In particular, recent regulatory pronouncements in the past few years have focused on operational risk, which arises from the potential that inadequate information systems, operational problems, breaches in internal controls, fraud, or unforeseen catastrophes will result in unexpected losses. New products and services, third-party risk management and cyber-security are critical sources of operational risk that financial institutions are expected to address in the current environment. The Bank is expected to have active board and senior management oversight; adequate policies, procedures, and limits; adequate risk measurement, monitoring, and management information systems; and comprehensive internal controls.
As an FDIC-insured institution, the Bank is required to pay deposit insurance premium assessments to the FDIC. The premiums fund the Deposit Insurance Fund (“DIF”). The FDIC assesses a quarterly deposit insurance premium on each insured institution based on risk characteristics of the institution and may also impose special assessments in emergency situations. Effective July 1, 2016, the FDIC changed the deposit insurance assessment system for banks, such as the Bank, with less than $10 billion in assets that have been federally insured for at least five years. Among other changes, the FDIC eliminated risk categories for such banks and now uses the “financial ratios method” to determine assessment rates for all such banks. Under the financial ratios method, the FDIC determines assessment rates based on a combination of financial data and supervisory ratings that estimate a bank’s probability of failure within three years. The assessment rate determined by considering such information is then applied to the amount of the institution’s average assets minus average tangible equity to determine the institution’s insurance premium.
On October 18, 2022, the FDIC adopted a final rule, applicable to ensureall insured depository institutions to increase the initial base deposit insurance assessment rate schedules uniformly by two basis points consistent with the Amended Restoration Plan approved by the FDIC on June 21, 2022. The FDIC indicated that it was taking this action in order to restore theDeposit Insurance Fund (DIF) reserve ratio to the required statutory minimum of 1.35% by the statutory deadline of September 30, 2028. The FDIC said that the DIF reserve ratio which ishad declined below this level because of the amountincrease in insured deposits since the start of the COVID-19 pandemic and other factors that affect the level of the DIF. Under the final rule, the increase in rates will begin with the first quarterly assessment period of 2023 and will remain in effect unless and until the reserve ratio meets or exceeds 2% in order to support growth in the DIF asin progressing toward the FDIC’s long-term goal of a percentage of all DIF-insured deposits, reached 1.35% by September 3, 2020.2% reserve ratio. The Dodd-Frank Act also altered the minimum designated reserve ratio for the DIF, increasing the minimum from 1.15% to 1.35%, and eliminated the requirement that the FDIC pay dividends to depository institutions when the reserve ratio exceeds certain thresholds. At least semi-annually, the FDIC updates its loss and income projections for the DIF and, if needed, may increase or decrease thein assessment rates following noticewill apply to F&M Bank and commentis projected to have an insignificant effect on proposed rulemaking if required. As a result, the Bank’s FDIC deposit insurance premiums could increase.Company’s capital levels and net income.
The Bank’s FDIC premiums were $1.4 million, $1.2 million, and $517,000 for the three years ended December 31, 2022, 2021, and 2020, respectively. In 2020, the Bank’s FDIC premiums were reduced by a one-time small bank assessment credit applied by the FDIC. This assessment credit was not available in 2020 and $624,000 in 2019.2021 or 2022. Future increases in insurance premiums could have adverse effects on the operating expenses and results of operations of the Company. Management cannot predict what the FDIC insurance assessment rates will be in the future.
Insurance of a bank’s deposits may be terminated by the FDIC upon a finding that the institution has engaged in unsafe or unsound practices, is in an unsafe or unsound condition to continue operations, or has violated any applicable law, regulation, rule, order, or condition imposed by the FDIC or the Bank’s primary regulator. Management of the Company is not aware of any practice, condition or violation that might lead to termination of the Company’s deposit insurance.
Community Reinvestment Act (“CRA”) and Fair Lending
The Bank is subject to certain fair lending requirements involving lending, investing, and other CRA activities. CRA requires each insured depository institution to identify the communities served by the institution’s offices and to identify the types of credit and investments the institution is prepared to extend within such communities including low and moderate-income neighborhoods. It also requires the institution’s regulators to assess the institution’s performance in meeting the credit needs of its community and to takeconsider such assessment into consideration in reviewing applications for mergers, acquisitions, relocation of existing branches, opening of new branches, and other transactions. A bank may be subject to substantial penalties and corrective measures for a violation of certain fair lending laws.
A bank’s compliance with the Community Reinvestment Act is assessed using an evaluation system, which bases CRA ratings on an institution’s lending, service and investment performance. An unsatisfactory rating may be the basis for denying a merger application. The Bank’s latest CRA examination was completed by the Federal Deposit Insurance CorporationFDIC in May 2019August 2022 and the Bank received an overall Outstanding rating in complying with its CRA obligations.
On December 12, 2019,May 5, 2022, the FDIC, Board of Governors of the Federal Reserve System (“FRB”) and the OCCOffice of the Comptroller of the Currency (“OCC”) announced a proposal to modernize the agencies’ regulations under the CRA that have not been substantively updated for nearlyover 25 years. On May 20, 2020,As of the OCC issueddate hereof, a final rule for CRA Modernization, however, the FDIC didhas not join the OCC and finalize the rule.been issued.
Consumer Protection Regulations
Banks and other financial institutions are subject to numerous laws and regulations intended to protect consumers in their transactions with banks. These laws include, among others, laws regarding unfair and deceptive acts and practices and usury laws, as well as the following consumer protection statutes: Truth in Lending Act, Truth in Savings Act, Electronic Fund Transfer Act, Expedited Funds Availability Act, Equal Credit Opportunity Act, Fair and Accurate Credit Transactions Act, Fair Housing Act, Fair Credit Reporting Act, Fair Debt Collection Practices Act, Gramm-Leach-Bliley Act, Home Mortgage Disclosure Act, Right to Financial Privacy Act, Servicemembers Civil Relief Act, Military Lending Act and Real Estate Settlement Procedures Act.
Many states and local jurisdictions have consumer protection laws analogous, and in addition, to those listed above. These federal, state and local laws regulate the manner in which financial institutions deal with customers when taking deposits, making loans or conducting other types of transactions. Failure to comply with these laws and regulations could give rise to regulatory sanctions, customer rescission rights, action by state and local attorneys general and civil or criminal liability. Failure to comply with consumer protection requirements may also result in our failure to obtain any required bank regulatory approval for merger or acquisition transactions we may wish to pursue or our prohibition from engaging in such transactions even if approval is not required.
The structure of federal consumer protection regulation applicable to all providers of consumer financial products and services changed significantly on July 21, 2011, when the CFPB commenced operations to supervise and enforce federal consumer protection laws. The consumer protection provisions of the Dodd-Frank Act and the examination, supervision and enforcement of those laws and implementing regulations by the CFPB have created a more intense and complex environment for consumer finance regulation. The CFPB has significant authority to implement and enforce federal consumer protection laws and new requirements for financial services products provided for in the Dodd-Frank Act, as well as the authority to identify and prohibit unfair, deceptive or abusive acts and practices. The review of products and practices to prevent such acts and practices is a continuing focus of the CFPB, and of banking regulators more broadly. The ultimate impact of this heightened scrutiny is uncertain but could result in changes to pricing, practices, products and procedures. It could also result in increased costs related to regulatory oversight, supervision and examination, additional remediation efforts and possible penalties. In addition, the Dodd-Frank Act provides the CFPB with broad supervisory, examination and enforcement authority over various consumer financial products and services, including the ability to require reimbursements and other payments to customers for alleged legal violations and to impose significant penalties, as well as injunctive relief that prohibits lenders from engaging in allegedly unlawful practices. The CFPB also has the authority to obtain cease and desist orders providing for affirmative relief or monetary penalties. The Dodd-Frank Act does not prevent states from adopting stricter consumer protection standards. State regulation of financial products and potential enforcement actions could also adversely affect our business, financial condition or results of operations.
The CFPB is authorized to issue rules for both bank and nonbanknon-bank companies that offer consumer financial products and services, subject to consultation with the prudential banking regulators. In general, however, banks with assets of $10 billion or less, such as the Bank, will continue to be examined for consumer compliance by their primary bank regulator.
Notice and Approval Requirements Related to Control
Banking laws impose notice, approval and ongoing regulatory requirements on any stockholder or other party that seeks to acquire direct or indirect "control" of an FDIC-insured depository institution. These laws include the BHCA and the Change in Bank Control Act. Among other things, these laws require regulatory filings by a stockholder or other party that seeks to acquire direct or indirect "control" of an FDIC-insured depository institution or bank holding company. The determination whether an investor "controls" a depository institution is based on all of the facts and circumstances surrounding the investment. As a general matter, a party is deemed to control a depository institution or other company if the party owns or controls 25% or more of any class of voting stock. Subject to rebuttal, a party may be presumed to control a depository institution or other company if the investor owns or controls 10% or more of any class of voting stock. Ownership by family members, affiliated parties, or parties acting in concert, is typically aggregated for these purposes. If a party's ownership of the Company were to exceed certain thresholds, the investor could be deemed to "control" the Company for regulatory purposes. This could subject the investor to regulatory filings or other regulatory consequences.
In addition, except under limited circumstances, bank holding companies are prohibited from acquiring, without prior approval:
control of any other bank or bank holding company or all or substantially all the assets thereof; or
more than 5% of the voting shares of a bank or bank holding company which is not already a subsidiary.
Incentive Compensation
In 2010, the federal bank regulatory agencies issued comprehensive guidance intended to ensure that the incentive compensation policies of banking organizations do not undermine the safety and soundness of those organizations by encouraging excessive risk-taking. The incentive compensation guidance sets expectations for banking organizations concerning their incentive compensation arrangements and related risk-management, control and governance processes. The incentive compensation guidance, which covers all employees that have the ability to materially affect the risk profile of an organization, either individually or as part of a group, is based upon three primary principles: (1) balanced risk-taking incentives; (2) compatibility with effective controls and risk management; and (3) strong corporate governance. Any deficiencies in compensation practices that are identified may be incorporated into the organization’s supervisory ratings, which can affect its ability to make acquisitions or take other actions. In addition, under the incentive compensation guidance, a banking organization’s federal supervisor may initiate enforcement action if the organization’s incentive compensation arrangements pose a risk to the safety and soundness of the organization.
In 2016, several federal financial agencies (including the FRB and FDIC) re-proposed restrictions on incentive-based compensation pursuant to Section 956 of the Dodd-Frank Act for financial institutions with $1 billion or more in total consolidated assets.
For institutions with at least $1 billion but less than $50 billion in total consolidated assets, the proposal would impose principles-based restrictions that are broadly consistent with existing interagency guidance on incentive-based compensation. Such institutions would be prohibited from entering into incentive compensation arrangements that encourage inappropriate risks by the institution: (i) by providing an executive officer, employee, director, or principal shareholder with excessive compensation, fees, or benefits; or (ii) that could lead to material financial loss to the institution. The comment period for these proposed regulations has closed, but a final rule has not been published. Depending upon the outcome of the rule making process, the application of this rule to us could require us to revise our compensation strategy, increase our administrative costs and adversely affect our ability to recruit and retain qualified employees. Further, as discussed above, the Basel III Capital Rules limit discretionary bonus payments to bank executives if the institution’s regulatory capital ratios fail to exceed certain thresholds that started being phased in on January 1, 2016.
Available Information
Company reports filed with the SEC including the annual report on Form 10-K, quarterly reports on Form 10-Q, current reports on Form 8-K, proxy statements and ownership reports filed by directors, executive officers and principal stockholders can be accessed through the Company’s website at http://www.fmbonline.com. The link to the SEC is on the About Us page. The Company’s reports may also be accessed at the SEC’s Internet website (http://www.sec.gov).
| Item 1A. | Risk Factors |
An investment in our common stock is subject to risks inherent in our business. The material risks and uncertainties that management believes may affect our business are described below. Before making an investment decision, you should carefully consider the risks and uncertainties described below together with all of the other information included or incorporated by reference in this 10-K Report. The risks and uncertainties described below are not the only ones facing our business. Additional risks and uncertainties that management is not aware of or focused on or that management currently deems immaterial may also impair our business operations. This 10-K Report is qualified in its entirety by these risk factors.
If any of the following risks actually occur, our financial condition and results of operations could be materially and adversely affected. If this were to happen, the value of our common stock could decline significantly, and you could lose all or part of your investment.
Risks Associated With Our BusinessRelated to COVID-19 Pandemic
In Our Service Areas Could Adversely Affect Our Operations And/Or Cause Us To Sustain Losses- Thelate 2021 and early 2022, as vaccination rates increased across the markets we serve and governmental restrictions were eased, economic activity began to improve, and at the current time COVID-19 is not having any material adverse impact on our business activities and financial results. However, the COVID-19 virus continues to develop new strains and no assurances can be given that these or other variants of the virus will not lead to future governmental restrictions on economic activity or have other materially adverse effects on the local and national economy and the economy of other portions of California had, for the most part, experienced solid improvements since the recession of 2007-2012, but in 2020 the spread of COVID-19 has placed many sectors of the economy under stress. The economy of the Central Valley of California, which remains the Company’s primary market area, has remained fairly resilient because of its strong agricultural base. However, this could changeour business.
Even if the COVID-19 outbreak continues to subside locally and nationally, we may experience material adverse impacts of COVID-19 continue for an extended period of time.
For additional information regarding the COVID-19 pandemic and its consequences for our business, see “COVID-19 (Coronavirus) Disclosure” above in this geographic concentration,Annual Report on Form 10-K.
Risks Relating to the Industry and Geographic Area in Which We Operate and the U.S. Economy
As a financial services company, our resultsbusiness and operations may be adversely affected by weak economic conditions. Our business operations, which primarily consist of operations depend largely uponlending money to clients in the form of loans, borrowing money from clients in the form of deposits and investing in securities, are sensitive to general business and economic conditions in these areas. Whereas much of this area has improved, real estate values remain below peak pricesthe United States. If the U.S. economy weakens, our growth and unemployment remains above most other areasprofitability from our lending, deposit and investment operations could be constrained. In addition, economic conditions in the state and country. As a result, risk still remains from the possibility that losses will be sustained if a significant number of our borrowers, guarantors and related parties fail to perform in accordance with the terms of their loans or leases. We have adopted underwriting and credit monitoring procedures and credit policies, including the establishment and review of the allowance for credit losses, that management believes are appropriate to minimize this risk by assessing the likelihood of nonperformance, tracking loan & lease performance and diversifying our credit portfolio. These policies and procedures; however, may not prevent unexpected losses thatforeign countries could materially and adversely affect our results of operations in general and the market value of our stock. See “Item 7. Management’s Discussion and Analysis of Financial Condition and Results of Operations – Overview - Looking Forward: 2021 and Beyond.”
Although only 4.7% of our loan portfolio consisted of real estate construction, and acquisition and land development loans as of December 31, 2020, real estate served as2022, such loans generally have a higher degree of risk than long-term financing of existing properties because repayment depends on the principal sourcecompletion of collateralthe project and usually on the sale or long term financing of the property. The COVID-19 pandemic has had, and may continue to have, an impact on the ability of our clients to complete these projects on time and within budget, particularly with respect to approximately 69%access to materials and labor and costs of ourthe same. In addition, these loans outstanding. Stresses in economic conditions in our local markets orare often “interest-only loans,” which normally require only the payment of interest accrued prior to maturity. Interest-only loans carry greater risk than other loans because no principal is paid prior to maturity. This risk is particularly apparent during periods of rising interest rates and declining real estate values. If there is a significant decline in the real estate market due to a material increase in interest rates or for other reasons, many of these loans could havedefault and result in foreclosure. If we are forced to foreclose on a project prior to completion, we may not be able to recover the entire unpaid portion of the loan or we may be required to fund additional money to complete the project or hold the property for an adverse effect onindeterminate period. In addition, real estate exposes us to incurring costs and liabilities for environmental contamination and remediation. Any of these outcomes may result in losses and reduce our earnings.
The FDIC has given guidance recommending that if the sum of (i) certain categories of CRE loans and (ii) acquisition, development and construction loans (“ADC loans”) exceeds 300% of total risk-based capital, or if ADC loans exceed 100% of total risk- based capital, heightened risk management practices should be employed to mitigate risk. As of December 31, 2022, our ratio for the sum of CRE and ADC loans was 190% and our ratio for ADC loans was 32.27%. Our concentration in ADC loans is cyclical and tends to increase in the second and third quarters of each year as demand for newADC loans increases. An increase in ADC loan concentration could cause our ratio for ADC loans to increase and even exceed the abilityFDIC’s guideline. We have exceeded these guidance ratios at times in the past and may do so in the future. We actively monitor and believe that we effectively manage our CRE and ADC loan concentrations. If we exceed the FDIC’s guidelines and do not effectively manage the risk of borrowersour CRE and ADC loans, we may be subject to repay outstanding loans,regulatory scrutiny, including a requirement to raise additional capital, reduce our loan concentrations, or undertake other remedial actions.
We could suffer material credit losses if we do not appropriately manage our credit risk. There are risks inherent in making any loan, including risks in dealing with individual clients, risks of non-payment, risks resulting from uncertainties as to the future value of real estatecollateral and other collateral securing loansrisks resulting from changes in economic and industry conditions. Changes in the value of real estate owned by us, as well aseconomy may cause the assumptions that we made at origination to change and may cause clients to be unable to make payments on their loans. There is no assurance that our credit risk monitoring and loan approval procedures are or will be adequate to address the inherent risks associated with lending. Any failure to manage such risks may materially adversely affect our financial condition and results of operations.
The small to medium-sized businesses that we lend to may have fewer resources to weather adverse business and economic developments, which may impair their ability to repay a loan, and such impairment could adversely affect our operations and financial condition.Our business strategy targets primarily small to medium-sized businesses, which frequently have smaller market shares than their competition, may be more vulnerable to economic downturns, often need substantial additional capital to expand or compete, and may experience substantial volatility in generaloperating results, any of which may impair a client’s ability to repay a loan.
The success of a small to medium-sized business often depends on the management skills, talents and efforts of one or a small number of people, and the market valuedeath, disability or resignation of one or more of these people could have a material adverse impact on the business and its ability to repay its loan. If general economic conditions negatively affect California and small to medium-sized businesses are adversely affected or our common stock. Additionally we have credit exposure to the Hospitality and Entertainment industries (See “Covid-19 Disclosure”) that have been significantly impactedclients are otherwise affected by COVID-19 and the primary collateral for those borrowers is real estate.
Our Business Is Subject To Interest Rate Risk And Changes In Interest Rates May Adversely Affect Our Performance And Financial Condition - Our earnings are impactedprofitability depends on interest rates generally, and we may be adversely affected by changingchanges in market interest rates. ChangesOur profitability depends in substantial part on our net interest income. Our net interest income depends on many factors that are partly or completely outside of our control, including competition, monetary and fiscal policies, and economic conditions generally. Our net interest income will be adversely affected if market interest rates impactchange so that the demand for new loans & leases, the credit profile of our borrowers, the rates received on loans & leases and securities and rates paid on deposits and borrowings. The difference between the rates received on loans & leases and securities and the rates paidinterest we pay on deposits and borrowings is known asincreases faster than the net interest margin. The FRB decreased short-term interest rates by 1.5% during 2020,we earn on loans and that has already impacted the Company’s net interest margin. Looking forward, if short-term rates remain low, when combined with aggressive competitor pricing strategies, our net interest margin could be adversely impactedinvestments. In addition, an increase in 2021.
During 2022, inflationary pressures began to affect many aspects of the U.S. economy, including gasoline and fuel prices, and global and domestic supply-chain issues have also had a disruptive effect on many industries, including the agricultural industry. In response, the FRB increased short-term interest rates by 4.25% in 2022, and further increases are generally expected in 2023. The impact of these developments on the business of our clients and on our business cannot be predicted with certainty but could present challenges in 2023 and beyond.
Beginning in 2021, the U.S. economy began to reflect relatively rapid rates of increase in the consumer price index and other economic indices; a prolonged elevated rate of inflation could present risks for the U.S. banking industry and our business. During the latter part of 2021 and into 2022, the U.S. economy exhibited relatively rapid rates of increase in the consumer price index and other economic indices. Pandemic-related supply chain disruptions may be contributing to this development. If the U.S. economy encounters a significant, prolonged rate of inflation, this could pose higher relative risks to the banking industry and our business. Such inflationary periods have historically corresponded with relatively weaker earnings and higher loan losses for banks.
In the past, inflationary environments have caused financing conditions to tighten and have increased borrowing costs for some marginal borrowers, which, in turn, has impacted bank credit quality and loan growth.
Additionally, a sustained period of inflation could prompt broad-based selling of longer-duration, fixed-rate debt, which could have negative implications for equity and real estate markets. Small businesses and leveraged loan borrowers can be challenged in a materially higher-rate environment. Higher interest rates can also present challenges for commercial real estate projects, pressuring valuations and loan-to-value ratios.
In addition, the outbreak of hostilities between Russia and Ukraine and global reactions thereto have increased U.S. domestic and global energy prices. Oil supply disruptions related to the Russia-Ukraine conflict, and sanctions and other measures taken by the U.S. or its allies, have led to higher costs for gas, food and goods in the U.S. and exacerbated the inflationary pressures on the economy, with potentially adverse impacts on our customers and on our business, results of operations. See “Item 7. Management’s Discussionoperations and Analysisfinancial condition.
We face strong competition from banks, credit unions and other financial services providers that offer banking services, which may limit our ability to attract and retain banking clients. Competition in the banking industry generally, and in our geographic market specifically, is strong. Competitors include banks, as well as other financial services providers, such as savings and loan institutions, consumer finance companies, brokerage firms, insurance companies, credit unions, mortgage banks and other financial intermediaries. Our competitors include several larger national and regional financial institutions whose greater resources may afford them a marketplace advantage inasmuch as they may offer a wider array of Financial Conditionbanking services at better rates and Resultsbe able to target a broader client base through more extensive promotional and advertising campaigns. Moreover, larger competitors may not be as vulnerable as we are to downturns in the local economy and real estate market since they have a broader geographic area and their loan portfolio is more diversified. While our deposit base has increased, several banks have grown their deposit market share in our markets faster than we have resulting in a declining relative deposit market share for us in our existing markets. We believe our declining relative market share in deposits has resulted primarily from aggressive marketing and advertising, in-migration of Operations – Net Interest Income/Net Interest Margin”more competitors, expanded delivery channels and “Item 7A. Quantitativemore attractive rates offered by larger bank competitors. We also compete against community banks, credit unions and Qualitative Disclosures About Market Risk - Interest Rate Risk.”non-bank financial services companies that have strong local ties. These smaller institutions are likely to cater to the same small to medium-sized businesses that we target. Additionally, financial technology companies allow clients to obtain loans via the Internet in an expeditious manner and have become competitors. If we are unable to attract and retain customers, we may be unable to continue to grow our loan and deposit portfolios and our operations and financial condition may otherwise be adversely affected. Ultimately, we may be unable to compete successfully against current and future competitors.
Our financial results may be impacted by the cyclicality and seasonality of our agricultural lending business. The Company has provided financing to agricultural customers in the mid Central Valley of California throughout its history. We recognize the cyclical nature of the industry, often caused by fluctuating commodity prices, changing climatic conditions and the availability of seasonal labor, and manage these risks accordingly. The Company remains committed to providing credit to agricultural customers and will always have a material exposure to this industry. Although the Company’s loan portfolio is believed to be well diversified, at various times during 2022 a significant portion of the Company’s loans (as much as 29.8%) were outstanding to agricultural borrowers. Commitments are well diversified across various commodities, including dairy, grapes, walnuts, almonds, cherries, apples, pears, and various row crops. Additionally, many individual borrowers are themselves diversified across commodity types, reducing their exposure, and therefore the Company’s, to cyclical downturns in any one commodity.
The Company’s service areas can also be significantly impacted by the seasonal operations of the agricultural industry. As a result, the Company’s financial results can be influenced by the banking needs of its agricultural customers. Generally speaking, during the spring and summer customers draw down their deposit balances and increase loan borrowings to fund the purchase of equipment and the planting of crops. Deposit balances are replenished and loans repaid in late fall and winter as crops are harvested and sold. Disruptions in the global supply chain arising from the COVID-19 pandemic may adversely affect the ability of some of our agricultural customers to efficiently export their agricultural products and in turn may adversely affect their results of operations or financial condition and their ability to repay loans we have made to them.
The impact of climate change and governmental and societal responses to climate change, including on the availability of water and the transition to a low-carbon economy, could adversely affect our business and our clients’ businesses. Despite the fact that 2023 began with significant levels of precipitation in California, the State has experienced severe drought conditions at times over the past several years. These weather patterns reinforce the fact that the long-term risks associated with the availability of water are significant. The farming belt of the Central Valley is often cited as an example of an area that experienced extreme drought. However, not all areas of the state are impacted equally, and this is particularly true in the Central Valley, which stretches some 450 miles from Bakersfield in the south to Redding in the north. The vast majority of the Company’s agricultural customers are located in the mid Central Valley, an area that benefits from the drainage of the Sacramento, American, Mokelumne and Stanislaus rivers.
In addition to the impact of climate has on the availability of water, State and Federal regulators ultimately manage this resource, which may also impact that access of our customers’ water. For example, in 2014, the State of California passed the Sustainable Groundwater Management Act. All Water Districts must develop plans to comply with the Act, including groundwater recharge programs. Although the exact impact of compliance is not currently known, and even prior to 2014 most of the water districts in the Bank’s service area had been developing and implementing management plans, it is possible that some water districts will have to ultimately fallow some ground to achieve compliance with the Act.
Additional legislation and regulatory requirements and changes in consumer preferences, including those associated with the transition to a low-carbon economy, could increase expenses of, or otherwise adversely impact, the Company, its businesses or its customers. We and our customers may face cost increases, asset value reductions, operating process changes, reduced availability of insurance, and the like, as a result of governmental actions or societal responses to climate change. New and/or more stringent regulatory requirements relating to climate change or environmental sustainability could materially affect the Company’s results of operations by increasing our compliance costs. Regulatory changes or market shifts to low-carbon products could also impact the creditworthiness of some of our customers or reduce the value of assets securing loans, which may require the Company to adjust our lending portfolios and business strategies.
Changes Toto LIBOR May Adversely Impact The Value Of,may adversely affect the value of, and The Return On, Our Financial Instruments That Are Indexed Tothe return on, our financial instruments that are indexed to LIBOR - . OnIn July 27, 2017, the United Kingdom’s Financial Conduct Authority (the authority that“FCA”) which regulates the London Interbank Funding Rate (“LIBOR”)LIBOR announced that it intends towould stop compelling banks to submit rates for the calculation of LIBOR after 2021 (although it may now. In March 2021, the FCA and LIBOR’s administrator, ICE Benchmarks Administration, announced that LIBOR would no longer be postponed untilprovided (i) for the one-week and two-month U.S. dollar settings and for various foreign currency settings after December 31, 2021, and (ii) for the remaining U.S. dollar settings after June 30, 2023).2023. In addition, the FRB issued guidance urging market participants in the U.S. to cease using LIBOR as a reference rate for new contracts entered into after December 31, 2021. There are on-going efforts to establish an alternative reference rate to LIBOR. The U.S.Secured Overnight Financing Rate (or SOFR) published by the Federal Reserve in conjunction withBank of New York (the “FRBNY”) is considered a likely alternative reference rate suitable for replacing LIBOR. SOFR is a broad measure of the cost of overnight borrowings collateralized by U.S. Treasury securities. The Alternative Reference Rates Committee, (“AARC”), is considering replacinga group of private-market participants convened by the FRBNY to help ensure a successful transition from U.S. dollar LIBOR withto a newly created index called the Secured Overnight Financing Rate (“SOFR”) calculated based on repurchase agreements backed by treasury securities. It is impossible to predict whether and to what extent banks will continue to provide LIBOR submissions to the administratornew reference rate, has recommended adoption of LIBOR, whether LIBOR rates will cease to be published before December 31, 2021 or June 30, 2023, as applicable, or whether any additional reforms to LIBOR may be enacted. Although the ARRC has announced SOFR as its recommendedthe alternative to LIBOR,reference rate. The scope of the acceptance of SOFR may not gain market acceptance or be widely used as a benchmark. Uncertainty as toand the natureconsequent impact on rates, pricing, the value and liquidity of our financial instruments and liquidity of such potential changes,instruments and the ability to manage risk, including through derivatives, remain uncertain at this time. While some of our existing products or contracts include fallback provisions to alternative reference rates, the eliminationother products or replacementcontracts may not include adequate fallback provisions and may require consent of all parties to any modification. The market transition from LIBOR or other reforms mayand similar benchmarks could adversely affect the return on and pricing, liquidity and value of our outstanding products and contracts, cause market dislocations, increase the cost of and access to capital and increase the risk of disputes and litigation in connection with the interpretation and enforceability of our outstanding products and contracts.
Failure of the U.S. Congress to increase the federal government’s debt limit could have material and adverse impacts on the U.S. and global economies and our business. Discussions are occurring between the Administration and the returnRepublican-controlled House of Representatives regarding the increase in the federal government’s statutory debt limit that is expected to be required later in 2023 in order to allow the U.S. to meet its outstanding obligations, including on its borrowings. If the debt limit were not raised and the U.S. were to default on its obligations, there could be material and adverse impacts on the U.S. and global economies with consequent impacts on the business of our financial instrumentscustomers and our business. Reductions of the ratings on U.S. sovereign debt as a result of issues over the debt ceiling could also have material and adverse impacts on the U.S. economy.
Risks Related to Our Growth
If we are not able to maintain our past levels of growth, our future prospects and competitive position could be diminished and our profitability could be reduced. We may not be able to sustain our deposit, loan, and asset growth at the rate we have attained during the past several years, including the significant deposit growth experienced since the onset of the COVID-19 pandemic. Our Accounting Estimates And Risk Management Processes Rely On Analytical And Forecasting Models - The processesgrowth over the past several years has been driven primarily by agricultural and commercial real estate growth in our market areas, growth in non-real estate agricultural and commercial loans, commercial leasing, and residential real estate. A failure to attract and retain high performing employees, heightened competition from other financial services providers, and an inability to attract additional core deposits and lending clients, among other factors, could limit our ability to grow as rapidly as we use to measurehave in the fair value of financial instruments,past and as well as the processes used to estimate the effects of changing interest rates and other market measuressuch could have a negative effect on our financial condition and resultsoperations.
If we are adequate, the models may proveunable to be inadequate or inaccurate because of other flaws in their design or their implementation. If the models we use for interest rate risk and asset-liability management are inadequate,manage our growth effectively, we may incur higher than anticipated costs, and our ability to execute our growth strategy could be impaired. It is our objective to continue to grow our assets and deposits by increasing our product and service offerings and expanding our operations organically. Our ability to manage growth successfully will depend on our ability to (i) identify suitable markets for expansion; (ii) attract and retain qualified management; (iii) attract funding to support additional growth; (iv) maintain asset quality and cost controls; (v) maintain adequate regulatory capital and profitability to support our lending activities; and (vi) may include finding attractive acquisition targets and successfully acquire and integrate the acquisitions in an efficient manner. If we do not manage our growth effectively, we may be unable to realize the benefit from our investments in technology, infrastructure, and personnel that we have made to support our expansion. In addition, we may incur higher costs and realize less revenue growth, which would reduce our earnings and diminish our future prospects. Failing to maintain effective financial and operational controls, as we grow, such as appropriate loan underwriting procedures, adequate allowances for credit losses and compliance with regulatory requirements could have a negative effect on our financial condition and operations, such as increased credit losses, reduced earnings and potential regulatory restrictions on growth.
Entering new market areas, new lines of business, or unexpected losses upon changes in market interest rates or other market measures. If the models we usenew products and services may subject us to measure the fair value of financial instruments are inadequate, the fair value of such financial instrumentsadditional risks. A failure to successfully manage these risks may fluctuate unexpectedly or may not accurately reflect what we could realize upon sale or settlement of such financial instruments. Any such failure in our analytical or forecasting models could have a material adverse effect on our business, financial condition and results of operations.
We may have difficulty attracting additional necessary personnel, which may divert resources and limit our ability to successfully expand our operations. The Company has provided financingOur business plan includes, and is dependent upon, our hiring and retaining highly qualified and motivated associates at every level. We have experienced, and expect to agricultural customerscontinue to experience, substantial competition in the Central Valley throughout its history. We recognize the cyclical nature of the industry, often caused by fluctuating commodity prices, changing climatic conditionsidentifying, hiring and the availability of seasonal labor,retaining top-quality associates due to low unemployment rate and new financial institutions entering our markets. If we are unable to hire and retain qualified personnel, we may be unable to successfully execute our business strategy and manage these risks accordingly. The Company remains committed to providing credit to agricultural customers and will always have a material exposure to this industry. Although the Company’s loan portfolio is believed to be well diversified, at various times during 2020 approximately 29% of the Company’s loan balances were outstanding to agricultural borrowers. Commitments are well diversified across various commodities, including dairy, grapes, walnuts, almonds, cherries, apples, pears, and various row crops. Additionally, many individual borrowers are themselves diversified across commodity types, reducing their exposure, and therefore the Company’s, to cyclical downturns in any one commodity. Agriculture has been deemed an “essential” industry during the COVID-19 pandemic, helping mitigate economic stress in the industry.
The Impactunexpected loss of Climatekey officers would materially and Governmentadversely affect our ability to execute our business strategy, and diminish our future prospects. Our success to date and our prospects for success in the future depend substantially on our senior management team. The Availabilityloss of Water is a Long Term Risk That Could Affect Our Customers’ Businesses - The Statekey members of California experienced drought conditions from 2013 through most of 2016. Since 2016, reasonable levels of rainour senior management team could materially and snow have alleviated drought conditions in California. Asadversely affect our ability to successfully implement our business plan and, as a result, current reservoir levels are adequate and the availabilityour future prospects. The loss of water insenior management without qualified successors who can execute our primary service area should not bestrategy would also have an issue. However, the weather patterns over the past 5 years further reinforce the fact that the long-term risks associated with the availability of water are significant.adverse impact on us.
As a community bank, our ability to maintain our positive reputation is critical to the success of our business. The farming beltfailure to maintain that reputation may materially and adversely affect our financial performance. Our reputation is one of the Central Valley was often cited asmost valuable components of our business. As such, we strive to conduct our business in a manner that enhances our reputation. This is done, in part, by recruiting, hiring and retaining employees who share our core values of being an example of an area that experienced extreme drought during 2013 - 2016. However, it is important to understand that not all areasintegral part of the state were impacted equally, and thiscommunities we serve, delivering superior service to our clients. If our reputation is particularly true innegatively affected by the Central Valley, which stretches some 450 miles from Bakersfield in the south to Redding in the north. The vast majority of the Company’s agricultural customers are located in the more northern portion of the Central Valley, an area that benefits from the drainage of the Sacramento, American, Mokelumne and Stanislaus rivers. As a result, even during the worst of the drought farmers in this area still had access to reasonable ground water sources that were economical to pump.
Risks Related to Our Financial Practices
Our allowance for credit losses may not be adequate to cover actual losses. A significant source of risk arises from the possibility that we could sustain losses due to loan defaults and non-performance on loans. We Face Strong Competition From Financial Service Companies And Other Companies That Offer Banking Services That Could Adversely Impact Our Business -maintain an allowance for credit losses in accordance with U.S. generally accepted accounting principles to provide for such defaults and other non-performance. The financial services business in our market areasdetermination of the appropriate level of this allowance is highly competitive. Itan inherently difficult process and is becoming increasingly competitive duebased on numerous assumptions. The amount of future losses is susceptible to changes in regulation, technological advances,economic, operating and the accelerating pace of consolidation among financial services providers. We face competition bothother conditions, including changes in attracting deposits and in making loans & leases. We compete for loans & leases principally through the interest rates, which may be beyond our control. In addition, our underwriting policies, adherence to credit monitoring processes, and loan & lease fees we chargerisk management systems and controls may not prevent unexpected losses. Our allowance for credit losses may not be adequate to cover actual credit losses. Moreover, any increase in our allowance for credit losses will adversely affect our earnings.
In June 2016, the efficiencyFinancial Accounting Standards Board (“FASB”) issued Accounting Standards Update (“ASU”) 2016-13, Measurement of Credit Losses on Financial Instruments (“ASU 2016-13”). ASU 2016-13 became effective January 1, 2020, and qualitysubstantially changed the accounting for credit losses on loans and other financial assets held by banks, financial institutions and other organizations. The standard replaced existing incurred loss impairment guidance and established a single allowance framework for financial assets carried at amortized cost. Upon adoption of services we provide. Increasing levelsASU 2016-13, companies must recognize credit losses on these assets equal to management’s estimate of competition incredit losses over the full remaining expected life. Companies must consider all relevant information when estimating expected credit losses, including details about past events, current conditions, and reasonable and supportable forecasts. We adopted and implemented this accounting standard fully effective January 1, 2022. The adoption of ASU 2016-13 did not have a material negative effect on the level of allowance for credit loss held by us or on our reported earnings. The potential negative effect that the adoption of this new accounting pronouncement may have on future lending by us or the banking and financial services business may reduceindustry in general is still not well known. We believe that our market share, decreaseallowance for credit losses as of December 31, 2022 was adequate to absorb expected credit losses inherent in our loan & lease demand, cause the pricesportfolio; however, we charge for our servicescannot assure that such levels will be sufficient to fall,cover actual or decrease our net interest margin by forcing us to offer lower lending interest rates and pay higher deposit interest rates. Therefore, our results may differ in future periods depending upon the nature or level of competition.losses.
We seek to incorporate appropriate historical data in our models, but the range of market values and services thatbehaviors reflected in any period of historical data is not at all times predictive of future developments in any particular period and the period of data we do not offer,incorporate into our models may prove to be inappropriate for the period being modeled. In such case, our ability to manage risk would be limited and many have substantiallyour risk exposure and losses could be significantly greater resources, suchthan our models indicated. This could harm our reputation as greater capital resourceswell as our revenues and more accessprofits. Finally, information we provide to longer term, lower cost funding sources. Manyour regulators based on poorly designed or implemented models could also have greater name recognition and market presence that benefit them in attracting business. In addition, larger competitors may be able to price loans & lease and deposits more aggressively than we do. Our larger competitors generally have easier access to capital, and often on better terms.inaccurate or misleading. Some of the financial services organizations with which we compete are not subjectdecisions that our regulators make, including those related to capital distributions to our stockholders, could be affected adversely due to their perception that the same degree of regulation as is imposed on bank holding companies and federally insured state-chartered banks, national banks and federal savings institutions. As a result, these non-bank competitors have certain advantages over us in accessing funding and in providing various services. Other competitors are subject to similar regulation but have the advantages of larger established customer bases, higher lending limits, extensive branch networks, numerous automated teller machines, greater advertising and marketing budgets or other factors. Some of our competitors have other advantages, such as tax exemption in the case of credit unions, and lesser regulation in the case of mortgage companies and specialty finance companies.
Impairment of investment securities could require charges to earnings, which would negatively affect our operations. We rely heavilymaintain a significant amount of our assets in investment securities, and must periodically evaluate investment securities for impairment under previously adopted accounting guidance during 2021 or for current expected credit losses after the adoption of ASU 2016-13. We evaluate our investment securities portfolio for impairment as of each reporting date. At December 31, 2022, we had no investment securities that were impaired.
Changes in accounting standards could materially affect our financial statements. The Company’s consolidated financial statements are presented in accordance with accounting principles generally accepted in the United States of America, called GAAP. The financial information contained within our consolidated financial statements is, to a significant extent, financial information that is based on communications and information systems to conduct our business. Any failure, interruption or breach in security of these systems could result in failures or disruptions in our customer relationship management, general ledger, deposit, loan & leases and other systems. While we have policies and procedures designed to prevent or limit the effectapproximate measures of the failure, interruption or security breachfinancial effects of our information systems, there can be no assurancetransactions and events that any such failures, interruptions or security breaches will not occur or, if they do occur, that they will be adequately addressed. The occurrencehave already occurred. A variety of any failures, interruptions or security breaches of our information systems could damage our reputation, result in a loss of customer business, subject us to additional regulatory scrutiny, or expose us to civil litigation and possible financial liability, any of which could have a material adverse effect on our financial condition and results of operations.
We May Be Adversely Affected By The Soundness Of Other Financial Institutions -may be unable to, or choose not to, pay dividends on our common shares. Financial services institutions are interrelated as a result of trading, clearing, counterparty and other relationships. We have exposureconsistently declared an annual cash dividend for over 87 years. Our ability to many different industriescontinue to pay dividends depends on various factors. FMCB is a legal entity separate and counterparties,distinct from the Bank, and routinely execute transactionsdoes not conduct stand-alone operations, which means that the Bank must first pay dividend(s) to the Company. The FDIC, the DFPI and California corporate and banking laws may, under certain circumstances, prohibit the Bank’s payment of dividends to FMCB. FRB policy requires bank holding companies to pay cash dividends on common shares only out of net income available over the past year and only if prospective earnings retention is consistent with counterpartiesthe organization’s expected future needs and financial condition. FMCB’s Board of Directors may determine that, even though funds are available for dividend payments, retaining the funds for other internal uses, such as expansion of our operations, is necessary or appropriate in the financial services industry, including commercial banks, broker-dealers, investment banks and other institutional clients. Manylight of these transactions expose us to credit risk in the event of a default by a counterparty or client. In addition, our credit risk may be exacerbated if our collateral cannot be foreclosed upon or is liquidated at prices not sufficient to recover the full amount of the credit or cover the derivative exposure due. Any such losses could have a material adverse effect on our business financial conditionplan and results of operations.objectives. A failure to pay dividends may negatively affect your investment.
The low trading volume in our common shares on the OTCQX means that our shares may have less liquidity than other companies, who shares are more broadly traded. We cannot ensure that the volume of trading in our common shares or the price of our common shares will be maintained or will increase in the future. Our stock price can fluctuate significantly in response to a variety of factors discussed in this section, including, among other things:
actual or anticipated variations in quarterly results of operations;
operating and stock price performance of other companies that investors deem comparable to our Company;
news reports relating to trends, concerns and other issues in the financial services industry;
available investment liquidity in our market area since our stock is not listed on any exchange; and
perceptions in the marketplace regarding our Company and/or its competitors.
If we need additional capital in the future to continue our growth, we may not be able to obtain it on terms that are favorable. We may need to raise additional capital in the future to support our continued growth and to maintain our capital levels. Our ability to raise capital through the sale of additional securities will depend primarily upon our financial condition and the condition of financial markets at that time. Accordingly, we may not be able to obtain additional capital in the amounts or on terms satisfactory to us. Our growth may be constrained if we are unable to generate or raise additional capital as needed.
Our Common Stock Is Not An Insured Depositfunding sources may prove insufficient to provide liquidity, replace deposits and support our future growth. We rely on customer deposits, advances from the Federal Home Loan Bank of San Francisco (“FHLB”), lines of credit at other financial institutions and the Federal Reserve Bank to fund our operations. Although we have historically been able to replace maturing deposits and advances if desired, we may not be able to replace such funds in the future if our financial condition, the financial condition of the FHLB or market conditions were to change. Our financial flexibility will be severely constrained if we are unable to maintain our access to funding or if adequate financing is not available to accommodate future growth at acceptable interest rates. Finally, if we are required to rely more heavily on more expensive funding sources to support future growth, our revenues may not increase proportionately to cover our costs. In this case, our profitability would be adversely affected. FHLB borrowings and other current sources of liquidity may not be available or, if available, not sufficient to provide adequate funding for operations. Furthermore, our own actions could result in a loss of adequate funding. For example, our borrowing capacity at the FHLB could be reduced if we are deemed to have poor documentation or processes. Accordingly, we may be required to seek additional higher-cost debt in the future to achieve our long-term business objectives. Additional borrowings, if sought, may not be available to us or, if available, may not be available on favorable terms. If additional financing sources are unavailable or are not available on reasonable terms, our growth and future prospects could be adversely affected.
Risks Related to Cyber-security and Information Technology
Cyber-attacks or other security breaches could have a material adverse effect on our business. In the normal course of business, we collect, process, and retain sensitive and confidential information regarding our clients. We also have arrangements in place with other third parties through which we share and receive information about their clients who are or may become our clients. Although we devote significant resources and management focus to ensuring the integrity of our systems through information security and business continuity programs, our facilities and systems, and those of third-party service providers, are vulnerable to external or internal security breaches, acts of vandalism, computer viruses, misplaced or lost data, programming or human errors or other similar events.
Information security risks for financial institutions have increased recently in part because of new technologies, the use of the Internet and telecommunications technologies (including mobile devices) to conduct financial and other business transactions, and the increased sophistication and activities of organized crime, perpetrators of fraud, hackers, terrorists and others. In addition to cyber-attacks or other security breaches involving the theft of sensitive and confidential information, hackers recently have engaged in attacks against large financial institutions, particularly denial of service attacks that are designed to disrupt key business services, such as client-facing websites. We are not able to anticipate or implement effective preventive measures against all potential security breaches, because the techniques used change frequently and because attacks can originate from a wide variety of sources. We employ detection and response mechanisms designed to contain and mitigate security incidents, but early detection may be thwarted by sophisticated attacks and malware designed to avoid detection.
We also face risks related to cyber-attacks and other security breaches in connection with credit and debit card transactions that typically involve the transmission of sensitive information regarding our clients through various third parties, including merchant acquiring banks, payment processors, payment card networks and our core processors. Some of these parties have in the past been the target of security breaches and cyber-attacks, and because the transactions involve third parties and environments such as the point of sale that we do not control or secure, future security breaches or cyber-attacks affecting any of these third parties could impact us through no fault of our own, and in some cases we may have exposure and suffer losses for breaches or attacks relating to them. We also rely on numerous other third-party service providers to conduct other aspects of our business operations and face similar risks relating to them. While we regularly conduct security assessments on these third parties, we cannot be sure that their information security protocols are sufficient at all times to withstand a cyber-attack or other security breach.
The access by unauthorized persons to, or the improper disclosure by us of, confidential information regarding our clients or our own proprietary information, software, methodologies, and business secrets could result in significant legal and financial exposure, supervisory liability, damage to our reputation or a loss of confidence in the security of our systems, products and services, which could have a material adverse effect on our financial condition or operations. In the past several years, there have been a number of well-publicized attacks or breaches affecting others in our industry that have heightened concern by consumers and have resulted in increased regulatory focus. Furthermore, cyber-attacks or other breaches in the future, whether affecting others or us, could intensify consumer concern and regulatory focus and result in reduced use of our cards and increased costs, all of which could have a material adverse effect on our business. To the extent we are involved in any future cyber-attacks or other breaches, our brand and reputation could be affected, and this could have a material adverse effect on our financial condition and operations. If we experience a cyber-attack, our insurance coverage may not cover all losses, and furthermore, we may experience a loss of reputation.
We rely on our information technology and telecommunications systems and third-party servicers, and the failure of these systems could adversely affect our business. Our business is highly dependent on the successful and uninterrupted functioning of our information technology and telecommunications systems and third-party servicers. We rely on these systems to process new and renewal loans, provide client service, facilitate collections and share data across our organization. The failure of these systems, or the termination of a third-party software license or service agreement on which any of these systems is based, could interrupt our operations. Because our information technology and telecommunications systems interface with and depend on third-party systems, we could experience service denials if demand for such services exceeds capacity or such third-party systems fail or experience interruptions. If sustained or repeated, a system failure or service denial could result in a deterioration of our ability to process new and renewal loans and provide client service or compromise our ability to collect loan payments in a timely manner. Our ability to adopt new information technology and technological products needed to meet our clients’ banking needs may be limited if our third-party servicers are slow to adopt or choose not to adopt such new technology and products. Such a failure to provide this technology and products to our clients could result in a loss of clients, which would negatively affect our financial condition and operations.
Other Operational Risks
Our risk management framework may not be effective in mitigating risks and losses to us. Our risk management framework is comprised of various processes, systems and strategies, and is designed to manage the types of risk to which we are subject, including, among others, credit, market, liquidity, interest rate and compliance. Our framework also includes financial or other modeling methodologies that involve management assumptions and judgment. Our risk management framework may not be effective under all circumstances and may not adequately mitigate any risk of loss to us. If our framework is not effective, we could suffer unexpected losses and our financial condition, operations or business prospects could be materially and adversely affected. We may also be subject to potentially adverse regulatory consequences.
We are subject to certain operating risks, related to client or employee fraud, which could harm our reputation and business. Employee error, or employee or client misconduct, could subject us to financial losses or regulatory sanctions and seriously harm our reputation. Misconduct by our employees could include hiding unauthorized activities from us, improper or unauthorized activities on behalf of our clients or improper use of confidential information. It is not always possible to prevent employee error and misconduct, and the precautions we take to prevent and detect this activity may not be effective in all cases. Employee error could also subject us to financial claims for negligence. If our internal controls fail to prevent or detect an occurrence, or if any resulting loss is not insured, excess insurance coverage is denied or not available, it could have a material adverse effect on our financial condition and operations.
We depend on the accuracy and completeness of information about clients and counterparties. In deciding whether to extend credit or enter into other transactions with clients and counterparties, we may rely on information furnished to us by or on behalf of clients and counterparties, including financial statements and other financial information. We also may rely on representations of clients and counterparties as to the accuracy and completeness of that information and, with respect to financial statements, on reports of independent auditors. In deciding whether to extend credit, we may rely upon our clients’ representations that their financial statements conform to U.S. generally accepted accounting principles, or GAAP, and present fairly, in all material respects, the financial condition, operations and cash flows of the client. We also may rely on client representations and certifications, or other auditors’ reports, with respect to the business and financial condition of our clients. Our financial condition, operations, financial reporting and reputation could be negatively affected if we rely on materially misleading, false, inaccurate or fraudulent information provided by or about clients and counterparties.
Catastrophic events including, but not limited to, hurricanes, tornadoes, earthquakes, fires, floods, prolonged drought, and pandemics may adversely affect the general economy, financial and capital markets, specific industries, and the Bank. The Bank has significant operations and a significant customer base in regions where natural and other disasters may occur. These regions are known for being vulnerable to natural disasters and other risks, such as earthquakes, fires, floods, and prolonged drought. These types of natural catastrophic events at times have disrupted the local economy, the Bank’s business and clients, and could pose physical risks to the Bank’s property. In addition, catastrophic events, such as natural disasters or global pandemics, occurring in other regions of the world may have an impact on the Bank’s clients and in turn on the Bank. Although we have business continuity and disaster recovery programs in place, a significant catastrophic event could materially adversely affect the Bank’s operating results.
The physical effects of climate change, as well as governmental and societal responses to climate change could materially adversely affect our operations, businesses and customers. There is increasing concern over the risks of climate change and related environmental sustainability matters. The physical effects of climate change include rising average global temperatures, rising sea levels and an increase in the frequency and severity of extreme weather events and natural disasters, including droughts, wildfires, floods, hurricanes and tornados. Most of the Company’s operations and customers are located in California, which could be adversely impacted by severe weather events. Agriculture is especially dependent on climate, and climate impacts could include shifting average growing conditions, increased climate and weather variability, decreases in available water sources, and more uncertainty in predicting climate and weather conditions, any or all of which could have a particularly adverse impact on our agricultural customers.
Additional legislation and regulatory requirements and changes in consumer preferences, including those associated with the transition to a low-carbon economy, could increase expenses of, or otherwise adversely affect, the Company, its businesses or its customers. Our customers and we may face cost increases, asset value reductions, operating process changes, reduced availability of insurance, and the like, because of governmental actions or societal responses to climate change.
New and/or more stringent regulatory requirements relating to climate change or environmental sustainability could materially affect the Company’s results of operations by increasing our compliance costs. Regulatory changes or market shifts to low-carbon products could also affect the creditworthiness of some of our customers or reduce the value of assets securing loans, which may require the Company to adjust our lending portfolios and business strategies.
Risks Related to Our Regulatory Environment
We are subject to regulation, which increases the cost and expense of regulatory compliance, and may restrict our growth and our ability to acquire other financial institutions. Supervision, regulation, and examination of the Company and the Bank by the bank regulatory agencies are intended primarily for the protection of consumers, bank clients and the Deposit Insurance Fund of the FDIC, rather than holders of our common stockshares. As a bank holding company under federal law, we are subject to regulation under the BHCA, and the examination and reporting requirements of the FRB. In addition to supervising and examining us, the FRB, through its adoption of regulations implementing the BHCA, places certain restrictions on the permissible activities for bank holding companies. Changes in the number or scope of permissible activities could have an adverse effect on our ability to realize our strategic goals. As a California state-chartered bank that is not a member of the Federal Reserve System, the Bank is separately subject to regulation by both the FDIC and the DFPI. The FDIC and DFPI regulate numerous aspects of the Bank’s operations, including adequate capital and financial condition, permissible types and amounts of extensions of credit and investments, permissible non-banking activities and restrictions on dividend payments. We may be required to invest significant management attention and resources to evaluate and make any changes necessary to comply with applicable laws and regulations. This allocation of resources, as well as any failure to comply with applicable requirements, may negatively affect our operations and financial condition.
Banking agencies periodically conduct examinations of our business, including compliance with laws and regulations, and our failure to comply with any regulatory actions to which we become subject because such examinations could materially and adversely affect us. The DFPI, the FDIC, and the FRB periodically conduct examinations of our business, including compliance with laws and regulations. Accommodating such examinations may require management to reallocate resources that would otherwise be used in the day-to-day operation of other aspects of our business. If, as a result of an examination, the DFPI or a federal banking agency were to determine that the financial condition, capital resources, asset quality, earnings prospects, management, liquidity or other aspects of our operations had become unsatisfactory, or that we or our management were in violation of any law or regulation, it may take a number of different remedial actions as it deems appropriate. These actions could include the power to enjoin “unsafe or unsound” practices, to require affirmative actions to correct any conditions resulting from any violation or practice, to issue an administrative order that can be judicially enforced, to direct an increase in our capital, to restrict our growth, to assess civil monetary penalties against us, our officers or directors, to remove officers and directors and, if it is concluded that such conditions cannot be corrected or there is an imminent risk of loss to clients, to terminate our deposit insurance. FDIC deposit insurance is critical to the continued operation of the Bank. If we become subject to such regulatory actions, our business operations could be materially and adversely affected.
Changes in laws, government regulation and monetary policy may have a material adverse effect on our operations. Financial institutions have been the subject of significant legislative and regulatory changes (including the Dodd-Frank Act) and may be the subject of further significant legislation or regulation in the future, none of which is within our control. This may result in repeals of or amendments to, existing laws, treaties, regulations, guidance, reporting, recordkeeping requirements, and other government policies. Significant new laws or regulations or changes in, or repeals of, existing laws or regulations, including those with respect to federal and state taxation, may cause our results of operations to differ materially. In addition, the costs and burden of compliance could adversely affect our ability to operate profitably. Further, federal monetary policy significantly affects the Bank’s credit conditions, as well as the Bank’s clients, particularly as implemented through the FRB, primarily through open market operations in U.S. government securities, the discount rate for bank depositborrowings and reserve requirements. A material change in any of these conditions could have a material impact on us, the Bank and the Bank’s clients, and therefore is not insured against losson our financial condition and operations.
New and future rulemaking by the FDIC, anyCFPB and other deposit insurance fundregulators, as well as enforcement of existing consumer protection laws, may have a material effect on our operations and operating costs. The CFPB has the authority to implement and enforce a variety of existing federal consumer protection statutes and to issue new regulations. However, with respect to institutions of our size, it does not have primary examination and enforcement authority. The authority to examine depository institutions with $10 billion or less in assets, such as the Bank, for compliance with federal consumer laws remains largely with our primary federal regulator, the FDIC. However, the CFPB may participate in examinations of smaller institutions on a “sampling basis” and may refer potential enforcement actions against such institutions to their primary regulators. In some cases, regulators such as the Federal Trade Commission, or FTC, and the Department of Justice also retain certain rulemaking or enforcement authority, and we remain subject to certain state consumer protection laws. The CFPB has placed significant emphasis on consumer complaint management and has established a public consumer complaint database to encourage consumers to file complaints they may have against financial institutions. We are expected to monitor and respond to these complaints, including those that we deem frivolous, and doing so may require management to reallocate resources away from more profitable endeavors.
The CFPB has adopted a number of significant rules that affect nearly every aspect of the lifecycle of a residential mortgage. These rules implement the Dodd-Frank Act amendments to the Equal Credit Opportunity Act, the Truth in Lending Act and the Real Estate Settlement Procedures Act. The rules require banks to, among other things: (i) develop and implement procedures to ensure compliance with a new “reasonable ability to repay” test and identify whether a loan meets a new definition for a “qualified mortgage”; (ii) implement new or revised disclosures, policies and procedures for servicing mortgages including, but not limited to, early intervention with delinquent clients and specific loss mitigation procedures for loans secured by any other publica client’s principal residence; (iii) comply with additional restrictions on mortgage loan originator compensation; and (iv) comply with new disclosure requirements and standards for appraisals and escrow accounts maintained for “higher priced mortgage loans.” These rules create operational and strategic challenges for us, as we are both a mortgage originator and a servicer.
We are subject to stringent capital requirements.
Pursuant to the Dodd-Frank Act, the federal banking agencies adopted final rules, or private entity. Investmentthe U.S. Basel III Capital Rules, to update their general risk-based capital and leverage capital requirements to incorporate agreements reflected in our common stock is inherently risky for the reasonsThird Basel Accord adopted by the Basel Committee on Banking Supervision, or Basel III Capital Standards, as well as the requirements of the Dodd-Frank Act. The U.S. Basel III Capital Rules are described in this “Risk Factors” sectionmore detail in “Supervision and elsewhereRegulation — Capital Standards” in this report and ison Form 10-K.
The failure to meet the established capital requirements could result in one or more of our regulators placing limitations or conditions on our activities or restricting the commencement of new activities. Such failure could subject us to a variety of enforcement remedies available to the same market forcesfederal regulatory authorities, including limiting our ability to pay dividends, issuing a directive to increase our capital and terminating our FDIC deposit insurance. FDIC deposit insurance is critical to the continued operation of the Bank. Our failure to meet applicable regulatory capital requirements, or to maintain appropriate capital levels in general, could affect client and investor confidence, our ability to grow, our costs of funds and FDIC insurance costs, our ability to pay dividends on common shares, our ability to make acquisitions, and our operations and financial condition, generally.
We may be required to contribute capital or assets to the Bank that affectcould otherwise be invested or deployed more profitably elsewhere. Federal law and regulatory policy impose a number of obligations on bank holding companies designed to reduce potential loss exposure to the clients of insured depository subsidiaries and to the FDIC’s DIF. For example, a bank holding company is required to serve as a source of financial strength to its FDIC-insured depository subsidiaries and to commit financial resources to support such institutions where it might not do so otherwise. These situations include guaranteeing the compliance of an “undercapitalized” bank with its obligations under a capital restoration plan.
A capital injection into the Bank may be required at times when we do not have the resources to provide it at the holding company level; therefore, we may be required to issue common shares or debt to obtain the required capital. Issuing additional common shares would dilute our current stockholders’ percentage of ownership and could cause the price of common stock in any company. As a result, if you acquire our common stock, youshares to decline. Any debt would be entitled to a priority of payment over the claims of the Company’s general unsecured creditors or equity holdings. Thus, any Company borrowing to make the required capital injection may lose some or all of your investment.be expensive and adversely affect our cash flows, financial condition, operations, and business prospects.
We face a risk of non-compliance and enforcement actions with respect to the Bank Secrecy Act (“BSA”) and other anti-money laundering statutes and regulations. Like all U.S. financial institutions, we are subject to monitoring requirements under federal law, including anti-money laundering, or AML, and BSA matters. Since September 11, 2001, banking regulators have intensified their focus on AML and BSA compliance requirements, particularly the AML provisions of the USA PATRIOT Act. There is also increased scrutiny of compliance with the rules enforced by the U.S. Treasury Department’s OFAC, which involve sanctions for dealing with certain persons or countries. While the Bank has adopted policies, procedures and controls to comply with the BSA, other AML statutes and regulations and OFAC regulations, this aggressive supervision and examination and increased likelihood of enforcement actions may increase our operating costs, which could negatively affect our operations and reputation.
We are subject to federal and state fair lending laws, and failure to comply with these laws could lead to material penalties. Federal and state fair lending laws and regulations, such as the Equal Credit Opportunity Act and the Fair Housing Act, impose non-discrimination lending requirements on financial institutions. The FDIC, the Department of Justice, the CFPB and other federal and state agencies are responsible for enforcing these laws and regulations. Private parties may also have the ability to challenge an institution’s performance under fair lending laws in private class action litigation. A successful challenge to our performance under the fair lending laws and regulations could adversely impact our rating under the CRA, and result in a wide variety of sanctions, including the required payment of damages and civil money penalties, injunctive relief, imposition of restrictions on merger and acquisition activity and restrictions on expansion activity, which could negatively impact our reputation, financial condition and operations.
Regulations relating to privacy, information security and data protection could increase our costs, affect or limit how we collect and use personal information and adversely affect our business opportunities. We are subject to various privacy, information security and data protection laws, including requirements concerning security breach notification, and these laws could negatively affect us. Federal law imposes requirements for the safeguarding of certain client information. Various state and federal banking regulators and states have also enacted data security breach notification requirements with varying levels of individual, consumer, regulatory or law enforcement notification in certain circumstances in the event of a security breach. Moreover, legislators and regulators in the United States are increasingly adopting or revising privacy, information security and data protection laws that potentially could have a significant impact on our current and planned privacy, data protection and information security-related practices, our collection, use, sharing, retention and safeguarding of consumer or employee information, and some of our current or planned business activities. This could also increase our costs of compliance and business operations and could reduce income from certain business initiatives.
Compliance with current or future privacy, data protection and information security laws (including those regarding security breach notification) affecting client or employee data to which we are subject could result in higher compliance and technology costs and could restrict our ability to provide certain products and services, which could have a material adverse effect on our financial conditions or operations.
Our failure to comply with privacy, data protection and information security laws could result in potentially significant regulatory or governmental investigations or actions, litigation, fines, sanctions and damage to our reputation, which could have a material adverse effect on our financial condition or operations.
Possible changes in the U.S. tax laws could adversely affect our business and result of operations in a variety of ways.
The Company has no unresolved comments receivedTax Cuts and Jobs Act (“TCJA”), signed into law on December 22, 2017, enacted sweeping changes to the U.S. federal tax laws generally, effective January 1, 2018. The TCJA reduced the corporate tax rate to 21% from staff at35%, which resulted in a net reduction in our annual income tax expense and which benefitted many of our corporate and other small business borrowers. However, our ability to utilize tax credits, such as those arising from low-income housing and alternative energy investments, was constrained by the SEC.lower tax rate. There are presently ongoing discussions in the U.S. Congress and the White House which could result in changes in the tax laws that would substantially increase the U.S. corporate tax rate. If enacted, such measures could adversely affect our profitability and that of our customers.
| Item 1B. | Unresolved Staff Comments |
None.
| Item 2. | Properties |
Farmers & Merchants Bancorp and its subsidiaries are headquartered in Lodi, California. Executive offices are located at 111 W. Pine Street. Banking services are provided in twenty-eight branches29 branch locations in the Company's service area. Of the twenty-eight29 branches, nineteen20 are owned and nine9 are leased. The expiration of these leases occurs between the years 20212023 and 2028.2030. See Note 20,14, located in “Item 8. Financial Statements and Supplementary Data.”Data” in this Annual Report on Form 10-K.
| Item 3. | Legal Proceedings |
Certain lawsuits and claims arising in the ordinary course of business have been filed or are pending against the Company or its subsidiaries. Based upon information available to the Company, its review of such lawsuits and claims and consultation with its counsel, the Company believes the liability relating to these actions, if any, would not have a material adverse effect on its consolidated financial statements.
There are no material proceedings adverse to the Company to which any director, officer or affiliate of the Company is a party.
| Item 4. | Mine Safety Disclosures |
Not Applicable
PART II
| Item 5. | Market for Registrant’s Common Equity, Related Stockholder Matters and Issuer Purchases of Equity Securities |
The common stock of Farmers & Merchants Bancorp is not widely held or listed on any exchange. However, trades are reported on the OTCQX under the symbol “FMCB”.“FMCB.”
The following tables summarize the actual high, low, and close sale prices for the Company's common stock since the first quarter of 2019. 2021. These figures are based on activity posted on the OTCQX.OTCQX:
| Calendar Quarter | High | Low | Close | Cash Dividends Declared (Per Share) | |||||||||||||
| 2020 | Fourth quarter | $ | 770 | $ | 701 | $ | 760 | $ | 7.50 | ||||||||
| Third quarter | 770 | 695 | 725 | - | |||||||||||||
| Second quarter | 800 | 626 | 706 | 7.25 | |||||||||||||
| First quarter | 800 | 650 | 685 | - | |||||||||||||
| Year Ended December 31, 2022 | ||||||||||||||||
| High | Low | Close | Dividend Declared | |||||||||||||
| First quarter | $ | 960 | $ | 913 | $ | 950 | $ | - | ||||||||
| Second quarter | 960 | 914 | 927 | 7.85 | ||||||||||||
| Third quarter | 975 | 922 | 956 | - | ||||||||||||
| Fourth quarter | 1,088 | 952 | 1,050 | 8.30 | ||||||||||||
| Calendar Quarter | High | Low | Close | Cash Dividends Declared (Per Share) | |||||||||||||
| 2019 | Fourth quarter | $ | 804 | $ | 755 | $ | 768 | $ | 7.15 | ||||||||
| Third quarter | 850 | 757 | 780 | - | |||||||||||||
| Second quarter | 950 | 700 | 795 | 7.05 | |||||||||||||
| First quarter | 788 | 695 | 725 | - | |||||||||||||
| Year Ended December 31, 2021 | ||||||||||||||||
| High | Low | Close | Dividend Declared | |||||||||||||
| First quarter | $ | 788 | $ | 731 | $ | 778 | $ | - | ||||||||
| Second quarter | 925 | 773 | 862 | 7.50 | ||||||||||||
| Third quarter | 920 | 862 | 897 | - | ||||||||||||
| Fourth quarter | 1,156 | 897 | 960 | 7.80 | ||||||||||||
As of January 31, 2021,February 28, 2023, there were approximately 1,6501,315 stockholders of record of the Company’s common stock. However, since approximately 30% of our common stock shares are held by brokers on behalf of stockholders, we are unable to determine the exact total number of stockholders.
The Company and, before the Company was formed, the Bank, has paid cash dividends for the past 8687 consecutive years. There are limitations under Delaware corporate law as to the amounts of cash dividends that may be paid by the Company. Additionally, if we decided to defer interest on our 2003 subordinated debentures, we would be prohibited from paying cash dividends on the Company’s common stock. The Company is dependent on cash dividends paid by the Bank to fund its cash dividend payments to its stockholders. There are regulatory limitations on cash dividends that may be paid by the Bank. See “Item 1. Business – Supervision and Regulation.”
The repurchase program also requires that no purchasesactual means and timing of any repurchases, the quantity of purchased shares and prices will be subject to certain limitations, including, without limitation, market prices of the Company’s common shares, general market and economic conditions, the Company’s financial performance, capital position, and applicable legal and regulatory requirements, and at the discretion of the Chief Executive Officer and Chief Financial Officer.
Repurchases under the Repurchase Plan may be made ifinitiated, discontinued, suspended, or restarted at any time in the Bank wouldCompany’s discretion. The Company is not remain “well-capitalized” after the repurchase.
On May 24, 2018, stockholders approved a proposal to increase our authorized shares of common stock from 7,500,000 to 40,000,000. In approving this proposal the stockholders also granted the Board discretionary authority (i.e., without further stockholder action) to determine whether to delay the proposed amendment. The Company has no immediate plans to effect the increase in the authorized shares of common stock.
On August 5, 2008, the Board of Directors approved a Share Purchase Rights Plan (the “Rights Plan”), pursuant to which the Company entered into a Rights Agreement dated August 5, 2008, with Computershare as Rights Agent, and the Company declared a dividend of a right to acquire one preferred share purchase right (a “Right”) for each outstanding share of the Company’s common stock, $0.01 par value per share, to stockholders of record at the close of business on August 15, 2008. Generally, the Rights are only triggered and become exercisable if a person or group (the “Acquiring Person”) acquires beneficial ownership of 10 percent or more of the Company’s common stock or announces a tender offer for 10 percent or more of the Company’s common stock.
The Rights Plan is similar to plans adopted by many other publicly traded companies. The effect of the Rights Plan is to discourage any potential acquirer from triggering the Rights without first convincing the Company’s Board of Directors that the proposed acquisition is fair to, and in the best interest of, all of the stockholders of the Company. The provisions of the Plan, if triggered by the Acquiring Person, will substantially dilute the equity and voting interest of any potential acquirer unless the Board of Directors approves of the proposed acquisition (under Article XV of the Company’s Certificate of Incorporation, the Board of Directors has the authority to consider any and all factors in determining whether an acquisition is in the best interests of the Company and its stockholders). Each Right, if and when exercisable, will entitle the registered holder to purchase from the Company one one-hundredth of a share of Series A Junior Participating Preferred Stock, no par value, at a purchase price of $1,600 for each one one-hundredth of a share, subject to adjustment.
Each holder of a Right (except for the Acquiring Person, whose Rights will be null and void upon such event) shall thereafter have the right to receive, upon exercise, that number of Common Shares of the Company having a market value of two times the exercise price of the Right. At any time before a person becomes an Acquiring Person, the Rights can be redeemed, in whole, but not in part, by Farmers and Merchants Bancorp’sthe Company’s Board of Directors at a price of $0.001 per Right.
The Rights Plan was set to expire on August 5, 2018. On November 19, 2015, the Board of Directors approved a seven-year extension of the term of the Rights Plan. Pursuant to an Amendment to the Rights Agreement dated February 18, 2016, the term of the Rights Plan was extended from August 5, 2018 to August 5, 2025. The extension of the term of the Rights Plan was intended as a means to continue to guard against abusive takeover tactics and was not in response to any particular proposal. The Board also increased the purchase price under the Rights Plan to $1,600 per one one-hundredth of a preferred share from $1,200, to reflect the increase in the market price of the Company’s common stock over the past several years.
During 2020,2022, the Company issuedrepurchased 21,309 shares under the Repurchase Plan, for a combined total 523of $20.31 million. All of these shares were purchased at prices ranging from $925.00 to $990.00 per share, based upon the then current price on the OTCQX. The Company did not issue any shares of common stock to the Bank’s non-qualified deferred compensation retirement plans. All of the shares were issued at a price of $770.00 per share based upon valuations completed during the quarter of issuance by a nationally recognized bank consulting and advisory firm and in reliance upon the exemption in Section 4(a)(2) of the Securities Act of 1933, as amended, and the regulations promulgated thereunder. The proceeds were contributed to the Bank as equity capital. See Note 14, located in “Item 8. Financial Statements and Supplementary Data.”2022.
The following table reports information regarding repurchases of our common stock during the year ended December 31, 2022:
| Period | Total number of shares purchased | Average price paid per share | Total number of shares purchased as part of publicly announced plans or programs | Maximum number (or approximate dollar value) of shares that may yet purchased under the plans or programs (In thousands) (1) | ||||||||||||
| Total 1st Quarter 2022 | 4,500 | $ | 945.00 | 4,500 | $ | 15,748 | ||||||||||
| Total 2nd Quarter 2022 | 7,956 | 954.32 | 7,956 | 8,155 | ||||||||||||
| Total 3rd Quarter 2022 | 6,368 | 951.68 | 6,368 | 2,095 | ||||||||||||
| October 1, 2022 to October 31, 2022 | 1,465 | $ | 962.22 | 1,465 | $ | 685 | ||||||||||
| November 1, 2022 to November 30, 2022 | 709 | 973.47 | 709 | 19,995 | ||||||||||||
| December 1, 2022 to December 31, 2022 | 311 | 979.84 | 311 | 19,690 | ||||||||||||
| Total 4th Quarter 2022 | 2,485 | $ | 967.64 | 2,485 | $ | 19,690 | ||||||||||
| �� | ||||||||||||||||
| Total 2022 | 21,309 | $ | 953.12 | 21,309 | $ | 19,690 | ||||||||||
(1)As of November 8, 2022 the Board approved an extension to the repurchase program through December 31, 2024 and for an additional $20 million of the Company's common stock.
The Company issued a combined total 9,312did not issue or purchase any shares of common stock to the Bank’s non-qualified deferred compensation retirement plans. All of the shares were issued at prices ranging from $715.00 to $770.00 per share based upon valuations completed during the quarter of issuance by a nationally recognized bank consulting and advisory firm and in reliance upon the exemption in Section 4(a)(2) of the Securities Act of 1933, as amended, and the regulations promulgated thereunder. The proceeds were contributed to the Bank as equity capital. See Note 14, located in “Item 8. Financial Statements and Supplementary Data.”2021.
Performance Graphs
The following graph compares the Company’s cumulative total stockholder return on common stock from December 31, 20152017 to December 31, 20202022 to that of: (i) the S&P 600 Regional Banks (Sub Ind) (TR) Index (which replaces the Morningstar Banks Index - Regional (US) Industry Group;Group going forward through 2020, since the data is no longer accessible); and (ii) the cumulative total return of the New York Stock Exchange market index. The graph assumes an initial investment of $100 on December 31, 20152017 and reinvestment of dividends. The stock price performance set forth in the following graph is not necessarily indicative of future price performance. The Company’s stock price data is based on activity posted on the OTCQX and on private transactions between individual stockholders that are reported to the Company. This data was furnished by Zacks SEC Compliance Services Group.
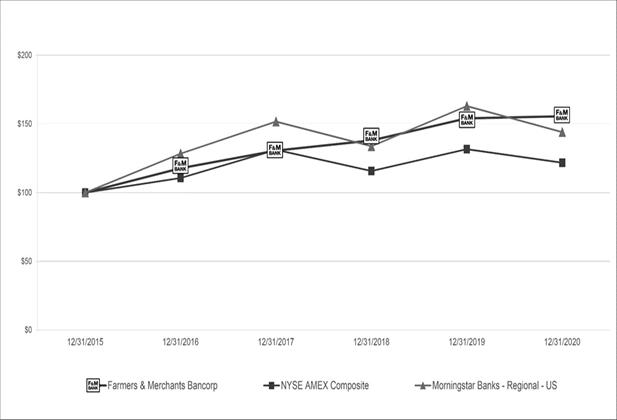
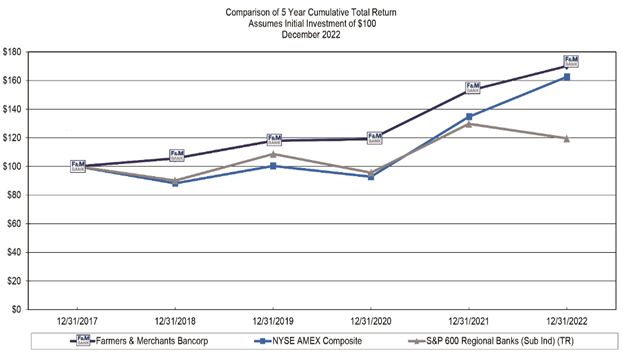
This graph shall not be deemed filed or incorporated by reference into any filing under the Securities Act of 1933.Act.
| Item 6. |
| Summary of Income: | 2020 | 2019 | 2018 | 2017 | 2016 | |||||||||||||||
| Total Interest Income | $ | 158,652 | $ | 153,708 | $ | 133,453 | $ | 114,612 | $ | 99,266 | ||||||||||
| Total Interest Expense | 9,491 | 13,194 | 7,950 | 6,289 | 4,196 | |||||||||||||||
| Net Interest Income | 149,161 | 140,514 | 125,503 | 108,323 | 95,070 | |||||||||||||||
| Provision for Credit Losses | 4,500 | 200 | 5,533 | 2,850 | 6,335 | |||||||||||||||
| Net Interest Income After Provision for Credit Losses | 144,661 | 140,314 | 119,970 | 105,473 | 88,735 | |||||||||||||||
| Total Non-Interest Income | 15,696 | 17,241 | 15,219 | 16,762 | 15,257 | |||||||||||||||
| Total Non-Interest Expense | 82,406 | 82,242 | 75,459 | 67,754 | 58,172 | |||||||||||||||
| Income Before Income Taxes | 77,951 | 75,313 | 59,730 | 54,481 | 45,820 | |||||||||||||||
| Provision for Income Taxes | 19,217 | 19,277 | 14,203 | 26,111 | 16,097 | |||||||||||||||
| Net Income | $ | 58,734 | $ | 56,036 | $ | 45,527 | $ | 28,370 | $ | 29,723 | ||||||||||
| Balance Sheet Data: | ||||||||||||||||||||
| Total Assets | $ | 4,550,453 | $ | 3,721,830 | $ | 3,434,243 | $ | 3,075,452 | $ | 2,922,121 | ||||||||||
| Loans & Leases | 3,099,592 | 2,673,027 | 2,571,241 | 2,215,295 | 2,177,601 | |||||||||||||||
| Allowance for Credit Losses | 58,862 | 55,012 | 55,266 | 50,342 | 47,919 | |||||||||||||||
| Investment Securities | 876,665 | 567,615 | 548,962 | 536,056 | 506,372 | |||||||||||||||
| Goodwill | 11,183 | 11,183 | 11,183 | - | - | |||||||||||||||
| Core Deposit Intangible | 4,013 | 4,640 | 5,278 | 836 | 946 | |||||||||||||||
| Deposits | 4,060,267 | 3,278,019 | 3,062,832 | 2,723,228 | 2,581,711 | |||||||||||||||
| Shareholders' Equity | 423,665 | 369,296 | 311,215 | 299,660 | 279,981 | |||||||||||||||
| Selected Ratios: | ||||||||||||||||||||
| Return on Average Assets | 1.43 | % | 1.61 | % | 1.45 | % | 0.94 | % | 1.12 | % | ||||||||||
| Return on Average Equity | 14.60 | % | 16.77 | % | 14.80 | % | 9.66 | % | 11.17 | % | ||||||||||
| Dividend Payout Ratio | 19.92 | % | 20.02 | % | 24.49 | % | 38.71 | % | 35.25 | % | ||||||||||
| Average Loans & Leases to Average Deposits | 80.77 | % | 84.38 | % | 84.36 | % | 82.18 | % | 88.63 | % | ||||||||||
| Average Equity to Average Assets | 9.78 | % | 9.61 | % | 9.66 | % | 9.77 | % | 10.05 | % | ||||||||||
| Period-end Shareholders' Equity to Total Assets | 9.31 | % | 9.92 | % | 9.06 | % | 9.74 | % | 9.58 | % | ||||||||||
| Basic and Diluted Per Share Data: | ||||||||||||||||||||
Earnings (1) | $ | 74.03 | $ | 71.18 | $ | 56.82 | $ | 35.03 | $ | 37.44 | ||||||||||
| Cash Dividends Per Share | $ | 14.75 | $ | 14.20 | $ | 13.90 | $ | 13.55 | $ | 13.10 | ||||||||||
Book Value Per Share at Year End (2) | $ | 536.53 | $ | 465.68 | $ | 397.10 | $ | 368.90 | $ | 346.80 | ||||||||||
| Item 7. | Management's Discussion and Analysis of Financial Condition and Results of Operations |
FORWARD-LOOKING STATEMENTS
This Annual Report on Form 10-K may contain certain forward-looking statements within the meaning of 2020Section 27A of the COVID-19 pandemic began, an eventSecurities Act, as amended, and Section 21E of the Exchange Act. These forward-looking statements reflect our current views and are not historical facts. These statements may include statements regarding projected performance for periods following the date of this report. These statements can generally be identified by use of phrases such as “believe,” “expect,” “will,” “seek,” “should,” “anticipate,” “estimate,” “intend,” “plan,” “target,” “project,” “commit” or other words of similar import. Similarly, statements that would impact economies everywhere. Importantly, agriculture has been designated as an “essential” industry duringdescribe our future financial condition, results of operations, objectives, strategies, plans, goals or future performance and business are also forward-looking statements. Statements that project future financial conditions, results of operations and shareholder value are not guarantees of performance and many of the pandemic, helpingfactors that will determine these results and values are beyond our ability to mitigate economic stresscontrol or predict. For those statements, we claim the protection of the safe harbor for forward-looking statements contained in the Company’s primary service area.
| Financial Performance Indicator | 2020 | 2019 | 2018 | 2017 | 2016 | |||||||||||||||
| Pre Tax Income | $ | 77,951 | $ | 75,313 | $ | 59,730 | $ | 54,481 | $ | 45,820 | ||||||||||
| Income Tax Expense | 19,217 | 19,277 | 14,203 | 26,111 | 16,097 | |||||||||||||||
| Effect of Income Tax Rate Change | ||||||||||||||||||||
| DTA Re-measurement | - | - | - | (6,300 | ) | - | ||||||||||||||
| Adjusted Income Tax Expense | 19,217 | 19,277 | 14,203 | 19,811 | 16,097 | |||||||||||||||
| Non-GAAP Adjusted Net Income | 58,734 | 56,036 | 45,527 | 34,670 | 29,723 | |||||||||||||||
| Effect of Income Tax Rate Change | ||||||||||||||||||||
| DTA Re-measurement | - | - | - | (6,300 | ) | - | ||||||||||||||
| Net Income (See Note 1) | $ | 58,734 | $ | 56,036 | $ | 45,527 | $ | 28,370 | $ | 29,723 | ||||||||||
| Total Assets | 4,550,453 | 3,721,830 | 3,434,243 | 3,075,452 | 2,922,121 | |||||||||||||||
| Total Loans & Leases | 3,099,592 | 2,673,027 | 2,571,241 | 2,215,295 | 2,177,601 | |||||||||||||||
| Total Deposits | 4,060,267 | 3,278,019 | 3,062,832 | 2,723,228 | 2,581,711 | |||||||||||||||
| Total Shareholders’ Equity | 423,665 | 369,296 | 311,215 | 299,660 | 279,981 | |||||||||||||||
| Total Risk-Based Capital Ratio | 12.60 | % | 12.40 | % | 11.40 | % | 13.07 | % | 12.80 | % | ||||||||||
| Non-Performing Loans as a % of Total Loans | 0.02 | % | 0.00 | % | 0.00 | % | 0.00 | % | 0.14 | % | ||||||||||
| Substandard Loans as a % of Total Loans | 0.60 | % | 0.61 | % | 0.57 | % | 0.40 | % | 0.29 | % | ||||||||||
| Net Charge-Offs (Recoveries) to Average Loans | 0.02 | % | 0.02 | % | 0.03 | % | 0.02 | % | 0.00 | % | ||||||||||
| Loan Loss Allowance as a % of Total Loans | 1.89 | % | 2.05 | % | 2.14 | % | 2.27 | % | 2.19 | % | ||||||||||
| Return on Average Assets | 1.43 | % | 1.61 | % | 1.45 | % | 0.94 | % | 1.12 | % | ||||||||||
| Adjusted Return on Average Assets | 1.43 | % | 1.61 | % | 1.45 | % | 1.15 | % | 1.12 | % | ||||||||||
| Return on Average Equity | 14.60 | % | 16.77 | % | 14.80 | % | 9.66 | % | 11.17 | % | ||||||||||
| Adjusted Return on Average Equity | 14.60 | % | 16.77 | % | 14.80 | % | 11.79 | % | 11.17 | % | ||||||||||
| Earnings Per Share | 74.03 | 71.18 | 56.82 | 35.03 | 37.44 | |||||||||||||||
| Adjusted Earnings Per Share | 74.03 | 71.18 | 56.82 | 42.81 | 37.44 | |||||||||||||||
| Cash Dividends Per Share | 14.75 | 14.20 | 13.90 | 13.55 | 13.10 | |||||||||||||||
| Cash Dividends Declared | 11,700 | 11,221 | 11,151 | 10,982 | 10,478 | |||||||||||||||
| ◾ | changes in general economic conditions, either nationally, in California, or in our local markets; |
| ◾ | inflation, changes in interest rates, securities market volatility and monetary fluctuations; |
| ◾ | increases in competitive pressures among financial institutions and businesses offering similar products and services; |
| ◾ | the future impact of the COVID-19 virus; |
| ◾ | higher defaults in our loan portfolio than we expect; |
| ◾ | changes in management’s estimate of the adequacy of the allowance for credit losses; |
| ◾ | risks associated with our growth and expansion strategy and related costs; |
| ◾ | increased lending risks associated with our high concentration of real estate loans; |
| ◾ | legislative or regulatory changes or changes in accounting principles, policies or guidelines; |
| ◾ | technological changes; |
| ◾ | failure to raise the debt limit on U.S. debt; |
| ◾ | regulatory or judicial proceedings; and |
| ◾ | other factors and risks including those described under “Risk Factors” and “Management’s Discussion and Analysis of Financial Condition and Results of Operations” in this Annual Report on Form 10-K. |
Should one or more of these risks or uncertainties materialize, or should underlying assumptions prove incorrect, actual results may vary materially from those anticipated, estimated, expected, projected, intended, committed or believed. Additional factors that all companies re-measure their DTA’s usingcould cause actual results to differ materially from those expressed in the new lower tax rateforward-looking statements are discussed in “Item 1A. Risk Factors” in this Annual Report on Form 10-K. Please take into account that forward-looking statements speak only as of the date of enactmentthis Annual Report on Form 10-K (or documents incorporated by reference, if applicable).
The Company does not undertake any obligation to publicly correct or update any forward-looking statement if it later becomes aware that actual results are likely to differ materially from those expressed in such forward-looking statement, except as required by law.
Overview
Farmers & Merchants Bancorp (the “Company”, “FMCB”, or “we”) is the holding company for Farmers & Merchants Bank of Central California (the “Bank” or “FMB). The Bank is a full-service community bank providing loans, deposit and cash management services to individuals and businesses. Our primary clients are small to medium-sized businesses that require highly personalized commercial banking products and services. The Bank has 29 branch locations and 3 ATMs that have been serving communities in the mid-Central Valley and East Bay of California for over 100 years.
The primary source of funding for our asset growth has been the generation of core deposits, which we raise through our existing branch locations, newly opened branch locations, or through acquisitions. Our recent loan growth is primarily the result of organic growth generated by our seasoned relationship managers and supporting associates who provide outstanding service and responsiveness to our clients or through acquisitions.
Our results of operations are largely dependent on net interest income. Net interest income is the difference between interest income we earn on interest earning assets, which are comprised of loans, investment securities and short-term investments, and the interest we pay on our interest bearing liabilities, which are primarily deposits, and, to a lesser extent, other borrowings. Management strives to match the re-pricing characteristics of the legislation. Asinterest earning assets and interest bearing liabilities to protect net interest income from changes in market interest rates and changes in the shape of the yield curve.
We measure our performance by calculating our net interest margin, return on average assets, and return on average equity. Net interest margin is calculated by dividing net interest income, which is the difference between interest income on interest earning assets and interest expense on interest bearing liabilities, by average interest earning assets. Net interest income is our largest source of revenue. Interest rate fluctuations, as well as changes in the amount and type of earning assets and liabilities, combine to affect net interest income. We also measure our performance by our efficiency ratio, which is calculated by dividing non-interest expense by the sum of net interest income and non-interest income.
Selected Financial Data
The following condensed consolidated statements of financial condition and operations and selected performance ratios as of December 31, 2022, 2021, and 2020 and for the years then ended have been derived from our audited consolidated financial statements. The information below is qualified in its entirety by the detailed information included elsewhere herein and should be read along with this “Item 7. Management’s Discussion and Analysis of Financial Condition and Results of Operations” and “Item 8, Financial Statement and Supplementary Data.”
| Years Ended December 31 | ||||||||||||
| (Dollars in thousands, except per share data) | 2022 | 2021 | 2020 | |||||||||
| Selected Income Statement Information: | ||||||||||||
| Interest income | $ | 198,413 | $ | 165,268 | $ | 159,294 | ||||||
| Interest expense | 4,840 | 4,332 | 9,491 | |||||||||
| Net interest income | 193,573 | 160,936 | 149,803 | |||||||||
| Provision for credit losses | 6,450 | 1,910 | 4,500 | |||||||||
| Net interest income after provision for credit losses | 187,123 | 159,026 | 145,303 | |||||||||
| Non-interest income | 6,178 | 21,056 | 15,054 | |||||||||
| Non-interest expense | 93,560 | 91,761 | 82,406 | |||||||||
| Income before income tax expense | 99,741 | 88,321 | 77,951 | |||||||||
| Income tax expense | 24,651 | 21,985 | 19,217 | |||||||||
| Net income | $ | 75,090 | $ | 66,336 | $ | 58,734 | ||||||
| Selected financial ratios: | ||||||||||||
| Basic and diluted earnings per share | $ | 96.55 | $ | 84.01 | $ | 74.03 | ||||||
| Cash dividends per common share | 16.15 | 15.30 | 14.75 | |||||||||
| Dividend ratio | 16.73 | % | 18.21 | % | 19.92 | % | ||||||
| Net interest margin | 3.80 | % | 3.46 | % | 3.88 | % | ||||||
| Non-interest income to average assets | 0.12 | % | 0.43 | % | 0.37 | % | ||||||
| Non-interest expense to average assets | 1.75 | % | 1.87 | % | 2.00 | % | ||||||
| Efficiency ratio | 46.84 | % | 50.42 | % | 49.99 | % | ||||||
| Return on average assets | 1.41 | % | 1.35 | % | 1.43 | % | ||||||
| Return on average equity | 16.04 | % | 15.00 | % | 14.60 | % | ||||||
| Net charge-offs (recoveries) to average loans | 0.01 | % | (0.01 | %) | 0.02 | % | ||||||
| As of December 31, | ||||||||||||
| (Dollars in thousands, except per share data) | 2022 | 2021 | 2020 | |||||||||
| Selected Balance Sheet Information: | ||||||||||||
| Cash and cash equivalents | $ | 588,257 | $ | 715,460 | $ | 383,837 | ||||||
| Investment securities | 997,817 | 1,007,506 | 876,665 | |||||||||
| Gross loans held for investment | 3,512,361 | 3,237,177 | 3,099,592 | |||||||||
| Total assets | 5,327,399 | 5,177,720 | 4,550,453 | |||||||||
| Total deposits | 4,759,269 | 4,640,152 | 4,060,267 | |||||||||
| Shareholders' equity | 485,308 | 463,136 | 423,665 | |||||||||
| Average Balances: | ||||||||||||
| Average earning assets | 5,091,684 | 4,656,337 | 3,861,070 | |||||||||
| Average assets | 5,341,901 | 4,913,999 | 4,112,537 | |||||||||
| Average shareholders' equity | 468,001 | 442,246 | 402,329 | |||||||||
| Selected financial ratios: | ||||||||||||
| Book value per share | $ | 631.63 | $ | 586.51 | $ | 536.53 | ||||||
| Tangible book value per share | $ | 613.42 | $ | 568.04 | $ | 517.28 | ||||||
| Allowance for credit losses to total loans | 1.90 | % | 1.88 | % | 1.89 | % | ||||||
| Non-performing assets to total assets | 0.03 | % | 0.03 | % | 0.03 | % | ||||||
| Loans held for investment to deposits | 73.80 | % | 69.76 | % | 76.34 | % | ||||||
| Capital ratios: | ||||||||||||
| Tier 1 leverage capital | 9.36 | % | 8.92 | % | 9.13 | % | ||||||
| Total risk-based capital | 13.06 | % | 13.19 | % | 12.59 | % | ||||||
| Average equity to average assets | 8.76 | % | 9.00 | % | 9.78 | % | ||||||
| Tangible common equity to tangible assets | 8.87 | % | 8.69 | % | 9.01 | % | ||||||
Summary of Critical Accounting Policies and Estimates
In the opinion of management, the accompanying Consolidated Statements of Financial Condition and related Consolidated Statements of Operations, Comprehensive Income, Changes in Shareholders’ Equity and Cash Flows reflect all adjustments (which include reclassification and normal recurring adjustments) that are necessary for a fair presentation in conformity with GAAP. The preparation of financial statements in conformity with GAAP requires management to make estimates and assumptions that affect amounts reported in the financial statements.
Various elements of our accounting policies, by their nature, are inherently subject to estimation techniques, valuation assumptions and other subjective assessments. In particular, management has identified certain accounting policies that, due to the judgments, estimates and assumptions inherent in those policies, are critical to an understanding of our financial statements. Management believes the judgments, estimates and assumptions used in the preparation of the financial statements are appropriate based on the factual circumstances at the time. However, given the sensitivity of the financial statements to these critical accounting policies, the use of other judgments, estimates and assumptions could result in material differences in our results of operations or financial condition. Further, subsequent changes in economic or market conditions could have a material impact on these estimates and our financial condition and operating results in future periods. For additional information concerning critical accounting policies, see the Selected Notes to the Consolidated Financial Statements and the following:
Use of Estimates — The preparation of our financial statements requires management to make estimates and judgments that affect the reported amount of assets, liabilities, revenues and expenses. On an ongoing basis, management evaluates the estimates used. Estimates are based upon historical experience, current economic conditions and other factors that management considers reasonable under the circumstances and the actual results may differ from these estimates under different assumptions. The allowance for credit losses, deferred income taxes, and fair values of financial instruments are estimates, which are particularly subject to change.
Allowance for Credit Losses — The Company recognizes there is risk of credit losses with financial instruments, to include loans, and unfunded loan commitments, where the Company advances funds to a counterparty. The risk of credit losses varies with, among other things, the type of financial instrument, the creditworthiness and cash flows of the counterparty, any guarantees from government agencies, and the collateral, if any, used to secure the financial instrument. The Company maintains an allowance for credit losses on loans and unfunded commitments held in accordance with GAAP. The allowance for credit losses represents our estimate of probable losses inherent in our existing loan portfolio. The allowance for credit losses is increased by charging a provision for credit losses against income and reduced by charge-offs, net of recoveries.
Under the guidance of Financial Accounting Standards Board Accounting Standards Update 2016-13, Financial Instruments – Credit Losses (Topic 326), Measurement of Credit Losses on Financial Instruments (“CECL”), we evaluate our allowance for credit losses quarterly based on a number of quantitative and qualitative factors, including levels and trends of past due and non-accrual loans, asset classifications, loan grades and internal loan reviews, change in volume and mix of loans, collateral value, historical loss experience, size and complexity of individual credits, loan concentrations and economic conditions. Allowance for credit losses is provided on both a specific and general basis. Specific allowances are provided for impaired credits for which the expected/anticipated loss is measurable. General valuation allowances are based on a portfolio segmentation based on risk grading, with a further evaluation of various quantitative and qualitative factors.
The Company begins its determination of credit losses by evaluating historical credit loss experience by loan segment. Historical loss information may be adjusted based on specific risk characteristics by loan segment. Such risk characteristics may include, but are not necessarily limited to, changes in lending policies and procedures, including changes in underwriting standards and collection, charge-off, and recovery practices not considered elsewhere in estimating credit losses; changes in national and local economic conditions and forecasts; changes in the nature and volume of the loans and in the terms of such instruments; changes in the experience, ability, and depth of lending management and other relevant staff; changes in the volume and severity of past due status, the volume of non-accrual loans, and the volume and severity of adversely classified or graded loans; changes in the quality of the institution’s loan review system; changes in the value of underlying collateral for collateral-dependent loans; the existence and effect of any concentrations of credit, and changes in the level of such concentrations; and the effect of other external factors such as competition and legal and regulatory requirements on the level of estimated credit losses.
While the Company utilizes a systematic methodology in determining its allowance, the allowance is based on estimates, and ultimate losses may vary from current estimates. The estimates are reviewed periodically and, as adjustments become necessary, are reported in earnings in the periods in which they become known. For additional information, see Note 4, located in “Item 8. Financial Statements and Supplementary Data” in this Annual Report on Form 10-K.
The allowance for credit losses on unfunded loan commitments is classified in other liabilities on the Consolidated Statements of Financial Condition. The allowance for credit losses on unfunded loan commitments is increased by charging a provision for credit losses on unfunded commitments, which was reported in other non-interest expenses for 2022 and prior.
We believe that our allowance for credit losses was adequate to absorb probable losses inherent in the loan portfolio as of December 31, 2022 and 2021.
Investment Securities — Investment securities are classified as held-to-maturity (“HTM”) when the Company has the positive intent and ability to hold the securities to maturity. Investment securities are classified as available-for-sale (“AFS”) when the Company has the intent of holding the security for an indefinite period of time, but not necessarily to maturity. The Company determines the appropriate classification at the time of purchase, and periodically thereafter. Investment securities classified at HTM are carried at amortized cost. Investment securities classified at AFS are reported at fair value. Purchase premiums and discounts are recognized in interest income using the interest method over the terms of the securities. Debt securities classified as held-to-maturity are carried at cost, net of the allowance for credit losses - securities, adjusted for amortization of premiums and discounts to the earliest callable date. Debt securities classified as available-for-sale are measured at fair value. Unrealized holding gains and losses on debt securities classified as available-for-sale are excluded from earnings and are reported net of tax as accumulated other comprehensive income (AOCI), a component of shareholders’ equity, until realized. When AFS securities, specifically identified, are sold, the unrealized gain or loss is reclassified from AOCI to non-interest income.
Management measures expected credit losses on held-to-maturity debt securities on a collective basis by major security type. The Company’s HTM portfolio contains securities issued by U.S. government entities and agencies and municipalities. The Company uses industry historical credit loss information adjusted for current conditions to establish the allowance for credit losses on its HTM municipal bond portfolio.
For available-for-sale debt securities in an unrealized loss position, the Company first assesses whether it intends to sell, or is more likely than not that it will be required to sell the security before recovery of its amortized cost basis. If the Company intends to sell the security or it is more likely than not that the Company will be required to sell the security before recovering its cost basis, the entire impairment loss would be recognized in earnings. If the Company does not intend to sell the security, and it is not more likely than not that the Company will be required to sell the security, the Company evaluates whether the decline in fair value has resulted from credit losses or other factors. In making this assessment, management considers the extent to which fair value is less than amortized costs, any changes to the rating of the security by a rating agency, and adverse conditions specifically related to the security, among other factors. If this assessment indicates that a credit loss exists, the present value of cash flows expected to be collected from the security are compared to the amortized cost basis of the security. Projected cash flows are discounted by the current effective interest rate. If the present value of cash flows expected to be collected is less than the amortized cost basis, a credit loss exists and an allowance for credit losses is recorded for the credit loss, limited by the amount that the fair value is less than the amortized cost basis. The remaining impairment related to all other factors, the difference between the present value of the cash flows expected to be collected and fair value, is recognized as a charge to AOCI.
Changes in the allowance for credit losses-securities are recorded as provision for (or reversal of) credit losses. Losses are charged against the allowance when management believes the non-collectability of an available-for-sale security is confirmed or when either criteria regarding intent of requirement to sell is met.
At December 31, 2022, we had no investment securities that were impaired.
Goodwill — Goodwill represents the excess of the purchase considerations paid over the fair value of the assets acquired, net of the fair values of liabilities assumed in a business combination it is not amortized but is reviewed annually, or more frequently as current circumstances and conditions warrant, for impairment. An assessment of qualitative factors is completed to determine if it is more likely than not that, the fair value of a reporting unit is less than its carrying amount. If the qualitative analysis concludes that further analysis is required, then a quantitative impairment test would be completed. The quantitative goodwill impairment compares the reporting unit's estimated fair values, including goodwill, to its carrying amount. If the carrying amount exceeds its reporting unit’s fair value, then an impairment loss would be recognized as a charge to earnings, but is limited by the amount of goodwill allocated to that reporting unit.
Other Intangible Assets — Other intangible assets consists primarily of core deposit intangibles (“CDI”), which are amounts recorded in business combinations or deposit purchase transactions related to the value of transaction-related deposits and the value of the client relationships associated with the deposits. Core deposit intangibles are amortized over the estimated useful lives of such deposits. These assets are reviewed at least annually for events or circumstances that could affect their recoverability. These events could include loss of the underlying core deposits, increased competition or adverse changes in the economy. The amortization of our CDI is recorded in other non-interest expense. To the extent other identifiable intangible assets are deemed unrecoverable; impairment losses are recorded in other non-interest expense to reduce the carrying amount of the assets.
Fair Value Measurements — The Company discloses the fair value of financial instruments and the methods and significant assumptions used to estimate those fair values. The estimated fair value amounts have been determined by the Company using available market information and appropriate valuation methodologies. The use of assumptions and various valuation techniques, as well as the absence of secondary markets for certain financial instruments, will likely reduce the comparability of fair value disclosures between financial institutions. In some cases, book value is a reasonable estimate of fair value due to the relatively short period between origination of the instrument and its expected realization.
For additional information, see “Item 7A. Quantitative and Qualitative Disclosures about Market Risk” and Note 12 located in “Item 8. Financial Statements and Supplementary Data” in this Annual Report on Form 10-K.
Income Taxes — Income taxes are filed on a consolidated basis with our subsidiaries and allocate income tax expense (benefit) based on each entity’s proportionate share of the consolidated provision for 2017 includedincome taxes. Deferred income tax assets and liabilities are recognized for the tax consequences of temporary differences between the reported amounts of assets and liabilities and their respective tax bases. Deferred income tax assets and liabilities are adjusted for the effects of changes in tax laws and rates on the date of enactment. The determination of the amount of deferred income tax assets, that are more likely than not to be realized is primarily dependent on projections of future earnings, which are subject to uncertainty and estimates that may change given economic conditions and other factors. The realization of deferred income tax assets is assessed and a $6.3 million re-measurementvaluation allowance is recorded if it is “more likely than not” that all or a portion of the deferred income tax asset will not be realized. “More likely than not” is defined as greater than a 50% probability. All available evidence, both positive and negative, is considered to determine whether, based on the weight of that evidence, a valuation allowance is needed.
Only tax positions that meet the more likely than not recognition threshold are recognized. The benefit of a tax position is recognized in the financial statements in the period during which, based on all available evidence, management believes it is more likely than not that the position will be sustained upon examination, including the resolution of appeals or litigation processes, if any. Tax positions taken are not offset or aggregated with other positions. Tax positions that meet the more likely than not recognition threshold are measured as the largest amount of tax benefit that is more than 50 percent likely of being realized upon settlement with the applicable taxing authority. The portion of the benefits associated with tax positions taken that exceeds the amount measured as described above is reflected as a one-time, non-cash increaseliability for unrecognized tax benefits in the accompanying consolidated statements of financial condition along with any associated interest and penalties that would be payable to the taxing authorities upon examination. Interest expense and penalties associated with unrecognized tax benefits are classified as income tax expense in the 4th quarter. Our situation is not unique in that the majorityconsolidated statements of all financial institutions reported significant DTA re-measurements in the 4th quarter of 2017. Excluding the impact of the $6.3 million DTA re-measurement, non-GAAP adjusted net income for the year totaled $34.6 million, an increase of $5.0 million or 16.8% over the prior year, which would have resulted in an adjusted return on average assets of 1.15% and adjusted return on average equity of 11.79%.income.
Results of Operations
The following discussion and analysis is intended to provide a better understanding of Farmers & Merchants Bancorp and its subsidiaries’ performance during each of the years in the three-yeartwo-year period ended December 31, 20202022 and the material changes in financial condition, operating income, and expense of the Company and its subsidiaries as shown in the accompanying consolidated financial statements.
| Year Ended December 31, 2020 | ||||||||||||
| Assets | Balance | Interest | Rate | |||||||||
| Interest Bearing Deposits with Banks | $ | 326,247 | $ | 1,207 | 0.37 | % | ||||||
| Investment Securities: | ||||||||||||
| U.S. Treasuries | 21,249 | 356 | 1.68 | % | ||||||||
| U.S. Govt SBA | 9,450 | 116 | 1.23 | % | ||||||||
| Government Agency & Government-Sponsored Entities | - | - | - | |||||||||
| Municipals - Taxable | 12,582 | 513 | 4.08 | % | ||||||||
Obligations of States and Political Subdivisions - Non-Taxable (1) | 52,736 | 2,109 | 4.00 | % | ||||||||
| Mortgage Backed Securities | 468,306 | 11,193 | 2.39 | % | ||||||||
| Other | 19,323 | 213 | 1.10 | % | ||||||||
| Total Investment Securities | 583,646 | 14,500 | 2.48 | % | ||||||||
Loans & Leases: (2) | ||||||||||||
| Real Estate | 1,921,485 | 95,194 | 4.95 | % | ||||||||
| Home Equity Lines and Loans | 37,952 | 1,828 | 4.82 | % | ||||||||
| Agricultural | 259,132 | 13,049 | 5.04 | % | ||||||||
| Commercial | 372,344 | 17,941 | 4.82 | % | ||||||||
Consumer (3) | 12,748 | 784 | 6.15 | % | ||||||||
| Other | 228,530 | 8,837 | 3.87 | % | ||||||||
| Leases | 106,293 | 5,750 | 5.41 | % | ||||||||
| Total Loans & Leases | 2,938,484 | 143,383 | 4.88 | % | ||||||||
| Total Earning Assets | 3,848,377 | $ | 159,090 | 4.13 | % | |||||||
| Unrealized Gain on Securities Available-for-Sale | 16,289 | |||||||||||
| Allowance for Credit Losses | (55,804 | ) | ||||||||||
| Cash and Due From Banks | 62,089 | |||||||||||
| All Other Assets | 241,586 | |||||||||||
| Total Assets | $ | 4,112,537 | ||||||||||
| Liabilities & Shareholders' Equity | ||||||||||||
| Interest Bearing Deposits: | ||||||||||||
| Interest Bearing DDA | $ | 787,306 | $ | 1,618 | 0.21 | % | ||||||
| Savings and Money Market | 1,128,623 | 2,724 | 0.24 | % | ||||||||
| Time Deposits | 489,246 | 4,771 | 0.98 | % | ||||||||
| Total Interest Bearing Deposits | 2,405,175 | 9,113 | 0.38 | % | ||||||||
| Federal Home Loan Bank Advances | 1 | - | 0.00 | % | ||||||||
| Subordinated Debt | 10,310 | 378 | 3.67 | % | ||||||||
| Total Interest Bearing Liabilities | 2,415,486 | $ | 9,491 | 0.39 | % | |||||||
Interest Rate Spread (4) | 3.74 | % | ||||||||||
| Demand Deposits (Non-Interest Bearing) | 1,232,874 | |||||||||||
| All Other Liabilities | 61,848 | |||||||||||
| Total Liabilities | 3,710,208 | |||||||||||
| Shareholders' Equity | 402,329 | |||||||||||
| Total Liabilities & Shareholders' Equity | $ | 4,112,537 | ||||||||||
| Impact of Non-Interest Bearing Deposits and Other Liabilities | 0.15 | % | ||||||||||
Net Interest Income and Margin on Total Earning Assets (5) | 149,599 | 3.89 | % | |||||||||
| Tax Equivalent Adjustment | (438 | ) | ||||||||||
| Net Interest Income | $ | 149,161 | 3.88 | % | ||||||||
| Year ended December 31, | ||||||||||||||||||||||||
| 2022 | 2021 | |||||||||||||||||||||||
| (Dollars in thousands) | Average Balance | Interest Income / Expense | Average Yield / Rate | Average Balance | Interest Income / Expense | Average Yield / Rate | ||||||||||||||||||
| ASSETS | ||||||||||||||||||||||||
Interest earnings deposits in other banks and federal funds sold | $ | 704,082 | $ | 12,102 | 1.72 | % | $ | 666,167 | $ | 902 | 0.14 | % | ||||||||||||
Investment securities:(1) | ||||||||||||||||||||||||
| Taxable securities | 1,044,954 | 19,678 | 1.88 | % | 838,710 | 14,646 | 1.75 | % | ||||||||||||||||
Non-taxable securities(2) | 48,168 | 1,569 | 3.26 | % | 52,384 | 1,648 | 3.15 | % | ||||||||||||||||
| Total investment securities | 1,093,122 | 21,247 | 1.94 | % | 891,094 | 16,294 | 1.83 | % | ||||||||||||||||
Loans:(3) | ||||||||||||||||||||||||
| Real estate: | ||||||||||||||||||||||||
| Commercial | 1,202,548 | 58,966 | 4.90 | % | 1,037,554 | 53,298 | 5.14 | % | ||||||||||||||||
| Agricultural | 705,222 | 35,010 | 4.96 | % | 641,086 | 29,544 | 4.61 | % | ||||||||||||||||
| Residential and home equity | 369,619 | 14,551 | 3.94 | % | 339,345 | 12,717 | 3.75 | % | ||||||||||||||||
| Construction | 182,523 | 9,788 | 5.36 | % | 182,722 | 7,965 | 4.36 | % | ||||||||||||||||
| Total real estate | 2,459,912 | 118,315 | 4.81 | % | 2,200,707 | 103,524 | 4.70 | % | ||||||||||||||||
| Commercial & industrial | 440,510 | 22,452 | 5.10 | % | 373,497 | 16,935 | 4.53 | % | ||||||||||||||||
| Agricultural | 262,461 | 14,084 | 5.37 | % | 233,544 | 10,385 | 4.45 | % | ||||||||||||||||
| Commercial leases | 94,040 | 5,702 | 6.06 | % | 98,056 | 5,485 | 5.59 | % | ||||||||||||||||
| Consumer and other | 22,008 | 3,469 | 15.76 | % | 178,535 | 10,879 | 6.09 | % | ||||||||||||||||
| Total loans and leases | 3,278,931 | 164,022 | 5.00 | % | 3,084,339 | 147,208 | 4.77 | % | ||||||||||||||||
| Non-marketable securities | 15,549 | 1,042 | 6.70 | % | 14,737 | 864 | 5.86 | % | ||||||||||||||||
| Total interest earning assets | 5,091,684 | 198,413 | 3.90 | % | 4,656,337 | 165,268 | 3.55 | % | ||||||||||||||||
| Allowance for credit losses | (62,588 | ) | (60,059 | ) | ||||||||||||||||||||
| Non-interest earning assets | 312,805 | 317,721 | ||||||||||||||||||||||
| Total average assets | $ | 5,341,901 | $ | 4,913,999 | ||||||||||||||||||||
| LIABILITIES AND SHAREHOLDERS' EQUITY | ||||||||||||||||||||||||
| Interest bearing deposits: | ||||||||||||||||||||||||
| Demand | $ | 1,120,198 | 1,497 | 0.13 | % | $ | 1,024,009 | 1,128 | 0.11 | % | ||||||||||||||
| Savings and money market accounts | 1,542,310 | 1,981 | 0.13 | % | 1,352,258 | 1,458 | 0.11 | % | ||||||||||||||||
| Certificates of deposit greater than $250,000 | 157,623 | 460 | 0.29 | % | 170,040 | 701 | 0.41 | % | ||||||||||||||||
| Certificates of deposit less than $250,000 | 215,044 | 411 | 0.19 | % | 235,746 | 730 | 0.31 | % | ||||||||||||||||
| Total interest bearing deposits | 3,035,175 | 4,349 | 0.14 | % | 2,782,053 | 4,017 | 0.14 | % | ||||||||||||||||
| Short-term borrowings | 1 | - | 0.00 | % | 1 | - | 0.00 | % | ||||||||||||||||
| Subordinated debentures | 10,310 | 491 | 4.76 | % | 10,310 | 315 | 3.06 | % | ||||||||||||||||
| Total interest bearing liabilities | 3,045,486 | 4,840 | 0.16 | % | 2,792,364 | 4,332 | 0.16 | % | ||||||||||||||||
| Non-interest bearing deposits | 1,751,797 | 1,610,611 | ||||||||||||||||||||||
| Total funding | 4,797,283 | 4,840 | 0.10 | % | 4,402,975 | 4,332 | 0.10 | % | ||||||||||||||||
| Other non-interest bearing liabilities | 76,617 | 68,778 | ||||||||||||||||||||||
| Shareholders' equity | 468,001 | 442,246 | ||||||||||||||||||||||
| Total average liabilities and shareholders' equity | $ | 5,341,901 | $ | 4,913,999 | ||||||||||||||||||||
| Net interest income | $ | 193,573 | $ | 160,936 | ||||||||||||||||||||
| Interest rate spread | 3.74 | % | 3.39 | % | ||||||||||||||||||||
Net interest margin(4) | 3.80 | % | 3.46 | % | ||||||||||||||||||||
| (1) | Excludes average unrealized (losses) gains of ($24.5) million and $3.4 million for the years ended December 31, 2022, and 2021, respectively, which are included in non-interest earning assets. |
| (2) | The average yield does not include the federal tax benefits at an assumed effective yield of 26% related to income earned on tax-exempt municipal securities totaling $415,000 and $436,000 for the years ended December 31, 2022, and 2021, respectively. |
| (3) | Loan interest income includes loan fees of $11.6 million and $17.0 million for the years ended December 31, 2022 and 2021, respectively. |
| (4) | Net interest margin is computed by dividing net interest income by average interest earning assets. |
| Year Ended December 31, 2019 | ||||||||||||
| Assets | Balance | Interest | Rate | |||||||||
| Interest Bearing Deposits with Banks | $ | 232,623 | $ | 4,909 | 2.11 | % | ||||||
| Investment Securities: | ||||||||||||
| U.S. Treasuries | 27,096 | 537 | 1.98 | % | ||||||||
| U.S. Govt SBA | 13,372 | 329 | 2.46 | % | ||||||||
| Government Agency & Government-Sponsored Entities | 2,108 | 62 | 2.94 | % | ||||||||
| Municipals - Taxable | 6,545 | 344 | 5.26 | % | ||||||||
| Obligations of States and Political Subdivisions - Non-Taxable | 51,872 | 2,079 | 4.01 | % | ||||||||
| Mortgage Backed Securities | 321,240 | 8,466 | 2.64 | % | ||||||||
| Other | 4,850 | 173 | 3.57 | % | ||||||||
| Total Investment Securities | 427,083 | 11,990 | 2.81 | % | ||||||||
| Loans & Leases: | ||||||||||||
| Real Estate | 1,736,406 | 93,227 | 5.37 | % | ||||||||
| Home Equity Lines and Loans | 90,423 | 2,316 | 2.56 | % | ||||||||
| Agricultural | 275,472 | 15,423 | 5.60 | % | ||||||||
| Commercial | 364,676 | 19,335 | 5.30 | % | ||||||||
| Consumer | 16,634 | 1,194 | 7.18 | % | ||||||||
| Other | 1,051 | 24 | 2.28 | % | ||||||||
| Leases | 104,896 | 5,718 | 5.45 | % | ||||||||
| Total Loans & Leases | 2,589,558 | 137,237 | 5.30 | % | ||||||||
| Total Earning Assets | 3,249,264 | $ | 154,136 | 4.74 | % | |||||||
| Unrealized Gain on Securities Available-for-Sale | 938 | |||||||||||
| Allowance for Credit Losses | (55,165 | ) | ||||||||||
| Cash and Due From Banks | 56,855 | |||||||||||
| All Other Assets | 225,565 | |||||||||||
| Total Assets | $ | 3,477,457 | ||||||||||
| Liabilities & Shareholders' Equity | ||||||||||||
| Interest Bearing Deposits: | ||||||||||||
| Interest Bearing DDA | $ | 668,818 | $ | 2,360 | 0.35 | % | ||||||
| Savings and Money Market | 930,390 | 3,340 | 0.36 | % | ||||||||
| Time Deposits | 519,848 | 6,940 | 1.34 | % | ||||||||
| Total Interest Bearing Deposits | 2,119,056 | 12,640 | 0.60 | % | ||||||||
| Federal Home Loan Bank Advances | 1 | - | 0.00 | % | ||||||||
| Subordinated Debt | 10,310 | 554 | 5.37 | % | ||||||||
| Total Interest Bearing Liabilities | 2,129,367 | $ | 13,194 | 0.62 | % | |||||||
| Interest Rate Spread | 4.12 | % | ||||||||||
| Demand Deposits | 949,695 | |||||||||||
| All Other Liabilities | 64,274 | |||||||||||
| Total Liabilities | 3,143,336 | |||||||||||
| Shareholders' Equity | 334,121 | |||||||||||
| Total Liabilities & Shareholders' Equity | $ | 3,477,457 | ||||||||||
| Impact of Non-Interest Bearing Deposits and Other Liabilities | 0.21 | % | ||||||||||
| Net Interest Income and Margin on Total Earning Assets | 140,942 | 4.34 | % | |||||||||
| Tax Equivalent Adjustment | (428 | ) | ||||||||||
| Net Interest Income | $ | 140,514 | 4.32 | % | ||||||||
| Year Ended December 31, 2018 | ||||||||||||
| Assets | Balance | Interest | Rate | |||||||||
| Interest Bearing Deposits with Banks | $ | 147,700 | $ | 2,755 | 1.87 | % | ||||||
| Investment Securities: | ||||||||||||
| U.S. Treasuries | 64,630 | 939 | 1.45 | % | ||||||||
| U.S. Govt SBA | 22,537 | 445 | 1.97 | % | ||||||||
| Government Agency & Government-Sponsored Entities | 3,057 | 88 | 2.88 | % | ||||||||
| Municipals - Taxable | 665 | 5 | 0.75 | % | ||||||||
| Obligations of States and Political Subdivisions - Non-Taxable | 53,143 | 2,024 | 3.81 | % | ||||||||
| Mortgage Backed Securities | 314,937 | 7,682 | 2.44 | % | ||||||||
| Other | 3,707 | 98 | 2.64 | % | ||||||||
| Total Investment Securities | 462,676 | 11,281 | 2.44 | % | ||||||||
| Loans & Leases | ||||||||||||
| Real Estate | 1,642,005 | 83,131 | 5.06 | % | ||||||||
| Home Equity Lines and Loans | 37,086 | 2,041 | 5.50 | % | ||||||||
| Agricultural | 273,178 | 14,067 | 5.15 | % | ||||||||
| Commercial | 291,209 | 15,158 | 5.21 | % | ||||||||
| Consumer | 9,014 | 503 | 5.58 | % | ||||||||
| Other | 1,356 | 31 | 2.29 | % | ||||||||
| Leases | 95,968 | 4,906 | 5.11 | % | ||||||||
| Total Loans & Leases | 2,349,816 | 119,837 | 5.10 | % | ||||||||
| Total Earning Assets | 2,960,192 | $ | 133,873 | 4.52 | % | |||||||
| Unrealized Loss on Securities Available-for-Sale | (8,151 | ) | ||||||||||
| Allowance for Credit Losses | (52,012 | ) | ||||||||||
| Cash and Due From Banks | 49,292 | |||||||||||
| All Other Assets | 199,526 | |||||||||||
| Total Assets | $ | 3,148,847 | ||||||||||
| Liabilities & Shareholders' Equity | ||||||||||||
| Interest Bearing Deposits | ||||||||||||
| Interest Bearing DDA | $ | 618,674 | $ | 1,683 | 0.27 | % | ||||||
| Savings and Money Market | 844,729 | 1,798 | 0.21 | % | ||||||||
| Time Deposits | 476,756 | 3,944 | 0.83 | % | ||||||||
| Total Interest Bearing Deposits | 1,940,159 | 7,425 | 0.38 | % | ||||||||
| Federal Home Loan Bank Advances | 36 | 1 | 2.78 | % | ||||||||
| Subordinated Debt | 10,310 | 524 | 5.08 | % | ||||||||
| Total Interest Bearing Liabilities | 1,950,505 | $ | 7,950 | 0.41 | % | |||||||
| Interest Rate Spread | 4.11 | % | ||||||||||
| Demand Deposits | 845,165 | |||||||||||
| All Other Liabilities | 45,516 | |||||||||||
| Total Liabilities | 2,841,186 | |||||||||||
| Shareholders' Equity | 307,661 | |||||||||||
| Total Liabilities & Shareholders' Equity | $ | 3,148,847 | ||||||||||
| Impact of Non-Interest Bearing Deposits and Other Liabilities | 0.14 | % | ||||||||||
| Net Interest Income and Margin on Total Earning Assets | 125,923 | 4.25 | % | |||||||||
| Tax Equivalent Adjustment | (420 | ) | ||||||||||
| Net Interest Income | $ | 125,503 | 4.24 | % | ||||||||
2020 versus 2019 Amount of Increase (Decrease) Due to Change in: | ||||||||||||
| Interest Earning Assets | Volume | Rate | Net Chg. | |||||||||
| Interest Bearing Deposits with Banks | $ | 3,529 | $ | (7,230 | ) | $ | (3,702 | ) | ||||
| Investment Securities: | ||||||||||||
| U.S. Treasuries | (105 | ) | (76 | ) | (181 | ) | ||||||
| U.S. Govt SBA | (78 | ) | (135 | ) | (213 | ) | ||||||
| Government Agency & Government-Sponsored Entities | (31 | ) | (31 | ) | (62 | ) | ||||||
| Municipals - Taxable | 223 | (54 | ) | 169 | ||||||||
| Obligations of States and Political Subdivisions - Non-Taxable | 35 | (5 | ) | 29 | ||||||||
| Mortgage Backed Securities | 3,423 | (696 | ) | 2,727 | ||||||||
| Other | 52 | (13 | ) | 40 | ||||||||
| Total Investment Securities | 3,519 | (1,010 | ) | 2,509 | ||||||||
| Loans: | ||||||||||||
| Real Estate | 7,147 | (5,180 | ) | 1,967 | ||||||||
| Home Equity | 943 | (1,431 | ) | (488 | ) | |||||||
| Agricultural | (881 | ) | (1,493 | ) | (2,374 | ) | ||||||
| Commercial | 418 | (1,811 | ) | (1,394 | ) | |||||||
Consumer (1) | (254 | ) | (156 | ) | (410 | ) | ||||||
| Other | 8,785 | 29 | 8,813 | |||||||||
| Leases | 72 | (41 | ) | 32 | ||||||||
| Total Loans | 16,229 | (10,083 | ) | 6,146 | ||||||||
| Total Earning Assets | 23,277 | (18,324 | ) | 4,953 | ||||||||
| Interest Bearing Liabilities | ||||||||||||
| Interest Bearing Deposits: | ||||||||||||
| Transaction | 547 | (1,290 | ) | (742 | ) | |||||||
| Savings | 1,147 | (1,762 | ) | (616 | ) | |||||||
| Time Deposits | (390 | ) | (1,779 | ) | (2,169 | ) | ||||||
| Total Interest Bearing Deposits | 1,304 | (4,831 | ) | (3,527 | ) | |||||||
| Other Borrowed Funds | - | - | - | |||||||||
| Subordinated Debt | - | (176 | ) | (176 | ) | |||||||
| Total Interest Bearing Liabilities | 1,304 | (5,007 | ) | (3,703 | ) | |||||||
| Total Change | $ | 21,973 | $ | (13,317 | ) | $ | 8,656 | |||||
2019 versus 2018 Amount of Increase (Decrease) Due to Change in: | ||||||||||||
| Interest Earning Assets | Volume | Rate | Net Chg. | |||||||||
| Interest Bearing Deposits with Banks | $ | 1,753 | $ | 401 | $ | 2,154 | ||||||
| Investment Securities: | ||||||||||||
| U.S. Treasuries | (1,078 | ) | 676 | (402 | ) | |||||||
| U.S. Govt SBA | (294 | ) | 178 | (116 | ) | |||||||
| Government Agency & Government-Sponsored Entities | (28 | ) | 2 | (26 | ) | |||||||
| Municipals - Taxable | 306 | 33 | 339 | |||||||||
| Obligations of States and Political Subdivisions - Non-Taxable | (66 | ) | 121 | 55 | ||||||||
| Mortgage Backed Securities | 156 | 628 | 784 | |||||||||
| Other | 35 | 41 | 76 | |||||||||
| Total Investment Securities | (969 | ) | 1,679 | 710 | ||||||||
| Loans & Leases: | ||||||||||||
| Real Estate | 4,920 | 5,176 | 10,096 | |||||||||
| Home Equity Lines and Loans | 438 | (163 | ) | 275 | ||||||||
| Agricultural | 119 | 1,237 | 1,356 | |||||||||
| Commercial | 3,890 | 287 | 4,177 | |||||||||
| Consumer | 516 | 175 | 691 | |||||||||
| Other | (7 | ) | - | (7 | ) | |||||||
| Leases | 474 | 337 | 811 | |||||||||
| Total Loans & Leases | 10,350 | 7,049 | 17,399 | |||||||||
| Total Earning Assets | 11,134 | 9,129 | 20,263 | |||||||||
| Interest Bearing Liabilities | ||||||||||||
| Interest Bearing Deposits: | ||||||||||||
| Interest Bearing DDA | 145 | 532 | 677 | |||||||||
| Savings and Money Market | 198 | 1,344 | 1,542 | |||||||||
| Time Deposits | 384 | 2,612 | 2,996 | |||||||||
| Total Interest Bearing Deposits | 727 | 4,488 | 5,215 | |||||||||
| Other Borrowed Funds | (1 | ) | - | (1 | ) | |||||||
| Subordinated Debt | - | 30 | 30 | |||||||||
| Total Interest Bearing Liabilities | 726 | 4,518 | 5,244 | |||||||||
| Total Change | $ | 10,408 | $ | 4,611 | $ | 15,019 | ||||||
Interest-bearing deposits with banks and overnight investments in Federal Funds SoldReserve balances are additional earning assets available to the Company. Average interest-bearing deposits with banks consisted primarily of FRB deposits. Balances with the FRB earnearned an average interest atrate of 1.72% and 0.14% for the Fed Funds rate, which decreased to .10% inyears ended December 2020 compared to 1.55% in December 2019.31, 2022 and 2021, respectively. The increase was primarily the result of the FRB increasing rates by 425 basis points during 2022. Average interest-bearing deposits with bankswas $704 million and $666 million for the yearyears ended December 31, 2020, was $326.2 million, an increase of $93.6 million compared to the average balance for the year ended December 31, 2019.2022 and 2021, respectively. Interest income on interest-bearing deposits with banks was $12.1 million and $902,000 for the yearyears ended December 31, 2020, decreased $3.7 million to $1.2 million from the year ended December 31, 2019.
The investment portfolio is the otheranother main component of the Company’s earning assets. Historically, the Company invested primarily in: (1) mortgage-backed securities issued by government-sponsored entities; (2) debt securities issued by the U.S. Treasury, government agencies and government-sponsored entities; and (3) investment grade bank-qualified municipal bonds. However, at certain times the Company selectively added investment grade corporate securities (floating rate and fixed rate with maturities less than 5 years) to the portfolio in order to obtain yields that exceed government agency securities of equivalent maturity. Since the risk factor for these types of investments is generally lower than that of loans &and leases, the yield earned on investments is generally less than that of loans &and leases.
Average total investment securities decreased $35.6were $1.1 billion and $891 million in 2019 compared tofor the average balance during 2018.years ended December 31, 2022 and 2021, respectively. The average yield on a tax equivalent basis, in thetotal investment portfolio was 2.81% in 2019 compared to 2.44% in 2018. This overall increase in yield was caused primarily by an increase in the mix of mortgage-backed securities as a percentage of total securitieswere 1.94% and an increase in market interest rates. As a result of the combined impact of these mix, balance and yield changes, tax equivalent interest income on securities increased slightly by $710,000 to $12.0 million1.83 % for the yearyears ended December 31, 2019, compared to $11.3 million for the year ended December 31, 2018.2022 and 2021, respectively. See “Financial Condition – Investment Securities”“Investment Securities and Federal Reserve balances” for a discussion of the Company’s investment strategy in 2019. Net interest income2022.
Average loans and leases held for investment were $3.3 billion and $3.1 billion for the years ended December 31, 2022 and 2021, respectively. The yield on the Schedule of Year-to-Date Average Balancesloan & lease portfolio was 5.00% and Interest Rates is shown4.77% for the years ended December 31, 2022 and 2021, respectively. The Company continues to experience aggressive competitor pricing for loans and leases to which it may need to respond in order to retain key customers. This could continue to place negative pressure on a tax equivalent basis, which is higher thanfuture loan & lease yields and net interest income as reflectedmargin.
Average interest-bearing liabilities was $3.0 billion and $2.8 billion for the years ended December 31, 2022 and 2021, respectively. Total interest expense on interest-bearing liabilities was $4.8 million, $4.3 million for the Consolidated Statements of Income because of adjustments that relate to incomeyears ended December 31, 2022 and 2021, respectively. The average rate paid on securities that are exempt from federal income taxes.interest-bearing liabilities was 0.16% and 0.16% for the years ended December 31, 2022 and 2021, respectively.
Year Ended December 31, 2022 compared with 2021 | ||||||||||||
| Increase (Decrease) Due to: | ||||||||||||
| (Dollars in thousands) | Volume | Rate | Net | |||||||||
| Interest income: | ||||||||||||
| Interest earnings deposits in other banks and federal funds sold | $ | 54 | $ | 11,146 | $ | 11,200 | ||||||
| Investment securities: | ||||||||||||
| Taxable securities | 3,816 | 1,216 | 5,032 | |||||||||
| Non-taxable securities | (136 | ) | 57 | (79 | ) | |||||||
| Total investment securities | 3,680 | 1,273 | 4,953 | |||||||||
| Loans: | ||||||||||||
| Real estate: | ||||||||||||
| Commercial | 7,805 | (2,137 | ) | 5,668 | ||||||||
| Agricultural | 3,081 | 2,385 | 5,466 | |||||||||
| Residential and home equity | 1,168 | 666 | 1,834 | |||||||||
| Construction | (9 | ) | 1,832 | 1,823 | ||||||||
| Total real estate | 12,045 | 2,746 | 14,791 | |||||||||
| Commercial & industrial | 3,261 | 2,256 | 5,517 | |||||||||
| Agricultural | 1,385 | 2,314 | 3,699 | |||||||||
| Commercial leases | (231 | ) | 448 | 217 | ||||||||
Consumer and other(1) | (14,475 | ) | 7,065 | (7,410 | ) | |||||||
| Total loans and leases | 1,986 | 14,828 | 16,814 | |||||||||
| Non-marketable securities | 49 | 129 | 178 | |||||||||
| Total interest income | 5,769 | 27,376 | 33,145 | |||||||||
| Interest expense: | ||||||||||||
| Interest bearing deposits: | ||||||||||||
| Demand | 113 | 256 | 369 | |||||||||
| Savings and money market accounts | 222 | 301 | 523 | |||||||||
| Certificates of deposit greater than $250,000 | (48 | ) | (193 | ) | (241 | ) | ||||||
| Certificates of deposit less than $250,000 | (60 | ) | (259 | ) | (319 | ) | ||||||
| Total interest bearing deposits | 227 | 105 | 332 | |||||||||
| Subordinated debentures | 8 | 168 | 176 | |||||||||
| Total interest expense | 235 | 273 | 508 | |||||||||
| Net interest income | $ | 5,534 | $ | 27,103 | $ | 32,637 | ||||||
(1) Consumer and other - These decreases respresent the end of the PPP loans which were $0 and $70,765 as of December 31, 2022 and 2021 respectively.
Net interest income was $193.6 million and $160.9 million for the two years ended December 31, 2022 and 2021, respectively. The increase in net interest income was driven primarily by increased interest rates and deposit growth, which we were able to partially deploy into growing our loan portfolio. The remaining increase in interest was held in interest earning deposits and investment securities.
Comparison of Results of Operations for the Years Ended December 31, 2022 and 2021
| Years Ended December 31 | ||||||||||||||||
| (Dollars in thousands) | 2022 | 2021 | $ Better / (Worse) | % Better / (Worse) | ||||||||||||
| Selected Income Statement Information: | ||||||||||||||||
| Interest income | $ | 198,413 | $ | 165,268 | $ | 33,145 | 20.06 | % | ||||||||
| Interest expense | 4,840 | 4,332 | (508 | ) | -11.73 | % | ||||||||||
| Net interest income | 193,573 | 160,936 | 32,637 | 20.28 | % | |||||||||||
| Provision for credit losses | 6,450 | 1,910 | (4,540 | ) | -237.70 | % | ||||||||||
| Net interest income after provision for credit losses | 187,123 | 159,026 | 28,097 | 17.67 | % | |||||||||||
| Non-interest income | 6,178 | 21,056 | (14,878 | ) | -70.66 | % | ||||||||||
| Non-interest expense | 93,560 | 91,761 | (1,799 | ) | -1.96 | % | ||||||||||
| Income before income tax expense | 99,741 | 88,321 | 11,420 | 12.93 | % | |||||||||||
| Income tax expense | 24,651 | 21,985 | (2,666 | ) | -12.13 | % | ||||||||||
| Net income | $ | 75,090 | $ | 66,336 | $ | 8,754 | 13.20 | % | ||||||||
Net Income. For the years ended December 31, 2022 and 2021, net income was $75.1 million compared with banks$66.3 million, respectively. The increase in net income was primarily the result of higher net interest income of $32.6 million. This increase was offset by a decrease in non-interest income of $14.9 million, higher provision for credit losses of $4.5 million, higher income tax expense of $2.7 million and overnight investmentsan increase in Federal Funds Sold are additionalnon-interest expense of $1.8 million.
Net Interest Income and Net Interest Margin. For the year ended December 31, 2022, net interest income increased $32.6 million, or 20.28%, to $193.6 million compared with $160.9 million for the same period a year earlier. The increase is the result of: (1) average interest earning assets availableincreasing $435.4 million, or 9.35%, to $5.1 billion compared with $4.7 billion for the Company. Average interest-bearing depositssame period a year earlier; and (2) the net interest margin increasing 34 basis points to 3.80% for all of 2022 compared with banks consisted3.46% for the same period a year earlier. The increase in the net interest margin was primarily the result of FRB deposits. Balances with the FRB increasing the federal funds rate over the past year.
The provision for credit losses for the year ended December 31, 2019,2022, was $232.6 million, an increase of $84.9$6.5 million compared towith $1.9 million for the average balance forsame period a year ago. For the year ended December 31, 2018. Interest income on interest-bearing deposits2022, the Company incurred net charge-offs of $0.2 million compared with banksnet recoveries of $0.2 million for the same period a year ended December 31, 2019, increased $2.2 million to $4.9 million from the year ended December 31, 2018.
Non-interest Income. Non-interest income decreased $14.9 million, or 70.66%, to $6.2 million for 2022 compared with $21.1 million for the same period a year earlier. The determinationyear-over-year decrease in non-interest income was primarily due to: (1) a $10.7 million loss on the sale of investment securities versus a $2.6 gain for the general reserve for loans or leases that are collectively evaluated for impairment is basedsame period a year earlier; and (2) $2.2 million decline in gains/(losses) on estimates made by management, to include, but not limited to, consideration of historical losses by portfolio segment, internal asset classifications, and qualitative factors that include economic trends in the Company's service areas, industry experience and trends, geographic concentrations, estimated collateral values, the Company's underwriting policies, the character of the loan & lease portfolio, and probable losses inherent in the portfolio taken as a whole.deferred compensation plan investments.
The Company maintains a separate allowance for each portfolio segment (loan & lease type). These portfolio segments include: (1) commercial real estate; (2) agricultural real estate; (3) real estate construction (including land and development loans); (4) residential 1st mortgages; (5) home equity lines and loans; (6) agricultural; (7) commercial; (8) consumer & other; and (9) equipment leases. See “Financial Condition – Loans & Leases” for examples of loans & leases made by the Company. The allowance for credit losses attributable to each portfolio segment, which includes both impaired loans & leases and loans & leases that are not impaired, is combined to determine the Company's overall allowance, which is included on the consolidated balance sheet.
| 2020 | 2019 | 2018 | 2017 | 2016 | ||||||||||||||||
| Allowance for Credit Losses Beginning of Year | $ | 55,012 | $ | 55,266 | $ | 50,342 | $ | 47,919 | $ | 41,523 | ||||||||||
| Provision Charged to Expense | 4,500 | 200 | 5,533 | 2,850 | 6,335 | |||||||||||||||
| Charge-Offs: | ||||||||||||||||||||
| Commercial Real Estate | - | - | - | 109 | - | |||||||||||||||
| Agricultural Real Estate | - | - | - | - | - | |||||||||||||||
| Real Estate Construction | - | - | - | - | - | |||||||||||||||
| Residential 1st Mortgages | - | - | 31 | 53 | 21 | |||||||||||||||
| Home Equity Lines and Loans | 7 | - | 8 | 3 | 46 | |||||||||||||||
| Agricultural | - | - | - | 374 | - | |||||||||||||||
| Commercial | 1,101 | 592 | 613 | - | - | |||||||||||||||
| Consumer & Other | 66 | 83 | 115 | 146 | 105 | |||||||||||||||
| Total Charge-Offs | 1,174 | 675 | 767 | 685 | 172 | |||||||||||||||
| Recoveries: | ||||||||||||||||||||
| Commercial Real Estate | - | - | 2 | 109 | 2 | |||||||||||||||
| Agricultural Real Estate | 81 | 38 | - | - | - | |||||||||||||||
| Real Estate Construction | - | - | - | - | - | |||||||||||||||
| Residential 1st Mortgages | 52 | 13 | 15 | 40 | 26 | |||||||||||||||
| Home Equity Lines and Loans | 78 | 28 | 6 | 8 | 103 | |||||||||||||||
| Agricultural | - | - | 61 | 17 | - | |||||||||||||||
| Commercial | 280 | 90 | 20 | 8 | 47 | |||||||||||||||
| Consumer & Other | 33 | 52 | 54 | 76 | 55 | |||||||||||||||
| Total Recoveries | 524 | 221 | 158 | 258 | 233 | |||||||||||||||
| Net (Charge-Offs) Recoveries | (650 | ) | (454 | ) | (609 | ) | (427 | ) | 61 | |||||||||||
| Total Allowance for Credit Losses, End of Year | $ | 58,862 | $ | 55,012 | $ | 55,266 | $ | 50,342 | $ | 47,919 | ||||||||||
| Ratios: | ||||||||||||||||||||
| Allowance for Credit Losses to: | ||||||||||||||||||||
| Total Loans & Leases at Year End | 1.89 | % | 2.05 | % | 2.14 | % | 2.27 | % | 2.19 | % | ||||||||||
| Average Loans & Leases | 2.00 | % | 2.12 | % | 2.35 | % | 2.31 | % | 2.34 | % | ||||||||||
| Consolidated Net (Charge-Offs) Recoveries to: | ||||||||||||||||||||
| Total Loans & Leases at Year End | (0.02 | %) | (0.02 | %) | (0.02 | %) | (0.02 | %) | 0.00 | % | ||||||||||
| Average Loans & Leases | (0.02 | %) | (0.02 | %) | (0.03 | %) | (0.02 | %) | 0.00 | % | ||||||||||
| December 31, 2020 | Commercial Real Estate | Agricultural Real Estate | Real Estate Construction | Residential 1st Mortgages | Home Equity Lines & Loans | Agricultural | Commercial | Consumer & Other | Leases | Unallocated | Total | |||||||||||||||||||||||||||||||||
| Year-To-Date Allowance for Credit Losses: | ||||||||||||||||||||||||||||||||||||||||||||
| Beginning Balance- January 1, 2020 | $ | 11,053 | $ | 15,128 | $ | 1,949 | $ | 855 | $ | 2,675 | $ | 8,076 | $ | 11,466 | $ | 456 | $ | 3,162 | $ | 192 | $ | 55,012 | ||||||||||||||||||||||
| Charge-Offs | - | - | - | - | (7 | ) | - | (1,101 | ) | (66 | ) | - | - | (1,174 | ) | |||||||||||||||||||||||||||||
| Recoveries | - | 81 | - | 52 | 78 | - | 280 | 33 | - | - | 524 | |||||||||||||||||||||||||||||||||
| Provision | 16,626 | (6,576 | ) | (306 | ) | 53 | (722 | ) | (3,262 | ) | (684 | ) | (90 | ) | (1,431 | ) | 892 | 4,500 | ||||||||||||||||||||||||||
| Ending Balance- December 31, 2019 | $ | 27,679 | $ | 8,633 | $ | 1,643 | $ | 960 | $ | 2,024 | $ | 4,814 | $ | 9,961 | $ | 333 | $ | 1,731 | $ | 1,084 | $ | 58,862 | ||||||||||||||||||||||
| Allowance Allocation at December 31, | ||||||||||||||||||||||||||||||||||||||||
| (in thousands) | 2020 Amount | Percent of Loans in Each Category to Total Loans | 2019 Amount | Percent of Loans in Each Category to Total Loans | 2018 Amount | Percent of Loans in Each Category to Total Loans | 2017 Amount | Percent of Loans in Each Category to Total Loans | 2016 Amount | Percent of Loans in Each Category to Total Loans | ||||||||||||||||||||||||||||||
| Commercial Real Estate | $ | 27,679 | 31.2 | % | $ | 11,053 | 31.6 | % | $ | 11,609 | 32.4 | % | $ | 10,922 | 31.1 | % | $ | 11,110 | 30.4 | % | ||||||||||||||||||||
| Agricultural Real Estate | 8,633 | 20.7 | % | 15,128 | 23.3 | % | 14,092 | 22.7 | % | 12,085 | 22.5 | % | 9,450 | 21.2 | % | |||||||||||||||||||||||||
| Real Estate Construction | 1,643 | 6.0 | % | 1,949 | 4.3 | % | 1,249 | 3.8 | % | 1,846 | 4.5 | % | 3,223 | 7.6 | % | |||||||||||||||||||||||||
| Residential 1st Mortgages | 960 | 9.6 | % | 855 | 9.5 | % | 880 | 10.1 | % | 815 | 11.7 | % | 865 | 10.3 | % | |||||||||||||||||||||||||
| Home Equity Lines and Loans | 2,024 | 1.1 | % | 2,675 | 1.5 | % | 2,761 | 1.6 | % | 2,324 | 1.6 | % | 2,140 | 1.7 | % | |||||||||||||||||||||||||
| Agricultural | 4,814 | 8.5 | % | 8,076 | 10.9 | % | 8,242 | 11.3 | % | 8,159 | 12.3 | % | 7,381 | 14.7 | % | |||||||||||||||||||||||||
| Commercial | 9,961 | 12.0 | % | 11,466 | 14.4 | % | 11,656 | 13.3 | % | 9,197 | 12.0 | % | 8,515 | 10.5 | % | |||||||||||||||||||||||||
| Consumer & Other | 333 | 7.6 | % | 456 | 0.6 | % | 494 | 0.8 | % | 209 | 0.3 | % | 200 | 0.3 | % | |||||||||||||||||||||||||
| Leases | 1,731 | 3.3 | % | 3,162 | 3.9 | % | 4,022 | 4.0 | % | 3,363 | 4.0 | % | 3,586 | 3.3 | % | |||||||||||||||||||||||||
| Unallocated | 1,084 | - | 192 | - | 261 | - | 1,422 | - | 1,449 | - | ||||||||||||||||||||||||||||||
| Total | $ | 58,862 | 100.0 | % | $ | 55,012 | 100.0 | % | $ | 55,266 | 100.0 | % | $ | 50,342 | 100.0 | % | $ | 47,919 | 100.0 | % | ||||||||||||||||||||
Net gains on deferred compensation plan investmentsobligations were $2.6$0.4 million in 20192022 compared to net gains of $1.1$2.6 million in 2018.2021. See Note 16,11, located in “Item 8. Financial Statements and Supplementary Data” for a description of these plans. Balances in non-qualified deferred compensation plans may be invested in financial instruments whose market value fluctuates based upon trends in interest rates and stock prices. Although Generally Accepted Accounting Principles requireGAAP requires these investment gains/losses be recorded in non-interest income, an offsetting entry is also required to be made to non-interest expense resulting in no effect on the Company’s net income.
Income Taxes
Financial Condition
Total assets grew $149.7 million, or 2.89%, to $5.3 billion at December 31, 2022 compared with $5.2 billion at December 31, 2021. Loans held for investment grew $275.2 million or 8.5% to $3.5 billion at December 31, 2022, compared with $3.2 billion at December 31, 2021. Exclusive of SBA PPP loans, the loan portfolio grew $346 million, or 10.69%, over December 31, 2021. This data constitutes non-GAAP financial data. The Company believes that excluding the temporary effect of the PPP loans furnishes useful information regarding the Company’s growth. Total deposits increased $119.1 million, or 2.57%, to $4.8 billion at December 31, 2022 compared with $4.6 billion at December 31, 2021. The increase in total assets and deposits was primarily the result of continued strong organic deposit growth.
Investment Securities and Federal Funds Sold
The Company’s investment portfolio decreased by less than 1.0%, to $1.0 billion at December 31, 2020 was $876.72022. This decrease is net of the impact of $47.7 million compared to $567.6 million at December 31, 2019, an increase of $309.1 million or 54.5%.that the Company sold for interest rate risk management purposes. The Company uses its investment portfolio to help balance its overallmanage interest rate risk. Accordingly, when market rates are increasing it invests most of its funds in shorter term Treasury and Agency securities or shorter term (10, 15 and 20 year) mortgage backed securities. Conversely, when rates are falling, 30 year mortgage backed securities or longer term Treasury and Agency securities may be increased.
liquidity risks. The Company's total investment portfolio currentlyas of December 31, 2022 represents 19.3%18.72% of the Company’s total assets as compared to 15.3%19.45% at December 31, 2019.
2021. Not included in the investment portfolio are interest bearing deposits with banks and overnight investments in Federal Funds Sold.Reserve balances. Interest bearing deposits with banks consisted primarily of FRB deposits.
The FRB currently pays interest on the deposits that banks maintain in their FRB accounts, whereas historically banks had to sell these Federal Funds to other banks in order to earn interest. Since balances at the FRB are effectively risk free, the Company elected to maintain its excess cash at the FRB. Interest bearing deposits with banks totaled $317.5$515 million at December 31, 20202022 and $223.2$663 million at December 31, 2019.2021.
The Company classifies its investmentsinvestment securities as either held-to-maturity (“HTM”), trading, or available-for-sale (“AFS”). Securities are classified as held-to-maturity and are carried at amortized cost, net of an allowance for credit losses, when the Company has the intent and ability to hold the securities to maturity. Trading securities are securities acquired for short-term appreciationSee Note 2 “Investment Securities” to the Consolidated Financial Statements in “Item 8. Financial Statements and are carried at fair value, with unrealized gains and losses recordedSupplementary Data” in non-interest income. As of December 31, 2020 and December 31, 2019, there were no securities in the trading portfolio.this Annual Report on Form 10-K. Securities classified as AFS include securities, which may be sold to effectively manage interest rate risk exposure, prepayment risk, satisfy liquidity demands and other factors. These securities are reported at fair value with aggregate, unrealized gains or losses excluded from income and included as a separate component of shareholders’ equity, net of related income taxes. As of December 31, 2022, the Company held no investment securities from any issuer (other than the U.S. Treasury or an agency of the U.S. government or a government-sponsored entity) that totaled over 10% of our shareholders’ equity.
The carrying value of our portfolio of investment securities was as follows:
| As of December 31, | ||||||||
| (Dollars in thousands) | 2022 | 2021 | ||||||
| Available-for-Sale Securities | ||||||||
| U.S. Treasury notes | $ | 4,964 | $ | 10,089 | ||||
| U.S. Government-sponsored securities | 4,427 | 6,374 | ||||||
Mortgage-backed securities(1) | 132,528 | 251,120 | ||||||
Collateralized mortgage obligations(1) | 1,054 | 2,436 | ||||||
| Corporate securities | 9,581 | - | ||||||
| Other | 310 | 435 | ||||||
| Total available-for-sale securities | $ | 152,864 | $ | 270,454 | ||||
(1) All mortgage-backed securities and collateralized mortgage obligations were issued by an agency or government sponsored entity of the U.S. Government.
| As of December 31, | ||||||||
| (Dollars in thousands) | 2022 | 2021 | ||||||
| Held-to-Maturity Securities | ||||||||
Mortgage-backed securities(1) | $ | 702,858 | $ | 596,775 | ||||
Collateralized mortgage obligations(1) | 80,186 | 73,781 | ||||||
Municipal securities(2) | 61,909 | 66,496 | ||||||
| Total held-to-maturity securities | $ | 844,953 | $ | 737,052 | ||||
(1) All mortgage-backed securities and collateralized mortgage obligations were issued by an agency or government sponsored entity of the U.S. Government.
(2) Municipal securities are net of allowance for credit losses of $393 and $0, respectively.
The following table summarizesshows the balancescarrying value for contractual maturities of investment securities and distributionsthe weighted average yields of such securities, including the benefit of tax-exempt securities:
| Investment Securities | As of December 31, 2022 | |||||||||||||||||||||||||||||||||||||||
| Within One Year | After One but Within Five Years | After Five but Within Ten Years | After Ten Years | Total | ||||||||||||||||||||||||||||||||||||
| (Dollars in thousands) | Amount | Yield | Amount | Yield | Amount | Yield | Amount | Yield | Amount | Yield | ||||||||||||||||||||||||||||||
| Debt securities available-for-sale | ||||||||||||||||||||||||||||||||||||||||
| U.S. Treasury notes | $ | 4,964 | 2.37 | % | $ | - | 0.00 | % | $ | - | 0.00 | % | $ | - | 0.00 | % | $ | 4,964 | 2.37 | % | ||||||||||||||||||||
| U.S. Government-sponsored securities | 3 | 2.17 | % | 53 | 2.29 | % | 380 | 4.52 | % | 3,991 | 4.52 | % | 4,427 | 4.29 | % | |||||||||||||||||||||||||
Mortgage-backed securities(1) | 13 | 2.82 | % | 16,460 | 2.31 | % | 15,156 | 2.41 | % | 100,899 | 1.82 | % | 132,528 | 1.95 | % | |||||||||||||||||||||||||
Collateralized mortgage obligations(1) | - | 0.00 | % | - | 0.00 | % | - | 0.00 | % | 1,054 | 2.35 | % | 1,054 | 2.35 | % | |||||||||||||||||||||||||
| Corporate securities | - | 0.00 | % | 9,581 | 3.13 | % | - | 0.00 | % | - | 0.00 | % | 9,581 | 3.13 | % | |||||||||||||||||||||||||
| Other | 310 | 4.60 | % | - | 0.00 | % | - | 0.00 | % | - | 0.00 | % | 310 | 4.60 | % | |||||||||||||||||||||||||
| Total debt securities available-for-sale | $ | 5,290 | 2.50 | % | $ | 26,094 | 2.61 | % | $ | 15,536 | 2.46 | % | $ | 105,944 | 1.93 | % | $ | 152,864 | 2.11 | % | ||||||||||||||||||||
(1) All mortgage-backed securities and collateralized mortgage obligations were issued by an agency or government sponsored entity of the investment securities held on the dates indicated.U.S. Government.
Available for Sale | Held to Maturity | Available for Sale | Held to Maturity | Available for Sale | Held to Maturity | |||||||||||||||||||
December 31: (in thousands) | 2020 | 2019 | 2018 | |||||||||||||||||||||
| U.S. Treasury Notes | $ | 15,288 | $ | - | $ | 54,995 | $ | - | $ | 164,514 | $ | - | ||||||||||||
| U.S. Government SBA | 8,160 | - | 10,798 | - | 15,447 | - | ||||||||||||||||||
| Government Agency & Government Sponsored Entities | - | - | - | - | 3,039 | - | ||||||||||||||||||
| Obligations of States and Political Subdivisions | - | 68,933 | - | 60,229 | - | 53,566 | ||||||||||||||||||
| Mortgage Backed Securities | 737,873 | - | 441,078 | - | 307,045 | - | ||||||||||||||||||
| Corporate Securities | 45,919 | - | - | - | - | - | ||||||||||||||||||
| Other | 492 | - | 515 | - | 5,351 | - | ||||||||||||||||||
| Total Book Value | $ | 807,732 | $ | 68,933 | $ | 507,386 | $ | 60,229 | $ | 495,396 | $ | 53,566 | ||||||||||||
| Fair Value | $ | 807,732 | $ | 70,049 | $ | 507,386 | $ | 61,097 | $ | 495,396 | $ | 53,738 | ||||||||||||
| As of December 31, 2022 | ||||||||||||||||||||||||||||||||||||||||
| Within One Year | After One but Within Five Years | After Five but Within Ten Years | After Ten Years | Total | ||||||||||||||||||||||||||||||||||||
| (Dollars in thousands) | Amount | Yield | Amount | Yield | Amount | Yield | Amount | Yield | Amount | Yield | ||||||||||||||||||||||||||||||
| Securities held-to-maturity | ||||||||||||||||||||||||||||||||||||||||
Mortgage-backed securities(1) | $ | - | 0.00 | % | $ | - | 0.00 | % | $ | 18,197 | 1.22 | % | $ | 684,661 | 1.90 | % | $ | 702,858 | 1.88 | % | ||||||||||||||||||||
Collateralized mortgage obligations(1) | - | 0.00 | % | - | 0.00 | % | - | 0.00 | % | 80,186 | 1.80 | % | 80,186 | 1.80 | % | |||||||||||||||||||||||||
| Municipal securities | 883 | 5.92 | % | 8,058 | 3.98 | % | 15,670 | 3.70 | % | 37,691 | 4.83 | % | 62,302 | 4.45 | % | |||||||||||||||||||||||||
| Total securities held-to-maturity | $ | 883 | 5.92 | % | $ | 8,058 | 3.98 | % | $ | 33,867 | 2.37 | % | $ | 802,538 | 2.03 | % | $ | 845,346 | 2.07 | % | ||||||||||||||||||||
| Investment Securities | As of December 31, 2021 | |||||||||||||||||||||||||||||||||||||||
| Within One Year | After One but Within Five Years | After Five but Within Ten Years | After Ten Years | Total | ||||||||||||||||||||||||||||||||||||
| (Dollars in thousands) | Amount | Yield | Amount | Yield | Amount | Yield | Amount | Yield | Amount | Yield | ||||||||||||||||||||||||||||||
| Securities available-for-sale | ||||||||||||||||||||||||||||||||||||||||
| U.S. Treasury notes | $ | 5,028 | 2.33 | % | $ | 5,061 | 2.38 | % | $ | - | 0.00 | % | $ | - | 0.00 | % | $ | 10,089 | 2.36 | % | ||||||||||||||||||||
| U.S. Government-sponsored securities | 2 | 1.80 | % | 148 | 2.29 | % | 512 | 1.55 | % | 5,712 | 1.26 | % | 6,374 | 1.30 | % | |||||||||||||||||||||||||
Mortgage-backed securities(1) | 13 | 1.50 | % | 21,155 | 2.36 | % | 50,554 | 2.36 | % | 179,398 | 1.61 | % | 251,120 | 1.83 | % | |||||||||||||||||||||||||
Collateralized mortgage obligations(1) | - | 0.00 | % | - | 0.00 | % | - | 0.00 | % | 2,436 | 2.30 | % | 2,436 | 2.30 | % | |||||||||||||||||||||||||
| Other | 435 | 3.31 | % | - | 0.00 | % | - | 0.00 | % | - | 0.00 | % | 435 | 3.31 | % | |||||||||||||||||||||||||
| Total securities available-for-sale | $ | 5,478 | 2.41 | % | $ | 26,364 | 2.36 | % | $ | 51,066 | 2.35 | % | $ | 187,546 | 1.61 | % | $ | 270,454 | 1.84 | % | ||||||||||||||||||||
(1) All mortgage-backed securities and collateralized mortgage obligations were issued by an agency or government sponsored entity of the U.S. Government.
| As of December 31, 2021 | ||||||||||||||||||||||||||||||||||||||||
| Within One Year | After One but Within Five Years | After Five but Within Ten Years | After Ten Years | Total | ||||||||||||||||||||||||||||||||||||
| (Dollars in thousands) | Amount | Yield | Amount | Yield | Amount | Yield | Amount | Yield | Amount | Yield | ||||||||||||||||||||||||||||||
| Securities held-to-maturity | ||||||||||||||||||||||||||||||||||||||||
Mortgage-backed securities(1) | $ | - | 0.00 | % | $ | - | 0.00 | % | $ | 10,641 | 0.41 | % | $ | 586,134 | 1.72 | % | $ | 596,775 | 1.70 | % | ||||||||||||||||||||
Collateralized mortgage obligations(1) | - | 0.00 | % | - | 0.00 | % | - | 0.00 | % | 73,781 | 1.71 | % | 73,781 | 1.71 | % | |||||||||||||||||||||||||
| Municipal securities | 308 | 1.10 | % | 8,487 | 2.19 | % | 18,433 | 3.42 | % | 39,268 | 4.52 | % | 66,496 | 3.90 | % | |||||||||||||||||||||||||
| Total securities held-to-maturity | $ | 308 | 1.10 | % | $ | 8,487 | 2.19 | % | $ | 29,074 | 2.32 | % | $ | 699,183 | 1.88 | % | $ | 737,052 | 1.90 | % | ||||||||||||||||||||
(1) All mortgage-backed securities and collateralized mortgage obligations were issued by an agency or government sponsored entity of the U.S. Government.
Expected maturities may differ from contractual maturities because issuers may have the right to call obligations with or without penalties including prepayments on mortgage-backed securities. The following table isCompany evaluates securities for expected credit losses at least on a summary of the relative maturitiesquarterly basis, and yields of the Company's investment securities Available-for-Sale as of December 31, 2020.
December 31, 2020 (in thousands) | Fair Value | Average Yield | ||||||
| U.S. Treasury | ||||||||
| One year or less | $ | 5,020 | 2.19 | % | ||||
| After one year through five years | 10,268 | 2.36 | % | |||||
| Total U.S. Treasury Securities | 15,288 | 2.30 | % | |||||
| U.S. Government Agency SBA | ||||||||
| After one year through five years | 333 | 2.12 | % | |||||
| After five years through ten years | 488 | 1.34 | % | |||||
| After ten years | 7,339 | 1.28 | % | |||||
| Total U.S. Government Agency SBA Securities | 8,160 | 1.31 | % | |||||
| Corporate Securities | ||||||||
| After one year through five years | 15,495 | 1.51 | % | |||||
| After five years through ten years | 30,424 | 2.12 | % | |||||
| Total Corporate Securities | 45,919 | 1.92 | % | |||||
| Other | ||||||||
| One year or less | 492 | 2.24 | % | |||||
| Total Other Securities | 492 | 2.24 | % | |||||
| Mortgage Backed Securities | 737,873 | 1.91 | % | |||||
| Total Investment Securities Available-for-Sale | $ | 807,732 | 1.91 | % | ||||
December 31, 2020 (in thousands) | Book Value | Average Yield | ||||||
| Obligations of States and Political Subdivisions | ||||||||
| One year or less | $ | 8,309 | 3.99 | % | ||||
| After one year through five years | 5,137 | 3.55 | % | |||||
| After five years through ten years | 23,493 | 3.49 | % | |||||
| After ten years | 31,994 | 4.74 | % | |||||
| Total Obligations of States and Political Subdivisions | 68,933 | 4.13 | % | |||||
| Total Investment Securities Held-to-Maturity | $ | 68,933 | 4.13 | % | ||||
Loans & and Leases
Loans &and leases can be categorized by borrowing purpose and use of funds. Common examples of loans &and leases made by the Company include:
Commercial and Agricultural Real Estate - – These are loans secured by farmland, commercialowner-occupied real estate, non-owner-occupied real estate, owner-occupied farmland, and multifamily residential properties, and other non-farm, non-residential properties generally within our market area.properties. Commercial mortgage term loans can be made if the property is either income producing or scheduled to become income producing based upon acceptable pre-leasing, andor the income will be the Bank's primary source of repayment for the loan. Loans are made both on owner occupied and investor properties; maturities generally do not exceed 15 years (and may have pricing adjustments on a shorter timeframe) amortizations of up to 25 years (30 years for multifamily residential properties); have debt service coverage ratios of 1.00 or better with a target of greater than 1.25;1.25 or greater; and fixed rates that are most often tied to treasury indices with an appropriate spread based on the amount of perceived risk in the loan.
Real Estate Construction - – These are loans for acquisition, development and construction (the Company generally requires the borrower to fund the land acquisition) and are secured by commercial or residential real estate. These loans are generally made only to experienced local developers with whom the Bank has a successful track record; for projects in our service area; with Loan Toto Value (LTV) below 75%; and where the property can be developed and sold within 2 years. Commercial construction loans are made only when there is a writtenan approved take-out commitment from the Bank or an acceptable financial institution or government agency. Most acquisition, development and construction loans are tied to the prime rate or LIBOR with an appropriate spread based on the amount of perceived risk in the loan.
Single Family Residential 1st Mortgages -Real Estate – These are loans primarily made on owner occupied residences; generally underwritten to income and LTV guidelines similar to those used by FNMA and FHLMC; however, weFHLMC. However, the Company will make loans on rural residential properties up to 4041 acres. Most residential loans have terms from ten to twentythirty years and carry fixed or variable rates priced off ofto treasury rates. The Company has always underwritten mortgage loans based upon traditional underwriting criteria and does not make loans that are known in the industry as “subprime,” “no or low doc,” or “stated income.”income” loans.
Home Equity Lines and Loans - – These are loans made to individuals for home improvements and other personal needs. Generally, amounts do not exceed $250,000;$500,000; but can be made for up to $1,000,000 in high cost counties. Combined Loan To Value (CLTV) does not exceed 80%75%; FICO scores are at or above 670; Total Debt Ratios do not exceed 43%; and in some situations the Company is in a 1st lien position.position
Agricultural - – These are non-real estate loans and lines of credit made to farmers to finance agricultural production. Lines of credit are extended to finance the seasonal needs of farmers during peak growing periods; are usually established for periods no longer than 12 to 36 months; are often secured by general filing liens on livestock, crops, crop proceeds and equipment; and are most often tied to the prime rate with an appropriate spread based on the amount of perceived risk in the loan. Term loans are primarily made for the financing of equipment, expansion or modernization of a processing plant, or orchard/vineyard development; have maturities from five to seven years; and fixed rates that are most often tied to treasury indices or variable rates tied to the prime rate with an appropriate spread based on the amount of perceived risk in the loan.
Commercial - – These are non-real estate loans and lines of credit to businesses that are sole proprietorships, partnerships, LLC’s and corporations. Lines of credit are extended to finance the seasonal working capital needs of customers during peak business periods; are usually established for periods no longer than 12 to 2436 months; are often secured by general filing liens on accounts receivable, inventory and equipment; and are most often tied to the prime rate with an appropriate spread based on the amount of perceived risk in the loan. Term loans are primarily made for the financing of equipment, expansion or modernization of a plant or purchase of a business; have maturities from five to seven years; and fixed rates that are most often tied to treasury indices or variable rates tied to the prime rate with an appropriate spread based on the amount of perceived risk in the loan.
Consumer - – These are loans to individuals for personal use, and primarily include loans to purchase automobiles or recreational vehicles, and unsecured lines of credit. The Company has a very minimal consumer loan portfolio, and loans are primarily made as an accommodation to deposit customers.portfolio.
Commercial Leases - – These are leases primarily to businesses or individuals,and farmers for the purpose of financing the acquisition of equipment. They can be either “finance leases” where the lessee retains the tax benefits of ownership but obtains 100% financing on their equipment purchases; or “true tax leases” where the Company, as lessor, places reliance on equipment residual value and in doing so obtains the tax benefits of ownership. Leases typically have a maturity of three to ten years, and fixed rates that are most often tied to treasury indices with an appropriate spread based on the amount of perceived risk. Credit risks are underwritten using the same credit criteria the Company would use when making an equipment term loan. Residual value risk is managed through the use ofwith qualified, independent appraisers that establish the residual values the Company uses in structuring a lease.
The Company accounts for leases with Investment Tax Credits (ITC)(“ITC”) under the deferred method as established in ASC 740-10. ITCITCs are viewed and accounted for as a reduction of the cost of the related assets and presented as deferred income on the Company’s financial statement.
Each loan or lease type involves risks specific to the: (1) borrower; (2) collateral; and (3) loan & lease structure. See “Results of Operations - Provision and Allowance for Credit Losses” for a more detailed discussion of risks by loan & lease type. The Company’s current underwriting policies and standards are designed to mitigate the risks involved in each loan & lease type. The Company’s policies require that loans &and leases arebe approved only to those borrowers exhibiting a clear source of repayment and the ability to service existing and proposed debt. The Company’s underwriting procedures for all loan & lease types require careful consideration of the borrower, the borrower’s financial condition, the borrower’s management capability, the borrower’s industry, and the economic environment affecting the loan or lease.
Most loans &and leases made by the Company are secured, but collateral is the secondary or tertiary source of repayment; cash flow is our primary source of repayment. The quality and liquidity of collateral are important and must be confirmed before the loan is made.
In order to be responsive to borrower needs, the Company prices loans &and leases: (1) on both a fixed rate and adjustable rate basis; (2) over different terms; and (3) based upon different rate indices;indices as long as these structures are consistent with the Company’s interest rate risk management policies and procedures. See “Item 7A. Quantitative and Qualitative Disclosures Aboutabout Market Risk-Interest Rate Risk” in this Annual Report on Form 10-K for further details.
Overall, the Company's loan & lease portfolio at December 31, 20202022 totaled $3.1$3.5 billion, an increase of $426.6$275.2 million or 16.0%8.50% over December 31, 2019.2021. Exclusive of SBA PPP loans, the loan portfolio grew $346.0 million, or 10.69%, over December 31, 2021. This increase in the non-PPP loans occurred as a result of: (1) the Company’s business development efforts directed toward credit-qualified borrowers; and (2) expansion of our service area into the East Bay of San Francisco and Napa; and (3)Napa County. This data constitutes non-GAAP financial data. The Company believes that excluding the origination of $347.4 million of PPP loans, of which $224.3 million remain outstanding at December 31, 2020 (See “Introduction - COVID-19 (Coronavirus) Disclosure” for additional information of the Company’s COVID-19 exposure). No assurances can be made that this growth in the loan & lease portfolio will continue, and it is anticipated that the remaindertemporary effect of the PPP loans will be forgiven byfurnishes useful information regarding the SBA in early 2021. However, the Company does anticipate that it will participate in the 2021 PPP which may add some additional loans.Company’s growth.
The following table sets forth the distribution of the loan & lease portfolio by type and percent at the end of each period presented:
| December 31, | ||||||||||||||||
| 2022 | 2021 | |||||||||||||||
| (Dollars in thousands) | Dollars | Percent of Total | Dollars | Percent of Total | ||||||||||||
| Gross Loans and Leases | ||||||||||||||||
| Real estate: | ||||||||||||||||
| Commercial | $ | 1,328,691 | 37.73 | % | $ | 1,167,516 | 35.95 | % | ||||||||
| Agricultural | 726,938 | 20.64 | % | 672,830 | 20.72 | % | ||||||||||
| Residential and home equity | 387,753 | 11.01 | % | 350,581 | 10.79 | % | ||||||||||
| Construction | 166,538 | 4.73 | % | 177,163 | 5.45 | % | ||||||||||
| Total real estate | 2,609,920 | 74.11 | % | 2,368,090 | 72.91 | % | ||||||||||
| Commercial & industrial | 478,758 | 13.59 | % | 427,799 | 13.17 | % | ||||||||||
| Agricultural | 314,525 | 8.93 | % | 276,684 | 8.52 | % | ||||||||||
| Commercial leases | 112,629 | 3.20 | % | 96,971 | 2.99 | % | ||||||||||
Consumer and other(1) | 5,886 | 0.17 | % | 78,367 | 2.41 | % | ||||||||||
| Total gross loans and leases | $ | 3,521,718 | 100.00 | % | $ | 3,247,911 | 100.00 | % | ||||||||
(1) Includes SBA PPP loans of $0 and $70,765 as of December 31, of the years indicated.2022 and December 31, 2021, respectively.
| 2020 | 2019 | 2018 | 2017 | 2016 | ||||||||||||||||||||||||||||||||||||
| (in thousands) | Amount | Percent | Amount | Percent | Amount | Percent | Amount | Percent | Amount | Percent | ||||||||||||||||||||||||||||||
| Commercial Real Estate | $ | 971,326 | 31.2 | % | $ | 846,486 | 31.6 | % | $ | 834,476 | 32.4 | % | $ | 691,639 | 31.1 | % | $ | 674,445 | 30.9 | % | ||||||||||||||||||||
| Agricultural Real Estate | 643,014 | 20.7 | % | 625,767 | 23.3 | % | 584,625 | 22.7 | % | 499,231 | 22.5 | % | 467,685 | 21.4 | % | |||||||||||||||||||||||||
| Real Estate Construction | 185,741 | 6.0 | % | 115,644 | 4.3 | % | 98,568 | 3.8 | % | 100,206 | 4.5 | % | 176,462 | 8.1 | % | |||||||||||||||||||||||||
| Residential 1st Mortgages | 299,379 | 9.6 | % | 255,253 | 9.5 | % | 259,736 | 10.1 | % | 260,751 | 11.7 | % | 242,247 | 11.1 | % | |||||||||||||||||||||||||
| Home Equity Lines and Loans | 34,239 | 1.1 | % | 39,270 | 1.5 | % | 40,789 | 1.6 | % | 34,525 | 1.6 | % | 31,625 | 1.4 | % | |||||||||||||||||||||||||
| Agricultural | 264,372 | 8.5 | % | 292,904 | 10.9 | % | 290,463 | 11.3 | % | 273,582 | 12.3 | % | 295,325 | 13.5 | % | |||||||||||||||||||||||||
| Commercial | 374,816 | 12.0 | % | 384,795 | 14.4 | % | 343,834 | 13.3 | % | 265,703 | 12.0 | % | 217,577 | 10.0 | % | |||||||||||||||||||||||||
Consumer & Other (1) | 235,529 | 7.6 | % | 15,422 | 0.6 | % | 19,412 | 0.8 | % | 6,656 | 0.3 | % | 6,913 | 0.3 | % | |||||||||||||||||||||||||
| Leases | 103,117 | 3.3 | % | 104,470 | 3.9 | % | 106,217 | 4.0 | % | 88,957 | 4.0 | % | 70,986 | 3.3 | % | |||||||||||||||||||||||||
| Total Gross Loans & Leases | 3,111,533 | 100.0 | % | 2,680,011 | 100.0 | % | 2,578,120 | 100.0 | % | 2,221,250 | 100.0 | % | 2,183,265 | 100.0 | % | |||||||||||||||||||||||||
| Less: Unearned Income | 11,941 | 6,984 | 6,879 | 5,955 | 5,664 | |||||||||||||||||||||||||||||||||||
| Subtotal | 3,099,592 | 2,673,027 | 2,571,241 | 2,215,295 | 2,177,601 | |||||||||||||||||||||||||||||||||||
| Less: Allowance for Credit Losses | 58,862 | 55,012 | 55,266 | 50,342 | 47,919 | |||||||||||||||||||||||||||||||||||
| Net Loans & Leases | $ | 3,040,730 | $ | 2,618,015 | $ | 2,515,975 | $ | 2,164,953 | $ | 2,129,682 | ||||||||||||||||||||||||||||||
The following table shows the maturity distribution and interest rate sensitivity of the loan portfolio of the Company on December 31, 2020.
| (in thousands) | One Year or Less | Over One Year to Five Years | Over Five Years | Total | ||||||||||||
| Commercial Real Estate | $ | 42,313 | $ | 275,256 | $ | 641,411 | $ | 958,980 | ||||||||
| Agricultural Real Estate | 22,811 | 150,752 | 469,451 | 643,014 | ||||||||||||
| Real Estate Construction | 94,364 | 87,484 | 3,893 | 185,741 | ||||||||||||
| Residential 1st Mortgages | 1,180 | 4,229 | 293,970 | 299,379 | ||||||||||||
| Home Equity Lines and Loans | 13 | 353 | 33,873 | 34,239 | ||||||||||||
| Agricultural | 155,485 | 97,736 | 11,151 | 264,372 | ||||||||||||
| Commercial | 120,994 | 199,704 | 54,118 | 374,816 | ||||||||||||
| Consumer & Other | 699 | 230,443 | 4,387 | 235,529 | ||||||||||||
| Leases | 8,517 | 50,720 | 44,285 | 103,522 | ||||||||||||
| Total | $ | 446,376 | $ | 1,096,677 | $ | 1,556,539 | $ | 3,099,592 | ||||||||
| Rate Sensitivity: | ||||||||||||||||
| Fixed Rate | $ | 66,042 | $ | 593,253 | $ | 1,027,705 | $ | 1,687,000 | ||||||||
| Variable Rate | 380,334 | 503,424 | 528,834 | 1,412,592 | ||||||||||||
| Total | $ | 446,376 | $ | 1,096,677 | $ | 1,556,539 | $ | 3,099,592 | ||||||||
| Percent | 14.40 | % | 35.38 | % | 50.22 | % | 100.00 | % | ||||||||
| Loan Contractual Maturity | ||||||||||||||||||||
| (Dollars in thousands) | One Year or Less | After One But Within Five Years | After Five But Within Fifteen Years | After Fifteen Years | Total | |||||||||||||||
| Gross loan and leases: | ||||||||||||||||||||
| Real estate: | ||||||||||||||||||||
| Commercial | $ | 61,340 | $ | 326,671 | $ | 889,041 | $ | 51,639 | $ | 1,328,691 | ||||||||||
| Agricultural | 26,588 | 172,766 | 452,249 | 75,335 | 726,938 | |||||||||||||||
| Residential and home equity | 384 | 4,143 | 117,421 | 265,805 | 387,753 | |||||||||||||||
| Construction | 94,238 | 72,300 | - | - | 166,538 | |||||||||||||||
| Total real estate | 182,550 | 575,880 | 1,458,711 | 392,779 | 2,609,920 | |||||||||||||||
| Commercial & industrial | 216,019 | 181,520 | 75,093 | 6,126 | 478,758 | |||||||||||||||
| Agricultural | 197,010 | 98,898 | 18,617 | - | 314,525 | |||||||||||||||
| Commercial leases | 45,503 | 61,377 | 5,749 | - | 112,629 | |||||||||||||||
| Consumer and other | 753 | 3,989 | 1,144 | - | 5,886 | |||||||||||||||
| Total gross loans and leases | $ | 641,835 | $ | 921,664 | $ | 1,559,314 | $ | 398,905 | $ | 3,521,718 | ||||||||||
| Rate Structure for Loans | ||||||||||||||||||||
| Fixed Rate | $ | 116,749 | $ | 475,248 | $ | 1,158,859 | $ | 255,628 | $ | 2,006,484 | ||||||||||
| Adjustable Rate | 525,086 | 446,416 | 400,455 | 143,277 | 1,515,234 | |||||||||||||||
| Total gross loans and leases | $ | 641,835 | $ | 921,664 | $ | 1,559,314 | $ | 398,905 | $ | 3,521,718 | ||||||||||
Non-Accrual Loans &and Leases - Accrual of interest on loans &and leases is generally discontinued when a loan or lease becomes contractually past due by 90 days or more with respect to interest or principal. When loans &and leases are 90 days past due, but in management's judgment are well secured and in the process of collection, they may not be classified as non-accrual.nonaccrual. When a loan or lease is placed on non-accrual status, all interest previously accrued but not collected is reversed. Income on such loans &and leases is then recognized only to the extent that cash is received and where the future collection of principal is probable. AtNon-accrual loans and leases totaled $571,000 and $516,000 for the years ended December 31, 2020, non-accrual loans & leases totaled $495,000. There were no non-accrual loans & leases at December 2019.2022 and 2021, respectively.
Restructured Loans &and Leases - A restructuring of a loan or lease constitutes a TDR under ASC 310-40, if the Company for economic or legal reasons related to the debtor's financial difficulties grants a concession to the debtorborrower that it would not otherwise consider, except when subject to the CARES Act and H.R. 133.133, as discussed below. Restructured loans or leases typically present an elevated level of credit risk, as the borrowers are not able to perform according to the original contractual terms. If the restructured loan or lease was current on all payments at the time of restructure and management reasonably expects the borrower will continue to perform after the restructure, management may keep the loan or lease on accrual. Loans &and leases that are on nonaccrualnon-accrual status at the time they become TDR loans or leases, remain on nonaccrualnon-accrual status until the borrower demonstrates a sustained period of performance, which the Company generally believes to be six consecutive months of payments, or equivalent. A loan or lease can be removed from TDR status if it was restructured at a market rate in a prior calendar year and is currently in compliance with its modified terms. However, these loans or leases continue to be classified as impairedcollateral dependent and are individually evaluated for impairment.
At December 31, 2020,2022, restructured loans totaled $7.9$1.3 million compared with $2.3 million at December 31, 2021, all of which were performingperforming. See Note 4 “Loans and at December 31, 2019, restructured loans totaled $12.1 million all of which were performing.Leases” to the Consolidated Financial Statements in “Item 8. Financial Statements and Supplementary Data” in this Annual Report on Form 10-K.
Other Real Estate - Loans whereOwned – OREO represents real property taken either through foreclosure or through a deed in lieu thereof from the collateral has been repossessed are classified as other real estate ("ORE")borrower. The Company records all OREO properties at amounts equal to or ifless than the collateral is personal property,fair market value of the loan is classified as other assetsproperties based on the Company's financial statements.current independent appraisals reduced by estimated selling costs. The Company reported $873,000 of foreclosed OREO at December 31, 2022, and at December 31, 2021.
Not included in the table below, but relevant to a discussion of asset quality are loans that were granted some form of relief because of COVID-19 and arebut were not considered TDRs because of the CARES Act and H.R. 133. Since April 2020, we have restructured $277.6$304.0 million of loans under the CARES Act and H.R. 133 guidelines (see “Part I, Introduction - COVID-19 (Coronavirus) Disclosure”). At December 31, 2022, all loans that were restructured as part of the CARES Act, have returned to the contractual terms and conditions of the loans, without exception.
The following table sets forthsummarizes the amountloans for which the accrual of the Company's non-performinginterest has been discontinued and loans & leases (defined asmore than 90 days past due and still accruing interest, including those non-accrual loans & leases plus accruingthat are troubled debt restructured loans, & leases past due 90 days or more) and ORE as of December 31 of the years indicated.OREO (as hereinafter defined):
| December 31, | ||||||||||||||||||||
| (in thousands) | 2020 | 2019 | 2018 | 2017 | 2016 | |||||||||||||||
| Non-Accrual Loans & Leases | ||||||||||||||||||||
| Commercial Real Estate | $ | - | $ | - | $ | - | $ | - | $ | - | ||||||||||
| Agricultural Real Estate | 495 | - | - | - | 1,304 | |||||||||||||||
| Real Estate Construction | - | - | - | - | - | |||||||||||||||
| Residential 1st Mortgages | - | - | - | - | 95 | |||||||||||||||
| Home Equity Lines and Loans | - | - | - | - | - | |||||||||||||||
| Agricultural | - | - | - | - | 243 | |||||||||||||||
| Commercial | - | - | - | - | 1,426 | |||||||||||||||
| Consumer & Other | - | - | - | - | 6 | |||||||||||||||
| Total Non-Accrual Loans & Leases | 495 | - | - | - | 3,074 | |||||||||||||||
| Accruing Loans & Leases Past Due 90 Days or More | ||||||||||||||||||||
| Commercial Real Estate | - | - | - | - | - | |||||||||||||||
| Agricultural Real Estate | - | - | - | - | - | |||||||||||||||
| Real Estate Construction | - | - | - | - | - | |||||||||||||||
| Residential 1st Mortgages | - | - | - | - | - | |||||||||||||||
| Home Equity Lines and Loans | - | - | - | - | - | |||||||||||||||
| Agricultural | - | - | - | - | - | |||||||||||||||
| Commercial | - | - | - | - | - | |||||||||||||||
| Consumer & Other | - | - | - | - | - | |||||||||||||||
| Total Accruing Loans & Leases Past Due 90 Days or More | - | - | - | - | - | |||||||||||||||
| Total Non-Performing Loans & Leases | $ | 495 | $ | - | $ | - | $ | - | $ | 3,074 | ||||||||||
| Other Real Estate Owned | $ | 873 | $ | 873 | $ | 873 | $ | 873 | $ | 3,745 | ||||||||||
| Total Non-Performing Assets | $ | 1,368 | $ | 873 | $ | 873 | $ | 873 | $ | 6,819 | ||||||||||
| Restructured Loans & Leases (Performing) | $ | 7,868 | $ | 12,105 | $ | 13,577 | $ | 6,301 | $ | 4,462 | ||||||||||
| Non-Performing Loans & Leases as a Percent of Total Loans & Leases | 0.02 | % | 0.00 | % | 0.00 | % | 0.00 | % | 0.14 | % | ||||||||||
| December 31, | ||||||||
| (Dollars in thousands) | 2022 | 2021 | ||||||
| Non-performing assets: | ||||||||
| Non-accrual loans and leases, not TDRs | ||||||||
| Real estate: | ||||||||
| Commercial | $ | 403 | $ | - | ||||
| Agricultural | - | 18 | ||||||
| Residential and home equity | - | - | ||||||
| Construction | 168 | - | ||||||
| Total real estate | 571 | 18 | ||||||
| Commercial & industrial | - | - | ||||||
| Agricultural | - | - | ||||||
| Commercial leases | - | - | ||||||
| Consumer and other | - | - | ||||||
| Subtotal | 571 | 18 | ||||||
| Non-accrual loans and leases, are TDRs | ||||||||
| Real estate: | ||||||||
| Commercial | - | - | ||||||
| Agricultural | - | - | ||||||
| Residential and home equity | - | - | ||||||
| Construction | - | - | ||||||
| Total real estate | - | - | ||||||
| Commercial & industrial | - | - | ||||||
| Agricultural | - | 498 | ||||||
| Commercial leases | - | - | ||||||
| Consumer and other | - | - | ||||||
| Subtotal | - | 498 | ||||||
| Total non-performing loans and leases | $ | 571 | $ | 516 | ||||
| Other real estate owned ("OREO") | $ | 873 | $ | 873 | ||||
| Total non-performing assets | $ | 1,444 | $ | 1,389 | ||||
| Performing TDRs | $ | 1,311 | $ | 1,824 | ||||
| Selected ratios: | ||||||||
| Non-performing loans to total loans and leases | 0.02 | % | 0.02 | % | ||||
| Non-performing assets to total assets | 0.03 | % | 0.03 | % | ||||
Although management believes that non-performing loans &and leases are generally well-secured and that potential losses are provided for in the Company’s allowance for credit losses, there can be no assurance that future deterioration in economic conditions and/or collateral values will not result in future credit losses. See Note 6,4. “Loans and Leases”, located in “Item 8. Financial Statements and Supplementary Data” in this Annual Report on Form 10-K for an allocation of the allowance classified to impairedcollateral dependent loans &and leases.
59
Except for: (i) those classified andfor non-performing loans &and leases discussed above; and (ii) those loans modified under the COVID-19 guidelines of the CARES Act and H.R. 133,above, the Company’s management is not aware of any loans &and leases as of December 31, 2020,2022, for which known financial problems of the borrower would cause serious doubts as to the ability of these borrowers to materially comply with their present loan or lease repayment terms, or any known events that would result in the loan or lease being designated as non-performing at some future date. However:
The State of California experienced drought conditions from 2013 through most of 2016. SinceAfter 2016, reasonable levels of rain and snow have alleviated drought conditions in California. As a result, current reservoirour primary service area, but the winter of 2020-2021 and 2021-2022 were once again dry (although 2023 has begun with significant levels are adequateof rain and snow). Despite this, the availability of water in our primary service area shouldwas not be an issue.issue for the 2022 growing season. However, the weather patterns over the past 5nine years further reinforce the fact that the long-term risks associated with the availability of water are significant.
While significant progress has been made in fighting the state and federal levels.
Allowance for Credit Losses—Loans and Leases
60
The following table sets forth the activity in our ACL for the periods indicated:
| Year Ended December 31, | ||||||||
| (Dollars in thousands) | 2022 | 2021 | ||||||
| Allowance for credit losses: | ||||||||
| Balance at beginning of year | $ | 61,007 | $ | 58,862 | ||||
| Provision / (recapture) for credit losses | 6,057 | 1,910 | ||||||
| Charge-offs: | ||||||||
| Real estate: | ||||||||
| Commercial | (170 | ) | - | |||||
| Agricultural | - | - | ||||||
| Residential and home equity | (25 | ) | - | |||||
| Construction | - | - | ||||||
| Total real estate | (195 | ) | - | |||||
| Commercial & industrial | (324 | ) | - | |||||
| Agricultural | - | - | ||||||
| Commercial leases | - | - | ||||||
| Consumer and other | (62 | ) | (44 | ) | ||||
| Total charge-offs | (581 | ) | (44 | ) | ||||
| Recoveries: | ||||||||
| Real estate: | ||||||||
| Commercial | - | - | ||||||
| Agricultural | - | - | ||||||
| Residential and home equity | 131 | 98 | ||||||
| Construction | - | - | ||||||
| Total real estate | 131 | 98 | ||||||
| Commercial & industrial | 195 | 99 | ||||||
| Agricultural | 53 | 55 | ||||||
| Commercial leases | - | - | ||||||
| Consumer and other | 23 | 27 | ||||||
| Total recoveries | 402 | 279 | ||||||
| Net charge-offs / recoveries | (179 | ) | 235 | |||||
| Balance at end of year | $ | 66,885 | $ | 61,007 | ||||
| Selected financial information: | ||||||||
| Gross loans and leases held for investment | $ | 3,512,361 | $ | 3,237,177 | ||||
| Average loans and leases | 3,278,931 | 3,084,339 | ||||||
| Non-performing loans and leases | 571 | 516 | ||||||
| Allowance for credit losses to non-performing loans and leases | 11713.66 | % | 11823.06 | % | ||||
| Net charge-offs / (recoveries) to average loans and leases | 0.01 | % | (0.01 | %) | ||||
| Provision for credit losses to average loans and leases | 0.18 | % | 0.06 | % | ||||
| Allowance for credit losses to loans and leases held for investment | 1.90 | % | 1.88 | % | ||||
The increase in ACL in both 2021 and 2022 was primarily related to higher expected probable losses inherent in the loan portfolio that was directly related to quantitative and qualitative factors associated with the current economic environment and overall growth in the loan portfolio.
The following table indicates management’s allocation of the ACL by time remaining to maturity,loan type as of each of the Company’s timefollowing dates:
| December 31, | ||||||||||||||||
| 2022 | 2021 | |||||||||||||||
| (Dollars in thousands) | Dollars | Percent of Each Loan Type to Total Loans | Dollars | Percent of Each Loan Type to Total Loans | ||||||||||||
| Allowance for credit losses: | ||||||||||||||||
| Real estate: | ||||||||||||||||
| Commercial | $ | 18,055 | 37.73 | % | $ | 28,536 | 35.95 | % | ||||||||
| Agricultural | 14,496 | 20.64 | % | 9,613 | 20.72 | % | ||||||||||
| Residential and home equity | 7,508 | 11.01 | % | 2,847 | 10.79 | % | ||||||||||
| Construction | 3,026 | 4.73 | % | 1,456 | 5.45 | % | ||||||||||
| Total real estate | 43,085 | 74.11 | % | 42,452 | 72.91 | % | ||||||||||
| Commercial & industrial | 11,503 | 13.59 | % | 11,489 | 13.17 | % | ||||||||||
| Agricultural | 10,202 | 8.93 | % | 5,465 | 8.52 | % | ||||||||||
| Commercial leases | 1,924 | 3.20 | % | 938 | 2.99 | % | ||||||||||
| Consumer and other | 171 | 0.17 | % | 663 | 2.41 | % | ||||||||||
| Total allowance for credit losses | $ | 66,885 | 100.00 | % | $ | 61,007 | 100.00 | % | ||||||||
Deposits
Total deposits in amountswere $4.76 billion and $4.64 billion as of $250,000 or more at December 31, 2020.
| (in thousands) | ||||
| Time Deposits of $250,000 or More | ||||
| Three Months or Less | $ | 63,183 | ||
| Over Three Months Through Six Months | 50,761 | |||
| Over Six Months Through Twelve Months | 51,854 | |||
| Over Twelve Months | 20,146 | |||
| Total Time Deposits of $250,000 or More | $ | 185,944 | ||
Non-interest bearing demand deposits increased to $1.76 billion, or 36.96% of total deposits, as of December 31, 2022 from $1.75 billion, or 37.72% of total deposits, as of December 31, 2021. Interest bearing deposits are comprised of interest-bearing transaction accounts, money market accounts, regular savings accounts, and (3) borrowers under the PPP depositing loan proceeds into their deposit accounts until those funds are used for operating expenses.certificates of deposit.
Demand and interest-bearing transaction accounts increased $612.8totaled $2.88 billion at December 31, 2022, an increase of $36.1 million, or 34.7% since1.27% from $2.85 billion held at December 31, 2019.2021.
Savings and money market accounts have increased $265.5$144.1 million, or 26.7% since10.29%, to $1.54 billion at December 31, 2019.2022 compared with $1.40 billion at December 31, 2021.
Certificates of deposit accounts have decreased $96.1$61.1 million, or 18.6% since15.56%, to $331.4 million at December 31, 2019.2022 compared with $392.5 million at December 31, 2021.
The following table shows the average amount and average rate paid on the categories of deposits for each of the periods presented:
| As of December 31, | ||||||||||||||||||||||||||||||||||||
| 2022 | 2021 | 2020 | ||||||||||||||||||||||||||||||||||
| (Dollars in thousands) | Average Balance | Interest Expense | Average Rate | Average Balance | Interest Expense | Average Rate | Average Balance | Interest Expense | Average Rate | |||||||||||||||||||||||||||
| Total deposits: | ||||||||||||||||||||||||||||||||||||
| Interest bearing deposits: | ||||||||||||||||||||||||||||||||||||
| Demand | $ | 1,120,198 | 1,497 | 0.13 | % | $ | 1,024,009 | 1,128 | 0.11 | % | $ | 787,306 | 1,618 | 0.21 | % | |||||||||||||||||||||
| Savings and money market | 1,542,310 | 1,981 | 0.13 | % | 1,352,258 | 1,458 | 0.11 | % | 1,128,623 | 2,724 | 0.24 | % | ||||||||||||||||||||||||
| Certificates of deposit greater than $250,000 | 157,623 | 460 | 0.29 | % | 170,040 | 701 | 0.41 | % | 220,952 | 2,535 | 1.15 | % | ||||||||||||||||||||||||
| Certificates of deposit less than $250,000 | 215,044 | 411 | 0.19 | % | 235,746 | 730 | 0.31 | % | 268,294 | 2,236 | 0.83 | % | ||||||||||||||||||||||||
| Total interest bearing deposits | 3,035,175 | 4,349 | 0.14 | % | 2,782,053 | 4,017 | 0.14 | % | 2,405,175 | 9,113 | 0.38 | % | ||||||||||||||||||||||||
| Non-interest bearing deposits | 1,751,797 | 1,610,611 | 1,232,874 | |||||||||||||||||||||||||||||||||
| Total deposits | $ | 4,786,972 | $ | 4,349 | 0.09 | % | $ | 4,392,664 | $ | 4,017 | 0.09 | % | $ | 3,638,049 | $ | 9,113 | 0.25 | % | ||||||||||||||||||
Deposits are gathered from individuals and businesses in our market areas. The interest rates paid are competitively priced for each particular deposit product and structured to meet our funding requirements. The significant increase in short-term interest rates during 2022 has placed pressure on deposit pricing, and we will continue to manage this ongoing impact through careful deposit pricing. The average cost of deposits, including non-interest bearing deposits was 0.09% for all of 2022 and all of 2021.
The following table shows deposits with a balance greater than $250,000 at December 31, 2022 and 2021:
| December 31 | ||||||||
| (Dollars in thousands) | 2022 | 2021 | ||||||
| Non-Maturity Deposits greater than $250,000 | $ | 2,872,754 | $ | 2,708,576 | ||||
| Certificates of deposit greater than $250,000, by maturity: | ||||||||
| Less than 3 months | 45,078 | 59,591 | ||||||
| 3 months to 6 months | 30,426 | 37,182 | ||||||
| 6 months to 12 months | 44,189 | 59,945 | ||||||
| More than 12 months | 9,153 | 12,147 | ||||||
| Total certificates of deposit greater than $250,000 | $ | 128,846 | $ | 168,865 | ||||
| Total deposits greater than $250,000 | $ | 3,001,600 | $ | 2,877,441 | ||||
Refer to the Year-To-Date Average Balances and Rate Schedules located in this "Item 7. Management's Discussion and Analysis of Financial Condition and Results of Operations" for information on separate deposit categories.
The Bank participates in a program wherein the State of California places time deposits with the Bank at the Bank’s option. At December 31, 2022 and 2021, the Bank had $3.0 million, of these deposits.
Federal Home Loan Bank Advances and Federal Reserve Bank Borrowings
Lines of Credit with the Federal Reserve Bank and Federal Home Loan Bank are other key sources of funds to support earning assets. These sources of funds are also used to manage the Company’s interest rate risk exposure; and, as opportunities arise, to borrow and invest the proceeds at a positive spread through the investment portfolio. There were no FHLB advances at December 31, 20202022 or 2019.2021. There were no Federal Funds purchased or advances from the FRB at December 31, 20202022 or 2019.2021.
Long-Term Subordinated Debentures
On December 17, 2003, the Company raised $10.0 million through the sale of subordinated debentures to an off-balance sheet trust and its sale of trust-preferred securities. See Note 13,9. “Long-Term Subordinated Debentures” located in “Item 8. Financial Statements and Supplementary Data.”Data” in this Annual Report on Form 10-K. Although this amount is reflected as subordinated debt on the Company’s balance sheet, under current regulatory guidelines, our TPSTrust Preferred Securities will continue to qualify as regulatory capital.
These securities accrue interest at a variable rate based upon 3-month London InterBank Offered Rate (“LIBOR”)LIBOR plus 2.85%. Interest rates reset quarterly (the next reset is March 17, 2021)2023) and the rate was 3.08%7.59% as of December 31, 2020.2022. The average rate paid for these securities was 3.66%4.76% in 20202022 and 5.37%3.06% in 2019.2021. Additionally, if the Company decided to defer interest on the subordinated debentures, the Company would be prohibited from paying cash dividends on the Company’s common stock.
Capital Resources
The Company relies primarily on capital generated through the retention of earnings to satisfy its capital requirements. The Company engages in an ongoing assessment of its capital needs in order to support business growth and to insure depositor protection. Shareholders’ Equity totaled $423.7$485.3 million at December 31, 2020,2022, and $369.3$463.1 million at the end of 2019.2021.
The Company and the Bank are subject to various regulatory capital requirements administered byadequacy guidelines as outlined under Part 324 of the federal banking agencies.FDIC Rules and Regulations. Failure to meet minimum capital requirements can initiate certain mandatory, and possibly discretionary, actions by regulators that, if undertaken, could have a direct material effect on the CompanyCompany’s and the Bank's financial statements. Under capital adequacy guidelines and the regulatory framework for prompt corrective action, the Company and the Bank must meet specific capital guidelines that involve quantitative measures of the Company’sCompany and the Bank's assets, liabilities, and certain off-balance-sheet items as calculated under regulatory accounting practices. The Company’sCompany and the Bank's capital amounts and classification are also subject to qualitative judgments by the regulators about components, risk weightings, and other factors.
The minimumCompany believes that it is currently in compliance with all of these capital level requirements applicable toand that they will not result in any restrictions on the Company andCompany’s business activity.
Management believes that the Bank are: (i) a common equitymeets the requirements to be categorized as “well capitalized” under the FDIC regulatory framework for prompt corrective action. To be categorized as well capitalized, the Bank must maintain minimum total risk-based, Tier 1 capital ratio of 4.5% of risk-weighted assets (“RWA”); (ii) a Tier 1 capital ratio of 6% of RWA; (iii) a total capital ratio of 8% of RWA;risk-based and (iv) a Tier 1 leverage ratio of 4% of total assets. A "capital conservation buffer" of 2.5% above each of the regulatory minimum capital ratios which would resultas set forth in the following minimum ratios: (i) a common equity Tier 1 capital ratiotables as of 7.0% of RWA; (ii) a Tier 1 capital ratio of 8.5% of RWA;December 31, 2022 and (iii) a total capital ratio of 10.5% of RWA. An institution will be subject to limitations on paying dividends, engaging in share repurchases, and paying discretionary bonuses if its capital level falls below the buffer amount. The Company’s subordinated debentures issued in 2003 continue to be counted as Tier 1 capital.2021.
Minimum to be Categorized as "Well Capitalized" under Prompt Corrective Action Regulations | As of December 31, | ||||||||||
| (Dollars in thousands) | 2022 | 2021 | |||||||||
| Farmers & Merchants Bancorp | |||||||||||
| CET1 capital to risk-weighted assets | N/A | 11.57 | % | 11.68 | % | ||||||
| Tier 1 capital to risk-weighted assets | N/A | 11.80 | % | 11.94 | % | ||||||
| Risk-based capital to risk-weighted assets | N/A | 13.06 | % | 13.19 | % | ||||||
| Tier 1 leverage capital ratio | N/A | 9.36 | % | 8.92 | % | ||||||
| Farmers & Merchants Bank | |||||||||||
| CET1 capital to risk-weighted assets | 6.50% | 11.79 | % | 11.91 | % | ||||||
| Tier 1 capital to risk-weighted assets | 8.00% | 11.79 | % | 11.91 | % | ||||||
| Risk-based capital to risk-weighted assets | 10.00% | 13.04 | % | 13.17 | % | ||||||
| Tier 1 leverage capital ratio | 5.00% | 9.35 | % | 8.91 | % | ||||||
On November 6, 2018,15, 2021, the Board of Directors approved an extensionreauthorized the Company’s share repurchase program for up to $20.0 million of the $20 millionCompany’s common stock repurchase program over(“Repurchase Plan”), representing approximately 4% of outstanding shareholders’ equity. Repurchases by the three-year period ending December 31, 2021. See “Item 5. Market for Registrant’s Common Equity, Related Stockholder Matters and Issuer Purchases of Equity Securities.”
may be made from time to time through open market purchases, trading plans established in accordance with SEC rules, privately negotiated transactions, or by other means. On August 5, 2008,November 8, 2022, the Board of Directors approved a Share Purchase Rights Plan (the “Rightsauthorized an extension to its share repurchase program through December 31, 2024 for an additional $20.0 million of the Company’s common stock (“Repurchase Plan”), pursuant to which the Company entered into a Rights Agreement dated August 5, 2008, with Computershare as Rights Agent. The Rights Plan was set to expire on August 5, 2018. On November 19, 2015, the Boardrepresents approximately 4% of Directors approved a seven-year extension of the term of the Rights Plan. Pursuant to an Amendment to the Rights Agreement dated February 18, 2016, the term of the Rights Plan was extended from August 5, 2018 to August 5, 2025. The extension of the term of the Rights Plan was intended as a means to continue to guard against abusive takeover tactics and was not in response to any particular proposal. See “Item 5. Market for Registrant’s Common Equity, Related Stockholder Matters and Issuer Purchases of Equity Securities” for further explanation.outstanding shareholders’ equity.
Off-Balance-Sheet Arrangements
Off-balance-sheet arrangements are any contractual arrangement to which an unconsolidatedentity is a party, under which the Company has: (1) any obligation under a guarantee contract; (2) a retained or contingent interest in assets transferred to an unconsolidated entity or similar arrangement that serves as credit, liquidity, or market risk support to that entity for such assets; (3) any obligation under certain derivative instruments; or (4) any obligation under a material variable interest held by us in an unconsolidated entity that provides financing, liquidity, market risk, or credit risk support to the Company, or engages in leasing, hedging, or research and development services with the Company. The Company had the following off balance sheet commitments as of the dates indicated.
| (in thousands) | December 31, 2020 | December 31, 2019 | ||||||
| Commitments to Extend Credit | $ | 1,040,844 | $ | 919,982 | ||||
| Letters of Credit | 18,846 | 20,346 | ||||||
| Performance Guarantees Under Interest Rate Swap Contracts Entered Into Between Our Borrowing Customers and Third Parties | 2,786 | 1,513 | ||||||
| Amount of Commitment Expiration per Period | ||||||||||||||||||||
| (Dollars in thousands) | Total Committed Amount | Less than One Year | One to Three Years | Three to Five Years | After Five Years | |||||||||||||||
| Off-balance sheet commitments | ||||||||||||||||||||
| Commitments to extend credit | $ | 1,141,036 | $ | 423,956 | $ | 203,186 | $ | 476,671 | $ | 37,223 | ||||||||||
| Standby letters of credit | 17,138 | 10,770 | 4,468 | 1,470 | 430 | |||||||||||||||
| Total off-balance sheet commitments | $ | 1,158,174 | $ | 434,726 | $ | 207,654 | $ | 478,141 | $ | 37,653 | ||||||||||
The Company's exposure to credit loss in the event of nonperformance by the other party with regard to standby letters of credit, undisbursed loan commitments, and financial guarantees is represented by the contractual notional amount of those instruments. Commitments to extend credit are agreements to lend to a customer as long as there is no violation of any condition established in the contract. The Company uses the same credit policies in making commitments and conditional obligations as it does for recorded balance sheet items. The Company may or may not require collateral or other security to support financial instruments with credit risk. Evaluations of each customer's creditworthiness are performed on a case-by-case basis.
Standby letters of credit are conditional commitments issued by the Company to guarantee performance of or payment for a customer to a third party.third-party. Most standby letters of credit are issued for 12have maturity dates ranging from 1 to 60 months or less.with final expiration in January 2027. Commitments generally have fixed expiration dates or other termination clauses and may require payment of a fee. Additionally, the Company maintains a reserve for off balance sheet commitments, which totaled $ 2.1 million and $315,000 at December 31, 201202022 and 2019. We do not anticipate any material losses as a result of these transactions.2021, respectively.
| (in thousands) | Total | 1 Year or Less | 2-3 Years | 4-5 Years | More Than 5 Years | |||||||||||||||
| Long-Term Subordinated Debentures | 10,310 | - | - | - | 10,310 | |||||||||||||||
Deferred Compensation (1) | 68,077 | 1,315 | 2,118 | 1,058 | 63,586 | |||||||||||||||
| Total | $ | 78,387 | $ | 1,315 | $ | 2,118 | $ | 1,058 | $ | 73,896 | ||||||||||
Liquidity
The Company’s methodologyability to have readily available funds sufficient to repay maturing liabilities is of primary importance to depositors, creditors and regulators. Our liquidity, represented by cash borrowing lines, federal funds and available-for-sale securities, is a result of our operating, investing and financing activities and related cash flows. In order to ensure funds are available at all times, we devote resources to projecting the amount of funds that will be required and we maintain relationships with a diversified client base so funds are accessible. Liquidity requirements can also be met through short-term borrowings or the disposition of short-term assets. We had the following borrowing lines available at December 31, 2022:
| As of December 31, 2022 | ||||||||||||||||||||
| (Dollars in thousands) | Total Credit Line Limit | Current Credit Line Available | Outstanding Amount | Remaining Credit Line Available | Value of Collateral Pledged | |||||||||||||||
| Additional liquidity sources: | ||||||||||||||||||||
| Federal Home Loan Bank | $ | 757,866 | $ | 757,866 | $ | - | $ | 757,866 | $ | 1,225,175 | ||||||||||
| Federal Reserve BIC | 650,925 | 650,925 | - | 650,925 | 883,754 | |||||||||||||||
| FHLB Fed Funds | 18,000 | 18,000 | - | 18,000 | - | |||||||||||||||
| US Bank Fed Funds | 35,000 | 35,000 | - | 35,000 | - | |||||||||||||||
| PCBB Fed Funds | 50,000 | 50,000 | - | 50,000 | - | |||||||||||||||
| Total additional liquidity sources | $ | 1,511,791 | $ | 1,511,791 | $ | - | $ | 1,511,791 | $ | 2,108,929 | ||||||||||
We believe our liquid assets and short-term borrowing credit lines are adequate to meet our cash flow needs for assessingloan funding and deposit cash withdrawal for the appropriatenessforeseeable future. As of December 31, 2022, we had $958 million in cash and unencumbered investment securities; $2.1 million in investment securities and $2.1 billion in loans pledged as collateral on short-term borrowing credit lines. We have the allowanceoption of either borrowing on our credit lines or selling these investment securities for cash flow needs.
On a long-term basis, our liquidity will be met by changing the relative distribution of our asset portfolios by reducing our investment or loan volumes, or selling or encumbering assets. Further, we will increase liquidity by soliciting higher levels of deposit accounts through promotional activities and/or borrowing from our correspondent banks as well as the FHLB. At the current time, our long-term liquidity needs primarily relate to funds required to support loan originations and commitments and deposit withdrawals.
We believe we can meet all of these needs from existing liquidity sources.
Our liquidity is applied on a regular basis and considers all loans & leases. The systematic methodology consistscomprised of three parts.primary classifications: cash flows from or used in operating activities; cash flows from or used in investing activities; and cash flows from or used in financing activities. Net cash provided by or used in operating activities has consisted primarily of net income adjusted for certain non-cash income and expense items such as the credit loss provision, investment and other amortization and depreciation.
Our primary investing activities are the origination of loans, and purchases and sales of investment securities. As of December 31, 2022, we had unfunded loan commitments of $1.1 billion and unfunded letters of credit of $17.1 million. We anticipate that we will have sufficient funds available to meet current loan commitments.
| Item 7A. | Quantitative and Qualitative Disclosures about Market Risk |
Our Asset Liability Management Committee (“ALCO”), which is impaired and there is a probabilitycomprised of loss. Management performs a detailed analysis of these loans & leases, including, but not limited to, cash flows, appraisalsmembers of the collateral, conditionsBoard of Directors and executive officers, manages market risk. ALCO monitors interest rate risk by analyzing the marketplace for liquidatingpotential impact on net interest income from potential changes in interest rates, and considers the collateral,impact of alternative strategies or changes in balance sheet structure. ALCO manages our balance sheet in part to maintain the potential impact of changes in interest rates on net interest income within acceptable ranges despite changes in interest rates.
Our exposure to interest rate risk is reviewed on at least a quarterly basis by ALCO. Interest rate risk exposure is measured using interest rate sensitivity analysis to determine our change in net interest income in the event of hypothetical changes in interest rates. If potential changes to net interest income resulting from hypothetical interest rate changes are not within risk tolerances determined by ALCO, and assessmentapproved by the full Board of Directors, Management may make adjustments to the guarantors. Management then determinesCompany’s asset and liability mix to bring interest rate risk levels within the inherent loss potentialBoard approved limits.
Net Interest Income Simulation. In order to measure interest rate risk, we used a simulation model to project changes in net interest income that result from forecasted changes in interest rates. This analysis calculates the difference between net interest income forecasted using a rising and allocates a portion offalling interest rate scenario and a net interest income forecast using a base market interest rate derived from the allowance for losses as a specific allowancecurrent treasury yield curve. The income simulation model includes various assumptions regarding the re-pricing relationships for each of our products. Many of our assets are floating rate loans, which are assumed to re-price immediately, and to the same extent as the change in market rates according to their contracted index.
Some loans and investment vehicles include the opportunity of prepayment (embedded options), and accordingly the simulation model uses national indexes to estimate these credits.prepayments and assumes the reinvestment of the proceeds at current yields. Our non-term deposit products re-price more slowly, usually changing less than the change in market rates and at our discretion.
This analysis indicates the impact of changes in net interest income for the given set of rate changes and assumptions. It assumes the balance sheet grows modestly, but that its structure will remain similar to the structure as of the period presented. It does not account for all factors that affect this analysis, including changes by management to mitigate the effect of interest rate changes or secondary impacts such as changes to our credit risk profile as interest rates change.
For the rising and falling interest rate scenarios, the base market interest rate forecast was increased or decreased, on an instantaneous and sustained basis, by segmenting the loan & lease portfolio by risk rating and into groups of loans & leases with similar characteristics in accordance with the “Contingency” topic200 basis points. As of the FASB ASC. In this second phase, groupsperiods presented, our net interest margin exposure related to these hypothetical changes in market interest rates was within the current guidelines established by us. Our simulation model highlights the fact that our balance sheet is asset sensitive, which means that our net interest income rises in a rising interest rate environment.
The ratio of variable to fixed-rate loans & leases with similar characteristics are reviewedin our loan portfolio, the ratio of short-term (maturing at a given time within 12 months) to long-term loans, and the appropriate allowance factor is appliedratio of our demand, money market and savings deposits to CDs (and their time periods), are the primary factors affecting the sensitivity of our net interest income to changes in market interest rates. Our short-term loans are typically priced at prime plus a margin, and our long-term loans are typically priced based on the historical average charge-off ratea FHLB index for each particular groupcomparable maturities, plus a margin. The composition of loansour rate-sensitive assets or leases.
Gap Analysis. Another way to measure the second element of the analysis of the allowance include, but are not limited to the following conditions that existed as of the balance sheet date:
periods presented. The Companyanalysis also utilizessets forth the results of a dynamic simulation model to quantify the estimated exposure of net interest income to sustained interest rate changes. The sensitivity of the Company’s net interest income is measured over a rolling one-year horizon.
Gap analysis has certain limitations. Measuring the volume of re-pricing or maturing assets and liabilities does not always measure the full impact on the portfolio value of equity or net interest income. Gap analysis does not account for rate caps on products, dynamic changes such as increasing prepayment speeds as interest rates decrease, basis risk, embedded options or the benefit of no-rate funding sources. The relation between product rate re-pricing and market rate changes (basis risk) is not the same for all products. The majority of interest earning assets generally re-price along with a movement in market rates, while non-term deposit rates in general move more slowly and usually incorporate only a fraction of the change in market rates.
Products categorized as a percent ofnon-rate sensitive, such as our non-interest bearing demand deposits, in the gap analysis behave like long-term fixed rate funding sources. Management uses income simulation, net interest income was a slight decrease in net interest incomerate shocks and market value of .03% if rates increase by 200 basis points and a decrease in net interest income of 0.2% if rates decline 100 basis points.
INDEX TO CONSOLIDATED FINANCIAL STATEMENTS
| Page | ||
Report of Independent Registered Public Accounting Firm (Eide Bailly LLP, San Ramon, California, PCAOB ID: 286) Report of Independent Registered Public Accounting Firm (Moss Adams LLP, San Francisco, California, PCAOB ID: 659) | ||
| Consolidated Financial Statements | ||
| Consolidated | ||
| Consolidated Statements of Income | ||
| Consolidated Statements of Comprehensive Income | ||
| Consolidated Statements of Changes in | ||
| Consolidated Statements of Cash Flows | ||
| Notes to the Consolidated Financial Statements | ||
To the Shareholders and the Board of Directors ofand Shareholders
Farmers & Merchants Bancorp
Lodi, California
Opinions on the Consolidated Financial Statements and Internal Control overOver Financial Reporting
We have audited the accompanying consolidated balance sheets of Farmers & Merchants Bancorp and subsidiaries (the “Company”) as of December 31, 20202022, and 2019, the related consolidated statements of income, comprehensive income, changes in shareholders’ equity, and cash flows for each of the three years in the periodyear then ended,December 31, 2020, and the related notes (collectively referred to as the “consolidated financial statements”). We also have audited the Company’s internal control over financial reporting as of December 31, 2020,2022, based on criteria established in 2013 Internal Control - Control—Integrated Framework (2013) issued by the Committee of Sponsoring Organizations of the Treadway Commission (COSO).
In our opinion, the consolidated financial statements referred to above present fairly, in all material respects, the consolidated financial position of the Company as of December 31, 2020 and 2019,2022, and the consolidated results of its operations and its cash flows for each of the three years in the periodyear then ended,December 31, 2020, in conformity with accounting principles generally accepted in the United States of America. Also in our opinion, the Company maintained, in all material respects, effective internal control over financial reporting as of December 31, 2020,2022, based on criteria established in 2013 Internal Control - Control—Integrated Framework (2013)issued by COSO.the Committee of Sponsoring Organizations of the Treadway Commission (COSO).
Change in Accounting Principle
As discussed in Note 1 to the consolidated financial statements, the Company has changed its method of accounting for the recognition and measurement of credit losses as of January 1, 2022 due to the adoption of the Financial Accounting Standards Board Accounting Standards Update 2016-13, Financial Instruments - Credit Losses, Measurement of Credit Losses on Financial Instruments.
Basis for Opinions
The Company’s management is responsible for these consolidated financial statements, for maintaining effective internal control over financial reporting and for its assessment of the effectiveness of internal control over financial reporting, included in the accompanying Management’s Report of Management on Internal Control overOver Financial Reporting included in Item 9A.Reporting. Our responsibility is to express an opinion on the Company’s consolidated financial statements and an opinion on the Company’s internal control over financial reporting based on our audits. We are a public accounting firm registered with the Public Company Accounting Oversight Board (United States) (“PCAOB”) and are required to be independent with respect to the Company in accordance with the U.S. federal securities laws and the applicable rules and regulations of the Securities and Exchange Commission and the PCAOB.
We conducted our audits in accordance with the standards of the PCAOB. Those standards require that we plan and perform the audits to obtain reasonable assurance about whether the consolidated financial statements are free of material misstatement, whether due to error or fraud, and whether effective internal control over financial reporting was maintained in all material respects.
Our auditsaudit of the consolidated financial statements included performing procedures to assess the risks of material misstatement of the consolidated financial statements, whether due to error or fraud, and performing procedures to respondthat responds to those risks. Such procedures included examining, on a test basis, evidence regarding the amounts and disclosures in the consolidated financial statements. Our auditsaudit also included evaluating the accounting principles used and significant estimates made by management, as well as evaluating the overall presentation of the consolidated financial statements. Our audit of internal control over financial reporting included obtaining an understanding of internal control over financial reporting, assessing the risk that a material weakness exists, and testing and evaluating the design and operating effectiveness of internal control based on the assessed risk. Our audits also included performing such other procedures as we considered necessary in the circumstances. We believe that our audits provide a reasonable basis for our opinions.
Definition and Limitations of Internal Control Over Financial Reporting
Because of its inherent limitations, internal control over financial reporting may not prevent or detect misstatements. Also, projections of any evaluation of effectiveness to future periods are subject to the risk that controls may become inadequate because of changes in conditions, or that the degree of compliance with the policies or procedures may deteriorate.
Critical Audit Matter
The critical audit matter communicated below is a matter arising from the current periodcurrent-period audit of the consolidated financial statements that was communicated or required to be communicated to the audit committee and that (1) relatesrelate to accounts or disclosures that are material to the consolidated financial statements and (2) involved our especially challenging, subjective, or complex judgments. The communication of critical audit matters does not alter in any way our opinion on the consolidated financial statements, taken as a whole, and we are not, by communicating the critical audit matter below, providing a separate opinion on the critical audit matter or on the accounts or disclosures to which it relates.
Allowance for Credit Losses – Loans and Leases
The Company has a gross loan portfolio of $3.5 billion and related allowance for credit losses (ACL) of $66.9 million as of December 31, 2022. As describeddiscussed in Notes 1 and 6 to& 5 of the Company’s consolidated financial statements, the Company’s consolidated allowance forACL represents management’s estimate of expected credit losses balance was $58.8 million at December 31, 2020. The allowance for credit losses is an estimate of probable incurred credit losses inherent inover the Company’s loan & lease portfolio as of the balance sheet date. The overall allowance consists of three primary components: specific reserves related to impaired loans & leases; general reserves for inherent losses related to loans & leases that are not impaired; and an unallocated component that takes into account the imprecision in estimating and allocating allowance balances associated with macro factors. The determination of the general reserve for loans & leases that are collectively evaluated for impairment is based on estimates made by management, to include, but not limited to, consideration of historical losses by portfolio segment, internal asset classifications, and qualitative factors that include economic trends in the Company's service areas, industry experience and trends, geographic concentrations, estimated collateral values, the Company's underwriting policies, the charactercontractual life of the loan & leaseportfolio. The ACL is estimated using relevant available information relating to past events, current economic conditions, and reasonable and supportable forecasts, as well as qualitative adjustments applied on a portfolio and probable losses inherent in the portfolio taken as a whole.
Auditing these complex judgments and trends, geographic concentrations, estimated collateral values, the Company's underwriting policies, and the character of the loan & lease portfolio, and are based on management’s evaluation of available internal and external data andassumptions involves significant management judgement. Auditing management’s judgments regarding the determination of risk ratings and qualitative factors appliedespecially challenging auditor judgment due to the allowance for credit losses involved a high degreenature and extent of subjectivity.audit evidence and effort required to address these matters, including the extent of specialized skill or knowledge needed.
Our considerations and procedures we performed to address this critical audit matter included:
| • | Obtaining an understanding of the Company’s process for establishing the ACL, including the models selected by management to estimate quantitative components of the ACL and qualitative adjustments made to the ACL. This includes the process utilized by management to challenge the model results and determine the best estimate of the ACL as of the balance sheet date. |
| • | Evaluating the design and testing the operating effectiveness of controls relating to the development and approval of the ACL methodology, management’s identification, determination and controls related to the significant assumptions used in the models, controls around the reliability and accuracy of the data used in the models, analysis of the ACL results and management’s review and approval of the ACL. |
| • | Determining whether the loan portfolio is segmented by similar risk characteristics by comparing to the Company’s business environment and relevant industry practices. |
| • | Evaluating the identification and measurement of the qualitative adjustments, including the basis for concluding an adjustment was warranted and compared the adjustments utilized by management to both internal portfolio metrics and external macroeconomic data to support the adjustments and evaluated the trends in such adjustments. We searched for and evaluated information that corroborates or contradicts management’s identification and measurement of qualitative factors. |
| • | Testing the completeness and accuracy of internal loan level data used as the basis for the calculation, including management’s controls. |
| • | Testing the mathematical accuracy and computation of the ACL. |
/s/ Eide Bailly LLP
We have served as the
San Ramon, California
March 15, 2023
Report of Independent Registered Public Accounting Firm
To the Shareholders and operating effectivenessthe Board of controls relating to management’s calculationDirectors of
Farmers & Merchants Bancorp
Opinion on the Financial Statements
We have audited the accompanying consolidated statement of financial condition of Farmers & Merchants Bancorp and subsidiaries (the “Company”) as of December 31, 2021, the related consolidated statements of income, comprehensive income, changes in shareholders’ equity, and cash flows for each of the allowance for credit losses, including controls overyears in the accuracy of risk ratings of loanstwo-year period ended December 31, 2021, and the determinationrelated notes (collectively referred to as the “consolidated financial statements”). In our opinion, the consolidated financial statements present fairly, in all material respects, the consolidated financial position of the qualitative factors used.Company as of December 31, 2021, and the consolidated results of its operations and its cash flows for each of the years in the two-year period ended December 31, 2021, in conformity with accounting principles generally accepted in the United States of America.
Basis for Opinion
These consolidated financial statements are the responsibility of the Company’s management. Our responsibility is to express an opinion on the Company’s consolidated financial statements based on our audits. We are a risk-based targeted selection of loanspublic accounting firm registered with the Public Company Accounting Oversight Board (United States) (“PCAOB”) and are required to gain substantive evidence thatbe independent with respect to the Company is appropriately rating these loans in accordance with its policies,the U.S. federal securities laws and the applicable rules and regulations of the Securities and Exchange Commission and the PCAOB.
We conducted our audits in accordance with the standards of the PCAOB. Those standards require that we plan and perform the risk ratings for the loans are reasonable.
Our audits included performing procedures to assess the risks of material misstatement of the consolidatedfinancial statements, whether due to error or fraud, and performing procedures to respond to those risks. Such procedures included examining, on a test basis, evidence regarding the amounts and disclosures in the calculationconsolidated financial statements. Our audits also included evaluating the accounting principles used and significant estimates made by management, as well as evaluating the overall presentation of the allowanceconsolidated financial statements. We believe that our audits providea reasonable basis for credit losses are supported by the analysis provided by management and are used in a manner consistent with management’s established policies and procedures.our opinion.
/s/ Moss Adams LLP
Sacramento, California
March 15, 202116, 2022
We have served as the Company’s auditor since 2013.from 2013 through 2022.
Farmers & Merchants Bancorp
CONSOLIDATED STATEMENTS OF FINANCIAL CONDITION
| |||||||||||||||||||||||||||||||||||||||||||||||||||||||||||||||||||||||||||||||||||||||||||||||||||||||||||||||||||||||||||||||||||||||||||||||||||||||||||||||||||||||||||||||||||||||||||||||||||||||||||||||||||||||||||||||||||||||||||||||||||||||||||||||||||||||||||||||||||||||||||||||||||||||||||||||||||||||||||||||||||||||||||||||||||||||||||||||||||||||||||||||||||||||||||||||||||||||||||||||||||||
| December 31, | ||||||||
| Assets | 2020 | 2019 | ||||||
| Cash and Cash Equivalents: | ||||||||
| Cash and Due from Banks | $ | 66,327 | $ | 71,564 | ||||
| Interest Bearing Deposits with Banks | 317,510 | 223,194 | ||||||
| Total Cash and Cash Equivalents | 383,837 | 294,758 | ||||||
| Investment Securities: | ||||||||
| Available-for-Sale, amortized cost $789,175, and $502,693, respectively | 807,732 | 507,386 | ||||||
| Held-to-Maturity, fair value $70,049 and $61,097, respectively | 68,933 | 60,229 | ||||||
| Total Investment Securities | 876,665 | 567,615 | ||||||
| Loans & Leases: | 3,099,592 | 2,673,027 | ||||||
| Less: Allowance for Credit Losses | 58,862 | 55,012 | ||||||
| Loans& Leases, Net | 3,040,730 | 2,618,015 | ||||||
| Premises and Equipment, Net | 50,147 | 45,271 | ||||||
| Bank Owned Life Insurance, Net | 69,235 | 67,148 | ||||||
| Interest Receivable and Other Assets | 129,839 | 129,023 | ||||||
| Total Assets | $ | 4,550,453 | $ | 3,721,830 | ||||
| Liabilities | ||||||||
| Deposits: | ||||||||
| Demand | $ | 1,475,425 | $ | 1,067,187 | ||||
| Interest-Bearing Transaction | 902,487 | 697,952 | ||||||
| Savings and Money Market | 1,260,487 | 994,958 | ||||||
| Time | 421,868 | 517,922 | ||||||
| Total Deposits | 4,060,267 | 3,278,019 | ||||||
| Subordinated Debentures | 10,310 | 10,310 | ||||||
| Interest Payable and Other Liabilities | 56,211 | 64,205 | ||||||
| Total Liabilities | 4,126,788 | 3,352,534 | ||||||
| Commitments & Contingencies (See Note 19) | 0 | 0 | ||||||
| Shareholders’ Equity | ||||||||
| Preferred Stock: NaN Par Value, 1,000,000 Shares Authorized, NaN Issued or Outstanding | 0 | 0 | ||||||
| Common Stock: Par Value $0.01, 7,500,000 Shares Authorized, 789,646 and 793,033 | ||||||||
| Shares Issued and Outstanding at December 31, 2020 and 2019, respectively. | 8 | 8 | ||||||
| Additional Paid-In Capital | 77,516 | 79,947 | ||||||
| Retained Earnings | 333,070 | 286,036 | ||||||
| Accumulated Other Comprehensive Income, Net of Taxes | 13,071 | 3,305 | ||||||
| Total Shareholders’ Equity | 423,665 | 369,296 | ||||||
| Total Liabilities and Shareholders’ Equity | $ | 4,550,453 | $ | 3,721,830 | ||||
See accompanying notes are an integral part of theseto the consolidated financial statementsstatements.
Farmers & Merchants Bancorp
Consolidated Statements of Income
| Year Ended December 31, | ||||||||||||
| (Dollars in thousands, except share and per share amounts) | 2022 | 2021 | 2020 | |||||||||
| Interest income | ||||||||||||
| Interest and fees on loans and leases | $ | 164,022 | $ | 147,208 | $ | 143,383 | ||||||
| Interest and dividends on securities | 22,289 | 17,158 | 14,704 | |||||||||
| Interest on deposits with others | 12,102 | 902 | 1,207 | |||||||||
| Total interest income | 198,413 | 165,268 | 159,294 | |||||||||
| Interest expense | ||||||||||||
| Deposits | 4,349 | 4,017 | 9,113 | |||||||||
| Subordinated debentures | 491 | 315 | 378 | |||||||||
| Total interest expense | 4,840 | 4,332 | 9,491 | |||||||||
| Net interest income | 193,573 | 160,936 | 149,803 | |||||||||
| Provision for credit losses | 6,450 | 1,910 | 4,500 | |||||||||
| Net interest income after provision for credit losses | 187,123 | 159,026 | 145,303 | |||||||||
| Non-interest income | ||||||||||||
| Card processing | 7,123 | 6,959 | 5,536 | |||||||||
| Service charges on deposit accounts | 2,794 | 2,972 | 2,637 | |||||||||
| Increase in cash surrender value of BOLI | 2,233 | 2,175 | 2,088 | |||||||||
| Net (loss)/gain on sale of investment securities available-for-sale | (10,689 | ) | 2,554 | 40 | ||||||||
| Net gain on deferred compensation benefits | 451 | 2,614 | 1,777 | |||||||||
| Other | 4,266 | 3,782 | 2,976 | |||||||||
| Total non-interest income | 6,178 | 21,056 | 15,054 | |||||||||
| Non-interest expense | ||||||||||||
| Salaries and employee benefits | 64,250 | 63,860 | 56,950 | |||||||||
| Net gain on deferred compensation benefits | 451 | 2,614 | 1,777 | |||||||||
| Occupancy | 4,717 | 4,675 | 4,640 | |||||||||
| Data Processing | 4,968 | 4,967 | 4,994 | |||||||||
| FDIC insurance | 1,444 | 1,237 | 517 | |||||||||
| Marketing | 1,324 | 1,097 | 922 | |||||||||
| Legal | 737 | 140 | 128 | |||||||||
| Other | 15,669 | 13,171 | 12,478 | |||||||||
| Total non-interest expense | 93,560 | 91,761 | 82,406 | |||||||||
| INCOME BEFORE INCOME TAXES | 99,741 | 88,321 | 77,951 | |||||||||
| Income tax expense | 24,651 | 21,985 | 19,217 | |||||||||
| NET INCOME | $ | 75,090 | $ | 66,336 | $ | 58,734 | ||||||
| Earnings per common share: | ||||||||||||
Basic | $ | 96.55 | $ | 84.01 | $ | 74.03 | ||||||
| Diluted | $ | 96.55 | $ | 84.01 | $ | 74.03 | ||||||
| Weighted average number of common shares | ||||||||||||
Basic | 777,726 | 789,646 | 793,337 | |||||||||
Diluted | 777,726 | 789,646 | 793,337 | |||||||||
| Year Ended December 31, | ||||||||||||
| 2020 | 2019 | 2018 | ||||||||||
| Interest Income | ||||||||||||
| Interest and Fees on Loans & Leases | $ | 143,383 | $ | 137,237 | $ | 119,837 | ||||||
| Interest on Deposits with Banks | 1,207 | 4,909 | 2,755 | |||||||||
| Interest on Investment Securities: | ||||||||||||
| Taxable | 12,391 | 9,911 | 9,257 | |||||||||
| Exempt from Federal Tax | 1,671 | 1,651 | 1,604 | |||||||||
| Total Interest Income | 158,652 | 153,708 | 133,453 | |||||||||
| Interest Expense | ||||||||||||
| Deposits | 9,113 | 12,640 | 7,425 | |||||||||
| Borrowed Funds | 0 | 0 | 1 | |||||||||
| Subordinated Debentures | 378 | 554 | 524 | |||||||||
| Total Interest Expense | 9,491 | 13,194 | 7,950 | |||||||||
| Net Interest Income | 149,161 | 140,514 | 125,503 | |||||||||
| Provision for Credit Losses | 4,500 | 200 | 5,533 | |||||||||
| Net Interest Income After Provision for Credit Losses | 144,661 | 140,314 | 119,970 | |||||||||
| Non-Interest Income | ||||||||||||
| Service Charges on Deposit Accounts | 2,637 | 3,673 | 3,479 | |||||||||
| Net Gain (Loss) on Sales Investment Securities | 40 | 1 | (1,260 | ) | ||||||||
| Increase in Cash Surrender Value of Bank Owned Life Insurance | 2,088 | 2,031 | 1,900 | |||||||||
| Debit Card and ATM Fees | 5,536 | 5,120 | 4,365 | |||||||||
| Net Gain on Deferred Compensation Investments | 1,777 | 2,625 | 1,088 | |||||||||
| Other | 3,618 | 3,791 | 5,647 | |||||||||
| Total Non-Interest Income | 15,696 | 17,241 | 15,219 | |||||||||
| Non-Interest Expense | ||||||||||||
| Salaries and Employee Benefits | 56,950 | 55,250 | 50,054 | |||||||||
| Net Gain on Deferred Compensation Plan Investments | 1,777 | 2,625 | 1,088 | |||||||||
| Occupancy | 4,640 | 4,295 | 3,905 | |||||||||
| Equipment | 4,994 | 4,921 | 4,303 | |||||||||
| Marketing | 922 | 1,254 | 1,232 | |||||||||
| Legal | 128 | 2,347 | 968 | |||||||||
| FDIC Insurance | 517 | 624 | 912 | |||||||||
| Acquisition Expenses | 0 | 0 | 2,933 | |||||||||
| Other | 12,478 | 10,926 | 10,064 | |||||||||
| Total Non-Interest Expense | 82,406 | 82,242 | 75,459 | |||||||||
| Income Before Provision for Income Taxes | 77,951 | 75,313 | 59,730 | |||||||||
| Provision for Income Taxes | 19,217 | 19,277 | 14,203 | |||||||||
| Net Income | $ | 58,734 | $ | 56,036 | $ | 45,527 | ||||||
| Basic and Diluted Earnings Per Common Share | $ | 74.03 | $ | 71.18 | $ | 56.82 | ||||||
See accompanying notes are an integral part of theseto the consolidated financial statementsstatements.
FARMERS & MERCHANTS BANCORP
Consolidated Statements of Comprehensive Income
| Year Ended December 31, | ||||||||||||
| (Dollars in thousands) | 2022 | 2021 | 2020 | |||||||||
| Net income | $ | 75,090 | $ | 66,336 | $ | 58,734 | ||||||
| Other comprehensive income | ||||||||||||
| Unrealized holding (losses)/gains on available-for-sale debt securities | (39,015 | ) | (17,986 | ) | 13,905 | |||||||
| Reclassification adjustment for losses/(gains) on available-for-sale debt securities | 10,689 | (2,554 | ) | (40 | ) | |||||||
| Amortization of unrealized loss on debt securities transferred to held-to-maturity | (238 | ) | (457 | ) | - | |||||||
| Net unrealized holding (losses)/gains on available-for-sale debt securities | (28,564 | ) | (20,997 | ) | 13,865 | |||||||
| Income tax benefit/(expense) | 8,445 | 6,207 | (4,099 | ) | ||||||||
| Other comprehensive (loss)/income, net of tax | (20,119 | ) | (14,790 | ) | 9,766 | |||||||
| Total comprehensive income | $ | 54,971 | $ | 51,546 | $ | 68,500 | ||||||
| Year Ended December 31, | ||||||||||||
| 2020 | 2019 | 2018 | ||||||||||
| Net Income | $ | 58,734 | $ | 56,036 | $ | 45,527 | ||||||
| Other Comprehensive Loss | ||||||||||||
| Net Unrealized Gain (Loss) on Available-for-Sale Securities | 13,905 | 8,936 | (4,343 | ) | ||||||||
| Deferred Tax (Benefit) Expense Related to Unrealized (Gain) Losses | (4,099 | ) | (2,642 | ) | 1,284 | |||||||
| Reclassification Adjustment for Realized (Gain) Loss on Sales of Available-for-Sale Securities Included in Net Income | (40 | ) | (1 | ) | 1,260 | |||||||
| Deferred Tax Related to Reclassification Adjustment | 0 | 0 | (372 | ) | ||||||||
| Total Other Comprehensive Income (Loss) | 9,766 | 6,293 | (2,171 | ) | ||||||||
| Comprehensive Income | $ | 68,500 | $ | 62,329 | $ | 43,356 | ||||||
See accompanying notes are an integral part of theseto the consolidated financial statementsstatements.
Farmers & Merchants Bancorp Consolidated Statements of Changes |
| (Dollars in thousands, except share and per share amounts) | Common Shares | Amount | Additional Paid-In Capital | Retained Earnings | Accumulated Other Comprehensive (Loss)/Income | Total | ||||||||||||||||||
Balance as of January 1, 2020 | 793,033 | $ | 8 | $ | 79,947 | $ | 286,036 | $ | 3,305 | $ | 369,296 | |||||||||||||
| Net income | - | - | - | 58,734 | - | 58,734 | ||||||||||||||||||
| Other comprehensive income, net of tax | - | - | - | - | 9,766 | 9,766 | ||||||||||||||||||
Cash dividends declared ($14.75 per share) | - | - | - | (11,700 | ) | - | (11,700 | ) | ||||||||||||||||
| Issuance of common stock | 523 | - | 403 | - | - | 403 | ||||||||||||||||||
Repurchase of common stock | (3,910 | ) | - | (2,834 | ) | - | - | (2,834 | ) | |||||||||||||||
Balance as of December 31, 2020 | 789,646 | $ | 8 | $ | 77,516 | $ | 333,070 | $ | 13,071 | $ | 423,665 | |||||||||||||
| Net income | - | - | - | 66,336 | - | 66,336 | ||||||||||||||||||
| Other comprehensive loss, net of tax | - | - | - | - | (14,790 | ) | (14,790 | ) | ||||||||||||||||
Cash dividends declared ($15.30 per share) | - | - | - | (12,075 | ) | - | (12,075 | ) | ||||||||||||||||
Balance as of December 31, 2021 | 789,646 | $ | 8 | $ | 77,516 | $ | 387,331 | $ | (1,719 | ) | $ | 463,136 | ||||||||||||
| Net income | - | - | - | 75,090 | - | 75,090 | ||||||||||||||||||
| Other comprehensive loss, net of tax | - | - | - | - | (20,119 | ) | (20,119 | ) | ||||||||||||||||
Cash dividends declared ($16.15 per share) | - | - | - | (12,489 | ) | - | (12,489 | ) | ||||||||||||||||
Repurchase of common stock | (21,309 | ) | - | (20,310 | ) | - | - | (20,310 | ) | |||||||||||||||
Balance as of December 31, 2022 | 768,337 | $ | 8 | $ | 57,206 | $ | 449,932 | $ | (21,838 | ) | $ | 485,308 | ||||||||||||
See accompanying notes to the consolidated financial statements.
Common Shares Outstanding | Common Stock | Additional Paid-In Capital | Retained Earnings | Accumulated Other Comprehensive (Loss) Income | Total Shareholders’ Equity | |||||||||||||||||||
| Balance, January 1, 2018 | 812,304 | $ | 8 | $ | 93,624 | $ | 206,845 | $ | (817 | ) | $ | 299,660 | ||||||||||||
| Net Income | 45,527 | 45,527 | ||||||||||||||||||||||
| Cash Dividends Declared on Common Stock ($13.90 per share) | (11,151 | ) | (11,151 | ) | ||||||||||||||||||||
| Repurchase of Common Stock | (44,503 | ) | (31,152 | ) | (31,152 | ) | ||||||||||||||||||
| Issuance of Common Stock | 15,920 | 10,502 | 10,502 | |||||||||||||||||||||
| Change in Net Unrealized Loss on Securities Available-for-Sale | (2,171 | ) | (2,171 | ) | ||||||||||||||||||||
| Balance, December 31, 2018 | 783,721 | $ | 8 | $ | 72,974 | $ | 241,221 | $ | (2,988 | ) | $ | 311,215 | ||||||||||||
| Net Income | 56,036 | 56,036 | ||||||||||||||||||||||
| Cash Dividends Declared on Common Stock ($14.20 per share) | (11,221 | ) | (11,221 | ) | ||||||||||||||||||||
| Issuance of Common Stock | 9,312 | 6,973 | 6,973 | |||||||||||||||||||||
| Change in Net Unrealized Gain on Securities Available-for-Sale | 6,293 | 6,293 | ||||||||||||||||||||||
| Balance, December 31, 2019 | 793,033 | $ | 8 | $ | 79,947 | $ | 286,036 | $ | 3,305 | $ | 369,296 | |||||||||||||
| Net Income | 58,734 | 58,734 | ||||||||||||||||||||||
| Cash Dividends Declared on Common Stock ($14.75 per share) | (11,700 | ) | (11,700 | ) | ||||||||||||||||||||
| Repurchase of Common Stock | (3,910 | ) | (2,834 | ) | (2,834 | ) | ||||||||||||||||||
| Issuance of Common Stock | 523 | 403 | 403 | |||||||||||||||||||||
| Change in Net Unrealized Gain on Securities Available-for-Sale | 9,766 | 9,766 | ||||||||||||||||||||||
| Balance, December 31, 2020 | 789,646 | $ | 8 | $ | 77,516 | $ | 333,070 | $ | 13,071 | $ | 423,665 | |||||||||||||
Farmers & Merchants Bancorp
Consolidated Statements of Cash Flows
| Year Ended December 31, | ||||||||||||
| (Dollars in thousands) | 2022 | 2021 | 2020 | |||||||||
| Cash flows from operating activities: | ||||||||||||
| Net income | $ | 75,090 | $ | 66,336 | $ | 58,734 | ||||||
| Adjustments to reconcile net income to net cash provided by operating activities: | ||||||||||||
| Provision for credit losses | 6,450 | 1,910 | 4,500 | |||||||||
| Depreciation and amortization | 2,428 | 2,632 | 2,769 | |||||||||
| Net amortization of securities premiums and discounts | 376 | 1,446 | 1,159 | |||||||||
| Increase in cash surrender value of BOLI | (2,233 | ) | (2,175 | ) | (2,088 | ) | ||||||
| Decrease/(increase) in deferred income taxes, net | 4,330 | (880 | ) | (1,962 | ) | |||||||
| Loss/(gains) on sale of securities available-for-sale | 10,689 | (2,554 | ) | (40 | ) | |||||||
| Net changes in: | ||||||||||||
Other assets | (8,262 | ) | (12,432 | ) | (818 | ) | ||||||
| Other liabilities | 12,910 | 5,680 | (4,135 | ) | ||||||||
| Net cash provided by operating activities | 101,778 | 59,963 | 58,119 | |||||||||
| Cash flows from investing activities: | ||||||||||||
| Net change in loans held for investment | (275,061 | ) | (137,216 | ) | (427,049 | ) | ||||||
| Purchase of available-for-sale securities | (10,217 | ) | (257,231 | ) | (670,550 | ) | ||||||
| Purchase of held-to-maturity securities | (173,907 | ) | (395,176 | ) | (22,020 | ) | ||||||
| Purchase of non-marketable securities | - | (2,856 | ) | - | ||||||||
| Proceeds from sales, maturities, calls and pay downs of available-for-sale securities | 88,504 | 458,855 | 383,257 | |||||||||
| Proceeds from maturities, calls and pay downs of held-to-maturity securities | 65,493 | 43,287 | 13,299 | |||||||||
| Purchase of premises and equipment | (4,190 | ) | (2,069 | ) | (7,709 | ) | ||||||
| Purchase of other investments | (6,600 | ) | (8,192 | ) | (6,063 | ) | ||||||
| Redemption of other investments | - | 2,752 | - | |||||||||
| Proceeds from bank-owned life insurance | 606 | - | - | |||||||||
| Proceeds from sale of assets | 73 | 1,696 | 81 | |||||||||
| Net cash used in investing activities | (315,299 | ) | (296,150 | ) | (736,754 | ) | ||||||
| Cash flows from financing activities: | ||||||||||||
| Net increase in deposits | 119,117 | 579,885 | 782,248 | |||||||||
| Cash dividends paid | (12,489 | ) | (12,075 | ) | (11,700 | ) | ||||||
| Net cash used in share repurchase of common stock | (20,310 | ) | - | (2,834 | ) | |||||||
| Net provided by financing activities | 86,318 | 567,810 | 767,714 | |||||||||
| Net change in cash and cash equivalents | (127,203 | ) | 331,623 | 89,079 | ||||||||
| Cash and cash equivalents, beginning of year | 715,460 | 383,837 | 294,758 | |||||||||
| Cash and cash equivalents, end of year | $ | 588,257 | $ | 715,460 | $ | 383,837 | ||||||
| Supplemental disclosures of cash flow information: | ||||||||||||
| Cash paid for interest | $ | 5,785 | $ | 4,369 | $ | 10,903 | ||||||
| Income taxes paid | $ | 12,469 | $ | 29,941 | $ | 9,581 | ||||||
| Issuance of common stock | $ | - | $ | - | $ | 403 | ||||||
| Supplemental disclosures of non-cash transactions: | ||||||||||||
| Investment securities available-for-sale transferred to held-to-maturity | $ | - | $ | 316,925 | $ | - | ||||||
| Unrealized (losses)/gains on securities available for sale | $ | 28,326 | $ | 20,540 | $ | (13,865 | ) | |||||
| Lease liabilities arising from obtaining right-of-use assets | $ | - | $ | 295 | $ | - | ||||||
| Year Ended December 31, | ||||||||||||
| 2020 | 2019 | 2018 | ||||||||||
| Operating Activities | ||||||||||||
| Net Income | $ | 58,734 | $ | 56,036 | $ | 45,527 | ||||||
| Adjustments to Reconcile Net Income to Net Cash Provided by Operating Activities: | ||||||||||||
| Provision for Credit Losses | 4,500 | 200 | 5,533 | |||||||||
| Depreciation and Amortization | 2,769 | 2,756 | 2,421 | |||||||||
| (Benefit) Provision for Deferred Income Taxes | (1,962 | ) | (3,254 | ) | 5,462 | |||||||
| Net Amortization of Investment Security Premiums & Discounts | 1,159 | 510 | 861 | |||||||||
| Amortization of Core Deposit Intangible | 626 | 639 | 228 | |||||||||
| Accretion of Discount on Acquired Loans | (166 | ) | (47 | ) | (153 | ) | ||||||
| Net (Gain) Loss on Sale of Investment Securities | (40 | ) | (1 | ) | 1,260 | |||||||
| Net Loss (Gain) on Sale of Property & Equipment | (32 | ) | 87 | (273 | ) | |||||||
| Earnings from Equity Investment | 0 | 0 | (66 | ) | ||||||||
| Dividends from Equity Investment | 0 | 0 | 63 | |||||||||
| Gain on Remeasurement of Previously Held Equity Investment | 0 | 0 | (997 | ) | ||||||||
| Net Change in Operating Assets & Liabilities: | ||||||||||||
| Net (Increase) Decrease in Interest Receivable and Other Assets | (3,333 | ) | 18,949 | (2,098 | ) | |||||||
| Net (Decrease) Increase in Interest Payable and Other Liabilities | (4,136 | ) | 4,983 | 6 | ||||||||
| Net Cash Provided by Operating Activities | 58,119 | 80,858 | 57,774 | |||||||||
| Investing Activities: | ||||||||||||
| Purchase of Investment Securities Available-for-Sale | (670,550 | ) | (652,280 | ) | (465,414 | ) | ||||||
| Proceeds from Sold, Matured, or Called Securities Available-for-Sale | 383,257 | 644,244 | 550,727 | |||||||||
| Purchase of Investment Securities Held-to-Maturity | (22,020 | ) | (16,376 | ) | (9,813 | ) | ||||||
| Proceeds from Matured, or Called Securities Held-to-Maturity | 13,299 | 10,871 | 10,647 | |||||||||
| Net Loans & Leases Paid, Originated or Acquired | (427,573 | ) | (102,413 | ) | (276,066 | ) | ||||||
| Principal Collected on Loans & Leases Previously Charged Off | 524 | 220 | 158 | |||||||||
| Cash Paid for Acquisition, Net | 0 | 0 | (5,987 | ) | ||||||||
| Additions to Premises and Equipment, Net | (7,709 | ) | (15,537 | ) | (4,577 | ) | ||||||
| Purchase of Other Investments | (6,063 | ) | (4,400 | ) | (5,750 | ) | ||||||
| Proceeds from Sale of Property & Equipment | 81 | 41 | 986 | |||||||||
| Net Cash Used in Investing Activities | (736,754 | ) | (135,630 | ) | (205,089 | ) | ||||||
| Financing Activities: | ||||||||||||
| Net Increase in Deposits | 782,248 | 215,187 | 148,033 | |||||||||
| Stock Repurchases | (2,834 | ) | 0 | (31,152 | ) | |||||||
| Cash Dividends | (11,700 | ) | (11,221 | ) | (11,151 | ) | ||||||
| Net Cash Provided by Financing Activities | 767,714 | 203,966 | 105,730 | |||||||||
| Net Change in Cash and Cash Equivalents | 89,079 | 149,194 | (41,585 | ) | ||||||||
| Cash and Cash Equivalents at Beginning of Year | 294,758 | 145,564 | 187,149 | |||||||||
| Cash and Cash Equivalents at End of Year | $ | 383,837 | $ | 294,758 | $ | 145,564 | ||||||
| Supplementary Data | ||||||||||||
| Cash Payments Made for Income Taxes | $ | 9,581 | $ | 7,342 | $ | 7,971 | ||||||
| Issuance of Common Stock to the Bank’s Non-Qualified Retirement Plans | $ | 403 | $ | 6,973 | $ | 10,502 | ||||||
| Interest Paid | $ | 10,903 | $ | 11,755 | $ | 7,731 | ||||||
| Supplementary Noncash Disclosure | ||||||||||||
| Lease Liabilities Arising from Obtaining Right-of-Use Assets | $ | 0 | $ | 5,645 | $ | 0 | ||||||
| Acquisitions: | ||||||||||||
| Fair Value of Assets Acquired | $ | 0 | $ | 0 | $ | 234,456 | ||||||
| Fair Value of Liabilities Acquired | $ | 0 | $ | 0 | $ | 192,809 | ||||||
See accompanying notes are an integral part of theseto the consolidated financial statementsstatements.
FARMERS & MERCHANTS BANCORP
NOTES TO CONSOLIDATED STATEMENTS
Note 1—Summary of Significant Accounting Policies
Nature of Operations and basis of consolidation—Farmers & Merchants Bancorp (the “Company”(“FMCB”) was organized March 10, 1999. Primary operations are related to traditional banking activities through its subsidiaryis a Delaware corporation headquartered in Lodi, California and is the bank holding company for Farmers & Merchants Bank of Central California (the “Bank” or “F&M Bank” and together with FMCB, the “Company”). The Company operates all business activities through the Bank, which was establishedorganized in 1916. The Bank’s wholly owned subsidiaries include Farmers & Merchants Investment CorporationF&M Bank is a California state-chartered bank. F&M Bank operates under the supervision of the California Department of Financial Protection and Farmers/Merchants Corp. Farmers & Merchants Investment Corporation has been dormant since 1991. Farmers/Merchants Corp. acts as trustee on deeds of trust originatedInnovation (“DFPI”), and its deposits are insured by the Federal Deposit Insurance Corporation (“FDIC”). F&M Bank is not a member of the Federal Reserve System; however, FMCB operates as a bank holding company under the Federal Bank Holding Company Act of 1956, subject to and under the supervision of and examination by the Board of Governors of the Federal Reserve System (“FRB”) and is the sole shareholder of F&M Bank. Both FMCB and F&M Bank are subject to periodic examination by these applicable federal and state regulatory agencies and file periodic reports and other information with the agencies. The Company considers F&M Bank to be its sole operating segment.
The Company’s other wholly ownedwholly-owned subsidiaries include F & M Bancorp, Inc. and FMCB Statutory Trust I. F & M Bancorp, Inc. was created in March 2002 to protect the name F & M Bank. During 2002, the Company completed a fictitious name filing in California to begin using the streamlined name “F & M Bank” as part of a larger effort to enhance the Company’s image and build brand name recognition. In December 2003, the Company formed a wholly owned subsidiary, FMCB Statutory Trust I, for the sole purpose of issuing Trust Preferred Securities and related subordinated debentures, indebentures. In accordance with generally accepted accounting principles in the United States (“U.S. GAAP”)., FMCB Statutory Trust I is a non-consolidated subsidiary.
F&M Bank provides a broad complement of Rio Vista, headquartered in Rio Vista, California,lending products, including commercial, commercial real estate, real estate construction, agribusiness, consumer, credit card, residential real estate loans, and equipment leases. Commercial products include term loans, leases, lines of credit and other working capital financing and letters of credit. Financing products for individuals include automobile financing, lines of credit, residential real estate, home improvement and home equity lines of credit.
F&M Bank also offers a locally ownedwide range of deposit products. These include checking, savings, money market, time certificates of deposit, individual retirement accounts and operated community bank established in 1904. Asonline banking services for both business and personal accounts.
F&M Bank offers a wide range of specialized services designed for the acquisition date,needs of its commercial accounts. These services include a credit card program for merchants, lockbox and other collection services, account reconciliation, investment sweep, on-line account access, and electronic funds transfers by way of domestic and international wire and automated clearinghouse.
Note 1—Summary of Significant Accounting Policies—Continued
F&M Bank of Rio Vista had approximately $217.5 million in assetsmakes investment products available to customers, including mutual funds and 3 branch locations in the communities of Rio Vista, Walnut Grove,annuities. These investment products are offered through a third-party, which employs investment advisors to meet with and Lodi. Since the Company had a 39.65% interest in Bank of Rio Vista priorprovide investment advice to the acquisition of the remaining interest, the transaction was accounted for as a business combination achieved in stages or a step acquisition. The Company, through an independent valuation, remeasured its previously held equity interest in Bank of Rio Vista at fair value, which resulted in a gain for the excess of the acquisition-date fair value over its carrying value of $997,000 which is included in other non-interest income in the consolidated statements of income. At the effective time of the acquisition, Bank of Rio Vista was merged into Farmers & Merchants Bank of Central California.Company’s customers.
The accounting and reporting policiesconsolidated financial statements of the Company conform to U.S. GAAPinclude the accounts of FMCB together with the Bank. All intercompany transactions and prevailing practice within the banking industry.balances have been eliminated.
Use of estimates — The accompanyingpreparation of consolidated financial statements and notes thereto have been prepared in accordanceconformity with accounting principles generally accepted in the United States of America for financial information.
Reclassifications — Certain amounts in the prior years'years’ financial statements and related footnote disclosures have been reclassified to conform to the current-yearcurrent year’s presentation. These reclassifications hadThere was no effectimpact on previously reported net income or total shareholders’ equity.retained earnings as a result of any reclassification.
Investment Securities
securities — Investment securities are classified at the time of purchase as held-to-maturity (“HTM”) if it is management’s intent andwhen the Company has the positive intent and ability to hold the securities untilto maturity. TheseInvestment securities are carried at cost, adjusted for amortization of premium over the term through the earliest call date and accretion of discount using a level yield of interest over the estimated remaining period until maturity. Losses, reflecting a decline in value judged by the Company to be other than temporary, are recognized in the period in which they occur.
Allowance for Credit Losses – Securities— Management measures expected credit losses on quoted market prices or broker/dealer price quotationsheld-to- maturity debt securities on a specific identification basis. Gains orcollective basis by major security type. The Company’s HTM portfolio contains securities issued by U.S. government entities and agencies and municipalities. The Company uses industry historical credit loss information adjusted for current conditions to establish the allowance for credit losses on its HTM municipal bond portfolio. Further information regarding our policies and methodology used to estimate the sale of theseallowance for credit losses on held-to-maturity securities are computed using the specific identification method.is presented in Note 2 – Investment securities.
Note 1—Summary of Significant Accounting Policies—Continued
For available-for-sale debt securities in an unrealized loss position, management considers the extent and duration of the unrealized loss, and the financial condition and near-term prospects of the issuer. Management alsoCompany first assesses whether it intends to sell, or it is more likely than not that it will be required to sell athe security in an unrealized loss position before recovery of its amortized cost basis. If either of the criteria regarding intent or requirementCompany intends to sell the security or it is met,more likely than not that, the Company will be required to sell the security before recovering its cost basis, the entire difference between amortized costimpairment loss would be recognized in earnings. If the Company does not intend to sell the security and it is not more likely than not that, the Company will be required to sell the security, the Company evaluates whether the decline in fair value has resulted from credit losses or other factors. In making this assessment, management considers the extent to which fair value is recognized as impairment through earnings. For debt securitiesless than amortized cost, any changes to the rating of the security by a rating agency, and adverse conditions specifically related to the security, among other factors. If this assessment indicates that do not meeta credit loss exists, the aforementioned criteria,present value of cash flows expected to be collected from the security are compared to the amortized cost basis of the security. Projected cash flows are discounted by the current effective interest rate. If the present value of cash flows expected to be collected is less than the amortized cost basis, a credit loss exists and an allowance for credit losses is recorded for the credit loss, limited by the amount ofthat the fair value is less than the amortized cost basis. The remaining impairment is split into 2 components as follows: (1) OTTI related to credit loss, which must be recognized in the income statement; and (2) OTTI related toall other factors, which is recognized in other comprehensive income. The credit loss is defined as the difference between the present value of the cash flows expected to be collected and fair value, is recognized as a charge to AOCI.
Changes in the amortized cost basis.allowance for credit losses-securities are recorded as provision for (or reversal of) credit losses. Losses are charged against the allowance when management believes the non-collectability of an available-for-sale security is confirmed or when either criteria regarding intent of requirement to sell is met.
Loans & Leases
and leases held for investment — Loans & leasesthat management has the intent and ability to hold for the foreseeable future or until maturity or pay-off are reported at their outstanding principal balance adjusted for any charge-offs, the allowance for loan losses, any deferred fees or costs on originated loans and unamortized premiums or discounts on acquired loans. Interest income is accrued on the unpaid principal amount outstandingbalance. Loan origination fees, net of unearned discounts and deferred loan & lease fees and costs. Interest income on loans & leases is accrued daily on the outstanding balances using the simple interest method. Loan & leasecertain direct origination feescosts, are deferred and recognized overas an adjustment of the contractual liferelated loan yield using the effective interest method.
Non-Accrual Loans and Leases - Accrual of theinterest on loans and leases is generally discontinued when a loan or lease as an adjustment to the yield. Loans & leases are placed on non-accrual status when the collection of principal or interest is in doubt or when they becomebecomes contractually past due forby 90 days or more unless theywith respect to interest or principal. When loans and leases are both well-secured90 days past due, but in management’s judgment are well secured and in the process of collection. For this purpose, a loan or lease is considered well-secured if it is collateralized by property having a net realizable value in excess of the amount of the loan or lease or is guaranteed by a financially capable party.collection, they may not be classified as non-accrual. When a loan or lease is placed on non-accrual status, theall interest previously accrued but not collected is reversed. Income on such loans and unpaid interest receivableleases is reversed and charged against current income; thereafter, interest income isthen recognized only as itto the extent that cash is collected in cash. Additionally, cash would be applied toreceived and where the future collection of principal if all principal was not expected to be collected. Loans & leases placed on non-accrual status are returned to accrual status when the loans or leases are paid current as to principal and interest and future payments are expected to be made in accordance with the contractual terms of the loan or lease.is probable.
81
FARMERS & leases are either: (1) non-accrual loans & leases; or (2) restructured loans & leases that are still accruing interest. Loans or leases determined to be impaired are individually evaluated for impairment. When a loan or lease is impaired, the Company measures impairment based on the present value of expected future cash flows discounted at the loan or lease's effective interest rate, except that as a practical expedient, it may measure impairment based on a loan or lease's observable market price, or the fair value of the collateral if the loan or lease is collateral dependent. A loan or lease is collateral dependent if the repayment of the loan or lease is expected to be provided solely by the underlying collateral.MERCHANTS BANCORP
Note 1—Summary of Significant Accounting Policies—Continued
Restructured loan and leases — A restructuring of a loan or lease constitutes a
Generally, the Company will not restructure loans or leases for borrowers unless: (1) the existing loan or lease is brought current as to principal and interest payments; and (2) the restructured loan or lease can be underwritten to reasonable underwriting standards. If these standards are not met other actions will be pursued (e.g., foreclosure) to collect outstanding loan or lease amounts. After restructure, a determination is made whether the loan or lease will be kept on accrual status based upon the underwriting and historical performance of the restructured credit.
On March 27, 2020, the Coronavirus Aid, Relief and Economic Security Act (“CARES Act”) was signed into law and was amended and extended by the Consolidated Appropriations Act of 2021 (“H.R. 133”) on December 21, 2020. The CARES Act and H.R. 133 provide financial institutions, under specific circumstances, the opportunity to temporarily suspend certain requirements under generally accepted accounting principles related to modifications for a limited period of time to account for the effects of COVID-19. In March 2020, a joint statement was issued by federal and state regulatory agencies, after consultation with the FASB, to clarify that short-term loan modifications are not TDRs if made on a good-faith basis in response to COVID-19 to borrowers who were current prior to any relief. Under this guidance, six months is provided as an example of short-term, and current is defined as less than 30 days past due at the time the modification program is implemented. The guidance also provides that these modified loans generally will not be classified as nonaccrual during the term of the modification. See “Note 2 – Risks and Uncertainties” for additional information onAs of December 31, 2022, all loans that were restructured as part of the CARES Act H.R. 133have returned to the contractual terms and conditions of the impact of COVID-19 on the Company.loans, without exception.
Note 1—Summary of Significant Accounting Policies—Continued
Allowance for Credit Losses
— Loans —The allowancemethodology for credit losses is an estimate of probable incurred credit losses inherent in the Company's loan & lease portfolio as of the balance sheet date. The allowance is established through a provision for credit losses, which is charged to expense. Additions to the allowance are expected to maintain the adequacy of the total allowance after credit losses and loan & lease growth. Credit exposures determined to be uncollectible are charged against the allowance. Cash received on previously charged off amounts is recorded as a recovery to the allowance. The overall allowance consists of 3 primary components: specific reserves related to impaired loans & leases; general reserves for inherent losses related to loans & leases that are not impaired; and an unallocated component that takes into account the imprecision in estimating and allocating allowance balances associated with macro factors.
The ACL is a valuation account that is deducted from the amortized cost basis of loans to present the relative risks innet amount expected to be collected on the portfolio, current economic conditions and other factors. Ifloans. The provision for credit losses reflects the Boardamount required to maintain the ACL at an appropriate level based upon management’s evaluation of Directors and management determine that changes are warranted based on those reviews, the allowance is adjusted. In addition, the Company's and Bank's regulators, including the Federal Reserve Board (“FRB”), the Department of Financial Protection and Innovation (“DFPI”) and the Federal Deposit Insurance Corporation (“FDIC”), as an integral part of their examination process, review the adequacy of loss reserves. The Company increases its ACL by charging provisions for credit losses on its consolidated statement of income. Losses related to specific assets are applied as a reduction of the allowance. These regulatory agencies may require additionscarrying value of the assets and charged against the ACL when management believes a loan balance is uncollectable. Recoveries on previously charged off loans are credited to the allowance based on their judgment about information available at the time of their examinations.ACL.
Management will incorporate reasonable and supportable information in order to calculate CECL reserves. This includes the ability to reliably forecast and document exogenous events that may affect the credit performance of the Company’s loan portfolio. Management is confident with its ability to effectively identify
Note 1—Summary of Significant Accounting Policies—Continued
historical loss information by the appropriate portfolio segmentation. In addition, Management believes that it can reasonably obtain historical loss information by its respective peers to further improve historical loss information. Additionally, the Company believes that it can effectively evaluate the potential impact that both macro and micro-economic conditions can have on its loan portfolio. Management is also comfortable that it can rely on weighted average maturity calculations, including estimated prepayments with its existing third party Asset/Liability Management (“ALM”) applications.
Management determined that the most effective approach to segment its portfolio and to extract the relevant information it needed to calculate its CECL reserves was to utilize the seventeen loan segments used in preparing regulatory Call Reports. This allows Management the ability to obtain historical loss information for itself as well as its peer group. Additionally, Management’s ALM application also utilizes a similar loan segmentation in calculating weighted average remaining terms.
The foundation of CECL modeling is the ability to estimate expected credit losses over the lifetime of a loan. Management must use relevant available information about past events (e.g. historical losses) current conditions, and reasonable and supportable forecasts about future conditions. Historical losses serve as the starting point to estimate expected credit losses. When available, historical losses should include cumulative actual losses incurred over the lifetime of the various loan segments of the loans being evaluated. In cases where such information is not available, companies may need to rely on external data, such as peer data of historical losses for similar loan segments.
Management has determined to use a “through-the-cycle” historical credit loss experience as its baseline for historical credit losses. Management has determined a representative period for a full credit cycle would be from 2008 to 2022 (fifteen-year credit cycle). Management has collected historical loss information on its own loan portfolio as well as peer group information by the seventeen loan segments over this time horizon using information available from the Federal regulators on the Uniform Bank Performance Report (“UBPR”).
Federal Regulators have placed the Company also maintainsinto a separate allowancepeer group of banks with assets between $3 billion to $10 billion. This peer group segmentation includes 181 banks across the nation. The model calculates the mean historical loss rate over the 15-year economic cycle for off-balance-sheet commitments. both the Bank and its peer group. The model calculates the stressed historical loss rate over the 15-year economic cycle for both the Bank and its peer group.
Management estimates anticipated losses using historical dataevaluates macro and utilization assumptions. The allowance for off-balance-sheet commitments is includedmicro economic information as well as internal trends in Interest Payable and Other Liabilitiescredit performance on the Company’s Consolidated Balance Sheet.loan portfolio to determine where they believe it is in an economic credit cycle. Depending upon estimations of what point in the credit cycle the current economy may exist, management adjusts, on a quantitative basis, historical loss rates either upwards or downwards from the mean. If Management believes we are nearing the end on a credit cycle, the Company may adjust historical losses in increments higher from the mean (e.g. one standard deviation from the mean). If the Company believes that we are in the recovery stage of a credit cycle, it may adjust historical losses downwards from the mean. Management understands that historical credit losses may not exactly follow a normal bell-shaped curve, but that the approach provides consistency across all loan segments as well as a measured probability of credit loss coverage.
Management evaluated current economic metrics as its basis to determine that it believes that the U.S. economy is at the beginning of an economic recession. Based on this determination, management has used a one-standard deviation from the mean to capture 68.2% of all credit losses over the 15-year economic cycle.
Note 1—Summary of Significant Accounting Policies—Continued
Management used the duration of each loan segment to estimate the remaining life of loans to ensure that the model covers credit losses over the expected life of such loans.
Management will continue to employ the use of qualitative factors as defined by the Interagency Policy Statement on the Allowance for Loan and Lease Losses (“SR 2006-17”). Management will consider qualitative or environmental factors that are likely to cause estimated credit losses associated with our existing portfolio to differ from historical loss experience, as defined in the Interagency Guidance, including but not limited to:
| ◾ | Changes in lending policies and procedures, including changes in underwriting standards and collection, charge-off, and recovery practices not considered elsewhere in estimating credit losses. |
| ◾ | Changes in international, national, regional, and local economic and business conditions and developments that affect the collectability of the portfolio, including the condition of various market segments. |
| ◾ | Changes in the nature and volume of the portfolio and in the terms of loans. |
| ◾ | Changes in the experience, ability, and depth of lending management and other relevant staff. |
| ◾ | Changes in the volume and severity of past due loans, the volume of non-accrual loans, and the volume and severity of adversely classified or graded loans. |
| ◾ | Changes in the quality of the institution’s loan review system. |
| ◾ | Changes in the value of underlying collateral for collateral-dependent loans. |
| ◾ | The existence and effect of any concentrations of credit, and changes in the level of such concentrations. |
| ◾ | The effect of other external factors such as competition and legal and regulatory requirements on the level of estimated credit losses in the institution’s existing portfolio. |
These qualitative factors are applied primarily to our agriculture and agricultural real estate loan exposure.
Premises and equipment — Land is carried at cost. Premises and equipment are carried at cost, net of accumulated depreciation and amortization. Depreciation and amortization expense is computed using the straight-line method based on the estimated useful lives of the related assets below:
| Building and building improvements | 30 to 40 years |
| Leasehold improvements | term of lease |
| Furniture and equipment | 3 to 7 years |
| Computers, software and equipment | 3 to 7 years |
Maintenance and repairs are expensed as incurred while major additions and improvements are capitalized.
Note 1—Summary of Significant Accounting Policies—Continued
Bank-owned life insurance (“BOLI”)— The Bank has purchased life insurance policies. These policies provide protection against the adverse financial effects that could result from the death of a key employee and provide tax-exempt income to offset expenses associated with certain employee benefit plans. It is the Bank’s intent to hold these policies as a long-term investment; however, there may be an income tax impact if the Bank chooses to surrender certain policies. Although the lives of individual current or former management-level employees are insured, the Bank is the owner and sole or partial beneficiary. BOLI is carried at the cash surrender value (“CSV”) of the underlying insurance contract. Changes in the CSV and any death benefits received in excess of the CSV are recognized as non-interest income.
Goodwill — Goodwill represents the excess of the purchase considerations paid over the fair value of the assets acquired, net of the fair values of liabilities assumed in a business combination and is not amortized but is reviewed annually as of December 31, or more frequently as current circumstances and conditions warrant, for impairment. An assessment of qualitative factors is completed to determine if it is more likely than not that, the fair value of a reporting unit is less than its carrying amount. If the qualitative analysis concludes that further analysis is required, then a quantitative impairment test would be completed. The quantitative goodwill impairment compares the reporting unit’s estimated fair values, including goodwill, to its carrying amount. If the carrying amount exceeds its reporting unit’s fair value, then an impairment loss would be recognized as a charge to earnings but is limited by the amount of goodwill allocated to that reporting unit.
Other intangible assets — Other intangible assets consist primarily of core deposit intangibles (“CDI”), which are amounts recorded in business combinations or deposit purchase transactions related to the value of transaction-related deposits and the value of the client relationships associated with the deposits. Core deposit intangibles are amortized over the estimated useful lives of such deposits. These assets are reviewed at least annually for events or circumstances that could affect their recoverability. These events could include loss of the underlying core deposits, increased competition or adverse changes in the economy. The amortization of our CDI is recorded in other non-interest expense. To the extent other identifiable intangible assets are deemed unrecoverable; impairment losses are recorded in other non-interest expense to reduce the carrying amount of the assets.
Transfers of financial assets — Transfers of financial assets are accounted for as sales when control over the assets has been surrendered. Control over transferred assets is deemed to be surrendered when (1) the assets have been isolated from the Company, (2) the transferee obtains the right (free of conditions that constrain it from taking advantage of that right) to pledge or exchange the transferred assets, and (3) the Company does not maintain effective control over the transferred assets through an agreement to repurchase them before their maturity.
Right of Use Lease Assetuse lease asset & Lease Liability
lease liability— The Company leases retail space and office space under operating leases. Most leases require the Company to pay real estate taxes, maintenance, insurance and other similar costs in addition to the base rent. Certain leases also contain lease incentives, such as tenant improvement allowances and rent abatement. Variable lease payments are recognized as lease expense as they are incurred.
We record an operating lease right of use (ROU)(“ROU”) asset and an operating lease liability (lease liability) for operating leases with a lease term greater than 12 months. The ROU asset and lease liability are recorded in other assets and other liabilities, respectively, in the consolidated statementstatements of financial condition. 12 ROU assets represent our right to use an underlying asset for the lease term and lease liabilities represent our obligation to make lease payments arising from the lease. ROU assets and lease liabilities are recognized
Note 1—Summary of Significant Accounting Policies—Continued
at commencement date based on the present value of lease payments over the lease term. Accordingly, ROU assets are reduced by tenant improvement allowances from landlordsproperty owners plus any prepaid rent. We do not separate lease and non-lease components of contracts. As most of our leases do not provide an implicit rate, we generally use our incremental borrowing rate based on the estimated rate of interest for collateralized borrowing over a similar term of the lease payments at commencement date. Many of our leases contain various provisions for increases in rental rates, based either on changes in the published Consumer Price Index or a predetermined escalation schedule, which are factored into our determination of lease payments when appropriate. A majority of the leases provide the Company with the option to extend the lease term one or more times following expiration of the initial term. The ROU asset and lease liability terms may include options to extend or terminate the lease when it is reasonably certain that we will exercise that option. Lease expense for lease payments is recognized on a straight-line basis over the lease term.
Off-balance sheet credit related financial instruments — In the ordinary course of business, the Company has entered into commitments to extend credit, including commitments under credit card arrangements, commercial letters of credit, and standby letters of credit. Such financial instruments are recorded when they are funded.
Revenue from Contractscontracts with Customers
customers— The Company records revenue from contracts with customers in accordance with Accounting Standards Codification Topic 606, “Revenue from Contracts with Customers” (“Topic 606”). Under Topic 606, the Company must identify the contract with a customer, identify the performance obligations in the contract, determine the transaction price, allocate the transaction price to the performance obligations in the contract, and recognize revenue when (or as) the Company satisfies a performance obligation. Significant revenue has not been recognized in the current reporting period that results from performance obligations satisfied in previous periods.
The Company’s primary sources of revenue are derived from interest and dividends earned on loans, investment securities, and other financial instruments that are not within the scope of Topic 606. The Company has evaluated the nature of its contracts with customers and determined that further disaggregation of revenue from contracts with customers into more granular categories beyond what is presented in the Consolidated Statements of Income was not necessary. The Company generally fully satisfies its performance obligations on its contracts with customers as services are rendered and the transaction prices are typically fixed; charged either on a periodic basis or based on activity. Because performance obligations are satisfied as services are rendered and the transaction prices are fixed, there is limited judgment involved in applying Topic 606 that significantly affects the determination of the amount and timing of revenue from contracts with customers.
Basic and Diluted Earnings Per Common Share
diluted earnings per common share— The Company’s common stock is not traded on any exchange. However, trades are reported on the OTCQX under the symbol "FMCB".“FMCB.” The shares are primarily held by local residents and are not actively traded. Basic earnings per common share amounts are computed by dividing net income by the weighted average number of common shares outstanding for the period. There are 0no common stock equivalent shares. Therefore, there is no difference between presentation of diluted and basic earnings per common share. See Note 15 – “Dividends and Basic and Diluted Earnings Per Common Share” for additional information.
Comprehensive Income
income— The “Comprehensive Income” topic of the FASB ASC establishes standards for the reporting and display of comprehensive income and its components in the financial statements. Other comprehensive income refers to revenues, expenses, gains, and losses that U.S. GAAP recognize as changes in value to an enterprise but are excluded from net income. For the Company, comprehensive income includes net income and changes in fair value of its available-for-sale investment securities.securities and amortization of net unrealized gains or losses on securities transferred from available-for-sale to held-to-maturity, net of related taxes.
Segment reporting— The “Segment Reporting” topic of the FASB ASC requires that public companies report certain information about operating segments. It also requires that public companies report certain information about their products and services, the geographic areas in which they operate, and their major customers.
Loss Contingencies
contingencies— Loss contingencies, including claims and legal actions arising in the ordinary course of business, are recorded as liabilities when the likelihood of loss is probable and an amount or range of loss can be reasonably estimated. Management does not believe there now are any such mattersloss contingencies that will have a material and adverse effect on the consolidated financial statements.
Note 1—Summary of Significant Accounting Policies—Continued
Advertising costs — Advertising costs are expensed when incurred and totaled $1.3 million in 2022, $1.1 million in 2021, and $0.9 million in 2020.
Accounting Standards Pending Adoption — The following paragraphs provide descriptions of newly issued but not yet effective accounting standards that could have a material effect on the Company’s financial position or results of operations.
In March 2020, the FASB issued ASU No. 2020-04, Reference Rate Reform (Topic 848). The amendments in this ASU are elective and provide optional guidance for a limited period of time to ease the potential burden in accounting for (or recognizing the effects of) reference rate reform. The amendments in this ASU provide optional expedients and exceptions for applying generally accepted accounting principles (GAAP) to contracts, hedging relationships, and other transactions that reference LIBOR or another reference rate expected to be discontinued because of reference rate reform. ASU 2020-04 was effective upon issuance and, based upon the amendments provided in ASU 2022-06 discussed below, can generally be applied through December 31, 2024. We have not elected to apply these amendments. However, we will assess the applicability of the ASU to us and continue to monitor guidance for reference rate reform from the FASB and its impact on our financial condition and results of operations.
In January 2021, the FASB issued ASU No. 2021-01, Reference Rate Reform (Topic 848). The main amendments in this ASU are intended to clarify certain optional expedients and scope of derivative instruments. The amendments are elective and effective immediately upon issuance of this ASU. ASU 2021-01 was effective upon issuance and, based upon the amendments provided in ASU 2022-06 discussed below, can generally be applied through December 31, 2024. We have not elected to apply these amendments; however, we will assess the applicability of this ASU to us as we continue to monitor guidance for reference rate reform from the FASB and its impact on our financial condition and results of operations.
In March 2022, the FASB issued guidance within ASU 2022-02, Financial Instruments – Credit Losses (Topic 326): Troubled Debt Restructurings and Vintage Disclosures. The amendments in this ASU eliminate the current troubled debt restructuring (TDR) recognition and measurement guidance and, instead, require that a creditor evaluate (consistent with the accounting for other loan modifications) whether the modification represents a new loan or a continuation of an existing loan. The amendments also introduce new requirements related to certain modifications of receivables made to borrowers experiencing financial difficulty.
These amendments require vintage disclosures including current-period gross write-offs by year of origination for financing receivables. Gross write-off information must be included in the vintage disclosures in accordance with ASC 326-20-50-6, which requires disclosure of the amortized cost basis of financing receivables by credit quality indicator and class of financing receivable by year of origination. The Company has elected to adopt this portion of the amendments in the current year.
The amendments in this ASU are effective for fiscal years beginning after December 15, 2022, including interim periods within those fiscal years. These amendments should be applied prospectively, though for the transition method related to the recognition and measurement of TDRs, an entity has the option to apply a modified retrospective transition method, resulting in a cumulative-effect adjustment to retained earnings in the period of adoption.
Early adoption is permitted, including adoption in an interim period. If an entity elects to early adopt in an interim period, the guidance should be applied as of the beginning of the fiscal year that includes the interim
Note 1—Summary of Significant Accounting Policies—Continued
period. An entity may elect to early adopt the amendments about TDRs and related disclosure enhancements separately from the amendments related to the vintage disclosures. ASU 2022-02 will be effective for the Company on January 1, 2023. The adoption of this ASU is not expected to have a material impact on the Company’s consolidated financial statements.
The amendments in this ASU are included ineffective for fiscal years, beginning after December 15, 2023, including interim periods within those fiscal years. Early adoption is permitted for both interim and annual financial statements that have not yet been issued or made available for issuance. The adoption of this ASU is not expected to have material impact on the statementCompany’s consolidated financial statements.
ASU No. 2022-06, “Reference Rate Reform (Topic 848): Deferral of operations from the Sunset Date of Topic 848.” ASU 2022-06 extends the period of time preparers can utilize the reference rate reform relief guidance provided by ASU 2020-04 and ASU 2021-01, which are discussed above. ASU 2022-06, which was effective upon issuance, defers the sunset date of acquisition. Acquisition-related costs, including conversion charges, are expensed as incurred.
| (in thousands) | 2021 | 2022 | 2023 | 2024 | 2025 | Thereafter | Total | |||||||||||||||||||||
| Core Deposit Intangible Amortization | $ | 611 | $ | 593 | $ | 573 | $ | 549 | $ | 522 | $ | 1,165 | $ | 4,013 | ||||||||||||||
Adoption of New Accounting Standard — The Accounting Standards Codification™ (“ASC”) is the FASB officially recognized source of authoritative GAAP applicable to all public and non-public non-governmental entities. Periodically, the FASB will issue Accounting Standard Updates (“ASU”) to its ASC. Rules and interpretive releases of the SEC under the authority of the federal securities laws are also sources of authoritative GAAP for the Company as an SEC registrant. All other accounting literature is non-authoritative.
On January 1, 2022, the Company adopted the Financial Accounting Standards Board (“FASB”) Accounting Standards Update (ASU) 2016-13, Financial Instruments - Credit Losses (Topic 326), Measurement of Credit Losses on Financial Instruments, as amended, which replaces the incurred loss methodology that delays recognition until it is probable a loss has been incurred with an expected loss methodology that is referred to as CECL. The Company adopted ASC 326 using the modified retrospective method for all financials assets measured at amortized cost and off-balance sheet credit exposures. Results for reporting periods beginning after January 1, 2022 are presented under ASC 326 while prior period amounts continue to be reported in accordance with previously applicable GAAP.
In adopting ASU 2016-13 (Topic 326) Management determined that the Weighted Average Remaining Maturity (“WARM”) method was most appropriate given the Company’s current size and complexity.
The implementation of CECL did not result in any material change in the amount of the Company’s December 31, 2021 Allowance for Credit Losses, therefore, no adjustment to Shareholders’ Equity was made as of January 1, 2022.
Note 1—Summary of Significant Accounting Policies—Continued
The main objective of this ASU is to provide financial statement users with more decision-useful information about the expected credit losses on financial instruments and other commitments to extend credit held by a reporting entity at each reporting date. The ASU affects loans, debt securities, trade receivables, net investments in leases, off-balance-sheet credit exposures, reinsurance receivables, and any other financial asset not excluded from the scope that have the contractual right to receive cash. The ASU replaces the incurred loss impairment methodology in previous GAAP with CECL, a methodology that reflects current expected credit losses and requires consideration of a broader range of reasonable and supportable information to inform credit loss estimates. This ASU requires a financial asset (or group of financial assets) measured at amortized cost basis to be presented at the net amount expected to be collected. The allowance for credit losses is a valuation account that is deducted from the amortized cost basis of the financial asset(s) to present the net carrying value at the amount expected to be collected on the financial asset. The measurement of expected credit losses is based on relevant information about past events, including historical experience, current conditions, and reasonable and supportable forecasts that affect the collectability of the reported amount. This ASU broadens the information that an entity must consider in developing its expected credit loss estimate for assets measured either collectively or individually. The use of forecasted information incorporates more timely information in the estimate of expected credit loss, which will be more decision useful to users of the financial statements.
The following table illustrates the pre-tax impact of the adoption of this ASU:
| January-2022 | ||||||||||||
| (Dollars in thousands) | Reported under ASC 326 | Reported Pre- Adoption | Impact of ASC 326 Adoption | |||||||||
| Allowance for credit losses: | ||||||||||||
| Real estate: | ||||||||||||
| Commercial | $ | (17,379 | ) | $ | (28,536 | ) | $ | 11,157 | ||||
| Agricultural | (14,580 | ) | (9,613 | ) | (4,967 | ) | ||||||
| Residential and home equity | (5,879 | ) | (2,847 | ) | (3,032 | ) | ||||||
| Construction | (3,311 | ) | (1,456 | ) | (1,855 | ) | ||||||
| Total real estate | (41,149 | ) | (42,452 | ) | 1,303 | |||||||
| Commercial & industrial | (11,417 | ) | (11,489 | ) | 72 | |||||||
| Agricultural | (6,363 | ) | (5,465 | ) | (898 | ) | ||||||
| Commercial leases | (1,567 | ) | (938 | ) | (629 | ) | ||||||
| Consumer and other | (511 | ) | (663 | ) | 152 | |||||||
| Total allowance for credit losses on loans | $ | (61,007 | ) | $ | (61,007 | ) | $ | - | ||||
Note 2—Investment Securities
The amortized cost, fair values, and unrealized gains and losses of the securities available-for-sale are as follows:
| Amortized | Gross Unrealized | Fair/Book | ||||||||||||||
| December 31, 2020 | Cost | Gains | Losses | Value | ||||||||||||
| US Treasury Notes | $ | 14,859 | $ | 429 | $ | 0 | $ | 15,288 | ||||||||
| US Government Agency SBA | 8,252 | 1 | 93 | 8,160 | ||||||||||||
Mortgage Backed Securities (1) | 720,562 | 17,359 | 48 | 737,873 | ||||||||||||
| Corporate Securities | 45,010 | 927 | 18 | 45,919 | ||||||||||||
| Other | 492 | 0 | 0 | 492 | ||||||||||||
| Total | $ | 789,175 | $ | 18,716 | $ | 159 | $ | 807,732 | ||||||||
| Amortized | Gross Unrealized | Fair/Book | ||||||||||||||
| December 31, 2019 | Cost | Gains | Losses | Value | ||||||||||||
| US Treasury Notes | $ | 54,745 | $ | 250 | $ | 0 | $ | 54,995 | ||||||||
| US Government Agency SBA | 10,902 | 9 | 113 | 10,798 | ||||||||||||
Mortgage Backed Securities (1) | 436,531 | 4,646 | 99 | 441,078 | ||||||||||||
| Other | 515 | 0 | 0 | 515 | ||||||||||||
| Total | $ | 502,693 | $ | 4,905 | $ | 212 | $ | 507,386 | ||||||||
| Gross Unrealized | ||||||||||||||||
| (Dollars in thousands) | Amortized Cost | Gains | Losses | Fair Value | ||||||||||||
| As of December 31, 2022 | ||||||||||||||||
| U.S. Treasury notes | $ | 4,989 | $ | - | $ | 25 | $ | 4,964 | ||||||||
| U.S. Government-sponsored securities | 4,430 | 21 | 24 | 4,427 | ||||||||||||
Mortgage-backed securities(1) | 162,314 | 9 | 29,795 | 132,528 | ||||||||||||
Collateralized mortgage obligations(1) | 1,085 | - | 31 | 1,054 | ||||||||||||
Corporate securities | 10,043 | - | 462 | 9,581 | ||||||||||||
| Other | 310 | - | - | 310 | ||||||||||||
| Total available-for-sale securities | $ | 183,171 | $ | 30 | $ | 30,337 | $ | 152,864 | ||||||||
(1)All Mortgage Backed Securitiesmortgage-backed securities and collateralized mortgage obligations were issued by an agency or government sponsored entity of the U.S. government.Government.
| Gross Unrealized | ||||||||||||||||
| (Dollars in thousands) | Amortized Cost | Gains | Losses | Fair Value | ||||||||||||
| As of December 31, 2021 | ||||||||||||||||
| U.S. Treasury notes | $ | 9,938 | $ | 151 | $ | - | $ | 10,089 | ||||||||
| U.S. Government-sponsored securities | 6,351 | 62 | 39 | 6,374 | ||||||||||||
Mortgage-backed securities(1) | 253,300 | 3,200 | 5,380 | 251,120 | ||||||||||||
| Collateralized mortgage obligations(1) | 2,412 | 24 | - | 2,436 | ||||||||||||
| Other | 435 | - | - | 435 | ||||||||||||
| Total available-for-sale securities | $ | 272,436 | $ | 3,437 | $ | 5,419 | $ | 270,454 | ||||||||
(1)All mortgage-backed securities and collateralized mortgage obligations were issued by an agency or government sponsored entity of the U.S. Government.
The book values, estimated fair values and unrealized gains and losses of investments classified as held-to-maturity are as follows:(in thousands)
| Amortized | Gross Unrealized | Fair | ||||||||||||||
| December 31, 2020 | Cost | Gains | Losses | Value | ||||||||||||
| Obligations of States and Political Subdivisions | $ | 68,933 | $ | 1,116 | $ | 0 | $ | 70,049 | ||||||||
| Total | $ | 68,933 | $ | 1,116 | $ | 0 | $ | 70,049 | ||||||||
| Amortized | Gross Unrealized | Fair | ||||||||||||||
| December 31, 2019 | Cost | Gains | Losses | Value | ||||||||||||
| Obligations of States and Political Subdivisions | $ | 60,229 | $ | 880 | $ | 12 | $ | 61,097 | ||||||||
| Total | $ | 60,229 | $ | 880 | $ | 12 | $ | 61,097 | ||||||||
| Gross Unrealized | ||||||||||||||||||||
| (Dollars in thousands) | Amortized Cost | Gains | Losses | Fair Value | Allowance for Credit Losses | |||||||||||||||
| As of December 31, 2022 | ||||||||||||||||||||
| Municipal securities | $ | 62,302 | $ | 49 | $ | 209 | $ | 62,142 | $ | 393 | ||||||||||
Mortgage-backed securities(1) | 702,858 | 29 | 141,121 | 561,766 | - | |||||||||||||||
Collateralized mortgage obligations(1) | 80,186 | - | 15,701 | 64,485 | - | |||||||||||||||
| Total held-to-maturity securities | $ | 845,346 | $ | 78 | $ | 157,031 | $ | 688,393 | $ | 393 | ||||||||||
(1)All mortgage-backed securities and collateralized mortgage obligations were issued by an agency or government sponsored entity of the U.S. Government.
Note 2—Investment Securities—Continued
| Gross Unrealized | ||||||||||||||||
| (Dollars in thousands) | Amortized Cost | Gains | Losses | Fair Value | ||||||||||||
| As of December 31, 2021 | ||||||||||||||||
| Municipal securities | $ | 66,496 | $ | 701 | $ | - | $ | 67,197 | ||||||||
Mortgage-backed securities(1) | 596,775 | 45 | 11,764 | 585,056 | ||||||||||||
Collateralized mortgage obligations(1) | 73,781 | 36 | 229 | 73,588 | ||||||||||||
| Total held-to-maturity securities | $ | 737,052 | $ | 782 | $ | 11,993 | $ | 725,841 | ||||||||
(1) All mortgage-backed securities and collateralized mortgage obligations were issued by an agency or government sponsored entity of the U.S. Government.
The allowance for credit losses on held-to-maturity securities is a contra-asset valuation account that is deducted from the amortized cost basis of held-to-maturity securities to present the net amount expected to be collected. Management measures expected credit losses on held-to-maturity securities on a collective basis by major security type with each type sharing similar risk characteristics, and considers historical credit loss information that is adjusted for current conditions and reasonable and supportable forecasts. With regard to residential mortgage-backed securities issued by the U.S. government, or agencies thereof, it is expected that the securities will not be settled at prices less than the amortized cost bases of the securities as such securities are backed by the full faith and credit of and/or guaranteed by the U.S. government. Accordingly, no allowance for credit losses has been recorded for these securities. With regard to securities issued by States and political subdivisions and other held-to-maturity securities, management considers (i) issuer bond ratings, (ii) historical loss rates for given bond ratings, (iii) whether issuers continue to make timely principal and interest payments under the contractual terms of the securities, (iv) internal forecasts and (v) whether or not such securities are guaranteed or pre-refunded by the issuers.
Fair values are based on quoted market prices or dealer quotes. If a quoted market price or dealer quote is not available, fair value is estimated using quoted market prices for similar securities.
The following tables show the gross unrealized losses for available-for-sale securities, for which an allowance for credit losses has not been recorded, that are less than 12 months and 12 months or more:
| December 31, 2022 | ||||||||||||||||||||||||
| Less Than 12 Months | 12 Months or More | Total | ||||||||||||||||||||||
| (Dollars in thousands) | Fair Value | Unrealized Losses | Fair Value | Unrealized Losses | Fair Value | Unrealized Losses | ||||||||||||||||||
| As of December 31, 2022 | ||||||||||||||||||||||||
| U.S.Treasury notes | $ | 4,964 | $ | 25 | $ | - | $ | - | $ | 4,964 | $ | 25 | ||||||||||||
| U.S. Government-sponsored securities | 378 | 1 | 1,326 | 23 | 1,704 | 24 | ||||||||||||||||||
Mortgage-backed securities(1) | 35,117 | 1,639 | 96,589 | 28,156 | 131,706 | 29,795 | ||||||||||||||||||
Collateralized mortgage obligations(1) | 1,054 | 31 | - | - | 1,054 | 31 | ||||||||||||||||||
| Corporate securities | - | - | 9,581 | 462 | 9,581 | 462 | ||||||||||||||||||
| Total available-for-sale securities | $ | 41,513 | $ | 1,696 | $ | 107,496 | $ | 28,641 | $ | 149,009 | $ | 30,337 | ||||||||||||
(1)All mortgage-backed securities and collateralized mortgage obligations were issued by an agency or government sponsored entity of the U.S. Government.
Note 2—Investment Securities—Continued
December 31, 2021 | ||||||||||||||||||||||||
| Less Than 12 Months | 12 Months or More | Total | ||||||||||||||||||||||
| (Dollars in thousands) | Fair Value | Unrealized Losses | Fair Value | Unrealized Losses | Fair Value | Unrealized Losses | ||||||||||||||||||
| As of December 31, 2021 | ||||||||||||||||||||||||
| U.S. Government-sponsored securities | $ | 183 | $ | - | $ | 2,007 | $ | 39 | $ | 2,190 | $ | 39 | ||||||||||||
Mortgage-backed securities(1) | 61,469 | 1,192 | 104,489 | 4,188 | 165,958 | 5,380 | ||||||||||||||||||
| Total available-for-sale securities | $ | 61,652 | $ | 1,192 | $ | 106,496 | $ | 4,227 | $ | 168,148 | $ | 5,419 | ||||||||||||
(1)All mortgage-backed securities were issued by an agency or government sponsored entity of the U.S. Government.
As of December 31, 2022, the Company held 195 available-for-sale securities of which 94 were in an unrealized loss position for less than twelve months and 75 securities were in an unrealized loss position for twelve months or more without an allowance for credit losses. Because the decline in fair value is attributable to changes in interest rates and not credit quality and because the Company does not have the intent to sell these securities and it is more likely that it will not be required to sell the securities before their anticipated recovery, the Company does not consider these securities to impaired. Management evaluates the available-for-sale securities in an unrealized loss position, relying primarily on industry analyst reports and observations of market conditions and interest rate fluctuations.
The following table presents the activity in the allowance for credit losses for held-to-maturity debt securities by major type:
December 31, 2022 | ||||||||||||||||
| (Dollars in thousands) | Municipal securities | Mortgage-backed securities | Collateralized mortgage obligations | Total | ||||||||||||
| Allowance for credit losses - securities | ||||||||||||||||
| Beginning Balance | $ | - | $ | - | $ | - | $ | - | ||||||||
| Provision for credit losses | 393 | - | - | 393 | ||||||||||||
| Ending Balance | $ | 393 | $ | - | $ | - | $ | 393 | ||||||||
The amortized cost and estimated fair values of investment securities at December 31, 20202022 by contractual maturity are shown in the following tables. (in thousands)tables:
| Available-for-Sale | Held-to-Maturity | |||||||||||||||
| December 31, 2020 | Amortized Cost | Fair/Book Value | Amortized Cost | Fair Value | ||||||||||||
| Within One Year | $ | 5,479 | $ | 5,512 | $ | 8,309 | $ | 8,309 | ||||||||
| After One Year Through Five Years | 25,427 | 26,096 | 5,137 | 5,179 | ||||||||||||
| After Five Years Through Ten Years | 30,281 | 30,912 | 23,493 | 24,451 | ||||||||||||
| After Ten Years | 7,426 | 7,339 | 31,994 | 32,110 | ||||||||||||
| 68,613 | 69,859 | 68,933 | 70,049 | |||||||||||||
| Investment Securities Not Due at a Single Maturity Date: | ||||||||||||||||
| Mortgage Backed Securities | 720,562 | 737,873 | 0 | 0 | ||||||||||||
| Total | $ | 789,175 | $ | 807,732 | $ | 68,933 | $ | 70,049 | ||||||||
| Available-for-Sale | Held-to-Maturity | |||||||||||||||
| (Dollars in thousands) | Amortized Cost | Fair Value | Amortized Cost | Fair Value | ||||||||||||
| Securities maturing in: | ||||||||||||||||
| One year or less | $ | 5,316 | $ | 5,290 | $ | 883 | $ | 883 | ||||||||
| After one year through five years | 27,290 | 26,094 | 8,058 | 8,004 | ||||||||||||
| After five years through ten years | 17,241 | 15,536 | 33,867 | 32,030 | ||||||||||||
| After ten years | 133,324 | 105,944 | 802,538 | 647,476 | ||||||||||||
Total | $ | 183,171 | $ | 152,864 | $ | 845,346 | $ | 688,393 | ||||||||
Expected maturities of mortgage-backed and CMO securities may differ from contractual maturities because borrowers have the right to call or prepay obligations with or without call or prepayment penalties.
94
| Less Than 12 Months | 12 Months or More | Total | ||||||||||||||||||||||
| December 31, 2020 | Fair Value | Unrealized Loss | Fair Value | Unrealized Loss | Fair Value | Unrealized Loss | ||||||||||||||||||
| Securities Available-for-Sale | ||||||||||||||||||||||||
| US Government Agency SBA | $ | 1,741 | $ | 3 | $ | 6,126 | $ | 90 | $ | 7,867 | $ | 93 | ||||||||||||
| Mortgage Backed Securities | 20,142 | 45 | 177 | 3 | 20,319 | 48 | ||||||||||||||||||
| Corporate Securities | 4,041 | 18 | 0 | 0 | 4,041 | 18 | ||||||||||||||||||
| Total | $ | 25,924 | $ | 66 | $ | 6,303 | $ | 93 | $ | 32,227 | $ | 159 | ||||||||||||
| Less Than 12 Months | 12 Months or More | Total | ||||||||||||||||||||||
| December 31, 2019 | Fair Value | Unrealized Loss | Fair Value | Unrealized Loss | Fair Value | Unrealized Loss | ||||||||||||||||||
| Securities Available-for-Sale | ||||||||||||||||||||||||
| US Government Agency SBA | $ | 2,693 | $ | 6 | $ | 5,198 | $ | 107 | $ | 7,891 | $ | 113 | ||||||||||||
| Mortgage Backed Securities | 131,005 | 88 | 713 | 11 | 131,718 | 99 | ||||||||||||||||||
| Total | $ | 133,698 | $ | 94 | $ | 5,911 | $ | 118 | $ | 139,609 | $ | 212 | ||||||||||||
| Securities Held-to-Maturity | ||||||||||||||||||||||||
| Obligations of States and Political Subdivisions | $ | 355 | $ | 12 | $ | 0 | $ | 0 | $ | 355 | $ | 12 | ||||||||||||
| Total | $ | 355 | $ | 12 | $ | 0 | $ | 0 | $ | 355 | $ | 12 | ||||||||||||
| Held-to-Maturity | ||||||||||||||||
| Amortized Cost | ||||||||||||||||
| (Dollars in thousands) | AAA/AA/A | BBB/BB/B | Not Rated | Total | ||||||||||||
| December 31, 2022 | ||||||||||||||||
| Municipal securities | $ | 19,380 | $ | 388 | $ | 42,534 | $ | 62,302 | ||||||||
| Total | $ | 19,380 | $ | 388 | $ | 42,534 | $ | 62,302 | ||||||||
Proceeds from sales and calls of these securities were as follows:
| (in thousands) | Gross Proceeds | Gross Gains | Gross Losses | |||||||||
| 2020 | $ | 5,080 | $ | 40 | $ | 0 | ||||||
| 2019 | $ | 5,300 | $ | 1 | $ | 0 | ||||||
| 2018 | $ | 99,323 | $ | 78 | $ | 1,338 | ||||||
| (Dollars in thousands) | Gross Proceeds | Gross Gains | Gross Losses | |||||||||
| 2022 | $ | 51,359 | $ | 2 | $ | 10,691 | ||||||
| 2021 | 301,320 | 5,570 | 3,016 | |||||||||
| 2020 | 5,080 | 40 | - | |||||||||
Pledged Securities
As of December 31, 2020,2022, securities carried at $439.7$479 million were pledged to secure public deposits, Federal Home Loan Bank (“FHLB”) borrowings, and other government agency deposits as required by law. This amount was $352.5$426 million at December 31, 2019.2021.
Note 3—Federal Home Loan Bank Stock and Other EquityNon-Marketable Securities at Cost
The Bank is a member of the FHLB system. Members are required to own a certain amount of stock based on the level of borrowings and other factors, and may invest in additional amounts. FHLB stock and other equity securities are carried at cost, classified as restricted securities, and periodically evaluated for impairment based on ultimate recovery of par value. Both cash and stock dividends are reported as income. FHLB stock and other equity securities are reported in Interest Receivable and Other AssetsNon-Marketable Securities on the Company’s Consolidated Balance Sheetsconsolidated statements of financial condition and totaled $12.7$15.5 million at both December 31, 20202022 and 2019.2021.
Note 4—Loans &and Leases
Loans &and leases as of the dates indicated consisted of the following:
| December 31, | ||||||||
| (Dollars in thousands) | 2022 | 2021 | ||||||
| Loans and leases held-for-investment, net | ||||||||
| Real estate: | ||||||||
| Commercial | $ | 1,328,691 | $ | 1,167,516 | ||||
| Agricultural | 726,938 | 672,830 | ||||||
| Residential and home equity | 387,753 | 350,581 | ||||||
| Construction | 166,538 | 177,163 | ||||||
| Total real estate | 2,609,920 | 2,368,090 | ||||||
| Commercial & industrial | 478,758 | 427,799 | ||||||
| Agricultural | 314,525 | 276,684 | ||||||
| Commercial leases | 112,629 | 96,971 | ||||||
Consumer and other(1) | 5,886 | 78,367 | ||||||
| Total gross loans and leases | 3,521,718 | 3,247,911 | ||||||
| Unearned income | (9,357 | ) | (10,734 | ) | ||||
| Total net loans and leases | 3,512,361 | 3,237,177 | ||||||
| Allowance for credit losses | (66,885 | ) | (61,007 | ) | ||||
| Total loans and leases held-for-investment, net | $ | 3,445,476 | $ | 3,176,170 | ||||
(1) Includes SBA PPP loans of $0 and $70,765 as of December 31, consisted of the following:
| (in thousands) | 2020 | 2019 | ||||||
| Commercial Real Estate | $ | 971,326 | $ | 846,486 | ||||
| Agricultural Real Estate | 643,014 | 625,767 | ||||||
| Real Estate Construction | 185,741 | 115,644 | ||||||
| Residential 1st Mortgages | 299,379 | 255,253 | ||||||
| Home Equity Lines and Loans | 34,239 | 39,270 | ||||||
| Agricultural | 264,372 | 292,904 | ||||||
| Commercial | 374,816 | 384,795 | ||||||
Consumer & Other (1) | 235,529 | 15,422 | ||||||
| Leases | 103,117 | 104,470 | ||||||
| Total Gross Loans & Leases | 3,111,533 | 2,680,011 | ||||||
| Less: Unearned Income | 11,941 | 6,984 | ||||||
| Subtotal | 3,099,592 | 2,673,027 | ||||||
| Less: Allowance for Credit Losses | 58,862 | 55,012 | ||||||
| Loans & Leases, Net | $ | 3,040,730 | $ | 2,618,015 | ||||
Paycheck Protection Program (“PPP”) … —Under the CARES Act and H.R. 133, (see “Note 2 – Risks and Uncertainties”) the U.S. Small Business Administration (“SBA”) was directed by Congress to provide loans to small businesses with less than 500 employees to assist these businesses in meeting their payroll and other financial obligations during the COVID-19 pandemic. These government guaranteed loans arewere made with an interest rate of 1%, a risk weight of 0% under risk-based capital rules, have a term of 2 to 5 years, and under certain conditions the SBA will forgive them. The Bank actively participated in the PPP, and since April 2020, the Bank has funded $347.4$494.39 million of loans for 1,5402,680 small business customers. As of December 2022 and 2021, PPP loans outstanding were $0 and $70.8 million, respectively.
At December 31, 2020,2022, the portion of loans that were approved for pledging as collateral on borrowing lines with the Federal Home Loan Bank (“FHLB”) and the Federal Reserve Bank (“FRB”) were $808.9 million$1.2 billion and $706.2$884 million, respectively. The borrowing capacity on these loans was $630.5$758.0 million from FHLB and $438.1$651.0 million from the FRB.
Note 4—Loans and December 31, 2019 by portfolio segment and by impairment methodology Leases(in thousands)—Continued:
| December 31, 2020 | Commercial Real Estate | Agricultural Real Estate | Real Estate Construction | Residential 1st Mortgages | Home Equity Lines & Loans | Agricultural | Commercial | Consumer & Other | Leases | Unallocated | Total | |||||||||||||||||||||||||||||||||
| Year-To-Date Allowance for Credit Losses: | ||||||||||||||||||||||||||||||||||||||||||||
| Beginning Balance- January 1, 2020 | $ | 11,053 | $ | 15,128 | $ | 1,949 | $ | 855 | $ | 2,675 | $ | 8,076 | $ | 11,466 | $ | 456 | $ | 3,162 | $ | 192 | $ | 55,012 | ||||||||||||||||||||||
| Charge-Offs | 0 | 0 | 0 | 0 | (7 | ) | 0 | (1,101 | ) | (66 | ) | 0 | 0 | (1,174 | ) | |||||||||||||||||||||||||||||
| Recoveries | 0 | 81 | 0 | 52 | 78 | 0 | 280 | 33 | 0 | 0 | 524 | |||||||||||||||||||||||||||||||||
| Provision | 16,626 | (6,576 | ) | (306 | ) | 53 | (722 | ) | (3,262 | ) | (684 | ) | (90 | ) | (1,431 | ) | 892 | 4,500 | ||||||||||||||||||||||||||
| Ending Balance- December 31, 2020 | $ | 27,679 | $ | 8,633 | $ | 1,643 | $ | 960 | $ | 2,024 | $ | 4,814 | $ | 9,961 | $ | 333 | $ | 1,731 | $ | 1,084 | $ | 58,862 | ||||||||||||||||||||||
| Ending Balance Individually Evaluated for Impairment | 0 | 0 | 0 | 117 | 8 | 92 | 20 | 52 | 0 | 0 | 289 | |||||||||||||||||||||||||||||||||
| Ending Balance Collectively Evaluated for Impairment | 27,679 | 8,633 | 1,643 | 843 | 2,016 | 4,722 | 9,941 | 281 | 1,731 | 1,084 | 58,573 | |||||||||||||||||||||||||||||||||
| Loans & Leases: | ||||||||||||||||||||||||||||||||||||||||||||
| Ending Balance | $ | 958,980 | $ | 643,014 | $ | 185,741 | $ | 299,379 | $ | 34,239 | $ | 264,372 | $ | 374,816 | $ | 235,529 | $ | 103,522 | $ | 0 | $ | 3,099,592 | ||||||||||||||||||||||
| Ending Balance Individually Evaluated for Impairment | 104 | 5,629 | 0 | 2,365 | 158 | 495 | 233 | 254 | 0 | 0 | 9,238 | |||||||||||||||||||||||||||||||||
| Ending Balance Collectively Evaluated for Impairment | 958,876 | 637,385 | 185,741 | 297,014 | 34,081 | 263,877 | 374,583 | 235,275 | 103,522 | 0 | 3,090,354 | |||||||||||||||||||||||||||||||||
| December 31, 2019 | Commercial Real Estate | Agricultural Real Estate | Real Estate Construction | Residential 1st Mortgages | Home Equity Lines & Loans | Agricultural | Commercial | Consumer & Other | Leases | Unallocated | Total | |||||||||||||||||||||||||||||||||
| Year-To-Date Allowance for Credit Losses: | ||||||||||||||||||||||||||||||||||||||||||||
| Beginning Balance- January 1, 2019 | $ | 11,609 | $ | 14,092 | $ | 1,249 | $ | 880 | $ | 2,761 | $ | 8,242 | $ | 11,656 | $ | 494 | $ | 4,022 | $ | 261 | $ | 55,266 | ||||||||||||||||||||||
| Charge-Offs | 0 | 0 | 0 | 0 | 0 | 0 | (592 | ) | (83 | ) | 0 | 0 | (675 | ) | ||||||||||||||||||||||||||||||
| Recoveries | 0 | 38 | 0 | 13 | 28 | 0 | 90 | 52 | 0 | 0 | 221 | |||||||||||||||||||||||||||||||||
| Provision | (556 | ) | 998 | 700 | (38 | ) | (114 | ) | (166 | ) | 312 | (7 | ) | (860 | ) | (69 | ) | 200 | ||||||||||||||||||||||||||
| Ending Balance- December 31, 2019 | $ | 11,053 | $ | 15,128 | $ | 1,949 | $ | 855 | $ | 2,675 | $ | 8,076 | $ | 11,466 | $ | 456 | $ | 3,162 | $ | 192 | $ | 55,012 | ||||||||||||||||||||||
| Ending Balance Individually Evaluated for Impairment | 234 | 0 | 0 | 118 | 12 | 99 | 137 | 61 | 0 | 0 | 661 | |||||||||||||||||||||||||||||||||
| Ending Balance Collectively Evaluated for Impairment | 10,819 | 15,128 | 1,949 | 737 | 2,663 | 7,977 | 11,329 | 395 | 3,162 | 192 | 54,351 | |||||||||||||||||||||||||||||||||
| Loans & Leases: | ||||||||||||||||||||||||||||||||||||||||||||
| Ending Balance | $ | 838,570 | $ | 625,767 | $ | 115,644 | $ | 255,253 | $ | 39,270 | $ | 292,904 | $ | 384,795 | $ | 15,422 | $ | 105,402 | $ | 0 | $ | 2,673,027 | ||||||||||||||||||||||
| Ending Balance Individually Evaluated for Impairment | 4,524 | 5,654 | 0 | 2,368 | 229 | 188 | 1,528 | 200 | 0 | 0 | 14,691 | |||||||||||||||||||||||||||||||||
| Ending Balance Collectively Evaluated for Impairment | 834,046 | 620,113 | 115,644 | 252,885 | 39,041 | 292,716 | 383,267 | 15,222 | 105,402 | 0 | 2,658,336 | |||||||||||||||||||||||||||||||||
| December 31, 2020 | Pass(1) | Special Mention | Substandard | Total Loans | ||||||||||||
| Loans & Leases: | ||||||||||||||||
| Commercial Real Estate | $ | 946,621 | $ | 7,849 | $ | 4,510 | $ | 958,980 | ||||||||
| Agricultural Real Estate | 631,043 | 400 | 11,571 | 643,014 | ||||||||||||
| Real Estate Construction | 185,741 | 0 | 0 | 185,741 | ||||||||||||
| Residential 1st Mortgages | 298,689 | 0 | 690 | 299,379 | ||||||||||||
| Home Equity Lines and Loans | 34,058 | 0 | 181 | 34,239 | ||||||||||||
| Agricultural | 263,781 | 96 | 495 | 264,372 | ||||||||||||
| Commercial | 373,038 | 1,060 | 718 | 374,816 | ||||||||||||
| Consumer & Other | 235,063 | 0 | 466 | 235,529 | ||||||||||||
| Leases | 103,522 | 0 | 0 | 103,522 | ||||||||||||
| Total | $ | 3,071,556 | $ | 9,405 | $ | 18,631 | $ | 3,099,592 | ||||||||
| December 31, 2019 | Pass(1) | Special Mention | Substandard | Total Loans | ||||||||||||
| Loans & Leases: | ||||||||||||||||
| Commercial Real Estate | $ | 831,941 | $ | 6,629 | $ | 0 | $ | 838,570 | ||||||||
| Agricultural Real Estate | 611,792 | 1,136 | 12,839 | 625,767 | ||||||||||||
| Real Estate Construction | 115,644 | 0 | 0 | 115,644 | ||||||||||||
| Residential 1st Mortgages | 254,459 | 0 | 794 | 255,253 | ||||||||||||
| Home Equity Lines and Loans | 39,092 | 0 | 178 | 39,270 | ||||||||||||
| Agricultural | 289,276 | 2,617 | 1,011 | 292,904 | ||||||||||||
| Commercial | 380,650 | 3,239 | 906 | 384,795 | ||||||||||||
| Consumer & Other | 14,934 | 0 | 488 | 15,422 | ||||||||||||
| Leases | 105,402 | 0 | 0 | 105,402 | ||||||||||||
| Total | $ | 2,643,190 | $ | 13,621 | $ | 16,216 | $ | 2,673,027 | ||||||||
The following tables show an aging analysis of the loan & lease portfolio, including unearned income, by the time past due at December 31, 20202022 and December 31, 2019 (in thousands):2021:
| December 31, 2020 | 30-59 Days Past Due | 60-89 Days Past Due | 90 Days and Still Accruing | Nonaccrual | Total Past Due | Current | Total Loans & Leases | |||||||||||||||||||||
| Loans & Leases: | ||||||||||||||||||||||||||||
| Commercial Real Estate | $ | 0 | $ | 0 | $ | 0 | $ | 0 | $ | 0 | $ | 958,980 | $ | 958,980 | ||||||||||||||
| Agricultural Real Estate | 0 | 0 | 0 | 495 | 495 | 642,519 | 643,014 | |||||||||||||||||||||
| Real Estate Construction | 0 | 0 | 0 | 0 | 0 | 185,741 | 185,741 | |||||||||||||||||||||
| Residential 1st Mortgages | 0 | 0 | 0 | 0 | 0 | 299,379 | 299,379 | |||||||||||||||||||||
| Home Equity Lines and Loans | 0 | 0 | 0 | 0 | 0 | 34,239 | 34,239 | |||||||||||||||||||||
| Agricultural | 0 | 0 | 0 | 0 | 0 | 264,372 | 264,372 | |||||||||||||||||||||
| Commercial | 0 | 0 | 0 | 0 | 0 | 374,816 | 374,816 | |||||||||||||||||||||
| Consumer & Other | 11 | 0 | 0 | 0 | 11 | 235,518 | 235,529 | |||||||||||||||||||||
| Leases | 0 | 0 | 0 | 0 | 0 | 103,522 | 103,522 | |||||||||||||||||||||
| Total | $ | 11 | $ | 0 | $ | 0 | $ | 495 | $ | 506 | $ | 3,099,086 | $ | 3,099,592 | ||||||||||||||
| December 31, 2022 | ||||||||||||||||||||||||
| (Dollars in thousands) | Current | 30-89 Days Past Due | 90+ Days Past Due | Non- accrual | Total Past Due | Total | ||||||||||||||||||
| Loans and leases held-for-investment, net | ||||||||||||||||||||||||
| Real estate: | ||||||||||||||||||||||||
| Commercial | $ | 1,319,911 | $ | - | $ | - | $ | 403 | $ | 403 | $ | 1,320,314 | ||||||||||||
| Agricultural | 726,938 | - | - | - | - | 726,938 | ||||||||||||||||||
| Residential and home equity | 387,753 | - | - | - | - | 387,753 | ||||||||||||||||||
| Construction | 166,370 | - | - | 168 | 168 | 166,538 | ||||||||||||||||||
| Total real estate | 2,600,972 | - | - | 571 | 571 | 2,601,543 | ||||||||||||||||||
| Commercial & industrial | 478,758 | - | - | - | - | 478,758 | ||||||||||||||||||
| Agricultural | 314,525 | - | - | - | - | 314,525 | ||||||||||||||||||
| Commercial leases | 111,649 | - | - | - | - | 111,649 | ||||||||||||||||||
| Consumer and other | 5,789 | 97 | - | - | 97 | 5,886 | ||||||||||||||||||
| Total loans and leases, net | $ | 3,511,693 | $ | 97 | $ | - | $ | 571 | $ | 668 | $ | 3,512,361 | ||||||||||||
| December 31, 2021 | ||||||||||||||||||||||||
| (Dollars in thousands) | Current | 30-89 Days Past Due | 90+ Days Past Due | Non- accrual | Total Past Due | Total | ||||||||||||||||||
| Loans and leases held-for-investment, net | ||||||||||||||||||||||||
| Real estate: | ||||||||||||||||||||||||
| Commercial | $ | 1,156,879 | $ | 459 | $ | - | $ | - | $ | 459 | $ | 1,157,338 | ||||||||||||
| Agricultural | 672,812 | - | - | 18 | 18 | 672,830 | ||||||||||||||||||
| Residential and home equity | 350,492 | 89 | - | - | 89 | 350,581 | ||||||||||||||||||
| Construction | 177,163 | - | - | - | - | 177,163 | ||||||||||||||||||
| Total real estate | 2,357,346 | 548 | - | 18 | 566 | 2,357,912 | ||||||||||||||||||
| Commercial & industrial | 427,799 | - | - | - | - | 427,799 | ||||||||||||||||||
| Agricultural | 276,186 | - | - | 498 | 498 | 276,684 | ||||||||||||||||||
| Commercial leases | 96,415 | - | - | - | - | 96,415 | ||||||||||||||||||
| Consumer and other | 78,363 | 4 | - | - | 4 | 78,367 | ||||||||||||||||||
| Total loans and leases, net | $ | 3,236,109 | $ | 552 | $ | - | $ | 516 | $ | 1,068 | $ | 3,237,177 | ||||||||||||
| December 31, 2019 | 30-59 Days Past Due | 60-89 Days Past Due | 90 Days and Still Accruing | Nonaccrual | Total Past Due | Current | Total Loans & Leases | |||||||||||||||||||||
| Loans & Leases: | ||||||||||||||||||||||||||||
| Commercial Real Estate | $ | 0 | $ | 0 | $ | 0 | $ | 0 | $ | 0 | $ | 838,570 | $ | 838,570 | ||||||||||||||
| Agricultural Real Estate | 0 | 0 | 0 | 0 | 0 | 625,767 | 625,767 | |||||||||||||||||||||
| Real Estate Construction | 240 | 0 | 0 | 0 | 240 | 115,404 | 115,644 | |||||||||||||||||||||
| Residential 1st Mortgages | 0 | 0 | 0 | 0 | 0 | 255,253 | 255,253 | |||||||||||||||||||||
| Home Equity Lines and Loans | 0 | 0 | 0 | 0 | 0 | 39,270 | 39,270 | |||||||||||||||||||||
| Agricultural | 0 | 0 | 0 | 0 | 0 | 292,904 | 292,904 | |||||||||||||||||||||
| Commercial | 77 | 0 | 0 | 0 | 77 | 384,718 | 384,795 | |||||||||||||||||||||
| Consumer & Other | 35 | 0 | 0 | 0 | 35 | 15,387 | 15,422 | |||||||||||||||||||||
| Leases | 0 | 0 | 0 | 0 | 0 | 105,402 | 105,402 | |||||||||||||||||||||
| Total | $ | 352 | $ | 0 | $ | 0 | $ | 0 | $ | 352 | $ | 2,672,675 | $ | 2,673,027 | ||||||||||||||
Non-accrual loans & leases at and for the year ended December 31, 2020 and December 31, 2019 (in thousands):are summarized as follows:
| December 31, 2020 | Recorded Investment | Unpaid Principal Balance | Related Allowance | Average Recorded Investment | Interest Income Recognized | |||||||||||||||
| With no related allowance recorded: | ||||||||||||||||||||
| Commercial Real Estate | $ | 84 | $ | 84 | $ | - | $ | 764 | $ | 35 | ||||||||||
| Agricultural Real Estate | 5,629 | 5,629 | - | 5,629 | 352 | |||||||||||||||
| Agricultural | 3 | 3 | - | 2 | 0 | |||||||||||||||
| Commercial | 0 | 0 | - | 377 | 16 | |||||||||||||||
| $ | 5,716 | $ | 5,716 | $ | - | $ | 6,772 | $ | 403 | |||||||||||
| With an allowance recorded: | ||||||||||||||||||||
| Commercial Real Estate | $ | 0 | $ | 0 | $ | 0 | $ | 21 | $ | 1 | ||||||||||
| Agricultural Real Estate | 0 | 0 | 0 | 137 | 0 | |||||||||||||||
| Residential 1st Mortgages | 1,671 | 1,895 | 84 | 1,652 | 76 | |||||||||||||||
| Home Equity Lines and Loans | 64 | 75 | 3 | 66 | 4 | |||||||||||||||
| Agricultural | 492 | 534 | 92 | 410 | 59 | |||||||||||||||
| Commercial | 234 | 234 | 13 | 123 | 18 | |||||||||||||||
| Consumer & Other | 190 | 191 | 56 | 194 | 13 | |||||||||||||||
| $ | 2,651 | $ | 2,929 | $ | 248 | $ | 2,603 | $ | 171 | |||||||||||
| Total | $ | 8,367 | $ | 8,645 | $ | 248 | $ | 9,375 | $ | 574 | ||||||||||
| December 31, | ||||||||
| (Dollars in thousands) | 2022 | 2021 | ||||||
| Non-accrual loans and leases: | ||||||||
| Non-accrual loans and leases, not TDRs | ||||||||
| Real estate: | ||||||||
| Commercial | $ | 403 | $ | - | ||||
| Agricultural | - | 18 | ||||||
| Residential and home equity | - | - | ||||||
| Construction | 168 | - | ||||||
| Total real estate | 571 | 18 | ||||||
| Commercial & industrial | - | - | ||||||
| Agricultural | - | - | ||||||
| Commercial leases | - | - | ||||||
| Consumer and other | - | - | ||||||
| Subtotal | 571 | 18 | ||||||
| Non-accrual loans and leases, are TDRs | ||||||||
| Real estate: | ||||||||
| Commercial | $ | - | $ | - | ||||
| Agricultural | - | - | ||||||
| Residential and home equity | - | - | ||||||
| Construction | - | - | ||||||
| Total real estate | - | - | ||||||
| Commercial & Industrial | - | - | ||||||
| Agricultural | - | 498 | ||||||
| Commercial leases | - | - | ||||||
| Consumer and other | - | - | ||||||
| Subtotal | - | 498 | ||||||
| Total non-accrual loans and leases | $ | 571 | $ | 516 | ||||
98
| December 31, 2019 | Recorded Investment | Unpaid Principal Balance | Related Allowance | Average Recorded Investment | Interest Income Recognized | |||||||||||||||
| With no related allowance recorded: | ||||||||||||||||||||
| Commercial Real Estate | $ | 86 | $ | 86 | $ | - | $ | 90 | $ | 8 | ||||||||||
| Agricultural Real Estate | 5,654 | 5,654 | - | 6,069 | 379 | |||||||||||||||
| Commercial | 0 | 0 | - | 8 | 1 | |||||||||||||||
| $ | 5,740 | $ | 5,740 | $ | - | $ | 6,167 | $ | 388 | |||||||||||
| With an allowance recorded: | ||||||||||||||||||||
| Commercial Real Estate | $ | 2,822 | $ | 2,822 | $ | 234 | $ | 2,853 | $ | 94 | ||||||||||
| Residential 1st Mortgages | 1,562 | 1,770 | 74 | 1,601 | 73 | |||||||||||||||
| Home Equity Lines and Loans | 68 | 79 | 7 | 71 | 4 | |||||||||||||||
| Agricultural | 188 | 188 | 99 | 195 | 6 | |||||||||||||||
| Commercial | 1,528 | 1,528 | 137 | 1,554 | 53 | |||||||||||||||
| Consumer & Other | 200 | 200 | 61 | 54 | 0 | |||||||||||||||
| $ | 6,368 | $ | 6,587 | $ | 612 | $ | 6,328 | $ | 230 | |||||||||||
| Total | $ | 12,108 | $ | 12,327 | $ | 612 | $ | 12,495 | $ | 618 | ||||||||||
Note 4—Loans and Economic Security Act (“CARES Act”) was signed into law, and was amended and extended by the Consolidated Appropriations Act 2021 (“H.R. 133”) on December 21, 2020. The CARES Act and H.R. 133 provide financial institutions, under specific circumstances, the opportunity to temporarily suspend certain requirements under generally accepted accounting principles related to TDR’s for a limited period of time to account for the effects of COVID-19. In March 2020, a joint statement was issued by federal and state regulatory agencies, after consultation with the FASB, to clarify that short-term loan modifications are not TDRs if made on a good-faith basis in response to COVID-19 to borrowers who were current prior to any relief. Under this guidance, six months is provided as an example of short-term, and current is defined as less than 30 days past due at the time the modification program is implemented. The guidance also provides that these modified loans generally will not be classified as nonaccrual during the term of the modification. Since April 2020, we have restructured $Leases—Continued277.6 million of loans under the CARES Act and H.R. 133 guidelines. As of December 31, 2020, $3.7 million of these loans remain in a deferral status, the other loans having returned to making principal and/or interest payments. We believe that these actions will assist these borrowers in getting through these difficult times, but no guaranties can be made that at some time in the future these loans will not be required to be accounted for as a TDR. For borrowers who are 30 days or more past due when enrolling in a loan modification program related to the COVID-19 pandemic, we evaluate the loan modifications under our existing TDR framework, and where such a loan modification would result in a more than insignificant concession to a borrower experiencing financial difficulty, the loan will be accounted for as a TDR and will generally not accrue interest. See “Note 2 – Risks and Uncertainties” for additional information on the CARES Act, H.R. 133 and the impact of COVID-19 on the Company.
The following table presents loans by class modified aslists total troubled debt restructured loans forthat the year ended December 31, 2020 (in thousands):Company is either accruing or not accruing interest by loan category:
| December 31, 2020 | ||||||||||||
| Troubled Debt Restructurings | Number of Loans | Pre-Modification Outstanding Recorded Investment | Post-Modification Outstanding Recorded Investment | |||||||||
| Residential 1st Mortgages | 2 | $ | 156 | $ | 156 | |||||||
| Agricultural | 3 | 495 | 495 | |||||||||
| Commercial | 1 | 224 | 224 | |||||||||
| Total | 6 | $ | 875 | $ | 875 | |||||||
| December 31, | ||||||||
| (Dollars in thousands) | 2022 | 2021 | ||||||
| Troubled debt restructured loans and leases: | ||||||||
| Accruing TDR loans and leases | ||||||||
| Real estate: | ||||||||
| Commercial | $ | - | $ | 41 | ||||
| Agricultural | - | - | ||||||
| Residential and home equity | 1,305 | 1,522 | ||||||
| Construction | - | - | ||||||
| Total real estate | 1,305 | 1,563 | ||||||
| Commercial & industrial | 6 | 260 | ||||||
| Agricultural | - | - | ||||||
| Commercial leases | - | - | ||||||
| Consumer and other | - | 1 | ||||||
| Subtotal | 1,311 | 1,824 | ||||||
| Non-accruing TDR loans and leases | ||||||||
| Real estate: | ||||||||
| Commercial | $ | - | $ | - | ||||
| Agricultural | - | - | ||||||
| Residential and home equity | - | - | ||||||
| Construction | - | - | ||||||
| Total real estate | - | - | ||||||
| Commercial & industrial | - | - | ||||||
| Agricultural | - | 498 | ||||||
| Commercial leases | - | - | ||||||
| Consumer and other | - | - | ||||||
| Subtotal | - | 498 | ||||||
| Total TDR loans and leases | $ | 1,311 | $ | 2,322 | ||||
Note 4—Loans and Leases—Continued
The troubled debt restructurings described above increasedfollowing table summarizes TDRs outstanding by year of occurrence:
| Year Ended December 31, 2022 | ||||||||||||||||||||||||
| (Dollars in thousands) | # of Accruing TDR | $ of Accruing TDR | # of Non- accruing TDR | $ of Non- accruing TDR | # of Total TDR | $ of Total TDR | ||||||||||||||||||
| Loan and lease TDRs | ||||||||||||||||||||||||
| 2022 | - | $ | - | - | $ | - | - | $ | - | |||||||||||||||
| 2021 | - | - | - | - | - | - | ||||||||||||||||||
| 2020 | 4 | 257 | - | - | 4 | 257 | ||||||||||||||||||
| 2019 | - | - | - | - | - | - | ||||||||||||||||||
| Prior | 8 | 1,054 | - | - | 8 | 1,054 | ||||||||||||||||||
| Total | 12 | $ | 1,311 | - | $ | - | 12 | $ | 1,311 | |||||||||||||||
| Year Ended December 31, 2021 | ||||||||||||||||||||||||
| (Dollars in thousands) | # of Accruing TDR | $ of Accruing TDR | # of Non- accruing TDR | $ of Non- accruing TDR | # of Total TDR | $ of Total TDR | ||||||||||||||||||
| Loan and lease TDRs | ||||||||||||||||||||||||
| 2021 | 1 | $ | 49 | - | $ | - | 1 | $ | 49 | |||||||||||||||
| 2020 | 5 | 476 | 2 | 498 | 7 | 974 | ||||||||||||||||||
| 2019 | - | - | - | - | - | - | ||||||||||||||||||
| 2018 | 1 | 84 | - | - | 1 | 84 | ||||||||||||||||||
| Prior | 10 | 1,215 | - | - | 10 | 1,215 | ||||||||||||||||||
| Total | 17 | $ | 1,824 | 2 | $ | 498 | 19 | $ | 2,322 | |||||||||||||||
Note 4—Loans and Leases—Continued
Outstanding loan balances (accruing and non-accruing) categorized by these credit quality indicators are summarized as follows:
| December 31, 2022 | ||||||||||||||||||||||||
| (Dollars in thousands) | Pass | Special Mention | Sub- standard | Doubtful | Total Loans & Leases | Total Allowance for Credit Losses | ||||||||||||||||||
| Loans and leases held for investment, net | ||||||||||||||||||||||||
| Real estate: | ||||||||||||||||||||||||
| Commercial | $ | 1,314,377 | $ | 5,535 | $ | 402 | $ | - | $ | 1,320,314 | $ | 18,055 | ||||||||||||
| Agricultural | 709,927 | 10,891 | 6,120 | - | 726,938 | 14,496 | ||||||||||||||||||
| Residential and home equity | 387,371 | - | 382 | - | 387,753 | 7,508 | ||||||||||||||||||
| Construction | 166,370 | - | 168 | - | 166,538 | 3,026 | ||||||||||||||||||
| Total real estate | 2,578,045 | 16,426 | 7,072 | - | 2,601,543 | 43,085 | ||||||||||||||||||
| Commercial & industrial | 478,437 | 63 | 258 | - | 478,758 | 11,503 | ||||||||||||||||||
| Agricultural | 308,830 | 5,682 | 13 | - | 314,525 | 10,202 | ||||||||||||||||||
| Commercial leases | 111,568 | 81 | - | - | 111,649 | 1,924 | ||||||||||||||||||
| Consumer and other | 5,650 | - | 236 | - | 5,886 | 171 | ||||||||||||||||||
| Total loans and leases, net | $ | 3,482,530 | $ | 22,252 | $ | 7,579 | $ | - | $ | 3,512,361 | $ | 66,885 | ||||||||||||
| December 31, 2021 | ||||||||||||||||||||||||
| (Dollars in thousands) | Pass | Special Mention | Sub- standard | Doubtful | Total Loans & Leases | Total Allowance for Loan Losses | ||||||||||||||||||
| Loans and leases held for investment, net | ||||||||||||||||||||||||
| Real estate: | ||||||||||||||||||||||||
| Commercial | $ | 1,142,175 | $ | 6,903 | $ | 8,260 | $ | - | $ | 1,157,338 | $ | 28,536 | ||||||||||||
| Agricultural | 663,157 | 3,292 | 6,381 | - | 672,830 | 9,613 | ||||||||||||||||||
| Residential and home equity | 350,148 | - | 433 | - | 350,581 | 2,847 | ||||||||||||||||||
| Construction | 177,163 | - | - | - | 177,163 | 1,456 | ||||||||||||||||||
| Total real estate | 2,332,643 | 10,195 | 15,074 | - | 2,357,912 | 42,452 | ||||||||||||||||||
| Commercial & industrial | 417,806 | 9,321 | 672 | - | 427,799 | 11,489 | ||||||||||||||||||
| Agricultural | 275,206 | 958 | 520 | - | 276,684 | 5,465 | ||||||||||||||||||
| Commercial leases | 96,415 | - | - | - | 96,415 | 938 | ||||||||||||||||||
| Consumer and other | 78,181 | - | 186 | - | 78,367 | 663 | ||||||||||||||||||
| Total loans and leases, net | $ | 3,200,251 | $ | 20,474 | $ | 16,452 | $ | - | $ | 3,237,177 | $ | 61,007 | ||||||||||||
Note 4—Loans and Leases—Continued
The following table represents outstanding loan balances by credit quality indicators and vintage year by class of financing receivable and current period gross charge-offs by year of origination as follows:
| December 31, 2022 | ||||||||||||||||||||||||||||||||
| Term Loans Amortized Cost Basis by Origination Year | ||||||||||||||||||||||||||||||||
| (Dollars in thousands) | 2022 | 2021 | 2020 | 2019 | 2018 | Prior | Revolving Loans Amortized Cost | Total | ||||||||||||||||||||||||
| Net loans and leases held for investment | ||||||||||||||||||||||||||||||||
| Real estate: | ||||||||||||||||||||||||||||||||
| Commercial | ||||||||||||||||||||||||||||||||
| Pass | $ | 194,698 | $ | 234,478 | $ | 150,203 | $ | 71,333 | $ | 85,132 | $ | 218,261 | $ | 360,272 | $ | 1,314,377 | ||||||||||||||||
| Special mention | - | - | - | - | 3,820 | 1,115 | 600 | 5,535 | ||||||||||||||||||||||||
| Substandard | - | - | - | - | - | 402 | - | 402 | ||||||||||||||||||||||||
| Doubtful | - | - | - | - | - | - | - | - | ||||||||||||||||||||||||
| Total Commercial | $ | 194,698 | $ | 234,478 | $ | 150,203 | $ | 71,333 | $ | 88,952 | $ | 219,778 | $ | 360,872 | $ | 1,320,314 | ||||||||||||||||
| Commercial | ||||||||||||||||||||||||||||||||
| Current-period gross charge-offs | $ | - | $ | - | $ | 170 | $ | - | $ | - | $ | - | $ | - | $ | 170 | ||||||||||||||||
| Agricultural | ||||||||||||||||||||||||||||||||
| Pass | $ | 67,044 | $ | 42,546 | $ | 54,893 | $ | 15,074 | $ | 50,186 | $ | 144,052 | $ | 336,132 | $ | 709,927 | ||||||||||||||||
| Special mention | - | - | - | 2,636 | - | - | 8,255 | 10,891 | ||||||||||||||||||||||||
| Substandard | - | - | - | - | 111 | 6,009 | - | 6,120 | ||||||||||||||||||||||||
| Doubtful | - | - | - | - | - | - | - | - | ||||||||||||||||||||||||
| Total Agricultural | $ | 67,044 | $ | 42,546 | $ | 54,893 | $ | 17,710 | $ | 50,297 | $ | 150,061 | $ | 344,387 | $ | 726,938 | ||||||||||||||||
| Agricultural | ||||||||||||||||||||||||||||||||
| Current-period gross charge-offs | $ | - | $ | - | $ | - | $ | - | $ | - | $ | - | $ | - | $ | - | ||||||||||||||||
| Residential and home equity | ||||||||||||||||||||||||||||||||
| Pass | $ | 66,847 | $ | 96,354 | $ | 86,545 | $ | 14,530 | $ | 6,632 | $ | 76,155 | $ | 40,308 | $ | 387,371 | ||||||||||||||||
| Special mention | - | - | - | - | - | - | - | - | ||||||||||||||||||||||||
| Substandard | - | - | - | - | - | 300 | 82 | 382 | ||||||||||||||||||||||||
| Doubtful | - | - | - | - | - | - | - | - | ||||||||||||||||||||||||
| Total Residential and home equity | $ | 66,847 | $ | 96,354 | $ | 86,545 | $ | 14,530 | $ | 6,632 | $ | 76,455 | $ | 40,390 | $ | 387,753 | ||||||||||||||||
| Residential and home equity | ||||||||||||||||||||||||||||||||
| Current-period gross charge-offs | $ | - | $ | - | $ | - | $ | - | $ | - | $ | 25 | $ | - | $ | 25 | ||||||||||||||||
| Construction | ||||||||||||||||||||||||||||||||
| Pass | $ | 2,000 | $ | 1 | $ | - | $ | 1,575 | $ | - | $ | 31 | $ | 162,763 | $ | 166,370 | ||||||||||||||||
| Special mention | - | - | - | - | - | - | - | - | ||||||||||||||||||||||||
| Substandard | - | - | - | - | - | - | 168 | 168 | ||||||||||||||||||||||||
| Doubtful | - | - | - | - | - | - | - | - | ||||||||||||||||||||||||
| Total construction | $ | 2,000 | $ | 1 | $ | - | $ | 1,575 | $ | - | $ | 31 | $ | 162,931 | $ | 166,538 | ||||||||||||||||
| Construction | ||||||||||||||||||||||||||||||||
| Current-period gross charge-offs | $ | - | $ | - | $ | - | $ | - | $ | - | $ | - | $ | - | $ | - | ||||||||||||||||
| Total Real estate | $ | 330,589 | $ | 373,379 | $ | 291,641 | $ | 105,148 | $ | 145,881 | $ | 446,325 | $ | 908,580 | $ | 2,601,543 | ||||||||||||||||
| Commercial & industrial | ||||||||||||||||||||||||||||||||
| Pass | $ | 34,410 | $ | 36,846 | $ | 12,325 | $ | 8,245 | $ | 7,167 | $ | 5,679 | $ | 373,765 | $ | 478,437 | ||||||||||||||||
| Special mention | - | 63 | - | - | - | - | - | 63 | ||||||||||||||||||||||||
| Substandard | - | - | - | - | 1 | 5 | 252 | 258 | ||||||||||||||||||||||||
| Doubtful | - | - | - | - | - | - | - | - | ||||||||||||||||||||||||
| Total Commercial & industrial | $ | 34,410 | $ | 36,909 | $ | 12,325 | $ | 8,245 | $ | 7,168 | $ | 5,684 | $ | 374,017 | $ | 478,758 | ||||||||||||||||
| Commercial & industrial | ||||||||||||||||||||||||||||||||
| Current-period gross charge-offs | $ | - | $ | - | $ | - | $ | 246 | $ | 78 | $ | - | $ | - | $ | 324 | ||||||||||||||||
| Agricultural | ||||||||||||||||||||||||||||||||
| Pass | $ | 5,378 | $ | 3,083 | $ | 989 | $ | 1,515 | $ | 636 | $ | 2,071 | $ | 295,158 | $ | 308,830 | ||||||||||||||||
| Special mention | - | - | - | - | - | - | 5,682 | 5,682 | ||||||||||||||||||||||||
| Substandard | - | - | - | 11 | 2 | - | - | 13 | ||||||||||||||||||||||||
| Doubtful | - | - | - | - | - | - | - | - | ||||||||||||||||||||||||
| Total Agricultural | $ | 5,378 | $ | 3,083 | $ | 989 | $ | 1,526 | $ | 638 | $ | 2,071 | $ | 300,840 | $ | 314,525 | ||||||||||||||||
| Agricultural | ||||||||||||||||||||||||||||||||
| Current-period gross charge-offs | $ | - | $ | - | $ | - | $ | - | $ | - | $ | - | $ | - | $ | - | ||||||||||||||||
| Commercial leases | ||||||||||||||||||||||||||||||||
| Pass | $ | 35,689 | $ | 15,874 | $ | 13,050 | $ | 5,904 | $ | 20,560 | $ | 20,491 | $ | - | $ | 111,568 | ||||||||||||||||
| Special mention | - | - | - | 81 | - | - | - | 81 | ||||||||||||||||||||||||
| Substandard | - | - | - | - | - | - | - | - | ||||||||||||||||||||||||
| Doubtful | - | - | - | - | - | - | - | - | ||||||||||||||||||||||||
| Total Commercial leases | $ | 35,689 | $ | 15,874 | $ | 13,050 | $ | 5,985 | $ | 20,560 | $ | 20,491 | $ | - | $ | 111,649 | ||||||||||||||||
| Commercial leases | ||||||||||||||||||||||||||||||||
| Current-period gross charge-offs | $ | - | $ | - | $ | - | $ | - | $ | - | $ | - | $ | - | $ | - | ||||||||||||||||
| Consumer and other | ||||||||||||||||||||||||||||||||
| Pass | $ | 1,476 | $ | 634 | $ | 275 | $ | 176 | $ | 315 | $ | 1,769 | $ | 1,005 | $ | 5,650 | ||||||||||||||||
| Special mention | - | - | - | - | - | - | - | - | ||||||||||||||||||||||||
| Substandard | 236 | - | - | - | - | - | - | 236 | ||||||||||||||||||||||||
| Doubtful | - | - | - | - | - | - | - | - | ||||||||||||||||||||||||
| Total Consumer and other | $ | 1,712 | $ | 634 | $ | 275 | $ | 176 | $ | 315 | $ | 1,769 | $ | 1,005 | $ | 5,886 | ||||||||||||||||
| Consumer and other | ||||||||||||||||||||||||||||||||
| Current-period gross charge-offs | $ | 40 | $ | 6 | $ | 7 | $ | 1 | $ | 4 | $ | 4 | $ | - | $ | 62 | ||||||||||||||||
| Total net loans and leases | $ | 407,778 | $ | 429,879 | $ | 318,280 | $ | 121,080 | $ | 174,562 | $ | 476,340 | $ | 1,584,442 | $ | 3,512,361 | ||||||||||||||||
Certain directors and executive officers of the allowance for credit losses by $120,000. ThereCompany are defined as related parties. These related parties, including their immediate families and companies in which they are principal owners, were 0 charge-offs forloan customers of the Bank during the twelve months ended December 31, 2020.2022 and December 31, 2021. Such loans were made on substantially the same terms, including interest rates and collateral, as those prevailing at the time for comparable loans with borrowers not related to the Company. These loans did not involve more than the normal risk of collection or have other unfavorable features. A summary of the changes in those loans is as follows:
| December 31, | ||||||||
| (Dollars in thousands) | 2022 | 2021 | ||||||
| Balance at beginning of the period | $ | 18,128 | $ | 11,682 | ||||
| New loans or advances during year | 523 | 7,254 | ||||||
| Repayments | (1,130 | ) | (808 | ) | ||||
| Balance at end of period | $ | 17,521 | $ | 18,128 | ||||
Note 4—Loans and Leases—Continued
| December 31, 2019 | ||||||||||||
| Troubled Debt Restructurings | Number of Loans | Pre-Modification Outstanding Recorded Investment | Post-Modification Outstanding Recorded Investment | |||||||||
| Agricultural | 1 | $ | 201 | $ | 201 | |||||||
| Consumer & Other | 1 | 195 | 195 | |||||||||
| Total | 2 | $ | 396 | $ | 396 | |||||||
| Year Ended December 31, 2022 | ||||||||||||||||||||||||||||
| (Dollars in thousands) | Commercial & Agricultural R/E | Construction | Residential & Home Equity | Commercial & Agricultural | Commercial Leases | Consumer & Other | Total | |||||||||||||||||||||
| Allowance for credit losses: | ||||||||||||||||||||||||||||
| Balance at beginning of year | $ | 38,149 | $ | 1,456 | $ | 2,847 | $ | 16,954 | $ | 938 | $ | 663 | $ | 61,007 | ||||||||||||||
| Impact of Adopting ASC 326 | (6,190 | ) | 1,855 | 3,032 | 826 | 629 | (152 | ) | - | |||||||||||||||||||
| Provision / (recapture) for credit losses | 762 | (285 | ) | 1,523 | 4,001 | 357 | (301 | ) | 6,057 | |||||||||||||||||||
| Charge-offs | (170 | ) | - | (25 | ) | (324 | ) | - | (62 | ) | (581 | ) | ||||||||||||||||
| Recoveries | - | - | 131 | 248 | - | 23 | 402 | |||||||||||||||||||||
| Net (charge-offs) / recoveries | (170 | ) | - | 106 | (76 | ) | - | (39 | ) | (179 | ) | |||||||||||||||||
| Balance at end of year | $ | 32,551 | $ | 3,026 | $ | 7,508 | $ | 21,705 | $ | 1,924 | $ | 171 | $ | 66,885 | ||||||||||||||
| Year Ended December 31, 2021 | ||||||||||||||||||||||||||||
| (Dollars in thousands) | Commercial & Agricultural R/E | Construction | Residential & Home Equity | Commercial & Agricultural | Commercial Leases | Consumer & Other | Total | |||||||||||||||||||||
| Allowance for credit losses: | ||||||||||||||||||||||||||||
| Balance at beginning of year | $ | 36,312 | $ | 1,643 | $ | 2,984 | $ | 14,775 | $ | 1,731 | $ | 1,417 | $ | 58,862 | ||||||||||||||
| Provision / (recapture) for credit losses | 1,837 | (187 | ) | (235 | ) | 2,025 | (793 | ) | (737 | ) | 1,910 | |||||||||||||||||
| Charge-offs | - | - | - | - | - | (44 | ) | (44 | ) | |||||||||||||||||||
| Recoveries | - | - | 98 | 154 | - | 27 | 279 | |||||||||||||||||||||
| Net (charge-offs) / recoveries | - | - | 98 | 154 | - | (17 | ) | 235 | ||||||||||||||||||||
| Balance at end of year | $ | 38,149 | $ | 1,456 | $ | 2,847 | $ | 16,954 | $ | 938 | $ | 663 | $ | 61,007 | ||||||||||||||
| Year Ended December 31, 2020 | ||||||||||||||||||||||||||||
| (Dollars in thousands) | Commercial & Agricultural R/E | Construction | Residential & Home Equity | Commercial & Agricultural | Commercial Leases | Consumer & Other | Total | |||||||||||||||||||||
| Allowance for credit losses: | ||||||||||||||||||||||||||||
| Balance at beginning of year | $ | 26,181 | $ | 1,949 | $ | 3,530 | $ | 19,542 | $ | 3,162 | $ | 648 | $ | 55,012 | ||||||||||||||
| Provision / (recapture) for credit losses | 10,050 | (306 | ) | (669 | ) | (3,946 | ) | (1,431 | ) | 802 | 4,500 | |||||||||||||||||
| Charge-offs | - | - | (7 | ) | (1,101 | ) | - | (66 | ) | (1,174 | ) | |||||||||||||||||
| Recoveries | 81 | - | 130 | 280 | - | 33 | 524 | |||||||||||||||||||||
| Net (charge-offs) / recoveries | 81 | - | 123 | (821 | ) | - | (33 | ) | (650 | ) | ||||||||||||||||||
| Balance at end of year | $ | 36,312 | $ | 1,643 | $ | 2,984 | $ | 14,775 | $ | 1,731 | $ | 1,417 | $ | 58,862 | ||||||||||||||
Note 4—Loans and Leases—Continued
A loan is considered collateral dependent when the borrower is experiencing financial difficulty and repayment is expected to be provided substantially through the operation or sale of the collateral. When management determines that foreclosure is probable, expected credit losses for collateral dependent loans are based on the fair value of the collateral at the reporting date, adjusted for selling costs as appropriate. The collateral on the loans is a significant portion of what secures the collateral dependent loans and significant changes to the fair value of the collateral can impact the ACL. During 2022, there were no significant changes to the
| December 31, 2022 | ||||||||||||
| (Dollars in thousands) | Real Estate | Vehicles and Equipment | Total | |||||||||
| Collateral dependent loans and leases | ||||||||||||
| Real estate: | ||||||||||||
| Commercial | $ | 1,114 | $ | - | $ | 1,114 | ||||||
| Agricultural | 11,035 | - | 11,035 | |||||||||
| Residential and home equity | 2,153 | - | 2,153 | |||||||||
| Construction | - | - | - | |||||||||
| Total Real estate | 14,302 | - | 14,302 | |||||||||
| Commercial & industrial | - | - | - | |||||||||
| Agricultural | - | 13 | 13 | |||||||||
| Commercial leases | - | - | - | |||||||||
| Consumer and other | - | 158 | 158 | |||||||||
| Total gross loans and leases | $ | 14,302 | $ | 171 | $ | 14,473 | ||||||
Note 5—Premises and Equipment
Premises and equipment as of December 31 consisted of the following:
| (in thousands) | 2020 | 2019 | ||||||
| Land and Buildings | $ | 60,246 | $ | 53,997 | ||||
| Furniture, Fixtures and Equipment | 21,750 | 21,058 | ||||||
| Leasehold Improvement | 3,753 | 3,745 | ||||||
| Subtotal | 85,749 | 78,800 | ||||||
| Less: Accumulated Depreciation and Amortization | 35,602 | 33,529 | ||||||
| Total | $ | 50,147 | $ | 45,271 | ||||
| December 31, | ||||||||
| (Dollars in thousands) | 2022 | 2021 | ||||||
| Premises and equipment: | ||||||||
| Buildings and land | $ | 61,274 | $ | 59,325 | ||||
| Furniture, fixtures, and equipment | 23,203 | 22,302 | ||||||
| Leasehold improvements | 3,982 | 3,658 | ||||||
| Subtotal | 88,459 | 85,285 | ||||||
| Accumulated depreciation and amortization | (38,983 | ) | (37,555 | ) | ||||
Total premises and equipment | $ | 49,476 | $ | 47,730 | ||||
Depreciation and amortization on premises and equipment included in occupancy and equipment expense amounted to $2,769,000, $2,756,000,$2.4, $2.6, and $2,421,000$2.8 million for the years ended December 31, 2020, 20192022, 2021 and 2018,2020, respectively. Rental income was $434,000, $183,000,$640,000, $491,000, and $173,000$434,000 for the years ended December 31, 2022, 2021, and 2020, 2019,respectively and 2018, respectively.is recorded in other income.
The Bank reported $873,000 in other real estate owned at December 31, 2020,2022 and December 31, 2019. Other real estate2021, which includes property no longer utilized for business operations and property acquired through foreclosure proceedings. These properties are carried at fair value less selling costs determined at the date acquired. Losses, if any, arising from properties acquired through foreclosure are charged against the allowance for loan losses at the time of foreclosure. Subsequent declines in value, periodic holding costs, and net gains or losses on disposition are included in other operating expense as incurred. Other real estate is reported in Interest Receivable and Other Assets on the Company’s Consolidated Balance Sheets.
Note 7—Deposits
Certificates of deposit greater than and less than or equal to the FDIC insurance limit of $250,000 or moreare summarized as follows:
| December 31, | ||||||||
| (Dollars in thousands) | 2022 | 2021 | ||||||
| Certificates of deposit: | ||||||||
| Certificates of deposit less than or equal to $250,000 | $ | 202,554 | $ | 223,620 | ||||
| Certificates of deposit greater than $250,000 | 128,846 | 168,865 | ||||||
Total certificates of deposit | $ | 331,400 | $ | 392,485 | ||||
Scheduled maturities for certificates of deposit are as follows for the years ending December 31:
| (Dollars in thousands) | Amount | |||
| 2023 | $ | 299,575 | ||
| 2024 | 26,097 | |||
| 2025 | 3,070 | |||
| 2026 | 1,310 | |||
| 2027 and beyond | 1,348 | |||
| Total certificates of deposit | $ | 331,400 | ||
Note 8—Short-term borrowings
As of December 31, 2022 and 2021, committed lines of credit arrangements totaling $1.5 billion and $1.4 billion were available to the Company from unaffiliated banks, respectively. The average Federal Funds interest rate as of December 31, were as follows:2022 was 4.50%.
| (in thousands) | 2020 | 2019 | ||||||
| Balance | $ | 185,944 | $ | 257,392 | ||||
| (in thousands) | Scheduled Maturities | |||
| 2021 | $ | 373,332 | ||
| 2022 | 38,620 | |||
| 2023 | 7,571 | |||
| 2024 | 715 | |||
| 2025 | 1,630 | |||
| Total | $ | 421,868 | ||
| (in thousands) | 2020 | 2019 | 2018 | |||||||||
| Current | ||||||||||||
| Federal | $ | 12,174 | $ | 14,798 | $ | 2,517 | ||||||
| State | 9,005 | 7,733 | 6,224 | |||||||||
| Total Current | 21,179 | 22,531 | 8,741 | |||||||||
| Deferred | ||||||||||||
| Federal | (1,115 | ) | (3,500 | ) | 5,622 | |||||||
| State | (847 | ) | 246 | (160 | ) | |||||||
| Total Deferred | (1,962 | ) | (3,254 | ) | 5,462 | |||||||
| Total Provision for Taxes | $ | 19,217 | $ | 19,277 | $ | 14,203 | ||||||
| 2020 | 2019 | 2018 | ||||||||||||||||||||||
| (in thousands) | Amount | Rate | Amount | Rate | Amount | Rate | ||||||||||||||||||
| Tax Provision at Federal Statutory Rate | $ | 16,370 | 21.0 | % | $ | 15,816 | 21.0 | % | $ | 12,543 | 21.0 | % | ||||||||||||
| Interest on Obligations of States and Political Subdivisions exempt from Federal Taxation | (350 | ) | (0.4 | %) | (358 | ) | (0.5 | %) | (338 | ) | (0.5 | %) | ||||||||||||
| State and Local Income Taxes, Net of Federal Income Tax Benefit | 6,445 | 8.3 | % | 6,304 | 8.4 | % | 4,791 | 7.9 | % | |||||||||||||||
| Bank Owned Life Insurance | (444 | ) | (0.6 | %) | (460 | ) | (0.6 | %) | (434 | ) | (0.7 | %) | ||||||||||||
| Low-Income Housing Tax Credit | (2,655 | ) | (3.4 | %) | (2,078 | ) | (2.8 | %) | (1,624 | ) | (2.7 | %) | ||||||||||||
| Out of Period Adjustment | 0 | 0.0 | % | 0 | 0.0 | % | (802 | ) | (1.3 | %) | ||||||||||||||
| Other, Net | (149 | ) | (0.2 | %) | 53 | 0.1 | % | 67 | 0.1 | % | ||||||||||||||
| Total Provision for Taxes | $ | 19,217 | 24.7 | % | $ | 19,277 | 25.6 | % | $ | 14,203 | 23.8 | % | ||||||||||||
| (in thousands) | 2020 | 2019 | ||||||
| Deferred Tax Assets | ||||||||
| Allowance for Credit Losses | $ | 17,248 | $ | 15,925 | ||||
| Accrued Liabilities | 8,526 | 8,452 | ||||||
| Deferred Compensation | 13,707 | 14,200 | ||||||
| State Franchise Tax | 1,891 | 1,624 | ||||||
| Tax Credit Carry Forward | 0 | 1,266 | ||||||
| Lease Liability | 1,454 | 1,487 | ||||||
| Acquired Net Operating Loss | 643 | 673 | ||||||
| Fair Value Adjustment on Loans Acquired | 237 | 286 | ||||||
| Fair Value Adjustment on ORE Acquired | 108 | 108 | ||||||
| PPP Loan Service Fee Income | 1,367 | 0 | ||||||
| Low-Income Housing Investment | 384 | 286 | ||||||
| Other | 7 | 2 | ||||||
| Total Deferred Tax Assets | $ | 45,572 | $ | 44,309 | ||||
| Deferred Tax Liabilities | ||||||||
| Premises and Equipment | (1,684 | ) | (1,974 | ) | ||||
| Securities Accretion | (588 | ) | (370 | ) | ||||
| Unrealized Gain on Securities Available-for-Sale | (5,156 | ) | (935 | ) | ||||
| Leasing Activities | (17,183 | ) | (19,226 | ) | ||||
| Core Deposit Intangible Asset | (1,186 | ) | (1,372 | ) | ||||
| ROU Lease Asset | (1,428 | ) | (1,471 | ) | ||||
| Prepaid | (45 | ) | (66 | ) | ||||
| Other | (1,209 | ) | (898 | ) | ||||
| Total Deferred Tax Liabilities | (28,479 | ) | (26,312 | ) | ||||
| Net Deferred Tax Assets | $ | 17,093 | $ | 17,997 | ||||
The Company has $883.8 million in pledged loans with the Federal Reserve Bank (the “Fed”). As of December 31, 2022, the Company’s overnight borrowing capacity using the primary credit facilities from the Fed account was $651.0 million. The borrowing rate is 425 basis points. There were no outstanding advances on the above borrowing facilities as of December 31, 2022 and 2021.
Note 9—Long-term Subordinated Debentures On March 27,2020, the Coronavirus Aid, Relief and Economic Security Act (CARES Act) was enacted in response to the COVID-19 pandemic. The CARES Act provides options for accelerating refunds associated with previously paid alternative minimum taxes. The Company benefited from the alternative minimum tax refund provisions of the CARES Act and submitted accelerated refund claims during the year ended December 31,2020. Based upon the level of historical taxable income and projections for future taxable income over the periods during which the deferred tax assets are expected to be deductible, Management believes it is more likely than not we will realize the benefit of the remaining deferred tax assets.
In December 2003, the Company formed a wholly owned Connecticut statutory business trust, FMCB Statutory Trust I (“Statutory Trust I”), which issued $10.0 million of guaranteed preferred beneficial interests in the Company’s junior subordinated deferrable interest debentures (the “Trust Preferred Securities”). The Company is not considered the primary beneficiary of the trust (variable interest entity), therefore the trust is not consolidated in the Company’s financial statements, but rather the subordinated debentures are shown as a liability. These debentures qualify as Tier 1 capital under current regulatory guidelines. All of the common securities of Statutory Trust I are owned by the Company. The proceeds from the issuance of the common securities and the Trust Preferred Securities were used by FMCB Statutory Trust to purchase $10.3 million of junior subordinated debentures of the Company, which carry a floating rate based on three-month LIBOR plus 2.85%. The debentures represent the sole asset of Statutory Trust I. The Trust Preferred Securities accrue and pay distributions at a floating rate of three-month LIBOR plus 2.85% per annum of the stated liquidation value of $1,000 per capital security. The Company has entered into contractual arrangements which, taken collectively, fully and unconditionally guarantee payment to the extent that Statutory Trust I has funds available thereforetherefor of: (i) accrued and unpaid distributions required to be paid on the Trust Preferred Securities; (ii) the redemption price with respect to any Trust Preferred Securities called for redemption by Statutory Trust I; and (iii) payments due upon a voluntary or involuntary dissolution, winding up, or liquidation of Statutory Trust I.
The Trust Preferred Securities are mandatorily redeemable upon maturity of the subordinated debentures on December 17, 2033, or upon earlier redemption as provided in the indenture. The Company has the right to redeem the subordinated debentures purchased by Statutory Trust I, in whole or in part, on or after December 17, 2008. As specified in the indenture, if the subordinated debentures are redeemed prior to maturity, the redemption price will be the principal amount and any accrued but unpaid interest. Additionally, if the Company decided to defer interest on the subordinated debentures, the Company would be prohibited from paying cash dividends on the Company’s common stock.
The Company and the Bank are subject to various federal regulatory capital requirementsadequacy guidelines as outlined under Part 324 of the Basel III Capital Rules.FDIC Rules and Regulations. Failure to meet minimum capital requirements can initiate certain mandatory, and possibly discretionary, actions by regulators that, if undertaken, could have a direct material effect on the Company’s and the Bank’s financial statements. Under capital adequacy guidelines and the regulatory framework for prompt corrective action, the Company and the Bank must meet specific capital guidelines that involve quantitative measures of the Company and the Bank’s assets, liabilities, and certain off-balance-sheet items as calculated under regulatory accounting practices. The Company and the Bank’s capital amounts and classification are also subject to qualitative judgments by the regulators about components, risk weightings, and other factors.
The implementation of Basel III requirements increased the required capital levels that the Company and the Bank must maintain. The final rules included new minimum risk-based capital and leverage ratios, which have been fully phased in. The new minimum capital level requirements applicable to the Company and the Bank under the final rules are: (i) a common equity Tier 1 capital ratio of 4.5% of risk-weighted assets (“RWA”); (ii) a Tier 1 capital ratio of 6% of RWA; (iii) a total capital ratio of 8% of RWA; and (iv) a Tier 1 leverage ratio of 4% of total assets. The final rules also established a “capital conservation buffer” of 2.5% above each of the new regulatory minimum capital ratios, which resulted in the following minimum ratios: (i) a common equity Tier 1 capital ratio of 7.0% of RWA; (ii) a Tier 1 capital ratio of 8.5% of RWA; and (iii) a total capital ratio of 10.5% of RWA. An institution will be subject to limitations on paying dividends, engaging in share repurchases, and paying discretionary bonuses if its capital level falls below the buffer amount. The final rules also permit the Company’s subordinated debentures issued in 2003 to continue to be counted as Tier 1 capital.
The Company’s and Bank’s actual and required capital amounts and ratios are no conditions or events since that notification that management believes have changed the Bank’s category.as follows:
| December 31, 2022 | ||||||||||||||||||||||||
| Actual | Required for Capital Adequacy Purposes | Minimum to be Categorized as “Well Capitalized” Under Prompt Corrective Action Regulation | ||||||||||||||||||||||
| (Dollars in thousands) | Amount | Ratio | Amount | Ratio | Amount | Ratio | ||||||||||||||||||
| Farmers & Merchants Bancorp | ||||||||||||||||||||||||
| CET1 capital to risk-weighted assets | $ | 493,438 | 11.57 | % | $ | 191,984 | 4.50 | % | N/A | N/A | ||||||||||||||
| Tier 1 capital to risk-weighted assets | 503,438 | 11.80 | % | 255,978 | 6.00 | % | N/A | N/A | ||||||||||||||||
| Risk-based capital to risk-weighted assets | 556,964 | 13.06 | % | 341,305 | 8.00 | % | N/A | N/A | ||||||||||||||||
| Tier 1 leverage capital ratio | 503,438 | 9.36 | % | 215,201 | 4.00 | % | N/A | N/A | ||||||||||||||||
| Farmers & Merchants Bank | ||||||||||||||||||||||||
| CET1 capital to risk-weighted assets | $ | 502,838 | 11.79 | % | $ | 191,970 | 4.50 | % | $ | 277,290 | 6.50 | % | ||||||||||||
| Tier 1 capital to risk-weighted assets | 502,838 | 11.79 | % | 255,960 | 6.00 | % | 341,280 | 8.00 | % | |||||||||||||||
| Risk-based capital to risk-weighted assets | 556,361 | 13.04 | % | 341,280 | 8.00 | % | 426,600 | 10.00 | % | |||||||||||||||
| Tier 1 leverage capital ratio | 502,838 | 9.35 | % | 215,018 | 4.00 | % | 268,772 | 5.00 | % | |||||||||||||||
Note 10—Shareholders’ Equity—Continued
| (in thousands) | Actual | Minimum Regulatory Capital Requirements | Well Capitalized Under Prompt Corrective Action | |||||||||||||||||||||
| December 31, 2020 | Amount | Ratio | Amount | Ratio | Amount | Ratio | ||||||||||||||||||
| Total Bank Capital to Risk Weighted Assets | $ | 446,251 | 12.46 | % | $ | 286,462 | 8.00 | % | $ | 358,077 | 10.00 | % | ||||||||||||
| Total Consolidated Capital to Risk Weighted Assets | $ | 450,890 | 12.59 | % | $ | 286,539 | 8.00 | % | N/A | N/A | ||||||||||||||
| Total Bank Common Equity Tier 1 Capital Ratio | $ | 401,313 | 11.21 | % | $ | 161,135 | 4.50 | % | $ | 232,750 | 6.50 | % | ||||||||||||
| Total Consolidated Common Equity Tier 1 Capital Ratio | $ | 395,941 | 11.05 | % | $ | 161,178 | 4.50 | % | N/A | N/A | ||||||||||||||
| Tier 1 Bank Capital to Risk Weighted Assets | $ | 401,313 | 11.21 | % | $ | 214,846 | 6.00 | % | $ | 286,462 | 8.00 | % | ||||||||||||
| Tier 1 Consolidated Capital to Risk Weighted Assets | $ | 405,941 | 11.33 | % | $ | 214,904 | 6.00 | % | N/A | N/A | ||||||||||||||
| Tier 1 Bank Capital to Average Assets | $ | 401,313 | 9.04 | % | $ | 177,605 | 4.00 | % | $ | 222,006 | 5.00 | % | ||||||||||||
| Tier 1 Consolidated Capital to Average Assets | $ | 405,941 | 9.13 | % | $ | 177,820 | 4.00 | % | N/A | N/A | ||||||||||||||
| (in thousands) | Actual | Minimum Regulatory Capital Requirements | Well Capitalized Under Prompt Corrective Action | |||||||||||||||||||||
| December 31, 2019 | Amount | Ratio | Amount | Ratio | Amount | Ratio | ||||||||||||||||||
| Total Bank Capital to Risk Weighted Assets | $ | 399,230 | 12.33 | % | $ | 259,012 | 8.00 | % | $ | 323,765 | 10.00 | % | ||||||||||||
| Total Consolidated Capital to Risk Weighted Assets | $ | 400,258 | 12.36 | % | $ | 259,028 | 8.00 | % | N/A | N/A | ||||||||||||||
| Total Bank Common Equity Tier 1 Capital Ratio | $ | 358,576 | 11.08 | % | $ | 145,694 | 4.50 | % | $ | 210,447 | 6.50 | % | ||||||||||||
| Total Consolidated Common Equity Tier 1 Capital Ratio | $ | 349,601 | 10.80 | % | $ | 145,703 | 4.50 | % | N/A | N/A | ||||||||||||||
| Tier 1 Bank Capital to Risk Weighted Assets | $ | 358,576 | 11.08 | % | $ | 194,259 | 6.00 | % | $ | 259,012 | 8.00 | % | ||||||||||||
| Tier 1 Consolidated Capital to Risk Weighted Assets | $ | 359,601 | 11.11 | % | $ | 194,271 | 6.00 | % | N/A | N/A | ||||||||||||||
| Tier 1 Bank Capital to Average Assets | $ | 358,576 | 9.89 | % | $ | 145,079 | 3.00 | % | $ | 181,349 | 5.00 | % | ||||||||||||
| Tier 1 Consolidated Capital to Average Assets | $ | 359,601 | 9.90 | % | $ | 145,255 | 3.00 | % | N/A | N/A | ||||||||||||||
| December 31, 2021 | ||||||||||||||||||||||||
| Actual | Required for Capital Adequacy Purposes | Minimum to be Categorized as “Well Capitalized” Under Prompt Corrective Action Regulation | ||||||||||||||||||||||
| (Dollars in thousands) | Amount | Ratio | Amount | Ratio | Amount | Ratio | ||||||||||||||||||
| Farmers & Merchants Bancorp | ||||||||||||||||||||||||
| CET1 capital to risk-weighted assets | $ | 450,687 | 11.68 | % | $ | 173,674 | 4.50 | % | N/A | N/A | ||||||||||||||
| Tier 1 capital to risk-weighted assets | 460,687 | 11.94 | % | 231,566 | 6.00 | % | N/A | N/A | ||||||||||||||||
| Risk-based capital to risk-weighted assets | 509,091 | 13.19 | % | 308,755 | 8.00 | % | N/A | N/A | ||||||||||||||||
| Tier 1 leverage capital ratio | 460,687 | 8.92 | % | 206,606 | 4.00 | % | N/A | N/A | ||||||||||||||||
| Farmers & Merchants Bank | ||||||||||||||||||||||||
| CET1 capital to risk-weighted assets | $ | 459,813 | 11.91 | % | $ | 173,664 | 4.50 | % | $ | 250,847 | 6.50 | % | ||||||||||||
| Tier 1 capital to risk-weighted assets | 459,813 | 11.91 | % | 231,551 | 6.00 | % | 308,735 | 8.00 | % | |||||||||||||||
| Risk-based capital to risk-weighted assets | 508,215 | 13.17 | % | 308,735 | 8.00 | % | 385,919 | 10.00 | % | |||||||||||||||
| Tier 1 leverage capital ratio | 459,813 | 8.91 | % | 206,426 | 4.00 | % | 258,033 | 5.00 | % | |||||||||||||||
The Company’s Board of Directors may declare cash or stock dividends out of retained earnings provided the regulatory minimum capital ratios are met. The Company plans to maintain capital ratios that meet the capital adequacy standards per the regulations.
Basic earnings per common share amounts are computed by dividing net income by the weighted average number of common shares outstanding for the period. The Company has no securities or other contracts, such as stock options, that could require the issuance of additional common stock. Accordingly, diluted earnings per share are equal to basic earnings per share. The following table calculates the basic and diluted earnings per common share forrepresents income available to common shareholders divided by the periods indicated.weighted-average number of common shares outstanding during the period.
(net income in thousands) | 2020 | 2019 | 2018 | |||||||||
| Net Income | $ | 58,734 | $ | 56,036 | $ | 45,527 | ||||||
| Weighted Average Number of Common Shares Outstanding | 793,337 | 787,227 | 801,229 | |||||||||
| Basic and Diluted Earnings Per Common Share | $ | 74.03 | $ | 71.18 | $ | 56.82 | ||||||
Earnings per common share have been computed based on the following:
| Year Ended December 31, | ||||||||||||
| (Dollars in thousands, except share and per share amounts) | 2022 | 2021 | 2020 | |||||||||
| Numerator | ||||||||||||
| Net income | $ | 75,090 | $ | 66,336 | $ | 58,734 | ||||||
| Denominator | ||||||||||||
| Weighted average number of common shares outstanding | 777,726 | 789,646 | 793,337 | |||||||||
| Weighted average number of dilutive shares outstanding | 777,726 | 789,646 | 793,337 | |||||||||
| Basic earnings per common share | $ | 96.55 | $ | 84.01 | $ | 74.03 | ||||||
| Diluted earning per commons share | $ | 96.55 | $ | 84.01 | $ | 74.03 | ||||||
Note 11—Employee Benefit Plans
Profit Sharing Plan
The Company, through the Bank, sponsors a Profit Sharing Plan for substantially all full-time employees of the Company with one or more years of service. The plan assets, reported at fair value, are primarily invested in mutual funds and other investments, which are primarily Level 2 inputs. Participants receive up to 2two annual employer contributions, one is discretionary and the other is mandatory. The discretionary contributions to the Profit Sharing Plan are determined annually by the Board of Directors. The discretionary contributions totaled $1.5$1.8 million, $1.4$1.6 million, and $1.2$1.5 million for the years ended December 31, 2020, 2019,2022, 2021, and 2018,2020, respectively. The mandatory contributions to the Profit Sharing Plan are made according to a predetermined set of criteria. Mandatory contributions totaled $1.6 million, $1.7 million, $1.6 million, and $1.4$1.7 million for the years ended December 31, 2020, 2019,2022, 2021, and 2018,2020, respectively. Company employees are permitted, within limitations imposed by tax law, to make pretax contributions and after tax (Roth) contributions to the 401(k) feature of the Profit Sharing Plan. The Company does not match employee contributions within the 401(k) feature of the Profit Sharing Plan and the Company can terminate the Profit Sharing Plan at any time. Benefits pursuant to the Profit Sharing Plan vest 0% during the first year of participation, 25% per full year thereafter and after five years such benefits are fully vested.
Executive Retirement Plan and Life Insurance Arrangements
The Company, through the Bank, sponsors an Executive Retirement Plan (“ERP”) for certain executive level employees. The ERP is a non-qualified deferred compensation plan and was developed to supplement the Company’s Profit Sharing Plan, which, as a qualified retirement plan, has a ceiling on benefits as set by the Internal Revenue Service.Service regulations. The ERP is comprised of: (1) a Performance Component which makes contributions based upon long-term cumulative profitability and increase in market value of the Company; (2) a Salary Component which makes contributions based upon participant salary levels; and (3) an Equity Component for which contributions are discretionary and subject to Board of Directors approval. The Company maintains a Rabbi Trust to fund, in part, the ERP. The Rabbi Trust is an irrevocable grantor trust to which the Company may contribute assets for the limited purpose of funding a nonqualified deferred compensation plan. The Company may not use the assets of the Rabbi Trust for any purpose other than meeting its obligations under the ERP,ERP; however, the assets of the Rabbi Trust remain subject to the claims of its creditors and are included in the consolidated financial statements. The Company contributes cash to the Rabbi Trust from time to time for the sole purpose of funding the ERP. The Rabbi Trust will use any cash the Company contributes to purchase shares of common stock of the Company, and other financial instruments, on the open market. ERP contributions are invested in a mix of financial instruments; however, the Equity Component contributions are invested primarily in common stock of the Company.
The Company expensed $6.8$7.4 million to the ERP during the year ended December 31, 2020, $6.62022, $9.0 million during the year ended December 31, 20192021 and $6.2$6.8 million during the year ended December 31, 2018.2020. The Company’s carrying value of the liability under the ERP was $56.7$57.0 million as of December 31, 20202022 and $50.5$63.9 million as of December 31, 2019.2021. The Company’s shares of common stock held as investments in the Rabbi Trust of the ERP as of December 31, 20202022 and 20192021 totaled 52,98050,196 and 48,13355,436 with an historical cost basis of $31.2$31.4 million and $29.1$33.2 million, respectively. All amounts have been fully funded into the Rabbi Trust as of December 31, 20202022 and 2019.2021. The consolidated investments held in the Rabbi Trust are recorded at fair value with changes in unrealized gains or losses recorded within non-interest income and the equal and offsetting charges in the related liability are recorded in non-interest expense in the consolidated statements of income.
Net gains on ERP plan investments were $1.8$0.1 million in 20202022 compared to net gains of $2.6$2.5 million in 2019.2021 and $1.8 million in 2020. Balances in non-qualified deferred compensation plans may be invested in financial instruments whose market value fluctuates based upon trends in interest rates and stock prices.
Note 11—Employee Benefit Plans—Continued
The Company has purchased single premium life insurance policies on the lives of certain key employees of the Company. These policies provide: (1) financial protection to the Company in the event of the death of a key employee; and (2) significant income to the Company to offset the expense associated with the Executive Retirement Plan and other employee benefit plans, since the interest earned on the cash surrender value of the policies is tax exempt as long as the policies are used to finance employee benefits. As compensation to each employee for agreeing to allow the Company to purchase an insurance policy on his or her life, split dollar agreements have been entered into with those employees. These agreements provide for a division of the life insurance death proceeds between the Company and each employee’s designated beneficiary or beneficiaries.
The Company earned tax-exempt interest on the life insurance policies of $2.2 million for the year ended December 31, 2022, $2.2 million for the year ended December 31, 2021, and $2.1 million for the year ended December 31, 2020, $2.0 million for the year ended December 31, 2019, and $1.9 million for the year ended December 31, 2018.2020. As of December 31, 20202022 and 2019,2021, the total cash surrender value of the insurance policies was $69.2$73.0 million and $67.1$71.4 million, respectively.
Senior Management Retention Plan
The Company, through the Bank, sponsors a Senior Management Retention Plan (“SMRP”) for certain senior level employees. The SMRP is a non-qualified deferred compensation plan and was developed to supplement the Company’s Profit Sharing Plan, which, as a qualified retirement plan, has a ceiling on benefits as set by the Internal Revenue Service.Service regulations. All contributions are discretionary and subject to the Board of Directors approval. The Company maintains a Rabbi Trust to fund, in part, the SMRP. The Rabbi Trust is an irrevocable grantor trust to which the Company may contribute assets for the limited purpose of funding a nonqualifiednon-qualified deferred compensation plan. The Company may not use the assets of the Rabbi Trust for any purpose other than meeting its obligations under the SMRP,SMRP; however, the assets of the Rabbi Trust remain subject to the claims of its creditors and are included in the consolidated financial statements. The Company contributes cash to the Rabbi Trust from time to time for the sole purpose of funding the SMRP. The Rabbi Trust will use any cash the Company contributes to purchase shares of common stock of the Company, and other financial instruments, on the open market. Contributions to the SMRP are invested primarily in common stock of the Company.
The Company expensed $2.3$3.0 million to the SMRP during the year ended December 31, 2020, $1.32022, $2.7 million during the year ended December 31, 20192021 and $1.5$2.3 million during the year ended December 31, 2018.2020. The Company’s carrying value of the liability under the SMRP was $8.6$13.6 million as of December 31, 20202022 and $6.3$11.1 million as of December 31, 2019.2021. The Company’s shares of stock held as investments in the Rabbi Trust of the SMRP as of December 31, 20202022 and December 31, 20192021 totaled 12,54815,998 and 9,82214,192 shares with an historical cost basis of $7.9$10.8 million and $5.8$9.5 million, respectively. All amounts have been fully funded into the Rabbi Trust as of December 31, 20202022 and 2019.2021. The consolidated investments held in the Rabbi Trust are recorded at fair value with changes in unrealized gains or losses recorded within non-interest income and the equal and offsetting charges in the related liability are recorded in non-interest expense in the consolidated statements of income.
Net gains on SMRP plan investments were $0.4 million in 2022, $0.1 million in 2020 compared to 02021 and $0.1 in 2019.2020. Balances in non-qualified deferred compensation plans may be invested in financial instruments whose market value fluctuates based upon trends in interest rates and stock prices.
Note 12—Fair Value Measurements
The Company follows the “Fair Value Measurement and Disclosures” topic of the FASB ASC, which establishes a framework for measuring fair value in U.S. GAAP and expands disclosures about fair value measurements. This standard applies whenever other standards require, or permit assets or liabilities to be measured at fair value but does not expand the use of fair value in any new circumstances. In this standard, the FASB clarifies the principle that fair value should be based on the assumptions market participants would use when pricing the asset or liability. In support of this principle, this standard establishes a fair value hierarchy that prioritizes the information used to develop those assumptions. The fair value hierarchy is as follows:
Level 1 inputs – Unadjusted quoted prices in active markets for identical assets or liabilities that the entity has the ability to access at the measurement date.
Level 2 inputs -– Inputs other than quoted prices included in Level 1 that are observable for the asset or liability, either directly or indirectly. These might include quoted prices for similar assets and liabilities in active markets, and inputs other than quoted prices that are observable for the asset or liability, such as interest rates and yield curves that are observable at commonly quoted intervals.
Level 3 inputs -– Unobservable inputs for determining the fair values of assets or liabilities that reflect an entity’s own assumptions about the assumptions that market participants would use in pricing the assets or liabilities.
Management monitors the availability of observable market data to assess the appropriate classification of financial instruments within the fair value hierarchy. Changes in economic conditions or model-based valuation techniques may require the transfer of financial instruments from one fair value level to another. In such instances, the transfer is reported at the beginning of the reporting period.
Management evaluates the significance of transfers between levels based upon the nature of the financial instrument and size of the transfer relative to total assets, total liabilities or total earnings.
Securities classified as available-for-sale are reported at fair value on a recurring basis utilizing Level 1, 2 and 3 inputs. For these securities, the Company obtains fair value measurements from an independent pricing service. The fair value measurements consider observable data that may include dealer quotes, market spreads, cash flows, the U.S. Treasury yield curve, live trading levels, trade execution data, market consensus prepayment speeds, credit information and the bond’s terms and conditions, among other things.
The Company does not record all loans &and leases at fair value on a recurring basis. However, from time to time, a loan or lease is considered impairedcollateral dependent and an allowance for credit losses is established. Once a loan or lease is identified as individually impaired,collaterally dependent, management measures impairment in accordance with the “Receivable” topic of the FASB ASC. The fair value of impairedcollateral dependent loans or leases is estimated using one of several methods, including collateral value when the loan is collateral dependent, market value of similar debt, enterprise value, and discounted cash flows. ImpairedCollateral dependent loans &and leases not requiring an allowance represent loans &and leases for which the fair value of the expected repayments or collateral exceed the recorded investments in such loans &and leases. ImpairedCollateral dependent loans &and leases where an allowance is established based on the fair value of collateral require classification in the fair value hierarchy. The fair value of collateral dependent impaired loans is generally based on recent real estate appraisals.
Note 12—Fair Value—Continued
These appraisals may utilize a single valuation approach or a combination of approaches including sales comparison, cost and the income approach. Adjustments are often made in the appraisal process by the appraisers to take in to account differences between the comparable sales and income and other available data. Such adjustments can be significant and typically result in a Level 3 classification of the inputs for determining fair value. The valuation technique used for Level 3 nonrecurring impairednon-recurring collateral dependent loans is primarily the sales comparison approach less estimated selling costs of 10%.costs.
Other Real Estate Owned (“ORE”OREO”) is reported at fair value on a non-recurring basis. Fair values are based on recent real estate appraisals. These appraisals may use a single valuation approach or a combination of approaches including sales comparison, cost and the income approach. Adjustments are often made in the appraisal process by the appraisers to take in to account differences between the comparable sales and income and other available data. Such adjustments can be significant and typically result in a Level 3 classification of the inputs for determining fair value. The valuation technique used for Level 3 nonrecurring OREnon-recurring OREO is primarily the sales comparison approach less estimated selling costs of 10%.costs.
The following tables present information aboutsummarize the carrying value and estimated fair values of the Company’s financial assets and liabilities measured at fair value on a recurring basis and indicate the fair value hierarchy of the valuation techniques utilized by the Company to determine such fair value for the periods indicated.
Fair Value Measurements At December 31, 2020, Using | ||||||||||||||||
| (in thousands) | Fair Value Total | Quoted Prices in Active Markets for Identical Assets (Level 1) | Other Observable Inputs (Level 2) | Significant Unobservable Inputs (Level 3) | ||||||||||||
| Available-for-Sale Securities: | ||||||||||||||||
| US Treasury Notes | $ | 15,288 | $ | 15,288 | $ | 0 | $ | 0 | ||||||||
| US Government Agency SBA | 8,160 | 0 | 8,160 | 0 | ||||||||||||
| Mortgage Backed Securities | 737,873 | 0 | 737,873 | 0 | ||||||||||||
| Corporate Securities | 45,919 | 0 | 45,919 | 0 | ||||||||||||
| Other | 492 | 182 | 310 | 0 | ||||||||||||
| Total Assets Measured at Fair Value On a Recurring Basis | $ | 807,732 | $ | 15,470 | $ | 792,262 | $ | 0 | ||||||||
| December 31, 2022 | Fair Value Measurements | |||||||||||||||||||
| (Dollars in thousands) | Carrying Amount | Level 1 | Level 2 | Level 3 | Total Fair Value | |||||||||||||||
| Financial Assets: | ||||||||||||||||||||
| Cash and cash equivalents | $ | 588,257 | $ | 588,257 | $ | - | $ | - | $ | 588,257 | ||||||||||
| Available-for-sale debt securities | 152,864 | 4,964 | 147,900 | - | 152,864 | |||||||||||||||
| Held-to-maturity debt securities | 844,953 | - | 661,167 | 42,534 | 703,701 | |||||||||||||||
| Non-marketable securities | 15,549 | - | - | 15,549 | 15,549 | |||||||||||||||
| Loans and leases, net | 3,445,476 | - | - | 3,335,042 | 3,335,042 | |||||||||||||||
Bank-owned life insurance | 73,038 | 73,038 | - | - | 73,038 | |||||||||||||||
| Financial Liabilities: | ||||||||||||||||||||
| Total deposits | $ | 4,759,269 | $ | - | $ | 4,427,869 | $ | 323,572 | $ | 4,751,441 | ||||||||||
| Subordinated debentures | 10,310 | - | 12,211 | - | 12,211 | |||||||||||||||
| December 31, 2021 | Fair Value Measurements | |||||||||||||||||||
| (Dollars in thousands) | Carrying Amount | Level 1 | Level 2 | Level 3 | Total Fair Value | |||||||||||||||
| Financial Assets: | ||||||||||||||||||||
| Cash and cash equivalents | $ | 715,460 | $ | 715,460 | $ | - | $ | - | $ | 715,460 | ||||||||||
| Available-for-sale debt securities | 270,454 | 10,214 | 260,240 | - | 270,454 | |||||||||||||||
| Held-to-maturity debt securities | 737,052 | - | 681,588 | 44,446 | 726,034 | |||||||||||||||
| Non-marketable securities | 15,549 | - | - | 15,549 | 15,549 | |||||||||||||||
| Loans and leases, net | 3,176,170 | - | - | 3,179,857 | 3,179,857 | |||||||||||||||
| Bank-owned life insurance | 71,411 | 71,411 | - | - | 71,411 | |||||||||||||||
| Financial Liabilities: | ||||||||||||||||||||
| Total deposits | $ | 4,640,152 | $ | - | $ | 4,247,666 | $ | 391,732 | $ | 4,639,398 | ||||||||||
| Subordinated debentures | 10,310 | - | 6,890 | - | 6,890 | |||||||||||||||
Fair Value Measurements At December 31, 2019, Using | ||||||||||||||||
| (in thousands) | Fair Value Total | Quoted Prices in Active Markets for Identical Assets (Level 1) | Other Observable Inputs (Level 2) | Significant Unobservable Inputs (Level 3) | ||||||||||||
| Available-for-Sale Securities: | ||||||||||||||||
| US Treasury Notes | $ | 54,995 | $ | 54,995 | $ | 0 | $ | 0 | ||||||||
| US Government Agency SBA | 10,798 | 0 | 10,798 | 0 | ||||||||||||
| Mortgage Backed Securities | 441,078 | 0 | 441,078 | 0 | ||||||||||||
| Other | 515 | 205 | 310 | 0 | ||||||||||||
| Total Assets Measured at Fair Value On a Recurring Basis | $ | 507,386 | $ | 55,200 | $ | 452,186 | $ | 0 | ||||||||
Non-recurring Measurements: collateral dependent loans and OREO are classified with Level 2 available-for-sale investment securities are3 of the fair value hierarchy. The estimated fair value of collateral dependent loans is based on quoted market pricesthe fair value of the collateral, less estimated costs to sell. The Company receives an appraisal or performs an evaluation for similar securities. Duringeach collateral dependent loan. The key inputs used to determine the year ended December 31, 2020, there were 0 transfers infair value of collateral dependent loans include selling costs, and adjustment to comparable collateral. Valuations and significant inputs obtained by independent sources are reviewed by the Company for accuracy and reasonableness. Appraisals are typically obtained at least on an annual basis. The Company also considers other factors and events that may affect the fair value. The appraisals or outevaluations are reviewed at least on a quarterly basis to determine if any adjustments are needed. After review and acceptance of level 1, 2,the appraisal or 3.evaluation, adjustments to collateral dependent loans may occur.
The following tables present information about the Company’s impaired loans & leasesBank’s assets and other real estate, classes of assets or liabilities that the Company carriesmeasured at fair value on a recurring and non-recurring basis and indicatesindicate the fair value hierarchy of the valuation techniques utilized by the CompanyBank to determine such fair value for the periods indicated. Not all impaired loans & leases are carried at fair value. Impaired loans & leases are only included in the following tables when their fair value is based upon an appraisal of the collateral, and if that appraisal results in a partial charge-off or the establishment of a specific reserve.
Fair Value Measurements At December 31, 2020, Using | ||||||||||||||||
| (in thousands) | Fair Value Total | Quoted Prices in Active Markets for Identical Assets (Level 1) | Other Observable Inputs (Level 2) | Significant Unobservable Inputs (Level 3) | ||||||||||||
| Impaired Loans: | ||||||||||||||||
| Residential 1st Mortgage | $ | 1,584 | $ | 0 | $ | 0 | $ | 1,584 | ||||||||
| Home Equity Lines and Loans | 61 | 0 | 0 | 61 | ||||||||||||
| Agricultural | 400 | 0 | 0 | 400 | ||||||||||||
| Commercial | 213 | 0 | 0 | 213 | ||||||||||||
| Consumer | 138 | 0 | 0 | 138 | ||||||||||||
| Total Impaired Loans | 2,396 | 0 | 0 | 2,396 | ||||||||||||
| Other Real Estate: | ||||||||||||||||
| Real Estate Construction | 873 | 0 | 0 | 873 | ||||||||||||
| Total Other Real Estate | 873 | 0 | 0 | 873 | ||||||||||||
| Total Assets Measured at Fair Value On a Non-Recurring Basis | $ | 3,269 | $ | 0 | $ | 0 | $ | 3,269 | ||||||||
| December 31, 2022 | Fair Value Measurements | |||||||||||||||||||
| (Dollars in thousands) | Carrying Amount | Level 1 | Level 2 | Level 3 | Total Fair Value | |||||||||||||||
| Fair valued on a recurring basis: | ||||||||||||||||||||
| Debt securities available-for-sale | ||||||||||||||||||||
U.S. Treasury notes | $ | 4,964 | $ | 4,964 | $ | - | $ | - | $ | 4,964 | ||||||||||
U.S. Government-sponsored securities | 4,427 | - | 4,427 | - | 4,427 | |||||||||||||||
Mortgage-backed securities | 132,528 | - | 132,528 | - | 132,528 | |||||||||||||||
Collateralized mortgage obligations | 1,054 | - | 1,054 | - | 1,054 | |||||||||||||||
Corporate securities | 9,581 | - | 9,581 | - | 9,581 | |||||||||||||||
Other | 310 | - | 310 | - | 310 | |||||||||||||||
| Fair valued on a non-recurring basis: | ||||||||||||||||||||
Collateral dependent loans | $ | 14,473 | $ | - | $ | - | $ | 14,473 | $ | 14,473 | ||||||||||
Other real estate owned | 873 | - | - | 873 | 873 | |||||||||||||||
| December 31, 2021 | Fair Value Measurements | |||||||||||||||||||
| (Dollars in thousands) | Carrying Amount | Level 1 | Level 2 | Level 3 | Total Fair Value | |||||||||||||||
| Fair valued on a recurring basis: | ||||||||||||||||||||
| Debt securities available-for-sale | ||||||||||||||||||||
U.S. Treasury notes | $ | 10,089 | $ | 10,089 | $ | - | $ | - | $ | 10,089 | ||||||||||
U.S. Government-sponsored securities | 6,374 | - | 6,374 | - | 6,374 | |||||||||||||||
Mortgage-backed securities | 251,120 | - | 251,120 | - | 251,120 | |||||||||||||||
Collateralized mortgage obligations | 2,436 | - | 2,436 | - | 2,436 | |||||||||||||||
Other | 435 | 125 | 310 | - | 435 | |||||||||||||||
| Fair valued on a non-recurring basis: | ||||||||||||||||||||
| Individually evaluated loans | $ | 2,562 | $ | - | $ | - | $ | 2,562 | $ | 2,562 | ||||||||||
| Other real estate owned | 873 | - | - | 873 | 873 | |||||||||||||||
114
Fair Value Measurements At December 31, 2019, Using | ||||||||||||||||
| (in thousands) | Fair Value Total | Quoted Prices in Active Markets for Identical Assets (Level 1) | Other Observable Inputs (Level 2) | Significant Unobservable Inputs (Level 3) | ||||||||||||
| Impaired Loans: | ||||||||||||||||
| Commercial Real Estate | $ | 2,588 | $ | 0 | $ | 0 | $ | 2,588 | ||||||||
| Residential 1st Mortgage | 1,403 | 0 | 0 | 1,403 | ||||||||||||
| Home Equity Lines and Loans | 142 | 0 | 0 | 142 | ||||||||||||
| Agricultural | 88 | 0 | 0 | 88 | ||||||||||||
| Commercial | 1,391 | 0 | 0 | 1,391 | ||||||||||||
| Consumer | 139 | 0 | 0 | 139 | ||||||||||||
| Total Impaired Loans | 5,751 | 0 | 0 | 5,751 | ||||||||||||
| Other Real Estate: | ||||||||||||||||
| Real Estate Construction | 873 | 0 | 0 | 873 | ||||||||||||
| Total Other Real Estate | 873 | 0 | 0 | 873 | ||||||||||||
| Total Assets Measured at Fair Value On a Non-Recurring Basis | $ | 6,624 | $ | 0 | $ | 0 | $ | 6,624 | ||||||||
December 31, 2020 (in thousands) | Fair Value | Valuation Technique | Unobservable Inputs | Range, Weighted Avg. | ||||||
| Impaired Loans: | ||||||||||
| Residential 1st Mortgage | $ | 1,584 | Sales Comparison Approach | Adjustment for Difference Between Comparable Sales | 0.72% - 4.13%, 2.57 | % | ||||
| Home Equity Lines and Loans | $ | 61 | Sales Comparison Approach | Adjustment for Difference Between Comparable Sales | 1.1% - 1.4%, 1.25 | % | ||||
| Agricultural | $ | 400 | Income Approach | Capitalization Rate | 10%, 10 | % | ||||
| Commercial | $ | 213 | Income Approach | Capitalization Rate | 10%, 10 | % | ||||
| Consumer | $ | 138 | Income Approach | Adjustment for Difference Between Comparable Sales | 10%, 10 | % | ||||
| Other Real Estate: | ||||||||||
| Real Estate Construction | $ | 873 | Sales Comparison Approach | Adjustment for Difference Between Comparable Sales | 10%, 10 | % | ||||
December 31, 2019 (in thousands) | Fair Value | Valuation Technique | Unobservable Inputs | Range, Weighted Avg. | ||||||
| Impaired Loans: | ||||||||||
| Commercial Real Estate | $ | 2,588 | Income Approach | Capitalization Rate | 3.3 | % | ||||
| Residential 1st Mortgages | $ | 1,403 | Sales Comparison Approach | Adjustment for Difference Between Comparable Sales | 0.8% - 6.4%, 3 | % | ||||
| Home Equity Lines and Loans | $ | 142 | Sales Comparison Approach | Adjustment for Difference Between Comparable Sales | 1% - 2%, 1.3 | % | ||||
| Agricultural | $ | 88 | Income Approach | Capitalization Rate | 4.3 | % | ||||
| Commercial | $ | 1,391 | Income Approach | Capitalization Rate | 3.3 | % | ||||
| Consumer | $ | 139 | Sales Comparison Approach | Adjustment for Difference Between Comparable Sales | 40.6 | % | ||||
| Other Real Estate: | ||||||||||
| Real Estate Construction | $ | 873 | Sales Comparison Approach | Adjustment for Difference Between Comparable Sales | 10 | % | ||||
| Fair Value of Financial Instruments Using | ||||||||||||||||||||
December 31, 2020 (in thousands) | Carrying Amount | Quoted Prices in Active Markets for Identical Assets (Level 1) | Other Observable Inputs (Level 2) | Significant Unobservable Inputs (Level 3) | Total Estimated Fair Value | |||||||||||||||
| Assets: | ||||||||||||||||||||
| Cash and Cash Equivalents | $ | 383,837 | $ | 383,837 | $ | 0 | $ | 0 | $ | 383,837 | ||||||||||
| Investment Securities Available-for-Sale | 807,732 | 15,470 | 792,262 | 0 | 807,732 | |||||||||||||||
| Investment Securities Held-to-Maturity | 68,933 | 0 | 26,262 | 43,787 | 70,049 | |||||||||||||||
| Loans & Leases, Net | 3,040,730 | 0 | 0 | 3,045,911 | 3,045,911 | |||||||||||||||
| Accrued Interest Receivable | 20,333 | 0 | 20,333 | 0 | 20,333 | |||||||||||||||
| Liabilities: | ||||||||||||||||||||
| Deposits | 4,060,267 | 3,638,400 | 0 | 422,840 | 4,061,240 | |||||||||||||||
| Subordinated Debentures | 10,310 | 0 | 6,888 | 0 | 6,888 | |||||||||||||||
| Accrued Interest Payable | 1,383 | 0 | 1,383 | 0 | 1,383 | |||||||||||||||
| Fair Value of Financial Instruments Using | ||||||||||||||||||||
December 31, 2019 (in thousands) | Carrying Amount | Quoted Prices in Active Markets for Identical Assets (Level 1) | Other Observable Inputs (Level 2) | Significant Unobservable Inputs (Level 3) | Total Estimated Fair Value | |||||||||||||||
| Assets: | ||||||||||||||||||||
| Cash and Cash Equivalents | $ | 294,758 | $ | 294,758 | $ | 0 | $ | 0 | $ | 294,758 | ||||||||||
| Investment Securities Available-for-Sale | 507,386 | 55,200 | 452,186 | 0 | 507,386 | |||||||||||||||
| Investment Securities Held-to-Maturity | 60,229 | 0 | 31,253 | 29,844 | 61,097 | |||||||||||||||
| Loans & Leases, Net | 2,618,015 | 0 | 0 | 2,584,805 | 2,584,805 | |||||||||||||||
| Accrued Interest Receivable | 16,733 | 0 | 16,733 | 0 | 16,733 | |||||||||||||||
| Liabilities: | ||||||||||||||||||||
| Deposits | 3,278,019 | 2,760,097 | 0 | 517,172 | 3,277,269 | |||||||||||||||
| Subordinated Debentures | 10,310 | 0 | 7,325 | 0 | 7,325 | |||||||||||||||
| Accrued Interest Payable | 2,795 | 0 | 2,795 | 0 | 2,795 | |||||||||||||||
In the normal course of business, the Company enters into financial instruments with off balance sheet risk in order to meet the financing needs of its customers and to reduce its own exposure to fluctuations in interest rates. These instruments include commitments to extend credit, letters of credit, and other types of financial guarantees. The Company had the following off balance sheet commitments as of the dates indicated.
| (in thousands) | December 31, 2020 | December 31, 2019 | ||||||
| Commitments to Extend Credit | $ | 1,040,844 | $ | 919,982 | ||||
| Letters of Credit | 18,846 | 20,346 | ||||||
| Performance Guarantees Under Interest Rate Swap Contracts Entered Into Between Our Borrowing Customers and Third Parties | 2,786 | 1,513 | ||||||
| December 31, | ||||||||
| (Dollars in thousands) | 2022 | 2021 | ||||||
Commitments to extend credit, including unsecured commitments of $20,401 and $21,036 as of December 31, 2022 and 2021, respectively | $ | 1,141,036 | $ | 937,009 | ||||
Stand-by letters of credit, including unsecured commitments of $7,954 and $9,091 as of December 31, 2022 and 2021, respectively | 17,138 | 17,880 | ||||||
| Performance guarantees under interest rate swap contracts entered into with our clients and third-parties | - | 1,433 | ||||||
The Company’s exposure to credit loss in the event of nonperformance by the other party with regard to standby letters of credit, undisbursed loan commitments, and financial guarantees is represented by the contractual notional amount of those instruments. Commitments to extend credit are agreements to lend to a customer as long as there is no violation of any condition established in the contract. The Company uses the same credit policies in making commitments and conditional obligations as it does for recorded balance sheet items. The Company may or may not require collateral or other security to support financial instruments with credit risk. Evaluations of each customer’s creditworthiness are performed on a case-by-case basis.
Standby letters of credit are conditional commitments issued by the Company to guarantee performance of or payment for a customer to a third party.third-party. Outstanding standby letters of credit have maturity dates ranging from 1 to 2560 months with final expiration in January 2022.2027. Commitments generally have fixed expiration dates or other termination clauses and may require payment of a fee.
In the ordinary course of business, the Company becomes involved in litigation arising out of its normal business activities. Management, after consultation with legal counsel, believes that the ultimate liability, if any, resulting from the disposition of such claims would not be material in relation to the financial position of the Company.
The Company may be required to maintain average reserves on deposit with the Federal Reserve Bank primarily based on deposits outstanding. Reserve requirements are offset by the Company’s vault cash and deposit balances maintained with the Federal Reserve Bank.
Lessee – Operating Leases
Operating leases in which we are the lessee are recorded as operating lease right-of-use (“ROU”) assets and operating lease liabilities, included in other assets and other liabilities, respectively, on our consolidated balance sheets.statements of financial condition. We do not currently have any significant finance leases in which we are the lessee.
Operating lease ROU assets represent our right to use an underlying asset during the lease term and operating lease liabilities represent our obligation to make lease payments arising from the lease. ROU assets and operating lease liabilities are recognized at lease commencement based on the present value of the remaining lease payments using a discount rate that represents our incremental borrowing rate at the lease commencement date. ROU assets are further adjusted for lease incentives. Operating lease expense, which is comprised of amortization of the ROU asset and the implicit interest accreted on the operating lease liability, is recognized on a straight-line basis over the lease term, and is recorded net in occupancy expense in the consolidated statements of income.
Our leases relate primarily to office space and bank branches with remaining lease terms of generally 1nine months to 108 years. Certain lease arrangements contain extension options whichthat typically range from 5 to 10 years at the then fair market rental rates. ASC 842 requires lessees to evaluate whether option periods, if available, will be exercised in order to determine the full life of the lease. The Company used the first option period, unless it is a relatively new lease that has a long initial lease term or other extenuating circumstances.
As of December 31, 2020,2022, operating lease ROU assets and liabilities were $4.80$3.4 million and $4.92$3.5 million, respectively. Operating lease expenses totaled $833,000$730,000 for the year ended December 31, 2020. 2022. As of December 31, 2019,2021, operating lease ROU assets and liabilities were $4.98$4.05 million and $5.03$4.13 million, respectively. Operating leaseslease expenses totaled $836,000$739,000 and $833,000 for the yearyears ended December 31, 2019. In the 4th quarter of2021 and 2020, the lease term and payment of 1 lease was modified resulting in additional ROU assets and liabilities of $542,000.respectively.
The table below summarizes the information related to our operating leases:
| Year Ended December 31, | ||||||||||||||||
| (in thousands except for percent and period data) | Year Ended December 31, 2020 | Year Ended December 31, 2019 | 2022 | 2021 | ||||||||||||
| Cash Paid for Amounts Included in the Measurement of Lease Liabilities Operating Cash Flow from Operating Leases | $ | 795 | $ | 783 | ||||||||||||
| Right-of-Use Assets Obtained in Exchange for New Operating Lease Liabilities | $ | 0 | $ | 5,645 | ||||||||||||
| Cash Paid for Amounts Included in the Measurement of Lease Liabilities | ||||||||||||||||
| Operating Cash Flow from Operating Leases | $ | 704 | $ | 709 | ||||||||||||
| Weighted-Average Remaining Lease Term - Operating Leases, in Years | 7.33 | 7.88 | 5.48 | 6.55 | ||||||||||||
| Weighted-Average Discount Rate - Operating Leases | 2.9 | % | 3.2 | % | 2.6 | % | 2.6 | % | ||||||||
Note 14—Leases—Continued
The table below summarizes the maturity of remaining lease liability:
| (in thousands) | December 31, 2020 | |||
| 2021 | 727 | |||
| 2022 | 695 | |||
| 2023 | 705 | |||
| 2024 | 721 | |||
| 2025 | 731 | |||
| 2026 and thereafter | 1,907 | |||
| Total Lease Payments | 5,486 | |||
| Less: Interest | (568 | ) | ||
| Present Value of Lease Liabilities | $ | 4,918 | ||
| (Dollars in thousands) | Amount | |||
2023 | $ | 720 | ||
2024 | 716 | |||
2025 | 714 | |||
2026 | 679 | |||
2027 | 367 | |||
| 2028 and beyond | 520 | |||
| Total lease payments | 3,716 | |||
| Discount | (243 | ) | ||
| Net present value of lease liabilities | $ | 3,473 | ||
As of December 31, 2020,2022, we havehad no additional operating leases for office space that have not yet commenced or that are anticipated to commence during the first quarter of 2021.2023.
Lessor -– Direct Financing Leases
The Company is the lessor in direct finance lease arrangements. Leases are recorded at the principal balance outstanding, net of unearned income and charge-offs. Interest income is recognized using the interest method. Leases typically have a maturity of three to ten years, and fixed rates that are most often tied to treasuryTreasury indices with an appropriate spread based on the amount of perceived risk. Credit risks are underwritten using the same credit criteria the Company would use when making an equipment term loan. Residual value risk is managed through the use ofwith qualified, independent appraisers that establish the residual values the Company uses in structuring a lease. The impact of adopting Topic 842 for lessor accounting was not significant.
Lease payments due to the Company are typically fixed and paid in equal installments over the lease term. Variable lease payments that do not depend on an index or a rate (e.g., property taxes) that are paid directly by the Company are minimal. The majority of property taxes are paid directly by the client to a third partythird-parties and are not considered part of variable payments and therefore are not recorded by the Company.
As a lessor, the Company leases certain types of agriculture equipment, solar equipment, construction equipment and other equipment to its customers. The Company’s net investment in direct financing leases was $103.5$111.6 million at December 31, 20202022 and $105.4$96.4 million at December 31, 2019.2021.
Note 15—Income Taxes
The followingcomponents of income tax expense (benefit) are as follows:
| Year Ended December 31, | ||||||||||||
| (Dollars in thousands) | 2022 | 2021 | 2020 | |||||||||
| Income tax expense / (benefit) | ||||||||||||
| Current: | ||||||||||||
| Federal | $ | 10,638 | $ | 12,595 | $ | 12,174 | ||||||
| State | 9,683 | 10,270 | 9,005 | |||||||||
| Total current expense | 20,321 | 22,865 | 21,179 | |||||||||
| Deferred: | ||||||||||||
| Federal | 3,744 | 59 | (1,115 | ) | ||||||||
| State | 586 | (939 | ) | (847 | ) | |||||||
| Total current deferred benefit | 4,330 | (880 | ) | (1,962 | ) | |||||||
| Provision for income tax expense | $ | 24,651 | $ | 21,985 | $ | 19,217 | ||||||
The combined federal and state income tax expense differs from that computed at the federal statutory corporate tax rate as follows:
| Year Ended December 31, | ||||||||||||||||||||||||
| 2022 | 2021 | 2020 | ||||||||||||||||||||||
| (Dollars in thousands) | Amount | Rate | Amount | Rate | Amount | Rate | ||||||||||||||||||
| Effective income tax rate | ||||||||||||||||||||||||
| Federal statutory rate | $ | 20,946 | 21.00 | % | $ | 18,548 | 21.00 | % | $ | 16,370 | 21.00 | % | ||||||||||||
| State taxes, net of Federal income tax benefit | 8,112 | 8.13 | % | 7,370 | 8.34 | % | 6,445 | 8.27 | % | |||||||||||||||
| Low-income housing tax credits | (3,031 | ) | (3.04 | %) | (3,116 | ) | (3.53 | %) | (2,655 | ) | (3.41 | %) | ||||||||||||
| Compensation expense | (578 | ) | (0.58 | %) | - | - | - | - | ||||||||||||||||
| Bank owned life insurance | (494 | ) | (0.49 | %) | (471 | ) | (0.53 | %) | (444 | ) | (0.57 | %) | ||||||||||||
| Tax-exempt interest income | (326 | ) | (0.32 | %) | (347 | ) | (0.39 | %) | (350 | ) | (0.45 | %) | ||||||||||||
| Other, net | 22 | 0.02 | % | 1 | 0.00 | % | (149 | ) | (0.19 | %) | ||||||||||||||
| Total provision for income tax expense and effective tax rate | $ | 24,651 | 24.72 | % | $ | 21,985 | 24.89 | % | $ | 19,217 | 24.65 | % | ||||||||||||
Note 15—Income Taxes—Continued
The nature and components of the Company’s net deferred income tax assets are as follows:
| December 31, | ||||||||
| (Dollars in thousands) | 2022 | 2021 | ||||||
| Deferred income tax assets: | ||||||||
| Allowance for credit losses | $ | 20,508 | $ | 18,129 | ||||
| Deferred compensation | 20,564 | 15,339 | ||||||
| Unrealized losses on debt securities | 9,341 | 945 | ||||||
| Accrued liabilities | 3,832 | 9,415 | ||||||
| State income taxes | 2,034 | 2,157 | ||||||
| Lease liabilities | 1,027 | 1,222 | ||||||
| SBA PPP loan fee income | - | 764 | ||||||
| Acquired net operating losses | 584 | 614 | ||||||
| Low-income housing tax investments | 565 | 503 | ||||||
| Acquired loans fair valuation | 108 | 197 | ||||||
| Acquired OREO fair valuation | 108 | 108 | ||||||
| Other | 2 | 19 | ||||||
| Total deferred income tax assets | 58,673 | 49,412 | ||||||
| Deferred income tax liabilities: | ||||||||
| Commercial leasing | $ | (21,204 | ) | $ | (17,892 | ) | ||
| Premises and equipment | (1,940 | ) | (1,860 | ) | ||||
| Deferred loan and lease costs | (1,105 | ) | (869 | ) | ||||
| Right of use leasing asset | (996 | ) | (1,197 | ) | ||||
| Core deposit intangible asset | (830 | ) | (1,006 | ) | ||||
| Accretion on investment securities | (547 | ) | (523 | ) | ||||
| FHLB dividends | (348 | ) | (348 | ) | ||||
| Prepaid assets | (40 | ) | (43 | ) | ||||
| Other | (156 | ) | (132 | ) | ||||
| Total deferred income tax liabilities | (27,166 | ) | (23,870 | ) | ||||
| Net deferred income tax assets | $ | 31,507 | $ | 25,542 | ||||
The Company believes, based on available information, that more likely than not, the net deferred income tax asset will be realized in the normal course of operations. Accordingly, no valuation allowance has been recorded at December 31, 2022 and 2021.
The impact of a tax position is recognized in the financial informationstatements if that position is presentedmore likely than not of being sustained on audit, based on the technical merits of the position. As of December 31, 2022 and 2021, the Company did not have any significant uncertain tax positions. The Company includes any interest and penalties associated with unrecognized tax benefits within the provision for income taxes. The Company does not expect a material change to the total amount of unrecognized tax benefits in the next twelve months.
The Company files U.S. and state income tax returns in jurisdictions with various statutes of limitations. The 2018 through 2022 tax years remain subject to selection for examination as of December 31, for2022. As of December 31, 2022 and 2021, the periods indicated.Company has net operating loss of $1.9 million and $2.0 million carry-forwards and no tax credit carry-forwards.
| (in thousands) | 2020 | 2019 | ||||||
| Cash | $ | 4,551 | $ | 1,341 | ||||
| Investment in Farmers & Merchants Bank of Central California | 429,037 | 378,271 | ||||||
| Investment Securities | 434 | 411 | ||||||
| Other Assets | 832 | 102 | ||||||
| Total Assets | $ | 434,854 | $ | 380,125 | ||||
| Subordinated Debentures | $ | 10,310 | $ | 10,310 | ||||
| Liabilities | 879 | 519 | ||||||
| Shareholders’ Equity | 423,665 | 369,296 | ||||||
| Total Liabilities and Shareholders’ Equity | $ | 434,854 | $ | 380,125 | ||||
| Year Ended December 31, | ||||||||||||
| (in thousands) | 2020 | 2019 | 2018 | |||||||||
| Equity (Loss) in Undistributed Earnings in Farmers & Merchants Bank of Central California | $ | 40,597 | $ | 44,571 | $ | (26,488 | ) | |||||
| Dividends from Subsidiary | 19,874 | 13,166 | 73,010 | |||||||||
| Interest Income | 11 | 17 | 16 | |||||||||
| Other Expenses, Net | (2,477 | ) | (2,416 | ) | (1,527 | ) | ||||||
| Tax Benefit | 729 | 698 | 516 | |||||||||
| Net Income | $ | 58,734 | $ | 56,036 | $ | 45,527 | ||||||
Note 16—Condensed Financial Statements of Cash FlowsParent Company
| Year Ended December 31, | ||||||||||||
| (in thousands) | 2020 | 2019 | 2018 | |||||||||
| Cash Flows from Operating Activities: | ||||||||||||
| Net Income | $ | 58,734 | $ | 56,036 | $ | 45,527 | ||||||
| Adjustments to Reconcile Net Income to Net Cash Provided by Operating Activities: | ||||||||||||
| (Equity) Loss in Undistributed Net Earnings from Subsidiary | (40,597 | ) | (44,571 | ) | 26,488 | |||||||
| Net (Increase) in Other Assets | (753 | ) | (160 | ) | (125 | ) | ||||||
| Net Increase (Decrease) in Liabilities | 360 | 222 | (942 | ) | ||||||||
| Net Cash Provided by Operating Activities | 17,744 | 11,527 | 70,948 | |||||||||
| Investing Activities: | ||||||||||||
| Payments for Business Acquisition | 0 | 0 | (28,642 | ) | ||||||||
| Payments for Investments in Non-Qualified Retirement Plan | (403 | ) | (6,273 | ) | (10,503 | ) | ||||||
| Net Cash Used by Investing Activities | (403 | ) | (6,273 | ) | (39,145 | ) | ||||||
| Financing Activities: | ||||||||||||
| Stock Repurchased | (2,834 | ) | 0 | (31,152 | ) | |||||||
| Issuance of Common Stock | 403 | 6,973 | 10,503 | |||||||||
| Cash Dividends | (11,700 | ) | (11,221 | ) | (11,151 | ) | ||||||
| Net Cash Used by Financing Activities | (14,131 | ) | (4,248 | ) | (31,800 | ) | ||||||
| Increase in Cash and Cash Equivalents | 3,210 | 1,006 | 3 | |||||||||
| Cash and Cash Equivalents at Beginning of Year | 1,341 | 335 | 332 | |||||||||
| Cash and Cash Equivalents at End of Year | $ | 4,551 | $ | 1,341 | $ | 335 | ||||||
Financial information pertaining only to Farmers and Merchants Bancorp (“FMCB”), on a parent-only basis, is as follows:
| December 31, | ||||||||
| (Dollars in thousands) | 2022 | 2021 | ||||||
| Balance Sheets | ||||||||
| Assets | ||||||||
| Cash and cash equivalents | $ | 1,582 | $ | 1,535 | ||||
| Investment in subsidiaries | 495,019 | 472,573 | ||||||
| Other assets | 304 | 241 | ||||||
| Total assets | $ | 496,905 | $ | 474,349 | ||||
| Liabilities and shareholders’ equity | ||||||||
| Subordinated debentures | $ | 10,310 | $ | 10,310 | ||||
| Other liabilities | 1,287 | 903 | ||||||
| Shareholders’ equity | 485,308 | 463,136 | ||||||
| Total liabilities and shareholders’ equity | $ | 496,905 | $ | 474,349 | ||||
| Year Ended December 31, | ||||||||||||
| (Dollars in thousands) | 2022 | 2021 | 2020 | |||||||||
| Statements of Income | ||||||||||||
| Dividend and other income from subsidiaries | $ | 34,700 | $ | 9,900 | $ | 19,874 | ||||||
| Interest and dividends | 14 | 9 | 11 | |||||||||
Total income | 34,714 | 9,909 | 19,885 | |||||||||
| Reimbursement of expenses from subsidiaries | 714 | 780 | 821 | |||||||||
| Other expenses | 2,388 | 1,469 | 1,656 | |||||||||
Total expense | 3,102 | 2,249 | 2,477 | |||||||||
| Income before income taxes | 31,612 | 7,660 | 17,408 | |||||||||
| Income tax benefit | 913 | 660 | 729 | |||||||||
| 32,525 | 8,320 | 18,137 | ||||||||||
Equity in undistributed net income of subsidiaries | 42,565 | 58,016 | 40,597 | |||||||||
| Net income | $ | 75,090 | $ | 66,336 | $ | 58,734 | ||||||
2020 (in thousands except per share data) | First Quarter | Second Quarter | Third Quarter | Fourth Quarter | Total | |||||||||||||||
| Total Interest Income | $ | 38,689 | $ | 37,967 | $ | 39,793 | $ | 42,203 | $ | 158,652 | ||||||||||
| Total Interest Expense | 3,263 | 2,552 | 2,094 | 1,582 | 9,491 | |||||||||||||||
| Net Interest Income | 35,426 | 35,415 | 37,699 | 40,621 | 149,161 | |||||||||||||||
| Provision for Credit Losses | 0 | 300 | 1,700 | 2,500 | 4,500 | |||||||||||||||
| Net Interest Income After | ||||||||||||||||||||
| Provision for Credit Losses | 35,426 | 35,115 | 35,999 | 38,121 | 144,661 | |||||||||||||||
| Total Non-Interest Income | 2,927 | 3,514 | 4,539 | 4,716 | 15,696 | |||||||||||||||
| Total Non-Interest Expense | 19,790 | 19,787 | 20,783 | 22,046 | 82,406 | |||||||||||||||
| Income Before Income Taxes | 18,563 | 18,842 | 19,755 | 20,791 | 77,951 | |||||||||||||||
| Provision for Income Taxes | 4,441 | 4,533 | 4,945 | 5,298 | 19,217 | |||||||||||||||
| Net Income | $ | 14,122 | $ | 14,309 | $ | 14,810 | $ | 15,493 | $ | 58,734 | ||||||||||
| Basic and Diluted Earnings Per Common Share | $ | 17.80 | $ | 18.03 | $ | 18.66 | $ | 19.54 | $ | 74.03 | ||||||||||
Note 16—Condensed Financial Statements of Parent Company—Continued
| (Dollars in thousands) | Year Ended December 31, | |||||||||||
| Statements of Cash Flows | 2022 | 2021 | 2020 | |||||||||
| Cash flows from operating activities: | ||||||||||||
| Net income | $ | 75,090 | $ | 66,336 | $ | 58,734 | ||||||
| Adjustments to reconcile net income to net cash provided by operating activities: | ||||||||||||
| Equity in undistributed net income of the Bank | (42,565 | ) | (58,016 | ) | (40,597 | ) | ||||||
| Change in other assets and liabilities | 197 | 739 | (393 | ) | ||||||||
| Net cash provided by operating activities | 32,722 | 9,059 | 17,744 | |||||||||
| Cash flows from investing activities: | ||||||||||||
| Payments for investments in non-qualified retirement plans | - | - | (403 | ) | ||||||||
| Securities sold or matured | 124 | - | - | |||||||||
| Net cash used in investing activities | 124 | - | (403 | ) | ||||||||
| Cash flows from financing activities: | ||||||||||||
| Common stock repurchases | (20,310 | ) | - | (2,834 | ) | |||||||
| Issuance of common stock | - | - | 403 | |||||||||
| Cash dividends paid | (12,489 | ) | (12,075 | ) | (11,700 | ) | ||||||
| Net used in financing activities | (32,799 | ) | (12,075 | ) | (14,131 | ) | ||||||
| Net change in cash and cash equivalents | 47 | (3,016 | ) | 3,210 | ||||||||
| Cash and cash equivalents, beginning of year | 1,535 | 4,551 | 1,341 | |||||||||
| Cash and cash equivalents, end of year | $ | 1,582 | $ | 1,535 | $ | 4,551 | ||||||
2019 (in thousands except per share data) | First Quarter | Second Quarter | Third Quarter | Fourth Quarter | Total | |||||||||||||||
| Total Interest Income | $ | 37,173 | $ | 38,626 | $ | 38,810 | $ | 39,099 | $ | 153,708 | ||||||||||
| Total Interest Expense | 2,966 | 3,253 | 3,530 | 3,445 | 13,194 | |||||||||||||||
| Net Interest Income | 34,207 | 35,373 | 35,280 | 35,654 | 140,514 | |||||||||||||||
| Provision for Credit Losses | 0 | 200 | 0 | 0 | 200 | |||||||||||||||
| Net Interest Income After | ||||||||||||||||||||
| Provision for Credit Losses | 34,207 | 35,173 | 35,280 | 35,654 | 140,314 | |||||||||||||||
| Total Non-Interest Income | 4,464 | 4,400 | 3,974 | 4,403 | 17,241 | |||||||||||||||
| Total Non-Interest Expense | 20,445 | 20,565 | 20,856 | 20,376 | 82,242 | |||||||||||||||
| Income Before Income Taxes | 18,226 | 19,008 | 18,398 | 19,681 | 75,313 | |||||||||||||||
| Provision for Income Taxes | 4,677 | 4,903 | 4,660 | 5,037 | 19,277 | |||||||||||||||
| Net Income | �� | $ | 13,549 | $ | 14,105 | $ | 13,738 | $ | 14,644 | $ | 56,036 | |||||||||
| Basic and Diluted Earnings Per Common Share | $ | 17.27 | $ | 17.92 | $ | 17.45 | $ | 18.54 | $ | 71.18 | ||||||||||
| Item 9. | Changes in and Disagreements with Accountants on Accounting and Financial Disclosure |
None
| Item 9A. | Controls and Procedures |
Evaluation of Disclosure Controls and Procedures
REPORT OF MANAGEMENT
Directors and Shareholders of Farmers & Merchants Bancorp
Management is responsible for establishing and maintaining adequatean effective system of internal control over financial reporting. The internal control system is augmented by written policies and procedures and by audits performed by an internal audit staff (assisted in certain instances by contracted external audit resources other than the independent registered public accounting firm), which reports to the Audit Committee of the Board of Directors. Internal auditors monitor the operation of the internal and external control system and report findings to management and the Audit Committee. When appropriate, corrective actions are taken to address identified control deficiencies and other opportunities for improving the system. The Audit Committee provides oversight to the financial reporting process. There are inherent limitations in the effectiveness of any system of internal control, including the possibility of human error and circumvention or overriding of controls. Accordingly, even an effective internal control system can provide only reasonable assurance with respect to financial statement preparation. Further, because of changes in conditions, the effectiveness of an internal control system may vary over time.
The Audit Committee of the Board of Directors is comprised entirely of outside directors who are independent of the Company’s management. The Audit Committee is responsible for the selection of the independent registered public accounting firm. It meets periodically with management, the independent auditors and the internal auditors to ensure that they are carrying out their responsibilities.
The Audit Committee is also responsible for performing an oversight role by reviewing and monitoring the financial, accounting, and auditing procedures of the Company in addition to reviewing the Company’s financial reports. The independent auditors and the internal auditors have full and free access to the Audit Committee, with or without the presence of management, to discuss the adequacy of the internal control structure for financial reporting and any other matters, which they believe should be brought to the attention of the Committee.
| /s/ Kent A. Steinwert | /s/ Stephen W. Haley | |
| Kent A. Steinwert | Stephen W. Haley | |
| Chairman, President, and Chief Executive Officer | Executive Vice President and Chief Financial Officer |
MANAGEMENT’S REPORT ON INTERNAL CONTROL OVER FINANCIAL REPORTING
Farmers & Merchants Bancorp management is responsible for establishing and maintaining effective internal control over financial reporting as defined in Rules 13a-15(f) and 15d-15(f) under the Securities Exchange Act of 1934, and for performing an assessment of the effectiveness of internal control over financial reporting as of December 31, 2020.amended. The Company’s internal control over financial reporting is a process designed by, or under the supervision of the Company’s management, including the Chief Executive Officer and Chief Financial Officer and effected by Management, and other personnel, to provide reasonable assurance regarding the reliability of financial reporting and the preparation of financial statements for external purposes in accordance with accounting principles generally accepted in the United States.
States of America (“GAAP”). The Company’s system of internal control over financial reporting includes those policies and procedures that (i) pertain to the maintenance of records that, in reasonable detail, accurately and fairly reflect transactions and dispositions of assets of the Company; (ii) provide reasonable assurance that transactions are recorded as necessary to permit preparation of financial statements in accordance with accounting principles generally accepted in the United States, and that receipts and expenditures of the Company are being made only in accordance with authorizations of management and directors of the Company; and (iii) provide reasonable assurance regarding prevention or timely detection of unauthorized acquisition, use or disposition of the Company’s assets that could have a material effect on the financial statements.that:
| (1) | Pertain to the maintenance of records that, in reasonable detail, accurately and fairly reflect the transactions and dispositions of the assets of the Company; |
| (2) | Provide reasonable assurance that transactions are recorded as necessary to permit preparation of financial statements in accordance with GAAP, and that receipts and expenditures of the Company are being made only in accordance with authorizations of management and directors of the Company; and |
| (3) | Provide reasonable assurance regarding prevention or timely detection of unauthorized acquisition, use or disposition of the Company’s assets that could have a material effect on the financial statements. |
There are inherent limitations in the effectiveness of any system of internal control, no matter how well designed and accordingly,misstatements due to error or fraud may occur and not be detected, including the possibility of circumvention or overriding of controls. Accordingly, even an effective internal control system can provide only reasonable assurance with respect to financial statement preparation and fair presentation.preparation. Further, because of changes in conditions, the effectiveness of an internal control system may vary over time.
The Company’s independent registered public accounting firm has audited the Company performedconsolidated financial statements for the year ended December 31, 2022, has issued an assessment ofaudit report on the Company’s internal control over financial reporting. Such audit report expresses an unqualified opinion on the effectiveness of the Company’s internal control over financial reporting in accordance with the standards of the Public Company Accounting Oversight Board as of December 31, 2020 as described2022 that appears on page 71.
Changes in “Internal Control-Integrated Framework (2013)” issued by the Committee of Sponsoring Organizations of the Treadway Commission. As a result of this assessment, management has concluded thatControls
There have not been any changes in the Company’s internal control over financial reporting was effective as of(as such term is defined in Rules 13a-15(f) and 15d-15(f) under the Exchange Act) during the year ended December 31, 2020.
None
| Item 9C. | Disclosure Regarding Foreign Jurisdictions that Prevent Inspections |
Not Applicable
PART III
| Item 10. | Directors, Executive Officers and Corporate Governance Consistent with the
Information regarding “Executive Compensation” is set forth under the headings “Director Compensation” and “Executive Compensation” of the Company’s Information regarding the “Compensation Committee Report” is set forth under the heading “Report of the Personnel Committee of the Board of Directors on Executive Compensation” under “Executive Compensation” in the Company’s Proxy Statement and is incorporated herein by reference.
Information regarding “Security Ownership of Certain Beneficial Owners and
Information regarding “Certain Relationships and Related Transactions, and Director 125
PART IV
List of Financial Statements and Financial Statement Schedules
*Filed herewith
None SIGNATURES Pursuant to the requirements of Section 13 or 15(d) of the Securities Exchange Act of 1934, the
POWER OF ATTORNEY KNOW ALL PERSONS BY THESE PRESENTS, that each person whose signature appears below constitutes and appoints Kent A. Steinwert and Stephen W. Haley, jointly and severally, his or her attorney-in-fact, with the power of substitution, for him or her in any and all capacities, to sign any amendments to this Annual Report on Form 10-K and to file the same, with exhibits thereto and other documents in connection therewith, with the Securities and Exchange Commission, hereby ratifying and confirming all that each of said attorneys-in-fact, or his or her substitute or substitutes, may do or cause to be done by virtue hereof. Pursuant to the requirements of the Securities Exchange Act of 1934, this report has been signed below on March 15, 2023, by the following persons on behalf of the registrant and in the capacities
| |||||||||||||||||||||||||||||||||||||||||||||||||||||||||||||||||||||||||||||||||||||||||||||||||||||||||||||||||||||||||||||||||||||||||||||||||||||||||||||||||||||||||||||||||||||||||||||||||||||||||||||||||||||||||||||||||||||||||||||||||||||||||||