false12-312021FY0000093389P33Y6MP6M1P1YP1Y2017 2018 2019 20202015 2016 2017 2018 2019 20202017 2018 2019 20202016 2017 2018 2019 20202017 2018 2019 20202017 2018 2019 20202016 2017 2018 2019 20202023-12-312022-03-312022-06-302030-12-3118500000933892021-01-012021-12-3100000933892021-06-3000000933892022-02-1700000933892019-01-012019-12-3100000933892020-01-012020-12-3100000933892021-12-3100000933892020-12-3100000933892018-12-3100000933892019-12-310000093389us-gaap:TreasuryStockMember2018-12-310000093389us-gaap:RetainedEarningsMember2018-12-310000093389us-gaap:AccumulatedOtherComprehensiveIncomeMember2018-12-310000093389us-gaap:ParentMember2018-12-310000093389us-gaap:NoncontrollingInterestMember2018-12-310000093389us-gaap:CommonStockMember2018-12-310000093389us-gaap:AdditionalPaidInCapitalMember2018-12-310000093389us-gaap:TreasuryStockMember2021-01-012021-12-310000093389us-gaap:RetainedEarningsMember2021-01-012021-12-310000093389us-gaap:CommonStockMember2021-01-012021-12-310000093389us-gaap:ParentMember2021-01-012021-12-310000093389us-gaap:AdditionalPaidInCapitalMember2021-01-012021-12-310000093389us-gaap:AccumulatedOtherComprehensiveIncomeMember2021-01-012021-12-310000093389us-gaap:NoncontrollingInterestMember2021-01-012021-12-310000093389us-gaap:CommonStockMember2020-01-012020-12-310000093389us-gaap:NoncontrollingInterestMember2019-01-012019-12-310000093389us-gaap:NoncontrollingInterestMember2020-01-012020-12-310000093389us-gaap:AccumulatedOtherComprehensiveIncomeMember2020-01-012020-12-310000093389us-gaap:ParentMember2020-01-012020-12-310000093389us-gaap:AdditionalPaidInCapitalMember2020-01-012020-12-310000093389us-gaap:ParentMember2019-01-012019-12-310000093389us-gaap:CommonStockMember2019-01-012019-12-310000093389us-gaap:TreasuryStockMember2019-01-012019-12-310000093389us-gaap:RetainedEarningsMember2019-01-012019-12-310000093389us-gaap:TreasuryStockMember2020-01-012020-12-310000093389us-gaap:AdditionalPaidInCapitalMember2019-01-012019-12-310000093389us-gaap:AccumulatedOtherComprehensiveIncomeMember2019-01-012019-12-310000093389us-gaap:RetainedEarningsMember2020-01-012020-12-310000093389us-gaap:ParentMember2021-12-310000093389us-gaap:CommonStockMember2019-12-310000093389us-gaap:CommonStockMember2021-12-310000093389us-gaap:AdditionalPaidInCapitalMember2020-12-310000093389us-gaap:TreasuryStockMember2019-12-310000093389us-gaap:RetainedEarningsMember2021-12-310000093389us-gaap:NoncontrollingInterestMember2020-12-310000093389us-gaap:NoncontrollingInterestMember2019-12-310000093389us-gaap:CommonStockMember2020-12-310000093389us-gaap:AccumulatedOtherComprehensiveIncomeMember2021-12-310000093389us-gaap:AdditionalPaidInCapitalMember2019-12-310000093389us-gaap:AdditionalPaidInCapitalMember2021-12-310000093389us-gaap:AccumulatedOtherComprehensiveIncomeMember2020-12-310000093389us-gaap:RetainedEarningsMember2019-12-310000093389us-gaap:NoncontrollingInterestMember2021-12-310000093389us-gaap:TreasuryStockMember2020-12-310000093389us-gaap:TreasuryStockMember2021-12-310000093389us-gaap:ParentMember2019-12-310000093389us-gaap:AccumulatedOtherComprehensiveIncomeMember2019-12-310000093389us-gaap:RetainedEarningsMember2020-12-310000093389us-gaap:ParentMember2020-12-310000093389smp:ParticulateMatterSensorBusinessOfStoneridgeIncMember2021-01-012021-12-310000093389smp:StabilOperativeGroupGmbHMember2021-01-012021-12-310000093389smp:TrumpetHoldingsIncMember2021-01-012021-12-310000093389srt:MaximumMemberus-gaap:ToolsDiesAndMoldsMember2021-01-012021-12-310000093389srt:MaximumMemberus-gaap:BuildingImprovementsMember2021-01-012021-12-310000093389srt:MaximumMemberus-gaap:BuildingMember2021-01-012021-12-310000093389us-gaap:ToolsDiesAndMoldsMembersrt:MinimumMember2021-01-012021-12-310000093389us-gaap:FurnitureAndFixturesMembersrt:MaximumMember2021-01-012021-12-310000093389srt:MinimumMemberus-gaap:BuildingImprovementsMember2021-01-012021-12-310000093389srt:MinimumMemberus-gaap:FurnitureAndFixturesMember2021-01-012021-12-310000093389us-gaap:BuildingMembersrt:MinimumMember2021-01-012021-12-310000093389us-gaap:MachineryAndEquipmentMembersrt:MaximumMember2021-01-012021-12-310000093389srt:MinimumMemberus-gaap:MachineryAndEquipmentMember2021-01-012021-12-310000093389us-gaap:CustomerConcentrationRiskMember2021-01-012021-12-310000093389smp:StabilOperativeGroupGmbHMember2021-09-300000093389smp:StabilOperativeGroupGmbHMember2021-09-012021-09-300000093389smp:StabilOperativeGroupGmbHMemberus-gaap:CustomerRelationshipsMember2021-01-012021-12-310000093389us-gaap:CorporateJointVentureMembersmp:TrumpetHoldingsIncMember2021-05-310000093389smp:TrumpetHoldingsIncMember2021-05-310000093389smp:TrumpetHoldingsIncMember2021-12-012021-12-310000093389smp:TrumpetHoldingsIncMember2021-05-012021-05-310000093389smp:TrumpetHoldingsIncMemberus-gaap:CustomerRelationshipsMember2021-05-310000093389smp:TrumpetHoldingsIncMemberus-gaap:TradeNamesMember2021-05-310000093389us-gaap:DevelopedTechnologyRightsMembersmp:TrumpetHoldingsIncMember2021-05-310000093389smp:TrumpetHoldingsIncMemberus-gaap:DevelopedTechnologyRightsMember2021-01-012021-12-310000093389smp:TrumpetHoldingsIncMemberus-gaap:CustomerRelationshipsMember2021-01-012021-12-310000093389us-gaap:TradeNamesMembersmp:TrumpetHoldingsIncMember2021-01-012021-12-310000093389smp:ParticulateMatterSensorBusinessOfStoneridgeIncTallinEstoniaMember2021-11-012021-11-300000093389smp:ParticulateMatterSensorBusinessOfStoneridgeIncMember2021-11-012021-11-300000093389smp:ParticulateMatterSensorBusinessOfStoneridgeIncLexingtonOhioMember2021-03-012021-03-310000093389smp:ParticulateMatterSensorBusinessOfStoneridgeIncMember2021-11-300000093389us-gaap:CustomerRelationshipsMembersmp:ParticulateMatterSensorBusinessOfStoneridgeIncMember2021-11-300000093389smp:ParticulateMatterSensorBusinessOfStoneridgeIncMemberus-gaap:CustomerRelationshipsMember2021-01-012021-12-310000093389us-gaap:EmployeeSeveranceMember2019-12-310000093389us-gaap:OtherRestructuringMember2019-12-310000093389us-gaap:OtherRestructuringMember2020-01-012020-12-310000093389us-gaap:EmployeeSeveranceMember2021-01-012021-12-310000093389us-gaap:OtherRestructuringMember2021-01-012021-12-310000093389us-gaap:EmployeeSeveranceMember2020-01-012020-12-310000093389smp:PollakRelocationMember2020-01-012020-12-310000093389smp:PlantRationalizationProgramMember2020-01-012020-12-310000093389smp:PlantRationalizationProgramMember2021-01-012021-12-310000093389smp:SootSensorProductLineRelocationMember2021-01-012021-12-310000093389us-gaap:EmployeeSeveranceMember2020-12-310000093389us-gaap:OtherRestructuringMember2021-12-310000093389smp:PollakRelocationMember2020-12-310000093389us-gaap:OtherRestructuringMember2020-12-310000093389smp:PlantRationalizationProgramMember2021-12-310000093389us-gaap:EmployeeSeveranceMember2021-12-310000093389smp:SootSensorProductLineRelocationMember2021-12-310000093389smp:SootSensorProductLineRelocationMembersrt:MaximumMember2021-01-012021-12-310000093389us-gaap:LandBuildingsAndImprovementsMember2021-12-310000093389us-gaap:MachineryAndEquipmentMember2021-12-310000093389us-gaap:LeaseholdImprovementsMember2021-12-310000093389us-gaap:LeaseholdImprovementsMember2020-12-310000093389us-gaap:MachineryAndEquipmentMember2020-12-310000093389us-gaap:ConstructionInProgressMember2020-12-310000093389us-gaap:ToolsDiesAndMoldsMember2020-12-310000093389us-gaap:LandBuildingsAndImprovementsMember2020-12-310000093389us-gaap:FurnitureAndFixturesMember2020-12-310000093389us-gaap:ConstructionInProgressMember2021-12-310000093389us-gaap:ToolsDiesAndMoldsMember2021-12-310000093389us-gaap:FurnitureAndFixturesMember2021-12-310000093389srt:MaximumMember2021-12-310000093389smp:TemperatureControlMember2019-12-310000093389smp:EngineManagementMember2019-12-310000093389smp:TemperatureControlMembersmp:TrumpetHoldingsIncMember2021-01-012021-12-310000093389smp:EngineManagementMembersmp:StabilOperativeGroupGmbHMember2021-01-012021-12-310000093389smp:TrumpetHoldingsIncMembersmp:EngineManagementMember2021-01-012021-12-310000093389smp:StabilOperativeGroupGmbHMembersmp:TemperatureControlMember2021-01-012021-12-310000093389smp:EngineManagementMember2021-01-012021-12-310000093389smp:EngineManagementMember2020-01-012020-12-310000093389smp:TemperatureControlMember2020-01-012020-12-310000093389smp:TemperatureControlMember2021-01-012021-12-310000093389smp:TemperatureControlMember2021-12-310000093389smp:TemperatureControlMember2020-12-310000093389smp:EngineManagementMember2021-12-310000093389smp:EngineManagementMember2020-12-310000093389smp:SupplyAgreementMember2020-12-310000093389us-gaap:TrademarksMember2021-12-310000093389smp:SupplyAgreementMember2021-12-310000093389us-gaap:NoncompeteAgreementsMember2021-12-310000093389us-gaap:LeaseAgreementsMember2020-12-310000093389smp:PatentsDevelopedTechnologyAndIntellectualPropertyMember2021-12-310000093389us-gaap:CustomerRelationshipsMember2021-12-310000093389us-gaap:LeaseAgreementsMember2021-12-310000093389us-gaap:NoncompeteAgreementsMember2020-12-310000093389us-gaap:CustomerRelationshipsMember2020-12-310000093389smp:PatentsDevelopedTechnologyAndIntellectualPropertyMember2020-12-310000093389us-gaap:TrademarksMember2020-12-310000093389us-gaap:TrademarksMember2020-01-012020-12-310000093389us-gaap:ComputerSoftwareIntangibleAssetMember2021-12-310000093389us-gaap:ComputerSoftwareIntangibleAssetMember2020-12-310000093389srt:MinimumMemberus-gaap:ComputerSoftwareIntangibleAssetMember2021-01-012021-12-310000093389srt:MaximumMemberus-gaap:ComputerSoftwareIntangibleAssetMember2021-01-012021-12-310000093389us-gaap:ComputerSoftwareIntangibleAssetMember2020-01-012020-12-310000093389us-gaap:ComputerSoftwareIntangibleAssetMember2019-01-012019-12-310000093389us-gaap:ComputerSoftwareIntangibleAssetMember2021-01-012021-12-310000093389smp:FoshanGuangdongAutomotiveAirConditioningCoLtdMember2021-12-310000093389smp:OrangeElectronicCoLtdMember2013-01-310000093389smp:FoshanGuangdongAutomotiveAirConditioningCoLtdMember2020-12-310000093389smp:FoshanCheYijiaNewEnergyTechnologyCoLtdMember2019-08-310000093389smp:FoshanCheYijiaNewEnergyTechnologyCoLtdMember2020-12-310000093389smp:FoshanGWOYNGSMPVehicleClimateControlCoolingProductsCoLtdMember2018-03-310000093389smp:FoshanGWOYNGSMPVehicleClimateControlCoolingProductsCoLtdMember2020-12-310000093389smp:OrangeElectronicCoLtdMember2021-12-310000093389smp:OrangeElectronicCoLtdMember2020-12-310000093389smp:FoshanGWOYNGSMPVehicleClimateControlCoolingProductsCoLtdMember2014-04-300000093389smp:FoshanCheYijiaNewEnergyTechnologyCoLtdMember2021-12-310000093389smp:FoshanGuangdongAutomotiveAirConditioningCoLtdMember2017-11-300000093389smp:FoshanGWOYNGSMPVehicleClimateControlCoolingProductsCoLtdMember2021-12-310000093389smp:FoshanCheYijiaNewEnergyTechnologyCoLtdMember2021-01-012021-12-310000093389smp:FoshanGWOYNGSMPVehicleClimateControlCoolingProductsCoLtdMember2021-01-012021-12-310000093389smp:FoshanGuangdongAutomotiveAirConditioningCoLtdMember2021-01-012021-12-310000093389smp:FoshanGWOYNGSMPVehicleClimateControlCoolingProductsCoLtdMember2020-01-012020-12-310000093389smp:OrangeElectronicCoLtdMember2020-01-012020-12-310000093389smp:OrangeElectronicCoLtdMember2021-01-012021-12-310000093389smp:FoshanGuangdongAutomotiveAirConditioningCoLtdMember2020-01-012020-12-310000093389smp:HSBCBankPolskaSAMember2020-12-310000093389smp:HSBCBankPolskaSAMember2021-12-310000093389us-gaap:RevolvingCreditFacilityMembercountry:CAsmp:JPMorganChaseBankCreditFacilityMember2021-12-310000093389smp:JPMorganChaseBankCreditFacilityMemberus-gaap:RevolvingCreditFacilityMember2021-12-310000093389us-gaap:RevolvingCreditFacilityMembersmp:JPMorganChaseBankCreditFacilityMember2021-01-012021-12-310000093389us-gaap:BaseRateMemberus-gaap:RevolvingCreditFacilityMembersrt:MinimumMembersmp:JPMorganChaseBankCreditFacilityMember2021-01-012021-12-310000093389srt:MaximumMembersmp:JPMorganChaseBankCreditFacilityMemberus-gaap:RevolvingCreditFacilityMemberus-gaap:BaseRateMember2021-01-012021-12-310000093389smp:JPMorganChaseBankCreditFacilityMemberus-gaap:RevolvingCreditFacilityMemberus-gaap:LondonInterbankOfferedRateLIBORMembersrt:MaximumMember2021-01-012021-12-310000093389srt:MinimumMembersmp:JPMorganChaseBankCreditFacilityMemberus-gaap:LondonInterbankOfferedRateLIBORMemberus-gaap:RevolvingCreditFacilityMember2021-01-012021-12-310000093389us-gaap:RevolvingCreditFacilityMembersmp:JPMorganChaseBankCreditFacilityMembersmp:BorrowingMember2021-12-310000093389us-gaap:RevolvingCreditFacilityMembersmp:JPMorganChaseBankCreditFacilityMemberus-gaap:BaseRateMember2021-12-310000093389smp:JPMorganChaseBankCreditFacilityMemberus-gaap:RevolvingCreditFacilityMember2020-12-310000093389smp:BorrowingMembersmp:JPMorganChaseBankCreditFacilityMemberus-gaap:RevolvingCreditFacilityMember2020-12-310000093389us-gaap:RevolvingCreditFacilityMembersmp:JPMorganChaseBankCreditFacilityMemberus-gaap:BaseRateMember2020-01-012020-12-310000093389us-gaap:BaseRateMemberus-gaap:RevolvingCreditFacilityMembersmp:JPMorganChaseBankCreditFacilityMember2021-01-012021-12-310000093389srt:MinimumMemberus-gaap:RevolvingCreditFacilityMembersmp:StockRepurchaseMember2021-12-310000093389us-gaap:RevolvingCreditFacilityMembersmp:FixedAssetsIncludedInBorrowingBaseMembersrt:MaximumMember2021-12-310000093389us-gaap:RevolvingCreditFacilityMembersmp:FixedAssetsNotIncludedInBorrowingBaseMember2021-12-310000093389us-gaap:RevolvingCreditFacilityMember2021-01-012021-12-310000093389smp:OtherDistributionsMembersrt:MinimumMemberus-gaap:RevolvingCreditFacilityMember2021-12-310000093389smp:StockRepurchaseMemberus-gaap:RevolvingCreditFacilityMember2021-12-310000093389us-gaap:DividendPaidMemberus-gaap:RevolvingCreditFacilityMember2021-12-310000093389smp:HSBCContinentalEuropeMemberus-gaap:SubsequentEventMember2022-02-280000093389smp:HSBCContinentalEuropeMember2021-01-012021-12-310000093389smp:HSBCContinentalEuropeMembersmp:WarsawInterbankOfferedRateMember2021-01-012021-12-310000093389smp:HSBCContinentalEuropeMember2020-12-310000093389smp:HSBCContinentalEuropeMember2021-12-310000093389us-gaap:SeriesAPreferredStockMember2021-12-310000093389us-gaap:PreferredStockMember2021-12-310000093389us-gaap:SeriesAPreferredStockMember2021-01-012021-12-310000093389us-gaap:PreferredStockMember2020-12-310000093389smp:StockRepurchaseProgram2020Member2020-03-310000093389smp:StockRepurchaseProgram2021OctoberMember2021-10-310000093389smp:StockRepurchaseProgram2021FebruaryMember2021-02-280000093389smp:StockRepurchaseProgram2020Member2021-01-012021-12-310000093389us-gaap:SubsequentEventMembersmp:StockRepurchaseProgram2021OctoberMember2022-01-012022-02-170000093389smp:StockRepurchaseProgram2020Member2020-01-012020-12-310000093389smp:StockRepurchaseProgram2021FebruaryMember2021-01-012021-12-310000093389smp:StockRepurchaseProgram2021OctoberMember2021-01-012021-12-310000093389smp:StockRepurchaseProgram2021OctoberMemberus-gaap:SubsequentEventMember2022-02-170000093389smp:StockRepurchaseProgram2021OctoberMember2021-12-310000093389us-gaap:ShareBasedPaymentArrangementNonemployeeMembersmp:TwoThousandAndSixteenOmnibusIncentivePlanMember2021-12-310000093389smp:TwoThousandAndSixteenOmnibusIncentivePlanMemberus-gaap:ShareBasedPaymentArrangementEmployeeMember2021-12-310000093389srt:MinimumMemberus-gaap:RestrictedStockMember2021-01-012021-12-310000093389us-gaap:PerformanceSharesMembersrt:MinimumMember2021-01-012021-12-310000093389us-gaap:RestrictedStockMembersrt:ExecutiveOfficerMemberus-gaap:ShareBasedCompensationAwardTrancheTwoMember2021-01-012021-12-310000093389srt:ExecutiveOfficerMemberus-gaap:RestrictedStockMemberus-gaap:ShareBasedCompensationAwardTrancheOneMember2021-01-012021-12-310000093389us-gaap:ShareBasedCompensationAwardTrancheThreeMemberus-gaap:RestrictedStockMembersrt:ExecutiveOfficerMember2021-01-012021-12-310000093389us-gaap:PerformanceSharesMember2021-01-012021-12-310000093389srt:MinimumMembersmp:ExecutivesAndDirectorsMembersmp:RestrictedAndPerformanceBasedSharesMember2021-01-012021-12-310000093389srt:MaximumMembersmp:ExecutivesAndDirectorsMembersmp:RestrictedAndPerformanceBasedSharesMember2021-01-012021-12-310000093389us-gaap:RestrictedStockMembersrt:ExecutiveOfficerMember2021-01-012021-12-310000093389us-gaap:RestrictedStockMembersrt:DirectorMember2021-01-012021-12-310000093389smp:EmployeesMemberus-gaap:RestrictedStockMember2021-01-012021-12-310000093389smp:TwoThousandAndSixteenOmnibusIncentivePlanMembersmp:RestrictedAndPerformanceBasedSharesMember2021-01-012021-12-310000093389smp:RestrictedAndPerformanceBasedSharesMembersmp:TwoThousandAndSixteenOmnibusIncentivePlanMember2021-12-310000093389smp:RestrictedAndPerformanceBasedSharesMember2021-12-310000093389smp:RestrictedAndPerformanceBasedSharesMember2020-12-310000093389smp:RestrictedAndPerformanceBasedSharesMembersmp:EmployeesMember2021-01-012021-12-310000093389srt:DirectorMembersmp:RestrictedAndPerformanceBasedSharesMember2020-01-012020-12-310000093389smp:EmployeesMembersmp:RestrictedAndPerformanceBasedSharesMember2020-01-012020-12-310000093389srt:DirectorMembersmp:RestrictedAndPerformanceBasedSharesMember2021-01-012021-12-310000093389smp:RestrictedAndPerformanceBasedSharesMember2019-12-310000093389smp:RestrictedAndPerformanceBasedSharesMember2021-01-012021-12-310000093389us-gaap:PerformanceSharesMembersmp:TwoThousandAndSixteenOmnibusIncentivePlanMember2021-01-012021-12-310000093389smp:TwoThousandAndSixteenOmnibusIncentivePlanMemberus-gaap:RestrictedStockMember2021-01-012021-12-310000093389smp:RestrictedAndPerformanceBasedSharesMember2020-01-012020-12-310000093389us-gaap:PerformanceSharesMember2020-01-012020-12-310000093389smp:RestrictedAndPerformanceBasedSharesMember2019-01-012019-12-310000093389smp:EmployeeStockOwnershipPlanAndTrustEsopMember2021-01-012021-12-310000093389smp:EmployeeStockOwnershipPlanAndTrustEsopMember2021-12-310000093389us-gaap:SupplementalEmployeeRetirementPlanDefinedBenefitMember2020-12-310000093389us-gaap:SupplementalEmployeeRetirementPlanDefinedBenefitMember2021-12-310000093389us-gaap:SupplementalEmployeeRetirementPlanDefinedBenefitMember2019-01-012019-12-310000093389us-gaap:SupplementalEmployeeRetirementPlanDefinedBenefitMember2020-01-012020-12-310000093389us-gaap:SupplementalEmployeeRetirementPlanDefinedBenefitMember2021-01-012021-12-310000093389us-gaap:ForeignCountryMember2021-01-012021-12-310000093389us-gaap:ForeignCountryMember2021-12-310000093389us-gaap:StateAndLocalJurisdictionMember2021-01-012021-12-310000093389smp:HungaryTaxAuthorityMember2021-01-012021-12-310000093389us-gaap:StateAdministrationOfTaxationChinaMember2021-01-012021-12-310000093389us-gaap:InlandRevenueHongKongMember2021-01-012021-12-310000093389us-gaap:CanadaRevenueAgencyMember2021-01-012021-12-310000093389us-gaap:MexicanTaxAuthorityMember2021-01-012021-12-310000093389smp:PolandTaxAuthorityMember2021-01-012021-12-310000093389srt:MaximumMemberus-gaap:ForeignCountryMember2021-01-012021-12-310000093389srt:MinimumMemberus-gaap:ForeignCountryMember2021-01-012021-12-310000093389smp:RestrictedAndPerformanceBasedSharesMember2020-01-012020-12-310000093389smp:RestrictedAndPerformanceBasedSharesMember2019-01-012019-12-310000093389smp:RestrictedAndPerformanceBasedSharesMember2021-01-012021-12-310000093389smp:TemperatureControlMemberus-gaap:OperatingSegmentsMember2021-01-012021-12-310000093389us-gaap:IntersegmentEliminationMembersmp:EngineManagementMember2021-01-012021-12-310000093389us-gaap:IntersegmentEliminationMemberus-gaap:CorporateAndOtherMember2019-01-012019-12-310000093389us-gaap:IntersegmentEliminationMembersmp:TemperatureControlMember2019-01-012019-12-310000093389us-gaap:OperatingSegmentsMembersmp:TemperatureControlMember2020-01-012020-12-310000093389smp:EngineManagementMemberus-gaap:OperatingSegmentsMember2019-01-012019-12-310000093389us-gaap:CorporateAndOtherMember2019-01-012019-12-310000093389us-gaap:CorporateAndOtherMemberus-gaap:IntersegmentEliminationMember2021-01-012021-12-310000093389us-gaap:CorporateAndOtherMember2020-01-012020-12-310000093389us-gaap:IntersegmentEliminationMembersmp:TemperatureControlMember2020-01-012020-12-310000093389us-gaap:IntersegmentEliminationMemberus-gaap:CorporateAndOtherMember2020-01-012020-12-310000093389us-gaap:IntersegmentEliminationMembersmp:EngineManagementMember2020-01-012020-12-310000093389smp:TemperatureControlMemberus-gaap:IntersegmentEliminationMember2021-01-012021-12-310000093389us-gaap:IntersegmentEliminationMember2019-01-012019-12-310000093389us-gaap:IntersegmentEliminationMember2020-01-012020-12-310000093389us-gaap:CorporateAndOtherMember2021-01-012021-12-310000093389us-gaap:OperatingSegmentsMembersmp:TemperatureControlMember2019-01-012019-12-310000093389us-gaap:IntersegmentEliminationMember2021-01-012021-12-310000093389smp:EngineManagementMemberus-gaap:OperatingSegmentsMember2020-01-012020-12-310000093389smp:EngineManagementMemberus-gaap:IntersegmentEliminationMember2019-01-012019-12-310000093389smp:EngineManagementMemberus-gaap:OperatingSegmentsMember2021-01-012021-12-310000093389us-gaap:OperatingSegmentsMembersmp:EngineManagementMember2019-12-310000093389us-gaap:OperatingSegmentsMembersmp:TemperatureControlMember2019-12-310000093389us-gaap:OperatingSegmentsMembersmp:EngineManagementMember2021-12-310000093389us-gaap:CorporateAndOtherMember2020-12-310000093389smp:EngineManagementMemberus-gaap:OperatingSegmentsMember2020-12-310000093389smp:TemperatureControlMemberus-gaap:OperatingSegmentsMember2021-12-310000093389us-gaap:CorporateAndOtherMember2021-12-310000093389us-gaap:CorporateAndOtherMember2019-12-310000093389smp:TemperatureControlMemberus-gaap:OperatingSegmentsMember2020-12-310000093389country:US2019-12-310000093389srt:AsiaMember2021-12-310000093389srt:AsiaMember2019-12-310000093389country:MX2021-12-310000093389srt:AsiaMember2020-12-310000093389country:US2021-12-310000093389country:CA2019-12-310000093389srt:EuropeMember2020-12-310000093389country:MX2019-12-310000093389country:CA2021-12-310000093389srt:EuropeMember2019-12-310000093389country:US2020-12-310000093389country:CA2020-12-310000093389srt:EuropeMember2021-12-310000093389country:MX2020-12-310000093389us-gaap:SalesRevenueNetMemberus-gaap:CustomerConcentrationRiskMembersmp:ThreeLargestIndividualCustomersMember2021-01-012021-12-310000093389us-gaap:SalesRevenueNetMembersmp:AutoZoneIncMemberus-gaap:CustomerConcentrationRiskMember2021-01-012021-12-310000093389us-gaap:CustomerConcentrationRiskMemberus-gaap:SalesRevenueNetMembersmp:OReillyAutomotiveIncMember2021-01-012021-12-310000093389smp:NapaAutoPartsMemberus-gaap:SalesRevenueNetMemberus-gaap:CustomerConcentrationRiskMember2021-01-012021-12-310000093389smp:OtherForeignMember2019-01-012019-12-310000093389smp:ExportMembersmp:EngineManagementMember2019-01-012019-12-310000093389smp:EngineManagementMembersmp:OtherForeignMember2019-01-012019-12-310000093389smp:OEOESMember2020-01-012020-12-310000093389smp:TemperatureControlMembersrt:AsiaMember2021-01-012021-12-310000093389smp:TemperatureControlMembersmp:OEOESMember2020-01-012020-12-310000093389us-gaap:CorporateAndOtherMembercountry:MX2019-01-012019-12-310000093389srt:EuropeMember2021-01-012021-12-310000093389us-gaap:CorporateAndOtherMembersmp:WireAndCableMember2019-01-012019-12-310000093389smp:OtherClimateControlPartsMemberus-gaap:CorporateAndOtherMember2019-01-012019-12-310000093389smp:TemperatureControlMembersmp:OtherClimateControlPartsMember2021-01-012021-12-310000093389smp:WireAndCableMember2020-01-012020-12-310000093389srt:AsiaMemberus-gaap:CorporateAndOtherMember2021-01-012021-12-310000093389country:CAsmp:EngineManagementMember2021-01-012021-12-310000093389us-gaap:CorporateAndOtherMembersmp:ExportMember2019-01-012019-12-310000093389us-gaap:CorporateAndOtherMembersrt:EuropeMember2021-01-012021-12-310000093389smp:TemperatureControlMembercountry:CA2019-01-012019-12-310000093389smp:TemperatureControlMembersmp:OEOESMember2021-01-012021-12-310000093389srt:AsiaMembersmp:EngineManagementMember2021-01-012021-12-310000093389smp:TemperatureControlMembersmp:OtherForeignMember2019-01-012019-12-310000093389country:CA2021-01-012021-12-310000093389country:CAus-gaap:CorporateAndOtherMember2020-01-012020-12-310000093389country:CAsmp:EngineManagementMember2020-01-012020-12-310000093389smp:EngineManagementMembercountry:US2019-01-012019-12-310000093389country:MXsmp:EngineManagementMember2019-01-012019-12-310000093389smp:TemperatureControlMembercountry:CA2021-01-012021-12-310000093389country:MX2019-01-012019-12-310000093389us-gaap:CorporateAndOtherMembersmp:OEOESMember2020-01-012020-12-310000093389smp:TemperatureControlMembersmp:WireAndCableMember2021-01-012021-12-310000093389smp:OEOESMemberus-gaap:CorporateAndOtherMember2021-01-012021-12-310000093389smp:IgnitionEmissionControlFuelAndSafetyRelatedSystemProductsMemberus-gaap:CorporateAndOtherMember2020-01-012020-12-310000093389country:USsmp:EngineManagementMember2020-01-012020-12-310000093389smp:TemperatureControlMember2019-01-012019-12-310000093389us-gaap:CorporateAndOtherMembercountry:MX2021-01-012021-12-310000093389us-gaap:CorporateAndOtherMembersrt:AsiaMember2019-01-012019-12-310000093389smp:TemperatureControlMembersrt:EuropeMember2021-01-012021-12-310000093389country:MXsmp:TemperatureControlMember2020-01-012020-12-310000093389smp:CompressorsMembersmp:TemperatureControlMember2021-01-012021-12-310000093389country:US2021-01-012021-12-310000093389us-gaap:CorporateAndOtherMembersmp:WireAndCableMember2021-01-012021-12-310000093389smp:OEOESMemberus-gaap:CorporateAndOtherMember2019-01-012019-12-310000093389srt:EuropeMember2019-01-012019-12-310000093389smp:OtherClimateControlPartsMember2020-01-012020-12-310000093389srt:AsiaMember2021-01-012021-12-310000093389us-gaap:CorporateAndOtherMembersmp:AftermarketMember2021-01-012021-12-310000093389smp:AftermarketMember2019-01-012019-12-310000093389smp:EngineManagementMembersmp:WireAndCableMember2021-01-012021-12-310000093389smp:TemperatureControlMembercountry:MX2019-01-012019-12-310000093389smp:IgnitionEmissionControlFuelAndSafetyRelatedSystemProductsMember2020-01-012020-12-310000093389srt:EuropeMember2020-01-012020-12-310000093389smp:OtherForeignMembersmp:EngineManagementMember2021-01-012021-12-310000093389us-gaap:CorporateAndOtherMembercountry:MX2020-01-012020-12-310000093389country:USus-gaap:CorporateAndOtherMember2021-01-012021-12-310000093389smp:AftermarketMembersmp:TemperatureControlMember2020-01-012020-12-310000093389us-gaap:CorporateAndOtherMembersrt:EuropeMember2020-01-012020-12-310000093389srt:AsiaMembersmp:TemperatureControlMember2019-01-012019-12-310000093389smp:WireAndCableMember2019-01-012019-12-310000093389smp:EngineManagementMembersmp:OtherForeignMember2020-01-012020-12-310000093389smp:IgnitionEmissionControlFuelAndSafetyRelatedSystemProductsMembersmp:TemperatureControlMember2019-01-012019-12-310000093389smp:EngineManagementMembersmp:AftermarketMember2019-01-012019-12-310000093389smp:EngineManagementMembersmp:IgnitionEmissionControlFuelAndSafetyRelatedSystemProductsMember2019-01-012019-12-310000093389smp:EngineManagementMembersmp:WireAndCableMember2020-01-012020-12-310000093389smp:IgnitionEmissionControlFuelAndSafetyRelatedSystemProductsMember2019-01-012019-12-310000093389smp:CompressorsMembersmp:EngineManagementMember2020-01-012020-12-310000093389smp:EngineManagementMember2019-01-012019-12-310000093389smp:AftermarketMember2020-01-012020-12-310000093389country:US2019-01-012019-12-310000093389country:CA2020-01-012020-12-310000093389smp:IgnitionEmissionControlFuelAndSafetyRelatedSystemProductsMembersmp:EngineManagementMember2020-01-012020-12-310000093389us-gaap:CorporateAndOtherMembercountry:CA2019-01-012019-12-310000093389us-gaap:CorporateAndOtherMembersmp:ExportMember2021-01-012021-12-310000093389smp:WireAndCableMembersmp:EngineManagementMember2019-01-012019-12-310000093389us-gaap:CorporateAndOtherMembersmp:OtherForeignMember2020-01-012020-12-310000093389smp:CompressorsMembersmp:EngineManagementMember2021-01-012021-12-310000093389smp:OtherClimateControlPartsMember2021-01-012021-12-310000093389us-gaap:CorporateAndOtherMembersmp:AftermarketMember2019-01-012019-12-310000093389smp:ExportMembersmp:TemperatureControlMember2021-01-012021-12-310000093389smp:CompressorsMember2020-01-012020-12-310000093389smp:IgnitionEmissionControlFuelAndSafetyRelatedSystemProductsMembersmp:TemperatureControlMember2021-01-012021-12-310000093389smp:IgnitionEmissionControlFuelAndSafetyRelatedSystemProductsMemberus-gaap:CorporateAndOtherMember2019-01-012019-12-310000093389smp:ExportMember2019-01-012019-12-310000093389srt:EuropeMembersmp:TemperatureControlMember2019-01-012019-12-310000093389smp:AftermarketMembersmp:EngineManagementMember2021-01-012021-12-310000093389smp:OEOESMembersmp:EngineManagementMember2019-01-012019-12-310000093389country:USsmp:TemperatureControlMember2020-01-012020-12-310000093389country:MXsmp:EngineManagementMember2021-01-012021-12-310000093389smp:TemperatureControlMembersmp:ExportMember2019-01-012019-12-310000093389smp:CompressorsMemberus-gaap:CorporateAndOtherMember2020-01-012020-12-310000093389smp:CompressorsMember2019-01-012019-12-310000093389us-gaap:CorporateAndOtherMembercountry:CA2021-01-012021-12-310000093389smp:TemperatureControlMembercountry:US2021-01-012021-12-310000093389smp:OEOESMembersmp:EngineManagementMember2020-01-012020-12-310000093389country:MXsmp:TemperatureControlMember2021-01-012021-12-310000093389smp:AftermarketMembersmp:EngineManagementMember2020-01-012020-12-310000093389smp:ExportMember2020-01-012020-12-310000093389us-gaap:CorporateAndOtherMembersmp:OtherClimateControlPartsMember2020-01-012020-12-310000093389srt:EuropeMembersmp:TemperatureControlMember2020-01-012020-12-310000093389smp:OtherForeignMemberus-gaap:CorporateAndOtherMember2021-01-012021-12-310000093389smp:IgnitionEmissionControlFuelAndSafetyRelatedSystemProductsMembersmp:TemperatureControlMember2020-01-012020-12-310000093389smp:EngineManagementMembercountry:CA2019-01-012019-12-310000093389country:MX2021-01-012021-12-310000093389srt:AsiaMemberus-gaap:CorporateAndOtherMember2020-01-012020-12-310000093389smp:OtherClimateControlPartsMembersmp:EngineManagementMember2020-01-012020-12-310000093389us-gaap:CorporateAndOtherMembersmp:WireAndCableMember2020-01-012020-12-310000093389us-gaap:CorporateAndOtherMembersmp:OtherForeignMember2019-01-012019-12-310000093389us-gaap:CorporateAndOtherMembercountry:US2019-01-012019-12-310000093389smp:OtherClimateControlPartsMembersmp:TemperatureControlMember2020-01-012020-12-310000093389smp:EngineManagementMembersrt:AsiaMember2019-01-012019-12-310000093389country:USus-gaap:CorporateAndOtherMember2020-01-012020-12-310000093389country:MX2020-01-012020-12-310000093389smp:EngineManagementMembersrt:EuropeMember2021-01-012021-12-310000093389us-gaap:CorporateAndOtherMembersmp:ExportMember2020-01-012020-12-310000093389smp:IgnitionEmissionControlFuelAndSafetyRelatedSystemProductsMember2021-01-012021-12-310000093389smp:OtherClimateControlPartsMembersmp:EngineManagementMember2021-01-012021-12-310000093389country:US2020-01-012020-12-310000093389country:CA2019-01-012019-12-310000093389smp:ExportMembersmp:EngineManagementMember2020-01-012020-12-310000093389smp:OEOESMembersmp:EngineManagementMember2021-01-012021-12-310000093389smp:OtherForeignMember2020-01-012020-12-310000093389us-gaap:CorporateAndOtherMembersrt:EuropeMember2019-01-012019-12-310000093389smp:TemperatureControlMembersmp:AftermarketMember2019-01-012019-12-310000093389smp:ExportMembersmp:TemperatureControlMember2020-01-012020-12-310000093389smp:TemperatureControlMembersmp:OtherForeignMember2020-01-012020-12-310000093389smp:CompressorsMember2021-01-012021-12-310000093389smp:OEOESMember2021-01-012021-12-310000093389smp:TemperatureControlMembersmp:WireAndCableMember2019-01-012019-12-310000093389smp:AftermarketMember2021-01-012021-12-310000093389smp:CompressorsMembersmp:TemperatureControlMember2019-01-012019-12-310000093389smp:AftermarketMemberus-gaap:CorporateAndOtherMember2020-01-012020-12-310000093389smp:OtherForeignMembersmp:TemperatureControlMember2021-01-012021-12-310000093389smp:TemperatureControlMembersrt:AsiaMember2020-01-012020-12-310000093389smp:EngineManagementMembersmp:OtherClimateControlPartsMember2019-01-012019-12-310000093389srt:AsiaMember2020-01-012020-12-310000093389smp:ExportMember2021-01-012021-12-310000093389us-gaap:CorporateAndOtherMembersmp:CompressorsMember2019-01-012019-12-310000093389srt:AsiaMembersmp:EngineManagementMember2020-01-012020-12-310000093389smp:EngineManagementMembersmp:CompressorsMember2019-01-012019-12-310000093389smp:OtherForeignMember2021-01-012021-12-310000093389smp:EngineManagementMembersmp:ExportMember2021-01-012021-12-310000093389smp:CompressorsMemberus-gaap:CorporateAndOtherMember2021-01-012021-12-310000093389smp:OEOESMember2019-01-012019-12-310000093389smp:CompressorsMembersmp:TemperatureControlMember2020-01-012020-12-310000093389smp:OtherClimateControlPartsMembersmp:TemperatureControlMember2019-01-012019-12-310000093389smp:TemperatureControlMembercountry:CA2020-01-012020-12-310000093389srt:AsiaMember2019-01-012019-12-310000093389country:USsmp:EngineManagementMember2021-01-012021-12-310000093389srt:EuropeMembersmp:EngineManagementMember2019-01-012019-12-310000093389smp:AftermarketMembersmp:TemperatureControlMember2021-01-012021-12-310000093389smp:OtherClimateControlPartsMember2019-01-012019-12-310000093389country:USsmp:TemperatureControlMember2019-01-012019-12-310000093389smp:OEOESMembersmp:TemperatureControlMember2019-01-012019-12-310000093389smp:EngineManagementMembersrt:EuropeMember2020-01-012020-12-310000093389smp:IgnitionEmissionControlFuelAndSafetyRelatedSystemProductsMemberus-gaap:CorporateAndOtherMember2021-01-012021-12-310000093389country:MXsmp:EngineManagementMember2020-01-012020-12-310000093389smp:IgnitionEmissionControlFuelAndSafetyRelatedSystemProductsMembersmp:EngineManagementMember2021-01-012021-12-310000093389us-gaap:CorporateAndOtherMembersmp:OtherClimateControlPartsMember2021-01-012021-12-310000093389smp:WireAndCableMember2021-01-012021-12-310000093389smp:WireAndCableMembersmp:TemperatureControlMember2020-01-012020-12-310000093389smp:OtherLeasedPropertiesMember2019-01-012019-12-310000093389us-gaap:LandAndBuildingMember2020-01-012020-12-310000093389us-gaap:LandAndBuildingMember2019-01-012019-12-310000093389us-gaap:LandAndBuildingMember2021-01-012021-12-310000093389smp:OtherLeasedPropertiesMember2021-01-012021-12-310000093389smp:OtherLeasedPropertiesMember2020-01-012020-12-310000093389us-gaap:FinancialStandbyLetterOfCreditMember2021-12-310000093389us-gaap:AsbestosIssueMember2021-12-310000093389us-gaap:AsbestosIssueMember2001-09-012020-12-310000093389srt:MaximumMemberus-gaap:SegmentDiscontinuedOperationsMemberus-gaap:AsbestosIssueMember2021-12-310000093389us-gaap:AsbestosIssueMembersrt:MaximumMember2020-08-310000093389us-gaap:AsbestosIssueMemberus-gaap:SegmentDiscontinuedOperationsMembersrt:MinimumMember2021-12-310000093389us-gaap:AsbestosIssueMembersrt:MinimumMember2020-08-310000093389us-gaap:AsbestosIssueMember2020-01-012020-12-310000093389us-gaap:AsbestosIssueMember2020-09-300000093389us-gaap:AsbestosIssueMember2020-09-012020-09-300000093389us-gaap:AsbestosIssueMemberus-gaap:SegmentDiscontinuedOperationsMember2019-01-012019-12-310000093389us-gaap:AsbestosIssueMemberus-gaap:SegmentDiscontinuedOperationsMember2020-01-012020-12-310000093389us-gaap:AsbestosIssueMemberus-gaap:SegmentDiscontinuedOperationsMember2021-01-012021-12-310000093389smp:SECSchedule1209AllowanceForSalesReturnsMember2019-12-310000093389smp:SECSchedule1209ReserveDiscountsMember2018-12-310000093389smp:SECSchedule1209AllowanceForSalesReturnsMember2018-12-310000093389smp:SECSchedule1209ReserveDiscountsMember2020-12-310000093389smp:SECSchedule1209ReserveDiscountsMember2019-12-310000093389smp:SECSchedule1209AllowanceForSalesReturnsMember2020-12-310000093389us-gaap:AllowanceForCreditLossMember2018-12-310000093389us-gaap:AllowanceForCreditLossMember2020-12-310000093389us-gaap:AllowanceForCreditLossMember2019-12-310000093389smp:SECSchedule1209ReserveDiscountsMember2019-01-012019-12-310000093389smp:SECSchedule1209ReserveDiscountsMember2021-01-012021-12-310000093389smp:SECSchedule1209AllowanceForSalesReturnsMember2021-01-012021-12-310000093389smp:SECSchedule1209AllowanceForSalesReturnsMember2020-01-012020-12-310000093389smp:SECSchedule1209AllowanceForSalesReturnsMember2019-01-012019-12-310000093389smp:SECSchedule1209ReserveDiscountsMember2020-01-012020-12-310000093389us-gaap:AllowanceForCreditLossMember2020-01-012020-12-310000093389us-gaap:AllowanceForCreditLossMember2019-01-012019-12-310000093389us-gaap:AllowanceForCreditLossMember2021-01-012021-12-310000093389smp:SECSchedule1209AllowanceForSalesReturnsMember2021-12-310000093389smp:SECSchedule1209ReserveDiscountsMember2021-12-310000093389us-gaap:AllowanceForCreditLossMember2021-12-31iso4217:USDxbrli:sharesiso4217:USDxbrli:sharesxbrli:puresmp:Customeriso4217:EURiso4217:PLNsmp:Votesmp:Typesmp:Employeesmp:Segmentsmp:Officersmp:Claim

UNITED STATES SECURITIES AND EXCHANGE COMMISSION
WASHINGTON, D.C. 20549
FORM 10-K
(Mark One)

ANNUAL REPORT PURSUANT TO SECTION 13 OR 15(d) OF THE SECURITIES EXCHANGE ACT OF 1934

For the fiscal year ended December 31, 20212023
or

TRANSITION REPORT PURSUANT TO SECTION 13 OR 15(d) OF THE SECURITIES EXCHANGE ACT OF 1934

For the transition period from ____ to ____

Commission file number:  001-04743

 
Standard Motor Products, Inc.
 
 
(Exact name of registrant as specified in its charter)
 

New York
11-1362020
(State or other jurisdiction of incorporation or organization)(I.R.S. Employer Identification No.)
  
37-18 Northern Blvd., Long Island City, New York
11101
(Address of principal executive offices)(Zip Code)
  
Registrant’s telephone number, including area code:(718) 392-0200

Securities registered pursuant to Section 12(b) of the Act:
Title of each classTrading Symbol(s)Name of each exchange on which registered
Common Stock, par value $2.00 per share
SMP
New York Stock Exchange LLC

Securities registered pursuant to Section 12(g) of the Act:None

Indicate by check mark if the registrant is a well-known seasoned issuer, as defined in Rule 405 of the Securities Act.  Yes   No

Indicate by check mark if the registrant is not required to file reports pursuant to Section 13 or Section 15(d) of the Act. Yes ☐  No 

Indicate by check mark whether the registrant (1) has filed all reports required to be filed by Section 13 or 15(d) of the Securities Exchange Act of 1934 during the preceding 12 months (or for such shorter period that the registrant was required to file such reports), and (2) has been subject to such filing requirements for the past 90 days. Yes           No

Indicate by check mark whether the registrant has submitted electronically every Interactive Data File required to be submitted pursuant to Rule 405 of Regulation S-T (§232.405 of this chapter) during the preceding 12 months (or for such shorter period that the registrant was required to submit such files).
Yes       No

Indicate by check mark whether the registrant is a large accelerated filer, an accelerated filer, a non-accelerated filer, a smaller reporting company, or an emerging growth company.  See definition of “large accelerated filer,” “accelerated filer,” “smaller reporting company” and “emerging growth company” in Rule 12b-2 of the Exchange Act.

Large Accelerated Filer 
Accelerated Filer
Non-Accelerated Filer   
Smaller reporting company  
Emerging growth company     

If an emerging growth company, indicate by check mark if the registrant has elected not to use the extended transition period for complying with any new or revised financial accounting standards provided pursuant to Section 13(a) of the Exchange Act.

Indicate by check mark whether the registrant has filed a report on and attestation to its management’s assessment of the effectiveness of its internal control over financial reporting under Section 404(b) of the Sarbanes-Oxley Act (15 U.S.C. 7262(b)) by the registered public accounting firm that prepared or issued its audit report.      ☑

If securities are registered pursuant to Section 12(b) of the Act, indicate by check mark whether the financial statements of the registrant included in the filing reflect the correction of an error to previously issued financial statements. ☐

Indicate by check mark whether any of those error corrections are restatements that required a recovery analysis of incentive-based compensation received by any of the registrant’s executive officers during the relevant recovery period pursuant to §240.10D-1(b). ☐

Indicate by check mark whether the registrant is a shell company (as defined in Rule 12b-2 of the Act).  Yes     No 

The aggregate market value of the voting common stock based on the closing price on the New York Stock Exchange on June 30, 20212023 (the last business day of registrant’s most recently completed second fiscal quarter) of $43.35$37.52 per share held by non-affiliates of the registrant was $868,423,747.$737,570,524.  For purposes of the foregoing calculation only, all directors and officers have been deemed to be affiliates, but the registrant disclaims that any of such are affiliates.

As of February 17, 2022,20, 2024, there were 21,962,76221,918,729 outstanding shares of the registrant’s common stock, par value $2.00 per share.

DOCUMENTS INCORPORATED BY REFERENCE

The information required by Part III of this Report is incorporated herein by reference from the registrant’s definitive proxy statement relating to its annual meeting of stockholders to be held on May 19, 2022.

16, 2024.


STANDARD MOTOR PRODUCTS, INC.

INDEX
PART I. Page No.
   
Item 1.
  3
Item 1A.
1413
Item 1B.
2523
Item 1C.
24
Item 2.
25
Item 3.
26
Item 4.
26
   
PART II.  
   
Item 5.
27
26
Item 6.
2928
Item 7.
29
28
Item 7A.
42
Item 8.
4344
Item 9.
88
90
Item 9A.
8890
Item 9B.
8991
Item 9C.
8991
   
PART III.  
   
Item 10.
89
91
Item 11.
8991
Item 12.
89
91
Item 13.
9091
Item 14.
9091
   
PART IV.  
   
Item 15.
9092
Item 16.
9092
 9496

PART I

In this Annual Report on Form 10-K, “Standard Motor Products,” “we,” “us,” “our,” “SMP,” and the “Company” refer to Standard Motor Products, Inc. and its subsidiaries, unless the context requires otherwise.  This Report, including the documents incorporated herein by reference, contains forward-looking statements within the meaning of Section 27A of the Securities Act of 1933 and Section 21E of the Securities Exchange Act of 1934.  Forward-looking statements in this Report are indicated by words such as “anticipates,” “expects,” “believes,” “intends,” “plans,” “estimates,” “projects,” “strategies” and similar expressions. These statements represent our expectations based on current information and assumptions and are inherently subject to risks and uncertainties.  Our actual results could differ materially from those which are anticipated or projected as a result of certain risks and uncertainties, including, but not limited to, changes or loss in business relationships with our major customers and in the timing, size and continuation of our customers’ programs; changes in our supply chain financing arrangements, such as changes in terms, termination of contracts and/or the impact of rising interest rates; the ability of our customers to achieve their projected sales; competitive product and pricing pressures; increases in production or material costs, including procurement costs resulting from higher tariffs, and inflationary cost increases in raw materials, labor and transportation, that cannot be recouped in product pricing; the performance of the automotive aftermarket heavy duty, industrial equipment and original equipment markets;and/or other end-markets that we supply; changes in the product mix and distribution channel mix; economic and market conditions; successful integration of acquired businesses; our ability to achieve benefits from our cost savings initiatives; product liability and environmental matters (including, without limitation, those related to asbestos-related contingent liabilities and remediation costs at certain properties)liabilities); the effects of widespread public health crises, includingdisruptions in the coronavirus (COVID-19) pandemic; climate-related risks, such as physical risks and transitionsupply chain caused by geopolitical risks; as well as other risks and uncertainties, such as those described under Risk Factors, Quantitative and Qualitative Disclosures About Market Risk and those detailed herein and from time to time in the filings of the Company with the SEC. Forward-looking statements are made only as of the date hereof, and the Company undertakes no obligation to update or revise the forward-looking statements, whether as a result of new information, future events or otherwise. In addition, historical information should not be considered as an indicator of future performance.

ITEM 1.BUSINESS

Overview

We are a leading manufacturer and distributor of premium replacement parts utilized in the maintenance, repair and service of vehicles in the automotive aftermarket industry. In addition, we continueand a custom-engineered solutions provider to increase our supplier capabilities with a complementary focus on specialized originalvehicle and equipment parts for manufacturers across multiple industries such as agriculture, heavy duty, and construction equipment. We believe that our extensive design and engineering capabilities have afforded us opportunities to expand our product coverage in ourdiverse non-aftermarket end markets.  Our automotive aftermarket business is comprised of two segments, Vehicle Controland enter newer specializedTemperature Control, while our Engineered Solutions Segment offers a broad array of conventional and future-oriented technologies in markets that require application-specific knowledge, such as those mentioned above.

Our business strategy centers on providing our customers with full-line product coverage as well as a suite of services tailored to our customers’ needs.  This combination of broad product coverage along with specificity in our customer service helps drive higher end-user demand for our products.

commercial and light vehicles, construction, agriculture, power sports, marine, hydraulics and lawn and garden.  We sell our products primarily to automotive aftermarket retailers, warehouse distributors, original equipment manufacturers and original equipment service part operations in the United States, Canada, Europe, Asia, Mexico and other Latin AmericanAmerica countries.

The Automotive Aftermarket

The automotive aftermarket replacement partsBeginning in the first quarter of 2023, we reorganized our business is a mature industry that primarily tendsinto three operating segments – Vehicle Control, Temperature Control and Engineered Solutions. This operating segment structure better aligns our operations with our strategic focus on diversifying our business, provides greater transparency into our positioning to follow trends, such as:capture opportunities for growth in the future, and provides clarity regarding the unique dynamics and margin profiles of the markets served by each segment.

numberOur Vehicle Control Segment services our core automotive aftermarket customers through its offering of vehicles onpremium replacement parts within the road;
average age of vehicles on the road; and
total number of miles driven per year.
following major product groups:

Other general trends including economic factors such as the level of light vehicle production can have a more indirect impact on the aftermarket, and a more direct impact on the specialized industries discussed above.

The automotive aftermarket industry is comprised of a large number of diverse manufacturers varying in product specialization and size.  In addition to manufacturing, aftermarket companies must allocate resources towards an efficient distribution process in order to maintain the flexibility and responsiveness on which their customers depend.  Aftermarket manufacturers must be efficient producers of small lot sizes, and must distribute, with rapid turnaround times, products for nearly all domestic and import vehicles on the road today.

In 2021, we completed three acquisitions that expanded our business into original equipment (OE) specialized markets that complement our core aftermarket business.  In addition to providing access to product technologies suitable to the aftermarket, and manufacturing and engineering capabilities to support our operating strategy to bring more product manufacturing in-house, these acquisitions provide geographic expansion in Europe and Asia.

Our Business Strategy

Our mission is to be the best full-line, full-service supplier of premium engine management and temperature control products.

The key elements of our strategy are as follows:

(1)
Maintain Our Strong Aftermarket Competitive Position in our Engine Management, which includes components for the ignition, emissions and Temperature Control Businesses.  We are a leading independent manufacturerfuel delivery systems of vehicles utilizing an internal combustion engine. Product categories include air injection and distributor serving North Americainduction components, air management valves, regulators and other geographic areas in our core businesses of Engine Managementsolenoids, exhaust gas recirculation (EGR) components, fuel injectors and Temperature Control.  We believe that our success is attributable to our emphasis on product quality, the breadthrelated components, fuel valves, ignition coils, connectors and depth of our product lines for both domesticsockets, modules, pumps, relays and import vehicles,fuses, starting and our reputation for outstanding value-added services.charging system parts, and vapor and purge components.
To maintain our strong competitive position, we remain committed to the following:
strengthening our capabilities as a leading manufacturer of parts and ensuring our global manufacturing footprint continues to meet the demands and expectations of our customers worldwide;
providing our customers with full-line coverage of high quality engine management and temperature control products and new technologies for most years, makes and models of vehicles on the road;
supporting our products with the highest level of value-added services;
supply chain excellence through supplier and customer focused initiatives, and continuing to maximize our production, supply chain and distribution efficiencies;
continuing to improve our cost position through increased global sourcing, increased manufacturing at our low-cost plants, and strategic transactions with manufacturers in low-cost regions;
focusing on our engineering development efforts including a focus on bringing more product manufacturing in-house; and
further expanding our parts coverage to include a broader product mix in categories such as electrification, including electric vehicles (EVs) and hybrid electric vehicles (HEVs), and connectivity as well as safety-related systems, such as various sensors including anti-lock brake (ABS), vehicle speed, tire pressure monitoring (TPMS), park assist and Advanced Driver Assistance Systems (ADAS) components to meet the growing needs of our customers.

Provide Superior Value-Added Services and Product Availability.  Our goal is to increase sales to existing and new customers by leveraging our skills in rapidly filling orders, maintaining high levels of product availability and offering a product portfolio that provides comprehensive coverage for all vehicle applications.  Although the automotive industry continues to experience supply chain disruptions related to COVID-19 (particularly with respect to goods sourced from China), we believe that, with respect to product availability and fill rates, we have benefited from our geographically diversified manufacturing footprint and our strategy to bring more product manufacturing in-house. Our marketing support provides insightful customer category management, technical support and award-winning programs, and our technically skilled sales personnel provide our customers with product selection, assortment and application support related to our products. In addition, we have a team dedicated to providing in-person and virtual technical training on diagnosing and repairing vehicles equipped with complex systems.

Expand Our Product Lines.  Vehicle manufacturers continue to introduce new technologies and systems creating opportunities for us to expand our product lines. In addition, we intend to increase our sales by continuing to develop internally, or through potential acquisitions, the range of engine management and temperature control products that we offer to our customers.  We are committed to investing the resources necessary to maintain and expand our technical capability to manufacture product lines that incorporate the latest technologies, including product lines relating to safety, advanced driver assistance and collision avoidance systems.  We believe that the three complementary acquisitions consummated in 2021 (discussed above) and our internal product development efforts better position us to satisfy customer demand for both traditional, internal combustion engine (or ICE) applications, and non-ICE (electric or hybrid electric) applications.  We estimate that approximately half of our product offering is powertrain neutral, or suitable for electric, hybrid electric and/or alternative energy vehicles.

Diversify our Business.  We seek to diversify our business primarily by (a) leveraging our manufacturing and distribution capabilities to secure additional business globally with original equipment manufacturers; (b) supporting the service part operations of vehicle and equipment manufacturers with value-added services and product support for the life of the part; (c) developing new product lines that complement our existing product offering and have the potential for high growth; (d) expanding our product offering in the medium and heavy duty, commercial vehicle, construction and agricultural equipment, power sports, and other segments; and (e) executing our acquisition strategy.

Improve Operating Efficiency and Cost Position.  Our management places significant emphasis on improving our financial performance by achieving operating efficiencies and improving asset utilization, while maintaining product quality and high customer order fill rates.

Cash Utilization.  We intend to apply any excess cash flow from operations and the management of working capital primarily to reduce our outstanding indebtedness, pay dividends to our shareholders, expand our product lines by investing in new tooling and equipment, grow revenues through potential acquisitions, and repurchase shares of our common stock.

(2)
Environmental, SocialElectrical & GovernanceSafety.  We support, which includes components for the electrical and seek continuous improvementsafety systems of vehicles, and are powertrain neutral vehicle technologies.  Product categories include electrical switches and actuators, chassis and drivetrain sensors such as anti-lock brake and vehicle speed sensors, fluid level sensors, pressure sensors such as tire pressure monitoring, temperature sensors, and sensors for advanced driver assistance systems (ADAS), along with battery cables, pigtails, sockets and a wide range of electrical wire, terminals, connectors, and tools for servicing a vehicle’s electrical system.


(3)
Wire Sets & Other, which includes spark plug wire sets, coil on plug boots and accessories servicing vehicle’s ignition system.  Certain product categories within this group are in the pursuit of environmental, social and corporate governance (ESG) practices that embody our culture and what we believe it means to be a good corporate citizen.secular decline based upon product life cycle.

Our Products & Services

Engine Management Segment

Our Engine Management Segment manufactures and distributes a full line of critical components for most years, makes and models of vehicles on the road, including new technologies. Key product categories within our engine management portfolio include: (i) ignition, such as electronic ignition control modules, camshaft and crankshaft position sensors, ignition wires and coils; (ii) electrical, such as switches and relays; (iii) emissions, such as exhaust gas recirculation valves, pressure and temperature sensors and variable valve timing (VVT) components; (iv) fuel, such as mass airflow sensors, fuel pressure sensors, electronic throttle bodies and fuel injectors, including diesel injectors and pumps (new and remanufactured); and (v) safety-related systems, such as various sensors including anti-lock brake (ABS), vehicle speed, tire pressure monitoring (TPMS) and park assist sensors.

We continuously look to expand our product offering.  Recently, we have done so by adding late-model coverage for existing product categories, and new product categories in response to new and evolving vehicle technologies, including diesel control modules, pumps and components, turbochargers, evaporation emission control system components, exhaust gas temperature sensors, active grill shutters, battery current sensors, and Advanced Driver Assistance Systems (ADAS) components, including blind spot detection sensors, cruise control distance sensors, lane departure sensor cameras and park assist backup cameras. For example, our offering includes more than seventy product categories for one of the first mass-produced hybrid electric vehicles (HEVs).  As more HEVs enter the aftermarket, we intend to expand our product offering to service this important segment.

Ignition, Emission Control, Fuel & Safety Related System Products.  Replacement parts for ignition, emission, fuel and safety related systems accounted for $786.5 million, or 61%, of our consolidated net sales in 2021, $691.7 million, or 61%, of our consolidated net sales in 2020, and $706 million, or 62%, of our consolidated net sales in 2019.

As the use and complexity of vehicle systems continue to develop and proliferate, we expect to identify and benefit from new sales opportunities. All new vehicles are factory‑equipped with numerous electronic control modules designed to monitor and control the internal combustion process and the emissions, transmission, safety and comfort systems of the vehicle.  Newer automotive systems include Advanced Driver Assistance Systems and Collision Avoidance Systems to alert the driver to potential problems, or to avoid collisions by implementing safeguards. Many of theseVehicle Control systems use on-board computers to monitor inputs from sensing devices located throughout the vehicle.  Our salesAs the complexity of these systems continues to develop and proliferate, we expect to benefit from increased demand for our sensors, switches, actuators, valves, solenoids and related parts, have increased as automobile manufacturers continuewhich are designed to equip their carsfunction with these more complex engine management systems.

New sales opportunities haveWe also arisen in the United States as a result ofexpect to benefit from government regulations regarding vehicle safety and emissions. Legally, automobiles must now comply withFor example, we believe emissions standards from the time they were manufactured and, in most states, until the last day they are in use.  Emissions laws and fuel economy regulations have had a positive impact on sales of our ignition, emissions control and fuel delivery parts since vehicles failing these lawsnot meeting emissions inspection standards may require repairs utilizing parts sold by us. Similarly, as government-mandated safety devices, such as anti-lock braking systems and air bags mature, requiring servicing and repair,ADAS, proliferate with new vehicle production, we anticipate increased salesreplacement opportunities for many of our products such as ABS sensors, TPMS sensors, and traction control products.

Wire & Cable Products.  Wireproducts and cable parts accounted for $151.4 million, or 12%, of our consolidated net sales in 2021, $144 million, or 13%, of our consolidated net sales in 2020, and $143.2 million, or 13%, of our consolidated net sales in 2019.  These products include spark plug wire sets, battery cables, pigtails, sockets and a wide range of electrical wire, terminals, connectors and tools for servicing an automobile’s electrical system.

Temperature Control SegmentADAS replacement parts.

Our Temperature Control Segment manufactures and distributes a full line also services our core automotive aftermarket customers through its offering of critical componentspremium replacement parts within the following major product groups:


(1)
AC System Components, which includes compressors, air conditioning repair kits, connecting lines, heat exchangers, and expansion devices.


(2)
Other Thermal Components, which includes parts that provide engine, transmission, electric drive motor, and battery temperature management.

We believe our Temperature Control Segment is poised to benefit from the broader adoption of more complex air conditioning systems that will provide passenger comfort regardless of the vehicle’s powertrain.  For example, in addition to cabin comfort, powertrains such as electric vehicles will require cooling systems for the temperature control (air conditioningbatteries, electronics, motors and heating) systems, engine cooling systems,other applications.

The Engineered Solutions Segment services our vehicle and equipment manufacturing customers across diverse global end markets, including on-highway and off-highway applications such as commercial and light vehicles, construction, agriculture, power window accessoriessports, marine, hydraulics and windshield washer systemslawn and garden, through an offering of motor vehicles.  Keycustom-engineered solutions within the following product categories withincategories:


(1)
Thermal Management Products, which are designed to control the operating temperature of HVAC, battery and heat exchange systems, such as electrical compressors, fans, motors and pumps.


(2)
Sensors, covering applications in speed, position, temperature, pressure, level and particulate matter, among others.


(3)
Switches, covering applications in electrical performance, position, temperature, pressure, tilt and fluid levels, among others.


(4)
Power Distribution, covering applications in power switching, industrial solenoids, and voltage regulators.


(5)
Electrification & Electronics, which includes controller area network (CAN) devices, CAN bus wiring and splitting devices, and electronic controls, transmitters and components.


(6)
Injection & Fuel Delivery, covering an extensive array of applications in transportation, such as gasoline, diesel and alternative fuels, such as compressed natural gas, liquefied natural gas, liquefied petroleum gas, and hydrogen.


(7)
Ignition & Emissions, which includes wire, ignition coils and positive crankcase ventilation valves.


(8)
Clamping Devices, covering automotive and industrial applications.

Our Business Strategy

Our Corporate Mission is to be a leading global supplier of parts and services to diverse end markets for the vehicles of yesterday, today and tomorrow, while leveraging our temperature control portfolio include: air conditioning compressors (newheritage of integrity and remanufactured), air conditioning repair kits, clutch assemblies, blower and radiator fan motors (brushless and brushed), filter dryers, evaporators, accumulators, actuators, hose assemblies, thermal expansion devices, heater valves, heater cores, A/C service tools and chemicals, fan assemblies, fan clutches, oil coolers, window lift motors, window regulators and assemblies, and windshield washer pumps.respect for all of our stakeholders.

We continuously looksell our products in the automotive aftermarket primarily to improve our cost position through strategic transactions with manufacturers in low cost regions.  In 2014, we formed Foshan GWOYNG SMP Vehicle Climate Control & Cooling Products Co. Ltd., a China-based joint venture that manufactures light vehicleretailers and heavy duty air conditioning accumulators, filter driers, hose assemblies,warehouse distributors, who buy directly from us and switches; in 2017, we formed Foshan FGD SMP Automotive Compressor Co., Ltd., a China-based joint venture that manufactures light vehiclesell directly to jobber stores, professional technicians and heavy duty belt driven air conditioning compressors; and in 2019, we acquired a minority interest ownership position in Foshan Che Yijia New Energy Technology Co., Ltd., a China-based manufacturer of electric air conditioning compressors.to individual consumers who perform “do-it-yourself” repairs on their personal vehicles.  We believe that these transactions will enhanceour value proposition is a key competitive advantage in maintaining our position as a basic low-cost manufacturerstrategic partner to our customers and a leadingleader in the automotive aftermarket.

In the automotive aftermarket, our mission is to be the best full-line, full-service supplier of temperature control partspremium Vehicle Control and allow an opportunity for growth in the China OE market, while providing key complementary manufacturing capabilities and synergy opportunities with our other manufacturing facilities. The synchronization and complimentary strategies between our operational and distribution facilities provides a more reliable supply of products, and supports our customers’ needs for consistent and reliable service levels.

Compressors.  Compressors accounted for $206.7 million, or 16%, of our consolidated net sales in 2021, $163.1 million, or 14%, of our consolidated net sales in 2020, and $160.5 million, or 14%, of our consolidated net sales in 2019. Included in consolidated net sales for the compressor product line is the revenue generated from the sale of kits.

Other ClimateTemperature Control Parts.  Other climate control parts accounted for $141.7 million, or 11%, of our consolidated net sales in 2021, $118.9 million, or 11%, of our consolidated net sales in 2020, and $117.9 million, or 10%, of our consolidated net sales in 2019.

Financial Information About Our Operating Segments

For additional information related to our operating segments, and the disaggregation of operating segment net sales by geographic area, major product group and major sales channel, see Note 19 “Industry Segment and Geographic Data” and Note 20 “Net Sales”, respectively, of the Notes to Consolidated Financial Statements in Item 8 of this Report.products.

Our Aftermarket Value Proposition

■     Premium Quality Products
■     Premium Brands
■     Full-Line Coverage
■    Supply Chain Excellence
■    Field Sales Support
■    Marketing Support
■    World-Class Training
■    Basic Manufacturing

Premium Quality Products.

We offer professional grade products intended to fit, form and function to standards that meet or exceed the original equipment (“OE”) product it replaces.  Our products undergo rigorous product qualification, testing our products against exacting specifications and performance criteria.  In some cases, we have successfully identified and implemented improvements in the durability of our products through the evaluation and analysis of OE product failures in the field.

Premium Brands.

We believe that our brands are an importanta key component of our value proposition, and serve to distinguish our premium engine management and temperature control products from those of our competitors.  We market and distribute our aftermarket products under our own brands, such as:

EngineVehicle
ManagementControl
Products
graphic
graphic
 
Temperature
Control
Products
graphicgraphic

We also distribute our products to customers for resale under private labels and the following co-labels:

Engine Management
graphicVehicle
Control
graphicgraphic
graphic

WeIn some cases, we have also developed our product offering and brand strategies to support our customers’ initiatives to market a tiered product assortment designed to satisfy end-user preferences for quality and value.  We believe that this alignment makes us an invaluable business partner to our customers.

Full-Line Coverage.

Our Customersproduct offering is designed to ensure our automotive aftermarket customers have the parts they need to maintain, service and repair the wide range of vehicles in operation. We offer a full line of critical components for most years, makes, models and engine sizes.  Our product offering is a reflection of the vehicles in operation, the adoption rates of new vehicle technologies by original equipment manufacturers, the number of miles driven, and the failure rates of parts in service.  We continuously look to expand our coverage through the addition of late-model applications in existing product categories as well as new product categories in response to evolving vehicle technologies, or that otherwise complement our existing offering and have potential for high growth.

We sellfocus on expanding our products primarily to:product coverage in advanced powertrain technologies, including start and stop technology, cylinder deactivation, variable valve timing, turbochargers, electronic throttle bodies, diesel exhaust emissions control, gasoline direct injection, active grill shutters; electrification, such as battery cooling fans, drive battery charging cables and adapters, and electric coolant pumps; and safety related categories, such as anti-lock brake, vehicle speed sensors, tire pressure monitoring, park assist sensors and advanced driver assistance components, including blind spot detection sensors, cruise control distance sensors, lane departure sensor cameras and park assist backup cameras.

In December 2023, we offered over 79,000 total stock keeping units (SKUs) to the automotive aftermarket. Approximately 2,600 of these SKUs were newly introduced in 2023, of which more than half were powertrain neutral vehicle technologies, such as cruise control distance sensors, park assist cameras and electronic parking brake actuators.

Automotive aftermarket retailers, such as O’Reilly Automotive, Inc. (“O’Reilly”), AutoZone, Inc. (“AutoZone”), and Canadian Tire Corporation, Limited.

Automotive aftermarket distributors, including warehouse distributors and program distribution groups, such as Genuine Parts Co. and National Automotive Parts Association (“NAPA”), Auto Value and All Pro/Bumper to Bumper (Aftermarket Auto Parts Alliance, Inc.), Automotive Distribution Network LLC, The National Pronto Association (“Pronto”), Federated Auto Parts Distributors, Inc. (“Federated”), Pronto and Federated’s affiliate, the Automotive Parts Services Group or The Group, and Icahn Automotive Group LLC (doing business as Pep Boys, Auto Plus, AAMCO and Precision Tune Auto Care).

Original equipment manufacturers and original equipment service part operations, such as General Motors Co., Ford Motor Co., Woodward, Inc., Deere & Company, Caterpillar Inc., Daimler Truck AG, Case/New Holland, Eberspacher, Mobile Climate Control, Volvo/Mack Truck, and Harley.
Our three largest individual customers accountedVehicle Control offering includes more than seventy product categories for approximately 57% ofhybrid electric vehicles. We are committed to strategically expanding our consolidated net sales in 2021.  During 2021, O’Reilly, NAPAproduct offerings for electric and AutoZone accounted for 26%, 17%, and 14% of our consolidated net sales, respectively. Net sales from each of these customers were reported in both our Engine Management and Temperature Control Segments.hybrid vehicles to service this important segment.

CompetitionSupply Chain Excellence.

Product availability, including order turn-around time and fill rates, are critical measures of performance in the automotive aftermarket, and we partner with our suppliers and customers, to implement focused initiatives designed to achieve high levels of performance against these key metrics. For example, we manage forecasting responsibilities for our major retail customers, and provide twelve month projections to our suppliers to assist in their raw material and capacity planning to ensure continuity of supply.

In 2023, we announced plans to open a new distribution center in Shawnee, Kansas.  The new facility,which is expected to have a phased opening beginning in 2024 and be fully operational in early 2025, will expand our total distribution network square footage to meet our growing demands in the automotive aftermarket, and integrate state-of-the-art technologies to deliver improved logistics capabilities, operational efficiencies, as well as enhanced employee, customer and supplier experiences. The new Shawnee, Kansas distribution facility will also bring our Vehicle Control products geographically closer to our Midwest and West Coast customers, reducing transportation lead-time, and will ultimately provide disaster recovery capabilities for automotive aftermarket products across our divisions.

Field Sales Support.

We compete primarily on the basis of product quality, product availability, value-added services, product coverage, order turn‑around time, order fill rate, technical support and price.  We believe we differentiate ourselves from our competitors primarily through:
technically-trained salesforce is a value‑added, knowledgeable sales force;
continuous product development, engineering & technical advancement;
extensive market leading product coverage in conjunction with market leading brands;
knowledgeable category management, including inventory stocking recommendations for our distributors to get the right parts on the shelf for their marketplace needs;
rigorous product qualification standards to ensure that our parts meet or exceed exacting performance specifications;
sophisticated parts cataloging systems, including catalogs available online through our website and our mobile application;
inventory levels and responsive logistical systems sufficient to meet the critical delivery requirements of customers;
breadth of manufacturing capabilities; and
award-winning marketing programs,key competitive advantage.  Our field sales support focuses on educating parts professionals (e.g., customer team members) and technical training.
We are one of the leading independent manufacturers and distributors serving North America and other geographic areas in our core businesses of Engine Management and Temperature Control.  In the Engine Management Segment, we compete with: ACDelco, Aptiv Plc, Denso Corporation, Continental AG, Hitachi, Ltd., Motorcraft, Robert Bosch GmbH, Visteon Corporation, NGK Spark Plug Co., Ltd., Dorman Products, Inc. and several privately-owned companies primarily importing products from Asia.  In the Temperature Control Segment, we compete with: ACDelco, MAHLE GmbH, Denso Corporation, Motorcraft, Sanden International (U.S.A.), Inc., Continental AG, Dorman Products, Inc., and several privately-owned companies.

Our business operatesprofessional technicians in highly competitive markets, and we face substantial competition in all markets that we serve.  In addition, in the aftermarket, we face competition from automobile manufacturers who supply many of the replacement parts sold by us, although these manufacturers generally supply parts only for cars they sell through OE dealerships.

Sales and Distribution

In the traditional aftermarket channel, we sell our products to warehouse distributors and retailers.technical product categories. Our customers buy directly from us and sell directly to jobber stores, professional technicians and to “do-it-yourselfers” who perform automotive repairs on their personal vehicles.  In recent years, warehouse distributors have consolidated with other distributors, and an increasing number of distributors own their jobber stores or sell down channel to professional technicians.  Retailers are also consolidating with other retailers and have begun to increase their efforts to sell to professional technicians adding additional competition in the “do-it-for-me,” or the professional technician segment of our industry.  As automotive parts and systems become more complex, “do-it-yourselfers” are less likely to service their own vehicles and may become more reliant on professional technicians.

In the heavy duty aftermarket, we sell our products to recognized distributors who buy directly from us and sell directly to fleet operators and repair facilities for use in the repair and maintenance of medium to heavy duty vehicles. We also sell our products to the service parts divisions of heavy duty OEMs for distribution into the independent heavy duty aftermarket.

In the original equipment market we sell our products to manufacturers of automotive, heavy duty truck, construction, agriculture, alternative energy, lawn/garden and powersports/marine vehicles and equipment, as well as their tier suppliers and system integrators.  We also sell and support the service part divisions of each of our customers.

We sell our products primarily in the United States, with additional sales in Canada, Europe, Asia, Mexicoand other Latin American countries.  Our sales are substantially denominated in U.S. dollars.  For information on revenues and long-lived assets by geographic area, see Note 19 “Industry Segment and Geographic Data” of the Notes to Consolidated Financial Statements in Item 8 of this Report.

Our customers have come to depend on our sales personnel as a reliable source for technical information and to assist with sales to their customers (e.g., jobber stores, professional technicians and professional technicians)individual consumers performing “do-it-yourself” repairs)In this manner, weWe direct a significant portion of our sales efforts to our customers’ customers to generate demand for our products, and we believe that theproducts.  The structure of our sales forcesalesforce facilitates these efforts, by enabling us to implement our sales and marketing programs uniformly throughout the distribution channel.

Another way weMarketing Support.

We support our customers with superior value-added services such as data-driven category management based on vehicles in operation, sophisticated parts catalogs, available online and through our mobile application, and technical support, including selection, assortment and application support for all of our products.  We also grant our customers royalty-free licenses to use certain intellectual property rights to advertise, market and sell our products.  The licenses primarily cover vehicle application data, which is used to identify the parts necessary to service any particular vehicle make, model, year and/or engine size, product information data, including product interchanges, part numbers, attributes, high resolution images and videos, dimensions, specifications and other technical descriptions of parts and components.

World-Class Training.

We generate demand for our products is through our technical training program, which offers training seminars to professional automotive technicians.  Our training program is accredited by the National Institute for Automotive Service Excellence (ASE) Training Managers Council.  Our seminars are taught by ASE certified instructors, in real time eitherand are available in-person or byand online through webinars online and feature more than 30 different topics.  We also offer on-demand training webinars online on more thanseminars.  Our seminars cover approximately 150 different topics.topics, offered in both English and Spanish.  Through our training program, we typically teach approximately 60,000 technicians annually how to diagnose and repair vehicles equipped with complex systems related to our products, and we have approximately 16,000 technicians and 7,000 of our customers’ store employees and sales team members who are registered to participate in such sessions through our online platform.

Basic Manufacturing.

We are committed to expanding our design, engineering and manufacturing capabilities, and vertically integrating production processes to bring more manufacturing in-house.  We engineer, tool and manufacture many of the products we offer for sale and the components used in their assembly.  We believe this level of vertical integration, in combination with our manufacturing footprint in low cost regions, is a key competitive advantage in terms of the quality, cost and availability of our products.

Examples of vertically integrated processes:
➢   plastic molding operations
➢   automated electronics assembly
➢   stamping and machining operations
➢   design and fabrication of processing and test equipment
➢   wire extrusion
➢   teardown, diagnostics and rebuilding of remanufactured air conditioning compressors, diesel injectors and diesel pumps

As of December 31, 2023, all of our principal manufacturing facilities maintained quality management systems that were ISO 9001 and/or TS 16949 certified, and ten of our principal manufacturing and distribution facilities maintained environmental management systems that were ISO 14001 certified.

Our manufacturing footprint is geographically diverse with a greater presence in North America and Europe compared to many of our peers.  We leverage our footprint to improve our cost position by locating labor-intensive processes within our low-cost plants, and by investing in automation and undertaking continuous improvement and expansion initiatives in our domestic facilities.

Our Engineered Solutions Value Proposition
We seek to leverage our extensive portfolio of adaptable products and strategically positioned global network of resources to deliver custom-engineered solutions for vehicle control and thermal management categories to the diversified end markets we supply.

Our Engineered Solutions products are sold primarily to original equipment manufacturers and their tier suppliers, system integrators, and original equipment service part operations.  Our customers use our products in serial production and as service and replacement parts.

We believe our global network of resources, including our engineering capabilities, advanced quality systems, manufacturing, distribution and technical sales expertise, combined with our customizable solutions for vehicle control and thermal management categories, is a key competitive advantage.  Our focus on vehicle control and thermal management categories leverages the legacy and leadership position of our automotive aftermarket business to provide a platform for future growth in diverse non-aftermarket end markets.  We drive growth in this segment by developing new customer relationships, cross-selling to existing customers, introducing new products to new and existing customers, and increasing content per unit.  Our growth strategy is long-term, and we do not expect growth to be linear given the lengthy nature of design engineering and validation and the period of time between the awarding of new business and the start of production, often which occurs 1-2 years after business is awarded.

We believe our automotive aftermarket business benefits from our Engineered Solutions business through accelerated future product development; systems, processes and quality enhancements; the technical insights of its original equipment customers; its global footprint; and synergistic mergers and acquisitions.

We distribute our Engineered Solutions products under the following trade names:

Engineered
Solutions
graphic

Strategic Acquisitions

We selectively pursue strategic acquisitions that strengthen our position in the markets we supply or that diversify our business in target markets or geographies.  Among other considerations, we seek acquisitions that align with our core competencies; enhance our existing design, engineering and manufacturing capabilities; and vertically integrate key technologies, products and processes.

For information on recent acquisitions and investments, see Note 2 “Business Acquisitions and Investments” of the Notes to Consolidated Financial Statements in Item 8 of this Report.

Industry Trends

The automotive aftermarket is a mature industry that tends to be influenced by trends such as the number of vehicles on the road, the average age of vehicles on the road, and the total number of miles driven per year.  Weather extremes like unseasonably hot or cool temperatures in the summer can also have an impact on automotive aftermarket product demand.

In the diverse non-aftermarket end markets we supply, such as commercial and light vehicles, construction, agriculture, power sports and others, other economic factors such as the level of new vehicle sales and production rates, which more recently have been impacted by disruptions in the global supply chain and labor, tend to have a more direct impact.

Our Customers

In the automotive aftermarket, our customers are many of the largest national and regional retailers and distributors, such as: Advance Auto Parts; Auto Value and Bumper to Bumper (Aftermarket Auto Parts Alliance); Automotive Distribution Network; AutoZone; Canadian Tire; Federated Auto Parts; Genuine Parts Company and National Automotive Parts Association; O’Reilly Auto Parts; The Automotive Parts Services Group or The Group; The National Pronto Association; and Uni-Select.

Engineered Solutions customers are many of the largest original equipment manufacturers and their tier suppliers, system integrators, and original equipment service part operations, such as:  Bombardier; Carquest: Caterpillar; CNH; Daimler Truck; Eberspacher; Ford; General Motors; Harley-Davidson; IVECO; John Deere; Mobile Climate Control; Polaris; Scania; Volvo/Mack Truck; and Woodward.

Our three largest individual customers accounted for approximately 59% of our consolidated net sales in 2023.  During 2023, O’Reilly Auto Parts, AutoZone and NAPA accounted for 29%, 16%, and 14% of our consolidated net sales, respectively.

Competition

Our business operates in highly competitive markets, and we face substantial competition in all of the markets that we supply.

In the automotive aftermarket, we compete primarily on the basis of product quality, availability (including order turn-around time and fill rate), coverage and price, and value-added services.  Our primary competitors are full-line suppliers, short- or value-line suppliers, tier suppliers and service part operations of original equipment manufacturers, including car dealerships, and the direct import programs of certain retailers.

In our Engineered Solutions segment, we compete on the basis of product quality, price and availability (including order turn-around time and fill rate), technical expertise (including product design, development and innovation), and lean process improvements.  Our primary competitors are global and regional tier suppliers of original equipment manufacturers.

We believe we differentiate ourselves from our competition through the execution of our value proposition, discussed further above.  In addition, in the automotive aftermarket, we offer a variety of strategic customer discounts, allowances and incentives to increase customer purchasesthe sale of our products.  For example, we offer cash discounts for paying invoices in accordance with the specified discounted terms of the invoice.  We also offer rebates and discounts to customers as advertising and sales force allowances, and allowances for warranty and overstock returns are also provided.  We believe theseThese discounts, allowances and incentives are a common practice throughoutin the automotive aftermarket, industry, and we intend to continue to offeroffering them in response to competitive pressures and to strategically support the growth in sales of all our products.

Seasonality

Historically, our operating results have fluctuated by quarter, with the greatest sales occurring in the second and third quarters of the year and revenues generally being recognized at the time of shipment.  It is in these quarters that demand for our products is typically the highest, specifically in the Temperature Control Segment of our business.  In addition to this seasonality, theThe demand for our Temperature Control products during the second and third quarters of the year may vary significantly with the summer weather and customer inventories.  Ordinarily, a warm summer, as we experienced in 2021, would increase the demand for our Temperature Control products, while a somewhat mild summer, as we experienced in 2019, may lessen such demand.  While the COVID-19 pandemic caused large shifts in sales demand between quarters in 2020, our business returned to a more normalized pattern of seasonality and variability in demand of our Temperature Control products in 2021.  As such, our working capital typically peaks near the end of the second quarter, as the inventory build-up of air conditioning products was converted to sales, and payments on the receivables associated with such sales were yet to be received.  During this period, our working capital requirements were funded by borrowing from our revolving credit facility.

Working Capital and Inventory Management

Automotive aftermarket companies have been under increasing pressure to provide broad SKU (stock keeping unit) coverage due to parts and brand proliferation.  In response to this, we have made, and continue to make, changes to ourWe maintain an inventory management system that is designed to reduce inventory requirements.requirements, and enhance our ability to compete on the basis of product availability (including order turn-around time and fill rate) and product coverage.  We haveseek continuous improvements in this system to improve inventory deployment, enhance collaboration with customers on forecasts and inventory assortments, and further integrate our supply chain with both our customers and suppliers.  We also utilize a pack‑to‑order distribution system, which permits us to retain slow moving items in a bulk storage state until ana related order for a specific branded part is received.  This system reduces the volume of a given part in inventory.  We also expanded our inventory management system to improve inventory deployment, enhance our collaboration with customers on forecasts and inventory assortments, and further integrate our supply chain both to customers and suppliers.

We face inventory management issues in our automotive Aftermarket business as a result of overstock returns.  We permit our automotive Aftermarket customers to return new, undamaged products to us within customer-specific limits (which are generally limited to a specified percentage of their annual purchases from us) in the event that they have overstocked their inventories.  We accrue for overstock returns as a percentage of sales after giving consideration to recent returns history.  In addition, as discussed further above under the heading “Seasonality”, the seasonality of our Temperature Control Segment requires that we increase our inventory during the winter season in preparation of the summer selling season and customers purchasing such inventory have the right to make returns.  We accrue for overstock returns as a percentage of sales after giving consideration to recent returns history.season.

OurAs such, our profitability and working capital requirements are seasonal due to our sales mix of Temperature Control products.  Our working capital requirements typically peak near the end of the second quarter, as the inventory build‑up of air conditioning products is converted to sales, and payments on the receivables associated with such sales have yet to be received.  These increased working capital requirements are funded by borrowings from our revolving credit facility.facility in our Credit Agreement.

Production and Engineering

10
An important component of our business strategy is to invest the resources necessary to expand our technical capabilities and bring more product manufacturing in-house. We engineer, tool and manufacture many of the products that we offer for sale and the components used in the assembly of those products, and we continue to evaluate opportunities to bring new product categories in-house.  For example, we perform our own plastic molding operations, stamping and machining operations, wire extrusion, automated electronics assembly and a wide variety of other processes.  In the case of remanufactured components, we conduct our own teardown, diagnostics and rebuilding for air conditioning compressors, diesel injectors, and diesel pumps.  We have found this level of vertical integration, in combination with our manufacturing footprint in low cost regions, provides advantages in terms of cost, quality and availability.
Suppliers

We source materials through a global network of suppliers to ensure a consistent, high quality and low cost supply of materials and key components for our product lines.  As a result of the breadth of our product offering, we are not dependent on any single raw material.

The principal raw materials purchased by us consist of brass, electronic components, fabricated copper (primarily in the form of magnet and insulated cable), steel magnets, laminations, tubes and shafts, stamped steel parts, copper wire, stainless steel coils and rods, aluminum coils, fittings, rods, cast aluminum parts, lead, steel roller bearings, rubber molding compound, thermo‑set and thermo plastic molding powders, and chemicals.  Additionally, we use components and cores (used parts) in our remanufacturing processes for air conditioning compressors, diesel injectors, and diesel pumps.

In the case of cores for air conditioning compressors, diesel injectors, and diesel pumps, we obtain them either from exchanges with customers who return cores subsequent to purchasing remanufactured parts or through direct purchases from a network of core brokers.  In addition, we acquire certain materials by purchasing products that are resold into the market, particularly by OEM sources and other domestic and foreign suppliers.

We believe there is an adequate supply of primary raw materials and cores; however, Irrespective, disruptions in the global economy in 2020 and the lingering impacts into 2021 have impeded global supply chains, resulting in inflationary cost increases in certain raw materials, labor and transportation, in longer lead times, and delays in procuring component parts and raw materials, and inflationary costin prior year inventory increases, in certain raw materials, labor and transportation.which are subsequently being worked down.  In response to the global supply chain volatility and inflationary cost increases, we have taken, and continue to take, several actions to mitigate the impact by working closely with our suppliers and customers to minimize any potential adverse impacts on our business, including initiatingimplementing cost savings initiatives and the pass through of higher costs to our customers which began in the fourth quarterform of 2021.price increases.

The principal raw materials purchased by us consist of brass, electronic components, fabricated copper (primarily in the form of magnet and insulated cable), steel magnets, laminations, tubes and shafts, stamped steel parts, stainless steel coils and rods, aluminum coils, fittings, rods, cast aluminum parts, lead, steel roller bearings, rubber molding compound, thermo‑set and thermo plastic molding powders, and chemicals.

Additionally, we use components and cores (used parts) in our remanufacturing processes for air conditioning compressors, diesel injectors, and diesel pumps.  We believeobtain cores from exchanges with customers who return cores subsequent to purchasing remanufactured products, and from a network of core brokers who sell cores.  In addition, we acquire certain materials by purchasing products that weare resold into the market, particularly by OEM sources and other domestic and foreign suppliers.

We expect to have also benefited froman adequate supply of primary raw materials and cores necessary to meet our geographically diversified manufacturing footprintneeds; however, there always are risks and our strategy to bring more product manufacturing in-house, especiallyuncertainties with respect to productthe supply of raw materials and components that could impact their availability in sufficient quantities and fill rates.at cost effective prices to meet our needs.

Environmental, SocialSustainability

We support and Governance (ESG)seek continuous improvement in the pursuit of environmental, social and Human Capitalcorporate governance practices that embody our culture and what we believe it means to be a good corporate citizen.

Our Culture

Our Company was founded in 1919 on the values of integrity, common decency and respect for others.  These values continue to this day and are embodied in our Code of Ethics, which has been adopted by the Board of Directors of the Company to serve as a statement of principles to guide our decision-making and reinforce our commitment to these values in all aspects of our business.  These values also serve as the foundation for our increasedcontinued focus on many important environmental, social and governance issues, such as environmental stewardship and our efforts to identify and implement practices that reduce our environmental impact while achieving our business goals; our attention to diversity, equity and inclusion, employee development, retention, and health and safety; and our community engagement initiatives, to name a few.  sustainability issues.

Environmental Stewardship

We have made significant strides with respect to our sustainability initiatives, building awareness of the environmental impact of our operations, and challenging ourselves to reduce our impact by reducing our consumptionusage of energy and generation of waste, as well as enhancing our recycling efforts.

Environmental Stewardship

We have made significant strides building awareness of the environmental impact of our operations, and challenging ourselves to reduce our impact by reducing our consumption of energy, including electricity, natural gas and propane;water, reducing our generation of waste, and increasing the percentage of waste recycled; reducing our use of waterrecycling efforts and reducing our Scope 1 and Scope 2 greenhouse gas emissions.

We are also focused on Additionally, we believe our product offering contributes to a greener car parc through several initiatives that are intended to promote a more environmentally-friendly car parc. Through our remanufacturing processes, we divert certain types of used automotive products from traditional waste streams and reprocess them for their original purpose.  We remanufacture key product categories within our product portfolio,that are critical components in automotive systems designed to improve fuel economy and reduce harmful emissions, such as air conditioning compressors, dieselfuel injectors, exhaust gas recirculation valves, sensors and diesel pumps, resulting in the production of premium automotive products within these categories through processes that we believe save energytubes, and reduce waste.evaporative emission control system components. We also bring to market emission control system products, which are designed to reduce emissions and improve fuel economy during vehicle operation, and alternative energy products, which utilize cleaner burning fuels or are designed for electric or hybrid electric vehicles.vehicles, and we remanufacture key categories within our product portfolio, such as air conditioning compressors, diesel injectors and diesel pumps, through processes that save energy and reduce waste.

Human Capital

We believe that our commitment to our employees is critical to our continued success, and has led to high employee satisfaction and low employee turnover.  To facilitate talent attraction and retention, we strive to have a diverse, inclusive and safe workplace, with opportunities for our employees to grow and develop in their careers, supported by strong compensation, benefits and health and wellness programs, and by programs that build connections between our employees and their communities.  Our employees share our corporate values of integrity, common decency and respect of others, values which have been established since our company was founded.

As of December 31, 2021,2023, we employed approximately 5,0005,200 people, with 2,0002,100 people in the United States and 3,0003,100 people in Mexico, Canada, Poland, the U.K., Germany, Hungary, China and Hong Kong and Taiwan.Kong. Of the 5,0005,200 people employed, approximately 2,7002,600 people are production employees.  We operate primarily in non‑union facilities and have binding labor agreements with employees at other unionized facilities.  We have approximately 8075 production employees in Edwardsville, Kansas, who will eventually migrate to our new Shawnee, KS facility, who are covered by a contract with The International Union, United Automobile, Aerospace and Agricultural Implement Workers of America (“UAW”) that expires in August 2022.2026.  We also have approximately 1,5001,200 employees in Mexico who are covered under union agreements negotiated at various intervals.  For clarification, the employee numbers described above exclude the employees of our joint venture operations.

Although the COVID-19 pandemic has led to some challenges in finding adequate labor, generally we  We believe that our facilities are in labor markets with ready access to adequate numbers of skilled and unskilled workers, and we believe our relations with our union and non‑union employees are good.

Diversity, Equity, Inclusion, and Inclusion.Belonging.  We believe thatstrive to hire, retain and advance a diverse workforce is critical to our success, andthat reflects the communities that we continue to focus on the hiring, retention and advancement of women and underrepresented populations.serve. Our recent efforts have been focused in three areas: inspiring innovation through an inclusive and diverse culture; expanding our efforts to recruit and hire world-class diverse talent; and identifying strategic partners to accelerate our inclusion and diversity programs.  Over the last 5 years, approximately 50% of our hires and promotions have been women or racially diverse individuals.  To further our commitment to diversity, in 2021, we established a Diversity, Equity and Inclusion steering committee to develop key structures within our organization to promote equality, inclusion and awareness among our employees.

Health, Safety and Wellness.  The success of our business is fundamentally connected to the well-being of our people.  Accordingly, weWe are committed to the health, safety and wellness of our employees.  We provide our employeesstrive to eliminate workplace incidents, risks and their families with access to a variety of innovative, flexible and convenienthazards. Our health and wellness programs including benefits that provide protection and security so they can have peace of mind concerning events that may require time away from work, or that impact their financial well-being; that support theirour employees’ physical and mental health by providing tools and resources to help them improve or maintain their health statusencourage healthy behaviors and encourage engagementprovide peace of mind in healthy behaviors; andcircumstances that offer choice where possible so they can customize their benefits to meet their needs and the needs of their families.

In response to the COVID-19 pandemic, we implemented significant changes that we determined were in the best interest of our employees and which comply with government regulations.  These include providing employees with flexible working arrangements, including where appropriate the ability to workmay require time away from home, and implementing a number of safety policies and practices at all of our facilities.work.

Compensation and Benefits.  We provide competitive compensation and benefits programs that meet the needs of our employees.  In addition to wages and salaries, these programs include annual cash bonuses, stock awards, a 401(k) Plan, healthcare and insurance benefits, health savings and flexible spending accounts, paid time off, family leave, fertility benefits, family care resources, tuition reimbursement, LGBTQ+ inclusive benefits, mental health resources and employee assistance programs.

Talent Development.  We invest significant resources to develop the talent of our high potential employees.  We deliver employee workshops and mentoring programs, numerous training opportunities, provide rotational assignment opportunities, have expanded our focus onoffer continuous learning and development, and implementedimplement methodologies to manage performance, provide feedback and develop talent.

Our talent development programs areopportunities, all designed to provide employees with the resources they need to help achieve their career goals and build management skills and lead their organizations.  We provide a series of employee workshops that support professional growth and development.skills.  Our annual review process encourages manager and employee conversations throughout the year to enhance growth and development.

13Employee satisfaction and engagement are important elements in our talent retention strategy. From time to time, we conduct employee engagement surveys to identify areas where we can enhance our talent retention strategy and employee satisfaction, including fostering a more inclusive and equitable environment. We utilize the results from these engagement surveys to better provide employees with the tools, resources and support that they need to succeed and grow in their SMP careers.

Social Engagement and Community Service

We believe that building connections between our employees, their families and our communities creates a more meaningful, fulfilling and enjoyable workplace.  Through our SMP Cares® initiative, we sponsor corporate giving and volunteering programs to encourage our employees to connect with our local communities and engage in the local causes that they are passionate about.

Our volunteering efforts include organizing blood drives with the American Red Cross, and fundraising for the March of Dimes, United Way, the Salvation Army, and many others.  In 2021, we collaborated with our employees to donate over $50,000 to local community organizations, hospitals, schools, shelters, and universities.  We are a lifetime trustee of the University of the Aftermarket Foundation (“UAF”), and we donate $10,000 annually to fund scholarships to support the next generation of technicians and automotive professionals, which we believe is an important way to sustain and give back to our industry.  We are also proud to sponsor annual scholarship contests for future automotive technicians, including our Women in Auto Care scholarship that aims to empower women entering the automotive industry.  Since our first scholarship contest in 2015, we have awarded $265,000 in scholarships.  We have continued to expand our scholarship program, and in 2021, we awarded ten students each with a $5,000 scholarship.  We continue to encourage participation in these initiatives as we believe they are essential in the support of our core values.

Governance

Our commitment to ESGsustainability is spearheaded by our Board of Directors. Specifically, our Nominating and Corporate Governance Committee established an ESGa sustainability steering committee among our executive officers including our Chief Executive Officer & President, Chief Legal Officer & Secretary, Chief Human Resources Officer, and Senior Vice President of North American Operations. This ESGsustainability steering committee is tasked with developing specific strategies to ensure that our company-wide operations adhere to our corporate governance values and advance our ESG objectives.sustainability objectives globally.  The multidisciplinary approach of our steering committee allows it to leverage our expertise in operations, engineering, supply chain, human capital management, finance, legal and other fields to push our ESGsustainability initiatives ahead from all angles.

Continued Commitment

With each year, we intend to further our commitment to sustainability initiatives, improving our environmental stewardship, finding ways to give back to our communities, and enhancing the diversity and inclusion of our workforce while offering opportunities for development.  Information on our sustainability initiatives can be found in our most current sustainability report and on our corporate website at ir.smpcorp.com under “Environmental & Social Responsibility” and at smpcares.smpcorp.com.  Information in our sustainability report and on our corporate websites regarding our sustainability initiatives are referenced for general information only and are not incorporated by reference in this Report.

Available Information

We are a New York corporation founded in 1919.  Our principal executive offices are located at 37‑18 Northern Boulevard, Long Island City, New York 11101, and our main telephone number at that location is (718) 392‑0200.  Our Internet address is www.smpcorp.com.  We provide a link to reports that we have filed with the SEC.  However, for those persons that make a request in writing or by e-mail (financial@smpcorp.com), we will provide free of charge our Annual Report on Form 10-K, our Quarterly Reports on Form 10-Q, our Current Reports on Form 8-K and any amendments to those reports filed or furnished pursuant to Section 13(a) or 15(d) of the Securities Exchange Act of 1934.  These reports and other information are also available, free of charge, at www.sec.gov.www.sec.gov.

ITEM 1A.RISK FACTORS

You should carefully consider the risks described below.  These risks and uncertainties are not the only ones we face.  Additional risks and uncertainties not presently known to us or other factors not perceived by us to present significant risks to our business at this time also may impair our business and results of operations.  If any of the stated risks actually occur, they could materially and adversely affect our business, financial condition or operating results.

 Risks Related to Our Operations

We depend on a limited number of key customers, and the loss of any such customer, or a significant reduction in purchases by such customer, could have a material adverse effect on our business, financial condition and results of operations.

14

Our three largest individual customers accounted for approximately 57%59% of our consolidated net sales in 2021.2023.  During 2021,2023, O’Reilly NAPAAuto Parts, AutoZone and AutoZoneNAPA accounted for 26%29%, 17%16% and 14% of our consolidated net sales, respectively. The loss of one or more of these customers or, a significant reduction in purchases of our products from any one of them such as the decision, announced in December 2020, of a large retail customer to pursue a private brand strategy for its engine management product line, could have a materially adverse impact on our business, financial condition and results of operations.  In addition, any consolidation among our key customers may further increase our customer concentration risk.

Also,In our automotive aftermarket business, we do not typically enter into long-term agreements with any of our customers.  Instead, we enter into a number of purchase order commitments with our aftermarket customers, based on their current or projected needs.  We have in the past, and may in the future, lose customers or lose a particular product line of a customer due to the highly competitive conditions in the automotive aftermarket industry, including pricing pressures, consolidation of customers, customer initiatives to buy direct from foreign suppliers and/or to pursue a private brand strategy, or other business considerations.  A decision by any significant customer, whether motivated by competitive conditions, financial difficulties or otherwise, to materially decrease the amount of products purchased from us, to change their manner of doing business with us, or to stop doing business with us, including a decision to source products directly from a low cost region such as Asia, could have a material adverse effect on our business, financial condition and results of operations.  Because our sales are concentrated, and the marketmarkets in which we operate isare very competitive, we are under ongoing pressure from our customers to offer lower prices, extend payment terms, increase marketing allowances and other terms more favorable to these customers.  These customer demands have put continued pressure on our operating margins and profitability, resulted in periodic contract renegotiation to provide more favorable prices and terms to these customers, and significantly increased our working capital needs.

Our industry is highly competitive, and our success depends on our ability to compete with suppliers of automotive products, some of which may have substantially greater financial, marketing and other resources than we do.

The automotive industry is highly competitive, and our success depends on our ability to compete with domestic and international suppliers of automotive products. In the Engine Management Segment,automotive aftermarket, we compete with: ACDelco, Aptiv Plc, Denso Corporation, Continental AG, Hitachi, Ltd., Motorcraft, Robert Bosch GmbH, Visteon Corporation, NGK Spark Plug Co., LTD., Dorman Products, Inc.primarily with full-line suppliers, short- or value-line suppliers, tier suppliers and several privately-owned companies primarily importing products from Asia.service part operations of original equipment manufacturers, including car dealerships, and the direct import programs of certain retailers. In the Temperature Control Segment,diverse non-aftermarket end markets we supply, we compete with: ACDelco, MAHLE GmbH, Denso Corporation, Motorcraft, Sanden International (U.S.A.), Inc., Continental AG, Dorman Products, Inc.,primarily with global and several privately-owned companies.  In addition, automobile manufacturers supply manyregional tier suppliers of the replacement parts we sell.original equipment manufacturers. Some of our competitors may have larger customer bases and significantly greater financial, technical and marketing resources than we do.  These factors may allow our competitors to:

respond more quickly than we can to new or emerging technologies and changes in customer requirements by devoting greater resources than we can to the development, promotion and sale of automotive products and services;
 
engage in more extensive research and development;
 
sell products at a lower price than we do;
 
undertake more extensive marketing campaigns; and
 
make more attractive offers to existing and potential customers and strategic partners.

We cannot assure you that our competitors will not develop products or services that are equal or superior to our products or that achieve greater market acceptance than our products or that in the future other companies involved in the automotive industry will not expand their operations into product lines produced and sold by us.  We also cannot assure you that additional entrants will not enter the automotive industry or that companies in the industry will not consolidate.  Any such competitive pressures could cause us to lose market share or could result in significant price decreases and could have a material adverse effect upon our business, financial condition and results of operations.

There is substantial price competition in our industry, and our success and profitability will depend on our ability to maintain a competitive cost and price structure.

There is substantial price competition in our industry, and our success and profitability will depend on our ability to maintain a competitive cost and price structure.  This is the result of a number of industry trends, including the impact of offshore suppliers in the marketplace (particularly in China) which do not have the same infrastructure costs as we do, the consolidated purchasing power of large customers, and actions taken by some of our competitors in an effort to ‘‘win over’’ new business.  We have in the past reduced prices to remain competitive and may have to do so again in the future.  Price reductions have impacted our sales and profit margins and may do so in the future.  Our future profitability will depend in part upon our ability to respond to changes in product and distribution channel mix, to continue to improve our manufacturing efficiencies, to generate cost reductions, including reductions in the cost of components purchased from outside suppliers, to maintain a cost structure that will enable us to offer competitive prices, and to pass through higher distribution, raw materials and labor costs to our customers.  Our inability to maintain a competitive cost structure could have a material adverse effect on our business, financial condition and results of operations.

Our business is seasonal and is subject to substantial quarterly fluctuations, which impact our quarterly performance and working capital requirements.

Historically, our operating results have fluctuated by quarter, with the greatest sales occurring in the second and third quarters of the year and revenues generally being recognized at the time of shipment. It is in these quarters that demand for our temperature control products is typically the highest, specifically in the Temperature Control Segment of our business.highest.

In addition to this seasonality, theThe demand for our Temperature Controltemperature control products during the second and third quarters of the year may vary significantly with the summer weather and customer inventories.  Ordinarily, a warm summer, as we experienced in 2020, would increase the demand for our Temperature Control products, while a somewhat mild summer, as we experienced in 2019, may lessen such demand.  While the COVID-19 pandemic caused large shifts in sales demand between quarters in 2020, our business has returned to a more normalized pattern of seasonality and variability in demand of our Temperature Control products in 2021. As such, our working capital requirements peakedtypically peak near the end of the second quarter, as the inventory build‑up of air conditioning products wasis converted to sales, and payments on the receivables associated with such sales werehave yet to be received.  During this period, ourThese increased working capital requirements wereare funded by borrowing from our revolving credit facility.facility in our Credit Agreement.

Climate-related physical risks, such as changes to weather patterns and conditions may also impact the pattern of seasonality and variability in demand for our Temperature Control products discussed above, which may impact our quarterly performance and working capital requirements.

We may incur material losses and significant costs as a result of warranty-related returns by our customers in excess of anticipated amounts.

Our products are required to meet rigorous standards imposed by our customers and our industry. Many of our products carry a warranty ranging from a 90-day limited warranty to a lifetime limited warranty, which generally covers defects in materials or workmanship, failureand conformance to meet industry published specifications and/or the result of installation error.agreed upon specifications. In the event that there are material deficiencies or defects in the design and manufacture of our products and/or installation error,fail to conform to these warranties, the affected products may be subject to warranty returns and/or product recalls. Although we maintain a comprehensive quality control program, we cannot give any assurance that our products will not suffer from defects or other deficiencies or that we will not experience material warranty returns or product recalls in the future.

We accrue for warranty returns as a percentage of sales, after giving consideration to recent historical returns. While we believe that we make reasonable estimates for warranty returns in accordance with our revenue recognition policies, actual returns may differ from our estimates. We have in the past incurred, and may in the future incur, material losses and significant costs as a result of our customers returning products to us for warranty-related issues in excess of anticipated amounts. Deficiencies or defects in our products in the future may result in warranty returns and product recalls in excess of anticipated amounts and may have a material adverse effect on our business, financial condition and results of operations.

Our profitability may be materially adversely affected as a result of overstock inventory related returns by our customers in excess of anticipated amounts.

WeIn our automotive aftermarket business, we permit overstock returns of inventory that may be either new or non-defective or non-obsolete but that we believe we can re-sell. Customers are generally limited to returning overstocked inventory according to a specified percentage of their annual purchases from us. In addition, a customer’s annual allowance cannot be carried forward to the upcoming year.

We accrue for overstock returns as a percentage of sales, after giving consideration to recent historical returns. While we believe that we make reasonable estimates for overstock returns in accordance with our revenue recognition policies, actual returns may differ from our estimates. To the extent that overstocked returns are materially in excess of our projections, our business, financial condition and results of operations may be materially adversely affected.

We may be materially adversely affected by asbestos claims arising from products sold by our former brake business, as well as by other product liability claims.

In 1986, we acquired a brake business, which we subsequently sold in March 1998.  When we originally acquired this brake business, we assumed future liabilities relating to any alleged exposure to asbestos-containing products manufactured by the seller of the acquired brake business.  In accordance with the related purchase agreement, we agreed to assume the liabilities for all new claims filed after September 2001.  Our ultimate exposure will depend upon the number of claims filed against us on or after September 2001, and the amounts paid for settlements, awards of asbestos-related damages, and defense of such claims.  We do not have insurance coverage for the indemnity and defense costs associated with the claims we face.

At December 31, 2021, 1,5542023, 1,390 cases were outstanding for which we may be responsible for any related liabilities.  Since inception in September 2001 through December 31, 2021,2023, the amounts paid for settled claims and awards of asbestos-related damages, including interest, were approximately $53.8$74.6 million.  A substantial increase in the number of new claims, or increased settlement payments, or awards of asbestos-related damages, could have a material adverse effect on our business, financial condition and results of operations.

In accordance with our policy to perform an annual actuarial evaluation in the third quarter of each year, an actuarial study was performed as of August 31, 2021.2023.  Based upon the results of the August 31, 20212023 actuarial study, and all other available information to us, we increased our asbestos liability to the low end of the range, and recorded an incremental pre-tax provision of $5.3$23.8 million in earnings (loss) from discontinued operations in the accompanying statement of operations.  The results of the August 31, 20212023 study included an estimate of our undiscounted liability for settlement payments and awards of asbestos-related damages, excluding legal costs, and any potential recovery from insurance carriers, ranging from $60.9$84 million to $100.2$135.3 million for the period through 2065.  Future legal costs, which are expensed as incurred and reported in earnings (loss) from discontinued operations in the accompanying statement of operations, are estimated, according to the August 31, 20212023 study, to range from $49.4$53.1 million to $99.3$105.2 million for the period through 2065.

Given the uncertainties associated with projecting asbestos-related matters into the future and other factors outside our control, we cannot give any assurance that significant increases in the number of claims filed against us will not occur, that awards of asbestos-related damages or settlement awards will not exceed the amount we have in reserve, or that additional provisions will not be required. Management will continue to monitor the circumstances surrounding these potential liabilities in determining whether additional reserves and provisions may be necessary. We plan on performing an annual actuarial analysis during the third quarter of each year for the foreseeable future, and whenever events or changes in circumstances indicate that additional provisions may be necessary.

In addition to asbestos-related claims, our product sales entail the risk of involvement in other product liability actions.  We maintain product liability insurance coverage, but we cannot give any assurance that current or future policy limits will be sufficient to cover all possible liabilities.  Further, we can give no assurance that adequate product liability insurance will continue to be available to us in the future or that such insurance may be maintained at a reasonable cost to us. In the event of a successful product liability claim against us, a lack or insufficiency of insurance coverage could have a material adverse effect on our business, financial condition and results of operations.

We may not be able to achieve the benefits that we expect from our cost savings initiatives.

We expect to realize the continued benefit of discretionary cost reduction measures, implemented in 2020, in response to the COVID-19 pandemic, and carried over into 2021, along with the continued cost savings anticipated from several ongoing and/or recently completed restructuring and integration initiatives.  Due to factors outside our control, such as the adoption or modification of domestic and foreign laws, regulations or policies, we may not be able to achieve the level of benefits that we expect to realize in these initiatives, or we may not be able to realize these benefits within the time frames we currently expect.  Our ability to achieve any anticipated cost savings could be affected by a number of factors such as changes in the amount, timing and character of charges related to such initiatives, or a substantial delay in the completion of such initiatives.  Failure to achieve the benefits of our cost saving initiatives could have a material adverse effect on us.  Our cost savings is also predicated upon maintaining our sales levels.

Severe weather, natural disasters and other disruptions could adversely impact our operations at our manufacturing and distribution facilities.

Severe weather conditions and natural disasters, such as hurricanes, tornados, earthquakes and floods, could damage our properties and effect our operations, particularly our major manufacturing and distribution operations at foreign facilities in Canada, China, Mexico, Poland, Germany and Hungary and at our domestic facilities in Florida, Indiana, Kansas, South Carolina, Texas, Virginia, and Wisconsin.  In February 2021, our operations in Texas were disrupted due to a severe winter storm that resulted in power grid failure, blackouts and the tragic loss of life across the State of Texas.  Moreover, global climate change may cause these natural disasters to occur more frequently and/or with more intense effects, which could prevent us from, or cause delays in our ability to, manufacture and deliver products to our customers, and/or cause us to incur additional costs.

In addition, our business and operations could be materially adversely affected in the event of other serious disruptions at these facilities due to fire, electrical blackouts, power losses, telecommunications failures, wars, terrorist attack or similar events.  Any of these occurrences could impair our ability to adequately manufacture or supply our customers due to all or a significant portion of our equipment or inventory being damaged.  WeIf our existing manufacturing or distribution facilities become incapable of producing and supplying products for any reason, we may not be able to effectively shift the manufacture or delivery of products tosatisfy our customers if one or more ofcustomers’ requirements and we may lose revenue and incur significant costs and expenses that may not be recoverable through our manufacturing or distribution facilities are significantly disrupted.business interruption insurance.

Disruptions in the supply of raw materials, manufactured components, or equipment could materially and adversely affect our operations and cause us to incur significant cost increases.

We source various types of raw materials, finished goods, equipment, and component parts from suppliers as part of a global supply chain, and we may be materially and adversely affected by the failure of those suppliers to perform as expected.  Although we have had an adequate supply of purchased supplier raw materials, finished goods, equipment and component parts, disruptions in the global economy in 2020 and the lingering impacts into 2021 have impeded global supply chains, resulting in longer lead times and delays in procuring component parts and raw materials, and inflationary cost increases in certain raw materials, labor and transportation.  In response to the global supply chain volatility and inflationary cost increases, we have taken, and continue to take, several actions to mitigate the impact by working closely with our suppliers and customers to minimize any potential adverse impacts on our business, including initiating cost savings initiatives and the pass through of higher costs to our customers, which began in the fourth quarter of 2021.customers.  We expect these inflationary trends to continue for some time, and while we believe that we will be able to somewhat offset the impact, there can be no assurancescannot assure that unforeseen future events in the global supply chain affecting the availability of materials and components, and/or increasing commodity pricing, will not have a material adverse effect on our business, financial condition and results of operations.

Additionally, supplier non-performance may consist of delivery delays or failures caused by production issues or delivery of non-conforming products.  Our suppliers’ ability to supply products to us is also subject to a number of risks, including the availability and cost of raw materials, the destruction of their facilities, work stoppages, cyber attacks oncybersecurity incidents affecting their information technology systems or other limitations on their business operations, which could be caused by any number of factors, such as labor disruptions, financial distress, severe weather conditions and natural disasters, social unrest, economic and political instability, and public health crises, including the occurrence of a contagious disease or illness, such as the COVID-19 pandemic, war, terrorism or other catastrophic events.  In addition, our failure to promptly pay, or order sufficient quantities of inventory from our suppliers may increase the cost of products we purchase or may lead to suppliers refusing to sell products to us at all.  Our efforts to protect against and to minimize these risks may not always be effective.

Our operationsOperations could be adversely affected by interruptions or breaches in the security of our computer and information technology systems.

We rely on information technology systems throughout our organization to conduct day-to-day business operations, including the management of our supply chain and our purchasing, receiving and distribution functions.  We also routinely use our information technology systems to send, receive, store, access and use sensitive data relating to our Company and its employees, customers, suppliers, and business partners, including intellectual property, proprietary business information, and other sensitive materials.  Additionally, we rely on our information technology systems to enable many of our employees to work remotely as a result of newmore recent policies and practices enacted by us in response to the COVID-19 pandemic.us.

Our information technology systems have been subject to cyber threats, including attempts to hack into our network and computer viruses.  Such hacking attempts and computer viruses have not significantly impacted or interrupted our business operations.  While we implement
17

Despite security measures designed to prevent and mitigate the risk of cyber attacks,cybersecurity incidents, our information technology systems, and the systems of our customers, suppliers and business partners, may continue to be vulnerable to computer viruses,such incidents, including interruptions, outages, data breaches, phishing attacks, by hackers, orransomware attacks, unauthorized access, caused by employee errorattempts to hack into our network, and computer viruses.  Moreover, the technologies and techniques used to carry out cyber-attacks are continuously evolving, making it difficult to detect these changes or malfeasance.  The exploitationimplement adequate measures in time to prevent or mitigate the impact of any such vulnerability could unexpectedly compromisean attack. Due to the foregoing, though we have not experienced a material cybersecurity incident in 2023, we cannot guarantee that there will be no future cybersecurity incident that causes a material adverse effect on our information security,systems, or the securitythat of our customers, suppliers and other business partners.  Furthermore, because

In the techniques used to carry out cyber attacks change frequently and in many instances are not recognized until after they are used against a target, we may be unable to anticipate these changes or implement adequate preventative measures.  Ifevent that our information technology systems, or the systems of our customers, suppliers or business partners, are subject to cyber attacks, such as those involving significant or extensive system interruptions, sabotage, computer viruses or unauthorized access,incidents, we could experience disruptionserrors, interruptions, delays, and/or the cessation of services in key portions of our information systems. If critical information systems fail or otherwise become unavailable, our ability to process orders, maintain proper inventory levels, collect accounts receivable and disburse funds could be adversely affected. The foregoing matters could also cause significant damage to our business operations andreputation, affect our relationships with our business partners, lead to claims against us, and/or subject us to fines or other penalties assessed by governmental authorities. Additionally, we may be required to incur substantial remediation costs whichto remediate the damage caused by these disruptions or protect us against future cybersecurity incidents. Depending on the nature and magnitude of these events, they could have a material and adverse effect on our business, financial condition or results of operations.

The transition risks associated with global climate change may cause us to incur significant costs.

In addition to the physical risks described above, global climate change has brought about certain risks associated with the anticipated transition to a lower-carbon economy, such as regulatory changes affecting vehicle emissions and fuel efficiency requirements, technological changes in vehicle architectures, changes in consumer demand, carbon taxes, greenhouse gas emissions tracking, and regulation of greenhouse gas emissions from certain sources. Any regulatory changes aimed to reduce or eliminate greenhouse gas emissions may require us to incur increased operating costs, such as to purchase and operate emissions control systems or other such technologies to comply with applicable regulations or reporting requirements. These regulations,, as well as shifts in consumer demand due to public awareness and concern of climate change, could affect the timing and scope of their proliferation and may also adversely impact our sales of products designed for the internal combustion engines. As we monitor the rapid developments in this area,, we may be required to adjust our business strategy to address the various transition risks posed by climate change.

Failure to maintain the value of our brands could have an adverse effect on our reputation, cause us to incur significant costs and negatively impact our business.

Our brands are an importanta key component of our value proposition, and serve to distinguish our premium engine management and temperature control products from those of our competitors.  WeIn our automotive aftermarket business, we believe that our success depends, in part, on maintaining and enhancing the value of our brands and executing our brand strategies, which are designed to drive end-user demand for our products and make us a valued business partner to our aftermarket customers through the support of their marketing initiatives.  A decline in the reputation of our brands as a result of events, such as deficiencies or defects in the design or manufacture of our products, or from legal proceedings, product recalls or warranty claims resulting from such deficiencies or defects, may harm our reputation as a manufacturer and distributor of premium automotive parts, reduce demand for our products and adversely affect our business.

Our revenue and results of operations may suffer upon the bankruptcy, insolvency or other credit failure of a significant customer.

Most of our customers buy products from us on credit. We extend credit to customers and offer extended payment terms based upon competitive conditions in the marketplace and our assessment and analysis of creditworthiness. General economic conditions, competition and other factors may adversely affect the solvency or creditworthiness of our customers. Higher interest rates, inflationary cost increases in raw materials, labor and transportation and a general worsening of economic conditions have put financial pressure on many of our customers and may threaten certain customers’ ability to maintain liquidity sufficient to repay their obligations to us as they become due. The bankruptcy, insolvency or other credit failure of any customer that has a substantial amount owed to us could have a material adverse effect on our operating revenue and results of operations. We recorded a $7 million pre-tax charge in 2022 to reduce our outstanding accounts receivable balance from a customer that filed for bankruptcy in the first quarter of 2023 to our estimated recovery amount.

In our Engineered Solutions business, our supply agreements with our customers are generally requirements contracts, and a decline in the production requirements of any of our significant customers could adversely impact our revenues and profitability.

In our Engineered Solutions business, our customers generally agree to purchase their requirements for specific products, and we receive volume forecasts of their requirements, but not long-term firm volume commitments. Furthermore, our customers typically reserve the right to change, delay or cancel their orders for products, and we have limited recourse in such events.  Changes, delays or cancellations by a significant customer or by a number of customers could adversely impact our results of operations by reducing the volumes of products we manufacture and sell, by causing a delay in the recovery of expenditures for raw materials and component parts procured to satisfy such orders, or by reducing our asset utilization, resulting in lower profitability.

We also make key decisions based on our estimates of our customers’ requirements, including in planning our production schedules, raw material and component part purchases, personnel needs and other resource requirements. Changes in demand for our customers’ products would likely reduce our customers’ requirements and adversely impact our ability to accurately estimate their requirements in the future. Any significant decrease or delay in customer orders could have a material adverse effect on our business, financial condition and results of operations.

Our inability to attract or retain key employees may have an adverse effect on our business, financial condition and results of operations.

Our success is dependent upon our ability to attract, retain and motivate certain key employees, including our management and our skilled workforce of engineers, technically-trained salesforce employees and other qualified personnel.  Many of our key employees have many years of experience with our Company and would be difficult to replace without allotment of a significant amount of time for knowledge transfer.  Furthermore, although we believe our facilities are in labor markets with ready access to adequate numbers of skilled and unskilled workers, we compete with other businesses to fill many of our hourly positions in our distribution facilities, which historically have had high turnover rates, which can lead to increased training and retention costs, particularly in a competitive and shrinking labor market.  We cannot be certain that we will be able to continue to attract or retain our key employees, which could cause us to fail to execute our value proposition, fail to achieve operational efficiencies, and incur increased labor costs, which could have an adverse effect our business, financial condition and results of operations.

Risks Related to Liquidity

We are exposed to risks related to our receivables supply chain financing arrangements.

We are party to several supply chain financing arrangements, in which we may sell certain of our customers’ trade accounts receivable without recourse to such customers’ financial institutions.  To the extent that these arrangements are terminated, our financial condition, results of operations, cash flows and liquidity could be adversely affected by extended payment terms, delays or failures in collecting trade accounts receivables.

The utility of the supply chain financing arrangements also depends upon a benchmark reference rate for the purpose of determining the discount rate on the sale of the underlying trade accounts receivable.  If the benchmark reference rate increases significantly, we may be negatively impacted as we may not be able to pass these added costs on to our customers, which could have a material and adverse effect upon our financial condition, results of operations and cash flows.  Depending upon the level of sales of receivables pursuant these agreements, a hypothetical, instantaneous and unfavorable change of 100 basis points in the reference rate may have an approximate $8.3 million negative impact on our earnings or cash flows.

IncreasingA significant increase in our indebtedness, or in interest rates, could negatively affect our financial health.condition, results of operations and cash flows.

We have a senior secured revolving credit facility of $250 million (with an additional $50 million accordion feature)Credit Agreement with JPMorgan Chase Bank, N.A., as administrative agent, and a syndicate of lenders, which we refer to throughout this Report as ourlenders. The Credit Agreement provides for a $500 million credit facility comprised of a $100 million term loan facility and a $400 million multi-currency revolving credit facility.facility available in U.S. Dollars, Euros, Sterling, Swiss Francs, Canadian Dollars and other currencies as agreed to by the administrative agent and the lenders. As of December 31, 2021,2023, our total outstanding indebtedness was $128.4$156.2 million, including outstanding borrowings under the Credit Agreement of which amount $125.3$156 million, consisting of outstanding indebtednesscurrent borrowings of $5 million and approximately $122.1 millionlong-term borrowings of availability was attributable$151 million.

Borrowings under our Credit Agreement bear interest, at the Company’s election, at a rate per annum equal to this revolving credit facility.  Term SOFR plus 0.10% plus an applicable margin, or an alternate base rate plus an applicable margin, where the alternate base rate is the greater of the prime rate, the federal funds effective rate plus 0.50%, and one-month Term SOFR plus 0.10% plus 1.00%. The applicable margin for the term benchmark borrowings ranges from 1.0% to 2.0%, and the applicable margin for alternate base rate borrowings ranges from 0% to 1.0%, in each case, based on the total net leverage ratio of the Company and its restricted subsidiaries.

The significant increase in our indebtedness could:

increase our borrowing costs;
limit our ability to obtain additional financing or borrow additional funds;

require that a substantial portion of our cash flow from operations be used to pay principal and interest in our indebtedness, instead of funding working capital, capital expenditures, acquisitions, dividends, stock repurchases, or other general corporate purposes;
limit our flexibility in planning for, or reacting to, changes in our business and the industry in which we operate; and
increase our vulnerability to general adverse economic and industry conditions.

Availability under our revolving credit facility is based on a formula of eligible accounts receivable, eligible drafts presented to financial institutions under our supply chain financing arrangements and eligible inventory. The loss of business of one or more of our key customers or, a significant reduction in purchases of our products from any one of them, could adversely impact availability under our revolving credit facility.

In addition, we have granted the lendersCompany’s obligations under our revolving credit facilitythe Credit Agreement are guaranteed by its material domestic subsidiaries (each, a “Guarantor”), and secured by a first priority perfected security interest in substantially all of ourthe existing and future personal property of the Company and each Guarantor, subject to certain exceptions.  The collateral security described above also secures certain banking services obligations and interest rate swaps and currency or other hedging obligations of the Company owing to any of the then existing lenders or any affiliates thereof.  Concurrently with the Company’s entry into the Credit Agreement, the Company also entered into a seven year interest rate swap agreement with Wells Fargo Bank, N.A., Co-Syndication Agent and lender under the Credit Agreement, on $100 million of borrowings under the Credit Agreement.  The interest rate swap agreement matures in May 2029.

The Credit Agreement contains customary covenants limiting, among other things, the incurrence of additional indebtedness, the creation of liens, mergers, consolidations, liquidations and dissolutions, sales of assets, including accounts receivable, inventorydividends and certain fixed assets,other payments in respect of equity interests, acquisitions, investments, loans and thoseguarantees, subject, in each case, to customary exceptions, thresholds and baskets.  The Credit Agreement also contains customary events of certain of our subsidiaries. We have also pledged shares of stock in our subsidiaries to those lenders.default.  If we were default on any of these covenants, or on any of our indebtedness, if interest rates were to significantly increase, or the financial institution that is a party to our interest rate swap agreement were to default, or if we are unable to obtain necessary liquidity, our business could be adversely affected.

We may not be able to generate the significant amount of cash needed to satisfy our obligations or maintain sufficient liquidity through borrowing capacities.

Our ability either to make payments on or to refinance our indebtedness, or to fund planned capital expenditures and research and development efforts, will depend on our ability to generate cash in the future. Our ability to generate cash is in part subject to:
 
general economic, financial, competitive, legislative, regulatory and other factors that are beyond our control;
 
the ability of our customers to pay timely the amounts we have billed; and
 
our ability to sell receivables under supply chain financing arrangements.

The foregoing factors could result in reduced cash flow, which could have a material adverse effect on us. When cash generated by earnings is not sufficient for the Company’s liquidity needs, the Company seeks external financing. Our access to funding sources in amounts adequate to finance our activities on terms that are beneficial to us could be impaired by factors that affect us specifically or the economy generally. During periods of disruptions in the credit and capital markets, potential sources of external financing could be reduced, and borrowing costs could increase. A significant downgrade in the company’s credit ratings could increase its borrowing costs and limit access to capital.

Based on our current level of operations, we believe our cash flow from operations, available cash and available borrowings under our revolving credit facility, inclusive of the utilization of the $50 million accordion feature in the facility,Credit Agreement will be adequate to meet our future liquidity needs for at least the next twelve months. Significant assumptions underlie this belief, including, among other things, that we will be able to mitigate the future impact, if any, of the COVID-19 pandemic, disruptions in theglobal supply chain that maychains, which have resulted in longer lead to a further increasetimes and delays in inventories to support our customers,procuring component parts and raw materials, and significant inflationary cost increases in certain raw materials, labor and transportation, and that there will be no material adverse developments in our business, liquidity or capital requirements. Because borrowings under the revolving credit facility are secured by substantially all of our assets, including accounts receivable, the loss of business of one or more of our key customers or, a significant reduction in purchases of our products from any one of them, could adversely impact availability under our revolving credit facility.  If we are unable to fund our operations through earnings or external financing, we will be forced to adopt an alternative strategy that may include actions such as:
 
deferring, reducing or eliminating future cash dividends;
 
reducing or delaying capital expenditures or restructuring activities;
 
reducing or delaying research and development efforts;
 
selling assets;
 
deferring or refraining from pursuing certain strategic initiatives and acquisitions;
 
refinancing our indebtedness; and
 
seeking additional funding.

We cannot assure you that, if material adverse developments in our business, liquidity or capital requirements should occur, our business will generate sufficient cash flow from operations, or that future borrowings will be available to us under our revolving credit facilityCredit Agreement in amounts sufficient to enable us to pay the principal and interest on our indebtedness, or to fund our other liquidity needs. In addition, if we default on any of our indebtedness, or breach any financial covenant in our revolving credit facility,Credit Agreement, our business could be adversely affected.

The proposed phase-out of the London Interbank Offered Rate (LIBOR) could materially impact our borrowing costs under our secured revolving credit facility or the utility of our supply chain financing arrangements.

Our secured revolving credit facility and certain of our supply chain financing arrangements utilize LIBOR for the purpose of determining the interest rate on certain borrowings or the discount rate on the sale of trade accounts receivable, respectively.  In July 2017, the U.K. Financial Conduct Authority, which regulates LIBOR, announced that, after the end of 2021, it would no longer compel contributing banks to make rate submissions to the ICE Benchmark Administration (the “IBA”) for the purposes of setting LIBOR.  The cessation date for submission and publication of rates for certain tenors of LIBOR has since been extended by the IBA through June 2023; however, in early 2021, the United States Federal Reserve BoardWe have significant goodwill and other regulatory bodies issued guidance encouraging banksintangible assets, and other financial market participants to cease entering into new contracts that use U.S. dollar LIBOR as a reference rate as soon as practicable and in any event no later than December 31, 2021.  As a result, LIBOR will likely cease to be available or cease to be deemed an appropriate reference rate, and we will likely need to amend our credit agreement and supply chain financing arrangements to utilize an alternative reference rate based on the then prevailing market convention at the time.  Although we do not believe that the proposed phase-outfuture impairment of LIBOR will materially impact our business, financial condition or results of operations, we can provide no assurances that any such alternative reference rate will be similar to LIBOR, or produce the same value or economic equivalence of LIBOR, or have the same volume or liquidity as LIBOR prior to its discontinuance.

Risks Related to External Factors

Our business, results of operations and financial condition could be materially adversely affected by the effects of widespread public health crises, including the novel coronavirus (COVID-19) pandemic, that are beyond our control.

The global outbreak of the novel coronavirus (COVID-19) pandemic has created significant volatility, uncertainty and economic disruption in many countries in which we operate, including the United States, Mexico, Canada, Poland, Germany, Hungary and China, and could, in the future, have a material adverse effect on our business, results of operations and financial condition.  Ultimately, the duration and severity of the pandemic may vary depending on the characteristics of the virus and the public health response; therefore, the nature and extent of its impact on our business and operations may be uncertain and beyond our control.  Customer demand for our products and customer preferences regarding product mix and distribution channels could be impacted as a result of the COVID-19 pandemic, and significant uncertainty exists with respect to the potential future impact of the pandemic as well as a deterioration of general economic conditions, including rising inflation, disruptions in the supply chain and a possible national or global recession.

If customer demand were to decrease in future periods, or if customer preferences regarding product mix and distribution channels were to change, we may be required to adjust and reduce production volumes and implement cost reduction and cash preservation initiatives, including potential reductions in capital expenditures and employee furloughs, whichthese assets could have a material adverse impact on our business,financial condition and results of operations and financial condition.operations.

In certain countries in which we operate, national, state and local governments implemented a variety of   measures in 2020 in response to the COVID-19 pandemic, including by declaring states of emergency, restricting people from gathering in groups or interacting within a certain physical distance (i.e., social distancing), restricting or limiting the operations of businesses deemed to be non-essential, and imposing travel restrictions on individuals, including restrictions requiring individuals to stay at their place of residence except to perform certain activities deemed to be essential.  Many of these restrictions have been eased, however, there can be no guarantee that they will not be implemented in the future.  As we were deemed to be an essential business, throughout the pandemic we have been able to continue to perform, with certain modifications, all of the material operations at allA significant portion of our principal facilities, however, we can provide no assurances that we will be able to continue to perform such operations in the future without disruption, such as temporary closures,long-term assets consists of goodwill and other intangible assets recorded as a result of newpast acquisitions. We do not amortize goodwill and certain other intangible assets having indefinite lives, but rather test them for impairment on an annual basis or modificationsin interim periods if an event occurs or circumstances change that may indicate the fair value is below its carrying amount. The process of evaluating the potential impairment of goodwill and other intangible assets requires significant judgement, specifically with respect to existing governmental measures in responseapplying assumptions and estimates to the pandemic.  Any restrictionsanalysis of identifiable intangibles and long‑lived asset impairment including projecting revenues, interest rates, tax rates and the cost of capital.  Many of the factors used in assessing fair value are outside our control and it is reasonably likely that assumptions and estimates will change in future periods.  These changes could result in impairment charges against our goodwill and other intangible assets. In the event that we determine that our goodwill or limitations onother intangible assets are impaired, we may be required to record a significant charge to earnings that could adversely affect our ability to perform such operations in the future without disruption, such as temporary closures, as a result of governmental measures in response to the pandemic could have a material adverse effect on our business,financial condition and results of operations and financial condition.operations.

Furthermore, the COVID-19 pandemic could have a material adverse effect on the business, operations and financial condition of our customers, suppliers and other supply chain partners as a result of the governmental measures described above, disruptionsRisks Related to their business and operations for reasons similar to those described above, and their ability to manage and mitigate the adverse effects of these and other risks unique to their business and operations that may arise as a result of the pandemic.External Factors

We conduct our manufacturing and distribution operations on a worldwide basis and are subject to risks associated with doing business outside the United States.

We have manufacturing and distribution facilities in many countries, including Canada, Mexico, Poland, Germany and Hungary, as well as a joint-venturejoint-ventures in China.  Increasing our manufacturing footprint in low cost regions is an important element of our strategy.  There are a number of risks associated with doing business internationally, including: (a) exposure to local economic and political conditions; (b) social unrest such as risks of terrorism or other hostilities; (c) currency exchange rate fluctuations and currency controls; (d) the effect of potential changes in U.S. trade policy and international trade agreements; and (e) the potential for shortages of trained labor.

In particular, historically there has been social unrest in Hong Kong and Mexico and any recurrence, or increased violence in or around our facilities in such countries could be disruptive to our business operations at such facilities, or present risks to our employees who may be directly affected by the violence and may result in a decision by them to relocate from the area, or make it difficult for us to recruit or retain talented employees at such facilities.

Furthermore, changes in U.S. trade policy, particularly as it relates to China, have resulted in the assessment of increased tariffs on goods that we import into the United States, and have caused uncertainty about the future of free trade generally.  We benefit from free trade agreements, such as the U.S.-Mexico-Canada Agreement (USMCA).  The repeal or modification of the USMCA or further increases to tariffs on goods imported into the United States could increase our costs to source materials, component parts and finished goods from other countries.  The likelihood of such occurrences and their potential effect on us is unpredictable and may vary from country to country. Any such occurrences could be harmful to our business and our financial results.

23

We may incur liabilities under government regulations and environmental laws, which may have a material adverse effect on our business, financial condition and results of operations.

Domestic and foreign political developments and government laws and regulations directly affect automotive consumer products in the United States and abroad.  In the United States, these laws and regulations include standards relating to vehicle safety, fuel economy and emissions, among others.  Furthermore, increased public awareness and concern regarding climate change may result in new laws and regulations designed to reduce or mitigate the effects of greenhouse gas emissions or otherwise effect the transition to a lower-carbon economy.  The modification of existing laws, regulations or policies, or the adoption of new laws, regulations or policies could have a material adverse effect on our business, financial condition and results of operations.

Our operations and properties are subject to a wide variety of increasingly complex and stringent federal, state, local and international laws and regulations, including those governing the use, storage, handling, generation, treatment, emission, release, discharge and disposal of materials, substances and wastes, the remediation of contaminated soil and groundwater and the health and safety of employees. Such environmental laws, including but not limited to those under the Comprehensive Environmental Response Compensation & Liability Act, may impose joint and several liability and may apply to conditions at properties presently or formerly owned or operated by an entity or its predecessors, as well as to conditions at properties at which wastes or other contamination attributable to an entity or its predecessors have been sent or otherwise come to be located.

The nature of our operations exposes us to the risk of claims with respect to such matters, and we can give no assurance that violations of such laws have not occurred or will not occur or that material costs or liabilities will not be incurred in connection with such claims.  We are currently monitoring our environmental remediation efforts at one of our facilities and our reserve balance related to the environmental clean-up at this facility is $1.5$1.4 million at December 31, 2021.2023.  The environmental testing and any remediation costs at such facility may be covered by several insurance policies, although we can give no assurance that our insurance will cover any environmental remediation claims.  We also maintain insurance to cover our existing U.S. and Canadian facilities. We can give no assurance that the future cost of compliance with existing environmental laws and the liability for known environmental claims pursuant to such environmental laws will not give rise to additional significant expenditures or liabilities that would be material to us. In addition, future events, such as new information, changes in existing environmental laws or their interpretation, and more vigorous enforcement policies of federal, state or local regulatory agencies, may have a material adverse effect on our business, financial condition and results of operations.

Our future performance may be materially adversely affected by changes in technologies and improvements in the quality of new vehicle parts.

If we do not respond appropriately to changes in automotive technologies, such as the adoption of new technologies and systems to make traditional, ICEinternal-combustion-engine vehicles more efficient, or the adoption of electric or hybrid electric vehicle architectures, we could experience less demand for our products thereby causing a decline in our results of operations or deterioration in our business and financial condition, and we may have a material adverse effect on our long-term performance.

In addition, the size of the automobile replacement parts marketautomotive aftermarket depends, in part, upon the growth in number of vehicles on the road, increase in average vehicle age, change in total miles driven per year, new or modified environmental and vehicle safety regulations, including fuel economy and emissions reduction standards, increase in pricing of new cars and new car quality and related warranties.  The automobile replacement parts marketautomotive aftermarket has been negatively impacted by the fact that the quality of more recent automotive vehicles and their component parts (and related warranties) has improved, thereby lengthening the repair cycle.  Generally, if parts last longer, there will be less demand for our aftermarket products and the average useful life of automobileautomotive parts has been steadily increasing in recent years due to innovations in products and technology.  In addition, the introduction by original equipment manufacturers of increased warranty and maintenance initiatives has the potential to decrease the demand for our aftermarket products.  When proper maintenance and repair procedures are followed, newer air conditioning (A/C) systems in particular are less prone to leak resulting in fewer A/C system repairs.  These factors could have a material adverse effect on our business, financial condition and results of operations.

ITEM 1B.UNRESOLVED STAFF COMMENTS

None.

ITEM 1C.CYBERSECURITY

Cybersecurity Risk Management and Strategy

We maintain an enterprise-wide approach to risk management through which we identify, manage and mitigate significant risks, including those related to our information systems.  Our cybersecurity risk management program, which applies to our global operations, focuses on our people, processes and technology, and is designed to secure our information systems by preventing, detecting and responding to current and emerging cybersecurity threats.

Our employees are a key element of our cybersecurity risk management program.  All of our employees are required to adhere to our cybersecurity practices, and undertake routine training to raise awareness and reinforce safe practices.  Our training program includes bi-annual online training courses, group tabletop exercises, phishing and malicious email simulations, and information security bulletins.  We also maintain policies that govern, and provide specific guidance to employees regarding how they may use our information systems.

Another key element of our cybersecurity risk management program is our use of processes and technologies to create information security safeguards and controls, and target specific users or business needs.  Our processes and technologies include firewalls, email security software and encryption, endpoint detection and response, access controls, backup and recovery procedures, system patches and updates, vulnerability scanning, penetration testing by third party vendors, incident response procedures, and internal and external audits of our information systems.

Through these internal and external assessments, we continuously identify areas for remediation and opportunities to improve the security of our information systems, including by evaluating our program against industry standards and best practices, such as the Cybersecurity Framework established by the National Institute of Standards and Technology (NIST) and the CIS Critical Security Controls established by the Center for Internet Security. We also track key performance indicators that we believe are indicative of the effectiveness of our cybersecurity risk management program.

For additional information related to cybersecurity risks that could have a material and adverse effect on our business, financial condition or results of operations, see “Our operations could be adversely affected by interruptions or breaches in the security of our computer and information systems” in Item 1A of this Report.

Cybersecurity Governance

The Audit Committee of our Board of Directors oversees the adequacy and effectiveness of our internal controls, policies and procedures regarding cybersecurity, information security and data protection, and compliance with applicable laws and regulations concerning privacy. Our Chief Information Officer (“CIO”), in turn, is responsible for managing the Company’s cybersecurity risk management program and incident response procedures. On a quarterly basis, and more frequently as circumstances warrant, our CIO briefs the Audit Committee on our cybersecurity risks, our strategies for preventing, detecting, responding to and mitigating such risks, including the effectiveness of our incident response procedures, and our information security controls. Our CIO has extensive knowledge and expertise regarding our information systems and security, having served in a variety of senior information technology positions across our organization for more than thirty years, and as an executive officer of the Company since 2006.

Additionally, our CIO leads an incident response team (“IRT”), charged with the on-going management of our cybersecurity program. This team is responsible for the prevention, mitigation, detection and remediation of cybersecurity risks and incidents affecting our operations pursuant to our incident response procedures. The IRT is composed of information security professionals, who collectively bring decades of relevant information security and cybersecurity experience to their roles. In the event that a cybersecurity incident is detected, the IRT performs a multi-factor, risk-based assessment to determine the appropriate level of response. Depending upon the results of the assessment, including the nature and magnitude of the event, our incident response procedures provide for oversight and management of an incident by the IRT, under the direction of the CIO, or, in the event of escalation, under the direction of the executive officers of the Company, with reporting to and oversight by the Audit Committee.

ITEM 2.PROPERTIES

We maintain our executive offices in Long Island City, New York. The table below describes our principal facilities as of December 31, 2021.2023.

Location
 
State or
Country
 
Principal Business Activity
 
Approx.
Square
Feet
 
Owned or
Expiration
Date
of Lease

State or
Country

Principal Business Activity
Approx.
Square
Feet

Owned or
Expiration
Date
of Lease¹
                
   Engine Management       Vehicle Control    
        
Bialystok Poland 
Manufacturing
 154,800 2027
Disputanta VA 
Distribution
 411,000 Owned
Edwardsville KS 
Distribution
 363,500 Owned
Ft. Lauderdale
 FL 
Distribution
 23,300 Owned FL 
Distribution
 23,300 Owned
Ft. Lauderdale
 FL 
Distribution
 30,000 Owned FL 
Distribution
 30,000 Owned
Mishawaka
 IN 
Manufacturing
 153,100 Owned
Edwardsville
 KS 
Distribution
 363,500 Owned
Independence
 KS 
Manufacturing
 337,400 Owned
Greenville2
 SC 
Manufacturing
 184,500 Owned
Independence2
 KS 
Manufacturing
 337,400 Owned
Long Island City
 NY 
Administration
 75,800 2023 NY 
Administration
 75,800 2033
Greenville
 SC 
Manufacturing
 184,500 Owned
Disputanta
 VA 
Distribution
 411,000 Owned
McAllen TX 
Distribution
 120,300 2027
Mishawaka2
 IN 
Manufacturing
 153,100 Owned
Reynosa2
 Mexico 
Manufacturing
 175,000 2025
Reynosa2
 Mexico 
Manufacturing
 153,000 2031
Shawnee3
 KS 
Distribution
 574,700 2033
        
   Temperature Control    
Foshan City China 
Manufacturing
 361,500 2028
Lewisville TX 
Administration and Distribution
 415,000 2034
Reynosa2
 Mexico 
Manufacturing
 82,000 2026
Reynosa2
 Mexico 
Manufacturing
 117,500 2026
Reynosa
 Mexico 
Manufacturing
 175,000 2025 Mexico 
Manufacturing
 111,800 2024
Reynosa
 Mexico 
Manufacturing
 153,000 2023
Bialystok
 Poland 
Manufacturing
 142,400 2027
Sheboygan Falls
 WI 
Manufacturing
       22,000 2025
Milwaukee
 WI 
Manufacturing
 84,000 2028
Tijuana
 Mexico 
Manufacturing
 37,500 2023
St. Thomas Canada 
Manufacturing
 42,500 Owned
        
   Engineered Solutions    
Kirchheim-Teck
 Germany 
Distribution
 27,500 2031 Germany 
Distribution
 27,500 2031
Pécel
 Hungary 
Manufacturing
       52,400 2031 Hungary 
Manufacturing
       59,500 Owned
Milwaukee WI 
Manufacturing
 84,000 2028
Sheboygan Falls WI 
Manufacturing
       22,500 2025
Tijuana Mexico 
Distribution
 13,800 2026
Tijuana Mexico 
Manufacturing
 30,400 2026
Wuxi
 China 
Manufacturing
 27,600 2023 China 
Manufacturing
 27,600 2029
        
   Temperature Control    
        
Lewisville
 TX 
Administration and Distribution
 415,000 2024
St. Thomas
 Canada 
Manufacturing
 40,000 Owned
Reynosa
 Mexico 
Manufacturing
 82,000 2026
Reynosa
 Mexico 
Manufacturing
 117,500 2026
Reynosa
 Mexico 
Manufacturing
 111,800 2024
        
   Other    
           Other
    
Mississauga
 Canada 
Administration and Distribution
 82,400 2023 Canada 
Administration and Distribution
 82,400 2028
Irving
 TX 
Training Center
 13,400 2027 TX 
Training Center
 13,400 2027

1 It is our intention to extend the leases that are set to expire in 2024.
2 These facilities are also utilized by the Engineered Solutions operating segment.
3 This facility is expected to have a phased opening beginning in 2024 and be fully operational in early 2025, and once operational, it will also be utilized by the Temperature Control and Engineered Solutions operating segments.

ITEM 3.LEGAL PROCEEDINGS

The information required by this Item is incorporated herein by reference to the information set forth in Item 8, “Financial Statements and Supplementary Data” of this Report under the captionscaption “Asbestos” and “Other Litigation” appearing in Note 21,23, “Commitments and Contingencies” of the Notes to Consolidated Financial Statements in Item 8 of this Report.

ITEM 4.MINE SAFETY DISCLOSURES

Not applicable.

PART II

ITEM 5.MARKET FOR THE REGISTRANT’S COMMON EQUITY, RELATED STOCKHOLDER MATTERS AND ISSUER PURCHASES OF EQUITY SECURITIES

Our common stock trades publicly on the New York Stock Exchange (“NYSE”) under the trading symbol “SMP.”  The last reported sale price of our common stock on the NYSE on February 17, 202220, 2024 was $47.63$40.23 per share.  As of February 17, 2022,20, 2024, there were 507497 holders of record of our common stock.
 
Dividends are declared and paid on the common stock at the discretion of our Board of Directors (the “Board”) and depend on our profitability, financial condition, capital needs, future prospects, and other factors deemed relevant by our Board.  Our revolving credit facilityCredit Agreement permits dividends and distributions by us provided specific conditions are met.  For information related to our revolving credit facility,Credit Agreement, see Note 11, “Credit Facilities and Long-Term Debt,” of the Notes to Consolidated Financial Statements in Item 8 of this Report.
 
There have been no unregistered offerings of our common stock during the fourth quarter of 2021.2023.
 
Purchases of Equity Securities by the Issuer and Affiliated Purchasers
For information related to our stock repurchases, see Note 12, “Stockholders’ Equity,” of the Notes to Consolidated Financial Statements in Item 8 of this Report.
The following table provides information relating to the Company’s purchases of its common stock for the fourth quarter of 2021:

Period 
Total Number of
Shares Purchased
(1)
  
Average
Price Paid
Per Share
  
Total Number of
Shares Purchased
as Part of Publicly
Announced Plans
or Programs (2)
  
Maximum Number (or
Approximate Dollar
Value) of Shares that
may yet be Purchased
Under the Plans or
Programs (2)
 
             
October 1-31, 2021  
  
$
   
  
$
 
November 1-30, 2021  
6,000
   
49.04
   
6,000
   
29,705,754
 
December 1-31, 2021  
1,000
   
47.69
   
1,000
   
29,656,062
 
Total  7,000  $49.13   7,000  $29,656,062 


(1)
All shares were purchased through the publicly announced stock repurchase programs in open-market transactions.

(2)
In October 2021, our Board of Directors authorized the purchase of up to $30 million of our common stock under a stock repurchase program.  Stock will be purchased from time to time, in the open market, or through private transactions, as market conditions warrant.  Under this program, during the fourth quarter of 2021, we repurchased 7,000 shares of our common stock at a total cost of $0.3 million.  During the year ended December 31, 2021, additional stock repurchases of 615,265 shares were made at a total cost of $26.5 million under prior Board of Directors authorizations, which are now fully completed.

As of December 31, 2021, there was approximately $29.7 million available for future stock purchases under the October 2021 program.  During the period from January 1, 2022 through February 17, 2022, we have repurchased an additional 64,482 shares of our common stock at a total cost of $3.1 million, thereby reducing the availability under the program to $26.6 million.

2726

Stock Performance Graph
 
The following graph compares the five year cumulative total return on the Company’s Common Stock to the total returns on the Standard & Poor’s 500 Stock Index and the S&P 1500 Auto Parts & Equipment Index, which is a combination of automotive parts and equipment companies within the S&P 400, the S&P 500 and the S&P 600.  The graph shows the change in value of a $100 investment in the Company’s Common Stock and each of the above indices on December 31, 20162018 and the reinvestment of all dividends. The comparisons in this table are required by the Securities and Exchange Commission and are not intended to forecast or be indicative of possible future performance of the Company’s Common Stock or the referenced indices.
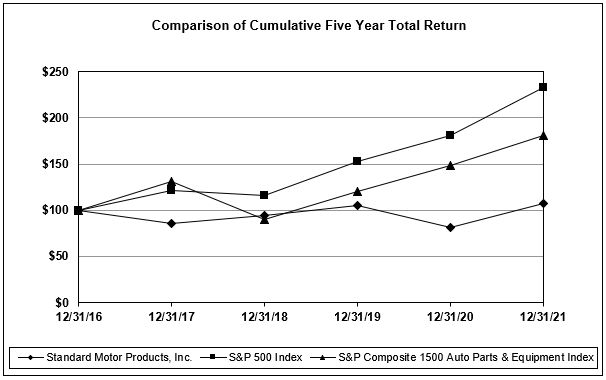
graphic    graphic

 
SMP
  
S&P 500
  
S&P 1500 Auto
Parts &
Equipment
Index
 SMP S&P 500 
S&P 1500 Auto
Parts &
Equipment
Index
2016 100  100  100 
2017 86  122  132 
2018 94  116  90 100 100 100
2019 105  153  121 112 131 133
2020 81  181  148 86 156 164
2021 107  233  182 114 200 201
2022
78 164 136
2023
92 207 145

* Source: S&P Capital IQ

28
27

ITEM 6.(RESERVED)

ITEM 7.MANAGEMENT’S DISCUSSION AND ANALYSIS OF FINANCIAL CONDITION AND RESULTS OF OPERATIONS
 
Overview

We are a leading manufacturer and distributor of premium replacement parts utilized in the maintenance, repair and service of vehicles in the automotive aftermarket industry. In addition, we continue to increase our supplier capabilities with a complementary focus on specialized original equipment parts for manufacturers across multiple industries such as agriculture, heavy duty, and construction equipment. We believe that our extensive design and engineering capabilities have afforded us opportunities to expand our product coverage in our aftermarket business and enter newer specialized markets that require application-specific knowledge, such as those mentioned above.
We are organized into two operating segments.  Each segment is focused on different product categories and with providing our customers with full-line coverage of its products, a full suite of complementary services that are tailored to our customers’ business needs, and with driving end-user demand for our products.  We sell our products primarily to automotive aftermarket retailers, program distribution groups, warehouse distributors, original equipment manufacturers and original equipment service part operations in the United States, Canada, Europe, Asia, Mexico and other Latin American countries.

Overview of Financial Performance

The following discussion should be read in conjunction with our consolidated financial statements and the notes thereto. This discussion summarizes the significant factors affecting our results of operations and the financial condition of our business during each of the fiscal years in the three-year period ended December 31, 2021.2023.

 December 31,  December 31, 
(In thousands, except per share data) 2021  2020  2019  2023  2022  2021 
                  
Net sales 
$
1,298,816
  
$
1,128,588
  
$
1,137,913
  
$
1,358,272
  
$
1,371,815
  
$
1,298,816
 
Gross profit 
376,931
  
336,655
  
331,800
  
388,826
  
382,539
  
376,931
 
Gross profit % 
29
%
 
29.8
%
 
29.2
%
 
28.6
%
 
27.9
%
 
29
%
Operating income 
128,999
  
108,895
  
94,495
  
92,677
  
104,135
  
128,999
 
Operating income % 
9.9
%
 
9.6
%
 
8.3
%
 
6.8
%
 
7.6
%
 
9.9
%
Earnings from continuing operations before income taxes 
130,465
  
107,379
  
91,796
  
81,716
  
98,332
  
130,465
 
Provision for income taxes 
31,044
  
26,962
  
22,745
  
18,368
  
25,206
  
31,044
 
Earnings from continuing operations 
99,421
  
80,417
  
69,051
  
63,348
  
73,126
  
99,421
 
Loss from discontinued operations, net of income taxes 
(8,467
)
 
(23,024
)
 
(11,134
)
 
(28,996
)
 
(17,691
)
 
(8,467
)
Net earnings 
90,954
  
57,393
  
57,917
  
34,352
  
55,435
  
90,954
 
Net earnings attributable to
noncontrolling interest
 
68


204
  
84
  
68
 
Net earnings attributable to SMP 
90,886
  
57,393
  
57,917
  
34,148
  
55,351
  
90,886
 
Per share data attributable to SMP – Diluted:                  
Earnings from continuing operations 
$
4.39
  
$
3.52
  
$
3.03
  
$
2.85
  
$
3.30
  
$
4.39
 
Discontinued operations  
(0.37
)
  
(1.01
)
  
(0.49
)
  
(1.31
)
  
(0.80
)
  
(0.37
)
Net earnings per common share 
$
4.02
  
$
2.51
  
$
2.54
  
$
1.54
  
$
2.50
  
$
4.02
 

The post COVID-19 sales momentum we experienced in the second half of 2020 carried over into 2021 resulting in recordConsolidated net sales and earnings from continuing operations.  We experienced strong demand across all our product categories as well asfor 2023 were $1,358.3 million, a more normalized seasonal trend consistent with years prior to 2020.
Net sales for 2021 were $1,298.8 million, an increasedecrease of $170.2$13.5 million, or 15.1%1% compared to net sales of $1,128.6$1,371.8 million in 2020, and an increase of $160.92022; while consolidated net sales for 2022 increased $73 million, or 14.1%5.6%, compared to net sales of $1,137.9$1,298.8 million in 2019.
The increase2021.  Consolidated net sales decreased in our Vehicle Control and Temperature Control operating segments, while net sales in 2021our Engineered Solutions operating segment increased when compared to the comparable period in the prior year.
Our net sales performance in 2023 reflects the favorable impact of multiple factors including:
 
successfullower sales in our Vehicle Control operating segment reflecting the impact of lower sales to a customer initiativesthat filed for bankruptcy in the marketplace,
first quarter, as well as the phase-in of new business wins,
beneficial summer weather,
continued strong customer demand as evidenced by robust customer POS and fueled by the replenishment of customer inventory levels,
the partialnegative impact of price increases in thelower customer pipeline orders and softer fourth quarter of the year, which were implemented to pass through inflationary increases in raw materials, freight and labor costs, and
incremental net sales, from our soot sensor, Trombetta and Stabil acquisitions.
 
The combination of the above factors more than offset
lower sales in our Temperature Control operating segment reflecting the impact of lost revenue relateda slow start to the decisionseason caused by a rainy spring and cool early summer temperatures across key markets. Although customer demand and net sales increased significantly in the third quarter of a large retail customer2023 as summer temperatures increased, the strong third quarter 2023 net sales were not enough to pursue a private brand strategy in December 2020.offset the slow start to the season, and
 
strong demand and new business wins in our Engineered Solutions operating segment with continued optimism about the long-term growth potential of the complementary markets served in this newly created segment.
Gross marginmargins as a percentage of net sales in 20212023 was 29%28.6% as compared to 29.8%27.9% in 20202022.  The gross margin percentages in 2023 increased year-over-year in each of our Vehicle Control, Temperature Control and 29.2%Engineered Solutions operating segments.  Overall, the gross margin increase as a percentage of sales in 2019.  Gross margins2023 reflects the positive impact of increased pricing, improved operating performance, and the favorable customer sales mix in the first half of 2021 were favorably impacted by greater fixed cost absorption due to higher production volumesEngineered Solutions, which more than offset ongoing inflationary increases in certain raw materials, labor and transportation costs, as we increased inventories to meetwell as the strong customer demand.  The strong gross margins achieved in the first half of 2021 were offset by some compression in the second half of 2021 caused by several factors including lower fixed cost absorption due to lower production levels than those achieved in the second half of 2020, inflationary cost increases in certain raw materials, labor and elevated transportation expense,2022 as we worked down inventory levels, and the higher mixweakening of heavy duty parts sales fromthe U.S. dollar on our recent acquisitions, which have a different margin profile than our aftermarket business with lower gross margins but comparable operating margin.international operations.  While we anticipate continued margin pressure resulting from inflationary headwinds, we believe that our annual cost savings initiatives coupled with our ability to pass through higher prices to our customers should help to offset much of this impact to our gross margins.

Operating margin as a percentage of net sales in 20212023 was 9.9%6.8% as compared to 9.6%7.6% in 2020 and 8.3% in 2019.  Our operating margins in 2021 were favorably impacted by higher net sales.2022.  Included in our operating margin were selling, general and administrative expenses (“SG&A”) of $293.6 million, or 21.6% of net sales in 2023, $276.6 million, or 20.2% of net sales in 2022, and $247.5 million, or 19.1% of net sales in 2021, $224.7 million, or 19.9% of net sales in 2020, and $234.7 million, or 20.6% of net sales in 2019.2021.  The higher SG&A expenses in 2021 resulted2023 is principally from elevated distribution costs associated with higher sales volumes as well asdue to the impact of increased freight(1) higher interest rate related costs of $14 million incurred in our supply chain financing arrangements and (2) higher employee compensationdistribution costs, andall of which more than offset the positive 2023 comparative impact of the $7 million charge recorded in 2022 to reduce our outstanding accounts receivable balance from a customer that filed for bankruptcy in the first quarter of 2023 to our estimated recoverable amount.  Excluding the impact of the incremental interest rate costs incurred in our supply chain financing arrangements, SG&A expenses from our soot sensor, Trombetta and Stabil acquisitions.  We anticipate that our future operating margins will be in line with the operating margins achievedyear ended December 31, 2023 were 20.6% of consolidated net sales, just slightly higher than the percentage in 2021 and 2020.the comparable prior year period.

Overall, our financial results in 2021 were extremely strong.  We posting record net sales and earnings from continuing operations and achieving substantial new business wins with existing customers.  Our core automotive aftermarket business remains strong, and we have made major strides into newcontinue to be optimistic about the long-term growth potential of the complementary markets with upside potential.served in our Engineered Solutions operating segment.

Recent Strategic AcquisitionsNew Distribution Facility in Shawnee, Kansas

As partIn May 2023, we signed a lease for a new distribution facility in Shawnee, Kansas with a lease commencement date of July 1, 2023.  The new facility will expand our strategic plan for diversification and growth beyondtotal distribution network square footage to meet our coregrowing demands in the automotive aftermarket business,industry.  The new 575,000 square foot facility will replace our current 363,000 square foot facility in Edwardsville, Kansas, and integrate state-of-the-art technologies to further expand internationally withdeliver improved logistics capabilities, operational efficiencies, as well as enhanced employee, customer and supplier experiences.  The new facility is located just five miles away from our Edwardsville facility, enabling us to retain our existing workforce avoiding the additional costs of hiring and training. The facility will have a focus onphased opening beginning in 2024 and be fully operational in early 2025.  We will incur additional costs in 2023 and 2024 during the European market,phase-in period while we completed three acquisitions in 2021. The acquisitions continue to increase our supplier capabilities with a complementary focus on specialized original equipment parts to manufacturers across multiple industries such as mediumoperate the two facilities.

Impact of Russia’s Invasion of the Ukraine

Russia’s invasion of the Ukraine, and heavy duty vehicles, construction and agricultural equipment, power sports,the resultant sanctions imposed by the U.S. and other sub-segments.  In additiongovernments, have created risks, uncertainties and disruptions impacting business continuity, liquidity and asset values not only in the Ukraine and Russia, but in markets worldwide. Significant price increases have occurred in gas and energy markets, as well as in other commodities. Although we have no facilities or business operations in either the Ukraine or Russia, have historically had only minor sales to expanding beyond our core automotive aftermarket business, it also provided geographic expansion ascustomers in Russia, which we now have meaningful footprints to grow salessubsequently discontinued, and have not experienced additional significant disruptions in Europethe supply chain, the inherent risks and Asia.

As we integrate these businesses, we will be able to take advantage of shared customer lists, product portfolios,uncertainties surrounding the invasion are being closely monitored. We have manufacturing and engineering capabilities,distribution facilities in Bialystok, Poland and geographic reach.  Many of the productsPecel, Hungary. Our facility in the acquired businesses are either power-train neutral,Bialystok, Poland does not use natural gas in its production process, or are geared toward electric and alternative energy vehiclesfor heating, and, as such, is not limitedimpacted by Russia’s decision to applications on internal combustion engine (“ICE”), providing potential synergieshalt the export of all natural gas to Poland and future sales growth opportunities in non-internal combustion engine applications.  After these acquisitions,Bulgaria. While we estimatehave not been impacted by the war to date, there can be no assurances that approximately half of our product offering is power-train neutral, or suitable for electric, hybrid electric and/or alternative energy vehicles.  Following is a brief summaryany escalation of the acquired businesses.
In March 2021, we acquired certain Soot Sensor product lines from Stoneridge, Inc. for $2.9 million. The product line assets acquired manufacture sensors used in the exhaust and emission systems of diesel engines. The acquisition isinvasion will not have an excellent fit for our strategy of expansion into the heavy duty market.
In May 2021, we acquired 100% of the capital stock of Trumpet Holdings, Inc., a Delaware corporation, (more commonly known as “Trombetta”), for $111.7 million.  Trombetta has manufacturing facilities in Milwaukee, Wisconsin; Sheboygan Falls, Wisconsin; Tijuana, Mexico, as well as a 70% ownership in a joint venture in Hong Kong, with operations in Shanghai and Wuxi, China (“Trombetta Asia, Ltd.”).  Trombetta is a worldwide leader in power switching and power management products and has a long history of supplying high-quality products to a broad group of blue-chip customers across multiple commercial vehicle and off-highway channels, including heavy truck, construction, agricultural, electric vehicle and power sports markets.  Few of Trombetta’s products are powertrain-related and thus unaffected by the shift from internal combustion engines.  We believe that the combination of Trombetta, along with our existing businesses will create a critical mass that can be a powerful force for growth.
In September 2021, we acquired 100% of the capital stock of Stabil Operative Group GmbH, a German company (“Stabil”), for Euros 13.7 million, or $16.3 million, subject to certain post-closing adjustments.  Stabil is a manufacturer and distributor of a variety of components, including electronic sensors, control units, and clamping devices to the European market, serving both commercial and light vehicle applications.  The acquired Stabil business is headquartered on the outskirts of Stuttgart, Germany with facilities in Germany and Hungary. The acquisition is an excellent fit for our strategy of expansion beyond our core aftermarket business into complementary areas, and gives us exposure to a diversified group of blue chip European commercial and light vehicle customers.
For additional information on our recent acquisitions, see Note 2, “Business Acquisitions and Investments,” of the Notes to Consolidated Financial Statements in Item 8 of this Report.
Impact of the Coronavirus (“COVID-19”)

On an ongoing basis, we continue to monitor theadverse impact if any, of COVID-19 on the global economy, our industry, business, and the markets that we serve.  In response to the COVID-19 pandemic, in 2020, we established a committee, comprised of our executive officers, to oversee the Company’s risk identification, management and mitigation strategies regarding the impact of the pandemic on our business and operations.  The committee continues to meet on a regular basis, monitoring events related to the pandemic and any appropriate actions to be taken.  Among the issues that are actively being monitored by the committee are the general state of economic conditions, governmental measures in response to the pandemic, the spread of the delta and omicron variants, and the enactment of policies and practices to ensure the health and safety of our employees, contractors and customers, as well as customer demand for our products and any potential disruptions in our supply chain.
As related to the performance of our business, we were declared an essential business under national and regional shelter-in-place orders and, as such, our business operations continued throughout 2020.  After a downturn in net sales initially in the second quarter of 2020, customer orders strengthened in the last half of the second quarter and continued throughout 2020, resulting in strong net sales for the year ended December 31, 2020.  The net sales momentum continued into 2021, as we experienced strong demand for our products, and a seasonal trend that was more in line with years prior to 2020.
Although our business remains strong and we continue to monitor the impact of the pandemic, any uncertain future effect of the pandemic may have a material adverse effect on our business, financial condition and results of operations.

31
29

Impact of Global Supply Chain Disruption and Inflation

Disruptions in the global economy in 2020 and the lingering impacts into 2021 have impeded global supply chains, resulted in longer lead times and delays in procuring component parts and raw materials, and resulted in inflationary cost increases in certain raw materials, labor and transportation.  In response to the global supply chain volatility and inflationary cost increases, we have taken, and continue to take, several actions to mitigate the impact by working closely with our suppliers and customers to minimize any potential adverse impacts on our business, including implementing cost savings initiatives and the pass through of higher costs to our customers which began in the fourth quarterform of 2021.price increases, and maintaining inventory at levels to minimize potential disruptions from out-of-stock raw materials and components to ensure higher fill rates with our customers.  We believe that we have also benefited from our geographically diversified manufacturing footprint and our strategy to bring more product manufacturing in-house, especially with respect to product availability and fill rates.  We expect these inflationary trends to continue for some time, and while we believe that we will be able to somewhat offset the impact, there can be no assurances that unforeseen future events in the global supply chain affecting the availability of materials and components, and/or increasing commodity pricing, will not have a materialan adverse effect on our business, financial condition and results of operations.

Impact of Changes in U.S. Trade Policy

Changes in U.S. trade policy, particularly as it relates to China, as with much of our industry, have resulted in the assessment of increased tariffs on goods that we, as with much of our industry, import into the United States.  Although our operating results in 2021 have been only slightly impacted by the tariff costs associated with Chinese sourced products (due to our diversified manufacturing and distribution footprint), we have taken, and continue to take, several actions to mitigate the impact of the increased tariffs, including but not limited to, price increases to our customers.  We do not anticipate that the increased tariffs will have a significant impact on our future operating results.  Although we are confident that we will be able to pass along the impact of the increased tariffs to our customers, there can be no assurances that we will be able to pass on the entire increased costs imposed by the tariffs.

Environmental, Social, & Governance (“ESG”)

Our Company was founded in 1919 on the values of integrity, common decency and respect for others.  These values continue to this day and are embodied in our Code of Ethics, which has been adopted by the Board of Directors of the Company to serve as a statement of principles to guide our decision-making and reinforce our commitment to these values in all aspects of our business.  These values also serve as the foundation for our increased focus on many important environmental, social and governance issues, such as environmental stewardship and our efforts to identify and implement practices that reduce our environmental impact while achieving our business goals; our attention to diversity, equity and inclusion, employee development, retention, and health and safety; and our community engagement initiatives, to name a few.  We have made significant strides building awareness of the environmental impact of our operations, and challenging ourselves to reduce our impact by reducing our consumption of energy and generation of waste, as well as enhancing our recycling efforts.

Additionally, we realize the intricate role our employees play to the overall success of our business.  Their health and happiness is important, and we continue to look for ways to address their needs and the needs of their families.  For example, in 2021 we conducted several surveys on employee engagement, employee satisfaction, and diversity, equity and inclusion to gain a deeper understanding of our employees’ well-being so as to ensure that the company’s culture remains strong.

Comparison of Results of Operations For Fiscal Years 20212023 and 20202022
 
Sales.  Consolidated net sales for 20212023 were $1,298.8$1,358.3 million, an increasea decrease of $170.2$13.5 million, or 15.1%1%, compared to $1,128.6$1,371.8 million in the same period of 2020.  Consolidated net sales increased in both our Engine Management and Temperature Control Segments,2022, with the majority of our net sales to customers located in the United States.
Consolidated net sales decreased in 2020 were adversely impacted in the first half of 2020 by the COVID-19 pandemic,our Vehicle Control and were followed by strongTemperature Control operating segments, while net sales in our Engineered Solutions operating segment increased when compared to the second half of 2020, as our business improved to pre-COVID-19 levels with our customers’ POS sales exceeding their comparable levelsperiod in the prior periods.year.
 
The following table summarizes consolidated net sales by segment and by major product group within each segment for the years ended December 31, 20212023 and 20202022 (in thousands):
 
  Year Ended December 31, 
  2021  2020 
Engine Management:      
Ignition, Emission Control, Fuel & Safety Related System Products 
$
786,514
  
$
691,722
 
Wire and Cable  
151,422
   
143,963
 
Total Engine Management
  
937,936
   
835,685


Temperature Control:        
Compressors
  
206,697
   
163,071
 
Other Climate Control Parts  
141,726
   
118,883
 
Total Temperature Control
  
348,423
   
281,954
 
         
All Other  
12,457
   
10,949
 
         
Total
 
$
1,298,816
  
$
1,128,588
 
  Year Ended December 31, 
  2023  2022 
Vehicle Control      
Engine Management (Ignition, Emissions and Fuel Delivery) 
$
450,180
  
$
454,571
 
Electrical and Safety  
221,782
   
230,487
 
Wire Sets and Other  
65,970
   
65,513
 
Total Vehicle Control  
737,932
   
750,571
 
         
Temperature Control        
AC System Components  
237,756
   
245,484
 
Other Thermal Components  
99,998
   
105,753
 
Total Temperature Control  
337,754
   
351,237
 
         
Engineered Solutions        
Commercial Vehicle  
83,025
   
80,275
 
Construction/Agriculture  
43,402
   
42,385
 
Light Vehicle  
92,759
   
91,533
 
All Other  
63,400
   
55,814
 
Total Engineered Solutions  
282,586
   
270,007
 
         
Other  


Total 
$
1,358,272
  
$
1,371,815
 

Engine Management’s net sales increased $102.3 million, or 12.2%, to $937.9 million for the year ended December 31, 2021.  Net sales in ignition, emission control, fuel and safety related system products for the year ended December 31, 2021 were $786.5 million, an increase of $94.8 million, or 13.7%, compared to $691.7 million in the same period of 2020.  Net sales in the wire and cable product group for the year ended December 31, 2021 were $151.4 million, an increase of $7.5 million, or 5.2%, compared to $144 million in the same period of 2020.  Engine Management’s increase inVehicle Control’s net sales for the year ended December 31, 20212023 decreased $12.7 million, or 1.7%, to $737.9 million compared to the same period in 2020, reflects the impact of successful customer initiatives in the marketplace, the phase-in of new business wins, continued strong customer demand as evidenced by robust customer POS, the partial impact of price increases in the fourth quarter of the year, which were implemented to pass through inflationary increases in raw materials, freight and labor costs, and incremental net sales from our soot sensor, Trombetta and Stabil acquisitions, along with the favorable year-over-year impact of having lower net sales in the first part of 2020 due to the general weakness in the economy caused by the COVID-19 pandemic.  The favorable net sales results achieved by Engine Management in 2021 more than offset the impact of the lower net sales from the decision, in December 2020, of a large retail customer to pursue a private brand strategy.
Incremental net sales from our soot sensor, Trombetta and Stabil acquisitions of $54.3 million were included in the net sales of the ignition, emission control, fuel and safety related system product group from the date of acquisition through December 31, 2021.  Compared to the year ended December 31, 2020, excluding the incremental net sales from the acquisitions, net sales in the ignition, emission control, fuel and safety related product group increased $40.5 million, or 5.9%, and Engine Management net sales increased $48 million, or 5.7%.
Temperature Control’s net sales increased $66.5 million, or 23.6%, to $348.4 million for the year ended December 31, 2021.  Net sales in the compressors product group for the year ended December 31, 2021 were $206.7 million, an increase of $43.6 million, or 26.7%, compared to $163.1$750.6 million in the same period of 2020.  Net2022.  The decrease in net sales in our Vehicle Control operating segment reflects the other climate control parts groupimpact of lower sales to a customer that filed for bankruptcy in the year ended December 31, 2021 were $141.7 million, an increasefirst quarter of $22.8 million, or 19.2%, compared to $118.9 million for2023, as well as the year ended December 31, 2020.  negative impact of lower customer pipeline orders in 2023 and softer fourth quarter sales.
Temperature Control’s increase in net sales for the year ended December 31, 2021, when2023 decreased $13.4 million, or 3.8%, to $337.8 million compared to $351.2 million in the same period in 2020,of 2022.  The lower year-over-year Temperature Control net sales reflects the impact of continueda slow start to the season caused by a rainy spring and cool early summer temperatures across key markets which negatively impacted first and second quarter 2023 net sales.  After the slow start to the season, demand increased significantly in the third quarter of 2023 as summer temperatures increased.  The result was strong customer demand stemming from the impact of very warm summer weather conditions and the replenishment of customer inventory levels, along with the favorable year-over-year impact of having lowerthird quarter 2023 net sales, inwhich was not enough to offset the first part of 2020 dueslow start to the general weakness in the economy caused by the COVID-19 pandemic.season. Demand for our Temperature Control products may vary significantly with summer weather conditions and customer inventory levels.
Engineered Solutions’ net sales for the year ended December 31, 2023 increased $12.6 million, or 4.7%, to $282.6 million compared to $270 million in the same period of 2022.  Overall, net sales in our Engineered Solutions operating segment showed year-over-year improvement driven by strong demand and new business wins, and we continue to be optimistic about the long-term growth potential of the complementary markets served in our newly created Engineered Solutions operating segment.
Gross Margins.  Gross margins, as a percentage of consolidated net sales, increased to 28.6% for 2023, compared to 27.9% for 2022.  The following table summarizes gross margins by segment for the years ended December 31, 2023 and 2022, respectively (in thousands):

Year Ended
December 31,
 
Vehicle
Control
  
Temperature
Control
  
Engineered
Solutions
  Other  Total 
2023               
Net sales 
$
737,932
  
$
337,754
  
$
282,586
  
$
  
$
1,358,272
 
Gross margins  
238,215
   
95,827
   
54,784
   
   
388,826
 
Gross margin percentage  
32.3
%
  
28.4
%
  
19.4
%
  
   
28.6
%
                     
2022                    
Net sales 
$
750,571
  
$
351,237
  
$
270,007
  
$
  
$
1,371,815
 
Gross margins  
232,267
   
98,913
   
51,359
   
   
382,539
 
Gross margin percentage  
30.9
%
  
28.2
%
  
19
%
  
   
27.9
%

Compared to 2022, gross margins at Vehicle Control increased 1.4 percentage points from 30.9% to 32.3%. Gross margins at Temperature Control increased 0.2 percentage points from 28.2% to 28.4%, and gross margins at Engineered Solutions increased 0.4 percentage points from 19% to 19.4%.

The gross margin percentage increase in our Vehicle Control operating segment reflects the positive impact of increased pricing and operating performance, which more than offset increases in material and labor costs, as well as the lower fixed cost absorption due to lower production levels than those achieved in the same period in 2022.  The gross margin percentage increase in our Temperature Control operating segment reflects the impact increased pricing and operating performance; while the gross margin percentage increase at our Engineered Solutions operating segment is driven primarily by favorable customer sales mix and increased pricing.  All of our operating segments were negatively impacted by the ongoing inflationary cost increases in certain raw materials, labor and transportation expenses.  While we anticipate continued margin pressure resulting from inflationary headwinds, we believe that our annual cost savings initiatives coupled with our ability to pass through higher prices to our customers should help to offset much of this impact to our gross margins.

Selling, General and Administrative Expenses.  Selling, general and administrative expenses (“SG&A”) increased to $293.6 million, or 21.6% of consolidated net sales in 2023, as compared to $276.6 million, or 20.2% of consolidated net sales in 2022.  The $17 million increase in SG&A expenses as compared to 2022 is principally due to the impact of (1) higher interest related costs of $14 million incurred in our supply chain financing arrangements and (2) higher distribution cost, all of which more than offset the positive 2023 comparative impact of the $7 million charge recorded in 2022 to reduce our outstanding accounts receivable balance from one of our customers that filed a petition for bankruptcy in January 2023 to our estimated recovery amount.  Excluding the impact of the incremental interest rate costs incurred in our supply chain financing arrangements, SG&A expenses in 2023 were 20.6% of consolidated net sales, slightly higher than the percentage in the comparable prior year period.

Restructuring and Integration Expenses.  Restructuring and integration expenses were $2.6 million in 2023 compared to restructuring and integration expenses of $1.9 million in 2022.  Restructuring and integration expenses in 2023 consists of (1) the $2.5 million of costs incurred in our 2022 cost reduction initiative, and (2) the $0.1 million increase in environmental cleanup costs for ongoing remediation in connection with the prior closure of our manufacturing operations at our Long Island City, New York location; while 2022 expenses consists of (1) costs of $1.5 million incurred in our 2022 cost reduction initiative, (2) relocation expenses of $0.2 million of certain inventory, machinery, and equipment acquired in our 2021 soot sensor acquisition to our facilities in Independence, Kansas and Bialystok, Poland, and (3) the $0.2 million increase in environmental cleanup costs for ongoing remediation in connection with the prior closure of our manufacturing operations at our Long Island City, New York location.

During the fourth quarter of 2022, to further our ongoing efforts to improve operating efficiencies and reduce costs, we announced plans for a reduction in our sales force, and initiated plans to relocate certain product lines from our Independence, Kansas manufacturing facility and from our St. Thomas, Canada manufacturing facility to our manufacturing facilities in Reynosa, Mexico.  Total restructuring and integration expenses related to the initiative were $2.5 million and $1.5 million 2023 and 2022, respectively.  Expenses related to the initiative for the year ended December 31, 2023 consist of (1) expenses of approximately $0.7 million related to a further sales force reduction, (2) expenses of $1.3 million of employee severance and bonuses related to our product line relocations, and (3) expenses of $0.5 million related to the relocation of machinery and equipment to our manufacturing facilities in Reynosa, Mexico.  Expenses related to the initiative for the year ended December 31, 2022 consist of (1) expenses of $0.9 million related to our sales force reduction, and (2) expenses of $0.6 million consisting of employee severance related to our product line relocations.  Additional restructuring costs related to the initiative, and expected to be incurred, are approximately $0.5 million.  We anticipate that the Cost Reduction Initiative will be completed by the end of the second quarter of 2024.

Operating Income.  Operating income was $92.7 million, or 6.8%, of consolidated net sales in 2023, compared to $104.1 million, or 7.6%, of consolidated net sales in 2022.  The year-over-year decrease in operating income of $11.4 million is the result of lower net sales, higher SG&A expenses, consisting primarily of higher interest rate related costs of $14 million incurred in our supply chain financing arrangements, and higher restructuring and integration expenses offset, in part, by higher gross margins as a percentage of sales.

Other Non-Operating Income (Expense), Net.  Other non-operating income, net was $2.3 million in 2023, compared to $4.8 million in 2022.  The year-over-year decrease in other non-operating income, net results from the decrease in year-over-year equity income from our joint ventures, and the unfavorable impact of changes in foreign currency exchange rates.  The decline in equity income from our joint ventures is due, in part, to lower production levels related to inventory reduction plans, and the impact of our acquisition of an additional 15% equity interest in Gwo Yng.  Commencing in July 2023, on the date of our 15% increase in equity interest, the financial results of Gwo Yng were no longer accounted for under the equity method of accounting.  Instead, Gwo Yng’s financial results were reported on a consolidated basis, resulting in lower joint venture equity income.

Interest Expense.  Interest expense increased to $13.3 million in 2023, compared to $10.6 million in 2022.  The year-over-year increase in interest expense reflects the impact of higher year-over-year average interest rates on our credit facilities when compared to 2022, which more than offset the impact of lower average outstanding balances.

Income Tax Provision. The income tax provision for 2023 was $18.4 million at an effective tax rate of 22.5%, compared to $25.2 million at an effective tax rate of 25.6% in 2022.  The lower effective tax rate in 2023 compared to 2022 reflects the impact of lower state and local income taxes due to changes in state laws, rates and filing methodologies, changes in foreign and domestic mix, and the effective rate impact of lower year-over-year pre-tax income.

Loss From Discontinued Operations.  Loss from discontinued operations, net of income tax, reflects information contained in the actuarial studies performed as of August 31, 2023 and 2022, as well as other information available and considered by us, and legal expenses and other costs associated with our asbestos-related liability.  During the years ended December 31, 2023 and 2022, we recorded a net loss of $29 million and $17.7 million from discontinued operations, respectively.  The loss from discontinued operations for the year ended December 31, 2023 and 2022 includes (1) a $23.8 million and $18.5 million pre-tax provision, respectively, to increase our indemnity liability in line with the 2023 and 2022 actuarial studies; (2) legal and other miscellaneous expenses, before taxes, of $4.9 million and $5.4 million for 2023 and 2022, respectively, and (3) a $10.5 million pre-tax provision in 2023 related to a breach of contract legal proceeding.  As discussed more fully in Note 23 “Commitments and Contingencies” of the Notes to Consolidated Financial Statements in Item 8 of this Report, we are responsible for certain future liabilities relating to alleged exposure to asbestos containing products.

Net Earnings Attributable to Noncontrolling Interest.  Net earnings attributable to noncontrolling interest relates to the minority shareholders’ interest in our 70% owned joint venture in Hong Kong, with operations in Shanghai and Wuxi, China (“Trombetta Asia, Ltd.”) and, in our 80% ownership in Gwo Yng, commencing in July 2023 upon the completion of our step acquisition. Net earnings attributable to the noncontrolling interest were $204,000 and $84,000 during the years ended December 31, 2023 and 2022, respectively. For additional information on the Gwo Yng step acquisition, see Note 2, “Business Acquisitions and Investments,” in the notes to our consolidated financial statements (unaudited).

Comparison of Results of Operations For Fiscal Years 2022 and 2021

Sales.  Consolidated net sales for 2022 were $1,371.8 million, an increase of $73 million, or 5.6%, compared to $1,298.8 million in the same period of 2022, with the majority of our net sales to customers located in the United States.  Consolidated net sales increased across all of our operating segments, when compared to the comparable period in the prior year.
The following table summarizes consolidated net sales by segment and by major product group within each segment for the years ended December 31, 2022 and 2021 (in thousands):
  Year Ended December 31, 
  2022  2021 
Vehicle Control      
Engine Management (Ignition, Emissions and Fuel Delivery) 
$
454,571
  
$
444,196
 
Electrical and Safety  
230,487
   
224,520
 
Wire Sets and Other  
65,513
   
68,715
 
Total Vehicle Control
  
750,571
   
737,431
 
         
Temperature Control        
AC System Components  
245,484
   
231,466
 
Other Thermal Components  
105,753
   
92,614
 
Total Temperature Control
  
351,237
   
324,080
 
         
Engineered Solutions        
Commercial Vehicle  
80,275
   
76,066
 
Construction/Agriculture  
42,385
   
33,220
 
Light Vehicle  
91,533
   
86,440
 
All Other  
55,814
   
41,579
 
Total Engineered Solutions
  
270,007
   
237,305
 
         
Other  


Total 
$
1,371,815
  
$
1,298,816
 

Vehicle Control’s net sales for the year ended December 31, 2022 increased $13.2 million, or 1.8%, to $750.6 million compared to $737.4 million in the same period of 2021.  The increase in net sales in our Vehicle Control operating segment reflects the impact of strong customer demand and price increases implemented in 2022, which were implemented to pass through inflationary increases in raw materials, distribution and labor costs.
Temperature Control’s net sales for the year ended December 31, 2022 increased $27.1 million, or 8.4%, to $351.2 million compared to $324.1 million in the same period of 2021.  The increase in net sales in our Temperature Control segment reflects the impact of continued strong customer demand, with the elevated demand we saw in 2021 holding firm, fueled by record heat across the country in 2022 and the replenishment of customer inventory levels after very warm summer conditions in 2021, and the impact of price increases, which were implemented to pass through inflationary increases in raw materials, distribution and labor costs.  Demand for our Temperature Control products may vary significantly with summer weather conditions and customer inventory levels.
Engineered Solutions’ net sales for the year ended December 31, 2022 increased $32.7 million, or 13.8%, to $270 million compared to $237.3 million in the same period of 2021.  The increase in net sales in our Engineered Solutions operating segment reflects the impact of the positive contribution of incremental sales from our soot sensor, Trombetta and Stabil acquisitions of $44.6 million.  Compared to the year ended December 31, 2021, excluding the incremental net sales from the acquisitions, Engineered Solutions net sales decreased $11.9 million, or 5%.
Gross Margins.  Gross margins, as a percentage of consolidated net sales, decreased to 27.9% for 2022, compared to 29% for 2021, compared to 29.8% for 2020.2021.  The following table summarizes gross margins by segment for the years ended December 31, 20212022 and 2020,2021, respectively (in thousands):

Year Ended
December 31,
 
Engine
Management
  
Temperature
Control
  Other  Total 
2021            
Net sales (a) 
$
937,936
  
$
348,423
  
$
12,457
  
$
1,298,816
 
Gross margins  
266,961
   
95,138
   
14,832
   
376,931
 
Gross margin percentage  
28.5
%
  
27.3
%
  
%
  
29
%
                 
2020                
Net sales (a) 
$
835,685
  
$
281,954
  
$
10,949
  
$
1,128,588
 
Gross margins  
251,747
   
75,161
   
9,747
   
336,655
 
Gross margin percentage  
30.1
%
  
26.7
%
  
%
  
29.8
%

(a)
Segment net sales include intersegment sales in our Engine Management and Temperature Control segments.
Year Ended
December 31,
 
Vehicle
Control
  
Temperature
Control
  Engineered
Solutions
  Other  Total 
2022               
Net sales 
$
750,571
  
$
351,237
  
$
270,007
  
$
  
$
1,371,815
 
Gross margins  
232,267
   
98,913
   
51,359
   
   
382,539
 
Gross margin percentage  
30.9
%
  
28.2
%
  
19
%
  
   
27.9
%
                     
2021                    
Net sales 
$
737,431
  
$
324,080
  
$
237,305
  
$
  
$
1,298,816
 
Gross margins  
238,790
   
91,738
   
46,403
   
   
376,931
 
Gross margin percentage  
32.4
%
  
28.3
%
  
19.6
%
  
   
29
%

Compared to 2020,2021, gross margins at Engine ManagementVehicle Control decreased 1.5 percentage points from 32.4% to 30.9%, gross margins at Temperature Control decreased 0.1 percentage points from 28.3% to 28.2%, and gross margins at Engineered Solutions decreased 1.6 percentage points from 30.1%19.6% to 28.5%, while gross margins at Temperature Control increased 0.6 percentage points from 26.7% to 27.3%19%.

The gross margin percentage decrease in Engine ManagementVehicle Control compared to the prior year reflects the impact of the lower gross margins achieved in the second half of 2021 compared to the second half of 2020, resulting from lower fixed cost absorption due to lower and more normalized production, levels than those achieved in the second half of 2020, inflationary cost increases in raw materials, labor and transportation, which began in the second quarter of 2021,were somewhat offset by increased pricing, and a higher mix of heavy duty OE salesfreight and related expenses resulting from recent acquisitions, which has a different margin profile than our aftermarket business with lower gross margins but comparable operating margins.  Engine Management gross margins in the first half of 2021 were favorably impacted by higher year-over-year absorption due to higher production volumes to build inventory levels, and the impact of year-over-year production variances carried over from the prior year.

levels. The slight gross margin percentage increasedecrease in Temperature Control compared to the prior year reflects the favorable impact of higher year-over-year absorption due to higher production volumes, as well as overall higher sales volume, which more than offset the unfavorable impact in the second half of 2021 of inflationary cost increases in certainraw materials, labor and transportation, and higher freight and related expenses resulting from higher inventory levels, which were offset by seasonal volume, customer mix and increased pricing.  The gross margin percentage decrease in Engineered Solutions compared to the prior year reflects the impact of inflationary cost increases in raw materials, labor and transportation.  While we anticipate continued margin pressures at both Engine Management and Temperature Controlacross all of our segments resulting from inflationary cost increases, we believe that our annual cost initiatives, and our ability to pass through higher prices to our customers, will help to offset the impact of the inflationary increases on our margins.

Selling, General and Administrative Expenses.  Selling, general and administrative expenses (“SG&A”) increased to $276.6 million, or 20.2% of consolidated net sales in 2022, as compared to $247.5 million, or 19.1% of consolidated net sales in 2021, as compared to $224.7 million, or 19.9% of consolidated net sales in 2020.2021.  The $22.8$29.1 million increase in SG&A expenses as compared to 20202021 is principally due to (1) higher distribution costs associated with higher sales volumes and the impact of an increase(1) higher interest related costs of $20.6 million incurred in freight costs,our supply chain financing arrangements, (2) higher employee compensation costs, and (3) the impact of the $7 million charge recorded in 2022 to reduce our outstanding accounts receivable balance from one of our customers that filed a petition for bankruptcy in January 2023 to our estimated recovery amount, (3) incremental expenses of $7.8$7.2 million from our soot sensor, Trombetta and Stabil acquisitions, including amortization of intangible assets acquired.  Theacquired, and (4) inflationary cost increases resulting in higher distribution and freight costs.  SG&A expenses in 2022 were favorably impacted by the higher mix of non-aftermarket parts sales from recent acquisitions, which have a different profile than our aftermarket business with lower year-over-year SG&A expenseexpenses as a percentage of consolidated net sales reflects the impact of discretionary cost reduction measures implemented in 2020 and carried over into 2021, and higher year-over-year sales volumes.sales.

Intangible Asset Impairment.  In December 2020, a large retail customer informed us of its decision to pursue a private brand strategy for its engine management product line.  As a result of this development, products sold under the BWD trademark were significantly reduced. In connection with the decision, we recorded an impairment charge of $2.6 million in 2020.

Restructuring and Integration Expenses.  Restructuring and integration expenses were $0.4$1.9 million in 20212022 compared to restructuring and integration expenses of $0.5$0.4 million in 2020.2021.  Restructuring and integration expenses incurred in 2021 relate2022 of $1.9 million related to the relocation(1) severance costs of $0.9 million in connection with a reduction in our Engine Management Segmentsales force, (2) expenses of $0.6 million consisting of employee severance costs related to our product line relocations from our Independence, Kansas manufacturing facility and from our St. Thomas, Canada manufacturing facility to our manufacturing facilities in Reynosa, Mexico, (3) relocation expenses of $0.2 million of certain inventory, machinery, and equipment acquired in our March 2021 soot sensor acquisition; while restructuringacquisition to our facilities in Independence, Kansas and integration expenses incurred in 2020 relate to (1)Bialystok, Poland, and (4) the $0.2 million increase in environmental cleanup costs for ongoing monitoring and remediation in connection with the prior closure of our manufacturing operations at our Long Island City, New York location,location.

Restructuring and (2) costsintegration expenses incurred in 2021 of $0.4 million related to the residual relocation activitiesof certain inventory, machinery, and equipment acquired in our Engine Management segment2021 soot sensor acquisition to our facilities in connection with our integration of the Pollak business of Stoneridge, Inc., acquired in April 2019.Independence, Kansas and Bialystok, Poland.  The soot sensor product line relocation has been completed.

Operating Income.  Operating income was $104.1 million, or 7.6%, of consolidated net sales in 2022, compared to $129 million, or 9.9%, of consolidated net sales in 2021, compared to $108.9 million, or 9.6%, of consolidated net sales in 2020.2021.  The year-over-year increasedecrease in operating income of $20.1$24.9 million is the result of higher SG&A expenses driven primarily by the impact of higher consolidated net salesincreased interest rate costs incurred in our supply chain financing arrangements, and the impact of the impairment charge in 2020 related to the BWD trademark, which more than offseta lesser extent by the impact of lower gross margins as a percentage of consolidated net sales and higher SG&A expenses.  Operating income of 9.9% ofrestructuring and integration costs offset, in part, by higher consolidated net sales achieved in 2021 is in line historical operating margin percentages achieved.sales.

Other Non-Operating Income (Expense), Net.  Other non-operating income, net was $4.8 million in 2022, compared to $3.5 million in 2021, compared to $0.8 million in 2020.2021.  The year-over-year increase in other non-operating income, net results primarily from the favorable impact of changes in foreign currency exchange rates, and to a lesser extent the increase in year-over-year equity income from our joint ventures and the favorable impact of changes in foreign currency exchange rates.  During the first quarter of 2020, our joint ventures in China experienced temporary shutdowns due to the impact of the COVID-19 pandemic, resulting in significantly lower equity income.  In March 2020, the joint ventures reopened and resumed manufacturing and distribution.ventures.

Interest Expense.  Interest expense decreasedincreased to $10.6 million in 2022, compared to $2 million in 2021, compared to $2.3 million in 2020.2021.  The year-over-year decreaseincrease in interest expense reflects the impact of lowerhigher average outstanding borrowings in 2022 when compared to 2021, and the impact of higher year-over-year average interest rates on our revolving credit facility, which more than offset the impact of slightly higher average outstanding borrowings in 2021 when compared to 2020.facilities.

Income Tax Provision.  The income tax provision for 20212022 was $25.2 million at an effective tax rate of 25.6%, compared to $31 million at an effective tax rate of 23.8%, compared to $27 million at an effective tax rate of 25.1% in 2020.2021.  The lowerhigher effective tax rate in 20212022 compared to 20202021 results primarily from the increased year-over-year income tax benefit fromprovision impact related to the exercise of restricted stock, and changes in the mix of U.S. and foreign income.stock.

Loss From Discontinued Operations.  Loss from discontinued operations, net of income tax, reflects information contained in the actuarial studies performed as of August 31, 20212022 and 2020, and in December 2020 to reflect events that occurred in the fourth quarter of 2020,2021, as well as other information available and considered by us, and legal expenses and other costs associated with our asbestos-related liability.  During the years ended December 31, 20212022 and 2020,2021, we recorded a net loss of $8.5$17.7 million and $23$8.5 million from discontinued operations, respectively.  The loss from discontinued operations for the year ended December 31, 2022 and 2021 and 2020 includes a $5.3an $18.5 million and $25.7$5.3 million pre-tax provision, respectively, to increase our indemnity liability in line with the 20212022 and 20202021 actuarial studies; and legal expenses and other miscellaneous expenses, before taxes, of $5.4 million and $6.1 million for 2022 and $5.4 million for 2021, and 2020, respectively.  As discussed more fully in Note 2123 “Commitments and Contingencies” of the Notes to Consolidated Financial Statements in the notes to our consolidated financial statements,Item 8 of this Report, we are responsible for certain future liabilities relating to alleged exposure to asbestos containing products.

Net Earnings Attributable to Noncontrolling Interest.  In May 2021, we acquired the Trombetta business for $111.7 million. As part of the acquisition, we acquired a 70% ownership in a joint venture in Hong Kong, with operations in Shanghai and Wuxi, China (“Trombetta Asia, Ltd.”).  Net earnings attributable to the noncontrolling interest of $84,000 and $68,000 during the yearyears ended December 31, 2022 and 2021, respectively, represents 30% of the net earnings of Trombetta Asia, Ltd. from the date of acquisition through December 31, 2021.

Comparison of Results of Operations For Fiscal Years 2020 and 2019

For a detailed discussion on the comparison of fiscal year 2020 to fiscal year 2019, see Item 7 “Management’s Discussion and Analysis of Financial Condition and Results of Operations” in the Company’s Annual Report on Form 10-K for the fiscal year ended December 31, 2020.

Restructuring and Integration Programs

For a detailed discussion on the restructuring and integration costs, see Note 3, “Restructuring and Integration Expense,” of the Notes Consolidated Financial Statements in Item 8 of this Report.
 
Liquidity and Capital Resources

Our primary cash requirements include working capital, capital expenditures, regular quarterly dividends, stock repurchases, principal and interest payments on indebtedness and acquisitions. The following table summarizes our primary sources of funds including ongoing net cash flows from operating activities and availability under our Credit Agreement.
  December 31, 
(In thousands) 2023  2022 
       
Operating cash flows 
$
144,260
  
$
(27,533
)
Total debt 
$
156,211
  
$
239,620
 
Cash and cash equivalents  
32,526
   
21,150
 
Net debt 
$
123,685
  
$
218,470
 
Remaining borrowing capacity 
$
334,180
  
$
255,631
 
Total liquidity  
366,706
   
276,781
 

Operating Activities.  During 2021,2023, cash provided by operating activities was $85.6$144.3 million compared to $97.9cash used in operating activities of $27.5 million in 2020.2022.  The decreaseincrease in cash provided by operating activities resulted primarily from the increaselarger year-over-year decrease in accounts receivable, the decrease in inventories compared to the decreasean increase in inventories in the prior year, the smaller year-over-year increase in sundry payables and accruedaccounts payable compared to a decrease in accounts payable in the prior year, no change in prepaid expenses and the larger year-over-yearother current assets compared to an increase in prepaid expenses and other current assets partially offset by the increase in net earnings, the decrease in accounts receivable compared to the increase in accounts receivable in the prior year, and the largersmaller year-over-year increasedecrease in accounts payable.sundry payables and accrued expenses offset, in part, by the decrease in net earnings.
 
Net earnings during 20212023 were $91$34.4 million compared to $57.4$55.4 million in 2020.2022.  During 20212023, (1) the decrease in accounts receivable was $28.5$8 million compared to the year-over-year decrease in accounts receivable of $6.9 million in 2022; (2) the decrease in inventories was $29.5 million compared to the year-over-year increase in accounts receivableinventories of $71.9$67.5 million in 2020; (2)2022; (3) the increase in inventoriesaccounts payable was $107.6$19.6 million compared to the year-over-year decrease in inventories of $18 million in 2020; (3) the increase in accounts payable was $33 million compared to the year-over-year increase in accounts payable of $7.4$48.6 million in 2020;2022; (4) the increasethere was no change in prepaid expenses and other current assets was $0.8 million compared to the year-over-year increase in prepaid expenses and other current assets of $0.4$5.5 million in 2020;2022; and (5) the increasedecrease in sundry payables and accrued expenses was $13.4$4.3 million compared to the year-over-year increasedecrease in sundry payables and accrued expenses of $40.7$29.1 million in 2020.  The decrease in2022.  During 2023, we generated operating cash flow of $144.3 million by reducing our inventory to more normalized levels while actively managing our accounts receivable during 2021 reflects the impact of $50 million of receivables presented to financial institutions at December 31, 2020, pursuant to our supply chain financing arrangements, that were collected in 2021; while the increase in inventories during 2021 reflects actions taken to meet continued strong customer demand, to replenish stock levels, which were depleted after record sales in the last half of 2020, and to serve as a hedge against the global disruptions in the supply chain.accounts payable.  We will continue to actively manage our working capital to maximize our operating cash flow.  Now that global supply chains have stabilized, allowing us to lower working capital in 2023, we expect cash flows from operations will return to historical levels in 2024.
 
Investing Activities.  Cash used in investing activities was $151.2$25.7 million in 20212023 compared to $17.8$27.8 million in 2020.2022.  Investing activities during 20212023 consisted of (1) the payment of $15.4$4 million netfor our acquisition of $0.9an additional 15% equity interest in Foshan GWO YNG SMP Vehicle Climate Control & Cooling Products Co., Ltd. (“Gwo Yng”) and (2) capital expenditures of $28.6 million ofoffset, in part, by cash acquired of $6.8 million in the Gwo Yng step acquisition.

Investing activities during 2022 consisted of (1) the cash payment of $1.7 million for our acquisition of 100% of the capital stock of Stabil Operative GroupKade Trading GmbH, a German company, (“Stabil”Kade”); , net of $1 million of cash acquired and the $0.5 million earn-out; (2) the payment of $107.1 million, net of $4.6 million of cash acquired, for our acquisition of 100% of the capital stock of Trumpet Holdings, Inc., a Delaware corporation, (“Trombetta”); (3) the payment of $2.9$0.2 million for our acquisition of certain assets of the soot sensor product lines from Stoneridge, Inc.;3.55% increase in equity ownership in Foshan Che Yijia New Energy Technology Co., Ltd., (“CYJ”), a China-based joint venture that manufactures automotive electric air conditioning compressors; and (4)(3) capital expenditures of $25.9 million.  Investing activities in 2020 consisted of capital expenditures of $17.8$26 million.

Financing Activities.  Cash used in financing activities was $109.6 million in 2023 compared to cash provided by financing activities of $55.5 million in 2022.  During 2023, we (1) reduced our borrowings under our Credit Agreement by $83.5 million; and (2) paid dividends of $25.2 million and $0.7 million to shareholders of our noncontrolling interests, respectively.  Cash provided by our operating activities was used to reduce our borrowings under our Credit Agreement, fund our investing activities and pay dividends.
In June 2022, we entered into a new credit agreement with JPMorgan Chase Bank, N.A., as agent. The new credit agreement provides for a $500 million credit facility comprised of a $100 million term loan facility and a $400 million revolving credit facility. Borrowings under the new credit facility were used to repay all outstanding borrowings under the then existing revolving credit facility, and certain fees and expenses incurred in connection with the refinancing.
Cash provided by financing activities was $69$55.5 million in 2021 compared to cash used in financing activities of $71.5 million in 2020.2022.  During 2021,2022, we (1) increased our borrowings under our revolving credit facilityfacilities by $115.3 million; (2) increased our borrowings under lease obligations and our Polish overdraft facility by $3 million; (3) made cash payments for the repurchase of shares of our common stock of $26.8 million; and (4) paid dividends of $22.2 million.  Cash provided by operating activities, along with borrowings under our revolving credit agreement, lease obligations and Polish overdraft facility were used to fund our investing activities, purchase shares of our common stock and pay dividends.
Cash used in financing activities was $71.5 million in 2020.  During 2020, we (1) reduced our borrowings under our revolving credit facility by $42.5$114.2 million; (2) reduced our borrowings under lease obligations and our Polish overdraft facility by $4.2$2.9 million; (3) made cash payments of $2.1 million for debt issuance costs in connection with our refinancing; (4) made cash payments for the repurchase of shares of our common stock of $13.5$29.7 million; and (4)(5) paid dividends of $11.2$23.4 million.  Cash provided by borrowings under our credit facilities were used to fund our operating activities, was used to pay downinvesting activities, reduce our revolving credit facility, ourborrowings under lease obligations and our Polish overdraft facility, and to fund our investing activities,pay debt issuance costs in connection with the refinancing, purchase shares of our common stock and pay dividends.
 
Dividends of $22.2$25.2 million and $11.2$23.4 million were paid in 20212023 and 2020,2022, respectively.  In January 2020, our BoardQuarterly dividends were paid at a rate of Directors voted to increase our quarterly dividend from $0.23 per share$0.29 in 2019 to $0.25 per share in 2020.  In April 2020, in response to the impact of the COVID-19 pandemic on our business, our Board of Directors approved to temporarily suspend our quarterly cash dividend payments2023 and stock repurchases.  In September 2020, our Board of Directors approved to reinstate our stock repurchase program; and in October 2020, our Board of Directors approved the reinstatement of our quarterly cash dividend of $0.25 per share.  In February 2021, our Board of Directors voted to maintain our quarterly dividend at $0.25 per share in 2021; and in February 2022, our Board of Directors voted to increase our quarterly dividend from $0.25 per share in 2021 to $0.27 per share in 2022.
 
Comparison of Liquidity and Capital Resources For Fiscal Years 20202022 and 20192021
For a detailed discussion of our Liquidity and Capital Resources comparison of fiscal year 20202022 to fiscal year 2019,2021, see Item 7 “Management’s Discussion and Analysis of Financial Condition and Results of Operations” in the Company’s Annual Report on Form 10-K for the fiscal year ended December 31, 2020.
2022.

Liquidity

Our primary cash requirements include working capital, capital expenditures, regular quarterly dividends, stock repurchases, principal and interest payments on indebtedness and acquisitions.  Our primary sources of funds are ongoing net cash flows from operating activities and availability under our secured revolving credit facilityCredit Agreement (as detailed below).
 
We haveIn June 2022, we entered into an amended credit agreementa new Credit Agreement with JPMorgan Chase Bank, N.A., as administrative agent, and a syndicate of lenders.lenders (the “Credit Agreement”).  The amended credit agreementCredit Agreement provides for a senior secured$500 million credit facility comprised of a $100 million term loan facility (the “term loan”) and a $400 million multi-currency revolving credit facility with a lineavailable in U.S. Dollars, Euros, Sterling, Swiss Francs, Canadian Dollars and other currencies as agreed to by the administrative agent and the lenders (the “revolving facility”).  The Credit Agreement replaces and refinances the existing Credit Agreement, dated as of credit of up to $250 million (with an additional $50 million accordion feature)October 28, 2015, among the Company, SMP Motor Products Ltd. and extendsTrumpet Holdings, Inc., as borrowers, JPMorgan Chase Bank, N.A., as administrative agent and lender, and the maturity date to December 2023.  The line of credit under the amended agreement also allows for a $10 million line of credit to Canada as part of the $250 million available for borrowing.  Direct borrowings under the amended credit agreement bear interest at LIBOR plus a margin ranging from 1.25% to 1.75% based on our borrowing availability, or floating at the alternate base rate plus a margin ranging from 0.25% to 0.75% based on our borrowing availability, at our option.  The amended credit agreement is guaranteed by certain of our subsidiaries and secured by certain of our assets.other lenders named therein (the “2015 Credit Agreement”).
 
Borrowings under the amended credit agreement are secured by substantiallyCredit Agreement were used to repay all of our assets, including accounts receivable, inventory and certain fixed assets, and those of certain of our subsidiaries.  Availability under the amended credit agreement is based on a formula of eligible accounts receivable, eligible drafts presented to the banks under our supply chain financing arrangements and eligible inventory.  After taking into account outstanding borrowings under the amended2015 Credit Agreement, and pay certain fees and expenses incurred in connection with the Credit Agreement, with future borrowings used for other general corporate purposes of the Company and its subsidiaries.  The term loan amortizes in quarterly installments of 1.25% in each of the first four years, and quarterly installments of 2.5% in the fifth year of the Credit Agreement.  The revolving facility has a $25 million sub-limit for the issuance of letters of credit agreement, there was an additional $122.1and a $25 million availablesub-limit for usthe borrowing of swingline loans.  The maturity date is June 1, 2027.  The Company may request up to borrow pursuant totwo one-year extensions of the formula at December 31, 2021.  maturity date.

The loss of businessCompany may, upon the agreement of one or more of our key customersthen existing lenders or of additional financial institutions not currently party to the Credit Agreement, increase the revolving facility commitments or obtain incremental term loans by an aggregate amount not to exceed (x) the greater of (i) $168 million or (ii) 100% of consolidated EBITDA (as defined in the Credit Agreement) for the four fiscal quarters ended most recently before such date, plus (y) the amount of any voluntary prepayment of term loans, plus (z) an unlimited amount so long as, immediately after giving effect thereto, the pro forma First Lien Net Leverage Ratio (as defined in the Credit Agreement) does not exceed 2.5 to 1.0.

Term loan and revolver facility borrowings in U.S. Dollars bear interest, at the Company’s election, at a significant reductionrate per annum equal to Term SOFR plus 0.10% plus an applicable margin, or an alternate base rate plus an applicable margin, where the alternate base rate is the greater of the prime rate, the federal funds effective rate plus 0.50%, and one-month Term SOFR plus 0.10% plus 1.00%. Term loan borrowings are being made at one-month Term SOFR.  The applicable margin for the term benchmark borrowings ranges from 1.0% to 2.0%, and the applicable margin for alternate base rate borrowings ranges from 0% to 1.0%, in purchaseseach case, based on the total net leverage ratio of our products fromthe Company and its restricted subsidiaries.  The Company may select interest periods of one, three or six months for Term SOFR borrowings.  Interest is payable at the end of the selected interest period, but no less frequently than quarterly.

The Company’s obligations under the Credit Agreement are guaranteed by its material domestic subsidiaries (each, a “Guarantor”), and secured by a first priority perfected security interest in substantially all of the existing and future personal property of the Company and each Guarantor, subject to certain exceptions.  The collateral security described above also secures certain banking services obligations and interest rate swaps and currency or other hedging obligations of the Company owing to any one of them, could adversely impact availabilitythe then existing lenders or any affiliates thereof.  Concurrently with the Company’s entry into the Credit Agreement, the Company also entered into a seven year interest rate swap agreement with Wells Fargo Bank, N.A., Co-Syndication Agent and lender under our revolving credit facility.the Credit Agreement, on $100 million of borrowings under the Credit Agreement.  The interest rate swap agreement matures in May 2029.

Outstanding borrowings under the credit agreement, which are classified as current liabilities, were $125.3  million and $10 million at December 31, 20212023 under the Credit Agreement were $156 million, consisting of current borrowings of $5 million and 2020, respectively;long-term debt of $151 million; while lettersoutstanding borrowings at December 31, 2022 were $239.5 million, consisting of current borrowings of $55 million and long-term debt of $184.5 million.  Letters of credit outstanding under the credit agreementCredit Agreement were $2.6$2.3 million and $2.8$2.4 million at December 31, 20212023 and 2020,2022, respectively.  Borrowings under the credit agreement have been classified as current liabilities based upon accounting rules and certain provisions in the agreement.
 
At December 31, 2021,2023, the weighted average interest rate onunder our amended credit agreementCredit Agreement was 1.4%5%, which consisted of $125$156 million in direct borrowings at 1.4%5% under Term SOFR, adjusted for the impact of the interest rate swap agreement on $100 million of borrowings.  At December 31, 2022, the weighted average interest rate under our Credit Agreement was 5.2%, which consisted of $237 million in borrowings at 5.2% under Term SOFR, adjusted for the impact of the interest rate swap agreement on $100 million of borrowings, and an alternative base rate loanborrowing of $0.3$2.5 million at 3.5%8%AtDuring the year ended December 31, 2020, the weighted average interest rate on2023, our amended credit agreement was 1.4%, which consisted of $10 million in direct borrowings.  Our average daily alternative base rate loan balance was $1.1$0.1 million, and $1.5compared to a balance of $5.6 million during 2021 and 2020, respectively.for the year ended December 31, 2022.
 
At any time that our borrowing availability is less than the greater of either (a) $25 million, or 10% of the commitments if fixed assets are not included in the borrowing base, or (b) $31.25 million, or 12.5% of the commitments if fixed assets are included in the borrowing base, the terms of the amended credit agreement provide for,The Credit Agreement contains customary covenants limiting, among other provisions, a financial covenant requiring us, on a consolidated basis,things, the incurrence of additional indebtedness, the creation of liens, mergers, consolidations, liquidations and dissolutions, sales of assets, dividends and other payments in respect of equity interests, acquisitions, investments, loans and guarantees, subject, in each case, to maintain a fixed charge coverage ratiocustomary exceptions, thresholds and baskets.  The Credit Agreement also contains customary events of 1:1 at the end of each fiscal quarter (rolling four quarters).  As of December 31, 2021, we were not subject to these covenants.  The amended credit agreement permits us to pay cash dividends of $20 million and make stock repurchases of $20 million in any fiscal year subject to a minimum availability of $25 million.  Provided specific conditions are met, the amended credit agreement also permits acquisitions, permissible debt financing, capital expenditures, and cash dividend payments and stock repurchases of greater than $20 million.default.

In February 2022,November 2023, our Polish subsidiary, SMP Poland sp. z.o.o., further amended its overdraft facility with HSBC Continental Europe (Spolka Akcyjna) Oddzial w Polsce, formerly HSBC France (Spolka Akcyjna) Oddzial w Polsce.  The overdraft facility, as amended, provides for borrowings under the facility in Euros and U.S. Dollars.  Under the amended terms, the overdraft facility provides for borrowings of up to Zloty 30 million (approximately $8$7.6 million).  Availability under if borrowings are solely in Zloty, or up to 85% of the amendedZloty 30 million limit (approximately $6.5 million) if borrowings are in Euros and/or U.S. Dollars.  The overdraft facility commenceshas a maturity date in March 2022 and ends in June 2022,2024, with automatic three-month renewals until June 2027, subject to cancellation by either party, at its sole discretion, at least 30 days prior to the commencement of the three-month renewal period.  Borrowings under the amended overdraft facility will bear interest at a rate equal to WIBOR(1) the one month Warsaw Interbank Offered Rate (“WIBOR”) + 1.5%1.0% for borrowings in Polish Zloty, (2) the one month Euro Interbank Offered Rate (“EURIBOR”) + 1.0% for borrowings in Euros, and (3) the Mid-Point of the Fed Target Range + 1.25% for borrowings in U.S Dollars.  Borrowings under the overdraft facility are guaranteed by Standard Motor Products, Inc., the ultimate parent company.  At December 31, 2021 and 2020,There were no borrowings outstanding under the overdraft facility were Zloty 12.3 million (approximately $3 million)at both December 31, 2023 and Zloty 0.4 million (approximately $0.1 million), respectively.December 31, 2022.

In order to reduce our accounts receivable balances and improve our cash flow, we are party to several supply chain financing arrangements, in which we may sell certain of our customers’ trade accounts receivable to such customers’ financial institutions.  We sell our undivided interests in certain of these receivables at our discretion when we determine that the cost of these arrangements is less than the cost of servicing our receivables with existing debt.  Under the terms of the agreements, we retain no rights or interest, have no obligations with respect to the sold receivables, and do not service the receivables after the sale.  As such, these transactions are being accounted for as a sale.
 
Pursuant to these agreements, we sold $818.8$830.8 million and $695.1$813.7 million of receivables for the years ended December 31, 20212023 and 2020, respectively, which was2022, respectively. Receivables presented at financial institutions and not yet collected as of December 31, 2023 were $4.5 million and remained in our receivable balance as of that date. There were no receivables presented at financial institutions and not yet collected as of December 31, 2022.  All receivables sold were reflected as a reduction of accounts receivable in the consolidated balance sheet at the time of sale.  Receivables presented at financial institutions and not yet collected as of December 31, 2021 and December 31, 2020 were approximately $1.3 million and $50 million, respectively, and remained in our accounts receivable balance for those periods.  A charge in the amount of $11.5$46 million, $12.2$32 million and $22$11.5 million related to the sale of receivables is included in selling, general and administrative expenses in our consolidated statements of operations for the years ended December 31, 2021, 20202023, 2022 and 2019,2021, respectively.
 
To the extent that these arrangements are terminated, our financial condition, results of operations, cash flows and liquidity could be adversely affected by extended payment terms, delays or failures in collecting trade accounts receivables.  The utility of the supply chain financing arrangements also depends upon a benchmark reference rate for the LIBOR rate, as it is a componentpurpose of determining the discount rate applicable to each arrangement. If the LIBORbenchmark reference rate increases significantly, we may be negatively impacted as we may not be able to pass these added costs on to our customers, which could have a material and adverse effect upon our financial condition, results of operations and cash flows.
 
In January 2023, one of our customers filed a petition for bankruptcy.  In connection with the bankruptcy filing, we evaluated our potential risk and exposure as related to our outstanding accounts receivable balance from the customer as of December 31, 2022, and estimated our anticipated recovery.  As a result of our evaluation, we recorded a $7 million pre-tax charge during the year ended December 31, 2022 to reduce our accounts receivable balance to our estimated recovery.  The $7 million pre-tax charge was included in selling, general and administrative expenses in our consolidated statement of operations.  The bankruptcy court proceedings have continued into 2023.  Although the courts have named us a “critical supplier,” the funds allocated to us have not yet been determined and, as such, we have not recorded an adjustment to the $7 million pre-tax charge previously recorded.
In March 2020, our Board of Directors authorized the purchase of up to $20 million of our common stock under a stock repurchase program.  Stock repurchases under this program during the yearsyear ended December 31, 2021 and 2020, were 150,273 and 323,867 shares of our common stock respectively, at a total cost of $6.5 million and $13.5 million, respectively, thereby completing the 2020 Board of Directors authorization.
 
In February 2021, our Board of Directors authorized the purchase of up to an additional $20 million of our common stock under a stock repurchase program.  Stock repurchases under this program during the year ended December 31, 2021 were 464,992 shares of our common stock at a total cost of $20 million, thereby completing the February 2021 Board of Directors authorization.
 
In October 2021, our Board of Directors authorized the purchase of up to an additional $30 million of our common stock under a stock repurchase program.  Stock repurchases under this program, during the year ended December 31, 2021 and 2022 were 7,000 and 692,067 shares of our common stock, respectively, at a total cost of $0.3 million and $29.7 million, respectively, thereby completing the October 2021 Board of Directors authorization.
In July 2022, our Board of Directors authorized the purchase of up to an additional $30 million of our common stock under a new stock repurchase program. Stock will be purchased under the programsprogram from time to time, in the open market or through private transactions, as market conditions warrant.  StockTo date, there have been no repurchases under this program, during the year ended December 31, 2021, were 7,000 shares of our common stock at a total cost of $0.3 million.  As of December 31, 2021, there was approximately $29.7 million available for future stock purchases under the program.  During the period from January 1, 2022 through February 17, 2022, we have repurchased an additional 64,482 shares of our common stock at a total cost of $3.1 million, thereby reducing the availability under the program to $26.6 million.

Material Cash Commitments

Material cash commitments as of December 31, 20212023 consist of required cash payments to service our outstanding borrowings of $125.3$156 million under our amended revolving credit agreementCredit Agreement with JPMorgan Chase Bank, N.A., as agent and the future minimum cash requirements of $44.9$131.7 million through 20312034 under operating leases.  All of our other cash commitments as of December 31, 20212023 are not material.  For additional information related to our material cash commitments, see Note 7, “Leases,” and Note 11, “Credit Facilities and Long-Term Debt,” of the Notes to Consolidated Financial Statements in Item 8 of this Report.
 
We anticipate that our cash flow from operations, available cash, and available borrowings under our revolving credit facility, inclusive of the utilization of the $50 million accordion feature in the facility,Credit Agreement will be adequate to meet our future liquidity needs for at least the next twelve months.  Significant assumptions underlie this belief, including, among other things, that we will be able to mitigate the future impact, if any, of the COVID-19 pandemic, disruptions in the supply chain that may lead to a further increasecaused by geo-political risks, future increases in inventories to support our customers,interest rates, and significant inflationary cost increases in raw materials, labor and transportation that we are unable to pass through our customers, macroeconomic uncertainty, and that there will be no material adverse developments in our business, liquidity or capital requirements.  If material adverse developments were to occur in any of these areas, there can be no assurance that our business will generate sufficient cash flow from operations, or that future borrowings will be available to us under our revolving credit facilityCredit Agreement in amounts sufficient to enable us to pay the principal and interest on our indebtedness, or to fund our other liquidity needs.  In addition, if we default on any of our indebtedness, or breach any financial covenant in our revolving credit facility,Credit Agreement, our business could be adversely affected.
 
For further information regarding the risks in our business, refer to Item 1A, “Risk Factors,” of this Report.
 
Critical Accounting Policies and Estimates

We have identified the two accounting policies and estimates below as critical to our business operations and the understanding of our results of operations.  The impact and any associated risks related to these policies and estimates on our business operations is discussed throughout “Management’s Discussion and Analysis of Financial Condition and Results of Operations,” where such policies and estimates affect our reported and expected financial results.  For a detailed discussion on the application of these and other accounting policies, see Note 1, “Summary of Significant Accounting Policies,” of the notesNotes to our consolidated financial statements.Consolidated Financial Statements in Item 8 of this Report.

You should be aware that preparation of our consolidated annual and quarterly financial statements requires us to make estimates and assumptions that affect the reported amount of assets and liabilities, the disclosure of contingent assets and liabilities at the date of our consolidated financial statements, and the reported amounts of revenue and expenses during the reporting periods. We can give no assurances that actual results will not differ from those estimates.  Although we do not believe that there is a reasonable likelihood that there will be a material change in the future estimates, or in the assumptions that we use in calculating the estimates, the uncertain future effects, if any, of the COVID-19 pandemic,disruptions in the supply chain caused by geo-political risks, future increases in interest rates, inflation, macroeconomic uncertainty, and other unforeseen changes in the industry, or business, could materially impact the estimates, and may have a material adverse effect on our business, financial condition and results of operations.

Valuation of Long‑Lived and Intangible Assets and Goodwill
 
At acquisition, we estimate and record the fair value of purchased intangible assets, which primarily consist of customer relationships, trademarks and trade names, patents, developed technology and intellectual property, and non-compete agreements.  Intangible assets acquired through business combinations are subject to potential adjustments within the measurement period, which is up to one year from the acquisition date.  Valuing intangible assets requires the use of significant estimates and assumptions.  As related to valuing customer relationships, significant estimates and assumptions used include but are not limited to: (1) forecasted revenues attributable to existing customers; (2) forecasted earnings before interest and taxes (“EBIT”) margins; (3) customer attrition rates; and (4) the discount rate.  Goodwill is the excess of the purchase price over the fair value of identifiable net assets acquired in business combinations.  Goodwill and certain other intangible assets having indefinite lives are not amortized to earnings, but instead are subject to periodic testing for impairment.  Intangible assets determined to have definite lives are amortized over their remaining useful lives.  We believe that the fair value of acquired identifiable net assets, including intangible assets, are based upon reasonable estimates and assumptions.
 
We assess the impairment of long‑lived assets, identifiable intangibles assets and goodwill whenever events or changes in circumstances indicate that the carrying value may not be recoverable.  With respect to goodwill and identifiable intangible assets having indefinite lives, we test for impairment on an annual basis or in interim periods if an event occurs or circumstances change that may indicate the fair value is below its carrying amount.  Factors we consider important, which could trigger an impairment review, include the following: (a) significant underperformance relative to expected historical or projected future operating results; (b) significant changes in the manner of our use of the acquired assets or the strategy for our overall business; and (c) significant negative industry or economic trends.  We review the fair values using the discounted cash flows method and market multiples.
 
When performing our evaluation of goodwill for impairment, if we conclude qualitatively that it is not more likely than not that the fair value of the reporting unit is less than its carrying amount, then a quantitative impairment test would not be required.  If we are unable to reach this conclusion, then we would perform a goodwill quantitative impairment test.  In performing the quantitative test, the fair value of the reporting unit is compared to its carrying amount.  A charge for impairment is recognized by the amount by which the reporting unit’s carrying amount exceeds its fair value, not to exceed the total amount of goodwill allocated to the reporting unit.
 
Identifiable intangible assets having indefinite lives are reviewed for impairment on an annual basis using a methodology similar with that used to evaluate goodwill.  Intangible assets having definite lives and other long-lived assets are reviewed for impairment whenever events such as product discontinuance, plant closures, product dispositions or other changes in circumstances indicate that the carrying amount may not be recoverable.  In reviewing for impairment, we compare the carrying value of such assets to the estimated undiscounted future cash flows expected from the use of the assets and their eventual disposition.  When the estimated undiscounted future cash flows are less than their carrying amount, an impairment loss is recognized equal to the difference between the assets fair value and their carrying value.
 
There are inherent assumptions and estimates used in developing future cash flows requiring our judgment in applying these assumptions and estimates to the analysis of identifiable intangibles and long‑lived asset impairment including projecting revenues, interest rates, tax rates and the cost of capital.  Many of the factors used in assessing fair value are outside our control and it is reasonably likely that assumptions and estimates will change in future periods.  These changes can result in future impairments.  In the event our planning assumptions were modified resulting in impairment to our assets, we would be required to include an expense in our statement of operations, which could materially impact our business, financial condition and results of operations.

Asbestos Litigation

In evaluating our potential asbestos-related liability, we have considered various factors including, among other things, an actuarial study of the asbestos related liabilities performed by an independent actuarial firm, our settlement amounts and whether there are any co-defendants, the jurisdiction in which lawsuits are filed, and the status and results of such claims.  As is our accounting policy, we consider the advice of actuarial consultants with experience in assessing asbestos-related liabilities to estimate our potential claim liability; and perform an actuarial evaluation in the third quarter of each year and whenever events or changes in circumstances indicate that additional provisions may be necessary.  The methodology used to project asbestos-related liabilities and costs in our actuarial study considered: (1) historical data available from publicly available studies; (2) an analysis of our recent claims history to estimate likely filing rates into the future; (3) an analysis of our currently pending claims; (4) an analysis of our settlements and awards of asbestos-related damages to date; and (5) an analysis of closed claims with pay ratios and lag patterns in order to develop average future settlement values.  Based on the information contained in the actuarial study and all other available information considered by us, we have concluded that no amount within the range of settlement payments and awards of asbestos-related damages was more likely than any other and, therefore, in assessing our asbestos liability we compare the low end of the range to our recorded liability to determine if an adjustment is required.  Future legal costs are expensed as incurred and reported in earnings (loss) from discontinued operations in the accompanying statement of operations.
 
We plan to perform an annual actuarial evaluation during the third quarter of each year for the foreseeable future and whenever events or changes in circumstances indicate that additional provisions may be necessary. Given the uncertainties associated with projecting such matters into the future and other factors outside our control, we can give no assurance that additional provisions will not be required. We will continue to monitor events and changes in circumstances surrounding these potential liabilities in determining whether to perform additional actuarial evaluations and whether additional provisions may be necessary, which will reported in earnings (loss) from discontinued operations in the accompanying statement of operations.  At the present time, however, we do not believe that any additional provisions would be reasonably likely to have a material adverse effect on our liquidity or consolidated financial position.  See Note 21,23, “Commitments and Contingencies,” of the Notes to Consolidated Financial Statements in Item 8 of this Report for additional information.

Recently Issued Accounting Pronouncements

For a detailed discussion on recently issued accounting pronouncements and their impact on our consolidated financial statements, see Note 1, “Summary of Significant Accounting Policies” of the Notes to Consolidated Financial Statements in Item 8 of this Report.

ITEM 7A.QUANTITATIVE AND QUALITATIVE DISCLOSURES ABOUT MARKET RISK

Quantitative and Qualitative Disclosures about Market Risk

We are exposed to market risk, primarily related to foreign currency exchange and interest rates. These exposures are actively monitored by management. Our exposure to foreign exchange rate risk is due to certain costs, revenues and borrowings being denominated in currencies other than one of our subsidiary’s functional currency.  Similarly, we are exposed to market risk as the result of changes in interest rates, which may affect the cost of our financing. It is our policy and practice to use derivative financial instruments only to the extent necessary to manage exposures.  We do not hold or issue derivative financial instruments for trading or speculative purposes.  As of December 31, 2021, we did not have any derivative financial instruments.

Exchange Rate Risk

We have exchange rate exposure, primarily, with respect to the Canadian Dollar, the Euro, the British Pound, the Polish Zloty, the Hungarian Forint, the Mexican Peso, the Taiwan Dollar, the Chinese Yuan Renminbi and the Hong Kong Dollar.  As of December 31, 2021,2023 and December 31, 2022, our monetary assets and liabilities which are subject to this exposure are immaterial, therefore, the potential immediate loss to us that would result from a hypothetical 10% change in foreign currency exchange rates would not be expected to have a material impact on our earnings or cash flows.  This sensitivity analysis assumes an unfavorable 10% fluctuation in the exchange rates affecting the foreign currencies in which monetary assets and liabilities are denominated and does not take into account the incremental effect of such a change on our foreign currency denominated revenues.

Interest Rate Risk

We manage our exposure to interest rate risk through the proportion of fixed rate debt and variable rate debt in our debt portfolio. To reduce our market risk for changes in interest rates on our variable rate borrowings, and to manage a portion of our exposure to changes in interest rate changes,rates, we have in the past enteredoccasionally enter into interest rate swap agreements.  We

In June 2022, we entered into a seven year interest rate swap agreement with a notional amount of $100 million that is to mature in May 2029.  The interest rate swap agreement has been designated as a cash flow hedge of interest payments on $100 million of borrowings under our Credit Agreement. Under the terms of the swap agreement, we will receive monthly variable interest payments based on one month Term SOFR and will pay interest based upon a fixed rate of 2.683% per annum, adjusted upward for the credit spread adjustment in the Credit Agreement of 0.10% and the loan margin in the Credit Agreement of 1.25% at December 31, 2023.

As of December 31, 2023, we had approximately $156 million of outstanding borrowings under our Credit Agreement, of which approximately $56 million bears interest at variable rates of interest and $100 million bears interest at fixed rates, after consideration of the interest rate swap agreement entered into in June 2022.  Additionally, we invest our excess cash in highly liquid short-term investments. Substantially all of our debt is variable rate debt as of December 31, 2021 and 2020.  Based upon our current level of borrowings under our revolving credit facility and our Polish overdraft facility,Credit Agreement and our excess cash, the effect of a hypothetical, instantaneous and unfavorable change of 100 basis points in the interest rate wouldmay have an immaterialapproximate $0.2 million annualized negative impact on our earnings or cash flows.
 
In addition, we are party to several supply chain financing arrangements, in which we may sell certain of our customers’ trade accounts receivable to such customers’ financial institutions.  We sell our undivided interests in certain of these receivables at our discretion when we determine that the cost of these arrangements is less than the cost of servicing our receivables with existing debt.  During the year ended December 31, 2021,2023, we sold $818.8$830.8 million of receivables.  Depending upon the level of sales of receivables pursuant these agreements, the effect of a hypothetical, instantaneous and unfavorable change of 100 basis points in the margin rate may have an approximate $8.2$8.3 million negative impact on our earnings or cash flows.  The charge related to the sale of receivables is included in selling, general and administrative expenses in our consolidated statements of operations.

42
43


ITEM 8.FINANCIAL STATEMENTS AND SUPPLEMENTARY DATA

INDEX TO CONSOLIDATED FINANCIAL STATEMENTS

 Page No.
  
44
45
  
4746

 
5048
  
5149
  
5250

 
5351
  
5452
  
5553


MANAGEMENT’S REPORT ON INTERNAL CONTROL
OVER FINANCIAL REPORTING

To the Stockholders of
Standard Motor Products, Inc. and Subsidiaries:

Our management is responsible for establishing and maintaining adequate internal control over financial reporting (as defined in Rule 13a-15(f) or 15d-15(f) of the Exchange Act). Our internal control system was designed to provide reasonable assurance to our management and Board of Directors regarding the preparation and fair presentation of published financial statements.
 
All internal control systems, no matter how well designed, have inherent limitations. Because of these inherent limitations, internal control over financial reporting can provide only reasonable assurance with respect to financial statement preparation and presentation, and may not prevent or detect misstatements.  Projections of any evaluation of effectiveness to future periods are subject to the risk that controls may become inadequate because of changes in conditions, or that the degree of compliance with the policies or procedures may deteriorate.
 
We assessed the effectiveness of the Company’s internal control over financial reporting as of December 31, 2021.  During 2021, the Company acquired Trumpet Holdings, Inc, (“Trombetta”) and Stabil Operative Group GmbH (“Stabil”), and have excluded from our assessment of the effectiveness of the Company’s internal control over financial reporting as of December 31, 2021, Trombetta’s and Stabil’s internal control over financial reporting associated with 13.8% of total assets and 3.5% of total revenues included in the consolidated financial statements of the Company as of and for the year ended December 31, 2021.2023. In making this assessment, we used the criteria set forth by the Committee of Sponsoring Organizations of the Treadway Commission (COSO) in the 2013 Internal Control - Integrated Framework.  Based on our assessment using those criteria, and after consideration of the aforementioned exclusion, we concluded that, as of December 31, 2021,2023, our internal control over financial reporting is effective.
 
Our independent registered public accounting firm, KPMG LLP, has audited our consolidated financial statements as of and for the year ended December 31, 20212023 and has also audited the effectiveness of our internal control over financial reporting as of December 31, 2021.2023.  KPMG’s report appears on the following pages of this “Item 8. Financial Statements and Supplementary Data.”

44
45

REPORT OF INDEPENDENT REGISTERED PUBLIC ACCOUNTING FIRM
INTERNAL CONTROL OVER FINANCIAL REPORTING

To the Stockholders and Board of Directors

Standard Motor Products, Inc. and Subsidiaries:
 
Opinion on Internal Control Over Financial Reporting
 
We have audited Standard Motor Products, Inc.’sInc and SubsidiariesSubsidiaries’ (the “Company”) internal control over financial reporting as of December 31, 2021,2023, based on criteria established in Internal Control – Integrated Framework (2013) issued by the Committee of Sponsoring Organizations of the Treadway Commission. In our opinion, the Company maintained, in all material respects, effective internal control over financial reporting as of December 31, 2021,2023, based on criteria established in Internal Control – Integrated Framework (2013) issued by the Committee of Sponsoring Organizations of the Treadway Commission.
 
We also have audited, in accordance with the standards of the Public Company Accounting Oversight Board (United States) (“PCAOB”)(PCAOB), the consolidated balance sheets of the Company as of December 31, 20212023 and 2020,2022, the related consolidated statements of operations, comprehensive income, changes in stockholders’ equity, and cash flows for each of the years in the three-year period ended December 31, 2021,2023, and the related notes and financial statement Schedule II, Valuation and Qualifying Accounts (collectively, the consolidated financial statements), and our report dated February 23, 2022 expressed22, 2024 expressed an unqualified opinion on those consolidated financial statements.
The Company acquired Trumpet Holdings, Inc. (“Trombetta”) and Stabil Operative Group GmbH, (“Stabil”) during 2021, and management excluded from its assessment of the effectiveness of the Company’s internal control over financial reporting as of December 31, 2021, Trombetta and Stabil’s internal control over financial reporting associated with 13.8% of total assets and 3.5% of total revenues included in the consolidated financial statements of the Company as of and for the year ended December 31, 2021. Our audit of internal control over financial reporting of the Company also excluded an evaluation of the internal control over financial reporting of Trombetta and Stabil.
 
Basis for Opinion
 
The Company’s management is responsible for maintaining effective internal control over financial reporting and for its assessment of the effectiveness of internal control over financial reporting, included in the accompanying Management’s Report on Internal Control over Financial Reporting. Our responsibility is to express an opinion on the Company’s internal control over financial reporting based on our audit. We are a public accounting firm registered with the PCAOB and are required to be independent with respect to the Company in accordance with the U.S. federal securities laws and the applicable rules and regulations of the Securities and Exchange Commission and the PCAOB.
 
We conducted our audit in accordance with the standards of the PCAOB. Those standards require that we plan and perform the audit to obtain reasonable assurance about whether effective internal control over financial reporting was maintained in all material respects. Our audit of internal control over financial reporting included obtaining an understanding of internal control over financial reporting, assessing the risk that a material weakness exists, and testing and evaluating the design and operating effectiveness of internal control based on the assessed risk. Our audit also included performing such other procedures as we considered necessary in the circumstances. We believe that our audit provides a reasonable basis for our opinion.
 
Definition and Limitations of Internal Control Over Financial Reporting
 
A company’s internal control over financial reporting is a process designed to provide reasonable assurance regarding the reliability of financial reporting and the preparation of financial statements for external purposes in accordance with generally accepted accounting principles. A company’s internal control over financial reporting includes those policies and procedures that (1) pertain to the maintenance of records that, in reasonable detail, accurately and fairly reflect the transactions and dispositions of the assets of the company; (2) provide reasonable assurance that transactions are recorded as necessary to permit preparation of financial statements in accordance with generally accepted accounting principles, and that receipts and expenditures of the company are being made only in accordance with authorizations of management and directors of the company; and (3) provide reasonable assurance regarding prevention or timely detection of unauthorized acquisition, use, or disposition of the company’s assets that could have a material effect on the financial statements.
Because of its inherent limitations, internal control over financial reporting may not prevent or detect misstatements. Also, projections of any evaluation of effectiveness to future periods are subject to the risk that controls may become inadequate because of changes in conditions, or that the degree of compliance with the policies or procedures may deteriorate.
 
/s/ KPMG LLP

New York, New York
February 22, 2024
February 23, 2022
REPORT OF INDEPENDENT REGISTERED PUBLIC ACCOUNTING FIRM
CONSOLIDATED FINANCIAL STATEMENTS

To the Stockholders and Board of Directors

Standard Motor Products, Inc. and Subsidiaries:
 
Opinion on the Consolidated Financial Statements
 
We have audited the accompanying consolidated balance sheets of Standard Motor Products, Inc. and SubsidiariesSubsidiaries’ (the “Company”) as of December 31, 20212023 and 2020,2022, the related consolidated statements of operations, comprehensive income, changes in stockholders’ equity, and cash flows for each of the years in the three‑year period ended December 31, 2021,2023, and the related notes and financial statement Schedule II Valuation and Qualifying Accounts (collectively, the “consolidated financial statements”). In our opinion, the consolidated financial statements present fairly, in all material respects, the financial position of the Company as of December 31, 20212023 and 2020,2022, and the results of its operations and its cash flows for each of the years in the three‑year period ended December 31, 2021,2023, in conformity with U.S. generally accepted accounting principles.
 
We also have audited, in accordance with the standards of the Public Company Accounting Oversight Board (United States) (“PCAOB”)(PCAOB), the Company’s internal control over financial reporting as of December 31, 2021,2023, based on criteria established in Internal Control – Integrated Framework (2013) issued by the Committee of Sponsoring Organizations of the Treadway Commission, and our report dated dated February 23, 2022 expressed22, 2024 expressed an unqualified opinion on the effectiveness of the Company’s internal control over financial reporting.
 
Basis for Opinion
 
These consolidated financial statements are the responsibility of the Company’s management. Our responsibility is to express an opinion on these consolidated financial statements based on our audits. We are a public accounting firm registered with the PCAOB and are required to be independent with respect to the Company in accordance with the U.S. federal securities laws and the applicable rules and regulations of the Securities and Exchange Commission and the PCAOB.
 
We conducted our audits in accordance with the standards of the PCAOB. Those standards require that we plan and perform the audit to obtain reasonable assurance about whether the consolidated financial statements are free of material misstatement, whether due to error or fraud. Our audits included performing procedures to assess the risks of material misstatement of the consolidated financial statements, whether due to error or fraud, and performing procedures that respond to those risks. Such procedures included examining, on a test basis, evidence regarding the amounts and disclosures in the consolidated financial statements. Our audits also included evaluating the accounting principles used and significant estimates made by management, as well as evaluating the overall presentation of the consolidated financial statements. We believe that our audits provide a reasonable basis for our opinion.
 
Critical Audit MattersMatter
 
The critical audit mattersmatter communicated below are mattersis a matter arising from the current period audit of the consolidated financial statements that werewas communicated or required to be communicated to the audit committee and that: (1) relaterelates to accounts or disclosures that are material to the consolidated financial statements and (2) involved our especially challenging, subjective, or complex judgments. The communication of a critical audit mattersmatter does not alter in any way our opinion on the consolidated financial statements, taken as a whole, and we are not, by communicating the critical audit mattersmatter below, providing a separate opinionsopinion on the critical audit mattersmatter or on the accounts or disclosures to which they relate.it relates.
 
Asbestos liability and litigation
 
As discussed in in Notes 1 and 2123 to thethe consolidated financial statements, the Company is involved in asbestos litigation and has a potential asbestos liability. As of December 31, 2021,2023, the accrued asbestos liability was $60.5$82 million.  The Company’s asbestos liability represents the low end of the actuarially determined range of the undiscounted liability for settlement payments and awards of asbestos related damages, excluding legal costs and any potential recovery from insurance carriers.
 
We identified the assessment of the asbestos liability recorded as a critical audit matter. This required subjective auditor judgment, due to the nature of the estimate and assumptions, including the applicability of those assumptions to the current facts and circumstances, as well as judgments about future events and uncertainties. Specialized skills were needed to evaluate the Company’s key assumptions. The key assumptions included future claim filings, closed with pay ratios, closed with pay lag patterns, settlement values, and large claims, and ratios of allocated loss adjustment exposure (ALAE) to indemnity.claims. Minor changes to these key assumptions could have had a significant effect on the Company’s assessment of the accrual for the asbestos liability.
 
The following are the primary procedures we performed to address this critical audit matter. We evaluated the design and tested the operating effectiveness of certain internal controls related to the asbestos liability estimation process. This included controls related to the key assumptions and the claims data utilized in the process, and the potential need for an updated actuarial valuation. We evaluated the asbestos related legal cases settled during the year and the number of open cases as of year-end by reading letters received directly from the Company’s external and internal legal counsel. We tested a selection of claims data used in the actuarial model by comparing the selection items to underlying claims documentation. We involved an actuarial professional with specialized skills and knowledge, who assisted in evaluating (1) the future claim filings assumption by developing an independent expectation and comparing it against the Company’s future claim filing assumption, and (2) the closed with pay ratios, closed with pay lag patterns, settlement values, and large claims and ratios of ALAE to indemnity by comparing them to the Company’s historical experience.
 
Fair value of acquisition date intangible assets

As discussed in Note 2 in the consolidated financial statements, in May 2021, the Company acquired Trumpet Holdings, Inc., (“Trombetta) for a purchase price of $111.7 million. As a result of the transaction, the Company acquired certain intangible assets, including customer relationship intangible assets with an acquisition date fair value of $39.4 million.
We identified the evaluation of the fair value of the acquisition date customer relationship intangible assets acquired in the Trombetta transaction as a critical audit matter. A high degree of subjective auditor judgment was required to evaluate the key assumptions used to determine the acquisition-date fair value of the acquired customer relationship assets. The key assumptions developed by the Company included the following for which there was limited observable market information, and the calculated fair value of such assets was sensitive to possible changes to these key assumptions:
forecasted revenues attributable to existing customers
forecasted earnings before interest and taxes (EBIT) margins
customer attrition rate
discount rate.
The following are the primary procedures we performed to address this critical audit matter. We evaluated the design and tested the operating effectiveness of certain internal controls over the Company’s acquisition-date valuation process, including the controls over the development of the key assumptions listed above. We evaluated the Company’s forecasted revenues attributable to existing customers and EBIT margins by comparing these forecasted assumptions to historical information of Trombetta. We involved valuation professionals with specialized skills and knowledge, who assisted in evaluating (1) the estimated annual attrition rate by comparing it to historical data of the Company, and (2) the Company’s discount rate by comparing the rate against a discount rate range that was independently developed using publicly available market data for comparable companies.
/s/ KPMG LLP

We have served as the Company’s auditor since 2010.
 
New York, New York
February 23, 202222, 2024

49
47

STANDARD MOTOR PRODUCTS, INC. AND SUBSIDIARIES

CONSOLIDATED STATEMENTS OF OPERATIONS

 Year Ended December 31,  Year Ended December 31, 
 2021  2020  2019  2023  2022  2021 
 
(Dollars in thousands,
except share and per share data)
  
(Dollars in thousands,
except share and per share data)
 
Net sales $1,298,816  $1,128,588  $1,137,913  $1,358,272  $1,371,815  $1,298,816 
Cost of sales  921,885   791,933   806,113   969,446   989,276   921,885 
Gross profit  376,931   336,655   331,800   388,826   382,539   376,931 
Selling, general and administrative expenses  247,547   224,670   234,715   293,583   276,626   247,547 
Intangible asset impairment  0   2,600   0 
Restructuring and integration expenses  392   464   2,585   2,642   1,891   392 
Other income (expense), net  7   (26)  (5)
Other income, net  76   113   7 
Operating income  128,999   108,895   94,495   92,677   104,135   128,999 
Other non-operating income, net  3,494   812   2,587   2,326   4,814   3,494 
Interest expense  2,028   2,328   5,286   13,287   10,617   2,028 
Earnings from continuing operations before income taxes  130,465   107,379   91,796   81,716   98,332   130,465 
Provision for income taxes  31,044   26,962   22,745   18,368   25,206   31,044 
Earnings from continuing operations  99,421   80,417   69,051   63,348   73,126   99,421 
Loss from discontinued operations, net of income tax benefit of $2,975, $8,089 and $3,912
  (8,467)  (23,024)  (11,134)
Loss from discontinued operations, net of income tax benefit of $10,188, $6,216 and $2,975
  (28,996)  (17,691)  (8,467)
Net earnings 
90,954  
57,393  
57,917   34,352   55,435   90,954 
Net earnings attributable to noncontrolling interest
  68   0   0   204   84   68 
Net earnings attributable to SMP (a)
 $90,886  $
57,393  $
57,917  $34,148  $55,351  $90,886 
                        
Net earnings attributable to SMP
                        
Earnings from continuing operations $
99,353  $
80,417  $
69,051  $63,144  $73,042  $99,353 
Discontinued operations  (8,467)  (23,024)  (11,134)  (28,996)  (17,691)  (8,467)
Total
 $
90,886  $
57,393  $
57,917  $34,148  $55,351  $90,886 
                        
Per share data attributable to SMP
                        
Net earnings per common share – Basic:                        
Earnings from continuing operations $4.49  $3.59  $3.09  $2.91  $3.37  $4.49 
Discontinued operations  (0.39)  (1.02)  (0.50)  (1.34)  (0.82)  (0.39)
Net earnings per common share – Basic $4.10  $2.57  $2.59  $1.57  $2.55  $4.10 
                        
Net earnings per common share – Diluted:                        
Earnings from continuing operations $4.39  $3.52  $3.03  $2.85  $3.30  $4.39 
Discontinued operations  (0.37)  (1.01)  (0.49)  (1.31)  (0.80)  (0.37)
Net earnings per common share – Diluted $4.02  $2.51  $2.54  $1.54  $2.50  $4.02 
                        
Dividend declared per share $1.00  $0.50  $0.92  $1.16  $1.08  $1.00 
                        
Average number of common shares  22,147,479   22,374,123   22,378,414   21,716,177   21,683,719   22,147,479 
Average number of common shares and dilutive common shares  22,616,456   22,825,885   22,818,451   22,161,341   22,139,981   22,616,456 
 
(a)  Throughout this Form 10-K, “SMP” refers to Standard Motor Products, Inc. and subsidiaries.

See accompanying notes to consolidated financial statements.

50
48


STANDARD MOTOR PRODUCTS, INC. AND SUBSIDIARIES

CONSOLIDATED STATEMENTS OF COMPREHENSIVE INCOME

 Year Ended December 31,  Year Ended December 31, 
 2021
  2020
  2019
  2023  2022  2021 
 (In thousands)  (In thousands) 
Net earnings  
$
90,954
  
$
57,393
  
$
57,917
  
$
34,352
  
$
55,435
  
$
90,954
 
Other comprehensive income (loss), net of tax:                        
Foreign currency translation adjustments   
(2,462
)
  
2,929
   
1,024
   
7,447
   
(8,222
)
  
(2,462
)
Derivative instruments
  (924)  3,823    
Pension and postretirement plans
  
(16
)
  
(16
)
  
(19
)
  
(13
)
  
(15
)
  
(16
)
Total other comprehensive income (loss), net of tax
  
(2,478
)
  
2,913
   
1,005
   
6,510
   
(4,414
)
  
(2,478
)
Total comprehensive income   
88,476
   
60,306
   
58,922
   
40,862
   
51,021
   
88,476
 
Comprehensive income (loss) attributable to noncontrolling interest, net of tax:                        
Net earnings   
68
   
0
   
0
   
204
   
84
   
68
 
Foreign currency translation adjustments   
15
   
0
   
0
   
14
   
(113
)
  
15
 
Comprehensive income (loss) attributable to noncontrolling interest, net of tax  
83
   
0
   
0
   
218
   
(29
)
  
83
 
Comprehensive income attributable to SMP  
$
88,393
  
$
60,306
  
$
58,922
  
$
40,644
  
$
51,050
  
$
88,393
 

See accompanying notes to consolidated financial statements.

51
49


STANDARD MOTOR PRODUCTS, INC. AND SUBSIDIARIES

CONSOLIDATED BALANCE SHEETS

  December 31, 
  2021  2020 
  
(Dollars in thousands,
except share data)
 
ASSETS      
CURRENT ASSETS:      
Cash and cash equivalents $21,755  $19,488 
Accounts receivable, less allowances for discounts and expected credit losses of $6,170 and $5,822 in 2021 and 2020, respectively
  180,604   198,039 
Inventories  468,755   345,502 
Unreturned customer inventories  22,268   19,632 
Prepaid expenses and other current assets  17,823   15,875 
Total current assets  711,205   598,536 
         
Property, plant and equipment, net  102,786   89,105 
Operating lease right-of-use assets  40,469   29,958 
Goodwill  131,652   77,837 
Other intangibles, net  106,234   54,004 
Deferred incomes taxes  36,126   44,770 
Investments in unconsolidated affiliates  44,087   40,507 
Other assets  25,402   21,823 
Total assets $1,197,961  $956,540 
         
LIABILITIES AND STOCKHOLDERS’ EQUITY        
CURRENT LIABILITIES:        
Notes payable $125,298  $10,000 
Current portion of other debt  3,117   135 
Accounts payable  137,167   100,018 
Sundry payables and accrued expenses  57,182   47,078 
Accrued customer returns  42,412   40,982 
Accrued core liability  23,663   22,014 
Accrued rebates  42,472   46,437 
Payroll and commissions  45,058   35,938 
Total current liabilities  476,369   302,602 
         
Long-term debt  21   97 
Noncurrent operating lease liabilities  31,206   22,450 
Other accrued liabilities  25,040   25,929 
Accrued asbestos liabilities  52,698   55,226 
Total liabilities  585,334   406,304 
Commitments and contingencies  0   0 
         
Stockholders’ equity:        
Common Stock - par value $2.00 per share:
        
Authorized 30,000,000 shares, issued 23,936,036 shares
  47,872   47,872 
Capital in excess of par value  105,377   105,084 
Retained earnings  532,319   463,612 
Accumulated other comprehensive income  (8,169)  (5,676)
Treasury stock - at cost (1,911,792 shares and 1,586,923 shares in 2021 and 2020, respectively)
  (75,819)  (60,656)
Total SMP stockholders’ equity  601,580   550,236 
Noncontrolling interest
  11,047   0 
Total stockholders’ equity
  612,627   550,236 
Total liabilities and stockholders’ equity $1,197,961  $956,540 

See accompanying notes to consolidated financial statements.
52


STANDARD MOTOR PRODUCTS, INC. AND SUBSIDIARIES

CONSOLIDATED STATEMENTS OF CASH FLOWS

  Year Ended December 31, 
  2021  2020  2019 
  (In thousands) 
CASH FLOWS FROM OPERATING ACTIVITIES:         
Net earnings $90,954  $57,393  $57,917 
Adjustments to reconcile net earnings to net cash provided by operating activities:            
Depreciation and amortization  27,243   26,323   25,809 
Amortization of deferred financing cost  228   228   225 
Increase (decrease) to allowance for expected credit losses
  451   396   (295)
Increase (decrease) to inventory reserves
  (585)  5,962   4,858 
Intangible asset impairment  0   2,600   0 
Equity (income) from joint ventures
  (3,295)  (820)  (2,865)
Employee Stock Ownership Plan allocation  2,513   2,301   2,519 
Stock-based compensation  9,479   8,101   6,917 
(Increase) decrease in deferred income taxes  (1,801)  (8,334)  4,736 
Increase in tax valuation allowance  466   864   358 
Loss on discontinued operations, net of tax  8,467   23,024   11,134 
Change in assets and liabilities:            
(Increase) decrease in accounts receivable  28,464   (71,933)  2,789 
(Increase) decrease in inventories  (107,609)  17,984   (17,901)
Increase in prepaid expenses and other current assets  (843)  (370)  (8,296)
Increase (decrease) in accounts payable  33,046   7,428   (1,950)
Increase (decrease) in sundry payables and accrued expenses  13,430   40,651   (2,957)
Net changes in other assets and liabilities  (15,044)  (13,902)  (6,070)
Net cash provided by operating activities  85,564   97,896   76,928 
             
CASH FLOWS FROM INVESTING ACTIVITIES:            
Acquisitions of and investments in businesses, net of cash acquired
  (125,419)  0   (43,490)
Net proceeds from sale of Grapevine, Texas facility  0   0   4,801 
Capital expenditures  (25,875)  (17,820)  (16,185)
Other investing activities  45   21   62 
Net cash used in investing activities  (151,249)  (17,799)  (54,812)
             
CASH FLOWS FROM FINANCING ACTIVITIES:            
Net borrowings (repayments) under line-of-credit agreements  115,298   (42,460)  8,771 
Net borrowings (repayments) of other debt and lease obligations  3,048   (4,248)  (911)
Purchase of treasury stock  (26,862)  (13,482)  (10,738)
Dividends paid  (22,179)  (11,218)  (20,593)
Increase (decrease) in overdraft balances  247   (108)  93 
Dividends paid to noncontrolling interest
  (540)  0   0 
Net cash provided by (used in) financing activities
  69,012   (71,516)  (23,378)
Effect of exchange rate changes on cash  (1,060)  535   496 
Net increase (decrease) in cash and cash equivalents  2,267   9,116   (766)
CASH AND CASH EQUIVALENTS at beginning of year  19,488   10,372   11,138 
CASH AND CASH EQUIVALENTS at end of year $21,755  $19,488  $10,372 
             
Supplemental disclosure of cash flow information:            
Cash paid during the year for:            
Interest $1,721  $2,187  $5,030 
Income taxes $26,323  $24,640  $22,267 

See accompanying notes to consolidated financial statements.
53


STANDARD MOTOR PRODUCTS, INC. AND SUBSIDIARIES
CONSOLIDATED STATEMENTS OF CHANGES IN STOCKHOLDERS’ EQUITY
Years Ended December 31, 2021, 2020 and 2019

  
Common
Stock
  
Capital in
Excess of
Par Value
  
Retained
Earnings
  
Accumulated
Other
Comprehensive
Income (Loss)
  
Treasury
Stock
  
Total
SMP
  
Non-
controlling
Interest
  Total 
(In thousands)      
BALANCE AT DECEMBER 31, 2018 $47,872  $102,470  $380,113  $(9,594) $(53,660) $467,201  $0  $467,201 
Net earnings  0   0   57,917   0   0   57,917   0   57,917 
Other comprehensive loss, net of tax  0   0   0   1,005   0   1,005   0   1,005 
Cash dividends paid ($0.92 per share)
  0   0   (20,593)  0   0   (20,593)  0   (20,593)
Purchase of treasury stock  0   0   0   0   (10,738)  (10,738)  0   (10,738)
Stock-based compensation  0   (473)  0   0   7,390   6,917   0   6,917 
Employee Stock Ownership Plan  0   745   0   0   1,774   2,519   0   2,519 
                                 
BALANCE AT DECEMBER 31, 2019  47,872   102,742   417,437   (8,589)  (55,234)  504,228   0   504,228 
Net earnings  0   0   57,393   0   0   57,393   0   57,393 
Other comprehensive income, net of tax  0   0   0   2,913   0   2,913   0   2,913 
Cash dividends paid ($0.50 per share)
  0   0   (11,218)  0   0   (11,218)  0   (11,218)
Purchase of treasury stock  0   0   0   0   (13,482)  (13,482)  0   (13,482)
Stock-based compensation  0   1,712   0   0   6,389   8,101   0   8,101 
Employee Stock Ownership Plan  0   630   0   0   1,671   2,301   0   2,301 
                                 
BALANCE AT DECEMBER 31, 2020  47,872   105,084   463,612   (5,676)  (60,656)  550,236   0   550,236 
Noncontrolling interest in business acquired
  0   0   0   0   0   0   11,504   11,504 
Net earnings  0   0   90,886   0   0   90,886   68   90,954 
Other comprehensive loss, net of tax  0   0   0   (2,493)  0   (2,493)  15   (2,478)
Cash dividends paid ($1.00 per share)
  0   0   (22,179)  0   0   (22,179)  0   (22,179)
Purchase of treasury stock  0   0   0   0   (26,862)  (26,862)  0   (26,862)
Dividends paid to noncontrolling interest
  0   0   0   0   0   0   (540)  (540)
Stock-based compensation  0   159   0   0   9,320   9,479   0   9,479 
Employee Stock Ownership Plan  0   134   0   0   2,379   2,513   0   2,513 
                                 
BALANCE AT DECEMBER 31, 2021 $47,872  $105,377  $532,319  $(8,169) $(75,819) $601,580  $11,047  $612,627 
  December 31, 
  2023
  2022
 
  
(Dollars in thousands,
except share data)
 
ASSETS      
CURRENT ASSETS:      
Cash and cash equivalents $32,526  $21,150 
Accounts receivable, less allowances for discounts and expected credit losses of $8,045 and $5,375 in 2023 and 2022, respectively
  160,282   167,638 
Inventories  507,075   528,715 
Unreturned customer inventories  18,240   19,695 
Prepaid expenses and other current assets  26,100   25,241 
Total current assets  744,223   762,439 
         
Property, plant and equipment, net  121,872   107,148 
Operating lease right-of-use assets  100,065   49,838 
Goodwill  134,729   132,087 
Other intangibles, net  92,308   100,504 
Deferred incomes taxes  40,533   33,658 
Investments in unconsolidated affiliates  24,050   41,745 
Other assets  35,267   27,510 
Total assets $1,293,047  $1,254,929 
LIABILITIES AND STOCKHOLDERS’ EQUITY        
CURRENT LIABILITIES:        
Current portion of revolving credit facility
 $  $50,000 
Current portion of term loan and other debt
  5,029   5,031 
Accounts payable  107,455   89,247 
Sundry payables and accrued expenses  63,303   49,990 
Accrued customer returns  38,238   37,169 
Accrued core liability  18,399   22,952 
Accrued rebates  42,278   37,381 
Payroll and commissions  29,561   31,361 
Total current liabilities  304,263   323,131 
         
Long-term debt  151,182   184,589 
Noncurrent operating lease liabilities  88,974   40,709 
Other accrued liabilities  25,742   22,157 
Accrued asbestos liabilities  72,013   63,305 
Total liabilities  642,174   633,891 
Commitments and contingencies      
         
Stockholders’ equity:        
Common Stock - par value $2.00 per share:
        
Authorized 30,000,000 shares, issued 23,936,036 shares
  47,872   47,872 
Capital in excess of par value  101,751   105,615 
Retained earnings  573,226   564,242 
Accumulated other comprehensive income  (5,974)  (12,470)
Treasury stock - at cost (2,018,982 shares and 2,350,377 shares in 2023 and 2022, respectively)
  (81,811)  (95,239)
Total SMP stockholders’ equity  635,064   610,020 
Noncontrolling interest
  15,809   11,018 
Total stockholders’ equity
  650,873   621,038 
Total liabilities and stockholders’ equity $1,293,047  $1,254,929 

See accompanying notes to consolidated financial statements.


5450

STANDARD MOTOR PRODUCTS, INC. AND SUBSIDIARIES

CONSOLIDATED STATEMENTS OF CASH FLOWS

  Year Ended December 31, 
  2023
  2022
  2021
 
  (In thousands) 
CASH FLOWS FROM OPERATING ACTIVITIES:         
Net earnings $34,352  $55,435  $90,954 
Adjustments to reconcile net earnings to net cash provided by (used in) operating activities:            
Depreciation and amortization  29,022   28,298   27,243 
Amortization of deferred financing cost  491   421   228 
Increase (decrease) to allowance for expected credit losses
  2,943   (757)  451 
Increase (decrease) to inventory reserves
  3,068   6,035   (585)
Customer bankruptcy charge
     7,002    
Equity income from joint ventures
  (2,070)  (3,464)  (3,295)
Employee Stock Ownership Plan allocation  2,966   2,296   2,513 
Stock-based compensation  6,598   8,178   9,479 
(Increase) in deferred income taxes
  (6,952)  (713)  (1,801)
Increase in tax valuation allowance  674   1,068   466 
Loss on discontinued operations, net of tax  28,996   17,691   8,467 
Change in assets and liabilities:            
Decrease in accounts receivable  7,965   6,916   28,464 
(Increase) decrease in inventories  29,494   (67,495)  (107,609)
(Increase) in prepaid expenses and other current assets
  (70)  (5,509)  (843)
Increase (decrease) in accounts payable  19,645   (48,604)  33,046 
Increase (decrease) in sundry payables and accrued expenses  (4,284)  (29,089)  13,430 
Net changes in other assets and liabilities  (8,578)  (5,242)  (15,044)
Net cash provided by (used in) operating activities
  144,260   (27,533)  85,564 
             
CASH FLOWS FROM INVESTING ACTIVITIES:            
Acquisitions of and investments in businesses
  (3,954)  (1,934)  (125,419)
Cash acquired in step acquisition
  6,779       
Capital expenditures  (28,633)  (25,956)  (25,875)
Other investing activities  108   73   45 
Net cash used in investing activities  (25,700)  (27,817)  (151,249)
             
CASH FLOWS FROM FINANCING ACTIVITIES:            
Borrowings under term loan
     100,000    
Repayments of term loan
  (5,000)  (2,500)   
Net borrowings (repayments) under revolving credit facilities
  (78,500)  16,702   115,298 
Net borrowings (repayments) of other debt and lease obligations
  (58)  (2,895)  3,048 
Purchase of treasury stock     (29,656)  (26,862)
Payments of debt issuance costs
     (2,128)   
Increase (decrease) in overdraft balances  (189)  (595)  247 
Dividends paid
  (25,164)  (23,428)  (22,179)
Dividends paid to noncontrolling interest
  (700)     (540)
Net cash provided by (used in) financing activities
  (109,611)  55,500   69,012 
Effect of exchange rate changes on cash  2,427   (755)  (1,060)
Net increase (decrease) in cash and cash equivalents  11,376   (605)  2,267 
CASH AND CASH EQUIVALENTS at beginning of year  21,150   21,755   19,488 
CASH AND CASH EQUIVALENTS at end of year $32,526  $21,150  $21,755 
             
Supplemental disclosure of cash flow information:            
Cash paid during the year for:            
Interest $14,597  $9,892  $1,721 
Income taxes $16,019  $25,015  $26,323 

See accompanying notes to consolidated financial statements.

STANDARD MOTOR PRODUCTS, INC. AND SUBSIDIARIES
CONSOLIDATED STATEMENTS OF CHANGES IN STOCKHOLDERS’ EQUITY
Years Ended December 31, 2023, 2022 and 2021

  
Common
Stock
  
Capital in
Excess of Par
Value
  
Retained
Earnings
  
Accumulated
Other
Comprehensive
Income (Loss)
  
Treasury
Stock
  Total SMP  
Non-
controlling
Interest
  Total 
(In thousands)      
BALANCE AT DECEMBER 31, 2020 $47,872  $105,084  $463,612  $(5,676) $(60,656) $550,236  $  $550,236 
Noncontrolling interest in business acquired                    11,504   11,504 
Net earnings        90,886         90,886   68   90,954 
Other comprehensive loss, net of tax           (2,493)     (2,493)  15   (2,478)
Cash dividends paid ($1.00 per share)
        (22,179)        (22,179)     (22,179)
Purchase of treasury stock              (26,862)  (26,862)     (26,862)
Dividends paid to noncontrolling interest
                    (540)  (540)
Stock-based compensation     159         9,320   9,479      9,479 
Employee Stock Ownership Plan     134         2,379   2,513      2,513 
                                 
BALANCE AT DECEMBER 31, 2021
  47,872   105,377   532,319   (8,169)  (75,819)  601,580   11,047   612,627 
Net earnings        55,351         55,351   84   55,435 
Other comprehensive loss, net of tax           (4,301)     (4,301)  (113)  (4,414)
Cash dividends paid ($1.08 per share)
        (23,428)        (23,428)     (23,428)
Purchase of treasury stock              (29,656)  (29,656)     (29,656)
Stock-based compensation     (131)        8,309   8,178      8,178 
Employee Stock Ownership Plan     369         1,927   2,296      2,296 
                                 
BALANCE AT DECEMBER 31, 2022
  47,872   105,615   564,242   (12,470)  (95,239)  610,020   11,018   621,038 
Noncontrolling interest in step acquisition
                    5,273   5,273 
Net earnings        34,148         34,148   204   34,352 
Other comprehensive loss, net of tax           6,496      6,496   14   6,510 
Cash dividends paid ($1.16 per share)
        (25,164)        (25,164)     (25,164)
Dividends paid to noncontrolling interest                    (700)  (700)
Stock-based compensation     (3,880)        10,478   6,598      6,598 
Employee Stock Ownership Plan     16         2,950   2,966      2,966 
                                 
BALANCE AT DECEMBER 31, 2023
 $47,872  $101,751  $573,226  $(5,974) $(81,811) $635,064  $15,809  $650,873 

See accompanying notes to consolidated financial statements.

STANDARD MOTOR PRODUCTS, INC. AND SUBSIDIARIES
NOTES TO CONSOLIDATED FINANCIAL STATEMENTS

1. Summary of Significant Accounting Policies

Principles of Consolidation

Standard Standard Motor Products, Inc. and its subsidiaries (referred to hereinafter in these notes to the consolidated financial statements as “we,” “us,” “our,” “SMP,” or the “Company”) is a leading automotive parts manufacturer and distributor of engine management and temperature control systems of motor vehiclespremium replacement parts in the automotive aftermarket, industry withand a complementary focus on the heavy duty, industrialcustom-engineered solutions provider to vehicle and equipment manufacturers in diverse non-aftermarket end markets.  Our automotive aftermarket is comprised of two segments, Vehicle Control and Temperature Control, while our Engineered Solutions segment offers a broad array of conventional and future-oriented technologies in markets for commercial and light vehicles, construction, agriculture, power sports, marine, hydraulics and lawn and garden.  We sell our products primarily to retailers, warehouse distributors, original equipment manufacturers and original equipment service markets.part operations in the United States, Canada, Europe, Asia, Mexico and other Latin American countries.

The consolidated financial statements include our accounts and all domestic and international companies in which we have more than a 50% equity ownership, except in instances where the minority shareholder maintains substantive participating rights, in which case we follow the equity method of accounting.  In instances where we have more than a 50% equity ownership and the minority shareholder does not maintain substantive participating rights, our consolidated financial statements include the accounts of the company on a consolidated basis with its net income and equity reported at amounts attributable to both our equity position and that of the noncontrolling interest. Investments in unconsolidated affiliates are accounted for on the equity method, as we do not have a controlling financial interest but have the ability to exercise significant influence.  All significant inter-company items have been eliminated.

Use of Estimates

The
The preparation of consolidated annual and quarterly financial statements in conformity with generally accepted accounting principles requires management to make estimates and assumptions that affect the reported amount of assets and liabilities, the disclosure of contingent assets and liabilities at the date of our consolidated financial statements, and the reported amounts of revenue and expenses during the reporting periods.  We have made a number of estimates and assumptions in the preparation of these consolidated financial statements.  We can give no assurances assurance that actual results will not differ from those estimates.  Although we do not believe that there is a reasonable likelihood that there will be a material change in the future estimates, or in the assumptions that we use in calculating the estimates, the uncertain future effects, if any, of disruptions in the COVID-19 pandemic,supply chain caused by geo-political risks, future increases in interest rates, inflation, macroeconomic uncertainty, and other unforeseen changes in the industry, or business, could materially impact the estimates, and may have a material adverse effect on our business, financial condition and results of operations.  Some of the more significant estimates include allowances for doubtful accounts,expected credit losses, cash discounts, valuation of inventory, valuation of long-lived assets, goodwill and other intangible assets, depreciation and amortization of long-lived assets, product liability exposures, asbestos, environmental and litigation matters, valuation of deferred tax assets, share based compensation and sales returns and other allowances.

Reclassification

Certain prior period amounts in the accompanying consolidated financial statements and related notes have been reclassified to conform to the 20212023 presentation.

53


STANDARD MOTOR PRODUCTS, INC. AND SUBSIDIARIES
NOTES TO CONSOLIDATED FINANCIAL STATEMENTS (Continued)
Reportable Segments


Beginning on January 1, 2023, we reorganized our business into three operating segments – Vehicle Control, Temperature Control and Engineered Solutions. The new operating segment structure better aligns our operations with our strategic focus on diversifying our business, provides greater transparency into our positioning to capture opportunities for growth in the future, and provides clarity regarding the unique dynamics and margin profiles of the markets served by each segment.  Prior period segment results have been reclassified to conform to our operating segment reorganization.  For additional information related to our segment reorganization, see Note 8, “Goodwill and Acquired Intangible Assets,” Note 21, “Industry Segment and Geographic Data” and Note 22, “Net Sales.”

Cash and Cash Equivalents

We consider all highly liquid investments purchased with a maturity of three months or less to be cash equivalents.

55

Index
STANDARD MOTOR PRODUCTS, INC. AND SUBSIDIARIES

NOTES TO CONSOLIDATED FINANCIAL STATEMENTS (continued)
Allowance for Expected Credit Losses and Cash Discounts

We do not generally require collateral for our trade accounts receivable. Accounts receivable have been reduced by an allowance for amounts that may become uncollectible in the future. These allowances are established based on a combination of write-off history, supportable forecasts, aging analysis, and specific account evaluations. When a receivable balance is known to be uncollectible, it is written off against the allowance for expected credit losses. Cash discounts are provided based on an overall average experience rate applied to qualifying accounts receivable balances.

Inventories

Inventories are valued at the lower of cost and net realizable value.  Cost is determined on the first-in first-out basis.  Where appropriate, standard cost systems are utilized for purposes of determining cost; the standards are adjusted as necessary to ensure they approximate actual costs.  Estimates of lower of cost and net realizable value of inventory are determined by comparing the actual cost of the product to the estimated selling prices in the ordinary course of business less reasonably predictable costs of completion, disposal and transportation of the inventory.

We also evaluate inventories on a regular basis to identify inventory on hand that may be obsolete or in excess of current and future projected market demand.  For inventory deemed to be obsolete, we provide a reserve on the full value of the inventory.  Inventory that is in excess of current and projected use is reduced by an allowance to a level that approximates our estimate of future demand.  Future projected demand requires management judgment and is based upon (a) our review of historical trends and (b) our estimate of projected customer specific buying patterns and trends in the industry and markets in which we do business.  Using rolling twelve month historical information, we estimate future demand on a continuous basis.  The historical volatility of such estimates has been minimal.  We maintain provisions for inventory reserves of $46.2$42.9 million and $49.4$42.5 million as of December 31, 20212023 and 2020,2022, respectively.

We utilize cores (used parts) in our remanufacturing processes for air conditioning compressors, diesel injectors, and diesel pumps.  The production of air conditioning compressors, diesel injectors, and diesel pumps involves the rebuilding of used cores, which we acquire either in outright purchases from used parts brokers, or from returns pursuant to an exchange program with customers. Under such exchange programs, at the time of sale of air conditioning compressors, diesel injectors, and diesel pumps, we estimate the core expected to be returned from the customer and record the estimated return as unreturned customer inventory.

54


STANDARD MOTOR PRODUCTS, INC. AND SUBSIDIARIES
NOTES TO CONSOLIDATED FINANCIAL STATEMENTS (Continued)
In addition, many of our customers can return inventory to us based upon customer warranty and overstock arrangements within customer specific limits.  At the time products are sold, we accrue a liability for product warranties and overstock returns and record as unreturned customer inventory our estimate of anticipated customer returns.  Estimates are based upon historical information on the nature, frequency and probability of the customer return.  Unreturned core, warranty and overstock customer inventory is recorded at standard cost.  Revision to these estimates is made when necessary, based upon changes in these factors.  We regularly study trends of such claims.

56

Index
STANDARD MOTOR PRODUCTS, INC. AND SUBSIDIARIES

NOTES TO CONSOLIDATED FINANCIAL STATEMENTS (continued)
Property, Plant and Equipment

Property, plant and equipment are recorded at historical cost and are depreciated using the straight-line method of depreciation over the estimated useful lives as follows:

Estimated Life
Buildings
25 to 33-1/2years
Building improvements10 to 25 years
Machinery and equipment
5 to 12 years
Tools, dies and auxiliary equipment
3 to 8 years
Furniture and fixtures
3 to 12 years

Leasehold improvements are depreciated over the shorter of the estimated useful life or the term of the lease.  Costs related to maintenance and repairs which do not prolong the assets useful lives are expensed as incurred.  We assess our property, plant and equipment to be held and used for impairment when indicators are present that the carrying value may not be recoverable.
 
Leases

We determine if an arrangement is a lease at inception.  For operating leases, we include and report operating lease right-of-use (“ROU”) assets, sundry payables and accrued expenses, and noncurrent operating lease liabilities on our consolidated balance sheet for leases with a term longer than twelve months.  Finance leases are reported on our consolidated balance sheets in property, plant and equipment, current portion of other debt, and long-term debt.

Operating lease ROU assets and operating lease liabilities are recognized at the lease commencement date based on the present value of the total lease payments over the lease term.  Our ROU assets represent the right to use an underlying leased asset over the existing lease term, and the corresponding lease liabilities represent our obligation to make lease payments arising from the lease agreement.  As most of our leases do not provide for an implicit rate, we use our secured incremental borrowing rate based on the information available when determining the present value of our lease payments.  Our lease terms may include options to terminate, or extend, our lease when it is reasonably certain that we will execute the option.  Lease agreements may contain lease and non-lease components, which are generally accounted for separately.  Operating lease expense is recognized on a straight-line basis over the lease term.

Valuation of Long-Lived and Intangible Assets and Goodwill

At acquisition, we estimate and record the fair value of purchased intangible assets, which primarily consist of customer relationships, trademarks and trade names, patents, developed technology and intellectual property, and non-compete agreements.  Intangible assets acquired through business combinations are subject to potential adjustments within the measurement period, which is up to one year from the acquisition date.  Valuing intangible assets requires the use of significant estimates and assumptions.  As related to valuing customer relationships, significant estimates and assumptions used include but are not limited to: (1) forecasted revenues attributable to existing customers; (2) forecasted earnings before interest and taxes (“EBIT”) margins; (3) customer attrition rates; and (4) the discount rate.  Goodwill is the excess of the purchase price over the fair value of identifiable net assets acquired in business combinations.  Goodwill and certain other intangible assets having indefinite lives are not amortized to earnings, but instead are subject to periodic testing for impairment.  Intangible assets determined to have definite lives are amortized over their remaining useful lives.  We believe that the fair value of acquired identifiable net assets, including intangible assets, are based upon reasonable estimates and assumptions.

57
55

STANDARD MOTOR PRODUCTS, INC. AND SUBSIDIARIES

NOTES TO CONSOLIDATED FINANCIAL STATEMENTS (continued)(Continued)
We assess the impairment of long‑lived assets, identifiable intangibles assets and goodwill whenever events or changes in circumstances indicate that the carrying value may not be recoverable. With respect to goodwill and identifiable intangible assets having indefinite lives, we test for impairment on an annual basis or in interim periods if an event occurs or circumstances change that may indicate the fair value is below its carrying amount.  Factors we consider important, which could trigger an impairment review, include the following: (a) significant underperformance relative to expected historical or projected future operating results; (b) significant changes in the manner of our use of the acquired assets or the strategy for our overall business; and (c) significant negative industry or economic trends. We review the fair values using the discounted cash flows method and market multiples.

When performing our evaluation of goodwill for impairment, if we conclude qualitatively that it is not more likely than not that the fair value of the reporting unit is less than its carrying amount, then a quantitative impairment test would not be required.  If we are unable to reach this conclusion, then we would perform a goodwill quantitative impairment test.  In performing the quantitative test, the fair value of the reporting unit is compared to its carrying amount.  A charge for impairment is recognized by the amount by which the reporting unit’s carrying amount exceeds its fair value, not to exceed the total amount of goodwill allocated to the reporting unit.

Identifiable intangible assets having indefinite lives are reviewed for impairment on an annual basis using a methodology similar with that used to evaluate goodwill.  Intangible assets having definite lives and other long-lived assets are reviewed for impairment whenever events such as product discontinuance, plant closures, product dispositions or other changes in circumstances indicate that the carrying amount may not be recoverable.  In reviewing intangible assets having definite lives and other long-lived assets for impairment, we compare the carrying value of such assets to the estimated undiscounted future cash flows expected from the use of the assets and their eventual disposition. When the estimated undiscounted future cash flows are less than their carrying amount, an impairment loss is recognized equal to the difference between the assets fair value and their carrying value.

There are inherent assumptions and estimates used in developing future cash flows requiring our judgment in applying these assumptions and estimates to the analysis of identifiable intangibles and long‑lived asset impairment including projecting revenues, interest rates, tax rates and the cost of capital.  Many of the factors used in assessing fair value are outside our control and it is reasonably likely that assumptions and estimates will change in future periods.  These changes can result in future impairments.  In the event our planning assumptions were modified resulting in impairment to our assets, we would be required to include an expense in our statement of operations, which could materially impact our business, financial condition and results of operations.

Foreign Currency Translation

Assets and liabilities of our foreign operations are translated into U.S. dollars at year-end exchange rates.  Income statement accounts are translated using the average exchange rates prevailing during the year.  The resulting translation adjustments are recorded as a separate component of accumulated other comprehensive income (loss) and remains there until the underlying foreign operation is liquidated or substantially disposed of.  Foreign currency transaction gains or losses are recorded in the statement of operations under the caption “other non-operating income (expense), net.”

56


STANDARD MOTOR PRODUCTS, INC. AND SUBSIDIARIES
NOTES TO CONSOLIDATED FINANCIAL STATEMENTS (Continued)
Revenue Recognition

We derive our revenue primarily from vehicle aftermarket sales of replacement parts for motor vehicles from bothin our Engine ManagementVehicle Control and Temperature Control Segments.Segments, and non-aftermarket sales in our Engineered Solutions Segment. We recognize revenues when our performance obligation has been satisfied and the control of products has been transferred to a customer which typically occurs upon shipment.  Revenue is measured as the amount of consideration we expect to receive in exchange for the transfer of goods or providing services. The amount of consideration we receive and revenue we recognize depends on the marketing incentives, product warranty and overstock returns we offer to our customers.  For certain of our sales of remanufactured products, we also charge our customers a deposit for the return of a used core component which we can use in our future remanufacturing activities.  Such deposit is not recognized as revenue at the time of the sale but rather carried as a core liability.  At the same time, we estimate the core expected to be returned from the customer and record the estimated return as unreturned customer inventory.  The liability is extinguished when a core is actually returned to us, or at period end when we estimate and recognize revenue for the core deposits not expected to be returned.  We estimate and record provisions for cash discounts, quantity rebates, sales returns and warranties in the period the sale is recorded, based upon our prior experience and current trends.  Significant management judgments and estimates must be made and used in estimating sales returns and allowances relating to revenue recognized in any accounting period.

58

Index
STANDARD MOTOR PRODUCTS, INC. AND SUBSIDIARIES

NOTES TO CONSOLIDATED FINANCIAL STATEMENTS (continued)
Product Warranty and Overstock Returns

Many of our products carry a warranty ranging from a 90-day limited warranty to a lifetime limited warranty, which generally covers defects in materials or workmanship and failure to meet industry published specifications and/or the result of installation error.  In addition to warranty returns, we also permit our customers to return new, undamaged products to us within customer-specific limits (which are generally limited to a specified percentage of their annual purchases from us) in the event that they have overstocked their inventories. At the time products are sold, we accrue a liability for product warranties and overstock returns as a percentage of sales based upon estimates established using historical information on the nature, frequency and average cost of the claim and the probability of the customer return.  At the same time, we record an estimate of anticipated customer returns as unreturned customer inventory.  Significant judgments and estimates must be made and used in connection with establishing the sales returns and other allowances in any accounting period.  Revision to these estimates is made when necessary, based upon changes in these factors.  We regularly study trends of such claims.

New Customer Acquisition Costs

New customer acquisition costs refer to arrangements pursuant to which we incur change-over costs to induce a new customer to switch from a competitor’s brand.  In addition, change-over costs include the costs related to removing the new customer’s inventory and replacing it with our inventory commonly referred to as a stock lift. New customer acquisition costs are recorded as a reduction to revenue when incurred.

Selling, General and Administration Expenses

Selling, general and administration expenses include shipping costs and advertising, which are expensed as incurred.  Shipping and handling charges, as well as freight to customers, are included in distribution expenses as part of selling, general and administration expenses.

57


STANDARD MOTOR PRODUCTS, INC. AND SUBSIDIARIES
NOTES TO CONSOLIDATED FINANCIAL STATEMENTS (Continued)
Deferred Financing Costs

Deferred financing costs represent costs incurred in conjunction with our debt financing activities.  Deferred financing costs related to our term loan and revolving credit facilityfacilities are capitalized and amortized over the life of the related financing arrangement.  If the debt is retired early, the related unamortized deferred financing costs are written off in the period the debt is retired and are recorded in the statement of operations under the caption other non-operating income (expense), net.

59

Index
STANDARD MOTOR PRODUCTS, INC. AND SUBSIDIARIES

NOTES TO CONSOLIDATED FINANCIAL STATEMENTS (continued)
Accounting for Income Taxes

Income taxes are calculated using the asset and liability method.  Deferred tax assets and liabilities are determined based on the estimated future tax effects of temporary differences between the financial statement carrying amounts and the tax bases of assets and liabilities, as measured by the current enacted tax rates.
 
We maintain valuation allowances when it is more likely than not that all or a portion of a deferred asset will not be realized.  In determining whether a valuation allowance is warranted, we consider all positive and negative evidence and all sources of taxable income such as prior earnings history, expected future earnings, carryback and carryforward periods and tax strategies to estimate if sufficient future taxable income will be generated to realize the deferred tax asset.  The assessment of the adequacy of our valuation allowance is based on our estimates of taxable income by jurisdiction in which we operate and the period over which our deferred tax assets will be recoverable.  In the event that actual results differ from these estimates, or we adjust these estimates in future periods for current trends or expected changes in our estimating assumptions, we may need to modify the level of valuation allowance which could materially impact our business, financial condition and results of operations.

The valuation allowance of $2.13.8 million as of December 31, 20212023 is intended to provide for the uncertainty regarding the ultimate realization of our U.S. foreign tax credit carryovers and foreign net operating loss carryovers.  Based on these considerations, we believe it is more likely than not that we will realize the benefit of the net deferred tax asset of $36.140.5 million as of December 31, 20212023, which is net of the remaining valuation allowance.

Tax benefits are recognized for an uncertain tax position when, in management’s judgment, it is more likely than not that the position will be sustained upon examination by a taxing authority.  For a tax position that meets the more-likely-than-not recognition threshold, the tax benefit is measured as the largest amount that is judged to have a greater than 50% likelihood of being realized upon ultimate settlement with a taxing authority.  The liability associated with unrecognized tax benefits is adjusted periodically due to changing circumstances and when new information becomes available.  Such adjustments are recognized entirely in the period in which they are identified.  During the years ended December 31, 2021, 20202023, 2022 and 20192021, we did not establish a liability for uncertain tax positions.

Environmental Reserves

We are subject to various U.S. Federal and state and local environmental laws and regulations and are involved in certain environmental remediation efforts.  We estimate and accrue our liabilities resulting from such matters based upon a variety of factors including the assessments of environmental engineers and consultants who provide estimates of potential liabilities and remediation costs.  Such estimates are not discounted to reflect the time value of money due to the uncertainty in estimating the timing of the expenditures, which may extend over several years.  Potential recoveries from insurers or other third parties of environmental remediation liabilities are recognized independently from the recorded liability, and any asset related to the recovery will be recognized only when the realization of the claim for recovery is deemed probable.

60
58

STANDARD MOTOR PRODUCTS, INC. AND SUBSIDIARIES

NOTES TO CONSOLIDATED FINANCIAL STATEMENTS (continued)(Continued)
Asbestos Litigation

In evaluating our potential asbestos-related liability, we have considered various factors including, among other things, an actuarial study of the asbestos related liabilities performed by an independent actuarial firm, our settlement amounts and whether there are any co-defendants, the jurisdiction in which lawsuits are filed, and the status and results of such claims.  As is our accounting policy, we consider the advice of actuarial consultants with experience in assessing asbestos-related liabilities to estimate our potential claim liability; and perform an actuarial evaluation in the third quarter of each year and whenever events or changes in circumstances indicate that additional provisions may be necessary.  The methodology used to project asbestos-related liabilities and costs in our actuarial study considered: (1) historical data available from publicly available studies; (2) an analysis of our recent claims history to estimate likely filing rates into the future; (3) an analysis of our currently pending claims; (4) an analysis of our settlements and awards of asbestos-related damages to date; and (5) an analysis of closed claims with pay ratios and lag patterns in order to develop average future settlement values.  Based on the information contained in the actuarial study and all other available information considered by us, we have concluded that no amount within the range of settlement payments and awards of asbestos-related damages was more likely than any other and, therefore, in assessing our asbestos liability we compare the low end of the range to our recorded liability to determine if an adjustment is required.  Future legal costs are expensed as incurred and reported in earnings (loss) from discontinued operations in the accompanying statement of operations.
 
We plan to perform an annual actuarial evaluation during the third quarter of each year for the foreseeable future and whenever events or changes in circumstances indicate that additional provisions may be necessary. Given the uncertainties associated with projecting such matters into the future and other factors outside our control, we can give no assurance that additional provisions will not be required. We will continue to monitor events and changes in circumstances surrounding these potential liabilities in determining whether to perform additional actuarial evaluations and whether additional provisions may be necessary, which will reported in earnings (loss) from discontinued operations in the accompanying statement of operations.  At the present time, however, we do not believe that any additional provisions would be reasonably likely to have a material adverse effect on our liquidity or consolidated financial position.

Loss Contingencies

We have loss contingencies, for such matters as legal claims and legal proceedings.  Establishing loss reserves for these matters requires estimates, judgment of risk exposure and ultimate liability.  We record provisions when the liability is considered probable and reasonably estimable.  Significant judgment is required for both the determination of probability and the determination as to whether an exposure can be reasonably estimated.  We maintain an ongoing monitoring and identification process to assess how the activities are progressing against the accrued estimated costs.  As additional information becomes available, we reassess our potential liability related to these matters.  Adjustments to the liabilities are recorded in the statement of operations in the period when additional information becomes available.  Such revisions of the potential liabilities could have a material adverse effect on our business, financial condition or results of operations.

Concentrations of Credit Risk

Financial instruments that potentially subject us to significant concentrations of credit risk consist principally of cash investments, accounts receivable and accounts receivable.derivative financial instruments used to reduce our market risk for changes in interest rates on our variable rate borrowings. We place our cash investments with high quality financial institutions and limit the amount of credit exposure to any one institution. Derivative financial instruments used to reduce our market risk for changes in interest rates on our variable rate borrowings are entered into with high quality financial institutions, with their credit worthiness reviewed on a quarterly basis. Although we are directly affected by developments in the vehicle parts industry, management does not believe significant credit risk exists.
59


STANDARD MOTOR PRODUCTS, INC. AND SUBSIDIARIES
NOTES TO CONSOLIDATED FINANCIAL STATEMENTS (Continued)
With respect to accounts receivable, such receivables are primarily from warehouse distributors and major retailers in the automotive aftermarket industry located in the U.S. We perform ongoing credit evaluations of our customers’ financial conditions. A significant portion of our net sales are concentrated from our 3three largest individual customers. The loss of one or more of these customers or, a significant reduction in purchases of our products from any one of them, could have a materially adverse impact on our business, financial condition and results of operations.

In January 2023, one of our customers filed a petition for bankruptcy. In connection with the bankruptcy filing, we evaluated our potential risk and exposure as related to our outstanding accounts receivable balance from the customer as of December 31, 2022, and estimated our anticipated recovery. As a result of our evaluation, we recorded a $7 million pre-tax charge during the year ended December 31, 2022 to reduce our accounts receivable balance to our estimated recovery. The $7 million pre-tax charge was included in selling, general and administrative expenses in our consolidated statement of operations. The bankruptcy court proceedings have continued into 2023. Although the courts have named us a “critical supplier,” the funds allocated to us have not yet been determined and, as such, we have not recorded an adjustment to the $7 million pre-tax charge previously recorded.
For further information on net sales to our 3three largest customers and our concentration our customer risk, see Note 19,21, “Industry Segment and Geographic Data.”

Foreign Cash Balances

Substantially all of the cash and cash equivalents, including foreign cash balances, at December 31, 20212023 and 20202022 were uninsured. Foreign cash balances at December 31, 20212023 and 20202022 were $16.830.5 million and $16.418.5 million, respectively.

Derivative Instruments and Hedging Activities

61We occasionally use derivative financial instruments to reduce our market risk for changes in interest rates on our variable rate borrowings.  Derivative financial instruments are recorded at fair value in other current and long-term assets, and other current and long-term liabilities in the consolidated balance sheets.  For derivative financial instruments that have been formally designated as cash flow interest rate hedges (“interest rate swap agreements”), provided that the hedging instrument is highly effective, the entire change in the fair value of the derivative will be deferred and recorded in accumulated other comprehensive income (“AOCI”) in the consolidated balance sheets. When the underlying hedged transaction is realized (i.e., when the interest payments on the underlying borrowing are recognized in the consolidated statements of operations), the gain/loss included in AOCI is recorded in earnings and reflected on the same line as the gain/loss on the hedged item attributable to the hedged risk (i.e., interest expense). At the inception of each transaction, we formally document the hedge relationship, including the identification of the hedge instrument, the related hedged items, the effectiveness of the hedge, as well as its risk management objectives and strategies.

60

STANDARD MOTOR PRODUCTS, INC. AND SUBSIDIARIES

NOTES TO CONSOLIDATED FINANCIAL STATEMENTS (continued)(Continued)
Recently Issued Accounting Pronouncements

Standards that were adopted

StandardDescription
Date of
adoption
Effects on the financial
statements or other
significant matters
ASU 2019-12,Income Taxes (Topic 740): Simplifying the Accounting for Income Taxes
This standard is intended to simplify the accounting for income taxes by removing certain ASC Topic 740 exceptions in performing intra-period tax allocations among income statement components, in calculating certain deferred tax liabilities related to outside basis differences, and in calculating income taxes in interim periods with year-to-date losses. In addition, this standard is also intended to improve consistency and add simplification by clarifying and amending the reporting of franchise taxes and other taxes partially based on income, the recognition of deferred income taxes related to the step-up in tax basis goodwill, and the reporting in interim periods of the recognition of the enactment of tax laws or rate changes.January 1, 2021The adoption of the technical clarifications in the standard did not materially impact our accounting for income taxes, our consolidated financial statements and related disclosures.

Standards that are not yet adopted as of December 31, 20212023

The following table provides a brief description of recently issued accounting pronouncements that have not yet been adopted as of December 31, 2021, and that could have an impact on our financial statements:
Standard Description Effective dateEffects on the financial statements or other significant matters
Date of
ASU 2023-07,
adoption /Segment Reporting (Topic 280): Improvements to Reportable Segment Disclosures
Effective
date
 
Effects
ASU 2023-07 will improve reportable segment disclosure requirements, primarily through enhanced disclosures about significant segment expenses on an interim and annual basis.
ASU 2023-07 expands segment disclosures by requiring disclosure of (1) significant segment expenses that are regularly provided to the chief operating decision maker (“CODM”) and included within each reported measure of segment profit or loss; (2) the amount and description of the composition of other segment items to reconcile to segment profit and loss; and (3) the CODM’s title and position and how the CODM uses the reported segment measures to allocate resources.  Additionally, ASU 2023-07 requires interim disclosures of all reportable segment profit or loss and assets previously required annually by Topic 280.
The ASU is effective for the fiscal years beginning after December 15, 2023, which for us is December 31, 2024, and all subsequent interim periods, with full retrospective application required to all prior periods presented. Early adoption is permitted.
The new standard will require expanding our segment disclosure to include additional segment level information. We are currently evaluating the full impact of adopting ASU 2023-07 on our consolidated financial
statements, or otherdisclosures, processes and controls. On an ongoing basis, we will continue to assess the impact of the new standard through our planned date of adoption of December 31, 2024.
significant matters
    
ASU 2020-04,Reference Rate Reform2023-09,
Income Taxes (Topic 848)270): Facilitation of the Effects of Reference Rate Reform on Financial ReportingImprovements to Income Tax Disclosures
 This standard
ASU 2023-09 will improve transparency and decision making usefulness of income tax disclosures.
ASU 2023-09 will expand the annual required income effective tax rate reconciliation disclosures to include disclosure of (1) eight specific categories of rate reconciling items; (2) additional information for reconciling items that meet or exceed a quantitative threshold; and (3) expand the required disclosures to include reconciling percentages as well as reported amounts.  Additionally, the ASU 2023-09 will expand required interim and annual disclosures of income taxes paid to include the disaggregation by federal, state and foreign jurisdictions, with expanded disclosures required annually.
The ASU is intendedeffective for annual reporting periods beginning after December 15, 2024, which for us is January 1, 2025, with full retrospective application required to provide optional guidance for a limited time to ease the potential burden in accounting for (or recognizing the effects of) reference rate reform on financial reporting. all prior periods presented. Early adoption is permitted.The new standard is applicable to contracts that reference LIBOR, or another reference rate, expected to be discontinued due to reference rate reform.Effective March 12, 2020 through December 31, 2022
The new standard may be applied as of the beginning of anwill require expanding our interim period that includes March 12, 2020 through December 31, 2022.  As certain ofand annual income tax disclosures in our contracts reference LIBOR, including our revolving credit facility and supply chain financing arrangements, wefinancial statements. We are currently reviewingevaluating the optional guidance in the standard to determine itsfull impact upon the discontinuance of LIBOR. At this time, we do not believe that the new guidance, nor the discontinuance of LIBOR, will have a material impactadopting ASU 2023-09 on our consolidated financial statements, disclosures, processes and related disclosures.
controls. On an ongoing basis, we will continue to assess the impact of the new standard through our planned date of adoption of March 31, 2025.


We have reviewed all other recently issued accounting pronouncements and concluded they were either not applicable or not expected to have a material impact on the Company’s consolidated financial statements.
62
61

STANDARD MOTOR PRODUCTS, INC. AND SUBSIDIARIES

NOTES TO CONSOLIDATED FINANCIAL STATEMENTS (continued)(Continued)
2.  Business Acquisitions and Investments

2023 Increase in Equity Investment

2021 Business Acquisitions

Acquisition of Capital Stock of Stabil Operative Group GmbH (“Stabil”)Investment in Foshan GWO YNG SMP Vehicle Climate Control & Cooling Products Co. Ltd.

In September 2021,April 2014, we formed Foshan GWO YNG SMP Vehicle Climate Control & Cooling Products Co. Ltd. (“Gwo Yng”), a 50/50 joint venture with Gwo Yng Enterprise Co., Ltd., a China-based manufacturer of air conditioner accumulators, filter driers, hose assemblies and switches.  We acquired our 50% interest in the joint venture for approximately $14 million.  In March 2018, we acquired 100%an additional 15% equity interest in the joint venture for RMB 26,475,583 (approximately $4.2 million), thereby increasing our equity interest in the joint venture to 65%.  While we increased our equity interest in the joint venture to 65%, the minority shareholder maintained substantive participating rights that allowed it to participate in certain significant financial and operating decisions that occur in the ordinary course of business.  As a result, we continued to account for our investment in the joint venture under the equity method of accounting.

In July 2023, we acquired an additional 15% equity interest in the joint venture for RMB 27,378,290 (approximately $4 million), thereby increasing our equity interest in Gwo Yng to 80%.  In connection with the transaction, we amended and restated the charter documents of Gwo Yng to remove all minority shareholder substantive participating rights, giving SMP control of Gwo Yng.  As a result, as of the capital stockclosing date of Stabil Operative Group GmbH,the transaction, Gwo Yng was accounted for as a German companybusiness combination achieved in stages (“Stabil”), for Euros 13.7 million, or $16.3 million, subject to certain post-closing adjustments.  Stabil is a manufacturer and distributor of a variety of components, including electronic sensors, control units, and clamping devices to the European Original Equipment (“OE”step acquisition”) market, serving both commercial and light vehicle applications.  The acquired Stabil business was paid for with cash funded by borrowings under our revolving credit facility with JPMorgan Chase Bank, N.A., as agent, and is headquartered.  Accordingly, commencing on the outskirtsclosing of Stuttgart, Germanythe transaction, we reported the results of Gwo Yng on a consolidated basis with facilities in Germany and Hungary. The acquisition, to bethe minority ownership interest reported as part of our Engine Management Segment, aligns with our strategy of expansion beyond our core aftermarket business into complementary areas, and gives us exposure to a diversified group of blue chip European commercial and light vehicle OE customers.noncontrolling interest.

The following table presentssummarizes the allocation of the total step acquisition purchase priceconsideration to the identifiable assets acquired and liabilities assumed based on their fair values subject to final agreement of post-closing adjustments, which we do anticipate will be significant (in thousands):

Purchase price    $16,290 
Total purchase consideration (1)    $21,725 
Assets acquired and liabilities assumed:              
Cash and cash equivalents $6,779     
Receivables  $2,852       5,912     
Inventory   5,126       5,945     
Other current assets (1)   1,628     
Other current assets   528     
Property, plant and equipment, net   1,810       2,924     
Operating lease right-of-use assets   4,971       4,372     
Intangible assets   5,471     
Intangible assets (2)   532     
Goodwill   4,827       2,208     
Long term investments and other assets  7,257     
Current liabilities   (4,190)      (6,004)    
Noncurrent operating lease liabilities  (4,454)      (3,455)    
Deferred income taxes  (1,751)    
Net assets acquired     $16,290 
Subtotal      26,998 
Fair value of acquired noncontrolling interest      (5,273)
Total purchase consideration allocated to net assets acquired     $21,725 


(1)The other current assets balance includes $0.9Total purchase consideration is the sum of the fair value of the previously held equity investment interest in Gwo Yng of $17.7 million and the cash paid of cash acquired.$4 million for the acquisition of the additional 15% equity ownership interest.

(2)Intangible assets consists of customer relationships of $0.4 million and capitalized software of $0.1 million.


62


STANDARD MOTOR PRODUCTS, INC. AND SUBSIDIARIES
NOTES TO CONSOLIDATED FINANCIAL STATEMENTS (Continued)
Intangible assets acquired of $5.5$0.4 million consistconsisting of customer relationships that will be amortized on a straight-line basis over the estimated useful life of 2010 years.  Goodwill of $4.8$2.2 million was allocated to the Engine Management Segment.Temperature Control and Engineered Solutions segments in the amounts of $1.2 million and $1 million, respectively.  The goodwill reflects relationships, business specific knowledge and the replacement cost of an assembled workforce associated with personal reputations.  The intangible assets and goodwill are not deductible for tax purposes.

Revenues from the acquired businessGwo Yng included in our consolidated statement of operations from the acquisitionclosing date of our 15% equity increase in July 2023 through December 31, 20212023 were $7.2 million.not material.

Acquisition of Capital Stock of Trumpet Holdings, Inc. (“Trombetta”)
2022 Increase in Equity Investment

Investment in Foshan Che Yijia New Energy Technology Co., Ltd.

In May 2021,August 2019, we acquired 100% of the capital stock of Trumpet Holdings, Inc.an approximate 29% minority interest in Foshan Che Yijia New Energy Technology Co., a Delaware corporation, (more commonly known as “Trombetta”Ltd. (“CYJ”), for $111.7 million, subject to certain post-closing adjustments.  In December 2021, the post-closing adjustments were finalized at approximately $30,000, thereby reducing the purchase price. Trombetta$5.1 million. CYJ is a leading providermanufacturer of power switchingautomotive electric air conditioning compressors and power management productsis located in China. We determined, at that time, that due to Original Equipment (“OE”) customersa lack of a voting majority and other qualitative factors, we do not control the operations of CYJ and accordingly, our investment in various markets.CYJ would be accounted for under the equity method of accounting.

In October 2022, we acquired an additional 3.55% equity interest in CYJ for RMB 1.7 million (approximately $242,000), increasing our minority ownership interest in CYJ from an approximate interest of 29% to 33%. The additional acquired Trombetta businessownership interest in CYJ was paid for in cash funded by borrowings under our revolving credit facilityCredit Agreement with JPMorgan Chase Bank, N.A., as agent,agent.  We will continue to account for our minority interest in CYJ using the equity method of accounting.

2022 Business Acquisitions

Acquisition of Capital Stock of Kade Trading GmbH (“Kade”)

In October 2022, we acquired 100% of the capital stock of Kade Trading GmbH (“Kade”) headquartered in Glinde, Germany for Euros 2.7 million (approximately $2.7 million) plus a Euros 0.5 million (approximately $0.5 million) earn-out based upon Kade’s performance in 2024 and 2025.  Kade is a supplier across Europe of mobile temperature control components to commercial vehicle, passenger car and specialty equipment markets and has manufacturing facilities in Milwaukee, Wisconsin; Sheboygan Falls, Wisconsin; Tijuana, Mexico, as well asbeen a 70% ownership in adistributor of products from our joint venture in Hong Kong,ventures including electric compressors, hose assemblies and receiver dryers, with operations in Shanghai and Wuxi, China (“Trombetta Asia, Ltd.”).annual sales of approximately $6 million. The acquisition, to beacquired Kade business, reported as part of our Engine Management Segment, alignsEngineered Solutions segment, was paid for with our strategy of expansion into the OE heavy duty market.

63

STANDARD MOTOR PRODUCTS, INC. AND SUBSIDIARIES

NOTES TO CONSOLIDATED FINANCIAL STATEMENTS (continued)
The following table presents the allocation of the purchase price to the assets acquired and liabilities assumed based on their fair values, subject to finalization of amounts related to deferred income taxes, which we do not anticipate will be significant (in thousands):

Purchase price    $111,711 
Assets acquired and liabilities assumed:       
Receivables           $9,173     
Inventory            12,460     
Other current assets (1)            5,193     
Property, plant and equipment, net            4,939     
Operating lease right-of-use assets            3,847     
Intangible assets            54,700     
Goodwill            49,250     
Current liabilities            (5,072)    
Noncurrent operating lease liabilities  (3,065)    
Deferred income taxes  (8,210)    
                  Subtotal      123,215 
       Fair value of acquired noncontrolling interest      (11,504)
Net assets acquired     $111,711 


(1)The other current assets balance includes $4.6 million of cash acquired.

Intangible assets acquired of $54.7 million consist of customer relationships of $39.4 million that will be amortized on a straight-line basis over the estimated useful life of 20 years; developed technology of $13.4 million that will be amortized on a straight-line basis over the estimated useful life of 15 years; and a trade name of $1.9 million that will be amortized on a straight-line basis over the estimated useful life of 10 years.  Goodwill of $49.3 million was allocated to the Engine Management Segment.  The goodwill reflects relationships, business specific knowledge and the replacement cost of an assembled workforce associated with personal reputations.  The intangible assets and goodwill are not deductible for tax purposes.

Revenues from the acquired business included in our consolidated statement of operations from the acquisition date through December 31, 2021 were $37.8 million.

Acquisition of Particulate Matter Sensor Business of Stoneridge, Inc. (“Soot Sensor”)

In March 2021, we agreed to acquire certain Soot Sensor product lines from Stoneridge, Inc. The product lines to be acquired manufacture sensors used in the exhaust and emission systems of diesel engines. The product lines acquired were located in Stoneridge’s facilities in Lexington, Ohio and Tallinn, Estonia.  We are not acquiring these facilities, nor any of Stoneridge’s employees, and will be relocating the production lines to our engine management plants in Independence, Kansas and Bialystok, Poland, respectively.  The acquisition, to be reported as part of our Engine Management Segment, aligns with our strategy of expansion into the OE heavy duty market.  Customer relationships to be acquired include Volvo, CNHi and Hino.cash.

The product lines located in Stoneridge’s facility in Lexington, Ohio were acquired in March 2021 for $2.1 million, while the product lines located in Stoneridge’s facility in Tallinn, Estonia were acquired in November 2021 for $0.8 million.  The acquired product lines were paid for with cash funded by borrowings under our revolving credit facility with JPMorgan Chase Bank, N.A.  The assets acquired include inventory, machinery & equipment and certain intangible assets.

The following table presents the allocation of the purchase price to the assets acquired and liabilities assumed based on their fair values (in thousands):

Purchase Price    $2,924 
Assets acquired and liabilities assumed:       
   Inventory $1,032     
   Machinery and equipment, net  1,137     
   Intangible assets  755     
Net assets acquired     $2,924 
Purchase price    $3,176 
Assets acquired and liabilities assumed:       
Receivables           $790     
Inventory            829     
Other current assets (1)            1,003     
Property, plant and equipment, net            63     
Operating lease right-of-use assets            401     
Intangible assets            2,395     
Goodwill            766     
Current liabilities            (1,977)    
Noncurrent operating lease liabilities  (328)    
Deferred income taxes  (766)    
Net assets acquired     $3,176 


(1)The other current assets balance includes $1 million of cash acquired.

63


STANDARD MOTOR PRODUCTS, INC. AND SUBSIDIARIES
NOTES TO CONSOLIDATED FINANCIAL STATEMENTS (Continued)
Intangible assets acquired of approximately $0.8$2.4 million consist of customer relationships that will be amortized on a straight-line basis over the estimated useful life of 1015 years.

Revenues
Incremental revenues from the acquired Kade business included in our consolidated statement of operations fromfor the acquisition date throughyear ended December 31, 20212023 were $9.3$5 million.

64

Index
STANDARD MOTOR PRODUCTS, INC. AND SUBSIDIARIES

NOTES TO CONSOLIDATED FINANCIAL STATEMENTS (continued)
3. Restructuring and Integration Expense
Expenses

The aggregated liabilities included in “sundry payables and accrued expenses” and “other accrued liabilities” in the consolidated balance sheet relating to the restructuring and integration activities as of and for the years ended December 31, 20212023 and 2020,2022, consisted of the following (in thousands):

  
Workforce
Reduction
  
Other Exit
Costs
  Total 
Exit activity liability at December 31, 2021
 $79  $  $79 
Restructuring and integration costs:            
Amounts provided for during 2022 (1)
  1,521   370   1,891 
Cash payments  (16)  (144)  (160)
Reclassification of environmental and other liabilities  (63)  (226)  (289)
Exit activity liability at December 31, 2022
 $1,521  $  $1,521 
Restructuring and integration costs:            
Amounts provided for during 2023 (1) (2)
  1,973   669   2,642 
Cash payments  (1,803)  (577)  (2,380)
Reclassification of environmental liability     (92)  (92)
Foreign currency exchange rate changes
  38      38 
Exit activity liability at December 31, 2023
 $1,729  $  $1,729 

  
Workforce
Reduction
  
Other Exit
Costs
  Total 
Exit activity liability at December 31, 2019
 $336  $0  $336 
Restructuring and integration costs:            
Amounts provided for during 2020 (1)  0   464   464 
Cash payments  (157)  (214)  (371)
Reclassification of environmental liability (1)  0   (250)  (250)
Exit activity liability at December 31, 2020
 $179  $0  $179 
Restructuring and integration costs:            
Amounts provided for during 2021  0   392   392 
Cash payments  (100)  (392)  (492)
Exit activity liability at December 31, 2021
 $79  $0  $79 


(1)Included in restructuring and integration costs in 20202023 and 2022 is a $0.3$0.1 million and $0.2 million increase, respectively, in environmental cleanup costs related to ongoing monitoring and remediation in connection with the prior closure of our manufacturing operations at our Long Island City, New York location.  The environmental liability has been reclassed to accrued liabilities as of December 31, 2020.2023 and 2022, respectively.
(2)Restructuring and integration expenses incurred during the year ended December 31, 2023 consist of $1.3 million in our Vehicle Control segment, $1.1 million in our Temperature Control segment and $0.2 million in our Engineered Solutions segment.

Restructuring Costs

Cost Reduction Initiative

During the fourth quarter of 2022, to further our ongoing efforts to improve operating efficiencies and reduce costs, we announced plans for a reduction in our sales force, and initiated plans to relocate certain product lines from our Independence, Kansas manufacturing facility and from our St. Thomas, Canada manufacturing facility to our manufacturing facilities in Reynosa, Mexico.

Total restructuring expenses related to the initiative of approximately $2.5 million and $1.5 million were incurred during the years ended December 31, 2023 and 2022, respectively. Expenses for the year ended December 31, 2023 consist of (1) expenses of approximately $0.7 million related to a further sales force reduction, (2) expenses of approximately $1.3 million of employee severance and bonuses related to our product line relocations, and (3) expenses of approximately $0.5 million related to the relocation of machinery and equipment to our manufacturing facilities in Reynosa, Mexico.  Expenses for the year ended December 31, 2022 consist of (1) expenses of approximately $0.9 million related to our sales force reduction, and (2) expenses of approximately $0.6 million consisting of employee severance related to our product line relocations.  Cash payments made under the initiative were $2.4 million during the year ended December 31, 2023. Additional restructuring costs related to the initiative, and expected to be incurred, are approximately $0.5 million.  We anticipate that the Cost Reduction Initiative will be completed by the end of the second quarter of 2024.

64


STANDARD MOTOR PRODUCTS, INC. AND SUBSIDIARIES
NOTES TO CONSOLIDATED FINANCIAL STATEMENTS (Continued)
Plant Rationalization Programs

The 2016 Plant Rationalization Program, which included the shutdown and sale of our Grapevine, Texas facility, and the 2017 Orlando Rationalization Program, which included the shutdown of our Orlando, Florida facility, have been completed.  Cash payments made of $16,000 during the year ended December 31, 2022 consist of severance payments to former employees terminated in connection with these programs. There is no remaining aggregate liability related to these programs as of December 31, 2022.

Integration Costs

Particulate Matter Sensor (“Soot Sensor”) Product Line Relocation

In connection with our acquisitions in March 2021 and November 2021 of certain soot sensor product lines from Stoneridge, Inc., we incurred certain integration expenses in connection with the relocation of certain inventory, machinery, and equipment from Stoneridge’s facilities in Lexington, Ohio and Tallinn, Estonia to our existing facilities in Independence, Kansas and Bialystok, Poland, respectively.  Integration expenses recognized and cash payments made of $392,000,$144,000 during the year ended December 31, 2021,2022 related to these relocation activities in our Engine Management segment.  Totalactivities.The soot sensor product line relocation expenses of approximately $600,000 are expected to be incurredhas been completed and there is no remaining aggregate liability related to the relocations. We anticipate that the soot sensor product line relocation will be completed by the end of the second quarter of 2022.

65

Index
STANDARD MOTOR PRODUCTS, INC. AND SUBSIDIARIES

NOTES TO CONSOLIDATED FINANCIAL STATEMENTS (continued)
Pollak Relocation

In connection with our April 2019 acquisition of certain assets and liabilities of the Pollak business of Stoneridge, Inc., we incurred certain integration expenses in connection with the relocation of certain inventory, machinery, and equipment from Pollak’s distribution and manufacturing facilities in El Paso, Texas, Canton, Massachusetts, and Juarez, Mexico, to our existing facilities in Disputanta, Virginia, Reynosa, Mexico and Independence, Kansas.

The Pollak Relocation has been completed.  Integration expense recognized and cash payments made of $214,000 during the year ended December 31, 2020 related to residual relocation activities in our Engine Management segment. There is 0 remaining aggregate liability related to the Pollak Relocation as of December 31, 2020.
2022.

Restructuring Costs

Plant Rationalization Programs

The 2016 Plant Rationalization Program, which included the shutdown and sale of our Grapevine, Texas facility, and the 2017 Orlando Rationalization Program, which included the shutdown of our Orlando, Florida facility, have been substantially completed.  Cash payments made of $100,000 and $157,000 during the years ended December 31, 2021 and 2020, respectively, and the remaining aggregate liability related to the programs as of December 31, 2021 of $79,000 consists of severance payments to former employees terminated in connection with these programs.

4. Sale of Receivables

We are party to several supply chain financing arrangements, in which we may sell certain of our customers’ trade accounts receivable to such customers’ financial institutions. We sell our undivided interests in certain of these receivables at our discretion when we determine that the cost of these arrangements is less than the cost of servicing our receivables with existing debt. Under the terms of the agreements, we retain no rights or interest, have no obligations with respect to the sold receivables, and do not service the receivables after the sale. As such, these transactions are being accounted for as a sale.

Pursuant to these agreements, we sold $818.8$830.8 million and $695.1$813.7 million of receivables for the years ended December 31, 20212023 and 2020,2022, respectively. Receivables presented at financial institutions and not yet collected as of December 31, 2021 and December 31, 20202023 were approximately $1.3$4.5 million and $50 million, respectively, and remained in our accounts receivable balance for those periods.as of that date. There were no receivables presented at financial institutions and not yet collected as of December 31, 2022. All receivables sold were reflected as a reduction of accounts receivable in the consolidated balance sheet at the time of sale. A charge in the amount of $11.5$46 million, $12.2$32 million and $22$11.5 million related to the sale of receivables is included in selling, general and administrative expenses in our consolidated statements of operations for the years ended December 31, 2021, 20202023, 2022 and 2019,2021, respectively.

To the extent that these arrangements are terminated, our financial condition, results of operations, cash flows and liquidity could be adversely affected by extended payment terms, delays or failures in collecting trade accounts receivables. The utility of the supply chain financing arrangements also depends upon a benchmark reference rate for the LIBOR rate, as it is a componentpurpose of determining the discount rate applicable to each arrangement. If the LIBORbenchmark reference rate increases significantly, we may be negatively impacted as we may not be able to pass these added costs on to our customers, which could have a material and adverse effect upon our financial condition, results of operations and cash flows.

66
65

STANDARD MOTOR PRODUCTS, INC. AND SUBSIDIARIES

NOTES TO CONSOLIDATED FINANCIAL STATEMENTS (continued)(Continued)
5. Inventories

 
December 31,
2021
  
December 31,
2020
      December 31, 
 (In thousands)  2023
  2022
 
       (In thousands) 
Finished goods $296,739  $225,523  $302,557  $324,362 
Work-in-process  16,010   10,711   18,503   14,099 
Raw materials  156,006   109,268   186,015   190,254 
Subtotal  468,755   345,502   507,075   528,715 
Unreturned customer inventories  22,268   19,632   18,240   19,695 
Total inventories $491,023  $365,134  $525,315  $548,410 

6. Property, Plant and Equipment

 December 31,  December 31, 
 2021  2020  2023
  2022
 
 (In thousands)  (In thousands) 
Land, buildings and improvements $40,882  $38,833  $45,710  $42,651 
Machinery and equipment  159,967   148,578   177,337   166,149 
Tools, dies and auxiliary equipment  63,944   60,102   73,494   67,017 
Furniture and fixtures  30,688   30,347   33,212   32,084 
Leasehold improvements  14,081   11,948   16,418   15,083 
Construction-in-progress  21,012   13,691   35,357   23,340 
Total property, plant and equipment  330,574   303,499   381,528   346,324 
Less accumulated depreciation  227,788   214,394   259,656   239,176 
Total property, plant and equipment, net $102,786  $89,105  $121,872  $107,148 

Depreciation expense was $19.7 million in 2023, $19 million in 2022 and $18.2 million in 2021, $17.8 million in 2020 and $17.4 million in 2019.2021.

7. Leases

Quantitative Lease Disclosures

We have operating and finance leases for our manufacturing facilities, warehouses, office space, automobiles, and certain equipment. Our leases have remaining lease terms of up to teneleven years,, some of which may include one or more five-year renewal options. We have not included any of the five-yearrenewal option for one of our leasesoptions in our operating lease payments, as we concluded that it is not reasonably certain that we will exercise the option.any of these renewal options. Leases with an initial term of twelve months or less are not recorded on the balance sheet. Operating lease expense is recognized on a straight-line basis over the lease term.  Finance leases are not material.

67
66

STANDARD MOTOR PRODUCTS, INC. AND SUBSIDIARIES

NOTES TO CONSOLIDATED FINANCIAL STATEMENTS (continued)(Continued)
The following tables provide quantitative disclosures related to our operating leases and includes all operating leases acquired in the Stabil and Trombetta acquisitions from the date of the acquisition (in thousands):

 December 31, 
Balance Sheet Information 2021  2020  December 31,   
Assets       2023   2022 
Operating lease right-of-use assets $40,469  $29,958  $100,065  $49,838 


Liabilities          
   
 
Sundry payables and accrued expenses $10,544  $8,719  $17,139  $10,763 
Noncurrent operating lease liabilities  31,206   22,450   88,974   40,709 
Total operating lease liabilities $41,750  $31,169  $106,113  $51,472 


Weighted Average Remaining Lease Term                
Operating leases 5.3 Years  5 Years  8.3 Years  7 Years 


Weighted Average Discount Rate          
   
 
Operating leases  3%  3.6%  4.8%  3.7%

 Year Ended, December 31,  Year Ended, December 31, 
Expense and Cash Flow Information 2021  2020  2023
  
2022
 
Lease Expense            
Operating lease expense (a) $10,051  $9,203  $16,434  $11,411 
Supplemental Cash Flow Information                
Cash Paid for the amounts included in the measurement of lease liabilities:                
Operating cash flows from operating leases $9,985  $9,087  $12,099  $11,293 
Right-of-use assets obtained in exchange for new lease obligations:                
Operating leases (b)
 $20,975  $3,180  $66,014  $31,064 

(a)Excludes expenses of approximately $2$3.3 million, $2.7 million and $2.5$2 million for the years ended December 31, 20212023, 2022, and 2020,2021, respectively, related to non-lease components such as maintenance, property taxes, etc., and operating lease expense for leases with an initial term of 12 months or less, which is not material.

(b)
Includes $8.8During the year ended December 31, 2023 includes $27.8 million of right-of-use assets related to the lease modification and extension for our distribution center and office in Lewisville, Texas; $26.1 million of right-of-use assets related to the new distribution center in Shawnee, Kansas; $4.4 million of right-of-use assets obtained in business acquisitions during the year ended December 31, 2021.
Gwo Yng step-acquisition; and $3.7 million of right-of-use assets related to our Reynosa, Mexico lease renewal.


Minimum Lease Payments

At December 31, 2021,2023, we are obligated to make minimum lease payments through 2031,2034, under operating leases, which are as follows (in thousands):

2022
 $10,707 
2023
  9,537 
2024
  7,165  $17,607 
2025
  5,860   16,145 
2026
  5,109   14,814 
2027
  13,671 
2028
  11,415 
Thereafter  6,562   58,059 
Total lease payments $44,940  $131,711 
Less: Interest  (3,190)  (25,598)
Present value of lease liabilities $41,750  $106,113 

6867

STANDARD MOTOR PRODUCTS, INC. AND SUBSIDIARIES

NOTES TO CONSOLIDATED FINANCIAL STATEMENTS (continued)(Continued)
8. Goodwill and Other Intangible Assets

Goodwill

We assess the impairment of longlived and identifiable intangibles assets and goodwill whenever events or changes in circumstances indicate that the carrying value may not be recoverable. With respect to goodwill, we test for impairment on an annual basis or in interim periods if an event occurs or circumstances change that may indicate the fair value of a reporting unit is below its carrying amount.  We completed our annual impairment test of goodwill as of December 31, 2021.

When performing our evaluation of goodwill for impairment, if we conclude qualitatively that it is not more likely than not that the fair value of the reporting unit is less than its carrying amount, then a quantitative impairment test would not be required. If we are unable to reach this conclusion, then we would perform a goodwill quantitative impairment test. In performing the quantitative test, the fair value of the reporting unit is compared to its carrying amount. A charge for impairment is recognized by the amount by which the reporting unit’s carrying amount exceeds its fair value, not to exceed the total amount of goodwill allocated to the reporting unit.
In connection with our operating segment reorganization, we reassessed our reporting units and reallocated goodwill from the reporting units that existed prior to the change to the new reporting units, using a relative fair value approach similar to that used when a portion of a reporting unit is to be disposed of. We performed goodwill impairment tests as of January 1, 2023 on both the reporting units in place prior to the change and the new reporting units, and concluded that the estimated fair values of each of the reporting units exceeded their respective carrying amounts and, therefore, no impairment charge was necessary.

We completed our annual impairment test of goodwill as of December 31, 2023. As of December 31, 2021,2023, we performed a qualitative assessment of the likelihood of a goodwill impairment for both the Engine Management andVehicle Control, Temperature Control and Engineered Solutions reporting units. Based upon our qualitative assessment, we determined that it was not more likely than not that the fair value of the each of the Engine ManagementVehicle Control, Temperature Control and Temperature ControlEngineered Solutions reporting units was less than their respective carrying amounts. As such, we concluded that the quantitative impairment test would not be required, and that there would be no required goodwill impairment charge as of December 31, 20212023 at each of the Engine Management and Temperature Control reporting units. While we concluded that we did not have a goodwill impairment charge as of December 31, 2021,2023, and we do not believe that future impairments are probable, we will need to maintain the current ongoing performance levels at each of the Engine ManagementVehicle Control, Temperature Control and Temperature ControlEngineered Solutions reporting units in future periods to sustain their goodwill carrying values.

68


STANDARD MOTOR PRODUCTS, INC. AND SUBSIDIARIES
NOTES TO CONSOLIDATED FINANCIAL STATEMENTS (Continued)
Changes in the carrying values of goodwill by operating segment during the years ended December 31, 20212023 and 20202022 are as follows (in thousands):

 
Engine
Management
  
Temperature
Control
  Total  
Vehicle
Control
  
Temperature
Control
 
Engineered
Solutions
  Total 
Balance as of December 31, 2019:
         
Goodwill $102,020  $14,270  $116,290 
Accumulated impairment losses  (38,488)  0   (38,488)
 $63,532  $14,270  $77,802 
Activity in 2020
            
Foreign currency exchange rate change  35   0   35 
Balance as of December 31, 2020:
            
Goodwill  102,055   14,270   116,325 
Accumulated impairment losses  (38,488)  0   (38,488)
 $63,567  $14,270  $77,837 
Activity in 2021
            
Acquisition of Trombetta  49,250   0   49,250 
Acquisition of Stabil  4,827   0   4,827 
Foreign currency exchange rate change  (262)  0   (262)
Balance as of December 31, 2021:
                       
Goodwill  155,870   14,270   170,140  $129,318  $10,839  $29,983  $170,140 
Accumulated impairment losses  (38,488)  0   (38,488)  (38,488)        (38,488)
 $117,382  $14,270  $131,652  $90,830  $10,839  $29,983  $131,652 
Activity in 2022
                
Acquisition of Kade
     582   184   766 
Foreign currency exchange rate change  (310)  53   (74)  (331)
Balance as of December 31, 2022:
                
Goodwill  129,008   11,474   30,093   170,575 
Accumulated impairment losses  (38,488)        (38,488)
 $90,520  $11,474  $30,093  $132,087 
Activity in 2023
                
Step acquisition of Gwo Yng
     1,214   994   2,208 
Foreign currency exchange rate change  286   42   106   434 
Balance as of December 31, 2023:                
Goodwill  129,294   12,730   31,193   173,217 
Accumulated impairment losses  (38,488)        (38,488)
 $90,806  $12,730  $31,193  $134,729 

69

STANDARD MOTOR PRODUCTS, INC. AND SUBSIDIARIES

NOTES TO CONSOLIDATED FINANCIAL STATEMENTS (continued)
Acquired Intangible Assets

Acquired identifiable intangible assets as of December 31, 20212023 and 20202022 consist of:

 December 31, December 31, 
 2021  2020 2023  2022 
 (In thousands) (In thousands) 
Customer relationships $157,020  $111,701  $159,641  $158,717 
Patents, developed technology and intellectual property  14,123   723   14,123   14,123 
Trademarks and trade names  8,880   6,980   8,880   8,880 
Non-compete agreements  3,280   3,272   3,295   3,282 
Supply agreements  800   800   800   800 
Leaseholds  160   160   160   160 
Total acquired intangible assets  184,263   123,636   186,899   185,962 
Less accumulated amortization (1)  (78,932)  (70,221)  (95,681)  (86,945)
Net acquired intangible assets $105,331  $53,415  $91,218  $99,017 


(1)(3)Applies to all intangible assets, except for a related trademark/trade name totaling $2.6 million, which has an indefinite useful life and, as such, is not being amortized.

In December 2020, a large retail customer informed us of its decision to pursue a private brand strategy for its engine management product line. As a result of this development, revenues sold under the BWD trademark were significantly reduced. In connection with the decision, in 2020, we recorded an impairment charge of $2.6 million to write-off the BWD intangible asset trademark.

Total amortization expense for acquired intangible assets was $8.5 million for the year ended December 31, 2023, $8.6 million for the year ended December 31, 2022, and $8.7 million for the year ended December 31, 2021, $8.2 million for the year ended December 31, 2020, and $8 million for the year ended December 31, 2019.2021. Based on the current estimated useful lives assigned to our intangible assets, amortization expense is estimated to be $8.5 million for 2022,2024, $8.5 million in 2025, $8.5 million in 2026, $8.4 million in 2023, $8.2 million in 2024, $8.2 million in 20252027 and $69.4$54.7 million in the aggregate for the years 20262028 through 2041.

For information related to identified intangible assets acquired in the Stabil, Trombetta,Kade acquisition and Soot Sensor acquisitions,Gwo Yng step acquisition, see Note 2, “Business Acquisitions and Investments,” of the notes to our consolidated financial statements.

Other Intangible Assets

Other intangible assets include computer software.  Computer software as of December 31, 20212023 and 20202022 totaled $17.4$19.1 million and $1718.7 million, respectively.  Total accumulated computer software amortization as of December 31, 20212023 and 20202022 was $16.5$18 million and $16.4$17.2 million, respectively.  Computer software is amortized over its estimated useful life of 3 to 10 years. Amortization expense for computer software was $0.3$0.8 million, $0.3$0.7 million and $0.4$0.3 million for the years ended December 31, 2023, 2022 and 2021, 2020 and 2019, respectively. Fully amortized computer software, no longer in use, of $0.2 million was written-off during each of the years ended December 31, 2021 and 2020.

9. Investments in Unconsolidated Affiliates

  December 31, 
  2021  2020 
  (In thousands) 
Foshan GWOYNG SMP Vehicle Climate Control & Cooling Products Co. Ltd. $20,692  $18,869 
Foshan FGD SMP Automotive Compressor Co. Ltd  16,676   15,036 
Foshan Che Yijia New Energy Technology Co., Ltd.  3,990   4,174 
Orange Electronic Co. Ltd  2,729   2,428 
Total $44,087  $40,507 

70
69

STANDARD MOTOR PRODUCTS, INC. AND SUBSIDIARIES

NOTES TO CONSOLIDATED FINANCIAL STATEMENTS (continued)(Continued)
9. Investments in Unconsolidated Affiliates

  December 31, 
  2023  2022 
  (In thousands) 
Foshan FGD SMP Automotive Compressor Co. Ltd $18,426  $16,747 
Foshan Che Yijia New Energy Technology Co., Ltd.  3,128   4,098 
Orange Electronic Co. Ltd  2,496   2,490 
Foshan GWO YNG SMP Vehicle Climate Control & Cooling Products Co. Ltd.
     18,410 
Total $24,050  $41,745 

Investment in Foshan FGD SMP Automotive Compressor Co. Ltd.

In November 2017, we formed Foshan FGD SMP Automotive Compressor Co., Ltd., a 50/50 joint venture with Foshan Guangdong Automotive Air Conditioning Co., Ltd. (“FGD”), a China-based manufacturer of automotive belt driven air conditioning compressors. We acquired our 50% interest in the joint venture for approximately $12.5 million.  We determined that due to a lack of a voting majority, and other qualitative factors, we do not control the operations of the joint venture and accordingly, our investment in the joint venture is accounted for under the equity method of accounting.  During the years ended December 31, 2023 and 2022, we made purchases from the joint venture of approximately$44.1 million and $43.5 million, respectively.

Investment in Foshan Che Yijia New Energy Technology Co., Ltd.

In August 2019, we acquired an approximate 29% minority interest in Foshan Che Yijia New Energy Technology Co., Ltd. (“CYJ”) for approximately $5.1 million.  CYJ is a manufacturer of automotive electric air conditioning compressors and is located in China.  Our minority interest in CYJ is accounted for using the equity method of accounting.

In December 2021, Standard Motor Products (Hong Kong), Ltd., (“SMP HK”), a subsidiary of Standard Motor Products, Inc., entered into an unsecured loan agreement with CYJ.  Under the terms of the loan agreement, CYJ shall have the right to borrow from SMP HK, as lender, up to an aggregate principal amount of $4 million, with interest calculated on the basis of simple interest of five percent (5%) per annum and a maturity date of November 30, 2023, subject to extension by SMP HK at its sole discretion. At December 31, 2021, thereIn September 2023, the loan agreement was 0 outstandingextended through November 30, 2025. Outstanding borrowings under the loan agreement.  During the years endedagreement at December 31, 2021 and 2020, purchases we made from CYJ2023 were not material.

Investment in Foshan FGD SMP Automotive Compressor Co. Ltd.$4 million.

In November 2017,October 2022, we formed Foshan FGD SMP Automotive Compressor Co., Ltd., a 50/50 joint venture with Foshan Guangdong Automotive Air Conditioning Co., Ltd. (“FGD”), a China-based manufacturer of automotive belt driven air conditioning compressors. We acquired our 50%an additional 3.55% equity interest in the joint ventureCYJ for approximately $12.5 million.RMB 1.7 million (approximately $242,000), increasing our minority ownership interest in CYJ from an approximate interest of 29% to 33%. We determined that duewill continue to a lack of a voting majority, and other qualitative factors, we do not control the operations of the joint venture and accordingly,account for our investmentminority interest in the joint venture is accounted for underCYJ using the equity method of accounting. During the years ended December 31, 20212023 and 2020,2022, purchases we made purchases from the joint venture of approximately$32.2 million and $17.4 million, respectively.CYJ were not material.

Investment in Foshan GWOYNG SMP Vehicle Climate Control & Cooling Products Co. Ltd.

In April 2014, we formed Foshan GWOYNG SMP Vehicle Climate Control & Cooling Products Co. Ltd., a 50/50 joint venture with Gwo Yng Enterprise Co., Ltd. (“Gwo Yng”), a China-based manufacturer of automotive air conditioner accumulators, filter driers, hose assemblies and switches. We acquired our 50% interest in the joint venture for $14 million.  We determined, at that time, that due to a lack of a voting majority and other qualitative factors, we do not control the operations of the joint venture and accordingly, our investment in the joint venture was accounted for under the equity method of accounting.

In March 2018, we acquired an additional 15% equity interest in the joint venture for approximately $4.2 million, thereby increasing our equity interest in the joint venture to 65%.  Although we increased our equity interest in the joint venture to 65%, the minority shareholder maintained participating rights that allowed it to participate in certain significant financial and operating decisions that occur in the ordinary course of business.  As a result of the existence of these substantive participating rights of the minority shareholder, we continued to account for our investment in the joint venture under the equity method of accounting.  During the years ended December 31, 2021 and 2020, we made purchases from the joint venture of approximately $15.9 million and $12.4 million, respectively.

Investment in Orange Electronic Co. Ltd.

In January 2013, we acquired an approximate 25%a minority interest in Orange Electronic Co., Ltd. (“Orange”) for $6.3 million.  Orange is a manufacturer of tire pressure monitoring system sensors and is located in Taiwan.  As of December 31, 2021,2022, our minority interest in Orange of 19.4% is accounted for using the equity method of accounting as we have the ability to exercise significant influence. During the years ended December 31, 20212023 and 2020,2022, we made purchases from Orange of approximately $7.8$3.2 million and $4.4$4.5 million, respectively.
71
70

STANDARD MOTOR PRODUCTS, INC. AND SUBSIDIARIES

NOTES TO CONSOLIDATED FINANCIAL STATEMENTS (continued)(Continued)
Investment in Foshan GWO YNG SMP Vehicle Climate Control & Cooling Products Co. Ltd.

In April 2014, we formed Foshan GWO YNG SMP Vehicle Climate Control & Cooling Products Co. Ltd. (“Gwo Yng”), a 50/50 joint venture with Gwo Yng Enterprise Co., Ltd., a China-based manufacturer of air conditioner accumulators, filter driers, hose assemblies and switches.  We acquired our 50% interest in the joint venture for approximately $14 million.  In March 2018, we acquired an additional 15% equity interest in the joint venture for RMB 26,475,583 (approximately $4.2 million), thereby increasing our equity interest in the joint venture to 65%.  While we increased our equity interest in the joint venture to 65%, the minority shareholder maintained substantive participating rights that allowed it to participate in certain significant financial and operating decisions that occur in the ordinary course of business.  As a result, we continued to account for our investment in the joint venture under the equity method of accounting.

In July 2023, we acquired an additional 15% equity interest in the joint venture for RMB 27,378,290 (approximately $4 million), thereby increasing our equity interest in Gwo Yng to 80%.  In connection with the transaction, we amended and restated the charter documents of Gwo Yng to remove all minority shareholder substantive participating rights, giving SMP control of Gwo Yng.  As a result, as of the closing date of the transaction, Gwo Yng will be accounted for as a business combination achieved in stages (“a step acquisition”).  Accordingly, commencing on the closing of the transaction, we will report the results of Gwo Yng on a consolidated basis with the minority ownership interest reported as a noncontrolling interest.
During the year ended December 31, 2023 and through the date of our step acquisition in July 2023, we made purchases from the joint venture of approximately $10.3 million.  Purchases made from the joint  venture approximated $16.2 million during the year ended December 13, 2022.
For additional information related to Gwo Yng, see Note 2, “Business Acquisitions and Investments,” of the notes to our consolidated financial statements.

10. Other Assets

 December 31,  December 31, 
 2021  2020  2023  2022 
 (In thousands)  (In thousands) 
Deferred compensation $23,623  $20,775  $23,893  $20,190 
Long-term investments  7,468    
Noncurrent portion of interest rate swap fair value  1,944   3,091 
Deferred financing costs, net  206   431   1,125   1,603 
Other  1,573   617   837   2,626 
Total other assets, net $25,402  $21,823  $35,267  $27,510 

Deferred Deferred compensation consists of assets held in a nonqualified defined contribution pension plan as of December 31, 20212023 and 2020,2022, respectively.  Long term investments as of December 31, 2023 consist of certificates of deposit with original maturities in excess of twelve months.

71


STANDARD MOTOR PRODUCTS, INC. AND SUBSIDIARIES
NOTES TO CONSOLIDATED FINANCIAL STATEMENTS (Continued)
11. Credit Facilities and Long-Term Debt

Total debt outstanding is summarized as follows:

 December 31,  December 31, 
 2021  2020  2023  2022 
 (In thousands)  (In thousands) 
Revolving credit facilities $125,298  $10,000 
Other (1)  3,138   232 
Credit facility – term loan due 2027
 $92,500  $97,500 
Credit facility – revolver due 2027
  63,500   142,000 
Other
  211   120 
Total debt $128,436  $10,232  $156,211  $239,620 
                
Current maturities of debt $128,415  $10,135  $5,029  $55,031 
Long-term debt  21   97   151,182   184,589 
Total debt $128,436  $10,232  $156,211  $239,620 

(1)Other includes borrowings under our Polish overdraft facility of Zloty 12.3 million (approximately $3 million) and Zloty 0.4 million (approximately $0.1 million) as of December 31, 2021 and 2020, respectively.

Maturities of long-term debt are not material for the year ended December 31, 2021Term Loan and beyond.Revolving Credit Facilities

Revolving Credit Facility

We haveIn June 2022, the Company entered into an amended credita new Credit Agreement with JPMorgan Chase Bank, N.A., as administrative agent, and a syndicate of lenders.lenders (the “Credit Agreement”). The amended credit agreementCredit Agreement provides for a senior secured$500 million credit facility comprised of a $100 million term loan facility (the “term loan”) and a $400 million multi-currency revolving credit facility with a line of credit of upavailable in U.S. Dollars, Euros, Sterling, Swiss Francs, Canadian Dollars and other currencies as agreed to $250 million (with an additional $50 million accordion feature)by the administrative agent and extends the maturity date to December 2023lenders (the “revolving facility”). The line of creditCredit Agreement replaces and refinances the 2015 Credit Agreement.

Borrowings under the amended credit agreement also allows for a $10 million line of creditCredit Agreement were used to Canada as part of the $250 million available for borrowing.  Directrepay all outstanding borrowings under the amended2015 Credit Agreement, and pay certain fees and expenses incurred in connection with the Credit Agreement, with future borrowings used for other general corporate purposes of the Company and its subsidiaries. The term loan amortizes in quarterly installments of 1.25% in each of the first four years, and quarterly installments of 2.5% in the fifth year of the Credit Agreement. The revolving facility has a $25 million sub-limit for the issuance of letters of credit and a $25 million sub-limit for the borrowing of swingline loans. The maturity date is June 1, 2027. The Company may request up to two one-year extensions of the maturity date.

The Company may, upon the agreement of one or more then existing lenders or of additional financial institutions not currently party to the Credit Agreement, increase the revolving facility commitments or obtain incremental term loans by an aggregate amount not to exceed (x) the greater of (i) $168 million or (ii) 100% of consolidated EBITDA (as defined in the Credit Agreement) for the four fiscal quarters ended most recently before such date, plus (y) the amount of any voluntary prepayment of term loans, plus (z) an unlimited amount so long as, immediately after giving effect thereto, the pro forma First Lien Net Leverage Ratio (as defined in the Credit Agreement) does not exceed 2.5 to 1.0.

Term loan and revolver facility borrowings in U.S. Dollars bear interest, at LIBORthe Company’s election, at a rate per annum equal to Term SOFR plus a0.10% plus an applicable margin, ranging from 1.25% to 1.75% based on our borrowing availability, or floating atan alternate base rate plus an applicable margin, where the alternate base rate is the greater of the prime rate, the federal funds effective rate plus a0.50%, and one-month Term SOFR plus 0.10% plus 1.00%. Term loan borrowings were made at one-month Term SOFR. The applicable margin rangingfor the term benchmark borrowings ranges from 0.25%1.0% to 0.75%2.0%, and the applicable margin for alternate base rate borrowings ranges from 0% to 1.0%, in each case, based on our borrowing availability,the total net leverage ratio of the Company and its restricted subsidiaries.  The Company may select interest periods of one, three or nine months for Term SOFR borrowings. Interest is payable at our option.  the end of the selected interest period, but no less frequently than quarterly.

The amended credit agreement isCompany’s obligations under the Credit Agreement are guaranteed by certain of ourits material domestic subsidiaries (each, a “Guarantor”), and secured by certain of our assets.

Borrowings under the amended credit agreement are secured bya first priority perfected security interest in substantially all of our assets, including accounts receivable, inventorythe existing and future personal property of the Company and each Guarantor, subject to certain fixed assets,exceptions. The collateral security described above also secures certain banking services obligations and thoseinterest rate swaps and currency or other hedging obligations of certainthe Company owing to any of our subsidiaries.  Availabilitythe then existing lenders or any affiliates thereof.  Concurrently with the Company’s entry into the Credit Agreement, the Company also entered into a seven year interest rate swap agreement with Wells Fargo Bank, N.A., Co-Syndication Agent and lender under the amended credit agreement is basedCredit Agreement, on a formula$100 million of eligible accounts receivable, eligible drafts presented to the banks under our supply chain financing arrangements and eligible inventory.  After taking into account outstanding borrowings under the amended creditCredit Agreement. The interest rate swap agreement there was an additional $122.1 million available for us to borrow pursuant to the formula at December 31, 2020.  The loss of business of one or more of our key customers or, a significant reductionmatures in purchases of our products from any one of them, could adversely impact availability under our revolving credit facility.May 2029.

72

STANDARD MOTOR PRODUCTS, INC. AND SUBSIDIARIES

NOTES TO CONSOLIDATED FINANCIAL STATEMENTS (continued)(Continued)
Outstanding borrowings under the credit agreement, which are classified as current liabilities, were $125.3 million and $10 million at December 31, 20212023 under the Credit Agreement were $156 million, consisting of current borrowings of $5 million and 2020, respectively;long-term debt of $151 million; while lettersoutstanding borrowings at December 31, 2022 were $239.5 million, consisting of current borrowings of $55 million and long-term debt of $184.5 million.  Letters of credit outstanding under the credit agreementCredit Agreement were $2.6$2.3 million and $2.8$2.4 million at December 31, 20212023 and 2020,2022, respectively.Borrowings under the credit agreement have been classified as current liabilities based upon accounting rules and certain provisions in the agreement.

At December 31, 2021,2023, the weighted average interest rate onunder our amended credit agreementCredit Agreement was 1.4%5%, which consisted of $125$156 million in direct borrowings at 1.4%5% under Term SOFR, adjusted for the impact of the interest rate swap agreement on $100 million of borrowings.  At December 31, 2022, the weighted average interest rate under our Credit Agreement was 5.2%, which consisted of $237 million in borrowings at 5.2% under Term SOFR, adjusted for the impact of the interest rate swap agreement on $100 million of borrowings, and an alternative base rate loanborrowing of $0.3$2.5 million at 3.5%8%AtDuring the year ended December 31, 2020, the weighted average interest rate on2023, our amended credit agreement was 1.4%, which consisted of $10 million in direct borrowings. Our average daily alternative base rate loan balance was $1.1$0.1 million, and $1.5compared to a balance of $5.6 million during 2021 and 2020, respectively.for the year ended December 31, 2022.

At any time that our borrowing availability is less than the greater of either (a) $25 million, or 10% of the commitments if fixed assets are not included in the borrowing base, or (b) $31.25 million, or 12.5% of the commitments if fixed assets are included in the borrowing base, the terms of the amended credit agreement provide for,The Credit Agreement contains customary covenants limiting, among other provisions, a financial covenant requiring us, on a consolidated basis,things, the incurrence of additional indebtedness, the creation of liens, mergers, consolidations, liquidations and dissolutions, sales of assets, dividends and other payments in respect of equity interests, acquisitions, investments, loans and guarantees, subject, in each case, to maintain a fixed charge coverage ratiocustomary exceptions, thresholds and baskets. The Credit Agreement also contains customary events of 1:1 at the end of each fiscal quarter (rolling four quarters).  As of December 31, 2021, we were not subject to these covenants.  The amended credit agreement permits us to pay cash dividends of $20 million and make stock repurchases of $20 million in any fiscal year subject to a minimum availability of $25 million.  Provided specific conditions are met, the amended credit agreement also permits acquisitions, permissible debt financing, capital expenditures, and cash dividend payments and stock repurchases of greater than $20 million.default.

Polish Overdraft Facility

In February 2022,In November 2023, our Polish subsidiary, SMP Poland sp. z.o.o., further amended its an overdraft facility with HSBC Continental Europe (Spolka Akcyjna) Oddzial w Polsce, formerly HSBC France (Spolka Akcyjna) Oddzial w Polsce. The overdraft facility, as amended, provides for borrowings under the facility in Euros and U.S. Dollars.  Under the amended terms, the overdraft facility provides for borrowings of upto Zloty 30 million (approximately $8$7.6 million).  Availability under if borrowings are solely in Zloty, or up to 85% of the amendedZloty 30 million limit (approximately $6.5 million) if borrowings are in Euros and/or U.S. Dollars.  The overdraft facility commenceshas a maturity date in March 2022 and ends in June 2022,2024, with automatic three-month renewals until June 2027, subject to cancellation by either party, at its sole discretion, at least 30 days prior to the commencement of the three-month renewal period.  Borrowings under the amended overdraft facility will bear interest at a rate equal to WIBOR(1) the one month Warsaw Interbank Offered Rate (“WIBOR”) + 1.5%1.0% for borrowings in Polish Zloty, (2) the one month Euro Interbank Offered Rate (“EURIBOR”) + 1.0% for borrowings in Euros, and (3) the Mid-Point of the Fed Target Range + 1.25% for borrowings in U.S Dollars.  Borrowings under the overdraft facility are guaranteed by Standard Motor Products, Inc., the ultimate parent company.  At December 31, 2021 and 2020,There were no borrowings outstanding under the overdraft facility were Zloty 12.3 million (approximately $3 million)at both December 31, 2023 and Zloty 0.4 million (approximately $0.1 million), respectively. December 31, 2022.

Deferred Financing Costs

We have deferred financing costs of approximately $0.4 million and $0.7 million as of December 31, 2021 and 2020, respectively.  Deferred financing costs as of December 31, 2021 are related to our revolving credit facility. Scheduled amortization for future years, assuming no prepayments of principal is as follows:

(In thousands)   
2022
  225 
2023
  206 
Total amortization $431 

73

STANDARD MOTOR PRODUCTS, INC. AND SUBSIDIARIES

NOTES TO CONSOLIDATED FINANCIAL STATEMENTS (continued)(Continued)

Maturities of Debt


As of December 31, 2023, maturities of debt through 2027, assuming no prepayments, are as follows (in thousands):
  Revolving Credit Facility  Term Loan Facility  Polish Overdraft Facility and Other Debt  Total 
2024
 $
  $
5,000  $
29  $
5,029 
2025     5,000   31   5,031 
2026
     7,500   49   7,549 
2027
  63,500   75,000   102   138,602 
Total
 $63,500  $92,500  $211  $156,211 
Less: current maturities
     (5,000)  (29)  (5,029)
 Long-term debt
 $63,500  $87,500  $182  $151,182 

Deferred Financing Costs

We have deferred financing costs of approximately $1.6 million and $2.1 million as of December 31, 2023 and 2022, respectively.  Deferred financing costs are related to our term loan and revolving credit facilities.  Deferred financing costs as of December 31, 2023, assuming no prepayments, are being amortized in the amounts of $0.5 million in 2024, $0.5 million in 2025, $0.5 million in 2026 and $0.1 million in 2027.

12.  Accumulated Other Comprehensive Income

Changes in Accumulated Other Comprehensive Income by Component (in thousands)

  
Foreign
Currency
Translation
  
Unrecognized
Postretirement
Benefit Costs
(Credit)
  
Unrealized
derivative
gains
(losses)
   Total 
Balance at December 31, 2021 attributable to SMP $(8,221) $52  $   $(8,169)
Other comprehensive income before reclassifications  (8,109)     3,797 (1)  (4,312)
Amounts reclassified from accumulated other comprehensive income     (15)  26    11 
Other comprehensive income, net  (8,109)  (15)  3,823    (4,301)
Balance at December 31, 2022 attributable to SMP $(16,330) $37  $3,823   $(12,470)
Other comprehensive income before reclassifications  7,433      831 (1)   8,264 
Amounts reclassified from accumulated other comprehensive income     (13)  (1,755)   (1,768)
Other comprehensive income, net  7,433   (13)  (924)   6,496 
Balance at December 31, 2023 attributable to SMP $(8,897) $24  $2,899   $(5,974)

(1)Consists of the unrecognized loss relating to the change in fair value of the cash flow interest rate hedge of $1.2 million ($0.9 million, net of tax) plus cash settlement receipts of $2.4 million ($1.7 million, net of tax) in the year ended December 31, 2023; and the unrecognized gain relating to the change in fair value of the cash flow interest rate hedge of $5.2 million ($3.8 million, net of tax) minus cash settlement payments of $42,000 ($31,000, net of tax) in the year December 31, 2022.

74


STANDARD MOTOR PRODUCTS, INC. AND SUBSIDIARIES
NOTES TO CONSOLIDATED FINANCIAL STATEMENTS (Continued)
Reclassifications Out of Accumulated Other Comprehensive Income (in thousands):

 
 Year Ended December 31, 
Details About Accumulated Other Comprehensive Income Components 2023  2022 
Derivative cash flow hedge:      
Unrecognized gain (loss) (1) $(2,372) $35 
Postretirement Benefit Plans:        
Unrecognized gain (loss) (2)  (22)  (25)
Total before income tax  (2,394)  10 
Income tax expense (benefit)
  (626)  (1)
Total reclassifications attributable to SMP $(1,768) $11 

(1)Unrecognized accumulated other comprehensive income (loss) related to the cash flow interest rate hedge is reclassified to earnings and reported as part of interest expense in our consolidated statements of operations when the interest payments on the underlying borrowings are recognized.

(2)Unrecognized accumulated other comprehensive income (loss) related to our post retirement plans is reclassified to earnings and included in the computation of net periodic postretirement benefit costs, which are included in other non-operating income (expense), net in our consolidated statements of operations (see Note 15, “Employee Benefits,” for additional information).

13. Stockholders’ Equity

We have authority to issue 500,000 shares of preferred stock, $20 par value, and our Board of Directors is vested with the authority to establish and designate any series of preferred, to fix the number of shares therein and the variations in relative rights as between each series. In December 1995, our Board of Directors established a new series of preferred shares designated as Series A Participating Preferred Stock. The number of shares constituting the Series A Preferred Stock is 30,000. The Series A Preferred Stock is designed to participate in dividends, ranks senior to our common stock as to dividends and liquidation rights and has voting rights. Each share of the Series A Preferred Stock shall entitle the holder to 1000one thousand votes on all matters submitted to a vote of the stockholders of the Company. NaNNo such shares were outstanding at December 31, 20212023 and 2020.2022.

In March 2020, our Board of Directors authorized the purchase of up to $20 million of our common stock under a stock repurchase program. Stock repurchases under this program, during the yearsyear ended December 31, 2021 and 2020, were  150,273 and 323,867 shares of our common stock respectively, at a total cost of $6.5 million and $13.5 million, respectively, thereby completing the 2020 Board of Directors authorization.

In February 2021, our Board of Directors authorized the purchase of up to an additional $20 million of our common stock under a stock repurchase program. Stock repurchases under this program during the year ended December 31, 2021 were 464,992 shares of our common stock at a total cost of $20 million, thereby completing the February2021 Board of Directors authorization.

In October 2021, our Board of Directors authorized the purchase of up to an additional $30 million of our common stock under a stock repurchase program. Stock repurchases under this program, during the year ended December 31, 2021 and 2022 were 7,000 and 692,067 shares of our common stock, respectively, at a total cost of $0.3 million and $29.7 million, respectively, thereby completing the October 2021 Board of Directors authorization.

In July 2022, our Board of Directors authorized the purchase of up to an additional $30 million of our common stock under a new stock repurchase program. Stock will be purchased under the program from time to time, in the open market or through private transactions, as market conditions warrant. StockTo date, there have been no repurchases under this program, during the year ended December 31, 2021, were 7,000 shares of our common stock at a total cost of $0.3 million.  As of December 31, 2021, there was approximately $29.7 million available for future stock purchases under the program.  During the period from January 1, 2022 through February 17, 2022, we have repurchased an additional 64,482 shares of our common stock at a total cost of $3.1 million, thereby reducing the availability under the program to $26.6 million.

75


STANDARD MOTOR PRODUCTS, INC. AND SUBSIDIARIES
NOTES TO CONSOLIDATED FINANCIAL STATEMENTS (Continued)
13.
14. Stock-Based Compensation Plans

Our stock-based compensation program is a broad-based program designed to attract and retain employees while also aligning employees’ interests with the interests of our shareholders.  In addition, members of our Board of Directors participate in our stock-based compensation program in connection with their service on our board.  In May 2016, our Board of Directors and Shareholders approved the 2016 Omnibus Incentive Plan.  The 2016 Omnibus Incentive Plan supersedes the 2006 Omnibus Incentive Plan, which terminated in May 2016.  The 2016 Omnibus Incentive Plan is the only remaining plan available to provide stock-based incentive compensation to our employees, directors and other eligible persons.

In May 2021, our Board of Directors and Shareholders approved an amendment and restatement to the 2016 Omnibus Incentive Plan (the “Plan”).  Under the Plan, which terminates in May 2026, we are authorized to issue, among other things, shares of restricted and performance-based stock to eligible employees and restricted stock to directors of up to 2,050,000 shares; and shares of restricted and performance-based stock to nonemployee directors of up to 350,000 shares.  Shares issued under the Plan that are cancelled, forfeited or expire by their terms are eligible to be granted again under the Plan.  The 2016 Omnibus Incentive Plan is the only remaining plan available to provide stock-based incentive compensation to our employees, directors and other eligible persons.  Awards previously granted under the 2006 Omnibus Incentive Plan are not affected by the plan’s termination,remain outstanding, while shares not yet granted under the plan are not available for future issuance.

We account for our stock-based compensation plans in accordance with the provisions of FASB ASC 718, Stock Compensation, which requires that a company measure the cost of employee services received in exchange for an award of equity instruments based on the grant-date fair value of the award.  The service period is the period of time that the grantee must provide services to us before the stock-based compensation is fully vested.  The grant-date fair value of the award is recognized as an expense on a straight-line basis over the requisite service periods in our consolidated statements of operations.  Forfeitures are estimated at the time of grant based on historical trends in order to estimate the amount of share-based awards that will ultimately vest.  We monitor actual forfeitures for any subsequent adjustment to forfeiture rates.

74

Index
STANDARD MOTOR PRODUCTS, INC. AND SUBSIDIARIES

NOTES TO CONSOLIDATED FINANCIAL STATEMENTS (continued)
Restricted Stock and Performance Share Grants

We currently grant shares of restricted stock to eligible employees and our independent directors and performance-based stock to eligible employees.  We grant eligible employees 2two types of restricted stock (standard restricted shares and long-term retention restricted shares).  Standard restricted shares granted to employees become fully vested no earlier than three years after the date of grant.  Long-term retention restricted shares granted to selected executives vest at a 25% rate on or within approximately two months of an executive reaching the ages of 60 and 63, and become fully vested on or within approximately two months of an executive reaching the age of 65.  Restricted shares granted to directors become fully vested upon the first anniversary of the date of grant.

Performance-based shares issued to eligible employees are subject to a three-year measuring period and the achievement of performance targets and, depending upon the achievement of such performance targets, they may become vested no earlier than three years after the date of grant.  Each period we evaluate the probability of achieving the applicable targets, and we adjust our accrual accordingly.  Restricted shares (other than long-term retention restricted shares) and performance shares issued to certain key executives and directors are subject to a one or two year holding period upon the lapse of the vesting period. Forfeitures on stock grants are estimated at 5% for employees and 0% for executives and directors based upon our evaluation of historical and expected future turnover.

Prior to the time a restricted share becomes fully vested or a performance share is issued, the awardees cannot transfer, pledge, hypothecate or encumber such shares.  Prior to the time a restricted share is fully vested, the awardees have all other rights of a stockholder, including the right to vote (but do not receive dividends during the vesting period).  Prior to the time a performance share is issued, the awardees shall have no rights as a stockholder.  All shares and rights are subject to forfeiture if certain employment conditions are not met.

76


STANDARD MOTOR PRODUCTS, INC. AND SUBSIDIARIES
NOTES TO CONSOLIDATED FINANCIAL STATEMENTS (Continued)
Under the amended and restated 2016 Omnibus Incentive Plan, 2,050,000 shares are authorized to be issued.  At December 31, 2021,2023, under the plan, there were an aggregate of (a) 1,121,4451,633,549 shares of restricted and performance-based stock grants issued, net of forfeitures, and (b) 928,555416,451 shares of common stock available for future grants.  For the year ended December 31, 2021, 211,8152023, 230,875 restricted and performance-based shares were granted (159,565(165,125 restricted shares and 52,25065,750 performance-based shares).

In determining the grant date fair value, the stock price on the date of grant, as quoted on the New York Stock Exchange, was reduced by the present value of dividends expected to be paid on the shares issued and outstanding during the requisite service period, discounted at a risk-free interest rate.  The risk-free interest rate is based on the U.S. Treasury rates at the date of grant with maturity dates approximately equal to the restriction or vesting period at the grant date. In addition, a further discount for the lack of marketability reduced the fair value of grants issued to certain key executives and directors subject to the one or two year post vesting holding period.  Assumptions used in calculating the discount for the lack of marketability include an estimate of stock volatility, risk-free interest rate, and a dividend yield.

As related to restricted and performance stock shares, we recorded compensation expense of $9.1$6.2 million ($6.94.8 million, net of tax), $7.8$7.6 million ($5.85.7 million, net of tax) and $6.5$9.1 million ($4.96.9 million, net of tax), for the years ended December 31, 2021, 20202023, 2022 and 2019,2021, respectively.  The unamortized compensation expense related to our restricted and performance-based shares was $16.6$13.3 million and $15.2$14.9 million at December 31, 20212023 and 2020,2022, respectively and is expected to be recognized over a weighted average period of 4.7 years and 0.4 years for employees and directors, respectively, as of December 31, 2021 and  over a weighted average period of 4.64.1 years and 0.3 years for employees and directors, respectively, as of December 31, 2020.2023 and  over a weighted average period of 4.3 years and 0.3 years for employees and directors, respectively, as of December 31, 2022.

75

Index
STANDARD MOTOR PRODUCTS, INC. AND SUBSIDIARIES

NOTES TO CONSOLIDATED FINANCIAL STATEMENTS (continued)
Our restricted and performance-based share activity was as follows for the years ended December 31, 20212023 and 2020:2022:

  Shares  
Weighted Average
Grant Date Fair
Value per Share
 
Balance at December 31, 2019
  852,540  $35.26 
Granted  208,200   38.21 
Vested  (161,054)  39.23 
Forfeited (1)  (60,000)  42.25 
Balance at December 31, 2020
  839,686  $34.77 
Granted  211,815   38.51 
Vested  (227,682)  36.10 
Forfeited  (16,800)  39.39 
Balance at December 31, 2021
  807,019  $34.92 


(1)
Due to the lack of achievement of performance targets, performance-based shares forfeited in the year ended December 31, 2020 were 50,250 shares.
  Shares  
Weighted Average
Grant Date Fair
Value per Share
 
Balance at December 31, 2021
  807,019  $34.92 
Granted  246,325   28.44 
Vested  (190,082)  41.71 
Performance Shares Target Adjustment  25,317   42.21 
Forfeited
  (7,750)  40.73 
Balance at December 31, 2022
  880,829  $31.79 
Granted  230,875   27.00 
Vested  (248,065)  36.30 
Performance Shares Target Adjustment  29,137   36.30 
Forfeited  (11,800)  35.36 
Balance at December 31, 2023
  880,976  $29.48 

The weighted-average grant date fair value of restricted and performance-based shares outstanding as of December 31, 2023, 2022 and 2021 2020was $26 million (or $29.48 per share), $28 million (or $31.79 per share), and 2019 was $28.2 million (or $34.92 per share), $29.2 million (or $34.77 per share), and $30.1 million (or $35.26 per share), respectively.

77


STANDARD MOTOR PRODUCTS, INC. AND SUBSIDIARIES
NOTES TO CONSOLIDATED FINANCIAL STATEMENTS (Continued)
15. Employee Benefits

Defined Contribution Plans

We maintain various defined contribution plans, which include profit sharing, and provide retirement benefits for substantially all of our employees. Matching obligations, in connection with the plans which are funded in cash and typically contributed to the plans in March of the following year, are as follows (in thousands):

 
U.S. Defined
Contribution
  
U.S. Defined
Contribution
 
Year ended December 31,      
2023 $10,510 
2022  10,180 
2021 $9,763   9,763 
2020  9,457 
2019  9,080 

We maintain a defined contribution Supplemental Executive Retirement Plan for key employees.  Under the plan, these employees may elect to defer a portion of their compensation and, in addition, we may at our discretion make contributions to the plan on behalf of the employees.  In March 20212023 and 2020,2022, contributions of $0.5 million and $0.3$0.8 million were made related to calendar year 2020years 2022 and 2019,2021, respectively. As of December 31, 2021,2023, we have recorded an obligation of $0.8$0.6 million for 2021.2023.

We also have an Employee Stock Ownership Plan and Trust (“ESOP”) for employees who are not covered by a collective bargaining agreement.  In connection therewith, we maintain an employee benefits trust to which we contribute shares of treasury stock.  We are authorized to instruct the trustees to distribute such shares toward the satisfaction of our future obligations under the plan. The shares held in trust are not considered outstanding for purposes of calculating earnings per share until they are committed to be released. The trustees will vote the shares in accordance with its fiduciary duties.  During 2021,2023, we contributed to the trust an additional 61,80072,800 shares from our treasury and released 61,80072,800 shares from the trust leaving 200 shares remaining in the trust as of December 31, 2021.2023.  The provision for expense in connection with the ESOP was approximately $2.5$3 million in 2021,2023, $2.3 million in 20202022 and $2.5 million in 2019.2021.

76

Index
STANDARD MOTOR PRODUCTS, INC. AND SUBSIDIARIES

NOTES TO CONSOLIDATED FINANCIAL STATEMENTS (continued)
Defined Benefit Pension Plan

We maintain a defined benefit unfunded Supplemental Executive Retirement Plan (“SERP”).  The SERP, as amended, is a defined benefit plan pursuant to which we will pay supplemental pension benefits to certain key employees upon the attainment of a contractual participant’s payment date based upon the employees’ years of service and compensation.  As there are no current participants in the SERP, there was 0no benefit obligation outstanding related to the plan as of December 31, 20212023 and 20202022 and we recorded 0no expense related to the plan during the years ended December 31, 2021, 20202023, 2022 and 2019.2021.

Postretirement Medical Benefits

We provide certain medical and dental care benefits to 14 former U.S. union employees. The postretirement medical and dental benefit obligation for the former union employees as of December 31, 2021,2023, and the net periodic benefit cost for our postretirement benefit plans for the years ended December 31, 2021, 20202023, 2022 and 20192021 were not material.

78


STANDARD MOTOR PRODUCTS, INC. AND SUBSIDIARIES
NOTES TO CONSOLIDATED FINANCIAL STATEMENTS (Continued)
16. Other Non-Operating Income (Expense), Net

The components of other non-operating income (expense), net are as follows:

 Year Ended December 31,  Year Ended December 31, 
 2021  2020  2019  2023
  2022
  2021
 
 (In thousands)  (In thousands) 
Interest and dividend income $49  $109  $97  $517  $209  $49 
Equity income from joint ventures
  3,295   820   2,865  2,070   3,464   3,295 
Loss on foreign exchange  (257)  (350)  (502)
Gain (loss) on foreign exchange  (776)  334  (257)
Other non-operating income, net  407   233   127   515   807   407 
Total other non-operating income, net $3,494  $812  $2,587 $2,326  $4,814  $3,494 

16.
17. Derivative Financial Instruments
Interest Rate Swap Agreements
We occasionally use derivative financial instruments to reduce our market risk for changes in interest rates on our variable rate borrowings. The principal financial instruments used for cash flow hedging purposes are interest rate swap agreements. The interest rate swaps effectively convert a portion of our variable rate borrowings under our existing facilities to a fixed rate based upon determined notional amount. We do not enter into interest rate swap agreements, or other financial instruments, for trading or speculative purposes.

In June 2022, we entered into a seven year interest rate swap agreement with a notional amount of $100 million that is to mature in May 2029.  The interest rate swap agreement has been designated as a cash flow hedge of interest payments on $100 million of borrowings under our Credit Agreement. Under the terms of the swap agreement, we will receive monthly variable interest payments based on one month Term SOFR and will pay interest based upon a fixed rate of 2.683% per annum, adjusted upward for the credit spread adjustment in the Credit Agreement of 0.10% and the loan margin in the Credit Agreement of 1.25% at December 31, 2023.
 
The fair value of the interest rate swap agreement as of December 31, 2023 and December 31, 2022 was an asset of $3.9 million and $5.2 million, respectively, which has been deferred and recorded in accumulated other comprehensive income, net of income taxes, in our consolidated balance sheet. When the interest expense on the underlying borrowing is recognized, the deferred gain/loss in accumulated other comprehensive income is recorded in earnings as interest expense in the consolidated statements of operations. We perform quarterly hedge effectiveness assessments and anticipate that the interest rate swap will be highly effective throughout its term.

18. Fair Value Measurements

We follow a three-level fair value hierarchy that prioritizes the inputs to measure fair value.  This hierarchy requires entities to maximize the use of “observable inputs” and minimize the use of “unobservable inputs.”  The three levels of inputs used to measure fair value are as follows:
Level 1: Quoted prices (unadjusted) for identical assets or liabilities in active markets as of the measurement date.
Level 2: Significant other observable inputs other than Level 1 prices such as quoted prices for similar assets or liabilities; quoted prices in markets that are not active; or other inputs that are observable or can be corroborated by observable market data.
Level 3: Significant unobservable inputs that reflect assumptions that market participants would use in pricing an asset or liability.

79


STANDARD MOTOR PRODUCTS, INC. AND SUBSIDIARIES
NOTES TO CONSOLIDATED FINANCIAL STATEMENTS (Continued)
The following is a summary of the estimated fair values, carrying amounts, and classification under the fair value hierarchy of our financial instruments consistingat December 31, 2023 and December 31, 2022 (in thousands):

    December 31, 2023  December 31, 2022 
 
Fair Value
Hierarchy
 Fair Value  
Carrying
Amount
  Fair Value  
Carrying
Amount
 
              
Cash and cash equivalents (a)
LEVEL 1/2
 
$
32,526
  
$
32,526
  
$
21,150
  
$
21,150
 
Deferred compensation
LEVEL 1
  
23,893
   
23,893
   
20,190
   
20,190
 
Short term borrowings
LEVEL 1
  
5,029
   
5,029
   
55,031
   
55,031
 
Long-term debt
LEVEL 1
  
151,182
   
151,182
   
184,589
   
184,589
 
Cash flow interest rate swap
LEVEL 2
  
3,939
   
3,939
   
5,174
   
5,174
 
Long-term investmentsLEVEL 2  7,468   7,468       

(a)As of December 31, 2023 cash and cash equivalents consist of cash of $29.5 million and cash equivalents of $3 million, which are classified as Level 1 and Level 2, respectively, under the fair value hierarchy.  Cash and cash equivalents at December 31, 2022 consists solely of cash of $21.2 million, which is classified as Level 1 under the fair value hierarchy.

Cash equivalents consist of cashcertificates of deposit with original maturities of 3 months, or less. These securities are accounted for as held-to-maturity and cash equivalents, deferred compensation, and short term borrowings approximaterecorded at amortized cost, which approximates their fair value.  In each instance, fair value is determined after considering Level 1 inputs under the three-level fair value hierarchy.  For fair value purposes, the carrying value of cash and cash equivalents approximates fair value due to the short maturity of those investments.values at December 31, 2023.  The fair value of the underlying assets held by the deferred compensation plan are based on the quoted market prices of the underlying funds which are held inby registered investment companies. The carrying value of our revolvingvariable rate short-term borrowings and long-term debt under our credit facilities classifiedapproximates fair value as short term borrowings, equalsthe variable interest rates in the facilities reflect current market rates. The fair value of our cash flow interest rate swap agreement is obtained from an independent third party, is based upon market value becausequotes, and represents the net amount required to terminate the interest rate reflects currentswap, taking into consideration market rates.rates and counterparty credit risk.  Long-term investments consist of certificates of deposit with original maturities in excess of twelve months. These securities are accounted for as held-to-maturity and recorded at amortized cost, which approximates their fair values at December 31, 2023.

77

Index
STANDARD MOTOR PRODUCTS, INC. AND SUBSIDIARIES

NOTES TO CONSOLIDATED FINANCIAL STATEMENTS (continued)
17.19. Income Taxes

The income tax provision (benefit) consists of the following (in thousands):

 Year Ended December 31,  Year Ended December 31, 
 2021  2020  2019  2023
  2022
  2021
 
Current:                  
Domestic $26,528  $30,368  $14,632  $15,422  $16,182  $26,528 
Foreign  5,851   4,064   3,019   9,224   8,669   5,851 
Total current  32,379   34,432   17,651   24,646   24,851   32,379 
                        
Deferred:                        
Domestic  (1,161)  (7,418)  4,677   (5,769)  1,102   (1,161)
Foreign  (174)  (52)  417   (509)  (747)  (174)
Total deferred  (1,335)  (7,470)  5,094   (6,278)  355   (1,335)
Total income tax provision $31,044  $26,962  $22,745  $18,368  $25,206  $31,044 

80


STANDARD MOTOR PRODUCTS, INC. AND SUBSIDIARIES
NOTES TO CONSOLIDATED FINANCIAL STATEMENTS (Continued)
Reconciliations between taxes at the U.S. Federal income tax rate and taxes at our effective income tax rate on earnings from continuing operations before income taxes are as follows (in thousands):

 Year Ended December 31, 
 2021  2020  2019  Year Ended December 31, 
          
2023
  
2022
  
2021
 
U.S. Federal income tax rate of 21%
 $27,398  $22,550  $19,277  $17,160  $20,650  $27,398 
Increase (decrease) in tax rate resulting from:                        
State and local income taxes, net of federal income tax benefit  4,579   3,781   3,328   2,086   3,118   4,579 
Income tax (tax benefit) attributable to foreign income  (122)  330   191 
Change in valuation allowance  674   1,068   466 
Income tax (benefit) attributable to foreign income  377   (53)  (122)
Other non-deductible items, net  (1,277)  (563)  (409)  (1,929)  423   (1,277)
Change in valuation allowance  466   864   358 
Provision for income taxes $31,044  $26,962  $22,745  $18,368  $25,206  $31,044 

The following is a summary of the components of the net deferred tax assets and liabilities recognized in the accompanying consolidated balance sheets (in thousands):

 December 31,  December 31, 
 2021  2020  2023
  2022
 
Deferred tax assets:            
Inventories $12,181  $12,773  $10,493  $11,604 
Allowance for customer returns  14,185   13,804   13,083   14,506 
Postretirement benefits  33   42 
Allowance for expected credit losses
  1,450   1,412 
Accrued asbestos liabilities  20,758   17,208 
Accrued salaries and benefits  15,585   12,984   11,816   12,048 
Tax credit and NOL carryforwards  5,702   1,451   5,968   5,103 
Accrued asbestos liabilities  15,463   15,372 
Allowance for expected credit losses
  3,567   2,965 
Other  190   170   17   215 
  64,789   58,008   65,702   63,649 
Valuation allowance  (2,087)  (1,621)  (3,830)  (3,155)
Total deferred tax assets  62,702   56,387   61,872   60,494 
Deferred tax liabilities:                
Intangible assets acquired, net of amortization
  13,450   0   12,668   13,292 
Depreciation  7,589   7,710   7,597   8,715 
Interest rate swap agreement
  990   1,299 
Other  5,537   3,907   84   3,530 
Total deferred tax liabilities  26,576   11,617   21,339   26,836 
                
Net deferred tax assets $36,126  $44,770  $40,533  $33,658 

78

Index
STANDARD MOTOR PRODUCTS, INC. AND SUBSIDIARIES

NOTES TO CONSOLIDATED FINANCIAL STATEMENTS (continued)
In assessing the realizability of the deferred tax assets, we consider whether it is more likely than not that some portion or the entire deferred tax asset will be realized.  Ultimately, the realization of the deferred tax asset is dependent upon the generation of sufficient taxable income in those periods in which temporary differences become deductible and/or net operating loss carryforwards can be utilized.  We consider the level of historical taxable income, scheduled reversal of temporary differences, carryback and carryforward periods, tax planning strategies and projected future taxable income in determining whether a valuation allowance is warranted.  We also consider cumulative losses in recent years as well as the impact of one-time events in assessing our pre-tax earnings. Assumptions regarding future taxable income require significant judgment. Our assumptions are consistent with estimates and plans used to manage our business.

The valuation allowance of $2.1$3.8 million as of December 31, 20212023 is intended to provide for uncertainty regarding the ultimate realization of our U.S. foreign tax credit carryovers and foreign net operating loss carryovers. Based on these considerations, we believe it is more likely than not that we would realize the benefit of the net deferred tax asset of $36.1$40.5 million as of December 31, 2021,2023, which is net of the remaining valuation allowance. At December 31, 2021,2023, we have foreign tax credit carryforwards of approximately $1.9$3.8 million that will expire in varying amounts by 20302032.

As related to the taxation of our foreign subsidiaries, we aggregate our foreign earnings and profits, and utilize allowable deductions and available foreign tax credits in computing our U.S. tax. Notwithstanding the U.S. taxation of these amounts, we intend to continue to invest most, or all, of these earnings indefinitely outside of the U.S., and do not expect to incur any significant additional taxes related to such amounts.

81


STANDARD MOTOR PRODUCTS, INC. AND SUBSIDIARIES
NOTES TO CONSOLIDATED FINANCIAL STATEMENTS (Continued)
In accordance with generally accepted accounting practices, we recognize in our financial statements only those tax positions that meet the more-likely-than-not recognition threshold.  We establish tax reserves for uncertain tax positions that do not meet this threshold.  During the years ended December 31, 2021, 20202023, 2022 and 2019,2021, we did 0not establish a liability for uncertain tax positions.

79

Index
STANDARD MOTOR PRODUCTS, INC. AND SUBSIDIARIES

NOTES TO CONSOLIDATED FINANCIAL STATEMENTS (continued)
We are subject to taxation in the U.S. and various state, local and foreign jurisdictions.  As of December 31, 2021,2023, the Company is no longer subject to U.S. Federal tax examinations for years before 2018.2020.  We remain subject to examination by state and local tax authorities for tax years 20172019 through 20202022.  Foreign jurisdictions have statutes of limitations generally ranging from 2 to 6 years.  Years still open to examination by foreign tax authorities in major jurisdictions include Canada (20172019 onward), Hong Kong (20162018 onward), China (20172021 onward), Mexico (20172019 onward), Poland (20162018 onward), and Hungary (20152018 onward), U.K. (2017 onward) and Germany (2019 onward).  We do not presently anticipate that our unrecognized tax benefits will significantly increase or decrease over the next 12 months; however, actual developments in this area could differ from those currently expected.

18.
20. Earnings Per Share

We present two calculations of earnings per common share.  “Basic” earnings per common share equals net earnings attributable to SMP divided by weighted average common shares outstanding during the period. “Diluted” earnings per common share equals net earnings attributable to SMP divided by the sum of weighted average common shares outstanding during the period plus potentially dilutive common shares.  Potentially dilutive common shares that are anti-dilutive are excluded from net earnings per common share.

The following are reconciliations of the net earnings attributable to SMP and the shares used in calculating basic and dilutive net earnings per common share attributable to SMP (in thousands, except per share data):

 Year Ended December 31,  Year Ended December 31, 
 2021  2020  2019  2023
  2022
  2021
 
Net Earnings Attributable to SMP -
                  
Earnings from continuing operations $99,353  $80,417  $69,051  $63,144  $73,042  $99,353 
Loss from discontinued operations  (8,467)  (23,024)  (11,134)  (28,996)  (17,691)  (8,467)
Net earnings attributable to SMP $90,886  $57,393  $57,917  $34,148  $55,351  $90,886 
                        
Basic Net Earnings Per Common Share Attributable to SMP -                        
Earnings from continuing operations per common share $4.49  $3.59  $3.09  $2.91  $3.37  $4.49 
Loss from discontinued operations per common share  (0.39)  (1.02)  (0.50)  (1.34)  (0.82)  (0.39)
Net earnings per common share attributable to SMP
 $4.10  $2.57  $2.59  $1.57  $2.55  $4.10 
                        
Weighted average common shares outstanding  22,147   22,374   22,378   21,716   21,684   22,147 
                        
  2023
   2022
   2021
 
Diluted Net Earnings Per Common Share Attributable to SMP -
                        
Earnings from continuing operations per common share
 $4.39  $3.52  $3.03  $2.85  $3.30  $4.39 
Loss from discontinued operations per common share
  (0.37)  (1.01)  (0.49)  (1.31)  (0.80)  (0.37)
Net earnings per common share attributable to SMP
 $4.02  $2.51  $2.54  $1.54  $2.50  $4.02 
                        
Weighted average common shares outstanding  22,147   22,374   22,378   21,716   21,684   22,147 
Plus incremental shares from assumed conversions:                        
Dilutive effect of restricted stock and performance-based stock  469   452   440   445   456   469 
Weighted average common shares outstanding – Diluted  22,616   22,826   22,818   22,161   22,140   22,616 

80
82

STANDARD MOTOR PRODUCTS, INC. AND SUBSIDIARIES

NOTES TO CONSOLIDATED FINANCIAL STATEMENTS (continued)(Continued)
The shares listed below were not included in the computation of diluted net earnings per common share attributable to SMP because to do so would have been anti-dilutive for the periods presented or because they were excluded under the treasury method (in thousands):

  2021  2020  2019 
Restricted and performance shares  269   268   255 
  2023
  2022
  2021
 
Restricted and performance shares  280   292   269 

19.
21. Industry Segment and Geographic Data

We have 2 major reportableBeginning on January 1, 2023, we reorganized our business into three operating segments each of which focuses– Vehicle Control, Temperature Control and Engineered Solutions. The new operating segment structure better aligns our operations with our strategic focus on a specific line of automotive partsdiversifying our business, provides greater transparency into our positioning to capture opportunities for growth in the future, and provides clarity regarding the unique dynamics and margin profiles of the markets served by each segment.

Vehicle Control is the new name for our Engine Management operating segment.  It includes our core automotive aftermarket with a complementary focus onbusiness after carving out all non-aftermarket business to our Engineered Solutions operating segment.  The Vehicle Control operating segment includes sales from ignition, emissions and fuel delivery, electrical and safety, and wire sets and other product categories.

Temperature Control is our ongoing automotive aftermarket operating segment, after the heavy duty, industrial equipmentcarve out of all non-aftermarket business to our Engineered Solutions operating segment. Temperature Control derives its sales from air conditioning system components and original equipment service markets. Our Engine Management Segment manufactures and remanufactures ignition and emission parts, ignition wires, battery cables, fuel system parts and sensors for vehicle systems.other thermal product categories.  Our Temperature Control Segment manufactures and remanufacturesoperating segment is poised to benefit from the broader adoption of more complex air conditioning compressors, air conditioningsystems that will provide passenger comfort regardless of the vehicle’s powertrain.

Engineered Solutions is a new operating segment created by carving out all non-aftermarket business from our prior Engine Management and heating parts, engine cooling system parts,Temperature Control operating segments.  Our Engineered Solutions segment supplies custom-engineered solutions to vehicle and equipment manufacturers in highly diversified global end-markets such as commercial and light vehicles, construction, agriculture, power window accessoriessports and windshield washer system parts.marine.

83


STANDARD MOTOR PRODUCTS, INC. AND SUBSIDIARIES
NOTES TO CONSOLIDATED FINANCIAL STATEMENTS (Continued)
The accounting policies of each segment are the same as those described in the summary of significant accounting policies (see Note 1). 

The following tables contain financial information for each reportable operating segment (in thousands):

 Year Ended December 31,  Year Ended December 31, 
 2021  2020  2019  2023
  2022
  2021
 
Net sales (a):                  
Engine Management $937,936  $835,685  $849,161 
Vehicle Control
 $
737,932  $
750,571  $
737,431 
Temperature Control  348,423   281,954   278,355  
337,754  
351,237  
324,080 
Engineered Solutions
  282,586   270,007   237,305 
Other  12,457   10,949   10,397          
Total net sales $1,298,816  $1,128,588  $1,137,913  $1,358,272  $1,371,815  $1,298,816 
Intersegment sales (a):
            
Engine Management $23,599  $15,952  $19,569 
Depreciation and Amortization:            
Vehicle Control
 $
13,877  $
14,075  $
14,840 
Temperature Control  9,024   6,162   6,545  
3,424  
2,973 

3,345 
Other  (32,623)  (22,114)  (26,114)
Total intersegment sales $0  $0  $0 
Depreciation and Amortization:            
Engine Management $21,881  $20,417  $19,463 
Temperature Control  3,626   4,035   4,568 
Engineered Solutions  9,966   9,557   7,390 
Other  1,736   1,871   1,778   1,755   1,693   1,668 
Total depreciation and amortization $27,243  $26,323  $25,809  $29,022  $28,298  $27,243 
Operating income (loss):
                        
Engine Management $117,367  $111,217  $103,808 
Vehicle Control
 $
71,327
  
$
74,153
  $
97,029
 
Temperature Control  36,997   21,296   13,667  
17,343  
26,459  
30,077 
Engineered Solutions  19,944   18,713   19,982 
Other  (25,365)  (23,618)  (22,980)  (15,937)  (15,190)  (18,089)
Total operating income $128,999  $108,895  $94,495  $92,677  $104,135  $128,999 
Investment in unconsolidated affiliates:                        
Engine Management $2,729  $2,428  $2,243 
Vehicle Control
 $
2,496
  $
2,490
  $
2,729
 
Temperature Control  41,358   38,079   36,615  
19,711  
27,557  
28,518 
Engineered Solutions  1,843   11,698   12,840 
Other  0   0   0          
Total investment in unconsolidated affiliates $44,087  $40,507  $38,858  $24,050  $41,745  $44,087 
Capital expenditures:
                        
Engine Management $21,922  $13,496  $12,593 
Vehicle Control
 $
13,955
  $
13,378
  $
17,048
 
Temperature Control  2,586   1,988   2,273  
1,899  
3,973  
2,130 
Engineered Solutions  12,095   6,489   5,354 
Other  1,367   2,336   1,319   684   2,116   1,343 
Total capital expenditures $25,875  $17,820  $16,185  $28,633  $25,956  $25,875 
Total assets:
                        
Engine Management $845,767  $618,210  $594,953 
Vehicle Control
 $
620,569
  $
618,789
  $
604,016
 
Temperature Control  257,114   230,111   216,591  
274,657  
254,137  
234,771 
Engineered Solutions  292,080   289,518   272,791 
Other  95,080   108,219   92,310   105,741   92,485   86,383 
Total assets $1,197,961  $956,540  $903,854  $1,293,047  $1,254,929  $1,197,961 


(a)Segment net sales includeThere are no intersegment sales inamong our Engine ManagementVehicle Control, Temperature Control and Temperature ControlEngineered Solutions operating segments.

Other consists of financial information related to the eliminationactivities of intersegment sales from our Engine Management and Temperature Control segments, as well as items pertaining to our Canadian business unit that does not meet the criteria of a reportable operating segment and our corporate headquarters function.

8184

STANDARD MOTOR PRODUCTS, INC. AND SUBSIDIARIES

NOTES TO CONSOLIDATED FINANCIAL STATEMENTS (continued)(Continued)
Reconciliation of segment operating income to net earnings:

 Year Ended December 31,  Year Ended December 31, 
 2021  2020  2019  2023
  2022
  2021
 
 (In thousands)  (In thousands) 
Operating income $128,999  $108,895  $94,495  $92,677  $104,135  $128,999 
Other non-operating income, net  3,494   812   2,587  2,326   4,814   3,494 
Interest expense  2,028   2,328   5,286   13,287   10,617   2,028 
Earnings from continuing operations before income taxes  130,465   107,379   91,796   81,716   98,332   130,465 
Provision for income taxes
  31,044   26,962   22,745   18,368   25,206   31,044 
Earnings from continuing operations  99,421   80,417   69,051   63,348   73,126   99,421 
Discontinued operations, net of tax  (8,467)  (23,024)  (11,134)  (28,996)  (17,691)  (8,467)
Net earnings $90,954  $57,393  $57,917  $34,352  $55,435  $90,954 

 December 31,  December 31, 
 2021  2020  2019  2023
  2022
  2021
 
Long-lived assets (a):
 (In thousands)  (In thousands) 
United States $315,983  $241,053  $253,384  $368,792  $326,199  $315,983 
Asia
  80,175   40,621   38,942   75,869   76,766   80,175 
Europe  37,892   16,504   17,004   44,517   38,351   37,892 
Mexico  12,119   10,586   12,036   13,262   10,355   12,119 
Canada
  4,461   4,470   4,659   5,851   7,161   4,461 
Total long-lived assets $450,630  $313,234  $326,025  $508,291  $458,832  $450,630 

(a)Long-lived assets are attributed to countries based upon the location of the assets.

82

Index
STANDARD MOTOR PRODUCTS, INC. AND SUBSIDIARIES

NOTES TO CONSOLIDATED FINANCIAL STATEMENTS (continued)
Our 3three largest individual customers accounted for approximately 57%59% of our consolidated net sales in 2021.2023. During 2021,2023, O’Reilly NAPAAuto Parts, AutoZone and AutoZoneNAPA accounted for 26%29%, 17%16% and 14% of our consolidated net sales, respectively. Net sales from each of the customers were reported in both our Engine ManagementVehicle Control and Temperature Control Segments. The loss of one or more of these customers or, a significant reduction in purchases of our products from any one of them such as the decision, announced in December 2020, of a large retail customer to pursue a private brand strategy for its engine management product line, could have a materiallymaterial adverse impact on our business, financial condition and results of operations. In addition, any consolidation among our key customers may further increase our customer concentration risk.

For the disaggregation of our net sales from customers by geographic area, major product group and major sales channels forgeographic area within each of our operating segments, see Note 20,22, “Net Sales.”

20.
22. Net Sales

Disaggregation of Net Sales

We disaggregate our net sales from contracts with customers by geographic area, major product group and major sales channels forgeographic area within each of our segments, as we believe it best depicts how the nature, amount, timing and uncertainty of our net sales are affected by economic factors.

Major Product Group

The following tables provide disaggregationVehicle Control operating segment generates its revenues from core aftermarket sales of netignition, emissions, and fuel delivery, electrical and safety, and wire sets and other product categories. The Temperature Controloperating segment generates its revenue from aftermarket sales information for the years ended December 31, 2021, 2020of air conditioning system components and 2019 (in thousands):other thermal products. The Engineered Solutions operating segment generates revenues from custom-engineered products to vehicle and equipment manufacturers in highly diversified  global end-markets such as commercial and light vehicles, construction, agriculture, power sports and marine.

Year Ended December 31, 2021 (a)
 
Engine
Management
  
Temperature
Control
  Other (b)  Total 
Geographic Area:            
United States $804,398  $329,980  $0  $1,134,378 
Canada  33,590   16,513   12,457   62,560 
Asia  40,668   348   0   41,016 
Mexico  25,288   358   0   25,646 
Europe   27,293   390   0   27,683 
Other foreign  6,699   834   0   7,533 
Total $937,936  $348,423  $12,457  $1,298,816 
Major Product Group:                
Ignition, emission control, fuel and safety related system products $786,514  $0  $8,956  $795,470 
Wire and cable  151,422   0   (275)  151,147 
Compressors  0   206,697   1,434   208,131 
Other climate control parts  0   141,726   2,342   144,068 
Total $937,936  $348,423  $12,457  $1,298,816 
Major Sales Channel:                
Aftermarket $692,895  $317,427  $12,457  $1,022,779 
OE/OES  218,338   28,922   0   247,260 
Export  26,703   2,074   0   28,777 
Total $937,936  $348,423  $12,457  $1,298,816 

83
85

STANDARD MOTOR PRODUCTS, INC. AND SUBSIDIARIES

NOTES TO CONSOLIDATED FINANCIAL STATEMENTS (continued)(Continued)
Year Ended December 31, 2020 (a)
 
Engine
Management
  
Temperature
Control
  Other (b)  Total 
Geographic Area:            
United States $738,521  $268,680  $0  $1,007,201 
Canada  25,842   11,679   10,949   48,470 
Asia  35,079   165   0   35,244 
Mexico
  19,336   271   0   19,607 
Europe  12,255   351   0   12,606 
Other foreign  4,652   808   0   5,460 
Total $835,685  $281,954  $10,949  $1,128,588 
Major Product Group:                
Ignition, emission control, fuel and safety related system products $691,722  $0  $8,172  $699,894 
Wire and cable  143,963   0   159   144,122 
Compressors  0   163,071   812   163,883 
Other climate control parts  0   118,883   1,806   120,689 
Total $835,685  $281,954  $10,949  $1,128,588 
Major Sales Channel:                
Aftermarket $674,744  $255,716  $10,949  $941,409 
OE/OES  142,072   25,070   0   167,142 
Export  18,869   1,168   0   20,037 
Total $835,685  $281,954  $10,949  $1,128,588 
The following table summarizes consolidated net sales by major product group within each operating segment for the years ended December 31, 2023, 2022 and 2021 (in thousands):

Year Ended December 31, 2019 (a)
 
Engine
Management
  
Temperature
Control
  Other (b)  Total 
Geographic Area:            
United States $760,134  $263,769  $0  $1,023,903 
Canada  27,439   12,322   10,397   50,158 
Asia  24,838   130   0   24,968 
Mexico
  19,330   705   0   20,035 
Europe  13,341   534   0   13,875 
Other foreign  4,079   895   0   4,974 
Total $849,161  $278,355  $10,397  $1,137,913 
Major Product Group:                
Ignition, emission control, fuel and safety related system products $705,994  $0  $6,381  $712,375 
Wire and cable  143,167   0   477   143,644 
Compressors  0   160,485   1,338   161,823 
Other climate control parts  0   117,870   2,201   120,071 
Total $849,161  $278,355  $10,397  $1,137,913 
Major Sales Channel:                
Aftermarket $697,722  $248,420  $10,397  $956,539 
OE/OES  129,815   27,915   0   157,730 
Export  21,624   2,020   0   23,644 
Total $849,161  $278,355  $10,397  $1,137,913 

(a)
Segment net sales include intersegment sales in our Engine Management and Temperature Control segments.

(b)Other consists of the elimination of intersegment sales from our Engine Management and Temperature Control segments as well as sales from our Canadian business unit that does not meet the criteria of a reportable operating segment. Intersegment wire and cable sales for the year ended December 31, 2021 exceeded third party sales from our Canadian business unit.
  Year Ended December 31, 
  2023  2022  2021 
Vehicle Control         
Engine Management (Ignition, Emissions and Fuel Delivery) $450,180  $454,571  $444,196 
Electrical and Safety  221,782   230,487   224,520 
Wire Sets and Other  65,970   65,513   68,715 
Total Vehicle Control  737,932   750,571   737,431 
             
Temperature Control            
AC System Components  237,756   245,484   231,466 
Other Thermal Components  99,998   105,753   92,614 
Total Temperature Control  337,754   351,237   324,080 
             
Engineered Solutions            
Commercial Vehicle  83,025   80,275   76,066 
Construction/Agriculture  43,402   42,385   33,220 
Light Vehicle  92,759   91,533   86,440 
All Other  63,400   55,814   41,579 
Total Engineered Solutions  282,586   270,007   237,305 
             
Other         

            
Total $1,358,272  $1,371,815  $1,298,816 

Geographic Area

We sell our line of products primarily in the United States, with additional sales in Canada, Mexico, Europe, Asia and Latin America. Sales are attributed to countries based upon the location of the customer. Our sales are substantially denominated in U.S. dollars.

The following tables provide disaggregation of net sales information by geographic area within each operating segment for the years ended December 31, 2023, 2022 and 2021 (in thousands):
84
Year Ended December 31, 2023 
Vehicle
Control
  
Temperature
Control
  
Engineered
Solutions
  Other  Total 
Geographic Area:               
United States $659,570  $319,904  $168,878  $  $1,148,352 
Canada  36,088   17,081   25,689      78,858 
Europe  916   8   59,266      60,190 
Mexico  36,350   49   6,658      43,057 
Asia  351   526   19,522      20,399 
Other foreign  4,657   186   2,573      7,416 
Total $737,932  $337,754  $282,586  $  $1,358,272 

86

STANDARD MOTOR PRODUCTS, INC. AND SUBSIDIARIES

NOTES TO CONSOLIDATED FINANCIAL STATEMENTS (continued)(Continued)
Major Product Group
Year Ended December 31, 2022 
Vehicle
Control
  
Temperature
Control
  
Engineered
Solutions
  Other  Total 
Geographic Area:               
United States $682,145  $335,281  $191,678  $  $1,209,104 
Canada  35,233   14,596   16,762      66,591 
Europe  661   75   37,784      38,520 
Mexico  26,019   401   4,897      31,317 
Asia  2,408   63   16,715      19,186 
Other foreign  4,105   821   2,171      7,097 
Total $750,571  $351,237  $270,007  $  $1,371,815 

The Engine Management segment of the Company principally generates revenue from the sale of automotive engine parts in the automotive aftermarket including ignition, emission control, fuel and safety related system products, and wire and cable parts.  The Temperature Control segment of the Company principally generates revenue from the sale of automotive temperature control systems parts in the automotive aftermarket including air conditioning compressors and other climate control parts.
Year Ended December 31, 2021 
Vehicle
Control
  
Temperature
Control
  
Engineered
Solutions
  Other  Total 
Geographic Area:               
United States $677,684  $309,247  $147,447  $  $1,134,378 
Canada  35,063   13,585   13,912      62,560 
Europe  771   153   26,759      27,683 
Mexico  19,741   358   5,547      25,646 
Asia  144   101   40,771      41,016 
Other foreign  4,028   636   2,869      7,533 
Total $737,431  $324,080  $237,305  $  $1,298,816 

Major Sales Channel

In the aftermarket channel, we sell our products to warehouse distributors and retailers.  Our customers buy directly from us and sell directly to jobber stores, professional technicians and to “do-it-yourselfers” who perform automotive repairs on their personal vehicles.  In the Original Equipment (“OE”) and Original Equipment Service (“OES”) channel, we sell our products to original equipment manufacturers who redistribute our products within their distribution network, independent dealerships and service dealer technicians.  Lastly, in the Export channel, our domestic entities sell to customers outside the United States.

21.
23. Commitments and Contingencies

Total rent expense for the three years ended December 31, 20212023 was as follows (in thousands):

  Total (1)
  Real Estate  Other 
2023
 $19,706  $15,735  $3,971 
2022
  14,135   11,385   2,750 
2021
  12,065   9,500   2,565 

  Total  Real Estate  Other 
2021 (1)
 $12,065  $9,500  $2,565 
2020 (1)
  11,669   8,290   3,379 
2019  11,382   7,909   3,473 


(1)
Includes expenses of approximately $2$3.3 million, $2.7 million, and $2.5$2 million for the years ended December 31, 20212023, 2022 and 2020,2021, respectively, related to non-lease components such as maintenance, property taxes, etc., and operating lease expense for leases with an initial term of 12 months or less, which is not material.

For our operating lease minimal rental payments that we are obligated to make, see Note 7, “Leases.”

Warranties

We generally warrant our products against certain manufacturing and other defects. These product warranties are provided for specific periods of time depending on the nature of the product. As of December 31, 20212023 and 2020,2022, we have accrued $17.5$21.1 million and $17.7$19.7 million, respectively, for estimated product warranty claims included in accrued customer returns. The accrued product warranty costs are based primarily on historical experience of actual warranty claims. Warranty expense for each of the years 2021, 20202023, 2022, and 20192021 were $91.9$120 million, $87.1$112.5 million and $99.3$91.9 million, respectively.

The following table provides the changes in our product warranties:

 December 31,  December 31, 
 2021  2020  2023
  2022
 
 (In thousands)  (In thousands) 
Balance, beginning of period $17,663  $17,175  $19,667  $17,463 
Liabilities accrued for current year sales  91,908   87,116   120,027   112,477 
Settlements of warranty claims  (92,108)  (86,628)  (118,560)  (110,273)
Balance, end of period $17,463  $17,663  $21,134  $19,667 

85
87

STANDARD MOTOR PRODUCTS, INC. AND SUBSIDIARIES

NOTES TO CONSOLIDATED FINANCIAL STATEMENTS (continued)(Continued)
Letters of Credit

AtAs of December 31, 2021,2023 and 2022, we had outstanding letters of credit with certain vendors aggregating approximately $2.6 million.$2.3 million and $2.4 million, respectively. These letters of credit are being maintained as security for reimbursements to insurance companies and as security to the landlord of our administrative offices in Long Island City, New York. The contract amount of the letters of credit is a reasonable estimate of their value as the value for each is fixed over the life of the commitment.

Change of Control Arrangements

We have a change in control arrangement with 1one key officer. In the event of a change of control (as defined in the agreement), the executive will receive severance payments and certain other benefits as provided in his agreement.

Asbestos

In 1986, we acquired a brake business, which we subsequently sold in March 1998 and which is accounted for as a discontinued operation in the accompanying statement of operations. When we originally acquired this brake business, we assumed future liabilities relating to any alleged exposure to asbestos-containing products manufactured by the seller of the acquired brake business. In accordance with the related purchase agreement, we agreed to assume the liabilities for all new claims filed on or after September 2001. Our ultimate exposure will depend upon the number of claims filed against us on or after September 2001, and the amounts paid for settlements, awards of asbestos-related damages, and defense of such claims.  At December 31, 2021,2023, approximately 1,5541,390 cases were outstanding for which we may be responsible for any related liabilities. Since inception in September 2001 through December 31, 2021,2023, the amounts paid for settled claims and awards of asbestos-related damages, including interest, were approximately $53.8$74.6 million. We do not have insurance coverage for the indemnity and defense costs associated with the claims we face.

In evaluating our potential asbestos-related liability, we have considered various factors including, among other things, an actuarial study of the asbestos related liabilities performed by an independent actuarial firm, our settlement amounts and whether there are any co-defendants, the jurisdiction in which lawsuits are filed, and the status and results of such claims. As is our accounting policy, we consider the advice of actuarial consultants with experience in assessing asbestos-related liabilities to estimate our potential claim liability; and perform an actuarial evaluation in the third quarter of each year and whenever events or changes in circumstances indicate that additional provisions may be necessary. The methodology used to project asbestos-related liabilities and costs in our actuarial study considered: (1) historical data available from publicly available studies; (2) an analysis of our recent claims history to estimate likely filing rates into the future; (3) an analysis of our currently pending claims; (4) an analysis of our settlements and awards of asbestos-related damages to date; and (5) an analysis of closed claims with pay ratios and lag patterns in order to develop average future settlement values. Based on the information contained in the actuarial study and all other available information considered by us, we have concluded that no amount within the range of settlement payments and awards of asbestos-related damages was more likely than any other and, therefore, in assessing our asbestos liability we compare the low end of the range to our recorded liability to determine if an adjustment is required.

88


STANDARD MOTOR PRODUCTS, INC. AND SUBSIDIARIES
NOTES TO CONSOLIDATED FINANCIAL STATEMENTS (Continued)

In accordance with our policy to perform an annual actuarial evaluation in the third quarter of each year, an actuarial study was performed as of August 31, 20212023. TheThe results of the August 31, 20212023 study included an estimate of our undiscounted liability for settlement payments and awards of asbestos-related damages, excluding legal costs, and any potential recovery from insurance carriers, ranging from $ $8460.9 million to $100.2135.3 million for the period through 2065. The change from the updated prior year study, which was in Decemberas of 2020,August 31, 2022, was a $2.1$15.2 million decreaseincrease for the low end of the range and a $1.1$23.7 million increase for the high end of the range. The changeincrease in the estimated undiscounted liability from the updated prior year study at both the low end and high end of the range reflects our actual experience, our historical data and certain assumptions with respect to events that may occur in the future.

86

STANDARD MOTOR PRODUCTS, INC. AND SUBSIDIARIES

NOTES TO CONSOLIDATED FINANCIAL STATEMENTS (continued)
Based upon the results of the August 31, 20212023 actuarial study, in September 20212023 we increased our asbestos liability to $60.984 million, the low end of the range, and recorded an incremental pre-tax provision of $5.323.8 million in earnings (loss) from discontinued operations in the accompanying statement of operations. Future legal costs, which are expensed as incurred and reported in earnings (loss) from discontinued operations in the accompanying statement of operations, are estimated, according to the August 31, 20212023 study, to range from $49.453.1 million to $$105.299.3 million for the period through 2065. Total operating cash outflows related to discontinued operations, which include settlements, awards of asbestos-related damages and legal costs, net of taxes, were $$118.8 million, $16.412 million and $7.68.8 million for the years ended December 31, 2021, 20202023, 2022 and 20192021, respectively.

We plan to perform an annual actuarial evaluation during the third quarter of each year for the foreseeable future and whenever events or changes in circumstances indicate that additional provisions may be necessary. Given the uncertainties associated with projecting such matters into the future and other factors outside our control, we can give no assurance that additional provisions will not be required. We will continue to monitor events and changes in circumstances surrounding these potential liabilities in determining whether to perform additional actuarial evaluations and whether additional provisions may be necessary. At the present time, however, we do not believe that any additional provisions would be reasonably likely to have a material adverse effect on our liquidity or consolidated financial position.

Other Litigation

In connection with the aforementioned former brake business, we were subject to a legal proceeding alleging a breach of contract claim of the related purchase agreement. In May 2023, we were found liable for approximately $11 million and, as such, in the second quarter of 2023 we recorded a pre-tax provision of such amount in earnings (loss) from discontinued operations in the accompanying statement of operations. However, in August 2023, we reached a final settlement of the legal proceeding, in which we reduced our liability to $10.5 million. In connection therewith, we reduced the pre-tax provision to $10.5 million and recorded a $0.5 million credit in earnings (loss) from discontinued operations in the accompanying statement of operations. Payment of such claim was made in early October 2023.

We are currently involved in various other legal claims and legal proceedings (some of which may involve substantial amounts), including claims related to commercial disputes, product liability, employment, and environmental.  Although these legal claims and legal proceedings are subject to inherent uncertainties, based on our understanding and evaluation of the relevant facts and circumstances, we believe that the ultimate outcome of these matters will not, either individually or in the aggregate, have a material adverse effect on our business, financial condition or results of operations. We may at any time determine that settling any of these matters is in our best interests, which settlement may include substantial payments. Although we cannot currently predict the specific amount of any liability that may ultimately arise with respect to any of these matters, we will record provisions when the liability is considered probable and reasonably estimable. Significant judgment is required in both the determination of probability and the determination as to whether an exposure can be reasonably estimated. As additional information becomes available, we reassess our potential liability related to these matters. Such revisions of the potential liabilities could have a material adverse effect on our business, financial condition or results of operations.

87
89


ITEM 9.CHANGES IN AND DISAGREEMENTS WITH ACCOUNTANTS ON ACCOUNTING AND FINANCIAL DISCLOSURE

None.
 
ITEM 9A.CONTROLS AND PROCEDURES

(a)
Evaluation of Disclosure Controls and Procedures.

We maintain disclosure controls and procedures that are designed to ensure that information required to be disclosed in reports we file or submit under the Exchange Act is recorded, processed, summarized and reported within the time periods specified in the SEC’s rules and forms, and that such information is accumulated and communicated to our management, including our Chief Executive Officer and Chief Financial Officer, as appropriate, to allow timely decisions regarding required disclosure.

Under the supervision and with the participation of our management, including our Chief Executive Officer and Chief Financial Officer, we conducted an evaluation of our disclosure controls and procedures, as such term is defined under Rule 13a-15(e) and Rule 15d-15(e) promulgated under the Exchange Act, as of the end of the period covered by this Report. This evaluation also included consideration of our internal controls and procedures for the preparation of our financial statements as required under Section 404 of the Sarbanes-Oxley Act of 2002 (the “Sarbanes-Oxley Act”).  Based upon that evaluation, our Chief Executive Officer and Chief Financial Officer concluded that our disclosure controls and procedures were effective as of the end of the period covered by this Report.

(b)
Management’s Report on Internal Control Over Financial Reporting.

Pursuant to Section 404 of the Sarbanes-Oxley Act, as part of this Report we have furnished a report regarding our internal control over financial reporting as of December 31, 2021.  During 2021, we acquired Trumpet Holdings, Inc, (“Trombetta”) and Stabil Operative Group GmbH (“Stabil”), and have excluded from our assessment of the effectiveness of the Company’s internal control over financial reporting as of December 31, 2021, Trombetta’s and Stabil’s internal control over financial reporting associated with 13.8% of total assets and 3.5% of total revenues included in the consolidated financial statements of the Company as of and for year ended December 31, 2021.2023. The report is under the caption “Management’s Report on Internal Control Over Financial Reporting” in “Item 8. Financial Statements and Supplementary Data,” which report in included herein.

(c)
Attestation Report of Independent Registered Public Accounting Firm.

KPMG LLP, our independent registered public accounting firm, has issued an opinion as to the effectiveness of the Company’s internal control over financial reporting as of December 31, 2021.2023. The opinion is under the caption “Report of Independent Registered Public Accounting Firm−Internal Control Over Financial Reporting” in “Item 8. Financial Statements and Supplementary Data” for this attestation report, which is included herein.

(d)
Changes in Internal Control Over Financial Reporting.

During the quarter ended December 31, 20212023 and subsequent to that date, we have not made changes in our internal control over financial reporting that have materially affected, or are reasonably likely to materially affect, our internal control over financial reporting.
 
ITEM 9A.CONTROLS AND PROCEDURES (Continued)

We review, document and test our internal control over financial reporting using the criteria set forth by the Committee of Sponsoring Organizations of the Treadway Commission (“COSO”) in the 2013 Internal Control–Integrated Framework.  We may from time to time make changes aimed at enhancing their effectiveness and to ensure that our systems evolve with our business.  These efforts may lead to various changes in our internal control over financial reporting.

ITEM 9B.
OTHER INFORMATION

None.

ITEM 9C.DISCLOSURE REGARDING FOREIGN JURISDICTIONS THAT PREVENT INSPECTIONS

Not Applicable.

PART III

ITEM 10.DIRECTORS, EXECUTIVE OFFICERS AND CORPORATE GOVERNANCE

The information required by this Item is incorporated herein by reference to the information in our Definitive Proxy Statement to be filed with the SEC in connection with our 20222024 Annual Meeting of Stockholders (the “2022“2024 Proxy Statement”) set forth under the captions “Proposal No. 1 - Election of Directors,”  “Management Information,” and “Corporate Governance.”

The Board of Directors of the Company has adopted a Code of Ethics that applies to all employees, officers and directors of the Company.  The Company’s Code of Ethics is available at ir.smpcorp.com under “Governance Documents.”  The Company intends to satisfy any disclosure requirement under Item 5.05 of Form 8-K regarding an amendment to, or waiver from, a provision of the Company’s Code of Ethics that applies to its principal executive officer, principal financial officer, principal accounting officer or controller, or persons performing similar functions, by disclosing such information on the Company’s website, at the address specified above.

ITEM 11.EXECUTIVE COMPENSATION

The information required by this Item is incorporated herein by reference to the information in our 20222024 Proxy Statement set forth under captions “Corporate Governance,” “Compensation Discussion & Analysis,” “Executive Compensation and Related Information” and “Report of the Compensation and Management Development Committee.”

ITEM 12.SECURITY OWNERSHIP OF CERTAIN BENEFICIAL OWNERS AND MANAGEMENT AND RELATED STOCKHOLDER MATTERS

The information required by this Item is incorporated herein by reference to the information in our 20222024 Proxy Statement set forth under the captions “Executive Compensation and Related Information” and “Security Ownership of Certain Beneficial Owners and Management.”

ITEM 13.CERTAIN RELATIONSHIPS AND RELATED TRANSACTIONS, AND DIRECTOR INDEPENDENCE

The information required by this Item is incorporated herein by reference to the information in our 20222024 Proxy Statement set forth under the captions “Corporate Governance” and “Executive Compensation and Related Information.

ITEM 14.PRINCIPAL ACCOUNTANT FEES AND SERVICES

The Company’s independent registered public accounting firm is KMPG LLP, New York, New York (PCAOB ID 185).  All other information required by this Item is incorporated herein by reference to the information in our 20222024 Proxy Statement set forth under the captions “Audit and Non-Audit Fees.”

PART IV

ITEM 15.EXHIBITS AND FINANCIAL STATEMENT SCHEDULES

(a)
(1)
The Index to Consolidated Financial Statements of the Registrant under Item 8 of this Report is incorporated herein by reference as the list of Financial Statements required as part of this Report.


(2)
The following financial schedule and related report for the years 2021, 20202023, 2022 and 20192021 is submitted herewith:

Schedule II - Valuation and Qualifying Accounts

All other schedules are omitted because they are not required, not applicable or the information is included in the financial statements or notes thereto.


Schedule II - Valuation and Qualifying Accounts
All other schedules are omitted because they are not required, not applicable or the information is included in the financial statements or notes thereto.
(3)
Exhibits.
The exhibit list in the Exhibit Index is incorporated by reference as the list of exhibits required as part of this Report.

The exhibit list in the Exhibit Index is incorporated by reference as the list of exhibits required as part of this Report.

ITEM 16.
FORM 10-K SUMMARY

None.

90
92

STANDARD MOTOR PRODUCTS, INC. AND SUBSIDIARIES
EXHIBIT INDEX

Exhibit
Number
  
3.1
  
3.2
  
3.3
  
10.1
  
10.2
  
10.3
  
10.4
  
10.5
  
10.6
10.7
10.8

91

STANDARD MOTOR PRODUCTS, INC. AND SUBSIDIARIES
EXHIBIT INDEX

Exhibit
Number
  
10.910.7
  
10.1010.8
  
10.1110.9

93

STANDARD MOTOR PRODUCTS, INC. AND SUBSIDIARIES
EXHIBIT INDEX

Exhibit
Number
  
10.1210.10
  
10.1310.11
  
10.1410.12
  
10.13
21
  
23
  
24
  
31.1
  
31.2
  
32.1
  
32.2
97

92
94

STANDARD MOTOR PRODUCTS, INC. AND SUBSIDIARIES
EXHIBIT INDEX

101.INS**
Inline XBRL Instance Document (the instance document does not appear in the Interactive Data File because its XBRL tags are embedded within the Inline XBRL document).
101.SCH**
Inline XBRL Taxonomy Extension Schema Document.
101.CAL**
Inline XBRL Taxonomy Extension Calculation Linkbase Document.
101.LAB**
Inline XBRL Taxonomy Extension Label Linkbase Document.
101.PRE**
Inline XBRL Taxonomy Extension Presentation Linkbase Document.
101.DEF**
Inline XBRL Taxonomy Extension Definition Linkbase Document.
104
Cover Page Interactive Data File (formatted as Inline XBRL and contained in Exhibit 101).

**
**In accordance with Regulation S-T, the XBRL-related information in Exhibit 101 to the Original Filing shall be deemed to be “furnished” and not “filed.”

93
95

Index
SIGNATURES

Pursuant to the requirements of Section 13 or 15(d) of the Securities Exchange Act of 1934, the Registrant has duly caused this Report to be signed on its behalf by the undersigned, thereunto duly authorized.

 STANDARD MOTOR PRODUCTS, INC.
 (Registrant)

 /s/
 /s/ Eric P. Sills
 Eric P. Sills
 Chief Executive Officer and President
  
 /s/ Nathan R. Iles
 Nathan R. Iles
 Chief Financial Officer
  
New York, New York 
February 23, 202222, 2024 

POWER OF ATTORNEY

KNOW ALL PERSONS BY THESE PRESENTS, that each person whose signature appears below constitutes and appoints Eric P. Sills and Nathan R. Iles, jointly and severally, as his attorneys-in-fact, each with the power of substitution, for him in any and all capacities, to sign any amendments to this Annual Report on Form 10-K and to file the same, with all exhibits thereto and other documents in connection therewith, with the Securities and Exchange Commission, hereby ratifying and confirming all that each of said attorneys-in-fact, or his substitute or substitutes, may do or cause to be done by virtue hereof.
 
Pursuant to the requirements of the Securities Exchange Act of 1934, this Report has been signed below by the following persons on behalf of the Registrant and in the capacities and on the dates indicated:

February 23, 202222, 2024/s/  Eric P. Sills
 Eric P. Sills
 Chief Executive Officer and President
 (Principal Executive Officer)
  
February 23, 202222, 2024/s/  Nathan R. Iles
 Nathan R. Iles
 Chief Financial Officer
 (Principal Financial and Accounting Officer)
  
February 23, 202222, 2024/s/  Lawrence I. SillsJames J. Burke
 Lawrence I. Sills,
James J. Burke
Chief Operating Officer and Director
February 22, 2024/s/  Alejandro C. Capparelli
Alejandro C. Capparelli, Director
  
February 23, 2022/s/   John P. Gethin
John P. Gethin, Director
 
February 23, 202222, 2024/s/  Pamela Forbes Lieberman
 
Pamela Forbes Lieberman, Director

94
96

Index
February 23, 202222, 2024/s/  Patrick S. McClymont
 Patrick S. McClymont, Director
  
February 23, 202222, 2024/s/  Joseph W. McDonnell
 Joseph W. McDonnell, Director
  
February 23, 202222, 2024/s/  Alisa C. Norris
 Alisa C. Norris, Director
  
February 23, 202222, 2024/s/  Pamela S. Puryear, Ph.D.
 Pamela S. Puryear, Director
February 23, 2022/s/   William H. Turner
William H. Turner, Director
February 23, 2022/s/   Richard S. Ward
Richard S. Ward, Director

95
97

Index

STANDARD MOTOR PRODUCTS, INC. AND SUBSIDIARIES

Schedule II Valuation and Qualifying Accounts

Years ended December 31, 2021, 20202023, 2022 and 20192021

    Additions           Additions       
                        
Description 
Balance at
beginning
of year
  
Charged to
costs and
expenses
  Other  Deductions  
Balance at
end of year
  
Balance at
beginning
of year
  
Charged to
costs and
expenses
  Other  Deductions  
Balance at
end of year
 
                              
Year ended December 31, 2021:
               
Year ended December 31, 2023:
               
Allowance for expected credit losses $4,406,000  $450,000  $0  $41,000  $4,815,000  $4,129,000  $2,940,000  $  $185,000  $6,884,000 
Allowance for discounts  1,416,000   13,827,000   0   13,888,000   1,355,000   1,246,000   12,449,000      12,534,000   1,161,000 
 $5,822,000  $14,277,000  $0  $13,929,000  $6,170,000  $5,375,000  $15,389,000  $  $12,719,000  $8,045,000 
                                        
Allowance for sales returns $40,982,000  $129,964,000  $0  $128,534,000  $42,412,000  $37,169,000  $162,525,000  $  $161,456,000  $38,238,000 
                                        
                                        
Year ended December 31, 2020:
                    
Year ended December 31, 2022:
                    
Allowance for expected credit losses $4,244,000  $392,000  $0  $230,000  $4,406,000  $4,815,000  $6,242,000 (1) $  $6,928,000  $4,129,000 
Allowance for discounts  968,000   11,488,000   0   11,040,000   1,416,000   1,355,000   13,456,000      13,565,000   1,246,000 
 $5,212,000  $11,880,000  $0  $11,270,000  $5,822,000  $6,170,000  $19,698,000  $  $20,493,000  $5,375,000 
                                        
Allowance for sales returns $35,240,000  $135,448,000  $0  $129,706,000  $40,982,000  $42,412,000  $152,985,000  $  $158,228,000  $37,169,000 


Year ended December 31, 2019:
                    
Year ended December 31, 2021:
                    
Allowance for expected credit losses $4,488,000  $(295,000) $0  $(51,000) $4,244,000  $4,406,000  $450,000 $  $41,000 $4,815,000 
Allowance for discounts  1,199,000   10,660,000   0   10,891,000   968,000   1,416,000   13,827,000      13,888,000   1,355,000 
 $5,687,000  $10,365,000  $0  $10,840,000  $5,212,000  $5,822,000  $14,277,000  $  $13,929,000  $6,170,000 
                                        
Allowance for sales returns $33,417,000  $136,777,000  $0  $134,954,000  $35,240,000  $40,982,000  $129,964,000  $  $128,534,000  $42,412,000 


(1)Includes a $7 million charge relating to one of our customers that filed a petition for bankruptcy in January 2023.


98