| Item 1: | BUSINESS |
GRAHAM ALTERNATIVE INVESTMENT FUND I LLC
General Development of Business
Graham Alternative Investment Fund I LLC (“GAIF I”) is a Delaware Series Limited Liability Company established through an amendment to the certificate of formation, effective March 28, 2013. Prior to March 28, 2013, GAIF I was organized as a Delaware Limited Liability Company which was formed on May 16, 2006. GAIF I was formed to enable U.S. taxable investors to achieve long-term capital appreciation through professionally managed trading in both U.S. and foreign markets, primarily in futures contracts, forward currency and metals contracts, spot currency contracts and associated derivative instruments such as options and swaps. GAIF I commenced operations on August 1, 2006.
The Core Macro Portfolio (formerly known as Blended Strategies Portfolio) uses a systematic trading program and a discretionary trading program. The Core Macro Portfolio units of interest (the “Units”) of GAIF I are registered under the Securities Exchange Act of 1934, as amended, (the “Exchange Act”) and the financial information and statements contained herein are solely with respect to that Portfolio.
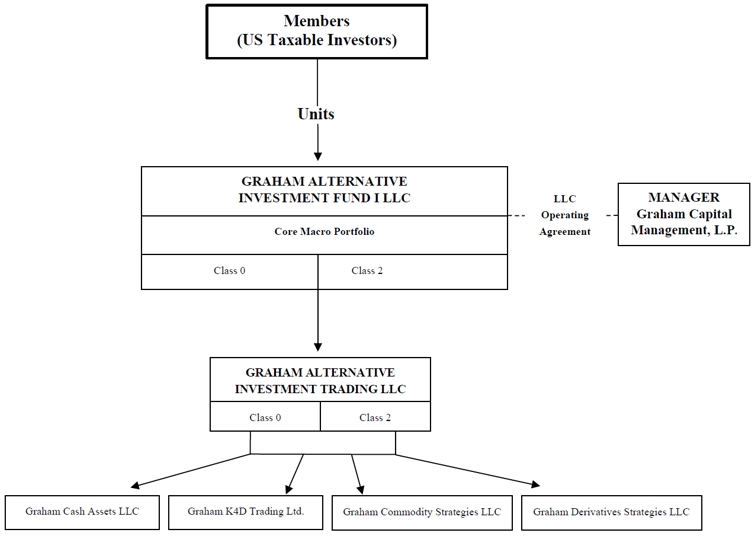
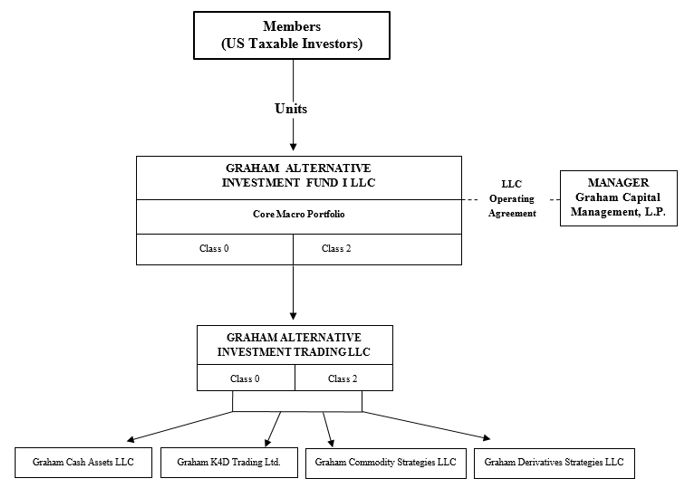
GAIF I invests in Graham Alternative Investment Trading LLC, a Delaware limited liability company (the “Feeder Fund”). Specifically, the assets of GAIF I subscribed for investment in the Core Macro Portfolio will be invested in Graham Alternative Investment Trading LLC. Trading on behalf of the Fund (as defined below) will be conducted in separate master funds (in a “master-feeder” fund structure) managed by the Manager (as defined below). For the purposes of this report, the term “Fund” shall include GAIF I, the Feeder Fund and the master funds in which they invest, unless the context implies otherwise. Graham Capital Management, L.P. (the “Manager”) is the Fund’s manager and the investment advisor to the Fund. The Manager’s website is www.grahamcapital.com.
The investment objective of the portfolio of the Fund is to achieve long-term capital appreciation through professionally managed trading in both U.S. and foreign markets, primarily in futures contracts, forwards contracts, spot currency contracts and associated derivative instruments such as options and swaps. The Fund may also trade futures on virtual currencies. The Fund seeks profit opportunities in the global financial markets, including interest raterates futures, foreign exchange, global stock indices and energy, metals and agricultural futures, as a professionally managed multi-strategy investment vehicle.
The portfolio of the Fund consists of multiple trading strategies of the Manager, which the Manager has combined in an effort to diversify the investment exposure of the portfolio and to make the performance returns of the portfolio less volatile and more consistently profitable. The Manager seeks to combine in one portfolio investment strategies that trade in different markets and display relatively low correlation to each other. Through such composition, the Manager aims to provide the portfolio with the potential to make profits and have strong risk-adjusted returns in both rising and falling markets and during both expanding and recessionary economic cycles. In discretionary programs, a trader determines trades subjectively based on his personal assessment of trading data and trading experience, while in systematic programs, trades are based almost entirely on computerized mathematical models. The Fund, at all times, will look primarily to commodity interests as its principal intended source of gains and anticipates that at all times commodity interests will present the Fund’s primary risk of loss, and the Fund will not acquire any financial instrument or enter into any financial transaction if to do so would cause the Fund to look to securities as its principal intended source of gains or anticipate that securities will present the Fund’s primary risk of loss.
3
The Manager believes strongly in the importance of research and development of new trading programs, and expects to develop additional trading systems and strategies for the Fund and to modify or replace the systems currently in use for the Fund over time. The Manager also seeks to add new trading strategies to its discretionary programs and to modify such strategies over time. There is no maximum number of trading programs that the Manager may see fit to include in the Core Macro Portfolio, and the Manager may increase or decrease the number of programs included in the portfolio over time or increase the number of markets or contracts that are traded on behalf of the portfolio. The Manager continually updates and modifies its trading programs and may make such additions or deletions of trading programs or make any other changes to the Core Macro Portfolio at any time– such as changes in the leverage of, or in the asset allocations to, any of the Fund’s trading programs – in its sole discretion. The Fund is not required to provide prior, or any, notice of any such changes to investors.
Under the Amended and Restated Limited Liability Company Agreement of GAIF I (the “Company Agreement”), the Manager has complete and exclusive responsibility for management and administration of the affairs of GAIF I. The Manager is currently registered as a commodity pool operator (“CPO”) and commodity trading advisor (“CTA”) with the Commodity Futures Trading Commission (“CFTC”), as an investment adviser with the Securities and Exchange Commission (“SEC”) and is a member of the National Futures Association (“NFA”). GAIF I is not required to be, and is not, registered under the Investment Company Act of 1940, as amended. Investors purchasing units of interests (the “Units”) in GAIF I have no rights to participate in the management of the Fund. Units are sold through dealers that are not affiliated with the Fund or the Manager.
Pursuant to the Company Agreement, GAIF I’s term will end upon the first to occur of the following:
December 31, 2050;
the withdrawal (voluntary or involuntary), bankruptcy or an assignment for the benefit of creditors or dissolution of the Manager; or
any date prior to December 31, 2050 on which the Manager elects to dissolve GAIF I.
GAIF I’s business constitutes only one segment for financial reporting purposes (i.e., a speculative commodity pool). GAIF I does not engage in sales of goods or services.
As of February 28, 2022,2023, the aggregate Net Asset Value (as defined below under “Allocation of Profit and Loss”) of the Units in GAIF I was $27,004,626.$29,966,504. GAIF I operates on a calendar fiscal year.
Narrative Description of Business
| (i) | General |
GAIF I offers two classes (each a “Class”) of Units, being Class 0 Units and Class 2 Units of the Core Macro Portfolio. As further described below under “Fees,” Class 0 and Class 2 Units of the portfolio differ only as to their applicable fees. Subscriptions for Units of any Class may be accepted by GAIF I as of the first business day of each month upon written notice of at least three business days prior to the last business day of the preceding month, and on such other notice and dates as the Manager may permit in its sole and absolute discretion.
Units of each Class are offered at their Net Asset Value per Unit as of the end of each month. The minimum initial investment for Class 0 Units is $10,000 (this Class is primarily for “wrap fee programs”) and the minimum additional investment is $5,000. Wrap fee programs bundle the various services provided to a client by a broker or financial advisor in a single fee arrangement rather than charging the client fees for specific transactions. The minimum initial investment for Class 2 Units is $10,000 and the minimum additional investment is $5,000. GAIF I will be continuously offered and has no limit on the maximum aggregate amount of subscriptions that may be contributed to it.
4
Capital contributions by a single subscriber for any Class of Units, upon acceptance of the subscriber as a member, represent a single interest in GAIF I for that subscriber’s respective Class of Units. A Unit of each Class reflects a member’s interest in GAIF I’s member’s capital with respect to the Class of Units owned by the member. Although separate Classes of Units in a portfolio are offered, all capital contributions to a particular portfolio are pooled by GAIF I and invested in GAIT. Units may be purchased only by investors who qualify as accredited investors under Regulation D of the Securities Act of 1933 (“Securities Act”). The principal differences among the separate Classes of Units within the same portfolio are their fees. Holders of Units, regardless of which Class of a portfolio they hold, participate pro rata in the profits and losses of that portfolio in proportion to the Net Asset Value of the Class and have identical rights, as members, under the Company Agreement.
5
| (ii) | The Manager |
The Manager was organized in May 1994 as a Delaware limited partnership. The general partner of the Manager is KGT, Inc., a Delaware corporation of which Kenneth G. Tropin is the sole director and ultimate sole shareholder. KGT, Inc. became a listed Principal of the Manager effective July 27, 1994.1994. The Manager has been registered as a CPO and CTA under the Commodity Exchange Act (“CEA”) and has been a member of the NFA since July 27, 1994 and is alsohas been registered as an investment adviser with the Securities and Exchange CommissionSEC since March 20, 2012.2012. As of March 1, 2023,2024, the Manager has approximately 193204 personnel and manages assets of over $18.8$19 billion. The Manager’s principal office is located at 40 Highland Avenue, Rowayton, Connecticut 06853 and its telephone number is (203) 899-3400. The Manager’s advisory services may in part be performed out of its branch office in West Palm Beach, Florida and the office of the Manager’s London affiliate, Graham Capital LLP.
| (iii) | The Trading Program |
The Manager’s Investment Committee, which is comprised of Kenneth G. Tropin, Pablo Calderini, Brian Douglas, Barry S. Fox, Christopher McCann, Timothy Sperry, Edward Tricker, Kelly Tropin Whitridge, George Schrade, and Jennifer Ancker Whelen, Brad Williams, Jason Slutsky and Thomas Feng makesmake decisions with respect to the selection of strategies traded on behalf of the Fund.
Biographical information regarding the members of the Investment Committee as of December 31, 20222023 is set forth below.
Kenneth G. Tropin, 6970, is the Chairman and the founder of the Manager. In May 1994, he founded the Manager and became an Associated Person and Principal effectiveJuly 27, 1994.1994. Mr. Tropin developed the firm's original trading programs and is responsible for the overall management of the organization, including the investment of its proprietary trading capital.
Pablo Calderini, 58,59, is the President and Chief Investment Officer of the Manager and, is responsible for the management and oversight of the discretionary and quantitative trading businesses at the Manager. He joined the Manager in August 2010 and became an Associated Person and Principal of the Manager effective August 13, 2010. Mr. Calderini received a B.A. in Economics from Universidad Nacional de Rosario in 1987 and a Masters in Economics from Universidad del Cema in 1989, each in Argentina.
Brian Douglas, 4950, C.P.A., is the Chief Executive Officer of the Manager. In July 2004, he joined the Manager as Manager of Financial Reporting. Mr. Douglas became Director of Financial Reporting in April 2008. Mr. Douglas became Chief Financial Officer in April 2013, Chief Operating Officer in March 2019 and Chief Executive Officer in October 2021. Mr. Douglas is responsible for the management and oversight of the finance, administration, investor services, technology, human resources, legal and compliance departments. He became an Associated Person of the Manager effective February 1, 2013 and a Principal on April 1, 2013. Mr. Douglas received a B.A. in accounting from Western Connecticut State University in May 1996.
George Schrade, 4849, C.P.A., is the Chief Financial Officer of the Manager, responsible for overseeing the Manager’s Middle Office, Financial Reporting, Treasury Operations, and Corporate Accounting groups. He became an Associated Person of the Manager effective December 21, 2016 and a Principal on February 28, 2019. In June 2007, he joined the Manager as Senior Analyst in Financial Reporting and has held positions of increasing responsibility prior to becoming Chief Financial Officer in March 2019. Mr. Schrade received a B.S in Accounting from Quinnipiac University in May 1996.
Barry S. Fox, 5960, is Managing Director of Quantitative Operations and Execution of the Manager. He became an Associated Person of the Manager effective November 10, 2000 and a Principal on November 15, 2007. Mr. Fox joined the Manager in August 2000. Mr. Fox received a B.S. in Business Administration from State University of New York at Buffalo in 1986.
Christopher McCann, 52,53, is the Chief Risk Officer of the Manager, responsible for identifying, monitoring and acting upon financial risks relative to financial returns in Manager's diverse trading strategies. He joined the Manager in May 2009 and became an Associated Person of the Manager effective May 29, 2009 and a Principal effective June 24, 2019. He was previously registered as a Principal of the Manager effective September 12, 2012 through February 22, 2016. Mr. McCann received an M.B.A. in Finance from New York University Stern School of Business in May 1998, a M.S. in Industrial Engineering from Rutgers University in May 1995, and a B.S. in Chemical Engineering from Washington University in May 1992.
Tim Sperry, 55,56, is Executive Director and Chief Compliance Officer of the Manager. He joined the Manager in June 2004. As Chief Compliance Officer, he oversees compliance and regulatory matters related to the firm’s business. He became an Associated Person of the Manager effective October 9, 2012 and a Principal on October 10, 2012. Mr. Sperry received a J.D. from New England School of Law in May 1998 and a B.A. in Political Science in 1989 from Boston University.
6
Edward Tricker, 3940, is Chief Investment Officer of Quant Strategies of the Manager. He is currently responsible for the management and oversight of the firm's Quantitative Strategies team, including quantitative operations and execution, research, alpha technology, and data science. He became an Associated Person of the Manager effective February 4, 2013 and a Principal on April 30, 2014. Dr. Tricker joined the Manager in June 2011 as a quantitative research analyst. Dr. Tricker received a Ph.D. in Statistics from Imperial College of Science and Technology in London in October 2009 and a B.S. in Mathematics and Statistics from the University of Oxford in June 2005.
Kelly TropinWhitridge, 32,33, is Chief Economist and Senior Managing Director of the Manager. Mrs. TropinWhitridge is responsible for leading the Manager’s economic research efforts in addition to playing a key role in the management of the firm’s discretionary trading team. Shejoined the Manager in May 2014 and became an Associated Person and Principal of the Manager effective September 6, 2018. Mrs. TropinWhitridge received a Bachelor of Arts in Government from Dartmouth College in June 2013.
Jennifer Ancker Whelen, 4950, is Chief Client Officer, Co-Head of Institutional Relations, and Managing Director of the Manager. She joined the Manager in April 2007 and became an Associated Person of the Manager effective June 6, 2007 and a Principal January 15, 2021. Mrs. Ancker Whelen is responsible for the development of strategic relationships with the Manager’s global client base, including consultants and institutional investors. Mrs. Ancker Whelen graduated cum laude from Colby College in 1995 with a B.A. in Economics and a minor in Sociology.
Thomas Feng, 51,is Chief Investment Officer of Quantitative Strategies of the Manager. He is currently responsible for the management and oversight of the firm’s Quantitative Strategies team, including quantitative operations and execution, research and data science teams. He became an Associated Person of the Manager effective February 7, 2013, and a Principal on April 30, 2014. Dr. Feng joined the Advisor in April 2009 as a portfolio manager/quantitative research analyst. Dr. Feng received a Ph.D. in Mathematics from Princeton University in June 1997 and a B.S. in Mathematics from Yale in May 1993.
Effective August 2023, Edward Tricker resigned from the Manager in connection with his retirement. Jason Slutsky, Bradford Williams and Thomas Feng became members of the Investment Committee effective January 2023, May 2023 and December 2023, respectively.
The discretionary traders for any discretionary investment strategy selected to trade on behalf of the Fund make the trading decisions for that discretionary strategy. The Manager has developed sophisticated proprietary software to study optimal portfolio weighting strategies and the effect of specific markets on the performance, risk, correlation and volatility characteristics of each of its trading strategies. As a result, the weighting or leverage that a trading strategy uses in each market may change to address changes in market conditions or to reflect other trading strategies trading in that market. With such software, the Manager devotes considerable attention to risk management at the portfolio level in an effort to ensure balance between markets and that the overall leverage used by the portfolio is consistent with the Manager’s overall views on risk. The Manager’s objective in forming the investment program of the portfolio is to provide the portfolio with significant potential for capital appreciation in both rising and falling markets and during expanding or recessionary economic cycles. Currently, 50% of the assets of the Core Macro Portfolio are allocated to trading the Manager’s Discretionary Trading Program and 50% of the assets are allocated to trading to a sole systematic program, the Manager’s K4D Program, (formerly referred to as the K4D-15V Program), but the Manager may alter these allocations at any time within its sole discretion.
7
The Fund will trade actively in both U.S. and foreign markets, primarily on major futures exchanges as well as the inter-bank cash currency and swaps markets. The Fund also engages in exchange for physical (EFP) transactions, which involve a privately negotiated and simultaneous exchange of a futures position for a corresponding position in the underlying physical commodity, and the Fund may use options and other derivatives in addition to swaps. The Manager may also trade other financial instruments, such as emerging market currencies, global stock index futures and futures on virtual currencies, as it endeavors to achieve superior results for investors and enhanced portfolio diversification. The Manager may trade without geographic or market restriction, with new and existing discretionary and quantitative strategies routinely expanding or otherwise modifying the types of instruments traded for the Fund. The Manager reserves the right in extraordinary market conditions to reduce leverage and portfolio risk if it feels in its sole discretion that it is in the potential best interest of the Fund. While such actions are anticipated to occur very infrequently, no assurance can be given that the Manager’s actions will enhance performance or that any efforts by the Manager to achieve portfolio diversification will be successful.
The Manager expects to add additional trading strategies and programs to the portfolio and to modify or replace the strategies currently in use for the portfolio over time and may in the future offer other portfolios. There is no maximum number of strategies and programs that the Manager may see fit to include in the Fund or the portfolio, and the Manager may increase or decrease the number of strategies and programs included in the Fund or the portfolio over time or increase the number of markets or contracts that are traded on behalf of the Fund or the portfolio. The Manager may make such additions or deletions of trading programs to the Fund or the portfolio at any time and may make such additions, deletions or any other changes, such as changes in the leverage or volatility targets of, or in the asset allocations to, any of the Fund’s trading strategies and programs, in its sole discretion and without prior notice to members. The Core Macro Portfolio does not currently have an annual leverage or volatility target, and even to the extent such targets are established by the Manager in the future, there can be no assurance that the Core Macro Portfolio's programs (or any trading systems or programs utilized by the Fund) will meet such targets in any given period.
The Manager conducts risk analysis and employs risk management controls at various levels of the Fund, including portfolio risk, strategy risk, market risk and execution risk. The objectives of its risk management approach are to measure a Portfolio’s quantitative and qualitative exposures to the risks identified; formulate appropriate policies and procedures in an effort prudently to manage overall risk; monitor compliance with the Manager’s risk policies and procedures; and report identified and measured risks to the Manager’s Risk Committee and risk management team.
In constructing a Portfolio, the Manager employs various risk management protocols. Using a proprietary asset allocation model and its own qualitative assessments, the Manager’s Investment Committee determines the appropriate strategies for a Portfolio and the weighting of each in the Portfolio. The Manager has developed a trade execution and reporting infrastructure designed to minimize the risk of errors. For example, where appropriate, trades are manually checked for accuracy by the Manager’s middle office staff and are subject to additional cross checking using computerized means. Each discretionary trader’s positions must adhere to established risk management guidelines and position limits, which are regularly monitored by the Manager��sManager’s risk management team.
Effective testing, reporting and review are critical elements of the Manager’s risk management process. Daily stress testing is performed to evaluate a strategy’s risk exposure. Daily reporting of Value-at-Risk (VaR), plus and intraday reporting of net gainsgain or lossesloss for each strategy enables the Manager’s Risk Committee and the Investment Committee to observe each strategy’s adherence to its investment profile as well as market exposure. VaR is a probabilistic measure of the amount of loss, often referred to as the threshold, that a portfolio of investments may experience over a specified time period. Each strategy is formally reviewed by the Investment Committee on a monthly basis.
The Manager’s quantitative trading programs (including the quantitative traders primarily responsible for implementing such programs) typically use proprietary portfolio construction and embedded risk management techniques within the programs themselves to manage exposure across individual markets and sectors. The quantitative risk management process incorporates the outputs of the underlying trading models with a sophisticated risk management process in an effort to enhance returns and maintain diversification and portfolio volatility targets. Notwithstanding the foregoing, certain quantitative traders may be subject to risk policies similar in whole or in part to the risk policies described below with respect to discretionary traders.
With respect to the discretionary traders who trade on behalf of the Fund, the Manager works closely with each discretionary trader to design an appropriate investment profile, including return objective and volatility level, for each individual trading strategy. Through continuous monitoring and an active dialogue with every discretionary trader, the Manager seeks to identify and minimize any deviations from the investment profile. In addition, the Manager has implemented a uniform set of risk guidelines for all discretionary traders designed to reduce a strategy’s downside risk. Each discretionary trader’s positions must adhere to established risk management guidelines and position limits, which are regularly monitored by the Manager’s risk management team.
8
The Manager subjects the trading of all of its discretionary traders to a risk monitoring regime that includes a set of defined drawdown limits and a series of risk measurements. Drawdown limits are used as a risk management tool to enforce risk reduction on a discretionary strategy if the discretionary trader is experiencing losses and has not yet reduced overall risk levels. The Manager generally defines a drawdown as losses experienced over a specified period of time, expressed as a percentage of net assets at the beginning of the period. The Manager imposes daily, monthly, and overall drawdown limits for all discretionary traders. The Manager establishes a daily move limit that requires a prompt report to the risk department, a monthly peak to trough drawdown that likely will leadleads to risk reduction, and a total peak to trough drawdown that likely leads to risk reduction. There is also a drawdown limit where the Manager’s Investment Committee would meet to consider closing a given program. Further, the Manager conducts a daily risk process measuring VaR and reviewing stress tests for the portfolio. The Manager evaluates the validity of VaR as a risk management tool by comparing the number of instances that profit and loss exceeded expected parameters over various time frames. For example, the Manager utilizes a one day 97.5% VaR, which means that in respect of the Portfolio that it is analyzing it expects the Portfolio to experience a loss in excess of VaR on approximately 1 out of every 40 days. In addition, the Manager runs an extensive series of stress tests, including historical scenarios as well as specific foreign exchange, equity and interest rate shocks. In managing strategy risk, the Manager limits the size and structure of positions taken on behalf of the Portfolio to ensure that they comply with various risk parameters, both those defined by the Manager for the underlying trading strategies and those defined by each of the discretionary traders that trade on behalf of the Portfolio.
In addition to the risk monitoring procedures employed by the Manager, each discretionary trader trading on behalf of a discretionary program for the Fund has established his or her own proprietary risk measures and parameters. These generally include measures of first order sensitivities (i.e., the sensitivity of the Portfolio to a change in a parameter of the underlying instruments) to the most relevant risk factors for a given book (for example, the dollar value of a basis point in the case of interest rate products), measurement of stress loss in extreme market events, or the use of explicit stop loss points. When individual limits on any of these are breached, the discretionary trader likely will reduce risk even if within the Manager’s guidelines.
The Fund currently employs a master-feeder structure for its individual trading programs such that the portfolio’s trading program may, but will not necessarily in all cases, be conducted through one or more master funds. Each of the master funds is managed by one or more employees of the Manager. The master funds were organized by the Manager in order to facilitate the management of various funds and accounts managed by the Manager using in whole or in part the same trading program. The Fund, alternatively, may trade its individual trading programs through one or more managed accounts in the Fund’s name.
Discretionary Trading Program
The Manager has been trading discretionary programs since February 1998. Discretionary programs, unlike systematic programs which are based almost entirely on computerized mathematical models, determine trades subjectively on the basis of a trader’s personal assessment of trading data and trading experience. Although the Manager has had over a decade of experience trading various discretionary programs, Discretionary Trading Program (“DTP”) itself commenced trading as of August 2008. DTP seeks to invest in various global macro markets that are highly liquid. DTP consists of several of the Manager’s leading discretionary strategies traded by employees of the Manager that do not trade securities that focus on the global fixed income, stock index, currency, energy, commodity and metals markets, but over time it may participate in any other liquid market that is available as the Manager deems appropriate. The Fund may also trade futures on virtual currencies.
The Manager’s discretionary programs have generally displayed a significant degree of non-correlation with traditional and other alternative investments, including with the Manager’s own quantitative investment programs. In its composition of DTP, the Manager will seek an investment portfolio that continues to offer such non-correlation and that provides diversification to other investments. DTP may take both long and short positions and thus may generate successful performance results in both rising and declining markets. The holding periods of its positions may range, depending on the individual trading strategies, from just a few hours to months, such that DTP may potentially profit in markets that exhibit either short-term moves or long-term trends. As with its systematic investment programs, the Manager may add or delete trading strategies or trading markets in DTP or alter their individual weightings or leverage as it deems appropriate, and no notice will be given to investors of such allocation changes. The Manager may make such allocation changes based on a proprietary allocation model, its assessment of market conditions or the availability of additional discretionary trading strategies, in its discretion.
The descriptions contained herein of DTP should not be understood as in any way limiting its investment activities. In addition, the Fund may engage in investment strategies and programs not described herein that the Manager considers appropriate.
9
Systematic Trading Program
The Manager’s systematic investment programs employ various quantitatively based systems that are designed to participate selectively in potential profit opportunities that can occur in a diverse number of U.S. and international markets. Such systems generally are based on computerized mathematical models and can rely both on technical (i.e., historic price and volume data) and fundamental (i.e., general economic, interest rate and industrial production data) information as the basis for their trading decisions. The systems establish positions in markets where the price action of a particular market signals the computerized systems used by the Manager that a potential move in prices is occurring. The systems are designed to analyze mathematically the recent trading characteristics of each market and to statistically compare such characteristics to the historical trading patterns of the particular market. The systems also employ proprietary risk management and trade filter strategies that seek to benefit from price moves while reducing risk and volatility exposure.
Each systematic investment program of the Manager incorporates trading strategies developed by the Manager’s research department. While the Manager’s systematic investment programs have employed long-term systematic strategies from their inception, the programs may also include trend systems with varying time horizons.
The Manager believes strongly in the importance of research and development of new trading strategies and expects to develop additional trading systems and strategies and to modify or replace the systems currently in use in its systematic programs over time in its ongoing efforts to keep pace with changing market conditions. The decision to add or subtract systems or strategies from any investment program or to change the leverage of, or the asset allocations to, any of the trading strategies of such investment program shall be at the Manager’s sole discretion. The Manager anticipates that the constellation of trading strategies comprising the K4D program will continue to grow and evolve over time. There is no maximum number of strategies that the Manager may include in the K4D investment program.
In connection with its programs’ systematic trading, the Manager may employ discretion in determining the leverage and timing of trades for new accounts and the market weighting and participation. In unusual or emergency market conditions, the Manager may also utilize discretion in establishing positions or liquidating positions or otherwise reducing portfolio risk where the Manager believes, in its sole discretion, that it is in the potential best interest of the Fund to do so. While such actions are anticipated to occur very infrequently, no assurance can be given that the Manager’s discretionary actions in these programs will enhance performance.
The K4D Program features the first system that the Manager developed, which began trading client accounts in 1995. It utilizes multiple computerized trading models and offers broad diversification in both financial and non-financial markets, currently trading in approximately 90-100 global markets. The K4D Program includes trend-following systems as well as carry, fundamental value/reversion strategies as well as strategies that in the aggregate are intended to be diversifying from trend-following, and is intended to generate significant returns over time with an acceptable degree of risk and volatility. The computer models are currently based on price-based data and non-priced based macroeconomic and fundamental information.
The investment objectives and methods summarized above represent the Manager’s current intentions. Depending on conditions in the financial and securities markets and the economy in general, the Manager may pursue other objectives, employ other investment techniques or purchase any type of financial instrument that it considers appropriate and in the best interests of the Fund, whether or not described in this section.
| (iv) | Use of Proceeds |
Northern Trust International Banking Corporation serves as the Fund’s banker for purposes of receiving subscription funds, disbursing redemption payments and processing cash transactions not directly related to the Fund’s portfolio.
Bank of America, N.A. serves as the Fund’s banker for transactions on behalf of the portfolio. A significant portion of the Fund’s assets may be held by Bank of America, N.A. in addition to the futures clearing brokers utilized on behalf of the Fund as well as OTC counterparties. The Fund may also hold excess funds not required for trading in bank accounts at Bank of America, N.A., JPMorgan Chase Bank, N.A. or elsewhere. The Manager, in its discretion, may change the brokerage and custodial arrangements described herein without notice to investors.
10
GAIF I currently has no direct arrangement with any futures commission broker; rather each master fund that trades on behalf of the Fund may have its separate clearing arrangements with one or more futures broker. At present, BofA Securities Inc., Wells Fargo Securities, LLC and Barclays Capital Inc. are the primary futures clearing brokers for the master funds, but neither the Fund nor the master funds are required or under any contractual obligation to continue to employ them as futures clearing brokers (together with additional or replacement clearing brokers the Manager may select from time to time without notice to investors, the “Futures Brokers”). The Manager is authorized to determine the Futures Brokers (or the counterparty, if concerning a foreign currency or swap transaction) to be used for the portfolio transactions for the Fund. The Manager is not affiliated with any futures commission merchant or broker-dealer.
Each Futures Broker will obtain, safe-keep and maintain custody of all of the Fund’s fully paid assets held by it in a customer account identified on the books of the Futures Broker as belonging to the Fund and segregated from the broker’s own proprietary positions. All of the Fund’s assets, funds, securities and other property held by each Futures Broker are held as security or collateral for the Fund’s obligations to the broker. The margin levels required to initiate or maintain open positions are established from time to time by each Futures Broker and applicable regulatory authorities. Each Futures Broker may close out positions, purchase securities, or cancel orders for the Fund’s account at any time it deems necessary for its protection, generally without the consent of or notice to the Fund.
Agreements with Futures Brokers in general provide that the broker will not be liable in connection with the execution, clearing, handling, purchasing, or selling of commodities, or other property, or other action, except for negligence or misconduct on the broker’s part. Such agreements also may provide that the Futures Broker will be indemnified and held harmless by the Fund from and against any loss, claim, or expense (including attorney’s fees) incurred by the broker in connection with it acting or declining to act for the Fund, and that the Fund will fully reimburse the broker for any legal or other expenses (including the cost of any investigation and preparation) which the broker may incur in connection with any claim, action, proceeding, or investigation arising out of or in connection with the agreement or the transactions contemplated thereunder.
In addition to trading in the Interbank market for foreign exchange, the Fund currently trades on all the major U.S. futures exchanges and may also trade on, but is not limited to, the following foreign exchanges:
ASX Trade24
Bolsa de Mercadorias and Futuros
Borsa Italiana (IDEM)
EUREX
EURONEXT/London International Financial Futures and Options Exchange
EURONEXT/Derivatives Paris
EURONEXT/Derivatives Amsterdam
European Options Exchange
Hong Kong Exchanges and Clearing Ltd.
ICE Endex
ICE Futures Canada
ICE Futures Europe
Intercontinental Exchange
JSE Equity Derivatives Market
Korea Futures Exchange
London Metal Exchange Ltd.
Montreal Exchange
OMX Nordic Exchange Stockholm
Osaka Securities Exchange
Singapore Exchange Ltd.
South African Exchange
Tokyo Commodity Exchange
Tokyo Financial Exchange
Tokyo Stock Exchange
Turkish Derivatives Exchange
11
In connection with such trading on foreign exchanges, the Fund’s assets may be deposited by the futures brokers with foreign brokers or banks. Although these foreign brokers or banks are subject to local regulation in their jurisdiction, the protections afforded by foreign regulatory bodies and rules may differ significantly from those afforded by United States regulators and rules.
The Fund earnsexpects to earn interest on cash not required to be posted as margin for its trading. Cash not required by the Fund’s investment programs for trading is currently invested by the Manager in a separate cash management master fund, Graham Cash Assets LLC (“Cash Assets”), managed by the Manager. The Fund pays the Manager no additional fees for managing the Fund’s assets invested in Cash Assets. It is currently anticipated that on average between 70% and 95% of the assets of the portfolio will be invested in Cash Assets. Other affiliates of the Manager and investment funds and accounts managed by the Manager may invest in Cash Assets and each such entity bears its proportional share of the operating expenses of Cash Assets. Cash Assets may pay some third-party fees to unaffiliated custodians or managers in connection with the management of its portfolio, which fees will effectively be borne pro rata by all investment vehicles that invest in Cash Assets. Cash Assets may deposit a portion of its assets in an interest bearing bank account with Bank of America N.A. and JPMorgan Chase Bank, N.A. or other banks or in brokerage accounts, or it may purchase securities (directly or through repurchase or reverse repurchase agreements) which are direct obligations of or obligations guaranteed as to principal or interest by the United States (e.g. U. S. Treasury Bills or Bonds), or other securities issued or guaranteed by corporations in which the United States has a direct or indirect interest (e.g., U.S. government agency securities) which have been designated pursuant to section 3(a)(12) of the Securities Exchange Act of 1934 as exempted securities.
In addition to exchange-traded futures contracts and swaps, the Fund trades spot and forward contracts on foreign currencies and, to a lesser degree, OTC swap and derivatives contracts. The Fund does not currently anticipate trading any other non-CFTC regulated instruments.instruments the Fund anticipates trading. The Manager estimates that 20-60% of the Fund’s trades for the portfolio may be in forward contracts and 0-10% in swap contracts, but depending on market conditions, the percentage of the portfolio’s trades constituted by forward or swap contracts may fall substantially outside that range. Bank of America, N.A. and Barclays currently serve as the Fund’s primary counterparties for foreign currency forward transactions. All of the Fund’s assets, funds, securities, and other property held by Bank of America, N.A. or Barclays as a Fund counterparty, and any other bank or broker-dealer acting as a foreign currency forward counterparty or OTC swap counterparty of the Fund are held as security or collateral for the Fund’s obligations to such entity. The forward and OTC swap markets bear additional risks (e.g., the credit risk of trading with counterparties) not present in exchange-traded futures and swaps trading. Under the Dodd–Frank Wall Street Reform and Consumer Protection Act, the CFTC, sometimes together with the SEC, has enacted regulations to govern these contracts and requires many of them to be cleared through an exchange or clearinghouse.
The Manager determines, in its sole and absolute discretion, the amount of distributions, if any, to be made by the Fund. It is expected that dividends ordinarily will not be paid and that all portfolio earnings will be retained for reinvestment (subject to the redemption privilege).
12
Fees
| (i) | Advisory Fee |
Pursuant to the Company Agreement, each Class of the Core Macro Portfolio of the Fund paid the Manager an advisory fee (the “Advisory Fee”) at an aggregate annual rate equal to 1.50% of the Net Asset Value of such Class. For purposes of calculating the Advisory Fee, the Net Asset Value of each Class equals the total fair market value of the assets of the Fund attributable to that Class less the liabilities of the Fund attributable to that Class. Profits and losses are allocated among the Classes in proportion to their respective Net Asset Values (before accrual of the Sponsor Fee and the Incentive Allocation set forth below). The Advisory Fee is payable monthly in arrears calculated as of the last business day of each month (before giving effect to any redemptions as of the last business day of the month and subscriptions as of the beginning of the next business day, and before deduction or accrual of fees payable to the Manager and the Incentive Allocation). A portion of the Advisory Fee may be paid to third parties as compensation for offering or selling activities in connection with the Fund. If the Manager is terminated as the manager of the Fund as of a date other than the last business day of a month, the Advisory Fee will be prorated through the termination date.
| (ii) | Sponsor Fee |
Each Class 0 and Class 2 of the Fund pays the Manager a sponsor fee (the “Sponsor Fee”) at an annual rate of the Members’ Capital specified in the table below. The Sponsor Fee, in each case payable monthly in arrears, determined in the same manner as the Advisory Fee.
| Class 0 | Class 2 |
| 0.50% | 1.25% |
A significant portion of the Sponsor Fees is paid to third parties as compensation for offering or selling activities in connection with the Fund. The Manager may pay initial service fees as well as on-going service fees to its selling agents. When an initial service fee is paid, the on-going service fee to a selling agent will generally commence the 13th month with respect to which the Fund investor introduced by such selling agent has been invested in the Fund. The service fees paid by the Manager to selling agents range up to 2% of net assets with respect to Class 2 investors.
| (iii) | Incentive Allocation |
Each Class of the Core Macro Portfolio bears a quarterly Incentive Allocation, payable to Graham Capital LLC, an affiliate of the Manager (“Graham LLC”), as of the end of each calendar quarter, equal to 20% of the net profits of the Class for the quarter, subject to a “loss carryforward” provision. The loss carryforward provision generally provides that Graham LLC will not receive an Incentive Allocation in respect of the Class for a calendar quarter to the extent that the Class experiences net loss since the last calendar quarter for which an Incentive Allocation was earned, and such loss has not been recouped through subsequent net profits. The Incentive Allocation is calculated and paid as follows: At the end of each calendar quarter, the Incentive Allocation is deducted from the Net Asset Value of each Class and credited to the Capital Account of Graham LLC in the Feeder Funds, in an amount equal to 20% of New High Net Trading Profits (as defined below) with respect to each class of the Core Macro Portfolio for such period. “New High Net Trading Profits” for any Class for any quarter shall mean the Net Capital Appreciation (which includes unrealized gains and losses and interest income and expense, less all accrued debts, liabilities and obligations of the Class (but before any accrual for the Incentive Allocation) for such period) for the quarter minus the Carryforward Loss (as defined below), if any, as of the beginning of the quarter, for such Class. The “Carryforward Loss” shall be increased as of the end of each calendar quarter by the amount of any Net Capital Depreciation with respect to such Class during the quarter then ended and shall be decreased (but not below zero) as of the end of each calendar quarter by the amount of any Net Capital Appreciation with respect to such Class during the quarter then ended. In addition, the Carryforward Loss for a Class for any calendar quarter shall be proportionately reduced effective as of the date of redemption of any Units of such Class by multiplying (i) the Carryforward Loss for such Class immediately prior to such redemption by (ii) the ratio that the amount of assets redeemed from such Class bears to the Net Assets of such Class immediately prior to such redemption. The Carryforward Loss of a Class must be recouped before any subsequent Incentive Allocation can be made to Graham LLC. The Incentive Allocation is also accrued and allocable on the date of redemption with respect to any Units that are redeemed on any date not the end of a calendar quarter, as if the date of redemption were the end of a calendar quarter and the Incentive Allocation shall only be deducted with respect to such redeemed Units.
A portion of any of the above fees (including the Incentive Allocation) may be paid by the Manager or its affiliates to third parties as compensation for offering or selling activities in connection with the Fund.
Beginning June 2022, each Class of the Fund shall pay or reimburse the Manager for all direct costs associated with its assets allocated to the various trading strategies, whether discretionary or quantitative, as the case may be, utilized on, or developed for, the Fund’s behalf and all other expenses related to the operations and business of the Fund including, but not limited to, all expenses of investment transactions such as brokerage commissions and exchange, clearing or regulatory fees and expenses; interest, commitment fees and other costs related to borrowing; transaction fees, finder’s fees, sourcing fees, investment banking fees, origination fees and other similar fees and expenses; fees and expenses of the Administrator; custodial fees; bank service fees; costs of news, research, data and quotation services, software and equipment, including Bloomberg terminals; third-party investment and trading, risk-management and portfolio management related services, licensing, systems, hardware and software (including the third-party installation, programming or servicing related thereto), including trade surveillance and trade order management, sanctions screening, collateral and margin management and accounting services, licensing, systems, hardware and software; costs of connectivity services; data storage costs; fees and expenses related to the Fund’s currency conversion and hedging activities; other hedging costs; membership, license and similar charges in connection with exchange memberships; income taxes, withholding taxes, transfer taxes and other governmental charges and duties; governmental, registration, license, membership or related fees or expenses payable to any regulatory or self-regulatory organization (including(including costs associated with monitoring for, preparing and filing regulatory reports such as Form 10-K, Form 10-Q, NFA Form PQR and MiFID trade and transaction reports)reports and SEC Forms 13D/G and SHO, the EU Short Selling Regulation and other global shareholder reporting) or in connection with the distribution of the Units in any jurisdiction; costs of compliance with FATCA, CRS or other similar rules; professional fees of tax advisors, accountants and attorneys; costs for D&O, E&O, cybersecurity and other insurance for the Fund and the Manager; the costs of maintaining the Fund’s registered office; the costs of printing and distributing offering materials and Net Asset Value reports and notices to Members or holding meetings of Members; fees and expenses paid to outside counsel, accountants, experts and other third parties in connection with sourcing, investigating, analyzing, evaluating and conducting due diligence and surveillance on, monitoring and conducting background checks in connection with, existing and potential investments (whether or not consummated); costs of negotiating trading counterparty and service provider agreements; legal and third party costs incurred in connection with settling trades; legal fees and costs (including settlement costs) arising in connection with any litigation, arbitration, investigation or other proceeding related to any portfolio investment; legal and compliance expenses (including responding to formal and informal inquiries, indemnification expenses and expenses associated with regulatory filings relating to the Fund and its portfolio investments); legal and tax structuring expenses; costs of any external appraisers; direct expenses or fees for third parties related to monitoring and responding to class action and other claims (including contingency fees); and all other expenses incurred in connection with locating, evaluating, purchasing, selling or holding investments. The Fund’s operating, administrative and trading expenses are estimated, based on recent experience of the Fund and recent experience with respect to the types of costs and expenses that are expected to be borne by the Fund in the future, to amount to approximately 1.12%1.24% of net assets annually for the Core Macro Portfolio, but actual expenses may exceed the estimated amount. These expenses will be calculated and payable monthly in arrears in the same manner as the Advisory Fee.
The Manager provides and pays for its own professional and administrative staff, office space, and other general overhead expenses incidental to its advisory services. For 2022, theThe Manager also providedprovides and paidpays for its expenses related to business equipment and facilities.
Extraordinary expenses of the Fund or any other fees or expenses not described above in the section “Fees,” will also be separately borne by the Fund. All fees and expenses of the Fund (including the Incentive Allocation) will be assessed at the Feeder Fund level.
Each investor should understand that the costs of the Fund’s operating, administrative and trading expenses may vary, and that these costs (including the costs described above) are not limited and may be higher than the above estimated amounts. The Fund makes no representation that in the future these expenses may not increase and may not exceed these estimates.
The Manager determines how certain expenses are allocated among the Fund and other funds and accounts managed by the Manager. The Manager will allocate the above expenses (including the investment and operating expenses of the Master Funds) among the funds and accounts the Manager manages in proportion to their respective net asset values, in proportion to their respective participation in a particular investment, strategy or program, or in any other manner that the Manager determines to be equitable (which may be based on the Manager’s assumptions as to relative usage or resources allocated among the funds and accounts). The Manager has established expense allocation policies in an effort to address such matters and may amend such policies or establish additional expense allocation policies in an effort to address potential conflicts of interest that may arise in the future.
Allocation of Profit and Loss
A separate Capital Account is maintained for each member with respect to each Class of Units held by such member. The initial balance of each Capital Account of each member will equal the net initial contribution to the Fund by such member with respect to the Class to which such Capital Account relates. Each Capital Account of each member is increased by any additional capital contributions by such member with respect to the Class to which such Capital Account relates and decreased by any redemptions of Units of such Class by such member. Net realized and unrealized appreciation or depreciation in the value of assets of the portfolio of the Fund, including investment income and expenses, is allocated at the end of each fiscal period among the Capital Accounts of the members in proportion to the relative values of such Capital Accounts as of the commencement of such fiscal period (in the case of any month end that is not also the end of a calendar year, before any accrual for the Incentive Allocation).
On the last day of each fiscal period, an allocation is made of the net profit or net loss attributable to the investments of the portfolio for such fiscal period. The net profit or net loss for a fiscal period is allocated among all the Classes of the portfolio pro rata in the proportion that the Net Asset Value of each Class as of the date of the commencement of such fiscal period bears to the Net Asset Value of the portfolio as of such date.
The Net Asset Value of each Class means the total value of the Fund’s assets, at fair value, attributable to that Class less the liabilities of the Fund attributable to that Class. The Net Asset Value per Unit of any Class is determined as of the close of business on the last business day of the month (a “Valuation Day”) by dividing the Net Asset Value of that Class by the number of outstanding Units of that Class. Such deductions will include an accrual for the Incentive Allocation and the fees to be paid to the Manager.
The net profit or net loss of each Class for a fiscal period in turn is allocated among all holders of Units of that Class pro rata in the proportion that the Net Asset Value of each member’s holding of Units of that Class as of the date of the commencement of such fiscal period (after adjustment for any contributions to the capital of the Fund which are effective on such date) bears to the aggregate Net Asset Value of that Class as of such date.
The Manager is responsible for determining the value of the Fund’s assets. The Fund has appointed SEI Global Services Inc. as the Fund’s independent administrator (“Administrator”), and in connection with that role SEI is responsible, subject to the ultimate supervision of the Manager, for calculating the Net Asset Value of the Fund and the Net Asset Value per Unit of each Class of Units. In determining the Net Asset Value of the Fund and the Net Asset Value per Unit of each Class of Units, the Administrator will follow the valuation policies and procedures adopted by the Fund as set out below. If and to the extent that the Manager is responsible for or otherwise involved in the pricing of any of the Fund’s portfolio assets, the Administrator may accept, use and rely on such prices in determining the Net Asset Value of the Fund and shall not be liable to the Fund, any investor in the Fund, the Manager or any other person in so doing.
For all purposes, including subscriptions, redemptions and the calculation of the fees paid to the Manager, the Manager shall determine the fair market value of any investment made by the Fund. In general, investments will be valued as follows:
| a. | The value of unrealized gain or loss on open futures contracts shall be recorded as the difference between the contract price on the trade date and the closing price reported as of the Valuation Day on the primary exchange on which such contracts are traded. |
| b. | The value of any option listed or traded on any recognized foreign or U.S. exchange shall be the settlement price published by the principal exchange on which it is traded on the relevant Valuation Day. If the recognized foreign or U.S. exchange does not publish a settlement price, the value of any option listed or traded on any recognized foreign or U.S. securities exchange shall be the last reported sale price on the relevant Valuation Day on the principal exchange on which such option is traded. If no such sale of such option was reported on that date, the market value shall be the average of the last reported bid and asked price. The market value of any over-the-counter option for which representative broker’s quotations are available shall be determined in like manner by reference to the last reported sale price, or, if none is available, to the average of the last reported bid and asked quotation. Premiums for the sale of such options written by the Fund shall be included in the assets of the portfolio, and the market value of such options shall be included as a liability. |
| c. | The value of any U.S. government security shall be the cost of such security plus accrued interest and discount. |
The fair value of any assets not referred to in clauses (a) through (c) above (or the valuation of any assets referred to therein in the event that the Manager shall determine that there is no active market or that another method of valuation is advisable in the circumstances) shall be determined by or pursuant to the direction of the Manager. Prospective investors should be aware that situations involving uncertainties as to the valuation of portfolio positions could have an adverse effect on Net Asset Value if management’s judgments regarding appropriate valuations should prove incorrect. Absent bad faith or manifest error, the Fund’s Net Asset Value determinations are conclusive and binding on all investors. Net Asset Values are expressed in U.S. dollars, and any items denominated in other currencies are translated at prevailing exchange rates as determined by the Administrator in consultation with the Manager.
The Manager may, in its sole and absolute discretion, permit any other method of valuation to be used if it considers that such method of valuation better reflects fair value and is in accordance with good accounting practice.
Reporting
The Fund is required to furnish audited annual reports to its members containing financial statements examined by the Fund’s independent registered public accounting firm. The Fund is also required to provide members with monthly performance updates and monthly unaudited financial statements.
Regulation
The Manager has been registered as a CPO and CTA under the CEA, and as an investment adviser with the SEC and has been a member of the NFA since July 27, 1994. GAIF I is regulated as a commodity pool by the CFTC and NFA.
The CFTC may suspend a CPO’s or CTA’s registration if it finds that its trading practices tend to disrupt orderly market conditions or in certain other situations. In the event that the registration of the Manager was terminated or suspended, the Manager would be unable to continue to manage the business of the Fund. The Fund is expected to be terminated should the Manager’s registration be suspended, termination of GAIF I might result.suspended. In addition to such registration requirements, the CFTC and certain commodity exchanges have established limits on the maximum net long or net short positions that any person may hold or control in particular commodities. Most exchanges also limit the changes in futures contract prices that may occur during a single trading day.
All persons who provide services directly to the Fund (as opposed to those persons who provide services through a third-party service provider) are employed by the Manager. The Fund has no employees of its own.
| Item 1A: | RISK FACTORS |
All investments risk the loss of capital. No guarantee or representation is made that either portfolio of the Fund will achieve its investment objective. An investment in the Fund is speculative and involves certain considerations and risk factors that prospective investors should consider before subscribing. The practices of leverage and derivatives trading and other investment techniques, which the Fund expects to employ, can, in certain circumstances, result in significant losses. Under certain circumstances, an investment in the Fund involves the risk of a substantial loss of such investment. Investors should be able to bear the loss of their entire investment in the Fund, and their investment in the Fund should not be their sole significant investment.
Past performance is not necessarily indicative of future results.
Class 0 of the Fund has been operating since August 1, 2006, and Class 2 since November 1, 2007 with respect to its original portfolio, now the Core Macro Portfolio. Moreover, DTP became a part of the Core Macro Portfolio as of August 2008. There can be no assurance that any portfolio of the Fund will achieve its investment objective.
Risks Related to Trading and Market Conditions
Futures and Options Trading Is Speculative and Volatile. Futures and options prices are highly volatile. Such volatility may lead to substantial risks and returns, generally much larger than in the case of equity or fixed-income investments. Price movements for futures are influenced by, among other things: changing supply and demand relationships; weather; agricultural, trade, fiscal, monetary, and exchange control programs and policies of governments; macro political and economic events and policies; changes in national and international interest rates and rates of inflation; currency devaluations and revaluations; and emotions of other marketplace participants. None of these factors can be controlled by the Fund and no assurance can be given that the Manager’s advice will result in profitable trades for a participating customer or that a customer will not incur substantial losses. The purchaser of an option is subject to the risk of losing the entire purchase price of the option, while the writer of an option is subject to an unlimited risk of loss, namely the risk of loss resulting from the difference between the premium received for the option and the price of the futures contract or other asset underlying the option which the writer must purchase or deliver upon exercise of the option.
The Fund may purchase call and put options in respect of specific futures contracts, and may write and sell covered or uncovered call and put option contracts. A call option gives the purchaser of the option the right to buy, and obligates the writer to sell, the underlying contract at a stated exercise price at any time prior to the expiration of the option. Similarly, a put option gives the purchaser of the option the right to sell, and obligates the writer to buy, the underlying contract at a stated exercise price at any time prior to the expiration of the option. A covered call option sold by the Fund, which is a call option with respect to which the Fund owns the underlying contract, exposes the Fund during the term of the option to possible loss of opportunity to realize appreciation in the market price of the underlying contract or to possible continued holding of a contract which might otherwise have been sold to protect against depreciation in the market price of the contract. A covered put option sold by the Fund, which is a put option with respect to which the Fund has sold short an equivalent number of the underlying contract or owns an offsetting put option, exposes the Fund during the term of the option to possible loss of opportunity to realize profit due to a decline in price of the underlying contract.
The Fund may engage in “uncovered” option transactions, where the writer of a call option does not own an equivalent number of the underlying contracts or, in the case of a put option, the writer has not segregated cash to fulfill the obligation, has not sold short an equivalent number of contracts and does not own a put option covering an equivalent number of contracts with an exercise price equal to or greater than the exercise price of the put written. Regarding uncovered options, the purchaser of an option is subject to the risk of losing the entire purchase price of the uncovered option, while the writer of an uncovered option is subject to an unlimited risk of loss, namely the risk of loss resulting from the difference between the premium received for the option and the price of the futures contract or other asset underlying the option which the writer must purchase and deliver upon exercise of the option.
Thus, an investment in the Fund is suitable only for those investors with speculative capital who understand the risks of futures and options markets.
18
The Fund’s Trading Is Highly Leveraged, Which May Result in Substantial Losses for the Fund. The Fund trades futures, currencies, swaps, options, and other instruments on a leveraged basis due to the low margin deposits normally required for trading. As a result, a relatively small price movement in a contract may result in immediate and substantial gains or losses for the Fund. For example, $3,000 in margin may be required to hold a U.S. Treasury futures contract with a face value of $100,000. If the value of the contract were to decline by 3%, the entire margin deposit would be lost. There is no cap on the amount of leverage that the Fund may employ.
Market Illiquidity May Cause Less Favorable Trade Prices. Futures trading at times may be illiquid. Most United States commodity exchanges limit price fluctuations in certain commodity interest prices during a single day by means of “daily price fluctuation limits” or “daily limits.” The daily limit, which is set by most exchanges for all but a portion of the expiration month, imposes a floor and a ceiling on the prices at which a trade may be executed, as measured from the last trading day’s close. While these limits were put in place to lessen margin exposure, they may have certain negative consequences for the Fund’s trading. For example, once the price of a particular contract has increased or decreased by an amount equal to the daily limit, thereby producing a “limit-up” or “limit-down” market, positions in the contract can neither be taken nor liquidated unless traders are willing to effect trades at or within the limit. Contract prices in various commodities have occasionally moved the daily limit for several consecutive days with little or no trading. Similar occurrences could prevent the Fund from promptly liquidating unfavorable positions, subjecting the Fund to substantial losses, or prevent it from entering into desired trades. Other investment positions held by the Fund may be or become illiquid. The Fund may invest in instruments traded on non-U.S. exchanges. The Fund may not be readily able to dispose of illiquid investments, and in some cases may be contractually prohibited from disposing of an investment for a specified period of time. An exchange or regulatory authority may suspend trading in a particular instrument, order immediate liquidation and settlement of a particular contract, or order that trading in a particular contract be conducted for liquidation only.
Exchange for Physicals (“EFPs”). The Fund may engage in transactions in physical commodities, including exchange for physical transactions. An exchange for physical (“EFP”) is a transaction permitted under the rules of many futures exchanges in which two parties holding futures positions may close out their positions without making an open, competitive trade on the exchange. Generally, the holder of a short futures position buys the physical commodity, while the holder of a long futures position sells the physical commodity. The prices at which such transactions are executed are negotiated between the parties.
The Fund May Invest in Swaps and Swaptions. Whether the Fund’s use of swap agreements or swaptions will be successful will depend on the Manager’s ability to select appropriate transactions for the Fund. Swap agreements and options on swap agreements (“swaptions”) can be individually negotiated and structured to include exposure to a variety of different types of investments, asset classes or market factors. Depending on their structure, swap agreements may increase or decrease the holder’s exposure to, for example, long-term or short-term interest rates, foreign currency values, credit spreads or other factors. Swap agreements can take many different forms and are known by a variety of names. Though the Fund’s investment portfolio is generally expected to be liquid, certain swap transactions may be highly illiquid and may increase or decrease the volatility of the Fund’s investment portfolio. Moreover, the Fund bears the risk of loss of the amount expected to be received under a swap agreement in the event of the default or insolvency of its counterparty. The Fund will also bear the risk of loss related to swap agreements, for example, for breaches of such agreements or the failure of the Fund to post or maintain required collateral. It is possible that developments in the swap markets, including potential government regulation, could adversely affect the Fund’s ability to terminate swap transactions or to realize amounts to be received under such transactions.
Virtual Currency Futures. The Fund may trade futures on virtual currencies. There are relatively few futures currently available with respect to virtual currencies. Futures with respect to virtual currencies typically have higher collateral and margin deposit requirements than apply to futures with respect to other asset classes, thereby limiting the ability of the Fund to leverage such investments. As margin deposit requirements are set as a percentage of the value of a particular contract, the inherent price volatility of the underlying virtual currency may result in substantial increases in margin requirements for long or short positions of related futures if the price of the underlying virtual currency rises or falls. If FCMs and exchanges lower such margin or collateral requirements in the future, this would increase the inherent leverage of such products, thus increasing the risk of such positions.
In light of the comparatively small number of market participants and trading volume compared to traditional markets and the volatile demand for the underlying virtual currencies, it may be more difficult to liquidate virtual currency futures at desired prices. In addition, FCMs and virtual currency exchanges may, in the future, impose position limits, prohibit naked shorting, or prohibit give-in transactions, among other restrictions on customer activity. Such restrictions may restrict the Fund 's ability to exit a position during a period of high volatility. Whether due to government action, virtual currency network failure or compromise, market disruptions or exchange or FCM imposed limits, the Fund’s inability to liquidate a position at the desired price or in general may result in substantial losses for the Fund.
Virtual currencies are not issued or controlled by any central governmental or non-governmental authority. The value of virtual currencies will depend on market demand by investors and market participants. As a result, the market prices for virtual currencies can be very volatile. In addition, tax, commodity and securities laws and regulations applicable to virtual currencies are still developing. In the future, CFTC and SEC rulemaking and other regulatory developments may impact the manner in which virtual currencies and related derivatives may be held or traded. One or more countries, including the United States, may take regulatory actions in the future that could severely restrict the right to acquire, own, hold, sell or use virtual currencies or to exchange virtual currencies for other currencies. Any such regulation could have a significant impact on the value of virtual currencies.
In Times of Market Stress, the Fund May Not Be Able to Diversify Its Portfolio and Risk Management Systems May Not be Effective. Where the markets are subject to exceptional stress, trading strategies and programs may become less diversified and more highly correlated as the stress may cause diverse and otherwise unrelated markets all to act in a similar manner. Efforts by the Manager to diversify the Fund’s trading strategies and investment exposure may not succeed in protecting the Fund from significant losses in the event of severe market disruptions. Furthermore, certain risk measures used by the Advisor as part of its risk management systems and procedures, including VaR, are dependent on inputs derived from historical scenarios and data. Such inputs based on historical scenarios and data may not be reliable during periods of unusual or distressed market conditions where the market ceases to function in a typical manner. As a result, the Advisor’s risk management systems and procedures may not operate as anticipated or be effective to prevent losses, in unusual or distressed market conditions. A significant risk of any risk management system using stop loss limits is “gap risk,” which is the risk that liquidity suddenly becomes unavailable and/or markets simply move too quickly through the desired stop level, resulting in greater than expected losses. The inability of a Portfolio or other investors to sell certain types of investments could also lead to a potential inability of the Portfolio and other investors to meet margin calls or fund withdrawals, the impact of which can be further aggravated as dealers and counterparties reduce available credit lines and investors withdraw additional capital. The COVID-19 outbreak initially placed tremendous stress on global markets, leading to a breakdown in typical asset class correlations, decreasing liquidity in the cash markets, and increasing volatility across all markets, although those effects have become muted in response to global vaccination measures to combat the outbreak and fiscal relief measures to support businesses and households.
The Fund Has Credit and Market Risks With Respect to Its Cash Management. The Fund currently invests all assets not required for trading in Cash Assets, which in turn presently holds deposits in bank accounts or invests broadly in U.S. government or agency securities. With respect to its cash deposited in bank accounts, although the bank accounts themselves may be insured by the United States Federal Deposit Insurance Corporation, the balances in such accounts will be largely uninsured, as the maximum amount of insurance available to such accounts will not be material relative to the balances that are expected to be maintained in the accounts. With respect to its investment in U.S. government or agency securities, Cash Assets currently intends to hold them until they mature and values them at amortized cost which approximates fair value. Some of these securities may not mature for a year or longer. If Cash Assets were forced to sell some of its securities in the open market before they mature to meet unanticipated redemption requests (whether from the Fund or other entities affiliated with the Manager), the market value of the securities at such time may be below their amortized cost, causing a loss for Fund investors. In addition, if interest rates rise, the interest rate that Cash Assets pays its investors (including the Fund) will not fully reflect the new rates because its pre-existing investments are still yielding interest at lower rates.
The Fund May Also Borrow Money to Support its Trading, Which Could Increase the Level of Volatility in its Performance and Expose the Fund to Greater Losses. In addition to the leverage implicit in trading futures, the Fund may borrow money from brokers or their affiliates and other lenders. A significant portion of the funds borrowed by the Fund may be obtained from brokerage entities in the form of margin loans collateralized by assets held in the Fund’s brokerage account with such brokerage firms. The Fund does not have any limits on borrowing or leverage.
The Fund May Be Terminated at Any Time. Unforeseen circumstances, including substantial losses, the retirement or loss of key personnel of the Manager, the withdrawal of the Manager or the decision of the Manager not to continue to manage the Fund, could cause the Fund to terminate prior to its stated termination date of December 31, 2050. Early termination of the Fund could disrupt an investor’s overall investment portfolio plan resulting in the loss of some or all of its investment.
There is no Secondary Market for the Units, Therefore Investors Should Consider Their Investment in the Fund to be Illiquid. It is not anticipated that an active secondary market will develop in the Units. The Units will not be transferable without the consent of the Manager (which may be granted or withheld in its discretion and on such terms as it determines). Units are not being registered so as to permit a public offering under the securities laws of any jurisdiction. Moreover, there are limitations on the ability of an investor to require the Fund to redeem Units. Consequently, the Units will be illiquid investments.
The Fund Does Not Anticipate Paying Dividends or Making Distributions, Therefore an Investment in the Fund is Not Appropriate for Investors Seeking Current Income. Since the Fund does not presently intend to pay dividends or other distributions, an investment in the Fund may not be suitable for investors seeking current returns for financial or tax planning purposes.
Regulatory and Related Risks
The Fund Is Subject to Speculative Position Limits, Which May Limit the Fund’s Ability to Generate Profits or Result in Losses. The CFTC and various exchanges impose speculative position limits on the number of futures positions a person or group may hold or control in particular futures. Most physical delivery and many financial futures and option contracts are subject to speculative position limits. The CFTC has established position limits with respect to 25 commodity futures and options contracts (including contracts for corn, oats, wheat, soybeans, soybean oil, soybean meal, and cotton) as well as economically equivalent swaps and may in the future impose limits on additional contracts.contracts. In other markets, the relevant exchanges are required to determine whether and to what extent limits should apply. For purposes of complying with speculative position limits, the Fund’s outright futures positions will be required to be aggregated with any futures positions owned or controlled by the Manager or any principal of the Manager, including all of the other client accounts managed by the Manager. Similar types of limits apply to trading on EU commodity exchanges as a result of EU regulations that came into effect in 2018, albeit in a manner somewhat different to the manner in which limits apply on US commodity exchanges. As a result, the Fund may be unable to take positions in particular futures or may be forced to liquidate positions in particular futures, which could limit the ability of the Fund to earn profits or cause it to experience losses.
Trading on Non-U.S. Exchanges Presents Greater Risks to the Fund than Trading on U.S. Exchanges. Unlike trading on U.S. commodity exchanges, trading on non-U.S. commodity exchanges is not regulated by the CFTC and may be subject to greater risks than trading on U.S. exchanges. For example, some non-U.S. exchanges are “principals’ markets” in which no common clearing facility exists, and a trader may look only to the broker for performance of the contract. In addition, unless the Fund hedges against fluctuations in the exchange rate between the U.S. dollar (in which Units are denominated) and other currencies in which trading is done on non-U.S. exchanges, any profits that the Fund might realize in trading could be reduced or eliminated by adverse changes in the exchange rate, or the Fund could incur losses as a result of those changes. Additional costs could also be incurred in connection with international investment activities. Foreign brokerage commissions generally are higher than in the United States. Expenses also may be incurred on currency exchanges when the Fund changes investments from one currency to another. Increased custodian costs as well as administrative difficulties (such as the applicability of foreign laws to foreign custodians in various circumstances, including bankruptcy, ability to recover lost assets, expropriation, nationalization and record access) may be associated with the maintenance of assets in foreign jurisdictions.
The Unregulated Nature of the Over-The-Counter Markets Creates Counterparty Risks that Do Not Exist in Futures Trading on Exchanges. Forward markets, including foreign currency markets, offer less protection against defaults in trading than is available when trading occurs on an exchange. Forward contracts are not guaranteed by an exchange or clearing house, and, therefore, a non-settlement or default on the contract would deprive the Fund of unrealized profits or force the Fund to cover its commitment to purchase and resale, if any, at the current market price.
Additional risks of the forward markets include: (i) there are generally no limitations on daily price moves in forward transactions; (ii) speculative position limits are not applicable to forward transactions although the counterparties with which the Fund may deal may limit the size or duration of positions available as a consequence of credit considerations; (iii) participants in the forward markets are not required to make continuous markets in forward contracts; and (iv) the forward markets are “principals’ markets” in which performance with respect to a forward contract is the responsibility only of the counterparty with which the trader has entered into a contract (or its guarantor, if any), and not of any exchange or clearing house. As a result, the Fund will be subject to the risk of inability or refusal to perform with respect to such contracts on the part of the counterparties with which the Fund trades. For example, because the Fund trades foreign exchange contracts with Bank of America, N.A., it is at risk with respect to the creditworthiness and trading practices of Bank of America, N.A. as the counterparty to its contracts.
The Fund Has Credit Risk with Respect to its Futures Brokers. The CEA requires a U.S. broker to segregate all funds received from such broker’s customers in respect of regulated futures transactions from such broker’s proprietary funds. If the broker were not to do so to the full extent required by law, the assets of the Fund might not be fully protected in the event of the bankruptcy of the broker. In the event of the broker’s bankruptcy, the Fund would be limited to recovering only a pro rata share of all available funds segregated on behalf of the broker’s combined customer accounts, even though certain property specifically traceable to the Fund (for example, U.S. Treasury bills deposited by the Fund) was held by the broker. In addition, in the event of bankruptcy or insolvency of an exchange or an affiliated clearing house, the Fund might experience a loss of funds deposited through its broker as margin with an exchange or affiliated clearing house, the loss of unrealized profits on its open positions, and the loss of funds owed to it as realized profits on closed positions. If the Fund retains brokers that are not subject to U.S. regulation, its funds deposited with those brokers might not be segregated.
Central Clearing. In order to mitigate counterparty risk and systemic risk, in general, U.S. and international regulatory initiativesrules require certain derivatives to be cleared through a clearinghouse. In the United States, clearing requirements were part of the U.S. Dodd-Frank Wall Street Reform and Consumer Protection Act (the “Dodd-Frank Act”). The CFTC imposed its first clearing mandate on December 13, 2012, affecting certain interest rate and credit default swaps. It is expected that the CFTC, the SEC and other international regulators will continue to implement clearing requirements for other derivatives in the future. Trades submitted for clearing are subject to minimum initial and variation margin requirements set by the relevant clearinghouse, the futures commission merchant (“FCM”), as well as possible SEC or CFTC mandated margin requirements. Clearing through FCMs has in certain cases led to losses caused by operational failure or fraud. As products become more standardized in order to be cleared, standardized derivatives may mean that the Fund may not be able to hedge its risks or express an investment view as well as it would using customizable derivatives available in the OTC markets. Compared to the OTC derivatives market, the Fund may be subject to more onerous and more frequent (daily or even intraday) margin calls from both the clearinghouse and the FCM. In addition, clearinghouse margin is dynamic and may be increased in times of market stress. Although standardized clearing for derivatives is intended to reduce risk (for instance, it may reduce the counterparty risk to the dealers to which the Fund would be exposed under OTC derivatives), it does not eliminate risk. Rather, standardized clearing transfers risk of default from the OTC derivatives dealer to the central clearinghouse, which may increase systemic risk, potentially more so than a failure by an OTC derivatives counterparty. The failure of a clearinghouse, although less likely than the failure of a counterparty, could have a much more significant impact on the financial system. Because these clearinghouses are still developing and the related bankruptcy process is untested, it is difficult to speculate what the actual risks would be to the Fund related to the default of a clearinghouse. Also, a clearinghouse will likely require that the Fund relinquish control of its transactions if the clearinghouse were to become insolvent, and, therefore, the Fund would not be able to terminate and close out of a defaulting clearinghouse’s positions but would become subject to regulators’ control over those positions. In such a circumstance, the Fund may not be able to take actions that it deems appropriate to lessen the impact of such clearinghouse’s default. Applicable regulations may also require the Fund to make public information regarding its swaps volume, position size and/or trades, which could detrimentally impact the Fund’s ability to achieve its investment objectives.
Taxes Will Be Imposed on You Regardless of Cash Distributions. U.S. taxable investors in the Fund must recognize for federal income tax purposes their pro rata share of the taxable net income of the Fund, regardless of whether such investors requested a partial redemption from the Fund to cover their U.S. federal income tax liabilities. An investment in the Fund may generate taxable income for a member even though the value of the member’s interest in the Fund has declined. A member may have to use personal funds to pay the income tax owed on the income or gain allocated to the member. Sufficient information may not be available in time for the member to determine accurately an amount to redeem to pay U.S. federal income taxes for a given fiscal year.
Changes in Tax Laws Governing Individual Retirement Accounts (“IRAs”) Could Result in Adverse Tax Consequences to IRA Owners and Beneficiaries. A change in the current tax laws under the Internal Revenue Code of 1986, as amended (the “Code”) or other applicable tax rules governing IRAs and their investments (including, without limitation, the Code provisions governing the maximum contributions that may be made to IRAs, the types of investments that IRAs may hold, the maximum amount that may be invested in IRAs, and/or the annual minimum required distributions that IRAs must make) could result in adverse tax consequences to IRAs (and their owners and beneficiaries) that invest in the Fund. Such changes could include, for example, a prohibition on IRAs holding investments such as an interest in the Fund and/or a limitation on the aggregate investments that an IRA may hold, which may cause an IRA to lose its tax-exempt status if it is unable to divest from the necessary investments to satisfy any such rules (and/or be exposed to penalty taxes for failure to comply with such rules). By investing in the Fund, an IRA will be deemed to represent and warrant that it expressly understands that its interest in the Fund is generally non-transferable and may not be transferred, exchanged, or otherwise disposed of except as permitted under and in accordance with the applicable LLC Agreement and this Private Offering Memorandum, and that there can be no assurance that the IRA will be able to timely liquidate or dispose of its interest in the Fund in the event of any such change in law in order to avoid any such adverse tax consequences (and that none of the Fund, the Manager or any of their affiliates is under any obligation, whether express or implied, to assist or otherwise accommodate such liquidation or transfer or mitigate such adverse tax consequences to such IRA or its owners or beneficiaries).
Investors Do Not Have the Protections Provided to a Regulated Mutual Fund. Although the Fund may be considered similar to an investment company, it is not required to, and does not intend to, register as such under the Investment Company Act of 1940, as amended (the “Investment Company Act”). Accordingly, certain provisions of the Investment Company Act (which, among other things, require investment companies to have a certain number of disinterested directors and regulate the relationship between the adviser and the investment company) will not be applicable.
Interests in the Fund have not been and will not be registered under the Securities Act, in reliance upon an exemption available under Regulation D under the Securities Act. Accordingly, interests in the Fund will be offered only to investors that, among other requirements, are accredited investors within the meaning of Regulation D.
23
Quantitative Trading System Flaws are not Trade Errors. The Manager’s quantitative trading systems utilize sophisticated quantitative methods for signal generation and trade execution. These systems rely heavily on price-based and fundamental data sourced from third parties. Inaccuracies in the data received, the design and implementation of the systems, and in the sourcing, processing and incorporation of the data into these systems can result in flaws in signal generation and faulty order execution potentially resulting in losses to client accounts. Systems are developed with the aid of historical data, which reflects how markets behaved in the past under different circumstances. These trading systems cannot predict or detect fundamental changes in market behavior and might not perform as designed or intended during periods of unexpected market behavior. Developing quantitative trading programs requires highly skilled personnel applying advanced quantitative methods to vast data sets. Notwithstanding the Manager’s approach to hiring highly qualified quantitative research personnel, commitment to well-defined research and development protocols and extensive testing and ongoing monitoring of its trading systems, the complex nature of quantitative trading programs creates the risk that flaws will arise in these systems. Such flaws may be difficult to detect and therefore may impact these systems for extended periods of time. All of these risks are intrinsic to the operation of quantitative trading strategies, and investors in the Fund must assume that the foregoing elements constitute an inherent risk of the Fund’s investment. As such, any losses attributable to these issues will not be deemed to be trade errors and will be borne by the Fund.
Regulation in the Derivatives Industry. The Dodd-Frank Act has had a significant impact on the derivatives industry. The Dodd-Frank Act divides the regulatory responsibility for derivatives in the United States between the SEC and the CFTC, a distinction that does not exist in any other jurisdiction. The CFTC has regulatory authority over “swaps” and the SEC has regulatory authority over “security-based swaps”. As a result of this bifurcation and the different pace at which the agencies have promulgated necessary regulations, different transactions are subject to different levels of regulation in the United States. In addition, there has been and will be extensive rulemaking related to derivative products by non-U.S. regulatory authorities. Differences between regulatory regimes may make it more difficult or costly for dealers, prime brokers, FCMs, custodians, exchanges, clearinghouses and other entities, such as the Fund, to comply with and follow various regulatory regimes. There are significant legal, operational, technological and trading implications that result from the Dodd-Frank Act and related rules and regulations that may make it difficult or impossible for the Fund to enter into otherwise beneficial transactions. As an example, both U.S. and non-U.S. regulators have mandated margin requirements with respect to uncleared derivatives under certain circumstances (such requirements together, the “Uncleared Margin Rules” or “UMR”). The Manager currently expects that at least a portion of the Fund’s trading will be subject to UMR, which may have negative trading implications for the Fund, including without limitation, increased trading costs and expenses and margin requirements.
Impact of Future Financial Industry Regulation is Uncertain and May Impact the Operation of the Portfolios. Legal, tax and regulatory developments could occur. Securities, futures and other financial markets are subject to comprehensive statutes, regulations and margin requirements enforced by the SEC, the CFTC and other U.S. and non-U.S. regulators and self-regulatory organizations and exchanges authorized to take extraordinary actions in the event of market emergencies. The regulation of derivatives transactions and funds that engage in such transactions is an evolving area of law and is subject to modification by government and judicial actions. The regulatory environment for private funds is evolving, and changes in the regulation of hedge funds and their trading activities may adversely affect the ability of investors (such as the Fund) to pursue certain investment strategies, the ability to obtain leverage and financing, and the value of certain investments. There can be no assurance that any such additional scrutiny or regulation will not have an adverse impact on the Fund’s activities. In addition, U.S. and non-U.S. regulators may take additional actions in light of other recent and future developments in global financial markets, such as the banking crisis.markets. In 2008, for example, the SEC and various non-U.S. regulatory bodies imposed temporary bans on short-selling of a variety of stocks, and adopted other regulations that may have the effect of making short-selling more difficult or costly. Additional legislation and regulations in global markets may further regulate or limit short-selling activities or other activities. These changes may adversely affect the markets in which the Fund invests and may limit or adversely affect the ability of the Manager to use short sales, swaps and other derivatives as part of the investment and hedging strategies used by the Manager. The Fund is generally subject to CFTC and NFA rules, and, to a lesser extent, SEC rules. However, the Fund is not expected to be subject to a number of recently-adopted SEC rules that are intended to benefit and protect investors in private funds.
Effect of Recent Developments Affecting Banks. Recent developments affecting banks in the United States and elsewhere have resulted in the appointment of the Federal Deposit Insurance Corporation as receiver for several banks, the sale of the assets of several banks, significant declines in the stock prices of some banks, and the need of some banks to obtain access to additional funding. These events have led to uncertainty in financial and lending markets as to the stability of the banking sector, both in the United States and internationally. It is possible that systemic risk in the banking sector could lead to more widespread disruption of the banking and broader financial sectors, that other sectors and industries will be affected, or that the ability of the Manager to obtain credit on behalf of the Fund for trading purposes could be limited, any of which could have an adverse effect on the Fund.
24
Risks of Using Trading Models. The success of certain systematic trading models developed by the Manager will depend on their ability to accurately predict future market prices, and upon the continuation of past correlations among the market prices of specific futures, forwards, securities and other financial instruments, the markets generally, and the factors used in the models. To the extent that such models, or the assumptions underlying them, are not correct, the Fund may sustain losses. Even if the same correlations continue to exist in the future, they may not exist over the period of any particular investment in the Fund.
The development and ongoing maintenance of trading models is complex and involves financial, economic, econometric and statistical theories, research and modeling, which are then translated into computer code. Although the Manager devotes significant resources to testing, evaluating, monitoring and improving its trading models on a continuous basis, there is always the risk that trading models may be subject to coding or other errors, and there is no assurance that the software code used by the Manager’s trading models will successfully or optimally translate the Manager’s theories and analyses into successful trading results. The Manager relies on trading, communication, programming and other systems and equipment (including web services, cloud storage, cloud computing platforms and cloud architecture) that may be subject to failures, interruptions, loss of functionality, degradation, compromises in security, loss of power or other events or circumstances. Many of the strategies used by the Manager also depend on the receipt of timely and accurate market and other data from third party vendors. Any failure to receive such data in a timely manner, or the receipt of inaccurate data for any reason, could disrupt and adversely affect trading until such failure or inaccuracy is corrected.
Reliance on Data Provided by Third Parties. Many of the trading strategies and models used by the Manager rely on the receipt of timely and accurate market and other data from third party vendors. Any failure to receive such data in a timely manner, or the receipt of inaccurate data for any reason, could disrupt and adversely affect the trading activities of the Fund until such failure or inaccuracy is corrected. Data received by the Manager includes general economic and market data, and may also include alternative data collected from a wide range of sources such as financial transactions, payment records, internet usage, data gathered from applications and devices (such as smartphones) that generate location and mobility data, data gathered by satellites, and government and other public records and databases. The analysis and interpretation of data can involve a high degree of uncertainty. No assurance can be given that the Manager will be successful in utilizing any data in its investment process. Any data, especially alternative data, involves an inherent risk that the Manager may rely on data outputs that reflect faulty system logic or that are based on inaccurate or incomplete data inputs. There has been increased scrutiny from regulators regarding the use of alternative data for investment purposes, and the Manager cannot predict what, if any, regulatory or other actions may be asserted with regard to the use of alternative data. Although the Manager generally conducts due diligence reviews of data providers and requires that they make certain representations about the sources of the data that they provide, such actions may not be effective to protect against the effect of misrepresentations or violations of law by such data providers.
Developing New Trading Strategies. The Manager believes strongly in the importance of research and development activities, particularly in the development of new trading strategies and expects both to develop additional trading strategies and to modify or remove the existing strategies over time. The time and costs of researching and developing new trading strategies and modifications to existing strategies is significant and the Fund will bear a portion of such costs. Despite this significant investment, there is no assurance that the Manager will ultimately deploy these new or modified trading strategies on behalf of the Fund, and even if deployed, the process may take several years. Furthermore, the intellectual property developed and comprising such trading strategies may have significant value and will accrue to the Manager. The Fund will have no right to or property interest in this intellectual property.
Concentration; Limited Diversification. In the normal course of making investments, the Fund is generally expected to have a diverse investment portfolio. However, the Fund is not subject to any diversification requirements and is expected to be concentrated at times to varying degrees in particular markets, investment strategies, investments, exchanges, counterparties or in investments with other shared characteristics. Concentration by the Fund in one or more investment strategies will increase the Fund’s reliance on the discretionary or quantitative personnel responsible for the strategies. In general, less diversification will tend to expose the Fund to greater volatility and/or risk than would be the case with a more broadly diversified investment portfolio. Even if the Fund is diversified, however, there can be no assurance that such diversification would reduce volatility and/or risk.
25
The Trading Programs Used by Thethe portfolio May Be Changed Without Notice to Investors. The Manager continuously updates and changes its trading programs as a result of its ongoing research efforts and in response to changing market conditions. The Manager also expects to develop and implement new trading programs from time to time, which may be used first by other funds or accounts managed by the Manager. The Manager may make additions or deletions of trading programs used by the Core Macro Portfolio at any time, and may make additions, deletions or any other changes to its trading programs used by either portfolio – such as changes in the amount of leverage or volatility targets of, or in the allocations of assets to, any of the trading programs used by either portfolio as well as changes to underlying trading models – at any time as determined by the Manager in its sole discretion. The Manager is not required to provide prior, or any, notice to investors of any such changes. As a result, the descriptions of the trading programs of the portfolio in the Fund’s offering materials may not at any particular time fully or accurately describe the trading programs being used by the portfolio.
Calculation and Payment of Redemption Proceeds to Members May Be Based on Unaudited Data and Accrued Liabilities Subject to Adjustment. Accordingly, adjustmentsAdjustments and revisions may be made to the Fund’s net asset value following the year-end audit of the Fund. Once paid, no revision to a Member’s redemption proceeds will be made based upon audit adjustments. Thus, the Fund will not seek reimbursement in the event of any overpayment and will not pay additional amounts in the event of an underpayment. As a result, a redeeming Member may be positively or negatively affected by a revision to the Fund’s net asset value. To the extent that such revisions to net asset value decrease the net asset value of the Fund, the outstanding Units will be adversely affected by redemptions. Conversely, any increases in the net asset value of the Fund resulting from such adjustments will be entirely for the benefit of the outstanding Units. Similarly, the Fund’s net asset value in any calculation period is reduced by accrued liabilities, including expenses borne by the Fund. Certain accruals for expenses and other liabilities may be adjusted in future calculation periods. The net asset value of the Fund in prior periods will not be revised due to any subsequent adjustment to the accruals.
Effect of Substantial Redemptions. Substantial redemptions could be triggered by a number of events, including, without limitation, unsatisfactory performance, events in the markets, a significant change in personnel or management of the Manager, legal or regulatory issues that investors perceive to have a bearing on the Fund and/or the Manager, or other events. Actions taken to meet substantial redemption requests from the Fund could result in the Fund altering its investments at other than optimal times, prices of financial instruments held by the Fund decreasing and in Fund expenses increasing (e.g., transaction costs and the costs of terminating agreements) and forced covering/sales to ensure proper margin ratios. The overall value of the Fund also may decrease because the liquidation value of certain assets may be materially less than their cost or mark-to-market value. Substantial redemptions from the Fund could also significantly restrict the Fund’s ability to obtain financing or transact with derivatives counterparties needed for its investment strategies, which would have a further material adverse effect on the Fund’s performance.
Systemic Risk. Credit risk may arise through a default by or because of one of several large institutions that are dependent on one another to meet their liquidity or operational needs, so that a default by or because of one institution may cause a series of defaults by the other institutions. This is sometimes referred to as a “systemic risk” and may adversely affect financial intermediaries, such as clearing houses, banks, securities firms and exchanges with which the Fund interacts. A systemic failure could have material adverse consequences on the Fund and on the markets for the financial instruments in which the Fund seeks to invest. The inability of the Fund or other investors to sell certain types of investments could lead to a potential inability of the Fund and other investors to meet margin calls or fund withdrawals, the impact of which can be further aggravated as dealers and counterparties reduce available credit lines and investors withdraw additional capital. In extreme market conditions, these factors can lead to a downward cycle that can have a significant adverse effect on the market prices of investments.
Risks Related to Conflicts of Interest
Performance Based and other Fund Compensation Could Expose the Fund to Greater Risks. The Manager could receive substantial compensation in the event it generates net profits for the Fund. Such compensation arrangements may provide an incentive for the Manager to effectuate larger and more risky transactions than would be the case in the absence of such arrangements. The Manager may receive compensation with respect to unrealized appreciation of Fund assets as well as with respect to realized gains from the trading of Fund assets. The fees and incentive allocation payable to the Manager were not the subject of arms’ length negotiation. In addition, investors that acquire Units of any Class with a Net Asset Value below a previous high-water mark might benefit at the expense of pre-existing investors where those Units increase in value but are not yet subject to an Incentive Allocation because the Class as a whole still has aggregate carried forward losses.
The Manager Manages and May Invest in Other Accounts. The Manager acts as general partner or trading advisor to other investment funds and accounts, including those referenced herein, that have investment objectives and methodologies that in some cases are similar to, and in other cases different from, those of the Fund. The majority of these investment funds and accounts employ many of the same discretionary or systematic trading strategies that are traded for the Fund.
The Manager is not required to trade all of the accounts that it manages on a parallel basis, and other accounts may take positions that are opposite, or ahead of, positions taken for the Fund. Even accounts that are ordinarily traded on a parallel or substantially similar basis may not participate on such a basis in all portfolio investments for a variety of reasons as determined in the discretion of the Manager, including, without limitation, specific account restrictions, rebalancing of accounts due to capital inflows and outflows, different sizes, funding levels and cash requirements of accounts which can influence position size and market access, and prior differences in portfolio investments. To the extent other investment funds and managed accounts grow in size, they may have an impact on the Fund’s trading and may adversely affect the Fund’s performance. The Manager receives higher management fees, higher incentive-based compensation and/or larger expense reimbursements for managing certain of these funds and accounts, which may create an incentive for the Manager and the Manager’s employees (including the Manager’s investment management and other trading personnel) to allocate riskier, more highly leveraged, or more highly compensated trading strategies, or a greater proportion of such trading strategies, to such funds and accounts. The Manager and its principals and their related parties also trade for their own accounts in some of the same markets in which the Fund trades, and also own significant positions in the Fund and other funds managed by the Manager.
The Manager and its principals and their related parties invest proprietary capital in different investment programs offered to clients from those offered by the Fund and may in addition invest proprietary capital to start new untested research strategies of the Manager. Fund investors will not be permitted to inspect the records of such proprietary accounts or the written policies related to such trading. The Manager and its principals may manage other accounts in the future. All of the above accounts will compete with the Fund for the same positions. All of the foregoing accounts will be aggregated for purposes of determining applicable position limits and may take the same or different positions as the Fund.
With respect to the discretionary strategies traded for the portfolio, all of the Manager’s trading is currently conducted through one or more Master Funds. Except with respect to portfolio managers trading on behalf of more than one account (as discussed further below), this structure generally eliminates the need for trade allocation procedures for the discretionary strategies that would otherwise be necessary if trading for each strategy was conducted for multiple accounts. The Manager closely reviews the capacity levels of each Master Fund traded for the Fund to ensure that all funds that utilize the discretionary strategies can invest in the Master Funds at the levels designated by the Manager’s Investment Committee. To date, the Master Funds have not experienced capacity limits that would impact the operation of the funds that invest in them; however, no assurance can be given that in the future one or more Master Funds will not be subject to capacity limits, which would require the Manager to limit the allocation of assets of one or more funds in the affected Master Funds. Both discretionary and quantitative trading strategies within the Master Funds will also be subject to capacity guidelines and constraints at times and trading allocations among or within the Master Funds will be adjusted accordingly as determined by the Manager’s Investment Committee.
In general, each portfolio manager makes all decisions about what to buy and sell independently from all other portfolio managers. Accordingly, portfolio managers may be buying or selling the same instruments at the same or different times, and at times may be competing with each other to identify, purchase or sell specific instruments. Additionally, portfolio managers may pursue the same or similar strategies and invest in some of the same instruments on behalf of multiple accounts, including certain accounts in which the Fund is not invested. The Manager has established a trade allocation policy that seeks to allocate investment opportunities among client accounts, including the Fund, in a manner that is fair and equitable. The policy identifies appropriate criteria by which the Manager may choose to allocate investments among client accounts, including considerations related to client account investment policies, guidelines or restrictions, tax considerations, cash availability and liquidity constraints. The policy also identifies inappropriate criteria for use in allocating investments among client accounts which relate to situations that would benefit the Manager at the expense of or through the use of client funds. The Manager may amend its existing trade allocation policies or establish additional trade allocation policies in an effort to address potential conflicts of interest that may arise in the future, including as the result of additional portfolio managers trading on behalf of more than one account.
The Manager and its officers and employees devote to the Fund as much time as the Manager deems necessary and appropriate to manage the Fund’s business. The Manager and its affiliates may form additional investment funds, enter into other investment advisory relationships, or engage in other business activities, even though such activities may be in competition with the Fund and may involve substantial time and resources of the Manager and its affiliates. These activities could be viewed as creating a conflict of interest in that the time and effort of the Manager’s officers and employees will not be devoted exclusively to the business of the Fund but will be allocated between the business of the Fund and the other business activities of the Manager and its affiliates. During turbulent conditions or distress in the financial markets or other times when the Fund will need focused support and assistance from the Manager and its officers and employees, other accounts for which the Manager serves as an investment manager may likewise require greater focus and attention, potentially placing the Manager’s resources in high demand. In such situations, the Fund may not receive the necessary support and assistance it would require or would otherwise receive if the Manager did not act as an investment manager for other accounts.
The Manager or its affiliates may manage separate managed accounts or dedicated investment vehicles for institutional investors that pursue strategies similar to, or that overlap with, those of the Fund. These clients may have access to detailed information about their accounts, including current portfolio holdings, which the Manager does not customarily make available to investors in the Fund or other pooled investment vehicles. Such clients may be able to take action, including more timely action, with respect to their accounts that investors in pooled vehicles with similar or parallel strategies cannot take.
The Manager continuously updates and changes its trading programs as a result of its ongoing research efforts and in response to changing market conditions. The Manager also expects to develop and implement new trading programs from time to time. In connection with these development efforts or as discussed further herein, the Manager may, in its sole discretion, determine not to include certain trading programs in client funds and accounts, including the Fund.
The Manager determines which accounts that it manages use which trading strategies and programs. The Manager may determine that certain accounts will not participate in certain trading strategies and programs, or allocate assets to particular portfolio managers, that are considered riskier, that are expected to be more volatile, that use greater leverage, that are newer and do not have an established track record, that do not have a track record or other performance metrics that are appropriate for the strategy or characteristics of a particular account, or that are experimental and still being developed or tested. The Manager may also determine that certain investors or prospective investors have an interest in investing in a different trading program which may allocate assets to particular trading programs or portfolio managers only, or to allocate assets to such trading programs and portfolio managers to a greater extent or lesser extent compared to other funds and accounts, including the Fund. The Manager has agreed, and may in the future agree, in its sole discretion, to manage funds or accounts investing pursuant to different trading programs, and such funds or accounts may be restricted to certain investors only, including, without limitation, investors who pay higher fees or expenses, large or strategic investors who satisfy significant minimum investment or other requirements, or investors with specific regulatory or investment policy requirements. The Manager and its principals and their related parties may elect to invest proprietary capital in the different trading programs, including to a greater or lesser extent compared to the level of proprietary capital investment in other funds and accounts, including the Fund. The inclusion or exclusion of a trading program or portfolio manager in a portfolio may have benefits or other consequences affecting other funds and accounts or the Manager generally.
While most funds and accounts managed by the Manager (including the Fund) charge a fixed management fee as a percentage of net assets and performance-based compensation as a percentage of the relevant fund’s or account’s net profits, certain other funds and accounts incur an additional level of expense equal to the allocable compensation payable to certain of the Manager’s investment management and trading personnel, with such performance based compensation generally calculated and payable without netting the performance of any one trading strategy, portfolio manager or portfolio management team against another. There is no requirement that all of the Manager’s portfolio managers be compensated in the same manner across all funds and accounts managed by the Manager, and portfolio managers are expected to be compensated separately with respect to their trading for such funds, with their compensation with respect to such funds having the potential to substantially exceed the compensation payable to them with respect to their trading for funds and accounts that do not incur such additional level of expense, such as the Fund. The funds and accounts incurring an additional level of expense will also bear their allocable portion of certain other non-compensation expenses as disclosed in the applicable offering documents for such funds from time to time, which may also materially exceed the non-compensation expenses borne by other funds and accounts, such as the Fund, which do not incur such expenses. The different expense and compensation structures described above may create actual or potential conflicts of interest for the Manager and its employees.
The Manager may make additions to or deletions from the Fund’s trading programs or add or remove portfolio managers at any time and may make modifications to those trading programs – such as changes in the amount of leverage of, or in the allocations of assets to, trading programs – at any time as determined by the Manager in its sole discretion. The Manager is not required to provide prior, or any, notice to Fund investors of any such changes. As a result, the descriptions of the Fund’s trading programs herein may not at any particular time fully or accurately describe each trading program being used by the Fund.
With respect to the Manager’s various trading programs, the Manager may place block orders with brokers on behalf of multiple accounts, including the Fund. Accounts in which the Manager and its principals have an interest may be included with client accounts in block orders.
Because a block order may be executed at different prices, one or more of the accounts may receive more favorable fills and some less favorable fills. The Manager generally uses a Monte Carlo simulation to allocate trades in its systematic strategies to multiple underlying accounts. Monte Carlo simulations measure the overall variance for how fills are distributed, with the goal to keep the allocation with the lowest variance so as to achieve the fairest allocation among accounts. The process builds a list of fills by broker/price that were received during the day, and a list of accounts/quantity. The account/quantity list is randomly sorted and then allocated the fills from the list in order. After all accounts are filled, the overall variance for how the fills were distributed is measured and that value is compared to the previous trial. If the variance is lower (more fair), the allocation result is kept. If the variance is higher, the result is discarded. This process is run 100,000 times using the allocation with the lowest variance to achieve the fairest allocation. If during the process an allocation results in a variance of 0 (where every account has received the average), the process stops and that allocation is used. Consistent application of this non-discretionary allocation methodology satisfies regulatory requirements of objectivity and fairness such that no account or group of accounts receives consistently favorable or unfavorable treatment. Allocations made according to this methodology will be deemed equitable even though under certain market conditions a trade may be more favorable to some accounts than others. In the event split fills of futures orders are allocated after execution, the Manager makes available upon request by certain affected clients composite data sufficient to compare execution results. Where block orders are not sanctioned or permitted for an account, whether by regulation or otherwise, buy or sell orders for such account are placed separately. These individual orders may be for the same positions as a block order executed for multiple accounts. The Manager’s execution of such trades is then subject to a trade rotation process that is intended to ensure that no account (whether utilizing separate orders or participating in block orders) receives consistently favorable or unfavorable treatment over any other. With this randomization process, the order or timing of execution of any trade for any account cannot be determined or predicted in advance. The Manager may determine to employ additional or alternative methods for allocating orders to client accounts that meet the regulatory requirements of objectivity and fairness such that no account or group of accounts receives consistently favorable or unfavorable treatment.
The Manager may enter into side agreements with specific investors in the Fund providing for different fees, redemption rights, access to information about the Fund’s investments or other matters relating to an investment in the Fund.
The Fund Will Generally Bear the Impact of Trade Errors. The Fund will ordinarily be responsible for any losses, and will benefit from any gains, resulting from trading errors and similar human errors, absent the Manager’s reckless disregard of its duties, willful misconduct, or gross negligence, or as otherwise required by law. As a result, any negative or positive results of trading errors generally will be borne by the Fund, rather than by the Manager, so long as the Manager adheres to the foregoing standard of care. However, the Manager bears all direct costs incurred in correcting trade errors, as defined below, without reimbursement for such costs from the Fund; provided, however, that the Manager shall be entitled to set off against such costs any amounts received by it from a broker or trade counter party in recognition of their relative degree of fault in the trade error. In no event shall the Manager be responsible for the negligence, dishonesty or bad faith of any broker or agent of the Fund; provided that such broker or agent was selected, engaged or retained by the Manager in good faith. A “trade error” is any execution by an employee of the Manager mistakenly transmitting, either through negligence or willful misconduct, a trade order to any broker or trade counter party on the Manager’s behalf that the Manager fails to liquidate through its trade reconciliation processes. In no event shall the Manager either offset the cost of correcting trade errors through soft dollars or seek to correct a trade error by instituting a trade between client accounts.
The Master–Feeder Structure Underlying the Fund’s Trading May Create Operating Inefficiencies for the Fund. All trading attributable to the Fund is currently conducted through the master funds organized and managed by the Manager, through a so-called “master-feeder” fund structure. A portion of the subscription proceeds received from investors ordinarily is invested by the Fund in the master funds, in each case with limited liability to the Fund. A separate master fund then invests in global futures, foreign exchange and other markets pursuant to each of the investment programs managed by the Manager.
Other investment funds and managed accounts structured to meet the needs of various U.S. and non-U.S. investors, including various proprietary accounts of the Managerand its related parties, also invest in such master funds, which include the Fund’s cash management vehicle, Cash Assets. The interests of such investors in any master fund may be in conflict in a number of respects, including, without limitation, as to theU.S. federal income tax consequences and capital utilization with regard to any master fund’s transactions. For example, each master fund’s transactions may provide investors subject to U.S. income taxation with different after-tax returns than those of non-U.S. and U.S. tax-exempt investors. In some cases, feeder funds that use different investment strategies are subject to different liquidity terms offered to their investors, and therefore may need to make more frequent withdrawals from master funds in order to satisfy redemption requests of investors. Also, each master fund may borrow to increase the efficiency of its capital utilization, but in so doing may incur borrowing charges at a rate that exceeds the rate at which the Fund earns interest income on its available cash. The Manager seeks to utilize such borrowing, with its attendant additional cost, to stabilize the master funds’ financing arrangements and offer various other advantages to their investors. At the same time, such borrowing may disproportionately benefit more leveraged investors in the master funds (including proprietary accounts of the Manager) over less leveraged investors (potentially including the Fund). Investors in the Fund may have conflicting investment, tax, or other interests with respect to their investment. The conflicting interests of individual investors may relate to or arise from, among other things, the nature of investments made by the Fund, the structuring of the acquisition of such investments, or the timing of disposition of investments. In such circumstances, the Manager will consider the investment and other objectives of the Fund and its investors as a whole, and not the investment or other objectives of any investor individually.
When two or more funds or accounts simultaneously invest in a single Master Fund, investors such as the Fund that are better capitalized or use less leverage than other investors may be exposed to losses resulting from a higher-leveraged investor’s inability to provide capital to the Master Fund pro rata to such Master Fund’s requirements from time to time.
Allocation of ExpensesExpenses.. The Manager determines how certain expenses are allocated among the Fund and other funds and accounts managed by the Manager. The Manager will allocate expenses (including the investment and operating expenses of the Master Funds) among the funds and accounts the Manager manages in proportion to their respective net asset values, in proportion to their respective participation in a particular investment, strategy or program, or in any other manner that the Manager determines to be equitable (which may be based on the Manager’s assumptions as to relative usage or resources allocated among the funds and accounts). The Manager has established expense allocation policies in an effort to address such matters and may amend such policies or establish additional expense allocation policies in an effort to address potential conflicts of interest that may arise in the future.
General Risk Factors
Natural Disasters and Other Events. The Fund and its investments may be affected by events beyond the control of the Fund and the Manager, including hurricanes, earthquakes, floods and other natural disasters, emergence of new viruses (such as COVID-19) or outbreaks of an infectious disease, pandemic or any other serious public health concern, infrastructure failures, war, terrorism, labor strikes, or social unrest or instability. The Manager is not able to predict the extent, severity or duration of these or other similar events or the impact that these events may have on the Fund or its investments.
Operational Risks, Including Those Related to Computer Systems and Cybersecurity Threats, May Impact the Fund’s Operations. The Fund depends on the Manager to develop, implement and operate the appropriate systems and procedures to execute all investment transactions and monitor and control operational risk. The success of the Fund’s business is highly dependent on its ability to process, on a daily basis, large volumes of data and transactions across numerous and diverse markets. Consequently, the Fund relies heavily on its execution, financial, accounting and other data processing systems to trade, clear and settle all transactions, to evaluate and monitor potential and existing portfolio investments, and to generate risk management and other reports that are critical to oversight of the Fund’s activities. Certain portions of the Fund’s and of the Manager’s operations are dependent upon systems operated by third parties, including the Fund’s administrator, prime brokers, market counterparties, electronic exchanges, other execution platforms, data providers and their various service providers. The Manager may not be in a position to verify the reliability of such third-party systems or data. Failure of or errors in such systems could result in mistakes or delays in the execution, confirmation or settlement of transactions, or in transactions not being properly booked, evaluated or accounted for. The increasing reliance on internet-based programs and applications to conduct transactions and store data also creates increased security risks. Targeted cyber-attacks, or accidental events, can lead to a breach in computer and data systems and access by unauthorized persons to sensitive transactional or personal information. Data taken in breaches may be used by criminals to commit identity theft, obtain loans or payments under false identities, and other crimes. Cybersecurity breaches at the Manager or its service providers or counterparties may directly or indirectly affect the Fund, and could lead to theft, data corruption, interference with business operations, disruption of operational or trading systems, interference with the Manager’s or the Fund’s ability to execute transactions, direct financial loss or reputational damage, or violations of applicable laws related to data and privacy protection and consumer protection.
30
The Fund Relies on Key Individuals. The Manager has complete and exclusive responsibility for management and administration of the affairs of the Fund, and Fund relies exclusively on the Manager for the management of its investment portfolio. The Manager, in turn, relies significantly on the services of its founder, Kenneth G. Tropin. The Manager also relies significantly on the services of certain discretionary and quantitative trading personnel for the Fund. There could be adverse consequences to the Fund in the event that the Manager ceases to be available to devote its services to the Fund. There could be adverse consequences to the Fund if Mr. Tropin ceases to be available to devote his services to the Manager. There could be adverse consequences to the Fund if certain discretionary and quantitative trading personnel cease to be available to devote their services to the Fund.
The foregoing list of risk factors and conflicts of interest does not purport to be a complete enumeration or explanation of the risks or conflicts involved in an investment in the Fund. Prospective investors should consult with their own advisors before deciding to subscribe for Units.
| Item 1B: | UNRESOLVED STAFF COMMENTS |
Not applicable.
| Item 1C: | Cybersecurity |
The Fund depends on the Manager to develop, implement and operate the appropriate systems and procedures to monitor and manage operational risks, including cybersecurity risks. The Manager maintains policies and procedures to manage cybersecurity risks as part of its overall risk management program. Its cybersecurity risk management program is operationally led by its Chief Technology Officer (CTO) and its Chief Information Security Officer (CISO), in consultation with other members of the Manager’s senior management. The Manager maintains a written information security governance policy setting forth the Manager’s information security policy objectives and guidelines on managing technology/cyber-related vulnerabilities, controlling physical security and network access rights, restricting data transfers, managing third-party vendors, managing technology incidents, training employees and retaining related books and records. The Manager maintains separate incident response procedures designed to assist senior management and technology personnel in responding to various technology/cyber incidents. The Manager publishes for employees various policies addressing user access rights, acceptable use of the firm’s technology, roles and responsibilities in respect of incident response and disciplinary guidelines. The aforementioned policies are reviewed and approved by senior management on an annual basis.
The CTO and CISO also lead the Manager’s Cybersecurity Awareness Committee, which is focused on managing and responding to cybersecurity risks. The CISO and CTO meet quarterly with members of the Cybersecurity Awareness Committee to provide updates on projects, threats, governance and the overall cybersecurity landscape. Members of this committee represent senior management of the Manager, including the Manager’s Chief Executive Officer, Chief Financial Officer, Managing Director of Quantitative Strategies, Chief Compliance Officer, and Chief Risk Officer. The Manager’s cybersecurity risk management program is informed by frameworks established by the National Institute of Standards and Technology (NIST), its regulators, and other recognized standard-setting bodies.
The Manager engages third party expert consultants to assist in the design, development, and operation of its cybersecurity risk management program, and to perform assessments with a view to identifying any vulnerabilities. The Fund’s and the Manager’s operations are dependent upon systems operated by third parties, including the Fund’s administrator, prime brokers, market counterparties, electronic exchanges, other execution platforms, data providers and their various service providers. Accordingly, the Manager’s risk management program endeavors to monitor such third parties for potential cybersecurity risks by utilizing a vendor management framework that includes a cybersecurity Due Diligence Questionnaire. Although the Manager has no control over the risk management policies of third parties, where and to the extent possible it seeks to obtain representations by such third parties related to their cybersecurity risk management policies and procedures.
No identified risks from known cybersecurity threats, including as a result of any prior known cybersecurity incidents, have materially affected or are reasonably likely to materially affect the operations, business strategy, results of operations, or financial condition of the Fund or the Manager.
| Item 2: | PROPERTIES |
The Fund does not own or use any physical properties in the conduct of its business. The Manager operates from its principal office in Rowayton, Connecticut as well as its offices in London, UK and West Palm Beach, Florida.
| Item 3: | LEGAL PROCEEDINGS |
There are no material legal proceedings pending, on appeal or concluded to which the Fund is a party or to which any of its assets is subject. There have been no material legal proceedings pending, on appeal or concluded against the Manager or any of its principals, directors or executive officers within the past five years.
| Item 4: | MINE SAFETY DISCLOSURES |
Not applicable.
| Item 5: | MARKET FOR REGISTRANT’S COMMON EQUITY, RELATED STOCKHOLDER MATTERS AND ISSUER PURCHASES OF EQUITY SECURITIES |
| (a) | Market information |
There is no public market for the Units, and none is likely to develop. Units may be redeemed subject to the conditions of the Company Agreement. Units may not be assigned or otherwise transferred except as permitted under the Company Agreement and as such may not be sold by investors pursuant to Rule 144 of the Securities Act of 1933, as amended.
| (b) | Holders |
As of March 1, 2023,2024, there were 6173 holders of Class 0 Units and 4845 holders of Class 2 Units of the Core Macro Portfolio.
| (c) | Dividends |
The Manager determines, in its sole and absolute discretion, the amount of distributions, if any, to be made by the Fund to its investors. To date no distributions have been paid on the Units and the Manager has no present intention to make any distributions in the future.
For the three months ended December 31, 2022,2023, the Fund did not issue anyissued 3,526.605 Units in exchange for $765,000 with respect to the Core Macro Portfolio.Portfolio, in each case in a transaction that was not registered under the Securities Act. The Units were issued in reliance upon applicable exemptions from registration under Section 4(a)(2) of the Securities Act and Rule 506 of Regulation D promulgated thereunder.
The following chart sets forth the purchases of Units of the Fund.
| Month beginning: | Core Macro Portfolio Class 0 Number of Units Purchased | Price of Core Macro Portfolio Class 0 Units Purchased | Core Macro Portfolio Class 2 Number of Units Purchased | Price of Core Macro Portfolio Class 2 Units Purchased | |||||||||||||
October 1, 2022 | 1,798.138 | $ | 230.97 | 921.741 | $ | 163.97 | |||||||||||
November 1, 2022 | 810.095 | $ | 224.11 | - | - | ||||||||||||
December 1, 2022 | 1,627.988 | $ | 224.59 | 968.677 | $ | 159.22 | |||||||||||
| Month beginning: | Core Macro Portfolio Class 0 Number of Units Purchased | Price of Core Macro Portfolio Class 0 Units Purchased | Core Macro Portfolio Class 2 Number of Units Purchased | Price of Core Macro Portfolio Class 2 Units Purchased | ||||||||
| October 1, 2023 | 308.824 | $ 239.25 | 1,682.001 | $ 168.94 | ||||||||
| November 1, 2023 | - | - | - | - | ||||||||
| December 1, 2023 | - | - | 457.876 | $ 158.20 |
| Item 6: | RESERVED |
Not applicable.
| Item 7: | MANAGEMENT’S DISCUSSION AND ANALYSIS OF FINANCIAL CONDITION AND RESULTS OF OPERATIONS |
| (a) | Management’s Discussion and Analysis of Financial Condition and Results of Operations |
Reference is made to “Item 8: Financial Statements”. The information contained therein is essential to, and should be read in conjunction with, the following analysis. The Fund does not engage in the sale of goods or services. The Fund’s capital consists of capital contributions of the members, as increased or decreased by gains and losses from its investments in the Master Funds, interest, expenses and redemptions. Its only assets are its investments in the Master Funds. The Master Funds do not engage in the sale of goods or services. Their assets are comprised of the equity in their accounts with clearing brokers and OTC counterparties, in each case consisting of cash, open trade equity on derivatives and the net option premium paid or received. In the case of Graham Cash Assets LLC, the assets consist of investments in debt obligations guaranteed by the U.S. federal government, as well as cash and cash equivalents.
For the year ended December 31, 2023, the Core Macro Portfolio’s Members’ Capital value decreased by $266,951 or -0.9%. This decrease in Members’ Capital was attributable to net loss of $66,478 or -0.2% and redemptions totaling $2,035,473 or -7.1%, offset by subscriptions totaling $1,835,000 or 6.4% for the year.
For the year ended December 31, 2022, the Core Macro Portfolio’s Members’ Capital value increased by $3,228,351 or 12.6%. This increase in Members’ Capital was attributable to net income of $6,745,624 or 26.3%, offset by redemptions totaling $3,517,273 or -13.7% for the year.
| (i) |
The Fund’s success depends primarily upon the Manager’s ability to recognize and capitalize on market trends in the different and varied sectors of the global financial markets in which it trades.
Core Macro Portfolio
2023 Summary
For the year ended December 31, 2023, the Core Macro Portfolio experienced trading gains of $174,572 attributable to the following sectors:
| Agriculture / Softs | $ | (58,559 | ) | ||
| Base Metals | (78,387 | ) | |||
| Energy | (323,362 | ) | |||
| Equities | 1,334,575 | ||||
| Foreign Exchange | 378,791 | ||||
| Long Term / Intermediate Rates | (761,783 | ) | |||
| Precious Metals | (392,714 | ) | |||
| Short Term Rates | 76,011 | ||||
$ | 174,572 |
The Core Macro Portfolio recorded a modest trading gain in 2023. The majority of gains were in equity indices and resulted from evolving long and short positions in U.S., Asian, and European benchmark indices. The portfolio produced profits in currencies, mainly from long exposure to the U.S. dollar versus various global currencies, particularly the Chinese yuan and Japanese yen, with additional gains from long exposure to the Mexican peso. Losses in commodities resulted mainly from long positions in precious metals and energy. In fixed income, short positions across the yield curve in Japan, Europe, and the U.S. led to losses, particularly in the fourth quarter.
33
Advisory and Sponsor Fees are calculated as a percentage of the Fund’s Members’ Capital value as of the end of each month and are affected by trading performance, interest income, subscriptions into and redemptions out of the Fund. Accordingly, the fluctuations in these amounts are directly correlated to the changes in net asset value which are discussed in detail herein.
For the year ended December 31, 2023, Advisory Fees decreased by $3,524 or -0.8%, Sponsor Fees decreased by $652 or -0.3%, and Administrator’s Fees decreased by $86 or -0.2% in the Core Macro Portfolio over the corresponding period of the preceding year. The movements are consistent with the timing of profit and loss and capital activity during the year. During the year ended December 31, 2023, interest income increased by $840,182 or 307.4%. Interest was earned on free cash at an average annualized yield of 3.96% for the year ended December 31, 2023 compared to 0.92% for the year ended December 31, 2022.
The Incentive Allocation is based on the New High Net Trading Profits of the portfolio. For the year ended December 31, 2023, the Incentive Allocation decreased by $1,299,717 or -81.1%. This was the result of a lower net income before incentive allocation for the year ended December 31, 2023 compared to the year ended December 31, 2022.
The following table illustrates the sector distribution of the Core Macro Portfolio’s investments in Master Funds as of December 31, 2023 based on the fair value of the underlying assets and liabilities in each master fund including both long and short positions. Positive percentages represent net assets whereas negative percentages represent net liabilities.
| Agriculture / Softs | 90.0 | % | |||
| Base Metals | 43.1 | % | |||
| Energy | 68.2 | % | |||
| Equities | (48.8 | )% | |||
| Foreign Exchange | 390.9 | % | |||
| Long Term / Intermediate Rates | 239.0 | % | |||
| Precious Metals | (5.8 | )% | |||
| Short Term Rates | (676.6 | )% | |||
100.0 | % |
2022 Summary
For the year ended December 31, 2022, the Core Macro Portfolio experienced trading gains of $9,089,749 attributable to the following sectors:
| Agriculture / Softs | $ | (147,371 | ) | ||
| Base Metals | 106,735 | ||||
| Commodity Mix | (63,460 | ) | |||
| Energy | 1,425,170 | ||||
| Equities | 638,791 | ||||
| Foreign Exchange | 2,749,233 | ||||
| Long Term / Intermediate Rates | 3,585,260 | ||||
| Precious Metals | (270,892 | ) | |||
| Short Term Rates | 1,066,283 | ||||
$ | 9,089,749 |
The Core Macro Portfolio recorded a net gain during 2022, with profits across all major sectors. The majority of profits resulted from positions in fixed income futures, primarily from positions across the yield curve in the U.S. and, to a lesser extent, Europe and Japan. In currencies, the portfolio produced gains from long positions in the U.S. dollar versus the Japanese yen, euro, and British pound sterling, particularly during the first three quarters of the year when the dollar was rising. The portfolio posted positive performance in commodities, mainly from long positions in energy. In equity index futures, positions in U.S., European, and Asian benchmark indices led to further gains for the portfolio.
Advisory and Sponsor Fees are calculated as a percentage of the Fund’s Members’ Capital value as of the end of each month and are affected by trading performance, interest income, subscriptions into and redemptions out of the Fund. Accordingly, the fluctuations in these amounts are directly correlated to the changes in net asset value which are discussed in detail herein.
For the year ended December 31, 2022, Advisory Fees increased by $14,709 or 3.4%, Sponsor Fees increased by $15,367 or 6.7%, and Administrator’s Fees increased by $790 or 2.2% in the Core Macro Portfolio over the corresponding period of the preceding year. The movements are consistent with the timing of profit and loss and capital activity during the year. During the year ended December 31, 2022, interest income increased by $249,365 or 1,039.6%. Interest was earned on free cash at an average annualized yield of 0.92% for the year ended December 31, 2022 compared to 0.10% for the year ended December 31, 2021.
The Incentive Allocation is based on the New High Net Trading Profits of the portfolio. For the year ended December 31, 2022, the Incentive Allocation increased by $1,172,360 or 272.8%. This was the result of a higher net gain before incentive allocation for the year ended December 31, 2022 compared to the year ended December 31, 2021.
The following table illustrates the sector distribution of the Core Macro Portfolio’s investments in Master Funds as of December 31, 2022 based on the fair value of the underlying assets and liabilities in each master fund including both long and short positions. Positive percentages represent net assets whereas negative percentages represent net liabilities.
| Agriculture / Softs | 54.9 | % | |||
| Base Metals | (13.5 | )% | |||
| Energy | 117.0 | % | |||
| Equities | (354.0 | )% | |||
| Foreign Exchange | 75.2 | % | |||
| Long Term / Intermediate Rates | 84.8 | % | |||
| Precious Metals | (3.0 | )% | |||
| Short Term Rates | 138.6 | % | |||
100.0 | % |
| Agriculture / Softs | $ | 659,505 | ||
| Base Metals | 407,714 | |||
| Energy | 806,437 | |||
| Equities | 1,644,987 | |||
| Foreign Exchange | 481,009 | |||
| Long Term / Intermediate Rates | (1,669,494 | ) | ||
| Precious Metals | (442,463 | ) | ||
| Short Term Rates | 34,661 | |||
$ | 1,922,356 |
Variables Affecting Performance
The performance of the portfolio of the Fund is affected by net profitability resulting from the trading operations of the master funds, the fees charged by the Fund, and interest income earned on cash and cash equivalents. The master funds acquire and liquidate long and short positions in futures contracts, forward contracts, spot currency contracts and associated derivative instruments such as options and swaps. These instruments are carried at fair value, which is heavily influenced by a wide variety of factors including, but not limited to the level and volatility of exchange rates, interest rates, equity prices, and commodity prices as well as global macro political events. These factors generate market movements affecting the fair value of these instruments and in turn the net gains and losses allocated from the master funds.
Brokerage, advisory and sponsor fees are calculated based on percentage of the net asset value of the portfolio. Changes in the net assets of the portfolio resulting from subscriptions, redemptions, interest and trading profits allocated from the master funds can therefore have a material impact in the fee expense of the portfolio.
A portion of the assets of the portfolio is held in cash and cash equivalents. Changes in the net assets of the portfolio as well as changes in the interest rates earned on these investments can have a material impact on interest income earned.
| (ii) | Liquidity |
A portion of the assets of the portfolio is generally held as cash or cash equivalents, which are used to margin the Fund’s investments. It is expected that the average margin the Fund will be required to post to support the Fund’s trading may range between 10% and 30% of the total assets of the portfolio, which will be segregated or secured by the futures brokers in accordance with the CEA and with CFTC regulations or be maintained on deposit with over-the-counter counterparties. In exceptional market conditions, this amount could increase. The master funds are subject to margin calls on a constant daily and intra-day basis, whether in connection with initiating new investment positions or as a result of changes in the value of current investment positions. These margin requirements are met through the posting of additional margin with the applicable futures broker or FX clearing broker, on an almost daily basis. The Manager generally expresses its margin requirements for the portfolios in terms of the aggregate of the margin requirements for the underlying strategies plus the net option premium costs for the underlying strategies. For the years ended December 31, 20222023 and December 31, 2021,2022, the margin requirements for the Core Macro Portfolio were 9.33%10.04% and 8.63%9.33%, respectively.
Other than any potential market-imposed limitations on liquidity, the Fund’s assets are highly liquid and are expected to remain so. Market-imposed limitations, when they occur, can be due to limited open interest in certain futures markets or to daily price fluctuation limits, which are inherent in the Fund’s futures trading. Through December 31, 2022,2023, the Fund experienced no meaningful periods of illiquidity in any of the markets traded by the Manager on behalf of the Fund.
| (iii) | Capital Resources |
The Fund raises additional capital only through the sale of Units and capital is increased through trading profits (if any) and interest income. The Fund may borrow money from brokers or their affiliates and other lenders. Units may be offered for sale as of the beginning, and may be redeemed as of the end, of each month. The amount of capital raised for the Fund should not have a significant impact on its operations, as the Fund has no significant capital expenditure or working capital requirements other than for monies to pay trading losses, brokerage commissions and expenses.
The Fund participates in the speculative trading of commodity futures contracts, substantially all of which are subject to margin requirements. The minimum amount of margin required for each contract is set from time to time in response to various market factors by the respective exchanges. Further, the Fund’s brokers may require margin in excess of minimum exchange requirements. The Fund bears the risk of financial failure of the brokers through which it clears trades and maintains margin in respect of any such trades and of its counterparties for its foreign exchange and swap trades with whom it also maintains margin.
| (iv) | Critical Accounting Policies |
Use of Estimates – The Fund’s financial statements have been prepared in conformity with U.S. generally accepted accounting principles (“U.S. GAAP”) and all amounts are stated in U.S. dollars. The preparation of the financial statements requires the Manager to make estimates and assumptions that affect the amounts reported in the financial statements and accompanying notes. Actual results could differ from those estimates. The Fund’s significant accounting policies are described in detail in Note 2 of the financial statements.
Fair Value Measurement - The Fund follows U.S. GAAP for fair value measurements, which defines fair value, establishes a framework for measuring fair value and requires certain disclosures about fair value measurements. U.S. GAAP uses a three-level hierarchy for fair value measurement based on the activeness of the market and the transparency and independence of inputs used in the valuation of an asset or liability as of the measurement date. The Fund reports the fair value of its investment-related assets and liabilities in accordance with the hierarchy established under U.S. GAAP.
The Fund records its investments in the Feeder Fund at fair value in accordance with U.S. GAAP. In determining its net asset value, the Feeder Fund records its investments in master funds at fair value in accordance with U.S. GAAP. The Fund records its proportionate share of the Feeder Funds’ investment income and loss, expenses, fees, and realized and unrealized gains and losses on a monthly basis. Purchases and sales of units in the Feeder Funds are recorded on a trade date basis.
The master funds record all their financial instruments at fair value, which is derived in accordance with U.S. GAAP. Unrealized appreciation and depreciation from these instruments are recorded based on changes in their fair value. Realized gains and losses are recorded when the positions are closed. All unrealized and realized gains and losses related to derivative financial instruments are included in net gain (loss) on investments in the master funds’ statements of operations.
Cash Assets - The Feeder Fund invests a portion of their excess liquidity in Cash Assets, an entity for which the Manager is also the sole investment advisor. The financial information of Cash Assets is included in the notes to the Financial Statements of the Feeder Funds within Item 8.
Income Taxes - No provision for income taxes has been made in the Fund’s financial statements, as each member is responsible for reporting income or loss based upon the member’s respective share of the Fund’s revenues and expenses for income tax purposes.
U.S. GAAP provides guidance for how uncertain tax positions should be recognized, measured, presented and disclosed in the financial statements. U.S. GAAP requires the evaluation of tax positions taken or expected to be taken in the course of preparing the Fund’s tax returns to determine whether the tax positions are “more-likely-than-not” of being sustained by the applicable tax authority. Tax positions not deemed to meet a more-likely-than-not threshold would be recorded as a tax expense in the current year. The Manager has evaluated the Fund’s tax positions and has concluded that there are no significant tax positions requiring recognition, measurement or disclosure in the financial statements. The Manager is not aware of any tax positions or interest/penalties for which it is reasonably possible that the total amounts of unrecognized tax expense will change materially in the next twelve months.
| Item 7A: | QUANTITATIVE AND QUALITATIVE DISCLOSURE ABOUT MARKET RISK |
No disclosure is required hereunder as the Fund is a “smaller reporting company,” as defined in Item 10(f)(1) of Regulation S-K.
| Item | FINANCIAL STATEMENTS AND SUPPLEMENTARY DATA |
| Graham Alternative Investment Fund I LLC | |
| Core Macro Portfolio | |
| Years Ended December 31, 2022 | |
| with Report of Independent Registered Public Accounting Firm |
GRAHAM ALTERNATIVE INVESTMENT FUND I LLC
CORE MACRO PORTFOLIO
40 Highland Avenue
Rowayton, CT 06853
The undersigned affirms, on behalf of Graham Alternative Investment Fund I LLC Core Macro Portfolio, that to the best of his knowledge and belief, the information contained in the attached audited financial statements of Graham Alternative Investment Fund I LLC Core Macro Portfolio for the years ended December 31, 20222023 and 20212022 is accurate and complete.
| By: | Graham Capital Management, L.P., as | ||||
| Sole Manager | |||||
| By: | /s/ George Schrade | |||
| George Schrade | ||||
| Chief Financial Officer | ||||
| March | ||||