UNITED STATES
SECURITIES AND EXCHANGE COMMISSION
WASHINGTON, DC 20549
FORM 10-K
(Mark One)
ý☒ ANNUAL REPORT UNDERPURSUANT TO SECTION 13 OR 15 (d) OF THE SECURITIES EXCHANGE ACT OF 1934
For the fiscal year ended December 31, 20172019
o☐ TRANSITION REPORT UNDERPURSUANT TO SECTION 13 OR 15 (d) OF THE SECURITIES EXCHANGE ACT OF 1934
For the transition period from ________ to _______
Commission file Number: 000-32891
1ST CONSTITUTION BANCORP
(Exact Name of Registrant as Specified in Its Charter)
|
| | |
| New Jersey | | 22-3665653 |
(State or Other Jurisdiction of Incorporation or Organization) | | (IRS Employer Identification Number) |
|
| | | | |
| 2650 Route 130 | P.O. Box 634 Cranbury, NJ 08512 | Cranbury | New Jersey | 08512 |
| (Address of Principal Executive Offices, including Offices) | (Zip Code) | |
|
| | |
| (609) 655-4500 | |
| (Registrant’s telephone number, including area code) | (609) | 655-4500 |
SECURITIES REGISTERED PURSUANT TO SECTION 12(b) OF THE ACT:
|
| | | |
| Title of each class
Common stock, no par value
| Name of each exchange on which registered
NASDAQ
| |
SECURITIES REGISTERED PURSUANT TO SECTION 12(g) OF THE ACT:Securities Registered Pursuant to Section 12(b) of the Act:
|
| | |
| Title of each class | None
Trading Symbol(s) | Name of each exchange on which registered |
| Common stock, no par value | (Title of Class)FCCY | NASDAQ Global Market |
Securities registered pursuant to Section 12(g) of the Act: None
Indicate by check mark if the registrant is a well-known seasoned issuer, as defined in Rule 405 of the Securities Act. Yes o☐ No ý☒
Indicate by check mark if the registrant is not required to file reports pursuant to Section 13 or 15(d) of the Act.
Yes o☐ No ý☒
Indicate by check mark whether the registrant: (1) has filed all reports required to be filed by Section 13 or 15(d) of the Securities Exchange Act of 1934 during the preceding 12 months (or for such shorter period that the registrant was required to file such reports), and (2) has been subject to such filing requirements for the past 90 days. Yes ý☒ No o☐
Indicate by check mark whether the registrant has submitted electronically and posted on its corporate website, if any, every Interactive Data File required to be submitted and posted pursuant to Rule 405 of Regulation S-T during the preceding 12 months (or for such shorter period that the registrant was required to submit and post such files).
Yes ý☒ No o
Indicate by check mark if disclosure of delinquent filers pursuant to Item 405 of Regulation S-K is not contained herein, and will not be contained, to the best of registrant’s knowledge, in definitive proxy or information statements incorporated by reference in Part III of this Form 10-K or any amendment to this Form 10-K. o☐
Indicate by check mark whether the registrant is a large accelerated filer, an accelerated filer, a non-accelerated filer, smaller reporting company or an emerging growth company. See the definitions of “large accelerated filer,” “accelerated filer,” "smaller reporting company," and "emerging growth company" in Rule 12b-2 of the Exchange Act. (Check one):
|
| | | |
| Large accelerated filer | o☐ | Accelerated filer | x☒ |
| Non-accelerated filer | o☐ | Smaller reporting company | o |
(Do not check if a smaller reporting company) | | ☒ |
| | | Emerging growth company | o☐ |
If an emerging growth company, indicate by check mark if the registrant has elected not to use the extended transition period for complying with any new or revised financial accounting standards provided pursuant to Section 13(a) of the Exchange Act. o☐
Indicate by check mark whether the registrant is a shell company (as defined in Rule 12b-2 of the Exchange Act).
Yes o☐ No ý
The aggregate market value of the registrant’s common stock held by non-affiliates of the registrant, computed by reference to the price at which the common stock was last sold, or the average bid and asked price of such common stock, as of the last business day of the registrant’s most recently completed second quarter, is $121,300,666.$136,654,174.
As of February 28, 2018, 8,112,2922020, 10,185,648 shares of the registrant’s common stock were outstanding.
Portions of the registrant’s definitiveDefinitive Proxy Statement for its 20182020 Annual Meeting of Shareholders (“2020 Proxy Statement”) are incorporated by reference into Part III of this Annual Report on Form10-K.
Form 10-K. The 2020 Proxy Statement will be filed within 120 days of the registrant’s fiscal year ended December 31, 2019.
|
| | |
| | FORM 10-K | |
| | | |
| | TABLE OF CONTENTS | |
| | | |
| | PART I | |
| | | |
| | |
| | |
| | |
| | |
| | |
| | |
| |
| | PART II | |
| |
| | |
| | |
| | |
| | |
| | |
| | |
| | |
| | |
| |
| | PART III | |
| |
| | |
| | |
| | |
| | |
| | |
| |
| | PART IV | |
| |
| | |
| Item 16. | Form 10-K Summary | |
| |
| |
When used in this Annual Report on Form 10-K for the year ended December 31, 20172019 (this "Form 10-K"), the words the "Company," "we," "our," and "us" refer to 1ST Constitution Bancorp and its wholly owned subsidiaries, unless we indicate otherwise.
Forward-Looking Statements
This Form 10-K contains "forward-looking statements" within the meaning of the Private Securities Litigation Reform Act of 1995 relating to, without limitation, our future economic performance, plans and objectives for future operations, and projections of revenues and other financial items that are based on our beliefs, as well as assumptions made by and information currently available to us. The words "may," "will," "anticipate," "should," "would," "believe," "contemplate," "could," "project," "predict," "expect," "estimate," "continue," and "intend," as well as other similar words and expressions of the future, are intended to identify forward-looking statements.
These forward-looking statements generally relate to our plans, objectives and expectations for future events and include statements about our expectations, beliefs, plans, objectives, intentions, assumptions and other statements that are not historical facts. These statements are based upon our opinions and estimates as of the date they are made. Although we believe that the expectations reflected in these forward-looking statements are reasonable, such forward-looking statements are subject to known and unknown risks and uncertainties that may be beyond our control, which could cause actual results, performance and achievements to differ materially from results, performance and achievements projected, expected, expressed or implied by the forward-looking statements.
Examples of events that could cause actual results to differ materially from historical results or those anticipated, expressed or implied include, without limitation, changes in the overall economy and interest rate changes; inflation, market and monetary fluctuations; the ability of our customers to repay their obligations; the accuracy of our financial statement estimates and assumptions, including the adequacy of the estimate made in connection with determining the adequacy of the allowance for loan losses; increased competition and its effect on the availability and pricing of deposits and loans; significant changes in accounting, tax or regulatory practices and requirements; changes in deposit flows, loan demand or real estate values; legislation or regulatory changes, including the Dodd-Frank Act;Wall Street Reform and Consumer Protection Act of 2010 (the “Dodd-Frank Act”); changes in monetary and fiscal policies of the U.S. Government; changes to the method that LIBOR rates are determined and to the potential phasing out of LIBOR after 2021; changes in loan delinquency rates or in our levels of non-performing assets; our ability to declare and pay dividends; changes in the economic climate in the market areas in which we operate; the frequency and magnitude of foreclosure of our loans; changes in consumer spending and saving habits; the effects of the health and soundness of other financial institutions, including the FDIC’s need of the Federal Deposit Insurance Corporation (the "FDIC") to increase the Deposit Insurance Fund assessments; technological changes; the effecteffects of climate change and harsh weather conditions, including hurricanes and man-made disasters; the effects of public health crises, including, but not limited to, the recent outbreak of the Novel Coronavirus (COVID-19); the economic impact of any future terrorist threats and attacks, acts of war or threats thereof and the response of the United States to any such threats and attacks; our ability to integrate acquisitions and achieve cost savings; other risks described from time to time in our filings with the Securities and Exchange Commission (the "SEC"); and our ability to manage the risks involved in the foregoing. Although management has taken certain steps to mitigate any negative effect of the aforementioned items, significant unfavorable changes could severely impact the assumptions used and have an adverse effect on profitability. Additional information concerning the factors that could cause actual results to differ materially from those in the forward-looking statements is contained in Item 1. "Business," Item 7. "Management’s Discussion and Analysis of Financial Condition and Results of Operations," and elsewhere in this Annual Report on Form 10-K and in our other filings with the SEC. However, other factors besides those listed in Item 1A. Risk Factors or discussed in this Annual Report also could adversely affect our results and you should not consider any such list of factors to be a complete list of all potential risks or uncertainties. Any forward-looking statements made by us or on our behalf speak only as of the date they are made. We undertake no obligation to publicly revise any forward-looking statements or cautionary factors, except as required by law.
PART I
Item 1. Business.
1ST Constitution Bancorp
1ST Constitution Bancorp is a bank holding company registered under the Bank Holding Company Act of 1956, as amended. 1ST Constitution Bancorp was organized under the laws of the State of New Jersey in February 1999 for the purpose of acquiring all of the issued and outstanding stock of 1ST Constitution Bank (the "Bank") and thereby enabling the Bank to operate within a bank holding company structure. The Company became an active bank holding company on July 1, 1999. As of December��December 31, 2017,2019, the Company has twothree employees, bothall of whom are full-time. The Bank is a wholly-owned subsidiary of the Company. Other than its investment in the Bank, the Company currently conducts no other significant business activities.
The main office of the Company and the Bank is located at 2650 Route 130 Cranbury, New Jersey 08512, and the telephone number is (609) 655-4500.
1ST Constitution Bank
The Bank is a commercial bank formed under the laws of the State of New Jersey and engages in the business of commercial and retail banking. As a community bank, the Bank offers a wide range of services (including demand, savings and time deposits and commercial and consumer/installment loans) to individuals, small businesses and not-for-profit organizations principally in the Fort Lee area of Bergen County and in Mercer, Middlesex, Mercer,Monmouth, Ocean and Somerset and Monmouth Counties of New Jersey. The Bank conducts its operations through its main office located in Cranbury, New Jersey, and operates 1725 additional branch offices in Asbury Park, downtown Cranbury, Fair Haven, Fort Lee, Freehold, Hamilton, Square, Hightstown, Hillsborough, Hopewell, Jackson, Jamesburg, Lawrenceville, Little Silver, Long Branch, Manahawkin, Neptune City, Perth Amboy, Plainsboro, Fort Lee, Princeton, Rumson, Fair Haven, Shrewsbury, Skillman Little Silver and Asbury Park,Toms River, New Jersey. The Bank also operates twoa residential mortgage loan production officesoffice in Forked River and Jersey City, New Jersey. The Bank’s deposits are insured up to applicable legal limits by the Federal Deposit Insurance Corporation "FDIC").FDIC. As of December 31, 2017,2019, the Bank had 183221 employees, of which 174218 were full-time employees.
Management efforts focus on positioning the Bank to meet the financial needs of the communities in Middlesex, Mercer, Somerset and Monmouth Counties and the Fort Lee area of Bergen County and in Mercer, Middlesex, Monmouth, Ocean and Somerset Counties and to provide financial services to individuals, families, institutions and small businesses. To achieve this goal, the Bank is focusing its efforts on:
•expansion of the Bank;
•personal service; and
•technological advances and e-commerce.
Expansion of the Bank
On November 8, 2019, the Company completed the merger of Shore Community Bank ("Shore"), a New Jersey chartered bank, with and into the Bank, with the Bank being the surviving entity (the "Shore Merger"). At the time of the Shore Merger, Shore had approximately $284.2 million in assets, approximately $209.6 million in loans, and approximately $249.8 million in deposits. Shore operated five branch offices located in Ocean County, New Jersey which became branches of the Bank as a result of the Shore Merger.
Pursuant to the terms of the merger agreement, dated as of June 23, 2019, governing the Shore Merger (the "Merger Agreement"), each outstanding share of Shore common stock owned at the effective time was exchanged for the right to receive (i) $16.50 in cash; (ii) 0.8786 of a share of the Company's common stock; or (iii) a combination of cash and the Company's common stock. Total consideration paid to Shore shareholders in the Shore Merger was $54.3 million, which was comprised of 1,509,275 shares of common stock of the Company with a market value of $29.2 million at the effective time of the Shore Merger, cash consideration of $24.2 million and cash of $925,000 paid in exchange for unexercised outstanding stock options. Cash used as consideration was provided by the Bank from existing cash assets.
On April 11, 2018, the Company completed the merger of New Jersey Community Bank ("NJCB"), a New Jersey-chartered bank, with and into the Bank, with the Bank being the surviving entity (the "NJCB Merger"). At the time of the NJCB Merger, NJCB had approximately $95 million in assets, approximately $75 million in loans, and approximately $87 million in deposits. NJCB operated two branch offices in Monmouth County, New Jersey which became branches of the Bank as a result of the NJCB Merger.
The Bank continually evaluates opportunities to expand its products and services to existing and new customers and expand into new markets through the acquisition of other banks and bank branch offices within and contiguous to its existing markets and/or by opening new branch offices.
On November 6, 2017, the Company and the Bank entered into an Agreement and Plan of Merger (the "Merger Agreement") with New Jersey Community Bank ("NJCB"), providing for the merger of NJCB with and into the Bank, with the Bank as the surviving entity (the "Merger"). If the Merger is completed, shareholders of NJCB will be entitled to receive, for each outstanding share of NJCB common stock that they own at the effective time of the Merger, a combination of common stock of the Company and cash as follows:
(i) 0.1309 of a share of common stock of the Company, subject to the payment of cash in lieu of fractional shares, which stock exchange ratio was based on the average closing price of $19.25 for a share of common price of the Company during the measurement period specified in the Merger Agreement; and
(ii) $1.60 in cash, subject to $0.21 being placed in escrow in accordance with the terms and conditions of the merger agreement to cover costs and expenses that may be incurred by the Company after the effective time of the merger as a result of specific pending litigation against NJCB.
The Company and the Bank have submitted and received all required regulatory approvals and waivers. The Company has filed a registration statement on Form S-4, which includes a proxy statement of NJCB and a prospectus of the Company, with the Securities and Exchange Commission (the "SEC") to register shares of common stock of the Company to be issued to shareholders of NJCB. The registration statement on Form S-4 was declared effective on February 15, 2018 by the SEC and the proxy statement-prospectus was mailed to shareholders of NJCB on or about February 22, 2018. The closing of the Merger remains subject to a number of conditions, including approval of the Merger Agreement by NJCB shareholders at a special meeting of shareholders scheduled to be held on March 22, 2018. The closing of the Merger is anticipated to take place during the second quarter of 2018.
On December 31, 2017, NJCB had approximately $103.1 million in assets, approximately $79.0 million in loans, approximately $93.7 million in deposits and approximately $8.9 million in shareholders' equity. NJCB operates two offices in Monmouth County, New Jersey: its main office in Freehold and a branch office in Neptune City.
Personal Service
The Bank provides a wide range of commercial and consumer banking services to individuals, families, institutions and small businesses in central and coastal New Jersey and the Fort Lee area of Bergen County. The Bank’s focus is to understand the needs of the community and its customers and to tailor products, services and advice to meet those needs. The Bank seeks to provide a high level of personalized banking services, emphasizing quick and flexible responses to customer demands.
Technological Advances and e-Commerce
The Bank recognizes that retail and business customers want to receive service via their most convenient delivery channel, be it the traditional branch office, by telephone,mobile device, ATM, or the Internet. For this reason, the Bank continues to enhance its e-commerce capabilities. At www.1stconstitution.com, customers have easy access to online banking, including account access, and to the Bank’s bill payment system. Consumers and businesses may also access their accounts and make deposits through their mobile devices. In 2019, the Bank introduced several features to enhance customers’ mobile and online banking experience, including real time account alerts and fraud monitoring on debit cards. Consumers can take advantage of Momentum Mortgage, our digital mortgage platform introduced in 2018, to apply online for loans and interact with senior management through the e-mail system.online portal. Business customers have access to cash management information and transaction capability through the Bank’s online Cash Manager product which permits business customers to make deposits, originate ACH payments, initiate wire transfers, retrieve account information and place “stop payment” orders. This overall expansionOur increased service offerings in electronic banking provides the Bank’sprovide our customers with the means to access the Bank’s services easily and at their own convenience.
Competition
The Bank experiences substantial competition in attracting and retaining deposits and in making loans. In attracting deposits and borrowers, the Bank competes with commercial banks, savings banks, and savings and loan associations, as well as regional and national insurance companies and non-bank financial institutions, mutual funds, regulated small loan companies and local credit unions, regional and national sponsors of money market funds and corporate and government borrowers. Within the direct market area of the Bank, there are a significant number of offices of competing financial institutions. In New Jersey generally, and in the Bank’s local market specifically, the Bank’s most direct competitors are large commercial banks, including Bank of America, PNC Bank, JP Morgan Chase, Wells Fargo and Santander Bank, as well as savings banks and savings and loan associations, including Provident Bank and Investors Bank.
The Bank is at a competitive disadvantage compared with these larger national and regional commercial and savings banks. By virtue of their larger capital, asset size and reserves, many of such institutions have substantially greater lending limits (ceilings on the amount of credit a bank may provide to a single customer that are linked to the institution’s capital) and other resources than the Bank. Many such institutions are empowered to offer a wider range of services, including trust services, than the Bank and, in some cases, have lower funding costs (the price a bank must pay for deposits and other borrowed monies used to make loans to customers) than the Bank. In addition to having established deposit bases and loan portfolios, these institutions, particularly large national and regional commercial and savings banks, have the financial ability to finance extensive advertising campaigns and to allocate considerable resources to locations and products perceived as profitable.
In addition, non-bank financial institutions offer services that compete for customers’ investable funds and deposits with the Bank. For example, brokerage firms and insurance companies offer such instruments as short-term money market funds, corporate and government securities funds, mutual funds and annuities. It is expected that competition in these areas will continue to increase. Some of these competitors are not subject to the same degree of regulation and supervision as the Company and the Bank and therefore may be able to offer customers more attractive products than the Bank.
However, management of the Bank believes that loans to small and mid-sized businesses and professionals, which represent the main commercial loan business of the Bank, are not always of primary importance to the larger banking institutions. The Bank competes for this segment of the market by providing responsive personalized services, making timely local decisions, and acquiring in depth knowledge of its customers and their businesses.
Lending Activities
The Bank’s lending activities include both commercial and consumer loans. Loan originations are derived from a number of sources, including real estate broker referrals, mortgage loan companies, direct solicitation by the Bank’s loan officers, existing depositors and borrowers, builders, attorneys, walk-in customers and, in some instances, other lenders. The Bank has established disciplined and systematic procedures for approving and monitoring loans that vary depending on the size and nature of the loans.
Commercial Business
The Bank offers a variety of commercial loan services, including term loans, lines of credit, and loans secured by equipment and receivables. A broad range of short-to-medium term commercial loans, both secured and unsecured, are made available to businesses for working capital (including inventory and receivables), business expansion (including acquisition and development of real estate and improvements), and the purchase of equipment and machinery. Commercial loans are granted based on the borrower’s ability to generate cash flow to support its debt obligations and other cash related expenses. A borrower’s ability to repay commercial loans is substantially dependent on the success of the business itself and on the quality of its management. As a general practice, the Bank takes, as collateral, a security interest in any available real estate, equipment, inventory, receivables or other personal property of its borrowers, although the Bank occasionally makes commercial loans on an unsecured basis. Generally, the Bank requires personal guarantees of its commercial loans to offset the risks associated with such loans. The Bank also offers loans of which a portion, generally 75% to 85%, are guaranteed by the Small Business Administration ("SBA"), which is a United States government agency. The Bank generally sells the guaranteed portion of these loans into the secondary market.
Commercial Real Estate
Commercial real estate loans are made to businesses to expand their facilities and operations and to real estate operators to finance the acquisition of income producing properties. The Company's loan policy requires that borrowers have sufficient cash flow to meet the debt service requirements and the value of the property meets the loan-to-value criteria set in the loan policy. The Company monitors loan concentrations by borrower, by type of property and by location and other criteria. The Company's commercial real estate portfolio is largely secured by real estate collateral located in the State of New Jersey.
Commercial Construction Financing
Construction financing is provided to businesses to expand their facilities and operations and to real estate developers for the acquisition, development and construction of residential and commercial properties. First mortgage construction loans are made to developers and builders primarily for single family homes or smaller multi-family buildings (less than ten units) that are presold, or are to be sold or leased on a speculative basis. The Bank lends to builders and developers with established relationships, successful operating histories and sound financial resources.
Residential Lending
A portion of the Bank’s lending activities consists of the origination of fixed and adjustable rate residential first mortgage loans secured by owner-occupied property located in the Bank’s primary market areas. Home mortgage lending is unique in that a broad geographic territory may be serviced by originators working from strategically placed offices either within the Bank’s traditional banking facilities or from affordable office locations in commercial buildings. The Bank also offers construction loans, reverse mortgages, second mortgage home improvement loans and home equity lines of credit.
The Bank finances the construction of individual, owner-occupied single-family houses on the basis of written underwriting and construction loan management guidelines. These loans are made to qualified individual borrowers and are generally supported by a take-out commitment from a permanent lender. The construction phase of these loans has certain risks, including the viability of the contractor, the contractor’s ability to complete the project within the budget and changes in interest rates.
The Bank will generally sell its originated residential mortgage loans in the secondary market. The decision to sell is made prior to origination. The sale into the secondary market allows the Bank to mitigate its interest rate risks related to such lending operations. This brokerage arrangement allows the Bank to accommodate its clients’ demands while eliminating the interest rate risk for the 15 to 30-year period generally associated with such loans.
For commercial and residential mortgage loans, the Bank, in most cases, requires borrowers to obtain and maintain title, fire, and extended casualty insurance, and, where required by applicable regulations, flood insurance. The Bank maintains its own errors and omissions insurance policy to protect against loss in the event of failure of a mortgagor to pay premiums on fire and other hazard insurance policies. Mortgage loans originated by the Bank customarily include a "due on sale" clause, which gives
the Bank the right to declare a loan immediately due and payable in certain circumstances, including, without limitation, upon the sale or other disposition by the borrower of the real property subject to a mortgage. In general, the Bank enforces "due on sale" clauses.
Non-Residential Consumer Lending
Non-residential consumer loans made by the Bank include loans for automobiles, recreation vehicles, and boats, as well as personal loans (secured and unsecured) and deposit account secured loans. Non-residential consumer loans are attractive to the Bank because they typically have a shorter term and carry higher interest rates than are charged on other types of loans. However, non-residential consumer loans pose an additional risk of collectability when compared to traditional loans, such as residential mortgage loans.
Consumer loans are granted based on employment and financial information solicited from prospective borrowers, as well as credit records collected from various reporting agencies. The stability of the borrower, willingness to pay and credit history are the primary factors to be considered. The availability of collateral is also a factor considered in making such a loan. The Bank seeks collateral that can be assigned and has good marketability with a clearly adequate margin of value. The geographic area of the borrower is another consideration, with preference given to borrowers in the Bank’s primary market areas.
Supervision and Regulation
Banking is a complex, highly-regulated industry. The primary goals of the bank regulatory scheme are to maintain a safe and sound banking system and to facilitate the conduct of monetary policy. In furtherance of those goals, Congress has created several largely autonomous regulatory agencies and enacted a myriad of legislation that governs banks, bank holding companies and the banking industry. This regulatory framework is intended primarily for the protection of depositors and not for the protection of the Company’s shareholders or creditors. Descriptions of, and references to, the statutes and regulations below are brief summaries thereof, and do not purport to be complete. The descriptions are qualified in their entirety by reference to the specific statutes and regulations discussed.
Regulation of the Bank Holding Company
The Company is a bank holding company within the meaning of the Bank Holding Company Act of 1956, as amended (the "BHCA"). As a bank holding company, the Company is subject to inspection, examination and supervision by the Board of Governors of the Federal Reserve System (the "Federal Reserve Board") and is required to file with the Federal Reserve Board an annual report and such additional information as the Federal Reserve Board may require pursuant to the BHCA. The Federal Reserve Board may also make examinations of the Company and its subsidiaries. The Company is subject to capital standards similar to, but separate from, those applicable to the Bank.
Under the BHCA, bank holding companies that are not financial holding companies generally may not acquire the ownership or control of more than 5% of the voting shares, or substantially all of the assets, of any company, including a bank or another bank holding company, without the Federal Reserve Board’s prior approval. The Company has not applied to become a financial holding company but did obtain such approval to acquire the shares of the Bank. A bank holding company that does not qualify as a financial holding company is generally limited in the types of activities in which it may engage to those that the Federal Reserve Board had recognized as permissible for bank holding companies prior to the date of enactment of the Gramm-Leach- Bliley Financial Services Modernization Act of 1999. For example, a holding company and its banking subsidiary are prohibited from engaging in certain tie-in arrangements in connection with any extension of credit or lease or sale of any property or the furnishing of services. At present, the Company does not engage in any significant activity other than owning the Bank.
In addition to federal bank holding company regulation, the Company is registered as a bank holding company with the New Jersey Department of Banking and Insurance (the "NJ Banking Department"). The Company is required to file with the NJ Banking Department copies of the reports it files with the federal banking and securities regulators.
Regulation of the Bank Subsidiary
As a New Jersey-chartered commercial bank, the Bank is subject to supervision and examination by the NJ Banking Department. The Bank is also subject to regulation and examination by the FDIC, which is its principal federal bank regulator.
The Bank must comply with various requirements and restrictions under federal and state law, including the maintenance of reserves against deposits, restrictions on the types and amounts of loans that may be granted and the interest that may be charged thereon, limitations on the types of investments that may be made and the services that may be offered, and restrictions
on dividends as described in the below section titled "Restrictions on Dividends and Redemption of Stock for the Company and the Bank." The Bank must also comply with the capital regulations promulgated by the FDIC as described in the section below titled "Capital Adequacy of the Company and the Bank." Consumer laws and regulations also affect the operations of the Bank. In addition to the impact of regulation, commercial banks are affected significantly by the actions of the Federal Reserve Board which influence the money supply and credit availability in the national economy.
For additional information on laws and regulations affecting the Bank, please refer to the below section titled "Banking Legislation and Regulations."
Capital Adequacy of the Company and the Bank
The Company is required to comply with minimum capital adequacy standards established by the Federal Reserve Board. There are two basic measures of capital adequacy for bank holding companies and the depository institutions that they own: a risk based measure and a leverage measure. All applicable capital standards must be satisfied for a bank holding company to be considered in compliance.
The Federal Deposit Insurance Corporation Improvement Act of 1991 ("FDICIA") requires each federal banking agency to revise its risk-based capital standards to ensure that those standards take adequate account of interest rate risk, concentration of credit risk and the risks of non-traditional activities. In addition, pursuant to FDICIA, each federal banking agency has promulgated regulations specifying the levels at which a bank would be considered "well capitalized," "adequately capitalized," "undercapitalized," "significantly undercapitalized," or "critically undercapitalized" and requiring that certain mandatory and discretionary supervisory actions be taken based on the capital level of the institution.
In December 2010, the Group of Governors and Heads of Supervisors of the Basel Committee on Banking Supervision, the oversight body of the Basel Committee, published its “calibrated” capital standards for major banking institutions, referred to as Basel III. Subsequently, in July 2013, the Federal Reserve Board and the FDIC approved revisions to their capital adequacy guidelines and prompt corrective action rules that implemented and addressed the revised standards of Basel III and addressaddressed relevant provisions of the Dodd-Frank Act. The Federal Reserve Board’s and the FDIC’s rules apply to all depository institutions, top-tier bank holding companies with total consolidated assets of $500 million or more (which was subsequently increased to $1 billion or more in May 2015), and top-tier savings and loan holding companies ("banking(collectively referred to herein as, "banking organizations"). Among other things, the rules establishestablished a new Common Equity Tier 1 minimum capital requirement (4.5% of risk-weighted assets) and increaseincreased the minimum Tier 1 capital to risk-based assets requirement (from 4% to 6% of risk-weighted assets). Banking organizations are also required to have a total capital ratio of at least 8% and a Tier 1 leverage ratio of at least 4%. The rules also limit a banking organization’s ability to pay dividends, engage in share repurchases or pay discretionary bonuses if the banking organization does not hold a "capital conservation buffer" consisting of 2.5% of Common Equity Tier 1 capital to risk-weighted assets in addition to the amount necessary to meet its minimum risk-based capital requirements. The rules became effective for the Company and the Bank on January 1, 2015 (subject to phase-in periods for certain components). TheAs of January 1, 2019, the capital conservation buffer requirement began phasing in on January 1, 2016 at 0.625% of Common Equity Tier 1 capital to risk-weighted assets and increases by that amount each year untilis fully implemented in January 2019 at 2.5% of Common Equity Tier 1 capital to risk-weighted assets. As of January 1, 2018, the Company and the Bank were required to maintain a capital conservation buffer of 1.875%.phased in.
With respect to the Bank, the FDIC’s regulations implementing these provisions of FDICIA provide that an institution will be classified as "well capitalized" if it (i) has a total risk-based capital ratio of at least 10.0 percent, (ii) has a Tier 1 risk-based capital ratio of at least 8.0 percent, (iii) has a Common Equity Tier 1, or CET1, ratio of at least 6.5 percent, (iv) has a Tier 1 leverage ratio of at least 5.0 percent, and (v) meets certain other requirements. An institution will be classified as "adequately capitalized" if it (i) has a total risk-based capital ratio of at least 8.0 percent, (ii) has a Tier 1 risk-based capital ratio of at least 6.0 percent, (iii) has a CET1 ratio of at least 4.5 percent, (iv) has a Tier 1 leverage ratio of at least 4.0 percent, and (v) does not meet the definition of "well capitalized." An institution will be classified as "undercapitalized" if it (i) has a total risk-based capital ratio of less than 8.0 percent, (ii) has a Tier 1 risk-based capital ratio of less than 6.0 percent, (iii) has a CET1 ratio of less than 4.5 percent or (iv) has a Tier 1 leverage ratio of less than 4.0 percent. An institution will be classified as "significantly undercapitalized" if it (i) has a total risk-based capital ratio of less than 6.0 percent, (ii) has a Tier 1 risk-based capital ratio of
less than 4.0 percent, (iii) has a CET1 ratio of less than 3.0 percent or (iv) has a Tier 1 leverage ratio of less than 3.0 percent. An institution will be classified as "critically undercapitalized" if it has a Tier 1 leverage ratio that is equal to or less than 2.0 percent. An insured depository institution may be deemed to be in a lower capitalization category if it receives an unsatisfactory examination rating. Similar categories apply to bank holding companies. WhenBecause the capital conservation buffer is now fully phased in, the capital ratios applicable to depository institutions will exceed the ratios to be considered well-capitalized under the prompt corrective action regulations.
Under these capital rules, the Bank’s CET1 risk-based capital, Tier 1 risk-based capital, total risk-based capital and leverage capital ratios were 11.74%10.99%, 11.74% ,12.55%10.99% ,11.67%, and 10.96%10.54%, respectively, at December 31, 2017.2019. The Bank is classified as a non-advanced approaches bank for regulatory purposes and has permanently opted out of including the amount of accumulated other
comprehensive income in the computation of regulatory capital.
On September 17, 2019, the federal banking agencies issued a final rule providing simplified capital requirements for certain community banking organizations (banks and holding companies) with less than $10 billion in total consolidated assets, implementing provisions of The Economic Growth, Regulatory Relief, and Consumer Protection Act. Under the proposal, a qualifying community banking organization would be eligible to elect the community bank leverage ratio (“CBLR”) framework, or continue to measure capital under the existing Basel III requirements. The new rule took effect on January 1, 2020, and qualifying community banking organizations may elect to opt into the new CBLR in their call report for the first quarter of 2020.
A qualifying community banking organization (“QCBO”) is defined as a bank, a savings association, a bank holding company or a savings and loan holding company with:
•a leverage capital ratio of greater than 9.0%;
•total consolidated assets of less than $10.0 billion;
total off-balance sheet exposures (excluding derivatives other than credit derivatives and unconditionally cancelable commitments) of 25% or less of total consolidated assets; and
•total trading assets and trading liabilities of 5% or less of total consolidated assets.
A QCBO opting into the CBLR must maintain a CBLR of 9.0%, subject to a two quarter grace period to come back into compliance, provided that the QCBO maintains a leverage ratio of more than 8.0% during the grace period. A QCBO failing to satisfy these requirements must comply with the Basel III requirements. The numerator of the CBLR is Tier 1 capital, as calculated under present rules. The denominator of the CBLR is the QCBO’s average assets, calculated in accordance with the QCBO’s Call Report instructions and less assets deducted from Tier 1 capital.
Management is still reviewing the CBLR framework, but does not expect that the Company or the Bank will elect to use the framework.
Restrictions on Dividends and Redemption of Stock for the Company and the Bank
The primary source of cash to pay dividends, if any, to the Company’s shareholders and to meet the Company’s obligations is dividends paid to the Company by the Bank. Dividend payments by the Bank to the Company are subject to the New Jersey Banking Act of 1948 (the "Banking Act") and the Federal Deposit Insurance Act (the "FDIA"). Under the Banking Act, the Bank may not pay dividends unless, following the dividend payment, the capital stock of the Bank will be unimpaired and (i) the Bank will have a surplus of not less than 50% of its capital stock or, if not, (ii) the payment of such dividend will not reduce the surplus of the Bank. Under the FDIA, the Bank may not pay any dividends if, after paying the dividend, it would be undercapitalized under applicable capital requirements. In addition to these explicit limitations, the federal regulatory agencies are authorized to prohibit a banking subsidiary or bank holding company from engaging in an unsafe or unsound banking practice. Depending upon the circumstances, the agencies could take the position that paying a dividend would constitute an unsafe or unsound banking practice. The Bank is also limited in paying dividends if it does not maintain the necessary "capital“capital conservation buffer'buffer” as discussed below.below and above under the section titled “Capital Adequacy of the Company and the Bank.”
It isDividend payments by the Company to its shareholders are subject to a the policy of the Federal Reserve Board which provides that bank holding companies should pay cash dividends on common stock only out of income available over the immediately preceding year and only if prospective earnings retention is consistent with the organization’s expected future needs and financial condition. The policy provides further that bank holding companies should not maintain a level of cash dividends that undermines the bank holding company’s ability to serve as a source of strength to its banking subsidiary. A bank holding company may not pay dividends when it is insolvent.
The Federal Reserve Board has issued a supervisory letter to bank holding companies that contains guidance on when the board of directors of a bank holding company should eliminate or defer or severely limit dividends, including, for example, when net income available for shareholders for the past four quarters, net of dividends paid during that period, is not sufficient to fully fund the dividends. The letter also contains guidance on the redemption of stock by bank holding companies which urges bank holding companies to advise the Federal Reserve Board of any such redemption or repurchase of common stock for cash or other value that results in the net reduction of a bank holding company’s capital at the beginning of the quarter below the capital outstanding at the end of the quarter. The Company’s payment of cash dividends to date were within the guidelines set forth in the Federal Reserve Board’s supervisory letter.
Subsequent to the issuance of the supervisory letter, the Federal Reserve Board adopted regulations requiring bank holding companies to give prior written notice to the Federal Reserve Board before purchasing or redeeming its stock if the gross consideration for the purchase or redemption, when aggregated with the net consideration (i.e., gross consideration paid for purchases and redemptions minus gross consideration received for all stock sold) paid for all purchases or redemptions of stock during the preceding 12 months, is equal to 10 percent10% or more of the bank holding company’s consolidated net worth. However, if a bank holding company (i) will be well-capitalized before and immediately after the purchase or redemption, (ii) is well-managed and (iii) is not the subject of any unresolved supervisory issues, then the bank holding company will not be required to give any prior written notice to the Federal Reserve Board. At this time, the Company fits within the above exception and is not required to give prior written notice to the Federal Reserve Board before purchasing or redeeming its stock.
The Federal Reserve Board’s capital adequacy rules also limit a banking organization’s ability to pay dividends or to engage in share repurchases if the banking organization does not hold a "capital conservation buffer" consisting of 2.5% of common equityCommon Equity Tier 1 capital to risk-weighted assets in addition to the amount necessary to meet its minimum risk-based capital requirements. The capital conservation buffer requirement began phasing in on January 1, 2016 at 0.625% of common equity Tier 1 capital to risk-weighted assets and will increase by that amount each year until fully implemented in January 2019 at 2.5% of common equity Tier 1 capital to risk-weighted assets. For further discussion of regulatory capital rules, please refer to the discussion under the above section titled "Capital Adequacy of the Company and the Bank." As of January 1, 2018, the Company and the Bank were required to maintain a capital conservation buffer of 1.875%.
The timing and the amount of the payment of future dividends, if any, on the Company's common shares will be at the discretion of the Company's Board of Directors and will be determined after consideration of various factors, including the level of earnings, cash requirements, regulatory capital and financial condition.
Priority on Liquidation
The Company is a legal entity separate and distinct from the Bank. The rights of the Company as the sole shareholder of the Bank, and therefore the rights of the Company’s creditors and shareholders, to participate in the distributions and earnings of the Bank when the Bank is not in receivership under Federal banking laws, are subject to various state and federal law restrictions as discussed above under the heading "Restrictions on Dividends and Redemption of Stock for the Company and the Bank." In the event of a liquidation or other resolution of an insured depository institution such as the Bank, the claims of depositors and other general or subordinated creditors are entitled to a priority of payment over the claims of holders of an obligation of the institution to its shareholders (the Company) or any shareholder or creditor of the Company. The claims on the Bank by creditors include obligations in respect of federal funds purchased and certain other borrowings, as well as deposit liabilities.
Financial Institution Legislation
Dodd-Frank Act
The Dodd-Frank Act has had a broad impact on the financial services industry, including significant regulatory and compliance requirements, including, among other things, (i) enhanced resolution authority of troubled and failing banks and their holding companies; (ii) increased capital and liquidity requirements; (iii) increased regulatory examination fees; (iv) changes to assessments to be paid to the FDIC for federal deposit insurance; and (v) numerous other provisions designed to improve supervision and oversight of, and strengthen safety and soundness for, the financial services sector. Additionally, the Dodd-Frank Act established a framework for systemic risk oversight within the financial system to be distributed among federal regulatory agencies, including the Financial Stability Oversight Council, the Federal Reserve Board, the Office of the Comptroller of the Currency, and the FDIC.
Effective in July 2011, the Dodd-Frank Act eliminated federal prohibitions on paying interest on demand deposits, thus allowing businesses to have interest bearing checking accounts. As of the date of this Form 10-K, the Bank does not pay interest on demand deposits. This significant change to existing law has not had an adverse impact on our net interest margin for the years ended December 31, 2017, 20162019, 2018 and 2015.2017.
The Dodd-Frank Act also changed the base for FDIC deposit insurance assessments. Assessments are based on average consolidated total assets less tangible equity capital of a financial institution, rather than on deposits. The Dodd-Frank Act also increased the maximum amount of deposit insurance for banks, savings institutions and credit unions to $250,000 per account owner. However, if an Interest on Lawyer Trust Account ("IOLTA") qualifies for pass-through coverage as a fiduciary account, then each separate client for whom a law firm holds funds in such IOLTA may be insured up to $250,000 for his or her funds. The legislation also increased the required minimum reserve ratio for the Deposit Insurance Fund, from 1.15% to 1.35% of insured deposits, and directed the FDIC to offset the effects of increased assessments on depository institutions with less than $10 billion in assets, including the Bank.
The Dodd-Frank Act requires publicly traded companies to give their stockholdersshareholders a non-binding vote on executive compensation ("say on pay") and so-called "golden parachute" payments. It also provides that the listing standards of the national securities exchanges shall require listed companies to implement and disclose "clawback" policies mandating the recovery of incentive compensation paid to executive officers in connection with accounting restatements. Such listing standards have yet to be implemented. For further discussion of incentive compensation rules, please refer to the discussion under the below section titled "Incentive Compensation."
The Dodd-Frank Act created the Consumer Financial Protection Bureau with broad powers to supervise and enforce consumer protection laws. The Consumer Financial Protection Bureau has broad rule-making authority for a wide range of consumer protection laws that apply to all banks and savings institutions, including the authority to prohibit "unfair, deceptive or abusive" acts and practices. The Consumer Financial Protection Bureau has examination and enforcement authority over all banks and savings institutions with more than $10 billion in assets, which authority does not extend to the Bank at this time since we do not meet the asset threshold.
The Dodd-Frank Act also weakens the federal preemption rules that have been applicable to national banks and federal savings associations, and gives state attorneys general the ability to enforce federal consumer protection laws. The Dodd-Frank Act requires minimum leverage (Tier 1) and risk based capital requirements for bank and savings and loan holding companies,
which exclude certain instruments that previously have been eligible for inclusion by bank holding companies as Tier 1 capital, such as trust preferred securities; however, bank holding companies with assets of less than $15 billion as of December 31, 2009 are permitted to include trust preferred securities that were issued before May 19, 2010 as Tier 1 capital.
The Dodd-Frank Act and the rules and regulations promulgated under the Dodd-Frank Act have impacted the Bank, as well as all community banks, by increasing our operating and compliance costs. To the extent the Dodd-Frank Act remains in place, it is likely to further increase our operating and compliance costs as certain yet to be written implementing rules and regulations are enacted.
Volcker Rule
On December 10, 2013, the Federal Reserve, the Office of the Comptroller of the Currency, the FDIC, the Commodity Futures Trading Commission and the SEC issued final rules to implement the Volcker Rule contained in Section 619 of the Dodd-Frank Act, which became effective on July 21, 2015, for investments in covered funds made after December 31, 2013. The Volcker Rule prohibits an insured depository institution and its affiliates from: (i) engaging in "proprietary trading" and (ii) investing in or sponsoring certain types of funds (defined as "Covered Funds") subject to certain limited exceptions. The rule also effectively prohibits short-term trading strategies by any U.S. banking entity if those strategies involve instruments other than those specifically permitted for trading and prohibits the use of some hedging strategies. In July 2019, the Federal Reserve, the Office of the Comptroller of the Currency, the FDIC, the Commodity Futures Trading Commission and the SEC adopted a final rule to exempt certain community banks, including the Bank, from the Volcker Rule, consistent with The Company identified no investments that metEconomic Growth, Regulatory Relief, and Consumer Protection Act. Under the definitionfinal rule, community banks with $10 billion or less in total consolidated assets and total trading assets and liabilities of Covered Funds and that were required to be divested by July 21, 2015 under5.0% or less of total consolidated assets are excluded from the foregoing rules.restrictions of the Volcker Rule.
Incentive Compensation
The Dodd-Frank Act requires the federal bank regulatory agencies and the SEC to establish joint regulations or guidelines prohibiting incentive-based payment arrangements at specified regulated entities with at least $1 billion in total assets, such as the Company and the Bank, that encourage inappropriate risks by providing an executive officer, employee, director or principal shareholder with excessive compensation, fees, or benefits or that could lead to material financial loss to the entity. In addition, these agencies must establish regulations or guidelines requiring enhanced disclosure to regulators of incentive-based compensation arrangements. The agencies proposed such regulations in April 2011 and subsequently proposed revised regulations in May 2016, but the revised regulations have not been finalized. If the revised regulations are adopted in the form proposed, they will impose limitations on the manner in which the Company may structure compensation for its executives and employees.
In 2010, the Federal Reserve, the Office of the Comptroller of the Currency and the FDIC issued comprehensive final guidance on incentive compensation policies intended to ensure that the incentive compensation policies of banking organizations do not undermine the safety and soundness of such organizations by encouraging excessive risk-taking. The guidance, which covers all employees that have the ability to materially affect the risk profile of an organization, either individually or as part of a group, is based on the key principles that a banking organization’s incentive compensation arrangements should (i) provide incentives that do not encourage risk-taking beyond the organization’s ability to effectively identify and manage risks, (ii) be compatible with effective internal controls and risk management, and (iii) be supported by strong corporate governance, including active and
effective oversight by the organization’s board of directors. These three principles are incorporated into the proposed joint compensation regulations under the Dodd-Frank Act.
The Federal Reserve will review, as part of its regular, risk-focused examination process, the incentive compensation arrangements of banking organizations, such as the Company, that are not "large, complex banking organizations." These reviews will be tailored to each organization based on the scope and complexity of the organization’s activities and the prevalence of incentive compensation arrangements. The findings of the supervisory initiatives will be included in reports of examination. Deficiencies will be incorporated into the organization’s supervisory ratings, which can affect the organization’s ability to make acquisitions and take other actions. Enforcement actions may be taken against a banking organization if its incentive compensation arrangements, or related risk-management control or governance processes, pose a risk to the organization’s safety and soundness and the organization is not taking prompt and effective measures to correct the deficiencies.
Gramm-Leach-Bliley Financial Services Modernization Act of 1999
The Gramm-Leach-Bliley Financial Services Modernization Act of 1999 (the "Modernization Act") became effective in early 2000. The Modernization Act:
allows bank holding companies meeting management, capital and Community Reinvestment Act standards to engage in a substantially broader range of non-banking activities, including insurance underwriting and making merchant banking investments in commercial and financial companies; if a bank holding company elects to become a financial holding company, it files a certification, effective in 30 days, and thereafter may engage in certain financial activities without further approvals;
allows banks to establish subsidiaries to engage in certain activities that a financial holding company could engage in, provided that the bank meets certain management, capital and Community Reinvestment Act standards; and
allows insurers and other financial services companies to acquire banks and removes various restrictions applicable to bank holding company ownership of securities firms and mutual fund advisory companies; and establishes the overall regulatory structure applicable to financial holding companies that also engage in insurance and securities operations.
The Modernization Act also amended the BHCA and the Bank Merger Act to require the federal banking agencies to consider the effectiveness of a financial institution’s anti-money laundering activities when reviewing an application under these acts. The Modernization Act modified other laws, including laws related to financial privacy and community reinvestment.
Additional proposals to change the laws and regulations governing the banking and financial services industry are frequently introduced in Congress, in state legislatures and before the various bank regulatory agencies. The likelihood and timing of any such changes and the impact such changes might have on the Company cannot be determined at this time.
Public Company Legislation
Sarbanes-Oxley Act of 2002
The Sarbanes-Oxley Act of 2002 (“Sarbanes-Oxley Act”), which became law on July 30, 2002, added new legal requirements affecting corporate governance, accounting and corporate reporting for companies with publicly traded securities.
The Sarbanes-Oxley Act provides for, among other things:
a prohibition on personal loans made or arranged by the issuer to its directors and executive officers (except for loans made by a bank subject to Regulation O of the Federal Reserve Board);
independence requirements for audit committee members;
disclosure of whether at least one member of the audit committee is a "financial expert" (as such term is defined by the SEC and if not, why not;
independence requirements for outside auditors;
a prohibition on a company’s registered public accounting firm from performing statutorily mandated audit services for the company if the company’s chief executive officer, chief financial officer, comptroller, chief accounting officer or any person serving in equivalent positions had been employed by such firm and participated in the audit of such company during the one-year period preceding the audit initiation date;
certification of financial statements and annual and quarterly reports by the principal executive officer and the principal financial officer;
the forfeiture of bonuses or other incentive-based compensation and profits from the sale of an issuer’s securities by directors and senior officers in the twelve month period following initial publication of any financial statements that later require restatement due to corporate misconduct;
disclosure of off-balance sheet transactions;
two-business day filing requirements for insiders filing Forms 4;
disclosure of a code of ethics for financial officers and filing a Form 8-K for a change or waiver of such code;
"real time" filing of periodic reports;
posting of certain SEC filings and other information on the company’s website;
the reporting of securities violations "up the ladder" by both in-house and outside attorneys;
restrictions on the use of non-GAAP financial measures;
the formation of a public accounting oversight board; and
various increased criminal penalties for violations of securities laws.
Additionally, Section 404 of the Sarbanes-Oxley Act requires that a public company subject to the reporting requirements of the Securities Exchange Act of 1934, as amended (the "Exchange Act"), include in its annual report (i) a management’s report on internal control over financial reporting assessing the company’s internal controls, and (ii) if the company is an "accelerated filer" or a "large accelerated filer", an auditor’s attestation report, completed by the registered public accounting firm that prepares or issues an accountant’s report which is included in the company’s annual report, attesting to the effectiveness of management’s internal control assessment.
The Company met the "accelerated filer" requirements as of the end of its fiscal year ended December 31, 2016 pursuant to Rule 12b-2 of the Exchange Act. However, pursuant to Rule 12b-2 and SEC Release No. 33-8876, the Company (as a smaller reporting company transitioning to the larger reporting company system) was not required to satisfy the larger reporting company disclosure requirements until its first Quarterly Report on Form 10-Q for the fiscal year ended December 31, 2017. The Company was further required to include an attestation report of the Company’s independent registered public accounting firm regarding the Company’s internal control over financial reporting in its Annual Report on Form 10-K for the year ended December 31, 2016. Going forward,In 2018, the SEC increased the public float threshold to be considered a “smaller reporting company” to $250 million from $75 million with respect to the accelerated filer reporting and disclosure requirements. However, the SEC did not change the public float threshold to be considered an “accelerated filer,” which remains $75 million or more, but less than $700 million with respect to the attestation report of the Company's independent registered public accounting firm. The Company willmeets the criteria to be both a “smaller reporting company” and an “accelerated filer,” and is therefore required to continue to include the attestation reportsreport of the Company’s independent registered public accounting firm regarding the Company’s internal control over financial reporting in its Annual ReportsReport on Form 10-K for so long as the Company is an "accelerated filer."10-K.
Each of the national stock exchanges, including the Nasdaq Global Market where the Company’s common stock is listed, have in place corporate governance rules, including rules requiring director independence, and the adoption of charters for the nominating, corporate governance, and audit committees. These rules are intended to, among other things, make the board of directors independent of management and allow shareholders to more easily and efficiently monitor the performance of companies and directors. These burdens increase the Company’s legal and accounting fees and the amount of time that the Board of Directors and management must devote to corporate governance issues.
Section 302(a) of the Sarbanes-Oxley Act requires the Company’s principal executive officer and principal financial officer to certify that the Company’s Quarterly and Annual Reports do not contain any untrue statement of a material fact or omit to state a material fact necessary to make the statements made, in light of circumstances under which they were made, not misleading. The rules have several requirements, including havingAmong other things, these officers must certify that: they are responsible for establishing, maintaining and regularly evaluating the effectiveness of the Company’s disclosure controls and procedures and internal control over financial reporting; they have made certain disclosures to the Company’s auditors and the audit committee of the Board of Directors about the Company’s internal control over financial reporting; and they have included information in the Company’s Quarterly and Annual Reports about their evaluation of disclosure controls and procedures and whether there have been significant changes in the Company’s internal controlscontrol over financial reporting.
Banking Legislation and Regulations
Anti-Money Laundering
As part of the USA PATRIOT Act, signed into law on October 26, 2001, Congress adopted the International Money Laundering Abatement and Financial Anti-Terrorism Act of 2001 (the "Act""FATA"). The ActFATA authorizes the Secretary of the Treasury, in consultation with the heads of other government agencies, to adopt special measures applicable to financial institutions such as banks, bank holding companies, broker-dealers and insurance companies. Among its other provisions, the ActFATA requires each financial institution: (i) to establish an anti-money laundering program; (ii) to establish due diligence policies, procedures and controls that are reasonably designed to detect and report instances of money laundering in United States private banking accounts and correspondent accounts maintained for non-United States persons or their representatives; and (iii) to avoid establishing, maintaining, administering, or managing correspondent accounts in the United States for, or on behalf of, a foreign shell bank that does not have a physical presence in any country. In addition, the ActFATA expands the circumstances under which funds in a bank account may be forfeited and requires covered financial institutions to respond under certain circumstances to requests for information from federal banking agencies within 120 hours.
The Department of Treasury has issued regulations implementing the due diligence requirements. These regulations require minimum standards to verify customer identity and maintain accurate records, encourage cooperation among financial institutions, federal banking agencies, and law enforcement authorities regarding possible money laundering or terrorist activities, prohibit the anonymous use of "concentration accounts," and require all covered financial institutions to have in place an anti- moneyanti-money laundering compliance program.
Community Reinvestment Act
Under the Community Reinvestment Act ("CRA"(the "CRA"), as implemented by FDIC regulations, a bank has a continuing and affirmative obligation, consistent with its safe and sound operation, to help meet the credit needs of its entire community, including low- and moderate-income neighborhoods. The CRA does not establish specific lending requirements or programs for financial institutions, nor does it limit an institution’s discretion to develop the types of products and services that it believes are best suited to its particular community, consistent with CRA. The CRA requires the FDIC to assess an institution’s record of meeting the credit needs of its community and to take such record into account in its evaluation of certain applications by the applicable institution. The CRA requires public disclosure of an institution’s CRA rating and requires that the FDIC provide a written evaluation of an institution’s CRA performance utilizing a four-tiered descriptive rating system. An institution’s CRA rating is considered in determining whether to grant charters, branches and other deposit facilities, relocations, mergers, consolidations and acquisitions. Performance less than satisfactory may be the basis for denying an application. At its last CRA examination, the Bank was rated "satisfactory" under the CRA.
FIRREAFinancial Institutions Reform, Recovery, and Enforcement Act of 1989
Under the Financial Institutions Reform, Recovery, and Enforcement Act of 1989 ("FIRREA"), a depository institution insured by the FDIC can be held liable for any loss incurred by, or reasonably expected to be incurred by, the FDIC in connection with (i) the default of a commonly controlled FDIC-insured depository institution or (ii) any assistance provided by the FDIC to a commonly controlled FDIC-insured depository institution in danger of default. These provisions have commonly been referred to as FIRREA’s "cross guarantee" provisions. Further, under FIRREA, the failure to meet capital guidelines could subject a bank to a variety of enforcement remedies available to federal regulatory authorities.
FIRREA also imposes certain independent appraisal requirements upon a bank’s real estate lending activities and further imposes certain loan-to-value restrictions on a bank’s real estate lending activities. Banking regulators have promulgated regulations in these areas.
Insurance of Deposits
The Bank’s deposits are insured up to applicable limits by the Deposit Insurance Fund of the FDIC. This limit is $250,000 per account owner. FDICIA is applicable to depository institutions and deposit insurance. The FDIC established a risk-based assessment system for all insured depository institutions and established an insurance premium assessment system based upon: (i) the probability that the insurance fund will incur a loss with respect to the institution, (ii) the likely amount of the loss, and (iii) the revenue needs of the insurance fund. The resulting matrix sets the assessment premium for a particular institution in accordance with its capital level and overall rating by the primary regulator.
As a result of the Dodd-Frank Act, the FDIC modified its assessment rules so that an institution’s deposit insurance assessment base changed from total deposits to total assets less tangible equity. These assessment base rates range from 2.5 to 9 basis points for Risk Category I banks and up to 45 basis points for Risk Category IV banks. Risk Category II and III banks have assessment base rates ranging from 9 to 33 basis points, respectively. If the risk category of the Bank changes adversely, our FDIC insurance premiums could increase.
Lending Limits
In January 2013, the NJ Banking Department issued an order requiring a New Jersey charteredJersey-chartered bank’s calculation of lending limits to any person or entity to include credit exposure to such person or entity arising from a derivative transaction, repurchase agreement, reverse repurchase agreement, securities lending transaction or securities borrowing transaction. Previously, such credit exposure was not included in a New Jersey charteredJersey-chartered bank’s calculation of lending limits. New Jersey charteredJersey-chartered banks must comply with the operative provisions of the order, which include compliance with all of the rules set forth in the Office of the Comptroller of the Currency’s rules on lending limits (codified at 12 C.F.R pts. 32, 159 and 160). This change in the calculation of lending limits did not have a significant impact on the Bank’s operations.
Information about our Executive Officers
Robert F. Mangano, 74, is the President and Chief Executive Officer of the Company and of the Bank, in which roles he has served since 1996. Prior to joining the Bank in 1996, Mr. Mangano was President and Chief Executive Officer of Urban National Bank, a community bank in northern New Jersey, for a period of three years and a Senior Vice President of another bank for one year. Prior to such time, Mr. Mangano held a senior position with Midlantic Corporation for 21 years. Mr. Mangano is Chairman of the Audit Committee of the Englewood Hospital Medical Center and serves on the Board of Trustees of Englewood Hospital Medical Center and its parent board.
Stephen J. Gilhooly, 67, has served as the Senior Vice President and Chief Financial Officer of the Company and the Bank and as the Treasurer of the Company since April 1, 2014. Prior to April 1, 2014, Mr. Gilhooly served as the Bank’s Senior Vice President and Chief Financial Officer. Prior to joining the Bank, Mr. Gilhooly most recently served as Senior Vice President and Treasurer of Florida Community Bank, Weston, Florida, from May 2011 to May 2013. Prior to joining Florida Community Bank, Mr. Gilhooly served as Executive Vice President and Treasurer of the banking subsidiaries of Capital Bank Financial Corporation (formerly North American Financial Holdings) (“CBF”) beginning in September 2010. Mr. Gilhooly served as Executive Vice President, Treasurer and Chief Financial Officer of TIB Financial Corp. (“TIB”), Naples, Florida, from 2006 to 2010, prior to its acquisition by CBF. Before joining TIB, Mr. Gilhooly worked for 15 years with Advest, Inc. in New York as Director in its Financial Institutions Group. Mr. Gilhooly earned a B.S. degree in Economics and a M.S. degree in Accounting from the Wharton School of the University of Pennsylvania. He is a Certified Public Accountant and a Chartered Global Management Accountant.
John T. Andreacio, 57, has served as the Executive Vice President and Chief Lending and Credit Officer of the Company since January 2018 and of the Bank since September 2014. Mr. Andreacio joined the Company in March 2012 and has used his extensive management and credit knowledge to enhance the Company’s credit and lending function. Prior to joining the Bank, Mr. Andreacio was President and Chief Executive Officer of Northern State Bank, a community bank in northern New Jersey, for a period of three years. Prior to that time, Mr. Andreacio held senior positons with National Penn Bank/KNBT and First Union Bank.
Naqi A. Naqvi, 63, has served as the Senior Vice President and Chief Accounting Officer of the Company and the Bank since May 7, 2018. Prior to his appointment, Mr. Naqvi served as Executive Vice President and Chief Financial Officer of NJCB from March 3, 2012 to April 11, 2018, when NJCB was merged with and into the Bank. Prior to joining NJCB in early 2010, Mr. Naqvi held a number of senior management roles at financial institutions, including Greater Community Bancorp and Village Bank of South Orange. Mr. Naqvi started his career at First Virginia Bank before joining Village Bank of South Orange in 1983. He then joined Greater Community Bancorp in 1986 as Treasurer and was subsequently elevated to Senior Vice President and Chief Financial Officer during his 22 years of service with Greater Community Bancorp. Mr. Naqvi is a graduate of Virginia Commonwealth University with a degree in accounting and finance.
There are no family relationships between any of the officers named above and there is no arrangement or understanding between any of such officers and any other person pursuant to which he or she was selected as an officer. Each of the officers named above was elected by the Board of Directors to hold office until his successor is elected and qualified or until his earlier resignation or removal.
Available Information
The Internet website address of the Company is http://www.1stconstitution.com. The informationcontent on ourany website referred to in this Form 10-K is not incorporated intoby reference in this Annual Report.Form 10-K unless expressly noted. The Company’s Annual Reports on Form 10-K, and Quarterly Reports on Form 10-Q, Current Reports on Form 8-K, proxy statements, and amendments to those reports, and statements filed or furnished pursuant to Section 13(a) or 15(d) of the Exchange Act, are made available free of charge, on or through our Internet website, as soon as reasonably practicable after such material is electronically filed with or furnished to the SEC. All filings we makeThe SEC’s website, www.sec.gov, contains reports, proxy and information statements, and other information regarding issuers that file electronically with the SEC are also available free of charge via EDGAR through the SEC’s website at http://www.sec.gov.SEC.
We also make available, free of charge, through the investors page on our website, charters of the committees of our Board of Directors, as well as other information and materials, including information about how to contact our Board of Directors, its committees and their members.
Item 1A. Risk Factors.
The following are some important factors that could cause the Company’s actual results to differ materially from those referred to or implied in any forward-looking statement. These are in addition to the risks and uncertainties discussed elsewhere in this Form 10-K and the Company’s other filings with the SEC.
An economic downturn or the return of negative developments in the financial services industry could negatively impact our operations.
The recent U.S. economic downturn from 2008 to 2010 resulted in uncertainty in the financial markets in general. WhileAlthough the U.S. economy has gradually improved overexperienced a recovery in the past few years the recovery has been slow andsince then, the possibility of a fall-back into recession currentlyalways exists. The Federal Reserve, in an attempt to help the overall economy, has kept interest rates historically low through its targeted federal funds rate even though it has increased the federal funds rate once in each of 2015 and 2016, and three times in 2017, and anticipates raising the federal funds rate three or four times in 2018.2018 and decreased two times in 2019. If the Federal Reserve increases the federal funds rate three or four times in 2018,the future, overall interest rates will likelymay rise, which may negatively impact the housing markets and the U.S. economic recovery.economy. An economic downturn or the return of negative developments in the financial services industry could negatively impact our operations by causing an increase in our provision for loan losses and a deterioration of our loan portfolio. Such a downturn may also adversely affect our ability to originate or sell loans. The occurrence of any of these events could have an adverse impact on our financial performance.
A downturn affecting the economy and/or the real estate market in our primary market area would adversely affect our loan portfolio and our growth potential.
Much of the Company’s lending is in northern and central New Jersey.Jersey and the New York City metropolitan area. As a result of this geographic concentration, a significant broad-based deterioration in economic conditions in the New Jersey and New York City metropolitan area could have a material adverse impact on the quality of the Company’s loan portfolio, results of operations and future growth potential. A prolonged decline in economic conditions in our market area could restrict borrowers’ ability to pay outstanding principal and interest on loans when due, and consequently, adversely affect the cash flows and results of operations of the Company’s business.
The Company’s loan portfolio is largelyprimarily secured by real estate collateral located in the State of New Jersey. Conditions in the real estate markets in which the collateral for the Company’s loans are located strongly influence the level of the Company’s non-performing loans and results of operations. A decline in the New Jersey real estate markets could adversely affect the Company’s loan portfolio. Decreases in local real estate values would adversely affect the value of property used as collateral for the Company’s loans. Adverse changes in the economy also may have a negative effect on the ability of our borrowers to make timely repayments of their loans, which would have an adverse impact on our earnings.
The Company faces significant competition.
The Company faces significant competition from many other banks, savings institutions and other financial institutions that have branch offices or otherwise operate in the Company’s market area. Non-bank financial institutions, such as securities brokerage firms, insurance companies and money market funds, engage in activities which compete directly with traditional bank business, which has also led to greater competition. Many of these competitors have substantially greater financial resources than the Company, including larger capital bases that allow them to attract customers seeking larger loans than the Company is able to accommodate and the ability to aggressively advertise their products and to allocate considerable resources to locations and products
perceived as profitable. There can be no assurance that the Company and the Bank will be able to successfully compete with these entities in the future.
The Company is subject to interest rate risk.
The Company’s earnings are largely dependent upon its net interest income. Net interest income is the difference between interest income earned on interest-earning assets such as loans and securities and interest expense paid on interest-bearing liabilities such as deposits and borrowed funds. Interest rates are highly sensitive to many factors that are beyond the Company’s control, including general economic conditions and policies of various governmental and regulatory agencies and, in particular, the Federal Reserve Board. Changes in monetary policy, including changes in interest rates, could influence not only the interest the Company receives on loans and securities and the amount of interest it pays on deposits and borrowings, but such changes could also affect (i) the Company’s ability to originate loans and obtain deposits, (ii) the fair value of the Company’s financial assets and liabilities, and (iii) the average duration of the Company’s mortgage-backed securities portfolio. If the spread between the interest rates paid on deposits and other borrowings and the interest rates received on loans and other investments narrows, the Company’s net interest income, and therefore earnings, could be adversely affected. This also includes the risk that interest-earning assets may be more responsive to changes in interest rates than interest-bearing liabilities, or vice versa (repricing risk), the risk that the individual interest rates or rate indices underlying various interest-earning assets and interest-bearing liabilities may not change in the same degree over a given time period (basis risk), and the risk of changing interest rate relationships across the spectrum of interest-earning asset and interest-bearing liability maturities (yield curve risk).
Although management believes it has implemented effective asset and liability management strategies to reduce the potential effects of changes in interest rates on the Company’s results of operations, any substantial, unexpected, prolonged change in market interest rates could have a material adverse effect on the Company’s financial condition and results of operations.
Historically low interest rates may adversely affect our net interest income and profitability.
During the last nineten years, it has been the policy of the Federal Reserve Board to maintain interest rates at historically low levels through its targeted federal funds rate and the purchase of mortgage-backed securities and Treasury securities. As a result, yields have been at levels lower than were available prior to 2008 on securities we have purchased and loans we have originated. Consequently, the average yield on our interest-earning assets has decreased during the low interest rate environment. As a general matter, our interest-bearing assets re-price or mature more quickly than our interest-bearing liabilities. Our ability to lower our interest expense is limited at these interest rate levels, while the average yield on our interest-earning assets may continue tocould decrease. WhileAlthough the Federal Reserve Board raised the targeted federal funds rate and discount rate in 2015, 2016, and 2017, and 2018, such rates were reduced in 2019, and the Federal Reserve Board may further raise or reduce the targeted federal funds rate and discount rate in 2018,the future. Notwithstanding this uncertainty, we believeanticipate that interest rates maywill remain relatively low forand could decline in the near future.future from current levels. Accordingly, our net interest margin maycould decline, which may have an adverse effect on our profitability.
The Company is subject to risks associated with speculative construction lending.
The risks associated with speculative construction lending include the borrower’s inability to complete the construction process on time and within budget, the sale of the project within projected absorption periods, the economic risks associated with real estate collateral, and the potential of a rising interest rate environment. Such loans may include financing the development and/or construction of residential subdivisions. This activity may involve financing land purchases, infrastructure development (i.e., roads, utilities, etc.), as well as construction of residences or multi-family dwellings for subsequent sale or lease by the developer/builder. Because the sale and leasing of developed properties is integral to the success of developer business, loan repaymentrepayments may be especially subject to the volatility of real estate market values. Management has established underwriting and monitoring criteria to minimize the inherent risks of speculative commercial real estate construction lending. Further, management concentrates lending efforts with developers demonstrating successful performance on marketable projects within the Bank’s lending areas.
Our mortgage warehouse lending business represents a significant portion of our overall lending activity and is subject to numerous risks.
Our primary lending emphasis is the origination of commercial business and commercial real estate loans and mortgage warehouse lines of credit. Based on the composition of our loan portfolio, the inherent primary risks are deteriorating credit quality, a decline in the economy, and a decline in New Jersey real estate market values. Any one, or a combination, of these events may adversely affect the loan portfolio and may result in increased delinquencies, loan losses and increased future provision levels.
A significant portion of our loan portfolio consists of the mortgage warehouse lines of credit. Risks associated with these loans include, without limitation, (i) credit risks relating to the mortgage bankers that borrow from us, (ii) the risk of intentional misrepresentation or fraud by any of such mortgage bankers, (iii) changes in the market value of mortgage loans originated by the mortgage banker, the sale of which is the expected source of repayment of the borrowings under a warehouse line of credit, due to changes in interest rates during the time in warehouse, or (iv) unsalable or impaired mortgage loans so originated, which could
lead to decreased collateral value and the failure of a purchaser of the mortgage loan to purchase the loan from the mortgage banker.
The impact of interest rates on our mortgage warehouse business can be significant. Changes in interest rates can impact the number of residential mortgages originated and initially funded under mortgage warehouse lines of credit and thus our mortgage warehouse related revenues. A decline in mortgage rates generally increases the demand for mortgage loans. Conversely, in a constant or increasing rate environment, we would expect fewer loans may be originated. Although we use models to assess the impact of interest rates on mortgage related revenues, the estimates of net income produced by these models are dependent on estimates and assumptions of future loan demand, prepayment speeds and other factors which may overstate or understate actual subsequent experience. Further, the concentration of our loan portfolio on loans originated through our mortgage warehouse business increases the risk associated with our loan portfolio because of the concentration of loans in a single line of business, namely one-to-four family residential mortgage lending, and in a particular segment of that business, namely mortgage warehouse lending.
If our allowance for loan losses is not sufficient to cover actual loan losses, our earnings could decrease.
We make various assumptions and judgments about the collectability of our loan portfolio, including the creditworthiness of our borrowers and the value of the real estate and other assets serving as collateral for the repayment of many of our loans. In determining the amount of the allowance for loan losses, we review our loans and our loan and delinquency experience, and we evaluate economic conditions. If our assumptions are incorrect, our allowance for loan losses may not be sufficient to cover losses inherent in our loan portfolio, resulting in additions to our allowance. Material additions to our allowance would materially decrease our net income.
In addition, bank regulators periodically review our loan portfolio and our allowance for loan losses and may require us to increase our provision for loan losses or recognize further loan charge-offs or reclassify loans. Any increase in our allowance for loan losses or loan charge-offs or loan reclassifications as required by these regulatory authorities might have a material adverse effect on our financial condition and results of operations.
If our acquisition of NJCB closes and we do not successfully integrate NJCB, or we do not successfully integrate any other banks that we may acquire in the future, the combined bank may be adversely affected.
If the merger of NJCB with and into the Bank is completed, and if we make additionalany acquisitions in the future, we will need to integrate the acquired entities into our existing business and systems. We may experience difficulties in accomplishing this integration or in effectively managing the combined bank after the merger with NJCB, and after any future acquisition. Any actual cost savings or revenue enhancements that we may anticipate fromThe integration of any acquired entity will also divert the merger with NJCB or any future acquisition will depend on future expense levels and operating results, the timingattention of certain events and general industry, regulatory and business conditions. Many of these events will be beyond our control, and wemanagement. We cannot assure you that if the merger of NJCB with and into the Bank is consummated or if we make any additional acquisitions in the future, we will be successful in integrating those businessesany future acquisitions into our own business.
If the acquisition of NJCB closes, the expected benefits of the merger of NJCB with and into the Bank, or theThe expected benefits from acquiring another entity may not be realized if the combined bank does not achieve certain cost savings and other benefits.
Our belief that cost savings and revenue enhancements are achievable as a result of the anticipated merger of NJCB with and into the Bank or in any future acquisition is a forward-looking statement that is inherently uncertain. The combined bank’s actual cost savings and revenue enhancements, if any, for any future acquisition cannot be quantified at this time. Any actual cost savings or revenue enhancements will depend on future expense levels and operating results, the timing of certain events and general industry, regulatory and business conditions. Many of these events will be beyond the control of the combined bank.
We depend on our executive officers and key personnel to implement our strategy and could be harmed by the loss of their services.
We believe that the implementation of our strategy will depend in large part on the skills of our executive management team and our ability to motivate and retain these and other key personnel. Accordingly, the loss of service of one or more of our executive officers or key personnel could reduce our ability to successfully implement our business strategy and materially and adversely affect us. Leadership changes will occur from time to time, and if significant resignations occur, we may not be able to recruit additional qualified personnel. We believe our executive management team possesses valuable knowledge about the banking industry and that their knowledge and relationships would be very difficult to replicate. Although our Chief Executive Officer and President has entered into an employment agreement with us, it is possible that he may not complete the term of his employment agreement or may choose not to renew it upon expiration.
Our customers also rely on us to deliver personalized financial services. Our success depends on the experience of our branch managers and lending officers and on their relationships with the customers and communities they serve. The loss of the service of these individuals could undermine the confidence of our customers in our ability to provide such personalized services. We need to continue to attract and retain these individuals and to recruit other qualified individuals to ensure continued growth. In addition, competitors may recruit these individuals in light of the value of the individuals’ relationships with their customers and communities and we may not be able to retain such relationships absent the individuals. If we are unable to attract and retain our branch managers and lending officers, and recruit individuals with appropriate skills and knowledge to support our business, our business strategy, business, financial condition and results of operations may be adversely affected.
Our directors and executive officers own a significant percentage of our stock and will be able to exert significant control over matters subject to shareholder approval.
As of December 31, 2017,2019, our directors and executive officers, together with their affiliates and related persons, beneficially own,owned, in the aggregate, approximately 14.5%12.6% of our outstanding shares of common stock. These shareholders, if acting together, may have the ability to determine the outcome of matters submitted to our shareholders for approval, including the election and removal of directors and any merger, consolidation, or sale of all or substantially all of our assets. In addition, these persons, acting together, may have the ability to control the management and affairs of our company. Accordingly, this concentration of ownership may harm the market price of our common stock by:
delaying, deferring, or preventing a change in control;
entrenching our management and/or the board of directors;
impeding a merger, consolidation, takeover, or other business combination involving us; or
discouraging a potential acquirer from making a tender offer or otherwise attempting to obtain control of us.
Federal and state government regulation impacts the Company’s operations.
The operations of the Company and the Bank are heavily regulated and will be affected by present and future legislation and by the policies established from time to time by various federal and state regulatory authorities. In particular, the monetary policies of the Federal Reserve Board have had a significant effect on the operating results of banks in the past and are expected to continue to do so in the future. Among the instruments of monetary policy used by the Federal Reserve Board to implement its objectives are changes in the discount rate charged on bank borrowings.borrowings and the targeted Federal Funds rate. It is not possible to predict what changes, if any, will be made to the monetary policies of the Federal Reserve Board or to existing federal and state legislation or the effect that such changes may have on the future business and earnings prospects of the Company.
The Company and the Bank are subject to examination, supervision and comprehensive regulation by various federal and state agencies. Compliance with the rules and regulations of these agencies may be costly and may limit growth and restrict certain activities, including payment of dividends, investments, loans and interest rate charges, interest rates paid on deposits, and locations of offices. The Bank is also subject to capitalization guidelines set forth in federal legislation and regulations.
The laws and regulations applicable to the banking industry could change at any time, and we cannot predict the impact of these changes on our business and profitability. Because government regulation greatly affects the business and financial results of all commercial banks and bank holding companies, the cost of compliance could adversely affect the Company’s results of operations.
Legislative and regulatory reforms may materially adversely impact our financial condition, results of operations, liquidity, or stock price.
The Dodd-Frank Act restructuresrestructured the regulation of depository institutions. The Dodd-Frank Act contains various provisions designed to enhance the regulation of depository institutions and prevent the recurrence of a financial crisis such as occurred in 2008-2009. Also included was the creation of the Consumer Financial Protection Bureau, a new federal agency administering consumer and fair lending laws, a function that was previously performed by the depository institution regulators. The federal preemption of state laws currently accorded to federally chartered depository institutions has been reduced as well. We expect that many of the requirements called for in the Dodd-Frank Act will be implemented over time, and most will be subject to implementing regulations over the course of several years. Given the uncertainty associated with the manner in which the provisions of the Dodd-Frank Act will be implemented by the various regulatory agencies and through regulations, the full extent of the impact such requirements will have on financial institutions’ operations is unclear. The changes resulting from the Dodd-Frank Act may impact the profitability of our business activities, require changes to certain of our business practices, impose upon us more stringent capital, liquidity and leverage ratio requirements or otherwise adversely affect our business. These changes may also require us to invest significant
to invest significant management attention and resources to evaluate and make necessary changes in order to comply with new statutory and regulatory requirements.
In addition, international banking industry regulators have largely agreed upon significant changes in the regulation of capital required to be held by banks and their holding companies to support their businesses. The international rules, known as Basel III, generally increased the capital required to be held and narrow the types of instruments which will qualify as providing appropriate capital and imposed a new liquidity measurement. The Basel III requirements are complex and will be phased in over many years.
The Basel III rules do not apply to U.S. banks or holding companies automatically. Among other things, the Dodd-Frank Act requires U.S. regulators to reform the system under which the safety and soundness of banks and other financial institutions, individually and systemically, are regulated. That reform effort included the regulation of capital and liquidity.
On July 2, 2013,Pursuant to federal regulatory requirements regarding the Federal Reserve approved a final rule (the “Final Rule”) to establish a new comprehensive regulatory capital framework for all U.S. banking organizations. On July 9, 2013,organizations, the FDIC approved an interim final rule (which became final in April 2014 with no substantive changes) that was substantially similar to the Final Rule. Effective January 1, 2015, these new requirements established the following minimum capital ratios: (1) a common equityCommon Equity Tier 1 (“CET1”) capital ratio of 4.5% of risk-weighted assets; (2) a Tier 1 capital ratio of 6.0% of risk-weighted assets; (3) a total capital ratio of 8.0% of risk-weighted assets; and (4) a leverage ratio of 4.0%.
In addition, there is a requirement to maintain a capital conservation buffer, comprised of CET1 capital, in an amount greater than 2.5% of risk-weighted assets over the minimum capital required by each of the minimum risk-based capital ratios in order to avoid limitations on the organization’s ability to pay dividends, repurchase shares or pay discretionary bonuses. The capital conservation buffer requirement began phasing in on January 1, 2016,has been fully implemented and initially requiredwas at a buffer amount greater than 0.625% during 2016 in order to avoid these limitations. Following 2016, the required amount of the capital conservation buffer continues to increase each year until January 1, 2019 when the buffer amount must be greater thanlevel above 2.5% in order to avoid the above limitations.at December 31, 2019.
These regulations define what qualifies as capital for purposes of meeting these various capital requirements, as well as the risk weight of certain assets for purposes of the risk-based capital ratios.
Under these regulations, in order to be considered well-capitalized for prompt corrective action purposes, the Bank will be required to maintain the following ratios: (1) a CET1 ratio of at least 6.5% of risk-weighted assets; (2) a Tier 1 capital ratio of at least 8.0% of risk weightedrisk-weighted assets; (3) a total capital ratio of a least 10.0% of risk-weighted assets; and (4) a leverage ratio of at least 5.0%. The Bank’s CET1 risk-based capital, Tier 1 risk-based capital, total risk-based capital and leverage capital ratios were 11.74%10.99%, 11.74%10.99%, 12.55%11.67%, and 10.96%10.54%, respectively, at December 31, 2017.2019.
On September 17, 2019, the federal banking agencies adopted a final rule, effective January 1, 2020, creating a CBLR framework for institutions with total consolidated assets of less than $10 billion and that meet other qualifying criteria. The CBLR framework provides for a simpler measure of capital adequacy for qualifying institutions. Qualifying institutions that elect to use the CBLR framework and that maintain a leverage ratio of greater than 9% will be considered to have satisfied the generally applicable risk-based and leverage capital requirements in the federal banking agencies’ capital rules and to have met the well-capitalized ratio requirements. Management is still reviewing the CBLR framework, but does not expect that the Company or the Bank will elect to use the framework.
The application of these capital requirements could increase the Company’s required capital levels and the cost of capital, among other things. Any permanent significant increase in the Company’s cost of capital could have significant adverse impacts on the profitability of many of our products, the types of products we could offer profitably, our overall profitability, and our overall growth opportunities, among other things. Implementation of changes to asset risk weightings for risk basedrisk-based capital calculations or items included or deducted in calculating regulatory capital and/or additional capital conservation buffers could also result in management modifying the Company’s business strategy and limiting the Company’s ability to repurchase our common stock. Furthermore, the imposition of liquidity requirements in connection with the implementation of Basel III could result in us having to lengthen the term of our funding, restructure our business models, and/or increase our holdings of liquid assets. Although most financial institutions would be affected, these business impacts could be felt unevenly, depending upon the business and product mix of each institution. Other potential adverse effects could include higher dilution of common shareholders if we had to issue additional shares and a higher risk that we might fall below regulatory capital thresholds in an adverse economic cycle.
Any additional changes in the regulation and oversight of the Company, in the form of new laws, rules and regulations, could make compliance more difficult or expensive or otherwise materially adversely affect our business, financial condition or operations.
The price of our common stock may fluctuate.
The price of our common stock on the NASDAQ Global Market constantly changes and recently, given the uncertainty in the financial markets, has fluctuated widely. From the beginning of fiscal year 20162018 through the end of fiscal year 2017,2019, our stock price fluctuated between a high of $20.80$27.00 per share and a low of $11.27$16.15 per share. We expect that the market closing price of our common stock will continue to fluctuate. Consequently, the current market price of our common stock may not be indicative of future market prices, and we may be unable to sustain or increase the value of an investment in our common stock.
Our common stock price can fluctuate as a result of a variety of factors, many of which are beyond our control. These factors include:
quarterly fluctuations in our operating and financial results;
operating results that vary from the expectations of management, securities analysts and investors;
changes in expectations as to our future financial performance, including financial estimates by securities analysts and investors;
events negatively impacting the financial services industry which result in a general decline in the market valuation of our common stock;
announcements of material developments affecting our operations or our dividend policy;
future sales of our equity securities;
new laws or regulations or new interpretations of existing laws or regulations applicable to our business;
changes in accounting standards, policies, guidance, interpretations or principles; and
general domestic economic and market conditions.
In addition, recently, the stock market generally has experienced extreme price and volume fluctuations. Industry factors and general economic and political conditions and events, such as economic slowdowns or recessions, interest rate changes or credit loss trends, could also cause our stock price to decrease regardless of our operating results.
The Bank is subject to liquidity risk.
Liquidity risk is the potential that the Bank will be unable to meet its obligations as they become due, capitalize on growth opportunities as they arise, or pay regular dividends because of an inability to liquidate assets or obtain adequate funding in a timely basis, at a reasonable cost and within acceptable risk tolerances.
Liquidity is required to fund various obligations, including credit commitments to borrowers, mortgage and other loan originations, withdrawals by depositors, repayment of borrowings, dividends to shareholders, operating expenses and capital expenditures.
Liquidity is derived primarily from retail deposit growth and retention; principal and interest payments on loans; principal and interest payments on investment securities; sale, maturity and prepayment of investment securities; net cash provided from operations and access to other funding sources.
Our access to funding sources in amounts adequate to finance our activities could be impaired by factors that affect us specifically or the financial services industry in general. Factors that could detrimentally impact our access to liquidity sources include a decrease in the level of our business activity due to a market downturn or adverse regulatory action against us. Our ability to borrow could also be impaired by factors that are not specific to us, such as a severe disruption of the financial markets or negative views and expectations about the prospects for the financial services industry as a whole. If we become unable to obtain funds when needed, it could have a material adverse effect on our business and in turn, our consolidated financial condition and results of operations.
The Company is subject to liquidity risk.
Our recurring cash requirements, at the holding company level, primarily consist of interest expense on junior subordinated debentures issued to capital trusts. Holding company cash needs are routinely satisfied by dividends collected from the Bank.
While we expect that the holding company will continue to receive dividends from the Bank sufficient to satisfy holding company cash needs, in the event that the Bank has insufficient resources or is subject to legal or regulatory restrictions on the
payment of dividends, the Bank may be unable to provide dividends or a sufficient level of dividends to the holding company; in that event, the holding company may have insufficient funds to satisfy its obligations as they become due.
Future growth, operating results or regulatory requirements may require us to raise additional capital but that capital may not be available.
We are required by federal and state regulatory authorities to maintain adequate levels of capital to support our operations. To the extent our future operating results erode capital or we elect to expand through loan growth or acquisition, we may be required to raise additional capital. Our ability to raise capital will depend on conditions in the capital markets, which are outside of our
control, and on our financial performance. Accordingly, we cannot be assured of our ability to raise capital when needed or on favorable terms. If we cannot raise additional capital when needed, we will be subject to increased regulatory supervision and the imposition of restrictions on our growth and business. These actions could negatively impact our ability to operate or further expand our operations and may result in increases in operating expenses and reductions in revenues that could have a material effect on our consolidated financial condition and results of operations.
Higher FDIC deposit insurance premiums and assessments could adversely affect our financial condition.
As a result of the Dodd-Frank Act, the FDIC modified its assessment rules so that an institution’s deposit insurance assessment base changed from total deposits to total assets less tangible equity. These assessment base rates range from 2.5 to 9 basis points for Risk Category I banks and up to 45 basis points for Risk Category IV banks. Risk Category II and III banks have assessment base rates ranging from 9 to 33 basis points, respectively. If the risk category of the Bank changes adversely, our FDIC insurance premiums could increase.
Insured depository institution failures, as well as deterioration in banking and economic conditions, could significantly increase the loss provisions of the FDIC, resulting in a decline in the designated reserve ratio of the Deposit Insurance Fund to historical lows. Effective January 1, 2011, the FDIC increased the designated reserve ratio from 1.25% to 2.00%. In addition, the Dodd-Frank Act permanently increased the deposit insurance limit on FDIC deposit insurance coverage to $250,000 per insured depositor, retroactive to January 1, 2008, which may result in even larger losses to the Deposit Insurance Fund.
The FDIC may further increase or decrease the assessment rate schedule in order to manage the Deposit Insurance Fund to prescribed statutory target levels. An increase in the risk category for the Bank or in the assessment rates could have an adverse effect on the Bank's earnings. The FDIC may terminate deposit insurance for an institution if it determines that such institution has engaged in or is engaging in unsafe or unsound banking practices, is in an unsafe or unsound condition, or has violated applicable laws, regulations or orders.
Future offerings of debt or other securities may adversely affect the market price of our stock.
In the future, the Company may attempt to increase its capital resources or, if the Company’s or the Bank’s capital ratios fall below the required minimums, the Company or the Bank could be forced to raise additional capital by making additional offerings of debt or preferred equity securities, including medium-term notes, trust preferred securities, senior or subordinated notes and preferred stock. Upon liquidation, holders of our debt securities and shares of preferred stock and lenders with respect to other borrowings will receive distributions of our available assets prior to the holders of our common stock.
The Company may issue additional shares of common stock which may dilute the ownership and voting power of our shareholders and the book value of our common stock.
The Company is currently authorized to issue up to 30,000,000 shares of common stock, of which 8,112,29210,185,648 shares were outstanding on February 28, 2018.2020. We may decide to issue additional shares of common stock for any corporate purposes. Our Board of Directors has the authority, without action or vote of our shareholders, to issue all or part of the authorized but unissued shares of common stock in public offerings or up to 20% of our outstanding common stock in non-public offerings. Any issuance of shares of our common stock will dilute the percentage ownership interest of our common shareholders and may reduce the market price of our common stock or dilute the book value of our common stock, or both. Holders of our common stock are not entitled to preemptive rights or other protections against dilution.
The Company may lose lower-cost funding sources.
Checking, savings, and money market deposit account balances and other forms of customer deposits can decrease when customers perceive alternative investments, such as the stock market, as providing a better risk/return tradeoff. If customers move
money out of bank deposits and into other investments, the Company could lose a relatively low-cost source of funds, increasing its funding costs and reducing the Company’s net interest income and net income.
There may be changes in accounting policies or accounting standards.
The Company’s accounting policies are fundamental to understanding its financial results and condition. Some of these policies require the use of estimates and assumptions that may affect the value of the Company’s assets or liabilities and financial results. The Company identified its accounting policies regarding the allowance for loan losses, security impairment, goodwill and other intangible assets, and income taxes to be critical because they require management to make difficult, subjective and
complex judgments about matters that are inherently uncertain. Under each of these policies, it is possible that materially different amounts would be reported under different conditions, using different assumptions, or as new information becomes available.
From time to time the Financial Accounting Standards Board (“FASB”) and the SEC change the financial accounting and reporting standards that govern the form and content of the Company’s external financial statements. FASB recently adopted new accounting standards related to fair value accounting, measurement of credit losses on financial instruments and accounting for leases that could materially change the Company’s financial statements in the future. In addition, accounting standard setters and those who interpret the accounting standards (such as the FASB, SEC, banking regulators and the Company’s independent auditors) may change or even reverse their previous interpretations or positions on how these standards should be applied. Changes in financial accounting and reporting standards and changes in current interpretations may be beyond the Company’s control, can be hard to predict and could materially impact how the Company reports its financial results and condition. In certain cases, the Company could be required to apply a new or revised standard retroactively or apply an existing standard differently (also retroactively), which may result in the Company restating prior period financial statements in material amounts.
For example, in 2016, the FASB released a new standard for determining the amount of the allowance for credit losses. The new standard will be effective for the Company for reporting periods beginning January 1, 2023. The new credit loss model will be a significant change from the standard in place today, as it requires the allowance for credit losses to be calculated based on current expected credit losses (commonly referred to as the “CECL model”) rather than losses inherent in the portfolio as of a point in time. Because the new CECL model focuses on the life of the loan concept, more data will be required to support allowance estimates, including that loan portfolios will need to be broken down by origination year. As a result, audit and disclosure requirements will increase. The extent of the increase is under evaluation, but will depend upon the nature and characteristics of the Company’s loan portfolio at the adoption date, and the macroeconomic conditions and forecasts at that date. As a result, the potential financial impact is currently unknown.
In addition, the Committee of Sponsoring Organizations of the Treadway Commission ("COSO") updated the criteria in its Internal-Control Integrated Framework for assessing the effectiveness of internal controls over financial reporting. The Company adopted such updated criteria, which changed the manner in which the Company assesses its internal controls over financial reporting, effective December 31, 2016. In the future, there may be further changes to the criteria used to assess the effectiveness of internal controls, which may result in the Company expending more resources to assess its internal controls.
Failure to maintain effective systems of internal controls over financial reporting could have a material adverse effect on our results of operations and financial condition disclosures.
We must have effective internal controls over financial reporting in order to provide reliable financial reports, to effectively prevent fraud, and to operate successfully as a public company. If we were unable to provide reliable financial reports or prevent fraud, our reputation and operating results would be harmed. As part of our ongoing monitoring of our internal controls over financial reporting, we may discover material weaknesses or significant deficiencies requiring remediation. A "material weakness" is a deficiency, or a combination of deficiencies, in internal controls over finanicalfinancial reporting, such that there is a reasonable possibility that a material misstatement of a company's annual or interim financial statements will not be prevented or detected on a timely basis.
We continually work to improve our internal controls; however, we cannot be certain that these measures will ensure appropriate and adequate controls over our future financial processes and reporting. Any failure to maintain effective controls or to timely implement any necessary improvement of our internal controls could, among other things, result in losses from fraud or error, harm our reputation, or cause investors to lose confidence in our reported financial information, each of which could have a material adverse effect on our results of operations and financial condition and the market value of our common stock.
We may be required to increase our allowance for credit losses as a result of a recent change to an accounting standard.
In 2016, the FASB released a new standard for determining the amount of the allowance for credit losses. The new standard will be effective for the Company for reporting periods beginning January 1, 2020. The new credit loss model will be a significant change from the standard in place today, as it requires the allowance for credit losses to be calculated based on current expected credit losses (commonly referred to as the “CECL model”) rather than losses inherent in the portfolio as of a point in time. Because the new CECL model focuses on the life of the loan concept, more data will be required to support allowance estimates, including that loan portfolios will need to be broken down by origination year. As a result, audit and disclosure requirements will increase. The extent of the increase is under evaluation, but will depend upon the nature and characteristics of the Company’s loan portfolio at the adoption date, and the macroeconomic conditions and forecasts at that date. As a result, the potential financial impact is currently unknown.
The fair value of our investment securities can flucutatefluctuate due to market conditions out of our control.
As of December 31, 2017,2019, approximately 80%77% of our investment securities portfolio was comprised of U.S. government agency and sponsored enterprises obligations, U.S. government agency and sponsored enterprises' mortgage backed securities and municipal securities. As of December 31, 2017,2019, the fair value of our investment portfolio was approximately $217.3$234.0 million. Factors beyond our control can significantly influence the fair value of securities in our portfolio and can cause potential adverse changes to the fair value of these securities. These factors include, but are not limited to, ratings agency downgrades of the securities, defaults by the issuer or with respect to the underlying securities, changes in market interest rates and instability in the credit markets. Any of these mentioned factors, among others, could cause other-than-temporary impairments in future periods and result in a realized loss, which could have a material adverse effect on our business. The process for determining whether
impairment is other-than-temporary usually requires complex, subjective judgements about the future financial performance of the issuer and any collateral underlying the security in order to assess the probability of receiving all contractual principal and interest payments on the security.
Because of changing economic and market conditions affecting issuers and the performance of underlying collateral, we may recognize realized and/or unrealized losses in future periods, which could have an adverse effect on our financial condition and results of operations.
The Company encounters continuous technological change.
The financial services industry is continually undergoing rapid technological change with frequent introductions of new technology-driven products and services. The effective use of technology increases efficiency and enables financial institutions to better serve customers and may reduce costs. The Company’s future success depends, in part, upon its ability to address the needs of its customers by using technology to provide products and services that will satisfy customer demands, as well as to create additional efficiencies in the Company’s operations. Many of the Company’s competitors have substantially greater resources to invest in technological improvements. The Company may not be able to effectively implement new technology-driven products and services or to successfully market these products and services to its customers. Failure to keep pace with technological change affecting the financial services industry could have a material adverse impact on the Company’s business and, in turn, the Company’s financial condition and results of operations.
The Company is subject to operational risk.
We rely on certain external vendors to provide products and services necessary to maintain our day-to-day operations. These third parties provide key components of our business operations such as data processing, recording and monitoring transactions, online banking interfaces and services, Internet connections and network access. While we have selected these third-party vendors carefully, we do not control their actions. Any complications caused by these third parties, including those resulting from disruptions in communication or electrical services provided by a vendor, failure of a vendor to handle current or higher volumes, cyber-attacks and security breaches at a vendor, failure of a vendor to provide services for any reason or poor performance of services, could adversely affect our ability to deliver products and services to our customers and otherwise conduct our business. Financial or operational difficulties of a third-party vendor could also hurt our operations if those difficulties interfere with the vendor’s ability to provide services. Furthermore, our vendors could also be sources of operational and information security risk, including from breakdowns or failures of their own systems or capacity constraints. Replacing these third-party vendors could also create significant delay and expense. Problems caused by external vendors could be disruptive to our operations, which could have a material adverse impact on our business, financial condition and results of operations.
Loss of, or failure to adequately safeguard, confidential or proprietary information may adversely affect the Company’s business, financial operations net income or reputation.
The Company regularly collects, processes, transmits and stores significant amounts of confidential information regarding its customers, employees and others. This information is necessary for the conduct of the Company’s business activities, including the ongoing maintenance of deposit, loan and other account relationships for ourthe Bank's customers, and receiving instructions and affecting transactions for those customers and other users of the Company’sBank’s products and services. In addition to confidential information regarding its customers, employees and others, the Company compiles, processes, transmits and stores proprietary, non-public information concerning its own business, operations, plans and strategies. In some cases, this confidential or proprietary information is collected, compiled, processed, transmitted or stored by third parties on behalf of the Company.
Information security risks have generally increased in recent years because of the proliferation of new technologies and the increased sophistication and activities of perpetrators of cyber-attacks. Although cybersecurity incidents in the financial services industry are on the rise, we have not experienced any losses relating to cyber-attacks or other information security breaches.
However, there can be no assurance that we will not suffer such losses in the future. A failure in or breach of the Company’s operational or information security systems, or those of the Company’s third-party service providers, as a result of cyber-attacks or information security breaches or due to employee error, malfeasance or other disruptions could adversely affect ourits business, result in the disclosure or misuse of confidential or proprietary information, damage ourits reputation, increase ourits costs and/or cause losses. The Company may also be required to expend significant additional resources to modify its protective measures, to investigate and remediate vulnerabilities or other exposures or to make required notifications or disclosure. As a result, cyber security and the continued development and enhancement of the controls and processes designed to protect the Company’s systems, computers, software, data and networks from attack, damage or unauthorized access are a very high priority for the Company.
If this confidential or proprietary information were to be mishandled, misused or lost, the Company could be exposed to significant regulatory consequences, reputational damage, civil litigation and financial loss. Mishandling, misuse or loss of this confidential or proprietary information could occur, for example, if the confidential or proprietary information were erroneously provided to parties who are not permitted to have the information, either by fault of the systems or employees of the Company,
or the systems or employees of third parties which have collected, compiled, processed, transmitted or stored the information on the Company’s behalf, where the information is intercepted or otherwise inappropriately taken by third parties or where there is a failure or breach of the network, communications or information systems which are used to collect, compile, process, transmit or store the information.
AlthoughThe Company continues to implement protections and adopt procedures to address the risks posed by the current information technology environment. For example, the Company employshas introduced and continues to introduce systems and software to prevent cyber incidents and continues to review and strengthen its defenses to cybersecurity threats through the use of various services, programs and outside vendors. The Company also continually reviews and revises its cybersecurity policy to ensure that it remains up to date. In the event that the Company experiences a varietymaterial cybersecurity incident or identifies a material cybersecurity threat, the Company will make all reasonable efforts to properly disclose it in a timely fashion. However, it is impossible for the Company to know when or if such incidents may arise or the business impact of physical, proceduralany such incident.
As a result of such risks, the Company has significantly increased the resources dedicated to this effort and technological safeguardsbelieves that further increases may be required in the future, in anticipation of increases in the sophistication and persistency of such attacks. The Company has and is likely to protectcontinue to incur additional costs in preparing its infrastructure and maintaining it to resist any such attacks. In addition to personnel dedicated to overseeing the infrastructure and systems to defend against cybersecurity incidents, senior management is regularly briefed on issues, preparedness and any incidents requiring response. At its regularly scheduled meetings, the Audit Committee of the Board of Directors and the Board of Directors are periodically briefed and brought up to date on cybersecurity matters.
Notwithstanding the precaution we need to take to safeguard this confidential and proprietary information from mishandling, misuse or loss, these safeguardsprecautions do not provide absolute assurance that mishandling, misuse or loss of the information will not occur, or that if mishandling, misuse or loss of the information did occur, those events would be promptly detected and addressed. Additionally, as informationNor is there any guarantee that the Company's cybersecurity efforts will be successful in discovering or preventing a security risksbreach, and cyber threats continueany failure or failures to evolve,safeguard against such security breaches may have a material adverse impact on the Company’s business, financial results, or reputation
Possible replacement of the LIBOR benchmark interest rate may have an impact on our business, financial condition or results of operations.
On July 27, 2017, the Financial Conduct Authority (FCA), a regulator of financial services firms in the United Kingdom, announced that it intends to stop persuading or compelling banks to submit LIBOR rates after 2021. The FCA and submitting LIBOR banks have indicated they will support the LIBOR indices through 2021 to allow for an orderly transition to an alternative reference rate. In the United States, efforts to identify a set of alternative U.S. dollar reference interest rates include proposals by the Alternative Reference Rates Committee of the Federal Reserve Board. Other financial services regulators and industry groups are evaluating the possible phase-out of LIBOR and the development of alternate reference rate indices or reference rates. Some of our assets and liabilities are indexed to LIBOR. We are evaluating the potential impact of the possible replacement of the LIBOR benchmark interest rate, but are not able to predict whether LIBOR will cease to be available after 2021, whether the alternative rates the Federal Reserve Board proposes to publish will become market benchmarks in place of LIBOR, or what the impact of such a transition will have on our business, financial condition, or results of operations. Reform of, or the replacement or phasing out of, LIBOR and proposed regulation of LIBOR and other “benchmarks” may materially adversely affect the amount of interest paid on any LIBOR-based loans, investment securities and borrowings of the Company may be required to expend additional resources to continue to enhance its information security measures and/or to investigate and remediate any information security vulnerabilities.the Company’s business, financial condition and results of operations.
We may not be able to detect money laundering and other illegal or improper activities fully or on a timely basis, which could expose us to additional liability and could have a material adverse effect on us.
We are required to comply with anti-money laundering, anti-terrorism and other laws and regulations in the United States. These laws and regulations require us, among other things, to adopt and enforce “know-your-customer” policies and procedures and to report suspicious and large transactions to applicable regulatory authorities. These laws and regulations have become increasingly complex and detailed, require improved systems, sophisticated monitoring and compliance personnel and have become the subject of enhanced government supervision.
While we have adopted policies and procedures aimed at detecting and preventing the use of our banking network for money laundering and related activities, those policies and procedures may not completely eliminate instances in which we may be used by customers to engage in money laundering and other illegal or improper activities. To the extent we fail to fully comply with applicable laws and regulations, the FDIC and/or with other banking agencies have the authority to impose fines and other penalties on us. In addition, our business and reputation could suffer if customers use our banking network for money laundering or illegal or improper purposes. At its regularly scheduled meetings, the Audit Committee of the Board of Directors and the Board of Directors are periodically briefed and brought up to date on money laundering and related matters.
There may be claims and litigation.
From time to time as part of the Company’s normal course of business, customers make claims and take legal actions against the Company based on actions or inactions of the Company. If such claims and legal actions are not resolved in a manner favorable to the Company, they may result in financial liability and/or adversely affect the market perception of the Company and its products and services. This may also impact customer demand for the Company’s products and services. Any financial liability or reputation damage could have a material adverse effect on the Company’s business, which, in turn, could have a material adverse effect on its financial condition and results of operations.
SevereOur financial and operating performance could be adversely impacted by disruptions to business conducted, or declines in property values, in northern and central New Jersey and the New York City metropolitan area, caused by severe weather, changes in climate and other natural disasters, acts of terrorism, public health crises and other external events could significantly impact our business.events.
A significant portion of our primary markets are located nearmarket includes counties in New Jersey with extensive coastal watersregions. These areas may be vulnerable to flooding, wind or other damage resulting from severe weather, such as hurricanes and other natural disasters, or changes in climate. As a result of a major natural disaster or changes in climate, our borrowers may suffer uninsured property damage, experience interruption of their businesses or lose their jobs, which may negatively impact the ability of these borrowers to make deposits with us or repay their loans or impair the values of collateral securing our loans, any of which could generate naturally occurring severe weather,result in losses and increased provisions for credit losses. Our operations may also be disrupted by the occurrence of natural disasters through interference with communications, including the interruption or in response to climate change, thatloss of our computer systems, which could have a significant impact oninterfere with our ability to conduct business. Additionally, surroundinggather deposits and originate loans, as well as through the destruction of facilities and our operational, financial and management information systems.
In addition, our primary market includes areas including New Jersey, may bethat are central targets forof potential acts of terrorism againstand the United States. Suchconcentration of our retail and commercial banking activities makes our business susceptible to disruptions resulting from public health crises and other external events, including trade disruptions caused by increased tariffs. These and other catastrophic events could affect the stability of our deposit base and impair the ability of borrowers to repay outstanding loans impair the valueas a result of collateral securing loans, cause significant property damage,quarantines, business closures, shortages in labor or raw materials and overall economic instability, which could result in the loss of revenue and/or cause additional expenses.revenue. Although the Company has established disaster recovery policies and procedures, the occurrence of any such event in the future could have a material adverse effect on our business, which, in turn, could have a material adverse effect on our financial condition and results of operations. For example, the outbreak of a strain of the Novel Coronavirus (COVID-19) originating from Wuhan, China has caused global disruption in the financial markets and our primary market is increasingly threatened by the potential spread of this virus. At this time, the extent to which the Coronavirus may impact our financial condition or results of operations is uncertain.
Item 1B. Unresolved Staff Comments.
Not applicable.
Item 2. Properties.
We currently operate 1826 bank branch offices in New Jersey, including the Bank’s main office in Cranbury, New Jersey. In addition, there is an Operations Center which is leased in Cranbury, New Jersey. The following table provides certain information with respect to our bank branch offices as of February 28, 2018:29, 2020:
| | | Location | | Leased or
Owned | | Original Year Leased or Acquired | | Year of Lease
Expiration | | Leased or
Owned | | Original Year Leased or Acquired | | Year of Lease
Expiration |
| Main Office | | | | | | | | | | | | |
2650 Route 130
Cranbury, New Jersey | | Leased | | 1989 | | 2027 | | Leased | | 1989 | | 2027 |
| Village Office | | | | | | | | | | | | |
74 North Main Street
Cranbury, New Jersey | | Owned | | 2005 | | — | | Owned | | 2005 | | — |
| Plainsboro Office | | | | | | | | | | | | |
Plainsboro Village Center 11 Shalks Crossing Road Plainsboro, New Jersey | | Leased | | 1998 | | 2021 | | Leased | | 1998 | | 2021 |
| Hamilton Square Office | | | | | | | | | | | | |
3659 Nottingham Way Hamilton, New Jersey | | Leased | | 1999 | | 2024 | | Leased | | 1999 | | 2024 |
| Princeton Office | | | | | | | | | | | | |
The Windrows at Princeton Forrestal 2000 Windrow Drive Princeton, New Jersey | | Leased | | 2001 | | 2018 | | Leased | | 2001 | | 2020 |
| Perth Amboy Office | | | | | | | | | | | | |
145 Fayette Street Perth Amboy, New Jersey | | Leased | | 2003 | | 2019 | | Leased | | 2003 | | 2026 |
| Jamesburg Office | | | | | | | | | | | | |
1 Harrison Street Jamesburg, New Jersey | | Owned | | 2002 | | — | | Owned | | 2002 | | — |
| Fort Lee Office | | | | | | | | | | | | |
180 Main Street Fort Lee, New Jersey | | Leased | | 2006 | | 2019 | | Leased | | 2006 | | 2024 |
| Hightstown Office | | | | | | | | | | | | |
140 Mercer Street Hightstown, New Jersey | | Leased | | 2007 | | 2024 | | Leased | | 2007 | | 2024 |
| Lawrenceville Property | | | | | | | | | | | | |
150 Lawrenceville-Pennington Road Lawrenceville, New Jersey | | Owned | | 2009 | | — | | Owned | | 2009 | | — |
| South River Operations Center | | |
1246 South River Road, Bldg. 2 Cranbury, New Jersey | | Leased | | 2010 | | 2020 | | Leased | | 2010 | | 2025 |
| Rocky Hill Office | | | | | | | | | | | | |
995 Route 518 Skillman, New Jersey | | Owned | | 2011 | | — | | Owned | | 2011 | | — |
| Hopewell Office | | | | | | | | | | | | |
86 East Broad Street Hopewell, New Jersey | | Owned | | 2011 | | — | | Owned | | 2011 | | — |
| Hillsborough Office | | | | | | | | | | | | |
32 New Amwell Road Hillsborough, New Jersey | | Owned | | 2011 | | — | | Owned | | 2011 | | — |
| Rumson Office | | | | | | | | | | | | |
20 Bingham Avenue
Rumson, New Jersey | | Leased | | 2014 | | 2026 | | Leased | | 2014 | | 2026 |
| | | Location | | Leased or
Owned | | Original Year Leased or Acquired | | Year of Lease
Expiration | | Leased or
Owned | | Original Year Leased or Acquired | | Year of Lease
Expiration |
| Fair Haven Office | | | | | | | | | | | | |
636 River Road
Fair Haven, New Jersey | | Leased | | 2014 | | 2022 | | Leased | | 2014 | | 2022 |
| Asbury Park Office | | | | | | | | | | | | |
511 Cookman Avenue
Asbury Park, New Jersey | | Owned | | 2014 | | — | | Owned | | 2014 | | — |
| Shrewsbury Office | | | | | | | | | | | | |
500 Broad Street
Shrewsbury, New Jersey | | Leased | | 2014 | | 2031 | | Leased | | 2014 | | 2031 |
| Little Silver Office | | | | | | | | | | | | |
| 517 Prospect Avenue Little Silver, New Jersey | | Leased | | 2015 | | 2019 | | Leased | | 2015 | | 2024 |
| Freehold Office | | |
3441 US Highway 9 Freehold, New Jersey | | | Leased | | 2018 | | 2022 |
| Neptune City Office | | |
118 3rd Avenue Neptune City, New Jersey | | | Leased | | 2018 | | 2022 |
| Long Branch | | |
444 Ocean Boulevard North Long Branch, New Jersey | | | Leased | | 2019 | | 2024 |
| Route 37 | | |
1216 Route 37 East Toms River, New Jersey | | | Leased | | 2019 | | 2024 |
| Hooper Avenue | | |
1012 Hooper Avenue Toms River, New Jersey | | | Owned | | 2019 | | — |
| Downtown | | |
201 Main Street Toms River, New Jersey | | | Leased | | 2019 | | 2020(1) |
| Jackson | | |
1130 East Veterans Highway Jackson, New Jersey | | | Leased | | 2019 | | 2026 |
| Manahawkin | | |
280 Route 72 East Manahawkin, New Jersey | | | Leased | | 2019 | | 2023 |
Management believes the foregoing facilities are suitable for the Company’s and the Bank’s present and projected operations.
(1) The current lease period expires on December 31, 2020 and the lease involves two lease extensions for a period of one year each. The Company expects to exercise the lease extension option.
Item 3. Legal Proceedings.
The Company may, in the ordinary course of business, become a party to litigation involving collection matters, contract claims and other legal proceedings relating to the conduct of its business. Management is not aware of any material pending legal proceedings against the Company which, if determined adversely, would have a material adverse effect on the Company’s financial condition or results of operations.
Item 4. Mine Safety Disclosures.
Not applicable.
PART II
Item 5. Market for Registrant’s Common Equity, Related Shareholder Matters and Issuer Purchases of Equity Securities.
The common stock of the Company trades on the Nasdaq Global Market under the trading symbol, FCCY. The following sets forth, for the periods indicated, the reported high and low sale prices on known trades and cash dividends declared per share by the Company.
|
| | | | | | | | | | | |
| | High | | Low | | Dividend Per Share |
| 2017 | | | | | |
| First Quarter | $ | 20.80 |
| | $ | 15.75 |
| | $ | 0.05 |
|
| Second Quarter | 18.80 |
| | 16.75 |
| | 0.05 |
|
| Third Quarter | 18.55 |
| | 16.50 |
| | — |
|
| Fourth Quarter | 18.50 |
| | 17.10 |
| | 0.06 |
|
| | | | | | |
| 2016 | | | | | |
| First Quarter | $ | 13.30 |
| | $ | 11.27 |
| | $ | — |
|
| Second Quarter | 12.85 |
| | 11.71 |
| | — |
|
| Third Quarter | 13.78 |
| | 11.78 |
| | 0.05 |
|
| Fourth Quarter | 20.85 |
| | 13.25 |
| | 0.05 |
|
Holders
“FCCY.” On February 28, 2018,2020, there were approximately 277 registered342 shareholders of record.
Performance
The following graph compares the cumulative total return on a hypothetical $100 investment made on December 31, 20122014 in (a) the Company's common stock; (b) the SNL US Bank & Thrift Index; (c) the SNL US Bank $500M-$1B Index; and (d) the SNL US Bank $1B-$5B Index. The graph is calculated assuming that all dividends are reinvested during the relevant periods. The graph shows how a $100 investment would increase or decrease in value over time, based on dividends (stock or cash) and increases or decreases in the market price of the stock. The performance graph shall not be deemed “filed” for purposes of Section 18 of the Exchange Act or incorporated by reference into any filings of the Company under the Securities Act of 1933, as amended, or the Exchange Act, except as expressly set forth by specific reference in such filing.
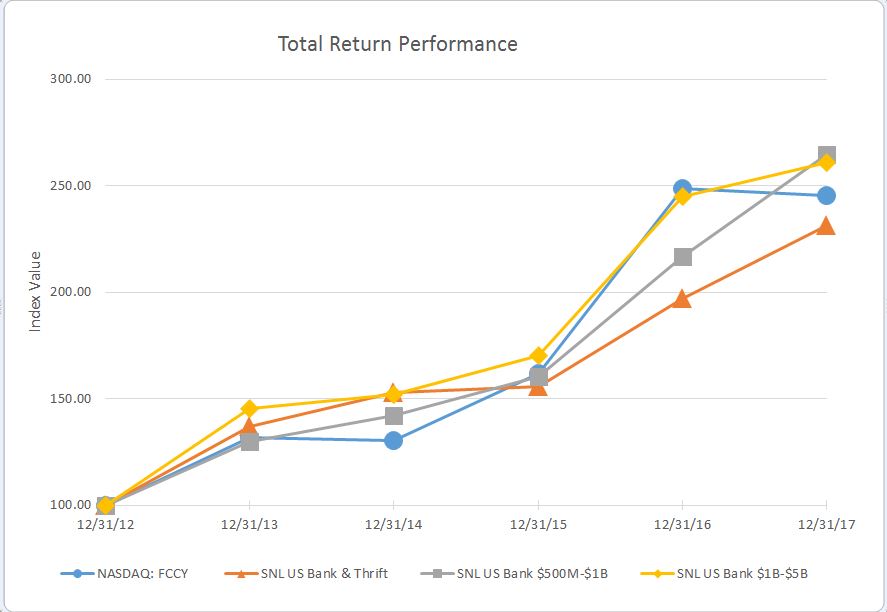
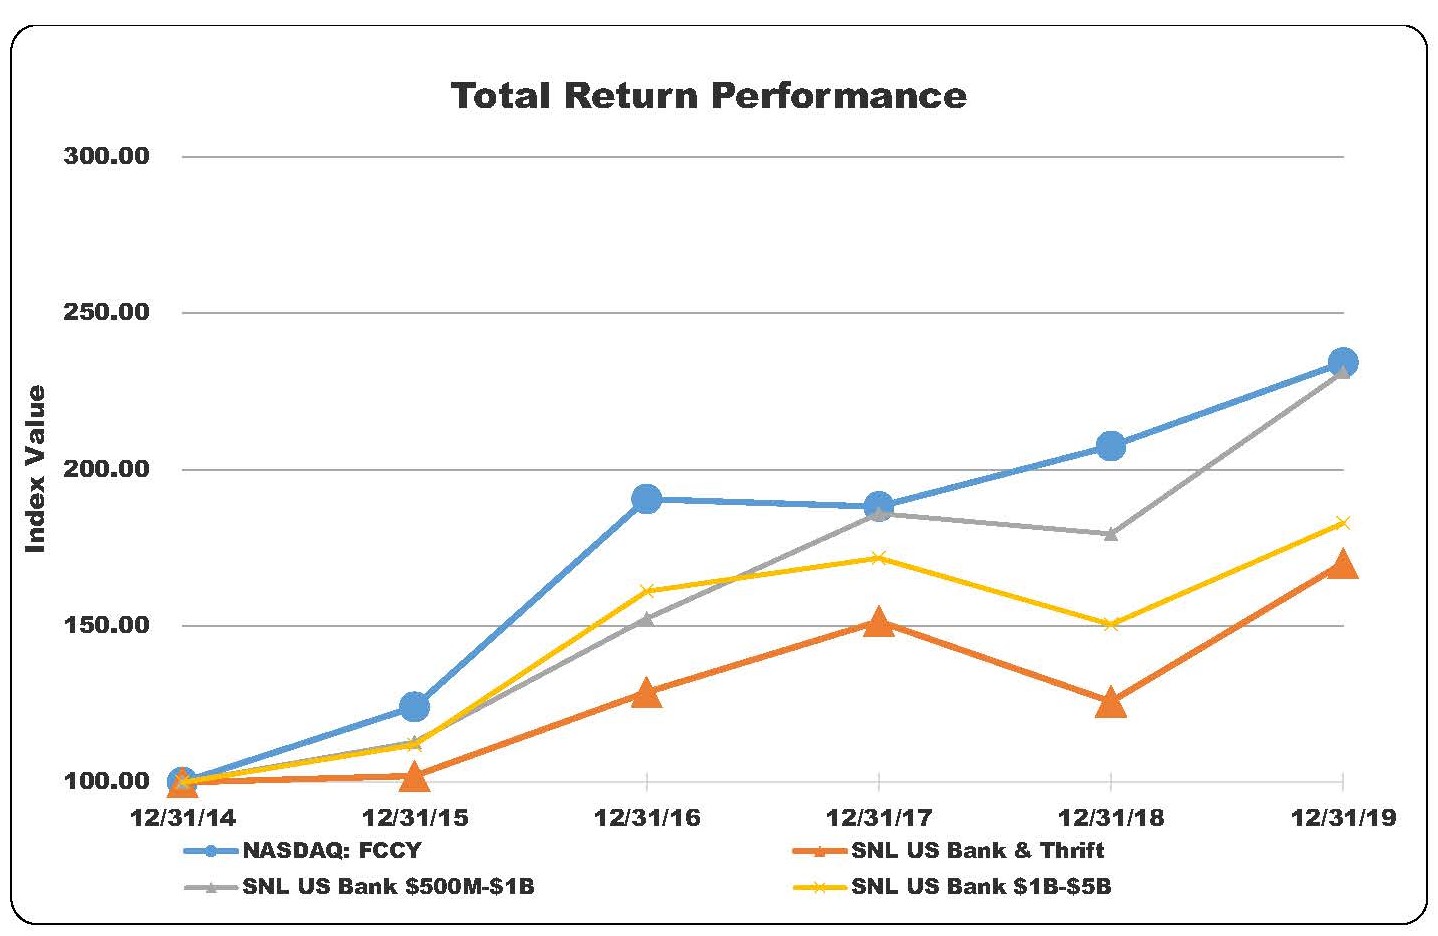
| | | | | Period Ending | | | Period Ending | |
| Index | 12/31/2012 |
| 12/31/2013 |
| 12/31/2014 |
| 12/31/2015 |
| 12/31/2016 |
| 12/31/2017 |
| 12/31/2014 |
| 12/31/2015 |
| 12/31/2016 |
| 12/31/2017 |
| 12/31/2018 |
| 12/31/2019 |
|
| 1st Constitution Bancorp | 100.00 |
| 131.85 |
| 130.53 |
| 161.98 |
| 248.72 |
| 245.59 |
| 100.00 |
| 124.09 |
| 190.54 |
| 188.14 |
| 207.44 |
| 234.13 |
|
| SNL US Bank & Thrift | 100.00 |
| 136.92 |
| 152.85 |
| 155.94 |
| 196.87 |
| 231.49 |
| 100.00 |
| 102.02 |
| 128.8 |
| 151.45 |
| 125.81 |
| 170.04 |
|
| SNL US Bank $500M-$1B | 100.00 |
| 129.67 |
| 142.26 |
| 160.57 |
| 216.81 |
| 264.51 |
| 100.00 |
| 112.87 |
| 152.4 |
| 185.93 |
| 179.45 |
| 231.13 |
|
| SNL US Bank $1B-$5B | 100.00 |
| 145.41 |
| 152.04 |
| 170.20 |
| 244.85 |
| 261.04 |
| 100.00 |
| 111.94 |
| 161.04 |
| 171.69 |
| 150.42 |
| 182.85 |
|
On December 31, 2017,2019, the last reported sale price of the Company's common stock was $18.30.$22.13.
In the past, in lieu of cash dividends to common shareholders, the Company (and its predecessor, the Bank) paid common stock dividends every year from 1993 to 2016, except 2014 due to the acquisition of Rumson-Fair Haven Bank and Trust Company, a New Jersey state commercial bank ("Rumson").
On September 15, 2016, the Board of Directors of the Company declared a cash dividend of $0.05 per common share. The cash dividend was paid on October 21, 2016 to all shareholders of record as of the close of business on September 28, 2016. This action represented the first cash dividend declared by the Company on its common shares.
The timing and the amount of the payment of future cash dividends, if any, on the Company's common shares will be at the discretion of the Company's Board of Directors and will be determined after consideration of various factors, including the level of earnings, cash requirements, regulatory capital and financial condition.
In addition, please referDividend Policy
The Company began declaring and paying cash dividends on its common stock in September 2016 and has declared and paid a cash dividend each quarter since then. Most recently, the Company paid a cash dividend of $0.09 per share of common stock on February 14, 2020, representing an increase of 20% compared to the discussion underdividend of $0.075 per share of common stock paid on November 5, 2019. Although the heading "Shareholders’ EquityCompany intends to continue to pay comparable cash dividends, the timing and Dividends" under Item 7. "Management’s Discussionthe amount of the payment of future cash dividends, if any, on the Company's common stock will be at the discretion of the Company's Board of Directors and Analysiswill be determined after consideration of Financial Conditionvarious factors, including the level of earnings, cash requirements, regulatory capital and Results of Operations" for additional restrictions on cash dividends.
financial condition.
Issuer Purchases of Equity Securities
On January 21, 2016, the Board of Directors of the Company authorized a new common stock repurchase program. Under the new common stock repurchase program, the Company may repurchase in open market or privately negotiated transactions up to five (5%) percent of its common stock outstanding on the date of approval of the stock repurchase program, which limitations will be adjusted for any future stock dividends. The Company's common stock repurchase program covers a maximum of 396,141 shares of common stock of the Company, representing 5% of the outstanding common stock of the Company on January 21, 2016, as adjusted for subsequent common stock dividends. There were no repurchases under the plan during 2017.2019.
|
| | | | | | | | | | | | | | |
| Period | | Total Number of Shares Purchased | | Average Price Paid Per Share | | Total Number of Shares Purchased As Part of Publicly Announced Program | | Maximum Number of Shares That May Yet be Purchased Under the Program |
| Beginning | Ending | | | | | | | | |
October 1, 20172019 | October 31, 20172019 | | — |
| | $ | — |
| | — |
| | 394,141 |
|
November 1, 20172019 | November 30, 20172019 | | — |
| | — |
| | — |
| | 394,141 |
|
December 1, 20172019 | December 31, 20172019 | | — |
| | — |
| | — |
| | 394,141 |
|
| Total | | — |
| | $ | — |
| | — |
| | 394,141 |
|
Unregistered Sales of UnregisteredEquity Securities
None.
Equity Compensation Plan Information
The following table shows information at December 31, 2017 for all equity compensation plans under which shares of our common stock may be issued.
|
| | | | | | | | | |
| | Number of Securities to be Issued Upon Exercise of Outstanding Options | | Weighted-Average Exercise Price of Outstanding Options | | Number of Securities Remaining Available for Future Issuance Under Equity Compensation Plans (excluding securities reflected in column (a)) |
| Plan Category | (a) | | (b) | | (c) |
| Equity Compensation Plans Approved by Security Holders | 142,005 |
| | $ | 7.86 |
| | 127,736 |
|
| Equity Compensation Plans Not Approved by Security Holders | — |
| | — |
| | — |
|
| Total | — |
| | $ | 7.86 |
| | 127,736 |
|
Item 6. Selected Financial Data
| | | | | As of and for the years ended December 31, | | As of and for the years ended December 31, |
| (In thousands, except per share data) | | 2017 | | 2016 | | 2015 | | 2014 | | 2013 | | 2019 | | 2018 | | 2017 | | 2016 | | 2015 |
| Summary earnings: | | | | | | | | | | | | | | | | | | | | |
| Interest income | | $ | 41,663 |
| | $ | 39,135 |
| | $ | 39,323 |
| | $ | 35,888 |
| | $ | 27,979 |
| | $ | 60,090 |
| | $ | 51,473 |
| | $ | 41,663 |
| | $ | 39,135 |
| | $ | 39,323 |
|
| Interest expense | | 5,498 |
| | 5,158 |
| | 4,636 |
| | 4,658 |
| | 4,255 |
| | 12,754 |
| | 8,041 |
| | 5,498 |
| | 5,158 |
| | 4,636 |
|
| Net interest income | | 36,165 |
| | 33,977 |
| | 34,687 |
| | 31,230 |
| | 23,724 |
| | 47,336 |
| | 43,432 |
| | 36,165 |
| | 33,977 |
| | 34,687 |
|
| Provision for loan losses | | 600 |
| | (300 | ) | | 1,100 |
| | 5,750 |
| | 1,077 |
| |
| Net interest income after provision for loan losses | | 35,565 |
| | 34,277 |
| | 33,587 |
| | 25,480 |
| | 22,647 |
| |
| Provision (credit) for loan losses | | | 1,350 |
| | 900 |
| | 600 |
| | (300 | ) | | 1,100 |
|
| Net interest income after provision (credit) for loan losses | | | 45,986 |
| | 42,532 |
| | 35,565 |
| | 34,277 |
| | 33,587 |
|
| Non-interest income | | 8,240 |
| | 6,922 |
| | 6,586 |
| | 6,814 |
| | 5,827 |
| | 8,237 |
| | 7,918 |
| | 8,240 |
| | 6,922 |
| | 6,586 |
|
| Non-interest expense | | 31,006 |
| | 27,291 |
| | 27,447 |
| | 26,865 |
| | 20,409 |
| | 35,549 |
| | 34,085 |
| | 31,006 |
| | 27,291 |
| | 27,447 |
|
| Income before income tax expense | | 12,799 |
| | 13,908 |
| | 12,726 |
| | 5,429 |
| | 8,065 |
| | 18,674 |
| | 16,365 |
| | 12,799 |
| | 13,908 |
| | 12,726 |
|
| Income tax expense | | 5,871 |
| | 4,623 |
| | 4,062 |
| | 1,073 |
| | 2,285 |
| | 5,040 |
| | 4,317 |
| | 5,871 |
| | 4,623 |
| | 4,062 |
|
| Net income | | $ | 6,928 |
| | $ | 9,285 |
| | 8,664 |
| | $ | 4,356 |
| | $ | 5,780 |
| | $ | 13,634 |
| | $ | 12,048 |
| | 6,928 |
| | $ | 9,285 |
| | $ | 8,664 |
|
| Per share data: | | | | | | | | | | | | | | | | | | | | |
| Basic earnings per share | | $ | 0.86 |
| | $ | 1.17 |
| | $ | 1.10 |
| | $ | 0.56 |
| | $ | 0.88 |
| |
| Diluted earnings per share | | 0.83 |
| | 1.14 |
| | 1.07 |
| | 0.55 |
| | 0.86 |
| |
| Earnings per share - basic | | | $ | 1.54 |
| | $ | 1.45 |
| | $ | 0.86 |
| | $ | 1.17 |
| | $ | 1.10 |
|
| Earnings per share - diluted | | | 1.53 |
| | 1.40 |
| | 0.83 |
| | 1.14 |
| | 1.07 |
|
| Cash dividends declared | | 0.16 |
| | 0.10 |
| | — |
| | — |
| | — |
| | 0.30 |
| | 0.26 |
| | 0.16 |
| | 0.10 |
| | — |
|
| Book value end-of-period (1) | | 13.81 |
| | 13.11 |
| | 12.72 |
| | 12.21 |
| | 11.36 |
| | 16.74 |
| | 14.77 |
| | 13.81 |
| | 13.11 |
| | 12.72 |
|
| | | | | | | | | | | | | | | | | | | | | |
| Basic weighted average shares outstanding | | 8,049,981 |
| | 7,962,121 |
| | 7,901,278 |
| | 7,366,955 |
| | 6,271,989 |
| | 8,875,237 |
| | 8,320,718 |
| | 8,049,981 |
| | 7,962,121 |
| | 7,901,278 |
|
| Common stock equivalents (dilutive) | | 262,803 |
| | 215,318 |
| | 174,474 |
| | 368,348 |
| | 313,599 |
| | 58,234 |
| | 272,791 |
| | 262,803 |
| | 215,318 |
| | 174,474 |
|
| Fully diluted weighted average shares outstanding | | 8,312,784 |
| | 8,177,439 |
| | 8,075,752 |
| | 7,735,303 |
| | 6,585,588 |
| | 8,933,471 |
| | 8,593,509 |
| | 8,312,784 |
| | 8,177,439 |
| | 8,075,752 |
|
| Balance sheet data (at period end): | | | | | | | | | | | | | | | | | | | | |
| Total assets | | $ | 1,079,274 |
| | $ | 1,038,213 |
| | $ | 967,991 |
| | $ | 956,779 |
| | $ | 742,325 |
| | $ | 1,586,262 |
| | $ | 1,177,833 |
| | $ | 1,079,274 |
| | $ | 1,038,213 |
| | $ | 967,991 |
|
| Securities, available for sale | | 105,458 |
| | 103,794 |
| | 91,422 |
| | 80,161 |
| | 99,199 |
| | 155,782 |
| | 132,222 |
| | 105,458 |
| | 103,794 |
| | 91,422 |
|
| Investment securities | | 110,267 |
| | 126,810 |
| | 123,261 |
| | 143,638 |
| | 152,817 |
| | 76,620 |
| | 79,572 |
| | 110,267 |
| | 126,810 |
| | 123,261 |
|
| Total loans | | 789,906 |
| | 724,808 |
| | 682,121 |
| | 654,297 |
| | 373,336 |
| | 1,216,028 |
| | 883,164 |
| | 789,906 |
| | 724,808 |
| | 682,121 |
|
| Allowance for loan losses | | (8,013 | ) | | (7,494 | ) | | (7,560 | ) | | (6,925 | ) | | (7,039 | ) | | (9,271 | ) | | (8,402 | ) | | (8,013 | ) | | (7,494 | ) | | (7,560 | ) |
| Total deposits | | 922,006 |
| | 834,516 |
| | 786,757 |
| | 817,761 |
| | 638,552 |
| | 1,277,362 |
| | 950,672 |
| | 922,006 |
| | 834,516 |
| | 786,757 |
|
| Shareholders' equity | | 111,653 |
| | 104,801 |
| | 95,960 |
| | 87,110 |
| | 68,357 |
| | 170,578 |
| | 127,085 |
| | 111,653 |
| | 104,801 |
| | 95,960 |
|
| Common cash dividends | | 1,690 |
| | 399 |
| | — |
| | — |
| | — |
| | 2,593 |
| | 2,120 |
| | 1,289 |
| | 800 |
| | — |
|
| Selected performance ratios: | | | | | | | | | | | | | | | | | | | | |
| Return on average total assets | | 0.67 | % | | 0.93 | % | | 0.89 | % | | 0.46 | % | | 0.72 | % | | 1.06 | % | | 1.06 | % | | 0.67 | % | | 0.93 | % | | 0.89 | % |
| Return on average shareholders' equity | | 6.36 | % | | 9.21 | % | | 9.49 | % | | 5.34 | % | | 8.73 | % | | 9.87 | % | | 10.11 | % | | 6.36 | % | | 9.21 | % | | 9.49 | % |
| Dividend payout ratio (2) | | 18.59 | % | | 8.62 | % | | n/a |
| | n/a |
| | n/a |
| | 19.02 | % | | 17.60 | % | | 18.61 | % | | 8.62 | % | | n/a |
|
| Net interest margin | | 3.81 | % | | 3.70 | % | | 3.90 | % | | 3.84 | % | | 3.44 | % | | 4.00 | % | | 4.09 | % | | 3.81 | % | | 3.70 | % | | 3.90 | % |
| Non-interest income to average assets | | 0.80 | % | | 0.69 | % | | 0.67 | % | | 0.61 | % | | 0.73 | % | | 0.64 | % | | 0.70 | % | | 0.80 | % | | 0.69 | % | | 0.67 | % |
| Non-interest expenses to average assets | | 3.01 | % | | 2.72 | % | | 2.81 | % | | 2.89 | % | | 2.67 | % | | 2.77 | % | | 3.00 | % | | 3.01 | % | | 2.72 | % | | 2.81 | % |
| | | | | | | | | | | | | | | | | | | | | |
| Nonperforming loans to total loans | | 0.90 | % | | 0.72 | % | | 0.88 | % | | 0.74 | % | | 1.69 | % | | 0.37 | % | | 0.75 | % | | 0.90 | % | | 0.72 | % | | 0.88 | % |
| Nonperforming assets to total assets | | 0.66 | % | | 0.52 | % | | 0.72 | % | | 1.11 | % | | 1.14 | % | | 0.32 | % | | 0.77 | % | | 0.66 | % | | 0.52 | % | | 0.72 | % |
| Allowance for loan losses to nonperforming loans | | 112.64 | % | | 144.17 | % | | 125.59 | % | | 143.08 | % | | 111.34 | % | | 206.16 | % | | 127.69 | % | | 112.64 | % | | 144.17 | % | | 125.59 | % |
| Allowance for loan losses to total loans | | 1.01 | % | | 1.03 | % | | 1.11 | % | | 1.06 | % | | 1.89 | % | | 0.76 | % | | 0.95 | % | | 1.01 | % | | 1.03 | % | | 1.11 | % |
| Net recoveries/(charge-offs) to average loans | | (0.01 | )% | | 0.03 | % | | (0.07 | )% | | (1.04 | )% | | (0.30 | )% | |
| Net recoveries (charge-offs) to average loans | | | (0.05 | )% | | (0.06 | )% | | (0.01 | )% | | 0.03 | % | | (0.07 | )% |
|
| | | | | | | | | | | | | | | |
| | | As of and for the years ended December 31, |
| (In thousands, except per share data) | | 2019 | | 2018 | | 2017 | | 2016 | | 2015 |
| Liquidity and capital ratios: | | | | | | | | | | |
| Average loans to average deposits | | 90.64 | % | | 87.28 | % | | 81.80 | % | | 84.58 | % | | 83.39 | % |
| Total shareholders' equity to total assets | | 10.75 | % | | 10.79 | % | | 10.35 | % | | 10.09 | % | | 9.91 | % |
| Total capital to risk-weighted assets | | 11.71 | % | | 13.17 | % | | 12.84 | % | | 13.24 | % | | 13.08 | % |
| Tier 1 capital to risk-weighted assets | | 11.03 | % | | 12.39 | % | | 12.02 | % | | 12.41 | % | | 12.18 | % |
| Common equity tier 1 capital ratio to risk-weighted assets | | 9.72 | % | | 10.72 | % | | 10.19 | % | | 10.40 | % | | 10.03 | % |
| Tier 1 leverage ratio | | 10.55 | % | | 11.73 | % | | 11.23 | % | | 10.93 | % | | 10.80 | % |
(1) Book value at end-of-period calculated by dividing shareholders' equity by number of outstanding common shares at end of period.
(2) Dividend payout ratio calculated by dividing dividends declared during the year by net income.
|
| | | | | | | | | | | | | | | |
| | | As of and for the years ended December 31, |
| (In thousands, except per share data) | | 2017 | | 2016 | | 2015 | | 2014 | | 2013 |
| Liquidity and capital ratios: | | | | | | | | | | |
| Average loans to average deposits | | 81.80 | % | | 84.58 | % | | 83.39 | % | | 69.15 | % | | 57.15 | % |
| Total shareholders' equity to total assets | | 10.35 | % | | 10.09 | % | | 9.91 | % | | 9.1 | % | | 9.21 | % |
| Total capital to risk-weighted assets | | 12.84 | % | | 13.24 | % | | 13.08 | % | | 12.28 | % | | 19.29 | % |
| Tier 1 capital to risk-weighted assets | | 12.02 | % | | 12.41 | % | | 12.18 | % | | 11.41 | % | | 18.04 | % |
| Common equity tier 1 capital ratio to risk-weighted assets | | 10.19 | % | | 10.4 | % | | 10.03 | % | | n/a |
| | n/a |
|
| Tier 1 leverage ratio | | 11.23 | % | | 10.93 | % | | 10.8 | % | | 9.53 | % | | 10.89 | % |
Item 7. Management’s Discussion and Analysis of Financial Condition and Results of Operations.
Overview
The following discussion and analysis is intended to provide information about the financial condition and results of operations of 1st Constitution Bancorpthe Company and its subsidiaries on a consolidated basis and should be read in conjunction with the consolidated financial statements and the related notes and supplemental financial information appearing elsewhere in this report.
1st Constitution Bancorp (the "Company"), formedThe Company, which was incorporated in 1999, is the parent holding company for 1st1st Constitution Bank, (the "Bank"), a commercial bank formed in 1989 that provides a wide range of financial services to consumers, businesses and government entities. The Bank's branch network primarily serves Central New Jersey and offers consumer and business banking products delivered through a network of well-trained staff dedicated to a positive client experience and enhancing shareholder value. Much of the Company's lending activity is in Northern and Central New Jersey and the New York metropolitan area. For purposes of the discussion below, 1st Constitution Capital Trust II (Trust II), a subsidiary of the Company, is not included in the Company's consolidated financial statements as it is a variable interest entity and the Company is not the primary beneficiary.
On November 8, 2019, the Company completed the merger of Shore with and into the Bank. The Shore Merger contributed approximately $284.2 million in assets, approximately $209.6 million in loans, and approximately $249.8 million in deposits.
On April 11, 2018, the Company completed the merger of NJCB with and into the Bank. The NJCB Merger contributed approximately $95 million in assets, approximately $75 million in loans, and approximately $87 million in deposits.
Critical Accounting Policies and Estimates
Management’s Discussion and Analysis of Financial Condition and Results of Operations is based upon the Company’s consolidated financial statements, which have been prepared in accordance with accounting principles generally accepted in the United States of America ("U.S. GAAP"). The preparation of these financial statements requires the Company to make estimates and judgments that affect the reported amounts of assets, liabilities, revenues and expenses. Note 1 to the Company’s Consolidated Financial Statements for the yearyears ended December 31, 20172019 and 2018 contains a summary of the Company’s significant accounting policies.
Management believes that the Company’s policies with respect to the methodologies for the determination of the allowance for loan losses and for determining other-than-temporary security impairment involve a higher degree of complexity and requires management to make difficult and subjective judgments, which often require assumptions or estimates about highly uncertain matters. Changes in these judgments, assumptions or estimates could materially impact results of operations. These critical policies and their application are periodically reviewed with the Audit Committee and the Board of Directors.
The provision for loan losses is based upon management’s evaluation of the adequacy of the allowance, including an assessment of known and inherent risks in the portfolio, after giving consideration to the size and composition of the loan portfolio, actual loan loss experience, level of delinquencies, detailed analysis of individual loans for which full collectability may not be assured, the existence and estimated net realizable value of any underlying collateral and guarantees securing the loans and current economic and market conditions. Although management uses the best information available, the level of the allowance for loan
losses remains an estimate, which is subject to significant judgment and short-term change. Various regulatory agencies, as an integral part of their examination process, periodically review the Company’s allowance for loan losses. Such agencies may require the Company to make additional provisions for loan losses based upon information available to them at the time of their examination. Furthermore, the majority of the Company’s loans are secured by real estate in the State of New Jersey. Accordingly, the collectability of a substantial portion of the carrying value of the Company’s loan portfolio is susceptible to changes in local market conditions and may be adversely affected shouldin the event that real estate values decline or shouldthe Company’s primary market area of northern and central New Jersey and the New Jersey marketYork City metropolitan area experienceexperiences adverse economic conditions. Future adjustments to the allowance for loan losses may be necessary due to economic, operating, regulatory and other conditions beyond the Company’s control.
Real estate acquired through foreclosure, or a deed-in-lieu of foreclosure, is recorded at fair value less estimated selling costs at the date of acquisition or transfer and, subsequently, fair value less estimated selling costs. Adjustments to the carrying value at the date of acquisition or transfer are charged to the allowance for loan losses. The carrying value of the individual properties is subsequently adjusted to estimated fair value less estimated selling costs, at which time a provision for losses on such real estate is charged to operations if it is lower. Appraisals are critical in determining the fair value of the other real estate owned ("OREO") amount. Assumptions for appraisals are instrumental in determining the value of properties. Overly optimistic assumptions or negative changes to assumptions could significantly affect the valuation of a property. The assumptions supporting such appraisals are carefully reviewed by management to determine that the resulting values reasonably reflect amounts realizable.
Debt securities are classified as held to maturity and carried at amortized cost when management has the positive intent and ability to hold them to maturity. Debt securities are classified as available for sale when they might be sold before maturity due to changes in interest rates, prepayment risk, liquidity or other factors. Securities available for sale are carried at fair value, with unrealized holding gains and losses reported in other comprehensive income, net of tax.
Management utilizes various inputs to determine the fair value of its investment portfolio. To the extent they exist, unadjusted quoted market prices in active markets for identical investments (level 1) or quoted prices on similar assets (level 2) are utilized to determine the fair value of each investment in the portfolio. In the absence of quoted prices, valuation techniques would be used to determine fair value of any investments that require inputs that are both significant to the fair value measurement and unobservable (level 3). Valuation techniques are based on various assumptions, including, but not limited to, cash flows, discount rates, rate of return, adjustments for nonperformance and liquidity and liquidation values. A significant degree of judgment is involved in valuing investments using level 3 inputs. The use of different assumptions could have a positive or negative effect on the Company's consolidated financial condition or results of operations.
Securities are evaluated on at least a quarterly basis to determine whether a decline in fair value is other-than-temporary. To determine whether a decline in value is other-than-temporary, management considers the reasons underlying the decline, including, but not limited to, the length of time an investment’s book value is greater than fair value, the extent and duration of the decline and the near-term prospects of the issuer as well as any credit deterioration of the investment. If the decline in value of an investment is deemed to be other-than-temporary, the entire difference between amortized cost and fair value is recognized as impairment through earnings.
The Company records income taxes using the asset and liability method. Accordingly, deferred tax assets and liabilities are recognized for the expected future tax consequences of events that have been recognized in the financial statements or tax returns; are attributable to differences between the financial statement carrying amounts of existing assets and liabilities and their respective tax bases; and are measured using enacted tax rates expected to apply in the years when those temporary differences are expected to be recovered or settled. The effect on deferred tax assets and liabilities of a change in tax rates is recognized in income tax expense in the period of enactment.
Deferred tax assets are recorded on the consolidated balance sheet at net realizable value. The Company periodically performs an assessment to evaluate the amount of deferred tax assets that it is more likely than not to realize. Realization of deferred tax assets is dependent upon the amount of taxable income expected in future periods as tax benefits require taxable income to be realized. If a valuation allowance is required, the deferred tax asset on the consolidated balance sheet is reduced via a corresponding income tax expense in the consolidated statement of income.
Earnings Summary
20172019 compared to 20162018
The Company reported net income of $6.9$13.6 million for the year ended December 31, 2019 compared to net income of $12.0 million for the year ended December 31, 2018. Diluted earnings per share were $1.53 for the year ended December 31, 2019 compared to diluted earnings per share of $1.40 for the year ended December 31, 2018. For the year ended December 31, 2019, net income increased $1.6 million, or $0.8313.2%, and net income per diluted share increased $0.13.
On November 8, 2019, the Company completed the Shore Merger. As a result of the Shore Merger, merger-related expenses of $1.7 million were incurred and the after-tax effect of the merger-related expenses reduced net income for the year ended December 31, 2019 by $1.3 million. The acquisition method of accounting for the business combination resulted in the recognition of goodwill of $23.2 million. A core deposit intangible of $1.5 million and a credit risk discount of $3.6 million applicable to loans were also recorded.
Adjusted net income, which excludes the after-tax effect of merger-related expenses, for the year ended December 31, 2019 was $15.0 million, or $1.68 per diluted share, compared to adjusted net income of $13.4 million, or $1.56 per diluted share, for the year ended December 31, 20172018. Adjusted net income for 2019 increased $1.6 million or 12.0% compared to adjusted net income for 2018. The increase was due primarily to an increase of $9.3$3.9 million or $1.14 per diluted sharein net interest income and an increase of $319,000 in non-interest income, which was partially offset by an increase of $450,000 in the provision for loan losses and an increase of $1.5 million in non-interest expense. The Shore Merger, excluding merger-related expenses, contributed $682,000 to the net income and adjusted net income for the year ended December 31, 2016.2019.
Return on average total assets (“ROAA”) and return on average shareholders' equity (“ROAE”) were 1.06% and 9.87%, respectively, for the year ended December 31, 2019 compared to 1.06% and 10.11%, respectively, for the year ended December 31, 2018. Excluding the merger-related expenses, ROAA and ROAE were 1.17% and 10.84%, respectively, for the year ended December 31, 2019 compared to 1.17% and 11.21%, respectively, for the year ended December 31, 2018.
Adjusted net income, adjusted net income per diluted share, adjusted ROAA and adjusted ROAE are non-GAAP financial measures. Each of these non-GAAP financial measures is the same as the corresponding GAAP measure, except that it excludes the after-tax effect of merger-related expenses from the Shore Merger in 2019 and the NJCB Merger in 2018. These non-GAAP financial measures should be considered in addition to, but not as a substitute for, the Company’s GAAP financial results. Management believes that the presentation of these non-GAAP financial measures of the Company may be helpful to readers in understanding the Company’s financial performance when comparing the Company’s financial statements for the years ended December 31, 2019 and 2018 because these non-GAAP financial measures present the Company’s financial performance excluding the financial impact of the merger-related expenses related to the Shore Merger in 2019 and the NJCB Merger in 2018.
The table below shows the major components of net income for the years ended December 31, 2019 and 2018 and a reconciliation of the non-GAAP measures to reported net income discussed above.
|
| | | | | | | | | | | | | | |
| | | | | | Change in |
| (Dollars in thousands) | 2019 | | 2018 | | $ | | % |
| Net interest income | $ | 47,336 |
| | $ | 43,432 |
| | $ | 3,904 |
| | 9.0 | % |
| Provision for loan losses | 1,350 |
| | 900 |
| | 450 |
| | 50.0 | % |
| Non-interest income | 8,237 |
| | 7,918 |
| | 319 |
| | 4.0 | % |
| Non-interest expense | 35,549 |
| | 34,085 |
| | 1,464 |
| | 4.3 | % |
| Net income before income taxes | 18,674 |
| | 16,365 |
| | 2,309 |
| | 14.1 | % |
| Income taxes | 5,040 |
| | 4,317 |
| | 723 |
| | 16.7 | % |
| Net income | 13,634 |
| | 12,048 |
| | 1,586 |
| | 13.2 | % |
| Adjustments: | | | | | | | |
| Revaluation of deferred tax assets | — |
| | (28 | ) | | 28 |
| | N.M. |
|
| Merger-related expenses | 1,730 |
| | 2,141 |
| | (411 | ) | | (19.2 | )% |
| Gain from bargain purchase | — |
| | (230 | ) | | 230 |
| | N.M. |
|
| Income tax effect of adjustments | (394 | ) | | (568 | ) | | 174 |
| | (30.6 | )% |
| Total adjustments | 1,336 |
| | 1,315 |
| | 21 |
| | 1.60 | % |
| Adjusted net income | $ | 14,970 |
| | $ | 13,363 |
| | $ | 1,607 |
| | 12.0 | % |
| | | | | | | | |
| Earnings per common share: | | | | | | | |
| Basic, as reported | $ | 1.54 |
| | $ | 1.45 |
| | $ | 0.09 |
| | 6.2 | % |
| Adjustments | 0.15 |
| | 0.16 |
| | (0.01 | ) | | (6.3 | )% |
| Basic, as adjusted | $ | 1.69 |
|
| $ | 1.61 |
|
| $ | 0.08 |
| | 5.0 | % |
| | | | | | | | |
| Diluted, as reported | $ | 1.53 |
| | 1.40 |
| | $ | 0.13 |
| | 9.3 | % |
| Adjustments | 0.15 |
| | 0.16 |
| | (0.01 | ) | | (6.3 | )% |
| Diluted, as adjusted | $ | 1.68 |
|
| $ | 1.56 |
|
| $ | 0.12 |
| | 7.7 | % |
| | | | | | | | |
| Return on average total assets: | | | | | | | |
| As reported | 1.06 | % | | 1.06 | % | | | | |
| | | | | | | | |
| Adjusted net income | $ | 14,970 |
| | $ | 13,363 |
| | | | |
| Average assets | 1,283,302 |
| | 1,137,768 |
| | | | |
| As adjusted | 1.17 | % | | 1.17 | % | | | | |
| Return on average shareholders' equity: | | | | | | | |
| As reported | 9.87 | % | | 10.11 | % | | | | |
| | | | | | | | |
| Adjusted net income | $ | 14,970 |
| | $ | 13,363 |
| | | | |
| Average shareholders' equity | 138,101 |
| | 119,212 |
| | | | |
| As adjusted | 10.84 | % | | 11.21 | % | | | | |
| | | | | | | | |
2018 compared to 2017
The Company reported net income of $12.0 million for the year ended December 31, 2018 compared to net income of $6.9 million for the year ended December 31, 2017. Diluted earnings per share were $1.40 for the year ended December 31, 2018 compared to diluted earnings per share of $0.83 for the year ended December 31, 2017. For the year ended December 31, 2018, net income increased $5.1 million, or 73.9%, and net income per diluted share increased $0.57.
On April 11, 2018, the Company completed the merger of NJCB with and into the Bank. As a result of the NJCB merger, merger-related expenses of $2.1 million were incurred and the after-tax effect of the merger expenses reduced net income for the year ended December 31, 2018 by $1.6 million. The acquisition method of accounting for the business combination resulted in the recognition of a gain from the bargain purchase of $230,000 and no goodwill. For the year ended December 31, 2017, net income decreased $2.4 million, or 25.4%, and net income per diluted share decreased $0.31.
The decreasethe Company recorded $265,000 in net income for 2017 compared to 2016 included additional estimated income tax expense of $1.7 million, or $0.21 per diluted share, due to the revaluation of the Company’s net deferred tax assets.merger-related expenses. As a result of the enactment of the Tax Cuts and Jobs Act (“Tax Act”) on December 22, 2017, which reduced the maximum federal corporate income tax rate from 35% to 21% beginning in 2018, the Company revalued its net deferred tax assets to reflect the lower federal corporate income tax rate that would be in effect in future years. Additionally, merger-related expenses onyears which resulted in an after-tax basisadditional $1.7 million of $188,000, or $0.02 per diluted share, relatedincome tax expense due to the pending mergerrevaluation of New Jersey Community Bank with and into the Bank, were incurred during the fourth quarter of 2017.Company’s deferred tax assets.
Excluding the gain from bargain purchase, the merger-related expenses and the additional income tax expense, and the merger-related expenses, adjusted net income for the year ended December 31, 20172018 was $13.4 million, or $1.56 per diluted share, compared to adjusted net income of $8.8 million, or $1.06 per diluted share, for the year ended December 31, 2017. Adjusted net income for 2018 increased $4.5 million or 51.4% compared to adjusted net income for 2017. The increase was due primarily to an increase of $7.3 million in net interest income, which was partially offset by an increase of $300,000 in the provision for loan losses, an increase of $3.1 million in non-interest expense and a decrease of $322,000 in non-interest income. The NJCB Merger contributed $960,000 to the net income and adjusted net income for the year ended December 31, 2016 of $9.3 million, or $1.14 per diluted share, reflecting a decrease of $457,000, or 4.9%, compared to 2016. This decrease was due primarily to an increase of $900,000 in the provision for loan losses and an increase in non-interest expense of $3.7 million, which were partially offset by an increase in net interest income of $2.2 million and an increase of $1.3 million in non-interest income.2018.
Return on average assets (“ROAA”)ROAA and return on average equity (“ROAE”)ROAE were 1.06% and 10.11%, respectively, for the year ended December 31, 2018 compared to 0.67% and 6.36%, respectively, for the year ended December 31, 2017 compared to 0.93%2017. Excluding the gain from bargain purchase, the merger-related expenses and 9.21%the additional income tax expense, ROAA and ROAE were 1.17% and 11.21%, respectively, for the year ended December 31, 2016. Excluding the additional income tax expense and the merger-related expense, ROAA and ROAE for the year ended December 31, 2017 would have been2018 compared to 0.86% and 8.10%, respectively.
If the lower federal corporate income tax rate had been in effect in 2017, the Company’s reported 2017 income tax expense of $5.9 million, excluding the $1.7 million of tax expense due to the revaluation of the net deferred tax assets, would have been approximately $2.9 million, or $1.3 million lower.
Adjusted net income and adjusted net income per diluted share are non-GAAP measures. The table below shows the major components of net income for the years ended December 31, 2017 and 2016 and a reconciliation of the non-GAAP measures to reported net income discussed above.
|
| | | | | | | | | | | | | | |
| | | | | | Change in |
| (Dollars in thousands) | 2017 | | 2016 | | $ | | % |
| Net interest income | $ | 36,165 |
| | $ | 33,977 |
| | $ | 2,188 |
| | 6.4 | % |
| Provision for loan losses | 600 |
| | (300 | ) | | 900 |
| | (300.0 | ) |
| Non-interest income | 8,240 |
| | 6,922 |
| | 1,318 |
| | 19.0 |
|
| Non-interest expense | 31,006 |
| | 27,291 |
| | 3,715 |
| | 13.6 |
|
| Net income before income taxes | 12,799 |
| | 13,908 |
| | (1,109 | ) | | (8.0 | ) |
| Income taxes | 5,871 |
| | 4,623 |
| | 1,248 |
| | 27.0 |
|
| Net income | 6,928 |
| | 9,285 |
| | (2,357 | ) | | (25.4 | )% |
| Adjustments: | | | | | | | |
| Revaluation of deferred tax assets | 1,712 |
| | — |
| | 1,712 |
| | N/A |
|
| Merger-related expenses | 265 |
| | — |
| | 265 |
| | N/A |
|
| Income tax effect of adjustments | (77 | ) | | — |
| | (77 | ) | | N/A |
|
| Total adjustments | 1,900 |
| | — |
| | 1,900 |
| | N/A |
|
| Adjusted net income | $ | 8,828 |
| | $ | 9,285 |
| | $ | (457 | ) | | (4.9 | )% |
| | | | | | | | |
| Earnings per share: | | | | | | | |
| Basic, as reported | $ | 0.86 |
| | $ | 1.17 |
| | $ | (0.31 | ) | | (26.5 | )% |
| Adjustments | 0.24 |
| | — |
| | 0.24 |
| | N/A |
|
| Basic, as adjusted | $ | 1.10 |
|
| $ | 1.17 |
|
| $ | (0.07 | ) | | (6.0 | )% |
| | | | | | | | |
| Diluted, as reported | $ | 0.83 |
| | 1.14 |
| | $ | (0.31 | ) | | (27.2 | )% |
| Adjustments | 0.23 |
| | — |
| | 0.23 |
| | N/A |
|
| Diluted, as adjusted | $ | 1.06 |
|
| $ | 1.14 |
|
| $ | (0.08 | ) | | (7.0 | )% |
| | | | | | | | |
| Return on average assets: | | | | | | | |
| As reported | 0.67 | % | | 0.93 | % | | | | |
| | | | | | | | |
| Adjusted net income | $ | 8,828 |
| | $ | 9,285 |
| | | | |
| Average assets | 1,031,796 |
| | 1,001,769 |
| | | | |
| As adjusted | 0.86 | % | | 0.93 | % | | | | |
| Return on average shareholders' equity: | | | | | | | |
| As reported | 6.36 | % | | 9.21 | % | | | | |
| | | | | | | | |
| Adjusted net income | $ | 8,828 |
| | $ | 9,285 |
| | | | |
| Average shareholders' equity | 108,925 |
| | 100.807 |
| | | | |
| As adjusted | 8.10 | % | | 9.21 | % | | | | |
| | | | | | | | |
2016 compared to 2015
The Company reported net income of $9.3 million or $1.14 per diluted share for the year ended December 31, 2016 compared to net income of $8.7 million or $1.07 per diluted share for the year ended December 31, 2015. For the year ended December 31, 2016 net income per diluted share increased 6.5% due to a $621,000, or 7.2%, increase in net income.
The increase in net income for 2016 compared to 2015 was due primarily to the reduction of $1.4 million in the provision for loan losses and a $336,000 increase in non-interest income, which were partially offset by decreases of $710,000 in net interest income and $156,000 in non-interest expense.
ROAA and ROAE were 0.93% and 9.21%, respectively, for the year ended December 31, 2016 compared to 0.89% and 9.49%, respectively, for the year ended December 31, 2015.2017.
The table below shows the major components of net income for the years ended December 31, 20162018 and 2015.2017 and a reconciliation of the non-GAAP measures to reported net income discussed above.
| | | | | | | | Change in | | | | | Change in |
| (Dollars in thousands | 2016 | | 2015 | | $ | | % | |
| (Dollars in thousands) | | 2018 | | 2017 | | $ | | % |
| Net interest income | $ | 33,977 |
| | $ | 34,687 |
| | $ | (710 | ) | | (2.0 | )% | $ | 43,432 |
| | $ | 36,165 |
| | $ | 7,267 |
| | 20.1 | % |
| (Credit) provision for loan losses | (300 | ) | | 1,100 |
| | (1,400 | ) | | (127.3 | ) | |
| Provision (credit) for loan losses | | 900 |
| | 600 |
| | 300 |
| | 50.0 |
|
| Non-interest income | 6,922 |
| | 6,586 |
| | 336 |
| | 5.1 |
| 7,918 |
| | 8,240 |
| | (322 | ) | | (3.9 | ) |
| Non-interest expense | 27,291 |
| | 27,447 |
| | (156 | ) | | (0.6 | ) | 34,085 |
| | 31,006 |
| | 3,079 |
| | 9.9 |
|
| Net income before income taxes | 13,908 |
| | 12,726 |
| | 1,182 |
| | 9.3 |
| 16,365 |
| | 12,799 |
| | 3,566 |
| | 27.9 |
|
| Income taxes | 4,623 |
| | 4,062 |
| | 561 |
| | 13.8 |
| 4,317 |
| | 5,871 |
| | (1,554 | ) | | (26.5 | ) |
| Net income | 9,285 |
| | 8,664 |
| | 621 |
| | 7.2 | % | 12,048 |
| | 6,928 |
| | 5,120 |
| | 73.9 | % |
| Adjustments: | | | | | | | | |
| Revaluation of deferred tax assets | | (28 | ) | | 1,712 |
| | (1,740 | ) | | N.M. |
|
| Merger-related expenses | | 2,141 |
| | 265 |
| | 1,876 |
| | N.M. |
|
| Gain from bargain purchase | | (230 | ) | | — |
| | (230 | ) | | |
| Income tax effect of adjustments | | (568 | ) | | (77 | ) | | (491 | ) | | N.M. |
|
| Total adjustments | | 1,315 |
| | 1,900 |
| | (585 | ) | | N.M. |
|
| Adjusted net income | | $ | 13,363 |
| | $ | 8,828 |
| | $ | 4,535 |
| | 51.4 | % |
| | | | | | | | | | | | | | | |
| Earnings per share: | | | | | | | | |
| Basic | $ | 1.17 |
| | $ | 1.10 |
| | $ | 0.07 |
| | 6.4 | % | |
| Diluted | 1.14 |
| | 1.07 |
| | 0.07 |
| | 6.5 |
| |
| Earnings per common share: | | | | | | | | |
| Basic, as reported | | $ | 1.45 |
| | $ | 0.86 |
| | $ | 0.59 |
| | 68.6 | % |
| Adjustments | | 0.16 |
| | 0.24 |
| | (0.08 | ) | | N.M. |
|
| Basic, as adjusted | | $ | 1.61 |
| | $ | 1.10 |
|
| $ | 0.51 |
| | 46.4 | % |
| | | | | | | | | |
| Diluted, as reported | | $ | 1.40 |
| | 0.83 |
| | $ | 0.57 |
| | 68.7 | % |
| Adjustments | | 0.16 |
| | 0.23 |
| | (0.07 | ) | | N.M. |
|
| Diluted, as adjusted | | $ | 1.56 |
|
| $ | 1.06 |
|
| $ | 0.50 |
| | 47.2 | % |
| | | | | | | | | |
| Return on average total assets: | | | | | | | | |
| As reported | | 1.06 | % | | 0.67 | % | | | | |
| | | | | | | | | |
| Adjusted net income | | $ | 13,363 |
| | $ | 8,828 |
| | | | |
| Average assets | | 1,137,768 |
| | 1,031,796 |
| | | | |
| As adjusted | | 1.17 | % | | 0.86 | % | | | | |
| Return on average shareholders' equity: | | | | | | | | |
| As reported | | 10.11 | % | | 6.36 | % | | | | |
| | | | | | | | | |
| Adjusted net income | | $ | 13,363 |
| | $ | 8,828 |
| | | | |
| Average shareholders' equity | | 119,212 |
| | 108,925 |
| | | | |
| As adjusted | | 11.21 | % | | 8.10 | % | | | | |
| | | | | | | | | |
Net Interest Income and Net Interest Margin
Net interest income, the Company’s largest and most significant component of operating income, is the difference between interest and fees earned on loans, investment securities and other earning assets and interest paid on deposits and borrowed funds. This component represented 81%85%, 83%85% and 84%81% of the Company’s net revenues (net interest income plus non-interest income) for the years ended December 31, 2017, 20162019, 2018 and 2015,2017, respectively. Net interest income is determined by the difference between the yields earned on earning assets and the rates paid on interest-bearing liabilities ("Net Interest Spread"net interest spread") and the relative amounts of average earning assets and average interest-bearing liabilities. The Company's net interest spread is affected by the monetary policy of the Federal Reserve Board, and regulatory, economic and competitive factors that influence interest rates, loan demand and deposit flows as well as general levels of nonperforming assets.
The following table summarizes the Company's net interest income and related spread and margin for the periods indicated:
| | | | Years ended December 31, | Years ended December 31, |
| (Dollars in thousands) | 2017 | | 2016 | | 2015 | 2019 | | 2018 | | 2017 |
| Net interest income | $ | 36,165 |
| | $ | 33,977 |
| | $ | 34,687 |
| $ | 47,336 |
| | $ | 43,432 |
| | $ | 36,165 |
|
| Interest rate spread | 3.58 | % | | 3.50 | % | | 3.74 | % | 3.65 | % | | 3.81 | % | | 3.58 | % |
| Net interest margin | 3.81 |
| | 3.70 |
| | 3.90 |
| 4.00 | % | | 4.09 | % | | 3.81 | % |
The following tables compare the Company’s consolidated average balance sheets, interest income and expense, net interest spreads and net interest margins for the years ended December 31, 2017, 20162019, 2018 and 20152017 (on a fully tax-equivalent basis). The average rates are derived by dividing interest income and expense by the average balance of assets and liabilities, respectively.
| | | | December 31, 2017 | December 31, 2019 |
| | Average | | Average | Average | | | | Average |
| (In thousands except yield/cost information) | Balance | Interest | Yield/Cost | Balance | | Interest | | Yield/Cost |
| Assets | | | | | | | |
| Interest earning assets: | | | |
| Interest-earning assets: | | | | | | |
| Federal funds sold/short term investments | $ | 27,533 |
| $ | 230 |
| 0.84 | % | $ | 8,142 |
| | $ | 176 |
| | 2.16 | % |
| Investment securities: | | | | | | | |
| Taxable | 140,431 |
| 3,326 |
| 2.37 |
| 163,415 |
| | 4,710 |
| | 2.88 |
|
Tax-exempt (4)(1) | 90,186 |
| 3,167 |
| 3.51 |
| 57,005 |
| | 2,110 |
| | 3.70 |
|
| Total investment securities | 230,617 |
| 6,493 |
| 2.82 |
| 220,420 |
| | 6,820 |
| | 3.09 |
|
Loans: (1)(2) | | | | | | | |
| Commercial real estate | 274,192 |
| 13,851 |
| 4.98 |
| 426,929 |
| | 22,129 |
| | 5.11 |
|
| Mortgage warehouse lines | 160,756 |
| 6,937 |
| 4.26 |
| 174,151 |
| | 9,543 |
| | 5.48 |
|
| Construction | 115,913 |
| 6,780 |
| 5.77 |
| 156,467 |
| | 10,576 |
| | 6.76 |
|
| Commercial business | 96,193 |
| 5,474 |
| 5.63 |
| 121,985 |
| | 7,295 |
| | 5.98 |
|
| Residential real estate | 41,898 |
| 1,777 |
| 4.24 |
| 56,745 |
| | 2,591 |
| | 4.50 |
|
| Loans to individuals | 22,171 |
| 903 |
| 4.07 |
| 23,312 |
| | 1,195 |
| | 5.06 |
|
| Loans held for sale | 4,197 |
| 202 |
| 4.81 |
| 4,280 |
| | 170 |
| | 3.97 |
|
| Other | 1,690 |
| 43 |
| 2.51 |
| |
| All other loans | | 1,051 |
| | 38 |
| | 3.57 |
|
| Total loans | 717,010 |
| 35,967 |
| 4.96 |
| 964,920 |
| | 53,537 |
| | 5.55 |
|
| Total interest earning assets | 975,160 |
| 42,690 |
| 4.33 | % | |
| Non-interest earning assets: | | | |
| Total interest-earning assets | | 1,193,482 |
| | 60,533 |
| | 5.07 | % |
| Non-interest-earning assets: | | | | | | |
| Allowance for loan losses | (7,703 | ) | | | (8,796 | ) | | | | |
| Cash and due from bank | 5,371 |
| | | 11,729 |
| | | | |
| Other assets | 58,968 |
| | | 86,887 |
| | | | |
| Total non-interesting earning assets | 56,636 |
| | | |
| Total non-interesting-earning assets | | 89,820 |
| | | | |
| Total assets | $ | 1,031,796 |
| | | $ | 1,283,302 |
| | | | |
| Liabilities and Shareholders' Equity | | | | | | | |
| Interest-bearing Liabilities: | | | |
| Interest-bearing liabilities: | | | | | | |
| Money market and NOW accounts | $ | 336,445 |
| $ | 1,440 |
| 0.43 | % | $ | 349,663 |
| | $ | 2,750 |
| | 0.79 | % |
| Savings accounts | 210,798 |
| 1,332 |
| 0.63 |
| 201,738 |
| | 1,952 |
| | 0.97 |
|
| Certificates of deposit | 145,539 |
| 1,778 |
| 1.22 |
| 286,419 |
| | 6,392 |
| | 2.23 |
|
| Borrowed funds | 21,139 |
| 429 |
| 2.03 |
| |
| Other borrowed funds | | 38,594 |
| | 912 |
| | 2.36 |
|
| Redeemable subordinated debentures | 18,557 |
| 519 |
| 2.80 |
| 18,557 |
| | 748 |
| | 4.03 |
|
| Total interest bearing liabilities | 732,478 |
| 5,498 |
| 0.75 | % | |
| Non-interest bearing liabilities: | | | |
| Total interest-bearing liabilities | | 894,971 |
| | 12,754 |
| | 1.43 | % |
| Non-interest-bearing liabilities: | | | | | | |
| Demand deposits | 183,802 |
| | | 226,701 |
| | | | |
| Other liabilities | 6,591 |
| | | 23,529 |
| | | | |
| Total non-interest bearing liabilities | 190,393 |
| | | |
| Total non-interest-bearing liabilities | | 250,230 |
| | | | |
| Shareholders' equity | 108,925 |
| | | 138,101 |
| | | | |
| Total liabilities and shareholders' equity | $ | 1,031,796 |
| | | $ | 1,283,302 |
| | | | |
Net interest spread (2)(3) | | 3.58 | % | | | | | 3.65 | % |
| Net interest margin (3) | | $ | 37,192 |
| 3.81 | % | |
Net interest income and margin (4) | | | | $ | 47,779 |
| | 4.00 | % |
| |
(1) | Tax-equivalent basis, using 21% federal tax rate in 2019. |
| |
(2) | Loan origination fees and costs are considered an adjustment to interest income. For the purpose of calculating loan yields, average loan balances include non-accrual loans with no related interest income. Please refer to Item 7. Management’s Discussionincome and Analysisaverage balance of Financial Condition and Results of Operations under the heading “Non-Performing Assets”loans held for a discussion of the Company’s policy with regard to non-accrual loans.sale. |
| |
(2)(3) | The net interest rate spread is the difference between the average yield on interest earning assets and the average rate paid on interest bearing liabilities. |
| |
(3)(4) | The net interest margin is equal to net interest income divided by average interest earning assets. |
| |
(4) | The tax-equivalent adjustment was $1.0 million for the year ended December 31, 2017. |
| | | | December 31, 2016 | December 31, 2018 |
| | Average | | Average | Average | | | | Average |
| (In thousands except yield/cost information) | Balance | Interest | Yield/Cost | Balance | | Interest | | Yield/Cost |
| Assets | | | | | | | |
| Interest earning assets: | | | |
| Interest-earning assets: | | | | | | |
| Federal funds sold/short term investments | $ | 21,041 |
| $ | 88 |
| 0.42 | % | $ | 20,157 |
| | $ | 258 |
| | 1.28 | % |
| Investment securities: | | | | | | | |
| Taxable | 143,461 |
| 3,268 |
| 2.28 |
| 146,631 |
| | 4,024 |
| | 2.74 |
|
Tax-exempt (4)(1) | 81,570 |
| 3,075 |
| 3.77 |
| 74,477 |
| | 2,518 |
| | 3.38 |
|
| Total investment securities | 225,031 |
| 6,343 |
| 2.82 |
| 221,108 |
| | 6,542 |
| | 2.96 |
|
Loans: (1)(2) | | | | | | | |
| Commercial real estate | 220,700 |
| 12,435 |
| 5.56 |
| 356,581 |
| | 18,318 |
| | 5.07 |
|
| Mortgage warehouse lines | 205,711 |
| 8,425 |
| 4.04 |
| 153,868 |
| | 8,403 |
| | 5.46 |
|
| Construction | 93,648 |
| 4,896 |
| 5.16 |
| 137,976 |
| | 9,090 |
| | 6.59 |
|
| Commercial business | 102,810 |
| 4,953 |
| 4.77 |
| 111,150 |
| | 6,059 |
| | 5.45 |
|
| Residential real estate | 42,694 |
| 1,828 |
| 4.28 |
| 46,301 |
| | 2,085 |
| | 4.44 |
|
| Loans to individuals | 23,250 |
| 933 |
| 4.01 |
| 23,155 |
| | 1,083 |
| | 4.61 |
|
| Loans held for sale | 7,256 |
| 176 |
| 2.43 |
| 2,738 |
| | 123 |
| | 4.49 |
|
| Other | 2,367 |
| 55 |
| 2.29 |
| |
| All other loans | | 1,197 |
| | 41 |
| | 3.38 |
|
| Total loans | 698,436 |
| 33,701 |
| 4.77 |
| 832,966 |
| | 45,202 |
| | 5.38 |
|
| Total interest earning assets | 944,508 |
| 40,132 |
| 4.21 | % | |
| Non-interest earning assets: | | | |
| Total interest-earning assets | | 1,074,231 |
| | 52,002 |
| | 4.81 | % |
| Non-interest-earning assets: | | | | | | |
| Allowance for loan losses | (7,538 | ) | | | (8,314 | ) | | | | |
| Cash and due from bank | 5,120 |
| | | 5,595 |
| | | | |
| Other assets | 59,679 |
| | | 66,256 |
| | | | |
| Total non-interesting earning assets | 57,261 |
| | | |
| Total non-interesting-earning assets | | 63,537 |
| | | | |
| Total assets | $ | 1,001,769 |
| | | $ | 1,137,768 |
| | | | |
| Liabilities and Shareholders' Equity | | | | | | | |
| Interest-bearing Liabilities: | | | |
| Interest-bearing liabilities: | | | | | | |
| Money market and NOW accounts | $ | 301,086 |
| $ | 1,128 |
| 0.37 | % | $ | 356,906 |
| | $ | 1,978 |
| | 0.55 | % |
| Savings accounts | 206,208 |
| 1,208 |
| 0.59 |
| 203,940 |
| | 1,467 |
| | 0.72 |
|
| Certificates of deposit | 152,078 |
| 1,708 |
| 1.12 |
| 189,521 |
| | 3,066 |
| | 1.62 |
|
| Borrowed funds | 48,448 |
| 687 |
| 1.42 |
| |
| Other borrowed funds | | 36,612 |
| | 836 |
| | 2.28 |
|
| Redeemable subordinated debentures | 18,557 |
| 427 |
| 2.30 |
| 18,557 |
| | 694 |
| | 3.74 |
|
| Total interest bearing liabilities | 726,377 |
| 5,158 |
| 0.71 | % | |
| Non-interest bearing liabilities: | | | |
| Total interest-bearing liabilities | | 805,536 |
| | 8,041 |
| | 1.00 | % |
| Non-interest-bearing liabilities: | | | | | | |
| Demand deposits | 166,380 |
| | | 204,002 |
| | | | |
| Other liabilities | 8,205 |
| | | 9,018 |
| | | | |
| Total non-interest bearing liabilities | 174,585 |
| | | |
| Total non-interest-bearing liabilities | | 213,020 |
| | | | |
| Shareholders' equity | 100,807 |
| | | 119,212 |
| | | | |
| Total liabilities and shareholders' equity | $ | 1,001,769 |
| | | $ | 1,137,768 |
| | | | |
Net interest spread (2)(3) | | 3.50 | % | | | | | 3.81 | % |
| Net interest margin (3) | | $ | 34,974 |
| 3.70 | % | |
Net interest income and margin (4) | | | | $ | 43,961 |
| | 4.09 | % |
| |
| (1) | Tax-equivalent basis, using 21% federal tax rate in 2018. |
| |
| (2) | Loan origination fees and costs are considered an adjustment to interest income. For the purpose of calculating loan yields, average loan balances include non-accrual loans with no related interest income. Please refer to Item 7. Management’s Discussionincome and Analysisaverage balance of Financial Condition and Results of Operations under the heading “Non-Performing Assets”loans held for a discussion of the Company’s policy with regard to non-accrual loans.sale. |
| |
(2)(3) | The net interest rate spread is the difference between the average yield on interest earning assets and the average rate paid on interest bearing liabilities. |
| |
(3)(4) | The net interest margin is equal to net interest income divided by average interest earning assets. |
| |
(4) | The tax-equivalent adjustments was $1 million for the year ended December 31, 2016. |
| | | | December 31, 2015 | December 31, 2017 |
| | Average | | Average | Average | | | | Average |
| (In thousands except yield/cost information) | Balance | Interest | Yield/Cost | Balance | | Interest | | Yield/Cost |
| Assets | | | | | | | |
| Interest earning assets: | | | |
| Interest-earning assets: | | | | | | |
| Federal funds sold/short term investments | $ | 23,516 |
| $ | 50 |
| 0.21 | % | $ | 27,533 |
| | $ | 230 |
| | 0.84 | % |
| Investment securities: | | | | | | | |
| Taxable | 125,446 |
| 3,167 |
| 2.52 |
| 140,431 |
| | 3,326 |
| | 2.37 |
|
Tax-exempt (4)(1) | 81,612 |
| 3,153 |
| 3.86 |
| 90,186 |
| | 3,167 |
| | 3.51 |
|
| Total investment securities | 207,058 |
| 6,320 |
| 3.05 |
| 230,617 |
| | 6,493 |
| | 2.82 |
|
Loans: (1)(2) | | | | | | | |
| Commercial real estate | 202,939 |
| 11,936 |
| 5.80 |
| 274,192 |
| | 13,851 |
| | 4.98 |
|
| Mortgage warehouse lines | 203,074 |
| 8,549 |
| 4.15 |
| 160,756 |
| | 6,937 |
| | 4.26 |
|
| Construction | 95,766 |
| 5,334 |
| 5.49 |
| 115,913 |
| | 6,780 |
| | 5.77 |
|
| Commercial business | 106,632 |
| 5,126 |
| 4.75 |
| 96,193 |
| | 5,474 |
| | 5.63 |
|
| Residential real estate | 43,048 |
| 1,796 |
| 4.17 |
| 41,898 |
| | 1,777 |
| | 4.24 |
|
| Loans to individuals | 22,217 |
| 934 |
| 4.20 |
| 22,171 |
| | 903 |
| | 4.07 |
|
| Loans held for sale | 8,954 |
| 246 |
| 2.75 |
| 4,197 |
| | 202 |
| | 4.81 |
|
| Other | 1,855 |
| 54 |
| 2.87 |
| |
| All other loans | | 1,690 |
| | 43 |
| | 2.51 |
|
| Total loans | 684,485 |
| 33,975 |
| 4.90 |
| 717,010 |
| | 35,967 |
| | 4.96 |
|
| Total interest earning assets | 915,059 |
| 40,345 |
| 4.36 | % | |
| Non-interest earning assets: | | | |
| Total interest-earning assets | | 975,160 |
| | 42,690 |
| | 4.33 | % |
| Non-interest-earning assets: | | | | | | |
| Allowance for loan losses | (7,484 | ) | | | (7,703 | ) | | | | |
| Cash and due from bank | 5,887 |
| | | 5,371 |
| | | | |
| Other assets | 64,563 |
| | | 58,968 |
| | | | |
| Total non-interesting earning assets | 62,966 |
| | | |
| Total non-interesting-earning assets | | 56,636 |
| | | | |
| Total assets | $ | 978,025 |
| | | $ | 1,031,796 |
| | | | |
| Liabilities and Shareholders' Equity | | | | | | | |
| Interest-bearing Liabilities: | | | |
| Interest-bearing liabilities: | | | | | | |
| Money market and NOW accounts | $ | 300,813 |
| $ | 1,013 |
| 0.34 | % | $ | 336,445 |
| | $ | 1,440 |
| | 0.43 | % |
| Savings accounts | 196,915 |
| 950 |
| 0.48 |
| 210,798 |
| | 1,332 |
| | 0.63 |
|
| Certificates of deposit | 158,754 |
| 1,741 |
| 1.10 |
| 145,539 |
| | 1,778 |
| | 1.22 |
|
| Borrowed funds | 38,472 |
| 577 |
| 1.50 |
| |
| Other borrowed funds | | 21,139 |
| | 429 |
| | 2.03 |
|
| Redeemable subordinated debentures | 18,557 |
| 355 |
| 1.91 |
| 18,557 |
| | 519 |
| | 2.80 |
|
| Total interest bearing liabilities | 713,511 |
| 4,636 |
| 0.62 | % | |
| Non-interest bearing liabilities: | | | |
| Total interest-bearing liabilities | | 732,478 |
| | 5,498 |
| | 0.75 | % |
| Non-interest-bearing liabilities: | | | | | | |
| Demand deposits | 164,348 |
| | | 183,802 |
| | | | |
| Other liabilities | 8,859 |
| | | 6,591 |
| | | | |
| Total non-interest bearing liabilities | 173,207 |
| | | |
| Total non-interest-bearing liabilities | | 190,393 |
| | | | |
| Shareholders' equity | 91,307 |
| | | 108,925 |
| | | | |
| Total liabilities and shareholders' equity | $ | 978,025 |
| | | $ | 1,031,796 |
| | | | |
Net interest spread (2)(3) |
| | 3.74 | % |
| | | | 3.58 | % |
| Net interest margin (3) | | $ | 35,709 |
| 3.90 | % | |
Net interest income and margin (4) | | | | $ | 37,192 |
| | 3.81 | % |
| |
| (1) | Tax-equivalent basis, using 34% federal tax rate in 2017. |
| |
| (2) | Loan origination fees and costs are considered an adjustment to interest income. For the purpose of calculating loan yields, average loan balances include non-accrual loans with no related interest income. Please refer to Item 7. Management’s Discussionincome and Analysisaverage balance of Financial Condition and Results of Operations under the heading “Non-Performing Assets”loans held for a discussion of the Company’s policy with regard to non-accrual loans.sale. |
| |
(2)(3) | The net interest rate spread is the difference between the average yield on interest earning assets and the average rate paid on interest bearing liabilities. |
| |
(3)(4) | The net interest margin is equal to net interest income divided by average interest earning assets. |
| |
(4) | The tax-equivalent adjustments was $1.0 million for the year ended December 31, 2015. |
Changes in net interest income and net interest margin result from the interaction between the volume and composition of interest earning assets, interest bearing liabilities, related yields and funding costs. The effect of volume and rate changes on net interest income (on a tax-equivalent basis) for the periods indicated are shown below:
| | | | Year ended 2017 compared with 2016 | | Year ended 2016 compared with 2015 | Year ended 2019 compared with 2018 | | Year ended 2018 compared with 2017 |
| | Due to Change in: | | Due to Change in: | Due to Change in: | | Due to Change in: |
| (Dollars in thousands) | Volume | | Rate | | Total | | Volume | | Rate | | Total | Volume | | Rate | | Total | | Volume | | Rate | | Total |
| Assets | | | | | | | | | | | | | | | | | | | | | | |
| Federal funds sold/short term investments | $ | 27 |
| | $ | 115 |
| | $ | 142 |
| | $ | (5 | ) | | $ | 43 |
| | $ | 38 |
| $ | (154 | ) | | $ | 72 |
| | $ | (82 | ) | | $ | (62 | ) | | $ | 90 |
| | $ | 28 |
|
| Investment securities: | | | | | | | | | | | | | | | | | | | | | | |
| Taxable | (69 | ) | | 127 |
| | 58 |
| | 455 |
| | (354 | ) | | 101 |
| 461 |
| | 225 |
| | 686 |
| | 148 |
| | 550 |
| | 698 |
|
Tax-exempt | 325 |
| | (233 | ) | | 92 |
| | (2 | ) | | (76 | ) | | (78 | ) | (591 | ) | | 183 |
| | (408 | ) | | (552 | ) | | (97 | ) | | (649 | ) |
| Total investment securities | 256 |
| | (106 | ) | | 150 |
| | 453 |
| | (430 | ) | | 23 |
| (130 | ) | | 408 |
| | 278 |
| | (404 | ) | | 453 |
| | 49 |
|
| Loans: | | | | | | | | | | | | | | | | | | | | | | |
| Commercial real estate | 2,973 |
| | (1,576 | ) | | 1,416 |
| | 1,037 |
| | (538 | ) | | 499 |
| 3,564 |
| | 247 |
| | 3,811 |
| | 4,105 |
| | 362 |
| | 4,467 |
|
| Mortgage warehouse lines | (1,816 | ) | | 348 |
| | (1,488 | ) | | 108 |
| | (232 | ) | | (124 | ) | 1,108 |
| | 32 |
| | 1,140 |
| | (293 | ) | | 1,759 |
| | 1,466 |
|
| Construction | 1,148 |
| | 710 |
| | 1,884 |
| | (122 | ) | | (316 | ) | | (438 | ) | 1,218 |
| | 268 |
| | 1,486 |
| | 1,273 |
| | 1,037 |
| | 2,310 |
|
| Commercial business | (316 | ) | | 833 |
| | 521 |
| | (187 | ) | | 14 |
| | (173 | ) | 591 |
| | 645 |
| | 1,236 |
| | 842 |
| | (257 | ) | | 585 |
|
| Residential real estate | (34 | ) | | (17 | ) | | (51 | ) | | (15 | ) | | 47 |
| | 32 |
| 464 |
| | 42 |
| | 506 |
| | 187 |
| | 121 |
| | 308 |
|
| Loans to individuals | (43 | ) | | 13 |
| | (30 | ) | | 43 |
| | (44 | ) | | (1 | ) | 7 |
| | 105 |
| | 112 |
| | 40 |
| | 140 |
| | 180 |
|
| Loans held for sale | (74 | ) | | 100 |
| | 26 |
| | (47 | ) | | (23 | ) | | (70 | ) | 69 |
| | (22 | ) | | 47 |
| | (70 | ) | | (9 | ) | | (79 | ) |
| Other | (16 | ) | | 4 |
| | (12 | ) | | 15 |
| | (14 | ) | | 1 |
| (5 | ) | | 2 |
| | (3 | ) | | (12 | ) | | 10 |
| | (2 | ) |
| Total loans | 1,822 |
| | 415 |
| | 2,266 |
| | 832 |
| | (1,106 | ) | | (274 | ) | 7,016 |
| | 1,319 |
| | 8,335 |
| | 6,072 |
| | 3,163 |
| | 9,235 |
|
| Total Interest Income | $ | 2,105 |
| | $ | 424 |
| | $ | 2,558 |
| | $ | 1,280 |
| | $ | (1,493 | ) | | $ | (213 | ) | |
| Total interest income | | $ | 6,732 |
| | $ | 1,799 |
| | $ | 8,531 |
| | $ | 5,606 |
| | $ | 3,706 |
| | $ | 9,312 |
|
| Liabilities | | | | | | | | | | | | | | | | | | | | | | |
| Money market and NOW accounts | 132 |
| | 180 |
| | 312 |
| | 1 |
| | 114 |
| | 115 |
| (40 | ) | | 812 |
| | 772 |
| | 88 |
| | 450 |
| | 538 |
|
| Savings accounts | 27 |
| | 97 |
| | 124 |
| | 45 |
| | 213 |
| | 258 |
| (16 | ) | | 501 |
| | 485 |
| | (43 | ) | | 178 |
| | 135 |
|
| Certificates of deposit | (73 | ) | | 143 |
| | 70 |
| | (73 | ) | | 40 |
| | (33 | ) | 1,568 |
| | 1,758 |
| | 3,326 |
| | 537 |
| | 751 |
| | 1,288 |
|
| Other Borrowed Funds | (387 | ) | | 129 |
| | (258 | ) | | 150 |
| | (40 | ) | | 110 |
| |
| Redeemable Subordinated Debentures | — |
| | 92 |
| | 92 |
| | — |
| | 72 |
| | 72 |
| |
| Total Interest Expense | (301 | ) | | 641 |
| | 340 |
| | 123 |
| | 399 |
| | 522 |
| |
| Net Interest Income | $ | 2,406 |
| | $ | (217 | ) | | $ | 2,218 |
| | $ | 1,157 |
| | $ | (1,892 | ) | | $ | (735 | ) | |
| Other borrowed funds | | 45 |
| | 31 |
| | 76 |
| | 314 |
| | 93 |
| | 407 |
|
| Redeemable subordinated debentures | | — |
| | 54 |
| | 54 |
| | — |
| | 175 |
| | 175 |
|
| Total interest expense | | 1,557 |
| | 3,156 |
| | 4,713 |
| | 896 |
| | 1,647 |
| | 2,543 |
|
| Net interest income | | $ | 5,175 |
| | $ | (1,357 | ) | | $ | 3,818 |
| | $ | 4,710 |
| | $ | 2,059 |
| | $ | 6,769 |
|
| |
(1) | Tax-equivalent basis, using 21% federal tax rate in 2019. |
20172019 compared to 20162018
For the year ended December 31, 2017,2019, the Company's net interest income, on a fully tax-equivalent basis, increased by $2.2$3.8 million, or 6.3%8.7%, to $37.2$47.8 million compared to $35.0$44.0 million for the year ended December 31, 2016.2018. This increase was due primarily to an increase in average earning assets, as well as an increase in the average yield on earning assets, which were partially offset by an increase in interest expense on average interest-bearing liabilities.
Average earning assets were $1.2 billion with a yield of 5.07% for 2019 compared to average earning assets of $1.1 billion with a yield of 4.81% for 2018. The generally higher interest rate environment during the first half of 2019 compared to 2018 had a positive effect on the yields of construction, commercial business and home equity loans despite a decline of 75 basis points in the Federal Reserve Board’s targeted federal funds rate and the corresponding decrease in the Prime Rate in the third and fourth quarters of 2019.
For the year ended December 31, 2019, interest income on interest earning assets increased by $8.5 million and interest income on average loans increased by $8.3 million as the average total loans increased $132.0 million year over year, reflecting growth in all segments of the loan portfolio. The Shore Merger contributed approximately $33.5 million to the increase in average loans for 2019, which consisted primarily of commercial real estate loans.
Interest expense on average interest-bearing liabilities was $12.8 million, or 1.43%, for the year ended December 31, 2019 compared to $8.0 million, or 1.00%, for the year ended December 31, 2018. The increase of $4.7 million in interest expense on average interest-bearing liabilities primarily reflected higher deposit interest rates and higher borrowing interest rates in 2019 compared to 2018.
During the year ended December 31, 2019, average interest-bearing liabilities increased $89.4 million to $895.0 million. The change in the mix of deposits, with the average balance of money market, NOW and savings accounts lower than, and certificates of deposits higher than, in 2018 also increased the cost of total deposits because certificates of deposit generally have a higher interest cost than non-maturity deposits. The Shore Merger contributed approximately $26.1 million to the increase in average interest-bearing liabilities for 2019.
2018 compared to 2017
For the year ended December 31, 2018, the Company's net interest income, on a fully tax-equivalent basis, increased by $6.8 million, or 18.2%, to $44.0 million compared to $37.2 million for the year ended December 31, 2017. This increase was due primarily to an increase in average earning assets, as well as an increase in the average yield on earning assets, which were partially offset by an increase in interest expense on average interest-bearing liabilities.
Average earning assets were $1.1 billion with a yield of 4.81% for 2018 compared to average earning assets of $975.2 million with a yield of 4.33% for 2017 compared to average earning assets of $944.5 million with a yield of 4.21% for 2016.2017. The 75100 basis point increase in the Federal Reserve’sReserve Board’s targeted federal funds rate and the corresponding increase in the Prime Rate since December of 2016 has2017 had a positive effect on the yields of construction commercial business and warehouse loans with variable interest rate terms. The generally higher interest rate environment in 2018 compared to 2017 also had a positive effect on the yields of commercial real estate and residential real estate loans.
For the year ended December 31, 2017,2018, interest income on interest bearingearning assets increased by $2.6$9.3 million and interest income on average loans increased by $2.3$9.2 million as the average balances of commercial real estate, construction and constructioncommercial business loans grew by $53.5$82.4 million, $22.1 million and $22.2$15.0 million, respectively. For 2017,2018, average loans increased $18.6$116.0 million to $717.0$833.0 million. The NJCB Merger contributed approximately $63.0 million to the increase in average loans for the year ended December 31, 2018, which consisted primarily of commercial real estate loans.
Interest expense on average interest-bearing liabilities was $8.0 million, or 1.00%, for the year ended December 31, 2018 compared to $5.5 million, or 0.75%, for the year ended December 31, 2017 compared to $5.2 million, or 0.71%, for the year ended December 31, 2016.2017. The increase of $340,000$2.5 million in interest expense on interest-bearing liabilities for 20172018 compared to 20162017 primarily reflects higher short-term market interest rates and increased competition for deposits in 20172018 compared to 2016.
2016 compared2017. For 2018, average interest-bearing liabilities increased $73.1 million to 2015
For$805.5 million. The NJCB Merger contributed approximately $60.9 million to the year ended December 31, 2016, the Company's net interest income, on a tax-equivalent basis, decreased by $735,000, or 2.1%, to $35.0 million compared to $35.7 millionincrease in average interest-bearing liabilities for the year ended December 31, 2015. This decrease was due primarily to the decrease in the average yield on interest-earning assets and an increase in interest expense on average interest-bearing liabilities.2018.
Interest expense on average interest-bearing liabilities was $5.2 million, or 0.71%, for the year ended December 31, 2016 compared to $4.6 million, or 0.62%, for the year ended December 31, 2015. The increase of $522,000 in interest expense on interest-bearing liabilities for 2016 compared to 2015 primarily reflects higher short-term market interest rates and increased competition for deposits in 2016 compared to 2015. The Federal Reserve Board increased the targeted federal funds rate in December 2015 by 25 basis points, which impacted short-term market interest rates in 2016.
The lower yield on average interest-earning assets for 2016 reflected primarily the lower yield earned on loans and investments. The yield on loans and investments declined due to the continued low interest rate environment as new loans were originated and investment securities were purchased at yields lower than the average yield on loans and investments, respectively, in the prior year period.
The net interest margin for the year ended December 31, 2016 was 3.70% compared to the 3.90% net interest margin recorded for the year ended December 31, 2015, reflecting a decrease of 20 basis points. The decrease in the Company’s net interest income and net interest margin for the year ended December 31, 2016 compared with the corresponding 2015 period was primarily due to the decrease of 15 basis points in the average yield of interest-earning assets to 4.21% for the year ended December 31, 2016 compared to 4.36% for the year ended December 31, 2015 and the increase in the cost of average interest bearing liabilities to 0.71% for the year ended December 31, 2016 compared to 0.62% for the year ended December 31, 2015.
Provision for Loan Losses
Management considers a complete review of the following specific factors in determining the provisions for loan losses: historical losses by loan category, non-accrual loans and problem loans as identified through internal classifications, collateral values and the growth, size and risk elements of the loan portfolio. In addition to these factors, management takes into consideration current economic conditions and local real estate market conditions.
In general, over the last threefive years, the Company experienced an improvement in loan credit quality and achieved a steady resolution of non-performing loans and assets related to the severe recession, which werewas reflected in the current level of non-performing loans at December 31, 2017.2019. Net charge-offs of commercial business and commercial real estate loans in 2017 andsince 2016 have declined significantly compared tofrom prior years,periods, which has resulted in a reduction of the historical loss factors for these segments of the loan portfolio that were applied by management to estimate the allowance for loan losses at December 31, 2017.2019.
20172019 compared to 20162018
The Company recorded a provision for loan losses of $600,000$1.4 million for the year ended December 31, 2017 and2019 compared to a credit (negative) provision of $300,000$900,000 for the year ended December 31, 2016.2018. For 2017,2019, net charge-offs of $81,000$481,000 were recorded compared to net recoveriescharge-offs of $234,000$511,000 recorded in 2016.2018. The allowance for loan losses at December 31, 20172019 and 20162018 totaled $8.0$9.3 million and $7.5$8.4 million, respectively. The increase in the provision for loan losses for 2017 was primarily attributed to loan growth and an increase in nonperforming loans while the credit (negative) provision for loan losses for 20162019 was primarily attributed to the net recovery of loans previously charged off.
At December 31, 2017, non-performing loans totaled $7.1 million compared to $5.2 million at December 31, 2016, an increase of $1.9 million, or 37.5%, and the ratio of non-performing loans to total loans increased to 0.90% at December 31, 2017 from 0.72% at December 31, 2016.
2016 compared to 2015
The Company recorded a credit (negative) provision of $300,000 for the year ended December 31, 2016 and a provision of $1.1 million for the year ended December 31, 2015. Net recoveries of $234,000 were recorded for the year ended December 31, 2016 compared to net charge-offs of $465,000 recorded for the year ended December 31, 2015. The allowance for loan losses at December 31, 2016 and 2015 totaled $7.5 million and $7.6 million, respectively. The decreasegrowth in the provision for loan losses for 2016 was primarily attributed to the net recovery of loans previously charged off and the lower historical loan loss factors, which reflected the improvement in loan credit quality, the resolution of non-performing loans and the significant reduction of net charge-offs of commercial and commercial real estate loans in 2016.and mortgage warehouse loans.
.
At December 31, 2016,2019, non-performing loans decreased by $822,000, or 13.7%,totaled $4.5 million compared to $5.2 million from $6.0$6.6 million at December 31, 20152018, a decrease of $2.1 million, or 31.7%, and the ratio of non-performing loans to total loans decreased to 0.72%0.37% at December 31, 2016 compared to 0.88%2019 from 0.75% at December 31, 2015.2018.
2018 compared to 2017
The Company recorded a provision for loan losses of $900,000 for the year ended December 31, 2018 compared to a provision of $600,000 for the year ended December 31, 2017. For 2018, net charge-offs of $511,000 were recorded compared to net charge-offs of $81,000 in 2017. The allowance for loan losses at December 31, 2018 and 2017 totaled $8.4 million and $8.0 million, respectively. The increase in the provision for loan losses for 2018 was primarily attributed to the growth of commercial real estate, construction and commercial business loans and the change in the mix of loans in the loan portfolio.
At December 31, 2018, non-performing loans totaled $6.6 million compared to $7.1 million at December 31, 2017, a decrease of $534,000, or 7.5%, and the ratio of non-performing loans to total loans decreased to 0.75% at December 31, 2018 from 0.90% at December 31, 2017.
Non-Interest Income
20172019 compared to 20162018
Total non-interest income for the year ended December 31, 20172019 increased $319,000 to $8.2 million from $6.9$7.9 million for the year ended December 31, 2016.2018. This revenue component represented 19% and 17%15% of the Company’s net revenues for the years ended December 31, 20172019 and 2016, respectively.2018.
Service charges on deposit accounts decreasedincreased by $119,000$25,000 to $596,000$663,000 for the year ended December 31, 20172019 compared to $715,000$638,000 for the year ended December 31, 20162018 due primarilyin part to declinesthe increase in insufficient funds charges.deposit accounts as a result of the Shore Merger.
Gains on sales of loans held for sale increased $1.3 million$410,000 to $5.1$4.9 million for the year ended December 31, 20172019 compared to $3.8$4.5 million for the year ended December 31, 2016. The Company sells both residential mortgage loans and portions of commercial business loans guaranteed by the Small Business Administration ("SBA") in the secondary market.
Gains on the sale of residential mortgage loans were $3.9 million in 2017 compared to $2.2 million in 2016. In 2017, $121.1 million of residential mortgage loans were sold compared to $88.1 million in 2016. The increase in the residential lending activity and gains on the sale of loans was due primarily to the hiring of a new residential lending team in July of 2016.
In 2017, $13.3 million of SBA loans were sold and generated net gains of $1.2 million compared to SBA loans sold and net gains of $17.0 million and $1.6 million, respectively, in 2016.
Non-interest income also includes income from Bank-owned life insurance (“BOLI”), which totaled $522,000 for the year ended December 31, 2017 compared to $549,000 for the year ended December 31, 2016.
The Company also generates non-interest income from a variety of fee-based services. These include safe deposit box rentals, wire transfer service fees and Automated Teller Machine fees for non-Bank customers. The other income component of non-interest income was $1.8 million for the year ended December 31, 2017 compared to $1.9 million for the year ended December 31, 2016.
2016 compared to 2015
Total non-interest income for the year ended December 31, 2016 increased to $6.9 million from $6.6 million for the year ended December 31, 2015. This revenue component represented 17% and 16% of the Company’s net revenues for the years ended December 31, 2016 and 2015, respectively. In 2015, total non-interest income was negatively impacted by a $692,000 loss on the sale of OREO that was included in other income. Excluding the effect of the loss, non-interest income would have declined $270,000 in 2016 compared to 2015.
Service charges on deposit accounts decreased by $103,000 to $715,000 for the year ended December 31, 2016 compared to $818,000 for the year ended December 31, 2015 due primarily to declines in insufficient funds charges.
Gains on sales of loans held for sale decreased $254,000 to $3.8 million for the year ended December 31, 2016 compared to $4.0 million for the year ended December 31, 2015.2018. The Company sells both residential mortgage loans and portions of commercial business loans guaranteed by the SBA in the secondary market.
Gains on the sale of residential mortgage loans were $2.2$3.9 million in 20162019 compared to $2.3$2.6 million in 2015.2018. In 2016, $88.12019, $132.2 million of residential mortgage loans were sold compared to $136.4$89.1 million in 2015.2018. The declineincrease in residential mortgage loans sold was due primarily to higher residential mortgage lending activity during 2019 compared to 2018 due in part to a higher level of refinancing activity.
In 2019, $11.7 million of SBA loans were sold and generated net gains of $930,000 compared to SBA loans sold and net gains of $23.3 million and $1.9 million, respectively, in 2018. SBA guaranteed commercial lending activity and loan sales vary from period to period based on customer demand.
Non-interest income also includes income from Bank-owned life insurance (“BOLI”), which totaled $623,000 for the year ended December 31, 2019 compared to $575,000 for the year ended December 31, 2018. The increase was due primarily to a $7.2 million increase in BOLI resulting from the Shore Merger.
The Company also generates non-interest income from a variety of fee-based services. These include safe deposit box rentals, wire transfer service fees and ATM fees for non-Bank customers. The other income component of non-interest income was $2.0 million for the years ended December 31, 2019 and 2018.
2018 compared to 2017
Total non-interest income for the year ended December 31, 2018 decreased $322,000 to $7.9 million from $8.2 million for the year ended December 31, 2017. This revenue component represented 15% and 19% of the Company’s net revenues for the years ended December 31, 2018 and 2017, respectively.
Service charges on deposit accounts increased by $42,000 to $638,000 for the year ended December 31, 2018 compared to $596,000 for the year ended December 31, 2017 due primarily to the increase in deposit accounts as a result of the NJCB Merger.
Gains on sales of loans held for sale decreased $674,000 to $4.5 million for the year ended December 31, 2018 compared to $5.1 million for the year ended December 31, 2017. The Company sells both residential mortgage loans and portions of commercial business loans guaranteed by the SBA in the secondary market.
Gains on the sale of residential mortgage loans were $2.6 million in 2018 compared to $3.9 million in 2017. In 2018, $89.1 million of residential mortgage loans were sold compared to $121.1 million in 2017. The decrease in the residential lending activity and gains on the sale of loans was due primarily to the turnover of personnel that occurred in the first two quarters of 2016, which significantly reduced thelower volume of loans originated and sold in 2016. In July 2016, the Bank hired a new residential lending team of 20 employees, which included residential mortgage loan originators and operations personnel, and the pace of residential lending activity and gains on the saleloans sold in 2018 as a result of loans increased.higher mortgage interest rates in 2018 compared to 2017.
In 2016, $17.02018, $23.3 million of SBA loans were sold and generated net gains of $1.6$1.9 million compared to SBA loans sold and net gains of $17.5$13.3 million and $1.7$1.2 million, respectively, in 2015.
2017.
Income from BOLINon-interest income also includes income fromBOLI, which totaled $549,000$575,000 for the year ended December 31, 20162018 compared to $558,000$522,000 for the year ended December 31, 2015. 2017. The increase was due primarily to a $3.7 million increase in BOLI resulting from the NJCB Merger.
The acquisition method of accounting for the business combination with NJCB resulted in the recognition of a gain on bargain purchase of $230,000 from the NJCB Merger.
OtherThe Company also generates non-interest income includingfrom a variety of fee-based services. These include safe deposit box rental income,rentals, wire transfer service fees and Automated Teller MachineATM fees totaled $1.9 million and $1.2for non-Bank customers. The other income component of non-interest income was $2.0 million for the yearsyear ended December 31, 2016 and 2015, respectively. Other income in 2015 was negatively impacted by2018 compared to $1.8 million for the loss on the sale of OREO of $692,000.year ended December 31, 2017.
Non-Interest Expenses
The following table presents the major components of non-interest expense:
| | | | Year ended December 31, | Year ended December 31, |
| (In thousands) | 2017 | | 2016 | | 2015 | 2019 | | 2018 | | 2017 |
| Salaries and employee benefits | $ | 18,804 |
| | $ | 16,543 |
| | $ | 15,589 |
| $ | 21,304 |
| | $ | 19,853 |
| | $ | 18,804 |
|
| Occupancy expense | 3,169 |
| | 3,243 |
| | 3,362 |
| 4,100 |
| | 3,623 |
| | 3,169 |
|
| Data processing expenses | 1,314 |
| | 1,277 |
| | 1,211 |
| 1,507 |
| | 1,332 |
| | 1,314 |
|
| Equipment expense | 1,008 |
| | 917 |
| | 939 |
| 1,286 |
| | 1,175 |
| | 1,008 |
|
| Marketing | 225 |
| | 240 |
| | 282 |
| 302 |
| | 280 |
| | 225 |
|
| Telephone | 389 |
| | 377 |
| | 449 |
| 400 |
| | 391 |
| | 389 |
|
| Regulatory, professional and consulting fees | 2,263 |
| | 1,706 |
| | 1,681 |
| 1,806 |
| | 1,713 |
| | 2,263 |
|
| Insurance | 373 |
| | 303 |
| | 324 |
| 391 |
| | 375 |
| | 373 |
|
| Merger-related expenses | 265 |
| | — |
| | — |
| 1,730 |
| | 2,141 |
| | 265 |
|
| FDIC insurance expense | 360 |
| | 453 |
| | 660 |
| 154 |
| | 486 |
| | 360 |
|
| Other real estate owned expenses | 42 |
| | 74 |
| | 734 |
| 171 |
| | 158 |
| | 42 |
|
| Amortization of intangible assets | 384 |
| | 404 |
| | 428 |
| 140 |
| | 318 |
| | 384 |
|
| Supplies | 259 |
| | 219 |
| | 248 |
| 275 |
| | 294 |
| | 259 |
|
| Other expenses | 2,151 |
| | 1,535 |
| | 1,540 |
| 1,983 |
| | 1,946 |
| | 2,151 |
|
| Total | $ | 31,006 |
| | $ | 27,291 |
| | $ | 27,447 |
| $ | 35,549 |
| | $ | 34,085 |
| | $ | 31,006 |
|
20172019 compared to 20162018
For the year ended December 31, 2017,2019, non-interest expenses totaled $31.0$35.5 million, an increase of $3.7$1.5 million, or 13.6%4.3%, when compared to $27.3$34.1 million for the year ended December 31, 2016.2018. The increase in non-interest expenses included increases in salaries and employee benefit expenses, occupancy expense, data processing expenses and other expenses related to the addition of the Shore operations, offset by a decrease in merger-related expenses and FDIC insurance expense.
Salaries and employee benefits, which represent the largest portion of non-interest expenses, increased by $1.5 million, or 7.3%, to $21.3 million compared to $19.9 million for the year ended December 31, 2018 due primarily to a $585,000 increase in commissions paid as a result of the higher level of residential mortgage lending activity, salaries for former Shore employees ($298,000) who joined the Company following the Shore Merger in November 2019, salaries for former NJCB employees
($169,000) who joined the Company following the NJCB Merger in the second quarter of 2018, merit increases and increases in employee benefits expenses. Cash incentive compensation and employee health benefits increased $241,000 and $162,000, respectively, during 2019. At December 31, 2019, there were 218 full-time equivalent employees compared to 189 full-time equivalent employees at December 31, 2018.
Occupancy expense totaled $4.1 million in 2019 compared to $3.6 million in 2018, increasing $477,000, or 13.2%, from 2018 to 2019 due primarily to the addition of the five former Shore branch offices ($129,000) in the fourth quarter of 2019 and the addition of two former NJCB branch offices ($123,000) in the second quarter of 2018.
For the years ended December 31, 2019 and 2018, equipment expense was $1.3 million and $1.2 million, respectively, reflecting an increase of $112,000, or 9.5%, from 2018 to 2019.
The cost of data processing services increased $175,000 to $1.5 million for the year ended December 31, 2019 compared to $1.3 million for the year ended December 31, 2018, due primarily to the addition of the Shore operations ($63,000) following the closing of the Shore Merger and increases in loans, deposits and other customer services.
Regulatory, professional and consulting fees increased by $93,000 to $1.8 million for the year ended December 31, 2019 compared to $1.7 million for the year ended December 31, 2018, due primarily to general increases in legal and consulting fees.
Shore Merger-related expenses of $1.7 million were incurred for the year ended December 31, 2019 compared to NJCB Merger-related expenses of $2.1 million incurred for the year ended December 31, 2018.
The Company recorded FDIC insurance expense of $154,000 for the year ended December 31, 2019 compared to $486,000 for the year ended December 31, 2018, representing a decrease of $332,000, due primarily to the receipt from FDIC of the small bank assessment credit for the second and the third quarters of 2019 and the reduction in the FDIC assessment rate. The Bank has a remaining credit of approximately $123,000 that may be applied by the FDIC to future quarters’ assessments. The application and receipt of future credits will depend on future reserve calculations for the Deposit Insurance Fund of the FDIC.
Amortization of intangible assets decreased $178,000 to $140,000 for the year ended December 31, 2019 compared to $318,000 for the year ended December 31, 2018 due primarily to the full amortization of the core deposit intangible in 2018 related to the acquisition of three branch offices and their deposits in 2011.
Other expenses totaled $1.9 million for the year ended December 31, 2019, representing an increase of $36,000 over the same period in the prior year, due primarily to general increases in various other operating expense categories.
2018 compared to 2017
For the year ended December 31, 2018, non-interest expenses totaled $34.1 million, an increase of $3.1 million, or 9.9%, when compared to $31.0 million for the year ended December 31, 2017. The increase in non-interest expenses included increases in salaries and employee benefit expenses, occupancy expense, NJCB merger-related expenses and expenses related to the addition of the NJCB operations, which were partially offset by a decrease in regulatory, professional and consulting fees and merger-related expenses.fees.
Salaries and employee benefits, which represents the largest portion of non-interest expenses, increased by $2.3$1.0 million, or 13.7%5.6%, to $18.8$19.9 million compared to $16.5$18.8 million for the year ended December 31, 20162017 due primarily to increases in commissions paid to residential loan officers and stock-based compensation expense, normalsalaries for former NJCB employees who joined the Company, merit increases and increases in employee health benefit costs. Commissions paid to residential loan officers increased by $643,000 as a result of a higher volume of residential mortgage loans originated during 2017. Stock-based compensation and cashbenefits expenses. Cash incentive compensation increased $292,000 and $151,000, respectively, during 2017 and employee health benefits increased $252,000$90,000 and $155,000, respectively, during 2017. The increase also reflects the full year effect of the increase in staff in the residential mortgage department, which accounted for $426,000 of the increase in salaries and employee benefits.2018. At December 31, 2017,2018, there were 179189 full-time equivalent employees compared to 199179 full-time equivalent employees at December 31, 2016.2017.
Occupancy expense totaled $3.6 million in 2018 compared to $3.2 million for bothin 2017, and 2016, decreasing $74,000,increasing $454,000, or 2.3%14.3%, from 20162017 to 20172018 due primarily to a decrease in depreciation expense. the addition of the two former NJCB branch offices.
For the years ended December 31, 20172018 and 2016,2017, equipment expense was $1.0$1.2 million and $917,000,$1.0 million, respectively, reflecting an increase of $91,000,$167,000, or 9.9%16.6%, from 20162017 to 2017.2018.
The cost of data processing services remained relatively flat at $1.3 million for the years ended December 31, 20172018 and 2016.2017.
Marketing expenses were $280,000 for the year 2018, an increase of $55,000 compared with $225,000 in 2017. The majority of the increase was primarily related to marketing of the Bank's products and services to the former customers of NJCB.
Regulatory, professional and consulting fees increased by $557,000, or 32.7%, to $2.3 million for the year ended December 31, 2017 compared to $1.7 million for the year ended December 31, 2016. The level of regulatory, professional and consulting fees has increased over the last several years due primarily to compliance with increased regulatory requirements, management of enterprise risk and information security and increased external and internal professional audit fees as well as loan collection and litigation costs. .
FDIC insurance expense decreased to $360,000 for the year ended December 31, 2017 compared to $453,000 for the year ended December 31, 2016 due to a lower assessment rate that reflected the improvement in asset quality and the continued improvement in the Company's financial performance in 2017.
OREO expenses decreased to $42,000 in 2017 from $74,000 for 2016 due primarily to the low amount of OREO assets held during 2017. At December 31, 2017, the Company held no OREO compared to one commercial real estate property with a carrying value of $166,000 held as OREO at December 31, 2016. In 2017 and 2016, the Company sold $626,000 and $1.0 million of OREO properties, respectively.
Amortization of intangible assets decreased $20,000 to $384,000 for the year ended December 31, 2017 compared to $404,000 for the year ended December 31, 2016 due to the lower amortization of core deposit intangibles.
Other expenses were $2.2 million for the year ended December 31, 2017 compared to $1.5 million for the year ended December 31, 2016. During 2017, management updated its deferred loan origination cost analysis and methodology, which resulted in the identification of approximately $500,000 of deferred loan origination costs at December 31, 2016 that were charged to expense in the first quarter of 2017. The balance of the increase was due to smaller increases in various expense categories.
2016 compared to 2015
Total non-interest expenses decreased by $156,000,$550,000, or 0.6%, to $27.3 million for the year ended December 31, 2016 from $27.4 million for the year ended December 31, 2015. The decrease in non-interest expenses included decreases in OREO expense, FDIC insurance expense and occupancy expense, which were partially offset by an increase in salaries and employee benefit expenses.
Salaries and employee benefits increased by $954,000, or 6.1%, to $16.5 million for the year ended December 31, 2016 compared to $15.6 million for the year ended December 31, 2015. The increase in salaries and employee benefits for 2016 was due primarily to an increase in salaries for additional commercial loan, business development and residential mortgage personnel, increases in commissions paid to residential loan officers, regular merit increases and increased employee health benefit costs. At December 31, 2016, there were 199 full-time equivalent employees compared to 195 full-time equivalent employees at December 31, 2015.
Occupancy expense decreased by $119,000, or 3.5%, to $3.2 million for 2016 compared to $3.4 million for 2015. The decrease in occupancy expense for the year ended December 31, 2016 was primarily attributable to a decrease in depreciation expense, which was partially offset by increases in rent and real estate tax expense related to the addition of four residential loan production offices in the third quarter of 2016.
The cost of data processing services increased to $1.3 million for the year ended December 31, 2016 from $1.2 million for the year ended December 31, 2015 and reflects the growth of the loan portfolio and the increase in deposits.
Regulatory, professional and consulting fees increased slightly by $25,000, or 1.5%24.3%, to $1.7 million for the year ended December 31, 20162018 compared to $1.7$2.3 million for the year ended December 31, 2015.2017. The level of regulatory, professional and consulting fees has increased over the last several yearsdeclined due primarily to compliance with increased regulatory requirements, management of enterprise risklower legal and information security and increased external and internal professional auditconsulting fees related to loan collections and litigation expenses.
Merger-related expenses of $2.1 million related to the implementationNJCB Merger were incurred in 2018 compared to $265,000 in 2017.
FDIC insurance expense increased to $486,000 for the year ended December 31, 2018 compared to $360,000 for the year ended December 31, 2017 due primarily to the internal growth of assets and the increase in assets as a result of the COSO 2013 internal control framework in 2015 and management's required 2016 year-end attestation regarding internal controls on financial reporting (Section 404 of the Sarbanes-Oxley Act).NJCB Merger.
OREO expenses decreased by $660,000increased to $74,000$158,000 in 2018 from $42,000 for 2016 compared to $734,000 for 20152017 due primarily to the significant reductionan increase in OREO assets in 2015. OREO expenses for 2015 included approximately $382,000 of write-downs of OREO.held during 2018. At December 31, 2016,2018, the Company held one commercial$2.5 million in OREO compared to no OREO held at December 31, 2017. The Company incurred expenses in connection with general maintenance, insurance and real estate taxes. OREO at December 31, 2018 was comprised of one residential property with a carrying value of $166,000 as OREO compared to one commercial real estate property$1.1 million acquired in the NJCB Merger, land with a carrying value of $1.0 million at December 31, 2015. In 2016$93,000 and 2015, the Company sold $1.0 million and $6.0 million of OREO properties, respectively.
FDIC insurance expense decreased to $453,000 for the year ended December 31, 2016 compared to $660,000 for the year ended December 31, 2015 due to a lower assessment ratecommercial real estate property that reflected the improvement in asset quality and the continued improvementwas foreclosed in the Company's financial performance in 2016.third quarter of 2018 with a fair value of $1.3 million.
Amortization of intangible assets decreased $24,000$66,000 to $404,000$318,000 for the year ended December 31, 20162018 compared to $428,000$384,000 for the year ended December 31, 20152017 due to the lower amortization of core deposit intangibles.intangible assets.
Supplies increased $35,000 to $294,000 in 2018 compared to $259,000 in 2017. The majority of the increase was related to the NJCB Merger.
Other operating expenses were $1.5$1.9 million for the yearsyear ended December 31, 2016 and 2015, respectively.2018 compared to $2.2 million for the year ended December 31, 2017. The decrease in other expenses was due primarily to the absence in the 2018 period of any write-off of deferred loan origination costs, which were approximately $500,000 in 2017, which was partially offset by increases in various other expense categories.
Income Taxes
20172019 compared to 20162018
The Company recorded income tax expense of $5.9$5.0 million in 20172019, resulting in an effective tax rate of 27.0%, compared to income tax expense of $4.6$4.3 million in 2016.2018, which resulted in an effective tax rate of 26.4%. The increasehigher effective tax rate in
2019 was primarily the result of the higher amount of pre-tax income taxed at the combined marginal federal and state statutory tax expenserate of 30.08% and the non-taxable gain from the bargain purchase in 2017the NJCB Merger in 2018.
2018 compared to 2016 was primarily due to the recording of additional estimated2017
The Company recorded income tax expense of $4.3 million in 2018, resulting in a effective tax rate of 26.4%, compared to income tax expense of $5.9 million in 2017, which resulted in an effective tax rate of 45.9%. Income tax expense for 2017 includes $1.7 million of additional income tax expense due to the revaluation of the deferred tax assets as a result of the enactment of the Tax Cuts and Jobs Act (“Tax Act”).in December 2017. Absent the $1.7 million of additional income tax expense, the effective tax rate would have been 32.5% for 2017. The Tax Act reduced the maximum federal corporate income tax rate to 21% from 35%, effective January 1, 2018, which requiredexplains the Company to revalue its deferred tax assets.
Thelower effective tax rate in 2018. Partially offsetting the lower federal corporate income tax rate was the enactment of legislation by the State of New Jersey in July 2018, which increased the corporate income tax rate to 11.5% from 9% for 2017 was 45.9%taxable income of $1.0 million or more effective January 1, 2018 and absent the additional $1.7 million of tax expense, it would have been 32.5%. Theresulted in a 2% higher effective tax rate for 2016 was 33.2%.in 2018.
2016 compared to 2015
The Company recorded income tax expense of $4.6 million for 2016 compared to income tax expense of $4.1million for 2015 primarily due to a $1.2 million increase in pre-tax income for 2016 compared to 2015. The Company’s effective tax rate increased to 33.2% in 2016 from 31.9% in 2015 due to the lower proportion of tax exempt interest income to pre-tax income in 2016 compared to 2015.
Financial Condition
Cash and Cash Equivalents
At December 31, 2017,2019, cash and cash equivalents totaled $18.8$14.8 million compared to $14.9$16.8 million at December 31, 2016. 2018.
Investment Securities
Amortized cost, gross unrealized gains and losses and the fair value by security type for the available for sale portfolio at December 31, 20172019 and 2016 are2018 were as follows:
|
| | | | | | | | | | | | | | | |
| | 2017 |
| | | | Gross | | Gross | | |
| | Amortized | | Unrealized | | Unrealized | | Fair |
| (In thousands) | Cost | | Gains | | Losses | | Value |
| U.S. treasury securities and obligations of U.S. government-sponsored corporations ("GSE") | $ | 1,997 |
| | $ | — |
| | $ | (30 | ) | | $ | 1,967 |
|
| Residential collateralized mortgage obligations - GSE | 27,688 |
| | 18 |
| | (381 | ) | | 27,325 |
|
| Residential mortgage-backed securities - GSE | 14,231 |
| | 129 |
| | (72 | ) | | 14,288 |
|
| Obligations of state and political subdivisions | 19,575 |
| | 227 |
| | (82 | ) | | 19,720 |
|
| Single-issuer trust preferred debt securities | 2,481 |
| | — |
| | (132 | ) | | 2,349 |
|
| Corporate debt securities | 27,917 |
| | 14 |
| | (248 | ) | | 27,683 |
|
| Other debt securities | 12,140 |
| | 12 |
| | (26 | ) | | 12,126 |
|
| Total | $ | 106,029 |
| | $ | 400 |
| | $ | (971 | ) | | $ | 105,458 |
|
|
| | | | | | | | | | | | | | | |
| | 2019 |
| | | | Gross | | Gross | | |
| | Amortized | | Unrealized | | Unrealized | | Fair |
| (In thousands) | Cost | | Gains | | Losses | | Value |
| U.S. treasury securities and obligations of U.S. government-sponsored corporations ("GSE") | $ | 774 |
| | $ | — |
| | $ | (10 | ) | | $ | 764 |
|
| Residential collateralized mortgage obligations - GSE | 53,223 |
| | 194 |
| | (242 | ) | | 53,175 |
|
| Residential mortgage-backed securities - GSE | 18,100 |
| | 292 |
| | (5 | ) | | 18,387 |
|
| Obligations of state and political subdivisions | 33,177 |
| | 342 |
| | — |
| | 33,519 |
|
| Single-issuer trust preferred debt securities | 1,492 |
| | — |
| | (50 | ) | | 1,442 |
|
| Corporate debt securities | 23,224 |
| | 139 |
| | (84 | ) | | 23,279 |
|
| Other debt securities | 25,378 |
| | 80 |
| | (242 | ) | | 25,216 |
|
| Total | $ | 155,368 |
| | $ | 1,047 |
| | $ | (633 | ) | | $ | 155,782 |
|
| | | | 2016 | 2018 |
| | | | Gross | | Gross | | | | | Gross | | Gross | | |
| | Amortized | | Unrealized | | Unrealized | | Fair | Amortized | | Unrealized | | Unrealized | | Fair |
| (In thousands) | Cost | �� | Gains | | Losses | | Value | Cost | | Gains | | Losses | | Value |
| U.S. treasury securities and obligations of U.S. government-sponsored corporations ("GSE") | $ | 3,514 |
| | $ | — |
| | $ | (35 | ) | | $ | 3,479 |
| $ | 2,993 |
| | $ | — |
| | $ | (41 | ) | | $ | 2,952 |
|
| Residential collateralized mortgage obligations-GSE | 22,647 |
| | 58 |
| | (145 | ) | | 22,560 |
| 48,789 |
| | 70 |
| | (676 | ) | | 48,183 |
|
| Residential mortgage backed securities – GSE | 31,207 |
| | 388 |
| | (119 | ) | | 31,476 |
| 13,945 |
| | 37 |
| | (100 | ) | | 13,882 |
|
| Obligations of state and political subdivisions | 21,604 |
| | 152 |
| | (356 | ) | | 21,400 |
| 23,506 |
| | 85 |
| | (249 | ) | | 23,342 |
|
| Trust preferred debt securities – single issuer | 2,478 |
| | — |
| | (206 | ) | | 2,272 |
| 1,490 |
| | — |
| | (161 | ) | | 1,329 |
|
| Corporate debt securities | 21,963 |
| | 10 |
| | (205 | ) | | 21,768 |
| 28,323 |
| | — |
| | (1,037 | ) | | 27,286 |
|
| Other debt securities | 845 |
| | — |
| | (6 | ) | | 839 |
| 15,383 |
| | 11 |
| | (146 | ) | | 15,248 |
|
| Total | $ | 104,258 |
| | $ | 608 |
| | $ | (1,072 | ) | | $ | 103,794 |
| $ | 134,429 |
| | $ | 203 |
| | $ | (2,410 | ) | | $ | 132,222 |
|
Amortized cost, carrying value, gross unrealized gains and losses and the fair value by security type for the held to maturity portfolio at December 31, 20172019 and 2016 are2018 were as follows:
| | | | 2017 | 2019 |
| (In thousands) | Amortized Cost | | Other-Than- Temporary Impairment Recognized In Accumulated Other Comprehensive Loss | | Carrying Value | | Gross Unrealized Gains | | Gross Unrealized Losses | | Fair Value | Amortized Cost | | Other-Than- Temporary Impairment Recognized In Accumulated Other Comprehensive Loss | | Carrying Value | | Gross Unrealized Gains | | Gross Unrealized Losses | | Fair Value |
| U. S. treasury securities and obligations of U.S.government sponsored corporations (“GSE”) | $ | 3,234 |
| | $ | — |
| | $ | 3,234 |
| | $ | — |
| | $ | (84 | ) | | $ | 3,150 |
| |
Residential collateralized mortgage obligations – GSE | 8,701 |
| | — |
| | 8,701 |
| | 94 |
| | (123 | ) | | 8,672 |
| |
Residential collateralized mortgage obligations - GSE | | $ | 5,117 |
| | $ | — |
| | $ | 5,117 |
| | $ | 76 |
| | $ | (35 | ) | | $ | 5,158 |
|
Residential mortgage backed securities- GSE | 34,072 |
| | — |
| | 34,072 |
| | 231 |
| | (127 | ) | | 34,176 |
| 36,528 |
| | — |
| | 36,528 |
| | 481 |
| | (54 | ) | | 36,955 |
|
| Obligations of state and political subdivisions | 63,797 |
| | — |
| | 63,797 |
| | 1,224 |
| | (35 | ) | | 64,986 |
| 32,533 |
| | — |
| | 32,533 |
| | 690 |
| | (25 | ) | | 33,198 |
|
| Trust preferred debt securities - pooled | 657 |
| | (501 | ) | | 156 |
| | 418 |
| | — |
| | 574 |
| 657 |
| | (492 | ) | | 165 |
| | 479 |
| | — |
| | 644 |
|
| Other debt securities | 307 |
| | — |
| | 307 |
| | — |
| | — |
| | 307 |
| 2,277 |
| | — |
| | 2,277 |
| | — |
| | (9 | ) | | 2,268 |
|
| Total | $ | 110,768 |
| | $ | (501 | ) | | $ | 110,267 |
| | $ | 1,967 |
| | $ | (369 | ) | | $ | 111,865 |
| $ | 77,112 |
| | $ | (492 | ) | | $ | 76,620 |
| | $ | 1,726 |
| | $ | (123 | ) | | $ | 78,223 |
|
| | | | 2016 | 2018 |
| (Dollars in thousands) | Amortized Cost | | Other-Than- Temporary Impairment Recognized In Accumulated Other Comprehensive Loss | | Carrying Value | | Gross Unrealized Gains | | Gross Unrealized Losses | | Fair Value | Amortized Cost | | Other-Than- Temporary Impairment Recognized In Accumulated Other Comprehensive Loss | | Carrying Value | | Gross Unrealized Gains | | Gross Unrealized Losses | | Fair Value |
| U. S. treasury securities and obligations of U.S. government sponsored corporations (“GSE”) | $ | 3,727 |
| | $ | — |
| | $ | 3,727 |
| | $ | — |
| | $ | (116 | ) | | $ | 3,611 |
| |
| Residential collateralized mortgage obligations – GSE | 11,882 |
| | — |
| | 11,882 |
| | 247 |
| | (130 | ) | | 11,999 |
| $ | 6,701 |
| | $ | — |
| | $ | 6,701 |
| | $ | 30 |
| | $ | (143 | ) | | $ | 6,588 |
|
| Residential mortgage backed securities -GSE | 40,565 |
| | — |
| | 40,565 |
| | 540 |
| | (113 | ) | | 40,992 |
| |
| Residential mortgage backed securities - GSE | | 31,343 |
| | — |
| | 31,343 |
| | 84 |
| | (346 | ) | | 31,081 |
|
| Obligations of state and political subdivisions | 70,017 |
| | — |
| | 70,017 |
| | 1,274 |
| | (255 | ) | | 71,036 |
| 38,494 |
| | — |
| | 38,494 |
| | 634 |
| | (118 | ) | | 39,010 |
|
| Trust preferred debt securities - pooled | 657 |
| | (501 | ) | | 156 |
| | 303 |
| | — |
| | 459 |
| 657 |
| | (501 | ) | | 156 |
| | 569 |
| | — |
| | 725 |
|
| Other debt securities | 463 |
| | — |
| | 463 |
| | — |
| | (1 | ) | | 462 |
| 2,878 |
| | — |
| | 2,878 |
| | — |
| | (78 | ) | | 2,800 |
|
| Total | $ | 127,311 |
| | $ | (501 | ) | | $ | 126,810 |
| | $ | 2,364 |
| | $ | (615 | ) | | $ | 128,559 |
| $ | 80,073 |
| | $ | (501 | ) | | $ | 79,572 |
| | $ | 1,317 |
| | $ | (685 | ) | | $ | 80,204 |
|
The investment securities portfolio totaled $215.7$232.4 million, or 20.0%14.7% of total assets, at December 31, 20172019 compared to $230.6$211.8 million, or 22.2%18.0% of total assets, at December 31, 2016.2018. Proceeds from maturities and prepayments for the year ended December 31, 20172019 totaled $75.7$58.0 million while purchases of investment securities totaled $70.3$50.2 million during this period. Proceeds on sales of investment securities totaled $8.6 million with net gains totaling $129,000 for the year ended December 31, 2017. On an average balance basis, the investment securities portfolio represented 23.6%18.5% and 23.8%20.6% of average interest-earning assets for the years ended December 31, 20172019 and 2016,2018, respectively.
Securities available for sale are investments that may be sold in response to changing market and interest rate conditions or for other business purposes. Activity in this portfolio is undertaken primarily to manage liquidity and interest rate risk and to take advantage of market conditions that create more economically attractive returns. At December 31, 2017,2019, available-for-sale securities amounted to $105.5$155.8 million, which was an increase of $1.7$23.6 million from $103.8$132.2 million at December 31, 2016.2018.
The following table sets forth certain information regarding the amortized cost, carrying value, fair value, weighted average yields and contractual maturities of the Company’s investment portfolio as of December 31, 2017.2019. Expected maturities will differ from contractual maturities because borrowersissuers may have the right to call or prepay obligations with or without call or prepayment penalties.
| | | (Dollars in thousands) | Amortized cost | |
Fair Value | | Yield | Amortized cost | |
Fair Value | | Yield |
| Available for sale | | | | | | | | | | |
| Due in one year or less | $ | 473 |
| | $ | 473 |
| | 1.84 | % | $ | 10,690 |
| | $ | 10,662 |
| | 2.66 | % |
| Due after one year through five years | 24,661 |
| | 24,612 |
| | 2.54 |
| 26,621 |
| | 26,824 |
| | 2.75 |
|
| Due after five years through ten years | 27,307 |
| | 27,131 |
| | 2.72 |
| 34,136 |
| | 34,193 |
| | 2.55 |
|
| Due after ten years | 53,588 |
| | 53,242 |
| | 2.69 |
| 83,921 |
| | 84,103 |
| | 2.75 |
|
| Total | $ | 106,029 |
| | $ | 105,458 |
| | 2.66 | % | $ | 155,368 |
| | $ | 155,782 |
| | 2.70 | % |
|
| | | | | | | | | | |
| (Dollars in thousands) | Carrying Value | |
Fair Value | | Yield |
| Held to maturity | | | | | |
| Due in one year or less | $ | 28,750 |
| | $ | 28,780 |
| | 1.89 | % |
| Due after one year through five years | 17,793 |
| | 18,419 |
| | 4.85 |
|
| Due after five years through ten years | 18,845 |
| | 19,235 |
| | 3.55 |
|
| Due after ten years | 44,879 |
| | 45,431 |
| | 3.09 |
|
| Total | $ | 110,267 |
| | $ | 111,865 |
| | 3.14 | % |
|
| | | | | | | | | | |
| (Dollars in thousands) | Carrying Value | |
Fair Value | | Yield |
| Held to maturity | | | | | |
| Due in one year or less | $ | 6,594 |
| | $ | 6,664 |
| | 3.88 | % |
| Due after one year through five years | 13,573 |
| | 13,803 |
| | 3.67 |
|
| Due after five years through ten years | 18,410 |
| | 18,766 |
| | 3.15 |
|
| Due after ten years | 38,043 |
| | 38,990 |
| | 3.11 |
|
| Total | $ | 76,620 |
| | $ | 78,223 |
| | 3.28 | % |
Proceeds from maturities and prepayments of securities available for sale amounted to $25.8$39.1 million for the year ended December 31, 20172019 compared to $23.4$17.7 million for the year ended December 31, 2016.2018. At December 31, 2017,2019, the portfolio had
net unrealized lossesgains of $571,000$414,000 compared to net unrealized losses of $464,000$2.2 million at December 31, 2016.2018. These unrealized gains or losses are reflected net of tax in shareholders’ equity as a component of accumulated other comprehensive income (loss).
Securities held to maturity, which are carried at amortized historical cost, are investments for which there is the positive intent and ability to hold to maturity. At December 31, 2017,2019, securities held to maturity were $110.3$76.6 million, reflecting a decrease of $16.5$3.0 million from $126.8$79.6 million at December 31, 2016.2018. The fair value of the held-to-maturity portfolio at December 31, 20172019 was $111.9$78.2 million.
The Company regularly reviews the composition of the investment securities portfolio, taking into account market risks, the current and expected interest rate environment, liquidity needs and its overall interest rate risk profile and strategic goals.
On a quarterly basis, management evaluates each security in the portfolio with an individual unrealized loss to determine if that loss represents other-than-temporary impairment. During the fourth quarter of 2009, management determined that it was necessary, following other-than-temporary impairment requirements, to write down the cost basis of the Company’s only pooled trust preferred security. This trust preferred debt security was issued by a two issuer pool (Preferred Term Securities XXV, Ltd. co-issued by Keefe, Bruyette and Woods, Inc. and First Tennessee (“PreTSL XXV”)) consisting primarily of financial institution holding companies. During 2009, the Company recognized an other-than-temporary impairment charge of $865,000 with respect to this security. No other-than-temporary impairment losses were recorded during 20172019 and 2016.2018. See Note 23-"Investment Securities" to the consolidated financial statements for additional information.
Loans Held for Sale
Loans held for sale at December 31, 20172019 totaled $4.3$5.9 million compared to $14.8$3.0 million at December 31, 2016.2018. The total loans originated for sale was $110.8$146.8 million and $111.1 million for 2017 compared with $97.0 million for 2016.2019 and 2018, respectively. At December 31, 2017,2019, residential mortgage loans held for sale totaled $2.3$5.7 million and SBA loans held for sale totaled $2.0 million.$225,000. The amount of loans held for sale varies from period to period due to changes in the amount and timing of sales of residential mortgage loans and SBA loans.
Loans
The loan portfolio, which represents the Company’s largest asset, is a significant source of both interest and fee income. Elements of the loan portfolio are subject to differing levels of credit and interest rate risk. The Company’s primary lending focus continues to be mortgage warehouse lines, construction loans, commercial business loans, owner-occupied commercial real estate mortgage loans and income producing commercial real estate loans. Total loans averaged $717.0$964.9 million for the year ended December 31, 2017,2019, representing an increase of $18.6$132.0 million, or 2.7%15.8%, compared to an average of $698.4$833.0 million for the year ended December 31, 2016.2018. At December 31, 2017,2019, total loans amounted to $789.9 million, which waswere $1.2 billion, representing an increase of $65.1$332.9 million, or 9.0%37.7%, when compared to $724.8$883.2 million at December 31, 2016. 2018. Loans acquired in the Shore Merger were $206.2 million at December 31, 2019, compared to $63.0 million in loans acquired in the NJCB Merger at December 31, 2018.
The average yield earned on the loan portfolio was 4.96%5.55% for the year ended December 31, 20172019 compared to 4.77%5.38% for the year ended December 31, 2016,2018, which was an increase of 1917 basis points.
The following table represents the components of the loan portfolio as of the dates indicated.
| | | | December 31, | December 31, |
| | 2017 | | 2016 | | 2015 | | 2014 | | 2013 | 2019 | | 2018 | | 2017 | | 2016 | | 2015 |
| (Dollars in thousands) | Amount | | % | | Amount | | % | | Amount | | % | | Amount | | % | | Amount | | % | Amount | | % | | Amount | | % | | Amount | | % | | Amount | | % | | Amount | | % |
| Commercial real estate | $ | 308,924 |
| | 39 | % | | $ | 242,393 |
| | 34 | % | | $ | 207,250 |
| | 30 | % | | $ | 198,211 |
| | 30 | % | | $ | 98,390 |
| | 26 | % | $ | 567,655 |
| | 47 | % | | $ | 388,431 |
| | 44 | % | | $ | 308,924 |
| | 39 | % | | $ | 242,393 |
| | 34 | % | | $ | 207,250 |
| | 30 | % |
| Mortgage warehouse lines | 189,412 |
| | 24 |
| | 216,259 |
| | 30 |
| | 216,572 |
| | 32 |
| | 179,172 |
| | 27 |
| | 116,951 |
| | 31 |
| 236,672 |
| | 20 |
| | 154,183 |
| | 17 |
| | 189,412 |
| | 24 |
| | 216,259 |
| | 30 |
| | 216,572 |
| | 32 |
|
| Construction | 136,412 |
| | 17 |
| | 96,035 |
| | 13 |
| | 93,745 |
| | 14 |
| | 95,627 |
| | 15 |
| | 51,002 |
| | 14 |
| 148,939 |
| | 12 |
| | 149,387 |
| | 17 |
| | 136,412 |
| | 17 |
| | 96,035 |
| | 13 |
| | 93,745 |
| | 14 |
|
| Commercial business | 92,906 |
| | 12 |
| | 99,650 |
| | 14 |
| | 99,277 |
| | 15 |
| | 110,771 |
| | 17 |
| | 82,348 |
| | 22 |
| 139,271 |
| | 11 |
| | 120,590 |
| | 14 |
| | 92,906 |
| | 12 |
| | 99,650 |
| | 14 |
| | 99,277 |
| | 15 |
|
| Residential real estate | 40,494 |
| | 5 |
| | 44,791 |
| | 6 |
| | 40,744 |
| | 6 |
| | 46,446 |
| | 7 |
| | 13,764 |
| | 4 |
| 90,259 |
| | 7 |
| | 47,263 |
| | 5 |
| | 40,494 |
| | 5 |
| | 44,791 |
| | 6 |
| | 40,744 |
| | 6 |
|
| Loans to individuals | 21,025 |
| | 3 |
| | 23,736 |
| | 3 |
| | 23,074 |
| | 3 |
| | 23,156 |
| | 4 |
| | 9,766 |
| | 3 |
| 32,604 |
| | 3 |
| | 22,962 |
| | 3 |
| | 21,025 |
| | 3 |
| | 23,736 |
| | 3 |
| | 23,074 |
| | 3 |
|
| Other | 183 |
| | — |
| | 207 |
| | — |
| | 233 |
| | — |
| | 199 |
| | — |
| | 171 |
| | — |
| 137 |
| | — |
| | 181 |
| | — |
| | 183 |
| | — |
| | 207 |
| | — |
| | 233 |
| | — |
|
| Deferred loan costs, net | 550 |
| | — |
| | 1,737 |
| | — |
| | 1,226 |
| | — |
| | 715 |
| | — |
| | 944 |
| | — |
| 491 |
| | — |
| | 167 |
| | — |
| | 550 |
| | — |
| | 1,737 |
| | — |
| | 1,226 |
| | — |
|
| Total | $ | 789,906 |
| | 100 | % | | $ | 724,808 |
| | 100 | % | | $ | 682,121 |
| | 100 | % | | $ | 654,297 |
| | 100 | % | | $ | 373,336 |
| | 100 | % | $ | 1,216,028 |
| | 100 | % | | $ | 883,164 |
| | 100 | % | | $ | 789,906 |
| | 100 | % | | $ | 724,808 |
| | 100 | % | | $ | 682,121 |
| | 100 | % |
Commercial business and commercial real estate loans averaged $370.4$426.9 million for the year ended December 31, 2017,2019, representing an increase of $46.9$70.3 million, whenor 19.7%, compared to the average of $323.5$356.6 million for the year ended December 31, 2016. Commercial business loans consist primarily of loans to small and middle market businesses and are typically working capital loans used to finance inventory, receivables or equipment needs. These loans are generally secured by business assets of the commercial borrower.2018. Commercial real estate loans consist primarily of loans to businesses that are collateralized by real estate assets employed in the operation of the business (owner-occupied properties) and loans to real estate investors to finance the acquisition and/or improvement of income producing commercial properties. The average yield on the commercial business loans was 5.63% in 2017 compared to 4.77% in 2016. The average yield on commercial real estate loans was 4.98%5.11% and 5.56%5.07% for 20172019 and 2016,2018, respectively.
Construction loans averaged $115.9 million for the year ended December 31, 2017, an increase of $22.3 million, or 23.8%, compared to the average of $93.6 million for the year ended December 31, 2016. Generally, these loans represent owner-occupied or investment properties and usually complement a broader commercial relationship between the Company and the borrower. Construction loans are structured to provide for advances only after work is completed and inspected by qualified professionals. The average yield on the construction loan portfolio increased 61 basis points to 5.77% for 2017 from 5.16% for 2016.
The mortgage warehouse lines component of the loan portfolio decreased by $26.8 million to $189.4 million at December 31, 2017 compared to $216.3 million at December 31, 2016. During 2017, $3.5 billion of mortgage loans were financed through our Mortgage Warehouse Funding Group compared to $3.8 billion of mortgage loans financed in 2016.
The Company’s Mortgage Warehouse Funding Group offers revolving lines of credit that are available to licensed mortgage banking companies (the “warehouse line of credit”). The warehouse line of credit is used by the mortgage banker to originate one-to-four family residential mortgage loans that are pre-sold to the secondary mortgage market, which includes state and national banks, national mortgage banking firms, insurance companies and government-sponsored enterprises, including the Federal National Mortgage Association, the Federal Home Loan Mortgage Corporation and others. On average, an advance under the warehouse line of credit remains outstanding for a period of less than 30 days, with repayment coming directly from the sale of the loan into the secondary mortgage market. Interest and a transaction fee are collected by the Company at the time of repayment. The Company had outstanding warehouse line of credit advances of $189.4$236.7 million at December 31, 20172019 compared to $216.3$154.2 million at December 31, 2016.2018. During 20172019 and 2016,2018, warehouse lines of credit advances averaged $160.8$174.2 million and $205.7$153.9 million, respectively, and yielded 4.26%5.48% and 4.04%5.46%, respectively. During 2019, $3.5 billion of mortgage loans were financed through our Mortgage Warehouse Funding Group compared to $3.4 billion of mortgage loans financed in 2018. The declineincrease in the warehouse lines of credit advances in 20172019 compared to 20162018 reflected the decline inincreased residential mortgage refinancing activity in 20172019 compared to 20162018 due in general, to highergenerally stable to lower market interest rates for residential mortgages in 20172019 than in 2016.2018. The number of active mortgage banking customers waswere 38 and 44 in 20172019 and 2018, respectively.
Construction loans averaged $156.5 million for the year ended December 31, 2019, representing an increase of $18.5 million, or 13.4%, compared to 45the average of $138.0 million for the year ended December 31, 2018. Generally, these loans represent owner-occupied or investment properties and usually complement a broader commercial relationship between the Company and the borrower. Construction loans are structured to provide for advances only after work is completed and inspected by qualified professionals. The average yield on the construction loan portfolio was 6.76% for 2019 compared to 6.59% for 2018.
Commercial business loans averaged $122.0 million for the year ended December 31, 2019, representing an increase of $10.8 million, or 9.7%, compared to the average of $111.2 million for the year ended December 31, 2018. Commercial business loans consist primarily of loans to small and middle market businesses and are typically working capital loans used to finance inventory, receivables or equipment needs. These loans are generally secured by business assets of the commercial borrower. The average yield on the commercial business loans was 5.98% in 2016.2019 compared to 5.45% in 2018.
Average residential real estate loans decreased $796,000increased $10.4 million to $41.9$56.7 million at December 31, 20172019 compared to $42.7$46.3 million at December 31, 2016.2018. The average yield on residential real estate loans was 4.50% in 2019 compared to 4.44% in 2018. Loans to individuals, which are comprised primarily of home equity loans, averaged $22.2$23.3 million during December 31, 20172019 compared to $23.3$23.2 million during 20162018.The average yield on loans to individuals was 5.06% in 2019 compared to 4.61% in 2018.
The following table provides information concerning the maturities and interest rate sensitivity of the loan portfolio at December 31, 2017.2019.
| | | | | Maturity Range | | | | Maturity Range | | |
| (Dollars in thousands) | | Within One Year | | After One But Within Five Years | | After Five Years | | Total | | Within One Year | | After One But Within Five Years | | After Five Years | | Total |
| Commercial real estate | | $ | 36,071 |
| | $ | 225,745 |
| | $ | 47,108 |
| | $ | 308,924 |
| | $ | 60,881 |
| | $ | 444,702 |
| | $ | 62,072 |
| | $ | 567,655 |
|
| Mortgage warehouse lines | | 189,412 |
| | — |
| | — |
| | 189,412 |
| | 236,672 |
| | — |
| | — |
| | 236,672 |
|
| Construction | | 129,396 |
| | 7,016 |
| | — |
| | 136,412 |
| | 145,189 |
| | 2,357 |
| | 1,393 |
| | 148,939 |
|
| Commercial business | | 49,898 |
| | 35,479 |
| | 7,529 |
| | 92,906 |
| | 58,886 |
| | 39,022 |
| | 41,363 |
| | 139,271 |
|
| Residential real estate | | 5,611 |
| | 16,290 |
| | 18,593 |
| | 40,494 |
| | 17,944 |
| | 32,247 |
| | 40,068 |
| | 90,259 |
|
| Loans to individuals and other loans | | 18,448 |
| | 750 |
| | 2,010 |
| | 21,208 |
| | 30,509 |
| | 778 |
| | 1,454 |
| | 32,741 |
|
| Total | | $ | 428,836 |
| | $ | 285,280 |
| | $ | 75,240 |
| | $ | 789,356 |
| | $ | 550,081 |
| | $ | 519,106 |
| | $ | 146,350 |
| | $ | 1,215,537 |
|
| | | | | | | | | | | | | | | | | |
| Fixed rate loans | | $ | 17,373 |
| | $ | 78,655 |
| | $ | 50,446 |
| | $ | 146,474 |
| | $ | 34,813 |
| | $ | 100,502 |
| | $ | 123,824 |
| | $ | 259,139 |
|
| Floating rate loans | | 411,463 |
| | 206,625 |
| | 24,794 |
| | 642,882 |
| | 515,268 |
| | 418,604 |
| | 22,526 |
| | 956,398 |
|
| Total | | $ | 428,836 |
| | $ | 285,280 |
| | $ | 75,240 |
| | $ | 789,356 |
| | $ | 550,081 |
| | $ | 519,106 |
| | $ | 146,350 |
| | $ | 1,215,537 |
|
Non-Performing Assets
Non-performing assets consist of non-performing loans and other real estate owned. Non-performing loans are composed of (1) loans on a non-accrual basis and (2) loans that are contractually past due 90 days or more as to interest and principal payments but have not been classified as non-accrual. Included in non-accrual loans are loans whose terms have been previously restructured to provide a reduction or deferral of interest and/or principal due to financial difficulties of the borrower that have not performed in accordance with the restructured terms.
The Company’s policy with regard to non-accrual loans is that, generally, loans are placed on a non-accrual status when they are 90 days past due, unless these loans are well secured and in the process of collection or, regardless of the past due status of the loan, when management determines that the complete recovery of principal or interest is in doubt. Consumer loans are generally charged off after they become 120 days past due. Subsequent payments on loans in non-accrual status are credited to income only if collection of principal is not in doubt.
Non-performing loans were $4.5 million at December 31, 2019 compared to $6.6 million at December 31, 2018. During 2017, $4.6the year ended December 31, 2019, $2.3 million of non-performing loans were resolved, $481,000 of loans were charged-off and $3.7 million of loans were transferredplaced on non-accrual. In the first quarter of 2019, the Bank was notified that a shared national credit syndicated loan in which it was a participant in a $4.3 million facility was upgraded to pass rating from substandard rating and was no longer classified as a non-accrual status and $2.7 millionloan. As of loans were resolved. Asthe date of notification, the Bank upgraded the loan, which had a result, non-performing loans increased by $1.9 million to $7.1balance of $2.8 million at December 31, 2017 from $5.2 million at December 31, 2016.that time, and returned the loan to accrual status. The loan subsequently was paid in full.
At December 31, 2017,2019, non-performing loans were comprised of threesix commercial real estate loans aggregating $2.5totaling $2.6 million, onethree residential mortgage loan with an outstanding principal balance of $69,000, nineloans totaling $708,000, three commercial business loans aggregating $4.2 milliontotaling $501,000 and five home equity loans aggregating $368,000.totaling $692,000.
The table below sets forth non-performing assets and risk elements in the Bank's loan portfolio for the years indicated. | | | | December 31, | December 31, |
| (Dollars in thousands) | 2017 | | 2016 | | 2015 | | 2014 | | 2013 | 2019 | | 2018 | | 2017 | | 2016 | | 2015 |
| Non-Performing loans: | | | | | | | | | | | | | | | | | | |
| Loans 90 days or more past due and still accruing | $ | — |
| | $ | 24 |
| | $ | — |
| | $ | 317 |
| | $ | — |
| $ | — |
| | $ | 55 |
| | $ | — |
| | $ | 24 |
| | $ | — |
|
| Non-accrual loans | 7,114 |
| | 5,174 |
| | 6,020 |
| | 4,523 |
| | 6,322 |
| 4,497 |
| | 6,525 |
| | 7,114 |
| | 5,174 |
| | 6,020 |
|
| Total non-performing loans | 7,114 |
| | 5,198 |
| | 6,020 |
| | 4,840 |
| | 6,322 |
| 4,497 |
| | 6,580 |
| | 7,114 |
| | 5,198 |
| | 6,020 |
|
| Other real estate owned | — |
| | 166 |
| | 966 |
| | 5,710 |
| | 2,136 |
| 571 |
| | 2,515 |
| | — |
| | 166 |
| | 966 |
|
| Other repossessed assets | — |
| | — |
| | — |
| | 66 |
| | — |
| — |
| | — |
| | — |
| | — |
| | — |
|
| Total non-performing assets | 7,114 |
| | 5,364 |
| | 6,986 |
| | 10,616 |
| | 8,458 |
| 5,068 |
| | 9,095 |
| | 7,114 |
| | 5,364 |
| | 6,986 |
|
| Performing troubled debt restructurings | 3,728 |
| | 864 |
| | 1,535 |
| | 3,925 |
| | 3,859 |
| 6,132 |
| | 4,003 |
| | 3,728 |
| | 864 |
| | 1,535 |
|
| Performing troubled debt restructurings and total non-performing assets | $ | 10,842 |
| | $ | 6,228 |
| | $ | 8,521 |
| | $ | 14,541 |
| | $ | 12,317 |
| $ | 11,200 |
| | $ | 13,098 |
| | $ | 10,842 |
| | $ | 6,228 |
| | $ | 8,521 |
|
| | | | | | | | | | | | | | | | | | | |
| Non-performing loans to total loans | 0.90 | % | | 0.72 | % | | 0.88 | % | | 0.74 | % | | 1.69 | % | 0.37 | % | | 0.75 | % | | 0.90 | % | | 0.72 | % | | 0.88 | % |
| Non-performing loans to total loans excluding warehouse lines | 1.18 |
| | 1.02 |
| | 1.29 |
| | 1.02 |
| | 2.47 |
| 0.46 |
| | 0.90 |
| | 1.18 |
| | 1.02 |
| | 1.29 |
|
| Non-performing assets to total assets | 0.66 |
| | 0.52 |
| | 0.72 |
| | 1.11 |
| | 1.14 |
| 0.32 |
| | 0.77 |
| | 0.66 |
| | 0.52 |
| | 0.72 |
|
| Non-performing assets to total assets excluding mortgage warehouse lines | 0.80 |
| | 0.65 |
| | 0.93 |
| | 1.37 |
| | 1.35 |
| 0.38 |
| | 0.89 |
| | 0.80 |
| | 0.65 |
| | 0.93 |
|
| Total non-performing assets and performing troubled debt restructurings to total assets | 0.88 |
| | 0.60 |
| | 0.88 |
| | 1.52 |
| | 1.66 |
| 0.71 |
| | 1.11 |
| | 1.00 |
| | 0.60 |
| | 0.88 |
|
As the table demonstrates, non-performing loans to total loans increaseddecreased to 0.90%0.37% at December 31, 20172019 from 0.72%0.75% at December 31, 2016.2018. Loan quality was stable and the loan portfolio is considered to be sound. This was accomplished through quality loan underwriting, a proactive approach to loan monitoring and aggressive workout strategies.
Additional interest income before taxes amounting to $514,000, $522,000$318,000, $155,000 and $471,000$514,000 would have been recognized in 2017, 20162019, 2018 and 2015,2017, respectively, if interest on all loans had been recorded based upon their original contract terms.
Non-performing assets increased by $1.7decreased $4.0 million to $7.1$5.1 million at December 31, 20172019 from $5.4$9.1 million at December 31, 2016. Non-performing loans increased $1.9 million to $7.1 million at December 31, 2017 from $5.2 million at December 31, 20162018 and other real estate owned decreased to zero at December 31, 2017 from $166,000 at December 31, 2016. In 2017, the Company transferred $455,000 of non-performing loans to OREO and sold $626,000 in OREO properties. In 2016, $141,000 of non-performing loans were transferred to OREO and one OREO property with a carrying value of $1.0 million was sold during the year. The Company did not record loss provisions against OREO during 2017 or 2016 compared to loss provisions recorded against OREO properties of $382,000 during 2015.
Non-performing assets represented 0.66%0.32% of total assets at December 31, 20172019 compared to 0.52%0.77% at December 31, 2016.2018. Non-performing loans decreased $2.1 million to $4.5 million at December 31, 2019 from $6.6 million at December 31, 2018. OREO decreased by $1.9 million to $571,000 at December 31, 2019 compared to $2.5 million at December 31, 2018. OREO is comprised of six residential lots with a carrying value of $478,000 acquired in the Shore Merger and land with a carrying value of $93,000.
In 2019, the Company sold two OREO properties with a carrying value of $2.4 million and recognized a net loss on sale of OREO of $101,000. In 2018, no OREO properties were sold.
At December 31, 2017,2019, the Company had ten13 loans totaling $5.5$6.4 million that were troubled debt restructurings. TwoThree of these loans totaling $1.8$345,000 are included in the above table as non-accrual loans and the remaining nine loans totaling $6.1 million are considered performing.
At December 31, 2018, the Company had 12 loans totaling $7.3 million that were troubled debt restructurings. Four of these loans totaling $3.3 million are included in the above table as non-accrual loans and the remaining eight loans totaling $3.7$4.0 million are considered performing.
At December 31, 2016, the Company had nine loans totaling $4.5 million that were troubled debt restructurings. Five of these loans totaling $3.6 million are included in the above table as non-accrual loans and the remaining four loans totaling $864,000 were considered performing.
In accordance with U.S. GAAP, the excess of cash flows expected at acquisition over the initial investment in the purchase of a credit impaired loan is recognized as interest income over the life of the loan. At December 31, 2017,2019, there were no loans acquired with evidence of deteriorated credit quality that were not classified as non-performing loans, while11 loans acquired with evidence of deteriorated credit quality totaling $439,000 at December 31, 2016$4.6 million that were not classified as non-performing loans.loans and there were two loans acquired with evidence of deteriorated credit quality totaling $865,000 that were not classified as non-performing loans at December 31, 2018.
Management takes a proactive approach in addressing delinquent loans. The Company’s President and Chief Executive Officer meets weekly with all loan officers to review the status of credits past-due ten days or more. An action plan is discussed for delinquent loans to determine the steps necessary to induce the borrower to cure the delinquency and restore the loan to a current status. In addition, delinquency notices are system generated when loans are five days past-due and again at 15 days past-due.
In most cases, the Company’s loan collateral is real estate and when the collateral is foreclosed upon, the real estate is carried at fair market value less the estimated selling costs. The amount, if any, by which the recorded amount of the loan exceeds the fair market value of the collateral less estimated selling costs is a loss that is charged to the allowance for loan losses at the time of foreclosure or repossession. Resolution of a past-due loan can be delayed if the borrower files a bankruptcy petition because a collection action cannot be continued unless the Company first obtains relief from the automatic stay provided by the bankruptcy code.
During the first quarter of 2017, the Company was notified that a shared national credit syndicated loan in which it was a participant in a $4.3 million facility had further deteriorated. The Company downgraded the loan, which had a balance of $4.0 million, and placed it on non-accrual. In the second quarter, the borrower was recapitalized through an equity contribution by new investors and the loan was paid down by $906,000 and all interest was brought current. All loan payments for this borrower are current at December 31, 2017. Management continues to closely monitor the borrower's financial position.
Allowance for Loan Losses and Related Provision
The allowance for loan losses is maintained at a level sufficient to absorb estimated credit losses in the loan portfolio as of the date of the financial statements. The allowance for loan losses is a valuation reserve available for losses incurred or inherent in the loan portfolio and other extensions of credit. The determination of the adequacy of the allowance for loan losses is a critical accounting policy of the Company.
The Company’s primary lending emphasis is the origination of commercial business, commercial real estate and construction loans and mortgage warehouse lines of credit. Based on the composition of the loan portfolio, the inherent primary risks are deteriorating credit quality, a decline in the economy and a decline in New Jersey real estate market values. Any one, or a combination, of these events may adversely affect the loan portfolio and may result in increased delinquencies, loan losses and increased future provision levels.
All, or part, of the principal balance of commercial business, commercial real estate and construction loans are charged off against the allowance as soon as it is determined that the repayment of all, or part, of the principal balance is highly unlikely. Consumer loans are generally charged off no later than 120 days past due on a contractual basis, earlier in the event of bankruptcy, or if there is an amount deemed uncollectible. Because all identified losses are charged off, no portion of the allowance for loan losses is restricted to any individual loan or groups of loans and the entire allowance is available to absorb any and all loan losses.
Management reviews the adequacy of the allowance on at least a quarterly basis to ensure that the provision for loan losses has been charged against earnings in an amount necessary to maintain the allowance at a level that is adequate based on management’s assessment of probable estimated losses. The Company’s methodology for assessing the adequacy of the allowance for loan losses consists of several key elements and is consistent with U.S. GAAP and interagency supervisory guidance. The allowance for loan losses methodology consists of two major components. The first component represents an estimation of losses associated with individually identified impaired loans. The second major component estimates losses on groups of loans with similar risk characteristics. The Company’s methodology results in an allowance for loan losses that includes a specific reserve for impaired loans, an allocated reserve and an unallocated portion.
When analyzing groups of loans, the Company follows the Interagency Policy Statement on the Allowance for Loan and Lease Losses. The methodology considers the Company’s historical loss experience, adjusted for changes in trends, conditions and other relevant factors that affect repayment of the loans as of the evaluation date. These adjustment factors, known as qualitative factors, include:
•Delinquencies and non-accruals;
•Portfolio quality;
•Concentration of credit;
•Trends in volume of loans;
•Quality of collateral;
•Policy and procedures;
•Experience, ability and depth of management;
•Economic trends – national and local; and
•External factors – competition, legal and regulatory.
The methodology includes the segregation of the loan portfolio into loan types with a further segregation into risk rating categories, such as special mention, substandard, doubtful and loss. This allows for an allocation of the allowance for loan losses by loan type; however, the allowance is available to absorb any loan loss without restriction. Larger balance, non-homogeneous loans representing significant individual credit exposures are evaluated individually through the internal loan review process. It is this process that produces the watch list. The borrower’s overall financial condition, repayment sources, guarantors and value of collateral, if appropriate, are evaluated. Based on these reviews, an estimate of probable losses for the individual larger-balance loans are determined, whenever possible, and used to establish specific loan loss reserves. In general, for non-homogeneous loans not individually assessed and for homogeneous groups, such as residential mortgages and consumer credits, the loans are
collectively evaluated based on delinquency status, loan type, and historical losses. These loan groups are then internally risk rated.
The watch list includes loans that are assigned a rating of special mention, substandard, doubtful and loss. Loans criticized as special mention have potential weaknesses that deserve management’s close attention. If uncorrected, the potential weaknesses may result in deterioration of the repayment prospects. Loans classified as substandard have a well-defined weakness or weaknesses that jeopardize the liquidation of the debt. They include loans that are inadequately protected by the current sound net worth and paying capacity of the obligor or of the collateral pledged, if any. Loans classified as doubtful have all the weaknesses inherent in loans classified as substandard with the added characteristic that collection or liquidation in full, on the basis of current conditions and facts, is highly improbable. Loans rated as doubtful in whole, or in part, are placed on non-accrual status. Loans classified as a loss are considered uncollectible and are charged off against the allowance for loan losses.
The specific allowance for impaired loans is established for specific loans that have been identified by management as being impaired. These loans are considered to be impaired primarily because the loans have not performed according to payment terms and there is reason to believe that repayment of the loan principal in whole, or in part, is unlikely. The specific portion of the allowance is the total amount of potential unconfirmed losses for these individual impaired loans. To assist in determining the fair value of loan collateral, the Company often utilizes independent third party qualified appraisal firms, which, in turn, employ their own criteria and assumptions that may include occupancy rates, rental rates and property expenses, among others.
The second category of reserves consists of the allocated portion of the allowance. The allocated portion of the allowance is determined by taking pools of outstanding loans that have similar characteristics and applying historical loss experience for each pool. This estimate represents the potential unconfirmed losses within the portfolio. Individual loan pools are created for commercial and commercial real estate loans, construction loans, warehouse lines of credit and various types of loans to individuals. The historical estimation for each loan pool is then adjusted for qualitative factors, such as economic trends, concentrations of credit, trends in the volume of loans, portfolio quality, delinquencies and non-accrual trends. These factors are evaluated for each class of the loan portfolio and may have positive or negative effects on the allocated allowance for the loan portfolio segment. The aggregate amount resulting from the application of these qualitative factors determines the overall risk for the portfolio and results in an allocated allowance for each of the loan segments.
The Company also maintains an unallocated allowance. The unallocated allowance is used to cover any factors or conditions that may cause a potential loan loss but are not specifically identifiable. It is prudent to maintain an unallocated portion of the allowance because no matter how detailed an analysis of potential loan losses is performed, these estimates, by definition, lack precision. Management must make estimates using assumptions and information that is often subjective and changing rapidly.
The following discusses the risk characteristics of each of our loan portfolios.
Commercial Business
The Company offers a variety of commercial loan services, including term loans, lines of credit and loans secured by equipment and receivables. A broad range of short-to-medium term commercial loans, both secured and unsecured, are made available to businesses for working capital (including inventory and receivables), business expansion (including acquisition and development of real estate and improvements) and the purchase of equipment and machinery. Commercial business loans are granted based on the borrower's ability to generate cash flow to support its debt obligations and other cash related expenses. A borrower's ability to repay commercial business loans is substantially dependent on the success of the business itself and on the quality of its management. As a general practice, the Company takes, as collateral, a security interest in any available real estate, equipment, inventory, receivables or other personal property of its borrowers, although the Company occasionally makes commercial business loans on an unsecured basis. Generally, the Company requires personal guarantees of its commercial business loans to offset the risks associated with such loans.
Much of the Company's lending is in northern and central New Jersey.Jersey and the New York City metropolitan area. As a result of this geographic concentration, a significant broad-based deterioration in economic conditions in the New Jersey and the New York City metropolitan area could have a material adverse impact on the Company's loan portfolio. A prolonged decline in economic conditions in our market area could restrict borrowers' ability to pay outstanding principal and interest on loans when due. The value of assets pledged as collateral may decline and the proceeds from the sale or liquidation of these assets may not be sufficient to repay the loan.
Commercial Real Estate
Commercial real estate loans are made to businesses to expand their facilities and operations and to real estate operators to finance the acquisition of income producing properties. The Company's loan policy requires that borrowers have sufficient cash flow to meet the debt service requirements and the value of the property meets the loan-to-value criteria set in the loan policy. The Company monitors loan concentrations by borrower, by type of property and by location and other criteria.
The Company's commercial real estate portfolio is largely secured by real estate collateral located in the State of New Jersey.Jersey and the New York City metropolitan area. Conditions in the real estate markets in which the collateral for the Company's loans are located strongly influence the level of the Company's non-performing loans. A decline in the New Jersey and New York City metropolitan area real estate marketmarkets could adversely affect the Company's loan portfolio. Decreases in local real estate values would adversely affect the value of property used as collateral for the Company's loans. Adverse changes in the economy also may have a negative effect on the ability of our borrowers to make timely repayments of their loans.
Construction Financing
Construction financing is provided to businesses to expand their facilities and operations and to real estate developers for the acquisition, development and construction of residential and commercial properties. First mortgage construction loans are made to developers and builders primarily for single family homes and multi-family buildings that are presold or are to be sold or leased on a speculative basis.
The Company lends to builders and developers with established relationships, successful operating histories and sound financial resources. Management has established underwriting and monitoring criteria to minimize the inherent risks of real estate construction lending. The risks associated with speculative construction lending include the borrower's inability to complete the construction process on time and within budget, the sale or rental of the project within projected absorption periods and the economic risks associated with real estate collateral. Such loans may include financing the development and/or construction of residential subdivisions. This activity may involve financing land purchases and infrastructure development (i.e., roads, utilities, etc.) as well as construction of residences or multi-family dwellings for subsequent sale by the developer/builder. Because the sale or rental of developed properties is integral to the success of developer business, loan repayment may be especially subject to the volatility of real estate market values.
Mortgage Warehouse Lines of Credit
The Company’s Mortgage Warehouse Funding Group provides revolving lines of credit that are available to licensed mortgage banking companies. The warehouse line of credit is used by the mortgage banker to originate one-to-four family residential mortgage loans that are pre-sold to the secondary mortgage market, which includes state and national banks, national mortgage banking firms, insurance companies and government-sponsored enterprises, including the Federal National Mortgage Association, the Federal Home Loan Mortgage Corporation and others. On average, an advance under the warehouse line of credit remains outstanding for a period of less than 30 days, with repayment coming directly from the sale of the loan into the secondary mortgage market. Interest and a transaction fee are collected by the Bank at the time of repayment.
As a separate class of the total loan portfolio, the warehouse loan portfolio is individually analyzed as a whole for allowance for loan losses purposes. Warehouse lines of credit are subject to the same inherent risks as other commercial lending, but the overall degree of risk differs. While the Company’s loss experience with this type of lending has been non-existent since the product was introduced in 2008, there are other risks unique to this lending that still must be considered in assessing the adequacy of the allowance for loan losses. These unique risks may include, but are not limited to, (i) credit risks relating to the mortgage bankers that borrow from us, (ii) the risk of intentional misrepresentation or fraud by any of such mortgage bankers, (iii) changes in the market value of mortgage loans originated by the mortgage banker, the sale of which is the expected source of repayment of the borrowings under a warehouse line of credit, due to changes in interest rates during the time in warehouse or (iv) unsalable or impaired mortgage loans so originated, which could lead to decreased collateral value and the failure of a purchaser of the mortgage loan to purchase the loan from the mortgage banker.
Consumer
The Company’s consumer loan portfolio segment is comprised of residential real estate loans, home equity loans and other loans to individuals. Individual loan pools are created for the various types of loans to individuals. The principal risk is the borrower becomes unemployed or has a significant reduction in income.
In general, for homogeneous groups such as residential mortgages and consumer credits, the loans are collectively evaluated based on delinquency status, loan type and historical losses. These loan groups are then internally risk rated.
The Company considers the following credit quality indicators in assessing the risk in the loan portfolio:
•Consumer credit scores;
•Internal credit risk grades;
•Loan-to-value ratios;
•Collateral; and
•Collection experience.
The following table presents, for the years indicated, an analysis of the allowance for loan losses and other related data:
| | | (Dollars in thousands) | 2017 | | 2016 | | 2015 | | 2014 | | 2013 | 2019 | | 2018 | | 2017 | | 2016 | | 2015 |
| Balance, beginning of year | $ | 7,494 |
| | $ | 7,560 |
| | $ | 6,925 |
| | $ | 7,039 |
| | $ | 7,151 |
| $ | 8,402 |
| | $ | 8,013 |
| | $ | 7,494 |
| | $ | 7,560 |
| | $ | 6,925 |
|
| Provision (credit) charged to operating expenses | 600 |
| | (300 | ) | | 1,100 |
| | 5,750 |
| | 1,077 |
| 1,350 |
| | 900 |
| | 600 |
| | (300 | ) | | 1,100 |
|
| Loans charged off: | |
| | |
| | |
| | |
| | |
| |
| | |
| | |
| | |
| | |
|
| Construction loans | — |
| | — |
| | — |
| | — |
| | (562 | ) | |
| Residential real estate loans | (101 | ) | | — |
| | — |
| | (15 | ) | | — |
| — |
| | — |
| | (101 | ) | | — |
| | — |
|
| Commercial and commercial real estate loans | (61 | ) | | (157 | ) | | (477 | ) | | (5,906 | ) | | (594 | ) | |
Commercial business and commercial real estate loans | | (463 | ) | | (553 | ) | | (61 | ) | | (157 | ) | | (477 | ) |
| Loans to individuals | — |
| | — |
| | (14 | ) | | (1 | ) | | (52 | ) | (7 | ) | | (16 | ) | | — |
| | — |
| | (14 | ) |
| All other loans | — |
| | (1 | ) | | — |
| | — |
| | — |
| (43 | ) | | (17 | ) | | — |
| | (1 | ) | | — |
|
| | (162 | ) | | (158 | ) | | (491 | ) | | (5,922 | ) | | (1,208 | ) | (513 | ) | | (586 | ) | | (162 | ) | | (158 | ) | | (491 | ) |
| Recoveries: | |
| | |
| | |
| | |
| | |
| |
| | |
| | |
| | |
| | |
|
| Construction loans | — |
| | — |
| | — |
| | — |
| | — |
| |
| Residential real estate loans | — |
| | — |
| | — |
| | — |
| | — |
| |
| Commercial and commercial real estate loans | 64 |
| | 386 |
| | 20 |
| | 58 |
| | 19 |
| |
Commercial business and commercial real estate
loans | | 26 |
| | 74 |
| | 64 |
| | 386 |
| | 20 |
|
| Loans to individuals | 4 |
| | 6 |
| | 6 |
| | — |
| | — |
| 6 |
| | 1 |
| | 4 |
| | 6 |
| | 6 |
|
| All other loans | 13 |
| | — |
| | — |
| | — |
| | — |
| — |
| | — |
| | 13 |
| | — |
| | — |
|
| | 81 |
| | 392 |
| | 26 |
| | 58 |
| | 19 |
| 32 |
| | 75 |
| | 81 |
| | 392 |
| | 26 |
|
| Net (charge offs) recoveries | (81 | ) | | 234 |
| | (465 | ) | | (5,864 | ) | | (1,189 | ) | (481 | ) | | (511 | ) | | (81 | ) | | 234 |
| | (465 | ) |
| Balance, end of year | $ | 8,013 |
| | $ | 7,494 |
| | $ | 7,560 |
| | $ | 6,925 |
| | $ | 7,039 |
| $ | 9,271 |
| | $ | 8,402 |
| | $ | 8,013 |
| | $ | 7,494 |
| | $ | 7,560 |
|
| Loans: | |
| | |
| | |
| | |
| | |
| |
| | |
| | |
| | |
| | |
|
| At year end | $ | 789,906 |
| | $ | 724,808 |
| | $ | 682,121 |
| | $ | 654,297 |
| | $ | 373,336 |
| $ | 1,216,028 |
| | $ | 883,164 |
| | $ | 789,906 |
| | $ | 724,808 |
| | $ | 682,121 |
|
| Average during the year | 717,010 |
| | 698,436 |
| | 684,485 |
| | 556,362 |
| | 399,462 |
| 964,920 |
| | 832,966 |
| | 717,010 |
| | 698,436 |
| | 684,485 |
|
| Net recoveries (charge offs) to average loans outstanding | (0.01 | )% | | 0.03 | % | | (0.07 | )% | | (1.04 | )% | | (0.30 | )% | (0.05 | )% | | (0.06 | )% | | (0.01 | )% | | 0.03 | % | | (0.07 | )% |
| Net recoveries (charge-offs) to average loans, excluding mortgage warehouse loans | (0.01 | )% | | 0.05 | % | | (0.10 | )% | | (1.36 | )% | | (0.48 | )% | (0.06 | )% | | (0.08 | )% | | (0.01 | )% | | 0.05 | % | | (0.10 | )% |
| Allowance for loan losses to: | | | | | |
| | |
| | |
| | | | | | | | | |
|
| Total loans at year end | 1.01 | % | | 1.03 | % | | 1.11 | % | | 1.06 | % | | 1.89 | % | 0.76 | % | | 0.95 | % | | 1.01 | % | | 1.03 | % | | 1.11 | % |
| Total loans at year end excluding mortgage warehouse lines and related allowance | 1.19 | % | | 1.28 | % | | 1.44 | % | | 1.27 | % | | 2.52 | % | 0.84 | % | | 1.05 | % | | 1.19 | % | | 1.28 | % | | 1.44 | % |
| Non-performing loans | 112.64 | % | | 144.17 | % | | 125.59 | % | | 143.08 | % | | 111.34 | % | 206.16 | % | | 127.69 | % | | 112.64 | % | | 144.17 | % | | 125.59 | % |
At December 31, 2017,2019, the allowance for loan losses was $8.0$9.3 million compared to $7.5$8.4 million at December 31, 2016,2018, representing an increase of $519,000.$869,000. The ratio of the allowance for loan losses to total loans at December 31, 20172019 and 20162018 was 1.01%0.76% and 1.03%0.95%, respectively. The allowance for loan losses as a percentage of non-performing loans was 112.64%206.16% at December 31, 20172019 compared to 144.17%127.69% at December 31, 2016.2018.
The allowance for loan losses increased in 20172019 due primarily to a provision for $600,000,of $1.4 million, which reflected net charge-offs of $81,000,$481,000, compared to a negative provision for loan losses in the amount of $300,000$900,000 in 2016 that was partially offset by2018, which reflected net recoveriescharge-offs of $234,000.$511,000.
The allowance for loan losses decreased as a percentage of total loans to 1.01%0.76% at December 31, 20172019 from 1.03%0.95% at December 31, 20162018 due primarily to acquisition accounting for the lower historical loss factors for commercial businessShore Merger, which resulted in the Shore loans being recorded at their fair value and commercial real estate loans.With respect to the loans acquired from Rumson-Fair Haven Bank and Trust Company, at December 31, 2017, the totalincluded a credit risk adjustment wasof approximately$420,000 and was comprised $3.6 million at the effective date of a non-accretive credit discount of $26,000 and an accretive general credit risk fair value discount of$394,000 compared to the total risk adjustment of $655,000 at December 31, 2016, which was comprised of a non-accretive credit discount of $215,000 and an accretive general credit risk fair value discount of $440,000.Shore Merger.
Management believes that the quality of the loan portfolio remains sound, considering the economic climate and economy in the State of New Jersey and the New York City metropolitan area, and that the allowance for loan losses is adequate in relation to credit risk exposure levels.
The following tables present the allocation of the allowance for loan losses among loan classes and certain other information as of the dates indicated. The total allowance is available to absorb losses from any segment of loans.
| | | | December 31, | December 31, |
| (Dollars in thousands) | 2017 | | 2016 | | 2015 | 2019 | | 2018 | | 2017 |
| | Amount | | ALL as a % of Loans | | Loans as a % of Total Loans | | Amount | | ALL as a % of Loans | | Loans as a % of Total Loans | | Amount | | ALL as a % of Loans | | Loans as a % of Total Loans | Amount | | ALL as a % of Loans | | Loans as a % of Total Loans | | Amount | | ALL as a % of Loans | | Loans as a % of Total Loans | | Amount | | ALL as a % of Loans | | Loans as a % of Total Loans |
| Commercial real estate | $ | 2,949 |
| | 0.95 | % | | 39 | % | | $ | 2,574 |
| | 1.06 | % | | 34 | % | | $ | 3,049 |
| | 1.47 | % | | 30 | % | $ | 4,524 |
| | 0.80 | % | | 47 | % | | $ | 3,439 |
| | 0.89 | % | | 44 | % | | $ | 2,949 |
| | 0.95 | % | | 39 | % |
| Commercial business | 1,720 |
| | 1.85 |
| | 12 |
| | 1,732 |
| | 1.74 |
| | 14 |
| | 2,005 |
| | 2.02 |
| | 15 |
| 1,409 |
| | 1.01 |
| | 11 |
| | 1,829 |
| | 1.52 |
| | 14 |
| | 1,720 |
| | 1.85 |
| | 12 |
|
| Construction loans | 1,703 |
| | 1.25 |
| | 17 |
| | 1,204 |
| | 1.25 |
| | 13 |
| | 1,025 |
| | 1.09 |
| | 14 |
| 1,389 |
| | 0.93 |
| | 12 |
| | 1,732 |
| | 1.16 |
| | 17 |
| | 1,703 |
| | 1.25 |
| | 17 |
|
| Residential real estate | 392 |
| | 0.97 |
| | 5 |
| | 367 |
| | 0.82 |
| | 6 |
| | 288 |
| | 0.71 |
| | 6 |
| 412 |
| | 0.46 |
| | 7 |
| | 431 |
| | 0.91 |
| | 5 |
| | 392 |
| | 0.97 |
| | 5 |
|
| Loans to individuals and other | 114 |
| | 0.54 |
| | 3 |
| | 112 |
| | 0.47 |
| | 3 |
| | 109 |
| | 0.47 |
| | 3 |
| 185 |
| | 0.57 |
| | 3 |
| | 148 |
| | 0.64 |
| | 3 |
| | 114 |
| | 0.54 |
| | 3 |
|
| Subtotal | 6,878 |
| | 1.15 |
| | 76 |
| | 5,989 |
| | 1.18 |
| | 70 |
| | 6,476 |
| | 1.39 |
| | 68 |
| 7,919 |
| | 0.81 |
| | 80 |
| | 7,579 |
| | 1.09 |
| | 83 |
| | 6,878 |
| | 1.15 |
| | 76 |
|
| Mortgage warehouse lines | 852 |
| | 0.45 |
| | 24 |
| | 973 |
| | 0.45 |
| | 30 |
| | 866 |
| | 0.40 |
| | 32 |
| 1,083 |
| | 0.46 |
| | 20 |
| | 731 |
| | 0.47 |
| | 17 |
| | 852 |
| | 0.45 |
| | 24 |
|
| Unallocated reserves | 283 |
| | — |
| | — |
| | 532 |
| | — |
| | — |
| | 218 |
| | — |
| | — |
| 269 |
| | — |
| | — |
| | 92 |
| | — |
| | — |
| | 283 |
| | — |
| | — |
|
| Total | $ | 8,013 |
| | 1.01 | % | | 100 | % | | $ | 7,494 |
| | 1.03 | % | | 100 | % | | $ | 7,560 |
| | 1.11 | % | | 100 | % | $ | 9,271 |
| | 0.76 | % | | 100 | % | | $ | 8,402 |
| | 0.95 | % | | 100 | % | | $ | 8,013 |
| | 1.01 | % | | 100 | % |
|
| | | | | | | | | | | | | | | | | | | |
| | December 31, |
| | 2014 | | 2013 |
| | Amount | | ALL as a % of Loans | | % of Loans | | Amount | | ALL as a % of Loans | | % of Loans |
| Commercial real estate | $ | 2,393 |
| | 1.21 | % | | 30 | % | | $ | 3,022 |
| | 3.07 | % | | 26 | % |
| Commercial business | 1,761 |
| | 1.59 |
| | 17 |
| | 1,272 |
| | 1.54 |
| | 22 |
|
| Construction loans | 1,215 |
| | 1.27 |
| | 15 |
| | 1,205 |
| | 2.36 |
| | 14 |
|
| Residential real estate | 197 |
| | 0.42 |
| | 7 |
| | 165 |
| | 1.20 |
| | 4 |
|
| Loans to individuals and other | 131 |
| | 0.56 |
| | 4 |
| | 111 |
| | 1.12 |
| | 3 |
|
| Subtotal | 5,697 |
| | 1.20 |
| | 73 |
| | 5,775 |
| | 2.26 |
| | 69 |
|
| Mortgage warehouse lines | 896 |
| | 0.50 |
| | 27 |
| | 585 |
| | 0.50 |
| | 31 |
|
| Unallocated reserves | 332 |
| | — |
| | — |
| | 679 |
| | — |
| | — |
|
| Total | $ | 6,925 |
| | 1.06 | % | | 100 | % | | $ | 7,039 |
| | 1.89 | % | | 100 | % |
|
| | | | | | | | | | | | | | | | | | | |
| | December 31, |
| | 2016 | | 2015 |
| | Amount | | ALL as a % of Loans | | % of Loans | | Amount | | ALL as a % of Loans | | % of Loans |
| Commercial real estate | $ | 2,574 |
| | 1.06 | % | | 34 | % | | $ | 3,049 |
| | 1.47 | % | | 30 | % |
| Commercial business | 1,732 |
| | 1.74 |
| | 14 |
| | 2,005 |
| | 2.02 |
| | 15 |
|
| Construction loans | 1,204 |
| | 1.25 |
| | 13 |
| | 1,025 |
| | 1.09 |
| | 14 |
|
| Residential real estate | 367 |
| | 0.82 |
| | 6 |
| | 288 |
| | 0.71 |
| | 6 |
|
| Loans to individuals and other | 112 |
| | 0.47 |
| | 3 |
| | 109 |
| | 0.47 |
| | 3 |
|
| Subtotal | 5,989 |
| | 1.18 |
| | 70 |
| | 6,476 |
| | 1.39 |
| | 68 |
|
| Mortgage warehouse lines | 973 |
| | 0.45 |
| | 30 |
| | 866 |
| | 0.40 |
| | 32 |
|
| Unallocated reserves | 532 |
| | — |
| | — |
| | 218 |
| | — |
| | — |
|
| Total | $ | 7,494 |
| | 1.03 | % | | 100 | % | | $ | 7,560 |
| | 1.11 | % | | 100 | % |
The allowance for loan losses, excluding the portion related to mortgage warehouse lines, increased to $7.2$8.2 million at December 31, 20172019 from $6.5$7.7 million at December 31, 2016.2018.
Deposits
The following table sets forth the balances and contractual rates payable to our customers, by account type, as of December 31, 20172019 and 2016:2018:
| | | | December 31, 2017 | | December 31, 2016 | December 31, 2019 | | December 31, 2018 |
| (Dollars in thousands) | Amount | | Percent Of Total | | Weighted Average Contractual Rate | | Amount | | Percent Of Total | | Weighted Average Contractual Rate | Amount | | Percent Of Total | | Weighted Average Contractual Rate | | Amount | | Percent Of Total | | Weighted Average Contractual Rate |
| Non-interest bearing demand | $ | 196,509 |
| | 21 | % | | — | % | | $ | 170,854 |
| | 20 | % | | — | % | $ | 287,555 |
| | 23 | % | | — | % | | $ | 212,981 |
| | 22 | % | | — | % |
| Interest bearing demand | 372,133 |
| | 41 | % | | 0.43 | % | | 310,103 |
| | 37 | % | | 0.37 | % | 393,392 |
| | 31 | % | | 0.79 | % | | 323,503 |
| | 34 | % | | 0.63 | % |
| Savings | 215,197 |
| | 23 | % | | 0.63 | % | | 205,294 |
| | 25 | % | | 0.59 | % | 259,033 |
| | 20 | % | | 0.97 | % | | 189,612 |
| | 20 | % | | 0.81 | % |
| Total core deposits | $ | 783,839 |
| | 85 | % | | 0.38 | % | | $ | 686,251 |
| | 82 | % | | 0.35 | % | $ | 939,980 |
| | 74 | % | | 0.60 | % | | $ | 726,096 |
| | 76 | % | | 0.51 | % |
| | | | | | | | | | | | | | | | | | | | | | | |
| Certificates of deposit | $ | 138,167 |
| | 15 | % | | 1.22 | % | | $ | 148,265 |
| | 18 | % | | 1.12 | % | $ | 337,382 |
| | 26 | % | | 2.23 | % | | $ | 224,576 |
| | 24 | % | | 1.98 | % |
| | | | | | | | | | | | | | | | | | | | | | | |
| Total | $ | 922,006 |
| | 100 | % | | 0.52 | % | | $ | 834,516 |
| | 100 | % | | 0.49 | % | $ | 1,277,362 |
| | 100 | % | | 1.04 | % | | $ | 950,672 |
| | 100 | % | | 0.85 | % |
The following table indicates the amount of certificates of deposit by time remaining until maturity as of December 31, 2017.2019.
| | | (In thousands) | 3 Months or Less | | Over 3 to 6 Months | | Over 6 to 12 Months | | Over 12 Months | | Total | 3 Months or Less | | Over 3 to 6 Months | | Over 6 to 12 Months | | Over 12 Months | | Total |
| Certificates of deposit of $100,000 or more | $ | 17,372 |
| | $ | 10,822 |
| | $ | 21,127 |
| | $ | 40,036 |
| | $ | 89,357 |
| $ | 54,368 |
| | $ | 60,652 |
| | $ | 76,136 |
| | $ | 48,225 |
| | $ | 239,381 |
|
| Certificates of deposit less than $100,000 | 9,676 |
| | 7,700 |
| | 9,596 |
| | 21,838 |
| | 48,810 |
| 17,080 |
| | 18,815 |
| | 24,999 |
| | 37,107 |
| | 98,001 |
|
| Total | $ | 27,048 |
| | $ | 18,522 |
| | $ | 30,723 |
| | $ | 61,874 |
| | $ | 138,167 |
| $ | 71,448 |
| | $ | 79,467 |
| | $ | 101,135 |
| | $ | 85,332 |
| | $ | 337,382 |
|
The following table illustrates the components of average total deposits for the years indicated:
| | | | 2017 | | 2016 | | 2015 | 2019 | | 2018 | | 2017 |
| (Dollars in thousands) | Average Balance | | Percentage of Total | | Average Balance | | Percentage of Total | | Average Balance | | Percentage of Total | Average Balance | | Percentage of Total | | Average Balance | | Percentage of Total | | Average Balance | | Percentage of Total |
| Non-interest bearing demand | $ | 183,802 |
| | 21 | % | | $ | 166,380 |
| | 20 | % | | $ | 164,348 |
| | 20 | % | $ | 226,701 |
| | 21 | % | | $ | 204,002 |
| | 21 | % | | $ | 183,802 |
| | 21 | % |
| Interest bearing demand | 336,445 |
| | 38 | % | | 301,086 |
| | 36 | % | | 300,813 |
| | 37 | % | 349,663 |
| | 33 | % | | 356,906 |
| | 38 | % | | 336,445 |
| | 38 | % |
| Savings | 210,798 |
| | 24 | % | | 206,208 |
| | 25 | % | | 196,915 |
| | 24 | % | 201,738 |
| | 19 | % | | 203,940 |
| | 21 | % | | 210,798 |
| | 24 | % |
| Certificates of deposit | 145,539 |
| | 17 | % | | 152,078 |
| | 19 | % | | 158,754 |
| | 19 | % | 286,419 |
| | 27 | % | | 189,521 |
| | 20 | % | | 145,539 |
| | 17 | % |
| Total | $ | 876,584 |
| | 100 | % | | $ | 825,752 |
| | 100 | % | | $ | 820,830 |
| | 100 | % | $ | 1,064,521 |
| | 100 | % | | $ | 954,369 |
| | 100 | % | | $ | 876,584 |
| | 100 | % |
Deposits, which include demand deposits (interest bearing and non-interest bearing), savings deposits and certificates of deposit, are a fundamental and cost-effective source of funding. The flow of deposits is influenced significantly by general economic conditions, changes in market interest rates and competition. The Company offers a variety of products designed to attract and retain customers, with the Company’s primary focus on the building and expanding of long-term relationships. Deposits for the year ended December 31, 20172019 averaged $876.6 million,$1.1 billion, representing an increase of $50.8$110.2 million, or 6.2%11.5%, compared to $825.8$954.4 million for the year ended December 31, 2016. 2018. The Shore Merger provided $35.7 million in average deposits for the year ended December 31, 2019.
At December 31, 2017,2019, total deposits were $922.0 million,$1.3 billion, representing an increase of $87.5$326.7 million, or 10.5%34.4%, from $834.5$950.7 million at December 31, 2016.2018. The Shore Merger provided $244.3 million in deposits at December 31, 2019. The increase in total deposits in 20172019 was due principally to an increase of $62.0$74.6 million in non-interest bearing demand deposits, an increase of $69.9 million in interest-bearing demand deposits, a $25.7an increase of $69.4 million in savings and an increase of $112.8 million in non-interest bearingcertificates of deposit. Total deposits, excluding Shore deposits, increased $82.4 million during the year ended December 31, 2019. Municipal deposits, primarily interest-bearing demand deposits and a $9.9savings accounts, increased approximately $55.3 million increase in savings deposits, which were partially offset by a $10.1 million decrease in certificates of deposits.from December 31, 2018. The average cost of the Company’s interest-bearing deposit accounts for 20172019 was 0.66%1.32%, representing an increase from the average cost of 0.61%0.87% for 2016.2018.
Average non-interest bearing demand deposits increased by $17.4$22.7 million, or 10.5%11.1%, to $183.8$226.7 million for the year ended December 31, 20172019 from $166.4$204.0 million for the year ended December 31, 2016.2018. At December 31, 2017,2019, non-interest bearing demand deposits totaled $196.5$287.6 million, representing an increase of $25.7$74.6 million, or 15.0%35.0%, compared to $170.9$213.0 million at December 31, 20162018. Non-interest bearing demand deposits made up 21.3%22.5% of total deposits at December 31, 20172019 compared to 20.5%22.4% at December 31, 20162018 and represent a stable, interest-free source of funds.
In 2017,2019, the average balance of savings accounts increaseddecreased by $4.6$2.2 million to $210.8$201.7 million compared to an average balance of $206.2$203.9 million in 2016.2018. Savings accounts increased by $9.9$69.4 million, or 4.8%36.6%, to $215.2$259.0 million at December 31, 20172019 from $205.3$189.6 million at December 31, 2016.2018. The average cost of savings deposits was 0.63%0.97% for 20172019 compared to 0.59%0.72% in 2016.2018.
Interest-bearing demand deposits, which include interest-bearing checking accounts, money market and NOW accounts and the Company’s premier money market product, 1st Choice account, increaseddecreased by $35.4$7.2 million, or 11.7%2.0%, to an average of $336.4$349.7 million for 20172019 from an average of $301.1$356.9 million for 2016.2018. At December 31, 2017,2019, interest-bearing demand deposits were $372.1$393.4 million compared to $310.1$323.5 million at December 31, 2016.2018. The average cost of interest-bearing demand deposits was 0.43%0.79% for 20172019 compared to 0.37%0.55% in 2016.2018.
Certificates of deposit at December 31, 20172019 were $138.2$337.4 million, a decreasean increase of $10.1$112.8 million from $148.3$224.6 million at December 31, 2016.2018. The average cost of certificates of deposits increased to 1.22%2.23% in 20172019 from 1.12%1.62% in 2016.2018.
Borrowings
Borrowings are comprised of Federal Home Loan Bank (“FHLB”) borrowings and overnight funds purchased and are primarily used to fund asset growth not supported by deposit generation. The average balance of other borrowed funds decreasedincreased by $27.3$2.0 million to $21.1$38.6 million for 20172019 from an average balance of $48.4$36.6 million for 20162018 due to an decreaseincrease in overnight borrowings in 2017 as well as2019 to meet the repaymentneed for funding of one long-term FHLB advance of $10.0 million at maturity.the Bank's loan growth. The average cost of other borrowed funds increased 618 basis points to 2.03%2.36% for 20172019 compared to 1.42%2.28% for 20162018 because of the increase in short-term market interest rates.
Shareholders’ Equity and Dividends
Shareholders’ equity increased by $6.9$43.5 million, or 6.5%34.2%, to $111.7$170.6 million at December 31, 20172019 from $104.8$127.1 million at December 31, 2016.2018. Book value per common share was $13.81$16.74 at December 31, 20172019 compared to $13.11$14.77 at December 31, 2016.2018. The ratio of average shareholders’ equity to total average assets was 10.56%10.76% and 10.06%10.48% for 20172019 and 2016,2018, respectively. The increase in shareholders’ equity from December 31, 20162018 to December 31, 20172019 was primarily the result of the issuance of common stock in connection with the Shore Merger and net income for 2017,of $13.6 million, which was partially offset by dividends paid.
On December 19, 2018, both of the outstanding warrants were exercised and pursuant to the terms and conditions of the two warrants, the Company issued a net of 198,378 shares. No cash was received from the exercise of the warrants.
In lieu of cash dividends, the Company (and its predecessor, the Bank) declared a stock dividend every year for the years 1992 through 2012 and paid such dividends every year for the years 1993 through 2013. The Company declared two stock dividends in 2015 and did not declare a stock dividend in 2014 or 2013. . The Company began declaring and paying cash dividends in September 2016. The2016 and has declared and paid a cash dividend each quarter since then. Most recently, the Company paid a cash dividend of $0.09 per share of common stock on February 27, 2020, representing an increase of 20% compared to the dividend of $0.075 per share of common stock paid on November 5, 2019. Although the Company intends to continue to pay comparable cash dividends, the timing and the amount of the payment of future cash dividends, if any, on the Company's common shares will be at the discretion of the Company's Board of Directors and will be determined after consideration of various factors, including the level of earnings, cash requirements, regulatory capital and financial condition.
The
Federal Reserve Board has issued a supervisory letter to bank holding companies that contains guidancebanking regulations on when the boardpayment of directorsdividends and the Company’s compliance with said regulations are discussed in Item 1 of a bank holding company should eliminate or defer or severely limit dividends, including, for example, when net income available for shareholdersthis Form 10-K under the section titled “Restrictions on Dividends and Redemption of Stock for the past four quarters, net of dividends paid during that period, is not sufficient to fully fundCompany and the dividends. The letter also contains guidance on the redemption of stock by bank holding companies, which urges bank holding companies to advise the Federal Reserve of any such redemption or repurchase of common stock for cash or other value that results in the net reduction of a bank holding company’s capital at the beginning of the quarter below the capital outstanding at the end of the quarter. The Company's payment of cash dividends to date were within the guidelines set forth in the Federal Reserve Board's supervisory letter.Bank.”
The Company’s common stock is quoted on the Nasdaq Global Market under the symbol “FCCY.”
The Company and the Bank are subject to various regulatory capital requirements administered by the Federal Reserve Board and the Federal Deposit Insurance Corporation.FDIC. For information on regulatory capital, see “Capital Adequacy”Adequacy of the Company and the Bank” in the “Supervision and Regulation” section under Item 1. “Business” and Note 18,19, "Regulatory Capital Requirements" of the Notes to Consolidated Financial Statements.
The Company believes that its shareholders’ equity and regulatory capital position are adequate to support the planned operations of the Company for the foreseeable future.next 12 months.
Capital Resources
The Company and the Bank are subject to various regulatory capital requirements administered by the Federal and state banking agencies. Failure to meet minimum capital requirements can initiate certain mandatory, and possibly additional discretionary, actions by regulators that, if undertaken, could have a direct material effect on the Company’s and the Bank’s financial statements. Under capital adequacy guidelines and the regulatory framework for prompt corrective action, the Company and the Bank must meet specific capital guidelines that involve quantitative measures of the Company’s and the Bank’s assets, liabilities and certain off-balance sheet items as calculated under regulatory accounting practices. The Company’s and the Bank’s capital amounts and classifications are also subject to qualitative judgments by the regulators about components, risk weightings and other factors.
Quantitative measures established by regulation to ensure capital adequacy require the Company and the Bank to maintain minimum amounts and ratios of Common Equity Tier 1, Total and Tier I capital (as defined in the regulations) to risk-weighted assets (as defined) and Tier I capital to average assets (Leverage ratio, as defined). As of December 31, 2017,2019, the Company and the Bank met all capital adequacy requirements to which they are subject.
To be categorized as adequately capitalized, the Company and the Bank must maintain minimum Common Equity Tier 1, Total capital to risk-weighted assets, Tier 1 capital to risk-weighted assets and Tier I leverage capital ratios as set forth in the below table. As of December 31, 2017,2019, the Bank's capital ratios exceeded the regulatory standards for well-capitalized institutions. Certain bank regulatory limitations exist on the availability of the Bank’s assets for the payment of dividends by the Bank without prior approval of bank regulatory authorities.
In July 2013,Federal regulatory capital adequacy requirements are discussed in Item 1 of this Form 10-K under the Federal Reserve Boardsection titled “Capital Adequacy of the Company and the FDIC approved revisions to their capital adequacy guidelines and prompt corrective action rules that implemented and addressed the revised standards of Basel III and addressed relevant provisions of the Dodd-Frank Act. The Federal Reserve Board’s final rules and the FDIC’s interim final rules (which became final in April 2014 with no substantive changes) apply to all depository institutions, top-tier bank holding companies with total consolidated assets of $500 million or more (which was subsequently increased to $1 billion or more in May 2015) and top-tier savings and loan holding companies (“banking organizations”)Bank. Among other things, the rules established a Common Equity Tier 1 minimum capital requirement (4.5% of risk-weighted assets) and increased the minimum Tier 1 capital to risk-based assets requirement (from 4% to 6% of risk-weighted assets). Banking organizations are also required to have a total capital ratio of at least 8% and a Tier 1 leverage ratio of at least 4%.”
The rulesCompany and Bank are also limited a banking organization’s ability to payin paying dividends engage in share repurchases or pay discretionary bonuses if they do not maintain the banking organization does not hold anecessary “capital conservation buffer” consistingas discussed in Item 1 of 2.5%this Form 10-K under the sections titled “Capital Adequacy of Common Equity Tier 1 capital to risk-weighted assets in addition to the amount necessary to meet its minimum risk-based capital requirements. The rules became effectiveCompany and the Bank” and “Restrictions on Dividends and Redemption of Stock for the Company and the Bank on January 1, 2015. The capital conservation buffer requirement began phasing in on January 1, 2016 at 0.625% of Common Equity Tier 1 capital to risk-weighted assets and increases by that amount each year until fully implemented in January 2019 at 2.5% of Common Equity Tier 1 capital to risk-weighted assets.Bank.” As of December 31, 2017,2019, the Company and the Bank weremaintained the required to maintain a capital conservation buffer of 1.25%2.5%.
The Company's and the Bank's regulatory capital ratios, excluding the impact of the capital conservation buffer, as of December 31, 2017 are2019 were as follows:
| | | | | | | | | | | | To Be Well Capitalized Under Prompt | | | | | | | | | To Be Well Capitalized Under Prompt |
| | | | | | For Capital | | Corrective | | | | | For Capital | | Corrective |
| | Actual | | Adequacy Purposes | | Action Provisions | Actual | | Adequacy Purposes | | Action Provisions |
| (Dollars in thousands) | Amount | | Ratio | | Amount | | Ratio | | Amount | | Ratio | Amount | | Ratio | | Amount | | Ratio | | Amount | | Ratio |
| Company | | | | | | | | | | | | | | | | | | | | | | |
| Common Equity Tier 1 | $ | 99,839 |
| | 10.19 | % | | $ | 44,106 |
| | 4.50 | % | | N/A |
| | N/A |
| $ | 133,046 |
| | 9.70 | % | | $ | 61,604 |
| | 4.50 | % | | N/A |
| | N/A |
|
| Total capital to risk-weighted assets | 125,852 |
| | 12.84 | % | | 78,411 |
| | 8.00 | % | | ��N/A |
| | N/A |
| 160,317 |
| | 11.69 | % | | 109,519 |
| | 8.00 | % | | N/A |
| | N/A |
|
| Tier 1 capital to risk-weighted assets | 117,839 |
| | 12.02 | % | | 58,808 |
| | 6.00 | % | | N/A |
| | N/A |
| 151,046 |
| | 11.01 | % | | 82,139 |
| | 6.00 | % | | N/A |
| | N/A |
|
| Tier 1 leverage capital | 117,839 |
| | 11.23 | % | | 41,987 |
| | 4.00 | % | | N/A |
| | N/A |
| 151,046 |
| | 10.56 | % | | 57,245 |
| | 4.00 | % | | N/A |
| | N/A |
|
| Bank | | | | | | | | | | | | | | | | | | | | | | |
| Common Equity Tier 1 | $ | 115,031 |
| | 11.74 | % | | $ | 44,106 |
| | 4.50 | % | | $ | 63,709 |
| | 6.50 | % | $ | 150,725 |
| | 10.99 | % | | $ | 61,579 |
| | 4.50 | % | | $ | 88,948 |
| | 6.50 | % |
| Total capital to risk-weighted assets | 123,044 |
| | 12.55 | % | | 78,411 |
| | 8.00 | % | | 98,014 |
| | 10.00 | % | 159,996 |
| | 11.67 | % | | 109,474 |
| | 8.00 | % | | 136,843 |
| | 10.00 | % |
| Tier 1 capital to risk-weighted assets | 115,031 |
| | 11.74 | % | | 58,808 |
| | 6.00 | % | | 78,411 |
| | 8.00 | % | 150,725 |
| | 10.99 | % | | 82,106 |
| | 6.00 | % | | 109,474 |
| | 8.00 | % |
| Tier 1 leverage capital | 115,031 |
| | 10.96 | % | | 41,987 |
| | 4.00 | % | | 52,484 |
| | 5.00 | % | 150,725 |
| | 10.54 | % | | 57,222 |
| | 4.00 | % | | 71,528 |
| | 5.00 | % |
At December 31, 2017,2019, the Company and the Bank met all the regulatory capital adequacy requirements to which they arewere subject and were classified as “well capitalized” under the regulatory framework for prompt corrective action. Management believes that no conditions or events have occurred since December 31, 20172019 that would materially adversely change the Company’s or the Bank’s capital classifications. Management believes that the Company’s and the Bank’s capital resources are adequate to support the planned merger with New Jersey Community Bank and the Company’s and the Bank’s current strategic and operating plans. The Company and the Bank do not expect any material changes in the mix and relative cost of their capital resources in 2018.2020.
On September 17, 2019, the federal banking agencies adopted a final rule, effective January 1, 2020, creating a CBLR framework for institutions with total consolidated assets of less than $10 billion and that meet other qualifying criteria. The CBLR framework provides for a simpler measure of capital adequacy for qualifying institutions. Qualifying institutions that elect to use the CBLR framework and that maintain a leverage ratio of greater than 9% will be considered to have satisfied the generally applicable risk-based and leverage capital requirements in the federal banking agencies’ capital rules and to have met the “well capitalized” ratio requirements. Management is still reviewing the CBLR framework, but does not expect that the Company or the Bank will elect to use the framework. A further discussion of the CBLR framework is provided in Item 1 of this Form 10-K under the section titled “Capital Adequacy of the Company and the Bank.”
The Company and the Bank do not have material commitments for capital expenditures at December 31, 2017.2019. Any non-material commitments for capital expenditures are in the ordinary course of business and will be funded through cash flow from operations in 2018.2020.
Off-Balance Sheet Arrangements and Contractual Obligations
In the normal course of business the Company enters into various transactions that, in accordance with U.S. GAAP, are not included on the balance sheet. The Company issues off-balance sheet financial instruments in connection with its lending activities and to meet the financing needs of its customers. These financial instruments include commitments to fund loans, lines of credit and commercial and standby letters of credit. These instruments carry various degrees of credit risk and market risk, which are essentially the same risks involved in extending loans. The Company generally follows the same credit and collateral policies in making these commitments and conditional obligations as it does for instruments recorded on the Company’s consolidated balance sheet. Many of these commitments and conditional obligations are expected to expire without being drawn, and the contractual amounts do not necessarily represent future cash requirements. These off-balance sheet arrangements have not had and are not reasonably likely to have a current or future material effect on the Company’s financial position, revenues, expenses, results of operations, liquidity, capital expenditures or capital resources.
The financial instrument commitments at December 31, 20172019 were as follows:
|
| | | | | | | | | | | | | | | | | | | |
| (In thousands) | Less than One Year | | One to Three Years | | Three to Five Years | | Over Five Years | | Total |
| Commercial and standby letters of credit | $ | 1,220 |
| | $ | — |
| | $ | — |
| | $ | — |
| | $ | 1,220 |
|
| Commitments to fund loans | 57,500 |
| | — |
| | — |
| | — |
| | 57,500 |
|
| Commitments to extend credit | 239,619 |
| | 147,945 |
| | — |
| | — |
| | 387,564 |
|
| Commitments to sell residential loans | 7,908 |
| | — |
| | — |
| | — |
| | 7,908 |
|
| Total | $ | 306,247 |
| | $ | 147,945 |
| | $ | — |
| | $ | — |
| | $ | 454,192 |
|
|
| | | | | | | | | | | | | | | | | | | |
| (In thousands) | Less than One Year | | One to Three Years | | Three to Five Years | | Over Five Years | | Total |
| Commercial and standby letters of credit | $ | 4,290 |
| | $ | — |
| | $ | — |
| | $ | — |
| | $ | 4,290 |
|
| Commitments to fund loans | 54,325 |
| | 180 |
| | 44 |
| | — |
| | 54,549 |
|
| Commitments to extend credit | 233,756 |
| | 31,998 |
| | 6,260 |
| | 54,456 |
| | 326,470 |
|
| Commitments to sell residential loans | 14,964 |
| | — |
| | — |
| | — |
| | 14,964 |
|
| Total | $ | 307,335 |
| | $ | 32,178 |
| | $ | 6,304 |
| | $ | 54,456 |
| | $ | 400,273 |
|
Commercial and standby letters of credit
Letters of credit are conditional commitments issued by the Company to guarantee the performance of a specified financial obligation of a customer to a third party. In the event that the customer does not perform in accordance with the terms of the agreement with the third party, the Company would be required to fund the commitment. The maximum potential future payments that the Company could be required to make was $1.2$4.3 million at December 31, 2017.2019.
Commitments to fund loans
Commitments to fund loans are legally binding loan commitments with set expiration dates and specified interest rates as well as for specific purposes. These loan commitments are intended to be disbursed, subject to the satisfaction of certain conditions, upon the request of the borrower.
Commitments to extend credit
The Company issues lines of credit to commercial businesses, to owners of commercial real estate, for the construction or acquisition of real estate properties and to consumers for home equity and personal expenditures. Many of these commitments may not be drawn but are available to the borrower under the terms of the loan agreement.
Commitments to sell residential loans
The Company enters into best efforts forward sales commitments to sell residential mortgage loans that it has closed (loans held for sale), or it expects to close (commitments to originate loans to be sold). These commitments are utilized to reduce the Company’s market price risk from the date of commitment to the date of sale. The notional amount of the forward sales commitments was approximately $7.9$15.0 million at December 31, 2017.2019.
The following table presents additional information regarding the Company’s outstanding contractual obligations as of December 31, 2017:2019:
| | | | Payments Due by Period | Payments Due by Period |
| (In thousands) | Less than One Year | | One to Three Years | | Three to Five Years | | More than Five Years | | Total | Less than One Year | | One to Three Years | | Three to Five Years | | More than Five Years | | Total |
| Operating leases | $ | 1,281 |
| | $ | 2,025 |
| | $ | 1,531 |
| | $ | 2,675 |
| | $ | 7,512 |
| $ | 1,663 |
| | $ | 3,169 |
| | $ | 2,195 |
| | $ | 1,866 |
| | $ | 8,893 |
|
| Borrowed funds and subordinated debentures | 20,500 |
| | — |
| | — |
| | 18,557 |
| | 39,057 |
| 92,050 |
| | — |
| | — |
| | 18,557 |
| | 110,607 |
|
| Certificates of deposit | 76,293 |
| | 42,656 |
| | 19,218 |
| | — |
| | 138,167 |
| 252,050 |
| | 83,191 |
| | 2,141 |
| | — |
| | 337,382 |
|
| Retirement benefit obligation projected | 4,509 |
| | — |
| | — |
| | — |
| | 4,509 |
| 4,719 |
| | — |
| | — |
| | — |
| | 4,719 |
|
| Total contractual obligations: | $ | 102,583 |
| | $ | 44,681 |
| | $ | 20,749 |
| | $ | 21,343 |
| | $ | 189,245 |
| $ | 350,482 |
| | $ | 86,360 |
| | $ | 4,336 |
| | $ | 20,423 |
| | $ | 461,601 |
|
Liquidity
At December 31, 2017,2019, the amount of liquid assets held by the Company remained at a level management deemed adequate to ensure that contractual liabilities, depositors’ withdrawal requirements and other operational and customer credit needs could be satisfied.
Liquidity management refers to the Company’s ability to support asset growth while satisfying the borrowing needs and deposit withdrawal requirements of its customers. In addition to maintaining liquid assets, factors such as capital position, profitability, asset quality and availability of funding affect a bank’s ability to meet its liquidity needs. On the asset side, liquid funds are maintained in the form of cash and cash equivalents, federal funds sold, deposits at the Federal Reserve Bank, investment securities held to maturity maturing within one year, securities available for sale and loans held for sale. Additional asset-based liquidity is derived from scheduled loan repayments as well as investment repayments of principal and interest from mortgage-backed securities. On the liability side, the primary source of liquidity is the ability to generate core deposits. Short-term and long-term borrowings are used as supplemental funding sources when growth in the core deposit base does not keep pace with that of earnings assets.
The Company has established a borrowing relationship with the FHLB, which further supports and enhances liquidity. During 2010, the FHLB replaced its Overnight Line of Credit and One-Month Overnight Repricing Line of Credit facilities available to member banks with a fully secured line of up to 50 percent of a bank’s quarter-end total assets. Under the terms of this facility, the Bank’s total credit exposure to the FHLB cannot exceed 50 percent, or $539.6$793.0 million, of its total assets at December 31, 2017.2019. In addition, the aggregate outstanding principal amount of the Bank’s advances, letters of credit, the dollar amount of the FHLB’s minimum collateral requirement for off balance sheet financial contracts and advance commitments cannot exceed 30 percent of the Bank’s total assets, unless the Bank obtains approval from the FHLB’s Board of Directors or its Executive Committee. These limits are further restricted by a member bank’s ability to provide eligible collateral to support its obligations to the FHLB, as well as a member bank’s ability to meet the FHLB’s stock requirement. A December 31, 2019 and December 31, 2018, the Bank pledged approximately $308.5 million and $270.9 million of loans, respectively, to support the FHLB borrowing capacity. At December 31, 2017,2019 and December 31, 2018, the Bank had available borrowing capacity of $140.3$160.7 million at the FHLB of New York. At December 31, 2016, the Bank had available borrowing capacity of $125.8and $131.2 million, respectively, at the FHLB of New York. The Bank also maintains unsecured federal funds lines of $46.0 million with two correspondent banks.banks, of which $25.0 million was available at December 31, 2019.
The Consolidated Statements of Cash Flows present the changes in cash from operating, investing and financing activities. At December 31, 2017,2019, the balance of cash and cash equivalents was $18.8$14.8 million.
Net cash provided by operating activities totaled $22.1$13.3 million for the year ended December 31, 20172019 compared to net cash provided by operating activities of $2.6$17.3 million for the year ended December 31, 2016.2018. The primary source of funds was net income from operations, adjusted for activity related to loans originated for sale, the provision for loan losses, depreciation expense and net amortization of premiums on securities. Cash was used in operations primarily for originating loans held for sale. The increasedecrease in net cash provided by operating activities was due primarily to net cash used in the origination and sale of loans totaling $2.9 million in 2019 compared to $1.2 million of cash provided by the origination and sale of loans totaling $10.6 million in 2017 compared to $9.02018. $2.5 million of cash was used to reduce accrued expenses and other liabilities in the origination and sale of loans in 2016.2019.
Net cash used in investing activities totaled $51.8$109.9 million for the year ended December 31, 20172019 compared to $60.7$9.9 million for the year ended December 31, 2016.2018. The cash used in lending activities was $65.6$127.1 million in 20172019 compared to $42.8$19.8 million in 2016. This higher use of cash was partially offset by2018. The cash provided by investment securities transactions of $14.0activities was $7.8 million in 20172019 compared to net cash used in investing activities of $17.7$12.9 million in 2016.2018.
Net cash provided by financing activities totaled $33.5$94.7 million for the year ended December 31, 20172019 compared to $61.6net cash used in financing activities of $9.3 million for the year ended December 31, 2016.2018. The net cash provided by financing activities in 20172019 was due primarily to the net increase in deposits and short-term borrowings, which was partially offset by net repayments of long-term borrowings of $10.0 million and overnight borrowings of $42.6 million.used in funding the lending activity. The Company paid dividends totaling $1.7$2.6 million in 20172019 compared to $399,000$2.1 million in 2016.2018.
The investment securities portfolios are also a source of liquidity, providing cash flows from maturities and periodic repayments of principal. For the year ended December 31, 2017,2019, sales, repayments and maturities of investment securities totaled $84.3$58.0 million compared to $54.8$55.9 million in 2016.2018. Another source of liquidity is the loan portfolio, which provides a flow of payments and maturities.
The CompanyManagement believes that itsthe Company's liquidity position is adequate to service the needs of its borrowers and depositors and provide for its planned operations.
Interest Rate Sensitivity Analysis
The largest component of the Company’s total income is net interest income and the majority of the Company’s financial instruments are composed of interest rate sensitive assets and liabilities with various terms and maturities. The primary objective of management is to maximize net interest income while minimizing interest rate risk. The Company’s assets consist primarily of floating rate construction loans, commercial lines of credit and fixed rate commercial real estate loans and its liabilities consist primarily of deposits. Interest rate risk is derived from timing differences and the magnitude of relative changes in the repricing
of assets and liabilities, loan prepayments, deposit withdrawals and differences in lending and funding rates. Management actively seeks to monitor and control the mix of interest rate sensitive assets and liabilities.
The following table sets forth certain information relating to the Company’s financial instruments that are sensitive to changes in interest rates, categorized by expected maturity or repricing of such instruments, at December 31, 2017.2019.
| | | | | Interest Sensitivity Period | | Total Within | | One Year to | | Over | | Non-interest | | | | Interest Sensitivity Period | | Total Within | | One Year to | | Over | | Non-interest | | |
| (In thousands) | | 30 Day | | 90 Day | | 180 Day | | 365 Day | | One Year | | Five Years | | Five Years | | Sensitive | | Total | | 30 Day | | 90 Day | | 180 Day | | 365 Day | | One Year | | Five Years | | Five Years | | Sensitive | | Total |
| Assets : | | | | | | | | | | | | | | | | | | | | | | | | | | | | | | | | | | | | |
| Cash and due from banks | | $ | 3,915 |
| | $ | — |
| | $ | — |
| | $ | — |
| | $ | 3,915 |
| | $ | — |
| | $ | — |
| | $ | 14,839 |
| | $ | 18,754 |
| | $ | 12,176 |
| | $ | — |
| | $ | — |
| | $ | — |
| | $ | 12,176 |
| | $ | — |
| | $ | — |
| | $ | 2,666 |
| | $ | 14,842 |
|
| Federal funds sold | | — |
| | — |
| | — |
| | — |
| | — |
| | — |
| | — |
| | — |
| | — |
| | — |
| | — |
| | — |
| | — |
| | — |
| | — |
| | — |
| | — |
| | — |
|
| Investment securities | | 17,954 |
| | 20,941 |
| | 11,333 |
| | 25,436 |
| | 75,664 |
| | 95,894 |
| | 36,317 |
| | 7,850 |
| | 215,725 |
| | 50,475 |
| | 21,932 |
| | 12,011 |
| | 22,701 |
| | 107,119 |
| | 93,400 |
| | 25,025 |
| | 6,858 |
| | 232,402 |
|
| Loans held for sale | | 4,254 |
| | — |
| | — |
| | — |
| | 4,254 |
| | — |
| | — |
| | — |
| | 4,254 |
| | 5,927 |
| | — |
| | — |
| | — |
| | 5,927 |
| | — |
| | — |
| | — |
| | 5,927 |
|
| Loans, net of allowance for loan losses | | 383,468 |
| | 30,972 |
| | 38,760 |
| | 46,991 |
| | 500,191 |
| | 251,484 |
| | 26,942 |
| | 11,289 |
| | 789,906 |
| | 521,744 |
| | 33,910 |
| | 43,390 |
| | 95,680 |
| | 694,724 |
| | 465,353 |
| | 42,763 |
| | 13,188 |
| | 1,216,028 |
|
| Other assets | | — |
| | — |
| | — |
| | — |
| | — |
| | — |
| | — |
| | 50,635 |
| | 50,635 |
| | — |
| | — |
| | — |
| | — |
| | — |
| | — |
| | — |
| | 117,063 |
| | 117,063 |
|
| | | $ | 409,591 |
| | $ | 51,913 |
| | $ | 50,093 |
| | $ | 72,427 |
| | $ | 584,024 |
| | $ | 347,378 |
| | $ | 63,259 |
| | $ | 84,613 |
| | $ | 1,079,274 |
| | $ | 590,322 |
| | $ | 55,842 |
| | $ | 55,401 |
| | $ | 118,381 |
| | $ | 819,946 |
| | $ | 558,753 |
| | $ | 67,788 |
| | $ | 139,775 |
| | $ | 1,586,262 |
|
| Liabilities and Equity: | | |
| | |
| | |
| | |
| | |
| | |
| | |
| | |
| | |
| | |
| | |
| | |
| | |
| | |
| | |
| | |
| | |
| | |
|
| Demand deposits - non-interest bearing | | $ | — |
| | $ | — |
| | $ | — |
| | $ | — |
| | $ | — |
| | $ | — |
| | $ | — |
| | $ | 196,509 |
| | $ | 196,509 |
| | $ | — |
| | $ | — |
| | $ | — |
| | $ | — |
| | $ | — |
| | $ | — |
| | $ | — |
| | $ | 287,555 |
| | $ | 287,555 |
|
| Demand deposits - interest bearing | | 178,589 |
| | — |
| | — |
| | — |
| | 178,589 |
| | 153,669 |
| | 39,875 |
| | — |
| | 372,133 |
| | 189,640 |
| | — |
| | — |
| | — |
| | 189,640 |
| | 159,460 |
| | 44,292 |
| | — |
| | 393,392 |
|
| Savings deposits | | 121,312 |
| | — |
| | — |
| | 28 |
| | 121,340 |
| | 50,851 |
| | 43,006 |
| | — |
| | 215,197 |
| | 134,996 |
| | — |
| | — |
| | 58 |
| | 135,054 |
| | 72,201 |
| | 51,778 |
| | — |
| | 259,033 |
|
| Certificates of deposits | | 5,936 |
| | 21,112 |
| | 18,522 |
| | 30,723 |
| | 76,293 |
| | 61,874 |
| | — |
| | — |
| | 138,167 |
| | 19,750 |
| | 50,140 |
| | 80,878 |
| | 101,282 |
| | 252,050 |
| | 85,332 |
| | — |
| | — |
| | 337,382 |
|
| Borrowings | | 20,500 |
| | — |
| | — |
| | — |
| | 20,500 |
| | — |
| | — |
| | — |
| | 20,500 |
| | 92,050 |
| | — |
| | — |
| | — |
| | 92,050 |
| | — |
| | — |
| | — |
| | 92,050 |
|
| Redeemable subordinated debentures | | — |
| | 18,000 |
| | — |
| | — |
| | 18,000 |
| | — |
| | — |
| | 557 |
| | 18,557 |
| | — |
| | 18,000 |
| | — |
| | — |
| | 18,000 |
| | — |
| | — |
| | 557 |
| | 18,557 |
|
| Non-interest-bearing sources | | — |
| | — |
| | — |
| | — |
| | — |
| | — |
| | — |
| | 118,211 |
| | 118,211 |
| | — |
| | — |
| | — |
| | — |
| | — |
| | — |
| | — |
| | 198,293 |
| | 198,293 |
|
| | | $ | 326,337 |
| | $ | 39,112 |
| | $ | 18,522 |
| | $ | 30,751 |
| | $ | 414,722 |
| | $ | 266,394 |
| | $ | 82,881 |
| | $ | 315,277 |
| | $ | 1,079,274 |
| | $ | 436,436 |
| | $ | 68,140 |
| | $ | 80,878 |
| | $ | 101,340 |
| | $ | 686,794 |
| | $ | 316,993 |
| | $ | 96,070 |
| | $ | 486,405 |
| | $ | 1,586,262 |
|
| | | | | | | | | | | | | | | | | | | | | | | | | | | | | | | | | | | | | |
| Asset (Liability) Sensitivity Gap : | | |
| | |
| | |
| | |
| | |
| | |
| | |
| | |
| | |
| | |
| | |
| | |
| | |
| | |
| | |
| | |
| | |
| | |
|
| Period Gap | | $ | 83,254 |
| | $ | 12,801 |
| | $ | 31,571 |
| | $ | 41,676 |
| | $ | 169,302 |
| | $ | 80,984 |
| | $ | (19,622 | ) | | $ | (230,664 | ) | | — |
| | $ | 153,886 |
| | $ | (12,298 | ) | | $ | (25,477 | ) | | $ | 17,041 |
| | $ | 133,152 |
| | $ | 241,760 |
| | $ | (28,282 | ) | | $ | (346,630 | ) | | — |
|
| Cumulative Gap | | 83,254 |
| | 96,055 |
| | 127,626 |
| | 169,302 |
| | 169,302 |
| | 250,286 |
| | 230,664 |
| | — |
| | — |
| | $ | 153,886 |
| | $ | 141,588 |
| | $ | 116,111 |
| | $ | 133,152 |
| | $ | 133,152 |
| | $ | 374,912 |
| | $ | 346,630 |
| | — |
| | — |
|
| Cumulative Gap to Total Assets | | 7.7 | % | | 8.9 | % | | 11.8 | % | | 15.7 | % | | 15.7 | % | | 23.2 | % | | 21.4 | % | | — |
| | — |
| | 9.7 | % | | 8.9 | % | | 7.3 | % | | 8.4 | % | | 8.4 | % | | 23.6 | % | | 21.9 | % | | — |
| | — |
|
Under the Company’s interest rate risk policy established by its Board of Directors, quantitative guidelines have been established with respect to the Company’s interest rate risk and how interest rate shocks are projected to affect the Company’s net interest income and economic value of equity (“EVE”). The Company engages the services of an outside consultant to assist with the measurement and analysis of interest rate risk. The Company uses a combination of analyses to monitor its exposure to changes in interest rates. The EVE analysis is a financial model that estimates the change in EVE over a range of instantaneously shocked interest rate scenarios. EVE is the discounted present value of expected cash flows from assets, liabilities and off-balance sheet contracts. In calculating changes in EVE, assumptions estimating loan prepayment rates, reinvestment rates and deposit decay rates that seem most likely based on historical experience during prior interest rate changes are employed. The net interest income simulation uses data derived from an asset and liability analysis and applies several elements, including actual interest rate indices and margins, contractual limitations and the U.S. Treasury yield curve as of the balance sheet date. The financial model uses immediate parallel yield curve shocks (in both directions) to determine possible changes in net interest income as if the theoretical rate shocks occurred. The EVE analysis and net interest income simulation model results are presented quarterly to the Asset/Liability Committee of the Board.
SummarizedBoard of Directors.Summarized below are the projected effects of a parallel shift of
increases of 200 and 300 basis points, respectively, and a decrease of 200 basis points in market rates on the Company’s net interest income and EVE.
| | | | | | | Next 12 Months | | | | Next 12 Months |
| Change in Interest Rates | | Economic Value of Equity (2) | | Net Interest Income | | Economic Value of Equity (2) | | Net Interest Income |
Basis Point (bp) (1) | | Dollar | | Dollar | | Percentage | | Dollar | | Dollar | | Percentage | | Dollar | | Dollar | | Percentage | | Dollar | | Dollar | | Percentage |
| (Dollars in thousands) | | Amount | | Change | | Change | | Amount | | Change | | Change | | Amount | | Change | | Change | | Amount | | Change | | Change |
| +300 bp | | $ | 157,546 |
| | $ | 1,591 |
| | 1.02 | % | | $ | 45,508 |
| | $ | 3,883 |
| | 9.30 | % | | $ | 205,647 |
| | $ | (5,573 | ) | | (2.64 | )% | | $ | 60,187 |
| | $ | 3,547 |
| | 6.26 | % |
| +200 bp | | 156,868 |
| | 913 |
| | 0.58 | % | | 44,209 |
| | 2,584 |
| | 6.20 | % | | 208,882 |
| | (2,338 | ) | | (1.11 | )% | | 59,071 |
| | 2,431 |
| | 4.29 | % |
| 0 bp | | 155,955 |
| | — |
| | — |
| | 41,625 |
| | — |
| | — |
| | 211,220 |
| | — |
| | — |
| | 56,640 |
| | — |
| | — |
|
| -200 bp | | | 201,629 |
| | (9,591 | ) | | (4.54 | )% | | 54,965 |
| | (1,675 | ) | | (2.96 | )% |
| |
(1) | Assumes an instantaneous and parallel shift in interest rates at all maturities. |
| |
(2) | EVE is the discounted present value of expected cash flows from assets, liabilities and off-balance sheet contracts. |
The above table indicates that, as of December 31, 2017,2019, in the event of a 200 basis point increase in interest rates, the Company would be expected to experience a 0.58%1.11% decrease in EVE and a $2.6$2.4 million, or 6.2%4.29%, increase in net interest income over the next twelve months. As of December 31, 2019, in the event of a 200 basis points decrease in interest rates, the Company would be expected to experience a $9.6 million, or 4.54% decrease in EVE and a $1.7 million, or 2.96% decrease in net interest income. This data does not reflect any future actions that management may take in response to changes in interest rates, such as changing the mix of assets and liabilities, which could change the results of the EVE and net interest income calculations.
Certain shortcomings are inherent in any methodology used in the above interest rate risk measurements. Modeling changes in EVE and net interest income require certain assumptions that may or may not reflect the manner in which actual yields and costs respond to changes in market interest rates. In this regard, the estimated EVE and net interest income presented above assumes that the composition of the Company’s interest-rate sensitive assets and liabilities existing at the beginning of a period remains constant over the period being measured and, accordingly, the data does not reflect any actions that the Company may take in response to changes in interest rates. The estimates also assume a particular change in interest rates is reflected uniformly across the yield curve regardless of the duration to maturity or the repricing characteristics of specific assets and liabilities. Although the estimated EVE and net interest income provide an indication of the Company’s sensitivity to interest rate changes at a particular point in time, such measurement is not intended to and does not provide a precise forecast of the effects of changes in market interest rates on the Company’s EVE and net interest income and will differ from actual results.
On July 27, 2017, the FCA, a regulator of financial services firms in the United Kingdom, announced that it intends to stop persuading or compelling banks to submit LIBOR rates after 2021. The FCA and submitting LIBOR banks have indicated they will support the LIBOR indices through 2021 to allow for an orderly transition to an alternative reference rate. In the United States, efforts to identify a set of alternative U.S. dollar reference interest rates include proposals by the Alternative Reference Rates Committee of the Federal Reserve Board. Other financial services regulators and industry groups are evaluating the possible phase-out of LIBOR and the development of alternate reference rate indices or reference rates. Some of our assets and liabilities are indexed to LIBOR. We are evaluating the potential impact of the possible replacement of the LIBOR benchmark interest rate, but are not able to predict whether LIBOR will cease to be available after 2021, whether the alternative rates the Federal Reserve Board proposes to publish will become market benchmarks in place of LIBOR, or what the impact of such a transition will have on our business, financial condition, or results of operations. Reform of, or the replacement or phasing out of, LIBOR and proposed regulation of LIBOR and other “benchmarks” may materially adversely affect the amount of interest paid on any LIBOR-based loans, investment securities and borrowings of the Company and the Company’s business, financial condition and results of operations.
Item 7A. Quantitative and Qualitative Disclosures About Market Risk.
The Company's Asset Liability Committee ("ALCO") is responsible for developing, implementing and monitoring asset liability management strategies and advising the Board on such strategies, as well as the related level of interest rate risk. Interest rate risk simulation models are prepared on a quarterly basis. These models demonstrate balance sheet gaps and predict changes to net interest income and the economic market value of portfolio equity under various interest rate scenarios.
ALCO is generally authorized to manage interest rate risk through the management of capital, cash flows and duration of assets and liabilities, including sales and purchases of assets, as well as additions of borrowings and other sources of medium or longer term funding.
The following strategies are among those used to manage interest rate risk:
Actively market commercial business loan originations, which tend to have adjustable rate features and which generate customer relationships that can result in higher core deposit accounts;
Actively market commercial mortgage loan originations, which tend to have shorter terms and higher interest rates than residential mortgage loans and which generate customer relationships that can result in higher core deposit accounts;
Actively market core deposit relationships, which are generally longer duration liabilities;
Utilize short term and long term certificates of deposit and/or wholesale borrowings to manage liability duration;
Closely monitor and actively manage the investment portfolio, including management of duration, prepayment and interest rate risk;
Maintain adequate levels of capital; and
Utilize loan sales and/or loan participations.
ALCO uses simulation modeling to analyze the Company's net interest income sensitivity as well as the Company's economic value of portfolio equity under various interest rate scenarios. The model is based on the actual maturity and estimated repricing characteristics of rate sensitive assets and liabilities. The model incorporates certain prepayment and interest rate assumptions, which management believes to be reasonable as of December 31, 2017.2019. The model assumes changes in interest rates without any proactive change in the balance sheet by management. In the model, the forecasted shape of the yield curve remained static as of December 31, 2017.2019.
In an immediate and sustained 200 basis point increase in market interest rates at December 31, 2017,2019, net interest income for year 1one would increase approximately 6.2%4.29%, when compared to a flat interest rate scenario. In year 2,two, this sensitivity improves to an increase of 9.5%8.30%, when compared to a flat interest rate scenario. In an immediate and sustained 200 basis points decrease in market interest rates, net interest income for year one would decrease approximately 2.96% and would decrease approximately 7.90% in year two.
Certain shortcomings are inherent in the methodologies used in determining interest rate risk. Simulation modeling requires making certain assumptions that may or may not reflect the manner in which actual yields and costs respond to changes in market interest rates. In this regard, the modeling assumes that the composition of our interest-sensitive assets and liabilities existing at the beginning of a period remains constant over the period being measured and assumes that a particular change in interest rates is reflected uniformly across the yield curve regardless of the duration or repricing of specific assets and liabilities. Accordingly, although the information provides an indication of our interest rate risk exposure at a particular point in time, such measurements are not intended to, and do not, provide a precise forecast of the effect of changes in market interest rates on our net interest income and will differ from actual results.
Model simulation results indicate the Company is asset sensitive, which indicates the Company's net interest income should increase in a rising rate environment and decrease in a falling rate environment. Management believes the Company's interest rate risk position is balanced and reasonable.
Item 8. Financial Statements and Supplementary Data.
Reference is made to ItemItems 15(a)(1) and (2) on page 6768 for a list of financial statements and supplementary data required to be filed pursuant to this Item 8. The information required by this Item 8 is provided beginning on page 6768 hereof.
Item 9. Changes in and Disagreements With Accountants on Accounting and Financial Disclosure.
None.
Item 9A. Controls and Procedures.
The Company has established disclosure controls and procedures designed to ensure that information required to be disclosed in the reports that the Company files or submits under the Exchange Act is recorded, processed, summarized, and reported within
the time periods specified in SEC rules and forms and is accumulated and communicated to management, including the principal executive officer and principal financial officer, to allow timely decisions regarding required disclosure.
The Company’s principal executive officer and principal financial officer, with the assistance of other members of the Company’s management, have evaluated the effectiveness of the Company’s disclosure controls and procedures (as such term is defined in Rules 13a-15(e) and 15d-15(e) under the Exchange Act) as of the end of the period covered by this annual report. Based upon such evaluation, the Company’s principal executive officer and principal financial officer have concluded that the Company’s disclosure controls and procedures are effective as of the end of the period covered by this annual report.
Management’s Report on Internal Control Over Financial Reporting
Management of the Company is responsible for establishing and maintaining adequate internal control over financial reporting, as defined in Rules 13a-15(f) and 15d-15(f) under the Exchange Act. The Company’s internal control over financial reporting is designed to provide reasonable assurance regarding the reliability of financial reporting and preparation of financial statements for external purposes in accordance with accounting principles generally accepted in the United States of America.
The Company’s internal control over financial reporting includes those policies and procedures that:
pertain to the maintenance of records that, in reasonable detail, accurately and fairly reflect the transactions and dispositions of the assets of the Company;
provide reasonable assurance that transactions are recorded as necessary to permit preparation of financial statements in accordance with generally accepted accounting principles, and that the receipts and expenditures of the Company are being made only in accordance with authorizations of its management and directors; and
provide reasonable assurance regarding prevention or timely detection of unauthorized acquisition, use or disposition of the Company’s assets that could have a material effect on its financial statements.
Because of its inherent limitations, internal control over financial reporting may not prevent or detect misstatements. Also, projections of any evaluation of the effectiveness of internal control over financial reporting to future periods are subject to the risk that controls may become inadequate because of changes in conditions, or that the degree of compliance with policies or procedures may deteriorate.
A material weakness is a deficiency, or a combination of deficiencies, in internal control over financial reporting, such that there is a reasonable possibility that a material misstatement of the Company’s annual or interim financial statements will not be prevented or detected on a timely basis. A significant deficiency is a control deficiency, or a combination of deficiencies, in internal control over financial reporting that is less severe than a material weakness; yet important enough to merit attention by those responsible for oversight of the Company’s financial reporting.
The Company’s management assessed the effectiveness of the Company’s internal control over financial reporting as of December 31, 2017.2019. In making this assessment, management used the criteria set forth in Internal Control-Integrated Framework (2013) issued by the Committee of Sponsoring Organizations of the Treadway Commission (“COSO”("COSO"). Based on their assessment using those criteria, management concluded that, as of December 31, 2017,2019, the Company’s internal control over financial reporting was effective.
The report of BDO USA, LLP, anthe Company's independent registered public accounting firm, audited our internal control over financial reporting as of December 31, 2017.2019. Their attestation report, which appears in the Company’s consolidated financial statements that are contained in the Annual Report onthis Form 10-K immediately following Item 15,16, expressed an unqualified opinion on our internal control over financial reporting. Such report is incorporated herein by reference.
Management is also responsible for compliance with laws and regulations relating to safety and soundness which are designated by the FDIC and the appropriate federal banking agency. Management assessed its compliance with these designated laws and regulations relating to safety and soundness and concluded that the Company complied, in all significant respects, with such laws and regulations during the year ended December 31, 2017.
The Company’s principal executive officer and principal financial officer also evaluated the effectiveness of the Company’s disclosure controls and procedures (as such term is defined in Rules 13a-15(f) and 15d-15(f) under the Exchange Act). Based on such evaluation, the Company’s principal executive officer and principal financial officer concluded that such disclosure controls and procedures were effective as of December 31, 2017 (the end of the period covered by this Annual Report on Form 10-K).2019.
The Company’s principal executive officer and principal financial officer have also concluded that there was no change in the Company’s internal control over financial reporting (as such term is defined in Rules 13a-15(f) and 15d-15(f) under the Exchange Act) that occurred during the quarter ended December 31, 20172019 that has materially affected, or is reasonably likely to materially affect, the Company’s internal control over financial reporting.
Item 9B. Other Information.
None.
PART III
Item 10. Directors, Executive Officers and Corporate Governance.
The information required by this item is incorporated by reference to the Company’s2020 Proxy Statement for its 2018 Annual Meeting of Shareholders under the captions "Directors, and Executive Officers," "Corporate Governance" and "Stock Ownership of Management and Principal Shareholders.Shareholders,"
except for disclosure of our executive officers, which is included in Item 1 of this Form 10-K under the section titled “Information about our Executive Officers.”
Item 11. Executive Compensation.
The information required by this item is incorporated by reference to the Company’s2020 Proxy Statement for its 2018 Annual Meeting of Shareholders under the caption "Executive Compensation"captions “Executive Compensation” and "Director“Director Compensation."”
Item 12. Security Ownership of Certain Beneficial Owners and Management and Related Shareholder Matters.
Equity Compensation Plan Information
The following table shows information at December 31, 2019 for all equity compensation plans under which shares of our common stock may be issued.
|
| | | | | | | | | |
| | Number of Securities to be Issued Upon Exercise of Outstanding Options | | Weighted-Average Exercise Price of Outstanding Options | | Number of Securities Remaining Available for Future Issuance Under Equity Compensation Plans (excluding securities reflected in column (a)) |
| Plan Category | (a) | | (b) | | (c) |
| Equity Compensation Plans Approved by Security Holders | 122,151 |
| | $ | 9.85 |
| | 398,991 |
|
| Equity Compensation Plans Not Approved by Security Holders | — |
| | — |
| | — |
|
| Total | 122,151 |
| | $ | 9.85 |
| | 398,991 |
|
The remaining information required by this item is incorporated by reference fromto the Company’s2020 Proxy Statement for its 2018 Annual Meeting of Shareholders under the captions "Equity Plans" and "Stock Ownership of Management and Principal Shareholders."
Item 13. Certain Relationships and Related Transactions, and Director Independence.
ThisThe information required by this item is incorporated by reference fromto the Company’s2020 Proxy Statement for its 2018 Annual Meeting of Shareholders under the captions "Certain Transactions Withwith Management" and "Corporate Governance."
Item 14. Principal Accounting Fees and Services.
The information required by this item is incorporated by reference to the Company’s2020 Proxy Statement for its 2018 Annual Meeting of Shareholders under the caption "Principal Accounting Fees and Services."
PART IV
Item 15. Exhibits, Financial Statement Schedules.
(a) Financial Statements and Financial Statement Schedules
1. The following documents are filed as part of this Annual Report on Form 10-K:
1.Financial Statements
Reports of Independent Registered Public Accounting Firm
Financial Statements of 1st Constitution Bancorp.
Consolidated Balance Sheets–Sheets – December 31, 20172019 and 2016.2018.
Consolidated Statements of Income – For the Years Ended December 31, 2017, 20162019, 2018 and 2015.2017.
Consolidated Statements of Comprehensive Income – For the Years Ended December 31, 2017, 20162019, 2018 and 2015.2017.
Consolidated Statements of Changes in Shareholders’ Equity–Equity – For the Years Ended December 31, 2017, 20162019, 2018 and 2015.2017.
Consolidated Statements of Cash Flows – For the Years Ended December 31, 2017, 20162019, 2018 and 2015.2017.
Notes to Consolidated Financial Statements
Reports of Independent Registered Public Accounting Firm
These statements are incorporated by reference to the Company’s Annual Report to Shareholders for the year ended December 31, 2017.2019.
| |
2. | All schedules are omitted because they are either inapplicable or not required, or because the information required therein is included in the Consolidated Financial Statements and Notes thereto. |
2. Financial Schedules
All schedules are omitted because they are either inapplicable or not required, or because the information required therein is included in the Consolidated Financial Statements and Notes thereto.
3. Exhibits
EXHIBIT INDEX
|
| | |
| Exhibit No. | Description |
| | |
| (i)(A) | |
| | |
| (ii)(A) |
|
| | |
| | |
| | |
| * | |
|
| | |
| # | Second Amendment, effective as of April 12, 2016, to the Amended and Restated Employment Agreement, dated as of July 1, 2010, by and between 1st Constitution Bancorp and Robert F. Mangano (the “Employment Agreement”), as amended by the Amendment to the Employment Agreement, effective as of April 4, 2014 (the “First Amendment”), by and between 1st Constitution Bancorp and Robert F. Mangano (incorporated by reference to Exhibit 10.1 to the Company’s Form 8-K (SEC File No. 000-32891) filed with the SEC on April 12, 2016)
|
| # |
|
| # | |
| # | |
| # * | |
| # | |
| # | |
| * # | |
| * # | |
| * # | |
| * # | |
| * # | |
| * | |
| * | |
| * | |
| * | |
| * | |
| 101.INS | * | Inline XBRL Instance Document - the instance document does not appear in the Interactive Data File because its XBRL tags are embedded within the Inline XBRL document |
| 101.SCH | * | Inline XBRL Taxonomy Extension Schema Document |
| 101.CAL | * | Inline XBRL Taxonomy Extension Calculation Linkbase Document |
| 101.DEF | * | Inline XBRL Taxonomy Extension Definition Linkbase Document |
| 101.LAB | * | Inline XBRL Taxonomy Extension Label Linkbase Document |
| 101.PRE | * | Inline XBRL Taxonomy Extension Presentation Linkbase Document |
___________________________
* Filed herewith.
# Management contract or compensatory plan or arrangement.
(b) Exhibits.
ExhibitsThe exhibits required by SectionItem 601 of Regulation S-K (see (a) above)are included in the Exhibit Index above under a(3) of this Item 15.
(c) Financial Statement Schedules
See the notesNotes to the Consolidated Financial Statements included in this Annual Report on Form 10-K.
Item 16. Form 10-K Summary.
Not applicable.
Report of Independent Registered Public Accounting Firm
Board of Directors and Shareholders
1st Constitution Bancorp
Cranbury, New Jersey
Opinion on the Consolidated Financial Statements
We have audited the accompanying consolidated balance sheets of 1st Constitution Bancorp (the “Company”) as of December 31, 20172019 and 2016,2018, the related consolidated statements of income, comprehensive income, changes in shareholders’ equity, and cash flows for each of the three years in the period ended December 31, 2017,2019, and the related notes (collectively referred to as the “consolidated financial statements”). In our opinion, the consolidated financial statements present fairly, in all material respects, the financial position of the Company at December 31, 20172019 and 2016,2018, and the results of theirits operations and theirits cash flows for each of the three years in the period ended December 31, 2017,2019, in conformity with accounting principles generally accepted in the United States of America.
We also have audited, in accordance with the standards of the Public Company Accounting Oversight Board (United States) (“PCAOB”), the Company's internal control over financial reporting as of December 31, 2017,2019, based on criteria established in Internal Control - Integrated Framework (2013) issued by the Committee of Sponsoring Organizations of the Treadway Commission (“COSO”) and our report dated March 19, 201816, 2020, expressed an unqualified opinion thereon.
Change in Accounting Principle
As discussed in Note 1 to the consolidated financial statements, effective January 1, 2019, the Company adopted Accounting Standards Codification Topic 842, Leases (Topic 842).
Basis for Opinion
These consolidated financial statements are the responsibility of the Company’s management. Our responsibility is to express an opinion on the Company’s consolidated financial statements based on our audits. We are a public accounting firm registered with the PCAOB and are required to be independent with respect to the Company in accordance with the U.S. federal securities laws and the applicable rules and regulations of the Securities and Exchange Commission and the PCAOB.
We conducted our audits in accordance with the standards of the PCAOB. Those standards require that we plan and perform the audit to obtain reasonable assurance about whether the consolidated financial statements are free of material misstatement, whether due to error or fraud.
Our audits included performing procedures to assess the risks of material misstatement of the consolidated financial statements, whether due to error or fraud, and performing procedures that respond to those risks. Such procedures included examining, on a test basis, evidence regarding the amounts and disclosures in the consolidated financial statements. Our audits also included evaluating the accounting principles used and significant estimates made by management, as well as evaluating the overall presentation of the consolidated financial statements. We believe that our audits provide a reasonable basis for our opinion.
/s/ BDO USA, LLP
We have served as the Company's auditor since 2013.
New York, New York
March 19, 2018
Report of Independent Registered Public Accounting Firm
Board of Directors and Shareholders
1st Constitution Bancorp
Cranbury, New Jersey
Opinion on Internal Control over Financial Reporting
We have audited 1st Constitution’sConstitution Bancorp’s (the “Company’s”) internal control over financial reporting as of December 31, 2017,2019, based on criteria established in Internal Control - Integrated Framework (2013) issued by the Committee of Sponsoring Organizations of the Treadway Commission (the “COSO criteria”). In our opinion, the Company maintained, in all material respects, effective internal control over financial reporting as of December 31, 2017,2019, based on the COSO criteria.
We also have audited, in accordance with the standards of the Public Company Accounting Oversight Board (United States) (“PCAOB”), the consolidated balance sheets of the Company as of December 31, 20172019 and 2016,2018, the related consolidated statements of income, comprehensive income, changes in shareholders’ equity, and cash flows for each of the three years in the period ended December 31, 2017,2019, and the related notes and our report dated March 19, 201816, 2020 expressed an unqualified opinion thereon.
Basis for Opinion
The Company’s management is responsible for maintaining effective internal control over financial reporting and for its assessment of the effectiveness of internal control over financial reporting, included in the accompanying Item 9A, Management’s Report on Internal Control over Financial Reporting. Our responsibility is to express an opinion on the Company’s internal control over financial reporting based on our audit. We are a public accounting firm registered with the PCAOB and are required to be independent with respect to the Company in accordance with U.S. federal securities laws and the applicable rules and regulations of the Securities and Exchange Commission and the PCAOB.
We conducted our audit of internal control over financial reporting in accordance with the standards of the PCAOB. Those standards require that we plan and perform the audit to obtain reasonable assurance about whether effective internal control over financial reporting was maintained in all material respects. Our audit included obtaining an understanding of internal control over financial reporting, assessing the risk that a material weakness exists, and testing and evaluating the design and operating effectiveness of internal control based on the assessed risk. Our audit also included performing such other procedures as we considered necessary in the circumstances. We believe that our audit provides a reasonable basis for our opinion.
Definition and Limitations of Internal Control over Financial Reporting
A company’s internal control over financial reporting is a process designed to provide reasonable assurance regarding the reliability of financial reporting and the preparation of financial statements for external purposes in accordance with generally accepted accounting principles. A company’s internal control over financial reporting includes those policies and procedures that (1) pertain to the maintenance of records that, in reasonable detail, accurately and fairly reflect the transactions and dispositions of the assets of the company; (2) provide reasonable assurance that transactions are recorded as necessary to permit preparation of financial statements in accordance with generally accepted accounting principles, and that receipts and expenditures of the company are being made only in accordance with authorizations of management and directors of the company; and (3) provide reasonable assurance regarding prevention or timely detection of unauthorized acquisition, use, or disposition of the company’s assets that could have a material effect on the financial statements.
Because of its inherent limitations, internal control over financial reporting may not prevent or detect misstatements. Also, projections of any evaluation of effectiveness to future periods are subject to the risk that controls may become inadequate because of changes in conditions, or that the degree of compliance with the policies or procedures may deteriorate.
/s/ BDO USA, LLP
New York, New York
Philadelphia, Pennsylvania
March 19, 201816, 2020
1ST CONSTITUTION BANCORP
CONSOLIDATED BALANCE SHEETS
December 31, 20172019 and 20162018
(Dollars in Thousands, except share data)
|
| | | | | | | |
| | 2017 | | 2016 |
| ASSETS | | | |
| Cash and Due From Banks | $ | 5,037 |
| | $ | 5,348 |
|
| Interest-earning deposits | 13,717 |
| | 9,538 |
|
| Total cash and cash equivalents | 18,754 |
| | 14,886 |
|
| Investment Securities: | | | |
| Available for sale, at fair value | 105,458 |
| | 103,794 |
|
| Held to maturity (fair value of $111,865 and $128,559 at December 31, 2017 and December 31, 2016, respectively) | 110,267 |
| | 126,810 |
|
| Total investment securities | 215,725 |
| | 230,604 |
|
| Loans Held for Sale | 4,254 |
| | 14,829 |
|
| Loans | 789,906 |
| | 724,808 |
|
| Less: Allowance for loan losses | (8,013 | ) | | (7,494 | ) |
| Net loans | 781,893 |
| | 717,314 |
|
| Premises and Equipment, Net | 10,705 |
| | 10,673 |
|
| Accrued Interest Receivable | 3,478 |
| | 3,095 |
|
| Bank-Owned Life Insurance | 25,051 |
| | 22,184 |
|
| Other Real Estate Owned | — |
| | 166 |
|
| Goodwill and Intangible Assets | 12,496 |
| | 12,880 |
|
| Other Assets | 6,918 |
| | 11,582 |
|
| Total assets | $ | 1,079,274 |
| | $ | 1,038,213 |
|
| LIABILITIES AND SHAREHOLDERS’ EQUITY | |
| | |
| LIABILITIES | |
| | |
| Deposits | |
| | |
| Non-interest bearing | $ | 196,509 |
| | $ | 170,854 |
|
| Interest bearing | 725,497 |
| | 663,662 |
|
| Total deposits | 922,006 |
| | 834,516 |
|
| Overnight Borrowings | 20,500 |
| | 63,050 |
|
| Federal Home Loan Bank advances | — |
| | 10,000 |
|
| Redeemable Subordinated Debentures | 18,557 |
| | 18,557 |
|
| Accrued Interest Payable | 804 |
| | 866 |
|
| Accrued Expenses and Other Liabilities | 5,754 |
| | 6,423 |
|
| Total liabilities | 967,621 |
| | 933,412 |
|
| SHAREHOLDERS’ EQUITY | | | |
| Preferred stock, no par value; 5,000,000 shares authorized; none issued | — |
| | — |
|
| Common Stock, no par value; 30,000,000 shares authorized; 8,116,201 and 8,027,087 shares issued and 8,082,903 and 7,993,789 shares outstanding as of December 31, 2017 and December 31, 2016, respectively | 72,935 |
| | 71,695 |
|
| Retained earnings | 39,822 |
| | 34,074 |
|
| Treasury Stock, 33,298 shares at December 31, 2017 and 2016 | (368 | ) | | (368 | ) |
| Accumulated other comprehensive loss | (736 | ) | | (600 | ) |
| Total shareholders’ equity | 111,653 |
| | 104,801 |
|
| Total liabilities and shareholders’ equity | $ | 1,079,274 |
| | $ | 1,038,213 |
|
|
| | | | | | | |
| | 2019 | | 2018 |
| ASSETS | | | |
| Cash and due from banks | $ | 2,547 |
| | $ | 4,983 |
|
| Interest-earning deposits | 12,295 |
| | 11,861 |
|
| Total cash and cash equivalents | 14,842 |
| | 16,844 |
|
| Investment securities: | | | |
| Available for sale, at fair value | 155,782 |
| | 132,222 |
|
Held to maturity (fair value of $78,223 and $80,204 at December 31, 2019 and
December 31, 2018, respectively) | 76,620 |
| | 79,572 |
|
| Total investment securities | 232,402 |
| | 211,794 |
|
| Loans held for sale | 5,927 |
| | 3,020 |
|
| Loans | 1,216,028 |
| | 883,164 |
|
| Less: allowance for loan losses | (9,271 | ) | | (8,402 | ) |
| Net loans | 1,206,757 |
| | 874,762 |
|
| Premises and equipment, net | 15,262 |
| | 11,653 |
|
| Right-of-use assets | 17,957 |
| | — |
|
| Accrued interest receivable | 4,945 |
| | 3,860 |
|
| Bank-owned life insurance | 36,678 |
| | 28,705 |
|
| Other real estate owned | 571 |
| | 2,515 |
|
| Goodwill and intangible assets | 36,779 |
| | 12,258 |
|
| Other assets | 14,142 |
| | 12,422 |
|
| Total assets | $ | 1,586,262 |
| | $ | 1,177,833 |
|
| LIABILITIES AND SHAREHOLDERS' EQUITY | |
| | |
| LIABILITIES | |
| | |
| Deposits | |
| | |
| Non-interest bearing | $ | 287,555 |
| | $ | 212,981 |
|
| Interest bearing | 989,807 |
| | 737,691 |
|
| Total deposits | 1,277,362 |
| | 950,672 |
|
| Short-term borrowings | 92,050 |
| | 71,775 |
|
| Redeemable subordinated debentures | 18,557 |
| | 18,557 |
|
| Accrued interest payable | 1,592 |
| | 1,228 |
|
| Lease liability | 18,617 |
| | — |
|
| Accrued expense and other liabilities | 7,506 |
| | 8,516 |
|
| Total liabilities | 1,415,684 |
| | 1,050,748 |
|
| SHAREHOLDERS' EQUITY | | | |
| Preferred stock, no par value; 5,000,000 shares authorized; none issued | — |
| | — |
|
Common stock, no par value; 30,000,000 shares authorized; 10,224,974 and
8,639,276 shares issued and 10,191,676 and 8,605,978 shares outstanding as
of December 31, 2019 and December 31, 2018, respectively | 109,964 |
| | 79,536 |
|
| Retained earnings | 60,791 |
| | 49,750 |
|
| Treasury stock, 33,298 shares at December 31, 2019 and December 31, 2018 | (368 | ) | | (368 | ) |
| Accumulated other comprehensive income (loss) | 191 |
| | (1,833 | ) |
| Total shareholders' equity | 170,578 |
| | 127,085 |
|
| Total liabilities and shareholders' equity | $ | 1,586,262 |
| | $ | 1,177,833 |
|
The accompanying notes are an integral part of these consolidated financial statementsstatements.
1ST CONSTITUTION BANCORP
CONSOLIDATED STATEMENTS OF INCOME
For the Years Ended December 31, 2017, 20162019, 2018 and 20152017
(Dollars in thousands, except per share data) | | | | 2017 | | 2016 | | 2015 | 2019 | | 2018 | | 2017 |
| INTEREST INCOME | | | | | | | | | | |
| Loans, including fees | $ | 35,967 |
| | $ | 33,701 |
| | $ | 33,975 |
| $ | 53,537 |
| | $ | 45,202 |
| | $ | 35,967 |
|
| Securities: | | | | | | | | | | |
| Taxable | 3,326 |
| | 3,268 |
| | 3,167 |
| 4,710 |
| | 4,024 |
| | 3,326 |
|
| Tax-exempt | 2,140 |
| | 2,078 |
| | 2,131 |
| 1,667 |
| | 1,989 |
| | 2,140 |
|
| Federal funds sold and short-term investments | 230 |
| | 88 |
| | 50 |
| 176 |
| | 258 |
| | 230 |
|
| Total interest income | 41,663 |
| | 39,135 |
| | 39,323 |
| 60,090 |
| | 51,473 |
| | 41,663 |
|
| INTEREST EXPENSE | | | |
| | |
| | | |
| | |
|
| Deposits | 4,550 |
| | 4,044 |
| | 3,704 |
| 11,094 |
| | 6,511 |
| | 4,550 |
|
| Borrowings | 429 |
| | 687 |
| | 577 |
| 912 |
| | 836 |
| | 429 |
|
| Redeemable subordinated debentures | 519 |
| | 427 |
| | 355 |
| 748 |
| | 694 |
| | 519 |
|
| Total interest expense | 5,498 |
| | 5,158 |
| | 4,636 |
| 12,754 |
| | 8,041 |
| | 5,498 |
|
| Net interest income | 36,165 |
| | 33,977 |
| | 34,687 |
| 47,336 |
| | 43,432 |
| | 36,165 |
|
| | | | | | | |
| PROVISION (CREDIT) FOR LOAN LOSSES | 600 |
| | (300 | ) | | 1,100 |
| |
| Net interest income after provision (credit) for loan losses | 35,565 |
| | 34,277 |
| | 33,587 |
| |
| PROVISION FOR LOAN LOSSES | | 1,350 |
| | 900 |
| | 600 |
|
| Net interest income after provision for loan losses | | 45,986 |
| | 42,532 |
| | 35,565 |
|
| NON-INTEREST INCOME | | | |
| | |
| | | |
| | |
|
| Service charges on deposit accounts | 596 |
| | 715 |
| | 818 |
| 663 |
| | 638 |
| | 596 |
|
| Gain on sales of loans, net | 5,149 |
| | 3,785 |
| | 4,039 |
| 4,885 |
| | 4,475 |
| | 5,149 |
|
| Income on bank-owned life insurance | 522 |
| | 549 |
| | 558 |
| 623 |
| | 575 |
| | 522 |
|
| Gain on sales of securities | 129 |
| | — |
| | — |
| |
| Gain from bargain purchase | | — |
| | 230 |
| | — |
|
| Gain on sales/calls of securities | | 30 |
| | 12 |
| | 129 |
|
| Other income | 1,844 |
| | 1,873 |
| | 1,171 |
| 2,036 |
| | 1,988 |
| | 1,844 |
|
| Total other income | 8,240 |
| | 6,922 |
| | 6,586 |
| |
| Total non-interest income | | 8,237 |
| | 7,918 |
| | 8,240 |
|
| NON-INTEREST EXPENSES | | | |
| | |
| | | |
| | |
|
| Salaries and employee benefits | 18,804 |
| | 16,543 |
| | 15,589 |
| 21,304 |
| | 19,853 |
| | 18,804 |
|
| Occupancy expense | 3,169 |
| | 3,243 |
| | 3,362 |
| 4,100 |
| | 3,623 |
| | 3,169 |
|
| Data processing expenses | 1,314 |
| | 1,277 |
| | 1,211 |
| 1,507 |
| | 1,332 |
| | 1,314 |
|
| FDIC insurance expense | 360 |
| | 453 |
| | 660 |
| 154 |
| | 486 |
| | 360 |
|
| Other real estate owned expenses | 42 |
| | 74 |
| | 734 |
| 171 |
| | 158 |
| | 42 |
|
| Merger-related expenses | | 1,730 |
| | 2,141 |
| | 265 |
|
| Other operating expenses | 7,317 |
| | 5,701 |
| | 5,891 |
| 6,583 |
| | 6,492 |
| | 7,052 |
|
| Total other expenses | 31,006 |
| | 27,291 |
| | 27,447 |
| |
| Total non-interest expenses | | 35,549 |
| | 34,085 |
| | 31,006 |
|
| Income before income taxes | 12,799 |
| | 13,908 |
| | 12,726 |
| 18,674 |
| | 16,365 |
| | 12,799 |
|
| INCOME TAXES | 5,871 |
| | 4,623 |
| | 4,062 |
| 5,040 |
| | 4,317 |
| | 5,871 |
|
| Net income | $ | 6,928 |
| | $ | 9,285 |
| | $ | 8,664 |
| |
| NET INCOME PER COMMON SHARE | | | |
| | |
| |
| Net Income | | $ | 13,634 |
| | $ | 12,048 |
| | $ | 6,928 |
|
| EARNINGS PER COMMON SHARE | | | | |
| | |
|
| Basic | $ | 0.86 |
| | $ | 1.17 |
| | $ | 1.10 |
| $ | 1.54 |
| | $ | 1.45 |
| | $ | 0.86 |
|
| Diluted | 0.83 |
| | 1.14 |
| | 1.07 |
| 1.53 |
| | 1.40 |
| | 0.83 |
|
| WEIGHTED AVERAGE SHARES OUTSTANDING | | | | | | | | | | |
| Basic | 8,049,981 |
| | 7,962,121 |
| | 7,901,278 |
| 8,875,237 |
| | 8,320,718 |
| | 8,049,981 |
|
| Diluted | 8,312,784 |
| | 8,177,439 |
| | 8,075,752 |
| 8,933,471 |
| | 8,593,509 |
| | 8,312,784 |
|
The accompanying notes are an integral part of these consolidated financial statementsstatements.
1ST CONSTITUTION BANCORP
Consolidated Statements of Comprehensive Income
For the years ended December 31, 2017, 20162019, 2018 and 20152017
(Dollars in thousands)
| | | | Twelve Months Ended December 31, | | | | | | | |
| | 2017 | | 2016 | | 2015 | 2019 | | 2018 | | 2017 |
| Net income | $ | 6,928 |
| | $ | 9,285 |
| | $ | 8,664 |
| $ | 13,634 |
| | $ | 12,048 |
| | $ | 6,928 |
|
| Other comprehensive income (loss): | | | | | | | | | | |
| Unrealized losses on securities available for sale | (14 | ) | | (667 | ) | | (224 | ) | |
| Unrealized gains (losses) on securities available for sale | | 2,651 |
| | (1,624 | ) | | (14 | ) |
| Tax effect | 40 |
| | 243 |
| | 38 |
| (646 | ) | | 388 |
| | 40 |
|
| Net of tax amount | 26 |
| | (424 | ) | | (186 | ) | 2,005 |
| | (1,236 | ) | | 26 |
|
| | | | | | | | | | | |
| Reclassification adjustment for realized gains on securities available for sale (1) | (93 | ) | | — |
| | — |
| (30 | ) | | (12 | ) | | (93 | ) |
| Tax effect (3) | 38 |
| | — |
| | — |
| |
Tax effect (2) | | 7 |
| | 3 |
| | 38 |
|
| Net of tax amount | | (23 | ) | | (9 | ) | | (55 | ) |
| | | | | | | |
Reclassification adjustment for unrealized impairment loss on held to maturity security (3) | | 9 |
| | — |
| | — |
|
| Tax effect | | (1 | ) | | — |
| | — |
|
| Net of tax amount | (55 | ) | | — |
| | — |
| 8 |
| | — |
| | — |
|
| | | | | | | | | | | |
| Pension liability | 62 |
| | 83 |
| | (53 | ) | 222 |
| | 269 |
| | 62 |
|
| Tax effect | (24 | ) | | (31 | ) | | 21 |
| (66 | ) | | (77 | ) | | (24 | ) |
| Net of tax amount | 38 |
| | 52 |
| | (32 | ) | 156 |
| | 192 |
| | 38 |
|
| | | | | | | | | | | |
| Reclassification adjustment for actuarial gains for unfunded pension liability (2) | (60 | ) | | (160 | ) | | (266 | ) | |
| Tax effect (3) | 24 |
| | 62 |
| | 106 |
| |
Reclassification adjustment for actuarial gains for unfunded pension liability (4) | | (176 | ) | | (62 | ) | | (60 | ) |
Tax effect (2) | | 54 |
| | 18 |
| | 24 |
|
| Net of tax amount | (36 | ) | | (98 | ) | | (160 | ) | (122 | ) | | (44 | ) | | (36 | ) |
| | | | | | | | | | | |
| Total other comprehensive loss | (27 | ) | | (470 | ) | | (378 | ) | |
| Total other comprehensive income (loss) | | 2,024 |
| | (1,097 | ) | | (27 | ) |
| | | | | | | | | | | |
| Comprehensive income | $ | 6,901 |
| | $ | 8,815 |
| | $ | 8,286 |
| $ | 15,658 |
| | $ | 10,951 |
| | $ | 6,901 |
|
| |
(1) | Included in gain on sale of securities on the consolidated statements of income |
| |
(2) | Included in income taxes on the consolidated statements of income |
| |
(3) | Included in investment securities held to maturity on the consolidated balance sheet |
| |
(4) | Included in salaries and employee benefits expense on the consolidated statements of income |
| |
(3) | Included in income taxes on the consolidated statements of income |
The accompanying notes are an integral part of these consolidated financial statementsstatements.
1ST CONSTITUTION BANCORP
CONSOLIDATED STATEMENTS OF CHANGES IN SHAREHOLDERS’ EQUITY
For the Years Ended December 31, 2017, 20162019, 2018 and 20152017
(Dollars in thousands)
|
| | | | | | | | | | | | | | | | | | | |
| | Common Stock | | Retained Earnings | | Treasury Stock | | Accumulated Other Comprehensive (Loss) Income | | Total Shareholders' Equity |
| Balance, January 1, 2015 | $ | 61,448 |
| | $ | 25,730 |
| | $ | (316 | ) | | $ | 248 |
| | $ | 87,110 |
|
| Net income | — |
| | 8,664 |
| | — |
| | — |
| | 8,664 |
|
| Exercise of stock options and issuance of restricted shares under employee benefit programs (33,800 shares issued from Treasury Stock) | (39 | ) | | — |
| | 331 |
| | — |
| | 292 |
|
| Share-based compensation | 631 |
| | — |
| | — |
| | — |
| | 631 |
|
| Treasury stock purchased (31,050 shares) | — |
| | — |
| | (359 | ) | | — |
| | (359 | ) |
| Stock dividends declared (737,448 shares) | 8,805 |
| | (8,805 | ) | | — |
| | — |
| | — |
|
| Other comprehensive loss | — |
| | — |
| | — |
| | (378 | ) | | (378 | ) |
| Balance, December 31, 2015 | 70,845 |
| | 25,589 |
| | (344 | ) | | (130 | ) | | 95,960 |
|
| | | | | | | | | | |
| Net income | — |
| | 9,285 |
| | — |
| | — |
| | 9,285 |
|
| Exercise of stock options (3,564 shares) | 96 |
| | — |
| | — |
| | — |
| | 96 |
|
| Share-based compensation | 754 |
| | — |
| | — |
| | — |
| | 754 |
|
| Treasury stock purchased (2,000 shares) | — |
| | — |
| | (24 | ) | | — |
| | (24 | ) |
| Dividends on common stock ($0.10 per share) | — |
| | (800 | ) | | — |
| | — |
| | (800 | ) |
| Other comprehensive loss | — |
| | — |
| | — |
| | (470 | ) | | (470 | ) |
| Balance, December 31, 2016 | 71,695 |
| | 34,074 |
| | (368 | ) | | (600 | ) | | 104,801 |
|
| | | | | | | | | | |
| Net income | — |
| | 6,928 |
| | — |
| | — |
| | 6,928 |
|
| Exercise of stock options | 247 |
| | — |
| | — |
| | — |
| | 247 |
|
| Share-based compensation | 993 |
| | — |
| | — |
| | — |
| | 993 |
|
| Dividends on common stock ($0.16 per share) | — |
| | (1,289 | ) | | — |
| | — |
| | (1,289 | ) |
| Other comprehensive loss | — |
| | — |
| | — |
| | (27 | ) | | (27 | ) |
| Reclassification of certain deferred tax effects | — |
| | 109 |
| | — |
| | (109 | ) | | — |
|
| Balance, December 31, 2017 | $ | 72,935 |
| | $ | 39,822 |
| | $ | (368 | ) | | $ | (736 | ) | | $ | 111,653 |
|
| | | | | | | | | | |
|
| | | | | | | | | | | | | | | | | | | |
| | Common Stock | | Retained Earnings | | Treasury Stock | | Accumulated Other Comprehensive Income (Loss) | | Total Shareholders' Equity |
| Balance, January 1, 2017 | $ | 71,695 |
| | $ | 34,074 |
| | $ | (368 | ) | | $ | (600 | ) | | $ | 104,801 |
|
| Net income | — |
| | 6,928 |
| | — |
| | — |
| | 6,928 |
|
Exercise of stock options and issuance of restricted
shares under employee benefit programs (31,640 and 60,613 shares, respectively) | 247 |
| | — |
| | — |
| | — |
| | 247 |
|
| Share-based compensation | 993 |
| | — |
| | — |
| | — |
| | 993 |
|
| Cash dividends ($0.16 per shares) | — |
| | (1,289 | ) | | — |
| | — |
| | (1,289 | ) |
| Other comprehensive loss | — |
| | — |
| | — |
| | (27 | ) | | (27 | ) |
| Reclassifications of certain deferred tax effects | — |
| | 109 |
| | — |
| | (109 | ) | | — |
|
| Balance, December 31, 2017 | 72,935 |
| | 39,822 |
| | (368 | ) | | (736 | ) | | 111,653 |
|
| | | | | | | | | | |
| Net income | — |
| | 12,048 |
| | — |
| | — |
| | 12,048 |
|
| Exercise of stock options and issuance of restricted shares (12,762 shares and 62,150 shares, respectively) | 88 |
| | — |
| | — |
| | — |
| | 88 |
|
| Share-based compensation | 1,019 |
| | — |
| | — |
| | — |
| | 1,019 |
|
| Exercise of stock warrants (198,378 shares) | — |
| | — |
| | — |
| | — |
| | — |
|
| Issuance of common stock (249,785 shares) | 5,494 |
| | — |
| | — |
| | — |
| | 5,494 |
|
| Cash dividends ($0.255 per share) | — |
| | (2,120 | ) | | — |
| | — |
| | (2,120 | ) |
| Other comprehensive loss | — |
| | — |
| | — |
| | (1,097 | ) | | (1,097 | ) |
| Balance, December 31, 2018 | 79,536 |
| | 49,750 |
| | (368 | ) | | (1,833 | ) | | 127,085 |
|
| | | | | | | | | | |
| Net income | — |
| | 13,634 |
| | — |
| | — |
| | 13,634 |
|
| Exercise of stock options and issuance of restricted shares (24,277 shares and 53,931 shares, respectively) | 149 |
| | — |
| | — |
| | — |
| | 149 |
|
| Share-based compensation | 1,104 |
| | — |
| | — |
| | — |
| | 1,104 |
|
| Issuance of common stock (1,509,275 shares) | 29,175 |
| | — |
| | — |
| | — |
| | 29,175 |
|
| Cash dividends declared ($0.30 per share) | — |
| | (2,593 | ) | | — |
| | — |
| | (2,593 | ) |
| Other comprehensive income | — |
| | — |
| | — |
| | 2,024 |
| | 2,024 |
|
| Balance, December 31, 2019 | $ | 109,964 |
| | $ | 60,791 |
| | $ | (368 | ) | | $ | 191 |
| | $ | 170,578 |
|
| | | | | | | | | | |
The accompanying notes are an integral part of these consolidated financial statementsstatements.
1ST CONSTITUTION BANCORP
CONSOLIDATED STATEMENTS OF CASH FLOWS
For the Years Ended December 31, 2017, 20162019, 2018 and 20152017
(Dollars in thousands)
| | | | 2017 | | 2016 | | 2015 | 2019 | | 2018 | | 2017 |
| OPERATING ACTIVITIES: | | | | | | | | | | |
| Net Income | $ | 6,928 |
| | $ | 9,285 |
| | $ | 8,664 |
| $ | 13,634 |
| | $ | 12,048 |
| | $ | 6,928 |
|
| Adjustments to reconcile net income to net cash provided by operating activities | | | | | | | | | | |
| Provision (credit) for loan losses | 600 |
| | (300 | ) | | 1,100 |
| |
| Provision for loss on other real estate owned | — |
| | — |
| | 382 |
| |
| Provision for loan losses | | 1,350 |
| | 900 |
| | 600 |
|
| Depreciation and amortization | 1,380 |
| | 1,415 |
| | 1,476 |
| 1,444 |
| | 1,389 |
| | 1,380 |
|
| Net amortization of premiums and discounts on securities | 879 |
| | 1,141 |
| | 810 |
| 675 |
| | 556 |
| | 879 |
|
| SBA discount accretion | (247 | ) | | (153 | ) | | (56 | ) | |
| Gain on sales of securities held for sale | (93 | ) | | — |
| | — |
| |
| SBA loan discount accretion | | (391 | ) | | (323 | ) | | (247 | ) |
| Gain on bargain purchase | | — |
| | (230 | ) | | — |
|
| Gain on sales/calls of securities available for sale | | (30 | ) | | (12 | ) | | (93 | ) |
| Gain on sales of securities held to maturity | (36 | ) | | — |
| | — |
| — |
| | — |
| | (36 | ) |
| (Gains) losses on sales of other real estate owned | (5 | ) | | (31 | ) | | 692 |
| |
| Loss (gain) on sales of other real estate owned | | 101 |
| | — |
| | (5 | ) |
| Gains on sales of loans held for sale | (5,149 | ) | | (3,785 | ) | | (4,039 | ) | (4,885 | ) | | (4,475 | ) | | (5,149 | ) |
| Originations of loans held for sale | (110,831 | ) | | (96,968 | ) | | (134,073 | ) | (146,808 | ) | | (111,109 | ) | | (110,831 | ) |
| Proceeds from sales of loans held for sale | 126,555 |
| | 91,708 |
| | 140,486 |
| 148,786 |
| | 116,818 |
| | 126,555 |
|
| Increase cash surrender value on bank-owned life insurance | (522 | ) | | (549 | ) | | (558 | ) | |
| Increase in cash surrender value on bank-owned life insurance | | (623 | ) | | (589 | ) | | (522 | ) |
| Loss on cash surrender value on bank-owned life insurance | | — |
| | 14 |
| | — |
|
| Share-based compensation expense | 993 |
| | 754 |
| | 631 |
| 1,104 |
| | 1,019 |
| | 993 |
|
| Deferred tax expense | 620 |
| | 354 |
| | 159 |
| 604 |
| | 305 |
| | 620 |
|
| Provisional re-measurement of deferred tax assets and liabilities | 1,712 |
| | — |
| | — |
| |
| (Increase) decrease in accrued interest receivable | (383 | ) | | (242 | ) | | 243 |
| |
| (Increase) decrease in other assets | (181 | ) | | 388 |
| | 617 |
| |
| (Decrease) increase in accrued interest payable | (62 | ) | | 20 |
| | (61 | ) | |
| Decrease in accrued expenses and other liabilities | (266 | ) | | (552 | ) | | (363 | ) | |
| Noncash rent and equipment expense | | 192 |
| | — |
| | — |
|
| Re-measurement of deferred tax assets and liabilities | | — |
| | (28 | ) | | 1,712 |
|
| Increase in accrued interest receivable | | (307 | ) | | (123 | ) | | (383 | ) |
| Decrease/(increase) decrease in other assets | | 511 |
| | (1,589 | ) | | (181 | ) |
| Increase (decrease) in accrued interest payable | | 364 |
| | 424 |
| | (62 | ) |
| (Decrease)/increase in accrued expenses and other liabilities | | (2,459 | ) | | 2,333 |
| | (266 | ) |
| Net cash provided by operating activities | 21,892 |
| | 2,485 |
| | 16,110 |
| 13,262 |
| | 17,328 |
| | 21,892 |
|
| INVESTING ACTIVITIES: | | | | | | | | | | |
| Purchases of securities : | | | | | | | | | | |
| Available for sale | (35,680 | ) | | (37,300 | ) | | (34,109 | ) | (33,972 | ) | | (35,209 | ) | | (35,680 | ) |
| Held to maturity | (34,592 | ) | | (35,212 | ) | | (15,599 | ) | (16,188 | ) | | (7,723 | ) | | (34,592 | ) |
| Proceeds from maturities and prepayments of securities: | | | | | | | | | | |
| Available for sale | 25,770 |
| | 23,354 |
| | 18,783 |
| 39,086 |
| | 17,664 |
| | 25,770 |
|
| Held to maturity | 49,889 |
| | 31,429 |
| | 35,705 |
| 18,891 |
| | 38,192 |
| | 49,889 |
|
| Proceeds from sales of securities: | | | | | | | | | | |
| Available for sale | 7,602 |
| | — |
| | — |
| — |
| | — |
| | 7,602 |
|
| Held to maturity | 1,034 |
| | — |
| | — |
| — |
| | — |
| | 1,034 |
|
| Proceeds from BOLI benefits paid | — |
| | 248 |
| | — |
| |
| Net redemption (purchase) of restricted stock | 2,408 |
| | (661 | ) | | (1,516 | ) | |
| Net increase in loans | (65,387 | ) | | (42,626 | ) | | (30,590 | ) | |
| Proceeds from bank-owned life insurance benefits paid | | — |
| | 893 |
| | — |
|
| Net (purchase) redemption of restricted stock | | (272 | ) | | (2,510 | ) | | 2,408 |
|
| Net (increase) in loans | | (127,121 | ) | | (19,762 | ) | | (65,387 | ) |
| Capital expenditures | (846 | ) | | (457 | ) | | (706 | ) | (161 | ) | | (648 | ) | | (846 | ) |
| Capital improvement to OREO | (5 | ) | | (61 | ) | | — |
| |
| Forfeitable deposit on other real estate owned | | — |
| | 175 |
| | — |
|
| Capital improvement to other real estate owned | | — |
| | — |
| | (5 | ) |
| Net cash paid for NJCB Merger | | — |
| | (996 | ) | | — |
|
| Net cash received from the Shore Merger | | 7,440 |
| | — |
| | — |
|
| Proceeds from sales of other real estate owned | 631 |
| | 1,033 |
| | 6,027 |
| 2,448 |
| | — |
| | 631 |
|
| Purchase of BOLI | (2,345 | ) | | (300 | ) | | — |
| |
| Purchase of bank-owned life insurance | | (100 | ) | | — |
| | (2,345 | ) |
| Net cash used in investing activities | (51,521 | ) | | (60,553 | ) | | (22,005 | ) | (109,949 | ) | | (9,924 | ) | | (51,521 | ) |
| FINANCING ACTIVITIES: | | | | | | |
| Exercise of stock options | 247 |
| | 96 |
| | 292 |
| |
| Purchase of treasury stock | — |
| | (24 | ) | | (359 | ) | |
| Cash dividends paid to shareholders | (1,690 | ) | | (399 | ) | | — |
| |
| Net increase (decrease) in deposits | 87,490 |
| | 47,759 |
| | (31,004 | ) | |
| | | (Decrease) increase in overnight borrowings | (42,550 | ) | | 24,154 |
| | 33,789 |
| |
| FINANCING ACTIVITIES: | | | | | | |
| Exercise of stock options | | 149 |
| | 88 |
| | 247 |
|
| Cash dividends paid to shareholders | | (2,593 | ) | | (2,120 | ) | | (1,690 | ) |
| Net (decrease) increase in deposits | | 76,854 |
| | (58,557 | ) | | 87,490 |
|
| Increase (decrease) in overnight borrowings | | 20,275 |
| | 51,275 |
| | (42,550 | ) |
| Repayment of long-term borrowing | (10,000 | ) | | (10,000 | ) | | — |
| — |
| | — |
| | (10,000 | ) |
| Net cash provided by financing activities | 33,497 |
| | 61,586 |
| | 2,718 |
| |
| Increase in cash and cash equivalents | 3,868 |
| | 3,518 |
| | (3,177 | ) | |
| Net cash provided by (used in) financing activities | | 94,685 |
| | (9,314 | ) | | 33,497 |
|
| (Decrease) increase in cash and cash equivalents | | (2,002 | ) | | (1,910 | ) | | 3,868 |
|
| Cash and cash equivalents at beginning of year | 14,886 |
| | 11,368 |
| | 14,545 |
| 16,844 |
| | 18,754 |
| | 14,886 |
|
| Cash and cash equivalents at end of period | 18,754 |
| | 14,886 |
| | 11,368 |
| |
| Cash and cash equivalents at end of year | | $ | 14,842 |
| | $ | 16,844 |
| | $ | 18,754 |
|
| Supplemental disclosures of cash flow information: | | | | | | | | | | |
| Cash paid during the period for : | | | | | | | | | | |
| Interest | $ | 5,560 |
| | $ | 5,138 |
| | $ | 4,697 |
| $ | 12,387 |
| | $ | 7,617 |
| | $ | 5,560 |
|
| Income taxes | 3,220 |
| | 4,590 |
| | 4,170 |
| 6,108 |
| | 3,226 |
| | 3,220 |
|
| Noncash items: | | | | | | | | | | |
| Transfer of loans to OREO | 455 |
| | 141 |
| | 2,357 |
| |
| Transfer of loans to other real estate owned | | — |
| | 1,460 |
| | 455 |
|
| Right-of-use assets | | 15,674 |
| | — |
| | — |
|
| Lease liability | | 16,142 |
| | — |
| | — |
|
| Acquisition of Shore Community Bank in 2019 and New Jersey Community Bank in 2018 | | | | | | |
| Noncash assets acquired: | | | | | | |
| Investment securities available for sale | | $ | 26,440 |
| | 11,173 |
| | |
| Loans | | 205,833 |
| | 75,144 |
| | |
| Premises and equipment, net | | 4,433 |
| | 1,120 |
| | |
| Bank-owned life insurance | | 7,250 |
| | 3,972 |
| | |
| Accrued interest receivable | | 778 |
| | 259 |
| | |
| Core deposit intangible asset | | 1,467 |
| | 80 |
| | |
| Other real estate owned | | 605 |
| | 1,230 |
| | |
| Right-of-use assets | | 3,226 |
| | — |
| | |
| Other assets | | 2,518 |
| | 1,601 |
| | |
| | | $ | 252,550 |
| | $ | 94,579 |
| | |
| Liabilities assumed: | | | | | | |
| Deposits | | $ | 249,836 |
| | $ | 87,223 |
| | |
| Lease liability | | 3,226 |
| | — |
| | |
| Other liabilities | | 948 |
| | 636 |
| | |
| | | $ | 254,010 |
| | $ | 87,859 |
| | |
| | | | | | | |
| Goodwill recorded from the Shore Merger | | $ | 23,194 |
| | $ | — |
| | |
| Common stock issued for NJCB Merger | | — |
| | 5,494 |
| | |
| Common stock issued for Shore Merger | | $ | 29,175 |
| | $ | — |
| | |
| | | | | | | |
| | | | | | | |
| | | | | | | |
The accompanying notes are an integral part of these consolidated financial statementss.
1ST CONSTITUTION BANCORP
NOTES TO CONSOLIDATED FINANCIAL STATEMENTS
December 31, 20172019 and 20162018
1. Summary of Significant Accounting Policies
1ST Constitution Bancorp (the “Company”) is a bank holding company registered under the Bank Holding Company Act of 1956, as amended, and was organized under the laws of the State of New Jersey. The Company is the parent to 1ST Constitution Bank (the “Bank”), a New Jersey state-chartered commercial bank. The Bank provides community banking services to a broad range of customers, including corporations, individuals, partnerships and other community organizations in the central, coastal and northeastern New Jersey areas. The Bank conducts its operations through its main office located in Cranbury, New Jersey and operated, as of December 31, 2017, 172019, 25 additional branch offices in Asbury Park, Cranbury, Fair Haven, Fort Lee, Freehold, Hamilton Square, Hightstown, Hillsborough, Hopewell, Jackson, Jamesburg, Lawrenceville, Little Silver, Long Branch, Manahawkin, Neptune City, Perth Amboy, Plainsboro, Skillman, Princeton, Rumson, Fair Haven, Asbury Park, Shrewsbury, Skillman and Little Silver,three offices in Toms River, New Jersey. The Bank also operates two2 residential mortgage loan production offices in Forked River and Jersey City, New Jersey.
The Company has evaluated events and transactions occurring subsequent to the balance sheet date of December 31, 20172019 for items that should potentially be recognized or disclosed in these financial statements. The evaluation was conducted through the date these financial statements were issued.
Basis of Financial Statement Presentation: The consolidated financial statements have been prepared in accordance with U.S. generally accepted accounting principles ("U.S. GAAP"). In preparing the financial statements, management is required to make estimates and assumptions that affect the reported amounts of assets and liabilities and disclosure of contingent assets and liabilities as of the date of the balance sheet and revenues and expenses for that period. Actual results could differ from those estimates. Material estimates that are particularly susceptible to significant change in the near term relate to the determination of the allowance for loan losses, other-than-temporary security impairment, the fair value of other real estate owned, if any, and the valuation of deferred tax assets.
Principles of Consolidation: The consolidated financial statements of the Company are prepared on the accrual basis and include the accounts of the Company and its wholly-owned subsidiary, the Bank, and the Bank’s wholly-owned subsidiaries, 1st Constitution Investment Company of New Jersey, Inc., FCB Assets Holdings, Inc., 204 South Newman Street, Corp.LLC and 249 New York Avenue, LLC. 1st Constitution Capital Trust II, a subsidiary of the Company (“Trust II”), is not included in the Company’s consolidated financial statements as it is a variable interest entity and the Company is not the primary beneficiary. While the following footnotes include the collective results of the Company and the Bank, the footnotes primarily reflect the Bank's and its subsidiaries' activities. All significant intercompany accounts and transactions have been eliminated in consolidation and certain prior period amounts have been reclassified to conform to current year presentation.
Concentration of Credit Risk: Financial instruments which potentially subject the Company and its subsidiaries to concentrations of credit risk primarily consist of investment securities and loans. At December 31, 2017, 41.5%2019, 49.0% of our investment securities portfolio consisted of U.S. Government and Agency issues and collateralized mortgage obligations collateralized by agency mortgage backed securities. In addition, 38.7%28.4% of the portfolio consisted of municipal bonds. The remaining 19.8%22.6% of our investment securities consisted primarily of corporate debt and asset-backed issues. The Bank’s lending activity is primarily concentrated in loans collateralized by real estate located primarily in the State of New Jersey. As a result, credit risk is broadly dependent on the real estate market and general economic conditions in that state.
Interest Rate Risk: The Bank is principally engaged in the business of attracting deposits from the general public and using these deposits, together with other funds, to purchase investment securities and to make loans, the majority of which are secured by real estate. The potential for interest-rate risk exists as a result of the Company's generally shorter duration of interest-sensitive assets compared to the generally longer duration of interest-sensitive liabilities. In a changing interest rate environment, assets held by the Bank will re-price faster than liabilities of the Bank, thereby affecting net interest income. For this reason, management regularly monitors the maturity structure and rate adjustment features of the Bank’s assets and liabilities in order to measure its level of interest-rate risk and to plan for future volatility.
Investment Securities: Investment securities which the Company has the intent and ability to hold until maturity are classified as held to maturity and are recorded at cost, adjusted for amortization of premiums and accretion of discounts. Investment securities that are held for indefinite periods of time, that management intends to use as part of its asset/liability management strategy, or that may be sold in response to changes in interest rates, changes in prepayment risk, increased capital requirements or other similar factors, are classified as available for sale and are carried at fair value. Unrealized gains and losses on available for sale securities are recorded as a separate component of shareholders’ equity. Realized gains and losses, which are computed using the specific identification method, are recognized in earnings on a trade date basis.
If the fair value of a security is less than its amortized cost, the security is deemed to be impaired. Management evaluates all securities with unrealized losses quarterly to determine if such impairments are temporary or other-than-temporary in accordance with the Accounting Standards Codification (“ASC”) of the Financial Accounting Standards Board (“FASB”). Temporary impairments on available for sale securities are recognized, on a tax-effected basis, through other comprehensive income (“OCI”) with offsetting adjustments to the carrying value of the security and the balance of related deferred taxes. Temporary impairments of held to maturity securities are not recorded in the consolidated financial statements; however, information concerning the amount and duration of impairments on held to maturity securities are disclosed.
Other-than-temporary impairments ("OTTI") on all equity securities and on debt securities that the Company has decided to sell, or will, more likely than not, be required to sell prior to the full recovery of fair value to a level equal to or exceeding amortized cost, are recognized in earnings. If neither of these conditions regarding the likelihood of sale for a debt security apply, the OTTI is bifurcated into credit-related and noncredit-related components. Credit-related impairment generally represents the amount by which the present value of the cash flows that are expected to be collected on a debt security fall below its amortized cost. The noncredit-related component represents the remaining portion of the impairment not otherwise designated as credit-related. The Company recognizes credit-related OTTI in earnings. Noncredit-related OTTI on debt securities are recognized in OCI.
Premiums and discounts on all securities are amortized/accreted to maturity by use of the level-yield method considering the impact of principal amortization and prepayments. Premiums on purchased callable debt securities are amortized to the earliest call date.
Federal law requires a member institution of the FHLB system to hold restricted stock of its district FHLB according to a predetermined formula. The Bank’s investment in the restricted stock of the FHLB of New York is carried at cost and is included in other assets. The investment in FHLB stock was $1.5$4.2 million and $4.0$3.9 million at December 31, 20172019 and December 31, 2016,2018, respectively.
Management evaluates the FHLB restricted stock for impairment in accordance with U.S. GAAP. Management’s determination of whether these investments are impaired is based on their assessment of the ultimate recoverability of their cost rather than by recognizing temporary declines in value. The determination of whether a decline affects the ultimate recoverability of their cost is influenced by criteria such as (1) the significance of the decline in net assets of the FHLB as compared to the capital stock amount for the FHLB and the length of time this situation has persisted, (2) commitments by the FHLB to make payments required by law or regulation and the level of such payments in relation to the operating performance of the FHLB, and (3) the impact of legislative and regulatory changes on institutions and, accordingly, on the customer base of the FHLB. Management believes no impairment charge is necessary related to the FHLB stock as of December 31, 2017.2019.
Bank-Owned Life Insurance: The Company invests in bank-owned life insurance (“BOLI”). BOLI involves the purchasing of life insurance by the Company on a select group of its executives, directors, officers and employees. The Company is the owner and beneficiary of the policies. This pool of insurance, due to the advantages of the Bank, is profitable to the Company. This profitability offsets a portion of current and future benefit costs and is intended to provide a funding source for the payment of future benefits. The Bank’s deposits fund BOLI and the earnings from BOLI are recognized as non-interest income.
Loans and Loans Held For Sale: Loans that management intends to hold to maturity are stated at the principal amount outstanding, net of unearned income. Unearned income is recognized over the lives of the respective loans, principally using the effective interest method. Interest income is generally not accrued on loans, including impaired loans, where interest or principal is 90 days or more past due, unless the loans are adequately secured and in the process of collection, or on loans where management has determined that the borrowers may be unable to meet contractual principal and/or interest obligations. When it is probable that, based upon current information, the Bank will not collect all amounts due under the contractual terms of the loan, the loan is reported as impaired. Smaller balance homogeneous type loans, such as residential loans and loans to individuals, which are collectively evaluated, are generally excluded from consideration for impairment. Loan impairment is measured based upon the present value of the expected future cash flows discounted at the loan’s effective interest rate or the underlying fair value of collateral for collateral dependent loans. When a loan, including an impaired loan, is placed on non-accrual, interest accruals cease and uncollected accrued interest is reversed and charged against current income. Non-accrual loans are generally not returned to
accruing status until principal and interest payments have been brought current and full collectibility is reasonably assured. Cash receipts on non-accrual and impaired loans are applied to principal, unless the loan is deemed fully collectible.
Loans held for sale are carried at the lower of aggregated cost or fair value. The fair value of loans held for sale are determined, when possible, using quoted secondary market prices. If no such quoted market prices exist, fair values are determined using quoted prices for similar loans, adjusted for the specific attributes of the loans. Realized gains and losses on loans held for sale are recognized at settlement date and are determined based on the cost, including deferred net loan origination fees and the costs of the specific loans sold. Residential mortgage loans are sold with servicing released.
The Bank accounts for its transfers and servicing of financial assets in accordance with ASC Topic 860, “Transfers and Servicing” ("ASC Topic 860"). The Bank originates residential mortgages under a definitive plan to sell those loans with servicing generally released. Residential mortgage loans originated and intended for sale in the secondary market are carried at the lower of aggregate cost or estimated fair value. The Bank also originates commercial loans, of which a portion are guaranteed by the Small Business Administration ("SBA"). The guaranteed portion of the loans is generally sold into the secondary market. Gains and losses on sales are also accounted for in accordance with ASC Topic 860.
The Bank enters into commitments to originate loans whereby the interest rate on the loan is determined prior to funding “rate lock commitments.” Rate lock commitments on residential mortgage loans that are intended to be sold are considered to be derivatives. Time elapsing between the issuance of a loan commitment and closing and sale of the loan generally ranges from 30 to 120 days. The Bank protects itself from changes in interest rates through the use of best efforts forward delivery commitments, whereby the Bank commits to sell a loan at the time the borrower commits to an interest rate with the intent that the buyer has assumed interest rate risk on the loan. As a result, the Bank is generally not exposed to losses nor will it realize significant gains related to its rate lock commitments due to changes in interest rates.
The fair value of rate lock commitments and best efforts commitments is not readily ascertainable with precision because rate lock commitments and best efforts commitments are not actively traded in stand-alone markets. The Bank determines the fair value of rate lock commitments based upon the forward sales price that is obtained in the best efforts commitment at the time the borrower locks in the interest rate on the loan while taking into consideration the probability that the rate lock commitments will close. Due to high correlation between rate lock commitments and best efforts commitments, no gain or loss occurs on the rate lock commitments. The estimated fair value of rate lock commitments was $135,000$159,000 and $123,000$79,000 at December 31, 20172019 and 2016,2018, respectively.
ASC Topic 460, "Guarantees," requires a guarantor entity, at the inception of a guarantee covered by the measurement provisions of the interpretation, to record a liability for the fair value of the obligation undertaken in issuing the guarantee.
Standby letters of credit are conditional commitments issued by the Bank to guarantee the financial performance of a customer to a third party. Those guarantees are primarily issued to support contracts entered into by customers. Most guarantees extend for one year. The credit risk involved in issuing letters of credit is essentially the same as that involved in extending loan facilities to customers. The Bank defines the fair value of these letters of credit as the fees paid by the customer or similar fees collected on similar instruments. The Bank amortizes the fees collected over the life of the instrument. The Bank generally obtains collateral, such as real estate or liens on customer assets, for these types of commitments. The Bank’s potential liability would be reduced by any proceeds obtained in liquidation of the collateral. The Bank had standby letters of credit for customers aggregating $1.2 million$4,300 thousand and $2.0 million$766 thousand at December 31, 20172019 and 2016,2018, respectively. These letters of credit are primarily related to real estate lending and the approximate value of underlying collateral upon liquidation is expected to be sufficient to cover this maximum potential exposure at December 31, 2017.2019. The amount of the liability related to guarantees under issued standby letters of credit was not material as of December 31, 20172019 and 2016.
2018.
Allowance for Loan Losses: The allowance for loan losses is maintained at a level sufficient to absorb estimated credit losses in the loan portfolio as of the date of the financial statements. The allowance for loan losses is a valuation reserve available for losses incurred or inherent in the loan portfolio and other extensions of credit. The determination of the adequacy of the allowance for loan losses is a critical accounting policy of the Bank.
All, or part, of the principal balance of commercial and commercial real estate loans and construction loans are charged off against the allowance as soon as it is determined that the repayment of all, or part, of the principal balance is highly unlikely. Consumer loans are generally charged off no later than 120 days past due on a contractual basis, or earlier in the event of bankruptcy, or if there is an amount deemed uncollectible. Because all identified losses are charged off, no portion of the allowance for loan losses is restricted to any individual loan or groups of loans, and the entire allowance is available to absorb any and all loan losses.
Loans are placed in a nonaccrual status when the ultimate collectability of principal or interest in whole, or in part, is in doubt. Past-due loans contractually past-due 90 days or more for either principal or interest are also placed in nonaccrual status unless they are both well secured and in the process of collection. Impaired loans are evaluated individually.
Purchased Credit-Impaired (“PCI”) loans are loans acquired at a discount that is due, in part, to credit quality. PCI loans are accounted for in accordance with ASC Subtopic 310-30, "Receivables, Loans and Debt Securities Acquired with Deteriorated Credit Quality" and are initially recorded at fair value (as determined by the present value of expected future cash flows) with no valuation allowance (i.e., the allowance for loan losses). The difference between the undiscounted cash flows expected at acquisition and the initial carrying amount (fair value) of the PCI loans or the “accretable yield,” is recognized as interest income utilizing the level-yield method over the life of the loans. Contractually required payments for interest and principal that exceed the undiscounted cash flows expected at acquisition, or the “non-accretable difference,” are not recognized as a yield adjustment, as a loss accrual or a valuation allowance. Reclassifications of the non-accretable difference to the accretable yield may occur subsequent to the loan acquisition dates due to increases in expected cash flows of the loans and result in an increase in yield on a prospective basis.
The following is our charge-off policy for our loan segments:
Commercial, Commercial Real Estate and Construction
Loans are generally fully or partially charged down to the fair value of collateral securing the asset when:
Management judges the loan to be uncollectible;
Repayment is deemed to be protracted beyond reasonable time frames;
The loan has been classified as a loss by either internal loan review process or external examiners;
The customer has filed bankruptcy and the loss becomes evident owing to a lack of assets; or
The loan is significantly past due unless both well secured and in the process of collection.
Consumer
Consumer loans are generally charged off no later than 120 days past due on a contractual basis, earlier in the event of bankruptcy, or if there is an amount deemed uncollectible.
Leases: The Company leases real property for its branch offices and general office space. Generally, the leases include one or more options to extend the lease term. In addition, the Company also leases office equipment, consisting of copiers, printers and two automobiles. None of the equipment leases include extensions and generally have three to five year terms.
The Company accounts for the leases in accordance with ASC Topic 842 “Leases.” The new standard requires a lessee to record a right-of-use asset ("ROU") and a lease liability on the balance sheet for all leases with terms longer than 12 months. The Company adopted this ASU effective January 1, 2019 and recognized a lease liability and a ROU on its balance sheet based on the present value of the remaining minimum lease payments. The lease expense is recognized based on the terms of the leases. The new guidance includes a number of optional transition-related practical expedients. The Company elected to apply the practical expedients that relate to: the identification and classification of leases that commenced before January 1, 2019 and the initial direct costs of these leases.
Premises and Equipment: Premises and equipment are stated at cost less accumulated depreciation and amortization. Depreciation is computed primarily on the straight-line method over the estimated useful lives of the related assets for financial reporting purposes and using the mandated methods by asset type for income tax purposes. Building, furniture and fixtures, equipment and leasehold improvements are depreciated or amortized over the estimated useful lives of the assets or lease terms, as applicable. Estimated useful lives of buildings are forty years, furniture and fixtures and equipment are three to fifteen years and leasehold improvements are generally three to ten years. Expenditures for maintenance and repairs are charged to expense as incurred.
The Bank accounts for impairment of long-lived assets in accordance with ASC Topic 360, “Property, Plant, and Equipment,” which requires recognition and measurement for the impairment of long-lived assets to be held and used or to be disposed of by sale. The Bank had no0 impaired long-lived assets at December 31, 20172019 and 2016.2018.
Income Taxes: There are two components of income tax expense or benefit: current and deferred. Current income tax expense or benefit approximates cash to be paid or refunded for taxes for the applicable period. Deferred tax assets and liabilities are recognized due to differences between the basis of assets and liabilities as measured by tax laws and their basis as reported in the financial statements. Deferred tax assets are subject to management’s judgment based upon available evidence that future realizations are likely. If management determines that the Company may not be able to realize some or all of the net deferred tax asset in the future, a charge to income tax expense may be required to increase the valuation reserve of the net deferred tax asset. Deferred tax assets and liabilities are measured using enacted tax rates expected to apply to taxable income in the years in which those temporary differences are expected to be recovered or settled. The effect on deferred taxes of a change in tax rates is recognized in income in the period that includes the enactment date. Deferred tax expense or benefit is recognized for the change in deferred tax assets and liabilities.
The Company accounts for uncertainty in income taxes recognized in its consolidated financial statements in accordance with ASC Topic 740, "Income Taxes," which prescribes a recognition threshold and measurement attribute for the financial statement recognition and measurement of a tax position taken or expected to be taken in a tax return, and also provides guidance on de-recognition, classification, interest and penalties, accounting in interim periods, disclosure and transition. The Company has not identified any significant income tax uncertainties through the evaluation of its income tax positions for the years ended December 31, 20172019 and 20162018 and has not recognized any liabilities for tax uncertainties as of December 31, 20172019 and 2016.2018. Our policy is to recognize interest and penalties on unrecognized tax benefits in income tax expense; such amounts were not significant during the years ended December 31, 20172019 and 2016.2018. The tax years subject to examination by the taxing authorities are, for federal and state purposes, the years ended December 31, 2019, 2018, 2017 2016, 2015 and 2014.2016.
On December 22, 2017, the 2017 Tax Cuts and Jobs Act (the “Tax Act”) was enacted into law. The Tax Act contained several key tax provisions including the reduction in the maximum corporate federal tax rate to 21% from 35% effective January 1, 2018. As a result, the Company was required to re-measure, through income tax expense, its deferred tax assets and liabilities using the enacted rate at which it expects them to be recovered or settled. In December 2017, the U.S. Securities and Exchange Commission ("SEC") also issued Staff Accounting Bulletin No. 118, "Income Tax Accounting Implications of the Tax Cuts and Jobs Act" ("SAB 118"), which allows companies to record provisional amounts during a measurement period not to extend beyond one year of the enactment date. Because the Tax Act was passed late in December 2017 and ongoing analysis and interpretation of the other key tax provisions iswas expected over the next 12 months, the Company considersconsidered the deferred tax re-measurements and other items to be provisional in nature. TheIn 2018, the Company expects to completecompleted its analysis within the measurement period in accordance with SAB 118. See Note 1213 - Income Taxes - for additional information.
Other Real Estate Owned ("OREO"): OREO obtained through loan foreclosures or the receipt of deeds-in-lieu of foreclosure is recorded at the fair value of the related property, as determined by current appraisals less estimated costs to sell at the initial transfer from the loan portfolio. Write-downs on these properties, which occur after the initial transfer from the loan portfolio, are recorded as operating expenses. Costs of holding such properties are charged to expense in the current period. Gains, to the extent realized, and losses on the disposition of these properties are reflected in current operations.
Goodwill and Other Intangible Assets: Goodwill represents the excess of the cost of an acquired entity over the fair value of the identifiable net assets acquired in accordance with the acquisition method of accounting. Goodwill is not amortized but is reviewed for potential impairment on an annual basis, or more often if events or circumstances indicated that there may be impairment, in accordance with ASC Topic 350, “Intangibles – Goodwill and Other.” Goodwill is tested for impairment at the reporting unit level and an impairment loss is recorded to the extent that the carrying amount of goodwill exceeds its implied fair value. Core deposit intangibles are a measure of the value of non-maturity checking, money market and savings deposits acquired in business combinations accounted for under the purchase method. Core deposit intangibles are amortized over their estimated lives (ranging from five to ten years) and identifiable intangible assets are evaluated for impairment if events and circumstances indicate a possible impairment. Any impairment loss related to goodwill and other intangible assets is reflected as other non-interest expense in the statement of income in the period in which the impairment was determined. No assurance can be given that future impairment tests will not result in a charge to earnings. See Note 89 – Goodwill"Goodwill and Intangible AssetsAssets" - for additional information.
Share-Based Compensation: The Company recognizes compensation expense for stock awards and options in accordance with ASC Topic 718, “Compensation – Stock Compensation.” The expense of stock-based compensation is generally measured at fair value at the grant date with compensation expense recognized over the service period, which is usually the vesting period. The Company utilizes the Black-Scholes option-pricing model to estimate the fair value of each stock option on the date of grant. The Black-Scholes model takes into consideration the exercise price and expected life of the options, the current price of the underlying stock and its expected volatility, the expected dividends on the stock and the current risk-free interest rate for the expected life of the option. The Company’s estimate of the fair value of a stock option is based on expectations derived from historical experience
and may not necessarily equate to its market value when fully vested. See Note 1516 – Share-Based"Share-Based Compensation " - for additional information.
Benefit Plans: The Company provides certain retirement savings benefits to employees under a 401(k) plan. The Company’s contributions to the 401(k) plan are expensed as incurred.
The Company also provides retirement benefits to certain employees under supplemental executive retirement plans. The plans are unfunded and the Company accrues actuarially determined benefit costs over the estimated service period of the employees in the plans. In accordance with ASC Topic 715, “Compensation – Retirement Benefits,” the Company recognizes the unfunded status of these postretirement plans as a liability in its consolidated balance sheets and recognizes changes in that unfunded status in the year in which the changes occur through other comprehensive income.
Cash and Cash Equivalents: Cash and cash equivalents includes cash on hand, interest and non-interest bearing amounts due from banks, federal funds sold and short-term investments.investments with original maturities less than 90 days. Generally, federal funds are sold and short-term investments are made for a one or two-day period.
Reclassifications: Certain reclassifications have been made to the prior period amounts to conform with the current period presentation. Such reclassification had no impact on net income or total shareholders’ equity.
Advertising Costs: It is the Company’s policy to expense advertising costs in the period in which they are incurred.
Earnings Per Common Share: Basic net incomeearnings per common share is calculated by dividing net income by the weighted average number of common shares outstanding during each period. Diluted net incomeearnings per common share is calculated by dividing net income by the weighted average number of common shares outstanding, as adjusted for the assumed exercise of dilutive common stock warrants and common stock options using the treasury stock method.
Awards of restricted shares are included in outstanding shares when granted. Unvested restricted shares are entitled to non-forfeitable dividends and participate in undistributed earnings with common shares. Awards of this nature are considered participating securities and basic and diluted earnings per share are computed under the two-class method.
Dilutive securities in the tables below exclude common stock options and warrants with exercise prices that exceed the average market price of the Company’s common stock during the periods presented. Inclusion of these common stock options and warrants would be anti-dilutive to the diluted earnings per common share calculation. For the years ended December 31, 2019, 2018 and 2017, 201627,930, 19,350 and 2015, 8,900 11,088 and 25,182 options, respectively, were anti-dilutive and were not included in the computation of diluted earnings per common share.
The following table illustrates the calculation of both basic and diluted earnings per share for the years ended December 31, 2017, 20162019, 2018 and 2015:2017:
| | | (In thousands, except per share data) | 2017 | | 2016 | | 2015 | 2019 | | 2018 | | 2017 |
| Net income | $ | 6,928 |
| | $ | 9,285 |
| | $ | 8,664 |
| $ | 13,634 |
| | $ | 12,048 |
| | $ | 6,928 |
|
| | | | | | | | | | | |
| Basic weighted average shares outstanding | 8,049,981 |
| | 7,962,121 |
| | 7,901,278 |
| 8,875,237 |
| | 8,320,718 |
| | 8,049,981 |
|
| Plus: common stock equivalents | 262,803 |
| | 215,318 |
| | 174,474 |
| 58,234 |
| | 272,791 |
| | 262,803 |
|
| Diluted weighted average shares outstanding | 8,312,784 |
| | 8,177,439 |
| | 8,075,752 |
| 8,933,471 |
| | 8,593,509 |
| | 8,312,784 |
|
| Earnings per share: | | | | | | | | | | |
| Basic | $ | 0.86 |
| | $ | 1.17 |
| | $ | 1.10 |
| $ | 1.54 |
| | $ | 1.45 |
| | $ | 0.86 |
|
| Diluted | 0.83 |
| | 1.14 |
| | 1.07 |
| 1.53 |
| | 1.40 |
| | 0.83 |
|
Comprehensive Income: Comprehensive income consists of net income and other comprehensive income (loss). Other comprehensive income (loss) includes unrealized gains and losses on securities available for sale, other-than-temporary non-credit related security impairments, and changes in the funded status of benefit plans.
Variable Interest Entities: Management has determined that Trust II qualifies as a variable interest entity under ASC Topic 810, “Consolidation.” Trust II issued mandatorily redeemable preferred stock to investors, loaned the proceeds to the Company and holds, as its sole asset, subordinated debentures issued by the Company. As a qualified variable interest entity, Trust II’s balance sheet and statement of operations have never been consolidated with those of the Company because the Company is not the primary beneficiary.
In March 2005, the Federal Reserve Board ("FRB") adopted a final rule that would continue to allow the inclusion of trust preferred securities in Tier 1 capital, but with stricter quantitative limits. Under the final rule, after a five-year transition period, the aggregate amount of trust preferred securities and certain other capital elements would be limited to 25% of Tier 1 capital elements, net of goodwill. The amount of trust preferred securities and certain other elements in excess of the limit could be included in Tier 2 capital, subject to restrictions. Based on the final rule, the Company has included all of its $18.0 million in trust preferred securities in Tier 1 capital at December 31, 20172019 and 2016.2018.
Segment Information: U.S. GAAP establishes standards for public business enterprises to report information about operating segments in their annual financial statements and requires that those enterprises report selected information about operating segments in subsequent interim financial reports issued to shareholders. It also established standards for related disclosure about products and services, geographic areas and major customers. Operating segments are components of an enterprise, which are evaluated regularly by the chief operating decision-maker in deciding how to allocate and assess resources and performance. The Company’s chief operating decision-maker is the President and Chief Executive Officer. The Company has applied the aggregation criteria for its operating segments to create one1 reportable segment, “Community Banking.”
The Company’s Community Banking segment consists of construction, commercial, retail and mortgage banking operations. The Community Banking segment is managed as a single strategic unit, which generates revenue from a variety of products and services provided by the Company. Construction, commercial, retail and mortgage lending is dependent upon the ability of the Company to fund itself with retail deposits and other borrowings and to manage interest rate, liquidity and credit risk as a single unit.
Reclassifications: Certain reclassifications have been made to the prior period amounts to conform with the current period presentation. Such reclassification had no impact on net income or total shareholders’ equity.
Recent Accounting Pronouncements
ASU 2018-022019-11 - Reclassification of Certain Tax Effects from Accumulated Other Comprehensive IncomeFinancial Instruments - Credit Losses: Codification Improvements (Topic 326)
In February 2018,November 2019, the FASBFinancial Accounting Standards Board (“FASB”) issued Accounting Standards Update ("ASU"(“ASU”) 2018-02, "Reclassification of Certain Tax Effects from Accumulated Other Comprehensive Income," which allows for reclassification from accumulated other comprehensive income (loss) to retained earnings for stranded tax effects resulting from the Tax Act described in the "Income Taxes" section above. The amountNo. 2019-11, “Financial Instruments - Credit Losses: Codification Improvements (Topic 326).” ASU 2019-11 clarifies and addresses specific issues about certain aspects of the reclassification should include the effect of the change in the federal corporate income tax rate related to items remaining in accumulated other comprehensive income (loss). The ASU would require an entity to disclose whether it elects to reclassify stranded tax effects from accumulated other comprehensive income (loss) to retained earnings in the period of adoption and, more generally, a description of the accounting policy for releasing income tax effects from accumulated other comprehensive income (loss). The amendments in ASU 2016-13. For the Company, the provisions of this updateASU are effective for fiscal years, and interim period within those fiscal years beginning after December 15, 2018.2022, including interim periods within those fiscal years. Early adoption is permitted for all entities as of the fiscal year beginning after December 15, 2018, including interim periods within those fiscal years. See the discussions regarding the adoptions of ASU 2016-13 below.
ASU 2019-10 - Financial Instruments - Credit Losses (Topic 326), Derivatives and Hedging (Topic 815), and Leases (Topic 842)
In November 2019, the FASB issued ASU No. 2019-10, “Financial Instruments - Credit Losses (Topic 326), Derivatives and Hedging (Topic 815), and Leases (Topic 842). ASU 2019-10 provides that the FASB’s recently developed philosophy regarding the implementation of effective dates applies to ASU 2016-13, Financial Instruments - Credit Losses (Topic 326), ASU 2017-12, Derivatives and Hedging (Topic 815), and ASU 2016-02, Leases (Topic 842).
See the discussions regarding the adoptions of ASU 2016-13 and ASU 2016-02 below.
ASU 2019-01 - Leases: Codification Improvements (Topic 842)
In March 2019, the FASB issued ASU No. 2019-01, “Leases: Codification Improvements (Topic 842).” ASU 2019-01 aligns the new leases guidance with existing guidance for fair value of the underlying asset by lessors that are not manufacturers or dealers, and clarifies an exemption for lessors and lessees from a certain interim disclosure requirement associated with adopting the FASB’s new lease accounting standard. Although this guidance is effective for years beginning after December 15, 2019, the Company adopted this guidance along with the adoption of ASU 2018-11, “Leases- Targeted Improvements,” and ASU 2016-02, “Leases.” The adoption of this guidance had a material impact on the Company’s consolidated financial statements. See the discussions regarding the adoption of ASU 2016-02 below.
ASU 2018-15 - Intangibles - Goodwill and Other - Internal-Use Software (Subtopic 350-40)
In August 2018, the FASB issued ASU 2018-15, “Intangibles - Goodwill and Other - Internal-Use Software (Subtopic 350-40): Customer’s Accounting for Fees Paid in a Cloud Computing Arrangement,” to help entities evaluate the accounting for fees paid
by a customer in a cloud computing arrangement (hosting arrangement) by providing guidance for determining when the arrangement includes a software license.
The amendments in this Update align the requirements for capitalizing implementation costs incurred in a hosting arrangement that is a service contract with the requirements for capitalizing implementation costs incurred to develop or obtain internal-use software (and hosting arrangements that include an internal use software license). The accounting for the service element of a hosting arrangement that is a service contract is not affected by the amendments in this updateUpdate.
The amendments in this ASU also require the entity (customer) to expense the capitalized implementation costs of a hosting arrangement that is permitteda service contract over the term of the hosting arrangement. The term of the hosting arrangement includes the non-cancellable period of the arrangement plus periods covered by (1) an option to extend the arrangement if the customer is reasonably certain to exercise that option, (2) an option to terminate the arrangement if the customer is reasonably certain not to exercise the termination option, and (3) an option to extend (or not to terminate) the arrangement in which exercise of the option is in the control of the vendor. The entity also is required to apply the existing impairment guidance in Subtopic 350-40 to the capitalized implementation costs as if the costs were long-lived assets.
The amendments in this ASU also require the entity to present the expense related to the capitalized implementation costs in the same line item in the statement of income as the fees associated with the hosting element (service) of the arrangement and classify payments for periodscapitalized implementation costs in the statement of cash flows in the same manner as payments made for fees associated with the hosting element. The entity is also required to present the capitalized implementation costs in the consolidated balance sheets in the same line item that a prepayment for the fees of the associated hosting arrangement would be presented.
The adoption of this guidance in 2020 is not expected to have a material impact on the Company's consolidated financial statements.
ASU 2018-14 - Compensation - Retirement Benefits - Defined Benefit Plans - General (Subtopic 715-20)
In August 2018, the FASB issued ASU 2018-14 - “Compensation - Retirement Benefits - Defined Benefit Plans - General (Subtopic 715-20),” which consists of amendments to the disclosure framework project to improve the effectiveness of disclosures in the notes to the financial statements. The amendments in this Update modify the disclosure requirements for employers that sponsor defined benefit pension or other postretirement plans.
The following disclosure requirements are removed from Subtopic 715-20:
| |
| 1. | The amounts in accumulated other comprehensive income expected to be recognized as components of net periodic benefit cost over the next fiscal year; |
| |
| 2. | The amount and timing of plan assets expected to be returned to the employer; |
| |
| 3. | The disclosures related to the June 2001 amendments to the Japanese Welfare Pension Insurance Law; |
| |
| 4. | Related party disclosures about the amount of future annual benefits covered by insurance and annuity contracts and significant transactions between the employer or related parties and the plan; |
| |
| 5. | For nonpublic entities, the reconciliation of the opening balances to the closing balances of plan assets measured on a recurring basis in Level 3 of the fair value hierarchy. However, nonpublic entities will be required to disclose separately the amounts of transfers into and out of Level 3 of the fair value hierarchy and purchases of Level 3 plan assets; and |
| |
| 6. | For public entities, the effects of a one-percentage point change in assumed health care cost trend rates on the (a) aggregate of the service and interest cost components of net periodic benefit costs and (b) benefit obligation for postretirement health care benefits. |
The following disclosure requirements are added to Subtopic 715-20:
| |
| 1. | The weighted-average interest crediting rates for cash balance plans and other plans with promised interest crediting rates; and |
| |
| 2. | An explanation of the reasons for significant gains and losses related to changes in the benefit obligation for the period. |
The amendments in this ASU also clarify the disclosure requirements in paragraph 715-20-50-3, which state that the following information for defined benefit pension plans should be disclosed:
| |
| 1. | The projected benefit obligation (“PBO”) and fair value of plan assets for plans with PBOs in excess of plan assets; and |
| |
| 2. | The accumulated benefit obligation (“ABO”) and fair value of plan assets for plans with ABOs in excess of plan assets. |
The amendments in this ASU remove disclosures that no longer are considered cost beneficial, clarify the specific requirements of disclosures and add disclosure requirements identified as relevant. Although narrow in scope, the amendments are considered an important part of the FASB’s efforts to improve the effectiveness of disclosures in the notes to financial statements have not been issued or made available for issuance, includingby applying concepts in the period the Tax Act was enacted. The Company elected to adopt the guidance for the year ended December 31, 2017. As of December 31, 2017,Concepts Statement.
For the Company, reclassified $109,000the provisions of stranded tax effects relatedthis ASU are effective for fiscal years ending after December 15, 2020. The adoption of this guidance in 2020 is not expected to net unrealized losseshave a material impact on its investment securitiesthe Company's consolidated financial statements.
ASU 2018-13 - Fair Value Measurement (Topic 820)
In August 2018, the FASB issued ASU 2018-13, “Disclosure Framework-Changes to the Disclosure Requirements for Fair Value Measurement,” which modifies the disclosure requirements on fair value measurements. The following disclosure requirements that are applicable to public entities were removed from Topic 820:
| |
| 1. | The amount of and reasons for transfers between Level 1 and Level 2 of the fair value hierarchy; |
| |
| 2. | The policy for timing of transfers between levels; and |
| |
| 3. | The valuation process for Level 3 fair value measurements. |
The following disclosure requirements were modified in Topic 820:
| |
| 1. | In lieu of a roll-forward for Level 3 fair value measurements, a nonpublic entity is required to disclose transfers into and out of Level 3 of the fair value hierarchy, in addition to purchases and issues of Level 3 assets and liabilities; |
| |
| 2. | For investments in certain entities that calculate net asset value, an entity is required to disclose the timing of liquidation of an investee’s assets and the date when restrictions from redemption might lapse, only if the investee has communicated the timing to the entity or announced the timing publicly; and |
| |
| 3. | The amendments clarify that the measurement uncertainty disclosure is to communicate information about the uncertainty in measurement as of the reporting date. |
The following disclosure requirements applicable to public companies were added to Topic 820:
| |
| 1. | The changes in unrealized gains and losses for the period included in other comprehensive income for recurring Level 3 fair value measurements held at the end of the reporting period; and |
| |
| 2. | The range and weighted average of significant unobservable inputs used to develop Level 3 fair value measurements. For certain unobservable inputs, an entity may disclose other quantitative information (such as the median or arithmetic average) in lieu of the weighted average if the entity determines that other quantitative information would be a more reasonable and rational method to reflect the distribution of unobservable inputs used to develop Level 3 fair value measurements. |
In addition, the amendments eliminate “at a minimum” from the phrase “an entity shall disclose at a minimum” to promote the appropriate exercise of discretion by entities when considering fair value measurement disclosures and actuarial gainsto clarify that materiality is an appropriate consideration of entities and their auditors when evaluating disclosure requirements.
For the Company, the provisions of this ASU are effective for unfunded pension liability to its retained earnings, whichfiscal years beginning after December 15, 2018, including interim periods within those years. The adoption of this guidance effective January 1, 2019 did not have a material impact on the Company’s consolidated financial statements.
ASU Update2018-11 - Leases - Targeted Improvements (Topic 842)
In July 2018, the FASB issued ASU 2018-11, “Leases-Targeted Improvements,” which provides an additional (and optional) transition method for a cumulative effect adjustment. The additional transition method allows entities to initially apply the new lease standard at the adoption date (January 1, 2019 for calendar-year-end public business entities) and recognizes a cumulative-
effect adjustment to the opening balance of retained earnings in the period of adoption. This additional transition method changes only when an entity is required to initially apply the transition requirements of the new leases standard; it does not change how those requirements apply. An entity’s reporting for the comparative periods presented in the financial statements in which it adopts the new lease standard will continue to be in accordance with the original U.S. GAAP (Topic 840, Leases).
For the Company, the provisions of this ASU were effective for fiscal years beginning after December 15, 2018, including interim periods within those years. The Company adopted this guidance effective January 1, 2019 along with the adoption of ASU 2016-02, “Leases.” The adoption of this guidance had a material impact on the Company's financial statements. See the discussion regarding the adoption of ASU 2016-02 below.
ASU 2018-07 - Compensation - Stock Compensation (Topic 718)
In June 2018, the FASB issued ASU 2018-07, “Compensation-Stock Compensation,” which expands the scope of Topic 718 to include share-based payment transactions for acquiring goods and services from non-employees.
The amendments specify that Topic 718 applies to all share-based payment transactions in which a grantor acquires goods or services to be used or consumed in a grantor’s own operations by issuing share-based payment awards. The amendment also clarifies that Topic 718 does not apply to share-based payments used to effectively provide (1) financing to the issuer, or (2) awards granted in conjunction with selling goods or services to customers as part of a contract accounted for under Topic 606, “Revenue from Contracts with Customers.”
For the Company, the provisions of this ASU were effective for fiscal years beginning after December 15, 2018, including interim periods within those years. The adoption of this guidance in 2019 did not have a material impact on the Company’s consolidated financial statements.
ASU 2017-08 - Premium Amortization on Purchased Callable Debt Securities
In March 2017, the FASB issued ASU 2017-08, "Premium“Premium Amortization on Purchased Callable Debt Securities,"” which shortens the amortization period for premiums on purchased callable debt securities to the earliest call date (i.e., yield-to-earliest call amortization) rather than amortizing over the full contractual term. The ASU does not change the accounting for securities held at a discount.
The amendments apply to callable debt securities with explicit, non-contingent call features that are callable at fixed prices and on preset dates. If a security may be prepaid based upon prepayments of the underlying loans and not because the issuer exercised a date specific call option, it is excluded from the scope of the new standard. However, for instruments with contingent call features, once the contingency is resolved and the security is callable at a fixed price and preset date, the security is within the scope of the amendments. Further, the amendments apply to all premiums on callable debt securities, regardless of how they were generated.
The amendments require companies to reset the effective yield using the payment terms of the debt security if the call option is not exercised on the earliest call date. If the security has additional future call dates, any excess of the amortized cost basis over the amount repayable by the issuer at the next call date should be amortized to the next call date.
For the Company, the provisions of this ASU arewere effective for fiscal years beginning after December 15, 2018, including interim periods within those years. Early adoption is permitted, including adoption in an interim period. If an entity early adopts the amendments in an interim period, any adjustments should be reflected as of the beginning of the fiscal year that includes the interim period.
The Company does not expect the adoption of this guidance to have a material impact on its consolidated financial statements.
ASU Update 2017-07 - Improving the Presentation of Net Periodic Pension Cost and Net Periodic Postretirement Benefit Cost
In March 2017, the FASB issued ASU 2017-07, "Improving the Presentation of Net Periodic Pension Cost and Net Periodic Postretirement Benefit Cost," which requires that an employer disaggregate the service cost component from the other components of net benefit costs as follows: (1) service cost must be presented in the same line item(s) as other employee compensation costs. These costs are generally included within income from continuing operations but in some cases, may be eligible for capitalization if certain criteria are met; and (2) all other components of net benefit cost must be presented in the income statement separately from the service cost component and outside a subtotal of income from operations, if one is presented. These generally include interest cost, actual return on plan assets, amortization of prior service cost included in accumulated other comprehensive income and gains or losses from changes in the value of the projected benefit obligation or plan assets.
For the Company, the provisions of this ASU are effective for fiscal years beginning after December 15, 2017, including interim periods within those years. Early adoption is permitted as of the beginning of an annual period.
The Company has determined that the adoption of this guidance will2019 did not have a material impact on its consolidated financial statements.
ASU Update 2017-04 - Intangibles-Goodwill and Other (Topic 350): Simplifying the Test for Goodwill Impairment
In January 2017, the FASB issued ASU 2017-04 "Intangibles-Goodwill and Other (Topic 350): Simplifying the Test for Goodwill Impairment," which simplifies how all entities assess goodwill for impairment by eliminating Step 2 from the goodwill impairment test. As amended, the goodwill impairment test will consist of one step comparing the fair value of a reporting unit with its carrying amount. An entity should recognize a goodwill impairment charge for the amount by which the carrying amount exceeds the reporting unit's fair value. The primary goal of this ASU is to simplify the goodwill impairment test and provide cost savings for all entities by removing the requirement to determine the fair value of individual assets and liabilities in order to calculate a reporting unit's "implied" goodwill under current U.S. GAAP.
For the Company, the provisions of this ASU are effective for its annual or any interim goodwill impairment tests in fiscal years beginning after December 15, 2019. The amendments should be adopted prospectively. Early adoption is permitted for interim or annual goodwill impairment tests performed on testing dates after January 1, 2017.
The Company does not expect the adoption of this guidance to have a material impact on its consolidated financial statements.
ASU Update 2017-01 - Business Combinations (Topic 805): Clarifying the Definition of a Business
In January 2017, the FASB issued ASU 2017-01 "Business Combinations (Topic 805): Clarifying the Definition of a Business," which clarifies the definition of a business with the objective of adding guidance to assist companies and other reporting organizations with evaluating whether transactions should be accounted for as acquisitions (or disposals) of assets or businesses. The amendments in this ASU provide a more robust framework to use in determining when a set of assets and activities is a business. The current definition of a business is interpreted broadly and can be difficult to apply. Stakeholders indicated that analyzing transactions is inefficient and costly and the definition does not permit the use of reasonable judgment.
Under current implementation guidance, there are three elements of a business: inputs, processes and outputs. While an integrated set of assets and activities (collectively referred to as a "set") that is a business usually has outputs, outputs are not required to be present. Additionally, all the inputs and processes that a seller uses in operating a set are not required if market participants can acquire the set and continue to produce outputs, for example, by integrating the acquired set with their own inputs and processes.
The ASU introduces a "screen" to assist entities in determining when a set should not be considered a business. If substantially all of the fair value of the gross assets acquired is concentrated in a single identifiable asset or group of similar identifiable assets, the set is not considered a business. If the screen is not met, the ASU requires that to be considered a business, a set must include, at a minimum, an input and a substantive process that together significantly contribute to the ability to create output. Further, the ASU removes the evaluation of whether a market participant could replace missing elements (as required under current U.S. GAAP).
For the Company, the ASU is effective for annual periods beginning after December 15, 2017, including interim periods within those periods. The amendments in this ASU should be applied prospectively on or after the effective date. No disclosures are required at transition.
The Company has determined that the adoption of this guidance will not have a material impact on its consolidated financial statements.
ASU Update 2016-15 - Statement of Cash Flows (Topic 230): Classification of Certain Cash Receipts and Cash Payments.
In August 2016, the FASB issued ASU 2016-15 "Statement of Cash Flows (Topic 230): Classification of Certain Cash Receipts and Cash Payments," which clarifies whether the following items should be categorized as operating, investing or financing in the statement of cash flows: (1) debt prepayment and extinguishment costs, (2) settlement of zero-coupon debt, (3) settlement of contingent consideration, (4) insurance proceeds, (5) settlement of corporate-owned life insurance (COLI) and bank-owned life insurance (BOLI) policies, (6) distributions from equity method investees, (7) beneficial interests in securitization transactions and (8) receipts and payments with aspects of more than one class of cash flows.
For the Company, the provisions of this ASU are effective for fiscal years beginning after December 15, 2017 and interim periods within those fiscal years.
The Company currently classifies cash flows related to BOLI in accordance with the guidance and the adoption of this guidance will not have a material impact on itsCompany’s consolidated financial statements.
ASU Update 2016-13 - Financial Instruments - Credit Losses (Topic 326): Measurement of Credit Losses on Financial Instruments
In June 2016, the FASB issued ASU 2016-13 "Financial Instruments-Credit Losses (Topic 326): Measurement of Credit Losses on Financial Instruments," which requires credit losses on most financial assets to be measured at amortized cost and certain other instruments to be measured using an expected credit loss model (referred to as the current expected credit loss (CECL) model).
Under this model, entities will estimate credit losses over the entire contractual term of the instrument (considering estimated prepayments but not expected extensions or modifications unless reasonable expectation of a troubled debt restructuring exists) from the date of initial recognition of that instrument.
The ASU also replaces the current accounting model for purchased credit impaired loans and debt securities. The allowance for credit losses for purchased financial assets with a more-than-insignificant amount of credit deterioration since origination ("PCD assets") should be determined in a similar manner to other financial assets measured on an amortized cost basis. Upon initial recognition, the allowance for credit losses is added to the purchase price ("gross up approach") to determine the initial amortized cost basis. The subsequent accounting for PCD assets will use the CECL model described above.
The ASU made certain targeted amendments to the existing impairment model for available-for-sale (AFS) debt securities. For an AFS debt security for which there is neither the intent nor a more-likely-than-not requirement to sell, an entity will record credit losses as an allowance rather than a write-down of the amortized cost basis.
For the Company, the provisions of this ASU are effective for fiscal years beginning after December 15, 2019,2022, including interim periods within those fiscal years. Early adoption is permitted for all entities as of the fiscal year beginning after December 15, 2018, including interim periods within those fiscal years.
The Company is currently evaluatinghas completed the initial analysis of its financial assets and will continue to build and validate the CECL models in 2020 to evaluate the impact of the pending adoption of the new standard on its consolidated financial statements.
ASU Update 2016-02 - Leases
In February 2016, the FASB issued ASU 2016-02 "Leases." From the lessee's perspective, the new standard establishes a right- of-use ("ROU") model that requires a lessee to record a ROU asset and a lease liability on the balance sheet for all leases with terms longer than 12 months. Leases will be classified as either finance or operating, with classification affecting the pattern of expense recognition in the income statement for a lessee. From the lessor's perspective, the new standard requires a lessor to classify leases as either sales-type, finance or operating. A lease will be treated as a sale if it transfers all of the risks and rewards, as well as control of the underlying asset, to the lessee. If risks and rewards are conveyed without the transfer of control, the lease is treated as a financing. If the lessor doesn’t convey risks and rewards or control, an operating lease results.
The new standard is effective for fiscal years beginning after December 15, 2018, including interim periods within those fiscal years. A modified retrospectiveThe Company adopted Topic 842 in the first quarter of 2019 utilizing the optional transition approach is required for lessees for capital and operating leases existing at, or entered into after,method as provided by ASU 2018-11. Under the beginning ofoptional transition method, only the earliest comparativemost recent period presented inwill reflect the financial statements,adoption with certain practical expedients available. A modified retrospective transition approach is required for lessors for sales-type, direct financinga cumulative-effect adjustment to the opening balance of retained earnings and operating leases existing at, or entered into after, the beginningcomparative prior periods will be presented under the previous guidance of the earliest comparative period presented in the financial statements, with certain practical expedients available.Topic 840.
The new guidance includes a number of optional transition-related practical expedients. The Company is currently completing an evaluationelected to apply the practical expedients that relate to: the identification and classification of allleases that commenced before January 1, 2019 and the initial direct costs of its leases to determine the potential impact on the Company's consolidated financial statements as a result of this new standard.these leases.
ASU Update 2016-01 - Financial Instruments-Overall: Recognition and MeasurementThe election of Financial Assets and Financial Liabilities
Inthese practical expedients allows the Company to continue to account for these leases that commenced before January 2016, the FASB issued ASU 2016-01 "Financial Instruments-Overall: Recognition and Measurement of Financial Assets and Financial Liabilities." The guidance in the ASU, among other things, requires equity investments, with certain exceptions, to be measured at fair value with changes in fair value recognized in net income; simplifies the impairment assessment of equity investments without readily determinable fair values by requiring a qualitative assessment to identify impairment; eliminates the requirement for public business entities to disclose the methods and significant assumptions used to estimate the fair value that is required to be disclosed for financial instruments measured at amortized cost on the balance sheet; requires public business entities to use the exit price notion when measuring the fair value of financial instruments for disclosure purposes; requires an entity to present separately in other comprehensive income, the portion of the change in fair value of a liability resulting from a change in the instrument-specific credit risk when the entity has elected to measure the liability at fair value1, 2019 in accordance with previous GAAP. All of the fair value option for financial instruments; requires separate presentation of financial assetsCompany’s leases that commenced before January 1, 2019 were operating leases and financial liabilities by measurement category and form of financial assetthe lease expense will continue to be recognized based on the balance sheet orterms of the accompanying notes toleases, except that a right-of-use asset and a lease liability will be recognized for each operating lease at each reporting date based on the financial statements; and clarifies that an entity should evaluatepresent value of the need for a valuation allowance on a deferred tax asset related to available-for-sale securities.
For the Company, the guidance in this ASU is effective for fiscal years beginning after December 15, 2017, including interim periods within those fiscal years.remaining minimum lease payments.
The Company has determined16 leases for real property, which includes leases for 13 of its branch offices and leases for 3 offices that are used for general office space. All of the real property leases include one or more options to extend the lease term. NaN of the leases for branch offices are a lease for the land under the building and the Company owns the leasehold improvements. The Company also has 13 leases for office equipment, which are primarily copier/printers.
For purposes of adopting Topic 842, the Company assumed in general that it would exercise the next lease extension for each real estate lease so that it would have the use of the property for at least a 5 to 10 year future period. With respect to one lease for land, the Company assumed that it would exercise all extensions covering a 25 year period because of the significance of the leasehold improvements. None of the equipment leases include extensions and generally have three to five year terms.
Due to the significance of the leases for real estate and the assumption regarding the exercise of the extensions for one land lease, the adoption of this guidance will not haveTopic 842 results in the recognition of a material impact on its consolidated financial statements.significant lease liability and ROU asset.
ASU 2014-9 -Revenue from Contracts with Customers (Topic 606)
In May 2014,Upon adoption on January 1, 2019, the FASB issued ASU 2014-9, deferred by ASU 2015-14, “Revenue from Contracts with Customers (Topic 606).” The amendments in this update establishCompany recognized a comprehensive revenue recognition standard for virtually all industries under U.S. GAAP, including those that previously followed industry specific guidance such as the real estate, construction and software industries. The revenue standard's core principle is built on the contract between a vendorlease liability of approximately $16.2 million and a customer forROU asset of $15.7 million. If the provision of goods and services. It attempts to depict the exchange of rights and obligations between the partiesincrease in the pattern of revenue recognition based on the consideration to which the vendor is entitled. To accomplish this objective, the standard requires five basic steps: (1) identify the contract with the customer, (2) identify the performance obligations in the contract, (3) determine the transaction price, (4) allocate the transaction priceassets due to the performance obligationsrecognized ROU asset had been included in assets at December 31, 2018, the contract and (5) recognize revenue when (or as) the entity satisfies a performance obligation.
In December 2016,Company’s regulatory capital ratios for CET 1 risk-based capital, Tier 1 risk-based capital, total risk-based capital, and leverage capital ratios would have been 10.57%, 12.22%, 12.98%, and 11.73%, respectively.
(2) Acquisition of Shore Community Bank
On November 8, 2019, the FASB issued ASU 2016-20 "Technical Corrections and Improvements to Topic 606, Revenue from Contracts with Customers," amending the new revenue recognition standard that it jointly issued with the International Accounting Standards Board ("IASB") in 2014. The amendments do not change the core principlesCompany completed its acquisition of 100 percent of the standard, but clarify certain narrow aspectsshares of common stock of Shore Community Bank ("Shore"), which merged with and into the Bank. The shareholders of Shore received total consideration of $54.3 million, which was comprised of 1,509,275 shares of common stock of the standard, including its scope, contract cost accounting, disclosures, illustrative examplesCompany with a market value of $29.2 million and other matters. The ASU becomes effective concurrently with ASU 2014-09 "Revenue from Contracts with Customers (Topic 606)."cash of $25.1 million, of which $925,000 was cash paid in exchange for unexercised outstanding stock options.
The Company's revenue is comprisedmerger was accounted for under the acquisition method of primarily interest income on interest-earningaccounting, and accordingly, assets less interest expense on interest-bearingacquired, liabilities assumed and non-interest income.consideration exchanged were recorded at preliminary estimated fair values as of the Shore merger date. The scopeexcess of this guidance excludesthe fair value of the consideration paid over the preliminary net interest income as well as other revenues associated with financialfair value of Shore's assets and liabilities (suchresulted in the recognition of goodwill of $23.2 million. Shore’s results of operations have been included in the Company’s Consolidated Statements of Income since November 8, 2019.
The assets acquired and liabilities assumed in the merger were recorded at their estimated fair values based on management’s best estimates, using information available at the date of the merger, including the use of third party valuation specialists. The fair values are preliminary estimates and subject to adjustment for up to one year after the closing date of the merger.
The following table summarizes the estimated fair value of the acquired assets and liabilities assumed:
|
| | | |
| (Dollars in thousands) | Amount |
| Consideration paid: | |
| Company stock issued | $ | 29,175 |
|
| Cash payment | 24,233 |
|
| Cash payment for unexercised outstanding stock options | 925 |
|
| Total consideration paid | $ | 54,333 |
|
| | |
| | |
| Recognized amounts of identifiable assets acquired and liabilities assumed at fair value: | |
| Cash and cash equivalents | $ | 32,599 |
|
| Investment securities available for sale | 26,440 |
|
| Loans | 205,833 |
|
| Premises and equipment, net | 4,433 |
|
| Core deposit intangible asset | 1,467 |
|
| Bank-owned life insurance | 7,250 |
|
| Right-of-use assets | 3,226 |
|
| Accrued interest receivable | 778 |
|
| Other real estate owned | 605 |
|
| Other assets | 2,518 |
|
| Deposits | (249,836 | ) |
| Lease liability | (3,226 | ) |
| Other liabilities | (948 | ) |
| Total identifiable assets and liabilities, net | $ | 31,139 |
|
| | |
| Goodwill recorded from Shore merger | $ | 23,194 |
|
Accounting Standards Codification (“ASC”) Topic 805-10 provides that if the initial accounting for a business combination is incomplete by the end of the reporting period in which the combination occurs, the acquirer shall report, in its financial statements, provisional amounts for the items for which the accounting is incomplete. During the measurement period, the acquirer shall retrospectively adjust the provisional amounts recognized at the acquisition date and may recognize additional assets or liabilities
to reflect new information obtained from facts and circumstances that existed as gainsof the acquisition date that, if known, would have affected the measurement of the amounts recognized as of that date. The measurement period may not exceed one year from the acquisition date.
Investments were recorded at fair value, utilizing quoted market prices on nationally recognized exchanges (Level 1) or by using Level 2 inputs. For Level 2 securities, the Company obtained fair value measurements from an independent pricing service. The fair value measurements consider observable data that may include dealer quotes, market spreads, cash flows, the U.S. Treasury yield curve, live trading levels, trade execution data, market consensus prepayments speeds, credit information and the security’s terms and conditions, among other things.
Loans acquired in the Shore merger were recorded at fair value and subsequently accounted for in accordance with ASC Topic 310. The fair values of loans acquired were estimated, utilizing cash flow projections based on the saleremaining maturity and repricing terms. Cash flows were adjusted for estimated future credit losses of approximately $3.6 million and estimated prepayments. Projected cash flows were then discounted to present value, utilizing a risk-adjusted market rate for similar loans that management determined market participants would likely use.
At the Shore merger date, the Company recorded $201.3 million of loans loan feeswithout evidence of credit quality deterioration and loan servicing fees), including$4.6 million of loans leases and securities. Accordingly, a significant portionwith evidence of credit quality deterioration.
The following table summarizes the composition of the Company's revenues will not be affected.loans acquired and recorded at fair value:
|
| | | | | | | | | | | | |
| | At November 8, 2019 |
| (Dollars in thousands) | Loans acquired with no credit quality deterioration | Loans acquired with credit quality deterioration | Total |
| Commercial | | | |
| Construction | $ | 9,733 |
| | $ | — |
| | $ | 9,733 |
| |
| Commercial real estate | 135,482 |
| | 4,071 |
| | 139,553 |
| |
| Commercial business | 12,027 |
| | — |
| | 12,027 |
| |
| Residential real estate | 36,849 |
| | 500 |
| | 37,349 |
| |
| Consumer | 7,171 |
| | — |
| | 7,171 |
| |
| Total loans | $ | 201,262 |
| | $ | 4,571 |
| | $ | 205,833 |
| |
The following is a summary of the loans acquired with evidence of deteriorated credit quality in the Shore merger as of the date of the closing of the merger:
|
| | | |
| (Dollars in thousands) | Acquired Credit Impaired Loans |
| Contractually required principal and interest at acquisition | $ | 7,584 |
|
| Contractual cash flows not expected to be collected (non-accretable difference) | 2,355 |
|
| | |
| Expected cash flows at acquisition | 5,229 |
|
| Interest component of expected cash flows (accretable difference) | 658 |
|
| | |
| Fair value of acquired loans | $ | 4,571 |
|
Bank-owned life insurance was recorded at the cash surrender value of the insurance policies, which approximates the redemption value of the policies.
The Company has decidedrecorded a core deposit intangible asset related to usea value ascribed to demand, interest checking, money market and savings account, referred to as core deposits, acquired as part of the modified retrospective methodacquisition. The value assigned to adopt the guidance.acquired core deposits represents the future economic benefit of the potential cost savings from acquiring the core deposits, net of operating expenses and including ancillary fee income, compared to the cost of obtaining alternative funds from available market sources. Management used estimates including the expected attrition rates of depository accounts, future interest rate levels, and the cost of servicing
various depository products. The core deposit intangible asset totaled $1.5 million and is being amortized over its estimated useful life of approximately 10 years, using an accelerated method.
The following table presents the projected amortization of the core deposit intangible asset for each period:
|
| | | |
| (Dollars in thousands) | Amount |
| Year | |
| 2019 | $ | 44 |
|
| 2020 | 262 |
|
| 2021 | 236 |
|
| 2022 | 209 |
|
| 2023 | 182 |
|
| Thereafter | 534 |
|
| Total | $ | 1,467 |
|
The fair values of deposit liabilities with no stated maturities, such as checking, money market and savings accounts, were assumed to equal the carrying value amounts since these deposits are payable on demand. The fair values of certificates of deposit represent the present value of contractual cash flows discounted at market rates for similar certificates of deposit.
Direct costs related to the Shore merger were expensed as incurred. For the year ended December 31, 2017, approximately 85%2019, the Company incurred $1.7 million of revenue was comprisedexpenses for termination of interest income oncontracts, legal and financial assetsadvisory fees, severance and earnings on bank-owned life insurance,other integration related expenses, which are explicitlyhave been separately stated as merger-related expenses in the Company’s Consolidated Statements of Income.
Supplemental Pro Forma Financial Information
The following table presents financial information regarding the former Shore operations included in the Company’s Consolidated Statements of Income from the date of the Shore Merger (November 8, 2019) through December 31, 2019 under the column “Actual from Acquisition Date to December 31, 2019.” In addition, the table presents unaudited condensed pro forma financial information assuming that the Shore Merger had been completed as of January 1, 2019 and January 1, 2018, respectively. In the table, merger-related expenses of $4.2 million of both the Bank and Shore were excluded from the scopepro forma non-interest expenses for the year ended December 31, 2019. There were 0 merger-related expenses incurred in 2018. Income taxes were also adjusted to exclude income tax benefits of ASU 2014-09. The Company has reviewed contracts potentially affected by the ASU, including service fees on deposits and ATM and debit card fees, and has not identified any material changes$394,000 related to the timing or amountmerger expenses for the year ended December 31, 2019.
The table has been prepared for comparative purposes only and is not necessarily indicative of its revenue recognition. The Company adopted the provisionsactual results that would have been attained had the Shore Merger occurred as of this guidance on January 1, 2018, which didthe beginning of the periods presented, nor is it indicative of future results. Furthermore, the unaudited pro forma financial information does not reflect management’s estimate of any revenue-enhancing opportunities nor anticipated cost savings that may have a material impact on its financial statements. There are expanded disclosure requirementsoccurred as a result of this ASU,the integration and consolidation of Shore’s operations. The pro forma financial information reflects adjustments related to certain merger expenses and the related income tax effects.
|
| | | | | | | | | | | |
| (Dollars in thousands) | Actual from Acquisition Date to 12/31/2019 | | Pro Forma for the Twelve Months Ended 12/31/2019 | | Pro Forma for the Twelve Months Ended 12/31/2018 |
| Net interest income | $ | 1,428 |
| | $ | 54,774 |
| | $ | 53,115 |
|
| Non-interest income | 23 |
| | 8,714 |
| | 8,851 |
|
| Non-interest expenses | 516 |
| | 39,265 |
| | 40,032 |
|
| Income taxes | 252 |
| | 5,445 |
| | 5,884 |
|
| Net income | 682 |
| | 18,778 |
| | 16,050 |
|
Acquisition of New Jersey Community Bank
On April 11, 2018, the Company completed the merger of New Jersey Community Bank (“NJCB”) with and into the Bank (the “NJCB Merger”). The shareholders of NJCB received total consideration of $8.6 million, which will notwas comprised of 249,785 shares of common stock of the Company with a market value of $5.5 million and cash consideration of $3.1 million, of which $401,000 was placed in escrow to cover costs and expenses, including settlement costs, if any, resulting from a certain litigation matter. In
June 2019, the Company reached a settlement in the litigation matter. The escrow balance of approximately $393,000, net of costs and expenses, was paid out to the former NJCB shareholders in the third quarter of 2019.
The NJCB Merger was accounted for under the acquisition method of accounting, and, accordingly, assets acquired, liabilities assumed and consideration exchanged were recorded at preliminary estimated fair values as of the acquisition date. NJCB’s results of operations have a material impactbeen included in the Company’s Consolidated Statements of Income since April 11, 2018.
The assets acquired and liabilities assumed in the NJCB Merger were recorded at their fair values based on management’s best estimates, using information available at the Company's financial statements.date of the NJCB Merger, including the use of third-party valuation specialists.
The following table summarizes the fair value of the acquired assets and liabilities assumed:
|
| | | |
| (Dollars in thousands) | Amount |
| Consideration paid: | |
| Company stock issued | $ | 5,494 |
|
| Cash payment | 2,668 |
|
| Cash held in escrow | 401 |
|
| Total consideration paid | $ | 8,563 |
|
| | |
| | |
| Recognized amounts of identifiable assets acquired and liabilities assumed at fair value: | |
| Cash and cash equivalents | $ | 2,073 |
|
| Investment securities available for sale | 11,173 |
|
| Loans | 75,144 |
|
| Premises and equipment, net | 1,120 |
|
| Core deposit intangible asset | 80 |
|
| Bank-owned life insurance | 3,972 |
|
| Accrued interest receivable | 259 |
|
| Other real estate owned | 1,230 |
|
| Other assets | 1,601 |
|
| Deposits | (87,223 | ) |
| Other liabilities | (636 | ) |
| Total identifiable assets and liabilities, net | $ | 8,793 |
|
| | |
| Gain from bargain purchase | $ | 230 |
|
2.3. Investment Securities
A summary of amortized cost and fair value of investment securities available for sale as of December 31, 20172019 and 20162018 follows:
|
| | | | | | | | | | | | | | | |
| | 2017 |
| | | | Gross | | Gross | | |
| | Amortized | | Unrealized | | Unrealized | | Fair |
| (In thousands) | Cost | | Gains | | Losses | | Value |
| U.S. Treasury securities and obligations of U.S. Government | | | | | | | |
| sponsored corporations (“GSE”) | $ | 1,997 |
| | $ | — |
| | $ | (30 | ) | | $ | 1,967 |
|
| Residential collateralized mortgage obligations- GSE | 27,688 |
| | 18 |
| | (381 | ) | | 27,325 |
|
| Residential mortgage backed securities – GSE | 14,231 |
| | 129 |
| | (72 | ) | | 14,288 |
|
| Obligations of state and political subdivisions | 19,575 |
| | 227 |
| | (82 | ) | | 19,720 |
|
| Trust preferred debt securities – single issuer | 2,481 |
| | — |
| | (132 | ) | | 2,349 |
|
| Corporate debt securities | 27,917 |
| | 14 |
| | (248 | ) | | 27,683 |
|
| Other debt securities | 12,140 |
| | 12 |
| | (26 | ) | | 12,126 |
|
| | $ | 106,029 |
| | $ | 400 |
| | $ | (971 | ) | | $ | 105,458 |
|
|
| | | | | | | | | | | | | | | |
| | 2019 |
| | | | Gross | | Gross | | |
| | Amortized | | Unrealized | | Unrealized | | Fair |
| (In thousands) | Cost | | Gains | | Losses | | Value |
| U.S. Treasury securities and obligations of U.S. Government sponsored corporations (“GSE”) | $ | 774 |
| | $ | — |
| | $ | (10 | ) | | $ | 764 |
|
| Residential collateralized mortgage obligations - GSE | 53,223 |
| | 194 |
| | (242 | ) | | 53,175 |
|
| Residential mortgage backed securities - GSE | 18,100 |
| | 292 |
| | (5 | ) | | 18,387 |
|
| Obligations of state and political subdivisions | 33,177 |
| | 342 |
| | — |
| | 33,519 |
|
| Trust preferred debt securities – single issuer | 1,492 |
| | — |
| | (50 | ) | | 1,442 |
|
| Corporate debt securities | 23,224 |
| | 139 |
| | (84 | ) | | 23,279 |
|
| Other debt securities | 25,378 |
| | 80 |
| | (242 | ) | | 25,216 |
|
| | $ | 155,368 |
| | $ | 1,047 |
| | $ | (633 | ) | | $ | 155,782 |
|
| | | | 2016 | 2018 |
| | | | Gross | | Gross | | | | | Gross | | Gross | | |
| | Amortized | | Unrealized | | Unrealized | | Fair | Amortized | | Unrealized | | Unrealized | | Fair |
| (In thousands) | Cost | | Gains | | Losses | | Value | Cost | | Gains | | Losses | | Value |
U. S. Treasury securities and obligations of U.S. Government sponsored corporations (“GSE”) | $ | 3,514 |
| | $ | — |
| | $ | (35 | ) | | $ | 3,479 |
| |
| U.S. Treasury securities and obligations of U.S. Government sponsored corporations (“GSE”) | | $ | 2,993 |
| | $ | — |
| | $ | (41 | ) | | $ | 2,952 |
|
| Residential collateralized mortgage obligations - GSE | 22,647 |
| | 58 |
| | (145 | ) | | 22,560 |
| 48,789 |
| | 70 |
| | (676 | ) | | 48,183 |
|
| Residential mortgage backed securities – GSE | 31,207 |
| | 388 |
| | (119 | ) | | 31,476 |
| |
| Residential mortgage backed securities - GSE | | 13,945 |
| | 37 |
| | (100 | ) | | 13,882 |
|
| Obligations of state and political subdivisions | 21,604 |
| | 152 |
| | (356 | ) | | 21,400 |
| 23,506 |
| | 85 |
| | (249 | ) | | 23,342 |
|
| Trust preferred debt securities – single issuer | 2,478 |
| | — |
| | (206 | ) | | 2,272 |
| 1,490 |
| | — |
| | (161 | ) | | 1,329 |
|
| Corporate debt securities | 21,963 |
| | 10 |
| | (205 | ) | | 21,768 |
| 28,323 |
| | — |
| | (1,037 | ) | | 27,286 |
|
| Other debt securities | 845 |
| | — |
| | (6 | ) | | 839 |
| 15,383 |
| | 11 |
| | (146 | ) | | 15,248 |
|
| | $ | 104,258 |
| | $ | 608 |
| | $ | (1,072 | ) | | $ | 103,794 |
| $ | 134,429 |
| | $ | 203 |
| | $ | (2,410 | ) | | $ | 132,222 |
|
A summary of amortized cost, carrying value and fair value of investment securities held to maturity as of December 31, 20172019 and 20162018 follows:
| | | | 2017 | 2019 |
| (In thousands) | Amortized Cost | | Other-Than- Temporary Impairment Recognized In Accumulated Other Comprehensive Loss | | Carrying Value | | Gross Unrealized Gains | | Gross Unrealized Losses | | Fair Value | Amortized Cost | | Other-Than- Temporary Impairment Recognized In Accumulated Other Comprehensive Loss | | Carrying Value | | Gross Unrealized Gains | | Gross Unrealized Losses | | Fair Value |
U. S. Treasury securities and obligations of U.S. Government sponsored corporations (“GSE”) | $ | 3,234 |
| | $ | — |
| | $ | 3,234 |
| | $ | — |
| | $ | (84 | ) | | $ | 3,150 |
| |
Residential collateralized mortgage obligations – GSE | 8,701 |
| | — |
| | 8,701 |
| | 94 |
| | (123 | ) | | 8,672 |
| |
| Residential collateralized mortgage obligations - GSE | | $ | 5,117 |
| | $ | — |
| | $ | 5,117 |
| | $ | 76 |
| | $ | (35 | ) | | $ | 5,158 |
|
Residential mortgage backed securities - GSE | 34,072 |
| | — |
| | 34,072 |
| | 231 |
| | (127 | ) | | 34,176 |
| 36,528 |
| | — |
| | 36,528 |
| | 481 |
| | (54 | ) | | 36,955 |
|
| Obligations of state and political subdivisions | 63,797 |
| | — |
| | 63,797 |
| | 1,224 |
| | (35 | ) | | 64,986 |
| 32,533 |
| | — |
| | 32,533 |
| | 690 |
| | (25 | ) | | 33,198 |
|
| Trust preferred debt securities - pooled | 657 |
| | (501 | ) | | 156 |
| | 418 |
| | — |
| | 574 |
| 657 |
| | (492 | ) | | 165 |
| | 479 |
| | — |
| | 644 |
|
| Other debt securities | 307 |
| | — |
| | 307 |
| | — |
| | — |
| | 307 |
| 2,277 |
| | — |
| | 2,277 |
| | — |
| | (9 | ) | | 2,268 |
|
| | $ | 110,768 |
| | $ | (501 | ) | | $ | 110,267 |
| | $ | 1,967 |
| | $ | (369 | ) | | $ | 111,865 |
| $ | 77,112 |
| | $ | (492 | ) | | $ | 76,620 |
| | $ | 1,726 |
| | $ | (123 | ) | | $ | 78,223 |
|
|
| | | | | | | | | | | | | | | | | | | | | | | |
| | 2016 |
| (In thousands) | Amortized Cost | | Other-Than- Temporary Impairment Recognized In Accumulated Other Comprehensive Loss | | Carrying Value | | Gross Unrealized Gains | | Gross Unrealized Losses | | Fair Value |
| Obligations of U.S. Government sponsored corporations (“GSE”) | $ | 3,727 |
| | $ | — |
| | $ | 3,727 |
| | $ | — |
| | $ | (116 | ) | | $ | 3,611 |
|
Residential collateralized mortgage obligations – GSE | 11,882 |
| | — |
| | 11,882 |
| | 247 |
| | (130 | ) | | 11,999 |
|
Residential mortgage backed securities - GSE | 40,565 |
| | — |
| | 40,565 |
| | 540 |
| | (113 | ) | | 40,992 |
|
Obligations of state and political subdivisions
| 70,017 |
| | — |
| | 70,017 |
| | 1,274 |
| | (255 | ) | | 71,036 |
|
Trust preferred debt securities - pooled | 657 |
| | (501 | ) | | 156 |
| | 303 |
| | — |
| | 459 |
|
| Other debt securities | 463 |
| | — |
| | 463 |
| | — |
| | (1 | ) | | 462 |
|
| | $ | 127,311 |
| | $ | (501 | ) | | $ | 126,810 |
| | $ | 2,364 |
| | $ | (615 | ) | | $ | 128,559 |
|
|
| | | | | | | | | | | | | | | | | | | | | | | |
| | 2018 |
| (In thousands) | Amortized Cost | | Other-Than- Temporary Impairment Recognized In Accumulated Other Comprehensive Loss | | Carrying Value | | Gross Unrealized Gains | | Gross Unrealized Losses | | Fair Value |
| Residential collateralized mortgage obligations - GSE | $ | 6,701 |
| | $ | — |
| | $ | 6,701 |
| | $ | 30 |
| | $ | (143 | ) | | $ | 6,588 |
|
| Residential mortgage backed securities - GSE | 31,343 |
| | — |
| | 31,343 |
| | 84 |
| | (346 | ) | | 31,081 |
|
| Obligations of state and political subdivisions | 38,494 |
| | — |
| | 38,494 |
| | 634 |
| | (118 | ) | | 39,010 |
|
| Trust preferred debt securities - pooled | 657 |
| | (501 | ) | | 156 |
| | 569 |
| | — |
| | 725 |
|
| Other debt securities | 2,878 |
| | — |
| | 2,878 |
| | — |
| | (78 | ) | | 2,800 |
|
| | $ | 80,073 |
| | $ | (501 | ) | | $ | 79,572 |
| | $ | 1,317 |
| | $ | (685 | ) | | $ | 80,204 |
|
At December 31, 20172019 and December 31, 2016, $98.42018, $92.2 million and $121.7$80.4 million of investment securities, respectively, were pledged to secure public funds, collateralize borrowings from the FHLB and for other purposes required or permitted by law.
During 2019 and 2018, the Company received proceeds from the calls of securities with a book value of $4.4 million and $1.4 million, respectively, and resulted in gains of $30,000 and $12,000 for the years ended December 31, 2019 and 2018, respectively.
During 2017, the Company sold securities with a book value of $8.5 million for a net gain of $129,000. Included in the sales were $1.0 million of securities that were in the held to maturity portfolio and that resulted in a gain of $36,000 for year ended December 31, 2017. All held to maturity securities sold were mortgage backed securities with a remaining book value of less than 15% of the
original principal balance at the time of purchase and, as allowed in ASC 320-10-25-14, were treated as held to maturity. There were no securities gains or losses in 2016 and 2015.
The following is a summary of the proceeds from the sales of investment securities and the associated gross gains, gross losses, and net tax expense related to proceeds on sales of investment securities for the yearyears ended December 31, 2019, 2018, and 2017.
| | | | | | | | | | 2019 | | 2018 | | 2017 |
| (In thousands) | Available for Sale | | Held to Maturity | Available for Sale | | Held to Maturity | | Available for Sale | | Held to Maturity | | Available for Sale | | Held to Maturity |
| Proceeds on sales | $ | 7,602 |
| | $ | 1,034 |
| |
| Proceeds | | $ | — |
| | $ | — |
| | $ | — |
| | $ | — |
| | $ | 7,602 |
| | $ | 1,034 |
|
| Gross gains | 120 |
| | 36 |
| — |
| | — |
| | — |
| | — |
| | 120 |
| | 36 |
|
| Gross losses | (27 | ) | | — |
| — |
| | — |
| | — |
| | — |
| | (27 | ) | | — |
|
| Net tax expense | 31 |
| | 12 |
| — |
| | — |
| | — |
| | — |
| | 38 |
| | 12 |
|
The following table sets forth certain information regarding the amortized cost, carrying value, fair value, weighted average yields and contractual maturities of the Company's investment portfolio as of December 31, 2017.2019. Expected maturities will differ from contractual maturities because borrowers may have the right to call or prepay obligations with or without call or prepayment penalties.
| | | (Dollars in thousands) | Amortized Cost | |
Fair Value | | Yield | Amortized Cost | |
Fair Value | | Yield |
| Available for sale | | | | | | | | | | |
| Due in one year or less | $ | 473 |
| | $ | 473 |
| | 1.84 | % | $ | 10,690 |
| | $ | 10,662 |
| | 2.66 | % |
| Due after one year through five years | 24,661 |
| | 24,612 |
| | 2.54 |
| 26,621 |
| | 26,824 |
| | 2.75 |
|
| Due after five years through ten years | 27,307 |
| | 27,131 |
| | 2.72 |
| 34,136 |
| | 34,193 |
| | 2.55 |
|
| Due after ten years | 53,588 |
| | 53,242 |
| | 2.69 |
| 83,921 |
| | 84,103 |
| | 2.75 |
|
| Total | $ | 106,029 |
| | $ | 105,458 |
| | 2.66 | % | $ | 155,368 |
| | $ | 155,782 |
| | 2.70 | % |
| | | | | | | | | | | |
| | Carrying Value | |
Fair Value | | Yield | Carrying Value | |
Fair Value | | Yield |
| Held to maturity | |
| | |
| | |
| |
| | |
| | |
|
| Due in one year or less | $ | 28,750 |
| | $ | 28,780 |
| | 1.89 | % | $ | 6,594 |
| | $ | 6,664 |
| | 3.88 | % |
| Due after one year through five years | 17,793 |
| | 18,419 |
| | 4.85 |
| 13,573 |
| | 13,803 |
| | 3.67 |
|
| Due after five years through ten years | 18,845 |
| | 19,235 |
| | 3.55 |
| 18,410 |
| | 18,766 |
| | 3.15 |
|
| Due after ten years | 44,879 |
| | 45,431 |
| | 3.09 |
| 38,043 |
| | 38,990 |
| | 3.11 |
|
| Total | $ | 110,267 |
| | $ | 111,865 |
| | 3.14 | % | $ | 76,620 |
| | $ | 78,223 |
| | 3.28 | % |
The following table presents gross unrealized losses on the Company's investment securities and the fair value of the related securities and length of time that the individual securities have been in a continuous unrealized loss position at December 31, 20172019 and 2016.2018.
|
| | | | | | | | | | | | | | | | | | | | | | | | | | |
| | 2019 |
| | | Less than 12 months | | 12 months or longer | | Total |
| (In thousands) | Number of Securities | | Fair Value | | Unrealized Losses | | Fair Value | | Unrealized Losses | | Fair Value | | Unrealized Losses |
| U. S. Treasury securities and obligations of U.S. Government sponsored corporations (“GSE”) | 1 |
| | $ | 764 |
| | $ | (10 | ) | | $ | — |
|
| $ | — |
| | $ | 764 |
| | $ | (10 | ) |
| Residential collateralized mortgage obligations - GSE | 39 |
| | 18,328 |
| | (138 | ) | | 13,300 |
| | (139 | ) | | 31,628 |
| | (277 | ) |
| Residential mortgage backed securities - GSE | 13 |
| | 5,505 |
| | (59 | ) | | — |
| | — |
| | 5,505 |
| | (59 | ) |
| Obligations of state and political subdivisions | 4 |
| | 2,311 |
| | (25 | ) | | 527 |
| | — |
| | 2,838 |
| | (25 | ) |
| Trust preferred debt securities -single issuer | 2 |
| | — |
| | — |
| | 1,442 |
| | (50 | ) | | 1,442 |
| | (50 | ) |
| Corporate debt securities | 4 |
| | 2,994 |
| | (5 | ) | | 7,954 |
| | (79 | ) | | 10,948 |
| | (84 | ) |
| Other debt securities | 12 |
| | 13,692 |
| | (151 | ) | | 5,598 |
| | (100 | ) | | 19,290 |
| | (251 | ) |
| Total temporarily impaired securities | 75 |
| | $ | 43,594 |
| | $ | (388 | ) | | $ | 28,821 |
| | $ | (368 | ) | | $ | 72,415 |
| | $ | (756 | ) |
|
| | | | | | | | | | | | | | | | | | | | | | | | | | |
| | 2017 |
| | | Less than 12 months | | 12 months or longer | | Total |
| (In thousands) | Number of Securities | | Fair Value | | Unrealized Losses | | Fair Value | | Unrealized Losses | | Fair Value | | Unrealized Losses |
| U. S. Treasury securities and obligations of U.S. Government sponsored corporations (“GSE”) | 2 |
| | $ | 1,967 |
| | $ | (30 | ) | | $ | 3,150 |
|
| $ | (84 | ) | | $ | 5,117 |
| | $ | (114 | ) |
Residential collateralized mortgage obligations - GSE
| 11 |
| | 19,237 |
| | (205 | ) | | 8,788 |
| | (299 | ) | | 28,025 |
| | (504 | ) |
Residential mortgage backed securities - GSE
| 35 |
| | 21,770 |
| | (141 | ) | | 3,074 |
| | (58 | ) | | 24,844 |
| | (199 | ) |
Obligations of state and political subdivisions
| 42 |
| | 11,594 |
| | (82 | ) | | 2,717 |
| | (35 | ) | | 14,311 |
| | (117 | ) |
Trust preferred debt securities -single issuer
| 4 |
| | — |
| | — |
| | 2,349 |
| | (132 | ) | | 2,349 |
| | (132 | ) |
| Corporate debt securities | 7 |
| | 11,967 |
| | (98 | ) | | 7,662 |
| | (150 | ) | | 19,629 |
| | (248 | ) |
| Other debt securities | 4 |
| | 8,840 |
| | (25 | ) | | 21 |
| | (1 | ) | | 8,861 |
| | (26 | ) |
| Total temporarily impaired securities | 105 |
| | $ | 75,375 |
| | $ | (581 | ) | | $ | 27,761 |
| | $ | (759 | ) | | $ | 103,136 |
| | $ | (1,340 | ) |
| | | | 2016 | 2018 |
| | | | Less than 12 months | | 12 months or longer | | Total | | | Less than 12 months | | 12 months or longer | | Total |
| (In thousands) | Number of Securities | | Fair Value | | Unrealized Losses | | Fair Value | | Unrealized Losses | | Fair Value | | Unrealized Losses | Number of Securities | | Fair Value | | Unrealized Losses | | Fair Value | | Unrealized Losses | | Fair Value | | Unrealized Losses |
| U.S. Treasury securities and obligations of U.S. Government sponsored corporations (GSE) | 3 |
| | $ | 7,090 |
| | $ | (151 | ) | | $ | — |
|
| $ | — |
| | $ | 7,090 |
| | $ | (151 | ) | |
| Residential collateralized mortgage obligations-GSE | 7 |
| | 17,242 |
| | (275 | ) | | — |
| | — |
| | 17,242 |
| | (275 | ) | |
| U. S. Treasury securities and obligations of U.S. Government sponsored corporations (“GSE”) | | 2 |
| | $ | 994 |
| | $ | (1 | ) | | $ | 1,958 |
|
| $ | (40 | ) | | $ | 2,952 |
| | $ | (41 | ) |
| Residential collateralized mortgage obligations - GSE | | 34 |
| | 20,756 |
| | (138 | ) | | 22,106 |
| | (682 | ) | | 42,862 |
| | (819 | ) |
| Residential mortgage backed securities - GSE | 29 |
| | 26,581 |
| | (216 | ) | | 3,542 |
| | (16 | ) | | 30,123 |
| | (232 | ) | 68 |
| | 18,393 |
| | (141 | ) | | 19,402 |
| | (305 | ) | | 37,795 |
| | (446 | ) |
| Obligations of state and political subdivisions | 74 |
| | 25,545 |
| | (611 | ) | | — |
| | — |
| | 25,545 |
| | (611 | ) | 67 |
| | 12,785 |
| | (154 | ) | | 11,638 |
| | (213 | ) | | 24,423 |
| | (367 | ) |
| Trust preferred debt securities– single issuer | 4 |
| | — |
| | — |
| | 2,272 |
| | (206 | ) | | 2,272 |
| | (206 | ) | |
| Trust preferred debt securities -single issuer | | 2 |
| | — |
| | — |
| | 1,329 |
| | (162 | ) | | 1,329 |
| | (162 | ) |
| Corporate debt securities | 6 |
| | 12,700 |
| | (204 | ) | | 1,999 |
| | (1 | ) | | 14,699 |
| | (205 | ) | 10 |
| | 8,912 |
| | (632 | ) | | 18,374 |
| | (405 | ) | | 27,286 |
| | (1,037 | ) |
| Other debt securities | 3 |
| | — |
| | — |
| | 1,276 |
| | (7 | ) | | 1,276 |
| | (7 | ) | 9 |
| | 10,943 |
| | (93 | ) | | 4,613 |
| | (130 | ) | | 15,556 |
| | (223 | ) |
| Total temporarily impaired securities | 126 |
| | $ | 89,158 |
| | $ | (1,457 | ) | | $ | 9,089 |
| | $ | (230 | ) | | $ | 98,247 |
| | $ | (1,687 | ) | 192 |
| | $ | 72,783 |
| | $ | (1,159 | ) | | $ | 79,420 |
| | $ | (1,937 | ) | | $ | 152,203 |
| | $ | (3,095 | ) |
U.S. Treasury securities and obligations of U.S. Government sponsored corporations and agencies: The unrealized losses on investments in these securities were caused by increases in market interest rates. The contractual terms of these investments do not permit the issuer to settle the securities at a price less than the par value of the investment. The Company does not intend to sell these investments and it is not more likely than not that the Company will be required to sell these investments before a market price recovery or maturity. Therefore, these investments are not considered other-than temporarily impaired.
Residential collateralized mortgage obligations and residential mortgage backed securities: The unrealized losses on investments in residential collateralized mortgage obligations and residential mortgage backed securities were caused by increases in market interest rates. The contractual cash flows of these securities are guaranteed by the issuer, primarily government or government sponsored agencies. It is expected that the securities would not be settled at a price less than the amortized cost of the investment. The Company does not intend to sell these investments and it is not more likely than not that the Company will be required to sell these investments before a market price recovery or maturity. Therefore, these investments are not considered other-than temporarily impaired.
Obligations of state and political subdivisions: The unrealized losses on investments in these securities were caused by increases in market interest rates. It is expected that the securities would not be settled at a price less than the amortized cost of the investment. None of the issuers have defaulted on interest payments. These investments are not considered to be other than temporarily impaired because the decline in fair value is attributable to changes in interest rates and not credit quality. The Company does not intend to sell these investments and it is not more likely than not that the Company will be required to sell these investments before a market price recovery or maturity. Therefore, these investments are not considered other-than temporarily impaired.
Trust preferred debt securities – single issuer: The investments in these securities are comprised of four2 corporate trust preferred securities issued by two1 large financial institutions that both mature in 2027. The contractual terms of the trust preferred securities do not allow the issuer to settle the securities at a price less than the face value of the trust preferred securities, which is greater than the amortized cost of the trust preferred securities. One of the issuersThe issuer continues to maintain an investment grade credit rating and neither has not defaulted on interest payments. The decline in fair value is attributable to the widening of interest rate spreads and the lack of an active trading market for these securities and, to a lesser degree, market concerns about the issuers’ credit quality. The Company does not intend to sell these investments and it is not more likely than not that the Company will be required to sell these investments before a market price recovery or maturity. Therefore, these investments are not considered other-than-temporarily impaired.
Corporate debt securities. The unrealized losses on investments in corporate debt securities were caused by an increase in market interest rates.rates, which includes the yield required by the market participant for the issuer's credit risk. None of the corporate issuers have defaulted on interest payments. The decline in fair value is attributable to changes in market interest rates and not credit quality.rates. The Company does not intend to sell these investments and it is not more likely than not that the Company will be required to sell these investments before a market price recovery or maturity. Therefore, these investments are not considered other-than-temporarily impaired.
Other debt securities. The unrealized losses on investments in other debt securities were caused by an increase in market interest rates, which includes the yield required by the market participant for the issuer's credit risk. None of the issuers have defaulted
on interest payments. The decline in fair value is attributable to changes in market interest rates. The Company does not intend to sell these investments and it is not more likely than not that the Company will be required to sell these investments before a market price recovery or maturity. Therefore, these investments are not considered other-than-temporarily impaired.
Trust preferred debt securities – pooled: This trust preferred debt security was issued by a two2 issuer pool (Preferred Term Securities XXV, Ltd. co-issued by Keefe, Bruyette and Woods, Inc. and First Tennessee (“PRETSL XXV”)), consisting primarily of financial institution holding companies. During 2009, the Company recognized an other-than-temporary impairment charge of $865,000, of which $364,000 was determined to be a credit loss and charged to operations and $501,000 was recognized in the other comprehensive income (loss) component of shareholders’ equity. The primary factor used to determine the credit portion of the impairment loss to be recognized in the income statement for this security was the discounted present value of projected cash flow, where that present value of cash flow was less than the amortized cost basis of the security. The present value of cash flow was developed using a model that considered performing collateral ratios, the level of subordination to senior tranches of the security and credit ratings of and projected credit defaults in the underlying collateral. Due to recovery of the cash flows underlying the security, the Company began to accrete the $501,000 of impairment charge in the other comprehensive income component in 2019. Total accretion of $9,000 was recognized in 2019 as an increase in the carrying amount of the security. On a quarterly basis, management evaluates this security to determine if any additional other-than-temporary impairment is required. As of December 31, 2017,2019, management concluded that no additional other-than-temporary impairment had occurred.
The Company regularly reviews the composition of the investment securities portfolio, taking into account market risks, the current and expected interest rate environment, liquidity needs and its overall interest rate risk profile and strategic goals.
3.4. Loans and Loans Held for Sale
The following table presents loans outstanding, by class of loan, as of December 31,
| | | | | | | | | |
| (In thousands) | 2017 | | 2016 | 2019 | | 2018 |
| Commercial real estate | $ | 308,924 |
| | $ | 242,184 |
| $ | 567,655 |
| | $ | 388,431 |
|
| Mortgage warehouse lines | 189,412 |
| | 216,259 |
| 236,672 |
| | 154,183 |
|
| Construction | 136,412 |
| | 96,035 |
| 148,939 |
| | 149,387 |
|
| Commercial business | 92,906 |
| | 99,859 |
| 139,271 |
| | 120,590 |
|
| Residential real estate | 40,494 |
| | 44,791 |
| 90,259 |
| | 47,263 |
|
| Loans to individuals | 21,025 |
| | 23,736 |
| 32,604 |
| | 22,962 |
|
| Other | 183 |
| | 207 |
| |
| Other loans | | 137 |
| | 181 |
|
| Gross Loans | 789,356 |
| | 723,071 |
| 1,215,537 |
| | 882,997 |
|
| Deferred loan costs, net | 550 |
| | 1,737 |
| 491 |
| | 167 |
|
| Total | $ | 789,906 |
| | $ | 724,808 |
| $ | 1,216,028 |
| | $ | 883,164 |
|
The Company's lending focus and business is concentrated primarily in New Jersey, particularly northern and central New Jersey.Jersey and the New York City metropolitan area. A significant portion of the total loan portfolio is secured by real estate or other collateral located in these areas.
The Company is a participant in the Small Business Administration ("SBA") Preferred Lender Program and originates loans under the program that are later sold. The Company also sells residential mortgage loans in the secondary market on a non-recourse basis, generally with the related loan servicing rights released to purchasers. Loans held for sale at December 31, 20172019 and 20162018 included $2.3$5.7 million and $14.8$2.1 million, respectively, in residential mortgage loans that the Company intends to sell under best efforts forward sales commitments providing for delivery to purchasers generally within a two month period. The estimated fair value of the derivatives of interest-rate lock commitments was $135,000$159,000 at December 31, 20172019 and $123,000$79,000 at December 31, 2016.2018.
The following table presents loans held for sale, by type of loan, as of December 31, 20172019 and 2016.2018.
| | | (In thousands) | 2017 | | 2016 | 2019 | | 2018 |
| Residential real estate | $ | 2,269 |
| | $ | 14,829 |
| $ | 5,702 |
| | $ | 2,145 |
|
| SBA | 1,985 |
| | — |
| 225 |
| | 875 |
|
| | $ | 4,254 |
| | $ | 14,829 |
| $ | 5,927 |
| | $ | 3,020 |
|
Loans sold to others and serviced by the Company are not included in the accompanying Consolidated Balance Sheets. The total amount of such loans serviced, but owned by outside investors, amounted to approximately $42.3$66.5 million and $32.6$71.7 million at December 31, 20172019 and 2016,2018, respectively. At December 31, 20172019 and 2016,2018, the carrying value, of servicing assets was $726,000$930,000 and $605,000,$991,000, respectively. The fair value of SBA servicing assets was determined using a discount rate of 10.25%10.75% on the servicing asset and 12.50% on the excess servicing and constant prepayment speeds averaging 8.50%14.93%.
The table below summarizes the changes in the related servicing assets for the years ended December 31, 20172019 and 2016.2018.
| | | (In thousands) | 2017 | | 2016 | 2019 | | 2018 |
| Balance, beginning of year | $ | 605 |
| | $ | 345 |
| $ | 991 |
| | $ | 726 |
|
| Servicing assets capitalized | 302 |
| | 377 |
| 259 |
| | 517 |
|
| Amortization expense | (181 | ) | | (117 | ) | (320 | ) | | (252 | ) |
| Balance, end of year | $ | 726 |
| | $ | 605 |
| $ | 930 |
| | $ | 991 |
|
In addition, the Company had discounts of $863,000$946,000 and $756,000$1.1 million related to the retained portion of the unsold SBA loans at December 31, 20172019 and 2016,2018, respectively.
4.5. Allowance for Loan Losses and Credit Quality Disclosures
The Company’s primary lending emphasis is the origination of commercial business and commercial real estate loans and mortgage warehouse lines of credit. Based on the composition of the loan portfolio, the primary inherent risks are deteriorating credit quality, a decline in the economy and a decline in New Jersey and New York City metropolitan area real estate market values. Any one, or a combination, of these events may adversely affect the loan portfolio and may result in increased delinquencies, loan losses and increased future provision levels.
The following table provides an aging of the loan portfolio by loan class at December 31, 20172019 and 2016:2018:
|
| | | | | | | | | | | | | | | | | | | | | | | | | | | | | | | |
| | 2019 |
| (Dollars in thousands) | 30-59 Days | | 60-89 Days | | Greater than 90 Days | | Total Past Due | | Current | | Total Loans Receivable | | Recorded Investment > 90 Days Accruing | | Nonaccrual Loans |
| Commercial real estate | $ | 238 |
| | $ | 1,927 |
| | $ | 3,882 |
| | $ | 6,047 |
| | $ | 561,608 |
| | $ | 567,655 |
| | $ | — |
| | $ | 2,596 |
|
| Mortgage warehouse lines | — |
| | — |
| | — |
| | — |
| | 236,672 |
| | 236,672 |
| | — |
| | — |
|
| Construction | — |
| | — |
| | — |
| | — |
| | 148,939 |
| | 148,939 |
| | — |
| | — |
|
| Commercial business | 381 |
| | — |
| | 330 |
| | 711 |
| | 138,560 |
| | 139,271 |
| | — |
| | 501 |
|
| Residential real estate | 2,459 |
| | 271 |
| | 677 |
| | 3,407 |
| | 86,852 |
| | 90,259 |
| | — |
| | 708 |
|
| Loans to individuals | 296 |
| | — |
| | 311 |
| | 607 |
| | 31,997 |
| | 32,604 |
| | — |
| | 692 |
|
| Other loans | — |
| | — |
| | — |
| | — |
| | 137 |
| | 137 |
| | — |
| | — |
|
| | $ | 3,374 |
| | $ | 2,198 |
| | $ | 5,200 |
| | $ | 10,772 |
| | $ | 1,204,765 |
| | 1,215,537 |
| | $ | — |
| | $ | 4,497 |
|
| Deferred loan costs, net | | | | | | | | | | | 491 |
| | | | |
| Total | | | | | | | | | | | $ | 1,216,028 |
| | | | |
|
| | | | | | | | | | | | | | | | | | | | | | | | | | | | | | | |
| | 2017 |
| (Dollars in thousands) | 30-59 Days | | 60-89 Days | | Greater than 90 Days | | Total Past Due | | Current | | Total Loans Receivable | | Recorded Investment > 90 Days Accruing | | Nonaccrual Loans |
| Commercial real estate | $ | 540 |
| | $ | — |
| | $ | 2,465 |
| | $ | 3,005 |
| | $ | 305,919 |
| | $ | 308,924 |
| | $ | — |
| | $ | 2,465 |
|
| Mortgage warehouse lines | — |
| | — |
| | — |
| | — |
| | 189,412 |
| | 189,412 |
| | — |
| | — |
|
| Construction | — |
| | $ | — |
| | — |
| | $ | — |
| | 136,412 |
| | 136,412 |
| | — |
| | — |
|
| Commercial business | 180 |
| | 545 |
| | 619 |
| | 1,344 |
| | 91,562 |
| | 92,906 |
| | — |
| | 4,212 |
|
| Residential real estate | 911 |
| | 256 |
| | 69 |
| | 1,236 |
| | 39,258 |
| | 40,494 |
| | — |
| | 69 |
|
| Loans to individuals | 119 |
| | — |
| | 116 |
| | 235 |
| | 20,790 |
| | 21,025 |
| | — |
| | 368 |
|
| Other | — |
| | — |
| | — |
| | — |
| | 183 |
| | 183 |
| | — |
| | — |
|
| | $ | 1,750 |
| | $ | 801 |
| | $ | 3,269 |
| | $ | 5,820 |
| | $ | 783,536 |
| | 789,356 |
| | $ | — |
| | $ | 7,114 |
|
| Deferred loan costs, net | | | | | | | | | | | 550 |
| | | | |
| Total | | | | | | | | | | | $ | 789,906 |
| | | | |
| | | | 2016 | 2018 |
| (Dollars in thousands) | 30-59 Days | | 60-89 Days | | Greater than 90 Days | | Total Past Due | | Current | | Total Loans Receivable | | Recorded Investment > 90 Days Accruing | | Nonaccrual Loans | 30-59 Days | | 60-89 Days | | Greater than 90 Days | | Total Past Due | | Current | | Total Loans Receivable | | Recorded Investment > 90 Days Accruing | | Nonaccrual Loans |
| Commercial real estate | $ | 741 |
| | $ | 942 |
| | $ | 2,707 |
| | $ | 4,390 |
| | $ | 237,794 |
| | $ | 242,184 |
| | $ | — |
| | $ | 3,187 |
| $ | — |
| | $ | 499 |
| | $ | 1,201 |
| | $ | 1,700 |
| | $ | 386,731 |
| | $ | 388,431 |
| | $ | — |
| | $ | 1,439 |
|
| Mortgage warehouse lines | — |
| | — |
| | — |
| | — |
| | 216,259 |
| | 216,259 |
| | — |
| | — |
| — |
| | — |
| | — |
| | — |
| | 154,183 |
| | 154,183 |
| | — |
| | — |
|
| Construction | — |
| | — |
| | 186 |
| | $ | 186 |
| | 95,849 |
| | 96,035 |
| | — |
| | 186 |
| — |
| | — |
| | — |
| | — |
| | 149,387 |
| | 149,387 |
| | — |
| | — |
|
| Commercial business | 113 |
| | 115 |
| | 790 |
| | 1,018 |
| | 98,841 |
| | 99,859 |
| | — |
| | 920 |
| 280 |
| | — |
| | 466 |
| | 746 |
| | 119,844 |
| | 120,590 |
| | — |
| | 3,532 |
|
| Residential real estate | 564 |
| | — |
| | 392 |
| | 956 |
| | 43,835 |
| | 44,791 |
| | — |
| | 544 |
| 588 |
| | — |
| | 1,156 |
| | 1,744 |
| | 45,519 |
| | 47,263 |
| | — |
| | 1,156 |
|
| Loans to individuals | — |
| | 29 |
| | 361 |
| | 390 |
| | 23,346 |
| | 23,736 |
| | 24 |
| | 337 |
| 16 |
| | 237 |
| | 263 |
| | 516 |
| | 22,446 |
| | 22,962 |
| | 55 |
| | 398 |
|
| Other | — |
| | — |
| | — |
| | — |
| | 207 |
| | 207 |
| | — |
| | — |
| |
| Other loans | | — |
| | — |
| | — |
| | — |
| | 181 |
| | 181 |
| | — |
| | — |
|
| | $ | 1,418 |
| | $ | 144 |
| | $ | 4,436 |
| | $ | 6,940 |
| | $ | 716,131 |
| | 723,071 |
| | $ | 24 |
| | $ | 5,174 |
| $ | 884 |
| | $ | 736 |
| | $ | 3,086 |
| | $ | 4,706 |
| | $ | 878,291 |
| | 882,997 |
| | $ | 55 |
| | $ | 6,525 |
|
| Deferred loan costs, net | | | | | | | | | | | 1,737 |
| | | | | | | | | | | | | | | 167 |
| | | | |
| Total | | | | | | | | | | | $ | 724,808 |
| | | | | | | | | | | | | | | $ | 883,164 |
| | | | |
As provided by ASC 310-30, the excess of cash flows expected at acquisition over the initial investment in the loan is recognized as interest income over the life of the loan. At December 31, 20172019 and 2016,2018, there were no PCI loans$5.4 million and $439,000$865,000 of PCI loans, respectively, that were not classified as non-performing loans due to the accretion of income based on their original contract terms.
Additional income before taxes amounting to $514,000, $522,000$318,000, $155,000 and $471,000$514,000 would have been recognized in 2017, 20162019, 2018 and 2015,2017, respectively, if interest on all loans had been recorded based upon their original contract terms.
Management reviews the adequacy of the allowance for loan losses on at least a quarterly basis to ensure that the provision for loan losses has been charged against earnings in an amount necessary to maintain the allowance at a level that is adequate based on management’s assessment of probable estimated losses. The Company’s methodology for assessing the adequacy of the allowance for loan losses consists of several key elements and is consistent with U.S. GAAP and interagency supervisory guidance. The allowance for loan losses methodology consists of two major components. The first component is an estimation of losses associated with individually identified impaired loans, which follows ASC Topic 310. The second major component estimates losses under ASC Topic 450, which provides guidance for estimating losses on groups of loans with similar risk characteristics. The Company’s methodology results in an allowance for loan losses which includes a specific reserve for impaired loans, an allocated reserve and an unallocated portion.
When analyzing groups of loans under ASC Topic 450, the Company follows the Interagency Policy Statement on the Allowance for Loan and Lease Losses. The methodology considers the Company’s historical loss experience adjusted for changes in trends, conditions, and other relevant factors that affect repayment of the loans as of the evaluation date. These adjustment factors, known as qualitative factors, include:
Delinquencies and non-accruals;
Portfolio quality;
Concentration of credit;
Trends in volume and type of loans;
Quality of collateral;
Policy and procedures;
Experience, ability and depth of management;
Economic trends – national and local; and
External factors – competition, legal and regulatory.
The methodology includes the segregation of the loan portfolio into loan classes with a further segregation into risk rating categories, such as special mention, substandard, doubtful, and loss. This allows for an allocation of the allowance for loan losses by loan type; however, the allowance is available to absorb any loan loss without restriction. Larger balance, non-homogeneous loans representing significant individual credit exposures are evaluated individually through the internal loan review process. It is this process that produces the watch list for loans that have indications of credit weakness. The borrower’s overall financial condition, repayment sources, guarantors and value of collateral, if appropriate, are evaluated. Based on these reviews, an estimate of probable losses for the individual larger-balance loans are determined, whenever possible, and used to establish specific loan loss reserves. In general, for non-homogeneous loans not individually assessed and for homogeneous groups, such as residential mortgages and consumer
credits, the loans are collectively evaluated based on delinquency status, loan type, and historical losses. These loan groups are then internally risk rated.
The watch list includes loans that are assigned a rating of special mention, substandard, doubtful and loss. Loans assigned a rating of special mention have potential weaknesses that deserve management’s close attention. If uncorrected, the potential weaknesses may result in deterioration of the repayment prospects. Loans classified as substandard have a well-defined weakness or weaknesses that jeopardize the liquidation of the debt. They include loans that are inadequately protected by the current sound net worth and paying capacity of the obligor or of the collateral pledged, if any. Loans classified as doubtful have all the weaknesses inherent in loans classified as substandard with the added characteristic that collection or liquidation in full, on the basis of current conditions and facts, is highly improbable. Loans rated as doubtful in whole, or in part, are placed in non-accrual status. Loans classified as a loss are considered uncollectible and are charged off against the allowance for loan losses.
The specific allowance for impaired loans is established for specific loans that have been identified by management as being impaired. These loans are considered to be impaired primarily because the loans have not performed according to payment terms and there is reason to believe that repayment of the loan principal in whole, or in part, is unlikely. The specific portion of the allowance is the total amount of potential unconfirmed losses for these individual impaired loans. To assist in determining the fair value of loan collateral, the Company often utilizes independent third party qualified appraisal firms which, in turn, employ their own criteria and assumptions that may include occupancy rates, rental rates and property expenses, among others.
The second category of reserves consists of the allocated portion of the allowance. The allocated portion of the allowance is determined by taking pools of loans outstanding that have similar characteristics and applying historical loss experience for each pool. This estimate represents the potential unconfirmed losses within the portfolio. Individual loan pools are created for commercial business loans and commercial real estate loans, construction loans, warehouse lines of credit and various types of loans to individuals. The historical loss estimation for each loan pool is then adjusted for qualitative factors such as economic trends, concentrations of credit, trends in the volume of loans, portfolio quality, delinquencies and non-accrual trends. These factors are evaluated for each class of the loan portfolio and may have positive or negative effects on the allocated allowance for the loan portfolio segment. The aggregate amount resulting from the application of these qualitative factors determines the overall risk for the portfolio and results in an allocated allowance for each of the loan segments.
The Company also maintains an unallocated allowance. The unallocated allowance is used to cover any factors or conditions which may cause a potential loan loss but are not specifically identifiable. It is prudent to maintain an unallocated portion of the allowance because no matter how detailed an analysis of potential loan losses is performed, these estimates, by definition, lack precision. Management must make estimates using assumptions and information that is often subjective and changing rapidly.
The following discusses the risk characteristics of each of our loan portfolios.
Commercial Business
The Company offers a variety of commercial loan services, including term loans, lines of credit and loans secured by equipment and receivables. A broad range of short-to-medium term commercial loans, both secured and unsecured, are made available to businesses for working capital (including inventory and receivables), business expansion (including acquisition and development of real estate and improvements) and the purchase of equipment and machinery. Commercial business loans are granted based on the borrower's
ability to generate cash flow to support its debt obligations and other cash related expenses. A borrower's ability to repay commercial business loans is substantially dependent on the success of the business itself and on the quality of its management. As a general practice, the Company takes as collateral a security interest in any available real estate, equipment, inventory, receivables or other personal property of its borrowers, although the Company occasionally makes commercial business loans on an unsecured basis. Generally, the Company requires personal guarantees of its commercial business loans to offset the risks associated with such loans.
Much of the Company's lending is in northern and central New Jersey.Jersey and New York City metropolitan area. As a result of this geographic concentration, a significant broad-based deterioration in economic conditions in New Jersey and the New York City metropolitan area could have a material adverse impact on the Company's loan portfolio. A prolonged decline in economic conditions in our market area could restrict borrowers' ability to pay outstanding principal and interest on loans when due. The value of assets pledged as collateral may decline and the proceeds from the sale or liquidation of these assets may not be sufficient to repay the loan.
Commercial Real Estate
Commercial real estate loans are made to businesses to expand their facilities and operations and to real estate operators to finance the acquisition of income producing properties. The Company's loan policy requires that borrowers have sufficient cash flow to meet
the debt service requirements and the value of the property meets the loan-to-value criteria set in the loan policy. The Company monitors loan concentrations by borrower, by type of property and by location and other criteria.
The Company's commercial real estate portfolio is largely secured by real estate collateral located in the State of New Jersey.Jersey and the New York City metropolitan area. Conditions in the real estate markets in which the collateral for the Company's loans are located strongly influence the level of the Company's non-performing loans. A decline in the New Jersey and the New York City metropolitan area real estate market could adversely affect the Company's loan portfolio. Decreases in local real estate values would adversely affect the value of property used as collateral for the Company's loans. Adverse changes in the economy also may have a negative effect on the ability of our borrowers to make timely repayments of their loans.
Construction Financing
Construction financing is provided to businesses to expand their facilities and operations and to real estate developers for the acquisition, development and construction of residential and commercial properties. First mortgage construction loans are made to developers and builders primarily for single family homes and multi-family buildings that are presold or are to be sold or leased on a speculative basis.
The Company lends to builders and developers with established relationships, successful operating histories and sound financial resources. Management has established underwriting and monitoring criteria to minimize the inherent risks of real estate construction lending. The risks associated with speculative construction lending include the borrower's inability to complete the construction process on time and within budget, the sale or rental of the project within projected absorption periods and the economic risks associated with real estate collateral. Such loans may include financing the development and/or construction of residential subdivisions. This activity may involve financing land purchases and infrastructure development (i.e., roads, utilities, etc.) as well as construction of residences or multi-family dwellings for subsequent sale by the developer/builder. Because the sale or rental of developed properties is integral to the success of developer business, loan repayment may be especially subject to the volatility of real estate market values.
Mortgage Warehouse Lines of Credit
The Company’s Mortgage Warehouse Funding Group provides revolving lines of credit that are available to licensed mortgage banking companies. The warehouse line of credit is used by the mortgage banker to originate one-to-four family residential mortgage loans that are pre-sold into the secondary mortgage market, which includes state and national banks, national mortgage banking firms, insurance companies and government-sponsored enterprises, including the Federal National Mortgage Association, the Federal Home Loan Mortgage Corporation and others. On average, an advance under the warehouse line of credit remains outstanding for a period of less than 30 days, with repayment coming directly from the sale of the loan into the secondary mortgage market. Interest and a transaction fee are collected by the Company at the time of repayment.
As a separate segment of the total portfolio, the warehouse loan portfolio is individually analyzed as a whole for allowance for loan losses purposes. Warehouse lines of credit are subject to the same inherent risks as other commercial lending, but the overall degree of risk differs. While the Company’s loss experience with this type of lending has been non-existent since the product was introduced in 2008, there are other risks unique to this lending that still must be considered in assessing the adequacy of the allowance for loan losses. These unique risks may include, but are not limited to, (i) credit risks relating to the mortgage bankers that borrow from us, (ii) the risk of intentional misrepresentation or fraud by any of such mortgage bankers, (iii) changes in the market value of mortgage loans originated by the mortgage banker, the sale of which is the expected source of repayment of the borrowings under a warehouse line of credit, due to changes in interest rates during the time in warehouse or (iv) unsalable or impaired mortgage loans so originated,
which could lead to decreased collateral value and the failure of a purchaser of the mortgage loan to purchase the loan from the mortgage banker.
Consumer
The Company’s consumer loan portfolio segment is comprised of residential real estate loans, loans to individuals and other loans. Individual loan pools are created for the various types of loans to individuals. The principal risk is the borrower becomes unemployed or has a significant reduction in income.
In general, for homogeneous groups such as residential mortgages and consumer credits, the loans are collectively evaluated based on delinquency status, loan type and historical losses. These loan groups are then internally risk rated.
The Company considers the following credit quality indicators in assessing the risk in the loan portfolio:
Consumer credit scores;
Internal credit risk grades;
Loan-to-value ratios;
Collateral; and
Collection experience.
Internal Risk Rating of Loans
The Company’s internal credit risk grades are based on the definitions currently utilized by the banking regulatory agencies. The grades assigned and their definitions are as follows, and loans graded excellent, above average, good and watch list are treated as “pass” for grading purposes:
1. Excellent - Loans that are based upon cash collateral held at the Company and adequately margined. Loans that are based upon "blue chip" stocks listed on the major stock exchanges and adequately margined.
2. Above Average - Loans to companies whose balance sheets show excellent liquidity and long-term debt is on well-spread schedules of repayment easily covered by cash flow. Such companies have been consistently profitable and have diversification in their product lines or sources of revenue. The continuation of profitable operations for the foreseeable future is likely. Management is comprised of a mix of ages, experience and backgrounds, and management succession is in place. Sources of raw materials and, for service companies, the sources of revenue are abundant. Future needs have been planned for. Character and management ability of individuals or company principals are excellent. Loans to individuals are supported by high net worths and liquid assets.
3. Good - Loans to companies whose balance sheets show good liquidity and cash flow adequate to meet maturities of long-term debt with a comfortable margin. Such companies have established profitable records over a number of years, and there has been growth in net worth. Operating ratios are in line with those of the industry, and expenses are in proper relationship to the volume of business done and the profits achieved. Management is well-balanced and competent in their responsibilities. Economic environment is favorable; however, competition is strong. The prospects for growth are good. Loans in this category do not meet the collateral requirements of loans in categories 1 and 2 above. Loans to individuals are supported by good net worth but whose supporting assets are illiquid.
3w. Watch - Included in this category are loans evidencing problems identified by Company management that require closer supervision. Such problems have not developed to the point which requires a "special mention" rating. This category also covers situations where the Company does not have adequate current information upon which credit quality can be determined. The account officer has the obligation to correct these deficiencies within 30 days from the time of notification.
4. Special Mention - A "special mention" loan has potential weaknesses that deserve management's close attention. If left uncorrected, these potential weaknesses may result in deterioration of the repayment prospects for the loan or in the Company's credit position at some future date. Special mention loans are not adversely classified and do not expose the Company to sufficient risk to warrant adverse classification.
5. Substandard - A "substandard" loan is inadequately protected by the current sound worth and paying capacity of the obligor or by the collateral pledged, if any. Loans so classified must have a well-defined weakness or weaknesses that jeopardize the liquidation of the debt. They are characterized by the distinct possibility that the Company will sustain some loss if the deficiencies are not corrected.
6. Doubtful - A loan classified as "doubtful" has all the weaknesses inherent in a loan classified as substandard with the added characteristic that the weaknesses make collection or liquidation in full, on the basis of currently known facts, conditions and values, highly questionable and improbable.
7. Loss - A loan classified as "loss" is considered uncollectible and of such little value that its continuance on the books is not warranted. This classification does not mean that the loan has absolutely no recovery or salvage value, but rather it is not practical or desireabledesirable to defer writing off this loan even though partial recovery may occur in the future.
The following table provides a breakdown of the loan portfolio by credit quality indicator at December 31, 20172019 and 2016:2018:
| | | Commercial Credit Exposure by Internally Assigned Grade | 2017 | 2019 |
| (In thousands) | Construction | | Commercial Business | | Commercial Real Estate | | Mortgage Warehouse Lines | | Residential Real Estate | Construction | | Commercial Business | | Commercial Real Estate | | Mortgage Warehouse Lines | | Residential Real Estate |
| Pass | $ | 136,180 |
| | $ | 84,746 |
| | $ | 289,203 |
| | $ | 189,412 |
| | $ | 39,539 |
| $ | 147,132 |
| | $ | 135,804 |
| | $ | 538,104 |
| | $ | 235,808 |
| | $ | 87,512 |
|
| Special Mention | 232 |
| | 3,454 |
| | 13,267 |
| | — |
| | 666 |
| — |
| | 1,990 |
| | 9,994 |
| | 864 |
| | 922 |
|
| Substandard | — |
| | 1,252 |
| | 6,454 |
| | — |
| | 289 |
| 1,807 |
| | 1,477 |
| | 19,557 |
| | — |
| | 1,825 |
|
| Doubtful | — |
| | 3,454 |
| | — |
| | — |
| | — |
| — |
| | — |
| | — |
| | — |
| | — |
|
| Total | $ | 136,412 |
| | $ | 92,906 |
| | $ | 308,924 |
| | $ | 189,412 |
| | $ | 40,494 |
| $ | 148,939 |
| | $ | 139,271 |
| | $ | 567,655 |
| | $ | 236,672 |
| | $ | 90,259 |
|
| | | Consumer Credit Exposure by Payment Activity | 2017 | 2019 |
| (In thousands) | Loans to Individuals | | Other | Loans to Individuals | | Other Loans |
| Performing | $ | 20,657 |
| | $ | 183 |
| $ | 31,912 |
| | $ | 137 |
|
| Nonperforming | 368 |
| | — |
| 692 |
| | — |
|
| Total | $ | 21,025 |
| | $ | 183 |
| $ | 32,604 |
| | $ | 137 |
|
| | | Commercial Credit Exposure by Internally Assigned Grade | 2016 | 2018 |
| (In thousands) | Construction | | Commercial Business | | Commercial Real Estate | | Mortgage Warehouse Lines | | Residential Real Estate | Construction | | Commercial Business | | Commercial Real Estate | | Mortgage Warehouse Lines | | Residential Real Estate |
| Pass | $ | 95,548 |
| | $ | 92,117 |
| | $ | 223,226 |
| | $ | 216,259 |
| | $ | 43,950 |
| $ | 146,460 |
| | $ | 104,162 |
| | $ | 366,424 |
| | $ | 152,378 |
| | $ | 45,825 |
|
| Special Mention | 301 |
| | 7,102 |
| | 14,334 |
| | — |
| | 244 |
| 2,927 |
| | 12,703 |
| | 13,317 |
| | 1,805 |
| | 103 |
|
| Substandard | 186 |
| | 611 |
| | 4,624 |
| | — |
| | 597 |
| — |
| | 3,487 |
| | 8,690 |
| | — |
| | 1,335 |
|
| Doubtful | — |
| | 29 |
| | — |
| | — |
| | — |
| — |
| | 238 |
| | — |
| | — |
| | — |
|
| Total | $ | 96,035 |
|
| $ | 99,859 |
|
| $ | 242,184 |
|
| $ | 216,259 |
|
| $ | 44,791 |
| $ | 149,387 |
|
| $ | 120,590 |
|
| $ | 388,431 |
|
| $ | 154,183 |
|
| $ | 47,263 |
|
| | | Consumer Credit Exposure by Payment Activity | 2016 | 2018 |
| (In thousands) | Loans to Individuals | | Other | Loans to Individuals | | Other Loans |
| Performing | $ | 23,375 |
| | $ | 207 |
| $ | 22,564 |
| | $ | 181 |
|
| Nonperforming | 361 |
| | — |
| 398 |
| | — |
|
| Total | $ | 23,736 |
| | $ | 207 |
| $ | 22,962 |
| | $ | 181 |
|
Impaired Loans Disclosures
Loans are considered to be impaired when, based on current information and events, it is determined that the Company will not be able to collect all amounts due according to the loan contract, including scheduled interest payments. When a loan is placed on non-accrual status, it is also considered to be impaired. Loans are placed on non-accrual status when: (1) the full collection of interest or principal becomes uncertain; or (2) they are contractually past due 90 days or more as to interest or principal payments unless the loans are both well secured and in the process of collection.
The following tables summarize the distribution of the allowance for loan losses and loans receivable by loan class and impairment method as of and for the years ended December 31, 2017, 20162019, 2018 and 2015,2017, respectively.
| | | | 2017 | 2019 |
| (Dollars in thousands) | Construction | Commercial Business | Commercial Real Estate | Mortgage Warehouse Lines | Residential Real Estate | Loans to Individuals | Other | Unallocated | Deferred Fees | Total | Construction | Commercial Business | Commercial Real Estate | Mortgage Warehouse Lines | Residential Real Estate | Loans to Individuals | Other | Unallocated | Deferred Loan Costs, Net | Total |
| Allowance for loan losses: | | |
| Beginning balance | $ | 1,204 |
| $ | 1,732 |
| $ | 2,574 |
| $ | 973 |
| $ | 367 |
| $ | 112 |
| $ | — |
| $ | 532 |
| | $ | 7,494 |
| $ | 1,732 |
| $ | 1,829 |
| $ | 3,439 |
| $ | 731 |
| $ | 431 |
| $ | 148 |
| $ | — |
| $ | 92 |
| | $ | 8,402 |
|
| Provision (credit) charged to operations | 499 |
| 2 |
| 358 |
| (121 | ) | 126 |
| (2 | ) | (13 | ) | (249 | ) | | 600 |
| (343 | ) | (76 | ) | 1,178 |
| 352 |
| (19 | ) | 38 |
| 43 |
| 177 |
| | 1,350 |
|
| Loans charged off | — |
| (61 | ) | — |
| — |
| (101 | ) | — |
| — |
| — |
| | (162 | ) | — |
| (370 | ) | (93 | ) | — |
| — |
| (7 | ) | (43 | ) | — |
| | (513 | ) |
| Recoveries of loans charged off | — |
| 47 |
| 17 |
| — |
| — |
| 4 |
| 13 |
| — |
| | 81 |
| — |
| 26 |
| — |
| — |
| — |
| 6 |
| — |
| — |
| | 32 |
|
| Ending balance | $ | 1,703 |
| $ | 1,720 |
| $ | 2,949 |
| $ | 852 |
| $ | 392 |
| $ | 114 |
| $ | — |
| $ | 283 |
| | $ | 8,013 |
| $ | 1,389 |
| $ | 1,409 |
| $ | 4,524 |
| $ | 1,083 |
| $ | 412 |
| $ | 185 |
| $ | — |
| $ | 269 |
| | $ | 9,271 |
|
| | | |
| Individually evaluated for impairment | $ | — |
| $ | 592 |
| $ | 92 |
| $ | — |
| $ | — |
| $ | — |
| $ | — |
| $ | — |
| | $ | 684 |
| $ | 8 |
| $ | 7 |
| $ | 50 |
| $ | — |
| $ | — |
| $ | — |
| $ | — |
| $ | — |
| | $ | 65 |
|
| Loans acquired with deteriorated credit quality | | — |
| 3 |
| 1 |
| — |
| — |
| — |
| — |
| — |
| — |
| 4 |
|
Collectively evaluated
for impairment | 1,703 |
| 1,128 |
| 2,460 |
| 852 |
| 392 |
| 114 |
| — |
| 283 |
| | 7,329 |
| 1,381 |
| 1,399 |
| 4,473 |
| 1,083 |
| 412 |
| 185 |
| — |
| 269 |
| | 9,202 |
|
| Ending balance | $ | 1,703 |
| $ | 1,720 |
| $ | 2,949 |
| $ | 852 |
| $ | 392 |
| $ | 114 |
| $ | — |
| $ | 283 |
| | $ | 8,013 |
| $ | 1,389 |
| $ | 1,409 |
| $ | 4,524 |
| $ | 1,083 |
| $ | 412 |
| $ | 185 |
| $ | — |
| $ | 269 |
| | $ | 9,271 |
|
| Loans receivables: | | |
| Individually evaluated for impairment | | $ | 1,807 |
| $ | 1,251 |
| $ | 6,171 |
| $ | — |
| $ | 708 |
| $ | 692 |
| $ | — |
| $ | — |
| $ | — |
| $ | 10,629 |
|
| Loans acquired with deteriorated credit quality | $ | — |
| $ | 274 |
| $ | 590 |
| $ | — |
| $ | — |
| $ | — |
| $ | — |
| $ | — |
| $ | — |
| $ | 864 |
| — |
| 334 |
| 5,419 |
| — |
| 504 |
| — |
| — |
| — |
| — |
| 6,257 |
|
| Individually evaluated for impairment | 232 |
| 4,459 |
| 5,713 |
| — |
| 69 |
| 368 |
| — |
| — |
| — |
| 10,841 |
| |
| Collectively evaluated for impairment | $ | 136,180 |
| 88,173 |
| $ | 302,621 |
| 189,412 |
| 40,425 |
| $ | 20,657 |
| 183 |
| — |
| 550 |
| 778,201 |
| 147,132 |
| 137,686 |
| 556,065 |
| 236,672 |
| 89,047 |
| 31,912 |
| 137 |
| — |
| 491 |
| 1,199,142 |
|
| Total | $ | 136,412 |
| $ | 92,906 |
| $ | 308,924 |
| $ | 189,412 |
| $ | 40,494 |
| $ | 21,025 |
| $ | 183 |
| $ | — |
| $ | 550 |
| $ | 789,906 |
| $ | 148,939 |
| $ | 139,271 |
| $ | 567,655 |
| $ | 236,672 |
| $ | 90,259 |
| $ | 32,604 |
| $ | 137 |
| $ | — |
| $ | 491 |
| $ | 1,216,028 |
|
| | | | 2016 | 2018 |
| (In thousands) | Construction | Commercial Business | Commercial Real Estate | Mortgage Warehouse Lines | Residential Real Estate | Loans to Individuals | Other | Unallocated | Deferred Fees | Total | Construction | Commercial Business | Commercial Real Estate | Mortgage Warehouse Lines | Residential Real Estate | Loans to Individuals | Other | Unallocated | Deferred Loan Costs, Net | Total |
| Allowance for loan losses: | | |
| Beginning balance | $ | 1,025 |
| $ | 2,005 |
| $ | 3,049 |
| $ | 866 |
| $ | 288 |
| $ | 109 |
| $ | — |
| $ | 218 |
| | $ | 7,560 |
| $ | 1,703 |
| $ | 1,720 |
| $ | 2,949 |
| $ | 852 |
| $ | 392 |
| $ | 114 |
| $ | — |
| $ | 283 |
| | $ | 8,013 |
|
| (Credit) provision charged to operations | 179 |
| (177 | ) | (800 | ) | 107 |
| 79 |
| (3 | ) | 1 |
| 314 |
| | (300 | ) | 29 |
| 158 |
| 920 |
| (121 | ) | 39 |
| 49 |
| 17 |
| (191 | ) | | 900 |
|
| Loans charged off | — |
| (97 | ) | (60 | ) | — |
| — |
| — |
| (1 | ) | — |
| | (158 | ) | — |
| (62 | ) | (491 | ) | — |
| — |
| (16 | ) | (17 | ) | — |
| | (586 | ) |
| Recoveries of loans charged off | — |
| 1 |
| 385 |
| — |
| — |
| 6 |
| |
| — |
| | 392 |
| — |
| 13 |
| 61 |
| — |
| — |
| 1 |
| — |
| — |
| | 75 |
|
| Ending balance | $ | 1,204 |
| $ | 1,732 |
| $ | 2,574 |
| $ | 973 |
| $ | 367 |
| $ | 112 |
| $ | — |
| $ | 532 |
| | $ | 7,494 |
| $ | 1,732 |
| $ | 1,829 |
| $ | 3,439 |
| $ | 731 |
| $ | 431 |
| $ | 148 |
| $ | — |
| $ | 92 |
| | $ | 8,402 |
|
| | | |
| Individually evaluated for impairment | $ | 7 |
| $ | 101 |
| $ | 114 |
| $ | — |
| $ | 38 |
| $ | — |
| $ | — |
| $ | — |
| | $ | 260 |
| $ | — |
| $ | 380 |
| $ | 71 |
| $ | — |
| $ | — |
| $ | — |
| $ | — |
| $ | — |
| | $ | 451 |
|
| Loans acquired with deteriorated credit quality | | — |
| — |
| 2 |
| — |
| — |
| — |
| — |
| — |
| — |
| 2 |
|
| Collectively evaluated for impairment | 1,197 |
| 1,631 |
| 2,460 |
| 973 |
| 329 |
| 112 |
| — |
| 532 |
| | 7,234 |
| 1,732 |
| 1,449 |
| 3,366 |
| 731 |
| 431 |
| 148 |
| — |
| 92 |
| | 7,949 |
|
| Ending balance | $ | 1,204 |
| $ | 1,732 |
| $ | 2,574 |
| $ | 973 |
| $ | 367 |
| $ | 112 |
| $ | — |
| $ | 532 |
| | $ | 7,494 |
| $ | 1,732 |
| $ | 1,829 |
| $ | 3,439 |
| $ | 731 |
| $ | 431 |
| $ | 148 |
| $ | — |
| $ | 92 |
| | $ | 8,402 |
|
| Loans receivable: | |
| |
| |
| |
| |
| |
| |
| |
| |
| |
| |
| |
| |
| |
| |
| |
| |
| |
| |
| |
|
| Individually evaluated for impairment | | $ | 103 |
| $ | 3,775 |
| $ | 5,093 |
| $ | — |
| $ | 1,156 |
| $ | 398 |
| $ | — |
| $ | — |
| $ | — |
| $ | 10,525 |
|
| Loans acquired with deteriorated credit quality | $ | — |
| $ | 191 |
| $ | 930 |
| $ | — |
| $ | — |
| $ | — |
| $ | — |
| $ | — |
| $ | — |
| $ | 1,121 |
| — |
| 319 |
| 1,419 |
| — |
| — |
| — |
| — |
| — |
| — |
| 1,738 |
|
| Individually evaluated for impairment | 391 |
| 947 |
| 3,817 |
| — |
| 544 |
| 337 |
| — |
| — |
| — |
| 6,036 |
| |
| Collectively evaluated for impairment | 95,644 |
| 98,721 |
| 237,437 |
| 216,259 |
| 44,247 |
| 23,399 |
| 207 |
| — |
| 1,737 |
| 717,651 |
| 149,284 |
| 116,496 |
| 381,919 |
| 154,183 |
| 46,107 |
| 22,564 |
| 181 |
| — |
| 167 |
| 870,901 |
|
| Total | $ | 96,035 |
| $ | 99,859 |
| $ | 242,184 |
| $ | 216,259 |
| $ | 44,791 |
| $ | 23,736 |
| $ | 207 |
| $ | — |
| $ | 1,737 |
| $ | 724,808 |
| $ | 149,387 |
| $ | 120,590 |
| $ | 388,431 |
| $ | 154,183 |
| $ | 47,263 |
| $ | 22,962 |
| $ | 181 |
| $ | — |
| $ | 167 |
| $ | 883,164 |
|
| | | | 2015 | 2017 |
| (In thousands) | Construction | Commercial Business | Commercial Real Estate | Mortgage Warehouse Lines | Residential Real Estate | Loans to Individuals | Other | Unallocated | Deferred Fees | Total | Construction | Commercial Business | Commercial Real Estate | Mortgage Warehouse Lines | Residential Real Estate | Loans to Individuals | Other | Unallocated | Deferred Fees | Total |
| Allowance for loan losses: | | | | |
| Beginning balance | $ | 1,215 |
| $ | 1,761 |
| $ | 2,393 |
| $ | 896 |
| $ | 197 |
| $ | 129 |
| $ | 2 |
| $ | 332 |
| | $ | 6,925 |
| $ | 1,204 |
| $ | 1,732 |
| $ | 2,574 |
| $ | 973 |
| $ | 367 |
| $ | 112 |
| $ | — |
| $ | 532 |
| | $ | 7,494 |
|
| (Credit) provision charged to operations | (190 | ) | 347 |
| 1,010 |
| (30 | ) | 91 |
| (13 | ) | (1 | ) | (114 | ) | | 1,100 |
| 499 |
| 2 |
| 358 |
| (121 | ) | 126 |
| (2 | ) | (13 | ) | (249 | ) | | 600 |
|
| Loans charged off | — |
| (116 | ) | (361 | ) | — |
| — |
| (13 | ) | (1 | ) | — |
| | (491 | ) | — |
| (61 | ) | — |
| — |
| (101 | ) | — |
| — |
| — |
| | (162 | ) |
| Recoveries of loans charged off | — |
| 13 |
| 7 |
| — |
| — |
| 6 |
| — |
| — |
| | 26 |
| — |
| 47 |
| 17 |
| — |
| — |
| 4 |
| 13 |
| — |
| | 81 |
|
| Ending balance | $ | 1,025 |
| $ | 2,005 |
| $ | 3,049 |
| $ | 866 |
| $ | 288 |
| $ | 109 |
| $ | — |
| $ | 218 |
|
| $ | 7,560 |
| $ | 1,703 |
| $ | 1,720 |
| $ | 2,949 |
| $ | 852 |
| $ | 392 |
| $ | 114 |
| $ | — |
| $ | 283 |
|
|
| $ | 8,013 |
|
| | | |
| Individually evaluated for impairment | | $ | — |
| $ | 592 |
| $ | 92 |
| $ | — |
| $ | — |
| $ | — |
| $ | — |
| $ | — |
| | $ | 684 |
|
| Collectively evaluated for impairment | | 1,703 |
| 1,128 |
| 2,857 |
| 852 |
| 392 |
| 114 |
| — |
| 283 |
| | 7,329 |
|
| Ending balance | | $ | 1,703 |
| $ | 1,720 |
| $ | 2,949 |
| $ | 852 |
| $ | 392 |
| $ | 114 |
| $ | — |
| $ | 283 |
| | $ | 8,013 |
|
| Loans receivable: | | |
| Individually evaluated for impairment | | $ | 232 |
| $ | 4,459 |
| $ | 5,713 |
| $ | — |
| $ | 69 |
| $ | 368 |
| $ | — |
| $ | — |
| $ | — |
| $ | 10,841 |
|
| Loans acquired with deteriorated credit quality | | — |
| 274 |
| 590 |
| — |
| — |
| — |
| — |
| — |
| — |
| 864 |
|
| Collectively evaluated for impairment | | 136,180 |
| 88,173 |
| 302,621 |
| 189,412 |
| 40,425 |
| 20,657 |
| 183 |
| — |
| 550 |
| 778,201 |
|
| Total | | $ | 136,412 |
| $ | 92,906 |
| $ | 308,924 |
| $ | 189,412 |
| $ | 40,494 |
| $ | 21,025 |
| $ | 183 |
| $ | — |
| $ | 550 |
| $ | 789,906 |
|
When a loan is identified as impaired, the measurement of impairment is based on the present value of expected future cash flows, discounted at the loan’s effective interest rate, except when the sole remaining source of repayment for the loan is the liquidation of
the collateral. In such cases, the current fair value of the collateral less selling costs is used. If the value of the impaired loan is less than the recorded investment in the loan, the impairment is recognized through an allowance estimate or a charge to the allowance.
The following tables summarize information regarding impaired loans receivable by loan class as of and for the years ended December 31, 2017, 20162019, 2018 and 2015,2017, respectively.
| | | | 2017 | 2019 |
| (Dollars in thousands) | Recorded Investment | | Unpaid Principal Balance | | Related Allowance | | Year to Date 2017 Average Recorded Investment | | Year to Date 2017 Interest Income Recognized | Recorded Investment | | Unpaid Principal Balance | | Related Allowance | | Year to Date 2019 Average Recorded Investment | | Year to Date 2019 Interest Income Recognized |
| With no related allowance: | | | | | | | | | | | | | | | | | | |
| Commercial: | | | | | | | | | | | | | | | | | | |
| Construction | $ | 232 |
| | $ | 232 |
| | $ | — |
| | $ | 209 |
| | $ | 12 |
| $ | — |
| | $ | — |
| | $ | — |
| | $ | 35 |
| | $ | — |
|
| Commercial business | 1,271 |
| | 1,419 |
| | — |
| | 828 |
| | 153 |
| 680 |
| | 1,971 |
| | — |
| | 916 |
| | 10 |
|
| Commercial real estate | 1,348 |
| | 1,372 |
| | — |
| | 2,772 |
| | 128 |
| 7,141 |
| | 8,204 |
| | — |
| | 2,855 |
| | 134 |
|
| Mortgage warehouse lines | — |
| | — |
| | — |
| | — |
| | — |
| — |
| | — |
| | — |
| | — |
| | — |
|
| | 2,851 |
| | 3,023 |
| | — |
| | 3,809 |
| | 293 |
| 7,821 |
| | 10,175 |
| | — |
| | 3,806 |
| | 144 |
|
| Consumer: | |
| | |
| | |
| | |
| | |
| |
| | |
| | |
| | |
| | |
|
| Residential real estate | 69 |
| | 123 |
| | — |
| | 142 |
| | — |
| 1,212 |
| | 1,465 |
| | — |
| | 1,334 |
| | 6 |
|
| Loans to individuals | 368 |
| | 438 |
| | — |
| | 342 |
| | — |
| 692 |
| | 802 |
| | — |
| | 695 |
| | — |
|
| Other | — |
| | — |
| | — |
| | — |
| | — |
| — |
| | — |
| | — |
| | — |
| | — |
|
| | 437 |
| | 561 |
| | — |
| | 484 |
| | — |
| 1,904 |
| | 2,267 |
| | — |
| | 2,029 |
| | 6 |
|
| With no related allowance | 3,288 |
|
| 3,584 |
|
| — |
|
| 4,293 |
|
| 293 |
| 9,725 |
|
| 12,442 |
|
| — |
|
| 5,835 |
|
| 150 |
|
| With an allowance: | |
| | |
| | |
| | |
| | |
| |
| | |
| | |
| | |
| | |
|
| Commercial: | |
| | |
| | |
| | |
| | |
| |
| | |
| | |
| | |
| | |
|
| Construction | — |
| | — |
| | — |
| | 86 |
| | — |
| 1,807 |
| | 1,807 |
| | 8 |
| | 602 |
| | 56 |
|
| Commercial business | 3,462 |
| | 3,464 |
| | 592 |
| | 2,864 |
| | 84 |
| 905 |
| | 993 |
| | 10 |
| | 977 |
| | 88 |
|
| Commercial real estate | 4,955 |
| | 5,748 |
| | 92 |
| | 3,005 |
| | 188 |
| 4,449 |
| | 5,757 |
| | 51 |
| | 4,621 |
| | 216 |
|
| Mortgage warehouse lines | — |
| | — |
| | — |
| | — |
| | — |
| — |
| | — |
| | — |
| | — |
| | — |
|
| | 8,417 |
|
| 9,212 |
|
| 684 |
|
| 5,955 |
|
| 272 |
| 7,161 |
|
| 8,557 |
|
| 69 |
|
| 6,200 |
|
| 360 |
|
| Consumer: | | | | | | | | | | | | | | | | | | |
| Residential real estate | — |
| | — |
| | — |
| | 75 |
| | — |
| — |
| | — |
| | — |
| | — |
| | — |
|
| Loans to individuals | — |
| | — |
| | — |
| | — |
| | — |
| — |
| | — |
| | — |
| | — |
| | — |
|
| Other | — |
| | — |
| | — |
| | — |
| | — |
| — |
| | — |
| | — |
| | 1 |
| | — |
|
| | — |
|
| — |
|
| — |
|
| 75 |
|
| — |
| — |
|
| — |
|
| — |
|
| 1 |
|
| — |
|
| With an allowance | 8,417 |
|
| 9,212 |
|
| 684 |
|
| 6,030 |
|
| 272 |
| 7,161 |
|
| 8,557 |
|
| 69 |
|
| 6,201 |
|
| 360 |
|
| | | | | | | | | | | | | | | | | | | |
| Total: | |
| | |
| | |
| | |
| | |
| |
| | |
| | |
| | |
| | |
|
Construction | 232 |
| | 232 |
| | — |
| | 295 |
| | 12 |
| 1,807 |
| | 1,807 |
| | 8 |
| | 637 |
| | 56 |
|
| Commercial business | 4,733 |
| | 4,883 |
| | 592 |
| | 3,692 |
| | 237 |
| 1,585 |
| | 2,964 |
| | 10 |
| | 1,893 |
| | 98 |
|
| Commercial real estate | 6,303 |
| | 7,120 |
| | 92 |
| | 5,777 |
| | 316 |
| 11,590 |
| | 13,961 |
| | 51 |
| | 7,476 |
| | 350 |
|
| Mortgage warehouse lines | — |
| | — |
| | — |
| | — |
| | — |
| — |
| | — |
| | — |
| | — |
| | — |
|
| Residential real estate | 69 |
| | 123 |
| | — |
| | 217 |
| | — |
| 1,212 |
| | 1,465 |
| | — |
| | 1,334 |
| | 6 |
|
| Loans to individuals | 368 |
| | 438 |
| | — |
| | 342 |
| | — |
| 692 |
| | 802 |
| | — |
| | 696 |
| | — |
|
| Other | — |
| | — |
| | — |
| | — |
| | — |
| — |
| | — |
| | — |
| | — |
| | — |
|
| | $ | 11,705 |
|
| $ | 12,796 |
|
| $ | 684 |
|
| $ | 10,323 |
|
| $ | 565 |
| $ | 16,886 |
|
| $ | 20,999 |
|
| $ | 69 |
|
| $ | 12,036 |
|
| $ | 510 |
|
| | | | December 31, 2016 | December 31, 2018 |
| (Dollars in thousands) | Recorded Investment | | Unpaid Principal Balance | | Related Allowance | | Year to Date 2016 Average Recorded Investment | | Year to Date 2016 Interest Income Recognized | Recorded Investment | | Unpaid Principal Balance | | Related Allowance | | Year to Date 2018 Average Recorded Investment | | Year to Date 2018 Interest Income Recognized |
| With no related allowance: | | | | | | | | | | | | | | | | | | |
| Commercial: | | | | | | | | | | | | | | | | | | |
| Construction | $ | 186 |
| | $ | 186 |
| | $ | — |
| | $ | 260 |
| | $ | — |
| $ | 103 |
| | $ | 103 |
| | $ | — |
| | $ | 115 |
| | $ | 7 |
|
| Commercial business | 883 |
| | 1,054 |
| | — |
| | 623 |
| | 14 |
| 992 |
| | 1,332 |
| | — |
| | 1,112 |
| | 112 |
|
| Commercial real estate | 1,380 |
| | 1,380 |
| | — |
| | 1,528 |
| | 74 |
| 2,304 |
| | 2,629 |
| | — |
| | 2,757 |
| | 48 |
|
| Mortgage warehouse lines | — |
| | — |
| | — |
| | — |
| | — |
| — |
| | — |
| | — |
| | — |
| | — |
|
| | 2,449 |
|
| 2,620 |
|
| — |
|
| 2,411 |
|
| 88 |
| 3,399 |
|
| 4,064 |
|
| — |
|
| 3,984 |
|
| 167 |
|
| Consumer: | | | | | | | | | | | | | | | | | | |
| Residential real estate | 244 |
| | 244 |
| | — |
| | 725 |
| | — |
| 1,156 |
| | 1,241 |
| | — |
| | 846 |
| | — |
|
| Loans to individuals | 337 |
| | 337 |
| | — |
| | 281 |
| | — |
| 398 |
| | 478 |
| | — |
| | 410 |
| | — |
|
| Other | — |
| | — |
| | — |
| | — |
| | — |
| — |
| | — |
| | — |
| | — |
| | — |
|
| | 581 |
| | 581 |
| | — |
| | 1,006 |
| | — |
| 1,554 |
| | 1,719 |
| | — |
| | 1,256 |
| | — |
|
| With no related allowance | 3,030 |
|
| 3,201 |
|
| — |
|
| 3,417 |
|
| 88 |
| 4,953 |
|
| 5,783 |
|
| — |
|
| 5,240 |
|
| 167 |
|
| With an allowance: | |
| | |
| | |
| | |
| | |
| |
| | |
| | |
| | |
| | |
|
| Commercial: | |
| | |
| | |
| | |
| | |
| |
| | |
| | |
| | |
| | |
|
| Construction | 205 |
| | 205 |
| | 7 |
| | 51 |
| | 9 |
| — |
| | — |
| | — |
| | — |
| | — |
|
| Commercial business | 255 |
| | 255 |
| | 101 |
| | 238 |
| | — |
| 3,102 |
| | 3,217 |
| | 380 |
| | 3,326 |
| | 44 |
|
| Commercial real estate | 3,367 |
| | 3,367 |
| | 114 |
| | 3,603 |
| | 19 |
| 4,208 |
| | 4,208 |
| | 73 |
| | 4,336 |
| | 252 |
|
| Mortgage warehouse lines | — |
| | — |
| | — |
| | — |
| | — |
| — |
| | — |
| | — |
| | — |
| | — |
|
| | 3,827 |
|
| 3,827 |
|
| 222 |
|
| 3,892 |
|
| 28 |
| 7,310 |
|
| 7,425 |
|
| 453 |
|
| 7,662 |
|
| 296 |
|
| Consumer: | | | | | | | | | | | | | | | | | | |
| Residential real estate | 300 |
| | 316 |
| | 38 |
| | 200 |
| | — |
| — |
| | — |
| | — |
| | — |
| | — |
|
| Loans to individuals | — |
| | — |
| | — |
| | — |
| | — |
| — |
| | — |
| | — |
| | — |
| | — |
|
| Other | — |
| | — |
| | — |
| | — |
| | — |
| — |
| | — |
| | — |
| | — |
| | — |
|
| | 300 |
|
| 316 |
|
| 38 |
|
| 200 |
|
| — |
| — |
|
| — |
|
| — |
|
| — |
|
| — |
|
| With an allowance | 4,127 |
| | 4,143 |
| | 260 |
| | 4,092 |
| | 28 |
| 7,310 |
| | 7,425 |
| | 453 |
| | 7,662 |
| | 296 |
|
| | | | | | | | | | | | | | | | | | | |
| Total: | |
| | |
| | |
| | |
| | |
| |
| | |
| | |
| | |
| | |
|
Construction | 391 |
| | 391 |
| | 7 |
| | 311 |
| | 9 |
| 103 |
| | 103 |
| | — |
| | 115 |
| | 7 |
|
| Commercial business | 1,138 |
| | 1,309 |
| | 101 |
| | 861 |
| | 14 |
| 4,094 |
| | 4,549 |
| | 380 |
| | 4,438 |
| | 156 |
|
| Commercial real estate | 4,747 |
| | 4,747 |
| | 114 |
| | 5,131 |
| | 93 |
| 6,512 |
| | 6,837 |
| | 73 |
| | 7,093 |
| | 300 |
|
| Mortgage warehouse lines | — |
| | — |
| | — |
| | — |
| | — |
| — |
| | — |
| | — |
| | — |
| | — |
|
| Residential real estate | 544 |
| | 560 |
| | 38 |
| | 925 |
| | — |
| 1,156 |
| | 1,241 |
| | — |
| | 846 |
| | — |
|
| Loans to individuals | 337 |
| | 337 |
| | — |
| | 281 |
| | — |
| 398 |
| | 478 |
| | — |
| | 410 |
| | — |
|
| Other | — |
| | — |
| | — |
| | — |
| | — |
| — |
| | — |
| | — |
| | — |
| | — |
|
| | $ | 7,157 |
|
| $ | 7,344 |
|
| $ | 260 |
|
| $ | 7,509 |
|
| $ | 116 |
| $ | 12,263 |
|
| $ | 13,208 |
|
| $ | 453 |
|
| $ | 12,902 |
|
| $ | 463 |
|
| | | (Dollars in thousands) | Year to Date 2015 Average Recorded Investment | | Year to Date 2015 Interest Income Recognized | Year to Date 2017 Average Recorded Investment | | Year to Date 2017 Interest Income Recognized |
| With no related allowance: | | | | | | |
| Commercial: | | | | | | |
| Construction | $ | 477 |
| | $ | 27 |
| $ | 209 |
| | $ | 12 |
|
| Commercial business | 492 |
| | 23 |
| 828 |
| | 153 |
|
| Commercial real estate | 2,998 |
| | 94 |
| 2,772 |
| | 128 |
|
| Mortgage warehouse lines | — |
| | — |
| — |
| | — |
|
| | 3,967 |
| | 144 |
| 3,809 |
| | 293 |
|
| Consumer: | | | | | | |
| Residential real estate | 981 |
| | — |
| 142 |
| | — |
|
| Loans to individuals | 88 |
| | — |
| 342 |
| | — |
|
| Other | — |
| | — |
| — |
| | — |
|
| | 88 |
| | — |
| 484 |
| | — |
|
| With no related allowance | 5,036 |
| | 144 |
| 4,435 |
| | 293 |
|
| With an allowance: | |
| | |
| |
| | |
|
| Commercial: | |
| | |
| |
| | |
|
| Construction | — |
| | — |
| 86 |
| | — |
|
| Commercial business | 307 |
| | 5 |
| 2,864 |
| | 84 |
|
| Commercial real estate | 4,200 |
| | 154 |
| 3,005 |
| | 188 |
|
| Mortgage warehouse lines | — |
| | — |
| — |
| | — |
|
| | 4,507 |
| | 159 |
| 5,955 |
| | 272 |
|
| Consumer: | | | | | | |
| Residential real estate | 100 |
| | — |
| 75 |
| | — |
|
| Loans to individuals | 175 |
| | — |
| — |
| | — |
|
| Other | — |
| | — |
| — |
| | — |
|
| | 275 |
| | — |
| 75 |
| | — |
|
| With an allowance | 4,882 |
| | 159 |
| 6,030 |
| | 272 |
|
| | | | | | | |
| Total: | |
| | |
| |
| | |
|
Construction | 477 |
| | 27 |
| 295 |
| | 12 |
|
| Commercial business | 799 |
| | 28 |
| 3,692 |
| | 237 |
|
| Commercial real estate | 7,198 |
| | 248 |
| 5,777 |
| | 316 |
|
| Mortgage warehouse lines | — |
| | — |
| — |
| | — |
|
| Residential real estate | 1,081 |
| | — |
| 217 |
| | — |
|
| Loans to individuals | 263 |
| | — |
| 342 |
| | — |
|
| Other | — |
| | — |
| — |
| | — |
|
| | $ | 9,818 |
| | $ | 303 |
| $ | 10,323 |
| | $ | 565 |
|
Purchased Credit-Impaired Loans
Purchased Credit-Impaired Loans ("PCI") are loans acquired at a discount that is due in part to credit quality. AcquiredOn November 8, 2019, as part of the Shore merger, the Company acquired purchased credit-impaired loans with loan balances totaling $2.6$6.3 million were deemed to be PCI at February 7, 2014 and were initially recorded at fair value (as determined byvalues totaling $4.6 million. On April 11, 2018, as part of the present value of expected future cash flows)NJCB merger, the Company acquired purchased credit-impaired loans with no valuation allowance (i.e., the allowance for loan losses).balances totaling $1.1 million and fair values totaling $881,000.
The following table presents additional information regarding PCI loans at December 31, 20172019 and 2016:2018:
| | | (In thousands) | 2017 | | 2016 | 2019 | | 2018 |
| Outstanding balance | $ | 998 |
| | $ | 1,470 |
| $ | 8,038 |
| | $ | 2,007 |
|
| Carrying amount | 860 |
| | 1,121 |
| 6,257 |
| | 1,738 |
|
In 2017 and 2016, no2019, $4,000 in loan loss provision was recorded for PCI loans. In 2015, a2018 and 2017, 0 loan loss provision in the amount of $64,000 was recorded for one PCI loan.loans.
The following table presents changes in accretable discount for PCI loans for the years ended December 31, 2017, 20162019, 2018 and 2015:2017:
| | | (In thousands) | 2017 | | 2016 | | 2015 | 2019 | | 2018 | | 2017 |
| Balance at beginning of year | $ | 30 |
| | $ | 73 |
| | $ | 135 |
| $ | 164 |
| | $ | 126 |
| | $ | 30 |
|
| Acquisition of impaired loans | | 658 |
| | 168 |
| | — |
|
| Transfer from non-accretable to accretable | 161 |
| | — |
| | — |
| — |
| | — |
| | 161 |
|
| Accretion of discount | (65 | ) | | (43 | ) | | (62 | ) | (165 | ) | | (130 | ) | | (65 | ) |
| Balance at end of year | $ | 126 |
| | $ | 30 |
| | 73 |
| $ | 657 |
| | $ | 164 |
| | 126 |
|
| | |
| | | | | |
| | | | |
| Non-accretable difference at end of year | $ | 26 |
| | $ | 215 |
| | $ | 215 |
| $ | 1,175 |
| | $ | 122 |
| | $ | 26 |
|
The following table presents the years for the scheduled remaining accretable discount that will accrete to income based on the Company’s most recent estimates of cash flows for PCI loans:
|
| | | | | |
| (In thousands) | Years ending December 31, |
| | 2018 | | $ | 82 |
|
| | 2019 | | 44 |
|
| | Thereafter | | — |
|
| | Total | | $ | 126 |
|
|
| | | | | |
| (In thousands) | Years ending December 31, |
| | 2020 | | $ | 365 |
|
| | 2021 | | 223 |
|
| | 2022 | | 69 |
|
| | Thereafter | | — |
|
| | Total | | $ | 657 |
|
Consumer Mortgage Loans Secured by Residential Real Estate in Process of Foreclosure
The following table summarizes the recorded investment in consumer mortgage loans secured by residential real estate in process of foreclosure:
|
| | | | | | | | | | | |
| | December 31, |
| (Dollars in thousands) | 2017 | | 2016 |
| | Number of loans | | Recorded Investment | | Number of loans | | Recorded Investment |
| | 1 | | $ | 77 |
| | 3 | | $ | 524 |
|
|
| | | | | | | | | | | |
| | December 31, |
| (Dollars in thousands) | 2019 | | 2018 |
| | Number of loans | | Recorded Investment | | Number of loans | | Recorded Investment |
| | 2 | | $ | 382 |
| | 4 | | $ | 821 |
|
In the normal course of business, the Company may consider modifying loan terms for various reasons. These reasons may include as a retention strategy to compete in the current interest rate environment or to re-amortize or extend a loan term to better match the loan’s payment stream with the borrower’s cash flow. A modified loan would be considered a troubled debt restructuring (“TDR”) if the Company grants a concession to a borrower and has determined that the borrower is troubled (i.e., experiencing financial difficulties).
If the Company restructures a loan to a troubled borrower, the loan terms (i.e., interest rate, payment, amortization period, maturity date) may be modified in various ways to enable the borrower to cover the modified debt service payments based on current financial information and cash flow adequacy. If a borrower’s hardship is thought to be temporary, then modified terms may only be offered for that time period. Where possible, the Company would attempt to obtain additional collateral and/or secondary repayment sources at the time of the restructure in order to put the Company in the best possible position if the borrower is not able to meet the modified terms. The Company will not offer modified terms if it believes that modifying the loan terms will only delay an inevitable permanent default.
In evaluating whether a restructuring constitutes a troubled debt restructuring, applicable guidance requires that a creditor must separately conclude that the restructuring constitutes a concession and the borrower is experiencing financial difficulties. The following table is a breakdown of troubled debt restructurings, all of which are classified as impaired, which occurred during the years ended December 31, 20172019 and 2016:2018:
| | | | 2017 | 2019 |
| (Dollars in thousands) | Number of Contracts | | Pre-Modification Outstanding Recorded Investment | | Post-Modification Outstanding Recorded Investment | Number of Contracts | | Pre-Modification Outstanding Recorded Investment | | Post-Modification Outstanding Recorded Investment |
| Troubled Debt Restructurings: | | | | | | | | | | |
| Commercial Real Estate | 1 |
| | $ | 2,337 |
| | $ | 2,322 |
| |
| Commercial business | | 3 |
| | $ | 597 |
| | $ | 595 |
|
| Construction | | 1 |
| | $ | 1,807 |
| | $ | 1,807 |
|
| | | | 2016 | 2018 |
| (Dollars in thousands) | Number of Contracts | | Pre-Modification Outstanding Recorded Investment | | Post-Modification Outstanding Recorded Investment | Number of Contracts | | Pre-Modification Outstanding Recorded Investment | | Post-Modification Outstanding Recorded Investment |
| Troubled Debt Restructurings: | | | | | | | | | | |
| Commercial Business | 1 |
| | $ | 458 |
| | $ | 458 |
| |
| Commercial business | | 1 |
| | $ | 135 |
| | $ | 132 |
|
| Commercial real estate | | 2 |
| | $ | 1,001 |
| | $ | 991 |
|
There were no0 troubled debt restructurings that subsequently defaulted within 12 months of restructuring during the yearyears ended December 31, 2017. There was one troubled debt restructuring in the amount of $458,000 that defaulted within twelve months of restructuring during the year ended December 31, 2016.
5.6. Related Parties
Activity related to loans to directors, executive officers and their affiliated interests during the years ended December 31, 20172019 2018 and 20162017 is as follows:
| | | (In thousands) | 2017 | | 2016 | | 2015 | 2019 | | 2018 | | 2017 |
| Balance, beginning of year | $ | 1,357 |
| | $ | 870 |
| | $ | 1,376 |
| $ | 5,805 |
| | $ | 2,719 |
| | $ | 1,357 |
|
| Loans granted | 1,603 |
| | 751 |
| | 16 |
| 3,199 |
| | 3,365 |
| | 1,603 |
|
| Repayments of loans | (241 | ) | | (264 | ) | | (522 | ) | (2,668 | ) | | (279 | ) | | (241 | ) |
| Balance, end of year | $ | 2,719 |
| | $ | 1,357 |
| | $ | 870 |
| $ | 6,336 |
| | $ | 5,805 |
| | $ | 2,719 |
|
All such loans were made under customary terms and conditions and were current as to principal and interest payments as of December 31, 2017 and 2016.
Related party deposits were $10.7$12.7 million, $12.0 million and $14.9$10.7 million at December 31, 20172019, 2018 and 2016,2017, respectively.
Rent of approximately $128,000, $126,000 and $122,000, was paid in 2019, 2018 and 2017, respectively, to an entity affiliated with a director of the Company for the lease of one of the Company’sCompany's offices.
The Company has had and intends to have business transactions in the ordinary course of business with directors, officers and affiliated interests on comparable terms as those prevailing from time to time for other non-affiliated customers of the Company. For these transactions, related expenses are not significant to the operations of the Company.
6.
7. Premises and Equipment
Premises and equipment consist of the following at December 31,
| | | (Dollars in thousands) | Estimated Useful Lives | | 2017 | | 2016 | Estimated Useful Lives | | 2019 | | 2018 |
| Land | | $ | 1,798 |
| | $ | 1,798 |
| | $ | 2,536 |
| | $ | 1,798 |
|
| Building | 40 years | | 8,083 |
| | 8,083 |
| 40 years | | 10,666 |
| | 8,340 |
|
| Leasehold improvements | 3 - 10 years | | 6,241 |
| | 5,864 |
| 3 - 10 years | | 7,721 |
| | 7,577 |
|
| Furniture, fixtures and equipment | 3 - 15 years | | 5,032 |
| | 4,794 |
| 3 - 15 years | | 6,401 |
| | 5,520 |
|
| Projects in progress | | 337 |
| | 103 |
| | 529 |
| | 24 |
|
| | | 21,491 |
| | 20,642 |
| | 27,853 |
| | 23,259 |
|
| Less: Accumulated depreciation | | 10,786 |
| | 9,969 |
| | 12,591 |
| | 11,606 |
|
| Total | | $ | 10,705 |
| | $ | 10,673 |
| | $ | 15,262 |
| | $ | 11,653 |
|
Depreciation expense was $814,000, $893,000$985,000, $820,000 and $1 million$814,000 for the years ended December 31, 2017, 20162019, 2018 and 2015,2017, respectively.
7.8. Other Real Estate Owned (“OREO”)
The following table presents the activity in other real estate owned for the years ended December 31,
| | | (In thousands) | 2017 | | 2016 | | 2015 | 2019 | | 2018 | | 2017 |
| Balance, beginning of year | $ | 166 |
| | $ | 966 |
| | $ | 5,710 |
| $ | 2,515 |
| | $ | — |
| | $ | 166 |
|
| OREO properties added | 455 |
| | 141 |
| | 2,357 |
| |
| Other real estate owned properties added | | — |
| | 1,460 |
| | 455 |
|
| Other real estate owned property acquired in NJCB merger | | — |
| | 1,230 |
| | — |
|
| Other real estate owned property acquired in Shore merger | | 605 |
| | | | |
| Sales during the year | (626 | ) | | (1,002 | ) | | (6,719 | ) | (2,549 | ) | | — |
| | (626 | ) |
| Increase (decrease) in carrying amount of real estate owned | 5 |
| | 61 |
| | (382 | ) | |
| Increase in carrying amount of other real estate owned | | — |
| | — |
| | 5 |
|
| Forfeitable deposit on other real estate owned | | — |
| | (175 | ) | | — |
|
| Balance, end of year | $ | — |
| | $ | 166 |
| | $ | 966 |
| $ | 571 |
| | $ | 2,515 |
| | $ | — |
|
The Company recorded (losses) and gains on salessale of other real estate owned of $5,000$(101,000), $0 and $31,000$5,000 for the years ended December 31, 2019, 2018 and 2017, and 2016, respectively, and losses of $692,000 for the year ended December 31, 2015.
8.9. Goodwill and Intangible Assets
The table below presents goodwill and intangible assets at December 31,
| | | (In thousands) | 2017 | | 2016 | 2019 | | 2018 |
| Beginning balance | | $ | 12,258 |
| | $ | 12,496 |
|
| Additions: | | | | |
| Goodwill | $ | 11,854 |
| | $ | 11,854 |
| 23,194 |
| | — |
|
| Core deposits intangible | 642 |
| | 1,026 |
| 1,467 |
| | 80 |
|
| Amortization expense | | (140 | ) | | (318 | ) |
| Total | $ | 12,496 |
| | $ | 12,880 |
| $ | 36,779 |
| | $ | 12,258 |
|
Amortization expense of intangible assets was $384,000, $404,000$140,000, $318,000 and $428,000$384,000 for the years ended December 31, 2019, 2018 and 2017, 2016 and 2015, respectively.
Scheduled amortization of the core deposits intangible is as follows:
|
| | | | | |
| (In thousands) | Year | | Amount |
| | 2018 | | $ | 305 |
|
| | 2019 | | 110 |
|
| | 2020 | | 88 |
|
| | 2021 | | 67 |
|
| | 2022 | | 45 |
|
| | After five years | | 27 |
|
| | | | $ | 642 |
|
|
| | | | | |
| (In thousands) | Year | | Amount |
| | 2020 | | $ | 390 |
|
| | 2021 | | 314 |
|
| | 2022 | | 263 |
|
| | 2023 | | 213 |
|
| | 2024 | | 164 |
|
| | After five years | | 388 |
|
| | | | $ | 1,732 |
|
9.10. Deposits
The following table presents the details of total deposits at December 31,
| | | | | | % of Total | | | | % of Total | | | % of Total | | | | % of Total |
| (Dollars in thousands) | 2017 | | Deposits | | 2016 | | Deposits | 2019 | | Deposits | | 2018 | | Deposits |
| Non-interest bearing | $ | 196,509 |
| | 21.31 | % | | $ | 170,854 |
| | 20.47 | % | $ | 287,555 |
| | 22.51 | % | | $ | 212,981 |
| | 22.40 | % |
| Interest bearing | 372,133 |
| | 40.36 |
| | 310,103 |
| | 37.16 |
| 393,392 |
| | 30.80 |
| | 323,503 |
| | 34.03 |
|
| Savings | 215,197 |
| | 23.34 |
| | 205,294 |
| | 24.60 |
| 259,033 |
| | 20.28 |
| | 189,612 |
| | 19.95 |
|
| Certificates of deposit | 138,167 |
| | 14.99 |
| | 148,265 |
| | 17.77 |
| 337,382 |
| | 26.41 |
| | 224,576 |
| | 23.62 |
|
| | $ | 922,006 |
| | 100.00 | % | | $ | 834,516 |
| | 100.00 | % | $ | 1,277,362 |
| | 100.00 | % | | $ | 950,672 |
| | 100.00 | % |
At December 31, 2017,2019, certificates of deposit have contractual maturities as follows:
|
| | | | | |
| (In thousands) | Year | | Amount |
| | 2018 | | $ | 76,293 |
|
| | 2019 | | 33,238 |
|
| | 2020 | | 9,418 |
|
| | 2021 | | 12,107 |
|
| | 2022 | | 7,111 |
|
| | | | $ | 138,167 |
|
|
| | | | | |
| (In thousands) | Year | | Amount |
| | 2020 | | $ | 251,852 |
|
| | 2021 | | 59,950 |
|
| | 2022 | | 19,658 |
|
| | 2023 | | 3,781 |
|
| | 2024 | | 2,141 |
|
| | | | $ | 337,382 |
|
Certificates of deposit greater than $250,000 were $23.6$48.6 million and $23.9$38.0 million at December 31, 20172019 and December 31, 2016,2018, respectively.
10.11. Borrowings
At December 31, 20172019 the Company had overnight borrowings totaling $20.5$92.1 million with an average interest rate of 1.53%1.81%. Overnight borrowings at December 31, 20162018 totaled $63.1$71.8 million with a weighted average interest rate of 0.74%2.6%. These borrowings are primarily used to fund asset growth not supported by deposit generation.
At December 31, 2016, the Company had a fixed-rate convertible advance from the FHLB in the amount of $10.0 million with an interest rate of 4.08%. This advance matured and was repaid in full on July 31, 2017.
At December 31, 2017,2019, unused short-term or overnight borrowing potential totaled $140.3$160.7 million from the FHLB and unused fed funds borrowing commitments totaled $46.0$25.0 million from correspondent banks.
11.
12. Redeemable Subordinated Debentures
On May 30, 2006, the Company established 1ST Constitution Capital Trust II (“Trust II”), a Delaware business trust and wholly-owned subsidiary of the Company, for the sole purpose of issuing $18.0 million of trust preferred securities (the “Capital Securities”). Trust II utilized the $18.0 million in proceeds, along with $557,000 invested in Trust II by the Company, to purchase $18,557,000 of floating rate junior subordinated debentures issued by the Company and due to mature on June 15, 2036. The subordinated debentures carry a floating interest rate based on the three-month LIBOR plus 165 basis points (3.3447%(3.5400% at December 31, 2017)2019). The Capital Securities were issued in connection with a pooled offering involving approximately 50 other financial institution holding companies. All of the Capital Securities were sold to a single pooling vehicle. The floating rate junior subordinated debentures are the only asset of Trust II and have terms that mirrored the Capital Securities. These debentures are redeemable in whole or in part prior to maturity. Trust II is obligated to distribute all proceeds of a redemption of these debentures,
whether voluntary or upon maturity, to holders of the Capital Securities. The Company’s obligation with respect to the Capital Securities and the debentures, when taken together, provided a full and unconditional guarantee on a subordinated basis by the Company of the obligations of Trust II to pay amounts when due on the Capital Securities. Interest payments on the floating rate junior subordinated debentures flow through Trust II to the pooling vehicle.
12.
13. Income Taxes
The components of income tax expense (benefit) are summarized as follows for the years ended December 31, 2017, 20162019, 2018 and 2015:2017:
| | | (In thousands) | 2017 | | 2016 | | 2015 | 2019 | | 2018 | | 2017 |
| Federal: | | | | | | | | | | |
| Current | $ | 2,791 |
| | $ | 3,360 |
| | $ | 3,199 |
| $ | 2,826 |
| | $ | 2,479 |
| | $ | 2,791 |
|
| Deferred | 496 |
| | 269 |
| | 8 |
| 418 |
| | 209 |
| | 496 |
|
| Provisional remeasurement of deferred tax assets and liabilities | 1,712 |
| | — |
| | — |
| |
| Remeasurement of deferred tax assets and liabilities | | — |
| | (28 | ) | | 1,712 |
|
| | 4,999 |
| | 3,629 |
| | 3,207 |
| 3,244 |
| | 2,660 |
| | 4,999 |
|
| State: | | | | | | | | | | |
| Current | 748 |
| | 909 |
| | 704 |
| 1,610 |
| | 1,561 |
| | 748 |
|
| Deferred | 124 |
| | 85 |
| | 151 |
| 186 |
| | 96 |
| | 124 |
|
| | 872 |
| | 994 |
| | 855 |
| 1,796 |
| | 1,657 |
| | 872 |
|
| | $ | 5,871 |
| | $ | 4,623 |
| | $ | 4,062 |
| $ | 5,040 |
| | $ | 4,317 |
| | $ | 5,871 |
|
A comparison of income tax expense at the Federal statutory rate of 21% in 2019 and 2018 and 34% in 2017 2016 and 2015 to the Company’s provision for income taxes is as follows:
| | | (In thousands) | 2017 | | 2016 | | 2015 | 2019 | | 2018 | | 2017 |
| Federal income tax | $ | 4,352 |
| | $ | 4,729 |
| | $ | 4,327 |
| $ | 3,922 |
| | $ | 3,437 |
| | $ | 4,352 |
|
| Add (deduct) effect of: | | | |
| | |
| | | |
| | |
|
| State income taxes net of federal income tax effect | 575 |
| | 656 |
| | 564 |
| 1,419 |
| | 1,309 |
| | 575 |
|
| Tax-exempt interest income | (728 | ) | | (706 | ) | | (724 | ) | (348 | ) | | (416 | ) | | (728 | ) |
| Bank-owned life insurance | (177 | ) | | (187 | ) | | (203 | ) | (131 | ) | | (110 | ) | | (177 | ) |
| Executive compensation | 139 |
| | — |
| | — |
| 120 |
| | 96 |
| | 139 |
|
| Provisional remeasurement of federal deferred tax assets and liabilities | 1,712 |
| | — |
| | — |
| |
| Remeasurement of federal deferred tax assets and liabilities | | — |
| | (28 | ) | | 1,712 |
|
| Other items, net | (2 | ) | | 131 |
| | 98 |
| 58 |
| | 29 |
| | (2 | ) |
| Provision for income taxes | $ | 5,871 |
| | $ | 4,623 |
| | $ | 4,062 |
| $ | 5,040 |
| | $ | 4,317 |
| | $ | 5,871 |
|
The tax effects of existing temporary differences that give rise to significant portions of the deferred tax assets and deferred tax liabilities are as follows at December 31, 2017, 20162019 and 2015:2018:
| | | (In thousands) | 2017 | | 2016 | 2019 | | 2018 |
| Deferred tax assets: | | | | | | |
| Allowance for loan losses | $ | 2,253 |
| | $ | 2,993 |
| $ | 2,606 |
| | $ | 2,362 |
|
| Unrealized loss on securities available for sale | 137 |
| | 130 |
| — |
| | 528 |
|
| Supplemental executive retirement plan liability | 1,213 |
| | 1,886 |
| 1,343 |
| | 1,294 |
|
| Other than temporary impairment loss | 119 |
| | 170 |
| 118 |
| | 119 |
|
| Depreciation | 622 |
| | 802 |
| 752 |
| | 612 |
|
| Non-accrual interest | 330 |
| | 313 |
| 318 |
| | 200 |
|
| Acquisition accounting adjustments | | 1,121 |
| | 647 |
|
| Lease liability | | 5,233 |
| | — |
|
| Federal net operating loss carryover, net | | 830 |
| | 871 |
|
| Other | 147 |
| | 262 |
| 103 |
| | 72 |
|
| Total gross deferred tax assets | $ | 4,821 |
| | $ | 6,556 |
| $ | 12,424 |
| | $ | 6,705 |
|
| Deferred tax liabilities: | | | | | | |
| Deferred costs | 540 |
| | — |
| 631 |
| | 564 |
|
| Pension liability | 31 |
| | 44 |
| 102 |
| | 90 |
|
| Acquisition accounting adjustments | 44 |
| | 52 |
| |
| Right-of-use assets | | 5,048 |
| | — |
|
| Unrealized gain on securities available for sale | | 111 |
| | — |
|
| Total gross deferred tax liabilities | $ | 615 |
| | $ | 96 |
| $ | 5,892 |
| | $ | 654 |
|
| | | | | | | |
| Net deferred tax assets | $ | 4,206 |
| | $ | 6,460 |
| $ | 6,532 |
| | $ | 6,051 |
|
Based upon the current facts, management has determined that it is more likely than not that there will be sufficient taxable income in future years to realize the deferred tax assets. However, there can be no assurances about the level of future earnings.
The Company is subject to U.S. Federal income tax as well as income tax of the State of New Jersey and other states. The tax years of 2016, 2017, 2018 and 2019 remain open to federal examination. The tax years of 2015, 2016, 2017, 2018 and 2019 remain open for state examination.
At December 31, 2019, the Company has $5.8 million of federal net operating loss carryforwards which begin to expire in 2034, unless previously used. These net operating loss carryforwards arose from the NJCB Merger. The Company's use of the net operating loss carryforward is limited by statute to a maximum of $197,000 per year.
On December 22, 2017, the Tax Cuts and Jobs Act (the "Tax Act") wasActwas signed into law. ASC 740 (Income Taxes) requires the recognition of the effect of changes in tax laws or rates in the period in which the legislation is enacted. The changes in the deferred tax assets and liabilities remeasured at the new 21% federal tax rate are reflected in income tax expense for fiscal year 2017.
The Company performed a preliminary analysis in 2017 and expensed an estimated $1.7 million impactrelated to the effect of the lower corporate tax rates on the deferred tax assets and liabilities. This was a non-cash charge to income. The final impact may differ from this estimate due to, among other things, additional analysis, changes in interpretations and assumptions the Company made, additional regulatory guidance and actions the Company may take as a resultUpon completion of the 2017 federal tax returns, the provisional remeasurement of federal deferred tax liability was reduced by $28,000. The measurement period under Staff Accounting Bulletin 118 issued by the SEC is closed as of December 22, 2018 and the accounting for the Tax Act. Information thatAct is needed to adjust provisional amounts would be the completion of all 2017 tax returns.final.
13.14. Comprehensive Income and Accumulated Other Comprehensive LossIncome (Loss)
Comprehensive income is the total of net income and all other changes in equity from non-shareholder sources, which are referred to as other comprehensive income. The components of accumulated other comprehensive income (loss) that are included in shareholders' equity and the related tax effects are as follows at December 31, 20172019 and 2016:2018:
| | | | 2017 | 2019 |
| (In thousands) | Before-Tax Amount | | Income Tax Effect | | Net-of-Tax Amount | Before-Tax Amount | | Income Tax Effect | | Net-of-Tax Amount |
| Net unrealized holding loss on securities available for sale | $ | (571 | ) | | $ | 137 |
| | $ | (434 | ) | |
| Net unrealized holding gain on securities available for sale | | $ | 414 |
| | $ | (111 | ) | | $ | 303 |
|
| Unrealized impairment loss on held to maturity security | (501 | ) | | 119 |
| | (382 | ) | (492 | ) | | 118 |
| | (374 | ) |
| Gains on unfunded pension liability | 111 |
| | (31 | ) | | 80 |
| 364 |
| | (102 | ) | | 262 |
|
| Total other comprehensive loss | $ | (961 | ) | | $ | 225 |
| | $ | (736 | ) | |
| Total other comprehensive income | | $ | 286 |
| | $ | (95 | ) | | $ | 191 |
|
| | | | | | | | | | | |
| | 2016 | 2018 |
| | Before-Tax Amount | | Income Tax Effect | | Net-of-Tax Amount | Before-Tax Amount | | Income Tax Effect | | Net-of-Tax Amount |
| Net unrealized holding loss on securities available for sale | $ | (464 | ) | | $ | 130 |
| | $ | (334 | ) | $ | (2,207 | ) | | $ | 528 |
| | $ | (1,679 | ) |
| Unrealized impairment loss on held to maturity security | (501 | ) | | 170 |
| | (331 | ) | (501 | ) | | 119 |
| | (382 | ) |
| Gains on unfunded pension liability | 109 |
| | (44 | ) | | 65 |
| 318 |
| | (90 | ) | | 228 |
|
| Total other comprehensive loss | $ | (856 | ) | | $ | 256 |
| | $ | (600 | ) | $ | (2,390 | ) | | $ | 557 |
| | $ | (1,833 | ) |
Changes in the components of accumulated other comprehensive income (loss)loss are as follows and are presented net of tax:
|
| | | | | | | | | | | | | | | |
| (In thousands) | Unrealized Holding Gains (Losses) on Available for Sale Securities | | Unrealized Impairment Loss on Held to Maturity Security | | Unfunded Pension Liability | | Accumulated Other Comprehensive Income (Loss) |
| Balance, December 31, 2014 | $ | 276 |
| | $ | (331 | ) | | $ | 303 |
| | $ | 248 |
|
| Other comprehensive income (loss) before reclassifications | (186 | ) | | — |
| | (32 | ) | | (218 | ) |
| Amounts reclassified from accumulated other comprehensive income | — |
| | — |
| | (160 | ) | | (160 | ) |
| Other comprehensive income (loss) | (186 | ) | | — |
| | (192 | ) | | (378 | ) |
| Balance, December 31, 2015 | 90 |
| | (331 | ) | | 111 |
| | (130 | ) |
| Other comprehensive income (loss) before reclassifications | (424 | ) | | — |
| | 52 |
| | (372 | ) |
| Amounts reclassified from accumulated other comprehensive income | — |
| | — |
| | (98 | ) | | (98 | ) |
| Other comprehensive loss | (424 | ) | | — |
| | (46 | ) | | (470 | ) |
| Balance, December 31, 2016 | (334 | ) | | (331 | ) | | 65 |
| | (600 | ) |
| Other comprehensive income (loss) before reclassifications | 26 |
| | — |
| | 38 |
| | 64 |
|
| Amounts reclassified from accumulated other comprehensive income | (55 | ) | | — |
| | (36 | ) | | (91 | ) |
| Reclassification of certain deferred tax effects | (71 | ) | | (51 | ) | | 13 |
| | (109 | ) |
| Other comprehensive loss | (100 | ) | | (51 | ) | | 15 |
| | (136 | ) |
| Balance, December 31, 2017 | $ | (434 | ) | | $ | (382 | ) | | $ | 80 |
| | $ | (736 | ) |
|
| | | | | | | | | | | | | | | |
| (In thousands) | Unrealized Holding Gains (Losses) on Available for Sale Securities | | Unrealized Impairment Loss on Held to Maturity Security | | Unfunded Pension Liability | | Accumulated Other Comprehensive Income (Loss) |
| Balance, December 31, 2016 | $ | (334 | ) | | $ | (331 | ) | | $ | 65 |
| | $ | (600 | ) |
| Other comprehensive income (loss) before reclassifications | 26 |
| | — |
| | 38 |
| | 64 |
|
| Amounts reclassified from accumulated other comprehensive income (loss) | (55 | ) | | — |
| | (36 | ) | | (91 | ) |
| Other comprehensive income (loss) | (29 | ) | | — |
| | 2 |
| | (27 | ) |
| Reclassification for certain deferred tax effects | (71 | ) | | (51 | ) | | 13 |
| | (109 | ) |
| Balance, December 31, 2017 | (434 | ) | | (382 | ) | | 80 |
| | (736 | ) |
| Other comprehensive income (loss) before reclassifications | (1,236 | ) | | — |
| | 192 |
| | (1,044 | ) |
| Amounts reclassified from accumulated other comprehensive income (loss) | — |
| | — |
| | (44 | ) | | (44 | ) |
| Reclassification adjustments for gains realized in income | (9 | ) | | — |
| | — |
| | (9 | ) |
| Other comprehensive income (loss) | (1,245 | ) | | — |
| | 148 |
| | (1,097 | ) |
| Balance, December 31, 2018 | (1,679 | ) | | (382 | ) | | 228 |
| | (1,833 | ) |
| Other comprehensive income before reclassifications | 2,005 |
| | — |
| | 156 |
| | 2,161 |
|
| Amounts reclassified from accumulated other comprehensive income (loss) | — |
| | 8 |
| | (122 | ) | | (114 | ) |
| Reclassification adjustments for gains realized in income | (23 | ) | | — |
| | — |
| | (23 | ) |
| Other comprehensive income | 1,982 |
| | 8 |
| | 34 |
| | 2,024 |
|
| Balance, December 31, 2019 | $ | 303 |
| | $ | (374 | ) | | $ | 262 |
| | $ | 191 |
|
14.15. Benefit Plans
Retirement Savings Plan: The Bank has a 401(k) Plan (the "Plan") which covers substantially all employees with six months or more of service. The plan permits all eligible employees to make contributions to the Plan up to the IRS salary deferral limit. Under the Plan, the Bank provided a matching contribution of 50%, up to 6% of base compensation. Employer contributions to the Plan amounted to $348,000, $343,000 and $353,000 $272,000in 2019, 2018 and $274,000 in 2017, 2016 and 2015.respectively.
Bank-Owned Life Insurance: In connection with the benefit plans, the Bank has life insurance policies on the lives of its executives, directors, officers and employees. The Bank is the owner and beneficiary of the policies. The cash surrender values of the policies totaled approximately $25.1$36.7 million and $22.2$28.7 million as of December 31, 20172019 and 2016,2018, respectively. Included in the total at December 31, 2019, was $7.2 million of bank-owned life insurance policies acquired in the Shore Merger and at December 31, 2018, was $4.0 million of bank-owned life insurance policies acquired in the NJCB Merger.
Supplemental Executive Retirement Plan
The Company also provides retirement benefits to certain employees under supplemental executive retirement plans (the "Supplemental Plans"). The Supplemental Plans are unfunded and the Company accrues actuarially determined benefit costs over the estimated service period of the employees participating in the Supplemental Plans. The present value of the benefits accrued under the Supplemental Plans as of December 31, 20172019 and 20162018 is approximately $4.2$4.4 million and $4.6$4.3 million, respectively, and is included in other liabilities and accumulated other comprehensive incomeloss in the accompanying consolidated balance sheets. Compensation expense related to the Supplemental Plans of $293,000, $235,000$177,000, $287,000 and $184,000$293,000 is included in the accompanying consolidated statements of income for the years ended December 31, 2017, 20162019, 2018 and 2015,2017, respectively.
The following table sets forth the changes in benefit obligations of the Company’s Supplemental Plans for the years ended December 31, 20172019 and 2016.2018.
| | | (In thousands) | 2017 | | 2016 | 2019 | | 2018 |
| Change in Benefit Obligation | | | | | | |
| Beginning January 1 | $ | 4,613 |
| | $ | 4,971 |
| $ | 4,285 |
| | $ | 4,205 |
|
| Service cost | 197 |
| | 216 |
| 189 |
| | 192 |
|
| Interest cost | 156 |
| | 179 |
| 164 |
| | 157 |
|
| Actuarial gain | (62 | ) | | (83 | ) | (222 | ) | | (269 | ) |
| Benefits paid | (699 | ) | | (670 | ) | — |
| | — |
|
| Ending December 31 | $ | 4,205 |
| | $ | 4,613 |
| $ | 4,416 |
| | $ | 4,285 |
|
| | | | | | | |
| Amount Recognized in Consolidated Balance Sheets | | | | | | |
| Liability for pension | $ | 4,316 |
| | $ | 4,722 |
| $ | 4,780 |
| | $ | 4,603 |
|
| Net actuarial gain included in accumulated other comprehensive income | (111 | ) | | (109 | ) | |
| Net actuarial gain included in accumulated other comprehensive loss | | (364 | ) | | (318 | ) |
| Net recognized pension liability | $ | 4,205 |
| | $ | 4,613 |
| $ | 4,416 |
| | $ | 4,285 |
|
| | | | | | | |
Information for pension plans with an accumulated benefit obligation in excess of plan assets | | | | | | |
| Projected benefit obligation | $ | 4,205 |
| | $ | 4,613 |
| $ | 4,416 |
| | $ | 4,285 |
|
| Accumulated benefit obligation | 4,043 |
| | 4,463 |
| 4,245 |
| | 4,120 |
|
The following table sets forth the components of net periodic benefit cost for the years ended December 31, 2017, 20162019, 2018 and 2015.2017.
| | | (In thousands) | 2017 | | 2016 | | 2015 | 2019 | | 2018 | | 2017 |
| Service cost | $ | 197 |
| | $ | 216 |
| | $ | 267 |
| $ | 189 |
| | $ | 192 |
| | $ | 197 |
|
| Interest cost | 156 |
| | 179 |
| | 183 |
| 164 |
| | 157 |
| | 156 |
|
| Recognized net actuarial gain | (60 | ) | | (160 | ) | | (266 | ) | (176 | ) | | (62 | ) | | (60 | ) |
| Net periodic benefit cost | $ | 293 |
| | $ | 235 |
| | $ | 184 |
| $ | 177 |
| | $ | 287 |
| | $ | 293 |
|
The net periodic benefit cost is projected to be $193,000a credit of $60,000 to expense and actuarial gains of $111,000$364,000 are expected to be removed from accumulated other comprehensive income and recognized as a component of net periodic benefit expense for the year ending December 31, 2018.
2020.
For each of the years ended December 31, 2017, 20162019, 2018 and 2015,2017, the weighted-average discount rate was 4% and the assumed salary increase was 4% for each of the same years.
Management's expectation as of December 31, 20172019 for the projected annual benefit payments is represented in the table below.
| | | (In thousands) | | | | |
| 2018 | | $ | 4,509 |
| |
| 2019 | | — |
| |
| 2020 | | — |
| | $ | 4,719 |
|
| 2021 | | — |
| | — |
|
| 2022 | | — |
| | — |
|
| 2023 | | | — |
|
| 2024 | | | — |
|
| Thereafter | | — |
| | — |
|
| | | $ | 4,509 |
| | $ | 4,719 |
|
15.16. Share-Based Compensation
The Company’s stock-based incentive plans (the “Stock Plans”) authorize the issuance of an aggregate of 485,873885,873 shares of the Company’s common stock (as adjusted for stock dividends) pursuant to awards that may be granted in the form of stock options to purchase common stock (“Options”("Options") and, awards of restricted shares of common stock (“Stock Awards”) and restricted stock units ("RSUs"). The purpose of the Stock Plans is to attract and retain personnel for positions of substantial responsibility and to provide additional incentive to certain officers, directors, employees and other persons to promote the success of the Company. Under the Stock Plans, optionsOptions have a term of ten years after the date of grant, subject to earlier termination in certain circumstances. Options are granted with an exercise price at the then fair market value of the Company’s common stock. The grant date fair value is calculated using the Black-Scholes option valuation model. As of December 31, 2017,2019, there were 127,736398,991 shares of common stock available for future grants under the Stock Plans.
Share-based compensation expense related to stock optionsOptions was $65,000, $44,000$55,000, $57,000 and $41,000$65,000 for the years ended December 31, 2017, 20162019, 2018 and 2015,2017, respectively.
As of December 31, 2017,2019, there was approximately $59,000$67,000 of unrecognized compensation cost related to non-vested stock option-based compensation arrangementsunvested Options granted under the Stock Plans that is expected to be recognized over the next four years.
Transactions in Options under the Company’s stock option plansStock Plans during the year ended December 31, 20172019 are summarized as follows:
|
| | | | | | | | | | | | | |
| | | Number of Shares | | Weighted Average Exercise Price | | Weighted Average Remaining Contractual Term (years) | | Aggregate Intrinsic Value (In thousands) |
| Balance, January 1, 2017 | | 165,819 |
| | $ | 7.35 |
| | 5.2 | | $ | 1,882 |
|
| Granted | | 9,900 |
| | 18.65 |
| | | | |
|
| Exercised | | (31,640 | ) | | 8.05 |
| | | | |
|
| Forfeited | | (1,030 | ) | | 14.57 |
| | | | |
|
| Expired | | (1,044 | ) | | 14.86 |
| | | | |
|
| Balance, December 31, 2017 | | 142,005 |
| | $ | 7.86 |
| | 4.4 | | $ | 1,486 |
|
| | | | | | | | | |
| Exercisable at December 31, 2017 | | 124,141 |
| | $ | 6.96 |
| | 3.9 | | $ | 1,408 |
|
|
| | | | | | | | | | | | | |
| | | Number of Shares | | Weighted Average Exercise Price | | Weighted Average Remaining Contractual Term (years) | | Aggregate Intrinsic Value (In thousands) |
| Outstanding at January 1, 2019 | | 139,511 |
| | $ | 8.70 |
| | 4.0 | | $ | 1,566 |
|
| Granted | | 11,400 |
| | 19.38 |
| | | | |
|
| Exercised | | (24,277 | ) | | 7.37 |
| | | | |
|
| Forfeited | | (1,268 | ) | | 17.91 |
| | | | |
|
| Expired or exchanged | | (3,215 | ) | | 13.03 |
| | | | |
|
| Outstanding at December 31, 2019 | | 122,151 |
| | $ | 9.85 |
| | 3.9 | | $ | 1,500 |
|
| | | | | | | | |
| Exercisable at December 31, 2019 | | 103,145 |
| | $ | 8.29 |
| | 3.1 | | $ | 1,427 |
|
The aggregate intrinsic value in the table above represents the total pre-tax intrinsic value (the difference between market value of the Company's common stock on the last trading day of 20172019 and the exercise price). The Company's closing stock price on
December 31, 20172019 was $18.30.$22.13. During the year ended December 31, 2017,2019, the aggregate intrinsic value of stock optionsOptions exercised was $304,000$284,000 and the Company received cash totaling $262,000$149,000 for optionsOptions exercised.
The following table summarizes stock optionsthe Options that were outstanding and exercisable at December 31, 2017:2019:
| | | | Outstanding Options | | Exercisable Options | Outstanding Options | | Exercisable Options |
| Exercise Price Range | Number | | Average Life in Years | | Average Exercise Price | | Number | | Average Life in Years | | Average Exercise Price | Number | | Average Life in Years | | Average Exercise Price | | Number | | Average Life in Years | | Average Exercise Price |
| $5.54 to $5.63 | 50,975 |
| | 3.8 | | $ | 5.60 |
| | 50,975 |
| | 3.8 | | $ | 5.60 |
| 44,897 |
| | 1.8 | | $ | 5.61 |
| | 44,897 |
| | 1.8 | | $ | 5.61 |
|
| $6.16 to $7.46 | 57,688 |
| | 3.1 | | 6.98 |
| | 57,688 |
| | 3.1 | | 6.98 |
| 27,827 |
| | 2.0 | | 7.10 |
| | 27,827 |
| | 2.0 | | 7.10 |
|
| $9.30 to $11.98 | 24,442 |
| | 7.1 | | 10.70 |
| | 13,698 |
| | 6.8 | | 10.43 |
| 21,497 |
| | 5.0 | | 10.64 |
| | 19,901 |
| | 4.9 | | 10.54 |
|
| $18.65 | 8,900 |
| | 9.0 | | 18.65 |
| | 1,780 |
| | 9.0 | | 18.65 |
| |
| $18.30 to 19.38 | | 27,930 |
| | 8.1 | | 18.81 |
| | 10,520 |
| | 7.8 | | 18.67 |
|
| | 142,005 |
| | 4.4 | | $ | 7.86 |
| | 124,141 |
| | 3.9 | | $ | 6.96 |
| 122,151 |
| | 3.9 | | $ | 9.85 |
| | 103,145 |
| | 3.1 | | $ | 8.29 |
|
The fair value of each optionOption and the significant weighted average assumptions used to calculate the fair value of the optionsOptions granted during the years ended December 31, 2017, 20162019, 2018 and 20152017 are as follows:
| | | | 2017 | | 2016 | | 2015 | 2019 | | 2018 | | 2017 |
| Fair value of options granted | $ | 6.05 |
| | $ | 4.65 |
| | $ | 4.05 |
| $ | 5.63 |
| | $ | 5.93 |
| | $ | 6.05 |
|
| Risk-free rate of return | 2.45 | % | | 2.25 | % | | 1.37 | % | 2.55 | % | | 2.46 | % | | 2.45 | % |
| Expected option life in years | 7 |
| | 7 |
| | 7 |
| 7 |
| | 7 |
| | 7 |
|
| Expected volatility | 31.25 | % | | 30.66 | % | | 32.37 | % | 29.09 | % | | 31.35 | % | | 31.25 | % |
Expected dividends (1) | 1.19 | % | | — | % | | — | % | 1.56 | % | | 1.18 | % | | 1.19 | % |
Share-based compensation expense related to Stock Awards was $1.0 million, $962,000 and $928,000 for the years ended December 31, 2019, 2018 and 2017, respectively.
As of December 31, 2019, there was approximately $1.7 million of unrecognized compensation cost related to non-vested stock awards that will be recognized over the next four years.
The following table summarizes the activity in nonvested restricted sharesunvested Stock Awards for the year ended December 31, 2017:2019:
| | | | | Number of Shares | | Weighted Average Grant-Date Fair Value | | Number of Shares | | Weighted Average Grant-Date Fair Value |
| Balance, January 1, 2017 | | 146,639 |
| | $ | 9.02 |
| |
| Balance, January 1, 2019 | | | 147,533 |
| | $ | 13.21 |
|
| Granted | | 61,900 |
| | 17.96 |
| | 53,931 |
| | 18.30 |
|
| Vested | | (56,507 | ) | | 10.60 |
| | (65,320 | ) | | 15.91 |
|
| Forfeited | | (1,287 | ) | | 12.49 |
| | (1,785 | ) | | 17.31 |
|
| Balance, December 31, 2017 | | 150,745 |
| | $ | 11.87 |
| |
| Balance at December 31, 2019 | | | 134,359 |
| | $ | 13.84 |
|
The value of restricted sharesthe Stock Awards is based upon the market value of the common stock on the date of grant. The sharesStock Awards generally vest over a four year service period with compensation expense recognized on a straight-line basis.
Share-based compensation expense related to stock grantsStock Awards was $934,000, $710,000$1.0 million, $962,000 and $590,000$928,000 for the years ended December 31, 2017, 20162019, 2018 and 2015,2017, respectively.
As of December 31, 2017,2019, there was approximately $1.5$1.7 million of unrecognized compensation cost related to non-vested stock grantsawards that will be recognized over the next threefour years.
Share based compensation expense related to RSUs was $67,000 for the year ended December 31, 2019, there was approximately $133,000 of unrecognized compensation expense related to unvested RSUs. No RSUs were granted prior to 2019. In January 2019, the Company granted 10,300 RSUs with a grant date fair value of $19.38. The RSUs will vest pro-rata over 3 years subject to achievement of certain established performance metrics. The ultimate number of RSUs earned, if any, will depend on the
performance achievement measured over each annual period during the period from January 1, 2019 through December 31, 2021. If performance measures are achieved, the RSUs will vest on the date of certification of performance achievement by the Compensation Committee following each annual performance period. Awards of RSUs are settled in cash unless the recipient timely elects for the RSUs to be settled in shares of common stock.
16.17. Commitments and Contingencies
As of December 31, 2017, future minimum rental payments under non-cancelable operating leases were as follows:
|
| | | |
| (In thousands) | |
| 2018 | $ | 1,281 |
|
| 2019 | 1,115 |
|
| 2020 | 910 |
|
| 2021 | 821 |
|
| 2022 | 710 |
|
| Thereafter | 2,675 |
|
| | $ | 7,512 |
|
Rent expense aggregated $1.5 million for each of the years ended December 31, 2017, 2016 and 2015.
Commitments With Off-Balance Sheet Risk: The consolidated balance sheet does not reflect various commitments relating to financial instruments which are used in the normal course of business. Management does not anticipate that the settlement of those financial instruments will have a material adverse effect on the Company’s financial condition. These instruments include commitments to extend credit and letters of credit. These financial instruments carry various degrees of credit risk, which is defined as the possibility that a loss may occur from the failure of another party to perform according to the terms of the contract. As these off-balance sheet financial instruments have essentially the same credit risk involved in extending loans, the Company generally uses the same credit and collateral policies in making these commitments and conditional obligations as it does for on-balance sheet investments. Additionally, as some commitments and conditional obligations are expected to expire without being drawn or returned, the contractual amounts do not necessarily represent future cash requirements.
Commitments to extend credit are legally binding loan commitments with set expiration dates. They are intended to be disbursed, subject to certain conditions, upon request of the borrower. The Company receives a fee for providing a commitment. The Company was committed to advance $57.5$36.0 million and $42.6$23.1 million for loans that have not closed and $387.6$381.0 million and $330.1$403.0 million for lines of credit on closed loans as of December 31, 20172019 and 2016,2018, respectively.
The Company issues financial standby letters of credit that are within the scope of ASC Topic 460, “Guarantees.” These are irrevocable undertakings by the Company to guarantee payment of a specified financial obligation. Most of the Company’s financial standby letters of credit arise in connection with lending relationships and have terms of one year or less. The maximum potential future payments that the Company could be required to make under these standby letters of credit amounted to $1.2$4.3 million at December 31, 20172019 and $2.0 million$766,000 at December 31, 2016.2018. The current amount of the liability as of December 31, 20172019 and 20162018 for guarantors under standby letters of credit is not material.
The Company also enters into best efforts forward sales commitments to sell residential mortgage loans that it has closed (loans held for sale) or that it expects to close (commitments to originate loans held for sale). These commitments are used to reduce the Company’s market price risk during the period from the commitment date to the sale date. The notional amount of the Company’s forward sales commitments was approximately $7.9$15.0 million at December 31, 20172019 and $8.3$4.3 million at December 31, 2016.2018. The fair value of the loan origination commitments was $135,000$159,000 at December 31, 20172019 and $123,000$79,000 at December 31, 2016.2018.
Litigation: The Company may, in the ordinary course of business, become a party to litigation involving collection matters, contract claims and other legal proceedings relating to the conduct of its business. The Company may also have various commitments and contingent liabilities which are not reflected in the accompanying consolidated balance sheet. Management is not aware of any present legal proceedings or contingent liabilities and commitments that would have a material impact on the Company’s financial condition or results of operations.
17.18. Other Operating Expenses
The components of other operating expenses for the years ended December 31, 2017, 20162019, 2018 and 20152017 are as follows:
| | | (Dollars in thousands) | 2017 | | 2016 | | 2015 | 2019 | | 2018 | | 2017 |
| Regulatory, professional and other consulting fees | $ | 2,263 |
| | $ | 1,706 |
| | $ | 1,681 |
| $ | 1,806 |
| | $ | 1,713 |
| | $ | 2,263 |
|
| Equipment | 1,008 |
| | 917 |
| | 939 |
| 1,286 |
| | 1,175 |
| | 1,008 |
|
| Telephone | 389 |
| | 377 |
| | 449 |
| 400 |
| | 391 |
| | 389 |
|
| Amortization of intangible assets | 384 |
| | 404 |
| | 428 |
| 140 |
| | 318 |
| | 384 |
|
| Insurance | 373 |
| | 303 |
| | 324 |
| 391 |
| | 375 |
| | 373 |
|
| Merger-related expenses | 265 |
| | — |
| | — |
| |
| Supplies | 259 |
| | 219 |
| | 248 |
| 275 |
| | 294 |
| | 259 |
|
| Marketing | 225 |
| | 240 |
| | 282 |
| 302 |
| | 280 |
| | 225 |
|
| Other expenses | 2,151 |
| | 1,535 |
| | 1,540 |
| 1,983 |
| | 1,946 |
| | 2,151 |
|
| | $ | 7,317 |
| | $ | 5,701 |
| | $ | 5,891 |
| $ | 6,583 |
| | $ | 6,492 |
| | $ | 7,052 |
|
18.19. Regulatory Capital Requirements
The Company and the Bank are subject to various regulatory capital requirements administered by the Federal and state banking agencies. Failure to meet minimum capital requirements can initiate certain mandatory, and possibly additional discretionary, actions by regulators that, if undertaken, could have a direct material effect on the Company’s and the Bank’s financial statements. Under capital adequacy guidelines and the regulatory framework for prompt corrective action, the Company and the Bank must meet specific capital guidelines that involve quantitative measures of the Company’s and the Bank’s assets, liabilities and certain off-balance sheet items as calculated under regulatory accounting practices. The Company’s and the Bank’s capital amounts and classifications are also subject to qualitative judgments by the regulators about components, risk weightings and other factors.
Quantitative measures established by regulation to ensure capital adequacy require the Company and the Bank to maintain minimum amounts and ratios of Common Equity Tier 1, Total and Tier I capital (as defined in the regulations) to risk-weighted assets (as defined) and Tier I capital to average assets (Leverage ratio, as defined). As of December 31, 2017,2019, the Company and the Bank met all capital adequacy requirements to which they are subject.
To be categorized as adequately capitalized, the Company and the Bank must maintain minimum Common Equity Tier 1, Total capital to risk-weighted assets, Tier 1 capital to risk-weighted assets and Tier I leverage capital ratios as set forth in the below table. As of December 31, 2017,2019, the Bank's capital ratios exceeded the regulatory standards for well-capitalized institutions. Certain bank regulatory limitations exist on the availability of the Bank’s assets for the payment of dividends by the Bank without prior approval of bank regulatory authorities.
In July 2013, the Federal Reserve Board and the FDIC approved revisions to their capital adequacy guidelines and prompt corrective action rules that implemented and addressed the revised standards of Basel III and addressed relevant provisions of the Dodd-Frank Act. The Federal Reserve Board’s final rules and the FDIC’s interim final rules (which became final in April 2014 with no substantive changes) apply to all depository institutions, top-tier bank holding companies with total consolidated assets of $500 million or more (which was subsequently increased to $1 billion or more in May 2015) and top-tier savings and loan holding companies (“banking organizations”). Among other things, the rules established a Common Equity Tier 1 minimum capital requirement (4.5% of risk-weighted assets) and increased the minimum Tier 1 capital to risk-based assets requirement (from 4% to 6% of risk-weighted assets). Banking organizations are also required to have a total capital ratio of at least 8% and a Tier 1 leverage ratio of at least 4%.
The rules also limited a banking organization’s ability to pay dividends, engage in share repurchases or pay discretionary bonuses if the banking organization does not hold a “capital conservation buffer” consisting of 2.5% of Common Equity Tier 1 capital to risk-weighted assets in addition to the amount necessary to meet its minimum risk-based capital requirements. The rules became effective for the Company and the Bank on January 1, 2015. The capital conservation buffer requirement began phasing in on January 1, 2016 at 0.625% of Common Equity Tier 1 capital to risk-weighted assets and increasesincreased by that amount each year until fully implemented in January 2019 at 2.5% of Common Equity Tier 1 capital to risk-weighted assets. As of December 31, 2017,2019, the Company and the Bank were required to maintainmaintained a capital conservation buffer of 1.25%at least 2.5%.
On September 17, 2019, the federal banking agencies adopted a final rule, effective January 1, 2020, creating a community bank leverage ratio framework for institutions with total consolidated assets of less than $10 billion and that meet other qualifying
criteria. The community bank leverage ratio framework provides for a simpler measure of capital adequacy for qualifying institutions. Qualifying institutions that elect to use the community bank leverage ratio framework and that maintain a leverage ratio of greater than 9% will be considered to have satisfied the generally applicable risk-based and leverage capital requirements in the federal banking agencies’ capital rules and to have met the “well capitalized” ratio requirements. Management is still reviewing the community bank leverage ratio framework, but does not expect that the Company or the Bank will elect to use the framework.
The Bank's actual capital amounts and ratios are presented in the following table:
| | | | | | | | | | | | To Be Well Capitalized Under Prompt | | | | | | | | | To Be Well Capitalized Under Prompt |
| | | | | | For Capital | | Corrective | | | | | For Capital | | Corrective |
| | Actual | | Adequacy Purposes | | Action Provisions | Actual | | Adequacy Purposes | | Action Provisions |
| (Dollars in thousands) | Amount | | Ratio | | Amount | | Ratio | | Amount | | Ratio | Amount | | Ratio | | Amount | | Ratio | | Amount | | Ratio |
| As of December 31, 2017 | | | | | | | | | | | | |
| As of December 31, 2019 | | | | | | | | | | | | |
| Common equity Tier 1 | $ | 115,031 |
| | 11.74 | % | | $ | 44,106 |
| | 4.50 | % | | $ | 63,709 |
| | 6.50 | % | $ | 150,725 |
| | 10.99 | % | | $ | 61,579 |
| | 4.50 | % | | $ | 88,948 |
| | 6.50 | % |
| Total capital to risk-weighted assets | 123,044 |
| | 12.55 | % | | 78,411 |
| | 8.00 | % | | 98,014 |
| | 10.00 | % | 159,996 |
| | 11.67 | % | | 109,474 |
| | 8.00 | % | | 136,843 |
| | 10.00 | % |
| Tier 1 capital to risk-weighted assets | 115,031 |
| | 11.74 | % | | 58,808 |
| | 6.00 | % | | 78,411 |
| | 8.00 | % | 150,725 |
| | 10.99 | % | | 82,106 |
| | 6.00 | % | | 109,474 |
| | 8.00 | % |
| Tier 1 leverage capital | 115,031 |
| | 10.96 | % | | 41,987 |
| | 4.00 | % | | 52,484 |
| | 5.00 | % | 150,725 |
| | 10.54 | % | | 57,222 |
| | 4.00 | % | | 71,528 |
| | 5.00 | % |
| | | | | | | | | | | | | | | | | | | | | | | |
| As of December 31, 2016 | | | | | | | | | | | | |
| As of December 31, 2018 | | | | | | | | | | | | |
| Common equity Tier 1 | $ | 108,606 |
| | 12.13 | % | | $ | 40,302 |
| | 4.50 | % | | $ | 58,214 |
| | 6.50 | % | $ | 133,548 |
| | 12.40 | % | | $ | 48,471 |
| | 4.50 | % | | $ | 70,013 |
| | 6.50 | % |
| Total capital to risk-weighted assets | 116,100 |
| | 12.96 | % | | 71,648 |
| | 8.00 | % | | 89,560 |
| | 10.00 | % | 141,950 |
| | 13.18 | % | | 86,170 |
| | 8.00 | % | | 107,712 |
| | 10.00 | % |
| Tier 1 capital to risk-weighted assets | 108,606 |
| | 12.13 | % | | 53,736 |
| | 6.00 | % | | 71,648 |
| | 8.00 | % | 133,548 |
| | 12.40 | % | | 64,627 |
| | 6.00 | % | | 86,170 |
| | 8.00 | % |
| Tier 1 leverage capital | 108,606 |
| | 10.68 | % | | 40,658 |
| | 4.00 | % | | 50,823 |
| | 5.00 | % | 133,548 |
| | 11.74 | % | | 45,516 |
| | 4.00 | % | | 56,894 |
| | 5.00 | % |
The Company's actual capital amounts and ratios are presented in the following table:
| | | | | | | | | | | | To Be Well Capitalized Under Prompt | | | | | | | | | To Be Well Capitalized Under Prompt |
| | | | | | For Capital | | Corrective | | | | | For Capital | | Corrective |
| | Actual | | Adequacy Purposes | | Action Provisions | Actual | | Adequacy Purposes | | Action Provisions |
| (Dollars in thousands) | Amount | | Ratio | | Amount | | Ratio | | Amount | | Ratio | Amount | | Ratio | | Amount | | Ratio | | Amount | | Ratio |
| As of December 31, 2017 | | | | | | | | | | | | |
| As of December 31, 2019 | | | | | | | | | | | | |
| Common equity Tier 1 | $ | 99,839 |
| | 10.19 | % | | $ | 44,106 |
| | 4.50 | % | | N/A | | N/A | $ | 133,046 |
| | 9.70 | % | | $ | 61,604 |
| | 4.50 | % | | N/A | | N/A |
| Total capital to risk-weighted assets | 125,852 |
| | 12.84 | % | | 78,411 |
| | 8.00 | % | | N/A | | N/A | 160,317 |
| | 11.69 | % | | 109,519 |
| | 8.00 | % | | N/A | | N/A |
| Tier 1 capital to risk-weighted assets | 117,839 |
| | 12.02 | % | | 58,808 |
| | 6.00 | % | | N/A | | N/A | 151,046 |
| | 11.01 | % | | 82,139 |
| | 6.00 | % | | N/A | | N/A |
| Tier 1 leverage capital | 117,839 |
| | 11.23 | % | | 41,987 |
| | 4.00 | % | | N/A | | N/A | 151,046 |
| | 10.56 | % | | 57,245 |
| | 4.00 | % | | N/A | | N/A |
| | | | | | | | | | | | | | | | | |
| As of December 31, 2016 | | | | | | | | | |
| As of December 31, 2018 | | | | | | | | | |
| Common equity Tier 1 | $ | 93,101 |
| | 10.40 | % | | $ | 40,302 |
| | 4.50 | % | | N/A | | N/A | $ | 115,537 |
| | 10.72 | % | | $ | 48,496 |
| | 4.50 | % | | N/A | | N/A |
| Total capital to risk-weighted assets | 118,595 |
| | 13.24 | % | | 71,648 |
| | 8.00 | % | | N/A | | N/A | 141,939 |
| | 13.17 | % | | 86,214 |
| | 8.00 | % | | N/A | | N/A |
| Tier 1 capital to risk-weighted assets | 111,101 |
| | 12.41 | % | | 53,736 |
| | 6.00 | % | | N/A | | N/A | 133,537 |
| | 12.39 | % | | 64,661 |
| | 6.00 | % | | N/A | | N/A |
| Tier 1 leverage capital | 111,101 |
| | 10.93 | % | | 40,658 |
| | 4.00 | % | | N/A | | N/A | 133,537 |
| | 11.73 | % | | 45,538 |
| | 4.00 | % | | N/A | | N/A |
Dividend payments by the Bank to the Company are subject to the New Jersey Banking Act of 1948, as amended (the “Banking Act”) and the Federal Deposit Insurance Act, as amended (the “FDIA”). Under the Banking Act, the Bank may not pay dividends unless, following the dividend payment, the capital stock of the Bank will be unimpaired and (i) the Bank will have a surplus of not less than 50% of its capital stock or, if not, (ii) the payment of such dividend will not reduce the surplus of the Bank. Under the FDIA, the Bank may not pay any dividends if after paying the dividend, it would be undercapitalized under applicable capital requirements. In addition to these explicit limitations, the federal regulatory agencies are authorized to prohibit a banking subsidiary or bank holding company from engaging in an unsafe or unsound banking practice. Depending upon the circumstances, the agencies could take the position that paying a dividend would constitute an unsafe or unsound banking practice. The Bank is also limited in paying dividends if it does not maintain the necessary “capital conservation buffer” as discussed below.
It is the policy of the Federal Reserve Board that bank holding companies should pay cash dividends on common stock only out of income available over the immediately preceding year and only if prospective earnings retention is consistent with the organization’s expected future needs and financial condition. The policy provides that bank holding companies should not maintain a level of cash dividend that undermines the bank holding company’s ability to serve as a source of strength to its banking subsidiary. A bank holding company may not pay dividends when it is insolvent. The Company's payment of cash dividends to date were within the guidelines set forth in the Federal Reserve Board's policy.
In the event the Company defers payments on the junior subordinated debentures used to fund payments to be made pursuant to the terms of the Capital Securities, the Company would be unable to pay cash dividends on its common stock until the deferred payments are made.
19.20. Shareholders’ Equity
The Company issued a warrant on December 23, 2008 to the United States Department of the Treasury (the “Treasury”) under the Troubled Asset Relief Program (“TARP”) Capital Purchase Program (the “CPP”). This warrant was sold by the Treasury on November 23, 2011 and exchanged for two2 new warrants which permit the holders thereof to acquire, on an adjusted basis resulting from declarations of stock and cash dividends to holders of common stock since the issuance of the two2 warrants, 286,174289,719 shares of common stock of the Company at a price of $6.291$6.214 per share. The warrants had an expiration date of December 23, 2018.
Certain terms and conditions of the warrantwarrants issued to the Treasury were modified or deleted in the two new warrants, including, without limitation, the deletion of the anti-dilution provision upon certain issuances of the Company’sCompany's common stock at or below a specified price relative to the initial exercise price. However, the two warrants still provideprovided for the adjustment of the exercise price and the number of shares of the Company’sCompany's common stock issuable upon exercise pursuant to customary anti-dilution provisions, such as upon stock splits or distributions of securities or other assets to holders of the Company’sCompany's common stock. The two warrants remain outstanding, are immediately exercisable and continue to have an expiration date of
On December 23,19, 2018, which was the expiration dateboth of the warrant originally issuedoutstanding warrants were exercised and pursuant to the Treasury.terms and conditions of the 2 warrants, the Company issued a net of 198,378 shares. No cash was received from the exercise of the warrants.
The Board of Governors of the Federal Reserve System has issued a supervisory letter to bank holding companies that contains guidance on when the board of directors of a bank holding company should eliminate or defer or severely limit dividends, including, for example, when net income available for shareholders for the past four quarters, net of dividends paid during that period, is not sufficient to fully fund the dividends. The letter also contains guidance on the redemption of stock by bank holding companies which urges bank holding companies to advise the Federal Reserve of any such redemption or repurchase of common stock for cash or other value which results in the net reduction of a bank holding company’s capital at the beginning of the quarter below the capital outstanding at the end of the quarter. The Company's payment of cash dividends to date were within the guidelines set forth in the Federal Reserve Board's supervisory letter.
On January 21, 2016, the Board of Directors of the Company authorized a new common stock repurchase program. Under the new common stock repurchase program, the Company may purchase in open market or privately negotiated transactions up to five (5%) percent of its common shares outstanding on the date of the approval of the stock repurchase program, which limitation will be adjusted for any future stock dividends. This new repurchase program replaced the repurchase program authorized on August 3, 2005. The Company repurchased no0 shares during the year ended December 31, 2017, while during the years ended December 31, 20162019, 2018 and 2015, the Company repurchased 2,000 shares for an aggregate price of approximately $24,000 and 31,050 shares for an aggregate price of approximately $359,000, respectively.2017.
20.21. Fair Value Disclosures
U.S. GAAP has established a fair value hierarchy that prioritizes the inputs to valuation methods used to measure fair value. The hierarchy gives the highest priority to unadjusted quoted prices in active markets for identical assets or liabilities (Level 1 measurements) and the lowest priority to unobservable inputs (Level 3 measurements). The three levels of the fair value hierarchy are as follows:
Unadjusted quoted prices in active markets that are accessible at the measurement date for identical, unrestricted assets or liabilities.
Quoted prices in markets that are not active, or inputs that are observable either directly or indirectly, for substantially the full term of the asset or liability.
Prices or valuation techniques that require inputs that are both significant to the fair value measurement and unobservable (i.e., supported with little or no market activity).
An asset’s or liability’s level within the fair value hierarchy is based on the lowest level of input that is significant to the fair value measurement.
A description of the valuation methodologies used for instruments measured at fair value, as well as the general classification of such instruments pursuant to the valuation hierarchy, is set forth below. These valuation methodologies were applied to all of the Company’s financial assets and financial liabilities carried at fair value.
In general, fair value is based upon quoted market prices, where available. If such quoted market prices are not available, fair value is based upon internally developed models that primarily use, as inputs, observable market-based parameters. Valuation adjustments may be made to ensure that financial instruments are recorded at fair value. These adjustments may include amounts to reflect counterparty credit quality and counterparty creditworthiness, among other things, as well as unobservable parameters. Any such valuation adjustments are applied consistently over time. The Company’s valuation methodologies may produce a fair value calculation that may not be indicative of net realizable value or reflective value or reflective of future values. While management believes that the Company’s valuation methodologies are appropriate and consistent with other market participants, the use of different methodologies or assumptions to determine the fair value of certain financial instruments could result in a different estimate of fair value at the reporting date.
Securities Available for Sale: Securities classified as available for sale are reported at fair value utilizing Level 1 and Level 2 inputs. For Level 2 securities, the fair value measurements consider observable data that may include dealer quotes, market spreads, cash flows, the U.S. Treasury yield curve, live trading levels, trade execution data, market consensus prepayment speeds, credit information and the security’s terms and conditions, among other things.
Interest Rate Lock Derivatives. Interest rate lock commitments do not trade in active markets with readily observable prices. The fair value of an interest rate lock commitment is estimated based upon the forward sales price that is obtained in the best efforts commitment at the time the borrower locks in the interest rate on the loan and the probability that the locked rate commitment will close.
Impaired loans: Loans included in the following table are those which the Company has measured and recognized impairment based generally on the fair value of the loan’s collateral. Fair value is generally determined based upon independent third party appraisals of the properties or discounted expected cash flows based on the expected proceeds.flows. These assets are included as Level 3 fair values based upon the lowest level of input that is significant to the fair value measurements. The fair value consists of the loan balances less specific valuation allowances.
Other Real Estate Owned. Foreclosed properties are adjusted to fair value less estimated selling costs at the time of foreclosure in preparation for transfer from portfolio loans to other real estate owned (“OREO”), thereby establishing a new accounting basis. The Company subsequently adjusts the fair value of the OREO, utilizing Level 3 inputs on a non-recurring basis to reflect partial write-downs based on the observable market price, current appraised value of the asset or other estimates of fair value. The fair value of other real estate owned is determined using appraisals, which may be discounted based on management’s review and changes in market conditions.
The following table summarizes financial assets and financial liabilities measured at fair value on a recurring basis, segregated by the level of the valuation inputs within the fair value hierarchy utilized to measure fair value:
| | | | December 31, 2017 | December 31, 2019 |
| (In thousands) | Level 1 Inputs | | Level 2 Inputs | | Level 3 Inputs | | Total Fair Value | Level 1 Inputs | | Level 2 Inputs | | Level 3 Inputs | | Total Fair Value |
| Securities available for sale: | | | | | | | | | | | | | | |
U.S. Treasury Securities and obligations of U.S. Government sponsored corporations ("GSE") | $ | — |
| | $ | 1,967 |
| | $ | — |
| | $ | 1,967 |
| $ | — |
| | $ | 764 |
| | $ | — |
| | $ | 764 |
|
Residential collateralized mortgage obligations - GSE | — |
| | 27,325 |
| | — |
| | 27,325 |
| — |
| | 53,175 |
| | — |
| | 53,175 |
|
Residential mortgage backed securities-GSE | — |
| | 14,288 |
| | — |
| | 14,288 |
| — |
| | 18,387 |
| | — |
| | 18,387 |
|
Obligations of state and political subdivisions | — |
| | 19,720 |
| | — |
| | 19,720 |
| — |
| | 33,519 |
| | — |
| | 33,519 |
|
| Trust preferred debt securities - single issuer | — |
| | 2,349 |
| | — |
| | 2,349 |
| — |
| | 1,442 |
| | — |
| | 1,442 |
|
| Corporate debt securities | 16,080 |
| | 11,603 |
| | — |
| | 27,683 |
| 11,151 |
| | 12,128 |
| | — |
| | 23,279 |
|
| Other debt securities | — |
| | 12,126 |
| | — |
| | 12,126 |
| — |
| | 25,216 |
| | — |
| | 25,216 |
|
| Interest rate lock derivative | | — |
| | 159 |
| | — |
| | 159 |
|
| Total | $ | 16,080 |
| | $ | 89,378 |
| | $ | — |
| | $ | 105,458 |
| $ | 11,151 |
| | $ | 144,790 |
| | $ | — |
| | $ | 155,941 |
|
| | | | December 31, 2016 | December 31, 2018 |
| (In thousands) | Level 1 Inputs | | Level 2 Inputs | | Level 3 Inputs | | Total Fair Value | Level 1 Inputs | | Level 2 Inputs | | Level 3 Inputs | | Total Fair Value |
| Securities available for sale: | |
| | |
| | |
| | |
| |
| | |
| | |
| | |
|
U.S. Treasury Securities and obligations of U.S Government sponsored corporations (“GSE”) | $ | — |
| | $ | 3,479 |
| | $ | — |
| | $ | 3,479 |
| $ | — |
| | $ | 2,952 |
| | $ | — |
| | $ | 2,952 |
|
Residential collateralized mortgage obligations - GSE | — |
| | 22,560 |
| | — |
| | 22,560 |
| — |
| | 48,183 |
| | — |
| | 48,183 |
|
Residential mortgage backed securities – GSE | — |
| | 31,476 |
| | — |
| | 31,476 |
| — |
| | 13,882 |
| | — |
| | 13,882 |
|
Obligations of state and political subdivisions | — |
| | 21,400 |
| | — |
| | 21,400 |
| — |
| | 23,342 |
| | — |
| | 23,342 |
|
| Trust preferred debt securities - single issuer | — |
| | 2,272 |
| | — |
| | 2,272 |
| — |
| | 1,329 |
| | — |
| | 1,329 |
|
| Corporate debt securities | 12,826 |
| | 8,942 |
| | — |
| | 21,768 |
| 16,388 |
| | 10,898 |
| | — |
| | 27,286 |
|
| Other debt securities | — |
| | 839 |
| | — |
| | 839 |
| — |
| | 15,248 |
| | — |
| | 15,248 |
|
| Interest rate lock derivative | | — |
| | 79 |
| | — |
| | 79 |
|
| Total | $ | 12,826 |
| | $ | 90,968 |
| | $ | — |
| | $ | 103,794 |
| $ | 16,388 |
| | $ | 115,913 |
| | $ | — |
| | $ | 132,301 |
|
Certain financial assets and financial liabilities are measured at fair value on a nonrecurring basis; that is, the instruments are not measured at fair value on an ongoing basis but are subject to fair value adjustments in certain circumstances (for example, when there is evidence of impairment).
Financial assets and financial liabilities measured at fair value on a non-recurring basis at December 31, 20172019 and 20162018 are as follows:
| | | (In thousands) | Level 1 Inputs | | Level 2 Inputs | | Level 3 Inputs | | Total Fair Value | Level 1 Inputs | | Level 2 Inputs | | Level 3 Inputs | | Total Fair Value |
| December 31, 2017 | | | | | | | | |
| December 31, 2019 | | | | | | | | |
| Impaired loans | — |
| | — |
| | $ | 8,313 |
| | $ | 8,313 |
| — |
| | — |
| | $ | 7,092 |
| | $ | 7,092 |
|
| Other real estate owned | | — |
| | — |
| | 93 |
| | 93 |
|
| | | | | | | | | | | | | | | |
| December 31, 2016 | |
| | |
| | |
| | |
| |
| December 31, 2018 | | |
| | |
| | |
| | |
|
| Impaired loans | — |
| | — |
| | $ | 4,130 |
| | $ | 4,130 |
| — |
| | — |
| | $ | 6,857 |
| | $ | 6,857 |
|
| Other real estate owned | | — |
| | — |
| | 1,460 |
| | 1,460 |
|
Impaired loans, measured at fair value and included in the above table, consisted of 1412 loans having an aggregate balance of $9.0$7.2 million and specific loan loss allowances of $684,000$69,000 at December 31, 20172019 and 98 loans having an aggregate balance of $4.4$7.3 million and specific loan loss allowances of $260,000$453,000 at December 31, 2016.
2018.
The following table presents additional qualitative information about assets measured at fair value on a non-recurring basis and for which the Company has utilized Level 3 inputs to determine fair value:
| | | (Dollars in thousands) | Fair Value Estimate | | Valuation Techniques | | Unobservable Input | | Range (Weighted Average) | Fair Value Estimate | | Valuation Techniques | | Unobservable Input | | Range (Weighted Average) |
| December 31, 2017 | | | | | | | | |
| December 31, 2019 | | | | | | | | |
| Impaired loans | $ | 8,313 |
| | Appraisal of collateral (1) | | Appraisal adjustments (2) | | 0.5%-100% (28.2%) | $ | 7,092 |
| | Appraisal of collateral (1) | | Appraisal adjustments (2) | | 0.1%-40.4% (12.6%) |
| December 31, 2016 | |
| | | | | | | |
| Other real estate owned | | 93 |
| | Appraisal of collateral (1) | | Appraisal adjustments (2) | | 47.0% (47.0%) |
| | | | |
| December 31, 2018 | | |
| | | | | | |
| Impaired loans | $ | 4,130 |
| | Appraisal of collateral (1) | | Appraisal adjustments (2) | | 3%-100% (29.1%) | $ | 6,857 |
| | Appraisal of collateral (1) | | Appraisal adjustments (2) | | 0.5%-100% (28.2%) |
| Other real estate owned | | $ | 1,460 |
| | Appraisal of collateral (1) | | Appraisal adjustments (2) | | 47%-80% (63.5%) |
| |
| (1) | Fair value is generally determined through independent appraisals of the underlying collateral, which generally include various Level 3 inputs that are not identifiable. |
| |
| (2) | Includes qualitative adjustments by management and estimated liquidation expenses. |
The following is a summary of the fair value and the carrying value of all of the Company’s financial instruments. For the Company and the Bank, as for most financial institutions, the bulk of assets and liabilities are considered financial instruments. Many of the financial instruments lack an available trading market as characterized by a willing buyer and willing seller engaging in an exchange transaction. Therefore, significant estimations and present value calculations are used. Changes in assumptions could significantly affect these estimates.
Estimated fair values have been determined by using the best available data and an estimation methodology suitable for each category of financial instruments as follows:
Cash and Cash Equivalents, Accrued Interest Receivable and Accrued Interest Payable: The carrying amounts reported on the balance sheet for cash and cash equivalents, accrued interest receivable and accrued interest payable approximate fair value.
Securities Held to Maturity: The fair values of securities held to maturity are determined in the same manner as for securities available for sale.
Loans Held For Sale: The fair values of loans held for sale are determined, when possible, using prices based on the best efforts commitment by the purchaser of the loan or quoted secondary market prices. If no such quoted market prices exist, fair values are determined using quoted prices for similar loans, adjusted for the specific attributes of the loans.
SBA servicing asset: Servicing assets do not trade in an active market with readily observable prices. The Company estimates the fair value of the SBA servicing asset using a discounted cash flow model, which incorporates assumptions based on observable discount rates and prepayment speeds.
Interest rate lock derivatives: Interest rate lock commitments do not trade in active markets with readily observable prices. The fair value of the interest rate lock commitments is estimated based upon the forward sales price that is obtained in the best efforts commitment at the time the borrower locks in the interest rate on the loan and the probability that the locked rate commitment will close.
Federal Home Loan Bank Stock: FHLB stock is carried at cost. The carrying value approximates fair value based upon the redemption price provision of the FHLB stock.
Gross Loans Receivable: The fair values of loans, excluding impaired loans subject to specific loss reserves, are estimated using discounted cash flow analyses and market rates at the balance sheet date that reflect the credit and interest rate-risk inherent in the loans. Projected future cash flows are calculated based upon contractual maturity or call dates, projected repayments and prepayments of principal. Generally, for variable rate loans that re-price frequently and with no significant change in credit risk, fair values are based on carrying values.
Deposit Liabilities: The fair values disclosed for demand deposits (e.g., interest and non-interest demand and savings accounts) are, by definition, equal to the amount payable on demand at the reporting date (i.e., their carrying amounts). Fair values of certificates of deposit are estimated using a discounted cash flow calculation that applies interest rates currently being offered in the market on certificates to a schedule of aggregated expected monthly maturities on time deposits.
Borrowings and Subordinated Debentures: The carrying amounts of short-term borrowings approximate their fair values. The fair values of long-term FHLB advances and subordinated debentures are estimated using discounted cash flow analysis, based on quoted or estimated interest rates for new borrowings with similar credit risk characteristics, terms and remaining maturity.
The fair values and the carrying value of financial instruments at December 31, 20172019 and 20162018 were as follows:
| | | | 2017 | 2019 |
| (In thousands) | Carrying Value | | Level 1 Inputs | | Level 2 Inputs | | Level 3 Inputs | | Fair Value | Carrying Value | | Level 1 Inputs | | Level 2 Inputs | | Level 3 Inputs | | Fair Value |
| Cash and cash equivalents | $ | 18,754 |
| | $ | 18,754 |
| | $ | — |
| | $ | — |
| | $ | 18,754 |
| $ | 14,842 |
| | $ | 14,842 |
| | $ | — |
| | $ | — |
| | $ | 14,842 |
|
| Securities available for sale | 105,458 |
| | 16,080 |
| | 89,378 |
| | — |
| | 105,458 |
| 155,782 |
| | 11,151 |
| | 144,631 |
| | — |
| | 155,782 |
|
| Securities held to maturity | 110,267 |
| | — |
| | 111,865 |
| | — |
| | 111,865 |
| 76,620 |
| | — |
| | 78,223 |
| | — |
| | 78,223 |
|
| Loans held for sale | 4,254 |
| | — |
| | 4,539 |
| | — |
| | 4,539 |
| 5,927 |
| | — |
| | 6,093 |
| | — |
| | 6,093 |
|
| Loans | 789,906 |
| | — |
| | — |
| | 784,064 |
| | 784,064 |
| |
| Net loans | | 1,206,757 |
| | — |
| | — |
| | 1,243,088 |
| | 1,243,088 |
|
| SBA servicing asset | 726 |
| | — |
| | 1,016 |
| | — |
| | 1,016 |
| 930 |
| | — |
| | 1,245 |
| | — |
| | 1,245 |
|
| Interest rate lock derivative | 135 |
| | — |
| | 135 |
| | — |
| | 135 |
| 159 |
| | — |
| | 159 |
| | — |
| | 159 |
|
| Accrued interest receivable | 3,478 |
| | — |
| | 3,478 |
| | — |
| | 3,478 |
| 4,945 |
| | — |
| | 4,945 |
| | — |
| | 4,945 |
|
| FHLB Stock | 1,490 |
| | — |
| | 1,490 |
| | — |
| | 1,490 |
| 4,176 |
| | — |
| | 4,176 |
| | — |
| | 4,176 |
|
| Deposits | (922,006 | ) | | — |
| | (920,732 | ) | | — |
| | (920,732 | ) | (1,277,362 | ) | | — |
| | (1,278,166 | ) | | — |
| | (1,278,166 | ) |
| Borrowings | (20,500 | ) | | — |
| | (20,500 | ) | | — |
| | (20,500 | ) | |
| Short-term borrowings | | (92,050 | ) | | — |
| | (92,050 | ) | | — |
| | (92,050 | ) |
| Redeemable subordinated debentures | (18,557 | ) | | — |
| | (12,326 | ) | | — |
| | (12,326 | ) | (18,557 | ) | | — |
| | (12,837 | ) | | — |
| | (12,837 | ) |
| Accrued interest payable | (804 | ) | | — |
| | (804 | ) | | — |
| | (804 | ) | (1,592 | ) | | — |
| | (1,592 | ) | | — |
| | (1,592 | ) |
| | | | 2016 | 2018 |
| (In thousands) | Carrying Value | | Level 1 Inputs | | Level 2 Inputs | | Level 3 Inputs | | Fair Value | Carrying Value | | Level 1 Inputs | | Level 2 Inputs | | Level 3 Inputs | | Fair Value |
| Cash and cash equivalents | $ | 14,886 |
| | $ | 14,886 |
| | $ | — |
| | $ | — |
| | $ | 14,886 |
| $ | 16,844 |
| | $ | 16,844 |
| | $ | — |
| | $ | — |
| | $ | 16,844 |
|
| Securities available for sale | 103,794 |
| | 12,826 |
| | 90,968 |
| | — |
| | 103,794 |
| 132,222 |
| | 16,388 |
| | 115,834 |
| | — |
| | 132,222 |
|
| Securities held to maturity | 126,810 |
| | — |
| | 128,559 |
| | — |
| | 128,559 |
| 79,572 |
| | — |
| | 80,204 |
| | — |
| | 80,204 |
|
| Loans held for sale | 14,829 |
| | — |
| | 15,103 |
| | — |
| | 15,103 |
| 3,020 |
| | — |
| | 3,141 |
| | — |
| | 3,141 |
|
| Loans | 724,808 |
| | — |
| | — |
| | 716,492 |
| | 716,492 |
| |
| Net loans | | 874,762 |
| | — |
| | — |
| | 874,742 |
| | 874,742 |
|
| SBA servicing asset | 605 |
| | — |
| | 822 |
| | — |
| | 822 |
| 991 |
| | — |
| | 1,490 |
| | — |
| | 1,490 |
|
| Interest rate lock derivative | 123 |
| | — |
| | 123 |
| | — |
| | 123 |
| 79 |
| | — |
| | 79 |
| | — |
| | 79 |
|
| Accrued interest receivable | 3,095 |
| | — |
| | 3,095 |
| | — |
| | 3,095 |
| 3,860 |
| | — |
| | 3,860 |
| | — |
| | 3,860 |
|
| FHLB Stock | 3,962 |
| | — |
| | 3,962 |
| | — |
| | 3,962 |
| 3,929 |
| | — |
| | 3,929 |
| | — |
| | 3,929 |
|
| Deposits | (834,516 | ) | | — |
| | (834,050 | ) | | — |
| | (834,050 | ) | (950,672 | ) | | — |
| | (949,813 | ) | | — |
| | (949,813 | ) |
| Borrowings | (73,050 | ) | | — |
| | (73,222 | ) | | — |
| | (73,222 | ) | |
| Short-term borrowings | | (71,775 | ) | | — |
| | (71,775 | ) | | — |
| | (71,775 | ) |
| Redeemable subordinated debentures | (18,557 | ) | | — |
| | (11,922 | ) | | — |
| | (11,922 | ) | (18,557 | ) | | — |
| | (12,774 | ) | | — |
| | (12,774 | ) |
| Accrued interest payable | (866 | ) | | — |
| | (866 | ) | | — |
| | (866 | ) | (1,228 | ) | | — |
| | (1,228 | ) | | — |
| | (1,228 | ) |
Loan commitments and standby letters of credit as of December 31, 20172019 and 20162018 were based on fees charged for similar agreements; accordingly, the estimated fair valuevalues of loan commitments and standby letters of credit were nominal.
22. Revenue from Contracts with Customers
21.All of the Company’s revenue from contracts with customers in the scope of Topic 606 is recognized within non-interest income. The following table presents the Company’s sources of non-interest income for the years ended December 31, 2019, 2018 and 2017. Items outside the scope of Topic 606 are noted as such.
|
| | | | | | | | | | | |
| | For the Years Ended December 31, |
| (Dollars in thousands) | 2019 | | 2018 | | 2017 |
| Service charges on deposits: | | | | | |
| Overdraft fees | $ | 368 |
| | $ | 343 |
| | $ | 300 |
|
| Other | 295 |
| | 295 |
| | 296 |
|
| Interchange income | 460 |
| | 405 |
| | 347 |
|
| Other income - in scope | 412 |
| | 521 |
| | 340 |
|
| (Loss) gain on sale of OREO | (101 | ) | | — |
| | 5 |
|
Income on BOLI (1) | 623 |
| | 575 |
| | 522 |
|
Gains on sales of loans, net (1) | 4,885 |
| | 4,475 |
| | 5,149 |
|
Loan servicing fees (1) | 711 |
| | 656 |
| | 576 |
|
Net gains on sales and calls of securities (1) | 30 |
| | 12 |
| | 129 |
|
Gain from bargain purchase (1) | — |
| | 230 |
| | — |
|
Other income (1) | 554 |
| | 406 |
| | 576 |
|
| | $ | 8,237 |
| | $ | 7,918 |
| | $ | 8,240 |
|
(1) Not within the scope of Topic 606
A description of the Company’s revenue streams accounted for under Topic 606 follows:
Service Charges on Deposits: The Company earns fees from its deposit account customers for transaction-based, account maintenance and overdraft services. Transaction-based fees, which include services such as ATM use fees, stop payment charges, statement rendering and ACH fees, are recognized at the time the transaction is executed as that is the point in time the Company fulfills the customer’s request. Account maintenance fees, which relate primarily to monthly maintenance, are earned over the course of a month, representing the period over which the Company satisfies the performance obligation. Overdraft fees are
recognized at the point in time that the overdraft occurs. Service charges on deposits are withdrawn from the customer’s account balance.
Interchange Income: The Company earns interchange fees from debit cardholder transactions conducted through the Visa payment network. Interchange fees from cardholder transactions represent a percentage of the underlying transaction value and are recognized daily, concurrently with the transaction processing services provided to the cardholder.
Other Income: The Company earns other fees from the execution of and receipt of wire transfers for customers, the rental of safe deposit boxes and fees for other services provided to customers. These fees are recognized at the time the transaction is executed or the service is provided as that is the point in time the Company fulfills the customer’s request.
Gain or Loss on Sales of OREO: The Company records a gain or loss from the sale of OREO when control of the property transfers to the buyer, which generally occurs at the time of an executed deed. The Company generally does not finance the sale of OREO to the buyer; however, in determining the gain or loss on the sale, the Company adjusts the transaction price and related gain or loss on sale if a significant financing component is present.
23. Leases
At December 31, 2019, the Company had 37 operating leases under which the Company is a lessee. Of the 37 leases, 23 leases were for real property, including leases for 19 of the Company’s branch offices and 4 leases were for general office space including the Company’s headquarters. All of the real property leases include one or more options to extend the lease term. NaN of the branch office leases are for the land on which the branch offices are located and the Company owns the leasehold improvements.
In addition, the Company had 12 leases for office equipment, which are primarily copiers and printers and 2 automobile leases. None of these leases include extensions and generally have three to five year terms.
The Company does not have any finance leases.
For the years ended December 31, 2019 and 2018, the Company recognized rent and equipment expense associated with these leases as follows:
|
| | | | | | | |
| (In thousands) | 2019 | | 2018 |
| Operating lease cost: | | | |
| Fixed rent expense and equipment expense | $ | 2,021 |
| | $ | 2,055 |
|
| Short-term lease expense | 12 |
| | — |
|
| Net lease cost | $ | 2,033 |
| | $ | 2,055 |
|
|
| | | | | | | |
| (In thousands) | 2019 | | 2018 |
| Lease cost - occupancy expense | $ | 1,778 |
| | $ | 1,801 |
|
| Lease cost - other expense | 255 |
| | 254 |
|
| Net lease cost | $ | 2,033 |
| | $ | 2,055 |
|
Rent expense aggregated $2.1 million, $1.8 million and $1.5 million for the years ended December 31, 2019, 2018 and 2017, respectively.
Following is the cash and non-cash activities that were associated with the leases for the years ended December 31, 2019 and 2018:
|
| | | | | | | |
| | For the Year Ended December 31, |
| (In thousands) | 2019 | | 2018 |
| Cash paid for amounts included in the measurement of lease liabilities: | | | |
| Operating cash flows from operating leases | $ | 1,840 |
| | $ | 2,055 |
|
| | | | |
| Non-cash investing and financing activities: | | | |
| Additions to ROU assets obtained from: | | | |
| New operating lease liabilities | | | |
| Upon adoption | $ | 15,674 |
| | $ | — |
|
| New or acquired during the year | 3,765 |
| | — |
|
The future payments due under operating leases at December 31, 2019 and 2018 were as follows:
|
| | | | | | | |
| | At December 31, |
| (In thousands) | 2019 | | 2018 |
| Due in less than one year | $ | 2,070 |
| | $ | 1,525 |
|
| Due in one year but less than two years | 2,035 |
| | 1,392 |
|
| Due in two years but less than three years | 2,022 |
| | 1,245 |
|
| Due in three years but less than four years | 1,984 |
| | 1,008 |
|
| Due in four years but less than five years | 1,847 |
| | 798 |
|
| Thereafter | 15,118 |
| | 2,284 |
|
| Total future payments | $ | 25,076 |
| | $ | 8,252 |
|
| Less: Implied interest | (6,459 | ) | | — |
|
| Total lease liability | $ | 18,617 |
| | $ | 8,252 |
|
As of December 31, 2019, future payments due under operating leases were based on ASC Topic 842 and included, in general, at least one lease renewal option on all real estate leases except on one land lease where all renewal options were included. As of December 31, 2018, the minimum future payments were disclosed as required by ASC Topic 840 and do not include future rent related to renewal options.
As of December 31, 2019, the weighted-average remaining lease term for all operating leases is 15.2 years. The weighted average discount rate associated with the operating leases as of December 31, 2019 was 3.33%.
24. Parent-only Financial Information
The condensed financial statements of 1STConstitution Bancorp (parent company only) are presented below:
1ST CONSTITUTION BANCORP
Condensed Statements of Financial Condition
(Dollars in Thousands)
| | | | December 31, | December 31, |
| | 2017 | | 2016 | 2019 | | 2018 |
Assets: | | | | | | |
| Cash | $ | 317 |
| | $ | 490 |
| $ | 594 |
| | $ | 425 |
|
| Investment securities | 557 |
| | 557 |
| 557 |
| | 557 |
|
| Investment in subsidiary | 126,846 |
| | 120,306 |
| 188,257 |
| | 145,096 |
|
| Other assets | 2,519 |
| | 2,451 |
| — |
| | — |
|
| Total Assets | $ | 130,239 |
| | $ | 123,804 |
| $ | 189,408 |
| | $ | 146,078 |
|
| Liabilities And Shareholders’ Equity | | | | | | |
| Other liabilities | $ | 29 |
| | $ | 446 |
| $ | 273 |
| | $ | 436 |
|
| Subordinated debentures | 18,557 |
| | 18,557 |
| 18,557 |
| | 18,557 |
|
| Shareholders’ equity | 111,653 |
| | 104,801 |
| 170,578 |
| | 127,085 |
|
| Total Liabilities and Shareholders’ Equity | $ | 130,239 |
| | $ | 123,804 |
| $ | 189,408 |
| | $ | 146,078 |
|
1ST CONSTITUTION BANCORP
Consolidated Statements of Income and Comprehensive Income
(Dollars in Thousands)
| | | | Year ended December 31, | Year ended December 31, |
| | 2017 | | 2016 | | 2015 | 2019 | | 2018 | | 2017 |
| Income: | | | | | | | | | | |
| Interest income | $ | 16 |
| | $ | 13 |
| | $ | 11 |
| $ | — |
| | $ | — |
| | $ | 16 |
|
| Dividend income from subsidiary | 1,826 |
| | 1,240 |
| | 366 |
| 3,369 |
| | 2,830 |
| | 1,826 |
|
| Total Income | 1,842 |
| | 1,253 |
| | 377 |
| 3,369 |
| | 2,830 |
| | 1,842 |
|
| Expense: | | | | | | | | | | |
| Interest expense | 535 |
| | 440 |
| | 366 |
| 748 |
| | 694 |
| | 535 |
|
| Total Expense | 535 |
| | 440 |
| | 366 |
| 748 |
| | 694 |
| | 535 |
|
| Income before income taxes and equity in undistributed income of subsidiaries | 1,307 |
| | 813 |
| | 11 |
| 2,621 |
| | 2,136 |
| | 1,307 |
|
| Income tax benefit | (177 | ) | | (146 | ) | | (122 | ) | (155 | ) | | (146 | ) | | (177 | ) |
| Income before equity in undistributed income of subsidiaries | 1,484 |
| | 959 |
| | 133 |
| 2,776 |
| | 2,282 |
| | 1,484 |
|
| Equity in undistributed income of subsidiaries | 5,444 |
| | 8,326 |
| | 8,531 |
| 10,858 |
| | 9,766 |
| | 5,444 |
|
| Net Income | 6,928 |
| | 9,285 |
| | 8,664 |
| 13,634 |
| | 12,048 |
| | 6,928 |
|
| Equity in other comprehensive loss of subsidiaries | (27 | ) | | (470 | ) | | (378 | ) | |
| Equity in other comprehensive income (loss) of subsidiaries | | 2,024 |
| | (1,097 | ) | | (27 | ) |
| Comprehensive Income | 6,901 |
| | 8,815 |
| | 8,286 |
| $ | 15,658 |
| | $ | 10,951 |
| | $ | 6,901 |
|
1ST CONSTITUTION BANCORP
Condensed Statements of Cash Flows
(Dollars in Thousands)
| | | | Year Ended December 31, | Year Ended December 31, |
| | 2017 | | 2016 | | 2015 | 2019 | | 2018 | | 2017 |
| Operating Activities: | | | | | | | | | | |
| Net Income | $ | 6,928 |
| | $ | 9,285 |
| | $ | 8,664 |
| $ | 13,634 |
| | $ | 12,048 |
| | $ | 6,928 |
|
| Adjustments: | | | | | | | | | | |
| Increase in other assets | (68 | ) | | (126 | ) | | (92 | ) | |
| (Decrease) increase in other liabilities | (16 | ) | | 408 |
| | — |
| |
| Decrease (increase) in other assets | | — |
| | 2,520 |
| | (68 | ) |
| Increase (decrease) in other liabilities | | (163 | ) | | 407 |
| | (16 | ) |
| Equity in undistributed income of subsidiaries | (5,444 | ) | | (8,326 | ) | | (8,531 | ) | (10,858 | ) | | (9,766 | ) | | (5,444 | ) |
| Net cash provided by operating activities | 1,400 |
| | 1,241 |
| | 41 |
| 2,613 |
| | 5,209 |
| | 1,400 |
|
| | | | | | | | | | | |
| Cash Flows From Investing Activities: | | | | | | | | | | |
| Investment in subsidiary | (130 | ) | | (501 | ) | | 37 |
| — |
| | — |
| | (130 | ) |
| Net cash (used in) provided by investing activities | (130 | ) | | (501 | ) | | 37 |
| |
| Cash paid for NJCB merger | | — |
| | (3,069 | ) | | |
| Net cash used in investing activities | | — |
| | (3,069 | ) | | (130 | ) |
| | | | | | | | | | | |
| Cash Flows From Financing Activities: | | | | | | | | | | |
| Cash dividend paid | (1,690 | ) | | (399 | ) | | — |
| (2,593 | ) | | (2,120 | ) | | (1,690 | ) |
| Exercise of stock options | 247 |
| | 96 |
| | 292 |
| 149 |
| | 88 |
| | 247 |
|
| Purchase of treasury stock, net | — |
| | (24 | ) | | (359 | ) | — |
| | — |
| | — |
|
| Net cash used in financing activities | (1,443 | ) | | (327 | ) | | (67 | ) | (2,444 | ) | | (2,032 | ) | | (1,443 | ) |
| | | | | | | | | | | |
| Net (decrease) increase in cash | (173 | ) | | 413 |
| | 11 |
| |
| Net increase (decrease) in cash | | 169 |
| | 108 |
| | (173 | ) |
| Cash at beginning of year | 490 |
| | 77 |
| | 66 |
| 425 |
| | 317 |
| | 490 |
|
| Cash at end of year | $ | 317 |
| | $ | 490 |
| | $ | 77 |
| $ | 594 |
| | $ | 425 |
| | $ | 317 |
|
25. Quarterly Financial Data (Unaudited)
The following table sets forth a condensed summary of the Company’s quarterly results of operations for the years ended December 31, 2017, 20162019, 2018 and 2015.2017. In the fourth quarter 2019, the Company completed the acquisition of Shore and the quarterly data for the quarter ended December 31, 2019 includes results of former Shore operations.
| | | Selected 2017 Quarterly Data | | |
| Selected 2019 Quarterly Data | | |
| (Dollars in thousands, except per share data) | December 31 | | September 30 | | June 30 | | March 31 | December 31 | | September 30 | | June 30 | | March 31 |
| Interest income | $ | 11,227 |
| | $ | 10,811 |
| | $ | 10,142 |
| | $ | 9,483 |
| $ | 16,748 |
| | $ | 14,874 |
| | $ | 14,553 |
| | $ | 13,915 |
|
| Interest expense | 1,418 |
| | 1,451 |
| | 1,340 |
| | 1,289 |
| 3,589 |
| | 3,357 |
| | 3,120 |
| | 2,688 |
|
| Net interest income | 9,809 |
| | 9,360 |
| | 8,802 |
| | 8,194 |
| 13,159 |
| | 11,517 |
| | 11,433 |
| | 11,227 |
|
| Provision for loan losses | 150 |
| | 150 |
| | 150 |
| | 150 |
| 300 |
| | 350 |
| | 400 |
| | 300 |
|
| Net interest income after provision for loan losses | 9,659 |
| | 9,210 |
| | 8,652 |
| | 8,044 |
| 12,859 |
| | 11,167 |
| | 11,033 |
| | 10,927 |
|
| Non-interest income | 1,930 |
| | 2,112 |
| | 1,785 |
| | 2,413 |
| 1,995 |
| | 2,206 |
| | 2,170 |
| | 1,866 |
|
| Non-interest expense | 8,064 |
| | 7,609 |
| | 7,677 |
| | 7,656 |
| 10,453 |
| | 8,436 |
| | 8,566 |
| | 8,094 |
|
| Income before income taxes | 3,525 |
| | 3,713 |
| | 2,760 |
| | 2,801 |
| 4,401 |
| | 4,937 |
| | 4,637 |
| | 4,699 |
|
| Income taxes | 2,951 |
| | 1,227 |
| | 841 |
| | 852 |
| 1,157 |
| | 1,314 |
| | 1,267 |
| | 1,302 |
|
| Net income | $ | 574 |
| | $ | 2,486 |
| | $ | 1,919 |
| | $ | 1,949 |
| $ | 3,244 |
| | $ | 3,623 |
| | $ | 3,370 |
| | $ | 3,397 |
|
Net income per common share:(1) | | | | | | | | |
Earnings per common share:(1) | | | | | | | | |
| Basic | $ | 0.07 |
| | $ | 0.31 |
| | $ | 0.24 |
| | $ | 0.24 |
| $ | 0.34 |
| | $ | 0.42 |
| | $ | 0.39 |
| | $ | 0.39 |
|
| Diluted | 0.07 |
| | 0.30 |
| | 0.23 |
| | 0.23 |
| 0.34 |
| | 0.42 |
| | 0.39 |
| | 0.39 |
|
|
| | | | | | | | | | | | | | | |
| Selected 2018 Quarterly Data | |
| (Dollars in thousands, except per share data) | December 31 | | September 30 | | June 30 | | March 31 |
| Interest income | $ | 13,754 |
| | $ | 13,783 |
| | $ | 12,881 |
| | $ | 11,055 |
|
| Interest expense | 2,415 |
| | 2,387 |
| | 1,863 |
| | 1,376 |
|
| Net interest income | 11,339 |
| | 11,396 |
| | 11,018 |
| | 9,679 |
|
| Provision for loan losses | 225 |
| | 225 |
| | 225 |
| | 225 |
|
| Net interest income after provision for loan losses | 11,114 |
| | 11,171 |
| | 10,793 |
| | 9,454 |
|
| Non-interest income | 1,836 |
| | 2,154 |
| | 2,043 |
| | 1,885 |
|
| Non-interest expense | 8,295 |
| | 7,894 |
| | 10,251 |
| | 7,645 |
|
| Income before income taxes | 4,655 |
| | 5,431 |
| | 2,585 |
| | 3,694 |
|
| Income taxes | 1,342 |
| | 1,420 |
| | 714 |
| | 841 |
|
| Net income | $ | 3,313 |
| | $ | 4,011 |
| | $ | 1,871 |
| | $ | 2,853 |
|
Earnings per common share:(1) | |
| | |
| | |
| | |
|
| Basic | $ | 0.39 |
| | $ | 0.48 |
| | $ | 0.22 |
| | $ | 0.35 |
|
| Diluted | 0.38 |
| | 0.46 |
| | 0.22 |
| | 0.34 |
|
|
| | | | | | | | | | | | | | | |
| Selected 2016 Quarterly Data | |
| (Dollars in thousands, except per share data) | December 31 | | September 30 | | June 30 | | March 31 |
| Interest income | $ | 9,983 |
| | $ | 10,399 |
| | $ | 9,476 |
| | $ | 9,277 |
|
| Interest expense | 1,361 |
| | 1,355 |
| | 1,257 |
| | 1,185 |
|
| Net interest income | 8,622 |
| | 9,044 |
| | 8,219 |
| | 8,092 |
|
| Provision for loan losses | — |
| | — |
| | (100 | ) | | (200 | ) |
| Net interest income after provision for loan losses | 8,622 |
| | 9,044 |
| | 8,319 |
| | 8,292 |
|
| Non-interest income | 2,010 |
| | 1,769 |
| | 1,548 |
| | 1,595 |
|
| Non-interest expense | 7,572 |
| | 6,662 |
| | 6,440 |
| | 6,617 |
|
| Income before income taxes | 3,060 |
| | 4,151 |
| | 3,427 |
| | 3,270 |
|
| Income taxes | 1,006 |
| | 1,456 |
| | 1,113 |
| | 1,048 |
|
| Net income | $ | 2,054 |
| | $ | 2,695 |
| | $ | 2,314 |
| | $ | 2,222 |
|
Net income per common share:(1) | |
| | |
| | |
| | |
|
| Basic | $ | 0.26 |
| | $ | 0.34 |
| | $ | 0.29 |
| | $ | 0.28 |
|
| Diluted | 0.25 |
| | 0.33 |
| | 0.28 |
| | 0.27 |
|
| | | Selected 2015 Quarterly Data | | |
| Selected 2017 Quarterly Data | | | | | | | | |
| (Dollars in thousands, except per share data) | December 31 | | September 30 | | June 30 | | March 31 | December 31 | | September 30 | | June 30 | | March 31 |
| Interest income | $ | 9,467 |
| | $ | 10,422 |
| | $ | 10,143 |
| | $ | 9,291 |
| $ | 11,227 |
| | $ | 10,811 |
| | $ | 10,142 |
| | $ | 9,483 |
|
| Interest expense | 1,170 |
| | 1,169 |
| | 1,153 |
| | 1,144 |
| 1,418 |
| | 1,451 |
| | 1,340 |
| | 1,289 |
|
| Net interest income | 8,297 |
| | 9,253 |
| | 8,990 |
| | 8,147 |
| 9,809 |
| | 9,360 |
| | 8,802 |
| | 8,194 |
|
| Provision for loan losses | 500 |
| | 100 |
| | — |
| | 500 |
| 150 |
| | 150 |
| | 150 |
| | 150 |
|
| Net interest income after provision for loan losses | 7,797 |
| | 9,153 |
| | 8,990 |
| | 7,647 |
| 9,659 |
| | 9,210 |
| | 8,652 |
| | 8,044 |
|
| Non-interest income | 926 |
| | 1,436 |
| | 2,046 |
| | 2,178 |
| 1,930 |
| | 2,112 |
| | 1,785 |
| | 2,413 |
|
| Non-interest expense | 6,349 |
| | 6,979 |
| | 7,609 |
| | 6,510 |
| 8,064 |
| | 7,609 |
| | 7,677 |
| | 7,656 |
|
| Income before income taxes | 2,374 |
| | 3,610 |
| | 3,427 |
| | 3,315 |
| 3,525 |
| | 3,713 |
| | 2,760 |
| | 2,801 |
|
| Income taxes | 747 |
| | 1,148 |
| | 1,112 |
| | 1,055 |
| 2,951 |
| | 1,227 |
| | 841 |
| | 852 |
|
| Net income | $ | 1,627 |
| | $ | 2,462 |
| | $ | 2,315 |
| | $ | 2,260 |
| $ | 574 |
| | $ | 2,486 |
| | $ | 1,919 |
| | $ | 1,949 |
|
Net income per common share:(1) | |
| | |
| | |
| | |
| |
| Earnings per common share:(1) | | |
| | |
| | |
| | |
|
| Basic | $ | 0.21 |
| | $ | 0.31 |
| | $ | 0.29 |
| | $ | 0.29 |
| $ | 0.07 |
| | $ | 0.31 |
| | $ | 0.24 |
| | $ | 0.24 |
|
| Diluted | 0.20 |
| | 0.30 |
| | 0.29 |
| | 0.28 |
| 0.07 |
| | 0.30 |
| | 0.23 |
| | 0.23 |
|
(1) The sum of quarterly income per basic and diluted common share may not equal net income per basic and diluted common share, respectively, for the years ended December 31, 2017, 20162019, 2018 and 20152017 due to differences in the computation of weighted average diluted common shares on a quarterly and annual basis.
23. Subsequent Event
On November 6, 2017, the Company and the Bank entered into an Agreement and Plan of Merger (the "Merger Agreement") with New Jersey Community Bank ("NJCB"), providing for the merger of NJCB with and into the Bank, with the Bank as the surviving entity (the "Merger"). If the Merger is completed, shareholders of NJCB will be entitled to receive, for each outstanding share of NJCB common stock that they own at the effective time of the Merger, a combination of common stock of the Company and cash as follows:
(i) 0.1309 of a share of common stock of the Company, subject to the payment of cash in lieu of fractional shares, which stock exchange ratio was based on the average closing price of $19.25 for a share of common stock of the Company during the measurement period specified in the Merger Agreement; and
(ii) $1.60 in cash, subject to $0.21 being placed in escrow in accordance with the terms and conditions of the Merger Agreement to cover costs and expenses that may be incurred by the Company after the effective time of the Merger as a result of specific pending litigation against NJCB.
The Company and the Bank have submitted and received all required regulatory approvals and waivers. The Company has filed a registration statement on Form S-4, which includes a proxy statement of NJCB and a prospectus of the Company, with the SEC to register shares of common stock of the Company to be issued to shareholders of NJCB. The registration statement on Form S-4 was declared effective on February 15, 2018 by the SEC and the proxy statement-prospectus was mailed to shareholders of NJCB on or about February 22, 2018. The closing of the Merger remains subject to a number of conditions, including approval of the Merger Agreement by NJCB shareholders at a special meeting of shareholders scheduled to be held on March 22, 2018. The closing of the Merger is anticipated to take place during the second quarter of 2018.
On December 31, 2017, NJCB had approximately $103.1 million in assets, approximately $79.0 million in loans, approximately $93.7 million in deposits and approximately $8.9 million in shareholders' equity. NJCB operates two offices in Monmouth County, New Jersey: its main office in Freehold and a branch office in Neptune City. The Merger will be accounted for using the acquisition method of accounting as prescribed by U.S. GAAP.
SIGNATURES
Pursuant to the requirements of Section 13 or 15(d) of the Securities Exchange Act of 1934, the registrant has duly caused this report to be signed on its behalf by the undersigned, thereunto duly authorized.
|
| | | |
| | | 1ST CONSTITUTION BANCORP |
| | | | |
| Date: | March 19, 201816, 2020 | By: | /s/ ROBERT F. MANGANO |
| | | | Robert F. Mangano |
| | | | President and Chief Executive Officer |
| | | | (Principal Executive Officer) |
Pursuant to the requirements of the Securities Exchange Act of 1934, this report has been signed below by the following persons on behalf of the registrant and in the capacities and on the dates indicated.
|
| | | | |
| Signature | | Capacity | | Date |
/s/ ROBERT F. MANGANO | | President, Chief Executive Officer and Director | | March 19, 201816, 2020 |
Robert F. Mangano
| | (Principal Executive Officer) | | |
| /s/ STEPHEN J. GILHOOLY | | Senior Vice President, Treasurer and Chief Financial Officer | | March 16, 2020 |
Stephen J. Gilhooly
/s/ NAQI A. NAQVI | | (Principal Financial Officer)
Senior Vice President and Chief Accounting Officer | | March 16, 2020 |
| Naqi A. Naqvi | | (Principal Accounting Officer) | | |
| /s/ CHARLES S. CROW, III | | Chairman of the Board | | March 19, 201816, 2020 |
Charles S. Crow, III
/s/ WILLIAM M. RUE | | Director | | March 19, 201816, 2020 |
William M. Rue /s/ EDWIN J. PISANI | | Director | | March 19, 201816, 2020 |
Edwin J. Pisani
/s/ ANTONIO L. CRUZ | | Director | | March 19, 201816, 2020 |
Antonio L. Cruz
/s/ ROY D. TARTAGLIA | | Director | | March 19, 201816, 2020 |
Roy D. Tartaglia /s/ J. LYNNE CANNON | | Director | | March 19, 201816, 2020 |
J. Lynne Cannon
/s/ JAMES G. AARON | | Director | | March 19, 201816, 2020 |
James G. Aaron
/s/ CARMEN M. PENTA | | Director | | March 19, 201816, 2020 |
Carmen M. Penta /s/ WILLIAM J. BARRETT | | Director | | March 19, 201816, 2020 |
William J. Barrett
/s/ STEPHEN J. GILHOOLYRAYMOND R. CICCONE | | Senior Vice President, Treasurer and Chief Financial OfficerDirector | | March 19, 201816, 2020 |
Stephen J. Gilhooly
Raymond R. Ciccone
| | (Principal Financial Officer) | | |