UNITED STATES
SECURITIES AND EXCHANGE COMMISSION
Washington, D.C. 20549

FORM 10-K
| x | ANNUAL REPORT PURSUANT TO SECTION 13 OR 15(d) OF THE SECURITIES EXCHANGE ACT OF 1934 |
For the Fiscal Year Ended December 31, 2009
OR
TRANSITION REPORT PURSUANT TO SECTION 13 OR 15(d) OF THE SECURITIES EXCHANGE ACT OF 1934 | ||
For the Transition Period from to .
Commission File Number: 001-32384
MACQUARIE INFRASTRUCTURE COMPANY LLC
(Exact Name of Registrant as Specified in Its Charter)
| Delaware | 43-2052503 | ||
| (Jurisdiction of Incorporation or Organization) | (IRS Employer Identification No.) | ||
125 West 55th55th Street
New York, New York 10019
(Address of Principal Executive Offices)(Zip (Zip Code)
Registrant’s Telephone Number, Including Area Code:(212) 231-1000
Securities registered pursuantRegistered Pursuant to Section 12(b) of the Act:
Title of Each Class: | Name of Exchange on Which Registered: | ||
Macquarie Infrastructure Company | New York Stock Exchange |
Securities registered pursuant to Section 12(g) of the Act:None
Indicate by check mark if the registrants are collectivelyregistrant is a well-known seasoned issuer, as defined in Rule 405 of the Securities Act. Yesýo No¨x
Indicate by check mark if the registrants are collectivelyregistrant is not required to file reports pursuant to Section 13 or Section 15(d) of the Act. Yes¨o Noýx
Indicate by check mark whether the registrantsregistrant (1) havehas filed all reports required to be filed by Section 13 or 15(d) of the Securities Exchange Act of 1934 during the preceding 12 months (or for such shorter period that the registrants wereregistrant was required to file such reports), and (2) havehas been subject to such filing requirements for the past 90 days. Yesýx No¨o
Indicate by check mark whether the registrant has submitted electronically and posted on its corporate Web site, if any, every Interactive Data File required to be submitted and posted pursuant to Rule 405 of Regulation S-T (§232.405 of this chapter) during the preceding 12 months (or for such shorter period that the registrant was required to submit and post such files). Yeso Noo
Indicate by check mark if disclosure of delinquent filers pursuant to Item 405 of Regulation S-K is not contained herein, and will not be contained, to the best of registrants’ knowledge, in definitive proxy or information statements incorporated by reference in Part III of this Form 10-K or any amendment to this Form 10-K.¨o
Indicate by check mark whether the registrants are collectivelyregistrant is a large accelerated filer, an accelerated filer, a non-accelerated filer, or a non-accelerated filer.smaller reporting company. See definitionthe definitions of “large accelerated filer,” “accelerated filerfiler” and large accelerated filer”“smaller reporting company” in Rule 12b-2 of the Exchange Act. (Check one):
Large Accelerated Filer | Accelerated Filer | Non-accelerated Filer | Smaller Reporting Company o |
Indicate by check mark whether the registrant is a shell company (as defined in Rule 12b-2 of the Exchange Act). Yeso Nox
The aggregate market value of the outstanding shares of trust stock held by non-affiliates of Macquarie Infrastructure Company TrustLLC at June 30, 20062009 was $674,150,614$170,868,634 based on the closing price on the New York Stock Exchange on that date. This calculation does not reflect a determination that persons are affiliates for any other purposes.
There were 37,562,16545,292,913 shares of trust stock without par value outstanding at February 28, 2007.
DOCUMENTS INCORPORATED BY REFERENCE
The definitive proxy statement relating to Macquarie Infrastructure Company Trust’sLLC’s Annual Meeting of Shareholders for fiscal year ended December 31, 2009, to be held May 24, 2007,June 3, 2010, is incorporated by reference in Part III to the extent described therein.
| PART I | ||||||
Item 1. Business | 3 | |||||
Item Risk Factors | 23 | |||||
Item 1B. Unresolved Staff Comments | 37 | |||||
Item 2. Properties | 37 | |||||
Item 3. Legal Proceedings | 39 | |||||
Item 4. | Submission of Matters to a Vote of Security Holders | 39 | ||||
| PART II | ||||||
Item 5. | Market for Registrant’s Common Equity, Related Stockholder Matters and Issuer Purchases of Equity Securities | 40 | ||||
Item 6. Selected Financial Data | 42 | |||||
Item 7. | Management’s Discussion and Analysis of Financial Condition and Results of Operations | 45 | ||||
Item 7A. | Quantitative and Qualitative Disclosures | 94 | ||||
Item 8. | Financial Statements and Supplementary Data | 97 | ||||
Item 9. | Changes in and Disagreements | 153 | ||||
Item 9A. Controls and Procedures | 153 | |||||
Item 9B. Other Information | 155 | |||||
| PART III | ||||||
Item 10. | Directors and Executive Officers of the Registrant | 156 | ||||
Item 11. Executive Compensation | 156 | |||||
Item 12. | Security Ownership of Certain Beneficial Owners and Management and Related Stockholder Matters | 156 | ||||
Item 13. | Certain Relationships and Related Transactions | 156 | ||||
Item 14. Principal Accountant Fees and Services | 156 | |||||
| PART IV | ||||||
Item 15. | Exhibits, Financial Statement Schedules | 156 | ||||
i
FORWARD-LOOKING STATEMENTS
We have included or incorporated by reference into this report, and from time to time may make in our public filings, press releases or other public statements, certain statements that may constitute forward-looking statements. These include without limitation those under “Risk Factors” in Part I, Item 1A, “Legal Proceedings” in Part I, Item 3, “Management’s Discussion and Analysis of Financial Condition and Results of Operations” in Part II, Item 7, and “Quantitative and Qualitative Disclosures about Market Risk” in Part II, Item 7A. In addition, our management may make forward-looking statements to analysts, investors, representatives of the media and others. These forward-looking statements are not historical facts and represent only our beliefs regarding future events, many of which, by their nature, are inherently uncertain and beyond our control. We may, in some cases, use words such as “project,” “believe,” “anticipate,” “plan,” “expect,” “estimate,” “intend,” “should,” “would,” “could,” “potentially,” or “may” or other words that convey uncertainty of future events or outcomes to identify these forward-looking statements.
In connection with the “safe harbor” provisions of the Private Securities Litigation Reform Act of 1995, we are identifying important factors that, individually or in the aggregate, could cause actual results to differ materially from those contained in any forward-looking statements made by us. Any such forward-looking statements are qualified by reference to the following cautionary statements.
Forward-looking statements in this report are subject to a number of risks and uncertainties, some of which are beyond our control, including, among other things:
Our actual results, performance, prospects or opportunities could differ materially from those expressed in or implied by the forward-looking statements. A description of risks that could cause our actual results to differ appears under the caption “Risk Factors” in Part I, Item 1A and elsewhere in this report. It is not possible to predict or identify all risk factors and you should not consider that description to be a complete discussion of all potential risks or uncertainties that could cause our actual results to differ.
In light of these risks, uncertainties and assumptions, you should not place undue reliance on any forward-looking statements. The forward-looking events discussed in this report may not occur. These forward-looking statements are made as of the date of this report. We undertake no obligation to publicly update or revise any forward-looking statements, whether as a result of new information, future events or otherwise. You should, however, consult further disclosures we may make in future filings with the Securities and Exchange Commission, or the SEC.
U.S. Dollar/Australian Dollar | U.S. Dollar/Pound Sterling | |||||||||||
Time Period | High | Low | Average | High | Low | Average | ||||||
| 2001 | 0.5552 | 0.5016 | 0.5169 | 1.4773 | 1.4019 | 1.4397 | ||||||
| 2002 | 0.5682 | 0.5128 | 0.5437 | 1.5863 | 1.4227 | 1.5024 | ||||||
| 2003 | 0.7391 | 0.5829 | 0.6520 | 1.7516 | 1.5738 | 1.6340 | ||||||
| 2004 | 0.7715 | 0.7083 | 0.7329 | 1.8950 | 1.7860 | 1.8252 | ||||||
| 2005 | 0.7974 | 0.7261 | 0.7627 | 1.9292 | 1.7138 | 1.8198 | ||||||
| 2006 | 0.7914 | 0.7056 | 0.7535 | 1.9794 | 1.7256 | 1.8294 | ||||||
Macquarie Infrastructure Company Trust areLLC is not an authorized deposit-taking institution for the purposes of the Banking Act 1959 (Commonwealth of Australia) and its obligations do not represent deposits with or other liabilities of Macquarie Bank Limited ABN 46 008 583 542 (MBL). MBL does not guarantee or of any Macquarie Group company and are subject to investment risk, including possible delaysotherwise provide assurance in repayment and loss of income and principal invested. Neither Macquarie Bank Limited nor any other member companyrespect of the Macquarie Group guarantees the performanceobligations of Macquarie Infrastructure Company Trust or the repayment of capital from Macquarie Infrastructure Company Trust.
PART I
Except as otherwise specified, “Macquarie Infrastructure Company Trust, a Delaware statutory trust that weCompany”, “MIC,” “the Company”, “we,” “us,” and “our” refer to as the trust, owns its businesses and investments through Macquarie Infrastructure Company LLC, a Delaware limited liability company, that we refer to as the company. Except as otherwise specified, “Macquarie Infrastructure Company,” “we,” “us,” and “our” refer to both the trust and the company and its subsidiaries together. References to our “shareholders” herein means holders of LLC interests. The company ownsholders of LLC interests are also the businesses located in the United States through a Delaware corporation, Macquarie Infrastructure Company Inc., or MIC Inc., and, during 2006, owned its businesses and investments located outsidemembers of the United States through Delaware limited liability companies.our company. Macquarie Infrastructure Management (USA) Inc., the company that we refer to as our Manager, is part of the Macquarie Group of companies. References to the Macquarie Group includemeans Macquarie BankGroup Limited and its respective subsidiaries and affiliates worldwide.
General
We own, operate and invest in a diversified group of infrastructure businesses primarily in the United States. We believe our infrastructure businesses, which provide basic services, have a sustainable and stable cash flow profile and offer the potential for capital growth. We offer investors an opportunity to participate directly in the ownership of infrastructure businesses, which traditionally have been owned by governments or private investors, or have formed part of vertically integrated companies. Our businesses which also constitute our operating segments and consist of the following:
The Energy-Related Businesses:
| (i) | a 50% interest in a bulk liquid storage terminal business (“International Matex Tank Terminals” or “IMTT”), which provides bulk liquid storage and handling services at ten marine terminals in the United States and two in Canada and is one of the largest participants in this industry in the U.S., based on capacity; |
| (ii) | a gas production and distribution business (“The Gas Company”), which is a full-service gas energy company, making gas products and services available in Hawaii; and |
| (iii) | a 50.01% controlling interest in a district cooling business (“District Energy”), which operates the largest such system in the U.S. and serves various customers in Chicago, Illinois and Las Vegas, Nevada. |
The Aviation-Related Business:an airport services business conducted through (“Atlantic Aviation;
On January 28, 2010, our airport parking business conducted through(“Parking Company of America Airports” or “PCAA”) entered into an asset purchase agreement and filed for protection under Chapter 11 of the Bankruptcy Code. We expect to complete the sale of the assets in the first half of 2010. This business is now a discontinued operation and is therefore separately reported in our consolidated financial statements and is no longer a reportable segment of the Company.
In 2007, we made an election to treat MIC as a corporation for federal income tax purposes. As a result, all investor tax reporting with respect to distributions made after December 31, 2006, and in all subsequent years, is based on our being a corporation for U.S. federal tax purposes and such reporting will be provided on Form 1099.
Our Manager
Our Manager is a member of the Macquarie Parking.
We have entered into a management services agreement with our Manager. Our Manager is responsible for our day-to-day operations and affairs and oversees the management teams of our operating businesses. Neither the trustThe Company neither has, nor the company have or will have, any employees. Our Manager has assigned, or seconded, to the company,Company, on a permanent and wholly dedicated basis, two of its employees to assume the offices of chief executive
officer and chief financial officer and seconds or makes other personnel available as required. The services performed for the companyCompany are provided at our Manager’s expense, includingand includes the compensation of our seconded personnel.
We pay our Manager a quarterly management fee based primarily on our market capitalization. In addition, to incentivize our Manager to maximize shareholder returns, we may pay performance fees. Our Manager can also earn a performance fee equal to 20% ofif the outperformance, if any, of quarterly total returnsreturn to our shareholders above(capital appreciation plus dividends) exceeds the quarterly total return of a weighted average of two benchmark indices, a U.S. utilities index and a European utilities index, weighted in proportion to our U.S. and non-U.S. equity investments. Currently, weWe currently do not have noany non-U.S. equity investments. The performance fee is equal to 20% of the difference between the benchmark return and the return for our shareholders. To be eligible for the performance fee, our Manager must deliver quarterly total shareholder returns for the quarter that are positive and in excess of any prior underperformance. Please see the management services agreement filed as an exhibit to this Annual Report on Form 10-K for the full terms of this agreement.
We believe that Macquarie Group’s demonstrated expertise and experience in the management, acquisition and funding of infrastructure businesses will provide us with a significant advantage in pursuing our strategy. Our Manager is part of Macquarie Group’s Capital Funds division. The Macquarie Capital Funds division manages a global portfolio of 110 businesses including toll roads, airports and airport-related infrastructure, ports, communications, media, electricity and gas distribution networks, water utilities, aged care, rail and ferry assets across 22 countries.
Industry
Infrastructure businesses provide basic, everydaytend to generate sustainable and growing long-term cash flows resulting from relatively inelastic customer demand and strong competitive positions of the businesses. Characteristics of infrastructure businesses include:
In addition to the benefits related to these characteristics, the revenues generated by our infrastructure businesses generally can be expected to keep pace with inflation. The price escalators built into the agreements with customers of contracted businesses, and the inflation and cost pass-through adjustments typically a part of pricing terms in user pays businesses or provided for by the regulatory process to regulated businesses, serve to insulate infrastructure businesses to a significant degree from the negative effects of inflation and commodity price risk. We also employ interest rate swaps in connection with our businesses’ floating rate debt to effectively fix our cash flows for the interest costs and hedge variability from interest rate changes.
We focus on the ownership and operation of infrastructure businesses in the following categories:
Strategy
The challenges posed by the economic conditions of the past 18 to 24 months have caused us to adopt a near-term strategy focused on reducing debt, improving operational performance and effectively deploying available growth capital. We believe that our focus on these elements is appropriate to ensuring that our businesses are well positioned to survive and grow regardless of the broader economic backdrop. This strategy included our decisions to sell a non-controlling interest in District Energy, repay our holding company level debt and reduce indebtedness at airports for parking facilities or fixed base operations (FBOs) or waterfront land near key portsAtlantic Aviation.
Over the medium term, subject to having access to external sources of entry for bulk liquid storage terminals;
Debt Reduction
We have two primary strategic objectives. First, we intend to grow our existing businesses. We intend to accomplish this by:
Operational Improvement
We intend to continue to seek opportunities to reduce expenses through rationalization of staffing and business process improvements. In addition, we are actively seeking opportunities to improve the marketing and organic growth of our businesses. We are prudently managing reinvestment in our businesses in the form of maintenance capital expenditures without compromising service levels or operational capabilities of these businesses. Executing this component of our strategy is expected to improve the generation of free cash flow by our businesses.
Growth Capital Expenditures
We have reinvested substantially all of the cash flows generated at IMTT in economically attractive growth opportunities, primarily additional storage capacity. We will continue to reinvest cash flow generated by this business in additional growth projects that we expect will also generate appropriate returns.
We have also reinvested a portion of the cash generated by each of District Energy and The Gas Company into projects that support customer acquisition. We will continue to reinvest in such opportunities in the future.
We intend to meet our contractual obligations with respect to the deployment of growth capital, such as our leasehold improvement obligations at Atlantic Aviation. We have sufficient committed financing to meet these expenditures. We expect that these projects will increase the amount of free cash flow generated by this business.
Our Businesses and Investments
We provide below information about our businesses and investments, including key financial information for each business. In previous filings, we disclosed operating income for each of our businesses who will be supportedas a measure of business segment profit or loss calculated in accordance with GAAP. Effective this reporting period, we are disclosing earnings before interest, taxes, depreciation and amortization (EBITDA) excluding non-cash items as defined by us. We believe EBITDA excluding non-cash items provides additional insight into the demonstrated infrastructure management expertise and experience of the Macquarie Group in the execution of this strategy.
Energy-Related Businesses
IMTT
Business Overview
We own 50% of International-Matex Tank Terminals, or IMTT. The 50% we do not allow them to finance these assets as efficiently as possible, d) regulatory pressures are causing an unbundling of vertically integrated product offerings, or e) they are seeking liquidity and redeployment of capital resources.
2006 | 2005 | 2004 | ||||||||
| Revenue | $ | 312.9 | $ | 201.5 | $ | 142.1 | ||||
| Operating income | 47.9 | 28.3 | 15.3 | |||||||
| Total assets | 932.6 | 553.3 | 410.3 | |||||||
| % of our consolidated revenue | 60.1 | % | 66.2 | % | 52.1 | % | ||||
2006 | 2005 | 2004 | |||||||
| Revenue | $ | 239.3 | $ | 250.6 | $ | 210.7 | |||
| Operating income | 51.0 | 44.5 | 33.5 | ||||||
| Total assets | 630.4 | 549.2 | 510.6 | ||||||
For the year endingended December 31, 2006,2009, IMTT generated approximately 52%43% of its terminal revenue and 50%approximately 42% of its terminal gross profit at its Bayonne, New Jersey facility which servicesin New York Harbor, and 34%Harbor. Approximately 41% of itsIMTT’s total terminal revenue and 42%approximately 48% of its terminal gross profit atwas generated by its St. Rose, Gretna, Avondale and Avondale, LouisianaGeismar facilities, which together service the lower Mississippi River region (with St. Rose as the largest contributor).
IMTT also owns two additional businesses: Oil Mop, an environmental response and spill clean-up business, and St. Rose Nursery, a nursery business.
The business generates approximately one halftable below summarizes the proportion of its revenue from spill clean-up, one quarter from tank cleaning and the balance from other activities including vacuum truck services, waste disposal and material sales to the spill clean-up sector. The underlying drivers of demand for spill clean-up services include shipping and oil and gas industry activity levels in the Gulf region, the aging of pipeline and other mid-stream petroleum infrastructure, the frequency of natural disasters and regulations regarding the standards of spill clean-up. Revenue generated by Oil Mop from spill clean-up tends to be highly variable depending on the frequency and magnitude of spills in any particular period.
| Proportion of Terminal Revenue from Major Commodities Stored | ||||||
| Petroleum/Asphalt | Chemical | Renewables/Vegetable & Animal Oil | Other | |||
| 58% | 29% | 9% | 4% | |||
Financial information for 100% of this business is as follows ($ in millions):
| As of, and for the Year Ended, December 31, | ||||||||||||
| 2009 | 2008 | 2007 | ||||||||||
| Revenue | $ | 346.2 | $ | 352.6 | $ | 275.2 | ||||||
| EBITDA excluding non-cash items | 147.7 | 136.6 | 89.0 | |||||||||
| Total assets | 1,064.8 | 1,006.3 | 862.5 | |||||||||
Bulk liquid storage terminals areprovide an essential link in the supply chain for most major liquid commodities that are transported in bulk. The ability of anysuch as crude oil, refined petroleum products and basic and specialized chemicals. In addition to renting storage tanks, bulk liquid storage terminal to increase itsterminals generate revenues by offering ancillary services including product transfer (throughput), heating and blending. Pricing for storage rates is principally driven by the balance between theand other services typically reflects local supply and demand for storage inas well as the locale that the terminal serves and thespecific attributes of theeach terminal in terms of dock water depth andincluding access to land baseddeepwater berths and connections to land-based infrastructure such as a pipeline, railroads, pipelines and road.
Both domestic and international factors influence demand for bulk liquid storage in the United States is fundamentally driven byStates. Demand for storage rises and falls according to local and regional consumption, which largely reflects the level of product inventories, which isunderlying economic activity over the medium term. In addition to these domestic forces, import and export activity also accounts for a functionmaterial portion of the volume of the stored products consumed and which in turn is largely driven by economic activity. Import and export levels of bulk liquid products are also important drivers of demand for domestic bulk liquid storage as imports and exportsbusiness. Shippers require storage for the staging, aggregation and/or break-updistribution of the products before and after shipment. An exampleThe extent of this is basic or commodity chemicals which are usedimport/export activity depends on macroeconomic trends such as feedstockcurrency fluctuations as well as industry-specific conditions, such as supply and demand balances in the productiondifferent geographic regions. The medium-term length of specialty chemical products. As a result of high natural gas pricesstorage contracts tends to offset short-term fluctuations in the United States, the cost of producing commodity chemicals that use natural gas as a feedstock (such as methanol) is now higher in the United States than the cost of importing such chemicals from countries with low cost natural gas. As a result domestic production of such chemicals has declined while imports have increased substantially, generating increased demand for bulk commodity chemical storage in both the United States.
Potential entrants into the bulk liquid storage terminal business face several substantial barriers. Strict environmental regulations, limited availability of waterfront land with the necessary access to land-based infrastructure, local community resistance to new fuel/chemical sites, and high capitalinitial investment costs represent substantial barriers toimpede the construction of
Strategy
The key components of these facilitiesIMTT’s strategy are well-located in key distribution centers for bulk liquid products, have deep water berths allowing large ships to dock without lightering and have access to road, rail and, in the case of Bayonne and St. Rose, pipeline infrastructure for onward distribution of stored product.
Flexibility: Operational flexibility is essential to make IMTT an attractive supplier of bulk liquid storage services in its key markets. Its facilities operate 24/7 providing shippers, refiners, manufacturers, traders and distributors with prompt access to a wide range of storage services. In each of its facilitiestwo key markets, IMTT’s scale ensures availability of sophisticated product handling and storage capabilities along with ancillary services such as heating and blending. IMTT continues to receiveimprove its facilities’ speed and distribute stored product from and to multiple modesflexibility of transportation at high speed. This includes continuing to investoperations by investing in dock, pipelineupgrades of its docks, pipelines and pumping infrastructure, and dredging to ensure that large ships and barges which represent the cheapest transport options, can deliver and receive stored product from IMTT’s facilities with fast turnaround to minimize shipping costs. As such investments create immediate value for customersfacility management systems.
Investment in the form of lower supply chain costs and increased logistical flexibility, the costs of such investments can usually be recovered quickly through storage rate increases. This is attractive given that such infrastructure investments have a long useful life and therefore result in a near permanent improvement in the capabilities of IMTT’s facilities and their long-term competitive position. Finally, IMTT intends to maintain its current high level of customer service.
Energy-Related Business: IMTT will also consider– (continued)
Locations
The following table summarizes the acquisition of storage facilities in markets outside of the key markets in which it currently operates and where IMTT believes that over the long term a favorable supply/demand balance will exist for bulk liquid storage or where IMTT believes that the performance of the facilities can be improved under its ownership.
| Facility | Land | Number of Storage Tanks in Service | Aggregate Capacity of Storage Tanks in Service | Number of Ship & Barge Berths in Service | ||||||||||||
| (Millions of Barrels) | ||||||||||||||||
| Facilities in the United States: | ||||||||||||||||
| Bayonne, NJ | Owned | 600 | 16.0 | 18 | ||||||||||||
| St. Rose, LA* | Owned | 205 | 13.4 | 16 | ||||||||||||
| Gretna, LA* | Owned | 56 | 2.0 | 5 | ||||||||||||
| Avondale, LA* | Owned | 82 | 1.1 | 4 | ||||||||||||
| Geismar, LA* | Owned | 34 | 0.9 | 3 | ||||||||||||
| Lemont, IL | Owned/Leased | 155 | 1.1 | 3 | ||||||||||||
| Joliet, IL | Owned | 71 | 0.7 | 2 | ||||||||||||
| Richmond, CA | Owned | 46 | 0.6 | 1 | ||||||||||||
| Chesapeake, VA | Owned | 23 | 1.0 | 1 | ||||||||||||
| Richmond, VA | Owned | 12 | 0.4 | 1 | ||||||||||||
| Facilities in Canada: | ||||||||||||||||
| Quebec City, Quebec(1) | Leased | 53 | 1.9 | 2 | ||||||||||||
| Placentia Bay, Newfoundland(2) | Leased | 6 | 3.0 | 2 | ||||||||||||
| Total | 1,343 | 42.1 | 58 | |||||||||||||
Facility | Land | Number of Storage Tanks in Service | Aggregate Capacity of Storage Tanks in Service | Number of Ship and Barge Docks in Service | ||||
| (millions of barrels) | ||||||||
Facilities in the United States: | ||||||||
| Bayonne, NJ | Owned | 478 | 15.4 | 18 | ||||
| St. Rose, LA | Owned | 174 | 11.7 | 16 | ||||
| Gretna, LA | Owned | 85 | 1.7 | 5 | ||||
| Avondale, LA | Owned | 86 | 1.0 | 4 | ||||
| Geismar, LA(1) | Owned | — | — | — | ||||
| Chesapeake, VA | Owned | 24 | 1.0 | 1 | ||||
| Lemont, IL | Owned/Leased | 145 | 0.9 | 3 | ||||
| Richmond, CA | Owned | 46 | 0.7 | 1 | ||||
| Richmond, VA | Owned | 12 | 0.4 | 1 | ||||
Facilities in Canada: | ||||||||
| Quebec City, Quebec(2) | Leased | 46 | 1.2 | 2 | ||||
| Placentia Bay, Newfoundland(3) | Owned | 6 | 3.0 | 2 |
| * | Collectively the “Louisiana” facilities. |
| (1) | Indirectly 66.7% owned and managed by IMTT. |
| (2) | Indirectly 20.1% owned and managed by IMTT. |
All facilities have marine access, all facilities have road access and, except for Richmond, Virginia and Placentia Bay, Newfoundland, all sites have rail access.
Bayonne, New Jersey.
The 16 million barrel storage terminal at Bayonne, New Jersey has its largestthe most storage capacity with 15.4 million barrels. It is locatedof any IMTT site. Located on the Kill Van Kull between New Jersey and Staten Island, and provides storage services tothe terminal occupies a strategically advantageous position in New York Harbor, or NYH. IMTT-Bayonne has a substantial share of the market for third-party petroleum and liquid chemical storage in NYH and isAs the largest third-partyindependent bulk liquid storage facility in NYH, by capacity. IMTT-Bayonne has expanded over a numbersubstantial market share for third-party storage of years by IMTT through progressive acquisitions of neighboring facilities.
NYH isserves as the main petroleum trading hub in the U.S. northeast. NYH isnortheast United States and the physical delivery point for the gasoline and heating oil futures contracts traded on NYMEX.New York Mercantile Exchange (NYMEX). In addition to waterborne shipments, products reach NYH is also the endpoint for thethrough major refined petroleum product pipelines from the U.S. gulfGulf region, where approximately half of U.S. domestic refining capacity is located. It isresides. NYH also serves as the starting point for refined petroleum product pipelines from the East coastlinked to the inland markets and theas a key port for U.S. refined petroleum product imports from outside of the United States.imports. IMTT-Bayonne has connections to the Colonial, Buckeye and Harbor refined petroleum product pipelines. It also haspipelines as well as rail and road connections. As a result, IMTT-Bayonne provides its customers with substantial logistical flexibility that is at least comparable with its competitors.flexibility.
Energy-Related Business: IMTT – (continued)
IMTT-Bayonne has the capability to aquickly load and unload the largest bulk liquid transport ships entering NYH. The U.S. Army Corp of Engineers or USACE, dredging program for(USACE) has dredged the Kill Van Kull and Newark Bay, the water depth in the channel passing IMTT-Bayonne’sthe IMTT-Bayonne docks isto 45 feet (IMTT has dredged some but not all of its docks to that depth) and we understand that the USACE is currently undertaking a project that will deepen this channel to 50 feet. Almost all of IMTT’s. Most competitors in NYH arehave facilities located on the southern reachesportion of the Arthur Kill (water depth of approximately 35 feet) and there are no plansforce large ships to transfer product through lightering (transferring cargo to barges at anchorage) before docking. This technique substantially increases the cost of which we are awareloading and unloading vessels. This competitive advantage for Bayonne may improve as the USACE has announced plans to dredge this bodythe Kill Van Kull to 50 feet (with no planned increase in the depth of water beyond its current depth. As a result, the water depth atsouthern portion of the docks of all of IMTT-Bayonne’s major competitors is substantially less than 45 feet. Thus, IMTT can handle large ships at full load without the needArthur Kill).
Demand for lightering which delays ships and is expensive. IMTT-Bayonne’s facility also has a large waterfront with a large number of generally uncongested docks, which reduces ship turnaround times and demurrage costs.
St. Rose/Gretna/Avondale/Gretna/Geismar Louisiana.
On the lower Mississippi River, IMTT currently operates four bulk liquid storage terminals (St. Rose, Gretna, Avondale Gretna and Geismar terminalsGeismar). With combined storage capacity of 17.4 million barrels, the four sites give IMTT substantial market share in storage for black oil, bulk liquid chemicals, and vegetable oils on the lower Mississippi RiverRiver.
The Louisiana facilities give IMTT a substantial presence in Louisiana have a combined storage capacity of 14.4 million barrels, with St. Rose as the largest with capacity of 11.7 million barrels. IMTT-St. Rose, individually and in combination with IMTT’s other
Demand for third-party bulk liquid storage inon the lower Mississippi isRiver has remained strong during the past several years, as illustrated by the level of capacity utilization at IMTT’sthe IMTT Louisiana facilities. For the three years ended December 31, 2006, on average2009, IMTT rented approximately 94%96% of the aggregate available storage capacity of IMTT’s Louisiana terminals was rented. Due to strong demand for storage capacity, IMTT has recently completed the construction of seven new storage tanksat St. Rose, Gretna, Avondale and is currently in the process of constructing a further eight new storage tanks with a total capacity of approximately 1.5 million barrels at its Louisiana facilities at a total estimated cost of approximately $39.0 million. It is anticipated that construction of these tanks will be completed in 2007. Rental contracts with initial terms of at least three years have been executed in relation to 11 of these tanks with the balance of the tanks to be used to service customers while their existing tanks are undergoing maintenance over the next five years. We anticipate that the new tanks will contribute approximately $6.4 million to IMTT’s terminal gross profit and EBITDA annually. At Geismar, a 570,000 barrel bulk liquid chemical storage and handling facility is under construction with capital committed to date of $160.0 million. Based on the current project scope and subject to certain minimum volumes of chemical products being handled by the facility, existing customer contracts are anticipated to generate terminal gross profit and EBITDA of at least $18.8 million per year. Completion of construction of the initial $160.0 million phase of the Geismar project is targeted for the first quarter of 2008. In the aftermath of Hurricane Katrina, construction costs in the region have increased and labor shortages have been experienced. Although a significant amount of the impact of Hurricane Katrina on construction costs has already been incorporated into the capital commitment plan, there could be further negative impacts on the cost of constructing the project (which may not be offset by an increase in its gross profit and EBITDA contribution) and/or the project construction schedule.
Competition
The competitive environment in which IMTT operates varies by terminal location. The principal competition for each of IMTT’s facilities comes from other third-party bulk liquid storage facilities located in the same regional market. Kinder Morgan, which owns three bulk liquid storage market.facilities in New Jersey and Staten Island, New York, represents IMTT’s major competitor in the New York Harbor storage market isNYH market. Kinder Morgan which has three storagealso owns facilities in the area. Kinder Morgan is also IMTT’s main competitor inalong the lower Mississippi River storage market.near New Orleans. In both the New York HarborNYH and Lowerlower Mississippi River markets, IMTT operates the largest third-party terminal by capacity. We believe that IMTT’s large share of the market for third-party bulk liquid storage in the New York Harbor and lower Mississippi regions,capacity which, combined with the capabilities of IMTT’s facilities, provides IMTT with a strong competitive position in both of these key bulk liquid storage markets.
IMTT’s minor facilities in Illinois, California and Virginia represent only a small proportion of available bulk liquid storage capacity in their respective markets and have numerous competitors with facilities of similar or larger size and with similar capabilities.
Secondary competition for IMTT’s facilities comes from bulk liquid storage facilities located in the same broad geographic region as IMTT’s terminals. For example, bulk liquid storage facilities located on the Houston Ship Channel provide a moderate level ofindirect competition for IMTT’s Louisiana facilities.
Customers
IMTT provides bulk liquid storage services principally to vertically integrated petroleum product producers petroleum productand refiners, chemical manufacturers, food processors and traders of bulk liquid petroleum, chemical and agricultural products. No single customer represented greater than 10% of IMTT’s total revenue for the year ended December 31, 2006.2009.
IMTT generally rents storage tanks are generally rented to customers under contracts with terms of onethree to five years. Pursuant to these contracts, customers generally pay for the capacity of the tank irrespective of whether they actually store product in the tank is actually used. Tank rentals areand the contracts generally payablehave no early termination provisions. Customers generally pay rental charges monthly andat rates are stated in terms of cents per barrel of storage capacity per month. Tank rental rates vary by commodity stored and by location. IMTT’s standard form of customer contract generally permits a certain number of free product movements into and out of the storage tank with charges for throughput aboveexceeding the prescribed levels. Where a customer is renting a tank that requiresIn cases where stored liquids require heating to prevent the stored product from becoming excessively viscous,keep viscosity at acceptable levels, IMTT generally charges the customer for the heating with such charges essentially reflecting a pass-through of IMTT’s cost. Heating charges are principally cover the cost of fuel used to produce steam. Pursuant to IMTT’s standard form of customer contract, tank rental rates, throughput rates and the rates for some other services are generally subject toincrease based on annual inflation increases. The productindices. Customers retain title to products stored in the tanks remains the property of the customer at all times and thereforehave responsibility for securing insurance against loss. As a result, IMTT takeshas no commodity price risk. The customerrisk related to the liquids stored in its tanks and has limited liability from product loss. IMTT is also responsible for ensuring appropriate care of products stored at its facilities and maintains adequate insurance against loss of the stored product.
Regulation
The rates that IMTT charges for theits services that it provides are not subject to regulation. However, IMTT’s operations are overseen by a number of regulatory bodies andoversee IMTT’s operations. IMTT must comply with numerous federal, state and local environmental, occupational health and safety, security, tax and planning statutes and regulations. These regulations require IMTT to obtain and maintain permits to operate its facilities and impose standards that govern the way IMTT operates its business. If IMTT does not comply with the relevant regulations, it could lose its operating permits andand/or incur fines and increased liability in the event of an accident.liability. As a result, IMTT has developed environmental and health and safety compliance functions which are overseen by the terminal managers at the terminal level and IMTT’s Director of Environmental, Health and Safety, Chief Operating Officer and Chief Executive Officer. While changes in environmental, health and safety regulations pose a risk to IMTT’s operations, such changes are generally phased in over time to manage the impact on industry.
The Bayonne New Jersey terminal, which has beenwas acquired and expanded over a 2226 year period, contains pervasive remediation requirements that were partially assumed at the time of purchase from the various former owners. One former owner retained environmental remediation responsibilities for a purchased site as well as sharing other remediation costs. These remediation requirements are documented in two memoranda of agreement and an administrative consent order with the State of New Jersey. Remediation efforts entail removal of the free product, soil treatment, repair/replacement of sewer systems, and the implementation of containment and monitoring systems. These remediation activities are estimatedexpected to span a period of ten to twenty years or more.
The Lemont terminal has entered into a consent order with the State of Illinois to remediate contamination at the site that pre-dated IMTT’s ownership. Remediation is also required as a result of the renewal of a lease with a government agency for a portion of the terminal. This remediation effort, including the implementation of extraction and monitoring wells and soil treatment, is estimated to span a period of ten to twenty years.
See “Management’s Discussion and Analysis of Financial Condition and Results of Operations — Liquidity and Capital Resources” in Part II, Item 7 for discussion of the expected future capitalized cost of environmental remediation.
Management
The day-to-day operationoperations of IMTT’s terminals isare overseen by individual terminal managers who are responsible for all aspects of the operations at their respective sites. IMTT’s terminal managers have on average 2931 years experience in the bulk liquid storage industry and 1718 years service with IMTT.
Energy-Related Business: IMTT – (continued)
The IMTT head office is in New Orleans. The head officeOrleans provides the business with central management, performs support functions such as accounting, tax, finance, human resources, insurance, information technology and legal services and provides support for functions that have been partially de-centralized to the terminal level such as engineering and environmental and occupational health and safety regulatory compliance. IMTT’s senior management team, other than the terminal managers, have on average 2136 years experience in the bulk liquid storage industry and 2128 years service with IMTT.
The Board of IMTT Holdings consists of six members with three appointees each from Macquarie Terminal Holdings, LLC, our wholly owned subsidiary, and our co-shareholder. All decisions of the Board require majority approval, including the approval of at least one member appointed by Macquarie Terminal Holdings, LLC and one member appointed by our co-shareholder. The shareholders’ agreement to which we became a party at the time of our investment in IMTT contains a customary list of items that must be referred to the Board for approval.
The shareholders’ agreement is filed as an exhibit to this Annual Report on Form 10-K.
Employees
As atof December 31, 2006,2009, IMTT (excluding non-consolidated sites) had a total of 9541,022 employees, with 710 employed at the bulk liquid storage terminals, 106including 133 employed by Oil Mop, 64 employed by St. Rose Nursery and 74 employed at the head office in New Orleans.Mop. At the Bayonne terminal, 132 staff members142 employees are unionized, and52 of the employees are unionized at the Lemont terminal, 48 ofand Joliet terminals and 33 employees are unionized at the staff members are unionized.Quebec terminal. We believe employee relations at IMTT are good.
The Gas Company LLC, from k1 Ventures Limited. The cost of the acquisition, including working capital adjustments and transaction costs, was approximately $262.7 million. In addition, we incurred financing costs of approximately $3.3 million.
Business Overview
The Gas Company is Hawaii’s only government franchised full-service gas energy company, makingmanufacturing and distributing gas products and services available in Hawaii. The Hawaii market includes Hawaii’s approximateapproximately 1.3 million resident population and approximate 7.5 million annual visitors. TGC provides both regulated and unregulated gas distribution services on the state’s six primary islands.
The Gas customers range from residential customers, for which TGC has nearly all of the market, to a wide variety of commercial and wholesale customers.
The Gas Company’s two products, SNG and LPG, are relatively clean-burning fuels that produce lower levels of carbon emissions than other hydrocarbon fuels such as coal or oil. This is particularly important in Hawaii where heightened public awareness of environmental impact makes lower emission products attractive to customers.
SNG and LPG have a wide number of commercial and residential applications including water heating, drying, cooking, emergency power generation and tiki torches. LPG is also used as a fuel for specialty vehicles such as forklifts. Gas customers include residential customers and a wide variety of commercial, hospitality, military, public sector and wholesale customers.
Energy-Related Business: The Gas Company – (continued)
Financial information for this business is as follows ($ in millions):
| As of, and for the Year Ended, December 31, | ||||||||||||
| 2009 | 2008 | 2007 | ||||||||||
| Revenue | $ | 175.4 | $ | 213.0 | $ | 170.4 | ||||||
| EBITDA excluding non-cash items | 37.6 | 27.9 | 25.6 | |||||||||
| Total assets | 344.9 | 330.2 | 313.1 | |||||||||
| % of our consolidated revenue | 24.7 | % | 21.8 | % | 22.6 | % | ||||||
2006 | 2005 | |||||
| Revenue | $ | 160.9 | $ | 147.5 | ||
| Operating income | 16.6 | 20.5 | ||||
| Total assets(1) | 308.5 | 175.1 | ||||
| % of our consolidated revenue | 16.9 | % | N/A | |||
Strategy
The Gas Company’s long-term strategy is as at June 30, the financial year endto increase and diversify its customer base. The business intends to increase penetration of the residential, the expanding government (primarily military) and the tourism-related markets. The business prioralso intends to our acquisition.
As a second component of Hawaii’s population and economy to present opportunities for increasing TGC’s base of residential and commercial customers of both SNG and LPG. TGCits strategy, The Gas Company intends to take advantagediversify its sources of growthfeedstock and LPG to ensure reliable supply and to mitigate any potential cost increases to its customers. The Gas Company is exploring other clean and renewable energy alternatives that may be distributed using its existing infrastructure.
The Gas Company also recognizes the important role it plays in Hawaii’s tourismthe local community and real estate industries by pursuing new customeras a component of its strategy will focus on maintaining good relationships with hotel, restaurantregulators, governments and condominium developers and other similar commercial customers, as well as the growing residential market.
Products
While the long-term, we expect to invest in selected capital expenditures, such as those for improvements to TGC’s distribution system and increases in TGC’s LPG storage capacity. We believe that these capital expenditures will increase the reliability of TGC’s distribution system and will enhance TGC’s attractiveness as an alternative to Hawaii’s regulated electric utilities and other non-regulated LPG suppliers. Additionally, we intend to market TGC as an environmentally friendly alternative to electricity generation and as an established, reliable and cost-effective distributor of LPG.
Synthetic Natural Gas. TGC catalyticallyThe business converts a light hydrocarbon feedstock (currently naphtha) to SNG. The product is chemically similar in most respects to natural gas and has a similar heating value on a per cubic foot basis. TGCThe Gas Company has the only SNG manufacturing capability in Hawaii at its plant located on the island of Oahu.
Liquefied Petroleum Gas. LPG is a generic name for a mixture of hydrocarbon gases, typically propane and butane. Owing to chemical properties whichLPG liquefies at a relatively low pressure under normal temperature conditions. As a result, in LPG becoming liquid at atmospheric temperature and elevated pressure, LPG maycan be stored or transported more easily than natural or synthetic natural gas. LPG is typically transported usingin cylinders or tanks. Domestic and commercial applications of LPG are similar to those of natural gas and synthetic natural gas.
Utility Regulation
The Gas Company’s utility operations arebusiness is regulated by the Hawaii Public Utilities Commission, or HPUC, while TGC’sthe business’ non-utility operations are not regulated.business is not. The HPUC exercises broad regulatory oversight and investigative authority over all public utility companies doing business in the state of Hawaii.
Rate Regulation. The HPUC currently regulatesestablishes the rates that TGCThe Gas Company can charge its utility customers via cost of service regulation. The rate approval process is intended to ensure that a public utility has a reasonable opportunity to recover costs that are prudently incurred and earn a fair return on its investments, while protecting consumer interests.
Although the HPUC sets the base rate for the SNG and LPG sold by The Gas Company’s utility business, the business is permitted to pass through changes in its raw materials cost by means of a monthly fuel adjustment charge, or FAC. The adjustment protects the business’ earnings from volatility in feedstock commodity costs.
Energy-Related Business: The Gas Company – (continued)
The business’ utility rates are established by the HPUC in periodic rate cases typically initiated by TGC when it has the need to do so, which historically has occurred approximately every five years. TGCThe Gas Company. The business initiates a rate case by submitting a request to the HPUC for an increase in the rates based, for example, upon materially higher costs related to providing the service. Following initiation of the rate increase request by The HPUCGas Company and submission by the Hawaii Division of Consumer Advocacy or DCA, may also initiate a rate case, although such proceedings have been relatively rare in Hawaii and will generally only occur if the HPUC or DCA receive numerous complaints about the rates being charged or if there is a concern that TGC’s regulated operations may be earning a greater than authorized rate of return on investment for an extended period of time.
Other Regulations. The HPUC is statutorily requiredregulates all franchised or certificated public service companies operating in Hawaii; prescribes rates, tariffs, charges and fees; determines the allowable rate of earnings in establishing rates; issues guidelines concerning the general management of franchised or certificated utility businesses; and acts on requests for the acquisition, sale, disposition or other exchange of utility properties, including mergers and consolidations. When we acquired The Gas Company, we agreed to issue an interim decision on a rate case application within a certain time period, generally within 10 months following application, depending on the circumstances and subject to TGC’s compliance14 regulatory conditions with procedural requirements. In addition to formal rate cases, tariff changes and capital additions are also approved by the HPUC.
Competition
Depending upon the end-use, the business competes with electricity, diesel, solar energy, geo-thermal, wind, other gas providers and alternative energy sources. Hawaii’s electricity is generated by TGC as early as the third quarter of 2008four electric utilities and new rates, if approved, could be implemented as early as the second quarter of 2009. As permitted by the HPUC, increases in TGC’s gas feedstock costs since the last rate case have been passed through to customers via a monthly fuel adjustment charge.
Competition
UnregulatedNon-Utility Business. TGCThe Gas Company also sells LPG in an unregulated market inon the six primary islands of Hawaii. Of the largest 250 non-utility customers, over 90% have multi-year supply contacts with a weighted average life of almost three years expiring various years through 2013. There are two other wholesale companies and several small retail distributors that share the LPG market. The largest of these is AmeriGas. We believe TGCThe Gas Company believes it has a competitive advantage due tobecause of its established accountcustomer base, storage facilities, distribution network and reputation for reliable cost-effective service. Depending upon the end-use, the unregulated business also competes with electricity, diesel and solar energy providers. For example, both solar energy and gas are used for water heating in Hawaii. Historically, TGC’s sales have been stable and somewhat insulated from downturns in the economic environment and tourism activity. This business contributes approximately 40% of TGC’s revenue.
Fuel Supply, SNG Plant and Distribution System
Fuel Supply
The business obtains its LPG from foreign sources and raw feedstock for SNG production from twoeach of the Chevron and Tesoro oil refineries located on the island of Oahu andOahu. The Gas Company has LPG supply agreements with each refinery. The business purchases its LPG from foreign imports. TGC ownssources under foreign supply agreements and through spot-market purchases, if needed.
In January 2010, Chevron announced that it plans to reduce the dedicated pipelines, storagesize of its global oil refining business, although it has not made any decisions regarding its refinery in Hawaii. Chevron could decide to continue operating in Hawaii, cease operations entirely or convert a portion of its operations into a terminal for importation of energy products. Chevron’s Hawaii refinery supplies The Gas Company with over half of its total LPG purchases. The refinery also supplies the business’ competitors in the non-utility market.
Energy-Related Business: The Gas Company – (continued)
Any decision by Chevron regarding its operations in Hawaii could affect the business’ cost of LPG and infrastructuremay adversely impact its non-utility contribution margin and profitability. In an effort to handle thismitigate the risk of supply disruption and/or a potential increase in costs, the business is evaluating a number of alternatives, including additional shipments of foreign sourced product.
The business also obtains its feedstock and the resulting volumes of gas. LPG is supplied to TGC’s non-Oahu customers by barge.
SNG Plant and Distribution System (Utility Business)
The Gas Company manufactures SNG at its plant located west of the Honolulu business district. The SNG plant configuration is effectively two production units, for most major pieces of equipment, thereby providing redundancy and ensuring continuous and adequate supply. A propane air unit provides backup in the event of a SNG plant shutdown. The SNG plant operates continuously with only a 15% seasonal variation in production and operates well within its design capacity of 150,000 therms per day. We believe that as of December 31, 2006 the SNG plant has with an appropriate level of maintenance capital investment, an estimated remaining economic life of approximately 20 years and that theyears. The economic life of the plant is further extendablemay be extended with additional capital investment.
A 22-mile transmission linepipeline links the SNG plant to a distribution system that ends at Pier 38 in south Oahu. The pipeline is predominately sixteen-inch transmission piping and is utilized only on Oahu to move SNG from the plant toFrom Pier 38 near the financial district in Honolulu. This line also provides short-term storage for 45-thousand therms. Thereafter, a pipeline distribution system consisting of approximately 900 miles of transmission, distribution and service pipelines takes the gas to customers. Additionally, LPG is trucked and shipped by barge to holding tanks on Oahu and shipped by barge to the neighboring islands to bewhere it is distributed via pipelines to utility customers that are not connected to the Oahu SNG pipeline system. Approximately 90% of TGC’sthe business’ pipeline system is on Oahu.
Distribution System (Non-Utility Business)
The non-utility business serves gas on all six primary islands to customers that are not connected to the TGCbusiness’ utility pipeline system. The LPG, acquired frommajority of The Gas Company’s non-utility customers are on the two Oahu refineries and from foreign suppliers,neighboring islands. LPG is distributed to the neighboring islandislands by direct deliveries from overseas suppliers and by barge delivery. The business also owns the infrastructure to distribute LPG to its customers, utilizing two LPG-dedicated barges exclusively time-chartered by a third-party,such as harbor pipelines, trucks, several holding facilities and storage base-yards on Kauai, Maui and Hawaii.
Employees and Management
As of December 31, 2006, TGC2009, The Gas Company had 311306 employees, of which 209 were union employees.206 are unionized. The unionized employees are subject to a collective bargaining agreement became effective May 1, 2004 and endsthat expires on April 30, 2008. TGC and the Union have had2013. The business believes it has a good relationship with the union and there have been no major disruptions in operations due to labor matters for over thirty30 years. Management of TGCthe business is headquartered in Honolulu, Oahu with branch managersoffice management at operating locations.
Environmental Matters
Environmental Matters and Legal Proceedings
Environmental Compliance.Compliance: We believeThe business believes that TGCit is in compliance in all material respects with applicable state and federal environmental laws and regulations. With regard to hazardous waste, all TGC facilities are generally classified as conditionally exempt small quantity generators, which means they generate between zero and one hundred kilograms of hazardous waste in a calendar month. Under normal operating conditions, theits facilities do not generate hazardous waste. Hazardous waste, ifwhen produced, should poseposes little or no ongoing risk to the facilities from a regulatory standpoint because SNG and LPG dissipate quickly whenif released.
District Energy
Business Overview
Through December 22, 2009, District Energy Business
2006 | 2005 | 2004 | ||||||||
| Revenue | $ | 43.6 | $ | 43.4 | $ | 35.0 | ||||
| Operating income | 9.0 | 9.4 | 7.9 | |||||||
| Total assets | 236.1 | 245.4 | 254.0 | |||||||
| % of our consolidated revenue | 8.4 | % | 14.2 | % | 14.3 | % | ||||
Energy-Related Business: District Energy – (continued)
District Energy operates the largest district cooling system in the United States. The system currently serves approximatelyover 100 customers in downtown Chicago under long-term contracts in downtown Chicago and one customer outside the downtown area. Thermal Chicago has signed contracts with three additional customers that are expected to start
District Energy also owns a site-specific heating and cooling plant that serves a single customer in Chicago outside of the downtown area. This plant has the capacity to produce 4,900 tons of cooling and 58.258 million British Thermal Units, or BTUs, of heating per hour.
District Energy’s Las Vegas operation owns and operates a stand-alone facility that provides cold and hot water (for chilling and heating, respectively) and emergency electricity generation to several customers in Las Vegas, Nevada. The Las Vegas operation represented approximately 25% of the cash flows of District Energy in 2009. Approximately 65% of cash flows generated by the Las Vegas operation in 2009 were from a long-term contract to service a resort and casino including a hotel, convention and conference facility and an adjacent shopping complex. In early 2009, the operation began providing service to a shopping mallnew customer building that was constructed on the same property. This new customer began receiving full service in February 2010. All three Las Vegas Nevada. Services are provided to both customers under long-term contracts that expire in 2020 with 90% of cash flows generated from the contract with the resort and casino.
Financial information for 100% of the membership intereststhis business is as follows ($ in Macquarie District Energy Holdings, LLC, the holding company of our district energy business, from the Macquarie Group, for $67.0 million (including transaction costs) and assumed $120.0 million of senior debt that was used partially to finance the acquisition of Thermal Chicago and our interest in Northwind Aladdin.millions):
| As of, and for the Year Ended, December 31, | ||||||||||||
| 2009 | 2008 | 2007 | ||||||||||
| Revenue | $ | 48.6 | $ | 48.0 | $ | 49.5 | ||||||
| EBITDA excluding non-cash items | 20.8 | 21.1 | 5.5 | |||||||||
| Total assets | 234.8 | 227.1 | 232.6 | |||||||||
| % of our consolidated revenue | 6.8 | % | 4.9 | % | 6.6 | % | ||||||
Industry Overview
District energy is the provision ofsystems provide chilled water, steam and/or hot water to customers from a centralized plant through underground piping for cooling and heating purposes. A typical district energy customer is the owner/manager of a large office or residential building or facilities such as hospitals, universities or municipal buildings. District energy systems exist in most major North American and European cities and some have been in operation for over 100 years.
Strategy
District energyEnergy’s strategy is not, however, anto position the business in the market as the most efficient option for suburban areas whereand effective method of providing building cooling such that it attracts and connects new customers are widely dispersed.
Energy-Related Business: District Energy – (continued)
Growth: This business intends to grow revenue and profits by increasingmarketing its services to developers in the output capacity of Thermal Chicago’s plants in downtown Chicago market. Its value proposition is centered on high reliability, efficiency and adding new customersease of maintenance. The management team develops and maintains relationships with property developers, engineers, architects and city planners as a means of keeping District Energy and these attributes “top of mind” when they select among building cooling systems and services.
Business Management: The business focuses on minimizing the cost of electricity consumed per unit of chilled water produced by operating its plants to the system.maximize efficient use of electricity. These cost savings are passed through to its customers.
System Expansion: Since our acquisition in 2004, minor system modifications and expansion at the business’ plants have been made that increased total cooling capacity by approximately 3,00015,000 tons or 3%15%. We have also begun the expansion of one of our cooling plants and expect the project to be completed in 2007. We anticipate spending up to $8.1 million for system expansion over the next two years. This expansion, in conjunction with operational strategies and increases noted above,Projects currently under development will add approximately 16,000 tons of saleable capacity to the downtown cooling system. Approximately 6,700 tons of saleable capacity has been used in 2006 to accommodate four customers that converted from interruptible to continuous service.
Operations
Corrective maintenance is typically performed by qualified contract personnel and off-season maintenance is performed by a combination of plant staff and contract personnel.
Customers
District Energy currently serveserves approximately 100 customers in downtown Chicago and one outside the downtown area, and have signed contracts with three additional customers expected to begin service between 2007 – 2009. These constitute a diversearea. Its customer base consistingis diverse and consists of retail stores, office buildings, residential buildings, theaters and government facilities. Office and commercial buildings constitute approximately 70% of the customers.its customer base. No one customer accounts for more than eight percent10% of total contracted capacity and only three customers account for more than five percent of total contracted capacity each. capacity.
The top 20% of customers account for approximately 60% of contracted capacity.
Customers pay two charges to receive chilled water services: a fixed charge, or capacity charge, and a variable charge, or consumption charge. The capacity charge is a fixed monthly chargeamount based on the maximum amountnumber of tons of chilled water that we havethe business has contracted to make available to the customer at any point in time. The consumption charge is a variable chargeamount based on the volume of chilled water actually used during a billing period.
Contractual adjustments to the capacity charge and consumption charge occur periodically, typically annually, either based on changes in certain economic indices or, under some contracts, at a flat rate.annually. Capacity charges generally increase at a fixed rate or are indexed to the Consumer Price Index, or CPI, as a broad measure of inflation. Consumption charges arepayments generally indexed to changesincrease in line with a number of economic indices. These economic indices measure changes inthat reflect the costscost of electricity, labor and chemicals inother input costs relevant to the region in which we operate. Whileoperations of the indices used vary, consumption charges in 90%business. The largest and most variable direct expense of our contracts (by capacity) are indexedthe operation is electricity. District Energy passes through to indices weighted at least 50% to CPI, costs of labor and chemicals with the balance reflectingits customers changes in electricity costs. Upon evaluationThe business focuses on minimizing the cost of our contractual price adjustment options, we have implemented a methodologyelectricity consumed per unit of chilled water produced by operating its plants to fully recover the increase in electricity expenses caused by the deregulationmaximize efficient use of the Illinois power market. We believe that the terms of our customer contracts permit us to fully pass through the increase or decreases in our electricity costs.
Seasonality
Consumption revenue is higher in the summer months when the demand for chilled water is at its highest and approximatelyhighest. Approximately 80% of consumption revenue is received in the second and third quarters ofcombined each year.
Energy-Related Business: District Energy – (continued)
Competition
District Energy is not subject to substantial competitive pressures. Pursuant to customer contracts, customersCustomers are generally not allowed to cool their premises by means other than the chilled water service provided by our district energy business.
District Energy believes competition from an alternative district energy system in the Chicago downtown market is unlikely. There are significant barriers to entry including the considerable capital investment required, the need to obtain City of Chicago consent and the difficulty in obtaining sufficient customers given the number of buildings in downtown Chicago already committed under long-term contracts to the use of the system owned by us.
City of Chicago Use Agreement
The business is not subject to specific government regulation, but ourits downtown Chicago operations are operated subject tosystem operates under the terms of a Use Agreement with the City of Chicago. The Use Agreement establishes the rights and obligations of our district energy businessDistrict Energy and the City of Chicago for the utilization of certain public wayswith respect to its use of the City of Chicago for the operation of our district cooling system.public ways. Under the Use Agreement, we havethe business has a non-exclusive right to construct, install, repair, operate and maintain the plants, facilities and facilitiespiping essential in providing district cooling chilled water and related air conditioning service to customers.
Management
The day-to-day operations of our district energy businessDistrict Energy are managed by an operating managementa team located in Chicago, Illinois. OurThe management team has a broad range of experience that includes engineering, construction and project management, business development, operations and maintenance, project consulting, energy performance contracting, and retail electricity sales. The team also has significant financial and accounting experience.
The business is governed by a Board of Northwind Aladdin’s cash flows are generated fromdirectors on which we have three representatives and our co-shareholder has two. Although we control decisions that require a long-term contract with the resort and casino, with the balance from a contract with a shopping mall. The resort and casino in Las Vegas includes a hotel with over 2,500 rooms, a 100,000 square foot casino and a 75,000 square foot convention and conference facility. Additional buildings are being constructed on the property and the Northwind Aladdin plant has the capability to serve the buildings.
Employees
As of electricity. The plant is staffed 24 hours a day. The plant supplies district energy services to its customers via an underground pipe system.
Aviation-Related Business
Atlantic Aviation
Business Overview
The business, Atlantic Aviation FBO Inc., operates 72 fixed-based operations, or FBOs, at 68 airports and one heliport throughout the United States. Atlantic Aviation’s FBOs primarily provide fueling and fuel-related services, aircraft parking business is the largest providerand hangar services to owners/operators of off-airport parking servicesjet aircraft in the United States, measured by number of facilities, with 30 facilities comprising over 40,000 parking spaces and over 360 acres at 20 major airports across the United States, including sixgeneral aviation sector of the busiest commercial U.S. airports for 2006. Our airport parking business provides customers with 24-hour secure parking close to airport terminals, as well asair transportation via shuttle bus to and from their vehicles and the terminal. Operations are carried out on either owned or leased land
Aviation-Related Business: Atlantic Aviation – (continued)
Financial information for this business is as follows ($ in millions):
| As of and for the Year Ended, December 31, | ||||||||||||
| 2009 | 2008 | 2007 | ||||||||||
| Revenue | $ | 486.1 | $ | 716.3 | $ | 534.3 | ||||||
| EBITDA excluding non-cash items | 106.5 | 137.1 | 119.9 | |||||||||
| Total assets | 1,473.2 | 1,660.8 | 1,763.7 | |||||||||
| % of our consolidated revenue | 68.5 | % | 73.3 | % | 70.8 | % | ||||||
2006 | 2005 | 2004 | ||||||||
| Revenue | $ | 76.1 | $ | 59.9 | $ | 51.4 | ||||
| Operating income (loss)(1) | (10.1 | ) | 6.5 | 7.1 | ||||||
| Total assets | 283.5 | 288.8 | 205.2 | |||||||
| % of our consolidated revenue | 14.6 | % | 19.6 | % | 33.6 | % | ||||
Industry Overview
FBOs predominantly service the general aviation segment of $23.5 million for existing trademarksthe air transportation industry. General aviation includes corporate and domain names dueleisure flying and does not include commercial air carriers or military operations. Local airport authorities, the owners of the airport property, grant FBO operators the right to provide fueling and other services pursuant to a re-branding initiative.long-term ground lease. Fuel sales provide the majority of an FBO’s revenue and gross profit.
FBOs generally operate in environments with high barriers to entry. Airports often have limited physical space for additional FBOs. Airport authorities generally do not have an incentive to add additional FBOs unless there is a significant demand for additional capacity, as profit-making FBOs are more likely to reinvest in the airport and provide a broad range of services, thus attracting increased airport traffic. The increased traffic tends to generate additional revenue for the airport authority in the form of landing and fuel flowage fees. Government approvals and design and construction of a new FBO can also take significant time.
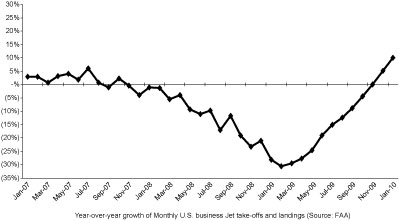
Demand for FBO services is driven by the level of general aviation aircraft activity and the number of take-offs and landings specifically. General aviation business jet take-offs and landings, declined by 17.3% in 2009 compared with 2008. According to flight data reported by the Federal Aviation Administration, or “FAA”, fourth quarter take-offs and landings were flat year-over-year and increased 1.9% over the third quarter of 2009. The number of aircraft operations is typically lower in the fourth quarter compared to the third quarter as a result of reduced business-related aircraft traffic in November and December.
Aviation-Related Business: Atlantic Aviation – (continued)
Despite improved access to general aviation resulting from an expansion of fractional and charter offerings and the challenges facing commercial aviation including potential mainline carrier consolidation and security-related delays, all of which strengthened the general aviation industry, FBO gross profit has been negatively affected by the economic downturn which resulted in a reduction in the volume of fuel sold. See “Risk Factors” in Part I, Item 1A.
Strategy
Atlantic Aviation is pursuing a strategy that has four principal components. The first component is to delever the business. The second day following our initial public offering, we acquired 100%component encompasses an overarching commitment to provide superior service to its customers. The third is to aggressively manage the business so as to minimize, to the extent possible, its operating expenses. The fourth component addresses organic growth of the ordinary sharesbusiness and focuses on leveraging the size of the Atlantic Aviation network and its information technology capabilities to identify marketing leads and implement cross-selling initiatives. These components are discussed in Macquarie Americas Parking Corporation,greater detail in the Operations andMarketingsections below.
Operations
The business has high-quality facilities and focuses on attracting customers who desire a high level of personal service. Fuel and fuel-related services generated 75% of Atlantic Aviation’s revenue and accounted for 63% of Atlantic Aviation’s gross profit in 2009. Other services, including de-icing, aircraft parking, hangar rental and catering, provided the balance. Fuel is stored in fuel tank farms and each FBO operates refueling vehicles owned or MAPC,leased by the FBO. The FBO either owns or has access to the fuel storage tanks to support its fueling activities. At some of Atlantic Aviation’s locations, services are also provided to commercial carriers. These may include refueling from the Macquarie Global Infrastructure Fund for cash considerationcarrier’s own fuel supplies stored in the carrier’s fuel farm, de-icing and/or ground and ramp handling services.
Atlantic Aviation buys fuel at the wholesale price and sells fuel to customers at a contracted price, or at a price negotiated at the point of $33.8 million (including transaction costs). At that time MAPCpurchase. While fuel costs can be volatile, Atlantic Aviation generally passes fuel cost changes through to customers and attempts to maintain and, when possible, grow a dollar-based margin per gallon of fuel sold. Atlantic Aviation also fuels aircraft with fuel owned approximately 83%by other parties and charges customers a service fee.
Atlantic Aviation has limited exposure to commodity price risk as it generally carries a limited inventory of jet fuel on its books and passes fluctuations in the wholesale cost of fuel through to its customers.
Atlantic Aviation is particularly focused on managing costs effectively. In light of the outstanding ordinary membership unitsrecent slowdown in Parking Companygeneral aviation activity, initiatives have been implemented that have reduced operating costs by more than $27.0 million per year. Atlantic Aviation will continue to evaluate opportunities to reduce expenses through, for example, more efficient purchasing and capturing synergies resulting from recent acquisitions.
Locations
Atlantic Aviation’s FBO facilities operate pursuant to long-term leases from airport authorities or local government agencies. The business and its predecessors have a strong history of America Airports Holdings LLC, or PCAA Holdings. In turn, PCAA Holdings owned approximately 51.9%successfully renewing leases, and have held some leases for over 40 years.
The existing leases have a weighted average remaining length of 17.6 years including extension options. The leases at 12 of Atlantic Aviation’s 72 FBOs will expire within the next five years and one currently operates on a month-to-month lease. No individual FBO generates more than 10% of the outstanding membership unitsgross profit of the business.
The airport authorities have termination rights in PCAA Parent LLC,each of Atlantic Aviation’s leases. Standard terms allow for termination if Atlantic Aviation defaults on the terms and conditions of the lease, abandons the property or PCAA Parent. PCAA Parent isbecomes insolvent or bankrupt. Less than ten leases may be terminated with notice by the 100% ownerairport authority for convenience or other similar reasons. In each of these cases, there are compensation agreements or obligations of the authority to make best efforts to relocate the FBO. Most of the leases allow for termination if liens are filed against the property.
Aviation-Related Business: Atlantic Aviation – (continued)
Marketing
Atlantic Aviation has a number of subsidiariesmarketing programs, each utilizing an internally-developed point-of-sale system that collectively owntracks all aircraft flight movements. One program supports flight tracking and operate Macquarie Parking.
Another program is a result of these transactions, we acquired in aggregate 100% of PCAA Holdings and 87.2% of PCAA Parent, and thereby acquired Macquarie Parking. The affairs of PCAA Parent are governed by its LLC agreement.
In 2009, in response to cost-plus contracts. Most airports have historically increased parking rates rapidly with increases incustomer demand, creating a favorable pricing environment for off-airport competitors.
Competition
Competition in the graphics on our shuttle buses. The brand will be incorporated into a new website and rolled out through our other marketing channels.
Atlantic Aviation believes there are located closer to passenger terminalsfewer than our locations. Airports generally have significantly more parking spaces than we do and provide different parking alternatives, including self-park short-term and long-term, off-airport lots and valet parking options.
Regulation
The aviation industry is overseen by friends and family. We face competition from other large off-airport parking providers in gaining access to marketing and distribution channels, including internet travel agencies, airlines and direct mail.
Aviation-Related Business: Atlantic Aviation – (continued)
Management
The day-to-day operations of our airport parking businessAtlantic Aviation are managed by a team primarily located at head offices in Downey, California. Eachindividual site is operated by local managers who are responsible for all aspects of the operations at their site. Responsibilities include ensuring that customer requirements are met by the staff employed at the site and that revenue from the sites is collected, and expenses incurred, in accordance with internal guidelines.
Atlantic Aviation’s operations are overseen by senior personnel with an average of approximately 20 years experience each in the aviation industry. The business management team has established close and effective working relationships with local authorities, customers, service providers and subcontractors. The team is responsible for overseeing the FBO operations, setting strategic direction and ensuring compliance with all contractual and regulatory obligations.
Atlantic Aviation’s head office is in Plano, Texas. The head office provides the business with overall management and performs centralized functions including accounting, information technology, risk management, human resources, payroll and insurance arrangements. We believe Atlantic Aviation’s head office facilities are adequate to meet its present and foreseeable operational needs.
Employees
As of December 31, 2006, our parking2009, the business employed approximately 1,034 individuals. Approximately 21.5%1,751 people across all of its employees aresites. Approximately 8.5% of the employee population is covered by collective bargaining agreements. We believe that employee relations at this businessAtlantic Aviation are good.
Our Employees
As of December 31, 2006,2009, we had a total of 2,728 employees inemployed approximately 2,100 people across our three ongoing, consolidated businesses (excluding IMTT) of which 27.2% areapproximately 18% were subject to collective bargaining agreements. The company and the trust doCompany itself does not have any employees.
AVAILABLE INFORMATION
We file annual, quarterly and current reports, proxy statements and other information with the SEC. You may read and copy any document we file with the SEC at the SEC’s public reference room at 100 F Street, NE, Washington, DC 20549. Please call the SEC at 1-800-SEC-0330 for information on the operations of the public reference room. The SEC maintains a website that contains annual, quarterly and current reports, proxy and information statements and other information that issuers (including Macquarie Infrastructure Company)Company LLC) file electronically with the SEC. The SEC’s website iswww.sec.gov.
Our website iswww.macquarie.com/mic. You can access our Investor Center through this website. We make available free of charge, on or through our Investor Center, our proxy statements, annual reports to shareholders, annual reportreports on Form 10-K, quarterly reports on Form 10-Q, current reports on Form 8-K and any amendments to those reportsthese filed or furnished pursuant to Section 13(a) or 15(d) of the Securities Exchange Act of 1934, as amended, or the Exchange Act, as amended, as soon as reasonably practicable after such material is electronically filed with, or furnished to, the SEC. We also make available through our Investor Center statements of beneficial ownership of the trust stockLLC interests filed by our Manager, our directors and officers, any holders of 10% or greater shareholdersmore of our LLC interests outstanding and others under Section 16 of the Exchange Act.
You can also access our Governance webpage through our Investor Center. We post the following on our Governance webpage:
Our Code of Ethics and Conduct applies to all of our directors, officers and employees as well as all directors, officers and employees of our Manager involved in the management of the companyCompany and its businesses. We will post any amendments to the Code of Ethics and Business Conduct, and any waivers that are required to be disclosed by the rules of either the SEC or the New York Stock Exchange or NYSE,(“NYSE”), on our website. The information on our website is not incorporated by reference into this report.
You can request a copy of these documents at no cost, excluding exhibits, by contacting Investor Relations at 125 West 55th55th Street, New York, NY 10019 (212-231-1000).
An investment in shares of trust stockour LLC interests involves a number of risks. Any of these risks could result in a significant or material adverse effect on our results of operations or financial condition and a corresponding decline in the market price of the shares.
Risks Related to Our Business
The current economic recession and adverse equity and credit market conditions may limithave a material adverse effect on our results of operations, our liquidity or our ability to make regular distributionsobtain credit on acceptable terms.
The equity and credit markets have been experiencing volatility and disruption. In some cases, the markets have exerted downward pressure on the availability of liquidity and credit capacity. Should credit and financial market conditions experience further disruption, our ability to raise equity or obtain capital, to repay or refinance credit facilities at maturity, pay significant capital expenditures or fund growth, is likely to be costly and/or impaired. Our access to debt financing in particular will depend on a variety of factors such as market conditions, the general availability of credit, the overall availability of credit to our shareholders because we will rely on distributions both fromindustry, our subsidiariescredit history and credit capacity, as well as the companies in which we hold investments.
The current economic recession also increases our counterparty risk, particularly in those businesses whose revenues are determined under multi-year contracts, such as IMTT and District Energy. In this environment, we would expect to declare see increases in counterparty defaults and/or bankruptcies, which could result in an increase in bad debt expense and may cause our operating results to decline.
The volatility in the financial markets makes projections regarding future obligations under pension plans difficult. Two of our businesses, The Gas Company and IMTT, have to delaydefined benefit retirement plans. Future funding obligations under those plans depend in large part on the future performance of plan assets and the mix of investment assets. Our defined benefit plans hold a significant amount of equity securities as well as fixed income securities. If the market values of these securities decline further or cancel payment of distributions on its shares.
Our businesses have substantial indebtedness, which could inhibit their operating flexibility.
As of December 31, 2006,2009, on a consolidated basis, wecontinuing operations had total long-term debt outstanding of $963.7 million, all of which is at the operating business level,$1.2 billion, plus a significant amount of additional availability under existing credit facilities, primarily $300.0facilities. In addition, IMTT had total long-term debt outstanding of $632.2 million under the MIC Inc. acquisition facility. IMTT also has a significant level of debt.at December 31, 2009. The terms of these debt arrangements generally require compliance with significant operating and financial covenants. The ability of each of our businesses or investments to meet their respective debt service obligations and to refinance or repay their outstanding indebtedness will depend primarily upon cash produced by that business.
This indebtedness could have important consequences, including:
If weour businesses are unable to comply with the terms of any of ourtheir various debt agreements, wethey may be required to refinance a portion or all of the related debt or obtain additional financing. WeAs discussed further
herein, our businesses may not be unableable to refinance or obtain additional financing because of ourtheir high levels of debt and debt incurrence restrictions under ourtheir debt agreements. Weagreements or because of adverse conditions in credit markets generally. Our businesses also may be forced to default on any of our various debt obligations if cash flow from the relevant operating business is insufficient and refinancing or additional financing is unavailable, and, as a result, the relevant debt holdersproviders may accelerate the maturity of their obligations.
Our total assets include a substantial amount of goodwill and intangible assets. The write-off of a significant portion of intangible assets would negatively affect our reported earnings.
Our total assets reflect a substantial amount of goodwill and other intangible assets. At December 31, 2009, goodwill and other intangible assets, net, represented approximately 56.3% of total assets from continuing operations. Goodwill and other intangible assets were primarily recognized as a result of the acquisitions of our strategy is to acquire additional infrastructure businesses both withinand investments. Other intangible assets consist primarily of airport operating rights, trade names and customer relationships. On at least an annual basis, we assess whether there has been an impairment in the sectors in which we currently operatevalue of goodwill and in sectors where we currently have no presence. Acquisitions involve a numberassess for impairment of special risks, including failure to successfully integrate acquired businesses in a timely manner, failureother intangible assets with indefinite lives when there are triggering events or circumstances. If the carrying value of the acquired businesstested asset exceeds its estimated fair value, impairment is deemed to implement strategic initiatives we set for it and/or achieve expected results, failurehave occurred. In this event, the amount is written down to identify material risks or liabilities associated with the acquired business prior to its acquisition, diversion of management’s attention and internal resources away from the management of existing businesses and operations, and the failure to retain key personnel of the acquired business. We expect to face competition for acquisition opportunities, and some of our competitors may have greater financial resources or access to financing on more favorable terms than we will. This competition may limit our acquisition opportunities, may lead to higher acquisition prices or both. While we expect that our relationship with the Macquarie Group will help us in making acquisitions, we cannot assure you that the benefits we anticipate will be realized. The successful implementation of our acquisition strategy may result in the rapid growth of our business which may place significant demands on management, administrative, operational and financial resources. Furthermore, other than our Chief Executive Officer and Chief Financial Officer, the personnel of IBF performing services for us under the management services agreement are not wholly dedicated to us, which mayfair value. Under current accounting rules, this would result in a further diversion of management time and resources. Our abilitycharge to manage our growth will depend on our maintaining and allocating an appropriate level of internal resources, information systems and controls throughout our business. Our inability to successfully implement our growth strategy or successfully manage growth could have a material adverse effect on our business, cash flow and ability to pay distributions on our shares.
If our shares do not maintain a sufficient market value, issuance of new shares may result in dilution of our then-existing shareholders. In addition, issuances of new shares, either privatelyborrowing costs increase or publicly, may occur at a discount to our stock price at the time. Our equity financing activities may cause the market price of our stock to decline. Alternatively, we may not be able to complete the issuance of the required amount of shares on short notice or at all due to a lack of investor demand for the shares at prices that we find acceptable. As a result, we may not be able to pursue our acquisition strategy successfully.
The majority of indebtedness with maturities ranging from 3 yearsat our businesses mature within three to 19five years. Refinancing this debt may result in substantially higher interest rates or margins or substantially more restrictive covenants. Either event may limit operational flexibility or reduce upstream dividends andand/or distributions from our operating businesses to us.us, which would have an adverse impact on our ability to freely deploy free cash flow. We also cannot assure youprovide assurance that we or the other owners of any of our businesses or investments will be able to make capital contributions to repay some or all of the debt if required.
The debt facilities at our businesses contain terms that become more restrictive over time, with stricter covenants and increased amortization schedules. Those terms will limit our ability to freely deploy free cash flow.
Our holding company structure may limit our ability to make regular distributions in the future to our shareholders because we will rely on the cash flows and distributions from our businesses. If anythe lack of distributions from our businesses prevents us from paying our management fees to our Manager, our Manager may resign, which would trigger a change-in-control default provision in the credit facilities of our businesses.
The Company is a holding company with no operations. Therefore, it is dependent upon the ability of our businesses orand investments were unable to repay its debts when due, it would become insolvent. Increased interest rates or margins would reduce the profitability of the relevant business or investment and, consequently, would have an adverse impact on its ability to pay dividends and make distributions to usthe Company to enable it to meet its expenses, reduce any outstanding debt at the holding company level and to make distributions to shareholders in the future. The ability of our operating subsidiaries and the businesses in which we will hold investments to make distributions to the Company is subject to limitations based on their operating performance, the terms of their debt agreements and the applicable laws of their respective jurisdictions. In addition, the ability of each business to reduce its outstanding debt will be similarly limited by its operating performance, as discussed below and in Part 1, Item 7, “Management’s Discussion and Analysis of Financial Condition and Results of Operations.” If, as a consequence of these various limitations and restrictions, we are unable to receive sufficient dividends and/or distributions from our businesses, we may be limited in our ability to pay dividends to shareholders.
We own, and may acquire in the future, investments in which we share voting control with third parties and, consequently, our ability to exercise significant influence over the business or level of their distributions to us depends on our maintaining good relationships with these third parties.
We own 50% of IMTT and 50.01% of District Energy and may acquire less than majority ownership in other investmentsbusinesses in the future. Our ability to influence the management of jointly controlled investments,owned businesses, and the ability of these investmentsbusinesses to continue operating without disruption, depends on our maintaining a good working relationshipreaching agreement with our co-investors and having similarreconciling investment and performance objectives for these investments.businesses. To the extent that we are unable to agree with co-investors regarding the business and operations of the relevant investment, the performance of the investment and level of dividends to us are likely tothe operations may suffer, whichand could have a material adverse effect on our results and our ability to pay distributions on our shares.results. Furthermore, we may, from time to time, own non-controlling interests in investments. Management and controlling shareholders of these investments may develop different objectives than we have and may not make distributions to us at levels that we had anticipated. Our inability to exercise significant influence over the operations, strategies and policies of non-controlled investments means that decisions could be made that could adversely affect our results and our ability to generate cash and pay distributions on our shares.
Our business isbusinesses are dependent on our relationships, on a contractual and regulatory level, with government entities that may have significant leverage over us. Government entities may be influenced by political considerations to take actions adverse to us.
Our businessbusinesses generally is,are, and will continue to be, subject to substantial regulation by governmental agencies. In addition, our business reliesbusinesses rely on obtaining and maintaining government permits, licenses, concessions, leases or contracts. Government entities, due to the wide-ranging scope of their authority, have significant leverage over us in their contractual and regulatory relationships with us that they may exercise in a manner that causes us delays in the operation of our businessbusinesses or pursuit of our strategy, or increased administrative expense. Furthermore, government permits, licenses, concessions, leases and contracts are generally very complex, which may result in periods of non-compliance, or disputes over interpretation or enforceability. If we fail to comply with these regulations or contractual obligations, we could be subject to monetary penalties or we may lose our rights to operate the affected business, or both. Where our ability to operate an infrastructure business is subject to a concession or lease from the government, the concession or lease may restrict our ability to operate the business in a way that maximizes cash flows and profitability. Further, our ability to grow our current and future businesses will often require consent of numerous government regulators. Increased regulation restricting the ownership or management of U.S. assets, particularly infrastructure assets, by non-U.S. persons, given the non-U.S. ultimate ownership of our Manager, may limit our ability to pursue acquisitions. Any such regulation may also limit our Manager’s ability to continue to manage our operations, which could cause disruption to our businessbusinesses and a decline in our performance. In addition, any required government consents may be costly to seek and we may not be able to obtain them. Failure to obtain any required consents could limit our ability to achieve our growth strategy.
Our contracts with government entities may also contain clauses more favorable to the government counterparty than a typical commercial contract. For instance, a lease, concession or general service contract may enable the government to terminate the agreement without requiring them to pay adequate compensation. In addition, government counterparties also may have the discretion to change or increase regulation of our operations, or implement laws or regulations affecting our operations, separate from any contractual rights they may have. Governments have considerable discretion in implementing regulations that could impact these businesses. Because our businesses provide basic everyday services, and face limited competition, governments may be influenced by political considerations to take actions that may hinder the efficient and profitable operation of our businesses and investments.
Governmental agencies may determine the prices we charge and may be able to restrict our ability to operate our businessbusinesses to maximize profitability.
Where our businesses or investments are sole or predominant service providers in their respective service areas and provide services that are essential to the community, they are likely to be subject to rate regulation by governmental agencies that will determine the prices they may charge. We may also face fees or other charges imposed by government agencies that increase our costs and over which we have no control. We may
be subject to increases in fees or unfavorable price determinations that may be final with no right of appeal or that, despite a right of appeal, could result in our profits being negatively affected. In addition, we may have very little negotiating
Our businesses are subject to environmental risks that may impact our future profitability.
Our businesses (including businesses in which we invest) are subject to numerous statutes, rules and regulations relating to environmental protection. Our airport services and airport parking businesses areAtlantic Aviation is subject to environmental protection requirements relating to the storage, transport, pumping and transfer of fuel, and our district energy businessDistrict Energy is subject to requirements relating mainly to its handling of significant amounts of hazardous materials. TGCThe Gas Company is subject to risks and hazards associated with the refining, handling, storage and transportation of combustible products. These risks could result in substantial losses due to personal injury, loss of life, damage or destruction of property and equipment, and environmental damage. Any losses we face could be greater than insurance levels maintained by our businesses, which could have an adverse effect on their and our financial results. In addition, disruptions to physical assets could reduce our ability to serve customers and adversely affect sales and cash flows.
IMTT’s operations in particular are subject to complex, stringent and expensive environmental regulation. Although we believe that our businesses comply in all material respectsregulation and future compliance costs are difficult to estimate with environmental, healthcertainty. IMTT also faces risks relating to the handling and safety regulations, failuretransportation of significant amounts of hazardous materials. Failure to comply in the futurewith regulations or other claims may give rise to interruptions in operations and civil or criminal penalties and liabilities that could adversely affect ourthe profitability of this business and financial condition.the distributions it makes to us, as could significant unexpected compliance costs. Further, these rules and regulations are subject to change and compliance with suchany changes could result in a restriction of the activities of our businesses, significant capital expenditures and/or increased ongoing operating costs.
A number of the properties owned by IMTT have been subject to environmental contamination in the past and require remediation for which IMTT is liable. These remediation obligations exist principally at IMTT’s Bayonne and Lemont facilities and could cost more than anticipated or could be incurred earlier than anticipated or both. In addition, IMTT may discover additional environmental contamination at its Bayonne, Lemont or other facilities that may require remediation at significant cost to IMTT. Further, the past contamination of the properties owned by IMTT, including by former owners or operators of such properties, could also result in remediation obligations, personal injury, or property damage, environmental damage or similar claims by third parties.
We may also be required to address other prior or future environmental contamination, including soil and groundwater contamination that results from the spillage of fuel, hazardous materials or other pollutants. Under various federal, state, local and foreign environmental statutes, rules and regulations, a current or previous owner or operator of real property may be liable for noncompliance with applicable environmental and health and safety requirements and for the costs of investigation, monitoring, removal or remediation of hazardous materials. These laws often impose liability, whether or not the owner or operator knew of, or was responsible for, the presence of hazardous materials. The presence of these hazardous materials on a property could also result in personal injury or property damage or similar claims by private parties that could have a material adverse effect on our financial condition or operating income. Persons who arrange for the disposal or treatment of hazardous materials may also be liable for the costs of removal or remediation of those materials at the disposal or treatment facility, whether or not that facility is or ever was owned or operated by that person.
We may face a greater exposure to terrorism than other companies because of the nature of our businesses and investments.
We believe that infrastructure businesses face a greater risk of terrorist attack than other businesses, particularly those businesses that have operations within the immediate vicinity of metropolitan and suburban areas. Specifically, because of the combustible nature of TGC’sthe products of The Gas Company and consumer reliance on these products for basic services, TGC’sthe business’ SNG plant, transmission pipelines, barges and storage facilities may be at greater risk for terrorism attacks than other businesses, which could affect TGC’sits operations significantly. Any terrorist attacks that occur at or near our business locations would likely cause significant harm to our employees and assets. As a result of the terrorist attacks in New York on September 11, 2001, insurers significantly reduced the amount of insurance coverage available for liability to persons other than employees or passengers for claims resulting from acts of terrorism, war or similar events. A terrorist attack that makes use of our property, or property under our control, may result in liability far in excess of available insurance coverage. In addition, any further terrorist attack, regardless of location, could cause a disruption to our business and a decline in earnings. Furthermore, it is likely to result in an increase in insurance premiums and a reduction in coverage, which could cause our profitability to suffer.
We are dependent on certain key personnel, and the loss of key personnel, or the inability to retain or replace qualified employees, could have an adverse effect on our business,businesses, financial condition and results of operations.
We operate our businesses on a stand-alone basis, relying on existing management teams for day-to-day operations. Consequently, our operational success, as well as the success of our internal growth strategy, will be dependent on the continued efforts of the management teams of our businesses, who have extensive experience in the day-to-day operations of these businesses. Furthermore, we will likely be dependent on the operating management teams of businesses that we may acquire in the future. The loss of key personnel, or the inability to retain or replace qualified employees, could have an adverse effect on our business, financial condition and results of operations.
Our income may be affected adversely if additional compliance costs are required as a result of new safety, health or environmental regulation.
Our businesses and investments are subject to federal, state and local safety, health and environmental laws and regulations. These laws and regulations affect all aspects of their operations and are frequently modified. There is a risk that any one of our businesses or investments may not be able to comply with some aspect of these laws and regulations, resulting in fines or penalties. Additionally, if new laws and regulations are adopted or if interpretations of existing laws and regulations change, we could be required to increase capital spending and incur increased operating expenses in order to comply. Because the regulatory environment frequently changes, we cannot predict when or how we may be affected by such changes.
A significant and sustained increase in the general aviation industry that results in less air traffic at airports we service wouldprice of oil could have a material adversenegative impact on our airport services business.
A significant and sustained increase in the price of oil could have a negative impact on the profitability of a number of our businesses. Higher prices for jet fuel could result in less use of aircraft by general aviation customers, which would have a negative impact on the profitability of Atlantic Aviation. Higher fuel prices could increase the cost of power to our businesses generally which they may not be able to fully pass on to customers.
Risks Related to IMTT
IMTT’s business is dependent on the demand for bulk liquid storage capacity in the locations where it operates.
Demand for IMTT’s bulk liquid storage is largely a particular airport compete based onfunction of U.S. domestic demand for chemical, petroleum and vegetable and animal oil products and, less significantly, the extent to which such products are imported into and/or exported out of the United States. U.S. domestic demand for chemical, petroleum and vegetable and animal oil products is influenced by a number of factors, including locationeconomic conditions, growth in the U.S. economy, the pricing of chemical, petroleum and vegetable and animal oil products and their substitutes. Import and export volumes of these products to and from the facility relativeUnited States are influenced by demand and supply imbalances in the United States and overseas, the cost of producing chemical, petroleum and vegetable and animal oil products domestically vis-à-vis overseas and the cost of transporting the products between the United States and overseas destinations. In addition, changes in government regulations that affect imports and exports of bulk chemical, petroleum and vegetable and animal oil products, including the imposition of surcharges or taxes on imported or exported products, could adversely affect import and export volumes to runways and street access, service, value added features, reliabilityfrom the United States. A reduction in demand for bulk liquid storage, particularly in the New York Harbor or the lower Mississippi River, as a consequence of lower U.S. domestic demand for, or imports/exports of, chemical, petroleum or vegetable and price. Many of our FBOs compete with one or more FBOs at their respective airports, and,animal oil products, could lead to a lesser extent, with FBOs at nearby airports. We cannot predictdecline in storage rates and tankage volumes rented out by IMTT and adversely affect IMTT’s revenue and profitability and the actions of competitors who may seekdistributions it makes to increase market share. Some present and potential competitors have or may obtain greater financial and marketing resources than we do, which may negatively impact our ability to compete at each airport.
IMTT’s business could be established at those FBO locations. The additionadversely affected by a substantial increase in bulk liquid storage capacity in the locations where it operates.
An increase in available bulk liquid storage capacity in excess of new competitors is particularly likely if we are seengrowth in demand for such storage in the key locations in which IMTT operates, such as New York Harbor and the lower Mississippi River, could result in overcapacity and a decline in storage rates and tankage volumes rented out by IMTT and could adversely affect IMTT’s revenue and profitability and the distributions it makes to us.
IMTT’s business could be earning significant profits from these FBO operations. Any such actions, if successful, may reduce, or impair our ability to increase,adversely affected by the revenue of the FBO business.
IMTT has a number of customers that together generate a material proportion of IMTT’s revenue and gross profit. In 2009, IMTT’s ten largest customers by revenue generated approximately 50.2% of total revenue. The insolvency of any of these large customers could result in an increase in unutilized storage capacity in the absence of such capacity being rented to other customers and adversely affect IMTT’s revenue and profitability and the distributions it makes to us.
IMTT’s business involves hazardous activities and is partly located in a region with a history of significant adverse weather events and is potentially a target for terrorist attacks. We cannot assure you that IMTT is, or will be in the future, adequately insured against all such risks.
The transportation, handling and storage of petroleum, chemical and vegetable and animal oil products are subject to the risk of spills, leakage, contamination, fires and explosions. Any of these events may result in loss of revenue, loss of reputation or goodwill, fines, penalties and other liabilities. In certain circumstances, such events could also require IMTT to halt or significantly alter operations at all or part of the FBO leases would damage our airport services business significantly.
Risks Related to The Gas Company
Disruptions or shutdowns at either of the two Oahu oil refineries for liquefied petroleum gason Oahu from which The Gas Company obtains both LPG and the primary feedstock for its SNG plant. Disruptions at eitherplant may have an adverse effect on the operations of those refineries may adversely affect TGC’s operations.
The Gas Company manufactures SNG and the distribution ofdistributes SNG and liquefied petroleum gas, or LPG. AnySNG feedstock SNG or LPG supply disruptions or refinery shutdowns that limit itsthe business’ ability to manufacture andand/or deliver gas forto customers would adversely affect its ability to carry out its operating activities. These could include:increase costs as a result of an inability to renewsource feedstock purchase arrangements, including our current SNG feedstock agreement which is due for renewal in 2007;at acceptable rates. The extended unavailability of one or both of the Oahu refineries; arefineries or disruption to crude oil supplies or feedstocksfeedstock to Hawaii; orHawaii could also result in an increased reliance on imported sources. Due to lack of Jones Act-qualified vessels, the business is unable to purchase LPG from the mainland U.S. An inability to purchase LPG from foreign sources. Specifically, TGCsources would adversely affect operations. The business is also limited in its ability to store both foreign-sourced LPG, and domestic LPG at the same location at the same time and, therefore, any disruption in supply may cause a short-term depletion of LPG.LPG stocks. Currently, the business has only one contracted source of feedstock for SNG, the Tesoro refinery, and if Tesoro chooses to discontinue the production or sale of feedstock to the business, which they could do with little notice, The Gas Company’s utility business would suffer a significant disruption and potentially significant operating cost increases and/or capital expenditures until alternative supplies of feedstock could be developed. All supply disruptions of SNG or LPG, if occurring for an extended period, could materially adversely impact TGC’s salesthe business’ contribution margin and cash flows.
In January 2010, Chevron announced that it plans to reduce the size of its global oil refining business, although it has not made any decisions regarding its refinery in Hawaii. Chevron could decide to continue operating in Hawaii, cease operations entirely or convert a portion of its operations into a terminal for importation of energy products. Chevron’s Hawaii refinery supplies The Gas Company with over half of its total LPG purchases. Any decision by Chevron regarding its operations in Hawaii could affect the business’ cost of LPG and may adversely impact its non-utility contribution margin and profitability.
The most significant costs for The Gas Company are locally-sourced LPG, LPG imports and feedstock for the SNG plant, the costs of which are directly related to petroleum prices. To the extent that these costs cannot be passed on to customers, TGC’s salesthe business’ contribution margin and cash flows will be adversely affected.
The profitability of TGCThe Gas Company is based on the margin of sales prices over costs. Since LPG and feedstock for the SNG plant are commodities, changes in the marketglobal supply of and demand for these products can have a significant impact on costs. In addition, increased reliance on higher-priced foreign sources of LPG, whether dueas a result of disruptions to disruptions or shortages in local sources or otherwise, could also have a significant impact on costs. TGCThe Gas Company has no control over these costs, and, to the extent that these costs cannot be passed on to customers, TGC’sthe business’ financial condition and the results of operations would be adversely affected. Higher prices could result in reduced customer demand or could result in customer conversion to alternative energy sources. Thissources, or both, that would reduce salesthe volume of gas sold and adversely affect profits.the profitability of The Gas Company.
The Gas Company relies on its SNG plant, including its transmission pipeline, for a significant portion of its sales. Disruptions at that facility could adversely affect the business’ ability to serve customers.
Disruptions at the SNG plant resulting from mechanical or operational problems or power failures could affect the ability of The Gas Company to produce SNG. Most of the utility sales on Oahu are of SNG and all SNG is produced at the Oahu plant. Disruptions to the primary and redundant production systems would have a significant adverse effect on The Gas Company’s sales and cash flows.
The operations of The Gas Company are subject to a variety of competitive pressures and the actions of competitors, particularly those involved in other energy sources, could have a materially adverse effect on operating results.
Other fuel sources such as electricity, diesel, solar energy, geo-thermal, wind, other gas providers and alternative energy sources may be substituted for certain gas end-use applications, particularly if the price of gas increases relative to other fuel sources, whether due to higher commodity supply costs or otherwise. Customers could, for a number of reasons, including increased gas prices, lower costs of alternative energy or convenience, meet their energy needs through alternative sources. This could have an adverse effect on the business’ revenue and cash flows.
The Gas Company’s utility business is subject to regulation by the Hawaii Public Utilities Commission, or HPUC, and actions by the HPUC or changes to the regulatory environment may constrain the operation or profitability of the business.
If the business fails to comply with certain HPUC regulatory conditions, the profitability of The Gas Company could be adversely impacted. The business agreed to 14 regulatory conditions with the HPUC that address a variety of matters including: a requirement that The Gas Company and HGC’s ratio of consolidated debt to total capital does not exceed 65%; and a requirement to maintain $20.0 million in readily-available cash resources at The Gas Company, HGC or MIC. The HPUC regulates all franchised or certificated public service companies operating in Hawaii; prescribes rates, tariffs, charges and fees; determines the allowable rate of earnings in establishing rates; issues guidelines concerning the general management of franchised or certificated utility businesses; and acts on requests for the acquisition, sale, disposition or other exchange of utility properties, including mergers and consolidations. Any adverse decision by the HPUC concerning the level or method of determining utility rates, the items and amounts that may be included in the rate base, the returns on equity or rate base found to be reasonable, the potential consequences of exceeding or not meeting such returns, or any prolonged delay in rendering a decision in a rate or other proceeding, could have an adverse effect on the business.
The Gas Company’s operations on the islands of Hawaii, Maui and Kauai rely on LPG that is transported to those islands by Jones Act qualified barges from Oahu and from non-Jones Act vessels from foreign ports. Disruptions to service by those vessels could adversely affect TGC’sthe business’ results of operations.
The Jones Act requires that all goods transported by water between U.S. ports be carried in U.S.-flag ships and that they meet certain other requirements. The business has time charter agreements allowing the use of two barges that currently have the capabilitya cargo capacity of transporting 424,000approximately 420,000 gallons and 500,000550,000 gallons of LPG respectively. The Jones Act requires that vessels carrying cargo between two U.S. ports meet certain requirements.each. The barges used by TGCthe business are the only two Jones Act qualified barges available in the Hawaiian Islands capable of carrying large volumes of LPG that are available in the Hawaiian Islands.LPG. They are near the end of their useful economic lives, and the barge owner intends to replacerefurbish one or both of them in the near future. ToIf the extent that the barge owner is unable to replace these barges, or alternatively, these barges are unable to transport LPG from Oahu and TGCthe business is not able to secure foreign-source LPG or obtain an exemption to the Jones Act, the storage capacity on those islands could be depleted and sales and cash flowsprofitability of the business could be adversely affected.
The recovery of amounts expended for capital projects and operating expenses in the regulated operationsGas Company is subject to approval byrisks associated with volatility in the Hawaii Public Utilities Commission, or HPUC, which exposes TGC toeconomy.
Tourism and government activities (including the risk of incurring costs that may not be recoverable from regulated customers.
Because of its geographic location, Hawaii, and in turn TGC,The Gas Company, is subject to earthquakes and certain weather risks that could materially disrupt operations.
Hawaii is subject to earthquakes and certain weather risks, such as hurricanes, floods, heavy and sustained rains and tidal waves. Because TGC’sthe business’ SNG plant, SNG transmission line and several storage facilities are close to the ocean, weather-related disruptions to operations are possible. In addition, earthquakes may cause disruptions. These events could damage TGC’sthe business’ assets or could result in wide-spread damage to TGC’sits customers, thereby reducing sales volumes and, to the extent such damages are not covered by insurance, TGC’sthe business’ revenue and cash flows.
Risks Related to District Energy
Pursuant to the terms of a use agreement with the City of Chicago, the City of Chicago has rights that, if exercised, could have a significant negative impact on our district energy business.
In order to operate ourthe district cooling system in downtown Chicago, we havethe business has obtained the right to use certain public ways of the City of Chicago under a use agreement, which we refer to as the Use Agreement. Under the terms of the Use Agreement, the City of Chicago retains the right to use the public ways for a public purpose and has the right in the interest of public safety or convenience to cause usthe business to remove, modify, replace or relocate ourits facilities at our own expense.the expense of the business. If the City of Chicago exercises these rights, weDistrict Energy could incur significant costs and ourits ability to provide service to ourits customers could be disrupted, which would have an adverse effect on our business,the business’ financial condition and results of operations. In addition, the Use Agreement is non-exclusive, and the City of Chicago is entitled to enter into use agreements with ourthe business’ potential competitors.
The Use Agreement expires on December 31, 20202040 and may be terminated by the City of Chicago for any uncured material breach of its terms and conditions. The City of Chicago also may require usDistrict Energy to pay liquidated damages of $6,000 a day if we failthe business fails to remove, modify, replace or relocate ourits facilities when required to do so, if we installit installs any facilities that are not properly authorized under the Use Agreement or if ourthe district cooling system does not conform to the City of Chicago’s standards. Each of these non-compliance penalties could result in substantial financial loss or effectively shut down ourthe district cooling system in downtown Chicago.
Any proposed renewal, extension or modification of the Use Agreement requires approval by the City Council of Chicago. Extensions and modifications subject to the City of Chicago’s approval include those to enable the expansion of chilling capacity and the connection of new customers to the district cooling system. The City of Chicago’s approval is contingent upon the timely filing of an Economic Disclosure Statement, or EDS, by us and certain of the beneficial owners of our stock. If any of these investors fails to file a completed EDS form within 30 days of the City of Chicago’s request or files an incomplete or inaccurate EDS, the City of Chicago has the right to refuse to provide the necessary approval for any extension or modification of the Use Agreement or to rescind the Use Agreement altogether. If the City of Chicago declines to approve extensions or modifications to the Use Agreement, weDistrict Energy may not be able to increase the capacity of ourits district cooling system and pursue ourits growth strategy for our district energy business.strategy. Furthermore, if the City of Chicago rescinds or voids the Use Agreement, ourthe district cooling system in downtown Chicago would be effectively shut down and our business,the business’ financial condition and results of operations would be materially and adversely affected as a result.
Certain number of our investors may be required to comply with certain disclosure requirements of the City of Chicago and non-compliance may result in the City of Chicago’s rescission or voidance of the Use Agreement and any other arrangements our district energy businessDistrict Energy may have with the City of Chicago at the time of the non-compliance.
In order to secure any amendment to the Use Agreement with the City of Chicago to pursue expansion plans or otherwise, or to enter into other contracts with the City of Chicago, the City of Chicago may require any person who owns or acquires 7.5% or more of our sharesLLC interests to make a number of representations to the City of Chicago by filing a completed EDS. Our LLC agreement and our trust agreement requirerequires that in the event that we need to obtain approval from the City of Chicago in the future for any specific matter, including to expand the district cooling system or to amend the Use Agreement, we and each of our then 10%7.5% investors would need to submit an EDS to the City of Chicago within 30 days of the City of Chicago’s request. In addition, our LLC agreement and our trust agreement requirerequires each 10%7.5% investor to provide any supplemental information needed to update any EDS filed with the City of Chicago as required by the City of Chicago and as requested by us from time to time. However, in 2005, the City of Chicago passed an ordinance lowering the ownership percentage for which an EDS is required from 10% to 7.5%.
Any EDS filed by an investor may become publicly available. By completing and signing an EDS, an investor will have waived and released any possible rights or claims which it may have against the City of Chicago in connection with the public release of information contained in the EDS and also will have authorized the City of Chicago to verify the accuracy of information submitted in the EDS. The requirements and consequences of filing
If any investor fails to comply with the EDS requirements on time or the City of Chicago determines that any information provided in any EDS is false, incomplete or inaccurate, the City of Chicago may rescind or void the Use Agreement or any other arrangements Thermal Chicago has with the City of Chicago, and pursue any other remedies available to them. If the City of Chicago rescinds or voids the Use Agreement, ourthe business’ district cooling system in downtown Chicago would be effectively shut down and our business,the business’ financial condition and results of operations would be adversely affected as a result.
If certain events within or beyond the control of our district energy businessDistrict Energy occur, our district energy businessDistrict Energy may be unable to perform its contractual obligations to provide chilling and heating services to its customers. If, as a result, its customers elect to terminate their contracts, our district energy businessDistrict Energy may suffer loss of revenue. In addition, our district energy businessDistrict Energy may be required to make payments to such customers for damages.
In the event of a shutdown of one or more of our district energy business’District Energy’s plants due to operational breakdown, strikes, the inability to retain or replace key technical personnel or events outside its control, such as an electricity blackout, or unprecedented weather conditions in Chicago, our district energy businessDistrict Energy may be unable to continue to provide chilling and heating services to all of its customers. As a result, our district energy businessDistrict Energy may be in breach of the terms of some or all of its customer contracts. In the event that such customers elect to terminate their contracts with our district energy businessDistrict Energy as a consequence of their loss of service, its revenue may be materially adversely affected. In addition, under a number of contracts, our district energy businessDistrict Energy may be required to pay damages to a customer in the event that a cessation of service results in loss to that customer.
Northwind Aladdin currently derives mosta majority of its operating cash flows from a contract with a single customer, the AladdinPlanet Hollywood Resort and Casino, which recently emerged from bankruptcy.bankruptcy several years ago. If this customer were to enter into bankruptcy again, ourNorthwind’s Aladdin’s contract may be amended or terminated and wethe business may receive no compensation, which could result in the loss of our investment in Northwind Aladdin.
Northwind Aladdin derives mosta majority of its cash flows from a contract with the Planet Hollywood resort and casino (formerly known as the Aladdin resort and casinocasino) in Las Vegas to supply cold and hot water and back-up electricity. The Aladdin resort and casino emerged from bankruptcy immediately prior to MDE’sDistrict Energy’s acquisition of Northwind Aladdin in September 2004, and, during the course of those proceedings, the contract with Northwind Aladdin was amended to reduce the payment obligations of the Aladdin resort and casino. If the AladdinPlanet Hollywood resort and casino were to enter into bankruptcy again and a cheaper source of the services that Northwind Aladdin provides can be found, ourthis contract may be terminated or amended. This could result in a total loss or significant reduction in ourDistrict Energy’s income from Northwind Aladdin, for which wethe business may receive no compensation.
Risks Related to Atlantic Aviation
Further deterioration of business jet traffic at airports where Atlantic Aviation operates would cause Atlantic Aviation to default on its debt obligations.
Atlantic Aviation’s current debt-to-EBITDA ratio as defined under its loan agreement is 7.97x. This compares to a maximum permitted debt-to-EBITDA ratio of 8.25x. The maximum permitted debt-to-EBITDA ratio drops to 8.00x from March 31, 2010. A further decline in business jet take-offs and landings at airports where Atlantic Aviation operates FBOs could result in a reduction of Atlantic Aviation’s EBITDA as defined under its loan agreement. Consequently, Atlantic Aviation could exceed the maximum permitted debt-to-EBITDA ratio under its loan agreement and default on its debt obligations. If the default remains uncured, the lenders under the loan agreement may accelerate the repayment of the outstanding balance of the borrowings under the agreement. If Atlantic Aviation is unable to repay or refinance this debt, it may be rendered insolvent. A default on the debt obligations leading to bankruptcy or insolvency would cause Atlantic Aviation to default on its FBO leases and would allow the local airport authorities to terminate the leases.
Further deterioration in the economy in general or in the aviation industry that results in less air traffic at airports that Atlantic Aviation services would have a material adverse impact on our business.
A large part of the business’ revenue is derived from fuel sales and other services provided to general aviation customers and, to a lesser extent, commercial air travelers. A further economic downturn could reduce
the level of air travel, adversely affecting Atlantic Aviation. General aviation travel is dependentprimarily a function of economic activity. Consequently, during periods of economic downturn, FBO customers are more likely to curtail air travel.
The economic downturn of 2008 and 2009 had a significant impact on the demand for bulk liquid storage capacityactivity levels of many FBO customers, which resulted in significant declines in the locationsgross profit of this business. If the economy does not continue to improve or negative sentiment regarding corporate jet usage persists or increases, we may see future declines in volumes of fuel sold, which could materially adversely affect the results of this business and which could cause it to fail to meet the financial covenants of its debt arrangements and allow its lenders to declare its entire indebtedness immediately due and payable.
Air travel and air traffic volume can also be affected by events that have nationwide and industry-wide implications, such as the events of September 11, 2001, as well as local circumstances. Events such as wars, outbreaks of disease such as SARS, and terrorist activities in the United States or overseas may reduce air travel. Local circumstances include downturns in the general economic conditions of the area where an airport is located or other situations in which our major FBO customers relocate their home base or preferred fueling stop to alternative locations.
In addition, changes to regulations governing the tax treatment relating to general aviation travel, either for businesses or individuals may cause a reduction in general aviation travel. Increased environmental regulation restricting or increasing the cost of aviation activities could also cause the business’ revenue to decline.
Current economic conditions and increased pricing competition at Atlantic Aviation may have an adverse effect on market share and fuel margins, causing a decline in the profitability of that business.
Some of Atlantic Aviation’s competitors are pursuing more aggressive pricing strategies. These competitors operate FBOs at a number of airports where Atlantic Aviation operates or at airports near where it operates.
Atlantic Aviation is subject to a substantial increase in bulk liquid storage capacity in the locations where it operates.
FBO operators at a particular airport compete based on amended terms and increased in size during 2007 to provide the funding necessary for IMTT to fully pursue its expansion plans. We cannot assure you that IMTT will be able to refinance its debt facilities on acceptable terms,a number of factors, including the loosening of certain restrictive covenants, or that IMTT will be able to expand the size of its debt facilities by an amount sufficient to cover the funding requirements of its expansion plans. If IMTT is unable to obtain sufficient additional financing, it will be unable to fully pursue its current expansion plans, its growth prospects and results of operations would be adversely affected and its distributions to us would decline from current levels. This would adversely affect our ability to make distributions to shareholders. Additionally, even if available, replacement debt facilities may only be available at substantially higher interest rates or margins or with substantially more restrictive covenants. Either event may limit the operational flexibility of IMTT and its ability to upstream dividends and distributions to us. If interest rates or margins increase, IMTT will pay higher rates of interest on any debt that it raises to refinance existing debt, thereby reducing its profitability and having an adverse impact on its ability to pay dividends to us and our ability to make distributions to shareholders.
Atlantic Aviation’s FBOs do not have the event occurred. Consistent with industry practice, IMTT carries insuranceright to protect against mostbe the sole provider of FBO services at any of its FBO locations. The authority responsible for each airport has the ability to grant other FBO leases at the airport and new competitors could be established at those FBO locations. The addition of new competitors may reduce, or impair Atlantic Aviation’s ability to increase, the revenue of the accident-related risks involved in the conductFBO business.
The termination for cause or convenience of the business; however, the limits of IMTT’s coverage mean IMTT cannot insure against all risks. In addition, because IMTT’s facilities are not insured against loss from terrorism, a terrorist attack that significantly damages one or more of IMTT’s major facilitiesthe FBO leases would havedamage Atlantic Aviation’s operations significantly.
Atlantic Aviation’s revenue is derived from long-term leases at 68 airports and one heliport. If Atlantic Aviation defaults on the terms and conditions of its leases, including upon insolvency, the relevant authority may terminate the lease without compensation. Additionally, leases at Chicago Midway, Philadelphia, North East Philadelphia, New Orleans International and Orange County airports and the Metroport 34th Street Heliport in New York City, representing approximately 12% of Atlantic Aviation’s gross profit in 2009, allow
the relevant authority to terminate the lease at their convenience. In each case, Atlantic Aviation would then lose the income from that location and potentially the expected returns from prior capital expenditures. Atlantic Aviation would also likely be in default under the loan agreements and be obliged to repay its lenders a negativeportion or the entire outstanding loan amount.
The Transportation Security Administration, or TSA, is considering new regulations which could impair the relative convenience of general aviation and adversely affect demand for Atlantic Aviation’s services.
The TSA has proposed new regulations known as the Large Aircraft Security Program (LASP), which would require all U.S. operators of general aviation aircraft exceeding 12,500 pounds maximum take-off weight to implement security programs that are subject to TSA audit. In addition, the proposed regulations would require airports servicing these aircraft to implement security programs involving additional security measures, including passenger and baggage screening. We believe these new regulations, if implemented, will affect many of Atlantic Aviation’s customers and all of the airports at which it operates. These rules, if adopted, could decrease the convenience and attractiveness of general aviation travel relative to commercial air travel and, therefore, may adversely impact on IMTT’s future cash flow and profitability. Further, losses sustained by insurers during future hurricanesdemand for Atlantic Aviation’s services.
Risk Related to PCAA
The creditors of PCAA may seek recourse to the Company regardless of the legal merits.
PCAA is in the U.S. gulf regionprocess of completing a sale of its assets through a Chapter 11 bankruptcy. Creditors of the business may result in lower insurance coveragealso attempt to seek recovery from the Company and, increased insurance premiums for IMTT’s properties in Louisiana.
Risks Related to Ownership of TrustOur Stock
Our Manager’s affiliation with Macquarie BankGroup Limited and the Macquarie Group may result in conflicts of interest.
Our Manager is an affiliate of Macquarie BankGroup Limited and a member of the Macquarie Group. From time to time, we have entered into, and in the future we may enter into, transactions and relationships involving Macquarie BankGroup Limited, its affiliates, or other members of the Macquarie Group. Such transactions have included and may include, among other things, the acquisition of businesses and investments from Macquarie Group members, the entry into debt facilities and derivative instruments with members of the Macquarie Bank LimitedGroup serving as lender or counterparty, and financial advisory services provided to us by the Macquarie Securities (USA) Inc. and other affiliates of Macquarie Bank Limited.
Although our audit committee, all of the members of which are independent directors, is required to approve of any related party transactions, including those involving Macquarie Bank Limited, its affiliates, or members of the Macquarie Group or its affiliates, the relationship of our Manager to Macquarie Bank Limited and the Macquarie Group may result in conflicts of interest.
In addition, as a result of our Manager’s being a member of the Macquarie Group, negative market perceptions of Macquarie Group Limited generally or of Macquarie’s infrastructure management model, or Macquarie Group statements or actions with respect to other managed vehicles, may affect market perceptions of our company and cause a decline in the price of our LLC interests unrelated to our financial performance and prospects.
Our Manager can resign with 90 days notice and we may not be able to find a suitable replacement within that time, resulting in a disruption in our operations which could adversely affect our financial results and negatively impact the market price of our LLC interests.
Our Manager has the right, under the management services agreement, to resign at any time with 90 days notice, whether we have found a replacement or not. The resignation of our Manager will trigger mandatory repayment obligations under debt facilities at all of our operating companies other than IMTT. If our Manager resigns, we may not be able to find a new external manager or hire internal management with similar expertise within 90 days to provide the same or equivalent services on acceptable terms, or at all. If we are
unable to do so quickly, our operations are likely to experience a disruption, our financial results could be adversely affected, perhaps materially, and the market price of our LLC interests may decline substantially. In addition, the coordination of our internal management, acquisition activities and supervision of our businesses and investments are likely to suffer if we were unable to identify and reach an agreement with a single institution or group of executives having the expertise possessed by our Manager and its affiliates.
Furthermore, if our Manager resigns, the Company and its subsidiaries will be required to cease use of the Macquarie brand entirely, and change their names to remove any reference to “Macquarie.” This may cause the value of the Company and the market price of our LLC interests to decline.
In the event of the underperformance of our Manager, we may be unable to remove our Manager, which could limit our ability to improve our performance and could adversely affect the market price of our shares.
Under the terms of the management services agreement, our Manager must significantly underperform in order for the management services agreement to be terminated. The company’s boardCompany’s Board of directorsDirectors cannot remove our Manager unless:
Because our Manager’s performance is measured by the market performance of our sharesLLC interests relative to a weighted average of two benchmark indices, a U.S. utilities index and a European utilities index, weighted in proportion to our U.S. and non-U.S. equity investments. As a result, even if the absolute market performance of our sharesLLC interests does not meet expectations, the company’s boardCompany’s Board of directorsDirectors cannot remove our Manager unless the market performance of our sharesLLC interests also significantly underperforms the weighted average of the benchmark indices. If we were unable to remove our Manager in circumstances where the absolute market performance of our sharesLLC interests does not meet expectations, the market price of our sharesLLC interests could be negatively affected.
Certain provisions of the management services agreement and the operating agreement of the company and the trust agreementCompany make it difficult for third parties to acquire control of the trust and the companyCompany and could deprive you of the opportunity to obtain a takeover premium for your shares.
In addition to the limited circumstances in which our Manager can be terminated under the terms of the management services agreement, the management services agreement provides that in circumstances where the trust stock ceases to be listed on a recognized U.S. exchange or on the Nasdaq National Market as a result of the acquisition of trust stock by third parties in an amount that results in the trust stock ceasing to meet the distribution and trading criteria on such exchange or market, the Manager has the option to either propose an alternate fee structure and remain our Manager or resign, terminate the management services agreement upon 30 days’days written notice and be paid a substantial termination fee. The termination fee payable on the Manager’s exercise of its right to resign as our Manager subsequent to a delisting of our sharesLLC interests could delay or prevent a change in control that may favor our shareholders. Furthermore, in the event of such a delisting, any proceeds from the sale, lease or exchange of a significant amount of assets must be reinvested in new assets of our company.company, subject to debt repayment obligations. We would also be prohibited from incurring any new indebtedness or engaging in any transactions with the shareholders of the companyCompany or its affiliates without the prior written approval of the Manager. These provisions could deprive the shareholders of the trust of opportunities to realize a premium on the shares of trust stockLLC interests owned by them.
The operating agreement of the company,Company, which we refer to as the LLC agreement, and the trust agreement containcontains a number of provisions that could have the effect of making it more difficult for a third-party to acquire, or discouraging a third-party from acquiring, control of the trust and the company. These provisions include:
The market price and marketability of our sharesLLC interests may from time to time be significantly affected by numerous factors beyond our control, which may adversely affect our ability to raise capital through future equity financings.
The market price of our sharesLLC interests may fluctuate significantly. Many factors that are beyond our control may significantly affect the market price and marketability of our sharesLLC interests and may adversely affect our ability to raise capital through equity financings. These factors include the following:
Risks Related to Taxation
We have significant income tax purposes.
We have accumulated over $116.0 million in federal income tax purposes and required to deliver a Schedule K-1 to shareholders for any extended length of time, it may negatively impact the liquidity of trading in our trust stock.
The current treatment of qualified dividend income and long-term capital gains under current U.S. federal income tax law may be adversely affected, changed or repealed in the future.
Under current law, qualified dividend income and long-term capital gains are taxed to non-corporate investors at a maximum U.S. federal income tax rate of 15%. This tax treatment may be adversely affected, changed or repealed by future changes in tax laws at any time and is currently scheduled to expire for tax years beginning after December 31, 2008.
None.
In general, the assets of our businesses, including real property, isare pledged to secure the financing arrangements at these businesses.of each business on a stand-alone basis. See “Management’s Discussion and Analysis of Financial Condition and Results of Operations — Liquidity and Capital Resources” in Part II, Item 7 for a further discussion of these financing arrangements.
Energy-Related Businesses and Investments — Airport Services Business — Business — Locations” in Part I, Item 1. The lease in Plano expires in 2008 and we extended the lease in Baltimore in May 2006 for 90 days, with automatic renewal until termination by either party. We believe that these facilities are adequate to meet current and foreseeable future needs.
IMTT
IMTT owns and operates eightten wholly-owned bulk liquid storage facilities in the United States and has part ownership in two companies that each own bulk liquid storage facilities in Canada. The land on which the facilities are located is either owned or leased by IMTT with leased land comprising a small proportion of the aggregate amount oftotal land on which the facilities are located.in use. IMTT also owns the storage tanks, piping and transportation infrastructure such as docks and truck and rail loading equipment located at allthe facilities and related ship docks, except forin Quebec and Geismar, where the docks are leased. We believe that the aforementioned equipment that is in service is generally well maintained and adequate for the present operations. For further details, see “Our Businesses and Investments — Bulk Liquid Storage Terminal Business — BusinessIMTT — Locations” in Part I, Item 1.
The Gas Production and Distribution Business
The Gas Company or TGC, has facilities and equipment on all major Hawaiian Islands providing support for our regulated and non-regulated operations. Property used in the regulated operations includesincluding: land beneath the SNG Plant and underground distribution piping. Regulated operations also includeplant; several LPG holding tanks for LPG for distribution via underground piping located on each major island and by trucks used to transport LPG to these holding tanks. TGC hascylinders; approximately 1,000 miles of underground piping, used in regulated operations, of which approximately 900 miles are on Oahu.Oahu; and a 22-mile transmission pipeline from the SNG plant to Pier 38 in Honolulu.
A summary of property, by island, follows. For more information regarding TGC’sThe Gas Company’s operations, see “Business — Our“Our Businesses and Investments — The Gas Production and Distribution BusinessCompany — Fuel Supply, SNG Plant and Distribution System” in Part 1,I, Item 1.
| Island | Description | Use | Own/Lease | |||
| Oahu | SNG Plant | Production of SNG | Lease | |||
| Kamakee Street Buildings and Maintenance yard | Engineering, Maintenance Facility, Warehouse | Own | ||||
| LPG Baseyard | Storage facility for tanks and cylinders | Lease | ||||
| Topa Fort Street Tower | Executive Offices | Lease | ||||
| Various Holding Tanks | Store and supply LPG to utility customers | Lease | ||||
| Maui | Office, tank storage facilities and baseyard | Island-wide operations | Lease | |||
| Kauai | Office | Island-wide operations | Own | |||
| Kauai | Tank storage facility and baseyard | Island-wide operations | Lease | |||
| Hawaii | Office, tank storage facilities and baseyard | Island-wide operations | Own |
District Energy Business
District Energy owns or leases six plants in Chicago as follows:
| Plant Number | Ownership or Lease Information | |
| P-1 | ||
| P-2 | Property, building and | |
| District Energy. | ||
| P-3 | ||
| equipment. | ||
| P-4 | ||
| P-5 | ||
| The equipment is owned by District Energy. | ||
| Stand-Alone |
District Energy Business — Business — Thermal Chicago — Overview”also owns approximately 14 miles of underground piping from which it distributes chilled water from its facilities to the customers in Item 1. Business for a discussion of individual plant capacities.
The equipment at District Energy’s Las Vegas facility is housed in its own building on a parcel of leased landproperty within the perimeter of the AladdinPlanet Hollywood resort and casino.casino, which expires in 2020. The property lease is co-terminus with the supply contract with the AladdinPlanet Hollywood resort and casino. The plant isbuilding and equipment are owned by Northwind AladdinDistrict Energy and upon terminationexpiration of the lease the plantbusiness is required to either be abandonedabandon the building and equipment or removedremove them at the landlord’s expense. The plant has sufficient capacity to serve its customers and has room for expansion if needed.
Aviation-Related Business
Atlantic Aviation
Atlantic Aviation does not own any real property. Its operations are carried out under various long-term leases. The land on which the facilities are located is either owned or leased by us. The material leases are generally long-term in nature. Please see the description under “Business — Our Businesses and Investments — Airport Parking Business — Locations” in Part I, Item 1 for a fuller description of the nature of the properties where these facilities are located.
Atlantic Aviation owns or leases a fleetnumber of shuttle busesvehicles, including fuel trucks and other equipment needed to transport customersprovide service to and from the airports at which it operates. The buses are either owned or leased. The total size of the fleet is approximately 192 shuttle buses. Some routinecustomers. Routine maintenance is performed by its own mechanics, while we outsource more significant maintenance. We believeon this equipment and a portion is replaced in accordance with a pre-determined schedule. Atlantic Aviation believes that these vehicles arethe equipment is generally well maintained and adequate for present operations. Our airport parking business replaces
ITEM 3. LEGAL PROCEEDINGS
Section 185 of the shuttle fleet approximately every threeClean Air Act (CAA) requires states (or in the absence of state action, the EPA) in severe and extreme non-attainment areas to five years.
There are no legal proceedings pending that we believe will have a material adverse effect on us other than ordinary course litigation incidental to our businesses. We are involved in ordinary course legal, regulatory, administrative and environmental proceedings. Typically, expenses associated with these proceedings periodically that are typically covered by insurance.
None.
PART II
ITEM 5. Market for Registrants’ Common Equity, Related Stockholder Matters and Issuer Purchases of Equity Securities
Market Information
Our common stock isLLC interests are traded on the NYSE under the symbol “MIC.” Our common stock began trading on the NYSE on December 16, 2004. The following table sets forth, for the fiscal periods indicated, the high and low sale prices per share of our common stockLLC interest on the NYSE:
| High | Low | |||||||
| Fiscal 2008 | ||||||||
| First Quarter | $ | 39.01 | $ | 29.13 | ||||
| Second Quarter | 33.24 | 25.29 | ||||||
| Third Quarter | 25.00 | 12.63 | ||||||
| Fourth Quarter | 12.90 | 2.32 | ||||||
| Fiscal 2009 | ||||||||
| First Quarter | $ | 5.74 | $ | 0.79 | ||||
| Second Quarter | 4.36 | 1.50 | ||||||
| Third Quarter | 9.38 | 3.10 | ||||||
| Fourth Quarter | 12.60 | 7.38 | ||||||
| Fiscal 2010 | ||||||||
| First Quarter (through February 18, 2010) | $ | 13.96 | $ | 12.20 | ||||
High | Low | ||||||
Fiscal 2005 | |||||||
| First Quarter | $ | 30.08 | $ | 27.91 | |||
| Second Quarter | 29.82 | 27.21 | |||||
| Third Quarter | 28.80 | 27.92 | |||||
| Fourth Quarter | 31.00 | 28.44 | |||||
Fiscal 2006 | |||||||
| First Quarter | $ | 35.23 | $ | 30.64 | |||
| Second Quarter | 32.27 | 26.06 | |||||
| Third Quarter | 32.68 | 23.84 | |||||
| Fourth Quarter | 35.79 | 29.20 | |||||
Fiscal 2007 | |||||||
| First Quarter (through February 23, 2007) | $ | 39.91 | $ | 34.65 | |||
As of January 31, 2007February 25, 2010, we had 37,562,165 shares of trust stock45,292,913 LLC interests outstanding that were held by 4690 holders of record and approximately 25,000representing over 16,000 beneficial owners.
Disclosure of NYSE-Required Certifications
Because our trust stock isLLC interests are listed on the NYSE, our Chief Executive Officer is required to make, and on November 7, 2006July 6, 2009 did make, an annual certification to the NYSE stating that he was not aware of any violation by the companyCompany of the corporate governance listing standards of the NYSE. In addition, we have filed, as exhibits to this annual report on Form 10-K, the certifications of the Chief Executive Officer and Chief Financial Officer required under Section 302 of the Sarbanes-Oxley Act of 2002 to be filed with the SEC regarding the quality of our public disclosure.
Distribution Policy
In February 2009, we suspended payment of quarterly cash distributions on all outstanding shares. Our policy is based on the predictable and stable cash flows of our businesses and investments and our intention to pay out as distributions to our shareholders the majority of our cash available for distributions and not to retain significant cash balances in excess of prudent reserves in our operating subsidiaries. We intend to finance our internal growth strategy primarily with selective operating cash flow and using existing debt and other resources at the company level. We intend to finance our acquisition strategy primarily through a combination of issuing new equity and incurring debt and not through operating cash flow. If our strategy is successful, we expect to maintain and increase the level of our distributions to shareholders in favor of applying the future.cash generated by our operating businesses to the reduction of holding company debt and operating company debt, principally at Atlantic Aviation. This policy is likely to remain in effect until such time as, a) we have achieved a prudent level of cash reserves at both our holding company and operating company entities, and b) the credit markets and customer spending patterns at the “user-pay” businesses regain a level of stability and predictability that enables us to confidently estimate refinancing terms relating to our long-term debt.
Since January 1, 2005,2008, we have made or declared the following per share distributions:
| Declared | Period Covered | $ per LLC Interest | Record Date | Payable Date | ||||||||||||
| February 25, 2008 | Fourth quarter 2007 | $ | 0.635 | March 5, 2008 | March 10, 2008 | |||||||||||
| May 5, 2008 | First quarter 2008 | $ | 0.645 | June 4, 2008 | June 10, 2008 | |||||||||||
| August 4, 2008 | Second quarter 2008 | $ | 0.645 | September 4, 2008 | September 11, 2008 | |||||||||||
| November 4, 2008 | Third quarter 2008 | $ | 0.20 | December 3, 2008 | December 10, 2008 | |||||||||||
Declared | Period Covered | $ Per Share | Record Date | Payable Date | ||||||
| May 14, 2005 | Dec 15 - Dec 31, 2004 | $ | 0.0877 | June 2, 2005 | June 7, 2005 | |||||
| May 14, 2005 | First quarter 2005 | $ | 0.50 | June 2, 2005 | June 7, 2005 | |||||
| August 8, 2005 | Second quarter 2005 | $ | 0.50 | September 6, 2005 | September 9, 2005 | |||||
| November 7, 2005 | Third quarter 2005 | $ | 0.50 | December 6, 2005 | December 9, 2005 | |||||
| March 14, 2006 | Fourth quarter 2005 | $ | 0.50 | April 5, 2006 | April 10, 2006 | |||||
| May 4, 2006 | First quarter 2006 | $ | 0.50 | June 5, 2006 | June 9, 2006 | |||||
| August 7, 2006 | Second quarter 2006 | $ | 0.525 | September 6, 2006 | September 11, 2006 | |||||
| November 8, 2006 | Third quarter 2006 | $ | 0.55 | December 5, 2006 | December 8, 2006 | |||||
| February 27, 2007 | Fourth quarter 2006 | $ | 0.57 | April 4, 2007 | April 9, 2007 | |||||
The declaration and payment of any future distribution will be subject to a decision of the company’s boardCompany’s Board of directors,Directors, which includes a majority of independent directors. The company’s boardCompany’s Board of directorsDirectors will take into account such matters as the state of the capital markets and general business conditions, our financial condition, results of operations, capital requirements and any contractual, legal and regulatory restrictions on the payment of distributions by us to our shareholders or by our subsidiaries to us, and any other factors that the boardBoard of directorsDirectors deems relevant. In particular, each of our businesses and investments have substantial debt commitments and restrictive covenants, which must be satisfied before any of them can distributepay dividends or make distributions to us. TheseAny or all of these factors could affect our ability to continue to makeboth the timing and amount, if any, of future distributions. See “Management’s Discussion and Analysis of Financial Condition and Results of Operations — Liquidity and Capital Resources” in Part II, Item 7.
Securities Authorized for Issuance Under Equity Compensation Plans
The table below sets forth information with respect to shares of trust stockLLC interests authorized for issuance as of December 31, 2006:
Plan Category | Number of Securities to be Issued Upon Exercise of Outstanding Options, Warrants and Rights(a) | Weighted-Average Exercise Price of Outstanding Options, Warrants and Rights(b) | Number of Securities Remaining Available for Future Issuance under Equity Compensation Plans (Excluding Securities Under Column (a))(c) | |||||
| Equity compensation plans approved by securityholders(1) | 16,869 | $ | — | (1 | ) | |||
| Equity compensation plans not approved by securityholders | — | — | — | |||||
| Total | 16,869 | — | (1 | ) | ||||
| Plan Category | Number of Securities to Be Issued Upon Exercise of Outstanding Options, Warrants and Rights (a) | Weighted-Average Exercise Price of Outstanding Options, Warrants and Rights (b) | Number of Securities Remaining Available for Future Issuance Under Equity Compensation Plans (Excluding Securities Under Column (a)) (c) | |||||||||
| Equity compensation plans approved by securityholders(1) | 128,205 | $ | — | (1) | ||||||||
| Equity compensation plans not approved by securityholders | — | — | — | |||||||||
| Total | 128,205 | — | (1) | |||||||||
| (1) | Information represents number of LLC interests issuable upon the vesting of director stock units pursuant to our independent directors’ equity plan, which was approved and became effective in December 2004. Under the plan, each independent director elected at our annual meeting of shareholders is entitled to receive a number of director stock units equal to $150,000 divided by the average closing sale price of the stock during the 10-day period immediately preceding our annual meeting. The units vest on the day prior to the following year’s annual meeting. We granted 42,735 director stock units to each of our independent directors elected at our 2009 annual shareholders’ meeting based on the average closing price per share over a 10 trading day period of $3.51. We have 488,739 LLC interests reserved for future issuance under the plan. |
ITEM 6. SELECTED FINANCIAL DATA
The selected financial data includes the results of operations, cash flow and balance sheet data of North America Capital Holding Company, or NACH (now known as Atlantic Aviation FBO Inc., or Atlantic Aviation), which was deemed to be our predecessor. We have included the results of operations and cash flow data of NACH for the years ended, and as of, December 31, 2002 and December 31, 2003, for the period from January 1, 2004 through July 29, 2004 and for the period July 30, 2004 through December 22, 2004. The period from December 23, 2004 through December 31, 2004 includes the results of operations and cash flow data for our businesses and investments from December 23 through December 31, 2004 and the results of the company from April 13, 2004 through December 31, 2004. The years ended December 31,2009, 2008, 2007, 2006 and 2005 include the full year of results for our consolidated group, with the results of businesses acquired during 2006 and 2005those years being included from the date of each acquisition. We have included the balance sheet data of NACH at December 31, 2003, and our consolidated balance sheet data at December 31, 2004, 2005 and 2006.
| Macquarie Infrastructure Company | ||||||||||||||||||||||
| Year Ended Dec 31, 2009 | Year Ended Dec 31, 2008(1) | Year Ended Dec 31, 2007(1) | Year Ended Dec 31, 2006(1) | Year Ended Dec 31, 2005(1) | ||||||||||||||||||
| ($ In Thousands, Except Per LLC Interest/Trust Stock Data) | ||||||||||||||||||||||
| Statement of operations data: | ||||||||||||||||||||||
| Revenue | ||||||||||||||||||||||
| Revenue from product sales | $ | 394,200 | $ | 586,054 | $ | 445,852 | $ | 262,432 | $ | 142,785 | ||||||||||||
| Revenue from product sales – utility | 95,769 | 121,770 | 95,770 | 50,866 | — | |||||||||||||||||
| Service revenue | 215,349 | 264,851 | 207,680 | 125,773 | 96,800 | |||||||||||||||||
| Financing and equipment lease income | 4,758 | 4,686 | 4,912 | 5,118 | 5,303 | |||||||||||||||||
| Total revenue | 710,076 | 977,361 | 754,214 | 444,189 | 244,888 | |||||||||||||||||
| Cost of revenue: | ||||||||||||||||||||||
| Cost of product sales | 231,139 | 406,997 | 302,283 | 192,399 | 84,480 | |||||||||||||||||
| Cost of product sales – utility | 71,252 | 103,216 | 64,371 | 14,403 | — | |||||||||||||||||
| Cost of services(2) | 46,317 | 63,850 | 53,387 | 37,905 | 37,085 | |||||||||||||||||
| Gross profit | 361,368 | 403,298 | 334,173 | 199,482 | 123,323 | |||||||||||||||||
| Selling, general and administrative expenses | 214,865 | 231,273 | 185,370 | 114,333 | 78,127 | |||||||||||||||||
| Fees to manager - related party | 4,846 | 12,568 | 65,639 | 18,631 | 9,294 | |||||||||||||||||
| Goodwill impairment(3) | 71,200 | 52,000 | — | — | — | |||||||||||||||||
| Depreciation(4) | 36,813 | 40,140 | 20,502 | 12,102 | 6,007 | |||||||||||||||||
| Amortization of intangibles(5) | 60,892 | 61,874 | 32,356 | 18,283 | 11,013 | |||||||||||||||||
| Operating (loss) income | (27,248 | ) | 5,443 | 30,306 | 36,133 | 18,882 | ||||||||||||||||
| Dividend income | — | — | — | 8,395 | 12,361 | |||||||||||||||||
| Interest income | 119 | 1,090 | 5,705 | 4,670 | 4,034 | |||||||||||||||||
| Interest expense | (91,154 | ) | (88,652 | ) | (65,356 | ) | (60,484 | ) | (23,449 | ) | ||||||||||||
| Loss on extinguishment of debt | — | — | (27,512 | ) | — | — | ||||||||||||||||
| Equity in earnings (losses) and amortization of charges of investees | 22,561 | 1,324 | (32 | ) | 12,558 | 3,685 | ||||||||||||||||
| Loss on derivative instruments | (29,540 | ) | (2,843 | ) | (1,362 | ) | (822 | ) | — | |||||||||||||
| Gain on sale of equity investment | — | — | — | 3,412 | — | |||||||||||||||||
| Gain on sale of investment | — | — | — | 49,933 | — | |||||||||||||||||
| Gain on sale of marketable securities | — | — | — | 6,737 | — | |||||||||||||||||
| Other income (expense), net | 760 | (19 | ) | (1,088 | ) | 92 | 136 | |||||||||||||||
| Net (loss) income from continuing operations before income taxes and noncontrolling interests | (124,502 | ) | (83,657 | ) | (59,339 | ) | 60,624 | 15,649 | ||||||||||||||
| Benefit for income taxes | 15,818 | 14,061 | 16,764 | 4,287 | 3,615 | |||||||||||||||||
| Net (loss) income from continuing operations before noncontrolling interests | (108,684 | ) | (69,596 | ) | (42,575 | ) | 64,911 | 19,264 | ||||||||||||||
| Noncontrolling interests | 486 | 585 | 554 | 528 | 719 | |||||||||||||||||
| Net (loss) income from continuing operations | $ | (109,170 | ) | $ | (70,181 | ) | $ | (43,129 | ) | $ | 64,383 | $ | 18,545 | |||||||||
| Discontinued operations | ||||||||||||||||||||||
| Net loss from discontinued operations before income taxes and noncontrolling interests | $ | (23,647 | ) | (180,104 | ) | $ | (9,679 | ) | $ | (27,150 | ) | $ | (3,865 | ) | ||||||||
| Benefit (provision) for income taxes | 1,787 | 70,059 | (281 | ) | 12,134 | — | ||||||||||||||||
Successor Year Ended Dec 31, 2006 | Successor Year Ended Dec 31, 2005 | Successor Dec 23 through Dec 31, 2004 | Predecessor July 30 through Dec 29, 2004 | Predecessor Jan 1 through July 29, 2004 | Predecessor Year Ended December 31, 2003 | Predecessor Year Ended December 31, 2002 | ||||||||||||||||
| ($ in thousands, except per share data) | ||||||||||||||||||||||
Statement of Operations Data: | ||||||||||||||||||||||
Revenue | ||||||||||||||||||||||
| Revenue from fuel sales | $ | 313,298 | $ | 142,785 | $ | 1,681 | $ | 29,465 | $ | 41,146 | $ | 57,129 | $ | 49,893 | ||||||||
| Service revenue | 201,835 | 156,655 | 3,257 | 9,839 | 14,616 | 20,720 | 18,698 | |||||||||||||||
| Lease Income | 5,118 | 5,303 | 126 | — | — | — | — | |||||||||||||||
| Total Revenue | 520,251 | 304,743 | 5,064 | 39,304 | 55,762 | 77,849 | 68,591 | |||||||||||||||
Cost of revenue: | ||||||||||||||||||||||
| Cost of product sales | (206,802 | ) | (84,480 | ) | (912 | ) | (16,599 | ) | (21,068 | ) | (27,003 | ) | (22,186 | ) | ||||||||
| Cost of services(1) | (92,542 | ) | (82,160 | ) | (1,633 | ) | (849 | ) | (1,428 | ) | (1,961 | ) | (1,907 | ) | ||||||||
Gross profit | 220,907 | 138,103 | 2,519 | 21,856 | 33,266 | 48,885 | 44,498 | |||||||||||||||
| Selling, general and administrative expenses(2) | (120,252 | ) | (82,636 | ) | (7,953 | ) | (13,942 | ) | (22,378 | ) | (29,159 | ) | (27,795 | ) | ||||||||
| Fees to manager | (18,631 | ) | (9,294 | ) | (12,360 | ) | — | — | — | — | ||||||||||||
| Depreciation | (12,102 | ) | (6,007 | ) | (175 | ) | (1,287 | ) | (1,377 | ) | (2,126 | ) | (1,852 | ) | ||||||||
| Amortization of intangibles(3) | (43,846 | ) | (14,815 | ) | (281 | ) | (2,329 | ) | (849 | ) | (1,395 | ) | (1,471 | ) | ||||||||
Operating income (loss) | 26,076 | 25,351 | (18,250 | ) | 4,298 | 8,662 | 16,205 | 13,380 | ||||||||||||||
| Interest income | 4,887 | 4,064 | 69 | 28 | 17 | 71 | 63 | |||||||||||||||
| Dividend income | 8,395 | 12,361 | 1,704 | — | — | — | — | |||||||||||||||
| Finance Fees | — | — | — | (6,650 | ) | — | — | — | ||||||||||||||
| Interest expense | (77,746 | ) | (33,800 | ) | (756 | ) | (2,907 | ) | (4,655 | ) | (4,820 | ) | (5,351 | ) | ||||||||
| Equity in earnings (loss) and amortization charges of investees | 12,558 | 3,685 | (389 | ) | — | — | — | — | ||||||||||||||
| Unrealized losses on derivative instruments | (1,373 | ) | — | — | — | — | — | — | ||||||||||||||
| Gain on sale of equity investment | 3,412 | — | — | — | — | — | — | |||||||||||||||
| Gain on sale of investment | 49,933 | — | — | — | — | — | — | |||||||||||||||
| Gain on sale of marketable securities | 6,738 | — | — | — | — | — | — | |||||||||||||||
| Other income (expense), net | 594 | 123 | 50 | (39 | ) | (5,135 | ) | (1,219 | ) | — | ||||||||||||
| Income (loss) from continuing operations before income tax | 33,474 | 11,784 | (17,572 | ) | (5,270 | ) | (1,111 | ) | 10,237 | 8,092 | ||||||||||||
| Income tax benefit (expense) | 16,421 | 3,615 | — | (286 | ) | 597 | (4,192 | ) | (3,150 | ) | ||||||||||||
| Minority interests | 23 | (203 | ) | (16 | ) | — | — | — | — | |||||||||||||
| Income (loss) from continuing operations | 49,918 | 15,196 | (17,588 | ) | (5,556 | ) | (514 | ) | 6,045 | 4,942 | ||||||||||||
| Discontinued operations: | ||||||||||||||||||||||
| Income from operations of discontinued operations | — | — | — | 116 | 159 | 121 | 197 | |||||||||||||||
| Loss on disposal of discontinued operations | — | — | — | — | — | (435 | ) | (11,620 | ) | |||||||||||||
| Income (loss) on disposal of discontinued operations (net of applicable income tax provisions) | — | — | — | 116 | 159 | (314 | ) | (11,423 | ) | |||||||||||||
Net income (loss) | 49,918 | 15,196 | (17,588 | ) | (5,440 | ) | (355 | ) | 5,731 | (6,481 | ) | |||||||||||
| Basic and diluted earnings (loss) per share(4) | 1.73 | 0.56 | (17.38 | ) | — | — | — | — | ||||||||||||||
| Cash dividends declared per common share | 2.075 | 1.5877 | — | — | — | — | — | |||||||||||||||
Cash Flow Data: | ||||||||||||||||||||||
| Cash provided by (used in) operating activities | 46,365 | 43,547 | (4,045 | ) | (577 | ) | 7,757 | 9,811 | 9,608 | |||||||||||||
| Cash (used in) provided by investing activities | (686,196 | ) | (201,950 | ) | (467,477 | ) | (228,145 | ) | 3,011 | (4,648 | ) | (2,787 | ) | |||||||||
| Cash provided by (used in) financing activities | 562,328 | 133,847 | 611,765 | 231,843 | (5,741 | ) | (5,956 | ) | (5,012 | ) | ||||||||||||
| Effect of exchange rate | (272 | ) | (331 | ) | (193 | ) | — | — | — | — | ||||||||||||
| Net (decrease) increase in cash | (77,775 | ) | (24,887 | ) | 140,050 | 3,121 | 5,027 | (793 | ) | 1,809 | ||||||||||||
| Macquarie Infrastructure Company | ||||||||||||||||||||||
| Year Ended Dec 31, 2009 | Year Ended Dec 31, 2008(1) | Year Ended Dec 31, 2007(1) | Year Ended Dec 31, 2006(1) | Year Ended Dec 31, 2005(1) | ||||||||||||||||||
| ($ In Thousands, Except Per LLC Interest/Trust Stock Data) | ||||||||||||||||||||||
| Net loss from discontinued operations before noncontrolling interests | (21,860 | ) | (110,045 | ) | (9,960 | ) | (15,016 | ) | (3,865 | ) | ||||||||||||
| Noncontrolling interests | (1,863 | ) | (1,753 | ) | (1,035 | ) | (551 | ) | (516 | ) | ||||||||||||
| Net loss from discontinued operations | $ | (19,997 | ) | $ | (108,292 | ) | $ | (8,925 | ) | $ | (14,465 | ) | $ | (3,349 | ) | |||||||
| Net loss | $ | (129,167 | ) | $ | (178,473 | ) | $ | (52,054 | ) | $ | 49,918 | $ | 15,196 | |||||||||
| Basic and diluted (loss) earnings per LLC interest/trust stock from continuing operations | $ | (2.43 | ) | $ | (1.56 | ) | $ | (1.05 | ) | $ | 2.23 | $ | 0.69 | |||||||||
| Basic and diluted loss per LLC interest/trust stock from discontinued operations | (0.44 | ) | (2.41 | ) | (0.22 | ) | (0.50 | ) | (0.13 | ) | ||||||||||||
| Weighted average number of shares outstanding: basic | 45,020,085 | 44,944,326 | 40,882,067 | 28,895,522 | 26,919,608 | |||||||||||||||||
| Weighted average number of shares outstanding: diluted | 45,020,085 | 44,944,326 | 40,882,067 | 28,912,346 | 26,929,219 | |||||||||||||||||
| Cash dividends declared per LLC interest/trust stock | $ | — | $ | 2.125 | $ | 2.385 | $ | 2.0750 | $ | 1.5877 | ||||||||||||
| Statement of cash flows data: | ||||||||||||||||||||||
| Cash flow from continuing operations | ||||||||||||||||||||||
| Cash provided by operating activities | $ | 82,976 | $ | 95,579 | $ | 93,499 | $ | 38,979 | $ | 39,033 | ||||||||||||
| Cash used in investing activities | (516 | ) | (56,716 | ) | (638,853 | ) | (681,994 | ) | (126,262 | ) | ||||||||||||
| Cash (used in) provided by financing activities | (117,818 | ) | 1,698 | 570,618 | 556,259 | 77,945 | ||||||||||||||||
| Effect of exchange rate | — | — | (1 | ) | (272 | ) | (331 | ) | ||||||||||||||
| Net (decrease) increase in cash | $ | (35,358 | ) | $ | 40,561 | $ | 25,263 | $ | (87,028 | ) | $ | (9,615 | ) | |||||||||
| Cash flow from discontinuing operations | ||||||||||||||||||||||
| Cash (used in) provided by operating activities | $ | (4,732 | ) | $ | (1,904 | ) | $ | 3,051 | $ | 7,386 | $ | 4,514 | ||||||||||
| Cash used in investing activities | (445 | ) | (26,684 | ) | (5,157 | ) | (4,202 | ) | (75,688 | ) | ||||||||||||
| Cash provided by (used in) financing activities | 2,144 | (1,215 | ) | (3,072 | ) | 6,069 | 55,902 | |||||||||||||||
| Net (decrease) increase in cash(6) | (3,033 | ) | (29,803 | ) | (5,178 | ) | 9,253 | (15,272 | ) | |||||||||||||
| Change in cash of discontinued operations held for sale(6) | $ | (208 | ) | $ | 2,459 | $ | 5,902 | $ | (2,740 | ) | $ | (5,931 | ) | |||||||||
| (1) | Reclassified to conform to current period presentation. |
| (2) | Includes depreciation expense of $6.1 million, $5.8 million, $5.8 million, $5.7 million and $5.7 million for the years ended December 31, 2009, 2008, 2007, 2006 and 2005, respectively, relating to District Energy. |
| (3) | Reflects non-cash impairment charge of $71.2 million and $52.0 million recorded during the first six months of 2009 and the fourth quarter of 2008, respectively, at Atlantic Aviation. |
| (4) | Includes a non-cash impairment charge of $7.5 million and $13.8 million recorded during the first six months of 2009 and the fourth quarter of 2008, respectively, at Atlantic Aviation. |
| (5) | Includes a non-cash impairment charge of $23.3 million and $21.7 million for contractual arrangements recorded in the first six months of 2009 and the fourth quarter of 2008, respectively, at Atlantic Aviation and a $1.3 million non-cash impairment charge on the airport management contracts at Atlantic Aviation in 2007. |
| (6) | Cash of discontinued operations held for sale is reported in assets of discontinued operations held for sale in our consolidated balance sheets. The net (decrease) increase in cash is different than the change in cash of discontinued operations held for sale due to intercompany transactions that are eliminated in consolidation. |
| Macquarie Infrastructure Company | ||||||||||||||||||||||
| Year Ended Dec 31, 2009 | Year Ended Dec 31, 2008(1) | Year Ended Dec 31, 2007(1) | Year Ended Dec 31, 2006(1) | Year Ended Dec 31, 2005(1) | ||||||||||||||||||
| ($ In Thousands) | ||||||||||||||||||||||
| Balance sheet data: | ||||||||||||||||||||||
| Assets of discontinued operations held for sale | $ | 86,695 | $ | 105,725 | $ | 258,899 | $ | 268,327 | $ | 288,846 | ||||||||||||
| Total current assets from continuing operations | 129,866 | 193,890 | 201,604 | 216,620 | 144,856 | |||||||||||||||||
| Property, equipment, land and leasehold improvements, net(2) | 580,087 | 592,435 | 577,498 | 425,045 | 240,260 | |||||||||||||||||
| Intangible assets, net(3) | 751,081 | 811,973 | 846,941 | 513,466 | 260,849 | |||||||||||||||||
| Goodwill(4) | 516,182 | 586,249 | 636,336 | 352,213 | 148,122 | |||||||||||||||||
| Total assets | 2,339,221 | 2,552,436 | 2,813,029 | 2,097,531 | 1,363,300 | |||||||||||||||||
| Liabilities of discontinued operations held for sale | $ | 220,549 | $ | 224,888 | $ | 225,042 | $ | 220,452 | $ | 207,321 | ||||||||||||
| Total current liabilities from continuing operations | 174,647 | 135,311 | 121,892 | 62,981 | 26,322 | |||||||||||||||||
| Deferred income taxes | 107,840 | 83,228 | 202,683 | 163,923 | 113,794 | |||||||||||||||||
| Long-term debt, including related party, net of current portion | 1,166,379 | 1,327,800 | 1,225,150 | 758,400 | 438,247 | |||||||||||||||||
| Total liabilities | 1,764,453 | 1,918,175 | 1,841,159 | 1,227,946 | 790,632 | |||||||||||||||||
| Members' equity | $ | 578,526 | $ | 628,838 | $ | 966,552 | $ | 864,425 | $ | 567,665 | ||||||||||||
| (1) | Reclassified to conform to current period presentation. |
| (2) | Includes a non-cash impairment charge of $7.5 million and $13.8 million recorded during the first six months of 2009 and the fourth quarter of 2008, respectively, at Atlantic Aviation. |
| (3) | Includes a non-cash impairment charge of $23.3 million and $21.7 million for contractual arrangements recorded in the first six months of 2009 and the fourth quarter of 2008, respectively, at Atlantic Aviation and a $1.3 million non-cash impairment charge on the airport management contracts at Atlantic Aviation in 2007. |
| (4) | Reflects non-cash impairment charge of $71.2 million and $52.0 million recorded during the first six months of 2009 and the fourth quarter of 2008, respectively, at Atlantic Aviation. |
Successor at December 31, 2006 | Successor at December 31, 2005 | Successor at December 31, 2004 | Predecessor at December 31, 2003 | ||||||||||
| ($ in thousands) | |||||||||||||
| Balance Sheet Data: | |||||||||||||
| Total current assets | $ | 230,966 | $ | 156,676 | $ | 167,769 | $ | 10,108 | |||||
| Property, equipment, land and leasehold improvements, net | 522,759 | 335,119 | 284,744 | 36,963 | |||||||||
| Contract rights and other intangibles, net | 526,759 | 299,487 | 254,530 | 52,524 | |||||||||
| Goodwill | 485,986 | 281,776 | 217,576 | 33,222 | |||||||||
| Total assets | 2,097,533 | 1,363,298 | 1,208,487 | 135,210 | |||||||||
| Current liabilities | 72,139 | 34,598 | 39,525 | 15,271 | |||||||||
| Deferred tax liabilities | 163,923 | 113,794 | 123,429 | 22,866 | |||||||||
| Long-term debt, including related party, net of current portion | 959,906 | 629,095 | 434,352 | 32,777 | |||||||||
| Total liabilities | 1,224,927 | 786,693 | 603,676 | 75,369 | |||||||||
| Redeemable convertible preferred stock | — | — | — | 64,099 | |||||||||
| Stockholders’ equity (deficit) | 864,425 | 567,665 | 596,296 | (4,258 | ) | ||||||||
The following discussion of the financial condition and results of operations of the companyCompany should be read in conjunction with the consolidated financial statements and the notes to those statements included elsewhere herein. This discussion contains forward-looking statements that involve risks and uncertainties and are made under the safe harbor provisions of the Private Securities Litigation Reform Act of 1995. Words such as “anticipates,” “expects,” “intends,” “plans,” “believes,” “seeks,” “estimates,” and similar expressions identify such forward-looking statements. Our actual results and timing of certain events could differ materially from those anticipated in these forward-looking statements as a result of certain factors, including, but not limited to, those set forth under “Risk Factors” in Part I, Item 1A. Unless required by law, we undertake no obligation to update forward-looking statements. Readers should also carefully review the risk factors set forth in other reports and documents filed from time to time with the SEC.
General
We own, operate and invest in a diversified group of infrastructure businesses that are providingprovide basic everyday services, such as parking, roadschilled water for building cooling and water,gas utility services to businesses and individuals primarily in the U.S. The businesses we own and operate are energy-related businesses consisting of IMTT, The Gas Company, and our controlling interest in District Energy, and an aviation-related business consisting of Atlantic Aviation.
On January 28, 2010, we agreed to sell the assets of PCAA through long-life physical assets. Thesea bankruptcy process, which we expect to complete in the first half of 2010. This business is now a discontinued operation and is therefore separately reported in our consolidated financial statements and is no longer a reportable segment.
Our infrastructure businesses generally operate in sectors with limited competition and high barriers to entry. Asentry resulting from a result,variety of factors including high initial development and construction costs, the existence of long-term contracts or the requirement to obtain government approvals and a lack of immediate cost-efficient alternatives to the services provided. Overall they havetend to generate sustainable and growing long-term cash flows.
Our energy-related businesses have proven, to date, largely resistant to the economic downturn of the past 18 to 24 months, primarily due to the contracted or utility-like nature of their revenues combined with the essential services they provide and the contractual or regulatory ability to pass through most cost increases to customers. We operatebelieve these businesses are generally able to generate consistent cash flows throughout the business cycle.
The results of Atlantic Aviation have been negatively affected since mid-2008 by lower overall economic and financedeclining general aviation activity levels through mid-2009. However, general activity levels stabilized in the second half of 2009 and finally showed some year on year growth in December. This stabilization, combined with expense reduction efforts, resulted in an improving outlook for the business.
The uncertainty and instability in the credit markets appears to be subsiding. This is evident in the increase in the volume of lending activity and the price at which such lending is occurring compared with levels during the height of the global financial crisis. We believe that this improvement in the credit market has had a beneficial impact on the outlook for our businesses, given the significant amount of long-term debt those businesses have outstanding.
Despite the improvement in the credit markets, we expect to continue to strengthen our consolidated balance sheet and those of our operating entities through prudent reduction in the amount of long-term debt outstanding, further increasing the likelihood that we will be able to successfully refinance this debt as it matures over approximately the next four years. In 2009, we accomplished a manner that maximizes these cash flows.
PCAA Asset Purchase Agreement
On January 28, 2010, we also received interest and principal on our subordinated loansannounced that PCAA had entered into an asset purchase agreement with Bainbridge ZKS — Corinthian Holdings, LLC. This agreement, which is subject to and dividends from, our toll road business and dividends from Macquarie Communications Infrastructure Group, or MCG, and South East Water, or SEW, through directly owned holding companies that we formed to hold our interest in each business and investment. We sold our toll road business in December 2006 and our interests in MCG and SEW in August and October of 2006, respectively.
As part of the bankruptcy filing, we have no obligation to and reductionhave no intention of committing additional capital to this business and our ongoing liabilities are expected to be no more than $5.3 million in the potential capital gain.
Sale of Non-controlling Stake in District Energy
On December 23, 2009, we sold 49.99% of the month preceding the respective closing datesnon-controlling interest of eachDistrict Energy to John Hancock Life Insurance Company and John Hancock Life Insurance Company (U.S.A.) (collectively “John Hancock”) for $29.5 million. The proceeds of the dispositions.
MIC Inc. Revolving Credit Facility
At March 31, 2009, we reclassified the membership interests in Eagle Aviation Resources, or EAR, operating an FBO in Las Vegas. On January 14, 2005, our airport services business acquired General Aviation Holdings, LLC, or GAH, with two FBOs in California. With these acquisitions, our airport services business owned and operated, at year end, a network of 41 FBOs and one heliport in the United States, the second largest such network in the industry.
By December 2009, we had received unanimous approval from the lenders to extend the term of the facility. However, using the net cash proceeds we received from the sale of the 49.99% non-controlling interest in District Energy, and associated costs with cash on hand. Thehand, we paid off the outstanding principal balance on December 28, 2009 and avoided the substantial costs that would have been incurred had the terms of the facility been amended. Shortly thereafter we elected to reduce the amount available on the revolving credit facility will continuefrom $97.0 million to be secured by all$20.0 million through to the maturity of the assetsfacility at March 31, 2010.
Income Taxes
We file a consolidated federal income tax return that includes the taxable income of all our businesses, except IMTT and, stock of companies within the airport services business.
Operating Segments and demographic growth in the regions serviced by a particular airport and the general rate of economic growth in the United States. A number of our airports are located near key business centers, for example, New York – Teterboro, Chicago – Midway and Philadelphia. We believe the traffic generated by the businesses at these locations could help our FBOs at these locations grow at a faster rate than the industry average nationwide.
Energy-Related Businesses
IMTT
IMTT provides bulk liquid storage and handling services in North America through a total of eightten terminals located on the East, West and Gulf coasts andCoasts, the Great Lakes region of the United States and a partially owned terminalterminals in each of Quebec and Newfoundland, Canada, with theCanada. IMTT has its largest terminals located onin the strategic locations of New York Harbor and on the lower Mississippi River near the Gulf of Mexico.New Orleans. IMTT stores and handles petroleum products, various chemicals, renewable fuels, and vegetable and animal oils. IMTT isoils and, based on storage capacity, operates one of the largest companies in the bulk liquid storage terminal industrybusinesses in the United States, based on storage capacity.
The key drivers of IMTT’s revenue and gross profit areinclude the amount of tank capacity rented to customers and the rates at which such capacity is rented.rental rates. Customers generally rent tanks under contracts with terms of between onethree and five years. Under these contracts, customers generally payyears that require payment regardless of actual tank usage. Demand for thestorage capacity ofwithin a particular region (e.g. New York Harbor) serves as the tank irrespective of whether the tank is actually used. The key driver of storage capacity utilization and tank rental rates is therates. This demand for capacity relative to the supply of capacity in a particular region (e.g., New York Harbor, Lower Mississippi River). Demand for capacity is primarily a function ofreflects both the level of consumption of the bulk liquid products stored by the terminals as well as import and the level of importation and exportationexport activity of such products. Demand for petroleum and liquid chemical products, the main products stored by IMTT, historically has generally been driven by the level of economic activity. We believe major constraints on increases in the supply of new bulk liquid storage capacity in IMTT’s key markets hashave been and will continue to be limited by the availability of waterfront land with access to the infrastructure necessary for land based receipt and distribution of stored product (road, rail and pipelines), lengthy environmental permitting processes and
Energy-Related Businesses: IMTT – (continued)
in the markets serviced by IMTT’s major facilities. This factor,condition, when combined with the attributes of IMTT’s facilities such as deep water drafts and access to land based infrastructure, have resulted in availableallowed IMTT to increase prices while maintaining very high storage capacity at IMTT’s major facilities for both petroleum and chemical products being consistently fully or near fully rented to customers.
IMTT earns revenue at its terminals from a number of sources including storage ofcharges for bulk liquids (per barrel, per month rental), throughput of liquids (handling charges), heating (a pass through of the cost associated with heating liquids to prevent excessive viscosity) and other (revenue from blending, packaging and warehousing, etc.). Most customer contracts include provisions for example). The key elements of revenue generally increase annuallyannual price increases based on the basis of inflation escalation provisions in customer contracts.
In operating its terminals, IMTT incurs labor costs, fuel costs, repair and maintenance costs, real and personal property taxes and other costs (which include insurance and other operating costs such as utilities and inventory used in packaging and drumming activities).
In 2006,2009, IMTT generated approximately 52%43% of its total terminal revenue and 50%approximately 42% of its terminal gross profit at its Bayonne NJ facility, which services New York Harbor, and 34%approximately 41% of its total terminal revenue and 42%approximately 48% of its terminal gross profit at its St. Rose, LA, Gretna, LAAvondale and Avondale, LAGeismar facilities, which together service the lower Mississippi River region (with St. Rose being the largest contributor).
Two key factors that arewill likely to materiallyhave a material impact on IMTT’s total terminal revenue and terminal gross profit in the future. First, IMTT has achieved substantial increases in storage rates at its Bayonne and St. RoseLouisiana facilities and some customers of IMTT have already agreed to extend contracts that do not expire until 2007 and 2008 at rates aboveover the existing rates under such contracts.past few years. Based on the current level of demand for bulk liquid storage in New York Harbor and the lower Mississippi River, we anticipate that IMTT will achieve annual increases in average storage revenuerates in excess of inflation at least through 2008.
The shareholders’ agreement between MIC,us, IMTT Holdings and its other shareholders until December 31, 2008, subject to compliance with law,specifies a default distribution policy for IMTT. Although the debt covenants applicable to its subsidiaries and retention of appropriate levels of reserves, IMTT Holdingsdefault under the shareholders’ agreement is required to distribute $7.0 million per quarterexcess cash, shareholders have indicated that they are prepared to us. At December 31, 2006, we recorded a $7.0 million receivablereinvest excess cash generated during 2010 in connection with the expected receipt of our share of the cash distribution for the fourth quarter of 2006 which was received on January 25, 2007. Subsequent to December 31, 2008, subject to the same limitations applicable prior to December 31, 2008 and subject to IMTT Holdings’ consolidated net debt to EBITDA ratio not exceeding 4.25:1 as at each quarter end, IMTT Holdings is required to distribute, quarterly, all of its consolidated cash flow from operations and cash flows from (but not used in) investing activities less maintenance and environmental remediation capital expenditure to its shareholders.
Our interest in IMTT Holdings, from the date of closing our acquisition, May 1, 2006, is reflected in our equity in earnings and amortization charges of investee line in our consolidated statements of operations. Cash distributions received by us in excess of our equity in IMTT’s earnings and amortization charges are reflected in our consolidated statements of cash flows in net cash used infrom investing activities under return on investment in unconsolidated business.
The Gas ProductionCompany
The Gas Company is Hawaii’s only government franchised full-service gas company, manufacturing and Distribution Business
The Hawaii market includes Hawaii’s approximate 1.3 million resident population and approximate 7.5 million annual visitors.
Energy-Related Businesses: The Gas Company – (continued)
SNG and LPG have a wide number of commercial and residential applications, including electricity generation, water heating, drying, cooking, emergency power generation and gas lighting.tiki torches. LPG is also used as a fuel for some automobiles, specialty vehicles andsuch as forklifts. Gas customers range frominclude residential customers for which TGC has nearly all of the market, toand a wide variety of commercial, hospitality, military, public sector and wholesale customers.
Revenue is primarily a function of the volume of SNG and LPG consumed by customers and the price per thermal unit or gallon charged to customers. Because both SNG and LPG are derived from petroleum,crude oil, revenue levels, without volume changes, will generally track global oil prices. Utility revenue includes fuel adjustment charges through which the changes in fuelfeedstock costs are passed through to utility customers. As a result,Evaluating the key measureperformance of performance for this business isbased on contribution margin.
Prices charged by TGCThe Gas Company to its customers for the utility gas business are based on Hawaii Public Utilities Commission, or HPUC, regulatedHPUC-utility rates that allow TGCthe business the opportunity to recover its costs of providing utility gas service, including operating expenses and taxes, a return ofand capital investments through recovery of depreciation and a return on the capital invested. TGC’sThe Gas Company’s rate structure generally allows it to maintain a relatively consistent dollar-based margin per thermal unit by passing increases or decreases in fuel costs through to customers through thevia fuel adjustment charges without filing a general rate case.
The rates that are charged to non-utility customers are based on the cost of LPG plus delivery costs, and on the cost of alternative fuels and competitive factors.
The Gas Company incurs expenses in operating and maintaining its facilities and distribution network, comprising a SNG plant, a 22-mile transmission line, 1,000900 miles of distribution and service pipelines, several tank storage facilities and a fleet of vehicles. These costs are generally fixed in nature. Other operating expenses incurred, such as for LPG, feedstock for the SNG plant and revenue-based taxes, are generally sensitive tofluctuate with the volume of product sold. In addition, TGCthe business incurs general and administrative expenses at its executive office that include expenses for senior management, accounting, information technology, human resources, environmental compliance, regulatory compliance, employee benefits, rents, utilities, insurance and other normal business costs.
District Energy
District Energy Business
Consumption payments (cooling consumption revenue) are a per unit chargecharges for the volume of chilled water used. Such payments are higher in the second and third quarters of each year when the demand for chilled waterbuilding cooling is at its highest. Consumption payments also fluctuate moderately from year to year depending on weather conditions. By contract, consumption payments generally increase in line with a number of economic indices that reflect the cost of electricity, labor and other input costs relevant to the operations of Thermal Chicago. The weighting of the individual economic indices broadly reflects the composition of Thermal Chicago’s direct expenses.
Energy-Related Businesses: District Energy – (continued)
Thermal Chicago’s principal direct expense is electricity. Other direct expenses in 2006 were electricity (40%),are labor, (14%), operations and maintenance (14%),and depreciation and accretion (23%) and other (9%).accretion. Electricity usage fluctuates in line with the volume of chilled water produced. Thermal Chicago particularly focuses on minimizing the amountcost of electricity consumed per unit of chilled water produced by operating its plants to maximize efficient use of electricity. Other direct expenses including labor, operations and maintenance, depreciation, and general and administrative are largely fixed irrespectiveregardless of the volumes of chilled water produced.
Thermal Chicago — Electricity Costs” in Item 1. Business. Thermal has entered into a contract with a retail energy supplier to provide for the supply of the majority of our 2007the business’ electricity in 2010 at a fixed priceprice. Electricity for one of the plants is purchased by the landlord/customer and the remaindercost is a cost passed through to us from a customer. We estimate our 2007the business. Based on Thermal Chicago’s retail contract, its 2010 electricity costs will increase on a per unit basis by 15-20%approximately 10% over 2006. We2009 and the business will pass the increase through to its customers. The business will need to enter into supply contracts for 20082011 and subsequent years which may result in further increases in our electricity costs. Future rate cases or rehearing’s with the ICC may also increase our electricity costs.
Northwind Aladdin provides coldservices customers (a hotel/casino complex and hot water and back-up electricity under two long-term contracts that expirea shopping mall) in February 2020. Pursuant to theseLas Vegas, Nevada. Under its customer contracts, Northwind Aladdin receives monthly fixed payments oftotaling approximately $5.4$6.4 million per annum through March 2016 and monthly fixed payments oftotaling approximately $2.0$3.0 million per year thereafter through February 2020. In addition, Northwind Aladdin receives
Aviation-Related Business
Atlantic Aviation
The performance of Atlantic Aviation depends upon the level of general aviation activity, and jet fuel consumption, and other variable payments from its customers that allow it to recover substantially allfor the largest portion of its operating costs. Approximately 90%gross profit. General aviation activity is in turn a function of total contract payments are received fromeconomic activity and demographic trends in the Aladdin resort and casino and the balance from the Desert Passage shopping mall.
Fuel gross profit is a function of the volume (gallons) sold and the average dollar margin per gallon. The average price per gallon is based on our cost of fuel plus, where applicable, fees and taxes paid to airports or other local authorities (cost of revenue — fuel), plus Atlantic Aviation’s margin. Dollar-based margins per gallon have been relatively insensitive to the wholesale price of fuel with both increases and decreases in the wholesale price of fuel generally passed through to customers, subject to the level of price competition that exists at the various FBOs. The average dollar-based margin varies based on business considerations and customer mix. Base tenants generally benefit from price discounts based on a higher utilization of Atlantic Aviation’s networks. Transient customers typically pay a higher price.
Atlantic Aviation also earns revenue from activities other than fuel sales (non-fuel revenue). For example, Atlantic Aviation earns revenue from refueling some general aviation customers on a “pass-through basis,” where it acts as a fueling agent for fuel suppliers. Atlantic Aviation receives a fee for this service, generally calculated on a per gallon basis. In addition, the business earns revenue from aircraft parking and hangar rental fees and by providing general aviation customers with other services, such as de-icing. At some sites where Atlantic Aviation operates an FBO business, Atlantic Aviation also earns revenue from refueling and de-icing some commercial airlines on a fee for service basis.
Expenses associated with non-fuel revenue (cost of revenue — non-fuel) include de-icing fluid costs and payments to airport authorities which vary from site to site. Cost of revenue — non-fuel is directly related to the discount applied, if any, and the numbervolume of days the customer is parked at the facility. For example, an increase in average parking revenue over time can be a result of increased pricing, reduced discounting or an increase in the average length of stay.
Atlantic Aviation incurs expenses in operating and maintaining each FBO. Operating expenses include rent and insurance, which are undertaken.
Results of the proceeds of our initial public offering. As a consequence, our consolidated operating results for the year ended December 31, 2004 only reflect the results of operations of our businesses and investments for a nine day period between December 22, 2004 and December 31, 2004. Any comparisons between our consolidated results of operations or cash flows in 2005 to 2004 would not be meaningful. We have therefore included a comparison of the historical results of operations and cash flows for these periods each of our consolidated businesses that we owned at the end of 2004, which we believe is a more appropriate approach to explaining the historical financial performance of the company. We have also provided a comparison of the historical results of operations and cashflows of TGC and IMTT from periods prior to our ownership to provide a better understanding of the performance of these businesses.
Consolidated
Key Factors Affecting Operating Results
Our consolidated results of operations are summarized belowas follows ($ in thousands):
| Year Ended December 31 | Change (From 2008 to 2009) Favorable/(Unfavorable) | Change (From 2007 to 2008) Favorable/(Unfavorable) | ||||||||||||||||||||||||||
| 2009 | 2008(1) | 2007(1) | $ | % | $ | % | ||||||||||||||||||||||
| ($ In Thousands) | ||||||||||||||||||||||||||||
| Revenue | ||||||||||||||||||||||||||||
| Revenue from product sales | $ | 394,200 | $ | 586,054 | $ | 445,852 | (191,854 | ) | (32.7 | ) | 140,202 | 31.4 | ||||||||||||||||
| Revenue from product sales — utility | 95,769 | 121,770 | 95,770 | (26,001 | ) | (21.4 | ) | 26,000 | 27.1 | |||||||||||||||||||
| Service revenue | 215,349 | 264,851 | 207,680 | (49,502 | ) | (18.7 | ) | 57,171 | 27.5 | |||||||||||||||||||
| Financing and equipment lease income | 4,758 | 4,686 | 4,912 | 72 | 1.5 | (226 | ) | (4.6 | ) | |||||||||||||||||||
| Total revenue | 710,076 | 977,361 | 754,214 | (267,285 | ) | (27.3 | ) | 223,147 | 29.6 | |||||||||||||||||||
| Costs and expenses | ||||||||||||||||||||||||||||
| Cost of product sales | 231,139 | 406,997 | 302,283 | 175,858 | 43.2 | (104,714 | ) | (34.6 | ) | |||||||||||||||||||
| Cost of product sales – utility | 71,252 | 103,216 | 64,371 | 31,964 | 31.0 | (38,845 | ) | (60.3 | ) | |||||||||||||||||||
| Cost of services | 46,317 | 63,850 | 53,387 | 17,533 | 27.5 | (10,463 | ) | (19.6 | ) | |||||||||||||||||||
| Gross profit | 361,368 | 403,298 | 334,173 | (41,930 | ) | (10.4 | ) | 69,125 | 20.7 | |||||||||||||||||||
| Selling, general and administrative | 214,865 | 231,273 | 185,370 | 16,408 | 7.1 | (45,903 | ) | (24.8 | ) | |||||||||||||||||||
| Fees to manager – related party | 4,846 | 12,568 | 65,639 | 7,722 | 61.4 | 53,071 | 80.9 | |||||||||||||||||||||
| Goodwill impairment | 71,200 | 52,000 | — | (19,200 | ) | (36.9 | ) | (52,000 | ) | NM | ||||||||||||||||||
| Depreciation | 36,813 | 40,140 | 20,502 | 3,327 | 8.3 | (19,638 | ) | (95.8 | ) | |||||||||||||||||||
| Amortization of intangibles | 60,892 | 61,874 | 32,356 | 982 | 1.6 | (29,518 | ) | (91.2 | ) | |||||||||||||||||||
| Total operating expenses | 388,616 | 397,855 | 303,867 | 9,239 | 2.3 | (93,988 | ) | (30.9 | ) | |||||||||||||||||||
| Operating (loss) income | (27,248 | ) | 5,443 | 30,306 | (32,691 | ) | NM | (24,863 | ) | (82.0 | ) | |||||||||||||||||
| Other income (expense) | ||||||||||||||||||||||||||||
| Interest income | 119 | 1,090 | 5,705 | (971 | ) | (89.1 | ) | (4,615 | ) | (80.9 | ) | |||||||||||||||||
| Interest expense | (91,154 | ) | (88,652 | ) | (65,356 | ) | (2,502 | ) | (2.8 | ) | (23,296 | ) | (35.6 | ) | ||||||||||||||
| Loss on extinguishment of debt | — | — | (27,512 | ) | — | NM | 27,512 | NM | ||||||||||||||||||||
| Equity in earnings (losses) and amortization charges of investees | 22,561 | 1,324 | (32 | ) | 21,237 | NM | 1,356 | NM | ||||||||||||||||||||
| Loss on derivative instruments | (29,540 | ) | (2,843 | ) | (1,362 | ) | (26,697 | ) | NM | (1,481 | ) | (108.7 | ) | |||||||||||||||
| Other income (expense), net | 760 | (19 | ) | (1,088 | ) | 779 | NM | 1,069 | 98.3 | |||||||||||||||||||
| Net loss from continuing operations before noncontrolling interests | (124,502 | ) | (83,657 | ) | (59,339 | ) | (40,845 | ) | (48.8 | ) | (24,318 | ) | (41.0 | ) | ||||||||||||||
| Benefit for income taxes | 15,818 | 14,061 | 16,764 | 1,757 | 12.5 | (2,703 | ) | (16.1 | ) | |||||||||||||||||||
| Net loss from continuing operations before noncontrolling interests | (108,684 | ) | (69,596 | ) | (42,575 | ) | (39,088 | ) | (56.2 | ) | (27,021 | ) | (63.5 | ) | ||||||||||||||
| Net income attributable to noncontrolling interests | 486 | 585 | 554 | 99 | 16.9 | (31 | ) | (5.6 | ) | |||||||||||||||||||
| Net loss from continuing operations | $ | (109,170 | ) | $ | (70,181 | ) | $ | (43,129 | ) | (38,989 | ) | (55.6 | ) | (27,052 | ) | (62.7 | ) | |||||||||||
| Discontinued operations | ||||||||||||||||||||||||||||
| Net loss from discontinued operations before income taxes and noncontrolling interests | (23,647 | ) | (180,104 | ) | (9,679 | ) | 156,457 | 86.9 | (170,425 | ) | NM | |||||||||||||||||
| Benefit (provision) for income taxes | 1,787 | 70,059 | (281 | ) | (68,272 | ) | (97.4 | ) | 70,340 | NM | ||||||||||||||||||
| Net loss from discontinued operations before noncontrolling interests | (21,860 | ) | (110,045 | ) | (9,960 | ) | 88,185 | 80.1 | (100,085 | ) | NM | |||||||||||||||||
| Net loss attributable to noncontrolling interests | (1,863 | ) | (1,753 | ) | (1,035 | ) | 110 | 6.3 | 718 | 69.3 | ||||||||||||||||||
| Net loss from discontinued operations | $ | (19,997 | ) | $ | (108,292 | ) | $ | (8,925 | ) | 88,295 | 81.5 | (99,367 | ) | NM | ||||||||||||||
| Net loss | $ | (129,167 | ) | $ | (178,473 | ) | $ | (52,054 | ) | 49,306 | 27.6 | (126,419 | ) | NM | ||||||||||||||
Year Ended December 31, 2006 | Year Ended December 31, 2005 | Change | April 13, 2004 (inception) to December 31, 2004 | ||||||||||||
$ | % | ||||||||||||||
Revenue | |||||||||||||||
| Revenue from product sales | $ | 313,298 | $ | 142,785 | 170,513 | 119.4 | $ | 1,681 | |||||||
| Service revenue | 201,835 | 156,655 | 45,180 | 28.8 | 3,257 | ||||||||||
| Financing and equipment lease income | 5,118 | 5,303 | (185 | ) | (3.5 | ) | 126 | ||||||||
| Total revenue | 520,251 | 304,743 | 215,508 | 70.7 | 5,064 | ||||||||||
Cost of revenue | |||||||||||||||
| Cost of product sales | 206,802 | 84,480 | 122,322 | 144.8 | 912 | ||||||||||
| Cost of services | 92,542 | 82,160 | 10,382 | 12.6 | 1,633 | ||||||||||
Gross profit | 220,907 | 138,103 | 82,804 | 60.0 | 2,519 | ||||||||||
| Selling, general and administrative | 120,252 | 82,636 | 37,616 | 45.5 | 7,953 | ||||||||||
| Fees to manager | 18,631 | 9,294 | 9,337 | 100.5 | 12,360 | ||||||||||
| Depreciation | 12,102 | 6,007 | 6,095 | 101.5 | 175 | ||||||||||
| Amortization of intangibles(1) | 43,846 | 14,815 | 29,031 | 196.0 | 281 | ||||||||||
Operating income (loss) | 26,076 | 25,351 | 725 | 2.9 | (18,250 | ) | |||||||||
Other income (expense) | |||||||||||||||
| Dividend income | 8,395 | 12,361 | (3,966 | ) | (32.1 | ) | 1,704 | ||||||||
| Interest income | 4,887 | 4,064 | 823 | 20.3 | 69 | ||||||||||
| Interest expense | (77,746 | ) | (33,800 | ) | (43,946 | ) | 130.0 | (756 | ) | ||||||
| Equity in earnings (loss) and amortization charges of investees | 12,558 | 3,685 | 8,873 | NM | (389 | ) | |||||||||
| Unrealized losses on derivative instruments | (1,373 | ) | — | (1,373 | ) | NM | — | ||||||||
| Gain on sale of equity investment | 3,412 | — | 3,412 | NM | — | ||||||||||
| Gain on sale of investment | 49,933 | — | 49,933 | NM | — | ||||||||||
| Gain on sale of marketable securities | 6,738 | — | 6,738 | NM | — | ||||||||||
| Other income, net | 594 | 123 | 471 | NM | 50 | ||||||||||
| Net income (loss) before income taxes and minority interests | 33,474 | 11,784 | 21,690 | 184.1 | (17,572 | ) | |||||||||
| Income tax benefit | 16,421 | 3,615 | 12,806 | NM | — | ||||||||||
| Net income (loss) before minority interests | 49,895 | 15,399 | 34,496 | NM | (17,572 | ) | |||||||||
| Minority interests | (23 | ) | 203 | (226 | ) | (111.3 | ) | 16 | |||||||
Net income | $ | 49,918 | $ | 15,196 | $ | 34,722 | NM | $ | (17,588 | ) | |||||
NM –— Not meaningful
| (1) | Reclassified to conform to current period presentation. |
Results of $23.5 million for existing trademarks and domain namesOperations: Consolidated – (continued)
Gross Profit
The decrease in our consolidated gross profit in 2009 was due to a re-branding initiative.
Selling, General and Administrative Expenses
The most significant factorsdecrease in our selling, general and administrative expenses in 2009 was primarily a result of cost reduction efforts at Atlantic Aviation, partially offset by higher costs at the holding company mainly attributable to the sale of the non-controlling stake in District Energy and increased incentive compensation, pension expense and professional services at our consolidated energy-related businesses. The increase in selling, general and administrative expenses were:
Fees to Manager
Base fees to our Manager decreased in 2009 due to our lower market capitalization. Our Manager elected to reinvest the second, third and fourth quarter of 2009 base management fees in additional LLC interests. LLC interests for the second and third quarters of 2009 were issued to our Manager during the second half of 2009. LLC interests for the fourth quarter of 2009 will be issued to our Manager during the first quarter of 2010.
The fees payable to our Manager in 2008 were lower primarily due to performance fees of $44.0 million in 2007 that did not recur in 2008. Our Manager elected to reinvest these performance fees in additional costs from the addition of TGC and Trajen not reflected in 2005 results;
Goodwill Impairment
Goodwill is considered impaired when the carrying amount of a $5.2 million increase inreporting unit’s goodwill exceeds its implied fair value. Based on the base fee due primarily to our increased asset base.
Depreciation
Depreciation includes non-cash asset impairment charges of $7.5 million and a dividend declared by MCG$13.8 million recorded in the second quarter2009 and received in the third quarter. The comparable SEW dividends from 2005, were both declared and received in the second quarter and fourth quarter.
Amortization of Intangibles
Amortization of intangibles expense includes non-cash asset impairment charges of $23.3 million, $21.7 million and $1.3 million recorded by Atlantic Aviation in 2006. 2009, 2008 and 2007, respectively. Excluding these impairment charges, amortization of intangibles expense increased in 2008 due to acquisitions made by Atlantic Aviation in 2007 and 2008. Amortization of intangibles expense for 2009 decreased due to the impairments previously discussed reducing the balance of intangible assets being amortized.
Interest Expense
Interest expense at Atlantic Aviation increased in 2009 primarily due mostlyto payments of interest rate swap breakage fees. This business expects to pay further interest rate swap breakage fees as it continues to pay down its term loan debt. This increase was partially offset by the favorable LIBOR movements on unhedged debt during the year, primarily from the MIC Inc. revolving credit facility, which was repaid in December 2009. The increase in interest expense in 2008 was due to a higher average level of debt outstanding, resulting from additional debt drawn to fund acquisitions and refinancings in 2006.
the second half of 2007.
Results of Operations: Consolidated – (continued)
Loss on Extinguishment of Debt
We recognized a loss on extinguishment of debt of $27.5 million in 2007, related to refinancings at Atlantic Aviation and District Energy. This loss included a $14.7 million make-whole payment for District Energy. The remainder was a non-cash write-off of previously deferred financing costs.
Equity in Earnings (Losses) and Amortization Charges of Investees
Our equity in the earnings on our 50%-owned investmentsof IMTT increased primarilyin 2009 due to higher operating results of the additionbusiness for that period, together with our share of IMTTthe non-cash derivative gains of $15.3 million compared with our share of non-cash derivative losses of $23.1 million in 20062008.
Loss on Derivative Instruments
We discontinued hedge accounting at Atlantic Aviation as of February 25, 2009 and a gain from changesApril 1, 2009 for our other businesses. In addition, in the first quarter of 2009, The Gas Company, District Energy and Atlantic Aviation each entered into LIBOR-based basis swaps. These basis swaps have lowered the effective cash interest rate on these businesses’ debt through March 2010.
For the year ended December 31, 2009, loss on derivative instruments represents the change in fair value of interest rate swaps from the dates that Yorkshire records inhedge accounting was discontinued. In addition, loss on derivative instruments includes the income statement, compared with areclassification of amounts from accumulated other comprehensive loss recorded in the second quarter of 2005.
Income Taxes
For the 2007 and 2008 years, we reported a consolidated net loss before income tax benefit in 2006 results primarily fromtaxes, for which we recorded a deferred tax benefit, recorded on the write-down of intangible assets at our parking business. The pre-tax gain in 2006 is due largely to gains on the sales of investments that are not taxable.
For 2009, we expect to have consolidated current federal taxable income of approximately $16.7 million, which will be offset by a portion of our consolidated federal net operating loss (NOL) carryforward. Our federal taxable income includes a taxable gain from the sale of the non-controlling interest of District Energy. We expect to pay a $334,000 federal Alternative Minimum Tax for 2009.
We include dividends received from IMTT in our consolidated income tax attributesreturn. Of the $7.0 million in distributions we received from that business in 2009, we expect that all of those distributions will carryforward to the US federal consolidated taxbe treated as a return of MIC, Inc.capital for income tax purposes, and its subsidiaries from those returns,not included in current taxable income.
Due to our NOL carryforwards, we do not expect to have regular taxable income or pay regular federal income tax payments through at least 2012. The cash state and an analysislocal taxes paid by our businesses is discussed below in the sections entitledIncome Taxes for each of our individual businesses.
As discussed in Note 18, “Income Taxes” in our consolidated financial statements, in Part II, Item 8 of this Form 10-K, we now evaluate the need for a valuation allowance on the realizability of the company’sagainst our deferred tax assets resulted in a decreasewithout taking into consideration the deferred tax liabilities of District Energy. We have concluded that the scheduled reversal of deferred tax liabilities will more likely than not result in the consolidatedrealization of all our federal deferred tax assets, except for approximately $15.3 million. Accordingly, we have provided a valuation allowance of approximatelyagainst our deferred tax assets for this amount. Of this valuation allowance, $5.9 million $4.4 millionis recorded on the books of PCAA, which is reported in our discontinued operations.
In calculating our consolidated state income tax provision, we have provided a valuation allowance for certain state income tax net operating loss carryforwards, the utilization of which is included as annot assured beyond a reasonable doubt. In addition, we expect to netincur certain expenses that will not be deductible in determining state taxable income.
Further, approximately $53.4 million of the write-down of intangibles is attributable to goodwill and is a permanent book-tax difference, for which no tax benefit has been recognized.
Results of Operations: Consolidated – (continued)
Discontinued Operations
On January 28, 2010, we agreed to sell the assets of PCAA through a bankruptcy process, which we expect to complete in the first half of 2010. This results of this business have been reported as a discontinued operation and prior comparable periods have been re-stated to conform to the current period presentation. See Note 4, “Discontinued Operations”, in our consolidated financial statements in Part II, Item 8 of this Form 10-K for financial information and further discussions.
Corporate allocation and other intercompany fees charged to PCAA have been reported in earnings from discontinued operations in our consolidated continuing results of operations.
Earnings Before Interest, Taxes, Depreciation and Amortization or(EBITDA) excluding non-cash items and Free Cash Flow
In accordance with GAAP, we have disclosed EBITDA
Effective this reporting period, we are also disclosing Free Cash Flow, as defined by us, as a means of assessing the amount of cash generated by our businesses and supplementing other information provided in accordance with GAAP. We believe that reporting Free Cash Flow will provide our investors with additional insight into our future ability to deploy cash, as GAAP metrics such as net income and cash from operating activities do not reflect all of the items that our management considers in estimating the amount of cash generated by our operating entities. In this Annual Report on Form 10-K, we have disclosed Free Cash Flow for our consolidated results and for each of our operating segments.
We define Free Cash Flow as cash from operating activities, less maintenance capital expenditures and changes in working capital. Working capital movements are excluded on the basis that these are largely timing differences in payables and receivables, and are therefore not reflective of our ability to servicegenerate cash.
We note that Free Cash Flow does not fully reflect our ability to freely deploy generated cash, as it does not reflect required payments to be made on our indebtedness, pay dividends and other fixed obligations or the other cash items excluded when calculating Free Cash Flow. We also note that Free Cash Flow may be calculated in a different manner by other companies, which limits its usefulness as a comparative measure. Therefore, our Free Cash Flow should be used as a supplemental measure and supportnot in lieu of our ongoing dividend policy.financial results reported under GAAP.
In 2008 and 2007, we disclosed EBITDA includes non-cash unrealized gains and losses on derivative instruments.
Year Ended December 31, 2006 | Year Ended December 31, 2005 | Change | April 13, 2004 (inception) to December 31, 2004 | |||||||||||
$ | % | |||||||||||||
| ($ in thousands) | ||||||||||||||
| Net income (loss) | $ | 49,918 | $ | 15,196 | 34,722 | NM | $ | (17,588 | ) | |||||
| Interest expense, net | 72,859 | 29,736 | 43,123 | 145.0 | 687 | |||||||||
| Income taxes | (16,421 | ) | (3,615 | ) | (12,806 | ) | NM | — | ||||||
| Depreciation(1) | 21,366 | 14,098 | 7,268 | 51.6 | 370 | |||||||||
| Amortization(2) | 43,846 | 14,815 | 29,031 | 196.0 | 281 | |||||||||
| EBITDA | $ | 171,568 | $ | 70,230 | 101,338 | 144.3 | $ | (16,250 | ) | |||||
Results of $5.7 million, $5.7 million and $140,000 for the district energy business for the years ended December 31, 2006, December 31, 2005 and the period December 22, 2004 (our acquisition date) through December 31, 2004, respectively. We include depreciation expense for the airport parking business and district energy business withinOperations: Consolidated – (continued)
A reconciliation of net loss from continuing operations to free cash flow from continuing operations, on a consolidated basis, is provided below:
| Year Ended December 31, | Change (From 2008 to 2009) Favorable/(Unfavorable) | Change (From 2007 to 2008) Favorable/(Unfavorable) | ||||||||||||||||||||||||||
| 2009 | 2008 | 2007 | $ | % | $ | % | ||||||||||||||||||||||
| ($ In Thousands) (Unaudited) | ||||||||||||||||||||||||||||
| Net loss from continuing operations | $ | (109,170 | ) | $ | (70,181 | ) | $ | (43,129 | ) | |||||||||||||||||||
| Interest expense, net | 91,035 | 87,562 | 59,651 | |||||||||||||||||||||||||
| Benefit for income taxes | (15,818 | ) | (14,061 | ) | (16,764 | ) | ||||||||||||||||||||||
| Depreciation (1) | 36,813 | 40,140 | 20,502 | |||||||||||||||||||||||||
| Depreciation - cost of services (1) | 6,086 | 5,813 | 5,792 | |||||||||||||||||||||||||
| Amortization of intangibles (2) | 60,892 | 61,874 | 32,356 | |||||||||||||||||||||||||
| Goodwill impairment | 71,200 | 52,000 | — | |||||||||||||||||||||||||
| Non-cash loss on extinguishment of debt | — | — | 12,817 | |||||||||||||||||||||||||
| Loss on derivative instruments | 29,540 | 2,843 | 1,362 | |||||||||||||||||||||||||
| Equity in (earnings) losses and amortization charges of investees(3) | (15,561 | ) | — | 32 | ||||||||||||||||||||||||
| Base management and performance fees settled/to be settled in LLC interests | 4,384 | — | 43,962 | |||||||||||||||||||||||||
| Other non-cash expense | 2,784 | 4,883 | 7,858 | |||||||||||||||||||||||||
| EBITDA excluding non-cash items from continuing operations | $ | 162,185 | $ | 170,873 | $ | 124,439 | (8,688 | ) | (5.1 | ) | 46,434 | 37.3 | ||||||||||||||||
| EBITDA excluding non-cash items from continuing operations | $ | 162,185 | $ | 170,873 | $ | 124,439 | ||||||||||||||||||||||
| Interest expense, net | (91,035 | ) | (87,562 | ) | (59,651 | ) | ||||||||||||||||||||||
| Amounts relating to foreign currency contracts | — | — | (4,055 | ) | ||||||||||||||||||||||||
| Amortization of debt financing costs | 5,121 | 4,762 | 4,429 | |||||||||||||||||||||||||
| Make-whole payment on debt financing | — | — | 14,695 | |||||||||||||||||||||||||
| Equipment lease receivables, net | 2,610 | 2,372 | 2,531 | |||||||||||||||||||||||||
| Benefit for income taxes, net of changes in deferred taxes | (2,105 | ) | (1,976 | ) | (5,772 | ) | ||||||||||||||||||||||
| Changes in working capital | 6,200 | 7,110 | 16,883 | |||||||||||||||||||||||||
| Cash provided by operating activities from continuing operations | 82,976 | 95,579 | 93,499 | |||||||||||||||||||||||||
| Changes in working capital | (6,200 | ) | (7,110 | ) | (16,883 | ) | ||||||||||||||||||||||
| Maintenance capital expenditures | (9,453 | ) | (14,846 | ) | (14,834 | ) | ||||||||||||||||||||||
| Free cash flow from continuing operations | $ | 67,323 | $ | 73,623 | $ | 61,782 | (6,300 | ) | (8.6 | ) | 11,841 | 19.2 | ||||||||||||||||
| (1) | Depreciation - cost of services includes depreciation expense for District Energy which is reported in cost of services in our consolidated statements of operations. Depreciation and Depreciation - cost of services do not include step-up depreciation expense of $6.9 million for each year in connection with our investment in IMTT, which is reported in equity in earnings (losses) and amortization charges of investees in our consolidated statements of operations. |
| (2) | Amortization of intangibles does not include step-up amortization expense of $1.1 million for each year related to intangible assets in connection with our investment in IMTT, which is reported in equity in earnings (losses) and amortization charges of investees in our consolidated statements of operations. |
| (3) | Equity in (earnings) losses and amortization charges of investees in the above table includes our 50% share of IMTT's earnings offset by distributions we received only up to our share of the earnings recorded. |
Energy-Related Businesses
IMTT
We account for our 50% interest in this business under the equity method. We recognized income of $22.6 million in our consolidated statementsresults for 2009. This includes our 50% share of operations. Does not include depreciation expense in connection with our investment in IMTT of $4.6IMTT’s net income, equal to $27.3 million for the period, May 1, 2006 (our acquisition date) throughoffset by $4.7 million of additional depreciation and amortization expense (net of taxes). For the year ended December 31, 2006.2008, we recognized income of $1.3 million in our consolidated results. This included our 50% share of IMTT’s net income, equal to $6.0 million for the period, offset by $4.7 million of additional depreciation and amortization expense (net of taxes).
Distributions from IMTT, to the degree classified as taxable dividends and not a return of capital for income tax purposes, qualify for the federal dividends received deduction. Therefore, 80% of any dividend is excluded in calculating our consolidated federal taxable income. Any distributions classified as a return of capital for income tax purposes will reduce our tax basis in IMTT. IMTT’s cash from operating activities for 2009 has been retained to fund IMTT’s growth capital expenditures and is expected to contribute significantly to IMTT’s future gross profit. See — “Liquidity and Capital Resources” for further discussion.
To enable meaningful analysis of IMTT’s performance across periods, IMTT’s overall performance is discussed below, rather than IMTT’s contribution to our consolidated results.
Year Ended December 31, 2009 Compared to Year Ended December 31, 2008
Key Factors Affecting Operating Results
Energy-Related Businesses: IMTT – (continued)
| Year Ended December 31, | ||||||||||||||||||||||||||||||||
| 2009 | 2008 | Change Favorable/(Unfavorable) | 2008 | 2007 | Change Favorable/(Unfavorable) | |||||||||||||||||||||||||||
| $ | $ | $ | % | $ | $ | $ | % | |||||||||||||||||||||||||
| ($ In Thousands) (Unaudited) | ||||||||||||||||||||||||||||||||
| Revenue | ||||||||||||||||||||||||||||||||
| Terminal revenue | 330,380 | 306,103 | 24,277 | 7.9 | 306,103 | 250,733 | 55,370 | 22.1 | ||||||||||||||||||||||||
| Environmental response revenue | 15,795 | 46,480 | (30,685 | ) | (66.0 | ) | 46,480 | 24,464 | 22,016 | 90.0 | ||||||||||||||||||||||
| Total revenue | 346,175 | 352,583 | (6,408 | ) | (1.8 | ) | 352,583 | 275,197 | 77,386 | 28.1 | ||||||||||||||||||||||
| Costs and expenses | ||||||||||||||||||||||||||||||||
| Terminal operating costs | 156,552 | 155,000 | (1,552 | ) | (1.0 | ) | 155,000 | 135,726 | (19,274 | ) | (14.2 | ) | ||||||||||||||||||||
| Environmental response operating costs | 14,792 | 34,658 | 19,866 | 57.3 | 34,658 | 19,339 | (15,319 | ) | (79.2 | ) | ||||||||||||||||||||||
| Total operating costs | 171,344 | 189,658 | 18,314 | 9.7 | 189,658 | 155,065 | (34,593 | ) | (22.3 | ) | ||||||||||||||||||||||
| Terminal gross profit | 173,828 | 151,103 | 22,725 | 15.0 | 151,103 | 115,007 | 36,096 | 31.4 | ||||||||||||||||||||||||
| Environmental response gross profit | 1,003 | 11,822 | (10,819 | ) | (91.5 | ) | 11,822 | 5,125 | 6,697 | 130.7 | ||||||||||||||||||||||
| Gross profit | 174,831 | 162,925 | 11,906 | 7.3 | 162,925 | 120,132 | 42,793 | 35.6 | ||||||||||||||||||||||||
| General and administrative expenses | 27,437 | 30,076 | 2,639 | 8.8 | 30,076 | 24,435 | (5,641 | ) | (23.1 | ) | ||||||||||||||||||||||
| Depreciation and amortization | 55,998 | 44,615 | (11,383 | ) | (25.5 | ) | 44,615 | 36,025 | (8,590 | ) | (23.8 | ) | ||||||||||||||||||||
| Operating income | 91,396 | 88,234 | 3,162 | 3.6 | 88,234 | 59,672 | 28,562 | 47.9 | ||||||||||||||||||||||||
| Interest expense, net | (29,510 | ) | (23,540 | ) | (5,970 | ) | (25.4 | ) | (23,540 | ) | (14,349 | ) | (9,191 | ) | (64.1 | ) | ||||||||||||||||
| Loss on extinguishment of debt | — | — | — | NM | — | (12,337 | ) | 12,337 | NM | |||||||||||||||||||||||
| Other income | 522 | 2,141 | (1,619 | ) | (75.6 | ) | 2,141 | 4,595 | (2,454 | ) | (53.4 | ) | ||||||||||||||||||||
| Unrealized gains (losses) on derivative instruments | 30,686 | (46,277 | ) | 76,963 | 166.3 | (46,277 | ) | (21,022 | ) | (25,255 | ) | (120.1 | ) | |||||||||||||||||||
| Provision for income taxes | (38,842 | ) | (9,452 | ) | (29,390 | ) | NM | (9,452 | ) | (7,076 | ) | (2,376 | ) | (33.6 | ) | |||||||||||||||||
| Noncontrolling interest | 332 | 1,003 | (671 | ) | (66.9 | ) | 1,003 | 143 | 860 | NM | ||||||||||||||||||||||
| Net income | 54,584 | 12,109 | 42,475 | NM | 12,109 | 9,626 | 2,483 | 25.8 | ||||||||||||||||||||||||
| Reconciliation of net income to EBITDA excluding non-cash items: | ||||||||||||||||||||||||||||||||
| Net income | 54,584 | 12,109 | 12,109 | 9,626 | ||||||||||||||||||||||||||||
| Interest expense, net | 29,510 | 23,540 | 23,540 | 14,349 | ||||||||||||||||||||||||||||
| Provision for income taxes | 38,842 | 9,452 | 9,452 | 7,076 | ||||||||||||||||||||||||||||
| Depreciation and amortization | 55,998 | 44,615 | 44,615 | 36,025 | ||||||||||||||||||||||||||||
| Unrealized (gains) losses on derivative instruments | (30,686 | ) | 46,277 | 46,277 | 21,022 | |||||||||||||||||||||||||||
| Other non-cash (income) expenses | (590 | ) | 601 | 601 | 860 | |||||||||||||||||||||||||||
| EBITDA excluding non-cash items | 147,658 | 136,594 | 11,064 | 8.1 | 136,594 | 88,958 | 47,636 | 53.5 | ||||||||||||||||||||||||
| EBITDA excluding non-cash items | 147,658 | 136,594 | 136,594 | 88,958 | ||||||||||||||||||||||||||||
| Interest expense, net | (29,510 | ) | (23,540 | ) | (23,540 | ) | (14,349 | ) | ||||||||||||||||||||||||
| Amortization of debt financing costs | 543 | 473 | 473 | — | ||||||||||||||||||||||||||||
| Make-whole payment on debt financing | — | — | — | 12,337 | ||||||||||||||||||||||||||||
| Provision for income taxes, net of changes in deferred taxes | (1,593 | ) | (4,053 | ) | (4,053 | ) | (1,434 | ) | ||||||||||||||||||||||||
| Changes in working capital | 16,284 | (15,387 | ) | (15,387 | ) | 5,919 | ||||||||||||||||||||||||||
| Cash provided by operating activities | 133,382 | 94,087 | 94,087 | 91,431 | ||||||||||||||||||||||||||||
| Changes in working capital | (16,284 | ) | 15,387 | 15,387 | (5,919 | ) | ||||||||||||||||||||||||||
| Maintenance capital expenditures | (39,977 | ) | (42,690 | ) | (42,690 | ) | (32,746 | ) | ||||||||||||||||||||||||
| Free cash flow | 77,121 | 66,784 | 10,337 | 15.5 | 66,784 | 52,766 | 14,018 | 26.6 | ||||||||||||||||||||||||
NM — Not meaningful
Energy-Related Businesses: IMTT – (continued)
Revenue and Gross Profit
The increase in terminal revenue primarily reflects growth in storage and other services revenues, partially offset by declines in throughput and heating revenues. Storage revenue grew primarily as average rental rates increased by 9.7% during the year. The increase in storage revenue also reflected an increase in storage capacity mainly attributable to certain expansion projects at IMTT’s Louisiana facilities. Demand for bulk liquid storage generally remains strong.
Gross profit increased primarily due to an increase in storage revenues and $15.2 million of additional revenue as a result of a full year of storage and related logistics services at IMTT’s Geismar terminal, which was partially offset by a customer reimbursement for capital projects completed at Bayonne in 2008 which did not includerecur. Throughput and heating revenues declined reflecting lower activity levels at IMTT’s facilities and lower heating costs due to the decline in fuel prices passed through to customers. Storage capacity utilization, defined as storage capacity rented divided by total capacity available, remained relatively constant at 94% during 2009 and 2008.
The terminal operating costs increased primarily as a result of increased health insurance claims, pension costs, salaries and wages, pipeline related work and a full year of operations at Geismar, partially offset by a $2.0 million excise tax settlement in the first half of 2008 that did not recur in 2009.
Gross profit from environmental services decreased from 2008 to 2009 primarily due to higher spill response activity in 2008 relating to IMTT’s central role in response activities following the July 23, 2008 fuel oil spill on the Mississippi River near New Orleans.
General and Administrative Expenses
Lower general and administrative costs during 2009 resulted primarily from the recovery of receivables that had been fully provisioned for in prior periods and reserves under bad debt expense in 2008 that did not recur in 2009.
Depreciation and Amortization
Depreciation and amortization expense increased as IMTT completed several major expansion projects, resulting in higher asset balances.
Interest Expense, Net
Interest costs during 2009 increased primarily due to higher borrowings incurred to fund growth capital expenditures along with the discontinuation of the capitalization of construction period interest upon the commencement of operations at Geismar, partially offset by a decrease in interest rates on unhedged debt balances.
Income Taxes
For the year ended December 31, 2009, IMTT expects to generate a loss for federal income tax purposes that can be carried forward and utilized to reduce current taxable income in 2010.
The business files separate state income tax returns in five states. For the year ended December 31, 2009, the business expects to pay state income taxes of approximately $1.5 million.
A significant difference between the IMTT’s book and federal taxable income relates to depreciation of fixed assets. For book purposes, fixed assets are depreciated primarily over 15 to 30 years using the straight-line method of depreciation. For federal income tax purposes, fixed assets are depreciated primarily over 5 to 15 years using accelerated methods. In addition, a significant portion of the fixed assets placed in service in 2009 qualify for the 50% federal bonus depreciation. Most of the states in which the business operates allow the use of the federal depreciation calculation methods. Louisiana is the only state where the business operates that allows the bonus depreciation deduction.
Energy-Related Businesses: IMTT – (continued)
Year Ended December 31, 2008 Compared to Year Ended December 31, 2007
Key Factors Affecting Operating Results
Revenue and Gross Profit
The increase in terminal revenue reflects growth in all major service segments. Storage revenue grew as the average rental rates charged to customers increased by 14.8% during 2008. The increase in storage revenue also reflected a 5.3% increase in storage capacity rented to customers for 2008, as the business completed certain expansion projects and reported contributions from a facility acquired in November 2007. In addition, the commencement of storage and related logistics services for our principal customer at the new Geismar terminal contributed $12.2 million to terminal revenue in 2008.
Storage capacity utilization, defined as storage capacity rented divided by total capacity available, remained relatively constant at 94% during 2008 and 2007.
Increases in terminal revenue were offset by higher operating costs relating to the commencement of operations at Geismar, the increase in storage capacity and throughput associated with the expansion of existing facilities, the acquisition of a new facility at Joliet in November 2007 and IMTT’s extensive tank inspection and repair program being undertaken in Louisiana. Also operating costs in 2008 were increased by a $2.0 million excise tax settlement related to IMTT’s handling of alcohol during 2005 and a $1.0 million accrual for a potential air emission fee at Bayonne. Please see “Legal Proceedings” in Part I, Item 3 for discussion on the air emission fee.
Revenue and gross profit from environmental response services increased substantially during 2008 due to the central role played by Oil Mop in the response activities following the July 2008 fuel oil spill on the Mississippi River near New Orleans. Oil Mop generated $27.3 million in revenue from spill response work and ancillary services in 2008.
General and Administrative Expenses
Increased general and administrative costs during 2008 resulted from a bad debt reserve for customers under bankruptcy protection and increased overhead costs due to the significant increase in environmental response activity.
Depreciation and Amortization
Depreciation and amortization expense increased by $8.6 million as IMTT completed several major expansion projects.
Interest Expense, Net
Interest costs increased during 2008 primarily due to higher borrowings incurred to fund growth capital expenditures.
Loss on Extinguishment of Debt
Loss on extinguishment of debt in 2007 comprised a $12.3 million make-whole payment associated with the repayment of the two tranches of senior notes in conjunction with the establishment of a new $625.0 million revolving credit facility.
Energy-Related Businesses: IMTT – (continued)
Other Income
Other income for 2008 declined primarily due to gains from insurance settlements in 2007, which did not recur in 2008.
The Gas Company
Year Ended December 31, 2009 Compared to Year Ended December 31, 2008
Key Factors Affecting Operating Results
Energy-Related Businesses: The Gas Company – (continued)
| Year Ended December 31, | ||||||||||||||||||||||||||||||||||||
| 2009 | 2008 | Change Favorable/(Unfavorable) | 2008 | 2007 | Change Favorable/(Unfavorable) | |||||||||||||||||||||||||||||||
| $ | $ | $ | % | $ | $ | $ | % | |||||||||||||||||||||||||||||
| ($ In Thousands) (Unaudited) | ||||||||||||||||||||||||||||||||||||
| Contribution margin | ||||||||||||||||||||||||||||||||||||
| Revenue – utility | 95,769 | 121,770 | (26,001 | ) | (21.4 | ) | 121,770 | 95,770 | 26,000 | 27.1 | ||||||||||||||||||||||||||
| Cost of revenue – utility | 60,227 | 91,978 | 31,751 | 34.5 | 91,978 | 64,371 | (27,607 | ) | (42.9 | ) | ||||||||||||||||||||||||||
| Contribution margin – utility | 35,542 | 29,792 | 5,750 | 19.3 | 29,792 | 31,399 | (1,607 | ) | (5.1 | ) | ||||||||||||||||||||||||||
| Revenue – non-utility | 79,597 | 91,244 | (11,647 | ) | (12.8 | ) | 91,244 | 74,602 | 16,642 | 22.3 | ||||||||||||||||||||||||||
| Cost of revenue – non-utility | 36,580 | 55,504 | 18,924 | 34.1 | 55,504 | 44,908 | (10,596 | ) | (23.6 | ) | ||||||||||||||||||||||||||
| Contribution margin – non-utility | 43,017 | 35,740 | 7,277 | 20.4 | 35,740 | 29,694 | 6,046 | 20.4 | ||||||||||||||||||||||||||||
| Total contribution margin | 78,559 | 65,532 | 13,027 | 19.9 | 65,532 | 61,093 | 4,439 | 7.3 | ||||||||||||||||||||||||||||
| Production | 5,467 | 5,717 | 250 | 4.4 | 5,717 | 4,913 | (804 | ) | (16.4 | ) | ||||||||||||||||||||||||||
| Transmission and distribution | 15,264 | 14,912 | (352 | ) | (2.4 | ) | 14,912 | 15,350 | 438 | 2.9 | ||||||||||||||||||||||||||
| Gross profit | 57,828 | 44,903 | 12,925 | 28.8 | 44,903 | 40,830 | 4,073 | 10.0 | ||||||||||||||||||||||||||||
| Selling, general and administrative expenses | 21,802 | 18,374 | (3,428 | ) | (18.7 | ) | 18,374 | 16,350 | (2,024 | ) | (12.4 | ) | ||||||||||||||||||||||||
| Depreciation and amortization | 6,829 | 6,739 | (90 | ) | (1.3 | ) | 6,739 | 6,737 | (2 | ) | NM | |||||||||||||||||||||||||
| Operating income | 29,197 | 19,790 | 9,407 | 47.5 | 19,790 | 17,743 | 2,047 | 11.5 | ||||||||||||||||||||||||||||
| Interest expense, net | (8,941 | ) | (9,390 | ) | 449 | 4.8 | (9,390 | ) | (9,195 | ) | (195 | ) | (2.1 | ) | ||||||||||||||||||||||
| Other (expense) income | (165 | ) | 148 | (313 | ) | NM | 148 | (162 | ) | 310 | 191.4 | |||||||||||||||||||||||||
| Unrealized losses on derivative instruments | (636 | ) | (221 | ) | (415 | ) | (187.8 | ) | (221 | ) | (431 | ) | 210 | 48.7 | ||||||||||||||||||||||
| Provision for income taxes(1) | (7,619 | ) | (4,044 | ) | (3,575 | ) | (88.4 | ) | (4,044 | ) | (3,115 | ) | (929 | ) | (29.8 | ) | ||||||||||||||||||||
| Net income(2) | 11,836 | 6,283 | 5,553 | 88.4 | 6,283 | 4,840 | 1,443 | 29.8 | ||||||||||||||||||||||||||||
| Reconciliation of net income to EBITDA excluding non-cash items: | ||||||||||||||||||||||||||||||||||||
| Net income(2) | 11,836 | 6,283 | 6,283 | 4,840 | ||||||||||||||||||||||||||||||||
| Interest expense, net | 8,941 | 9,390 | 9,390 | 9,195 | ||||||||||||||||||||||||||||||||
| Provision for income taxes(1) | 7,619 | 4,044 | 4,044 | 3,115 | ||||||||||||||||||||||||||||||||
| Depreciation and amortization | 6,829 | 6,739 | 6,739 | 6,737 | ||||||||||||||||||||||||||||||||
| Unrealized losses on derivative instruments | 636 | 221 | 221 | 431 | ||||||||||||||||||||||||||||||||
| Other non-cash expenses | 1,771 | 1,180 | 1,180 | 1,290 | ||||||||||||||||||||||||||||||||
| EBITDA excluding non-cash items | 37,632 | 27,857 | 9,775 | 35.1 | 27,857 | 25,608 | 2,249 | 8.8 | ||||||||||||||||||||||||||||
| EBITDA excluding non-cash items | 37,632 | 27,857 | 27,857 | 25,608 | ||||||||||||||||||||||||||||||||
| Interest expense, net | (8,941 | ) | (9,390 | ) | (9,390 | ) | (9,195 | ) | ||||||||||||||||||||||||||||
| Amortization of debt financing costs | 478 | 478 | 478 | 478 | ||||||||||||||||||||||||||||||||
| Provision for income taxes, net of changes in deferred taxes | (4,936 | ) | — | — | — | |||||||||||||||||||||||||||||||
| Changes in working capital | 1,327 | 8,133 | 8,133 | (886 | ) | |||||||||||||||||||||||||||||||
| Cash provided by operating activities | 25,560 | 27,078 | 27,078 | 16,005 | ||||||||||||||||||||||||||||||||
| Changes in working capital | (1,327 | ) | (8,133 | ) | (8,133 | ) | 886 | |||||||||||||||||||||||||||||
| Maintenance capital expenditures | (3,939 | ) | (6,202 | ) | (6,202 | ) | (5,257 | ) | ||||||||||||||||||||||||||||
| Free cash flow | 20,294 | 12,743 | 7,551 | 59.3 | 12,743 | 11,634 | 1,109 | 9.5 | ||||||||||||||||||||||||||||
NM — Not meaningful
| (1) | Income tax provision for 2007 has been calculated based on 2008 tax rate for comparability. |
| (2) | Corporate allocation expense, other intercompany fees and the federal tax effect have been excluded from the above table as they are eliminated on consolidation at the MIC Inc. level. |
Energy-Related Businesses: The Gas Company – (continued)
Although the presentation and analysis of contribution margin is a non-GAAP performance measure, management believes that it is meaningful to understanding the business’ performance under both a utility rate structure and a non-utility competitive pricing structure. Under a utility environment, feedstock costs are automatically passed through to utility customers, while non-utility pricing may be adjusted, subject to the competitive environment, to recover changes in raw material costs.
Contribution margin should not be considered an alternative to revenue, operating income, or net income, determined in accordance with U.S. GAAP. The business calculates contribution margin as revenue less direct costs of revenue other than production and transmission and distribution costs. Other companies may calculate contribution margin differently or may use different metrics and, therefore, the contribution margin presented for The Gas Company is not necessarily comparable with metrics of other companies.
Contribution Margin and Operating Income
Utility contribution margin was higher, primarily due to implementation of the interim rate increase from June 11, 2009, partially offset by volume declines related almost entirely to commercial customers, who are more exposed to the variability of the economic cycle. Sales volume in 2009 was approximately 3% lower than 2008.
Non-utility contribution margin was higher, primarily due to lower input costs, partially offset by a 0.6% volume decline from 2008. Local suppliers reduced their production of propane. To the extent that local suppliers are unable to supply The Gas Company with a sufficient amount of propane, the business believes it can supplement its supply from foreign sources. Foreign sourced propane is likely to cost more than locally produced propane, although a portion of any increased cost may be offset by improved efficiency in distribution.
Selling, general and administrative costs increased due to an approximate $930,000 increase in pension expense, higher incentive compensation based upon strong 2009 performance, and professional service costs primarily related to the implementation of a profit center structure in 2009.
Income Taxes
Income from The Gas Company is included in our consolidated federal income tax return, and its income is subject to Hawaii state income taxes. The tax expense in the table above includes both state taxes and the portion of the consolidated federal tax liability attributable to the business.
The business’ federal taxable income differs from book income primarily as a result of differences in the depreciation of fixed assets. Net book income before taxes includes depreciation based on asset values and lives that differ from those used in determining taxable income. For 2009, the business expects to have a current state income tax liability of approximately $863,000.
Year Ended December 31, 2008 Compared to Year Ended December 31, 2007
Key Factors Affecting Operating Results
Contribution Margin and Operating Income
Utility contribution margin decreased primarily due to lower volume of gas sold. Sales volume in 2008 was approximately 4% lower than 2007. Prior to the third quarter of 2008, a portion of utility customer fuel cost adjustments was offset by withdrawals from an acquisition funded escrow account that was fully exhausted in the second quarter of 2008. For 2008 and 2007, withdrawals of $1.6 million and $1.9 million, respectively, were recorded in cash flows from operating activities.
Non-utility contribution margin increased due to customer price increases, partially offset by higher costs of LPG and increases in the cost to transport LPG between islands. The volume of gas products sold in 2008 was approximately 2% lower than 2007.
Energy-Related Businesses: The Gas Company – (continued)
Production costs increased primarily due to higher electricity, material and personnel costs. Transmission and distribution costs were lower due principally to lower costs related to the completion of the government required pipeline inspection, and lower adjustment to reserves for asset retirement costs, partially offset by higher personnel and rent costs. Selling, general and administrative costs were higher due to an increase in bad debt expense reserves, higher personnel costs, including overtime and fewer vacancies, higher employee benefit costs, including pension expense, and higher professional services costs.
Interest Expense, Net
Interest expense increased due to higher outstanding borrowings for utility capital expenditures during 2008.
District Energy
The financial results discussed below reflect 100% of District Energy’s full year performance.
Year Ended December 31, 2009 Compared to Year Ended December 31, 2008
Key Factors Affecting Operating Results
Energy-Related Businesses: District Energy – (continued)
| Year Ended December 31, | ||||||||||||||||||||||||||||||||
| 2009 | 2008 | Change Favorable/(Unfavorable) | 2008 | 2007 | Change Favorable/(Unfavorable) | |||||||||||||||||||||||||||
| $ | $ | $ | % | $ | $ | $ | % | |||||||||||||||||||||||||
| ($ In Thousands) (Unaudited) | ||||||||||||||||||||||||||||||||
| Cooling capacity revenue | 20,430 | 19,350 | 1,080 | 5.6 | 19,350 | 18,854 | 496 | 2.6 | ||||||||||||||||||||||||
| Cooling consumption revenue | 20,236 | 20,894 | (658 | ) | (3.1 | ) | 20,894 | 22,876 | (1,982 | ) | (8.7 | ) | ||||||||||||||||||||
| Other revenue | 3,137 | 3,115 | 22 | 0.7 | 3,115 | 2,864 | 251 | 8.8 | ||||||||||||||||||||||||
| Finance lease revenue | 4,758 | 4,686 | 72 | 1.5 | 4,686 | 4,912 | (226 | ) | (4.6 | ) | ||||||||||||||||||||||
| Total revenue | 48,561 | 48,045 | 516 | 1.1 | 48,045 | 49,506 | (1,461 | ) | (3.0 | ) | ||||||||||||||||||||||
| Direct expenses – electricity | 13,356 | 13,842 | 486 | 3.5 | 13,842 | 15,424 | 1,582 | 10.3 | ||||||||||||||||||||||||
| Direct expenses – other(1) | 18,647 | 17,809 | (838 | ) | (4.7 | ) | 17,809 | 17,696 | (113 | ) | (0.6 | ) | ||||||||||||||||||||
| Direct expenses – total | 32,003 | 31,651 | (352 | ) | (1.1 | ) | 31,651 | 33,120 | 1,469 | 4.4 | ||||||||||||||||||||||
| Gross profit | 16,558 | 16,394 | 164 | 1.0 | 16,394 | 16,386 | 8 | NM | ||||||||||||||||||||||||
| Selling, general and administrative expenses | 3,407 | 3,390 | (17 | ) | (0.5 | ) | 3,390 | 3,208 | (182 | ) | (5.7 | ) | ||||||||||||||||||||
| Amortization of intangibles | 1,368 | 1,372 | 4 | 0.3 | 1,372 | 1,368 | (4 | ) | (0.3 | ) | ||||||||||||||||||||||
| Operating income | 11,783 | 11,632 | 151 | 1.3 | 11,632 | 11,810 | (178 | ) | (1.5 | ) | ||||||||||||||||||||||
| Interest expense, net | (10,153 | ) | (10,341 | ) | 188 | 1.8 | (10,341 | ) | (9,009 | ) | (1,332 | ) | (14.8 | ) | ||||||||||||||||||
| Loss on extinguishment of debt | — | — | — | — | — | (17,708 | ) | 17,708 | NM | |||||||||||||||||||||||
| Other income | 1,235 | 201 | 1,034 | NM | 201 | 740 | (539 | ) | (72.8 | ) | ||||||||||||||||||||||
| Unrealized (losses) gains on derivative instruments | (220 | ) | 26 | (246 | ) | NM | 26 | (28 | ) | 54 | 192.9 | |||||||||||||||||||||
| (Provision) benefit for income taxes | (773 | ) | (242 | ) | (531 | ) | NM | (242 | ) | 5,490 | (5,732 | ) | (104.4 | ) | ||||||||||||||||||
| Noncontrolling interest | (690 | ) | (585 | ) | (105 | ) | (17.9 | ) | (585 | ) | (554 | ) | (31 | ) | (5.6 | ) | ||||||||||||||||
| Net income (loss)(2) | 1,182 | 691 | 491 | 71.1 | 691 | (9,259 | ) | 9,950 | 107.5 | |||||||||||||||||||||||
| Reconciliation of net income (loss) to EBITDA excluding non-cash items: | ||||||||||||||||||||||||||||||||
| Net income (loss)(2) | 1,182 | 691 | 691 | (9,259 | ) | |||||||||||||||||||||||||||
| Interest expense, net | 10,153 | 10,341 | 10,341 | 9,009 | ||||||||||||||||||||||||||||
| Provision (benefit) for income taxes | 773 | 242 | 242 | (5,490 | ) | |||||||||||||||||||||||||||
| Depreciation(1) | 6,086 | 5,813 | 5,813 | 5,792 | ||||||||||||||||||||||||||||
| Amortization of intangibles | 1,368 | 1,372 | 1,372 | 1,368 | ||||||||||||||||||||||||||||
| Unrealized losses (gains) on derivative instruments | 220 | (26 | ) | (26 | ) | 28 | ||||||||||||||||||||||||||
| Non-cash loss on extinguishment of debt | — | — | — | 3,013 | ||||||||||||||||||||||||||||
| Other non-cash expenses | 1,009 | 2,654 | 2,654 | 1,086 | ||||||||||||||||||||||||||||
| EBITDA excluding non-cash items | 20,791 | 21,087 | (296 | ) | (1.4 | ) | 21,087 | 5,547 | 15,540 | NM | ||||||||||||||||||||||
| EBITDA excluding non-cash items | 20,791 | 21,087 | 21,087 | 5,547 | ||||||||||||||||||||||||||||
| Interest expense, net | (10,153 | ) | (10,341 | ) | (10,341 | ) | (9,009 | ) | ||||||||||||||||||||||||
| Make-whole payment on debt financing | — | — | — | 14,695 | ||||||||||||||||||||||||||||
| Amortization of debt financing costs | 681 | 682 | 682 | 309 | ||||||||||||||||||||||||||||
| Equipment lease receivable, net | 2,610 | 2,372 | 2,372 | 2,531 | ||||||||||||||||||||||||||||
| Changes in working capital | 519 | 3,966 | 3,966 | 12 | ||||||||||||||||||||||||||||
| Cash provided by operating activities | 14,448 | 17,766 | 17,766 | 14,085 | ||||||||||||||||||||||||||||
| Changes in working capital | (519 | ) | (3,966 | ) | (3,966 | ) | (12 | ) | ||||||||||||||||||||||||
| Maintenance capital expenditures | (1,001 | ) | (989 | ) | (989 | ) | (949 | ) | ||||||||||||||||||||||||
| Free cash flow | 12,928 | 12,811 | 117 | 0.9 | 12,811 | 13,124 | (313 | ) | (2.4 | ) | ||||||||||||||||||||||
NM — Not meaningful
| (1) | Includes depreciation expense of $6.1 million, $5.8 million and $5.8 million for the years ended December 31, 2009, 2008 and 2007, respectively. |
| (2) | Corporate allocation expense and the federal tax effect have been excluded from the above table as they are eliminated on consolidation at the MIC Inc. level. |
Energy-Related Businesses: District Energy – (continued)
Gross Profit
Gross profit increased primarily due to a net increase in contract capacity as six new customers began service and annual inflation-related increases of contract capacity rates in accordance with customer contract terms. This was partially offset by reduced cooling consumption revenue related to lower ton-hour sales resulting from cooler average temperatures through the summer of 2009 compared with 2008, and an adjustment for electricity costs passed through in 2008. A cooler summer in the Chicago area, compared with 2008, contributed to a significant decrease in chilled water demand.
Other Income
Other income increased due to payments received under agreements to review and manage the business’ energy demand during periods of peak demand in 2008 and 2009 and a one-time termination payment received from a customer.
Income Taxes
For the period preceding the sale of a 49.99% non-controlling interest in the business, the income from District Energy is included in our consolidated federal income tax return, and its income is subject to Illinois state income taxes. The tax expense in the table above includes both state taxes and the portion of the consolidated federal tax liability attributable to the business.
Subsequent to the sale of the 49.99% non-controlling interest, District Energy is expected to file a separate consolidated federal income tax return, and continue to file a combined Illinois state income tax return. The business is expected to have approximately $26.0 million in federal and state NOL carryforwards available to offset positive taxable income. The business does not expect to have positive taxable income in 2010 or 2011.
Due to differences in determining book and tax deductible depreciation and amortization, the business’ state taxable income is expected to exceed book income in 2009. However, as of December 31, 2009 the business had more than $20.0 million of state income tax net operating loss carryforwards that are expected to offset any state tax liability through 2011.
Year Ended December 31, 2008 Compared to Year Ended December 31, 2007
Key Factors Affecting Operating Results
Gross Profit
Gross profit was relatively flat primarily due to annual inflation-related increases of contract capacity rates in accordance with customer contract terms offset by lower cooling consumption revenue and overall electricity costs due to lower ton-hour sales resulting from cooler than average temperatures in 2008 compared with 2007. Other revenue increased due to the business’ pass-through to customers of the higher cost of natural gas consumables, which is offset in other direct expenses.
Selling, General and Administrative Expenses
Selling, general and administrative expenses increased primarily due to the timing of audit fees in 2008 and the collection in 2007 of amounts which were previously written-off in relation to a customer bankruptcy filed in 2004.
Interest Expense, Net
Interest expense increased as a result of higher debt levels associated with the 2007 refinancing and higher non-cash amortization of deferred financing costs.
Energy-Related Businesses: District Energy – (continued)
Loss on Extinguishment of Debt
Loss on extinguishment of debt comprised a $14.7 million make-whole payment and a $3.0 million deferred financing costs write-off associated with the refinance of the business’ senior notes in 2007, which did not recur in 2008.
Aviation-Related Business
Atlantic Aviation
The rapidly changing conditions affecting this business warrants a discussion of current and comparable prior period performance as well as a quarter on quarter sequential analysis in order to facilitate an understanding of the stabilization of the general aviation market in recent months and its effect on the business’ financial results.
The soft economic conditions caused a lower utilization of business jets by both corporations and individuals. This lower utilization was exacerbated by the negative publicity of the general aviation sector. According to flight data reported by the FAA, the level of U.S. business jet flight activity (as measured by take-offs and landings) declined 17.3% in 2009. Quarterly activity level has increased sequentially since the second quarter of 2009. In the fourth quarter of 2009, business jet take-offs and landings were flat year-on-year but increased sequentially versus the third quarter of 2009 despite the typical seasonal business jet traffic slowdown in the fourth quarter versus the third quarter.
The leverage covenant for Atlantic Aviation steps down on March 31, 2010 from 8.25x to 8.00x trailing twelve month EBIDTA, as defined by the terms of the debt facility. Given the performance of the business of the last three quarters of 2009, the business needs to achieve an EBITDA of approximately $24.0 million to remain covenant compliant in the first quarter of 2010. In the first quarter of 2009, EBITDA was $25.0 million. Since that time, take-offs and landings have sequentially improved by 14.4% and we have reduced our costs by 9.4%. The fourth quarter EBITDA was $26.6 million. Accordingly, we remain confident of being covenant compliant when the covenant steps down on March 31, 2010 unless there is some external shock to the industry or sudden decline in general aviation activity.
After March 31, 2010, the covenant then steps down every subsequent March until and including March 2014. Volatility in the general aviation sector in the last 18 months makes it difficult to project future take-off and landings with any degree of confidence. However, given the recent business jet traffic trajectory, and assuming no external shock to the industry, we believe that cash generation from the business will be sufficient to meet debt service obligations and the business will remain in compliance with financial covenants through the maturity of the business’ debt without any further equity contribution from MIC. Additionally, we anticipate further cost reductions which will be accelerated in an event of a decline in business activity.
Year Ended December 31, 2009 Compared to Year Ended December 31, 2008
Key Factors Affecting Operating Results
Aviation-Related Business: Atlantic Aviation – (continued)
| Year Ended December 31, | ||||||||||||||||
| 2009 | 2008 | Change Favorable/(Unfavorable) | ||||||||||||||
| $ | $ | $ | % | |||||||||||||
| ($ In Thousands) (Unaudited) | ||||||||||||||||
| Revenue | ||||||||||||||||
| Fuel revenue | 314,603 | 494,810 | (180,207 | ) | (36.4 | ) | ||||||||||
| Non-fuel revenue | 171,546 | 221,492 | (49,946 | ) | (22.5 | ) | ||||||||||
| Total revenue | 486,149 | 716,302 | (230,153 | ) | (32.1 | ) | ||||||||||
| Cost of revenue | ||||||||||||||||
| Cost of revenue – fuel | 184,853 | 342,102 | 157,249 | 46.0 | ||||||||||||
| Cost of revenue – non-fuel | 14,314 | 32,198 | 17,884 | 55.5 | ||||||||||||
| Total cost of revenue | 199,167 | 374,300 | 175,133 | 46.8 | ||||||||||||
| Fuel gross profit | 129,750 | 152,708 | (22,958 | ) | (15.0 | ) | ||||||||||
| Non-fuel gross profit | 157,232 | 189,294 | (32,062 | ) | (16.9 | ) | ||||||||||
| Gross profit | 286,982 | 342,002 | (55,020 | ) | (16.1 | ) | ||||||||||
| Selling, general and administrative expenses(1) | 179,949 | 205,304 | 25,355 | 12.3 | ||||||||||||
| Goodwill impairment | 71,200 | 52,000 | (19,200 | ) | (36.9 | ) | ||||||||||
| Depreciation and amortization | 89,508 | 93,903 | 4,395 | 4.7 | ||||||||||||
| Operating loss | (53,675 | ) | (9,205 | ) | (44,470 | ) | NM | |||||||||
| Interest expense, net | (67,983 | ) | (62,967 | ) | (5,016 | ) | (8.0 | ) | ||||||||
| Other expense | (1,451 | ) | (241 | ) | (1,210 | ) | NM | |||||||||
| Unrealized losses on derivative instruments | (28,277 | ) | (1,871 | ) | (26,406 | ) | NM | |||||||||
| Benefit for income taxes | 61,009 | 29,936 | 31,073 | 103.8 | ||||||||||||
| Net loss(2) | (90,377 | ) | (44,348 | ) | (46,029 | ) | (103.8 | ) | ||||||||
| Reconciliation of net loss to EBITDA excluding non-cash items: | ||||||||||||||||
| Net loss(2) | (90,377 | ) | (44,348 | ) | ||||||||||||
| Interest expense, net | 67,983 | 62,967 | ||||||||||||||
| Benefit for income taxes | (61,009 | ) | (29,936 | ) | ||||||||||||
| Depreciation and amortization | 89,508 | 93,903 | ||||||||||||||
| Goodwill impairment | 71,200 | 52,000 | ||||||||||||||
| Unrealized losses on derivative instruments | 28,277 | 1,871 | ||||||||||||||
| Other non-cash expenses | 903 | 624 | ||||||||||||||
| EBITDA excluding non-cash items | 106,485 | 137,081 | (30,596 | ) | (22.3 | ) | ||||||||||
| EBITDA excluding non-cash items | 106,485 | 137,081 | ||||||||||||||
| Interest expense, net | (67,983 | ) | (62,967 | ) | ||||||||||||
| Amortization of debt financing costs | 3,144 | 2,613 | ||||||||||||||
| Benefit for income taxes, net of changes in deferred taxes | (190 | ) | (7,950 | ) | ||||||||||||
| Changes in working capital | 9,474 | 4,351 | ||||||||||||||
| Cash provided by operating activities | 50,930 | 73,128 | ||||||||||||||
| Changes in working capital | (9,474 | ) | (4,351 | ) | ||||||||||||
| Maintenance capital expenditures | (4,513 | ) | (7,655 | ) | ||||||||||||
| Free cash flow | 36,943 | 61,122 | (24,179 | ) | (39.6 | ) | ||||||||||
NM — Not meaningful
| (1) | Includes $2.4 million increase in the bad debt reserve in the first quarter of 2009 due to the deterioration of accounts receivable aging. |
| (2) | Corporate allocation expense and the federal tax effect have been excluded from the above table as they are eliminated on consolidation at the MIC Inc. level. |
Results for the years ended2008 include SevenBar FBOs from March 4, 2008 (acquisition date) to December 31, 2006, December 31, 2005 and the period December 22, 2004 (our acquisition date) through December 31, 2004, respectively. Also does not2008. Results for 2009 include amortization expense related to intangible assets in connection with our investment in IMTT of $756,000 for the period May 1, 2006 (our acquisition date) through December 31, 2006. Included in amortization expenseSevenBar FBOs for the year ended December 31, 2006 is a $23.5 million impairment charge relating to trade names and domain names at our airport parking business.
Existing Locations | Total | ||||||||||||||||||
Year Ended December 31, | Year Ended December 31, | ||||||||||||||||||
2006 | 2005 | Change | Acquisitions | 2006 | 2005 | Change | |||||||||||||
$ | $ | $ | % | (1) | $ | $ | $ | % | |||||||||||
| ($ in thousands) (unaudited) | |||||||||||||||||||
Revenue | |||||||||||||||||||
| Fuel revenue | 161,198 | 142,785 | 18,413 | 12.9 | 64,372 | 225,570 | 142,785 | 82,785 | 58.0 | ||||||||||
| Non-fuel revenue | 62,915 | 58,701 | 4,214 | 7.2 | 24,391 | 87,306 | 58,701 | 28,605 | 48.7 | ||||||||||
| Total revenue | 224,113 | 201,486 | 22,627 | 11.2 | 88,763 | 312,876 | 201,486 | 111,390 | 55.3 | ||||||||||
Cost of revenue | |||||||||||||||||||
| Cost of revenue-fuel | 95,259 | 84,480 | 10,779 | 12.8 | 42,625 | 137,884 | 84,480 | 53,404 | 63.2 | ||||||||||
| Cost of revenue-non-fuel | 6,883 | 7,906 | (1,023 | ) | (12.9 | ) | 1,616 | 8,499 | 7,906 | 593 | 7.5 | ||||||||
| Total cost of revenue | 102,142 | 92,386 | 9,756 | 10.6 | 44,241 | 146,383 | 92,386 | 53,997 | 58.4 | ||||||||||
| Fuel gross profit | 65,939 | 58,305 | 7,634 | 13.1 | 21,747 | 87,686 | 58,305 | 29,381 | 50.4 | ||||||||||
| Non-fuel gross profit | 56,032 | 50,795 | 5,237 | 10.3 | 22,775 | 78,807 | 50,795 | 28,012 | 55.1 | ||||||||||
| Gross Profit | 121,971 | 109,100 | 12,871 | 11.8 | 44,522 | 166,493 | 109,100 | 57,393 | 52.6 | ||||||||||
| Selling, general and administrative expenses | 69,717 | 65,140 | 4,577 | 7.0 | 23,576 | 93,293 | 65,140 | 28,153 | 43.2 | ||||||||||
| Depreciation and amortization | 15,997 | 15,652 | 345 | 2.2 | 9,285 | 25,282 | 15,652 | 9,630 | 61.5 | ||||||||||
| Operating income | 36,257 | 28,308 | 7,949 | 28.1 | 11,661 | 47,918 | 28,308 | 19,610 | 69.3 | ||||||||||
| Other expense | (129 | ) | (1,035 | ) | 906 | (87.5 | ) | 119 | (10 | ) | (1,035 | ) | 1,025 | (99.0 | ) | ||||
| Unrealized (loss) gain on derivative instruments | (2,417 | ) | 1,990 | (4,407 | ) | NM | — | (2,417 | ) | 1,990 | (4,407 | ) | NM | ||||||
| Interest expense, net | (16,801 | ) | (18,313 | ) | 1,512 | (8.3 | ) | (8,861 | ) | (25,662 | ) | (18,313 | ) | (7,349 | ) | 40.1 | |||
| Provision for income taxes | (5,271 | ) | (5,134 | ) | (137 | ) | 2.7 | (1,031 | ) | (6,302 | ) | (5,134 | ) | (1,168 | ) | 22.8 | |||
Net income(2) | 11,639 | 5,816 | 5,823 | 100.1 | 1,888 | 13,527 | 5,816 | 7,711 | 132.6 | ||||||||||
Existing Locations | Total | ||||||||||||||||||
Year Ended December 31, | Year Ended December 31, | ||||||||||||||||||
2006 | 2005 | Change | Acquisitions | 2006 | 2005 | Change | |||||||||||||
$ | $ | $ | % | (1) | $ | $ | $ | % | |||||||||||
| ($ in thousands) (unaudited) | |||||||||||||||||||
Reconciliation of net income to EBITDA: | |||||||||||||||||||
| Net income(2) | 11,639 | 5,816 | 5,823 | 100.1 | 1,888 | 13,527 | 5,816 | 7,711 | 132.6 | ||||||||||
| Interest expense, net | 16,801 | 18,313 | (1,512 | ) | (8.3 | ) | 8,861 | 25,662 | 18,313 | 7,349 | 40.1 | ||||||||
| Provision for income taxes | 5,271 | 5,134 | 137 | 2.7 | 1,031 | 6,302 | 5,134 | 1,168 | 22.8 | ||||||||||
| Depreciation and amortization | 15,997 | 15,652 | 345 | 2.2 | 9,285 | 25,282 | 15,652 | 9,630 | 61.5 | ||||||||||
| EBITDA | 49,708 | 44,915 | 4,793 | 10.7 | 21,065 | 70,773 | 44,915 | 25,858 | 57.6 | ||||||||||
The majority of the revenue and gross profit in our airport services businessAtlantic Aviation is generated through fueling general aviation aircraft at our 42 FBOs.the business’ 72 FBOs around the United States. This revenue is categorized according to who owns the fuel that we useused to service these aircraft. If we ownour business owns the fuel, wethey record ourthe cost to purchase that fuel as cost of revenue-fuel. OurThe business’ corresponding fuel revenue is ourits cost to purchase that fuel plus a margin. WeThe business generally pursuepursues a strategy of maintaining, and where appropriate increasing, dollardollar-based margins, thereby passing any increase in fuel prices to the customer. WeThe business also havehas into-plane arrangements whereby we fuelit fuels aircraft with fuel owned by another party. We collectThe business collects a fee for this service that is recorded as non-fuel revenue. Other non-fuel revenue includes various services such as hangar rentals, de-icing and airport services. Cost of revenue–non-fuel includes our cost, if any, to provide these services.
Gross profit for 2009 declined compared to 2008 mainly due to lower volume of general aviation fuel sold. Fuel volumes declined 15.6% as compared with 2008. Weighted average margins, including into-plane sales, were essentially flat. Excluding the results from the Charter operations and Management Contracts business, which were sold in the second half of 2008, gross profit growth wasfrom other services (including hangar rentals, de-icing and miscellaneous services) decreased by 7.0% for the year, primarily due to several factors:
Gross profit for the full yearquarter ended December 31, 2009 decreased by 6.5% compared to the fourth quarter of 2006;
Selling, General and Gulfport, MS were impacted by Hurricane Katrina. Some of our hangar and terminal facilities were damaged. However, our 2006 results were not significantly affected by other storms. We believe that we have an appropriate level of insurance coverage to repair or rebuild our facilities and protect us from business interruption losses that we may experience due to future hurricanes or similar events.
The increasedecrease in selling, general and administrative expenses is due to:
Selling, general and administrative expenses for the quarter ended December 31, 2009 declined 6.5% compared to the fourth quarter of 2008 as a result of cost reduction initiatives. Operating cost sequentially increased by 4.2% reflecting typical seasonality of the business driven by increase utilities expense, repairs and maintenance expense and overtime expense related to increased fuel revenue;snow removal.
Goodwill Impairment
In addition to its annual impairment test in the fourth quarter, the business performed an impairment test at the reporting unit level during the first six months of 2009. Goodwill is considered impaired when the carrying amount of a reporting unit’s goodwill exceeds its implied fair value, as determined under a two step approach. Based on the testing performed, the business recognized goodwill impairment charges of $71.2 million in the first six months of 2009 and
Depreciation and utility costs.
The increasedecrease in depreciation and amortization expense is primarilywas due to non-cash impairment charges of $30.8 million incurred in the first half of 2009 as compared to a non-cash cash impairment charge of $35.5 million in the fourth quarter of 2008.
Aviation-Related Business: Atlantic Aviation – (continued)
Interest Expense, Net
Interest expense increased despite a reduction of $81.6 million of debt due to the additionpayment of $8.8 million of swap termination fees paid during 2009.
Income Taxes
Income generated by Atlantic Aviation is included in our consolidated federal income tax return. The business files separate state income returns in more than 30 states in which it operates. The tax expense in the table above includes both state taxes and the portion of the Las Vegas FBOconsolidated federal tax liability attributable to the business.
For purposes of determining book and Trajen.
While the business as a $4.9 million impact of deferred financing costs that were chargedwhole expects to generate a current year federal income tax loss, certain entities within the business will generate state taxable income. The current state income tax expense in connection with a December 2005 refinancing, interest expense increased in 2006 due2009 was approximately $574,000.
The business has approximately $45.0 million of state NOL carryforwards. State NOL carryforwards are specific to the increased debt level associated withstate in which the debt refinancingNOL was generated and various states impose limitations on the acquisitionutilization of Trajen and higher non-cash amortization of deferred financing costs. In December 2005, we refinanced two existing debt facilities with a single debt facility, increasing outstanding borrowings by $103.5NOL carryforwards. Therefore, the business may incur state income tax liabilities in the near future, even if consolidated state taxable income is less than $45.0 million. In July 2006, we increased borrowings under this facility again by $180.0 million to finance our acquisition of Trajen. The debt facility provides an aggregate term loan borrowing of $480.0 million and includes a $5.0 million working capital facility.
Year Ended December 31, 20052008 Compared to Year Ended December 31, 2004
The following section summarizes the historical consolidated financial performance of Atlantic Aviation for the years ended December 31, 2008 and 2007.
The acquisition column and the total 2008 results in the table below include the operating results for:
Key Factors Affecting Operating Results
Aviation-Related Business: Atlantic Aviation – (continued)
| Year Ended December 31, | ||||||||||||||||||||||||||||||||||||||||||||||||||||||||||||||||||||||||||||||||||||||||||||||||||||||||||||||||||||||||||||||||||||||||||||||||||||||||||||||||||||||||||||||||||||||||||||||||||||||||||||||||||||||||||||||||||||||||||||||||||||||||||||||||||||||||||||||||||||||||||||||||||||||||||||||||||||||||||||||||||||||||||||||||||||||||||||||||||||||||||||||||||||||||||||||||||||||||||||
| Existing Locations(2) | Total | |||||||||||||||||||||||||||||||||||||||||||||||||||||||||||||||||||||||||||||||||||||||||||||||||||||||||||||||||||||||||||||||||||||||||||||||||||||||||||||||||||||||||||||||||||||||||||||||||||||||||||||||||||||||||||||||||||||||||||||||||||||||||||||||||||||||||||||||||||||||||||||||||||||||||||||||||||||||||||||||||||||||||||||||||||||||||||||||||||||||||||||||||||||||||||||||||||||||||||
| 2008 | 2007 | Change Favorable/ (Unfavorable) | Acquisitions(3) | 2008 | 2007 | Change Favorable/ (Unfavorable) | ||||||||||||||||||||||||||||||||||||||||||||||||||||||||||||||||||||||||||||||||||||||||||||||||||||||||||||||||||||||||||||||||||||||||||||||||||||||||||||||||||||||||||||||||||||||||||||||||||||||||||||||||||||||||||||||||||||||||||||||||||||||||||||||||||||||||||||||||||||||||||||||||||||||||||||||||||||||||||||||||||||||||||||||||||||||||||||||||||||||||||||||||||||||||||||||||||||||
| $ | $ | $ | % | $ | $ | $ | $ | % | ||||||||||||||||||||||||||||||||||||||||||||||||||||||||||||||||||||||||||||||||||||||||||||||||||||||||||||||||||||||||||||||||||||||||||||||||||||||||||||||||||||||||||||||||||||||||||||||||||||||||||||||||||||||||||||||||||||||||||||||||||||||||||||||||||||||||||||||||||||||||||||||||||||||||||||||||||||||||||||||||||||||||||||||||||||||||||||||||||||||||||||||||||||||||||||||||||||
| ($ In Thousands) (Unaudited) | ||||||||||||||||||||||||||||||||||||||||||||||||||||||||||||||||||||||||||||||||||||||||||||||||||||||||||||||||||||||||||||||||||||||||||||||||||||||||||||||||||||||||||||||||||||||||||||||||||||||||||||||||||||||||||||||||||||||||||||||||||||||||||||||||||||||||||||||||||||||||||||||||||||||||||||||||||||||||||||||||||||||||||||||||||||||||||||||||||||||||||||||||||||||||||||||||||||||||||||
| Revenue | ||||||||||||||||||||||||||||||||||||||||||||||||||||||||||||||||||||||||||||||||||||||||||||||||||||||||||||||||||||||||||||||||||||||||||||||||||||||||||||||||||||||||||||||||||||||||||||||||||||||||||||||||||||||||||||||||||||||||||||||||||||||||||||||||||||||||||||||||||||||||||||||||||||||||||||||||||||||||||||||||||||||||||||||||||||||||||||||||||||||||||||||||||||||||||||||||||||||||||||
| Fuel revenue | 365,262 | 371,250 | (5,988 | ) | (1.6 | ) | 129,548 | 494,810 | 371,250 | 123,560 | 33.3 | |||||||||||||||||||||||||||||||||||||||||||||||||||||||||||||||||||||||||||||||||||||||||||||||||||||||||||||||||||||||||||||||||||||||||||||||||||||||||||||||||||||||||||||||||||||||||||||||||||||||||||||||||||||||||||||||||||||||||||||||||||||||||||||||||||||||||||||||||||||||||||||||||||||||||||||||||||||||||||||||||||||||||||||||||||||||||||||||||||||||||||||||||||||||||||||||||
| Non-fuel revenue | 157,923 | 163,086 | (5,163 | ) | (3.2 | ) | 63,569 | 221,492 | 163,086 | 58,406 | 35.8 | |||||||||||||||||||||||||||||||||||||||||||||||||||||||||||||||||||||||||||||||||||||||||||||||||||||||||||||||||||||||||||||||||||||||||||||||||||||||||||||||||||||||||||||||||||||||||||||||||||||||||||||||||||||||||||||||||||||||||||||||||||||||||||||||||||||||||||||||||||||||||||||||||||||||||||||||||||||||||||||||||||||||||||||||||||||||||||||||||||||||||||||||||||||||||||||||||
| Total revenue | 523,185 | 534,336 | (11,151 | ) | (2.1 | ) | 193,117 | 716,302 | 534,336 | 181,966 | 34.1 | |||||||||||||||||||||||||||||||||||||||||||||||||||||||||||||||||||||||||||||||||||||||||||||||||||||||||||||||||||||||||||||||||||||||||||||||||||||||||||||||||||||||||||||||||||||||||||||||||||||||||||||||||||||||||||||||||||||||||||||||||||||||||||||||||||||||||||||||||||||||||||||||||||||||||||||||||||||||||||||||||||||||||||||||||||||||||||||||||||||||||||||||||||||||||||||||||
| Cost of revenue | ||||||||||||||||||||||||||||||||||||||||||||||||||||||||||||||||||||||||||||||||||||||||||||||||||||||||||||||||||||||||||||||||||||||||||||||||||||||||||||||||||||||||||||||||||||||||||||||||||||||||||||||||||||||||||||||||||||||||||||||||||||||||||||||||||||||||||||||||||||||||||||||||||||||||||||||||||||||||||||||||||||||||||||||||||||||||||||||||||||||||||||||||||||||||||||||||||||||||||||
| Cost of revenue-fuel | 251,084 | 237,112 | (13,972 | ) | (5.9 | ) | 91,018 | 342,102 | 237,112 | (104,990 | ) | (44.3 | ) | |||||||||||||||||||||||||||||||||||||||||||||||||||||||||||||||||||||||||||||||||||||||||||||||||||||||||||||||||||||||||||||||||||||||||||||||||||||||||||||||||||||||||||||||||||||||||||||||||||||||||||||||||||||||||||||||||||||||||||||||||||||||||||||||||||||||||||||||||||||||||||||||||||||||||||||||||||||||||||||||||||||||||||||||||||||||||||||||||||||||||||||||||||||||||||||||
| Cost of revenue-non-fuel | 16,420 | 20,568 | 4,148 | 20.2 | 15,778 | 32,198 | 20,568 | (11,630 | ) | (56.5 | ) | |||||||||||||||||||||||||||||||||||||||||||||||||||||||||||||||||||||||||||||||||||||||||||||||||||||||||||||||||||||||||||||||||||||||||||||||||||||||||||||||||||||||||||||||||||||||||||||||||||||||||||||||||||||||||||||||||||||||||||||||||||||||||||||||||||||||||||||||||||||||||||||||||||||||||||||||||||||||||||||||||||||||||||||||||||||||||||||||||||||||||||||||||||||||||||||||||
| Total cost of revenue | 267,504 | 257,680 | (9,824 | ) | (3.8 | ) | 106,796 | 374,300 | 257,680 | (116,620 | ) | (45.3 | ) | |||||||||||||||||||||||||||||||||||||||||||||||||||||||||||||||||||||||||||||||||||||||||||||||||||||||||||||||||||||||||||||||||||||||||||||||||||||||||||||||||||||||||||||||||||||||||||||||||||||||||||||||||||||||||||||||||||||||||||||||||||||||||||||||||||||||||||||||||||||||||||||||||||||||||||||||||||||||||||||||||||||||||||||||||||||||||||||||||||||||||||||||||||||||||||||||
| Fuel gross profit | 114,178 | 134,138 | (19,960 | ) | (14.9 | ) | 38,530 | 152,708 | 134,138 | 18,570 | 13.8 | |||||||||||||||||||||||||||||||||||||||||||||||||||||||||||||||||||||||||||||||||||||||||||||||||||||||||||||||||||||||||||||||||||||||||||||||||||||||||||||||||||||||||||||||||||||||||||||||||||||||||||||||||||||||||||||||||||||||||||||||||||||||||||||||||||||||||||||||||||||||||||||||||||||||||||||||||||||||||||||||||||||||||||||||||||||||||||||||||||||||||||||||||||||||||||||||||
| Non-fuel gross profit | 141,503 | 142,518 | (1,015 | ) | (0.7 | ) | �� | 47,791 | 189,294 | 142,518 | 46,776 | 32.8 | ||||||||||||||||||||||||||||||||||||||||||||||||||||||||||||||||||||||||||||||||||||||||||||||||||||||||||||||||||||||||||||||||||||||||||||||||||||||||||||||||||||||||||||||||||||||||||||||||||||||||||||||||||||||||||||||||||||||||||||||||||||||||||||||||||||||||||||||||||||||||||||||||||||||||||||||||||||||||||||||||||||||||||||||||||||||||||||||||||||||||||||||||||||||||||||||||
| Gross profit | 255,681 | 276,656 | (20,975 | ) | (7.6 | ) | 86,321 | 342,002 | 276,656 | 65,346 | 23.6 | |||||||||||||||||||||||||||||||||||||||||||||||||||||||||||||||||||||||||||||||||||||||||||||||||||||||||||||||||||||||||||||||||||||||||||||||||||||||||||||||||||||||||||||||||||||||||||||||||||||||||||||||||||||||||||||||||||||||||||||||||||||||||||||||||||||||||||||||||||||||||||||||||||||||||||||||||||||||||||||||||||||||||||||||||||||||||||||||||||||||||||||||||||||||||||||||||
| Selling, general and administrative expenses | 148,546 | 155,474 | 6,928 | 4.5 | 56,758 | 205,304 | 155,474 | (49,830 | ) | (32.1 | ) | |||||||||||||||||||||||||||||||||||||||||||||||||||||||||||||||||||||||||||||||||||||||||||||||||||||||||||||||||||||||||||||||||||||||||||||||||||||||||||||||||||||||||||||||||||||||||||||||||||||||||||||||||||||||||||||||||||||||||||||||||||||||||||||||||||||||||||||||||||||||||||||||||||||||||||||||||||||||||||||||||||||||||||||||||||||||||||||||||||||||||||||||||||||||||||||||||
| Goodwill impairment | 51,473 | — | (51,473 | ) | NM | 527 | 52,000 | — | (52,000 | ) | NM | |||||||||||||||||||||||||||||||||||||||||||||||||||||||||||||||||||||||||||||||||||||||||||||||||||||||||||||||||||||||||||||||||||||||||||||||||||||||||||||||||||||||||||||||||||||||||||||||||||||||||||||||||||||||||||||||||||||||||||||||||||||||||||||||||||||||||||||||||||||||||||||||||||||||||||||||||||||||||||||||||||||||||||||||||||||||||||||||||||||||||||||||||||||||||||||||||
| Depreciation and amortization | 77,271 | 44,753 | (32,518 | ) | (72.7 | ) | 16,632 | 93,903 | 44,753 | (49,150 | ) | (109.8 | ) | |||||||||||||||||||||||||||||||||||||||||||||||||||||||||||||||||||||||||||||||||||||||||||||||||||||||||||||||||||||||||||||||||||||||||||||||||||||||||||||||||||||||||||||||||||||||||||||||||||||||||||||||||||||||||||||||||||||||||||||||||||||||||||||||||||||||||||||||||||||||||||||||||||||||||||||||||||||||||||||||||||||||||||||||||||||||||||||||||||||||||||||||||||||||||||||||
| Operating (loss) income | (21,609 | ) | 76,429 | (98,038 | ) | (128.3 | ) | 12,404 | (9,205 | ) | 76,429 | (85,634 | ) | (112.0 | ) | |||||||||||||||||||||||||||||||||||||||||||||||||||||||||||||||||||||||||||||||||||||||||||||||||||||||||||||||||||||||||||||||||||||||||||||||||||||||||||||||||||||||||||||||||||||||||||||||||||||||||||||||||||||||||||||||||||||||||||||||||||||||||||||||||||||||||||||||||||||||||||||||||||||||||||||||||||||||||||||||||||||||||||||||||||||||||||||||||||||||||||||||||||||||||||||
| Interest expense, net | (45,847 | ) | (42,559 | ) | (3,288 | ) | (7.7 | ) | (17,120 | ) | (62,967 | ) | (42,559 | ) | (20,408 | ) | (48.0 | ) | ||||||||||||||||||||||||||||||||||||||||||||||||||||||||||||||||||||||||||||||||||||||||||||||||||||||||||||||||||||||||||||||||||||||||||||||||||||||||||||||||||||||||||||||||||||||||||||||||||||||||||||||||||||||||||||||||||||||||||||||||||||||||||||||||||||||||||||||||||||||||||||||||||||||||||||||||||||||||||||||||||||||||||||||||||||||||||||||||||||||||||||||||||||||||||
| Loss on extinguishment of debt | - | (9,804 | ) | 9,804 | NM | - | - | (9,804 | ) | 9,804 | NM | |||||||||||||||||||||||||||||||||||||||||||||||||||||||||||||||||||||||||||||||||||||||||||||||||||||||||||||||||||||||||||||||||||||||||||||||||||||||||||||||||||||||||||||||||||||||||||||||||||||||||||||||||||||||||||||||||||||||||||||||||||||||||||||||||||||||||||||||||||||||||||||||||||||||||||||||||||||||||||||||||||||||||||||||||||||||||||||||||||||||||||||||||||||||||||||||||
| Other (expense) income | (323 | ) | (775 | ) | 452 | 58.3 | 82 | (241 | ) | (775 | ) | 534 | 68.9 | |||||||||||||||||||||||||||||||||||||||||||||||||||||||||||||||||||||||||||||||||||||||||||||||||||||||||||||||||||||||||||||||||||||||||||||||||||||||||||||||||||||||||||||||||||||||||||||||||||||||||||||||||||||||||||||||||||||||||||||||||||||||||||||||||||||||||||||||||||||||||||||||||||||||||||||||||||||||||||||||||||||||||||||||||||||||||||||||||||||||||||||||||||||||||||||||
| Unrealized losses on derivative instruments | (1,709 | ) | (1,659 | ) | (50 | ) | (3.0 | ) | (162 | ) | (1,871 | ) | (1,659 | ) | (212 | ) | (12.8 | ) | ||||||||||||||||||||||||||||||||||||||||||||||||||||||||||||||||||||||||||||||||||||||||||||||||||||||||||||||||||||||||||||||||||||||||||||||||||||||||||||||||||||||||||||||||||||||||||||||||||||||||||||||||||||||||||||||||||||||||||||||||||||||||||||||||||||||||||||||||||||||||||||||||||||||||||||||||||||||||||||||||||||||||||||||||||||||||||||||||||||||||||||||||||||||||||
| Benefit (provision) for income taxes | 28,003 | (8,575 | ) | 36,578 | NM | 1,933 | 29,936 | (8,575 | ) | 38,511 | NM | |||||||||||||||||||||||||||||||||||||||||||||||||||||||||||||||||||||||||||||||||||||||||||||||||||||||||||||||||||||||||||||||||||||||||||||||||||||||||||||||||||||||||||||||||||||||||||||||||||||||||||||||||||||||||||||||||||||||||||||||||||||||||||||||||||||||||||||||||||||||||||||||||||||||||||||||||||||||||||||||||||||||||||||||||||||||||||||||||||||||||||||||||||||||||||||||||
| Net (loss) income(1) | (41,485 | ) | 13,057 | (54,542 | ) | NM | (2,863 | ) | (44,348 | ) | 13,057 | (57,405 | ) | NM | ||||||||||||||||||||||||||||||||||||||||||||||||||||||||||||||||||||||||||||||||||||||||||||||||||||||||||||||||||||||||||||||||||||||||||||||||||||||||||||||||||||||||||||||||||||||||||||||||||||||||||||||||||||||||||||||||||||||||||||||||||||||||||||||||||||||||||||||||||||||||||||||||||||||||||||||||||||||||||||||||||||||||||||||||||||||||||||||||||||||||||||||||||||||||||||||
| Reconciliation of net (loss) income to EBITDA excluding non-cash items: | ||||||||||||||||||||||||||||||||||||||||||||||||||||||||||||||||||||||||||||||||||||||||||||||||||||||||||||||||||||||||||||||||||||||||||||||||||||||||||||||||||||||||||||||||||||||||||||||||||||||||||||||||||||||||||||||||||||||||||||||||||||||||||||||||||||||||||||||||||||||||||||||||||||||||||||||||||||||||||||||||||||||||||||||||||||||||||||||||||||||||||||||||||||||||||||||||||||||||||||
| Net (loss) income(1) | (41,485 | ) | 13,057 | (2,863 | ) | (44,348 | ) | 13,057 | ||||||||||||||||||||||||||||||||||||||||||||||||||||||||||||||||||||||||||||||||||||||||||||||||||||||||||||||||||||||||||||||||||||||||||||||||||||||||||||||||||||||||||||||||||||||||||||||||||||||||||||||||||||||||||||||||||||||||||||||||||||||||||||||||||||||||||||||||||||||||||||||||||||||||||||||||||||||||||||||||||||||||||||||||||||||||||||||||||||||||||||||||||||||||||||||||||||
| Interest expense, net | 45,847 | 42,559 | 17,120 | 62,967 | 42,559 | |||||||||||||||||||||||||||||||||||||||||||||||||||||||||||||||||||||||||||||||||||||||||||||||||||||||||||||||||||||||||||||||||||||||||||||||||||||||||||||||||||||||||||||||||||||||||||||||||||||||||||||||||||||||||||||||||||||||||||||||||||||||||||||||||||||||||||||||||||||||||||||||||||||||||||||||||||||||||||||||||||||||||||||||||||||||||||||||||||||||||||||||||||||||||||||||||||||||
| (Benefit) provision for income taxes | (28,003 | ) | 8,575 | (1,933 | ) | (29,936 | ) | 8,575 | ||||||||||||||||||||||||||||||||||||||||||||||||||||||||||||||||||||||||||||||||||||||||||||||||||||||||||||||||||||||||||||||||||||||||||||||||||||||||||||||||||||||||||||||||||||||||||||||||||||||||||||||||||||||||||||||||||||||||||||||||||||||||||||||||||||||||||||||||||||||||||||||||||||||||||||||||||||||||||||||||||||||||||||||||||||||||||||||||||||||||||||||||||||||||||||||||||||
| Depreciation and amortization | 77,271 | 44,753 | 16,632 | 93,903 | 44,753 | |||||||||||||||||||||||||||||||||||||||||||||||||||||||||||||||||||||||||||||||||||||||||||||||||||||||||||||||||||||||||||||||||||||||||||||||||||||||||||||||||||||||||||||||||||||||||||||||||||||||||||||||||||||||||||||||||||||||||||||||||||||||||||||||||||||||||||||||||||||||||||||||||||||||||||||||||||||||||||||||||||||||||||||||||||||||||||||||||||||||||||||||||||||||||||||||||||||||
| Goodwill impairment | 51,473 | — | 527 | 52,000 | — | |||||||||||||||||||||||||||||||||||||||||||||||||||||||||||||||||||||||||||||||||||||||||||||||||||||||||||||||||||||||||||||||||||||||||||||||||||||||||||||||||||||||||||||||||||||||||||||||||||||||||||||||||||||||||||||||||||||||||||||||||||||||||||||||||||||||||||||||||||||||||||||||||||||||||||||||||||||||||||||||||||||||||||||||||||||||||||||||||||||||||||||||||||||||||||||||||||||||
| Non-cash loss on extinguishment of debt | — | 9,804 | — | — | 9,804 | |||||||||||||||||||||||||||||||||||||||||||||||||||||||||||||||||||||||||||||||||||||||||||||||||||||||||||||||||||||||||||||||||||||||||||||||||||||||||||||||||||||||||||||||||||||||||||||||||||||||||||||||||||||||||||||||||||||||||||||||||||||||||||||||||||||||||||||||||||||||||||||||||||||||||||||||||||||||||||||||||||||||||||||||||||||||||||||||||||||||||||||||||||||||||||||||||||||||
| Unrealized losses on derivative instruments | 1,709 | 1,659 | 162 | 1,871 | 1,659 | |||||||||||||||||||||||||||||||||||||||||||||||||||||||||||||||||||||||||||||||||||||||||||||||||||||||||||||||||||||||||||||||||||||||||||||||||||||||||||||||||||||||||||||||||||||||||||||||||||||||||||||||||||||||||||||||||||||||||||||||||||||||||||||||||||||||||||||||||||||||||||||||||||||||||||||||||||||||||||||||||||||||||||||||||||||||||||||||||||||||||||||||||||||||||||||||||||||||
| Other non-cash expenses (income) | 722 | (556 | ) | (98 | ) | 624 | (556 | ) | ||||||||||||||||||||||||||||||||||||||||||||||||||||||||||||||||||||||||||||||||||||||||||||||||||||||||||||||||||||||||||||||||||||||||||||||||||||||||||||||||||||||||||||||||||||||||||||||||||||||||||||||||||||||||||||||||||||||||||||||||||||||||||||||||||||||||||||||||||||||||||||||||||||||||||||||||||||||||||||||||||||||||||||||||||||||||||||||||||||||||||||||||||||||||||||||||||||
| EBITDA excluding non-cash items | 107,534 | 119,851 | (12,317 | ) | (10.3 | ) | 29,547 | 137,081 | 119,851 | 17,230 | 14.4 | |||||||||||||||||||||||||||||||||||||||||||||||||||||||||||||||||||||||||||||||||||||||||||||||||||||||||||||||||||||||||||||||||||||||||||||||||||||||||||||||||||||||||||||||||||||||||||||||||||||||||||||||||||||||||||||||||||||||||||||||||||||||||||||||||||||||||||||||||||||||||||||||||||||||||||||||||||||||||||||||||||||||||||||||||||||||||||||||||||||||||||||||||||||||||||||||||
| EBITDA excluding non-cash items | 107,534 | 119,851 | 29,547 | 137,081 | 119,851 | |||||||||||||||||||||||||||||||||||||||||||||||||||||||||||||||||||||||||||||||||||||||||||||||||||||||||||||||||||||||||||||||||||||||||||||||||||||||||||||||||||||||||||||||||||||||||||||||||||||||||||||||||||||||||||||||||||||||||||||||||||||||||||||||||||||||||||||||||||||||||||||||||||||||||||||||||||||||||||||||||||||||||||||||||||||||||||||||||||||||||||||||||||||||||||||||||||||||
| Interest expense, net | (45,847 | ) | (42,559 | ) | (17,120 | ) | (62,967 | ) | (42,559 | ) | ||||||||||||||||||||||||||||||||||||||||||||||||||||||||||||||||||||||||||||||||||||||||||||||||||||||||||||||||||||||||||||||||||||||||||||||||||||||||||||||||||||||||||||||||||||||||||||||||||||||||||||||||||||||||||||||||||||||||||||||||||||||||||||||||||||||||||||||||||||||||||||||||||||||||||||||||||||||||||||||||||||||||||||||||||||||||||||||||||||||||||||||||||||||||||||||||||
| Amortization of debt financing costs | 2,444 | 2,554 | 169 | 2,613 | 2,554 | |||||||||||||||||||||||||||||||||||||||||||||||||||||||||||||||||||||||||||||||||||||||||||||||||||||||||||||||||||||||||||||||||||||||||||||||||||||||||||||||||||||||||||||||||||||||||||||||||||||||||||||||||||||||||||||||||||||||||||||||||||||||||||||||||||||||||||||||||||||||||||||||||||||||||||||||||||||||||||||||||||||||||||||||||||||||||||||||||||||||||||||||||||||||||||||||||||||||
| Benefit/provision for income taxes, net of changes in deferred taxes | (7,437 | ) | (8,435 | ) | (513 | ) | (7,950 | ) | (8,435 | ) | ||||||||||||||||||||||||||||||||||||||||||||||||||||||||||||||||||||||||||||||||||||||||||||||||||||||||||||||||||||||||||||||||||||||||||||||||||||||||||||||||||||||||||||||||||||||||||||||||||||||||||||||||||||||||||||||||||||||||||||||||||||||||||||||||||||||||||||||||||||||||||||||||||||||||||||||||||||||||||||||||||||||||||||||||||||||||||||||||||||||||||||||||||||||||||||||||||
| Changes in working capital | 4,070 | 13,912 | 281 | 4,351 | 13,912 | |||||||||||||||||||||||||||||||||||||||||||||||||||||||||||||||||||||||||||||||||||||||||||||||||||||||||||||||||||||||||||||||||||||||||||||||||||||||||||||||||||||||||||||||||||||||||||||||||||||||||||||||||||||||||||||||||||||||||||||||||||||||||||||||||||||||||||||||||||||||||||||||||||||||||||||||||||||||||||||||||||||||||||||||||||||||||||||||||||||||||||||||||||||||||||||||||||||||
| Cash provided by operating activities | 60,764 | 85,323 | 12,364 | 73,128 | 85,323 | |||||||||||||||||||||||||||||||||||||||||||||||||||||||||||||||||||||||||||||||||||||||||||||||||||||||||||||||||||||||||||||||||||||||||||||||||||||||||||||||||||||||||||||||||||||||||||||||||||||||||||||||||||||||||||||||||||||||||||||||||||||||||||||||||||||||||||||||||||||||||||||||||||||||||||||||||||||||||||||||||||||||||||||||||||||||||||||||||||||||||||||||||||||||||||||||||||||||
| Changes in working capital | (4,070 | ) | (13,912 | ) | (281 | ) | (4,351 | ) | (13,912 | ) | ||||||||||||||||||||||||||||||||||||||||||||||||||||||||||||||||||||||||||||||||||||||||||||||||||||||||||||||||||||||||||||||||||||||||||||||||||||||||||||||||||||||||||||||||||||||||||||||||||||||||||||||||||||||||||||||||||||||||||||||||||||||||||||||||||||||||||||||||||||||||||||||||||||||||||||||||||||||||||||||||||||||||||||||||||||||||||||||||||||||||||||||||||||||||||||||||||
| Maintenance capital expenditures | (7,161 | ) | (8,628 | ) | (494 | ) | (7,655 | ) | (8,628 | ) | ||||||||||||||||||||||||||||||||||||||||||||||||||||||||||||||||||||||||||||||||||||||||||||||||||||||||||||||||||||||||||||||||||||||||||||||||||||||||||||||||||||||||||||||||||||||||||||||||||||||||||||||||||||||||||||||||||||||||||||||||||||||||||||||||||||||||||||||||||||||||||||||||||||||||||||||||||||||||||||||||||||||||||||||||||||||||||||||||||||||||||||||||||||||||||||||||||
| Free cash flow | 49,533 | 62,783 | (13,250 | ) | (21.1 | ) | 11,589 | 61,122 | 62,783 | (1,661 | ) | (2.6 | ) | |||||||||||||||||||||||||||||||||||||||||||||||||||||||||||||||||||||||||||||||||||||||||||||||||||||||||||||||||||||||||||||||||||||||||||||||||||||||||||||||||||||||||||||||||||||||||||||||||||||||||||||||||||||||||||||||||||||||||||||||||||||||||||||||||||||||||||||||||||||||||||||||||||||||||||||||||||||||||||||||||||||||||||||||||||||||||||||||||||||||||||||||||||||||||||||||
NM — Not meaningful
| (1) | Corporate allocation expense and the federal tax effect have been excluded from the above table as they are eliminated on consolidation at the MIC Inc. level. |
| (2) | Results for the existing locations columns include Supermarine FBOs from May 30, 2007 (following our acquisition) to December 31, 2007 and June 1, 2008 to December 31, 2008; Mercury FBOs from August 9, 2007 (following our acquisition) to December 31, 2007 and August 9, 2008 to December 31, 2008; San Jose FBOs from August 17, 2007 (following our acquisition) to December 31, 2007 and August 17, 2008 to December 31, 2008; and Rifle FBO from November 30, 2007 (following our acquisition) to December 31, 2007 and December 1, 2008 to December 31, 2008. Also included are all locations owned since January 1, 2007 for the full year. |
| (3) | Acquisitions include the results of Supermarine FBOs (acquired May 30, 2007) for the period January 1, 2008 to May 31, 2008; Mercury FBOs (acquired August 9, 2007) for the period January 1, 2008 to August 8, 2008; San Jose FBOs (acquired August 17, 2007) for the period January 1, 2008 to August 16, 2008; Rifle FBOs (acquired November 30, 2007) for the period January 1, 2008 to November 30, 2008 and SevenBar FBOs (acquired March 4, 2008). |
Aviation-Related Business: Atlantic Aviation – (continued)
Revenue and Gross Profit
The growth in gross profit at all sites was primarily due to the inclusion of the results of sites acquired in 2007 and 2008. Gross profit at existing locations decreased mainly due to lower fuel volume resulting from lower general aviation activity (declines of 17.8% and 8.7% for the quarter and the year, respectively) and lower average general aviation fuel margins. Gross profit from other services at existing locations increased by 2.8% in 2008 as a result of higher de-icing revenue and hangar rentals in the first half of the year. For the quarter ended December 31, 2008, gross profit from other services declined as a result of lower general aviation traffic.
We attribute the volume decline primarily to a decrease in general aviation transient traffic. We believe the decline in transient traffic is due primarily to overall soft economic conditions. The slowing economy has contributed to a general decrease in corporate activity and reduction in business-related general aviation activity.
While the business seeks to maintain or increase a dollar-based margin per gallon backed by a premium services offering, increased fuel prices that peaked in mid-2008 led to an increased focus on cost by some of our airport services businesscustomers. These customers negotiated more aggressively on fuel purchases and contributed to a decrease in our average margins through the third quarter. Declining fuel price in the fourth quarter had a favorable impact on average fuel margins. In addition, some competitors are pursuing more aggressive pricing strategies that have also contributed to increased margin pressure.
Selling, General and Administrative Expenses
The decrease in selling, general and administrative expenses at existing locations for the year ended December 31, 2005. Information relating2008 is due primarily to existing locationscost efficiencies resulting from integration of recently acquired businesses and management’s actions to streamline our cost structure in 2005 representsresponse to the results of our airport services business excluding the results of EAR, an FBOdecline in Las Vegas and GAH, which comprises two California FBOs. The acquisition column below includes the operating results of EAR and GAHgross profit resulting from the acquisition datesoverall slowing of August 12, 2005 and January 15, 2005, respectively.
Year Ended December 31, | GAH & EAR | Year Ended December 31, | |||||||||||||||||
2005 | 2004 | Change | Acquisitions | 2005 | 2004 | Change | |||||||||||||
$ | $ | $ | % | $ | $ | $ | $ | % | |||||||||||
| ($ in thousands) (unaudited) | |||||||||||||||||||
Revenue | |||||||||||||||||||
| Fuel revenue | 115,270 | 100,363 | 14,907 | 14.9 | 27,515 | 142,785 | 100,363 | 42,422 | 42.3 | ||||||||||
| Non-fuel revenue | 49,165 | 41,714 | 7,451 | 17.9 | 9,536 | 58,701 | 41,714 | 16,987 | 40.7 | ||||||||||
| Total revenue | 164,435 | 142,077 | 22,358 | 15.7 | 37,051 | 201,486 | 142,077 | 59,409 | 41.8 | ||||||||||
Cost of revenue | |||||||||||||||||||
| Cost of revenue-fuel | 67,914 | 53,572 | 14,342 | 26.8 | 16,566 | 84,480 | 53,572 | 30,908 | 57.7 | ||||||||||
| Cost of revenue-non-fuel | 7,044 | 6,036 | 1,008 | 16.7 | 862 | 7,906 | 6,036 | 1,870 | 31.0 | ||||||||||
| Total cost of revenue | 74,958 | 59,608 | 15,350 | 25.8 | 17,428 | 92,386 | 59,608 | 32,778 | 55.0 | ||||||||||
| Fuel gross profit | 47,356 | 46,791 | 565 | 1.2 | 10,949 | 58,305 | 46,791 | 11,514 | 24.6 | ||||||||||
| Non-fuel gross profit | 42,121 | 35,678 | 6,443 | 18.1 | 8,674 | 50,795 | 35,678 | 15,117 | 42.4 | ||||||||||
| Gross Profit | 89,477 | 82,469 | 7,008 | 8.5 | 19,623 | 109,100 | 82,469 | 26,631 | 32.3 | ||||||||||
| Selling, general and administrative expenses | 54,472 | 55,041 | (569 | ) | (1.0 | ) | 10,668 | 65,140 | 55,041 | 10,099 | 18.3 | ||||||||
| Depreciation and amortization | 12,187 | 12,142 | 45 | 0.4 | 3,465 | 15,652 | 12,142 | 3,510 | 28.9 | ||||||||||
| Operating income | 22,818 | 15,286 | 7,532 | 49.3 | 5,490 | 28,308 | 15,286 | 13,022 | 85.2 | ||||||||||
| Other expense | (122 | ) | (11,814 | ) | 11,692 | (99.0 | ) | (913 | ) | (1,035 | ) | (11,814 | ) | 10,779 | (91.2 | ) | |||
| Unrealized gain on derivative instruments | 1,990 | — | 1,990 | NM | — | 1,990 | — | 1,990 | NM | ||||||||||
| Interest expense, net | (14,714 | ) | (11,423 | ) | (3,291 | ) | 28.8 | (3,599 | ) | (18,313 | ) | (11,423 | ) | (6,890 | ) | 60.3 | |||
| Provision for income taxes | (4,591 | ) | 326 | (4,917 | ) | NM | (543 | ) | (5,134 | ) | 326 | (5,460 | ) | NM | |||||
Income from continuing operations | 5,381 | (7,625 | ) | 13,006 | (170.6 | ) | 435 | 5,816 | (7,625 | ) | 13,441 | (176.3 | ) | ||||||
Reconciliation of income from continuing operations to EBITDA from continuing operations: | |||||||||||||||||||
| Income from continuing operations | 5,381 | (7,625 | ) | 13,006 | (170.6 | ) | 435 | 5,816 | (7,625 | ) | 13,441 | (176.3 | ) | ||||||
| Interest expense, net | 14,714 | 11,423 | 3,291 | 28.8 | 3,599 | 18,313 | 11,423 | 6,890 | 60.3 | ||||||||||
| Provision for income taxes | 4,591 | (326 | ) | 4,917 | NM | 543 | 5,134 | (326 | ) | 5,460 | NM | ||||||||
| Depreciation and amortization | 12,187 | 12,142 | 45 | 0.4 | 3,465 | 15,652 | 12,142 | 3,510 | 28.9 | ||||||||||
| EBITDA from continuing operations | 36,873 | 15,614 | 21,259 | 136.2 | 8,042 | 44,915 | 15,614 | 29,301 | 187.7 | ||||||||||
Goodwill Impairment
Atlantic Aviation performed an annual impairment test during the fourth quarter of 2008. Goodwill is considered impaired when the carrying amount of a stock appreciation rights plan for certain employees atreporting unit’s goodwill exceeds its implied fair value, as determined under a parttwo-step approach. Based on the testing performed, the business recognized a goodwill impairment charge of our airport services business. $52.0 million during 2008.
Depreciation and Amortization
The increase in depreciation and amortization expense was due to the recordingnon-cash impairment charges of the business’s net assets$21.7 million related to fair value upon their acquisitions, partially offset by the expiration in November 2004 of a two-year non-compete agreement.
Year Ended December 31, | Year Ended December 31, | ||||||||||||||||
2006 | 2005 | Change | 2005 | 2004 | Change | ||||||||||||
$ | $ | $ | % | $ | $ | $ | % | ||||||||||
| ($ in thousands) (unaudited) | |||||||||||||||||
Revenue | |||||||||||||||||
| Terminal revenue | 193,712 | 182,518 | 11,194 | 6.1 | 182,518 | 168,384 | 14,134 | 8.4 | |||||||||
| Terminal revenue - heating | 17,268 | 20,595 | (3,327 | ) | (16.2 | ) | 20,595 | 15,252 | 5,343 | 35.0 | |||||||
| Environmental response revenue | 18,599 | 37,107 | (18,508 | ) | (49.9 | ) | 37,107 | 16,124 | 20,983 | 130.1 | |||||||
| Nursery revenue | 9,700 | 10,404 | (704 | ) | (6.8 | ) | 10,404 | 10,907 | (503 | ) | (4.6 | ) | |||||
Total revenue | 239,279 | 250,624 | (11,345 | ) | (4.5 | ) | 250,624 | 210,667 | 39,957 | 19.0 | ) | ||||||
Costs | |||||||||||||||||
| Terminal operating costs | 99,182 | 97,746 | 1,436 | 1.5 | 97,746 | 87,755 | 9,991 | 11.4 | |||||||||
| Terminal operating costs – fuel | 12,911 | 20,969 | (8,058 | ) | (38.4 | ) | 20,969 | 17,712 | 3,257 | 18.4 | |||||||
| Environmental response operating costs | 11,941 | 24,774 | (12,833 | ) | (51.8 | ) | 24,774 | 9,720 | 15,054 | 154.9 | |||||||
| Nursery operating costs | 10,837 | 10,268 | 569 | 5.5 | 10,268 | 11,136 | (868 | ) | (7.8 | ) | |||||||
Total costs | 134,871 | 153,757 | (18,886 | ) | (12.3 | ) | 153,757 | 126,323 | 27,434 | 21.7 | ) | ||||||
| Terminal gross profit | 98,887 | 84,398 | 14,489 | 17.2 | 84,398 | 78,169 | 6,229 | 8.0 | |||||||||
| Environmental response gross profit | 6,658 | 12,333 | (5,675 | ) | (46.0 | ) | 12,333 | 6,404 | 5,929 | 92.6 | |||||||
| Nursery gross profit | (1,137 | ) | 136 | (1,273 | ) | NM | 136 | (229 | ) | 365 | (159.4 | ) | |||||
Gross profit | 104,408 | 96,867 | 7,541 | 7.8 | 96,867 | 84,344 | 12,523 | 14.8 | |||||||||
Operating expenses | |||||||||||||||||
| General and administrative expenses | 22,348 | 22,834 | (486 | ) | (2.1 | ) | 22,834 | 20,911 | 1,923 | 9.2 | |||||||
| Depreciation and amortization | 31,056 | 29,524 | 1,532 | 5.2 | 29,524 | 29,929 | (405 | ) | (1.4 | ) | |||||||
Operating income | 51,004 | 44,509 | 6,495 | 14.6 | 44,509 | 33,504 | 11,005 | 32.8 | |||||||||
Year Ended December 31, | Year Ended December 31, | ||||||||
2006 | 2005 | Change | |||||||
$ | $ | $ | % | ||||||
| ($ in thousands) (unaudited) | |||||||||
Contribution margin | |||||||||
| Revenue – utility | 93,602 | 85,866 | 7,736 | 9.0 | |||||
| Cost of revenue – utility | 63,222 | 51,648 | 11,574 | 22.4 | |||||
| Contribution margin – utility | 30,380 | 34,218 | (3,838 | ) | (11.2 | ) | |||
| Revenue – non-utility | 67,260 | 61,592 | 5,668 | 9.2 | |||||
| Cost of revenue – non-utility | 40,028 | 36,414 | 3,614 | 9.9 | |||||
| Contribution margin – non-utility | 27,232 | 25,178 | 2,054 | 8.2 | |||||
Total contribution margin | 57,612 | 59,396 | (1,784 | ) | (3.0 | ) | |||
| Production | 4,718 | 4,458 | 260 | 5.8 | |||||
| Transmission and distribution | 14,110 | 13,091 | 1,019 | 7.8 | |||||
| Selling, general and administrative expenses | 16,116 | 16,107 | 9 | — | |||||
| Depreciation and amortization | 6,089 | 5,236 | 853 | 16.3 | |||||
Operating income | 16,579 | 20,504 | (3,925 | ) | (19.1 | ) | |||
| Interest expense, net | (8,666 | ) | (4,123 | ) | (4,543 | ) | 110.2 | ||
| Other (expense) income | (1,605 | ) | 2,325 | (3,930 | ) | (169.0 | ) | ||
| Unrealized loss on derivatives | (3,717 | ) | — | (3,717 | ) | NM | |||
Income before taxes(1) | 2,591 | 18,706 | (16,115 | ) | (86.1 | ) | |||
Reconciliation of income before taxes to EBITDA: | |||||||||
| Income before taxes(1) | 2,591 | 18,706 | (16,115 | ) | (86.1 | ) | |||
| Interest expense, net | 8,666 | 4,123 | 4,543 | 110.2 | |||||
| Depreciation and amortization | 6,089 | 5,236 | 853 | 16.3 | |||||
EBITDA | 17,346 | 28,065 | (10,719 | ) | (38.2 | ) | |||
Consolidated | |||||||||
2006 | 2005 | Change | |||||||
$ | $ | $ | % | ||||||
| ($ in thousands) (unaudited) | |||||||||
| Cooling capacity revenue | 17,407 | 16,524 | 883 | 5.3 | |||||
| Cooling consumption revenue | 17,897 | 18,719 | (822 | ) | (4.4 | ) | |||
| Other revenue | 3,163 | 2,855 | 308 | 10.8 | |||||
| Finance lease revenue | 5,118 | 5,303 | (185 | ) | (3.5 | ) | |||
| Total revenue | 43,585 | 43,401 | 184 | 0.4 | |||||
| Direct expenses — electricity | 12,245 | 12,080 | 165 | 1.4 | |||||
| Direct expenses — other(1) | 17,161 | 17,098 | 63 | 0.4 | |||||
| Direct expenses — total | 29,406 | 29,178 | 228 | 0.8 | |||||
| Gross profit | 14,179 | 14,223 | (44 | ) | (0.3 | ) | |||
| Selling, general and administrative expenses | 3,811 | 3,480 | 331 | 9.5 | |||||
| Amortization of intangibles | 1,368 | 1,368 | — | — | |||||
| Operating income | 9,000 | 9,375 | (375 | ) | (4.0 | ) | |||
| Interest expense, net | (8,331 | ) | (8,271 | ) | (60 | ) | 0.7 | ||
| Other (expense) income | (139 | ) | 369 | (508 | ) | (137.7 | ) | ||
| Benefit (provision) for income taxes | 1,102 | (302 | ) | 1,404 | NM | ||||
| Minority interest | (528 | ) | (719 | ) | 191 | (26.6 | ) | ||
| Net income(2) | 1,104 | 452 | 652 | 144.2 | |||||
Reconciliation of net income to EBITDA | |||||||||
| Net income(2) | 1,104 | 452 | 652 | 144.2 | |||||
| Interest expense, net | 8,331 | 8,271 | 60 | 0.7 | |||||
| (Benefit) provision for income taxes | (1,102 | ) | 302 | (1,404 | ) | NM | |||
| Depreciation | 5,709 | 5,694 | 15 | 0.2 | |||||
| Amortization of intangibles | 1,368 | 1,368 | — | — | |||||
| EBITDA | 15,410 | 16,087 | (677 | ) | (4.2 | ) | |||
Interest Expense, Net
The increase in net interest expense was due to additional credit line draws necessary to fund scheduled capital expenditures and new customer connections during the year. Our interest rate on our senior debt is a fixed rate.
MDEH Excluding ETT Nevada | ETT Nevada | Consolidated | |||||||||||||||||||
2005 | 2004 | Change | 2005 | 2004 | 2005 | 2004 | Change | ||||||||||||||
$ | $ | $ | % | $ | $ | $ | $ | $ | % | ||||||||||||
| ($ in thousands) | |||||||||||||||||||||
| Cooling capacity revenue | 16,524 | 16,224 | 300 | 1.8 | — | — | 16,524 | 16,224 | 300 | 1.8 | |||||||||||
| Cooling consumption revenue | 16,894 | 14,359 | 2,535 | 17.7 | 1,825 | 289 | 18,719 | 14,648 | 4,071 | 27.8 | |||||||||||
| Other revenue | 1,090 | 1,285 | (195 | ) | (15.2 | ) | 1,765 | 436 | 2,855 | 1,721 | 1,134 | 65.9 | |||||||||
| Finance lease revenue | 1,287 | 1,387 | (100 | ) | (7.2 | ) | 4,016 | 1,036 | 5,303 | 2,423 | 2,880 | 118.9 | |||||||||
| Total revenue | 35,795 | 33,255 | 2,540 | 7.6 | 7,606 | 1,761 | 43,401 | 35,016 | 8,385 | 23.9 | |||||||||||
| Direct expenses – electricity | 10,270 | 8,767 | 1,503 | 17.1 | 1,810 | 231 | 12,080 | 8,998 | 3,082 | 34.3 | |||||||||||
| Direct expenses – other(1) | 15,590 | 13,410 | 2,180 | 16.3 | 1,508 | 369 | 17,098 | 13,779 | 3,319 | 24.1 | |||||||||||
| Direct expenses – total | 25,860 | 22,177 | 3,683 | 16.6 | 3,318 | 600 | 29,178 | 22,777 | 6,401 | 28.1 | |||||||||||
| Gross profit | 9,935 | 11,078 | (1,143 | ) | (10.3 | ) | 4,288 | 1,161 | 14,223 | 12,239 | 1,984 | 16.2 | |||||||||
| Selling, general and administrative expenses | 3,161 | 3,555 | (394 | ) | (11.1 | ) | 319 | 74 | 3,480 | 3,629 | (149 | ) | (4.1 | ) | |||||||
| Amortization of intangibles | 1,321 | 704 | 617 | 87.6 | 47 | 12 | 1,368 | 716 | 652 | 91.1 | |||||||||||
| Operating income | 5,453 | 6,819 | (1,366 | ) | (20.0 | ) | 3,922 | 1,075 | 9,375 | 7,894 | 1,481 | 18.8 | |||||||||
| Interest expense, net | (6,255 | ) | (20,736 | ) | 14,481 | (69.8 | ) | (2,016 | ) | (585 | ) | (8,271 | ) | (21,321 | ) | 13,050 | (61.2 | ) | |||
| Other income | 138 | 1,529 | (1,391 | ) | (91.0 | ) | 231 | — | 369 | 1,529 | (1,160 | ) | (75.9 | ) | |||||||
| Provision for income taxes | (302 | ) | (1,103 | ) | 801 | (72.6 | ) | (116 | ) | (302 | ) | (1,219 | ) | 917 | (75.2 | ) | |||||
| Minority interest | — | — | — | — | (719 | ) | (118 | ) | (719 | ) | (118 | ) | (601 | ) | 509.3 | ||||||
| Net income (loss) | (966 | ) | (13,491 | ) | 12,525 | (92.8 | ) | 1,418 | 256 | 452 | (13,235 | ) | 13,687 | (103.4 | ) | ||||||
Reconciliation of net income (loss) to EBITDA | |||||||||||||||||||||
| Net income (loss) | (966 | ) | (13,491 | ) | 12,525 | (92.8 | ) | 1,418 | 256 | 452 | (13,235 | ) | 13,687 | (103.4 | ) | ||||||
| Interest expense, net | 6,255 | 20,736 | (14,481 | ) | (69.8 | ) | 2,016 | 585 | 8,271 | 21,321 | (13,050 | ) | (61.2 | ) | |||||||
| Provision for income taxes | 302 | 1,103 | (801 | ) | (72.6 | ) | — | 116 | 302 | 1,219 | (917 | ) | (75.2 | ) | |||||||
| Depreciation | 5,694 | 4,202 | 1,492 | 35.5 | — | — | 5,694 | 4,202 | 1,492 | 35.5 | |||||||||||
| Amortization of intangibles | 1,321 | 704 | 617 | 87.6 | 47 | 12 | 1,368 | 716 | 652 | 91.1 | |||||||||||
| EBITDA | 12,606 | 13,254 | (648 | ) | (4.9 | ) | 3,481 | 969 | 16,087 | 14,223 | 1,864 | 13.1 | |||||||||
Year Ended December 31, | Change | ||||||||||||
2006 | 2005 | $ | % | ||||||||||
| ($ in thousands) (unaudited) | |||||||||||||
| Revenue | $ | 76,062 | $ | 59,856 | $ | 16,206 | 27.1 | ||||||
| Direct expenses(1) | 54,637 | 45,076 | 9,561 | 21.2 | |||||||||
| Gross profit | 21,425 | 14,780 | 6,645 | 45.0 | |||||||||
| Selling, general and administrative expenses | 5,918 | 4,509 | 1,409 | 31.2 | |||||||||
| Amortization of intangibles(2) | 25,563 | 3,802 | 21,761 | NM | |||||||||
| Operating (loss) income | (10,056 | ) | 6,469 | (16,525 | ) | NM | |||||||
| Interest expense, net | (17,267 | ) | (10,320 | ) | (6,947 | ) | 67.3 | ||||||
| Other income (expense) | 502 | (14 | ) | 516 | NM | ||||||||
| Unrealized (loss) gain on derivative instruments | (720 | ) | 170 | (890 | ) | NM | |||||||
| Income tax benefit (expense) | 12,364 | (60 | ) | 12,424 | NM | ||||||||
| Minority interest in loss (income) of consolidated subsidiaries | 572 | 538 | 34 | 6.3 | |||||||||
| Net loss(3) | $ | (14,605 | ) | $ | (3,217 | ) | $ | (11,388 | ) | NM | |||
Reconciliation of net loss to EBITDA | |||||||||||||
| Net loss(3) | $ | (14,605 | ) | $ | (3,217 | ) | $ | (11,388 | ) | NM | |||
| Interest expense, net | 17,267 | 10,320 | 6,947 | 67.3 | |||||||||
| Income tax (expense) benefit | (12,364 | ) | 60 | (12,424 | ) | NM | |||||||
| Depreciation | 3,555 | 2,397 | 1,158 | 48.3 | |||||||||
| Amortization of intangibles(2) | 25,563 | 3,802 | 21,761 | NM | |||||||||
| EBITDA | $ | 19,416 | $ | 13,362 | $ | 6,054 | 45.3 | ||||||
Year Ended December 31, | |||||||
2006 | 2005 | ||||||
Operating Data: | |||||||
Total Revenue ($ in thousands)(1): | |||||||
| New locations | $ | 17,892 | $ | 5,616 | |||
| Comparable locations | $ | 58,170 | $ | 54,240 | |||
| Comparable locations increase | 7.2 | % | |||||
Parking Revenue ($ in thousands)(2): | |||||||
| New locations | $ | 17,751 | $ | 5,485 | |||
| Comparable locations | $ | 56,045 | $ | 52,330 | |||
| Comparable locations increase | 7.1 | % | |||||
Cars Out(3): | |||||||
| New locations | 671,521 | 213,436 | |||||
| Comparable locations | 1,415,561 | 1,453,925 | |||||
| Comparable locations (decrease) | -2.6 | % | |||||
| Average Revenue per Car Out: | |||||||
| New locations | $ | 26.43 | $ | 25.70 | |||
| Comparable locations | $ | 39.59 | $ | 35.99 | |||
| Comparable locations increase | 10.0 | % | |||||
Average Overnight Occupancy(4): | |||||||
| New locations | 6,638 | 5,768 | |||||
| Comparable locations | 15,452 | 14,925 | |||||
| Comparable locations increase | 3.5 | % | |||||
| Gross Profit Percentage: | |||||||
| New locations | 29.10 | % | 21.63 | % | |||
| Comparable locations | 27.91 | % | 25.44 | % | |||
| Locations: | |||||||
| New locations | 9 | ||||||
| Comparable locations | 21 | ||||||
2005 | 2004 | Change | |||||||
$ | $ | $ | % | ||||||
| ($ in thousands) (unaudited) | |||||||||
| Revenue | 59,856 | 51,444 | 8,412 | 16.4 | |||||
| Direct expenses(1) | 45,076 | 36,872 | 8,204 | 22.2 | |||||
| Gross profit | 14,780 | 14,572 | 208 | 1.4 | |||||
| Selling, general and administrative expenses | 4,509 | 4,670 | (161 | ) | (3.4 | ) | |||
| Amortization of intangibles | 3,802 | 2,850 | 952 | 33.4 | |||||
| Operating income | 6,469 | 7,052 | (583 | ) | (8.3 | ) | |||
| Interest expense, net | (10,320 | ) | (8,392 | ) | (1,928 | ) | 23.0 | ||
| Other expense | (14 | ) | (47 | ) | 33 | (70.2 | ) | ||
| Unrealized gain on derivative instruments | 170 | — | 170 | NM | |||||
| Income tax expense | (60 | ) | — | (60 | ) | NM | |||
| Minority interest in loss of consolidated subsidiaries | 538 | 629 | (91 | ) | (14.5 | ) | |||
| Net loss | (3,217 | ) | (758 | ) | (2,459 | ) | NM | ||
Reconciliation of net loss to EBITDA: | |||||||||
| Net loss | (3,217 | ) | (758 | ) | (2,459 | ) | NM | ||
| Interest expense, net | 10,320 | 8,392 | 1,928 | 23.0 | |||||
| Income tax expense | 60 | — | 60 | NM | |||||
| Depreciation | 2,397 | 2,164 | 233 | 10.8 | |||||
| Amortization of intangibles | 3,802 | 2,850 | 952 | 33.4 | |||||
| EBITDA | 13,362 | 12,648 | 714 | 5.6 | |||||
Liquidity and Capital Resources
Consolidated
Our primary cash settlementrequirements include normal operating expenses, debt service, maintenance capital expenditures and debt principal payments. Our primary source of cash is operating activities, although we could borrow against existing credit facilities, issue additional LLC interests or sell assets.
At March 31, 2009, we reclassified the outstanding balance drawn on the revolving credit facility at our non-operating holding company from an early contract terminationlong-term debt to current portion of long-term debt on our consolidated balance sheet due to its scheduled maturity on March 31, 2010. During the year, we were in discussions with our lenders to convert the facility to a term loan and extend the maturity date of the $66.4 million outstanding balance.
By December 2009, we had received in 2004. Total revenue growth of $8.4 million included $3.2 millionunanimous approval from the six SunPark facilities acquired in the fourth quarter.
We believe that weour operating businesses will have sufficient liquidity and capital resources to meet our future liquidity requirements, including in relation to our acquisition strategy and our dividend policy.servicing long-term debt obligations. We base our assessment of the sufficiency of our liquidity and capital resources on the following assumptions:
Typically, we have capitalized our businesses, in part, using project finance style debt. Project finance style debt is limited-recourse, floating rate, non-amortizing debt with a medium term maturity of between five and seven years, although the principal balance on the term loan debt at Atlantic Aviation is being prepaid using the excess cash generated by the business. At December 31, 2009, the average remaining maturity of the debt facilities across all of our businesses, including our proportional interest in the debt of IMTT, was approximately 4.4 years. In light of the improvement in the functioning of the credit markets generally, and the leverage ratios and interest coverage we expect each of these businesses to produce at the maturity of their respective debt facilities, we believe that we will be able to successfully refinance any amounts borrowed under our revolving credit facility.
The section below discusses the sources and uses of cash on a consolidated basis and for each of our businesses and investments. All inter-company activities such as corporate allocations, capital contributions to our businesses and distributions from our businesses have been excluded from the tables as these transactions are eliminated in consolidation. Prior period comparatives have been updated to also remove these inter-company activities.
COMMITMENTS AND CONTINGENCIES
The following tables summarize our future obligations, due by period, as of December 31, 2009, under our various contractual obligations and commitments. We had no off-balance sheet arrangement at that date or currently. The following information detailsdoes not include IMTT, which is not consolidated.
| Payments Due by Period | ||||||||||||||||||||
| Total | Less than One Year | 1 – 3 Years | 3 – 5 Years | More than 5 Years | ||||||||||||||||
| ($ In Thousands) | ||||||||||||||||||||
| Long-term debt(1) | $ | 1,212,279 | $ | 45,900 | $ | 111,878 | $ | 1,054,501 | $ | — | ||||||||||
| Interest obligations | 296,180 | 68,677 | 138,051 | 89,452 | — | |||||||||||||||
| Capital lease obligations(2) | 101 | 59 | 42 | — | — | |||||||||||||||
| Notes payable | 1,632 | 176 | 266 | 226 | 964 | |||||||||||||||
| Operating lease obligations(3) | 425,301 | 33,238 | 60,362 | 56,828 | 274,873 | |||||||||||||||
| Time charter obligations(4) | 1,386 | 973 | 413 | — | — | |||||||||||||||
| Pension benefit obligations | 23,063 | 1,980 | 4,359 | 4,666 | 12,058 | |||||||||||||||
| Post-retirement benefit obligations | 2,054 | 187 | 444 | 405 | 1,018 | |||||||||||||||
| Other | 478 | 478 | — | — | — | |||||||||||||||
| Total contractual cash obligations(5) | $ | 1,962,474 | $ | 151,668 | $ | 315,815 | $ | 1,206,078 | $ | 288,913 | ||||||||||
| (1) | The long-term debt represents the consolidated principal obligations to various lenders. The debt facilities, which are obligations of the operating businesses and have maturities between 2013 and 2014, are subject to certain covenants, the violation of which could result in acceleration of the maturity dates. |
| (2) | Capital lease obligations are for the lease of certain transportation equipment. Such equipment could be subject to repossession upon violation of the terms of the lease agreements. |
| (3) | This represents the minimum annual rentals required to be paid under non-cancelable operating leases with terms in excess of one year. |
| (4) | The Gas Company currently has a time charter arrangement for the use of two barges for transporting liquefied petroleum gas between Oahu and its neighbor islands. |
| (5) | The above table does not reflect certain long-term obligations, such as deferred taxes, for which we are unable to estimate the period in which the obligation will be incurred. |
In addition to these commitments and contingencies, we typically incur capital expenditures on a regular basis to:
See “Investing Activities” below for further discussion of capital expenditures.
We also have other contingencies, including pending threatened legal and administrative proceedings that are not reflected above as amounts at this time are not ascertainable. See “Legal Proceedings” in Part I, Item 3.
Our sources of cash to meet these obligations are as follows:
We have also incurred performance fees from time to time paid to our Manager. Our Manager has historically elected to reinvest these fees in our LLC interests (previously trust stock). While these fees do not directly affect cash flows when paid in equity, they do result in more outstanding LLC interests.
Analysis of Consolidated Historical Cash Flows from Continuing Operations
| Year Ended December 31, | Change (From 2008 to 2009) Favorable/(Unfavorable) | Change (From 2007 to 2008) Favorable/(Unfavorable) | ||||||||||||||||||||||||||
| 2009 | 2008 | 2007 | ||||||||||||||||||||||||||
| ($ In Thousands) | $ | $ | $ | $ | % | $ | % | |||||||||||||||||||||
| Cash provided by operating activities | 82,976 | 95,579 | 93,499 | (12,603 | ) | (13.2 | ) | 2,080 | 2.2 | |||||||||||||||||||
| Cash used in investing activities | (516 | ) | (56,716 | ) | (638,853 | ) | 56,200 | 99.1 | 582,137 | 91.1 | ||||||||||||||||||
| Cash (used in) provided by financing activities | (117,818 | ) | 1,698 | 570,618 | (119,516 | ) | NM | (568,920 | ) | (99.7 | ) | |||||||||||||||||
NM — Not meaningful
Operating Activities
Consolidated cash provided by operating activities mainly comprises the cash from operations of the businesses we own, as described in each of the business discussions below. The cash flow from our consolidated business’ operations is partially offset by expenses paid at the corporate level, such as base management fees paid in cash, professional fees and interest on any amounts drawn on our revolving credit facility.
The decrease in consolidated cash provided by operating activities was due primarily to:
We believe our operating activities overall provide a source of sustainable and stable cash flows over the long-term with the opportunity for future growth due to:
Investing Activities
The decrease in consolidated cash used in investing activities was primarily due to:
Distributions from IMTT are reflected in our consolidated cash provided by operating activities only up to our 50% share of IMTT’s positive earnings. Amounts in excess of this, and any distributions when IMTT records a net loss, are reflected in our consolidated cash from investing activities. For 2009, $7.0 million in equity distributions were included in cash from operations. In 2008, $1.3 million of the $28.0 million dividends received were included in cash from operating activities and $26.7 million were included in investing activities.
The primary driver of cash used in investing activities in our consolidated cash flows from operating, financinghas been acquisitions of businesses in new and investing activities forexisting segments, the periods ended December 31, 2006, 2005 and 2004. We acquired our initial businesses and investments on December 22 and December 23, 2004 using proceeds from our initial public offering and concurrent private placement. Consequently, our consolidated cash flows from operating, financing and investing activities in 2004 largely reflects the nine-day period between December 22, 2004 and December 31, 2004. Any comparisonsdispositions of our consolidated cash flows from operating, investing and financing activities for this short period in 2004 to any future periods would not be meaningful. Therefore we have included a comparison of the cash flows from operating, financing and investing activities for each of our consolidated businesses for each of the full years 2006, 2005 and 2004. We believe this is a more appropriate approach to explaining our historical financial performance.
Year Ended December 31, 2006 | Year Ended December 31, 2005 | April 13, 2004 (inception) - December 31, 2004 | |||||||||
| ($ in thousands) | |||||||||||
| Cash provided by (used in) operations | $ | 46,365 | $ | 43,547 | $ | (4,045 | ) | ||||
| Cash used in investing activities | $ | (686,196 | ) | $ | (201,950 | ) | $ | (467,477 | ) | ||
| Cash provided by financing activities | $ | 562,328 | $ | 133,847 | $ | 611,765 | |||||
Financing Activities
The increase in 2006.consolidated cash used in financing activities was primarily due to:
The primary drivers of cash flow provided by financing activities totaled $562.3 million 2006. Cashare equity offerings, debt financing of acquisitions and capital expenditures, the subsequent refinancing of our businesses and the repayment of the outstanding principal balance on maturing debt. A smaller portion of cash provided by financing activities relates to principal payments on capital leases.
For 2010, we expect to apply all excess cash flows from Atlantic Aviation to prepay the debt principal under the amended terms of the credit facility. Actual prepayment amounts through the maturity of the facility will depend on the operating performance of the business.
Our businesses are capitalized with a mix of equity and project-financing style long-term debt. We believe we can prudently maintain relatively high levels of leverage due to the generally sustainable and stable
long-term cash flows our businesses have provided in the past and we expect to continue in the future as discussed above. Our long-term debt is non-amortizing and we expect to be able to refinance the outstanding balances at maturity, except at Atlantic Aviation, where all excess cash flow from financing activities increased significantly over 2005. We received proceedsthe business is used to prepay the outstanding principal balance of $305.3 millionthe term loan, and the last two years before maturity at District Energy. Most of our businesses’ debt is term debt, while some of our businesses also maintain capital expenditure and/or working capital facilities.
MIC Inc. Revolving Credit Facility
Effective April 14, 2009, we elected to reduce the available principal on its revolving credit facility from issuance of shares of trust stock. Our gas production and distribution business borrowed $160.0$300.0 million to finance$97.0 million and on December 31, 2009, further reduced the equity component of the TGC acquisition. Our airport services business borrowed an additional $180.0 million under its facilityavailable principal to finance the Trajen acquisition. The airport parking business refinanced its debt facilities paying out $185.0 million of existing debt and receiving $195.0 million from the new facility.
On February 20, 2008, we drew $56.0 million on this facility, part of which was used to fund the acquisition of SevenBar FBOs which was completed in the first quarter of 2008, and part of which was used for other projects. On July 31, 2008, MIC Inc. drew an appropriate time.additional $13.0 million on this facility to fund the acquisition of SkyPark, which was completed in the third quarter of 2008. On February 25, 2009, we repaid $2.6 million of the outstanding balance on the revolving credit facility.
At March 31, 2009, we reclassified the outstanding balance drawn on the revolving credit facility at the non-operating holding company from long-term debt to current portion of long-term debt on our consolidated balance sheet due to its scheduled maturity on March 31, 2010. During 2006,the year, we expandedwere in discussions with our lenders to convert the facility to increasea term loan and extend the maturity date of the $66.4 million outstanding balance.
By December 2009, we had received unanimous approval from our lenders to extend the term of the facility. However, using the net cash proceeds it received from the sale of the 49.99% non-controlling interest in District Energy, and cash on hand, we paid off the outstanding principal balance on December 28, 2009 and avoided the substantial costs that would have been incurred had the terms of the facility been amended. Shortly thereafter we elected to reduce the amount available on the revolving portioncredit facility from $250.0$97.0 million to $300.0$20.0 million andthrough to provide for $180.0 millionthe maturity of term loans to fund specific acquisitions. In connection with the increase, we agreed to higher interest margins and a more restrictive leverage ratio while the term loans remained outstanding. We borrowed a total of $454.0 million under this facility in 2006 and repaid the facility in full withat March 31, 2010. We expect to retain excess cash generated by the proceeds fromconsolidated businesses over the sales of our interests in SEW and MCG and most of the proceeds of our 2006 equity offering.
The borrower under the facility is MIC Inc., a direct subsidiary of the company,Company, and the obligations under the facility are guaranteed by the companyCompany and secured by a pledge of the equity of all current and future direct subsidiaries of MIC Inc. and the company.Company. The terms and conditions for the revolving facility include events of default, and representations and warranties and covenants that are generally customary for a facility of this type. In addition, the revolving facility includes a restriction on cross guarantees and an event of default should the Manager or another affiliatemember of the Macquarie Bank Limited ceasesGroup cease to act as manager.
The following is a summary of the material terms of the facility:
| $ | ||||
| Termination | March 31, | 2010 | ||
| Interest and principal | Interest only during the term of the loan | |||
| Repayment of principal at termination, upon voluntary prepayment, or upon an event requiring mandatory | prepayment | |||
| Eurodollar | LIBOR plus |
| Base | Base rate plus | ||||
| Annual commitment | |||||
| Financial MIC Inc. and the | • Ratio of Debt to Consolidated Adjusted Cash from Operations < 5.6x (at December 31, 2009: 0.00x) | ||||
• Ratio of Consolidated Adjusted Cash from Operations to Interest Expense | > 2.0x (at December 31, 2009: 9.49x) | ||||
• Minimum EBITDA (as defined in the facility) > $100.0 million (at December 31, | 2009: $165.4 million) |
Year Ended December 31, 2006 | Year Ended December 31, 2005 | Change | ||||||||
$ | % | |||||||||
| ($ in thousands) | ||||||||||
| Cash provided by operations | $ | 35,853 | $ | 21,783 | 14,070 | 64.6 | ||||
| Cash used in investing activities | $ | (353,620 | ) | $ | (112,466 | ) | 241,154 | NM | ||
| Cash provided by financing activities | $ | 318,102 | $ | 93,121 | 224,981 | NM | ||||
See below for further description of the cash flows related to our businesses.
Energy-Related Businesses
IMTT
The following analysis represents 100% of the cash flows of IMTT, which we believe is the most appropriate and meaningful
| Year Ended December 31, | Change (From 2008 to 2009) Favorable/(Unfavorable) | Change (From 2007 to 2008) Favorable/(Unfavorable) | ||||||||||||||||||||||||||
| 2009 | 2008 | 2007 | ||||||||||||||||||||||||||
| ($ In Thousands) | $ | $ | $ | $ | % | $ | % | |||||||||||||||||||||
| Cash provided by operating activities | 133,382 | 94,087 | 91,431 | 39,295 | 41.8 | 2,656 | 2.9 | |||||||||||||||||||||
| Cash used in investing activities | (141,216 | ) | (166,640 | ) | (264,457 | ) | 25,424 | 15.3 | 97,817 | 37.0 | ||||||||||||||||||
| Cash provided by financing activities | 6,262 | 71,815 | 142,228 | (65,553 | ) | (91.3 | ) | (70,413 | ) | (49.5 | ) | |||||||||||||||||
Operating Activities
Cash provided by operating activities at IMTT is generated primarily from storage rentals and ancillary services that are billed monthly and paid on various terms. Cash used in 2006 comparedoperating activities is mainly for payroll costs, maintenance and repair of fixed assets, utilities and professional services, interest payments and payments to 2005;
The increase in 2008 was primarily due to higher debt levels;
Investing Activities
Cash used in investing activities relates primarily to capital expenditures includeddiscussed below. Capital expenditures decreased from $221.7 million in 2008 to $137.0 million in 2009, reflecting a reduction in growth capital expenditures as projects have been completed. Maintenance capital expenditures also decreased resulting from reduced levels of tank inspections and repairs and remediation work at the Bayonne facility. However, cash used in investing activities were $7.1in 2008 was offset by $55.5 million in 2006 compared to $4.0 million in 2005, and included $3.2 for maintenance and $3.9 for expansion;
Energy-Related Businesses: IMTT – (continued)
Maintenance Capital Expenditure
IMTT incurs maintenance capital expenditures to prolong the useful lives and increase the service capacity of existing revenue producing assets. Maintenance capital expenditures include the refurbishment of storage tanks, piping, dock facilities, and environmental capital expenditures, principally in relation to improvements in containment measures and remediation.
During 2009, IMTT spent $40.0 million on maintenance capital expenditures, including $36.1 million principally in relation to tank refurbishments and repairs to docks and other infrastructure and $3.9 million on environmental capital expenditures, principally in relation to improvements in containment measures and remediation.
In 2010, IMTT expects to spend a total of $55.0 million to $65.0 million on maintenance capital contributionexpenditures. The increase in maintenance capital expenditure from MIC Inc; and
Year Ended December 31, 2005 | Year Ended December 31, 2004 | Change | |||||||||
$ | % | ||||||||||
| ($ in thousands) | |||||||||||
| Cash provided by operations | $ | 21,783 | $ | 9,803 | 11,980 | 122.2 | |||||
| Cash used in investing activities | $ | (112,466 | ) | $ | (229,839 | ) | 117,373 | (51.1 | ) | ||
| Cash provided by financing activities | $ | 93,121 | $ | 228,357 | 135,236 | 59.2 | |||||
Year Ended December 31, 2006 | Year Ended December 31, 2005 | Change | |||||||||||
$ | % | ||||||||||||
| ($ in thousands) | |||||||||||||
| Cash provided by operations | $ | 14,534 | $ | 19,296 | (4,762 | ) | (24.7 | ) | |||||
| Cash used in investing activities | $ | (265,007 | ) | $ | (6,923 | ) | (258,084 | ) | NM | ||||
| Cash provided by (used in) financing activities | $ | 251,149 | $ | (5,535 | ) | 256,684 | NM | ||||||
Year Ended December 31, 2006 | Year Ended December 31, 2005 | Change | |||||||||||
$ | % | ||||||||||||
| ($ in thousands) | |||||||||||||
| Cash provided by operations | $ | 9,074 | $ | 12,106 | (3,032 | ) | (25.0 | ) | |||||
| Cash used in investing activities | $ | (1,618 | ) | $ | (332 | ) | (1,286 | ) | NM | ||||
| Cash used in financing activities | $ | (8,094 | ) | $ | (15,235 | ) | 7,141 | 46.9 | |||||
Growth Capital Expenditure
During 2009, IMTT spent $82.6 million on growth capital expenditures for new customer connections and the 2005 goodwill adjustment of $694,000 related to our share of a settlement providingprojects, including $43.9 million for the early release of escrow established with the Aladdin bankruptcy;
Year Ended December 31, 2006 | Year Ended December 31, 2005 | Change | |||||||||
$ | % | ||||||||||
| ($ in thousands) | |||||||||||
| Cash provided by operations | $ | 7,473 | $ | 4,893 | 2,580 | 52.7 | |||||
| Cash used in investing activities | $ | (4,202 | ) | $ | (75,688 | ) | 71,486 | (94.4 | ) | ||
| Cash (used in) provided by financing activities | $ | (529 | ) | $ | 76,720 | (77,249 | ) | (100.7 | ) | ||
Year Ended December 31, 2006 | Year Ended December 31, 2005 | Year Ended December 31, 2004 | ||||||||
| ($ in thousands) | ||||||||||
| Cash provided by operations | $ | 66,791 | $ | 51,706 | $ | 40,713 | ||||
| Cash used in investing activities | $ | (90,540 | ) | $ | (37,090 | ) | $ | (51,033 | ) | |
| Cash provided by (used in) financing activities | $ | 57,526 | $ | (13,460 | ) | $ | 10,174 | |||
Since our investment in IMTT, during 2006the business has undertaken or committed to a total of approximately $534.9 million in expansion projects and acquired the Joliet facility for $18.5 million. Through December 31, 2009, these projects added and/or refurbished approximately 6.1 million barrels of storage capacity and are contributing $49.6 million to gross profit and EBITDA on an annualized basis.
In addition, IMTT currently has ongoing growth projects for the construction or refurbishment of 2.2 million barrels of new storage capacity comprised primarily of 1.8 million barrels at IMTT’s St. Rose facility, of which 1.1 million barrels were on line at December 31, 2009 with the remainder expected to be fully placed into service by early 2010. Other smaller growth projects are also being pursued. On a combined basis, the projects under construction are expected to have a total cost of $129.4 million and will contribute approximately $19.2 million to gross profit and EBITDA on an annualized basis. Of the $129.4 million of IMTT’s current growth projects, $54.8 million remained to be spent as of December 31, 2009. IMTT expects to fund these committed projects with its existing credit facilities and cash generated from operations. Contracts with a term of between 4 and 12 years have been signed with customers for substantially all of the tanks being constructed/converted in Louisiana and New Jersey.
IMTT continues to review numerous additional attractive growth opportunities. IMTT anticipates funding new growth capital expenditures with a combination of its cash flow from operating activities, existing and additional credit facilities.
It is anticipated that the existing growth capital expenditure commitments will be funded from a combination of IMTT’s existing and new debt facilities and cash from operations. In 2010, IMTT is seeking to raise additional debt financing to fund its growth capital expenditure program.
Financing Activities
At December 31, 2009, the outstanding balance on IMTT’s debt facilities consisted of $250.9 million in revolving credit facilities, $251.3 million in bonds and $130.0 million in term loan facilities, including shareholder loans. The weighted average interest rate of the outstanding debt facilities including any interest rate swaps and fees associated with outstanding letters of credit at December 31, 2009 is 4.8%. During 2009, IMTT paid approximately $29.0 million, net of capitalized interest, in interest related to its debt facilities.
Energy-Related Businesses: IMTT – (continued)
Cash flows from financing activities decreased from 2008 to 2009 primarily due to decreases in debt draw downs on the revolving credit facility offset by dividends paidthe Regions term loan used to usfund growth capital expenditures, and to the existing shareholders of IMTT (netby lower dividend payments and repayment of shareholder loans as discussed below) and repaymentsin 2009.
The decrease in cash flows from financing activities from 2007 to 2008 was primarily due to the issuance of borrowings. In 2005, expansion capital expendituresall of the GO Zone bonds during July 2007 while $55.5 million of the proceeds raised were lower than in prior years and the excess of cash provided by operations over capital expenditures was used to reducenot utilized until 2008 reducing debt and to make distributions to shareholders of IMTT at that time and advances to their affiliates.
The following tables summarize the key terms of IMTT’s senior debt facilities as atof December 31, 2006. All2009.
On June 7, 2007, IMTT entered into a Revolving Credit Agreement with Suntrust Bank, Citibank N.A., Regions Bank, Rabobank Nederland, Branch Banking & Trust Co., DNB NOR Bank ASA, Bank of these senior debt facilities rank equallyAmerica N.A., BNP Paribas, Bank of Montreal, The Royal Bank of Scotland PLC, Mizuho Corporate Bank Ltd. and areeight other banks establishing a $600.0 million U.S. dollar denominated revolving credit facility and a $25.0 million equivalent Canadian dollar revolving credit facility. The Agreement also allows for an increase in the U.S. dollar denominated revolving credit facility of up to $300.0 million on the same terms at the election of IMTT. No commitments have been sought from lenders to provide this increase at this time. The facility is guaranteed by IMTT’s key operating subsidiaries.
The revolving credit facilities have been used primarily to fund IMTT’s growth capital expenditures in the U.S. and Canada. The terms of the IMTT’s U.S. dollar and Canadian dollar denominated revolving credit facilities are summarized in the table below.
| Facility Term | USD Revolving Credit Facility | |||||
| CAD Revolving Credit Facility | ||||||
| Amount | $ | $ | ||||
| Amount utilized for Letters of Credit at December 31, 2009 | $264.9 million | |||||
| Amount undrawn at December 31, 2009 | $105.0 million | $4.2 million | ||||
| Uncommitted Expansion Amounts | ||||||
| — | ||||||
| June, 2012 | ||||||
| June, 2012 | ||||||
| Amortization | Revolving. Payable at | |||||
| maturity | ||||||
| Interest Rate | <2.00 – 0.55% 2.00>2.50 – 0.70% 2.50>3.00 – 0.85% 3.00>3.75 – 1.00% 3.75>4.00 – 1.25% 4.00> – 1.50% | Floating at Canadian LIBOR <2.00 – 0.55% 2.00>2.50 – 0.70% 2.50>3.00 – 0.85% 3.00>3.75 – 1.00% 3.75>4.00 – 1.25% 4.00> – 1.50% |
Energy-Related Businesses: IMTT – (continued)
| Facility Term | ||||||
| Commitment Fees | <2.00 – 0.125% 2.00>2.50 – 0.15% 2.50>3.00 – 0.175% 3.00>3.75 – 0.20% 3.75>4.00 – 0.25% 4.00> – 0.25% | |||||
| A percentage of undrawn committed amounts based on the ratio of Debt | ||||||
| to EBITDA of IMTT’s operating subsidiaries as follows: <2.00 – 0.125% 2.00>2.50 – 0.15% 2.50>3.00 – 0.175% 3.00>3.75 – 0.20% 3.75>4.00 – 0.25% 4.00> – 0.25% | ||||||
| Security | Unsecured | Unsecured |
| Financial Covenants | ||||||
| Debt to EBITDA Ratio: (at December 31, 2009: 3.82x) EBITDA to Interest Ratio: | Debt to EBITDA Ratio: Max 4.75x (at December 31, 2009: 3.82x) EBITDA to Interest Ratio: | |||||
| Min 3.00x (at December 31, 2009: 6.83x) | ||||||
| Restrictions on | None, provided no default as a result of | None, provided no default as a result of payment. |
Of the $495.0 million outstanding balance against the U.S. dollar denominated revolving credit facility, IMTT had drawn $230.1 million in cash and issued $264.9 million in letters of credit backing tax-exempt GO Zone bonds and NJEDA bonds on issue by IMTT and commercial activities.
To partially hedge the interest rate risk associated with IMTT’s current floating rate borrowings under the U.S. dollar denominated revolving credit agreement, IMTT entered into a 10 year fixed to quarterly LIBOR swap, maturing in March 2017, with a notional amount $115.0 million as of December 31, 2009 increasing to $200.0 million by December 31, 2012, at a fixed rate of 5.507%.
The key terms of the GO Zone bonds and the NJEDA bonds on issue by IMTT are summarized below.
| Facility Term | New Jersey Economic Development Authority Dock Facility Revenue Refund Bonds | New Jersey Economic Development Authority Variable Rate Demand Revenue Refunding Bond | ||
| Amount Outstanding as of December 31, 2009 | $30.0 million | $6.3 million | ||
| Undrawn Amount | — | — | ||
| Maturity | December, 2027 | December, 2021 | ||
| Amortization | Payable at maturity | Payable at maturity | ||
| Interest Rate | Floating at tax exempt bond daily tender rates | Floating at tax exempt bond daily tender rates | ||
| Make-whole on Early Repayment | None | None | ||
| Debt Service Reserves Required | None | None | ||
| Security | Unsecured (required to be supported at all times by bank letter of credit issued under the revolving credit facility) | Unsecured (required to be supported at all times by bank letter of credit issued under the revolving credit facility) |
Energy-Related Businesses: IMTT – (continued)
| Facility Term | New Jersey Economic Development Authority Dock Facility Revenue Refund Bonds | New Jersey Economic Development Authority Variable Rate Demand Revenue Refunding Bond | ||||
| Financial Covenants (applicable to IMTT’s key operating subsidiaries on a combined basis) | None | None | ||||
| Restrictions on Payments of Dividends | None, provided no default as a result of payment | None, provided no default as a result of payment | ||||
| Interest Rate Hedging | Hedged from October, 2007 through November, 2012 with $30.0 million 3.41% fixed vs. 67% of LIBOR interest rate swap | Hedged |
The key terms of the GO Zone Bonds issued are summarized in the table below.
| Facility Term | ||||||
| Amount Outstanding as of December 31, | $ | |||||
| Undrawn Amount | ||||||
| Maturity | ||||||
| July, 2043 | ||||||
| Amortization | ||||||
| maturity | ||||||
| Interest Rate | Floating at | |||||
| None | ||||||
| Debt Service Reserves Required | ||||||
| None | ||||||
| Security | ||||||
| Financial Covenants (applicable to IMTT’s key operating subsidiaries on a combined basis) | ||||||
| None | ||||||
| Restrictions on | None, provided no default as a result of payment |
For federal income tax purposes, interest on the GO Zone Bonds is excluded from gross income and is not an item of tax preference for purposes of federal alternative minimum tax imposed on individuals and corporations that are investors in the Go Zone Bonds; however, for purposes of computing the federal alternative minimum tax imposed on certain corporations, such interest is taken into account in determining adjusted current earnings. As a consequence of this and the credit support provided by the letters of credit issued under the U.S dollar denominated revolving credit facility, the floating interest rate applicable to similar bonds has historically averaged approximately 67% of LIBOR. Interest on the GO Zone Bonds is deductible to IMTT as incurred except to the extent capitalized and amortized as part of project costs as required, for federal income tax purposes.
To hedge the interest rate risk associated with IMTT’s GO Zone Bond borrowings, IMTT has entered into a 10 year fixed to monthly 67% of LIBOR swap, maturing in June 2017, with a notional amount of $215.0 million as of December 31, 2009, at a fixed rate of 3.662%.
On August 28, 2009, IMTT entered into a loan agreement with Regions Bank, as Administrative Agent, to provide unsecured term loan financing of $30.0 million. IMTT drew down $30.0 million on the same day and applied the funds to repay its current U.S. dollar denominated revolving credit facility.
Energy-Related Businesses: IMTT – (continued)
| Regions Term Loan Facility | ||||||
| Amount Outstanding as of December 31, 2009 | $30.0 million | |||||
| Undrawn Amount | — | |||||
| Maturity | June, 2012 | |||||
| Amortization | Payable at maturity | |||||
| Interest Rate | Floating at LIBOR plus a margin based on the ratio of Debt to EBITDA of IMTT’s operating subsidiaries as follows: <2.00 – 3.00% 2.00>2.50 – 3.50% 2.50>3.00 – 3.75% 3.00>3.75 – 4.00% 3.75>4.00 – 4.25% 4.00> – 5.00% | |||||
| Subordination Rate | 10.00% per annum applied in the event that (i) any other indebtedness is secured by the assets or equity and (ii) Regions term loan is not pari passu with such indebtedness | |||||
| Security | Unsecured | |||||
| Financial Covenants | Debt to EBITDA Ratio: Max 4.75x (at December 31, 2009: 3.82x) EBITDA to Interest Ratio: Min 3.00x (at December 31, 2009: 6.83x) | |||||
| Restrictions on Payments of Dividends | None | |||||
| Interest Rate Hedging |
As discussed above, IMTT intends to seek to raise additional U.S dollar denominated debt facilities at the operating company level in 2010 to fund IMTT’s growth capital expenditure program. Due to current financial market conditions, it is anticipated that the interest rate margins payable on new debt facilities raised will be in excess of the margins payable on the existing U.S dollar denominated revolving credit facility.
In addition to the senior debt facilities discussed above, subsidiaries of IMTT Holdings IncInc. that are the parent entities of IMTT’s key operating subsidiaries are the borrowers and guarantors under a debt facility with the following key terms:
| Term Loan Facility | ||
| Amount Outstanding as of December 31, | $ | |
| Undrawn Amount | — | |
| December, 2012 | ||
| Amortization | $13.0 million | |
| Interest Rate | Floating at LIBOR | |
| None. | ||
| Debt Service Reserves Required | None. | |
| Security | Unsecured. |
| Guarantees |
Energy-Related Businesses: IMTT – (continued)
| Term Loan Facility | ||
| Financial Covenants | None. | |
| Restrictions on | None. | |
| Interest Rate Hedging | Fully hedged with |
In addition to the terms of the shareholders’ agreement between ourselves and the otherdebt facilities discussed above, IMTT Holdings Inc. received loans from its shareholders in IMTT, all shareholders in IMTT other than MIC Inc. are requiredfrom 2006 to loan all dividends received by them (excluding the $100.0 million dividend paid to prior existing shareholders at the closing of our investment in IMTT), net of tax payable in relation to such dividends, through the quarter ending December 31, 2007 back to IMTT Holdings Inc.2008. The shareholder loan willloans have at a fixed interest rate of 5.5% and will be repaid over 15 years by IMTT Holdings Inc. with equal quarterly amortization commencingthat commenced March 31, 2008. Shareholder loans of $11.2$34.5 million were outstanding as atof December 31, 2006.2009.
The Gas Company
| Year Ended December 31, | Change (From 2008 to 2009) Favorable/(Unfavorable) | Change (From 2007 to 2008) Favorable/(Unfavorable | ||||||||||||||||||||||||||
| 2009 | 2008 | 2007 | ||||||||||||||||||||||||||
| ($ In Thousands) | $ | $ | $ | $ | % | $ | % | |||||||||||||||||||||
| Cash provided by operating activities | 25,560 | 27,078 | 16,005 | (1,518 | ) | (5.6 | ) | 11,073 | 69.2 | |||||||||||||||||||
| Cash used in investing activities | (7,105 | ) | (9,424 | ) | (7,870 | ) | 2,319 | 24.6 | (1,554 | ) | (19.7 | ) | ||||||||||||||||
| Cash provided by financing activities | 10,000 | 2,000 | 5,000 | 8,000 | NM | (3,000 | ) | (60.0 | ) | |||||||||||||||||||
NM — Not meaningful
Operating Activities
The main driver for cash provided by operating activities is customer receipts. These are offset in part by the timing of payments for fuel, materials, pipeline repairs, vendor services and supplies, payroll and benefit costs, revenue-based taxes and payment of administrative costs. Customers are generally billed monthly and make payments on account. Vendors and suppliers generally bill the business when services are rendered or when products are shipped.
The decrease from 2008 to 2009 was primarily due to higher cash pension payments and the exhaustion in 2008 of the escrow account established at acquisition partially offset by improved operating results. The increase from 2007 to 2008 was primarily due to higher operating income driven by higher margins.
Investing Activities
Cash used in investing activities primarily comprises capital expenditures. Capital Expenditures
Maintenance Capital Expenditure
Maintenance capital expenditures include replacement of pipeline sections, improvements to the business’ transmission system and SNG plant, improvements to buildings and other property and the purchases of vehicles and equipment.
Growth Capital Expenditure
Growth capital expenditures include the purchases of meters, regulators and propane tanks for new customers, the cost of installing pipelines for new residential and commercial construction and the costs of new projects.
Energy-Related Businesses: The Gas Company – (continued)
The following table sets forth information about capital expenditures in The Gas Company:
| Maintenance | Growth | |||||||
| 2007 | $ | 4.7 million | $ | 4.0 million | ||||
| 2008 | $ | 5.8 million | $ | 3.9 million | ||||
| 2009 | $ | 3.3 million | $ | 4.1 million | ||||
| 2010 projected | $ | 5.5 million | $ | 6.5 million | ||||
| Commitments at December 31, 2009 | $ | 1.0 million | $ | 439,000 | ||||
The business expects to spend approximately $3.8 million, or $200,000 per FBO, per year on maintenancefund its total 2010 capital expenditure at Atlantic Aviation’s existing FBO’s. At our newly acquired Trajen FBO’s we expect to spend approximately $3.3 million or $140,000 per FBO, per year on maintenance capital expenditure. The amounts will be spent on items such as repainting, replacing equipment as necessary and any ongoing environmental or required regulatory expenditure, such as installing safety equipment. This expenditure is fundedexpenditures primarily from cash flow from operations.
The change in capital expenditure into subsequent periods. from 2008 to 2009 was primarily due to:
The expected level of future maintenancechange in capital expenditure from 2007 to 2008 was primarily due to:
Commitments at December 31, 2009 include renewal work on pipelines, acquisition of tanks and other equipment for 2010 projects as well as a paving project at the Kamakee facility.
Financing Activities
At December 31, 2009, the outstanding balance on the business’ debt facilities consisted of $160.0 million in term loan facility borrowings and $19.0 million in capital expenditure facility borrowings. The weighted average interest rate of the outstanding debt facilities including any interest rate swaps at December 31, 2009 is 4.6%. For the year, the business paid approximately $8.5 million in interest expense related to its debt facilities.
The Gas Company has interest rate swaps hedging 100% of the interest rate exposure under the two $80.0 million term loan facilities that effectively fix the interest rate at 4.8375% (excluding the margin).
The Gas Company also has an uncommitted unsecured short-term borrowing facility of $7.5 million that was renewed during the second quarter of 2009. This credit line bears interest at the lending bank’s quoted rate or prime rate. The facility is available for working capital needs. No amounts were outstanding as of December 31, 2009.
The main drivers for cash from financing activities are debt financings for capital expenditures and the repayment of outstanding credit facilities.
The change from 2008 to 2009 was due primarily to the timing of borrowings to fund capital expenditures.
The change from 2007 to 2008 was primarily due to:
Energy-Related Businesses: The Gas Company – (continued)
The facilities include events of default, representations and warranties and other covenants that are customary for facilities of this type. A change of control will occur if the Macquarie Group, or any fund or entity managed by the Macquarie Group, fails to control majority of the respective borrowers. Material terms of the credit facilities are summarized below:
| Holding Company Debt | Operating Company Debt | |||||
| Borrowers | HGC | The Gas Company, LLC | ||||
| Facilities | $80.0 million Term Loan | $80.0 million Term Loan | $20.0 million Revolver ($19.0 million drawn at December 31, 2009) | |||
| Collateral | First priority security interest on HGC’s assets and equity interests | First priority security interest on The Gas Company’s assets and equity interests | ||||
| Maturity | June, 2013 | June, 2013 | June, 2013 | |||
| Amortization | Payable at maturity | Payable at maturity | Payable at maturity for utility capital expenditures | |||
| Interest Rate: Years 1 – 5 | LIBOR plus 0.60% | LIBOR plus 0.40% | LIBOR plus 0.40% | |||
| Commitment Fees: Years 1 – 5 | — | — | 0.14% on undrawn portion | |||
| Interest Rate: Years 6 – 7 | LIBOR plus 0.70% | LIBOR plus 0.50% | LIBOR plus 0.50% | |||
| Commitment Fees: Years 6 – 7 | — | — | 0.18% on undrawn portion | |||
| Distributions Lock-Up Test | — | 12 mo. look-forward and 12 mo. look-backward adjusted EBITDA/interest <3.5x (at December 31, 2009: 7.9x and 7.7x, respectively) | — | |||
| Mandatory Prepayments | — | 12 mo. look-forward and 12 mo. look-backward adjusted EBITDA/interest <3.5x for 3 consecutive quarters | — | |||
| Events of Default Financial Triggers | — | 12 mo. look-backward adjusted EBITDA/interest <2.5x | 12 mo. look-backward adjusted EBITDA/ interest <2.5x | |||
As part of the regulatory approval process of our acquisition of The Gas Company, we agreed to 14 regulatory conditions from the HPUC that address a variety of matters. The more significant conditions include:
At December 31, 2009, the consolidated debt to total capital ratio was 63.2%.
Energy-Related Businesses – (continued)
District Energy
| Year Ended December 31, | Change (From 2008 to 2009) Favorable/(Unfavorable) | Change (From 2007 to 2008) Favorable/(Unfavorable) | ||||||||||||||||||||||||||
| 2009 | 2008 | 2007 | ||||||||||||||||||||||||||
| ($ In Thousands) | $ | $ | $ | $ | % | $ | % | |||||||||||||||||||||
| Cash provided by operating activities | 14,448 | 17,766 | 14,085 | (3,318 | ) | (18.7 | ) | 3,681 | 26.1 | |||||||||||||||||||
| Cash used in investing activities | (12,095 | ) | (5,378 | ) | (9,421 | ) | (6,717 | ) | (124.9 | ) | 4,043 | 42.9 | ||||||||||||||||
| Cash provided by financing activities | 17,917 | 986 | 11,637 | 16,931 | NM | (10,651 | ) | (91.5 | ) | |||||||||||||||||||
NM — Not meaningful
Operating Activities
Cash provided by operating activities is primarily driven by customer receipts for services provided and for leased equipment (including non-revenue lease principal), the timing of payments for electricity and vendor services or supplies and the payment of payroll and benefit costs. The decline in cash provided by operating activities was primarily due to new customer reimbursements in 2008 for costs to connect to the business’ system, the timing of payments to vendors in 2009 compared to 2008 and a one-time capacity paydown from a customer in 2008. These items are also primarily responsible for the increase in cash provided by operating activities from 2007 to 2008. Excluding these payments, the cash contribution from ongoing operations was relatively flat period over period.
As provided in the longer term primarily reflectsagreement between MIC and John Hancock, the need for increased environmental expenditure going forward bothowners of the non-controlling interest of District Energy (collectively, the “members”), all “available cash” will be distributed pro rata to remediate existing sitesthe members on a quarterly basis. “Available cash” is calculated as cash from operating activities plus cash from investing activities (excluding debt funded capital expenditures, and acquisitions net of cash) plus net debt proceeds minus distributions paid to upgrade waste water treatment and spill containment infrastructureminority shareholders of the Nevada district energy business. The distribution of available cash may be reduced to comply with existing,any contractual or legal limitations, including restrictions on distributions contained in the business’ credit facility, and currently foreseeable changes to environmental regulations. Future maintenanceprovide for reserves for working capital expenditure is expected to berequirements.
Investing Activities
Cash used in investing activities mainly comprises capital expenditures, which are generally funded from IMTT’s cash flow from operations.
Maintenance Capital Expenditure
The business expects to spend approximatelyup to $1.0 million per year on capital expenditures relating to the replacement of parts, system reliability, customer service improvements and minor system modifications. Since 2004, minor system modifications have been made that increased system capacity by approximately 3,000 tons. Maintenance capital expenditures for the next year will be funded from available debt facilities.
Growth Capital Expenditure
The following table summarizes growth capital expenditures committed by District Energy as well as the gross profit and EBITDA expected to be generated by those expenditures. Of the $27.7 million total, approximately $24.1 million, or 87%, has been spent as of December 31, 2009.
Energy-Related Businesses: District Energy – (continued)
| Capital Expenditure Cost ($ Millions) | Gross Profit/ EBITDA ($ Millions)(1) | Expected Date for Gross Profit/ EBITDA | ||||||||||
| Chicago Plant and Distribution System Expansion | 7.7 | |||||||||||
| New Chicago Customer Connections and Minor System Modifications | 6.6 | |||||||||||
| 14.3 | 4.9 | 2007 – 2012 | ||||||||||
| Chicago Plant Renovation and Expansion | 10.7 | 1.3 | 2009 – 2011 | |||||||||
| Las Vegas System Expansion | 2.7 | 0.3 | 2010 | |||||||||
| Total | 27.7 | 6.5 | ||||||||||
| (1) | Represents projected increases in annualized EBITDA in the first year following completion of the project. |
New customers will begin service between 2007 and 2009. We have identifiedtypically reimburse the likely purchasersbusiness for a substantial portion of the remaining saleable capacity and expectexpenditures related to have contracts signed by the end of 2007.
The business expects to fund the capital expenditureexpenditures for system expansion and interconnection by drawing on available debt facilities. The following table sets forth information about capital expenditures in District Energy:
| Maintenance | Growth | |||||||
| 2007 | $ | 906,000 | $ | 8.5 million | ||||
| 2008 | $ | 987,000 | $ | 4.4 million | ||||
| 2009 | $ | 875,000 | $ | 11.2 million | ||||
| 2010 projected | $ | 1.0 million | $ | 4.1 million | ||||
| Commitments at December 31, 2009 | $ | 257,000 | $ | 2.9 million | ||||
Financing Activities
At December 31, 2009, the outstanding balance on the business’ debt facilities consisted of $170.0 million in long-term loan facilities. The weighted average interest rate of the outstanding debt facilities including any interest rate swaps and fees associated with outstanding letters of credit at December 31, 2009 is 5.3%. For the year ended December 31, 2009, the business paid approximately $9.5 million in interest expense related to its debt facilities.
The increase in cash provided by financing activities is primarily due to $18.5 million of borrowings on the business’ credit facility in 2009 to finance growth capital expenditures.
The change from 2007 to 2008 was primarily due to the 2007 refinancing in which $150.0 million of new long-term borrowing was used to repay outstanding senior notes of $120.0 million and an $11.6 million revolver facility ($9.0 million of which was drawn in 2007), partially offset by a make-whole payment of $14.7 million.
Energy-Related Businesses: District Energy – (continued)
Material terms of the facility are presented below:
| Borrower | Macquarie District Energy LLC, or MDE | |
| Facilities | • $150.0 million term loan facility (fully drawn at December 31, 2009) | |
• $20.0 million capital expenditure loan facility (fully drawn at December 31, 2009) | ||
• $18.5 million revolving loan facility ($7.1 million utilized at December 31, 2009 for letters of credit) | ||
| Amortization | Payable at maturity | |
| Interest type | Floating | |
| Interest rate and fees | • Interest rate: | |
• LIBOR plus 1.175% or | ||
• Base Rate (for capital expenditure loan and revolving loan facilities only): 0.5% above the greater of the prime rate or the federal funds rate | ||
• Commitment fee: 0.35% on the undrawn portion. | ||
| Maturity | September, 2014; September, 2012 for the revolving loan facility | |
| Mandatory prepayment | • With net proceeds that exceed $1.0 million from the sale of assets not used for replacement assets; | |
• With insurance proceeds that exceed $1.0 million not used to repair, restore or replace assets; | ||
• In the event of a change of control; | ||
• In years 6 and 7, with 100% of excess cash flow applied to repay the term loan and capital expenditure loan facilities; | ||
• With net proceeds from equity and certain debt issuances; and | ||
• With net proceeds that exceed $1.0 million in a fiscal year from contract terminations that are not reinvested. | ||
| Distribution covenant | Distributions permitted if the following conditions are met: | |
• Backward interest coverage ratio greater than 1.5x (at December 31, 2009: 2.8x); | ||
• Leverage ratio (funds from operations to net debt) for the previous 12 months equal to or greater than 6.0% (at December 31, 2009: 8.6%); | ||
• No termination, non-renewal or reduction in payment terms under the service agreement with the Planet Hollywood (formerly Aladdin) hotel, casino and the shopping mall, unless MDE meets certain financial conditions on a projected basis, including through prepayment; and | ||
• No default or event of default. | ||
| Collateral | First lien on the following (with limited exceptions): | |
• Project revenues; | ||
• Equity of the Borrower and its subsidiaries; | ||
• Substantially all assets of the business; and | ||
• Insurance policies and claims or proceeds. |
Energy-Related Businesses: District Energy – (continued)
The facility includes events of default, representations and warranties and other covenants that are customary for facilities of this type. A change of control will occur if the Macquarie Group, or any fund or entity managed by the Macquarie Group, fails to control a majority of MDE.
To hedge the interest commitments under the new term loan, District Energy entered into interest rate swaps fixing 100% of the term loan at 5.074% (excluding the margin).
Aviation-Related Business
Atlantic Aviation
| Year Ended December 31, | Change (From 2008 to 2009) Favorable/(Unfavorable) | Change (From 2007 to 2008) Favorable/(Unfavorable) | ||||||||||||||||||||||||||
| 2009 | 2008 | 2007 | ||||||||||||||||||||||||||
| ($ In Thousands) | $ | $ | $ | $ | % | $ | % | |||||||||||||||||||||
| Cash provided by operating activities | 50,930 | 73,128 | 85,323 | (22,198 | ) | (30.4 | ) | (12,195 | ) | (14.3 | ) | |||||||||||||||||
| Cash used in investing activities | (10,817 | ) | (68,002 | ) | (704,259 | ) | 57,185 | 84.1 | 636,257 | 90.3 | ||||||||||||||||||
| Cash (used in) provided by financing activities (1) | (76,736 | ) | 27,069 | 411,191 | (103,805 | ) | NM | (384,122 | ) | (93.4 | ) | |||||||||||||||||
NM - Not meaningful
| (1) | During the first quarter of 2009, we provided Atlantic Aviation with a capital contribution of $50.0 million to pay down $44.6 million of debt. The remainder of the capital contribution was used to pay interest rate swap breakage fees and expenses. In the first quarter of 2008, we provided Atlantic Aviation with $41.9 million of funding, which was used to pay for the acquisition of SevenBar FBOs (reflected above in cash used in investing activities) and to pre-fund integration costs. These contributions have been excluded from the above table as they are eliminated on consolidation. |
In response to the slowing of the overall economy and the recent decline in general aviation activity, we continue to reduce the indebtedness of Atlantic Aviation. In cooperation with the business’ lenders, the terms of the loan agreement were amended by Atlantic Aviation. The amendment was executed on February 25, 2009. The revised terms are outlined under “Financing Activities” below.
Operating Activities
Operating cash at Atlantic Aviation is generated from sales transactions primarily paid by credit cards. Some customers are extended payment terms and billed accordingly. Cash is used in operating activities mainly for payments to vendors of fuel, aircraft services and professional services, as well as payroll costs and payments to tax jurisdictions. Cash provided by operating activities decreased mainly due to:
Investing Activities
Cash used in investing activities relates primarily to acquisitions and capital expenditures. The decrease in cash used in investing activity is primarily due to the SevenBar acquisition in March 2008 and lower capital expenditures by the business.
Maintenance expenditures are generally funded by cash from operating activities and growth capital expenditures are generally funded with drawdowns on capital expenditure facilities.
Aviation-Related Business: Atlantic Aviation – (continued)
Maintenance Capital Expenditure
Maintenance capital projects include regular replacement of shuttle busesexpenditures encompass repainting, replacing equipment as necessary and IT equipment, some of whichany ongoing environmental or required regulatory expenditure, such as installing safety equipment. These expenditures are generally funded from cash flow from operating activities.
Growth Capital Expenditure
Growth capital expenditures are incurred primarily in connection with lease extensions and only where the business expects to receive an appropriate return relative to its cost of capital. Historically these expenditures have included development of hangars, terminal buildings and ramp upgrades. The business has generally funded these projects through its growth capital expenditure facilities.
The following table sets forth information about capital expenditures in Atlantic Aviation:
| Maintenance | Growth | |||||||
| 2007 | $ | 8.6 million | $ | 19.0 million | ||||
| 2008 | $ | 7.7 million | $ | 26.8 million | ||||
| 2009 | $ | 4.5 million | $ | 6.3 million | ||||
| 2010 projected | $ | 7.6 million | $ | 1.8 million | ||||
| Commitments at December 31, 2009 | $ | 24,000 | $ | 203,000 | ||||
Growth capital expenditures declined in 2009 since various major projects were completed in 2008, these include the construction of a new hangar at the San Jose FBO and a ramp repair and extension at the Teterboro location that were completed in 2008. The business expects growth capital expenditures to be $1.8 million in 2010 and $4.5 million in 2011. This expected decrease in growth capital expenditures reflects the completion of all major projects undertaken last year as well as obligations under our various FBO lease agreements.
The decreases in maintenance capital expenditures were primarily due to the deferral of maintenance capital expenditures in response to the overall soft economy.
Financing Activities
At December 31, 2009, the outstanding balance on the business’ debt facilities consisted of $818.4 million in term loan facility borrowings, which is 100% hedged with interest rate swaps, and $44.9 million in capital expenditure facility borrowings. The weighted average interest rate of the outstanding debt facilities including any interest rate swaps at December 31, 2009 is 6.37%. In 2009, the business paid approximately $57.3 million in interest expense, excluding interest rate swap breakage fees, related to its debt facilities.
In addition, for the year ended December 31, 2009, cash interest expense included $8.8 million in interest rate swap breakage fees. The business expects to pay further interest rate swap breakage fees to its swap counterparties as it continues to pay down its term loan debt and somereduce its corresponding interest rate swaps.
During the first quarter of which are financed, including2009, the Company provided the business with a capital leases.contribution of $50.0 million. The business paid down $44.6 million of debt and used the remainder of the capital contribution to pay interest rate swap breakage and debt amendment fees. In addition, during 2009 the business used $40.6 million of its excess cash flow to prepay $37.0 million of the outstanding principal balance of the term loan and $3.6 million in interest rate swap breakage fees.
In February, 2010, Atlantic Aviation used $17.1 million of cash generated by Atlantic Aviation to repay $15.5 million of the outstanding principal balance of the term loan debt and $1.6 million of interest rate swap breakage fees. As a result of this prepayment, the refinance and sale of surplus land, Parking hadleverage ratio would decrease to 7.82x based upon the trailing twelve months December 2009 EBITDA, as calculated under the facility. We expect to apply all excess cash flow from the business to prepay additional funds availabledebt principal for capital expenditure. These funds were usedthe foreseeable future.
The decrease in cash provided by financing activities is primarily due to accelerate capital expenditure previously scheduled for 2007.
Aviation-Related Business: Atlantic Aviation – (continued)
The following tables summarize our future obligations, due by period, asfinancial covenant requirements under Atlantic Aviation’s credit facility, and the calculation of these measures at December 31, 2006, under our various contractual obligations and commitments. We had no off-balance sheet arrangement at that date or currently. The following information does not include information for IMTT, which is not consolidated.
| • | Debt Service Coverage Ratio >1.2x (default threshold). The ratio at December 31, 2009 was 1.85x. |
Payments Due by Period | ||||||||||||||||
Total | Less Than One Year | 1-3 Years | 3-5 Years | More Than 5 years | ||||||||||||
| ($ in thousands) | ||||||||||||||||
| Long-term debt(1) | $ | 963,660 | $ | 3,754 | $ | 212,005 | $ | 489,180 | $ | 258,721 | ||||||
| Capital lease obligations(2) | 4,492 | 2,018 | 2,123 | 351 | — | |||||||||||
| Notes payable | 3,326 | 2,665 | 539 | 122 | — | |||||||||||
| Operating lease obligations(3) | 471,833 | 28,199 | 55,582 | 50,613 | 337,439 | |||||||||||
| Time charter obligations(4) | 4,170 | 912 | 1,879 | 1,379 | — | |||||||||||
| Pension benefit obligations | 20,965 | 1,705 | 3,677 | 4,096 | 11,487 | |||||||||||
| Post-retirement benefit obligations | 1,857 | 257 | 385 | 358 | 857 | |||||||||||
| Purchase obligations(5) | 56,980 | 56,980 | — | — | — | |||||||||||
| Total contractual cash obligations(6) | $ | 1,527,283 | $ | 96,490 | $ | 276,190 | $ | 546,099 | $ | 608,504 | ||||||
The terms of the lease agreements.
| Borrower | Atlantic Aviation | |
| Facilities | $900.0 million term loan facility (outstanding balance of $818.4 million at December 31, 2009) | |
| $50.0 million capital expenditure facility ($44.9 million drawn at December 31, 2009) | ||
| $18.0 million revolving working capital and letter of credit facility ($6.5 million utilized to back letter of credit at December 31, 2009) | ||
| Amortization | Payable at maturity | |
| Years 1 to 5, amortization per leverage grid below: 100% excess cash flow when Leverage Ratio is 6.0x or above 50% excess cash flow when Leverage Ratio is between 6.0x and 5.5x 100% of excess cash flow in years 6 and 7 (unchanged) | ||
| Interest type | Floating | |
| Interest rate and fees | Years 1 – 5: | |
| LIBOR plus 1.6% or | ||
| Base Rate (for revolving credit facility only): 0.6% above the greater of: (i) the prime rate or (ii) the federal funds rate plus 0.5% | ||
| Years 6 – 7: | ||
| LIBOR plus 1.725% or | ||
| Base Rate (for revolving credit facility only): 0.725% above the greater of: (i) the prime rate or (ii) the federal funds rate plus 0.5% | ||
| Maturity | October, 2014 | |
| Mandatory prepayment | With net proceeds that exceed $1.0 million from the sale of assets not used for replacement assets; | |
| With net proceeds of any debt other than permitted debt; | ||
| With net insurance proceeds that exceed $1.0 million not used to repair, restore or replace assets; | ||
| In the event of a change of control; | ||
| Additional mandatory prepayment based on leverage grid (see distribution covenant below) | ||
| With any FBO lease termination payments received; | ||
| With excess cash flows in years 6 and 7. | ||
| Financial covenants | Debt service coverage ratio >1.2x (at December 31, 2009: 1.85x) | |
| Maximum leverage ratio for subsequent periods modified as follows: 2009: 8.25x 2012: 6.75x 2010: 8.00x 2013: 6.00x 2011: 7.50x 2014: 5.00x (unchanged) |
Aviation-Related Business: Atlantic Aviation – (continued)
| Distribution covenant | Distributions permitted if the following conditions are met: | |
| Backward and forward debt service coverage ratio equal to or greater than 1.6x; | ||
| No default; | ||
| All mandatory prepayments have been made; | ||
| Replaced by a test based on the Leverage Ratio: 100% of excess cash flow permitted to be distributed when leverage ratio is below 5.5x 50% of excess cash to be distributed when leverage ratio is equal to or greater than 5.5x and less than 6.0x No distribution permitted when leverage ratio is 6.0x or above | ||
| No revolving loans outstanding. | ||
| Collateral | First lien on the following (with limited exceptions): | |
| Project revenues; | ||
| Equity of the borrower and its subsidiaries; and | ||
| Insurance policies and claims or proceeds. | ||
| Adjusted EBITDA definition | Excludes (i) all extraordinary or non-recurring non-cash income or losses during relevant the period (including losses resulting from write-off of goodwill or other assets); and (ii) any non-cash income or losses due to change in market value of the hedging agreements |
CRITICAL ACCOUNTING POLICIES
The preparation of our financial statements requires management to make estimates and judgments that affect the amounts reported in the financial statements and accompanying notes. We base our estimates on historical experience and on various other assumptions that we believe to be reasonable under the circumstances. Actual results could differ from these estimates under different assumptions and judgments and uncertainties, and potentially could result in materially different results under different conditions. Our critical accounting estimates and policies are discussed below. These estimates and policies are consistent with the estimates and accounting policies followed by the businesses we own.
Business Combinations
Our acquisitions of businesses that we control are accounted for under the purchase method of accounting. The amounts assigned to the identifiable assets acquired and liabilities assumed in connection with acquisitions are based on estimated fair values as of the date of the acquisition, with the remainder, if any, recorded as goodwill. The fair values are determined by our management, taking into consideration information supplied by the management of acquired entities and other relevant information. Such information includes valuations supplied by independent appraisal experts for significant business combinations. The valuations are generally based upon future cash flow projections for the acquired assets, discounted to present value. The determination of fair values require significant judgment both by management and outside experts engaged to assist in this process.
Goodwill, intangible assetsIntangible Assets and property, plantProperty, Plant and equipment
Significant assets acquired in connection with our acquisition of the airport services business, airport parking business, district energy businessThe Gas Company, District Energy and gas production and distribution businessAtlantic Aviation include contract rights, customer relationships, non-compete agreements, trademarks, domain names, property and equipment and goodwill.
Trademarks and domain names are generally considered to be indefinite life intangibles. Trademarks, domain names and goodwill are not amortized in most circumstances. It may be appropriate to amortize some trademarks and domain names. However, for unamortized intangible assets, we are required to perform annual impairment reviews and more frequently in certain circumstances.
The goodwill impairment test is a two-step process, which requires management to make judgments in determining what assumptions to use in the calculation. The first step of the process consists of estimating the
fair value of each reporting unit based on a discounted cash flow model using revenue and profit forecasts and comparing those estimated fair values with the carrying values, which included the allocated goodwill. If the estimated fair value is less than the carrying value, a second step is performed to compute the amount of the impairment by determining an “implied fair value” of goodwill. The determination of a reporting unit’s “implied fair value” of goodwill requires the allocation of the estimated fair value of the reporting unit to the assets and liabilities of the reporting unit. Any unallocated fair value represents the “implied fair value” of goodwill, which is compared to its corresponding carrying value. The airport services business, airport parking business, district energy businessGas Company, District Energy and gas production and distribution businessAtlantic Aviation are separate reporting units for purposes of this analysis. The impairment test for trademarks and domain names, which are not amortized, requires the determination of the fair value of such assets. If the fair value of the trademarks and domain names is less than their carrying value, an impairment loss is recognized in an amount equal to the difference. We cannot predict the occurrence of certain future events that might adversely affect the reported value of goodwill and/or intangible assets. Such events include, but are not limited to, strategic decisions made in response to economic and competitive conditions, the impact of the economic environment on our customer base, or material negative change in relationship with significant customers.
Property and equipment areis initially stated at cost. Depreciation on property and equipment is computed using the straight-line method over the estimated useful lives of the property and equipment after consideration of historical results and anticipated results based on our current plans. Our estimated useful lives represent the period the asset remains in servicesservice assuming normal routine maintenance. We review the estimated useful lives assigned to property and equipment when our business experience suggests that they do not properly reflect the consumption of economic benefits embodied in the property and equipment nor result in the appropriate matching of cost against revenue. Factors that lead to such a conclusion may include physical observation of asset usage, examination of realized gains and losses on asset disposals and consideration of market trends such as technological obsolescence or change in market demand.
Significant intangibles, including contract rights, customer relationships, non-compete agreements and technology are amortized using the straight-line method over the estimated useful lives of the intangible asset after consideration of historical results and anticipated results based on our current plans. With respect to contract rights in our airport services business,Atlantic Aviation, we take into consideration the history of contract right renewals in determining our assessment of useful life and the corresponding amortization period.
We perform impairment reviews of property and equipment and intangibles subject to amortization, when events or circumstances indicate that assets are less than their carrying amount and the undiscounted cash flows estimated to be generated by those assets are less than the carrying amount of those assets. In this circumstance, the impairment charge is determined based upon the amount of the net book value of the assets exceeds their fair market value. Any impairment is measured by comparing the fair value of the asset to its carrying value.
The “implied fair value” of reporting units and fair value of property and equipment and intangible assets is determined by our management and is generally based upon future cash flow projections for the acquired assets, discounted to present value. We use outside valuation experts when management considers that it is appropriate to do so.
We test for goodwill for impairment as of October 1 each year. There was no goodwill impairment as of October 1, 2006. We test our long-livedand indefinite-lived intangible assets when there is an indicator of impairment. Impairments of long-livedgoodwill, property, equipment, land and leasehold improvements and intangible assets during 20062009, 2008 and 2007 relating to Atlantic Aviation, are discussed in “Management’s Discussion and Analysis of Financial Condition and Results of Operations — Results of Operations — Airport Parking Business”Operations” in Part II, Item 7.
Revenue recognition
The Gas Company recognizes revenue from our airport services business is recorded when fuel is provided or whenthe services are rendered. Our airport services business also records hangar rental fees, whichprovided. Sales of gas to customers are recognized during the month for which servicebilled on a monthly cycle basis. Most revenue is provided.
District Energy recognizes revenue from cooling capacity and consumption at the time of performance of service. Cash received from customers for services to be provided in the future are recorded as unearned revenue and recognized over the expected services period on a straight-line basis.
Fuel revenue from Atlantic Aviation is recorded when thefuel is provided or when services are rendered. Atlantic Aviation also records hangar rental fees, which are recognized during the month for which service is provided. Sales
Hedging
We have in place variable-rate debt. Management believes that it is prudent to limit the variability of gasa portion of its interest payments. To meet this objective, the Company enters into interest rate swap agreements to customers are billedmanage fluctuations in cash flows resulting from interest rate risk on a monthly cycle basis. Most revenue is based upon consumption, however, certain revenue is based uponmajority of its debt with a flat rate.
As of February 25, 2009 for Atlantic Aviation and effective April 1, 2009 for our other businesses, we elected to our debt facilities anddiscontinue hedge accounting. From the expected cash flows from our previously held non-U.S. investments, we have entered into a seriesdates that hedge accounting was discontinued, all movements in the fair value of the interest rate and foreign exchange derivatives to provide an economicswaps are recorded directly through earnings. As a result of the discontinuance of hedge accounting, we will reclassify into earnings net derivative losses included in accumulated other comprehensive loss over the remaining life of ourthe existing interest rate and foreign exchange exposure. We originally classified each hedge as a cash flow hedge at inception for accounting purposes. As discussed in Note 11 to our consolidated financial statements, we subsequently determined that none of ourswaps.
Our derivative instruments qualified for hedge accounting. SFAS No. 133, Accounting for Derivative Instruments and Certain Hedging Activities, as amended, requires that all derivative instruments beare recorded on the balance sheet at their respective fair values and, for derivatives that do not qualify for hedge accounting, thatvalue with changes in the fair value of interest rate swaps recorded directly through earnings. We measure derivative instruments at fair value using the income approach, which discounts the future net cash settlements expected under the derivative be recognizedcontracts to a present value. See Note 13, “Derivative Instruments and Hedging Activities” in earnings. The determination of fair value of these instruments involves estimates and assumptions and actual value may differ from the fair value reflectedour consolidated financial statements in the financial statements. We commenced hedge accounting in January 2007 and have classified each derivative instrument as a cash flow hedge as of January 1, 2007. Changes in the value of the hedges, to the extent effective, will be recorded in other comprehensive income (loss). Changes in the value that represent the ineffective portion of the hedge will be recorded in earnings as a gain or loss.
Income Taxes
We account for income taxes using the asset and liability method of accounting. Under this method, deferred tax assets and liabilities are recognized for the future tax consequences attributable to differences between the financial statement carrying amounts of existing assets and liabilities and their respective tax basis and for operating loss and tax credit carry forwards. Deferred tax assets and liabilities are measured using enacted tax rates expected to apply to taxable income in the years in which those temporary differences are expected to be recovered or settled.
In assessing the need for a valuation allowance, management considers whether it is more likely than not that some portion or all of the deferred tax assets will not be realized. The ultimate realization of deferred tax assets is dependent upon the generation of future taxable income during the periods in which those temporary differences become deductible. Management considers the scheduled reversal of deferred tax liabilities, projected future taxable income, and tax planning strategies in making this assessment.
Accounting Policies, Accounting Changes and Future Application of Accounting Standards
See Note 2, “Summary of Significant Accounting Policies” in our consolidated financial statements for a summary of the Company’s significant accounting policies, including a discussion of recently adopted and issued accounting pronouncements.
The discussion that follows describes our exposure to market risks and the use of derivatives to address those risks. See “Critical Accounting PoliciesEstimates — Hedging” for a discussion of the related accounting.
Interest Rate Risk
We are exposed to interest rate risk in relation to the borrowings of our businesses. Our current policy is to enter into derivative financial instruments to fix variable rate interest payments covering at least half of the interest rate risk associated with the borrowings of our businesses, subject to the requirements of our lenders. As of December 31, 2006,2009, we have totalhad $1.2 billion of current and long-term debt outstanding atfor our consolidated businessescontinuing operations, $1.1 billion of $963.7 million. Of this total debt outstanding, $126.7 million is fixed rate and $837.0 million is floating. Of the $837.0 million of floating rate debt, $776.3 million iswhich was economically hedged with interest rate swaps $58.7and $83.9 million is hedged with an interest rate cap and $2.0 million isof which was unhedged.
IMTT at
At December 31, 2006,2009, IMTT had two issues of New Jersey Economic Development Authority tax exempt revenue bonds outstanding with a total balance of $36.3 million where the interest rate is reset daily by tender. A 1% increase in interest rates on this tax exempt debt would result in a $363,000 increase in interest cost per year and a corresponding 1% decrease would result in a $363,000 decrease in interest cost per year. IMTT’s exposure to interest rate changes through the tax exempt debt has been largely hedged through October 2007 through the use of a $50.0 million notional value interest rate swap. As the interest rate swap is fixed against 90-day LIBOR and not the daily tax exempt tender rate, it does not result in a perfect hedge for short term rates on tax exempt debt although it will largely offset any additional interest rate expense incurred as a result of increases in interest rates. The face value of the interest rate swap currently exceeds IMTT’s total outstanding floating rate debt as a consequence of repayment of debt subsequent to our investment in IMTT. If interest rates decrease, the value of the interest rate swap will also decrease. A 10% relative decrease in interest rates would result in a decrease in the fair market value of the interest rate swap of $199,000 and a corresponding 10% relative increase would result in a $198,000 increase in the fair market value. IMTT’s exposure to interest rate changes through thethis tax exempt debt has been hedged from October 2007 through November 2012 through the use of a $36.3 million face value 67% of LIBOR swap. As this interest rate swap is fixed against 67% of 30-day LIBOR and not the daily tax exempt tender rate, it does not result in a perfect hedge for short termshort-term rates on tax exempt debt although it will largely offset any additional interest rate expense incurred as a result of increases in interest rates. If interest rates decrease, the fair market value of this interest rate swap will also decrease. A 10% relative decrease in interest rates would result in a decrease in the fair market value of the interest rate swap of $612,000$137,000 and a corresponding 10% relative increase would result in a $415,000$136,000 increase in the fair market value.
At December 31, 2006, had $6.4 million outstanding under its Canadian Dollar denominated revolving credit facility. A 1% increase in interest rates on this revolver would result in a $64,000 increase in interest cost per year. A corresponding 1% decrease would result in a $64,000 decrease in interest cost per year.
At December 31, 2009, IMTT had issued $215.0 million in Gulf Opportunity Zone Bonds (GO Zone Bonds) to fund qualified project costs at its St. Rose and Geismar storage facilities. The interest rate on the GO Zone Bonds is reset daily or weekly at IMTT’s option by tender. A 1% increase in interest rates on the outstanding GO Zone Bonds would result in a $2.2 million increase in interest cost per year and a corresponding 1% decrease would result in a $2.2 million decrease in interest cost per year. IMTT’s exposure to interest rate changes through the GO Zone Bonds has been largely hedged until June 2017 through the use of an interest rate swap which has a notional value of $215.0 million. As the interest rate swap is fixed against 67% of the 30-day LIBOR rate and not the tax exempt tender rate, it does not result in a perfect hedge for short-term rates on tax exempt debt although it will largely offset any additional interest rate expense incurred as a result of increases in interest rates. If interest rates decrease, the fair market value of the interest rate swap will also decrease. A 10% relative decrease in interest rates would result in a decrease in the fair market value of the interest rate swap of $171,000 and a corresponding 10% relative increase would result in a $170,000 increase in the fair market value.
On December 31, 2009, IMTT had $230.1 million outstanding under its U.S. revolving credit facility. A 1% increase in interest rates on this debt would result in a $2.3 million increase in interest cost per year and a corresponding 1% decrease would result in a $2.3 million decrease in interest cost per year. IMTT’s exposure to interest rate changes on its U.S. revolving credit facility has been partially hedged against 90-day LIBOR from October 2007 through March 2017 through the use of an interest rate swap which has a notional value of $115.0 million as of December 31, 2009 which increases to $200.0 million through December 31, 2012. If
interest rates decrease, the fair market value of the interest rate swap will also decrease. A 10% relative decrease in interest rates would result in a decrease in the fair market value of the interest rate swap of $3.7 million and a corresponding 10% relative increase would result in a $3.6 million increase in the fair market value.
On December 31, 2009, IMTT had $20.8 million outstanding under its Canadian revolving credit facility. A 1% increase in interest rates on this debt would result in a $208,000 increase in interest cost per year and a corresponding 1% decrease would result in a $208,000 decrease in interest cost per year.
On December 31, 2009, IMTT had $30.0 million outstanding under its Regions term loan facility. A 1% increase in interest rates on this debt would result in a $300,000 increase in interest cost per year and a corresponding 1% decrease would result in a $300,000 decrease in interest cost per year.
The Gas Production and Distribution Business
The senior term-debt for TGCThe Gas Company and HGC comprise two non-amortizing term facilities totaling $160.0 million and a senior secured revolving credit facility totaling $20.0 million. At December 31, 2006,2009, the entire $160.0 million in term debt and $2.0$19.0 million of the revolving credit line had been drawn. These variable rate facilities mature on August 31,June 7, 2013.
A 1% increase in the interest rate on TGCThe Gas Company and HGC’s term debt would result in a $1.6 million increase in interest cost per year. A corresponding 1% decrease would result in a $1.6 million decrease in annual interest cost. TGCThe Gas Company and HGC’s exposure to interest rate changes for the term facilities has, however, been fully hedged from September 1, 2006 until maturity through interest rate swaps. These derivative hedging arrangements will offset any interest rate increases or decreases during the term of the notes, resulting in stable interest rates of 5.24% for TGCThe Gas Company (rising to 5.34% in years 6 and 7 of the facility) and 5.44% for HGC (rising to 5.55%5.54% in years 6 and 7 of the facility). TGC’s and HGC’s swaps were entered into on August 17 and 18, 2005, but became effective on August 31, 2006. A 10% relative decrease in market interest rates from December 31, 20062009 levels would decrease the fair market value of the hedge instruments by $3.0$1.3 million. A corresponding 10% relative increase would increase their fair market value by $2.9$1.3 million.
The Gas Company also has issued $120a $20.0 million revolver of aggregate principal amount of fixed rate senior secured notes maturingwhich $19.0 million was drawn at December 31, 2023, with variable quarterly amortization commencing in the fourth quarter of 2007. We have a fixed rate exposure on these notes. A 10% relative increase in interest rates will result in a $5.4 million decrease in the fair market value of the notes. A 10% relative decrease in interest rates will result in a $5.8 million increase in the fair market value of the notes.
District Energy
District Energy has a $150.0 million floating rate term loan facility maturing in 2014. A 1% increase in the $195.0interest rate on the $150.0 million facility willDistrict Energy debt would result in a $1.5 million increase in the interest cost by $2.0 million per year. A corresponding 1% decrease in interest rates willwould result in a $2.0$1.5 million decrease in interest cost per year. A 10% relative increase
District Energy’s exposure to interest rate changes through the term loan facility has been fully hedged to maturity through the use of interest rate swaps. These hedging arrangements will offset any additional interest rate expense incurred as a result of increases in interest rates. However, if interest rates will decrease, the fair market value of the $4.5 million facility by $61,000.District Energy’s hedge instruments will also decrease. A 10% relative decrease in interest rates willwould result in a $61,000 increase in the fair market value. A 10% relative increase in interest rates will increase the fair market value of the $2.2 million facility by $25,000. A 10% relative decrease in interest rates will result in a $26,000 decrease in the fair market value. We purchased an interest rate cap agreement at a base rate of LIBOR equal to 4.48% for a notional amount of $58.7 million. We have also entered into an interest rate swap agreement for the $136.3 million balance of our floating rate facility at 5.17% through October 16, 2008 and for the full $195.0 million once our interest rate cap expires through the maturity of the loan on September 1, 2009. PCAA’s obligations under the interest rate swap have been guaranteed by MIC Inc. A 10% relative decrease in market interest rates from December 31, 2006 levels would decrease the fair market value of the hedge instruments byof $2.0 million. A corresponding 10% relative increase would result in a $2.0 million increase theirin the fair market value.
District Energy also has a $20.0 million capital expenditure loan facility which was fully drawn at December 31, 2009. A 1% increase in the interest rate on District Energy’s capital expenditure loan facility would result in a $200,000 increase in interest cost per year. A corresponding 1% decrease would result in a $200,000 decrease in annual interest cost.
Atlantic Aviation
As of December 31, 2009, the outstanding balance of the floating rate senior debt for Atlantic Aviation was $863.3 million. A 1% increase in the interest rate on Atlantic Aviation’s debt would result in an $8.6 million increase in the interest cost per year. A corresponding 1% decrease would result in an $8.6 million decrease in interest cost per year.
The exposure of the term loan portion of the senior debt (which at December 31, 2009 was $818.4 million) to interest rate changes has been 100% hedged until October 2012 through the use of interest rate swaps. These hedging arrangements will offset any additional interest rate expense incurred as a result of increases in interest rates during that period. However, if interest rates decrease, the value of our hedge instruments will also decrease. A 10% relative decrease in interest rates would result in a decrease in the fair market value by $2.0of the hedge instruments of $3.8 million.
MACQUARIE INFRASTRUCTURE COMPANY LLC
INDEX TO FINANCIAL STATEMENTS
| 105 | ||
| Schedule – II Valuation and Qualifying Accounts | ||
| 152 |
REPORT OF INDEPENDENT REGISTERED PUBLIC ACCOUNTING FIRM
The Board of Directors of and Stockholders
Macquarie Infrastructure Company LLC:
We have audited the accompanying consolidated balance sheets of Macquarie Infrastructure Company Trust (the Trust)LLC and subsidiaries as of December 31, 20062009 and 2005,2008, and the related consolidated statements of operations, stockholders’members’ equity and comprehensive income (loss), and cash flows for each of the years in the three-year period ended December 31, 2006 and 2005, and the period April 13, 2004 (inception) to December 31, 2004.2009. In connection with theour audits of the consolidated financial statements, we also have audited the related financial statement schedule. These consolidated financial statements and financial statement schedule are the responsibility of the Trust’sCompany’s management. Our responsibility is to express an opinion on these consolidated financial statements and financial statement schedule based on our audits.
We conducted our audits in accordance with the standards of the Public Company Accounting Oversight Board (United States). Those standards require that we plan and perform the audit to obtain reasonable assurance about whether the financial statements are free of material misstatement. An audit includes examining, on a test basis, evidence supporting the amounts and disclosures in the financial statements. An audit also includes assessing the accounting principles used and significant estimates made by management, as well as evaluating the overall financial statement presentation. We believe that our audits provide a reasonable basis for our opinion.
In our opinion, the consolidated financial statements referred to above present fairly, in all material respects, the financial position of Macquarie Infrastructure Company TrustLLC and subsidiaries as of December 31, 20062009 and 2005,2008, and the results of their operations and their cash flows for each of the years in the three-year period ended December 31, 2006 and 2005, and the period April 13, 2004 (inception) to December 31, 2004,2009, in conformity with U.S. generally accepted accounting principles. Also in our opinion, the related financial statement schedule, when considered in relation to the basic consolidated financial statements taken as a whole, presents fairly, in all material respects, the information set forth therein.
We also have audited, in accordance with the standards of the Public Company Accounting Oversight Board (United States), the effectiveness of Macquarie Infrastructure Company Trust’sLLC’s internal control over financial reporting as of December 31, 2006,2009, based on criteria established inInternal Control-IntegratedControl — Integrated Framework issued by the Committee of Sponsoring Organizations of the Treadway Commission (COSO), and our report dated February 28, 200725, 2010 expressed an unqualified opinion on management’s assessmentthe effectiveness of and the effective operation of,Company’s internal control over financial reporting.
As discussed in Note 2 to the consolidated financial statements, the Company has changed its method of accounting for noncontrolling interests due to the adoption of ASC 810-10Consolidation (formerly Statement on Financial Accounting Standards No. 160,Noncontrolling Interests in Consolidated Financial Statements, an amendment of ARB No. 51) in 2009.
/s/KPMG LLP
Dallas, Texas
February 28, 2007
CONSOLIDATED BALANCE SHEETS
| December 31, 2009 | December 31, 2008(1) | |||||||
| ($ in Thousands, Except Share Data) | ||||||||
| ASSETS | ||||||||
| Current assets: | ||||||||
| Cash and cash equivalents | $ | 27,455 | $ | 66,054 | ||||
| Accounts receivable, less allowance for doubtful accounts of $1,629 and $2,141, respectively | 47,256 | 60,874 | ||||||
| Dividends receivable | — | 7,000 | ||||||
| Inventories | 14,305 | 15,968 | ||||||
| Prepaid expenses | 6,688 | 7,954 | ||||||
| Deferred income taxes | 23,323 | 21,960 | ||||||
| Income tax receivable | — | 489 | ||||||
| Other | 10,839 | 13,591 | ||||||
| Assets of discontinued operations held for sale | 86,695 | 105,725 | ||||||
| Total current assets | 216,561 | 299,615 | ||||||
| Property, equipment, land and leasehold improvements, net | 580,087 | 592,435 | ||||||
| Restricted cash | 16,016 | 15,982 | ||||||
| Equipment lease receivables | 33,266 | 36,127 | ||||||
| Investment in unconsolidated business | 207,491 | 184,930 | ||||||
| Goodwill | 516,182 | 586,249 | ||||||
| Intangible assets, net | 751,081 | 811,973 | ||||||
| Deferred financing costs, net of accumulated amortization | 17,088 | 22,209 | ||||||
| Other | 1,449 | 2,916 | ||||||
| Total assets | $ | 2,339,221 | $ | 2,552,436 | ||||
| LIABILITIES AND MEMBERS’ EQUITY | ||||||||
| Current liabilities: | ||||||||
| Due to manager – related party | $ | 1,977 | $ | 3,521 | ||||
| Accounts payable | 44,575 | 45,565 | ||||||
| Accrued expenses | 17,432 | 23,189 | ||||||
| Current portion of notes payable and capital leases | 235 | 1,914 | ||||||
| Current portion of long-term debt | 45,900 | — | ||||||
| Fair value of derivative instruments | 49,573 | 45,464 | ||||||
| Customer deposits | 5,617 | 5,457 | ||||||
| Other | 9,338 | 10,201 | ||||||
| Liabilities of discontinued operations held for sale | 220,549 | 224,888 | ||||||
| Total current liabilities | 395,196 | 360,199 | ||||||
| Notes payable and capital leases, net of current portion | 1,498 | 1,622 | ||||||
| Long-term debt, net of current portion | 1,166,379 | 1,327,800 | ||||||
| Deferred income taxes | 107,840 | 83,228 | ||||||
| Fair value of derivative instruments | 54,794 | 105,970 | ||||||
| Other | 38,746 | 39,356 | ||||||
| Total liabilities | 1,764,453 | 1,918,175 | ||||||
| Commitments and contingencies | — | — | ||||||
| Members’ equity: | ||||||||
| LLC interests, no par value; 500,000,000 authorized; 45,292,913 LLC interests issued and outstanding at December 31, 2009 and 44,948,694 LLC interests issued and outstanding at December 31, 2008 | 959,897 | 956,956 | ||||||
| Additional paid in capital | 21,956 | — | ||||||
| Accumulated other comprehensive loss | (43,232 | ) | (97,190 | ) | ||||
| Accumulated deficit | (360,095 | ) | (230,928 | ) | ||||
| Total members’ equity | 578,526 | 628,838 | ||||||
| Noncontrolling interests | (3,758 | ) | 5,423 | |||||
| Total equity | 574,768 | 634,261 | ||||||
| Total liabilities and equity | $ | 2,339,221 | $ | 2,552,436 | ||||
December 31, 2006 | December 31, 2005 | ||||||
| ($ in thousands, except share amounts) | |||||||
ASSETS | |||||||
| Current assets: | |||||||
| Cash and cash equivalents | $ | 37,388 | $ | 115,163 | |||
| Restricted cash | 1,216 | 1,332 | |||||
| Accounts receivable, less allowance for doubtful accounts of $1,435 and $839, respectively | 56,785 | 21,150 | |||||
| Dividends receivable | 7,000 | 2,365 | |||||
| Other receivables | 87,973 | — | |||||
| Inventories | 12,793 | 1,981 | |||||
| Prepaid expenses | 6,887 | 4,701 | |||||
| Deferred income taxes | 2,411 | 2,101 | |||||
| Income tax receivable | 2,913 | 3,489 | |||||
| Other | 15,600 | 4,394 | |||||
| Total current assets | 230,966 | 156,676 | |||||
| Property, equipment, land and leasehold improvements, net | 522,759 | 335,119 | |||||
| Restricted cash | 23,666 | 19,437 | |||||
| Equipment lease receivables | 41,305 | 43,546 | |||||
| Investments in unconsolidated businesses | 239,632 | 69,358 | |||||
| Investment, cost | — | 35,295 | |||||
| Securities, available for sale | — | 68,882 | |||||
| Related party subordinated loan | — | 19,866 | |||||
| Goodwill | 485,986 | 281,776 | |||||
| Intangible assets, net | 526,759 | 299,487 | |||||
| Deposits and deferred costs on acquisitions | 579 | 14,746 | |||||
| Deferred financing costs, net of accumulated amortization | 20,875 | 12,830 | |||||
| Fair value of derivative instruments | 2,252 | 4,660 | |||||
| Other | 2,754 | 1,620 | |||||
| Total assets | $ | 2,097,533 | $ | 1,363,298 | |||
LIABILITIES AND STOCKHOLDERS’ EQUITY | |||||||
| Current liabilities: | |||||||
| Due to manager | $ | 4,284 | $ | 2,637 | |||
| Accounts payable | 29,819 | 11,535 | |||||
| Accrued expenses | 19,780 | 13,994 | |||||
| Current portion of notes payable and capital leases | 4,683 | 2,647 | |||||
| Current portion of long-term debt | 3,754 | 146 | |||||
| Fair value of derivative instruments | 3,286 | — | |||||
| Other | 6,533 | 3,639 | |||||
| Total current liabilities | 72,139 | 34,598 | |||||
| Capital leases and notes payable, net of current portion | 3,135 | 2,864 | |||||
| Long-term debt, net of current portion | 959,906 | 610,848 | |||||
| Related party long-term debt | — | 18,247 | |||||
| Deferred income taxes | 163,923 | 113,794 | |||||
| Fair value of derivative instruments | 453 | — | |||||
| Other | 25,371 | 6,342 | |||||
| Total liabilities | 1,224,927 | 786,693 | |||||
| Minority interests | 8,181 | 8,940 | |||||
| Stockholders’ equity: | |||||||
| Trust stock, no par value; 500,000,000 authorized; 37,562,165 shares issued and outstanding at December 31, 2006 and 27,050,745 shares issued and outstanding at December 31, 2005 | 864,233 | 583,023 | |||||
| Accumulated other comprehensive income (loss) | 192 | (12,966 | ) | ||||
| Accumulated deficit | — | (2,392 | ) | ||||
| Total stockholders’ equity | 864,425 | 567,665 | |||||
| Total liabilities and stockholders’ equity | $ | 2,097,533 | $ | 1,363,298 | |||
| (1) | Reclassified to conform to current period presentation. |
CONSOLIDATED STATEMENTS OF OPERATIONS
| Year Ended December 31, 2009 | Year Ended December 31, 2008(1) | Year Ended December 31, 2007(1) | ||||||||||||||
| ($ in Thousands, Except Share and Per Share Data) | ||||||||||||||||
| Revenue | ||||||||||||||||
| Revenue from product sales | $ | 394,200 | $ | 586,054 | $ | 445,852 | ||||||||||
| Revenue from product sales – utility | 95,769 | 121,770 | 95,770 | |||||||||||||
| Service revenue | 215,349 | 264,851 | 207,680 | |||||||||||||
| Financing and equipment lease income | 4,758 | 4,686 | 4,912 | |||||||||||||
| Total revenue | 710,076 | 977,361 | 754,214 | |||||||||||||
| Costs and expenses | ||||||||||||||||
| Cost of product sales | 231,139 | 406,997 | 302,283 | |||||||||||||
| Cost of product sales – utility | 71,252 | 103,216 | 64,371 | |||||||||||||
| Cost of services | 46,317 | 63,850 | 53,387 | |||||||||||||
| Selling, general and administrative | 214,865 | 231,273 | 185,370 | |||||||||||||
| Fees to manager – related party | 4,846 | 12,568 | 65,639 | |||||||||||||
| Goodwill impairment | 71,200 | 52,000 | — | |||||||||||||
| Depreciation | 36,813 | 40,140 | 20,502 | |||||||||||||
| Amortization of intangibles | 60,892 | 61,874 | 32,356 | |||||||||||||
| Total operating expenses | 737,324 | 971,918 | 723,908 | |||||||||||||
| Operating (loss) income | (27,248 | ) | 5,443 | 30,306 | ||||||||||||
| Other income (expense) | ||||||||||||||||
| Interest income | 119 | 1,090 | 5,705 | |||||||||||||
| Interest expense | (91,154 | ) | (88,652 | ) | (65,356 | ) | ||||||||||
| Loss on extinguishment of debt | — | — | (27,512 | ) | ||||||||||||
| Equity in earnings (losses) and amortization charges of investee | 22,561 | 1,324 | (32 | ) | ||||||||||||
| Loss on derivative instruments | (29,540 | ) | (2,843 | ) | (1,362 | ) | ||||||||||
| Other income (expense), net | 760 | (19 | ) | (1,088 | ) | |||||||||||
| Net loss from continuing operations before income taxes and noncontrolling interests | (124,502 | ) | (83,657 | ) | (59,339 | ) | ||||||||||
| Benefit for income taxes | 15,818 | 14,061 | 16,764 | |||||||||||||
| Net loss from continuing operations before noncontrolling interests | (108,684 | ) | (69,596 | ) | (42,575 | ) | ||||||||||
| Net income attributable to noncontrolling interests | 486 | 585 | 554 | |||||||||||||
| Net loss from continuing operations | $ | (109,170 | ) | $ | (70,181 | ) | $ | (43,129 | ) | |||||||
| Discontinued operations | ||||||||||||||||
| Net loss from discontinued operations before income taxes and noncontrolling interests | (23,647 | ) | (180,104 | ) | (9,679 | ) | ||||||||||
| Benefit (provision) for income taxes | 1,787 | 70,059 | (281 | ) | ||||||||||||
| Net loss from discontinued operations before noncontrolling interests | (21,860 | ) | (110,045 | ) | (9,960 | ) | ||||||||||
| Net loss attributable to noncontrolling interests | (1,863 | ) | (1,753 | ) | (1,035 | ) | ||||||||||
| Net loss from discontinued operations | $ | (19,997 | ) | $ | (108,292 | ) | $ | (8,925 | ) | |||||||
| Net loss | $ | (129,167 | ) | $ | (178,473 | ) | $ | (52,054 | ) | |||||||
| Basic and diluted loss per share from continuing operations | $ | (2.43 | ) | $ | (1.56 | ) | $ | (1.05 | ) | |||||||
| Basic and diluted loss per share from discontinued operations | (0.44 | ) | (2.41 | ) | (0.22 | ) | ||||||||||
| Basic and diluted loss per share | $ | (2.87 | ) | $ | (3.97 | ) | $ | (1.27 | ) | |||||||
| Weighted average number of shares outstanding: basic and diluted | 45,020,085 | 44,944,326 | 40,882,067 | |||||||||||||
| Cash distributions declared per share | $ | — | $ | 2.125 | $ | 2.385 | ||||||||||
Year Ended December 31, 2006 | Year Ended December 31, 2005 | April 13, 2004 (inception) to December 31, 2004 | ||||||||
| ($ in thousands, except share and per share data) | ||||||||||
Revenue | ||||||||||
| Revenue from product sales | $ | 313,298 | $ | 142,785 | $ | 1,681 | ||||
| Service revenue | 201,835 | 156,655 | 3,257 | |||||||
| Financing and equipment lease income | 5,118 | 5,303 | 126 | |||||||
| Total revenue | 520,251 | 304,743 | 5,064 | |||||||
Costs and expenses | ||||||||||
| Cost of product sales | 206,802 | 84,480 | 912 | |||||||
| Cost of services | 92,542 | 82,160 | 1,633 | |||||||
| Selling, general and administrative | 120,252 | 82,636 | 7,953 | |||||||
| Fees to manager | 18,631 | 9,294 | 12,360 | |||||||
| Depreciation | 12,102 | 6,007 | 175 | |||||||
| Amortization of intangibles | 43,846 | 14,815 | 281 | |||||||
| Total operating expenses | 494,175 | 279,392 | 23,314 | |||||||
Operating income (loss) | 26,076 | 25,351 | (18,250 | ) | ||||||
Other income (expense) | ||||||||||
| Dividend income | 8,395 | 12,361 | 1,704 | |||||||
| Interest income | 4,887 | 4,064 | 69 | |||||||
| Interest expense | (77,746 | ) | (33,800 | ) | (756 | ) | ||||
| Equity in earnings (loss) and amortization charges of investees | 12,558 | 3,685 | (389 | ) | ||||||
| Unrealized losses on derivative instruments | (1,373 | ) | — | — | ||||||
| Gain on sale of equity investment | 3,412 | — | — | |||||||
| Gain on sale of investment | 49,933 | — | — | |||||||
| Gain on sale of marketable securities | 6,738 | — | — | |||||||
| Other income, net | 594 | 123 | 50 | |||||||
| Net income (loss) before income taxes and minority interests | 33,474 | 11,784 | (17,572 | ) | ||||||
| Income tax benefit | 16,421 | 3,615 | — | |||||||
| Net income (loss) before minority interests | 49,895 | 15,399 | (17,572 | ) | ||||||
| Minority interests | (23 | ) | 203 | 16 | ||||||
Net income (loss) | $ | 49,918 | $ | 15,196 | $ | (17,588 | ) | |||
| Basic earnings (loss) per share: | $ | 1.73 | $ | 0.56 | $ | (17.38 | ) | |||
| Weighted average number of shares of trust stock outstanding: basic | 28,895,522 | 26,919,608 | 1,011,887 | |||||||
| Diluted earnings (loss) per share: | $ | 1.73 | $ | 0.56 | $ | (17.38 | ) | |||
| Weighted average number of shares of trust stock outstanding: diluted | 28,912,346 | 26,929,219 | 1,011,887 | |||||||
| Cash dividends declared per share | $ | 2.075 | $ | 1.5877 | $ | — | ||||
| (1) | Reclassified to conform to current period presentation. |
CONSOLIDATED STATEMENTS OF
EQUITY AND COMPREHENSIVE INCOME (LOSS)
| Macquarie Infrastructure Company LLC Member’s Equity | ||||||||||||||||||||||||||||||||
| Trust stock and LLC interests | Additional Paid in Capital | Accumulated Deficit | Accumulated Other Comprehensive Income (Loss) | Total Members’ Equity | Noncontrolling Interests(1) | Total Equity | ||||||||||||||||||||||||||
| Number of Shares | Amount | |||||||||||||||||||||||||||||||
| ($ in Thousands, Except Share and Per Share Data) | ||||||||||||||||||||||||||||||||
| Balance at December 31, 2006 | 37,562,165 | $ | 864,233 | $ | — | $ | — | $ | 192 | $ | 864,425 | $ | 8,181 | $ | 872,606 | |||||||||||||||||
| Issuance of LLC interests, net of offering costs | 6,165,871 | 241,330 | — | — | — | 241,330 | — | 241,330 | ||||||||||||||||||||||||
| Issuance of LLC interests to manager | 1,193,475 | 43,962 | — | — | — | 43,962 | — | 43,962 | ||||||||||||||||||||||||
| Issuance of LLC interests to independent directors | 16,869 | 450 | — | — | — | 450 | — | 450 | ||||||||||||||||||||||||
| Distributions to holders of LLC interests (comprising $0.57 per share paid on 37,562,165 shares, $0.59 per share paid on 37,562,165 shares, $0.605 per share paid on 43,766,877 shares and $0.62 per share paid on 44,938,380 shares) | — | (97,913 | ) | — | — | — | (97,913 | ) | — | (97,913 | ) | |||||||||||||||||||||
| Distributions to noncontrolling interest members | — | — | — | — | — | — | (528 | ) | (528 | ) | ||||||||||||||||||||||
| Other comprehensive loss: | ||||||||||||||||||||||||||||||||
| Net loss for the year ended December 31, 2007 | — | — | — | (52,054 | ) | — | (52,054 | ) | (481 | ) | (52,535 | ) | ||||||||||||||||||||
| Retained earnings adjustment relating to income taxes (FIN 48) | — | — | — | (401 | ) | — | (401 | ) | — | (401 | ) | |||||||||||||||||||||
| Change in fair value of derivatives, net of taxes of $21,702 | — | — | — | — | (30,731 | ) | (30,731 | ) | — | (30,731 | ) | |||||||||||||||||||||
| Reclassification of realized gains of derivatives into earnings, net of taxes of $1,905 | — | — | — | — | (2,855 | ) | (2,855 | ) | — | (2,855 | ) | |||||||||||||||||||||
| Change in post-retirement benefit plans, net of taxes of $218 | — | — | — | — | 339 | 339 | — | 339 | ||||||||||||||||||||||||
| Total comprehensive loss for the year ended December 31, 2007 | �� | (85,702 | ) | (481 | ) | (86,183 | ) | |||||||||||||||||||||||||
| Balance at December 31, 2007 | 44,938,380 | $ | 1,052,062 | $ | — | $ | (52,455 | ) | $ | (33,055 | ) | $ | 966,552 | $ | 7,172 | $ | 973,724 | |||||||||||||||
| Offering costs related to prior period issuance of LLC interests | — | (47 | ) | — | — | — | (47 | ) | — | (47 | ) | |||||||||||||||||||||
| Issuance of LLC interests to independent directors | 10,314 | 450 | — | — | — | 450 | — | 450 | ||||||||||||||||||||||||
| Distributions to holders of LLC interests (comprising $0.635 per share paid on 44,938,380 shares, $0.645 per share paid on 44,948,694 shares, $0.645 per share paid on 44,948,694 shares and $0.20 per share paid on 44,948,694 shares) | — | (95,509 | ) | — | — | — | (95,509 | ) | — | (95,509 | ) | |||||||||||||||||||||
| Distributions to noncontrolling interest members | — | — | — | — | — | — | (481 | ) | (481 | ) | ||||||||||||||||||||||
| Purchase of subsidiary interest from noncontrolling interest | — | — | — | — | — | — | (100 | ) | (100 | ) | ||||||||||||||||||||||
| Other comprehensive loss: | ||||||||||||||||||||||||||||||||
| Net loss for the year ended December 31, 2008 | — | — | — | (178,473 | ) | — | (178,473 | ) | (1,168 | ) | (179,641 | ) | ||||||||||||||||||||
| Translation adjustment | — | — | — | — | (4 | ) | (4 | ) | — | (4 | ) | |||||||||||||||||||||
Trust Stock | Accumulated Gain (Deficit) | Accumulated Other Comprehensive Income (Loss) | Total Stockholders' Equity | |||||||||||||
Number of Shares | Amount | |||||||||||||||
| ($ in thousands, except number of shares and per share amounts) | ||||||||||||||||
| Issuance of trust stock, net of offering costs | 26,610,100 | $ | 613,265 | $ | — | $ | — | $ | 613,265 | |||||||
| Other comprehensive income (loss): | ||||||||||||||||
| Net loss for the period ended December 31, 2004 | — | — | (17,588 | ) | — | (17,588 | ) | |||||||||
| Translation adjustment | — | — | — | 855 | 855 | |||||||||||
| Unrealized loss on marketable securities | — | — | — | (237 | ) | (237 | ) | |||||||||
| Change in fair value of derivatives | — | — | — | 1 | 1 | |||||||||||
| Total comprehensive loss for the period ended December 31, 2004 | (16,969 | ) | ||||||||||||||
| Balance at December 31, 2004 | 26,610,100 | $ | 613,265 | $ | (17,588 | ) | $ | 619 | $ | 596,296 | ||||||
| Issuance of trust stock to manager | 433,001 | 12,088 | — | — | 12,088 | |||||||||||
| Issuance of trust stock to independent directors | 7,644 | 191 | — | — | 191 | |||||||||||
| Adjustment to offering costs | — | 427 | — | — | 427 | |||||||||||
| Distributions to trust stockholders (comprising $1.5877 per share paid on 27,050,745 shares) | — | (42,948 | ) | — | — | (42,948 | ) | |||||||||
| Other comprehensive income (loss): | ||||||||||||||||
| Net income for the year ended December 31, 2005 | — | — | 15,196 | — | 15,196 | |||||||||||
| Translation adjustment | — | — | — | (16,160 | ) | (16,160 | ) | |||||||||
| Unrealized gain on marketable securities | 2,106 | 2,106 | ||||||||||||||
| Change in fair value of derivatives, net of taxes of $1,707 | — | — | — | 469 | 469 | |||||||||||
| Total comprehensive income for the year ended December 31, 2005 | 1,611 | |||||||||||||||
| Balance at December 31, 2005 | 27,050,745 | $ | 583,023 | $ | (2,392 | ) | $ | (12,966 | ) | $ | 567,665 | |||||
| Issuance of trust stock, net of offering costs | 10,350,000 | 291,104 | — | — | 291,104 | |||||||||||
| Issuance of trust stock to manager | 145,547 | 4,134 | — | — | 4,134 | |||||||||||
| Issuance of trust stock to independent directors | 15,873 | 450 | — | — | 450 | |||||||||||
| Distributions to trust stockholders (comprising $0.50 per share paid on 27,050,745 and 27,066,618 shares, $0.525 per share paid on 27,212,165 shares and $0.55 per share paid on 37,562,165 shares) | — | (14,478 | ) | (47,526 | ) | — | (62,004 | ) | ||||||||
| Change in post-retirement benefit plans, net of taxes of $118 | — | — | — | 187 | 187 | |||||||||||
| Other comprehensive income (loss): | ||||||||||||||||
| Net income for the year ended December 31, 2006 | — | — | 49,918 | — | 49,918 | |||||||||||
| Translation adjustment | — | — | — | 13,597 | 13,597 | |||||||||||
| Translation adjustment reversed upon sale of foreign investments | — | — | — | 1,708 | 1,708 | |||||||||||
| Change in fair value of derivatives, net of taxes of $832 | — | — | — | 1,462 | 1,462 | |||||||||||
| Change in fair value of derivatives reversed upon sale of foreign investments | — | — | — | (1,927 | ) | (1,927 | ) | |||||||||
| Unrealized gain on marketable securities | — | — | — | 7,416 | 7,416 | |||||||||||
| Gain on marketable securities, realized | — | — | — | (9,285 | ) | (9,285 | ) | |||||||||
| Total comprehensive income for the year ended December 31, 2006 | 62,889 | |||||||||||||||
| Balance at December 31, 2006 | 37,562,165 | $ | 864,233 | $ | — | $ | 192 | $ | 864,425 | |||||||
MACQUARIE INFRASTRUCTURE COMPANY TRUST
CONSOLIDATED STATEMENTS OF
EQUITY AND COMPREHENSIVE INCOME (LOSS) – (continued)
| Macquarie Infrastructure Company LLC Member’s Equity | ||||||||||||||||||||||||||||||||
| Trust stock and LLC interests | Additional Paid in Capital | Accumulated Deficit | Accumulated Other Comprehensive Income (Loss) | Total Members’ Equity | Noncontrolling Interests(1) | Total Equity | ||||||||||||||||||||||||||
| Number of Shares | Amount | |||||||||||||||||||||||||||||||
| ($ in Thousands, Except Share and Per Share Data) | ||||||||||||||||||||||||||||||||
| Change in fair value of derivatives, net of taxes of $49,188 | — | — | — | — | (74,267 | ) | (74,267 | ) | — | (74,267 | ) | |||||||||||||||||||||
| Reclassification of realized losses of derivatives into earnings, net of taxes of $10,255 | — | — | — | — | 15,639 | 15,639 | — | 15,639 | ||||||||||||||||||||||||
| Unrealized loss on marketable securities | — | — | — | — | (1 | ) | (1 | ) | — | (1 | ) | |||||||||||||||||||||
| Change in post-retirement benefit plans, net of taxes of $3,539 | — | — | — | — | (5,502 | ) | (5,502 | ) | — | (5,502 | ) | |||||||||||||||||||||
| Total comprehensive loss for the year ended December 31, 2008 | (242,608 | ) | (1,168 | ) | (243,776 | ) | ||||||||||||||||||||||||||
| Balance at December 31, 2008 | 44,948,694 | $ | 956,956 | $ | — | $ | (230,928 | ) | $ | (97,190 | ) | $ | 628,838 | $ | 5,423 | $ | 634,261 | |||||||||||||||
| Issuance of LLC interests to manager | 330,104 | 2,491 | — | — | — | 2,491 | — | 2,491 | ||||||||||||||||||||||||
| Issuance of LLC interests to independent directors | 14,115 | 450 | — | — | — | 450 | — | 450 | ||||||||||||||||||||||||
| Distributions to noncontrolling interest members | — | — | — | — | — | — | (583 | ) | (583 | ) | ||||||||||||||||||||||
| Sale of subsidiary interest to noncontrolling interest | — | — | 21,956 | — | 4,685 | 26,641 | (7,352 | ) | 19,289 | |||||||||||||||||||||||
| Other comprehensive loss: | ||||||||||||||||||||||||||||||||
| Net loss for the year ended December 31, 2009 | — | — | — | (129,167 | ) | — | (129,167 | ) | (1,377 | ) | (130,544 | ) | ||||||||||||||||||||
| Change in fair value of derivatives, net of taxes of $1,050 | — | — | — | — | 1,498 | 1,498 | — | 1,498 | ||||||||||||||||||||||||
| Reclassification of realized losses of derivatives into earnings, net of taxes of $31,885 | — | — | — | — | 47,857 | 47,857 | 131 | 47,988 | ||||||||||||||||||||||||
| Change in post-retirement benefit plans, net of taxes of $53 | — | — | — | — | (82 | ) | (82 | ) | — | (82 | ) | |||||||||||||||||||||
| Total comprehensive loss for the year ended December 31, 2009 | (79,894 | ) | (1,246 | ) | (81,140 | ) | ||||||||||||||||||||||||||
| Balance at December 31, 2009 | 45,292,913 | $ | 959,897 | $ | 21,956 | $ | (360,095 | ) | $ | (43,232 | ) | $ | 578,526 | $ | (3,758 | ) | $ | 574,768 | ||||||||||||||
Year Ended December 31, 2006 | Year Ended December 31, 2005 | April 13, 2004 (inception) to December 31, 2004 | ||||||||||||||||
| ($ in thousands) | ||||||||||||||||||
Operating activities | ||||||||||||||||||
| Net income (loss) | $ | 49,918 | $ | 15,196 | $ | (17,588 | ) | |||||||||||
| Adjustments to reconcile net income to net cash provided by operating activities: | ||||||||||||||||||
| Depreciation and amortization of property and equipment | 21,366 | 14,098 | 370 | |||||||||||||||
| Amortization of intangible assets | 43,846 | 14,815 | 281 | |||||||||||||||
| Loss on disposal of equipment | 140 | 674 | — | |||||||||||||||
| Equity in (earnings) loss and amortization charges of investee | (4,293 | ) | 1,803 | 389 | ||||||||||||||
| Gain on sale of unconsolidated business | (3,412 | ) | — | — | ||||||||||||||
| Gain on sale of investments | (49,933 | ) | — | — | ||||||||||||||
| Gain on sale of marketable securities | (6,738 | ) | — | — | ||||||||||||||
| Amortization of finance charges | 6,178 | 6,290 | — | |||||||||||||||
| Noncash derivative loss | 1,373 | — | — | |||||||||||||||
| Noncash interest expense | 4,506 | (4,166 | ) | — | ||||||||||||||
| Noncash performance fees expense | 4,134 | — | — | |||||||||||||||
| Noncash directors fees expense | 181 | — | — | |||||||||||||||
| Accretion of asset retirement obligation | 224 | 222 | — | |||||||||||||||
| Deferred rent | 2,475 | 2,308 | 80 | |||||||||||||||
| Deferred revenue | 109 | (130 | ) | (62 | ) | |||||||||||||
| Deferred taxes | (14,725 | ) | (5,695 | ) | — | |||||||||||||
| Minority interests | (23 | ) | 203 | 16 | ||||||||||||||
| Noncash compensation | 706 | 209 | — | |||||||||||||||
| Post retirement obligations | 557 | (116 | ) | — | ||||||||||||||
| Other noncash income | (80 | ) | — | — | ||||||||||||||
| Accrued interest expense on subordinated debt – related party | 1,087 | 1,003 | 26 | |||||||||||||||
| Accrued interest income on subordinated debt – related party | (430 | ) | (399 | ) | (50 | ) | ||||||||||||
| Changes in operating assets and liabilities: | ||||||||||||||||||
| Restricted cash | 4,216 | (462 | ) | — | ||||||||||||||
| Accounts receivable | (5,330 | ) | (7,683 | ) | (420 | ) | ||||||||||||
| Equipment lease receivable, net | 1,880 | 1,677 | (121 | ) | ||||||||||||||
| Dividend receivable | 2,356 | (651 | ) | (1,704 | ) | |||||||||||||
| Inventories | 352 | (178 | ) | 686 | ||||||||||||||
| Prepaid expenses and other current assets | (4,601 | ) | (39 | ) | (439 | ) | ||||||||||||
| Due to subsidiaries | — | — | 1,398 | |||||||||||||||
| Accounts payable and accrued expenses | (9,954 | ) | 1,882 | 798 | ||||||||||||||
| Income taxes payable | (3,213 | ) | — | — | ||||||||||||||
| Due to manager | 1,647 | 2,419 | 12,306 | |||||||||||||||
| Other | 1,846 | 267 | (11 | ) | ||||||||||||||
| Net cash provided by (used in) operating activities | $ | 46,365 | $ | 43,547 | $ | (4,045 | ) | |||||||||||
Investing activities | ||||||||||||||||||
| Acquisition of businesses and investments, net of cash acquired | $ | (845,063 | ) | $ | (182,367 | ) | $ | (467,413 | ) | |||||||||
| Additional costs of acquisitions | (22 | ) | (60 | ) | — | |||||||||||||
| Deposits and deferred costs on future acquisitions | (279 | ) | (14,746 | ) | — | |||||||||||||
| Goodwill adjustment – cash received | — | 694 | — | |||||||||||||||
| Proceeds from sale of investment | 89,519 | — | — | |||||||||||||||
| Proceeds from sale of marketable securities | 76,737 | — | — | |||||||||||||||
| Collection on notes receivable | — | 358 | — | |||||||||||||||
| Purchases of property and equipment | (18,409 | ) | (6,743 | ) | (81 | ) | ||||||||||||
| Return on investment in unconsolidated business | 10,471 | — | — | |||||||||||||||
| Proceeds received on subordinated loan | 850 | 914 | — | |||||||||||||||
| Other | — | — | 17 | |||||||||||||||
| Net cash used in investing activities | $ | (686,196 | ) | $ | (201,950 | ) | $ | (467,477 | ) | |||||||||
| (1) | Reclassified to conform to current period presentation. |
CONSOLIDATED STATEMENTS OF CASH FLOWS
| Year Ended December 31, 2009 | Year Ended December 31, 2008(1) | Year Ended December 31, 2007(1) | ||||||||||||
| ($ In Thousands) | ||||||||||||||
| Operating activities | ||||||||||||||
| Net loss | $ | (129,167 | ) | $ | (178,473 | ) | $ | (52,054 | ) | |||||
| Adjustments to reconcile net loss to net cash provided by operating activities: | ||||||||||||||
| Net loss from discontinued operations | 19,997 | 108,292 | 8,925 | |||||||||||
| Non-cash goodwill impairment | 71,200 | 52,000 | — | |||||||||||
| Depreciation and amortization of property and equipment | 42,899 | 45,953 | 26,294 | |||||||||||
| Amortization of intangible assets | 60,892 | 61,874 | 32,356 | |||||||||||
| Equity in (earnings) losses and amortization charges of investees | (22,561 | ) | (1,324 | ) | 32 | |||||||||
| Equity distributions from investees | 7,000 | 1,324 | — | |||||||||||
| Amortization of debt financing costs | 5,121 | 4,762 | 4,429 | |||||||||||
| Non-cash derivative loss (gain), net of non-cash interest expense (income) | 29,540 | 2,843 | (2,693 | ) | ||||||||||
| Base management and performance fees settled/to be settled in LLC interests | 4,384 | — | 43,962 | |||||||||||
| Equipment lease receivable, net | 2,610 | 2,372 | 2,531 | |||||||||||
| Deferred rent | 183 | 183 | 178 | |||||||||||
| Deferred taxes | (17,923 | ) | (16,037 | ) | (22,536 | ) | ||||||||
| Other non-cash expenses, net | 2,601 | 4,700 | 4,243 | |||||||||||
| Non-operating losses relating to foreign investments | — | — | 3,437 | |||||||||||
| Loss on extinguishment of debt | — | — | 27,512 | |||||||||||
| Changes in other assets and liabilities, net of acquisitions: | ||||||||||||||
| Restricted cash | — | — | 264 | |||||||||||
| Accounts receivable | 13,020 | 16,392 | (12,244 | ) | ||||||||||
| Inventories | 1,233 | 2,698 | (3,291 | ) | ||||||||||
| Prepaid expenses and other current assets | 3,086 | 6,928 | 605 | |||||||||||
| Due to manager – related party | (3,438 | ) | (2,216 | ) | 1,453 | |||||||||
| Accounts payable and accrued expenses | (4,670 | ) | (17,132 | ) | 22,923 | |||||||||
| Income taxes payable | 535 | (1,108 | ) | 4,981 | ||||||||||
| Other, net | (3,566 | ) | 1,548 | 2,192 | ||||||||||
| Net cash provided by operating activities from continuing operations | 82,976 | 95,579 | 93,499 | |||||||||||
| Investing activities | ||||||||||||||
| Acquisitions of businesses and investments, net of cash acquired | — | (41,804 | ) | (704,171 | ) | |||||||||
| Proceeds from sale of equity investment | — | — | 84,904 | |||||||||||
| Proceeds from sale of investment | 29,500 | 7,557 | 160 | |||||||||||
| Settlements of non-hedging derivative instruments | — | — | (2,530 | ) | ||||||||||
| Purchases of property and equipment | (30,320 | ) | (49,560 | ) | (45,721 | ) | ||||||||
| Return of investment in unconsolidated business | — | 26,676 | 28,000 | |||||||||||
| Other | 304 | 415 | 505 | |||||||||||
| Net cash used in investing activities from continuing operations | (516 | ) | (56,716 | ) | (638,853 | ) | ||||||||
Year Ended December 31, 2006 | Year Ended December 31, 2005 | April 13, 2004 (inception) to December 31, 2004 | ||||||||||||||
| ($ in thousands) | ||||||||||||||||
Financing activities | ||||||||||||||||
| Proceeds from issuance of shares of trust stock | $ | 305,325 | $ | — | $ | 665,250 | ||||||||||
| Proceeds from long-term debt | 537,000 | 390,742 | (1,500 | ) | ||||||||||||
| Proceeds from line-credit facility | 455,957 | 850 | — | |||||||||||||
| Contributions received from minority shareholders | — | 1,442 | — | |||||||||||||
| Distributions paid to trust shareholders | (62,004 | ) | (42,948 | ) | — | |||||||||||
| Debt financing costs | (14,217 | ) | (11,350 | ) | — | |||||||||||
| Distributions paid to minority shareholders | (736 | ) | (1,219 | ) | — | |||||||||||
| Payment of long-term debt | (638,356 | ) | (197,170 | ) | — | |||||||||||
| Offering and equity raise costs | (14,220 | ) | (1,844 | ) | (51,985 | ) | ||||||||||
| Restricted cash | (4,228 | ) | (2,362 | ) | — | |||||||||||
| Payment of notes and capital lease obligations | (2,193 | ) | (1,605 | ) | — | |||||||||||
| Acquisition of swap contract | — | (689 | ) | — | ||||||||||||
| Net cash provided by financing activities | 562,328 | 133,847 | 611,765 | |||||||||||||
| Effect of exchange rate changes on cash | (272 | ) | (331 | ) | (193 | ) | ||||||||||
| Net change in cash and cash equivalents | (77,775 | ) | (24,887 | ) | 140,050 | |||||||||||
| Cash and cash equivalents, beginning of period | 115,163 | 140,050 | — | |||||||||||||
| Cash and cash equivalents, end of period | $ | 37,388 | $ | 115,163 | $ | 140,050 | ||||||||||
Supplemental disclosures of cash flow information: | ||||||||||||||||
| Noncash investing and financing activities: | ||||||||||||||||
| Accrued deposits and deferred costs on acquisition, and equity offering costs | $ | 3 | $ | — | $ | 2,270 | ||||||||||
| Accrued purchases of property and equipment | $ | 1,438 | $ | 384 | $ | 810 | ||||||||||
| Acquisition of property through capital leases | $ | 2,331 | $ | 3,270 | $ | — | ||||||||||
| Issuance of trust stock to manager for payment of December 2004 performance fees | $ | — | $ | 12,088 | $ | — | ||||||||||
| Issuance of trust stock to independent directors | $ | 269 | $ | 191 | $ | — | ||||||||||
| Taxes paid | $ | 1,835 | $ | 2,610 | $ | — | ||||||||||
| Interest paid | $ | 65,967 | $ | 30,902 | $ | 2,056 | ||||||||||
MACQUARIE INFRASTRUCTURE COMPANY TRUSTLLC
CONSOLIDATED STATEMENTS OF CASH FLOWS – (continued)
| Year Ended December 31, 2009 | Year Ended December 31, 2008(1) | Year Ended December 31, 2007(1) | ||||||||||||
| ($ In Thousands) | ||||||||||||||
| Financing activities | ||||||||||||||
| Proceeds from issuance of LLC interests | — | — | 252,739 | |||||||||||
| Proceeds from long-term debt | 10,000 | 5,000 | 1,356,625 | |||||||||||
| Net (payments) proceeds on line of credit facilities | (45,400 | ) | 96,150 | 11,560 | ||||||||||
| Offering and equity raise costs paid | — | (65 | ) | (11,392 | ) | |||||||||
| Distributions paid to holders of LLC interests | — | (95,509 | ) | (97,913 | ) | |||||||||
| Distributions paid to noncontrolling interests | (583 | ) | (481 | ) | (395 | ) | ||||||||
| Payment of long-term debt | (81,621 | ) | — | (904,500 | ) | |||||||||
| Debt financing costs paid | — | (1,879 | ) | (26,234 | ) | |||||||||
| Make — whole payment on debt refinancing | — | — | (14,695 | ) | ||||||||||
| Change in restricted cash | (33 | ) | (865 | ) | 5,367 | |||||||||
| Payment of notes and capital lease obligations | (181 | ) | (653 | ) | (544 | ) | ||||||||
| Net cash (used in) provided by financing activities from continuing operations | (117,818 | ) | 1,698 | 570,618 | ||||||||||
| Net change in cash and cash equivalents from continuing operations | (35,358 | ) | 40,561 | 25,264 | ||||||||||
| Cash flows (used in) provided by discontinued operations: | ||||||||||||||
| Net cash (used in) provided by operating activities | (4,732 | ) | (1,904 | ) | 3,051 | |||||||||
| Net cash used in investing activities | (445 | ) | (26,684 | ) | (5,157 | ) | ||||||||
| Net cash provided by (used in) financing activities | 2,144 | (1,215 | ) | (3,072 | ) | |||||||||
| Cash used in discontinued operations(2) | (3,033 | ) | (29,803 | ) | (5,178 | ) | ||||||||
| Change in cash of discontinued operations held for sale(2) | (208 | ) | 2,459 | 5,902 | ||||||||||
| Effect of exchange rate changes on cash | — | — | (1 | ) | ||||||||||
| Net change in cash and cash equivalent | (38,599 | ) | 13,217 | 25,987 | ||||||||||
| Cash and cash equivalents, beginning of period | 66,054 | 52,837 | 26,850 | |||||||||||
| Cash and cash equivalents, end of period | $ | 27,455 | $ | 66,054 | $ | 52,837 | ||||||||
| Supplemental disclosures of cash flow information for continuing operations: | ||||||||||||||
| Non-cash investing and financing activities: | ||||||||||||||
| Accrued acquisition and equity offering costs | $ | — | $ | — | $ | 1,208 | ||||||||
| Accrued purchases of property and equipment | $ | 1,277 | $ | 883 | $ | 1,647 | ||||||||
| Acquisition of equipment through capital leases | $ | — | $ | — | $ | 30 | ||||||||
| Issuance of LLC interests to manager for base management and performance fees | $ | 2,490 | $ | — | $ | 43,962 | ||||||||
| Issuance of LLC interests to independent directors | $ | 450 | $ | 450 | $ | 450 | ||||||||
| Taxes paid | $ | 1,231 | $ | 3,048 | $ | 3,632 | ||||||||
| Interest paid | $ | 87,308 | $ | 84,235 | $ | 77,914 | ||||||||
| (1) | Reclassified to conform to current period presentation. |
| (2) | Cash of discontinued operations held for sale is reported in assets of discontinued operations held for sale in the accompanying consolidated balance sheets. The cash used in discontinued operations is different than the change in cash of discontinued operations held for sale due to intercompany transactions that are eliminated in consolidation. |
See accompanying notes to the consolidated financial statements.
MACQUARIE INFRASTRUCTURE COMPANY LLC
NOTES TO CONSOLIDATED FINANCIAL STATEMENTS
1. Organization and Description of Business
Macquarie Infrastructure Company Trust, or the Trust,LLC, a Delaware statutory trust,limited liability company, was formed on April 13, 2004. Macquarie Infrastructure Company LLC, orboth on an individual entity basis and together with its consolidated subsidiaries, is referred to in these financial statements as “the Company”. The Company owns, operates and invests in a diversified group of infrastructure businesses in the Company, a Delaware limited liability company, was also formed on April 13, 2004. Prior to December 21, 2004, the Trust was a wholly owned subsidiary ofUnited States. Macquarie Infrastructure Management (USA) Inc., or MIMUSA. MIMUSA, is the Company’s manager and is referred to in these financial statements as the Manager. The Manager is a subsidiary of the Macquarie Group of companies, which is comprised of Macquarie BankGroup Limited and its subsidiaries and affiliates worldwide. Macquarie BankGroup Limited is headquartered in Australia and is listed on the Australian Stock Exchange.
Macquarie Infrastructure Company Trust, or the Trust, a Delaware statutory trust, was also formed on April 13, 2004. Prior to December 21, 2004 and the completion of the initial public offering, the Trust was a wholly-owned subsidiary of the Manager. On June 25, 2007, all of the outstanding shares of trust stock issued by the Trust were exchanged for an equal number of limited liability company, or LLC, interests in the Company, and the Trust was dissolved. Prior to this exchange of trust stock for LLC interests and the dissolution of the Trust, all interests in the Company were formed to own, operate and invest in a diversified group of infrastructure businesses inheld by the United States and other developed countries.Trust. The Company is thecontinues to be an operating entity with a Board of Directors and other corporate governance responsibilities generally consistent with that of a Delaware corporation.
The Company owns airport services, airport parking, district energy and gas production and distributionits businesses and an interest in a bulk liquid storage terminal business, through the Company’sits wholly-owned subsidiary Macquarie Infrastructure Company Inc., or MIC Inc.
The Energy-Related Businesses:
| (i) | a 50% interest in a bulk liquid storage terminal business (“International Matex Tank Terminals” or “IMTT”), which provides bulk liquid storage and handling services at ten marine terminals in the United States and two in Canada and is one of the largest participants in this industry in the U.S., based on capacity; |
| (ii) | a gas production and distribution business (“The Gas Company”), which is a full-service gas energy company, making gas products and services available in Hawaii; and, |
| (iii) | a 50.01% controlling interest in a district energy business (“Thermal Chicago” or “District Energy”), which operates the largest district cooling system in the U.S., serving various customers in Chicago, Illinois and Las Vegas, Nevada. |
The Aviation-Related Business — an entity that operates twoairport services business (“Atlantic Aviation”), comprising a network of 72 fixed basedbase operations, or FBOs, providing products and services including fuel and aircraft hangaring/parking to owners and operators of private jets at 68 airports and one heliport in California.
On August 12, 2005,January 28, 2010, the Company acquired allagreed to sell the assets in its airport parking business (“Parking Company of the membership interests in Eagle Aviation Resources, Ltd.,America Airports” or EAR, an FBO company doing business as Las Vegas Executive Air Terminal.
2. Summary of Significant Accounting Policies
Principles of Consolidation
The accompanying consolidated financial statements include the accounts of the Company and its wholly ownedwholly-owned subsidiaries. All significant intercompany balances and transactions have been eliminated in consolidation. Except as otherwise specified, we refer to Macquarie Infrastructure Company LLC and its subsidiaries collectively as the “Company”. The Company consolidates investments where it has a controlling financial interest. The usual condition for a controlling financial interest is ownership of a majority of the voting interest and, therefore, as a general rule, ownership, directly or indirectly, of over 50% of the outstanding
MACQUARIE INFRASTRUCTURE COMPANY LLC
NOTES TO CONSOLIDATED FINANCIAL STATEMENTS
2. Summary of Significant Accounting Policies – (continued)
voting shares is a condition for consolidation. For investments in variable interest entities, as defined by Financial Accounting Standards Board (FASB) Interpretation No. 46R, Consolidation of Variable Interest Entities, the Company consolidates when it is determined to be the primary beneficiary of the variable interest entity. As of December 31, 2006,2009, the Company was not the primary beneficiary of any variable interest entity in which it did not own a majority of the outstanding voting stock.
Investments
The Company accounts for 50% or less owned companies over which it has the ability to exercise significant influence using the equity method of accounting, otherwise the cost method is used. The Company’s share of net income or losses of equity investments is included in equity in earnings (loss) and amortization charges of investee in the consolidated statementstatements of operations. Losses are recognized in other income (expense) when a decline in the value of the investment is deemed to be other than temporary. In making this determination, the Company considers Accounting Principles Board (APB) Opinion No. 18, The Equity Method of Accounting for Investments in Common Stock and related interpretations, which set forth factors to be evaluated in determining whether a loss in value should be recognized, including the Company’s ability to hold its investment and inability of the investee to sustain an earnings capacity, which would justify the carrying amount of the investment.
Use of Estimates
The preparation of our consolidated financial statements in conformity with generally accepted accounting principles, or GAAP, requires usthe Company to make estimates and assumptions. These estimates and assumptions affect the reported amounts of assets and liabilities, the disclosure of contingent assets and liabilities at the date of the consolidated financial statements, and the reported amounts of revenue and expenses during the reporting period. We evaluateThe Company evaluates these estimates and judgments on an ongoing basis and base ourthe estimates are based on experience, current and expected future conditions, third-party evaluations and various other assumptions that we believethe Company believes are reasonable under the circumstances. Significant items subject to such estimates and assumptions include the carrying amount of property, equipment and leasehold improvements, intangibles, asset retirement obligations and goodwill; valuation allowances for receivables, inventories and deferred income tax assets; assets and obligations related to employee benefits; environmental liabilities; and valuation of derivative instruments. The results of these estimates form the basis for making judgments about the carrying values of assets and liabilities as well as identifying and assessing the accounting treatment with respect to commitments and contingencies. Actual results may differ from the estimates and assumptions used in the financial statements and related notes.
Cash and Cash Equivalents
The Company considers all highly liquid investments with a maturity of three months or less when purchased to be cash equivalents. Included in cash and cash equivalents at December 31, 2005 is $87.02008 was $15.0 million of commercial paper. There was no commercial paper, held asissued by a counterparty with a Standard & Poor rating of December 31, 2006.
Restricted Cash
The Company classifies all cash pledged as collateral on the outstanding senior debt as restricted cash in the consolidated balance sheets. At December 31, 2006 and December 31, 2005, thesheets relating to Atlantic Aviation. The Company has recorded $23.7
Allowance for Doubtful Accounts
The Company uses estimates to determine the amount of the allowance for doubtful accounts necessary to reduce billed and unbilled accounts receivable to their net realizable value. The Company estimates the amount of the required allowance by reviewing the status of past-due receivables and analyzing historical bad debt trends. Actual collection experience has not varied significantly from estimates due primarily to credit policies and a lack of concentration of accounts receivable. The Company writes off receivables deemed to be uncollectible to the allowance for doubtful accounts. Accounts receivable balances are not collateralized.
MACQUARIE INFRASTRUCTURE COMPANY LLC
NOTES TO CONSOLIDATED FINANCIAL STATEMENTS
2. Summary of Significant Accounting Policies – (continued)
Inventory
Inventory consists principally of fuel purchased from various third-party vendors and materials and supplies.supplies at Atlantic Aviation and The Gas Company. Fuel inventory is stated at the lower of cost or market. Materials and supplies inventory is valued at the lower of average cost or market cost.market. Inventory sold is recorded using the first-in-first-out method at Atlantic Aviation and an average cost method at The Gas Company. Cash flows related to the sale of inventory are classified in net cash provided by operating activities in ourthe consolidated statementstatements of cash flows. The Company’s inventory balance at December 31, 20062009 comprised $8.7$10.1 million of fuel and $4.1$4.2 million of materials and supplies. InventoryThe Company’s inventory balance at December 31, 20052008 comprised $2.0$11.7 million of fuel.
Property, Equipment, Land and Leasehold Improvements
Property, equipment and land are initially recorded at cost less accumulated depreciation.cost. Leasehold improvements are recorded at the initial present value of the minimum lease payments less accumulated amortization. Major renewals and improvements are capitalized while maintenance and repair expenditures are expensed when incurred. We depreciate ourInterest expense relating to construction in progress is capitalized as an additional cost of the asset. The Company depreciates property, equipment and leasehold improvements over their estimated useful lives on a straight-line basis. Depreciation expense for our district energy and airport parking businesses areDistrict Energy is included within cost of services in ourthe consolidated statements of operations. The estimated economic useful lives range according to the table below:
| Buildings | 10 to 68 years | |||
| Leasehold and land improvements | 3 to 40 years | |||
| Machinery and equipment | 1 to 62 years | |||
| Furniture and | 3 to 25 years | |||
Goodwill and Intangible Assets
Goodwill consists of costs in excess of the aggregate purchase price over the fair value of tangible and identifiable intangible net assets acquired in the purchase business combinations as described in Note 4. Intangible assets acquired in the purchase business combinations include contractual rights, customer relationships, non-compete agreements, trade names, leasehold rights, domain names, and technology.5, “Acquisitions”. The cost of intangible assets with determinable useful lives are amortized over their estimated useful lives ranging from 1 to 40 years.as follows:
| Customer relationships | 5 to 10 years | |||
| Contract rights | 5 to 40 years | |||
| Non-compete agreements | 2 to 5 years | |||
| Leasehold interests | 3 to 15 years | |||
| Trade names | Indefinite | |||
| Technology | 5 years | |||
Impairment of Long-lived Assets, Excluding Goodwill
Long-lived assets, including amortizable intangible assets, are reviewed for impairment whenever events or changes in
MACQUARIE INFRASTRUCTURE COMPANY LLC
NOTES TO CONSOLIDATED FINANCIAL STATEMENTS
2. Summary of Significant Accounting Policies – (continued)
Impairment of Goodwill
Goodwill and Other Intangible Assets, goodwill is tested for impairment annually.at least annually or when there is a triggering event that indicates impairment. Goodwill is considered impaired when the carrying amount of a reporting unit’s goodwill exceeds its implied fair value, as determined under a two-step approach. The first step is to determine the estimated fair value of each reporting unit with goodwill. The reporting units of the Company, for purposes of the impairment test, are those components of operating segments for which discrete financial information is available and segment management regularly reviews the operating results of that component. Components are combined when determining reporting units if they have similar economic characteristics.
The Company estimates the fair value of each reporting unit by estimating the present value of the reporting unit’s future discounted cash flows.flows or value expected to be realized in a third party sale. If the recorded net assets of the reporting unit are less than the reporting unit’s estimated fair value, then no impairment is indicated. Alternatively, if the recorded net assets of the reporting unit exceed its estimated fair value, then goodwill is assumed to be impaired and a second step is performed. In the second step, the implied fair value of goodwill is determined by deducting the estimated fair value of all tangible and identifiable intangible net assets of the reporting unit from the estimated fair value of the reporting unit. If the recorded amount of goodwill exceeds this implied fair value, an impairment charge is recorded for the excess.
Impairment of Indefinite-lived Intangibles, Excluding Goodwill
Indefinite-lived intangibles, primarily trademarks and domain names, are considered impaired when the carrying amount of the asset exceeds its implied fair value.
The Company estimates the fair value of each trademark using the relief-from-royalty method that discounts the estimated net cash flows the Company would have to pay to license the trademark under an arm’s length licensing agreement. The Company estimates the fair value of each domain name using a method that discounts the estimated net cash flows attributable to the domain name.
If the recorded indefinite-liveindefinite-lived intangible is less than its estimated fair value, then no impairment is indicated. Alternatively, if the recorded intangible asset exceeds its fair value, an impairment loss is recognized in an amount equal to that excess.
Debt Issuance Costs
The Company capitalizes all direct costs incurred in connection with the issuance of debt as debt issuance costs. These costs are amortized over the contractual term of the debt instrument, which ranges from 3 to 197 years, using the effective interest method.
Derivative Instruments
The Company accounts for derivatives and hedging activities in accordance with ASC 815Derivatives and Hedging(formerly SFAS No. 133, “Accounting for Derivative Instruments and Certain Hedging Activities”, as amended,amended), which requires that all derivative instruments be recorded on the balance sheet at their respective fair values.
Previously, the Company applied hedge accounting to its derivative instruments. On the date a derivative contract iswas entered into, the Company designatesdesignated the derivative as either a hedge of the fair value of a recognized asset or liability or of an unrecognized firm commitment (fair value hedge), a hedge of a forecasted transaction or the variability of cash flows to be received or paid related to a recognized asset or liability (cash flow hedge), or a foreign-currency fair-value or cash-flow hedge (foreign currency hedge). For all hedging relationships the
MACQUARIE INFRASTRUCTURE COMPANY LLC
NOTES TO CONSOLIDATED FINANCIAL STATEMENTS
2. Summary of Significant Accounting Policies – (continued)
The Company formally documentsdocumented the hedging relationship and its risk-management objective and strategy for undertaking the hedge, the hedging instrument, the hedged item, the nature of the risk being hedged, how the hedging instrument’s effectiveness in offsetting the hedged risk willwould be assessed prospectively and retrospectively, and a description of the method of measuring ineffectiveness. This process includesincluded linking all derivatives that arewere designated as fair-value, cash-flow, or foreign-currency hedges to specific assets and liabilities on the balance sheet or to specific firm commitments or forecasted transactions. The Company also formally assesses,assessed, both at the hedge’s inception and on an ongoing basis, whether the derivatives that are used in hedging transactions arewere highly effective in offsetting changes in fair values or cash flows of hedged items. Changes in the fair value of a derivative that iswere highly effective and that iswere designated and qualifies as a fair-value hedge, along with the loss or gain on the hedged asset or liability or unrecognized firm commitment of the hedged item that is attributable to the hedged risk, are recorded in earnings. Changes in the fair value of a derivative that is highly effective and that is designated and qualifiesqualified as a cash-flow hedge arewere recorded in other comprehensive income to the extent that the derivative iswas effective as a hedge, until earnings arewere affected by the variability in cash flows of the designated hedged item. Changes in the fair value of derivatives that are highly effective as hedges and that are designated and qualify as foreign-currency hedges are recorded in either earnings or other comprehensive income, depending on whether the hedge transaction is a fair-value hedge or a cash-flow hedge. The ineffective portion of the change in fair value of a derivative instrument that qualifiesqualified as either a fair-value hedge or a cash-flow hedge iswas reported in earnings.
The Company discontinues hedge accounting prospectively when it is determined that the derivative is no longer effective in offsetting changes in the fair value or cash flows of the hedged item,item; the derivative expires or is sold, terminated, or exercised,exercised; the derivative is no longer designated as a hedging instrument because it is unlikely that a forecasted transaction will occur,occur; a hedged firm commitment no longer meets the definition of a firm commitment,commitment; or management determines that designation of the derivative as a hedging instrument is no longer appropriate.
In all situations in which hedge accounting is discontinued, the Company continues to carry the derivative at its fair value on the balance sheet and recognizes any subsequent changes in its fair value in earnings. When hedge accounting is discontinued because it is determined that the derivative no longer qualifies as an effective fair-value hedge, the Company no longer adjusts the hedged asset or liability for changes in fair value. The adjustment of the carrying amount of the hedged asset or liability is accounted for in the same manner as other components of the carrying amount of that asset or liability. When hedge accounting is discontinued because the hedged item no longer meets the definition of a firm commitment, the Company removes any asset or liability that was recorded pursuant to recognition of the firm commitment from the balance sheet, and recognizes any gain or loss in earnings. When hedge accounting is discontinued because it is probable that a forecasted transaction will not occur, the Company recognizes immediately in earnings gains and losses that were accumulated in other comprehensive income.
As of February 25, 2009 for Atlantic Aviation and effective April 1, 2009 for the other businesses, the Company elected to discontinue hedge accounting. From the dates that hedge accounting was discontinued, all movements in the fair value of the interest rate swaps are recorded directly through earnings. As a result of the discontinuance of hedge accounting, the Company will reclassify into earnings net derivative losses included in accumulated other comprehensive loss over the remaining life of the existing interest rate swaps. See Note 13, “Derivative Instruments and Hedging Activities”, for further discussion.
Financial Instruments
The Company’s financial instruments, including cash and cash equivalents, accounts receivable, accounts payable and variable rate senior debt, are carried at cost, which approximates their fair value because of either the short-term maturity, or variable or competitive interest rates assigned to these financial instruments.
Concentrations of Credit Risk
Financial instruments that potentially expose the Company to concentrations of credit risk consist primarily of cash and cash equivalents and accounts receivable. The Company places its cash and cash equivalents with financial institutions and its balances may exceed federally insured limits. The Company’s accounts receivable are mainly derived from fuel and gas sales and services rendered under contract terms with commercial and private customers located primarily in the United States. At December 31, 2009 and December 31, 2008, there were no outstanding accounts receivable due from a single customer that accounted for more than 10% of the total accounts receivable. Additionally, no single customer accounted for more than 10% of the Company’s revenue during the years ended December 31, 2009, 2008 and 2007.
MACQUARIE INFRASTRUCTURE COMPANY LLC
NOTES TO CONSOLIDATED FINANCIAL STATEMENTS
2. Summary of Significant Accounting Policies – (continued)
(Loss) Earnings per Share
The Company calculates (loss) earnings per share using the weighted average number of common shares outstanding during the period. Diluted (loss) earnings per share is computed using the weighted average number of common and dilutive common equivalent shares outstanding during the period. Common equivalent shares consist of shares issuable upon the exercise of stock options (using the treasury stock method) and stock units granted to the Company’s independent directors; common equivalent shares are excluded from the calculation if their effect is anti-dilutive.
Comprehensive (Loss) Income
The Company follows the requirements of ASC 220Comprehensive Income(formerly SFAS No. 130, “Reporting Comprehensive Income”), for the reporting and presentation of comprehensive (loss) income and its components. This guidance requires unrealized gains or losses on the Company’s available for sale securities, foreign currency translation adjustments, minimum pension liability adjustments and changes in fair value of derivatives, where hedge accounting is applied, to be included in other comprehensive (loss) income.
Advertising
Advertising costs are expensed as incurred. Costs associated with direct response advertising programs may be prepaid and are expensed once the printed materials are distributed to the public.
Revenue Recognition
The Company recognizes revenue when persuasive evidence of an arrangement exists, delivery has occurred or services have been rendered, the seller’s price to the buyer is fixed and determinable, and collectability is probable.
The Gas Company
The Gas Company recognizes revenue when the services are provided. Sales of gas to customers are billed on a monthly-cycle basis. Earned but unbilled revenue is accrued and included in accounts receivable and revenue based on the amount of gas that is delivered but not billed to customers from the latest meter reading or billed delivery date to the end of an accounting period, and the related costs are charged to expense. Most revenue is based upon consumption; however, certain revenue is based upon a flat rate.
District Energy
Revenue from cooling capacity and consumption are recognized at the time of performance of service. Cash received from customers for services to be provided in the future are recorded as unearned revenue and recognized over the expected service period on a straight-line basis.
Atlantic Aviation
Revenue on fuel sales is recognized when the fuel has been delivered to the customer, collection of the resulting receivable is probable, persuasive evidence of an arrangement exists and the fee is fixed or determinable. Fuel sales are recorded net of volume discounts and rebates.
Service revenue includes certain fuelling fees. The Company receives a fuelling fee for fuelling certain carriers with fuel owned by such carriers. Revenue from these transactions is recorded based on the service fee earned and does not include the cost of the carriers’ fuel.
Other FBO revenue consists principally of de-icing services, landing and fuel distribution fees as well as rental income for hangar and terminal use. Other FBO revenue is recognized as the services are rendered to the customer.
MACQUARIE INFRASTRUCTURE COMPANY LLC
NOTES TO CONSOLIDATED FINANCIAL STATEMENTS
2. Summary of Significant Accounting Policies – (continued)
Previously, Atlantic Aviation also had management contracts to operate regional airports or aviation-related facilities. Management fees were recognized pro rata over the service period based on negotiated contractual terms. All costs incurred under these contracts were reimbursed entirely by the customer and were generally invoiced with the related management fee. As the business was acting as an agent in these contracts, the amount invoiced was recorded as revenue net of the reimbursable costs. In December 2008, Atlantic Aviation sold its management contracts business.
Regulatory Assets and Liabilities
The regulated utility operations of The Gas Company are subject to regulations with respect to rates, service, maintenance of accounting records, and various other matters by the Hawaii Public Utilities Commission, or HPUC. The established accounting policies recognize the financial effects of the rate-making and accounting practices and policies of the HPUC. Regulated utility operations are subject to the provisions of ASC 980,Regulated Operations(formerly SFAS No. 92, “Regulated Enterprise — Accounting For Phase in Plans” — an amendment of SFAS No. 71, “Accounting for the Effects of Certain Type of Regulations”). This guidance requires regulated entities to disclose in their financial statements the authorized recovery of costs associated with regulatory decisions. Accordingly, certain costs that otherwise would normally be charged to expense may, in certain instances, be recorded as an asset in a regulatory entity’s balance sheet. The Gas Company records regulatory assets for costs that have been deferred for which future recovery through customer rates has been approved by the HPUC. Regulatory liabilities represent amounts included in rates and collected from customers for costs expected to be incurred in the future.
ASC 980 may, at some future date, be deemed inapplicable because of changes in the regulatory and competitive environments or other factors. If the Company were to discontinue the application of this guidance, the Company would be required to write off its regulatory assets and regulatory liabilities and would be required to adjust the carrying amount of any other assets, including property, plant and equipment, that would be deemed not recoverable related to these affected operations. The Company believes its regulated operations in The Gas Company continue to meet the criteria of ASC 980 and that the carrying value of its regulated property, plant and equipment is recoverable in accordance with established HPUC rate-making practices.
Income Taxes
The Company uses the liability method in accounting for income taxes. Under this method, deferred income tax assets and liabilities are determined based on differences between financial reporting and tax basis of assets and liabilities and are measured using the enacted tax rates and laws that will be in effect when the differences are expected to reverse. Commencing in 2007, the Company and its subsidiaries file a consolidated U.S. federal income tax return. The Company’s consolidated income tax return does not include the taxable income of IMTT and, subsequent to the sale of 49.99% of the business, the taxable income of District Energy. Those businesses file separate income tax returns.
Reclassifications
Certain reclassifications were made to the financial statements for the prior period to conform to current year presentation.
Recently Issued Accounting Standards
In April 2009, the Financial Accounting Standards Board, or FASB, issued ASC 825-10-65Financial Instruments
MACQUARIE INFRASTRUCTURE COMPANY TRUST
NOTES TO CONSOLIDATED FINANCIAL STATEMENTS
2. Summary of Significant Accounting Policies – (continued)
of changes in the United States. At December 31, 2006method and December 31, 2005, there were no outstanding accounts receivable due fromsignificant assumptions. The Company adopted this guidance during the second quarter of 2009. Since this guidance requires only additional disclosures, the adoption did not have a single customer that accounted for more than 10% of the total accounts receivable. Additionally, no single customer accounted for more than 10% ofmaterial impact on the Company’s revenue duringfinancial results of operations and financial condition.
In February 2008, the years ended December 31, 2006FASB issued ASC 820Fair Value Measurements and 2005Disclosures (formerly FSP SFAS No. 157-1, “Application of SFAS No. 157 to SFAS No. 13 and Other Accounting Pronouncements That Address Fair Value Measurements for Purposes of Lease Classification or Measurement under SFAS No. 13”, and FSP SFAS No. 157-2, “Effective Date of FASB Statement No. 157”) affecting the implementation of SFAS No. 157. This guidance excludes ASC 840-10 Leases (formerly SFAS No. 13, “Accounting for Leases”), and other accounting pronouncements that address fair value measurements under SFAS No. 13 from the period April 13, 2004 through December 31, 2004.
In March 2008, the reportingFASB issued ASC 815-10Derivatives and presentation of comprehensive income (loss) and its components.Hedging (formerly SFAS No. 130161, “Disclosure about Derivative Instruments and Hedging Activities — an amendment of SFAS No. 133”), which requires unrealizedcompanies with derivative instruments to disclose information about how and why a company uses derivative instruments; how derivative instruments and related hedged items are accounted for and how derivative instruments and related hedged items affect a company’s financial position, financial performance and cash flows. The required disclosures include the fair value of derivative instruments and their gains or losses in tabular format, information about credit-risk-related contingent features in derivative agreements, counterparty credit risk, and the company’s strategies and objectives for using derivative instruments. This guidance is effective for periods beginning after November 15, 2008. The Company adopted this guidance on January 1, 2009. Since this guidance requires only additional disclosures concerning derivatives and hedging activities, the adoption did not have a material impact on the Company’s availablefinancial results of operations and financial condition. See Note 13, “Derivative Instruments and Hedging Activities”, for sale securities, foreign currency translation adjustmentsfurther discussion.
In December 2008, the FASB issued ASC 715-20Compensation — Retirement Benefits (formerly FSP SFAS No. 132(R)-1, “Employers’ Disclosures about Postretirement Benefit Plan Assets”). This guidance requires additional disclosures surrounding how investment allocation decisions are made, including the factors that are pertinent to an understanding of investment policies and change instrategies, the fair value of derivatives, where hedge accounting is applied, to be included in other comprehensive income (loss).
In November 2008, the FASB ratified ASC 323Investments — Equity Method and does not includeJoint Ventures (formerly EITF 08-6, “Equity Method Investment Accounting Considerations''). This guidance concludes that the cost basis of a new equity-method investment would be determined using a cost-accumulation model, which would continue the practice of including transaction costs in the cost of investment and would exclude the carriers’ fuel.
MACQUARIE INFRASTRUCTURE COMPANY TRUST
NOTES TO CONSOLIDATED FINANCIAL STATEMENTS
2. Summary of Significant Accounting Policies – (continued)
after December 15, 2008, with early adoption prohibited. The Company adopted this guidance on January 1, 2009 and the impact of de-icing services, landingthe adoption did not have a material impact on the Company’s financial results of operations and fuel distribution feesfinancial condition.
In April 2008, the FASB issued ASC 350-30Intangibles — Goodwill and Other (formerly FSP SFAS No. 142-3, “Determination of the Useful Life of Intangible Assets”). This guidance amends the factors an entity should consider in developing renewal or extension assumptions used in determining the useful life of recognized intangible assets. Companies estimating the useful life of a recognized intangible asset must now consider their historical experience in renewing or extending similar arrangements or, in the absence of historical experience, must consider assumptions that market participants would use about renewal or extension as welladjusted for entity-specific factors. This guidance is effective for financial statements issued for fiscal years and interim periods beginning after December 15, 2008. Early adoption is prohibited. The Company adopted this guidance and the impact of the adoption did not have a material impact on the Company’s financial results of operations and financial condition.
In December 2007, the FASB issued ASC 810-10Consolidation (formerly SFAS No. 160, “Noncontrolling Interests in Consolidated Financial Statements — an amendment of ARB NO. 51”), which requires noncontrolling interests (previously referred to as rental incomeminority interests) to be treated as a separate component of equity, not as a liability or other item outside of permanent equity. This guidance is effective for hangarperiods beginning on or after December 15, 2008 and terminal use. Other FBO revenue is recognized aswill be applied prospectively to all noncontrolling interests with comparative period information reclassified. The Company adopted this guidance on January 1, 2009 and adoption did not have a material impact on the services are renderedCompany’s financial results of operations and financial condition.
In December 2007, the FASB revised ASC 805-10Business Combinations (formerly SFAS No. 141(R)). The revised standard includes various changes to the customer.
MACQUARIE INFRASTRUCTURE COMPANY TRUST
NOTES TO CONSOLIDATED FINANCIAL STATEMENTS
3. Earnings (Loss) PerLoss per Share
Following is a reconciliation of the basic and diluted number of shares used in computing earnings (loss)loss per share:
| Year Ended December 31, | ||||||||||||
| 2009 | 2008 | 2007 | ||||||||||
| Weighted average number of shares outstanding: basic | 45,020,085 | 44,944,326 | 40,882,067 | |||||||||
| Dilutive effect of restricted stock unit grants | — | — | — | |||||||||
| Weighted average number of shares outstanding: diluted | 45,020,085 | 44,944,326 | 40,882,067 | |||||||||
Year Ended December 31, 2006 | Year Ended December 31, 2005 | Period from April 13, 2004 (inception) to December 31, 2004 | ||||
| Weighted average number of shares of trust stock outstanding: basic | 28,895,522 | 26,919,608 | 1,011,887 | |||
| Dilutive effect of restricted stock unit grants | 16,824 | 9,611 | — | |||
| Weighted average number of shares of trust stock outstanding: diluted | 28,912,346 | 26,929,219 | 1,011,887 |
The effect of potentially dilutive shares for the year ended December 31, 2006 is calculated by assuming that the10,314 restricted stock unit grants issuedprovided to ourthe Company’s independent directors on May 25, 2006, which vest in24, 2007, had been fully converted to shares on that date. The effect of potentially dilutive shares for the year ended December 31, 2005 is calculated by assuming that the14,115 restricted stock unit grants issued to our independent directors on May 25, 2005, which vested in 2006, had been fully converted to shares on that date. The effect of potentially dilutive shares for the period from April 13, 2004 through December 31, 2004 is calculated by assuming that the restricted stock unit grants issued to our independent directors on December 21, 2004, which vested in 2005, had been fully converted to shares on that date. The stock grants provided to our independent directors on December 21, 2004May 27, 2008 and the 128,205 restricted stock unit grants provided to our independent directors on June 4, 2009 were anti-dilutive in 20042007, 2008 and 2009 due to the Company’s net loss for those years.
4. Discontinued Operations
PCAA operates 31 facilities comprising over 40,000 parking spaces near 20 major airports across the period.
On January 28, 2010, the Company announced that PCAA had entered into an asset purchase agreement with Bainbridge ZKS — Corinthian Holdings, LLC. This agreement, which is subject to approval by the bankruptcy court, will result in the sale of the assets of PCAA for $111.5 million, subject to certain adjustments and will result in the elimination of $201.0 million of current debt from the liabilities of discontinued operations held for sale in the consolidated balance sheet. The cancelled debt in excess of the sale proceeds used to repay such debt would result in cancellation of debt income and the proceeds from our initial public offering,in excess of the business’ assets as a gain on sale. As a part of the bankruptcy sale process, all cash proceeds would be paid to creditors of the business. PCAA also commenced a voluntary Chapter 11 case with the bankruptcy court. If approved, the Company expects to complete the sale of the business in the first half of 2010.
As part of the bankruptcy filing, the Company has no obligation to and has no intention of committing additional capital to this business. Creditors of this business do not have recourse to any assets of the holding company or IPO,any assets of the other Company’s businesses, other than approximately $5.3 million relating to acquire our initiala guarantee of a single parking facility lease.
Results for PCAA are reported separately as discontinued operations for all periods presented. The assets and liabilities of the business being sold are included in assets of discontinued operations held for sale and liabilities of discontinued operations held for sale on the Company’s consolidated businessesbalance sheet.
MACQUARIE INFRASTRUCTURE COMPANY LLC
NOTES TO CONSOLIDATED FINANCIAL STATEMENTS
4. Discontinued Operations – (continued)
The following is a summary of the assets and liabilities of discontinued operations held for cash fromsale related to PCAA as of December 31, 2009 and December 31, 2008:
| December 31, 2009 | December 31, 2008 | |||||||
| ($ in Thousands) | ||||||||
| Assets | ||||||||
| Total current assets | $ | 7,676 | $ | 5,789 | ||||
| Property, equipment, land and leasehold improvements, net | 77,524 | 93,476 | ||||||
| Other non-current assets | 1,495 | 6,460 | ||||||
| Total assets | $ | 86,695 | $ | 105,725 | ||||
| Liabilities | ||||||||
| Current portion of long-term debt | $ | 200,999 | $ | 201,344 | ||||
| Other current liabilities | 10,761 | 15,951 | ||||||
| Total current liabilities | 211,760 | 217,295 | ||||||
| Other non-current liabilities | 8,789 | 7,593 | ||||||
| Total liabilities | 220,549 | 224,888 | ||||||
| Noncontrolling interest | (1,863 | ) | — | |||||
| Total liabilities and noncontrolling interest | $ | 218,686 | $ | 224,888 | ||||
Summarized financial information for discontinued operations related to PCAA for the Macquarie Group or from infrastructure investment vehicles managed by the Macquarie Group during the periodyears ended December 31, 2004.2009, 2008 and 2007 are as follows:
| For the Year Ended December 31, 2009 | For the Year Ended December 31, 2008 | For the Year Ended December 31, 2007 | ||||||||||
| ($ in Thousands, Except Share Data) | ||||||||||||
| Service revenue | $ | 68,457 | $ | 74,692 | $ | 77,180 | ||||||
| Net loss from discontinued operations before income taxes and noncontrolling interest | $ | (23,647 | ) | $ | (180,104 | ) | $ | (9,679 | ) | |||
| Income tax benefit (provision) | 1,787 | 70,059 | (281 | ) | ||||||||
| Net loss from discontinued operations before noncontrolling interest | (21,860 | ) | (110,045 | ) | (9,960 | ) | ||||||
| Net loss attributable to noncontrolling interests | (1,863 | ) | (1,753 | ) | (1,035 | ) | ||||||
| Net loss from discontinued operations | $ | (19,997 | ) | $ | (108,292 | ) | $ | (8,925 | ) | |||
| Basic and diluted loss per share from discontinued operations | $ | (0.44 | ) | $ | (2.41 | ) | $ | (0.22 | ) | |||
| Weighted average number of shares outstanding at the Company level: basic and diluted | 45,020,085 | 44,944,326 | 40,882,067 | |||||||||
MACQUARIE INFRASTRUCTURE COMPANY LLC
NOTES TO CONSOLIDATED FINANCIAL STATEMENTS
5. Acquisitions during
SevenBar FBOs
On March 4, 2008, Atlantic Aviation completed the year ended December 31, 2005 were funded byacquisition of 100% of the remaining IPO proceedsinterests in Sun Valley Aviation, Inc., SB Aviation Group, Inc. and additional debt. Acquisitions duringSevenBar Aviation Inc. (collectively referred to as “SevenBar”). SevenBar owns and operates three FBOs located in Farmington and Albuquerque, New Mexico and Sun Valley, Idaho.
The cost of the year ended December 31, 2006 were funded by additional debtacquisition, including transaction costs, was $41.9 million and drawdowns on ourthe Company has pre-funded integration costs of $300,000. The Company financed the acquisition facility atwith borrowings under the MIC Inc. level, some ofrevolving credit facility, which was fully repaid with proceeds from the equity offering.
For a description of certain related party transactions associated with the Company’s acquisitions,acquisition, see Note 15, Related17, “Related Party Transactions.
The initial purchase price allocation may be adjusted within one year of the purchase date for changes in estimates of the fair value of assets acquired and liabilities assumed.
| Current assets | $ | 1,203 | ||
| Property, equipment, land and leasehold improvements | 10,353 | |||
| Intangible assets: | ||||
| Customer relationships | 750 | |||
| Contractual arrangements | 26,050 | |||
| Non-compete agreements | 50 | |||
| Goodwill(1) | 5,125 | |||
| Total assets acquired | 43,531 | |||
| Current liabilities | (1,296 | ) | ||
| Other liabilities | (370 | ) | ||
| Net assets acquired | $ | 41,865 | ||
| Current assets | $ | 1,820 | ||
| Property, equipment, land and leasehold improvements | 12,680 | |||
| Intangible assets: | ||||
| Customer relationships | 1,100 | |||
| Airport contract rights | 18,800 | |||
| Non-compete agreements | 1,100 | |||
| Goodwill | 15,686 | |||
| Total assets acquired | 51,186 | |||
| Current liabilities | 882 | |||
| Net assets acquired | $ | 50,304 |
| (1) | Included in goodwill is approximately $4.9 million that is expected to be deductible for tax purposes. |
The Company paid more than the fair value of the underlying net assets as a result of the expectation of its ability to earn a higher rate of return from the acquired business than would be expected if those net assets had to be acquired or developed separately. The value of the acquired intangible assets was determined by taking into account risks related to the characteristics and applications of the assets, existing and future markets and analysesanalysis of expected future cash flows to be generated by the business. The airport contract rights are being amortized on a straight-line basis over their estimated useful lives ranging from 20 to 30 years.
The Company allocated $1.1 million$750,000 of the purchase price to customer relationships in accordance with EITF 02-17, Recognition of Customer Relationship Intangible Assets Acquired in a Business Combination.relationships. The Company is amortizingwill amortize the amount allocated to customer relationships over a nine-year period.
6. Dispositions
District Energy consists of EAR
| Current assets | $ | 2,264 | ||
| Property, equipment, land and leasehold improvements | 17,259 | |||
| Intangible assets: | ||||
| Airport contract rights | 38,286 | |||
| Goodwill | 3,905 | |||
| Total assets acquired | 61,714 | |||
| Current liabilities | 1,934 | |||
| Net assets acquired | $ | 59,780 |
MACQUARIE INFRASTRUCTURE COMPANY TRUST
NOTES TO CONSOLIDATED FINANCIAL STATEMENTS
6. Dispositions – (continued)
| Current assets | $ | 93 | ||
| Property, equipment, land and leasehold improvements | 18,859 | |||
| Intangible assets: | ||||
| Customer relationships | 1,020 | |||
| Trade name | 500 | |||
| Leasehold rights | 1,750 | |||
| Domain names | 320 | |||
| Goodwill | 44,396 | |||
| Total assets acquired | 66,938 | |||
| Current liabilities | 60 | |||
| Net assets acquired | $ | 66,878 |
As the Company acquired a combination of real property, personal propertyhas retained majority ownership and intangible assets during 2005 at four parking facilities for a total purchase price of approximately $9.4 million, including transaction costs.
| Current assets | $ | 78,074 | ||
| Non-current assets | 552,361 | |||
| Current liabilities | (48,267 | ) | ||
| Non-current liabilities | (395,321 | ) | ||
| Revenue | 239,279 | |||
| Gross profit | 104,407 | |||
| Net income | 19,814 |
| Current assets | $ | 42,297 | ||
| Property, equipment, land and leasehold improvements | 127,075 | |||
| Intangible assets: | ||||
| Customer relationships | 7,400 | |||
| Trade name | 8,500 | |||
| Real estate leases | 100 | |||
| Goodwill | 119,703 | |||
| Other assets | 3,108 | |||
| Total assets acquired | 308,183 | |||
| Current liabilities | 20,309 | |||
| Deferred income taxes | 12,202 | |||
| Other liabilities | 12,931 | |||
| Total liabilities assumed | 45,442 | |||
| Net assets acquired | $ | 262,741 |
| Current assets | $ | 19,669 | ||
| Property, equipment, land and leasehold improvements | 57,966 | |||
| Intangible assets: | ||||
| Customer relationships | 32,800 | |||
| Airport contract rights | 221,800 | |||
| Non-compete agreements | 200 | |||
| Trade name | 100 | |||
| Goodwill | 84,387 | |||
| Other assets | 266 | |||
| Total assets acquired | 417,188 | |||
| Current liabilities | 17,941 | |||
| Deferred income taxes | 51,625 | |||
| Other liabilities | 319 | |||
| Total liabilities assumed | 69,885 | |||
| Net assets acquired | $ | 347,303 |
For a description of certain related party transactions associated with the Company’s dispositions,relating to this transaction, see Note 15, Related17, “Related Party Transactions.
7. Direct Financing Lease Transactions
The Company has entered into energy service agreements containing provisions to lease equipment to customers. Under these agreements, title to the leased equipment will transfer to the customer at the end of the lease terms, which range from 5 to 25 years. The lease agreements are accounted for as direct financing leases. The components of the Company’s consolidated net investments in direct financing leases at December 31, 20062009 and December 31, 20052008 are as follows (in($ in thousands):
| December 31, 2009 | December 31, 2008 | |||||||
| Minimum lease payments receivable | $ | 65,116 | $ | 69,493 | ||||
| Less: unearned financing lease income | (28,481 | ) | (30,249 | ) | ||||
| Net investment in direct financing leases | $ | 36,635 | $ | 39,244 | ||||
| Equipment lease: | ||||||||
| Current portion | $ | 3,369 | $ | 3,117 | ||||
| Long-term portion | 33,266 | 36,127 | ||||||
| $ | 36,635 | $ | 39,244 | |||||
December 31, 2006 | December 31, 2005 | ||||||
| Minimum lease payments receivable | $ | 83,919 | $ | 90,879 | |||
| Less: Unearned financing lease income | (39,771 | ) | (44,851 | ) | |||
| Net investment in direct financing leases | $ | 44,148 | $ | 46,028 | |||
| Equipment lease: | |||||||
| Current portion | $ | 2,843 | $ | 2,482 | |||
| Long-term portion | 41,305 | 43,546 | |||||
| $ | 44,148 | $ | 46,028 | ||||
Unearned financing lease income is recognized over the terms of the leases. Minimum lease payments to be received by the Company total approximately $83.9$65.1 million as follows (in($ in thousands):
| 2010 | $ | 7,143 | ||
| 2011 | 7,141 | |||
| 2012 | 7,141 | |||
| 2013 | 7,141 | |||
| 2014 | 7,141 | |||
| Thereafter | 29,409 | |||
| Total | $ | 65,116 | ||
| 2007 | $ | 7,756 | ||
| 2008 | 6,887 | |||
| 2009 | 6,881 | |||
| 2010 | 6,874 | |||
| 2011 | 6,874 | |||
| Thereafter | 48,647 | |||
| Total | $ | 83,919 |
MACQUARIE INFRASTRUCTURE COMPANY LLC
NOTES TO CONSOLIDATED FINANCIAL STATEMENTS
8. Property, Equipment, Land and Leasehold Improvements
Property, equipment, land and leasehold improvements at December 31, 20062009 and December 31, 20052008 consist of the following (in($ in thousands):
| December 31, 2009 | December 31, 2008 | |||||||
| Land | $ | 4,618 | $ | 4,651 | ||||
| Easements | 5,624 | 5,624 | ||||||
| Buildings | 24,789 | 24,752 | ||||||
| Leasehold and land improvements | 312,881 | 284,207 | ||||||
| Machinery and equipment | 330,226 | 307,662 | ||||||
| Furniture and fixtures | 9,395 | 8,228 | ||||||
| Construction in progress | 16,519 | 48,223 | ||||||
| Property held for future use | 1,561 | 1,540 | ||||||
| 705,613 | 684,887 | |||||||
| Less: accumulated depreciation | (125,526 | ) | (92,452 | ) | ||||
| Property, equipment, land and leasehold improvements, net(1) | $ | 580,087 | $ | 592,435 | ||||
December 31, 2006 | December 31, 2005 | ||||||
| Land | $ | 63,275 | $ | 62,520 | |||
| Easements | 5,624 | 5,624 | |||||
| Buildings | 35,836 | 32,866 | |||||
| Leasehold and land improvements | 166,490 | 108,726 | |||||
| Machinery and equipment | 259,897 | 132,196 | |||||
| Furniture and fixtures | 5,473 | 1,920 | |||||
| Construction in progress | 20,196 | 3,486 | |||||
| Property held for future use | 1,316 | 1,196 | |||||
| Other | 7,566 | 764 | |||||
| 565,673 | 349,298 | ||||||
| Less: Accumulated depreciation | (42,914 | ) | (14,179 | ) | |||
| Property, equipment, land and leasehold improvements, net | $ | 522,759 | $ | 335,119 | |||
| (1) | Includes $1.3 million and $2.1 million of capitalized interest for the years ended December 31, 2009 and 2008, respectively. |
During the year ended December 31, 2005, our operations at three FBO sites were impacted by Hurricane Katrina. Thefirst six months of 2009 and the fourth quarter of 2008, the Company recognized lossesnon-cash impairment charges of $7.5 million and $13.8 million, respectively, primarily relating to leasehold and land improvements; buildings; machinery and equipment; and furniture and fixtures at Atlantic Aviation. These charges are recorded in depreciation expense in the valueconsolidated statements of property, equipment and leasehold improvements, but has recovered some of these losses under existing insurance policies in 2006 and early 2007 and expects to recover the remaining losses in the near future. The write-down in property, equipment and leasehold improvements, and the corresponding insurance receivable (including amounts received), were not significant.
9. Intangible Assets
Intangible assets at December 31, 20062009 and December 31, 20052008 consist of the following (in($ in thousands):
| Weighted Average Life (Years) | December 31, 2009 | December 31, 2008 | ||||||||||
| Contractual arrangements | 31.2 | $ | 774,309 | $ | 802,419 | |||||||
| Non-compete agreements | 2.5 | 9,515 | 9,515 | |||||||||
| Customer relationships | 10.7 | 78,596 | 78,596 | |||||||||
| Leasehold rights | 12.5 | 3,331 | 3,331 | |||||||||
| Trade names | Indefinite | 15,401 | 15,401 | |||||||||
| Technology | 5.0 | 460 | 460 | |||||||||
| 881,612 | 909,722 | |||||||||||
| Less: accumulated amortization | (130,531 | ) | (97,749 | ) | ||||||||
| Intangible assets, net | $ | 751,081 | $ | 811,973 | ||||||||
As a result of a decline in the performance of certain asset groups during the first six months of 2009 and the quarter ended December 31, 2008, the Company evaluated such asset groups for impairment and determined that the asset groups were impaired. The Company estimated the fair value of each of the impaired asset groups using the discounted cash flow model. Accordingly, the Company recognized non-cash impairment charges of $23.3 million and $21.7 million related to contractual arrangements at Atlantic Aviation during the first six months of 2009 and during the quarter ended December 31, 2008, respectively. These charges are recorded in amortization of intangibles in the consolidated statement of operations.
Weighted Average Life (Years) | December 31, 2006 | December 31, 2005 | ||||||||
| Contractual arrangements | 30.5 | $ | 459,373 | $ | 237,572 | |||||
| Non-compete agreements | 2.8 | 5,035 | 4,835 | |||||||
| Customer relationships | 10.1 | 66,840 | 26,640 | |||||||
| Leasehold rights | 12.2 | 8,359 | 8,259 | |||||||
| Trade names | Indefinite | (1) | 17,499 | 26,175 | ||||||
| Domain names | Indefinite | (2) | 2,092 | 8,307 | ||||||
| Technology | 5 | 460 | 460 | |||||||
| 559,658 | 312,248 | |||||||||
| Less: Accumulated amortization | (32,899 | ) | (12,761 | ) | ||||||
| Intangible assets, net | $ | 526,759 | $ | 299,487 | ||||||
MACQUARIE INFRASTRUCTURE COMPANY LLC
NOTES TO CONSOLIDATED FINANCIAL STATEMENTS
9. Intangible Assets – (continued)
Amortization expense of intangible assets for the years ended December 31, 20062009, 2008, and 20052007 totaled $43.8$60.9 million, $61.9 million and $14.8$32.4 million, respectively. Included within amortization expense for the year ended December 31, 2006 is a $23.5 million impairment charge relating to trade names and domain names at the Company’s airport parking business. Re-branding initiatives at the airport parking business which are due to take place in 2007 indicated this impairment for the 2006 year.
The change in goodwill from December 31, 2008 to December 31, 2009 is as follows ($ in thousands):
| Balance at December 31, 2007 | $ | 636,336 | ||
| Acquisition of SevenBar FBOs | 5,156 | |||
| Prior period acquisition purchase price adjustments | (3,243 | ) | ||
| Impairment of Atlantic Aviation’s goodwill | (52,000 | ) | ||
| Balance at December 31, 2008 | 586,249 | |||
| Impairment of Atlantic Aviation’s goodwill | (71,200 | ) | ||
| Prior period acquisition purchase price adjustments | 31 | |||
| Other | 1,102 | |||
| Balance at December 31, 2009 | $ | 516,182 | ||
The Company tests for goodwill impairment at the reporting unit level on an annual basis and between annual tests if a triggering event indicates impairment. The decline in the Company’s stock price, particularly over the latter part of 2008 and the first half of 2009, has caused the book value of the Company to exceed its market capitalization. The Company performed goodwill impairment tests during the first six months of 2009 and fourth quarter of 2008. The goodwill impairment test is a two-step process, which requires management to make judgments in determining what assumptions to use in the test. The first step of the process consists of estimating the fair value of each reporting unit based on a discounted cash flow model using cash flow forecasts and comparing those estimated fair values with the carrying values, which includes the allocated goodwill. If the estimated fair value is less than the carrying value, a second step is performed to compute the amount of the impairment by determining an implied fair value of goodwill. The determination of a reporting unit’s “implied fair value” of goodwill requires the allocation of the estimated fair value of the reporting unit to the assets and liabilities of the reporting unit. Any unallocated fair value represents the “implied fair value” of goodwill, which is compared to its corresponding carrying value. If the corresponding carrying value is higher than the “implied fair value”, goodwill is written down to reflect the impairment. Based on the testing performed, the Company recorded goodwill impairment charge of $71.2 million and $52.0 million at Atlantic Aviation during the first six months of 2009 and the quarter ended December 31, 2008, respectively. The Company also performed its annual goodwill impairment test in the fourth quarter of 2009, and concluded that no further goodwill impairment was required.
While management has a plan to return the Company’s business fundamentals to levels that support the book value per common share, there is no assurance that the plan will be successful, or that the market price of the common stock will increase to such levels in the foreseeable future. Discount rates used in recent cash flow analyses have increased and projected cash flows relating to the Company’s reporting units generally declined in the latter half of 2008 and first half of 2009 primarily as the result of negative macroeconomic factors. There is no assurance that discount rates will not increase or that the earnings, book values or projected earnings and cash flows of the Company’s individual reporting units will not decline. Management will continue to monitor the relationship of the Company’s market capitalization to its book value, the differences for which management attributes to both negative macroeconomic factors and Company specific factors, and management will continue to evaluate the carrying value of goodwill and other intangible assets. Accordingly, an additional impairment charge to goodwill and other intangible assets may be required in the foreseeable future if the Company’s common stock price continues to trade below book value per common share or the book value exceeds its estimated fair value of an individual reporting unit.
MACQUARIE INFRASTRUCTURE COMPANY LLC
NOTES TO CONSOLIDATED FINANCIAL STATEMENTS
10. Nonfinancial Assets Measured at Fair Value
The following major categories of nonfinancial assets at the impaired asset groups were written down to fair value during the first six months of 2009 for Atlantic Aviation:
| Fair Value Measurements Using | Total Losses | |||||||||||||||||||
| Description | Quoted Prices in Active Markets for Identical Assets (Level 1) | Significant Other Observable Inputs (Level 2) | Significant Unobservable Inputs (Level 3) | Quarter Ended December 31, 2009 | Year Ended December 31, 2009 | |||||||||||||||
| ($ in Thousands) | ||||||||||||||||||||
| Property, Equipment, Land and Leasehold Improvements, net | $ | — | $ | — | $ | 5,122 | $ | — | $ | (7,521 | ) | |||||||||
| Intangible Assets | — | — | 14,430 | — | (23,326 | ) | ||||||||||||||
| Goodwill | — | — | 377,343 | — | (71,200 | ) | ||||||||||||||
| Total | $ | — | $ | — | $ | 396,895 | $ | — | $ | (102,047 | ) | |||||||||
The Company estimated the fair value of each of the impaired asset groups using discounted cash flows. Property, equipment, land and leasehold improvements with a carrying amount of $12.6 million were written down to fair value of $5.1 million during 2009. This resulted in a non-cash impairment charge of $7.5 million, which is recorded in depreciation expense for Atlantic Aviation during the first six months of 2009 in the consolidated statement of operations.
Additionally, intangible assets with carrying amounts of $37.7 million were written down to their fair value of $14.4 million during the first six months of 2009 at Atlantic Aviation. This resulted in a non-cash impairment charge of $23.3 million, which is recorded in amortization of intangibles expense in the consolidated statement of operations.
As discussed in Note 9, “Intangible Assets”, the Company performed goodwill impairment analyses during the first six months of 2009. As a result of these analyses, goodwill with a carrying amount of $448.5 million was written down to its implied fair value of $377.3 million resulting in a non-cash impairment charge of $71.2 million at Atlantic Aviation. This non-cash impairment charge was included in goodwill impairment in the consolidated statement of operations.
The significant unobservable inputs used for all fair value measurements in the above table included forecasted cash flows of Atlantic Aviation and its asset groups, the discount rate and, in the case of goodwill, the terminal value. The forecasted cash flows for this business were developed using actual cash flows from 2008 and 2009, forecasted jet fuel volumes from the Federal Aviation Administration, forecasted consumer price indices and forecasted LIBOR rates based on proprietary models using various published sources. The discount rate was developed using a capital asset pricing model.
Model inputs included:
The terminal value was based on observed earnings before interest, taxes, depreciation and amortization, or EBITDA, and multiples historically paid in transactions for comparable businesses.
MACQUARIE INFRASTRUCTURE COMPANY LLC
NOTES TO CONSOLIDATED FINANCIAL STATEMENTS
11. Accrued Expenses
Accrued expenses at December 31, 20062009 and December 31, 20052008 consist of the following (in($ in thousands):
| December 31, 2009 | December 31, 2008 | |||||||
| Payroll and related liabilities | $ | 6,030 | $ | 8,462 | ||||
| Interest | 609 | 1,218 | ||||||
| Insurance | 1,770 | 1,932 | ||||||
| Real estate taxes | 887 | 896 | ||||||
| Other | 8,136 | 10,681 | ||||||
| $ | 17,432 | $ | 23,189 | |||||
December 31, 2006 | December 31, 2005 | ||||||
| Payroll and related liabilities | $ | 7,624 | $ | 3,794 | |||
| Interest | 1,176 | 1,082 | |||||
| Insurance | 2,076 | 1,909 | |||||
| Real estate taxes | 2,550 | 2,484 | |||||
| Other | 6,354 | 4,725 | |||||
| $ | 19,780 | $ | 13,994 | ||||
12. Long-Term Debt
The Company capitalizes its operating businesses separately using non-recourse, project finance style debt. In addition, it has a credit facility at its subsidiary, MIC Inc., primarily to finance acquisitions and capital expenditures, which matures on whichMarch 31, 2010. At December 31, 2009, there was no balance outstanding at December 31, 2006.on this facility. The Company currently has no indebtedness at the MIC LLC level.
All of the term debt facilities described below contain customary financial covenants, including maintaining or Trust level.
For a description of certain related party transactions associated with the Company’s long-term debt, see Note 15, Related17, “Related Party Transactions.
At December 31, 20062009 and December 31, 2005, our2008, the Company’s consolidated long-term debt consists ofcomprised the following (in($ in thousands):
| December 31, 2009 | December 31, 2008 | |||||||
| MIC Inc. | $ | — | $ | 69,000 | ||||
| The Gas Company | 179,000 | 169,000 | ||||||
| District Energy | 170,000 | 150,000 | ||||||
| Atlantic Aviation | 863,279 | 939,800 | ||||||
| Total | 1,212,279 | 1,327,800 | ||||||
| Less: current portion | (45,900 | ) | — | |||||
| Long-term portion | $ | 1,166,379 | $ | 1,327,800 | ||||
December 31, 2006 | December 31, 2005 | ||||||
| Airport services debt | $ | 480,000 | $ | 300,000 | |||
| MDE senior notes | 120,000 | 120,000 | |||||
| PCAA (new facility) | 195,000 | — | |||||
| PCAA (various) loan payable | — | 125,448 | |||||
| PCAA Chicago loan payable | 4,474 | 4,574 | |||||
| PCAA SP loan payable | — | 58,740 | |||||
| RCL Properties loan payable | 2,186 | 2,232 | |||||
| TGC loans payable | 162,000 | — | |||||
| 963,660 | 610,994 | ||||||
| Less current portion | 3,754 | 146 | |||||
| Long-term portion | $ | 959,906 | $ | 610,848 | |||
At December 31, 2006,2009, future maturities of long-term debt are as follows (in($ in thousands):
| 2010 | $ | 45,900 | ||
| 2011 | 55,906 | |||
| 2012 | 55,972 | |||
| 2013 | 258,325 | |||
| 2014 | 796,176 | |||
| Total | $ | 1,212,279 | ||
| 2007 | 3,754 | |||
| 2008 | 6,162 | |||
| 2009 | 205,843 | |||
| 2010 | 484,800 | |||
| 2011 | 4,380 | |||
| Thereafter | 258,721 | |||
| $ | 963,660 |
MACQUARIE INFRASTRUCTURE COMPANY TRUST
NOTES TO CONSOLIDATED FINANCIAL STATEMENTS
12. Long-Term Debt – (continued)
MIC Inc.
Effective April 14, 2009, MIC Inc. elected to MSUSA, a related party, by MDE prior toreduce the Company’s acquisition ofavailable principal on its parent Macquarie District Energy Holdings LLC, and the remaining unamortized balance of these fees are included in deferred financing costs on the accompanying consolidated balance sheet. These costs are amortized over the life of the long-term debt.
On February 20, 2008, MIC Inc. drew $56.0 million on this facility, part of which was used to fund the acquisition of SevenBar FBOs which was completed in the first quarter of 2008, and part of which was used for other projects. On July 31, 2008, MIC Inc. drew an additional $13.0 million on this facility to fund the acquisition of SkyPark, which was completed in November 2005 with maximumthe third quarter of 2008. On February 25, 2009, MIC Inc. repaid $2.6 million of the outstanding balance on the revolving borrowing of $250.0 million. During 2006,credit facility.
At March 31, 2009, the Company expandedreclassified the outstanding balance drawn on the revolving credit facility at the non-operating holding company from long-term debt to current portion of long-term debt on the consolidated balance sheet due to its scheduled maturity on March 31, 2010. During the year, the Company was in discussions with its lenders to convert the facility to increasea term loan and extend the maturity date of the $66.4 million outstanding balance.
On December 28, 2009, the Company used the net cash proceeds it received from the sale of the 49.99% non-controlling interest in District Energy, and cash on hand, to pay off the outstanding principal balance on the revolving portioncredit facility. Shortly thereafter the Company elected to reduce the amount available on the revolving credit facility from $250.0$97.0 million to $300.0$20.0 million andthrough to provide for $180.0 millionthe maturity of term loans to fund the Trajen acquisition. In connection with the increase, the interest rate margin increased to LIBOR plus 2.00% until the term loan was repaid in October 2006.facility at March 31, 2010. The Company borrowedexpects to retain excess cash generated by the consolidated businesses over the near term.
See Note 17, “Related Party Transactions” for a totaldiscussion of $454.0 million under this facility in 2006 and repaid the facility in full with the proceeds from the sales of its interests in SEW and MCG and mostMacquarie Group’s portion of the proceeds of its 2006 equity offering.
The obligations under the facility are guaranteed by the Company and secured by a pledge of the equity of all current and future direct subsidiaries of MIC Inc. and the Company. Among other things, the revolving facility includes an event of default should the Manager or another affiliate ofwithin the Macquarie Bank Limited ceasesGroup cease to act as manager of the Company.
Material terms of the MIC Inc.’s revolving credit facility are presented below:
| Borrower | MIC Inc. | |
| Facilities | $20.0 million for loans and/or letters of credit | |
| Termination date | March 31, 2010 | |
| Interest and principal repayments | Interest only during the term of the loan Repayment of principal at termination, upon voluntary prepayment, or upon an event requiring mandatory prepayment | |
| Eurodollar rate | LIBOR plus 2.75% per annum | |
| Base rate | Base rate plus 1.75% per annum | |
| Annual commitment fee | 0.50% per annum on the average daily undrawn balance |
MACQUARIE INFRASTRUCTURE COMPANY LLC
NOTES TO CONSOLIDATED FINANCIAL STATEMENTS
12. Long-Term Debt – (continued)
The Gas Company
The acquisition of The Gas Company in June 2006 was partially financed with $160.0 million of term loans borrowed under the two amended and restated loan agreements. One of these loan agreements provides for an $80.0 million term loan borrowed by HGC Holdings LLC, or HGC, the parent company of The Gas Company, LLC, or TGC. The other loan agreement provides for an $80.0 million term loan borrowed by TGC and a $20.0 million revolving credit facility, including a $5.0 million letter of credit facility. TGC generally intends to utilize the $20.0 million revolving credit facility to finance its working capital and to finance or refinance its capital expenditures for regulated assets. At December 31, 2009, $19.0 million was outstanding under the revolving credit facility.
The obligations under the credit agreements are secured by security interests in the assets of TGC as well as the equity interests of TGC and HGC. Material terms of the term and revolving credit facilities are presented below:
| Holding Company Debt | Operating Company Debt | |||||
| Borrowers | HGC | TGC | ||||
| Facilities | $80.0 million Term Loan (fully drawn at December 31, 2009 and 2008) | $80.0 million Term Loan (fully drawn at December 31, 2009 and 2008) | $20.0 million Revolver ($19.0 million and $9.0 million drawn at December 31, 2009 and 2008, respectively) | |||
| Collateral | First priority security interest on HGC’s assets and equity interests | First priority security interest on TGC’s assets and equity interests | ||||
| Maturity | June, 2013 | June, 2013 | June, 2013 | |||
| Amortization | Payable at maturity | Payable at maturity | Payable at maturity for utility capital expenditures | |||
| Interest: Years 1 – 5 | LIBOR plus 0.60% | LIBOR plus 0.40% | LIBOR plus 0.40% | |||
| Commitment Fees: Years 1 – 5 | — | — | 0.14% on undrawn portion | |||
| Interest: Years 6 – 7 | LIBOR plus 0.70% | LIBOR plus 0.50% | LIBOR plus 0.50% | |||
| Commitment Fees: Years 6 – 7 | — | — | 0.18% on undrawn portion | |||
To hedge the interest commitments under the new term loan, The Gas Company entered into interest rate swaps fixing 100% of the term loans at 4.8375% (excluding the margin).
In addition to customary terms and conditions for secured term loan and revolving credit agreements, the agreements provide that TGC:
| (1) | may not incur more than $7.5 million of new debt; and |
| (2) | may not sell or dispose of more than $10.0 million of assets per year. |
The facilities also require mandatory repayment if the Company or another entity managed by the Macquarie Group fails to either own 75% of the respective borrowers or control the management and policies of the respective borrowers.
The Hawaii Public Utilities Commission, in approving the purchase of the business by the Company, required that The Gas Company’s consolidated debt facilities describedto total capital ratio does not exceed 65%. This ratio was 63.2% at December 31, 2009 and 61.7% at December 31, 2008.
MACQUARIE INFRASTRUCTURE COMPANY LLC
NOTES TO CONSOLIDATED FINANCIAL STATEMENTS
12. Long-Term Debt – (continued)
The Gas Company also has an uncommitted unsecured short-term borrowing facility of $7.5 million that was renewed during the second quarter of 2009. This credit line bears interest at the lending bank’s quoted rate or prime rate. The facility is available for working capital needs. At December 31, 2009 and December 31, 2008, no amounts were outstanding.
District Energy
District Energy has in place a term loan facility, a capital expenditure loan facility and a revolving loan facility. Proceeds of $150.0 million, drawn under the term loan facility in 2007, were used to repay the previously existing debt outstanding, pay a $14.7 million make-whole payment, and to pay accrued interest, fees and transaction costs.
Material terms of the facility are presented below:
| Borrower | Macquarie District Energy LLC, or MDE | |
| Facilities | • $150.0 million term loan facility (fully drawn at December 31, 2009 and 2008) | |
• $20.0 million capital expenditure loan facility fully drawn at December 31, 2009 and $1.5 million drawn at December 31, 2008) | ||
• $18.5 million revolving loan and letter of credit facility ($7.1 million utilized at December 31, 2009 and 2008 for letters of credit) | ||
| Amortization | Payable at maturity | |
| Interest type | Floating | |
| Interest rate and fees | • Interest rate: | |
• LIBOR plus 1.175% or | ||
• Base Rate (for capital expenditure loan and revolving loan facilities only): 0.5% above the greater of the prime rate or the federal funds rate | ||
• Commitment fee: 0.35% on the undrawn portion | ||
| Maturity | September, 2014; September, 2012 for the revolving loan facility | |
| Mandatory prepayment | • With net proceeds that exceed $1.0 million from the sale of assets not used for replacement assets; | |
• With insurance proceeds that exceed $1.0 million not used to repair, restore or replace assets; | ||
• In the event of a change of control; | ||
• In years 6 and 7, with 100% of excess cash flow applied to repay the term loan and capital expenditure loan facilities; | ||
• With net proceeds from equity and certain debt issuances; and | ||
• With net proceeds that exceed $1.0 million in a fiscal year from contract terminations that are not reinvested. | ||
| Collateral | First lien on the following (with limited exceptions): | |
• Project revenues; | ||
• Equity of the Borrower and its subsidiaries; | ||
• Substantially all assets of the business; and | ||
• Insurance policies and claims or proceeds. |
MACQUARIE INFRASTRUCTURE COMPANY LLC
NOTES TO CONSOLIDATED FINANCIAL STATEMENTS
12. Long-Term Debt – (continued)
To hedge the interest commitments under the term loan facility, District Energy entered into an interest rate swap fixing 100% of the term loan facility at 5.074% (excluding the margin).
Atlantic Aviation
Atlantic Aviation has in place a term loan facility, a capital expenditure facility and a revolving credit facility. On February 25, 2009, Atlantic Aviation amended its credit facility to provide the business additional financial flexibility over the near and medium term. Additionally, under the amended terms, the business will apply all excess cash flow from the business to prepay additional debt whenever the leverage ratio (debt to adjusted EBITDA) is equal to or greater than 6.0x to 1.0 for the district energytrailing twelve months and will use 50% of excess cash flow to prepay debt whenever the leverage ratio is equal to or greater than 5.5x to 1.0 and below 6.0x to 1.0. During the first quarter of 2009, the Company provided the business airport serviceswith a capital contribution of $50.0 million. The business airport parkingpaid down $44.6 million of debt and used the remainder of the capital contribution to pay interest rate swap breakage fees and debt amendment costs. In addition, during 2009 the business gas productionused $40.6 million of its excess cash flow to prepay $37.0 million of the outstanding principal balance of the term loan and distribution business$3.6 million in interest rate swap breakage fees. The Company has classified $45.9 million relating to Atlantic Aviation’s debt in current portion of long-term debt in the consolidated 2009 balance sheet as it expects to repay this amount during 2010.
In February 2010, Atlantic Aviation used $17.1 million of excess cash flow from the fourth quarter of 2010 to prepay $15.5 million of the outstanding principal balance of the term loan debt under this facility and MIC Inc. contain customary financial covenants, including maintaining or exceeding certain financial ratios, and limitationsincurred $1.6 million in interest rate swap breakage fees.
The key terms of the loan agreement of Atlantic Aviation, as revised on capital expenditures and additional debt.February 25, 2009, are presented below:
| Borrower | Atlantic Aviation | |
| Facilities | $900.0 million term loan facility ($818.4 million outstanding at December 31, 2009 and fully drawn at December 31, 2008) | |
| $50.0 million capital expenditure facility ($44.9 million and $39.8 million drawn at December 31, 2009 and 2008, respectively) | ||
| $18.0 million revolving working capital and letter of credit facility ($6.5 million and $6.8 million utilized to back letters of credit at December 31, 2009 and 2008, respectively) | ||
| Amortization | Payable at maturity |
| Years 1 to 5: 100% excess cash flow when Leverage Ratio is 6.0x or above 50% excess cash flow when Leverage Ratio is between 6.0x and 5.5x 100% of excess cash flow in years 6 and 7 (unchanged) | ||
| Interest type | Floating | |
| Interest rate and fees | Years 1 – 5: LIBOR plus 1.6% or Base Rate (for revolving credit facility only): 0.6% above the greater of: (i) the prime rate or (ii) the federal funds rate plus 0.5% | |
| Years 6 – 7: LIBOR plus 1.725% or Base Rate (for revolving credit facility only): 0.725% above the greater of: (i) the prime rate or (ii) the federal funds rate plus 0.5% |
MACQUARIE INFRASTRUCTURE COMPANY LLC
NOTES TO CONSOLIDATED FINANCIAL STATEMENTS
12. Long-Term Debt – (continued)
| Maturity | October, 2014 | |
| Mandatory prepayment | With net proceeds that exceed $1.0 million from the sale of assets not used for replacement assets; | |
| With net proceeds of any debt other than permitted debt; | ||
| With net insurance proceeds that exceed $1.0 million not used to repair, restore or replace assets; | ||
| In the event of a change of control; | ||
| Additional mandatory prepayment based on leverage grid | ||
| With any FBO lease termination payments received; | ||
| With excess cash flows in years 6 and 7. | ||
| Collateral | First lien on the following (with limited exceptions): | |
• Project revenues; | ||
• Equity of the borrower and its subsidiaries; and | ||
• Insurance policies and claims or proceeds. |
To hedge the interest risk associated with commitments under Atlantic Aviation’s term loan, Atlantic Aviation entered into a number of interest rate swaps with various maturity dates to hedge 100% of the term loan through October 16, 2012. As of December 31, 2009, six swaps were remaining, five of which will expire on December 14, 2010. The weighted average hedged rate for these swaps was approximately 5.21%. On December 14, 2010, Atlantic will have only one remaining swap hedging 100% of the outstanding balance of the term loan, with a hedge rate of 5.19%.
13. Derivative Instruments and Hedging Activities
The Company has interest-rate related and foreign-exchange relatedinterest rate-related derivative instruments to manage its interest rate exposure on its debt instruments, and to manage its exchange rate exposure on its future cash flows from its non-U.S. investments, including cash flows from the sale of the non-U.S. investments.instruments. The Company does not enter into derivative instruments for any purpose other than economic interest rate hedging or economic cash-flow hedging purposes.hedging. That is, the Company does not speculate using derivative instruments.
By using derivative financial instruments to hedge exposures to changes in interest rates and foreign exchange rates, the Company exposes itself to credit risk and market risk. Credit risk is the failure of the counterparty to perform under the terms of the derivative contract. When the fair value of a derivative contract is positive, the counterparty owes the Company, which creates credit risk for the Company. When the fair value of a derivative contract is negative, the Company owes the counterparty and, therefore, it does not possess credit risk. The Company minimizes the credit risk in derivative instruments by entering into transactions with high-quality counterparties.
Market risk is the adverse effect on the value of a financial instrument that results from a change in interest rates or currency exchange rates. The market risk associated with interest rates is managed by establishing and monitoring parameters that limit the types and degree of market risk that may be undertaken.
Debt Obligations
The Company entered into foreign exchange forward contracts forand its anticipated cash flows in order to hedge the market risk associated with fluctuations in foreign exchange rates. The forward contracts limit the unfavorable effect that foreign exchange rate changes willbusinesses have on cash flows, including foreign currency distributions and proceeds on the sale of foreign investments. All of the Company’s forward contracts relating to anticipated future cash flows were originally designated as cash flow hedges, however, we subsequently determined that the derivatives did not qualify as hedges for accounting purposes. The maximum term over which the Company was hedging exposures to the variability of foreign exchange rates was 24 months. As the Company sold all of its foreign investments during the year ended December 31, 2006, the Company’s existing foreign exchange forward contracts were closed out by entering equal and offsetting contracts.
MACQUARIE INFRASTRUCTURE COMPANY LLC
NOTES TO CONSOLIDATED FINANCIAL STATEMENTS
13. Derivative Instruments and Hedging Activities – (continued)
At December 31, 2009, the Company had $1.2 billion of current and long-term debt, $1.1 billion of which was economically hedged with interest rate swaps and $83.9 million of which was unhedged. At December 31, 2008, the Company had $1.3 billion of debt, $1.2 billion of which was economically hedged with interest rate swaps and $117.8 million of which was unhedged.
For the year ended December 31, 2006, $1.92009, Atlantic Aviation used $90.4 million to prepay $81.6 million of gains, representing changesthe outstanding principal balance of the term loan debt under the facility and $8.8 million in interest rate swap breakage fees. As a result of the future interest payments that are no longer probable of occurring due to the prepayment of debt, $44.0 million of accumulated other comprehensive loss in the valuation of interest rateconsolidated balance sheet related to Atlantic Aviation’s derivatives was recorded in unrealized lossesreclassified to loss on derivative instruments in the accompanying consolidated statement of operations.
In March 2009, Atlantic Aviation, The Gas Company and District Energy entered into interest rate basis swap contracts with their existing counterparties. These contracts effectively changed the interest rate index on the Company’s existing swap contracts through March 2010 from receiving the 90-day LIBOR rate to receiving the 30-day LIBOR rate plus a margin of 19.50 basis points for Atlantic Aviation and 24.75 basis points for The Gas Company and District Energy. This transaction, adjusted for the prepayments of outstanding principal on the term loan debt at Atlantic Aviation, resulted in $1.8 million lower interest expense for these businesses in 2009 and is expected to lower the effective cash interest expense on these businesses’ debt by approximately $581,000 for the first quarter of 2010.
As of February 25, 2009, due to the amendment of the credit facility for Atlantic Aviation discussed above, and effective April 1, 2007,2009 for the Company’s other businesses, the Company elected to discontinue hedge accounting. In prior periods, when the Company applied hedge accounting, changes in the fair value of interest rate swaps designated as hedging instrumentsderivatives that effectively offset the variability of cash flows associated with variable-rate, long-termon the Company’s debt interest obligations will be reportedwere recorded in other comprehensive income. In accordance with SFAS No. 133,From the Company has concludeddates that from this date,hedge accounting was discontinued, all movements in the fair value of itsthe interest rate swaps qualify as cash flow hedges.are recorded directly through earnings. As interest payments are made, a portion of the other comprehensive loss recorded under hedge accounting is also reclassified into earnings. The Company anticipateswill reclassify into earnings the hedges to be effective on an ongoing basis. The term$72.3 million of net derivative losses included in accumulated other comprehensive loss as of December 31, 2009 over the remaining life of the existing interest rate swaps, of which the Company is currently hedging exposures relatingexpects approximately $31.7 million will be reclassified over the next 12 months.
The Company’s derivative instruments are recorded on the balance sheet at fair value with changes in fair value of interest rate swaps recorded directly through earnings since the dates that hedge accounting was discontinued. The Company measures derivative instruments at fair value using the income approach, which discounts the future net cash settlements expected under the derivative contracts to debt is through August 2013.
MACQUARIE INFRASTRUCTURE COMPANY TRUST
NOTES TO CONSOLIDATED FINANCIAL STATEMENTS
13. Derivative Instruments and Hedging Activities – (continued)
The Company’s fair value measurements of its derivative instruments and the related location of the liabilities associated with the hedging instruments within the consolidated balance sheets at December 31, 2009 and December 31, 2008 were as follows:
| Liabilities at Fair Value(1) | ||||||||
| Interest Rate Swap Contracts Not Designated as Hedging Instruments(2) | Interest Rate Swap Contracts Designated as Hedging Instruments | |||||||
| Balance Sheet Location | December 31, 2009 | December 31, 2008 | ||||||
| ($ in Thousands) | ||||||||
| Fair value of derivative instruments – current liabilities | $ | (49,573 | ) | $ | (45,464 | ) | ||
| Fair value of derivative instruments – non-current liabilities | (54,794 | ) | (105,970 | ) | ||||
| Total interest rate derivative contracts | $ | (104,367 | ) | $ | (151,434 | ) | ||
| (1) | Fair value measurements at reporting date were made using significant other observable inputs (level 2). |
| (2) | As of February 25, 2009 for Atlantic Aviation and April 1, 2009 for the other businesses, the Company elected to discontinue hedge accounting. |
The Company’s hedging activities for the years ended December 31, 2009 and 2008 and the related location within the consolidated financial statements were as follows:
| Derivatives Designated as Hedging Instruments(1) | Derivatives Not Designated as Hedging Instruments(1) | |||||||||||||||||||||||||||||||
| Amount of Gain/ (Loss) Recognized in OCI on Derivatives (Effective Portion) for the Year Ended December 31, | Amount of Loss Reclassified from OCI into Income (Effective Portion) for the Year Ended December 31, | Amount of Loss Recognized in Loss on Derivative Instruments (Ineffective Portion) for the Year Ended December 31, | Amount of Loss Recognized in Loss on Derivative Instruments for the Year Ended December 31, | |||||||||||||||||||||||||||||
| Financial Statement Account | 2009 | 2008 | 2009(2) | 2008 | 2009 | 2008 | 2009(3) | 2008 | ||||||||||||||||||||||||
| ($ in Thousands) | ||||||||||||||||||||||||||||||||
| Interest expense | $ | — | $ | — | $ | (15,691 | ) | $ | (19,798 | ) | $ | — | $ | — | $ | (43,937 | ) | $ | — | |||||||||||||
| Loss on derivative instruments | — | — | (25,154 | ) | (2,648 | ) | (84 | ) | (195 | ) | (4,302 | ) | — | |||||||||||||||||||
| Accumulated other comprehensive gain (loss) | 2,848 | (118,362 | ) | — | — | — | — | — | — | |||||||||||||||||||||||
| Total | $ | 2,848 | $ | (118,362 | ) | $ | (40,845 | ) | $ | (22,446 | ) | $ | (84 | ) | $ | (195 | ) | $ | (48,239 | ) | $ | — | ||||||||||
| (1) | Substantially all derivatives are interest rate swap contracts. |
| (2) | Includes $22.7 million of accumulated other comprehensive losses reclassified into earnings (loss or derivative instruments) resulting from the $44.6 million pay down of principal debt at Atlantic Aviation in the first quarter of 2009. Interest expense represents cash interest paid on derivative instruments, of which $5.2 million is related to the payment of interest rate swap breakage fees in the first quarter of 2009. |
| (3) | For the year ended December 31, 2009, loss on derivative instruments primarily represents the change in fair value of interest rate swaps from the discontinuation of hedge accounting as of February 25, 2009 for Atlantic Aviation and April 1, 2009 for the Company’s other businesses. In addition, loss on derivative |
MACQUARIE INFRASTRUCTURE COMPANY LLC
NOTES TO CONSOLIDATED FINANCIAL STATEMENTS
13. Derivative Instruments and Hedging Activities – (continued)
| instruments includes the reclassification of amounts from accumulated other comprehensive loss into earnings, as Atlantic Aviation pays down its debt more quickly than anticipated. |
All of the Company’s derivative instruments are collateralized by all of the assets of the respective businesses.
14. Notes Payable and Capital Leases
The Company has existing notes payable with various finance companies for the purchase of equipment. The notes are secured by the equipment and require monthly payments of principal and interest. The Company also leases certain equipment under capital leases. The following is a summary of the maturities of the notes payable and the future minimum lease payments under capital leases, together with the present value of the minimum lease payments, as of December 31, 2006 (in2009 ($ in thousands):
| Notes Payable | Capital Leases | |||||||
| 2010 | $ | 176 | $ | 59 | ||||
| 2011 | 153 | 42 | ||||||
| 2012 | 113 | — | ||||||
| 2013 | 113 | — | ||||||
| 2014 | 113 | — | ||||||
| Thereafter | 964 | — | ||||||
| Present value of minimum payments | 1,632 | 101 | ||||||
| Less: current portion | (176 | ) | (59 | ) | ||||
| Long-term portion | $ | 1,456 | $ | 42 | ||||
Notes Payable | Capital Leases | ||||||
| 2007 | $ | 2,665 | $ | 2,018 | |||
| 2008 | 460 | 1,354 | |||||
| 2009 | 79 | 769 | |||||
| 2010 | 73 | 303 | |||||
| 2011 | 49 | 48 | |||||
| Thereafter | — | — | |||||
| Total minimum payments | $ | 3,326 | $ | 4,492 | |||
| Less: Amounts representing interest | — | — | |||||
| Present value of minimum payments | 3,326 | 4,492 | |||||
| Less current portion | (2,665 | ) | (2,018 | ) | |||
| Long-term portion | $ | 661 | $ | 2,474 | |||
The net book value of equipment under capital leaseleases at December 31, 20062009 and December 31, 20052008 was $6.1 million$291,000 and $5.3 million,$429,000, respectively.
15. Members’ Equity
The TrustCompany is authorized to issue 500,000,000 shares of trust stock, and the Company is authorized to issue a corresponding number of LLC interests. Unless the Trust is dissolved, it must remain the sole holder of 100%Each outstanding LLC interest of the Company’s LLC interests and, at all times, the Company will have the identical number of LLC interests outstanding as shares of trust stock. Each share of trust stock represents an undivided beneficial interest in the Trust, and each share of trust stock corresponds to one underlying LLC interest in the Company. Each outstanding share of the trust stock is entitled to one vote for each share on any matter with respect to which membersholders of LLC interests are entitled to vote.
Prior to June 25, 2007, the Company’s publicly traded entity was the Trust. On June 25, 2007, the Trust was dissolved and all of the outstanding shares of beneficial interest in the Trust were exchanged for an equal number of LLC interests in the Company. Prior to this exchange and the dissolution of the Trust, all interests in the Company were held by the Trust. As a result of the mandatory share exchange, each shareholder of the Trust at the time of the exchange became a shareholder of, and with the same percentage interest in, the Company. The LLC interests were listed on the New York Stock Exchange under the symbol “MIC” at the time of the exchange.
Equity Offering
On June 28, 2007, the Company entered into a Purchase Agreement (the “Purchase Agreement”) with the Manager and Citigroup Global Markets Inc., Credit Suisse Securities (USA) LLC, Merrill Lynch & Co., Merrill Lynch, Pierce, Fenner & Smith Incorporated and Macquarie Securities (USA) Inc., as representatives of the underwriters named in the Purchase Agreement (the “Underwriters”), whereby the Company and the Manager agreed to sell and the Underwriters agreed to purchase, subject to and upon terms and conditions set forth therein, 5,701,000 LLC interests and 599,000 LLC interests, respectively, of the Company are entitledunder the Company’s existing shelf registration statement (Registration No. 333-138010-01). Additionally, under the Purchase Agreement, the Company granted the Underwriters an option to vote.purchase up to 945,000 additional LLC interests solely to cover overallotments.
MACQUARIE INFRASTRUCTURE COMPANY LLC
NOTES TO CONSOLIDATED FINANCIAL STATEMENTS
15. Members’ Equity – (continued)
The offering of Directorsthe LLC interests was priced at $40.99 per LLC interest and stockholders adoptedwas completed in July 2007. In addition, the Company’sUnderwriters exercised their overallotment option for 464,871 LLC interests. The proceeds from the equity offering was $241.3 million, net of underwriting fees and expenses. The Company used the proceeds of the offering to partially finance the acquisitions of additional FBO sites in 2007.
Independent Director Equity Plan
The Company has an independent director equity plan, which provides for automatic, non-discretionary awards of director stock units as an additional fee for the independent directors’ services on the Board. The purpose of this plan is to promote the long-term growth and financial success of the Company by attracting, motivating and retaining independent directors of outstanding ability. Only the Company’s independent directors may participate in the plan.
On the date of each annual meeting, each director will receivereceives a grant of stock units equal to $150,000 divided by the fair market value of one share of trust stock asaverage closing sale price of the date of eachstock during the 10-day period immediately preceding the annual meeting of the trust’sCompany’s stockholders. The stock units vest, assuming continued service by the director, on the date immediately preceding the next annual meeting of the Company’s stockholders.
The Company has issued the completion of our offering on December 21, 2004, each independent director was granted 2,548following stock units, for a total of 7,644 stock units. These stock units, which equal $150,000 per director divided by the initial public offering price of $25.00 per share and on a pro rata basis relating to the period from the closingBoard of the offering through the anticipated date of our first annual meeting of stockholders, vested on the day immediately preceding our annual meeting of the Company’s stockholders. The compensation expense related toDirectors under this grant for 2004 (in accordance with Accounting Principles Board Opinion No. 25, Accounting for Stock Issued to Employers, as interpreted) did not have a significant effect on operations.plan:
| Date of Grant | Stock Units Granted | Price of Stock Units Granted | Date of Vesting | |||||||||
| December 21, 2004 | 7,644 | (1) | $25.00 | May 24, 2005 | ||||||||
| May 25, 2005 | 15,873 | $ | 28.35 | May 25, 2006 | ||||||||
| May 25, 2006 | 16,869 | $ | 26.68 | May 23, 2007 | ||||||||
| May 24, 2007 | 10,314 | $ | 43.63 | May 26, 2008 | ||||||||
| May 27, 2008 | 14,115 | $ | 31.88 | June 3, 2009 | ||||||||
| June 4, 2009 | 128,205 | $ | 3.51 | (2) | ||||||||
| (1) | Pro rata basis relating to the period from the closing of the initial public offering through the anticipated date of the Company’s first annual meeting of stockholders. |
| (2) | Date of vesting will be the day immediately preceding the 2010 annual meeting of the Company’s stockholders. |
MACQUARIE INFRASTRUCTURE COMPANY TRUST
NOTES TO CONSOLIDATED FINANCIAL STATEMENTS
16. Reportable Segments
The Company’s operations are broadly classified into four reportable business segments: airport services business, airport parking business, district energythe energy-related businesses and the gas productionaviation-related business.
The energy-related businesses consist of two reportable segments: The Gas Company and distribution business.District Energy. The gas production and distributionenergy-related businesses also include a 50% investment in IMTT, which is accounted for under the equity method. Financial information for IMTT’s business as a whole is a new segment startingpresented below ($ in the second quarterthousands) (unaudited):
| As of, and for the Year Ended December 31, | ||||||||||||
| 2009 | 2008 | 2007 | ||||||||||
| Revenue | $ | 346,175 | $ | 352,583 | $ | 275,197 | ||||||
| Net income | $ | 54,584 | $ | 12,109 | $ | 9,626 | ||||||
| Interest expense, net | 29,510 | 23,540 | 14,349 | |||||||||
| Provision for income taxes | 38,842 | 9,452 | 7,076 | |||||||||
| Depreciation and amortization | 55,998 | 44,615 | 36,025 | |||||||||
| Unrealized (gains) losses on derivative instruments | (30,686 | ) | 46,277 | 21,022 | ||||||||
| Other non-cash income (expenses) | (590 | ) | 601 | 860 | ||||||||
| EBITDA excluding non-cash items(1) | $ | 147,658 | $ | 136,594 | $ | 88,958 | ||||||
| Capital expenditures paid | $ | 137,008 | $ | 221,700 | $ | 209,124 | ||||||
| Property, equipment, land and leasehold improvements, net | 987,075 | 912,887 | 724,806 | |||||||||
| Total assets balance | 1,064,849 | 1,006,289 | 862,534 | |||||||||
| (1) | EBITDA consists of earnings before interest, taxes, depreciation and amortization. Non-cash items that are excluded consist of impairments, derivative gains and losses, and all other non-cash income and expense items. |
The aviation-related business consists of 2006, and the results included below are from the date of acquisition on June 7, 2006.Atlantic Aviation. All of the business segments are managed separately. Duringseparately and management has chosen to organize the prior year,Company around the airportdistinct products and services business consisted of two reportable segments. These businesses are currently managed together. Therefore, they are now combined into a single reportable segment. Results for prior periods have been aggregated to reflectoffered.
Energy-Related Businesses:
IMTT provides bulk liquid storage and handling services in North America through ten terminals located on the new combined segment.
The revenue from the airport parking businessThe Gas Company reportable segment is included in service revenue from product sales and includes distribution and sales of synthetic natural gas, or SNG, and liquefied petroleum gas, or LPG. Revenue is primarily consistsa function of fees from off-airport parkingthe volume of SNG and ground transportation to and from the parking facilitiesLPG consumed by customers and the airport terminals. At December 31, 2006, the airport parking business operated 30 off-airport parking facilities located at 20 major airports across the United States.
The revenue from the district energy businessDistrict Energy reportable segment is included in service revenue and financing and equipment lease income. Included in service revenue is capacity charge revenue, which relates to monthly fixed contract charges, and consumption revenue, which relates to contractual rates applied to actual usage. Financing and equipment lease income relates to direct financing lease transactions and equipment leases to
MACQUARIE INFRASTRUCTURE COMPANY LLC
NOTES TO CONSOLIDATED FINANCIAL STATEMENTS
16. Reportable Segments – (continued)
the Company’sbusiness’ various customers. The CompanyDistrict Energy provides suchits services to buildings throughout the downtown Chicago area and to the Aladdin Resort and Casinoa casino and shopping mall located in Las Vegas, Nevada.
Aviation-Related Business:
The revenue from the gas production and distribution businessAtlantic Aviation reportable segment is included in revenueprincipally derives income from productfuel sales and from other airport services. Airport services revenue includes distributionfuel-related services, de-icing, aircraft hangarage and sales of SNG and LPG. Revenue is primarily a functionother aviation services. All of the volumerevenue of SNG and LPG consumed by customers andAtlantic Aviation is generated in the price per thermal unit or gallon charged to customers. Because both SNG and LPG are derived from petroleum, revenue levels, without organic operating growth, will generally track global oil prices. TGC’s utility revenue includes fuel adjustment charges, or FACs, through which changes in fuel costs are passed through to customers.
Selected information by reportable segment is presented in the following tables. The tables do not include financial data for ourthe Company’s equity and cost investments.
Revenue from external customers for the Company’s consolidated reportable segments for the year ended December 31, 2006 arewas as follows (in($ in thousands) (unaudited):
| Year Ended December 31, 2009 | ||||||||||||||||
| Energy-related Businesses | Aviation-related Business | |||||||||||||||
| The Gas Company | District Energy | Atlantic Aviation | Total | |||||||||||||
| Revenue from Product Sales | ||||||||||||||||
| Product sales | $ | 79,597 | $ | — | $ | 314,603 | $ | 394,200 | ||||||||
| Product sales – utility | 95,769 | — | — | 95,769 | ||||||||||||
| 175,366 | — | 314,603 | 489,969 | |||||||||||||
| Service Revenue | ||||||||||||||||
| Other services | — | 3,137 | 171,546 | 174,683 | ||||||||||||
| Cooling capacity revenue | — | 20,430 | — | 20,430 | ||||||||||||
| Cooling consumption revenue | — | 20,236 | — | 20,236 | ||||||||||||
| — | 43,803 | 171,546 | 215,349 | |||||||||||||
| Financing and Lease Income | ||||||||||||||||
| Financing and equipment lease | — | 4,758 | — | 4,758 | ||||||||||||
| — | 4,758 | — | 4,758 | |||||||||||||
| Total Revenue | $ | 175,366 | $ | 48,561 | $ | 486,149 | $ | 710,076 | ||||||||
Airport Services | Airport Parking | District Energy | Gas Production and Distribution | Total | ||||||||||||
Revenue from Product Sales | ||||||||||||||||
| Fuel sales | $ | 225,570 | $ | — | $ | — | $ | 87,728 | $ | 313,298 | ||||||
| 225,570 | — | — | 87,728 | 313,298 | ||||||||||||
Service Revenue | ||||||||||||||||
| Other services | 87,306 | — | 3,163 | — | 90,469 | |||||||||||
| Cooling capacity revenue | — | — | 17,407 | — | 17,407 | |||||||||||
| Cooling consumption revenue | — | — | 17,897 | — | 17,897 | |||||||||||
| Parking services | — | 76,062 | — | — | 76,062 | |||||||||||
| 87,306 | 76,062 | 38,467 | — | 201,835 | ||||||||||||
Financing and Lease Income | ||||||||||||||||
| Financing and equipment lease | — | — | 5,118 | — | 5,118 | |||||||||||
| — | — | 5,118 | — | 5,118 | ||||||||||||
Total Revenue | $ | 312,876 | $ | 76,062 | $ | 43,585 | $ | 87,728 | $ | 520,251 | ||||||
Year Ended December 31, 2006 | December 31, 2006 | ||||||||||||||||||
Segment Profit(1) | Interest Expense | Depreciation/ Amortization(2) | Capital Expenditures | Property, Equipment, Land and Leasehold Improvements | Total Assets | ||||||||||||||
| Airport services | $ | 166,493 | $ | 30,456 | $ | 25,282 | $ | 7,101 | $ | 149,623 | $ | 932,614 | |||||||
| Airport parking | 21,425 | 17,262 | 29,118 | 4,181 | 97,714 | 283,459 | |||||||||||||
| District energy | 14,179 | 8,683 | 7,077 | 1,618 | 142,787 | 236,080 | |||||||||||||
| Gas production and distribution | 18,810 | 5,426 | 3,735 | 5,509 | 132,635 | 308,500 | |||||||||||||
| Total | $ | 220,907 | $ | 61,827 | $ | 65,212 | $ | 18,409 | $ | 522,759 | $ | 1,760,653 | |||||||
MACQUARIE INFRASTRUCTURE COMPANY TRUST
NOTES TO CONSOLIDATED FINANCIAL STATEMENTS
16. Reportable Segments – (continued)
| Year Ended December 31, 2008 | ||||||||||||||||
| Energy-related Businesses | Aviation-related Business | |||||||||||||||
| The Gas Company | District Energy | Atlantic Aviation | Total | |||||||||||||
| Revenue from Product Sales | ||||||||||||||||
| Product sales | $ | 91,244 | $ | — | $ | 494,810 | 586,054 | |||||||||
| Product sales – utility | 121,770 | — | — | 121,770 | ||||||||||||
| 213,014 | — | 494,810 | 707,824 | |||||||||||||
| Service Revenue | ||||||||||||||||
| Other services | — | 3,115 | 221,492 | 224,607 | ||||||||||||
| Cooling capacity revenue | — | 19,350 | — | 19,350 | ||||||||||||
| Cooling consumption revenue | — | 20,894 | — | 20,894 | ||||||||||||
| — | 43,359 | 221,492 | 264,851 | |||||||||||||
| Financing and Lease Income | ||||||||||||||||
| Financing and equipment lease | — | 4,686 | — | 4,686 | ||||||||||||
| — | 4,686 | — | 4,686 | |||||||||||||
| Total Revenue | $ | 213,014 | $ | 48,045 | $ | 716,302 | 977,361 | |||||||||
| Year Ended December 31, 2007 | ||||||||||||||||
| Energy-related Businesses | Aviation-related Business | |||||||||||||||
| The Gas Company | District Energy | Atlantic Aviation | Total | |||||||||||||
| Revenue from Product Sales | ||||||||||||||||
| Product sales | $ | 74,602 | $ | — | $ | 371,250 | $ | 445,852 | ||||||||
| Product sales – utility | 95,770 | — | — | 95,770 | ||||||||||||
| 170,372 | — | 371,250 | 541,622 | |||||||||||||
| Service Revenue | ||||||||||||||||
| Other services | — | 2,864 | 163,086 | 165,950 | ||||||||||||
| Cooling capacity revenue | — | 18,854 | — | 18,854 | ||||||||||||
| Cooling consumption revenue | — | 22,876 | — | 22,876 | ||||||||||||
| — | 44,594 | 163,086 | 207,680 | |||||||||||||
| Financing and Lease Income | ||||||||||||||||
| Financing and equipment lease | — | 4,912 | — | 4,912 | ||||||||||||
| — | 4,912 | — | 4,912 | |||||||||||||
| Total Revenue | $ | 170,372 | $ | 49,506 | $ | 534,336 | $ | 754,214 | ||||||||
In accordance with FASB ASC 280Segment Reporting (formerly SFAS No. 131, “Disclosures about Segments of an Enterprise and Related Information''), the Company has disclosed earnings before interest, taxes, depreciation and amortization (EBITDA) excluding non-cash items. Non-cash items includes impairments, derivative gains and losses and adjustments for other non-cash items reflected in the statements of operations. The Company believes EBITDA excluding non-cash items provides additional insight into the performance of the operating businesses relative to each other and similar businesses without regard to their capital structure, and their ability to service or reduce debt, fund capital expenditures and/or support distributions to the holding company. EBITDA excluding non-cash items is reconciled to net loss.
MACQUARIE INFRASTRUCTURE COMPANY LLC
NOTES TO CONSOLIDATED FINANCIAL STATEMENTS
16. Reportable Segments – (continued)
In 2008 and 2007, the Company disclosed EBITDA only. The following tables, reflecting results of operations for the consolidated group and for each of the businesses for the years ended December 31, 2008 and 2007, have been conformed to current periods’ presentation reflecting EBITDA excluding non-cash items.
EBITDA excluding non-cash items for the Company’s consolidated reportable segments is shown in the below tables ($ in thousands) (unaudited).
| Year Ended December 31, 2009 | ||||||||||||||||
| Energy-related Businesses | Aviation-related Business | |||||||||||||||
| The Gas Company | District Energy | Atlantic Aviation(1) | Total Reportable Segments | |||||||||||||
| Net income (loss) | $ | 11,836 | $ | 1,182 | $ | (90,377 | ) | $ | (77,359 | ) | ||||||
| Interest expense, net | 8,941 | 10,153 | 67,983 | 87,077 | ||||||||||||
| Benefit (provision) for income taxes | 7,619 | 773 | (61,009 | ) | (52,617 | ) | ||||||||||
| Depreciation | 5,991 | 6,086 | 30,822 | 42,899 | ||||||||||||
| Amortization of intangibles | 838 | 1,368 | 58,686 | 60,892 | ||||||||||||
| Goodwill impairment | — | — | 71,200 | 71,200 | ||||||||||||
| Losses on derivative instruments | 636 | 220 | 28,277 | 29,133 | ||||||||||||
| Other non-cash expense | 1,771 | 1,009 | 903 | 3,683 | ||||||||||||
| EBITDA excluding non-cash items | $ | 37,632 | $ | 20,791 | $ | 106,485 | $ | 164,908 | ||||||||
| (1) | Includes non-cash impairment charges of $102.0 million recorded during the first six months of 2009, consisting of $71.2 million related to goodwill, $23.3 million related to intangible assets (in amortization of intangibles) and $7.5 million related to property, equipment, land and leasehold improvements (in depreciation). |
| Year Ended December 31, 2008 | ||||||||||||||||
| Energy-related Businesses | Aviation-related Business | |||||||||||||||
| The Gas Company | District Energy | Atlantic Aviation(1) | Total Reportable Segments | |||||||||||||
| Net income (loss) | $ | 6,283 | $ | 691 | $ | (44,348 | ) | $ | (37,374 | ) | ||||||
| Interest expense, net | 9,390 | 10,341 | 62,967 | 82,698 | ||||||||||||
| Benefit (provision) for income taxes | 4,044 | 242 | (29,936 | ) | (25,650 | ) | ||||||||||
| Depreciation | 5,883 | 5,813 | 34,257 | 45,953 | ||||||||||||
| Amortization of intangibles | 856 | 1,372 | 59,646 | 61,874 | ||||||||||||
| Goodwill impairment | — | — | 52,000 | 52,000 | ||||||||||||
| Losses (gains) on derivative instruments | 221 | (26 | ) | 1,871 | 2,066 | |||||||||||
| Other non-cash expense | 1,180 | 2,654 | 624 | 4,458 | ||||||||||||
| EBITDA excluding non-cash items | $ | 27,857 | $ | 21,087 | $ | 137,081 | $ | 186,025 | ||||||||
| (1) | Includes non-cash impairment charges of $87.5 million recorded during the fourth quarter of 2008, consisting of $52.0 million related to goodwill, $21.7 million related to intangible assets (in amortization of intangibles) and $13.8 million related to property, equipment, land and leasehold improvements (in depreciation). |
MACQUARIE INFRASTRUCTURE COMPANY LLC
NOTES TO CONSOLIDATED FINANCIAL STATEMENTS
16. Reportable Segments – (continued)
| Year Ended December 31, 2007 | ||||||||||||||||
| Energy-related Businesses | Aviation-related Business | |||||||||||||||
| The Gas Company | District Energy | Atlantic Aviation(2) | Total Reportable Segments | |||||||||||||
| Net income (loss) | $ | 4,840 | $ | (9,259 | ) | $ | 13,057 | $ | 8,638 | |||||||
| Interest expense, net | 9,195 | 9,009 | 42,559 | 60,763 | ||||||||||||
| Benefit (provision) for income taxes | 3,115 | (5,490 | ) | 8,575 | 6,200 | |||||||||||
| Depreciation | 5,881 | 5,792 | 14,621 | 26,294 | ||||||||||||
| Amortization of intangibles | 856 | 1,368 | 30,132 | 32,356 | ||||||||||||
| Non-cash loss on extinguishment of debt(1) | — | 3,013 | 9,804 | 12,817 | ||||||||||||
| Losses on derivative instruments | 431 | 28 | 1,659 | 2,118 | ||||||||||||
| Other non-cash expense (income) | 1,290 | 1,086 | (556 | ) | 1,820 | |||||||||||
| EBITDA excluding non-cash items | $ | 25,608 | $ | 5,547 | $ | 119,851 | $ | 151,006 | ||||||||
| (1) | Consists of non-cash write-offs of deferred financing costs from debt refinancings. |
| (2) | Includes non-cash impairment charges of $1.3 million related to intangible assets (in amortization of intangibles). |
Reconciliations of consolidated reportable segments’ EBITDA excluding non-cash items to consolidated net loss from continuing operations before income taxes and noncontrolling interests were as follows ($ in thousands) (unaudited):
| Year Ended December 31, | ||||||||||||||||
| 2009 | 2008 | 2007 | ||||||||||||||
| Total reportable segments EBITDA excluding non-cash items | $ | 164,908 | $ | 186,025 | $ | 151,006 | ||||||||||
| Interest income | 119 | 1,090 | 5,705 | |||||||||||||
| Interest expense | (91,154 | ) | (88,652 | ) | (65,356 | ) | ||||||||||
| Depreciation(1) | (42,899 | ) | (45,953 | ) | (26,294 | ) | ||||||||||
| Amortization of intangibles(2) | (60,892 | ) | (61,874 | ) | (32,356 | ) | ||||||||||
| Selling, general and administrative – corporate | (9,707 | ) | (4,205 | ) | (10,038 | ) | ||||||||||
| Fees to manager | (4,846 | ) | (12,568 | ) | (65,639 | ) | ||||||||||
| Equity in earnings (losses) and amortization charges of investees | 22,561 | 1,324 | (32 | ) | ||||||||||||
| Goodwill impairment | (71,200 | ) | (52,000 | ) | — | |||||||||||
| Non-cash loss on extinguishment of debt | — | — | (12,817 | ) | ||||||||||||
| Losses on derivative instruments | (29,540 | ) | (2,843 | ) | (1,362 | ) | ||||||||||
| Other expense, net | (1,852 | ) | (4,001 | ) | (2,156 | ) | ||||||||||
| Total consolidated net loss from continuing operations before income taxes and noncontrolling interests | $ | (124,502 | ) | $ | (83,657 | ) | $ | (59,339 | ) | |||||||
| (1) | Depreciation includes depreciation expense for District Energy, which is reported in cost of services in the consolidated statements of operations. Depreciation also includes non-cash impairment charges of $7.5 million and $13.8 million recorded by Atlantic Aviation during the first six months of 2009 and during the fourth quarter of 2008, respectively. |
| (2) | Includes a non-cash impairment charge of $23.3 million and $21.7 million for contractual arrangements |
MACQUARIE INFRASTRUCTURE COMPANY LLC
NOTES TO CONSOLIDATED FINANCIAL STATEMENTS
16. Reportable Segments – (continued)
| recorded in the first six months of 2009 and the fourth quarter of 2008, respectively, at Atlantic Aviation and a $1.3 million non-cash impairment charge on the airport management contracts at Atlantic Aviation in 2007. |
Capital expenditures for the Company’s reportable segments were as follows ($ in thousands) (unaudited):
| Year Ended December 31, | ||||||||||||
| 2009 | 2008 | 2007 | ||||||||||
| The Gas Company | $ | 7,388 | $ | 9,720 | $ | 8,715 | ||||||
| District Energy | 12,095 | 5,378 | 9,421 | |||||||||
| Atlantic Aviation | 10,837 | 34,462 | 27,585 | |||||||||
| Total | $ | 30,320 | $ | 49,560 | $ | 45,721 | ||||||
Property, equipment, land and leasehold improvements, goodwill and total assets for the Company’s reportable segments as of December 31 were as follows ($ in thousands) (unaudited):
| Property, Equipment, Land and Leasehold Improvements | Goodwill | Total Assets | ||||||||||||||||||||||
| 2009(1) | 2008(2) | 2009(3) | 2008(4) | 2009 | 2008 | |||||||||||||||||||
| The Gas Company | $ | 143,783 | $ | 143,019 | $ | 120,193 | $ | 120,193 | $ | 344,876 | $ | 330,180 | ||||||||||||
| District Energy | 151,543 | 145,616 | 18,647 | 18,647 | 234,847 | 227,102 | ||||||||||||||||||
| Atlantic Aviation | 284,761 | 303,800 | 377,342 | 448,511 | 1,473,228 | 1,660,801 | ||||||||||||||||||
| Total | $ | 580,087 | $ | 592,435 | $ | 516,182 | $ | 587,351 | $ | 2,052,951 | $ | 2,218,083 | ||||||||||||
| (1) | Includes a non-cash impairment charge of $7.5 million recorded during the first six months of 2009 at Atlantic Aviation. |
| (2) | Includes a non-cash impairment charge of $13.8 million recorded during the fourth quarter of 2008 at Atlantic Aviation. |
| (3) | Includes a non-cash goodwill impairment charge of $71.2 million recorded at Atlantic Aviation during the first six months of 2009. |
| (4) | Includes a non-cash goodwill impairment charge of $52.0 million recorded at Atlantic Aviation during the fourth quarter of 2008. |
Reconciliation of total reportable segmentsegments’ total assets to consolidated total assets at December 31, 2006 (in($ in thousands) (unaudited):
| As of December 31, | ||||||||
| 2009 | 2008 | |||||||
| Total assets of reportable segments | $ | 2,052,951 | $ | 2,218,083 | ||||
| Investment in IMTT | 207,491 | 184,930 | ||||||
| Assets of discontinued operations held for sale | 86,695 | 105,725 | ||||||
| Corporate and other | (7,916 | ) | 43,698 | |||||
| Total consolidated assets | $ | 2,339,221 | $ | 2,552,436 | ||||
| Total reportable segments | $ | 1,760,653 | ||
| Equity investments | ||||
| Investment in IMTT | 239,632 | |||
| Corporate – Macquarie Infrastructure Company LLC and Macquarie Infrastructure Company Inc. | 462,605 | |||
| Less: Consolidation entries | (365,357 | ) | ||
| Total consolidated assets | $ | 2,097,533 |
| Total reportable segments | $ | 220,907 | ||
| Selling, general and administrative | (120,252 | ) | ||
| Fees to manager | (18,631 | ) | ||
| Depreciation and amortization | (55,948 | ) | ||
| 26,076 | ||||
| Other income, net | 7,398 | |||
| Total consolidated income before income taxes and minority interests | $ | 33,474 |
Airport Services | Airport Parking | District Energy | Total | ||||||||||
Revenue from Product Sales | |||||||||||||
| Fuel sales | $ | 142,785 | $ | — | $ | — | $ | 142,785 | |||||
| 142,785 | — | — | 142,785 | ||||||||||
Service Revenue | |||||||||||||
| Other services | 58,701 | — | 2,855 | 61,556 | |||||||||
| Capacity revenue | — | — | 16,524 | 16,524 | |||||||||
| Consumption revenue | — | — | 18,719 | 18,719 | |||||||||
| Parking services | — | 59,856 | — | 59,856 | |||||||||
| 58,701 | 59,856 | 38,098 | 156,655 | ||||||||||
Financing and Lease Income | |||||||||||||
| Financing and equipment lease | — | — | 5,303 | 5,303 | |||||||||
| — | — | 5,303 | 5,303 | ||||||||||
Total Revenue | $ | 201,486 | $ | 59,856 | $ | 43,401 | $ | 304,743 | |||||
MACQUARIE INFRASTRUCTURE COMPANY TRUST
NOTES TO CONSOLIDATED FINANCIAL STATEMENTS
16. Reportable Segments – (continued)
From the date of acquisition to December 31, 2005 | December 31, 2005 | ||||||||||||||||||
Segment Profit(1) | Interest Expense | Depreciation/ Amortization(2) | Capital Expenditures | Property, Equipment, Land and Leasehold Improvements | Total Assets | ||||||||||||||
| Airport services | $ | 109,100 | $ | 18,650 | $ | 15,652 | $ | 4,038 | $ | 92,906 | $ | 553,285 | |||||||
| Airport parking | 14,780 | 10,350 | 6,199 | 1,679 | 94,859 | 288,846 | |||||||||||||
| District energy | 14,223 | 8,543 | 7,062 | 1,026 | 147,354 | 245,405 | |||||||||||||
| Total | $ | 138,103 | $ | 37,543 | $ | 28,913 | $ | 6,743 | $ | 335,119 | $ | 1,087,536 | |||||||
| Total reportable segments | $ | 1,087,536 | ||
| Equity and cost investments: | ||||
| Equity investment in toll road business | 69,358 | |||
| Investment in SEW | 35,295 | |||
| Investment in MCG | 68,882 | |||
| Corporate – Macquarie Infrastructure Company LLC and Macquarie Infrastructure Company Inc. | 359,403 | |||
| Less: Consolidation entries | (257,176 | ) | ||
| Total consolidated assets | $ | 1,363,298 |
Reconciliation of reportable segment profitsegments’ goodwill to consolidated income before income taxes and minority interests for the year ended December 31, 2005 (ingoodwill ($ in thousands) (unaudited):
| As of December 31, | ||||||||
| 2009 | 2008 | |||||||
| Goodwill of reportable segments | $ | 516,182 | $ | 587,351 | ||||
| Corporate and other | — | (1,102 | ) | |||||
| Total consolidated goodwill | $ | 516,182 | $ | 586,249 | ||||
| Total reportable segments | $ | 138,103 | ||
| Selling, general and administrative | (82,636 | ) | ||
| Fees to manager | (9,294 | ) | ||
| Depreciation and amortization | (20,822 | ) | ||
| 25,351 | ||||
| Other expense, net | (13,567 | ) | ||
| Total consolidated income before income taxes and minority interests | $ | 11,784 |
17. Related Party Transactions
Management Services Agreement with Macquarie Infrastructure Management (USA) Inc., or MIMUSA
The Manager acquired 2,000,000 shares of companytrust stock concurrently with the closing of the initial public offering in December 2004, with an aggregate purchase price of $50.0 million, at a purchase price per share equal to the initial public offering price of $25.$25.00, which were exchanged for LLC interests on June 25, 2007. Pursuant to the terms of the Management Agreement (discussed below), MIMUSAthe Manager may sell up to 65% of these shares (now LLC interests) at any timetime. The Manager has also received additional shares of trust stock and may sellLLC interests (the LLC interests replacing the balance at any time from and after December 21, 2007 (beingtrust stock following the third anniversarydissolution of the IPO closing).
The Company entered into a management services agreement, or Management Agreement, with MIMUSAthe Manager pursuant to which MIMUSAthe Manager manages the Company’s day-to-day operations and oversees the management teams of the Company’s operating businesses. In addition, MIMUSAthe Manager has the right to appoint the Chairman of the Board of the Company, and an alternate, subject to minimum equity ownership, and to assign, or second, to the Company, on a permanent and wholly-dedicated basis, employees to assume the role of Chief Executive Officer and Chief Financial Officer and second or make other personnel available as required.
In accordance with the Management Agreement, MIMUSAthe Manager is entitled to a quarterly base management fee based primarily on the Trust’sCompany’s market capitalization, and a performance fee, as defined, based on the performance of the trustCompany’s stock relative to a weighted average of two benchmark indices, a U.S. utilities indexindex. Base management and a European utilities index, weighted in proportionperformance fees payable to the Manager, and the Manager’s reinvestment of the base management and performance fees in the Company’s equity investments. ForLLC interests, for the yearyears ended December 31, 2006,2009, 2008 and 2007 were as follows ($ in thousands):
| Year Ended December 31, | ||||||||||||
| 2009(1) | 2008 | 2007(2) | ||||||||||
| Base management fee | $ | 4,846 | $ | 12,568 | $ | 21,677 | ||||||
| Performance fee | — | — | 43,962 | |||||||||
| (1) | During 2009, the Manager elected to reinvest the base management fee for the second and third quarters of 2009 in LLC interests and the Company issued 149,795 LLC interests and 180,309 LLC interests, respectively, to the Manager during the third and fourth quarters of 2009, respectively. The base management fee for the fourth quarter of 2009 will be reinvested in LLC interests during the first quarter of 2010. |
| (2) | During 2007, the Manager elected to reinvest the performance fee for the first and second quarters of 2007 in LLC interests and the Company issued 21,972 LLC interests and 1,171,503 LLC interests, respectively, to the Manager during the third and fourth quarters of 2007, respectively. |
The unpaid portion of the fees at the end of each reporting period is included in due to manager-related party in the consolidated balance sheets.
MACQUARIE INFRASTRUCTURE COMPANY LLC
NOTES TO CONSOLIDATED FINANCIAL STATEMENTS
17. Related Party Transactions – (continued)
During the third quarter of 2008, the Manager had offered to reinvest its base fee for the third quarter of 2008 in additional LLC interests of the Company. However in the fourth quarter of 2008, the Board of Directors requested that the Manager reverse its decision to reinvest its base management fees in stock under the terms of $14.5 million and performance fees of $4.1 million were payable to MIMUSA. Of this amount, $4.5 million is included asthe management services agreement due to managerthe significant decline in the accompanying consolidated balance sheetmarket price of the LLC interests between the end of the third quarter of 2008 and the time at December 31, 2006. On June 27, 2006,which the Company would have issued 145,547 shares of trust stockthose LLC interests and the resulting potential substantial dilution to MIMUSA as consideration forexisting shareholders. The Manager agreed to this request and subsequently, both the $4.1 million performance fee. For the year ended December 31, 2005,third and fourth quarter 2008 base management fees of $9.3 million were payable to MIMUSA. Of this amount, $2.5 million is included as due to manager in the accompanying consolidated balance sheet at December 31, 2005, and washave been paid in 2006. There was no performance fee payable to MIMUSA forcash during the year ended December 31, 2005. For the period ended December 31, 2004, base management feesfirst quarter of $271,000 and performance fees of $12.1 million were payable to MIMUSA. 2009.
The base management fees were paid in 2005 and on April 19, 2005, the Company issued 433,001 shares of trust stock to MIMUSA as consideration for the $12.1 million performance fee due for the fiscal quarter ended December 31, 2004.
Advisory and Other Services from the Macquarie Group
The Macquarie Group, throughand wholly-owned subsidiaries within the holding company,Macquarie Group, including Macquarie Bank Limited, or MBL, and its wholly owned subsidiaries,Macquarie Capital (USA) Inc., or MCUSA (formerly Macquarie Securities (USA) Inc.), or MSUSA, and Macquarie Securities (Australia) Limited, or MSAL, have provided various advisory and other services and have incurred expenses in connection with the Company’s equity raising activities, acquisitions dispositions and underlying debt associated withstructuring for the businesses, comprisingCompany and its businesses. Underwriting fees are recorded in members’ equity as a direct cost of equity offerings. Advisory fees and out-of-pocket expenses relating to acquisitions are expensed as incurred. Debt arranging fees are deferred and amortized over the term of the credit facility. Amounts relating to these transactions comprise the following (in($ in thousands):
| Year Ended December 31, 2009 | ||||
| Sale of 49.99% of non-controlling interest stake of District Energy to John Hancock | — advisory services from MCUSA | $1,294 | ||
— reimbursement of out-of-pocket expenses to MCUSA | 15 | |||
| Strategic review of alternatives available to the Company | — advisory services from MCUSA | 300 | ||
— reimbursement of out-of-pocket expenses to MCUSA | 2 | |||
| Atlantic Aviation’s accounts receivable management consulting services | — consulting services from Macquarie Business Improvement and Strategy, or MBIS | 159 | ||
— reimbursement of out-of-pocket expenses to MBIS | 71 | |||
| PCAA restructuring advice | — advisory services from MCUSA | 200 | ||
— reimbursement of out-of-pocket expenses to MCUSA | 3 | |||
| Atlantic Aviation’s debt amendment | — debt arranging services from MCUSA | 970 | ||
| Year Ended December 31, 2008 | ||||
| Acquisition of SevenBar FBOs | — advisory services from MCUSA | $ 819 | ||
— reimbursement of out-of-pocket expenses to MCUSA | 3 |
Year Ended December 31, 2006 | |||
| Acquisition of IMTT | |||
| – advisory services from MSUSA | $ | 4,232 | |
| Acquisition of TGC | |||
| – advisory services from MSUSA | 3,750 | ||
| – debt arranging services from MSUSA | 900 | ||
| – out of pocket expense reimbursement to MSUSA | 53 | ||
| Acquisition of Trajen | |||
| – advisory services from MSUSA | 5,260 | ||
| – debt arranging services from MSUSA | 900 | ||
| Disposition of MCG | |||
| – broker services from MSAL | 231 | ||
| Disposition of SEW | |||
| – advisory services from MBL | 933 | ||
| Disposition of MYL | |||
| – advisory services from MBL (accrued in 2006 and paid in 2007) | 867 | ||
| Airport Parking Business Refinancing | |||
| – advisory services from MSUSA | 1,463 | ||
| MIC Inc. Acquisition Facility increase | |||
| – advisory services from MSUSA | 575 | ||
Year Ended December 31, 2005 | |||
| Acquisition of GAH | |||
| – advisory services from MSUSA | $ | 1,070 | |
| – debt arranging services from MSUSA | 160 | ||
| – equity and debt underwriting services from MSUSA | 913 | ||
| – out of pocket expense reimbursement to MSUSA | 16 | ||
| Acquisition of EAR | |||
| – advisory services from MSUSA | 1,000 | ||
| – out of pocket expense reimbursement to MSUSA | 9 | ||
| Acquisition of SunPark | |||
| – advisory services from MSUSA | 1,000 | ||
| – out of pocket expense reimbursement to MSUSA | 1 | ||
| Airport Services Business Long–term Debt Refinancing | |||
| – advisory services from MSUSA | 1,983 | ||
| – out of pocket expense reimbursement to MSUSA | 48 | ||
| MIC Inc. Acquisition Facility | |||
| – advisory services from MSUSA | 625 | ||
MACQUARIE INFRASTRUCTURE COMPANY TRUST
NOTES TO CONSOLIDATED FINANCIAL STATEMENTS
17. Related Party Transactions – (continued)
Long-Term Debt
MIC Inc. has a $20.0 million revolving credit facility with various financial institutions, including entities within the Macquarie Group. There was no outstanding balance on the revolving credit facility at December 31, 2009. Amounts relating to the portion of this revolving credit facility from the Macquarie Group comprise the following ($ in thousands):
| 2009 | ||||
| Revolving credit facility commitment provided by Macquarie Group during the period January 1, 2009 through April 13, 2009(1) | $ | 66,667 | ||
| Revolving credit facility commitment provided by Macquarie Group during the period April 14, 2009 through December 30, 2009(2) | 21,556 | |||
| Revolving credit facility commitment provided by Macquarie Group on December 31, 2009 | 4,444 | |||
| Portion of revolving credit facility commitment from Macquarie Group drawn down, as of December 31, 2009(3) | — | |||
| Macquarie Group portion of the principal payments made to the revolving credit facility during the year ended December 31, 2009(3) | 15,333 | |||
| Interest expense on Macquarie Group portion of the drawn down commitment, for the year ended December 31, 2009 | 599 | |||
| Commitment fees to the Macquarie Group, for year ended December 31, 2009 | 100 | |||
| 2008 | ||||
| Revolving credit facility commitment provided by the Macquarie Group during the period January 1, 2008 through February 11, 2008 | $ | 50,000 | ||
| Revolving credit facility commitment provided by Macquarie Group during the period February 12, 2008 through December 31, 2008 | 66,667 | |||
| Portion of credit facility commitment from Macquarie Group drawn down, as of December 31, 2008 | 15,333 | |||
| Interest expense on Macquarie Group portion of the drawn down commitment, 2008 year | 698 | |||
| Commitment fees to the Macquarie Group, year ended December 31, 2008 | 252 | |||
| Upfront fee to Macquarie Group upon renewal of facility in February 2008 | 333 | |||
| (1) | On April 14, 2009, the Company elected to reduce the available principal on its revolving credit facility from $300.0 million to $97.0 million. This resulted in a decrease in the Macquarie Group’s total commitment under the revolving credit facility from $66.7 million to $21.6 million. See Note 12, “Long-Term Debt”, for further discussion. |
| (2) | On December 31, 2009, the Company elected to reduce the available principal on its revolving credit facility from $97.0 million to $20.0 million. This resulted in a decrease in the Macquarie Group’s total commitment under the revolving credit facility from $21.6 million to $4.4 million. See Note 12, “Long-Term Debt”, for further discussion. |
| (3) | On December 28, 2009, using the net cash proceeds from the sale of the 49.99% non-controlling interest in District Energy, and cash on hand, the Company repaid the outstanding principal balance on the MIC Inc. revolving credit facility. See Note 12, “Long-Term Debt”, for further discussion. |
MACQUARIE INFRASTRUCTURE COMPANY LLC
NOTES TO CONSOLIDATED FINANCIAL STATEMENTS
17. Related Party Transactions – (continued)
Derivative Instruments and Hedging Activities
The Company has derivative instruments in place to fix the interest rate on certain outstanding variable-rate term loan facilities. MBL has provided interest rate swaps for Atlantic Aviation and The Gas Company. At December 31, 2009 and 2008, Atlantic Aviation had $818.4 million and $900.0 million, respectively, of its variable-rate term loans hedged, of which MBL was providing the interest rate swaps for a notional amount of $307.0 million and $343.3 million, respectively. The remainder of the swaps are from an unrelated third party. During the years ended December 31, 2009 and 2008, Atlantic Aviation made net payments to MBL of $14.1 million and $5.8 million, respectively, in relation to these swaps. During the year ended December 31, 2007, MBL made net payment to Atlantic Aviation of $732,000 in relation to these swaps.
As discussed in Note 12, “Long-Term Debt”, for year ended December 31, 2009, Atlantic Aviation paid $8.8 million in interest rate swap breakage fees, of which $1.8 million was paid to MBL.
In February 2010, per the revised terms of the term loan agreement as described in Note 12, “Long-Term Debt”, Atlantic Aviation used $17.1 million of excess cash flow to prepay $15.5 million of the outstanding principal balance of the term loan debt and incurred $1.6 million in interest rate swap breakage fees, of which $215,000 was paid to MBL.
At December 31, 2009 and 2008, The Gas Company had $160.0 million of its term loans hedged, of which MBL was providing the interest rate swaps for a notional amount of $48.0 million. The remainder of the swaps are from an unrelated third party. During the years ended December 31, 2009 and 2008, The Gas Company made net payments to MBL of $1.9 million and $685,000, respectively, in relation to these swaps. During the year ended December 31, 2007, MBL made net payments to The Gas Company of $328,000 in relation to these swaps.
Other Transactions
On March 30, 2009, The Gas Company entered into licensing agreements with Utility Service Partners, Inc. and America’s Water Heater Rentals, LLC, both indirect subsidiaries of Macquarie Group Limited, to enable these entities to offer products and services to The Gas Company’s customer base. No payments were made under these arrangements during the year ended December 31, 2009.
On August 29, 2008, Macquarie Global Opportunities Partners, or MGOP, a private equity fund managed by the Macquarie Group, completed the acquisition of the jet membership, retail charter and fuel management business units previously owned by Sentient Jet Holdings, LLC. The new company is called Sentient Flight Group (referred to hereafter as “Sentient”). Sentient was an advisory agreement with MSUSA relating toexisting customer of Atlantic Aviation. For the pending FBO acquisition. No fees have been paid asyears ended December 31, 2009 and 2008, Atlantic Aviation recorded $9.6 million and $3.6 million, respectively, in revenue from Sentient. As of December 31, 2006. The2009 and 2008, Atlantic Aviation had $195,000 and $77,000, respectively, in receivables from Sentient, which is included in accounts receivable in the consolidated balance sheets.
In 2008, the Company expects to pay approximately $1.3received a reimbursement of $1.4 million and $163,000 for advisory and debt arranging services, respectively, when the acquisition closes in 2007.
In addition, the Company reimbursed an affiliateand various of MBL $1,600 for out-of-pocket expenses incurred in relationits subsidiaries have entered into a licensing agreement with the Macquarie Group related to the same acquisition. This amount was accrued at December 31, 2006use of the Macquarie name and paid in January 2007.
Year ended December 31, 2006 | |||
| Portion of loan from MBL, as at December 31, 2006 | $ | 50,000 | |
| Interest expense on MBL portion of loan | 3,164 | ||
| Financing fee to MBL | 307 | ||
Year ended December 31, 2005 | |||
| Financing fee to MBL | $ | 244 | |
| Interest expense on MBL portion of loan prior to refinancing in December 2005 | 2,230 | ||
| Portion of loan from MBL from refinancing, as at December 31, 2005 | 60,000 | ||
| Underwriting fee to MBL from refinancing | 600 | ||
| Interest expense on MBL portion of loan from refinancing | 162 | ||
Year ended December 31, 2006 | |||
| Portion of loan outstanding from MBL, as at December 31, 2006 | $ | — | |
| Maximum drawdown on the loan from MBL during 2006 | 100,000 | ||
| Interest expense on MBL portion of loan | 3,540 | ||
| Fees paid to MBL for increase in facility | 250 | ||
Year ended December 31, 2005 | |||
| Portion of acquisition facility commitment provided by MBL | $ | 100,000 | |
| Establishment fees paid to MBL | 250 |
MACQUARIE INFRASTRUCTURE COMPANY TRUST
NOTES TO CONSOLIDATED FINANCIAL STATEMENTS
18. Income Taxes
As discussed in Note 15, “Members’ Equity”, in June 2007 the airport services business paid MBL $40,000 on an additional interest rate swap. MBL made payments toTrust was dissolved and all outstanding trust stock was exchanged for LLC interests in the airport services business of $35,000 forCompany. In addition, the period December 14, 2005 (the date of the airport services business’s debt re-financing) through December 31, 2005.
Components of the Company’s income tax benefit related to loss from continuing operations for the years ended December 31 2009, 2008 and 2007 were as follows ($ in thousands):
| Year Ended December 31, 2009 | Year Ended December 31, 2008 | Year Ended December 31, 2007 | ||||||||||
| Current taxes: | ||||||||||||
| Federal | $ | 334 | $ | — | $ | 192 | ||||||
| State | 1,859 | 2,536 | 2,113 | |||||||||
| Total current taxes | $ | 2,193 | $ | 2,536 | $ | 2,305 | ||||||
| Deferred tax benefit: | ||||||||||||
| Federal | $ | (20,175 | ) | $ | (12,849 | ) | $ | (17,545 | ) | |||
| State | (7,333 | ) | (3,748 | ) | (1,524 | ) | ||||||
| Total deferred tax benefit | (27,508 | ) | (16,597 | ) | (19,069 | ) | ||||||
| Change in valuation allowance | 9,497 | — | — | |||||||||
| Total tax benefit | $ | (15,818 | ) | $ | (14,061 | ) | $ | (16,764 | ) | |||
In connection with the 2009 sale of 49.99% of District Energy, the Company converted a holding company within the District Energy group from an entity disregarded for income tax purposes to a taxable corporation. The change in the tax status of this holding company, combined with the sale of the 49.99% interest, resulted in a taxable transaction. The taxable income was offset by the Company’s other consolidated taxable loss and its NOL carryforwards. The consolidated benefit for income taxes of $15.8 million includes a charge for income taxes of $10.2 million related to the tax on the conversion of the District Energy holding company’s tax status attributable to the 50.01% interest in District Energy retained by the Company. The tax on the conversion of the District Energy holding company’s tax status of approximately $10.2 million attributable to the 49.99% interest in District Energy that was sold has been reflected as a reduction in the $32.2 million gain on the sale and recorded in additional paid in capital in the consolidated 2009 balance sheet.
MACQUARIE INFRASTRUCTURE COMPANY TRUST
NOTES TO CONSOLIDATED FINANCIAL STATEMENTS
18. Income Taxes – (continued)
Year Ended December 31, 2006 | Year Ended December 31, 2005 | ||||||
| Current taxes: | |||||||
| Federal | $ | 176 | $ | — | |||
| State | 1,663 | 2,080 | |||||
| Total current taxes | 1,839 | 2,080 | |||||
| Deferred tax benefit: | |||||||
| Federal | (13,322 | ) | (463 | ) | |||
| State | (4,771 | ) | (862 | ) | |||
| Change in valuation allowance | (167 | ) | (4,370 | ) | |||
| Total tax expense (benefit) | $ | (16,421 | ) | $ | (3,615 | ) | |
The tax effects of temporary differences that give rise to significant portions of the deferred tax assets and deferred tax liabilities at December 31, 20062009 and December 31, 20052008 are presented below (in($ in thousands):
| December 31, 2009 | December 31, 2008 | |||||||
| Deferred tax assets: | ||||||||
| Net operating loss carryforwards | $ | 58,801 | $ | 63,393 | ||||
| Lease transaction costs | 1,638 | 1,811 | ||||||
| Deferred revenue | 1,311 | 1,192 | ||||||
| Accrued compensation | 9,136 | 9,192 | ||||||
| Accrued expenses | 1,503 | 2,010 | ||||||
| Partnership basis differences | 50,466 | 49,184 | ||||||
| Other | 1,403 | 1,275 | ||||||
| Unrealized losses | 41,904 | 62,969 | ||||||
| Allowance for doubtful accounts | 653 | 859 | ||||||
| Total gross deferred tax assets | 166,815 | 191,885 | ||||||
| Less: valuation allowance | (20,571 | ) | (4,159 | ) | ||||
| Net deferred tax assets after valuation allowance | $ | 146,244 | $ | 187,726 | ||||
| Deferred tax liabilities: | ||||||||
| Intangible assets | $ | (148,286 | ) | $ | (164,851 | ) | ||
| Property and equipment | (81,041 | ) | (82,382 | ) | ||||
| Prepaid expenses | (1,434 | ) | (1,761 | ) | ||||
| Total deferred tax liabilities | (230,761 | ) | (248,994 | ) | ||||
| Net deferred tax liability | (84,517 | ) | (61,268 | ) | ||||
| Less: current deferred tax asset | (23,323 | ) | (21,960 | ) | ||||
| Noncurrent deferred tax liability | $ | (107,840 | ) | $ | (83,228 | ) | ||
December 31, 2006 | December 31, 2005 | ||||||
| Deferred tax assets: | |||||||
| Net operating loss carryforwards | $ | 23,801 | $ | 15,115 | |||
| Capital loss carryforwards | 4,786 | 4,885 | |||||
| Lease transaction costs | 1,966 | 2,131 | |||||
| Amortization of intangible assets | 4,821 | 4,398 | |||||
| Deferred revenue | 562 | 515 | |||||
| Accrued compensation | 3,210 | 717 | |||||
| Accrued expenses | 1,857 | 1,225 | |||||
| SFAS No. 143 retirement obligations | 1,224 | 1,135 | |||||
| Other | 1,319 | 1,569 | |||||
| Unrealized losses | 1,456 | — | |||||
| Allowance for doubtful accounts | 474 | — | |||||
| Total gross deferred tax assets | 45,476 | 31,690 | |||||
| Less: Valuation allowance | (5,271 | ) | (5,451 | ) | |||
| Net deferred tax assets after valuation allowance | 40,205 | 26,239 | |||||
| Deferred tax liabilities: | |||||||
| Intangible assets | (129,176 | ) | (70,259 | ) | |||
| Property and equipment | (61,915 | ) | (59,133 | ) | |||
| Partnership basis differences | (7,727 | ) | (6,373 | ) | |||
| Prepaid expenses | (1,479 | ) | (693 | ) | |||
| Other | (1,420 | ) | (1,474 | ) | |||
| Total deferred tax liabilities | (201,717 | ) | (137,932 | ) | |||
| Net deferred tax liability | (161,512 | ) | (111,693 | ) | |||
| Less: current deferred tax asset | 2,411 | 2,101 | |||||
| Noncurrent deferred tax liability | $ | (163,923 | ) | $ | (113,794 | ) | |
At December 31, 2006, MIC Inc.2009, the Company had net operating lossNOL carryforwards for federal income tax purposes of approximately $58.0$116.3 million which isare available to offset future taxable income, if any, through 2026.2029. Approximately $9.0$35.0 million of these net operating losses willmay be limited, on an annual basis, due to the change of control for tax purposes of the respective subsidiaries in which such losses were incurred.
In assessing the realizability of deferred tax assets,need for a valuation allowance, management considers whether it is more likely than not that some portion or all of the deferred tax assets will not be realized. The ultimate realization of deferred tax assets is dependent upon the generation of future taxable income during the periods in which those temporary differences become deductible. Management considers the scheduled reversal of deferred tax liabilities, projected future taxable income, and tax planning strategies in making this assessment. DueThe sale of a 49.99% interest in District Energy precludes including that business in the Company’s consolidated federal income tax return from the date of sale. Accordingly, the net deferred tax liabilities of that business, approximately $44.3 million, cannot be considered in evaluating the ultimate realization of the Company’s deferred tax assets.
In 2009, the Company’s management concluded that the reversal of deferred tax liabilities should more likely than not result in the ultimate realization of all but approximately $15.3 million of federal deferred tax assets. Accordingly the Company has provided a valuation allowance for this amount, of which approximately $5.9 million has been recorded in the Company’s discontinued operations. In addition, in 2009, PCAA provided a valuation allowance of approximately $1.1 million against the state NOL deferred tax asset generated in that year, which is also included in discontinued operations.
In 2007, due to statutory limitations on the utilization of certain deferred tax assets, primarily at PCAA, the Company has applied a valuation reserveallowance on a portion of the deferred tax assets. As a result of the utilization and expiration of certain state net operating loss carryforwards, a change in the state deferred income tax effective rate, and a settlement of the IRS examination of a portion of Atlantic Aviation for 2003,
MACQUARIE INFRASTRUCTURE COMPANY LLC
NOTES TO CONSOLIDATED FINANCIAL STATEMENTS
18. Income Taxes – (continued)
management decreased its valuation allowance for capital loss and operating loss carryforwards, by approximately $5.3 million in 2007. Also in 2007, management determined that it is more likely than not that the deferred tax benefit related to the state income tax net operating loss carryforward of PCAA will not be realized. Accordingly, a valuation allowance of approximately $2.9 million was recorded, which is also included in discontinued operations. This additional valuation allowance was net of the related federal income tax benefit at the statutory rate of 35%.
As of December 31, 2009, the Company hashad approximately $162.0$84.5 million in net deferred tax liabilities. A significant portion of the Company’s deferred tax liabilities relates to tax basis temporary differences of both intangible assets and property and equipment. For financial accounting purposes, we recordedThe Company records the acquisitions of our consolidated businesses under the purchase method of accounting and accordingly recognizedrecognizes a significant increase to the value of the intangible assets and to property and equipment. For tax purposes, we assumedthe Company may assume the existing tax basis of the acquired businesses. Tobusinesses, in which cases the Company records a deferred tax liability to reflect the increase in the financialpurchase accounting basis of the assets acquired over the carryover income tax basis, a deferred tax liability was recorded. Thebasis. This liability will reduce in future periods as these temporary differences reverse.
In 2006, management revised its estimate of the effective stateCompany recognized a deferred tax rate applicable to deferred taxes, primarily resulting from a change in the Texas franchise tax law. This change resulted in a benefit of approximately $754,000.
A reconciliation of the reported income tax expense attributable to continuing operations to the amount that would result by applying the U.S. federal tax rate to the reported net income (loss)loss is as follows (in($ in thousands):
| Year Ended December 31, 2009 | Year Ended December 31, 2008 | Year Ended December 31, 2007 | ||||||||||
| Tax benefit at U.S. statutory rate | $ | (43,746 | ) | $ | (29,484 | ) | $ | (20,962 | ) | |||
| Tax effect of impairment of non-deductible intangibles | 18,601 | 13,684 | — | |||||||||
| Effect of permanent differences and other | 1,073 | (49 | ) | 534 | ||||||||
| State income taxes, net of federal benefit | (3,559 | ) | (788 | ) | 383 | |||||||
| Tax effect of flow-through entities | — | — | — | |||||||||
| Tax effect of IMTT taxable dividend income in excess of book income | (7,895 | ) | 5,425 | 4,456 | ||||||||
| Tax effect of federal dividends received deduction on IMTT dividend | — | (4,710 | ) | (3,556 | ) | |||||||
| Change in MDEH tax status | 10,211 | — | — | |||||||||
| Reversal of tax benefit recorded in 2006 on the excess of the tax basis over carrying value of IMTT | — | — | 2,381 | |||||||||
| True-up of deferred tax balances | — | 1,861 | — | |||||||||
| Change in valuation allowance | 9,497 | — | — | |||||||||
| Total tax benefit | $ | (15,818 | ) | $ | (14,061 | ) | $ | (16,764 | ) | |||
Uncertain Tax Positions
The Company adopted the provisions of FIN 48 on January 1, 2007. As a result of the implementation of FIN 48, the Company recorded a $510,000 increase in the liability for unrecognized tax benefits, which was offset by a reduction of the deferred tax liability of $109,000, resulting in a decrease to the January 1, 2007 retained earnings balance of $401,000. At the adoption date of January 1, 2007, the Company had $1.8 million of unrecognized tax benefits, all of which would affect the effective tax rate if recognized.
Year Ended December 31, 2006 | Year Ended December 31, 2005 | ||||||
| Tax expense at U.S. statutory rate | $ | 11,724 | $ | 4,124 | |||
| Effect of permanent differences and other | 648 | 168 | |||||
| State income taxes, net of federal benefit | (2,020 | ) | 1,125 | ||||
| Tax effect of flow-through entities | (23,223 | ) | (4,662 | ) | |||
| Tax effect of IMTT basis difference and dividends received deduction | (3,383 | ) | — | ||||
| Change in valuation allowance | (167 | ) | (4,370 | ) | |||
| Total tax benefit | $ | (16,421 | ) | $ | (3,615 | ) | |
MACQUARIE INFRASTRUCTURE COMPANY LLC
NOTES TO CONSOLIDATED FINANCIAL STATEMENTS
18. Income Taxes – (continued)
It is expected that the amount of unrecognized tax benefits will change in the next 12 months, however, the Company does not expect the change to have a significant impact on the results of operations or the financial position of the Company.
The Company recognizes interest and penalties related to unrecognized tax benefits in income tax expense in the statements of operations, which is consistent with the recognition of these items in prior reporting periods. On January 1, 2007, the Company recorded a liability of approximately $400,000 for the payment of interest and penalties. The liability for the payment of interest and penalties did not materially change subsequent to December 31, 2007.
During the quarter and year ended December 31, 2008, the Company determined that the statute of limitations expired on unrecognized benefits of approximately $782,000. Approximately $690,000 of that amount was an acquired reserve and accordingly, recognition of its benefit was treated as an adjustment of goodwill. The balance of the reversal, approximately $92,000, was included in income as a reduction of state income tax expense.
During the quarter ended June 30, 2007, the IRS completed its audit of the 2003 federal income tax return for a subsidiary of Atlantic Aviation. That audit did not result in a material assessment beyond the related reserve established as of January 1, 2007, upon the adoption of FIN 48. As a result of the audit settlement, the Company no longer has a capital loss carryforward of approximately $11.9 million. The deferred tax benefit related to this carryforward loss was approximately $4.8 million, against which the Company applied a full valuation allowance. Both the carryforward loss and valuation allowance have been reversed. There are no other ongoing tax examinations of returns filed by the Company or any of its subsidiaries. Federal returns for all tax years ending after 2005, and state returns for all tax years ending in 2004 and later are subject to examination by federal and state tax authorities. There was no material change in the Company’s reserve for uncertain tax positions during 2009, except as discussed above.
During the year ended December 31, 2009, the IRS completed its audit of PCAA for 2004 and 2003. The conclusion of the audit did not result in material assessment.
As of December 31, 2009, there were no ongoing federal or state income tax audits of the Company and its subsidiaries.
The following table sets forth a reconciliation of the Company’s unrecognized tax benefits from January 1, 2009 to December 31, 2009. The balance as of January 1, 2009 includes the increase in the liability upon the adoption of FIN 48 treated as a reduction in retained earnings. Amounts are in thousands.
| Balance as of January 1, 2009 | $ | 313 | ||
| Current year increases | 45 | |||
| Decreases due to the lapse of applicable statue of limitations and payments | (22 | ) | ||
| Balance as of December 31, 2009 | $ | 336 | ||
MACQUARIE INFRASTRUCTURE COMPANY LLC
NOTES TO CONSOLIDATED FINANCIAL STATEMENTS
19. Leases
The Company leases land, buildings, office space and certain office equipment under noncancellable operating lease agreements that expire through April 2031.
Future minimum rental commitments at December 31, 20062009 are as follows (in($ in thousands):
| 2010 | $ | 33,238 | ||
| 2011 | 30,740 | |||
| 2012 | 29,622 | |||
| 2013 | 28,820 | |||
| 2014 | 28,008 | |||
| Thereafter | 274,873 | |||
| Total | $ | 425,301 | ||
| 2007 | $ | 28,199 | ||
| 2008 | 28,063 | |||
| 2009 | 27,519 | |||
| 2010 | 25,656 | |||
| 2011 | 24,957 | |||
| Thereafter | 337,439 | |||
| $ | 471,833 |
Rent expense under all operating leases for the years ended December 31, 20062009, 2008 and December 31, 20052007 was $28.8$34.9 million, $34.2 million and $22.5$26.4 million, respectively.
20. Employee Benefit Plans
401(k) Savings Plan
In 2006, MIC Inc. maintainestablished a defined contribution plansplan under section 401(k) of the Internal Revenue Code, allowing eligible employees of the consolidated businesses to contribute a percentage of their annual compensation up to an annual amount as set by the Internal Revenue Service. IRS. Prior to this, each of the consolidated businesses maintained their own plans. Following the establishment of the MIC Inc. plan, Atlantic Aviation, District Energy and PCAA consolidated their plans under the MIC Inc. plan. The Gas Company also sponsored a 401(k) plan for eligible employees of that business. On January 1, 2008, employees in The Gas Company 401(k) plan were added to the MIC Inc. plan. The Company completed the merger of The Gas Company plan into the MIC Inc. plan in the first quarter of 2008.
The employer contribution to these plans ranges from 0% to 6% of eligible compensation. For the years ended December 31, 20062009, 2008 and 2005 and the period December 23, 2004 through December 31, 2004,2007, contributions were approximately $382,000, $156,000$1.3 million, $1.1 million and $4,000,$1.1 million, respectively.
| Opening balance, December 31, 2005 | $ | 747,857 | ||
| Service costs | — | |||
| Interest costs | 37,395 | |||
| Participant contributions | 35,100 | |||
| Actuarial gains/losses | 64,231 | |||
| Benefits paid | (206,065 | ) | ||
| Ending balance, December 31, 2006 | $ | 678,518 |
Union Pension Plan
The Gas Company has a Defined Benefit Pension Plan for Classified Employees of GASCO, Inc. (the “Plan”“DB Plan”) that accrues benefits pursuant to the terms of a collective bargaining agreement. The DB Plan is non-contributory and covers all bargaining unit employees who have met certain service and age requirements. The benefits are based on a flat rate per year of service andthrough the date of employment termination. TGCtermination or retirement. The Gas Company made contributions to the DB Plan of $2.9 million during 2009 and did not make any contributions to the Plan during 2006.2008. Future contributions will be made to meet ERISA funding requirements. The DB Plan’s trustee, First Hawaiian Bank, handles the DB Plan’s assets and an investment manager invests them in a diversified portfolio of equity and fixed-income securities. The projected benefit obligation for the DB Plan totaled $29.0$35.3 million at December 31, 2009 and $31.2 million at December 31, 2008. The DB Plan has assets of $21.9 million and $16.7 million at December 31, 2009 and 2008, respectively.
The Gas Company expects to make contributions in 2010 and annually for at least five years as it complies with the requirements of the Pension Protection Act of 2006.
In May 2008, The Gas Company entered into a new five-year collective bargaining agreement which increased the benefits for participants and that immediately froze the plan to new participants. The benefit increases will occur annually for three years after which there will be no further increase to the flat rate.
MACQUARIE INFRASTRUCTURE COMPANY TRUST
NOTES TO CONSOLIDATED FINANCIAL STATEMENTS
20. Employee Benefit Plans – (continued)
Participants will, however, continue to accrue years of service toward their final benefit. The financial effects of the new agreement are included in the tables below as “Plan amendments”.
Other Benefits Plan
The Gas Company has a post-retirementpostretirement plan. The GASCO, Inc. Hourly Postretirement Medical and Life Insurance Plan (“106(the “PMLI Plan”), which covers all bargaining unit participants who were employed by TGCThe Gas Company on May 1, 1999 and who retire after the attainment of age 62 with 15 years of service. Prior to the establishment of this plan, the participants were covered under a multiemployer plan administered by the Hawaii Teamsters Health and Welfare Trust; the PMLI Plan was formed when the multiemployer plan was dissolved. Under the provisions of the 106PMLI Plan, TGCThe Gas Company pays for medical premiums of the retirees and spouses up until age 65. After age 65, TGCthe Gas Company pays for medical premiums up to a maximum of $150 per month. The retirees are also provided $1,000 of life insurance benefits.
Additional information about the fair value of the benefit plan assets, the components of net periodic cost, and the projected benefit obligation as of December 31, 20062009 and 2008, and for the period from June 7, 2006 toyear ended December 31, 20062009 and 2008 is as follows (in($ in thousands):
| DB Plan Benefits | PMLI Benefits | |||||||||||||||
| 2009 | 2008 | 2009 | 2008 | |||||||||||||
| Change in benefit obligation: | ||||||||||||||||
| Benefit obligation – beginning of period | $ | 31,167 | $ | 29,022 | $ | 1,744 | $ | 1,641 | ||||||||
| Service cost | 629 | 631 | 42 | 39 | ||||||||||||
| Interest cost | 1,888 | 1,832 | 113 | 103 | ||||||||||||
| Plan amendments | — | 775 | — | — | ||||||||||||
| Participant contributions | — | — | 60 | 41 | ||||||||||||
| Actuarial losses | 3,251 | 488 | 252 | 32 | ||||||||||||
| Benefits paid | (1,685 | ) | (1,581 | ) | (116 | ) | (112 | ) | ||||||||
| Benefit obligation – end of year | $ | 35,250 | $ | 31,167 | $ | 2,095 | $ | 1,744 | ||||||||
| Change in plan assets: | ||||||||||||||||
| Fair value of plan assets – beginning of period | $ | 16,652 | $ | 24,358 | $ | — | $ | — | ||||||||
| Actual return (loss) on plan assets | 4,170 | (6,044 | ) | — | — | |||||||||||
| Employer/participant contributions | 2,901 | — | 116 | 112 | ||||||||||||
| Expenses paid | (127 | ) | (81 | ) | — | — | ||||||||||
| Benefits paid | (1,685 | ) | (1,581 | ) | (116 | ) | (112 | ) | ||||||||
| Fair value of plan assets – end of year | $ | 21,911 | $ | 16,652 | $ | — | $ | — | ||||||||
Pension Benefits | Other Benefits | ||||||||||||
| Change in benefit obligation: | |||||||||||||
| Benefit obligation – beginning of period | $ | 27,747 | $ | 1,495 | |||||||||
| Service cost | 345 | 19 | |||||||||||
| Interest cost | 955 | 51 | |||||||||||
| Plan amendments | — | — | |||||||||||
| Participant contributions | — | 12 | |||||||||||
| Actuarial losses | 739 | 14 | |||||||||||
| Benefits paid | (763 | ) | (39 | ) | |||||||||
| Benefit obligation – end of year | $ | 29,023 | $ | 1,552 | |||||||||
Pension Benefits | Other Benefits | ||||||||||||
| Change in plan assets | |||||||||||||
| Fair value of plan assets – beginning of period | $ | 22,790 | $ | — | |||||||||
| Actual return on plan assets | 2,347 | — | |||||||||||
| Employer/participant contributions | — | 39 | |||||||||||
| Expenses paid | (62 | ) | — | ||||||||||
| Benefits paid | (763 | ) | (39 | ) | |||||||||
| Fair value of plan assets – end of year | $ | 24,312 | $ | — | |||||||||
MACQUARIE INFRASTRUCTURE COMPANY TRUST
NOTES TO CONSOLIDATED FINANCIAL STATEMENTS
20. Employee Benefit Plans – (continued)
The net adjustment to accumulated other comprehensive income at adoption of approximately $500,000 ($300,000 net of tax) represents the net unrecognized actuarial losses. These effects are relatively small because the Company recorded the net pension obligation at fair value upon its purchasefunded status of the business. The effects of adopting the provisions of SFAS No. 158 in the accompanying consolidatedCompany’s balance sheet as ofat December 31, 2006,2009 and 2008, are presented in the following table (in($ in thousands):
| DB Plan Benefits | PMLI Benefits | |||||||||||||||
| 2009 | 2008 | 2009 | 2008 | |||||||||||||
| Funded status | ||||||||||||||||
| Funded status at end of year | $ | (13,339 | ) | $ | (14,515 | ) | $ | (2,095 | ) | $ | (1,744 | ) | ||||
| Net amount recognized in balance sheet | $ | (13,339 | ) | $ | (14,515 | ) | $ | (2,095 | ) | $ | (1,744 | ) | ||||
| Amounts recognized in balance sheet consists of: | ||||||||||||||||
| Current liabilities | $ | — | $ | — | $ | (120 | ) | $ | (107 | ) | ||||||
| Noncurrent liabilities | (13,339 | ) | (14,515 | ) | (1,975 | ) | (1,637 | ) | ||||||||
| Net amount recognized in balance sheet | $ | (13,339 | ) | $ | (14,515 | ) | $ | (2,095 | ) | $ | (1,744 | ) | ||||
| Amounts not yet reflected in net periodic benefit cost and included in accumulated other comprehensive income: | ||||||||||||||||
| Prior service cost | $ | (465 | ) | $ | (620 | ) | $ | — | $ | — | ||||||
| Accumulated loss | (7,379 | ) | (7,362 | ) | (325 | ) | (72 | ) | ||||||||
| Accumulated other comprehensive loss | (7,844 | ) | (7,982 | ) | (325 | ) | (72 | ) | ||||||||
| Net periodic benefit cost in excess of cumulative employer contributions | (5,495 | ) | (6,533 | ) | (1,770 | ) | (1,672 | ) | ||||||||
| Net amount recognized in balance sheet | $ | (13,339 | ) | $ | (14,515 | ) | $ | (2,095 | ) | $ | (1,744 | ) | ||||
Pension Benefits | Other Benefits | |||||||
| Funded status: | ||||||||
| Funded status at end of year | $ | (4,710 | ) | $ | (1,552 | ) | ||
| Employer contributions between measurement date and year end | — | — | ||||||
| Net amount recognized in balance sheet (after SFAS No. 158) | $ | (4,710 | ) | $ | (1,552 | ) | ||
| Amounts recognized in balance sheet consists of: | ||||||||
| Non-current assets | $ | — | $ | — | ||||
| Current liabilities | — | (99 | ) | |||||
| Non-current liabilities | (4,710 | ) | (1,453 | ) | ||||
| Net amount recognized in balance sheet (after SFAS No. 158) | $ | (4,710 | ) | $ | (1,552 | ) | ||
| Amounts not yet reflected in net periodic benefit cost and included in accumulated other comprehensive income: | ||||||||
| Transition obligation asset (obligation) | $ | — | $ | — | ||||
| Prior service credit (cost) | — | — | ||||||
| Accumulated gain (loss) | 518 | (14 | ) | |||||
| Accumulated other comprehensive income | 518 | (14 | ) | |||||
| Cumulative employer contributions in excess of net periodic benefit cost | (5,228 | ) | (1,538 | ) | ||||
| Net amount recognized in balance sheet (after SFAS No. 158) | $ | (4,710 | ) | $ | (1,552 | ) | ||
| Change in accumulated other comprehensive income due to application of SFAS No. 158: | ||||||||
| Additional minimum liability (before SFAS No. 158) | — | — | ||||||
| Intangible asset (before SFAS No. 158) | — | — | ||||||
| Accumulated other comprehensive income (before SFAS No. 158) | — | — | ||||||
| Net increase (decrease) in accumulated other comprehensive income due to SFAS No. 158 | $ | 518 | $ | (14 | ) | |||
| Estimated amounts that will be amortized from accumulated other comprehensive income over the next year: | ||||||||
| Amortization of transition obligation (asset) | — | — | ||||||
| Amortization of prior service cost (credit) | — | — | ||||||
| Amortization of net (gain) loss | — | — | ||||||
| Weighted average assumptions: | ||||||||
| Discount rate | 6.00 | % | 6.00 | % | ||||
| Expected return on plan assets | 8.25 | % | — | |||||
| Rate of compensation increases | — | — | ||||||
| Assumed healthcare cost trend rates: | ||||||||
| Initial health care cost trend rate | — | 9.50 | % | |||||
| Ultimate rate | — | 5.00 | % | |||||
| Year ultimate rate is reached | — | 2015 | ||||||
The components of net periodic benefit cost and other changes in other comprehensive income for the plans isare shown below (in($ in thousands):
| DB Plan Benefits | PML Benefits | |||||||||||||||
| 2009 | 2008 | 2009 | 2008 | |||||||||||||
| Components of net periodic benefit cost: | ||||||||||||||||
| Service cost | $ | 629 | $ | 631 | $ | 42 | $ | 39 | ||||||||
| Interest cost | 1,888 | 1,832 | 113 | 103 | ||||||||||||
| Expected return on plan assets | (1,221 | ) | (1,820 | ) | — | — | ||||||||||
| Recognized actuarial loss | 413 | — | — | — | ||||||||||||
| Amortization of prior service cost | 155 | 155 | — | — | ||||||||||||
| Net periodic benefit cost | $ | 1,864 | $ | 798 | $ | 155 | $ | 142 | ||||||||
| Other changes recognized in other comprehensive income: | ||||||||||||||||
| Prior service cost arising during period | $ | — | $ | 775 | $ | — | $ | — | ||||||||
| Net loss arising during period | 429 | 8,433 | 253 | 32 | ||||||||||||
| Amortization of prior service cost | (155 | ) | (155 | ) | — | — | ||||||||||
| Amortization of loss | (412 | ) | — | — | — | |||||||||||
| Total recognized in other comprehensive income | $ | (138 | ) | $ | 9,053 | $ | 253 | $ | 32 | |||||||
Pension Benefits | Other Benefits | ||||||
| Components of net periodic benefit cost: | |||||||
| Service cost | $ | 345 | $ | 19 | |||
| Interest cost | 955 | 51 | |||||
| Expected return on plan assets | (1,029 | ) | — | ||||
| Net periodic benefit cost | $ | 271 | $ | 70 | |||
MACQUARIE INFRASTRUCTURE COMPANY LLC
NOTES TO CONSOLIDATED FINANCIAL STATEMENTS
20. Employee Benefit Plans – (continued)
| DB Plan Benefits | PMLI Benefits | |||||||||||||||
| 2009 | 2008 | 2009 | 2008 | |||||||||||||
| Estimated amounts that will be amortized from accumulated other comprehensive income over the next year: | ||||||||||||||||
| Amortization of prior service cost | $ | 155 | $ | 155 | $ | — | $ | — | ||||||||
| Amortization of net loss | 395 | 389 | 17 | — | ||||||||||||
| Weighted average assumptions to determine benefit obligations: | ||||||||||||||||
| Discount rate | 5.70 | % | 6.20 | % | 5.60 | % | 6.30 | % | ||||||||
| Rate of compensation increase | N/A | N/A | N/A | N/A | ||||||||||||
| Measurement date | December 31 | December 31 | December 31 | December 31 | ||||||||||||
| Weighted average assumptions to determine net cost: | ||||||||||||||||
| Discount rate | 6.20 | % | 6.30 | % | 6.30 | % | 6.20 | % | ||||||||
| Expected long-term rate of return on plan assets during fiscal year | 7.25 | % | 7.75 | % | N/A | N/A | ||||||||||
| Rate of compensation increase | N/A | N/A | N/A | N/A | ||||||||||||
| Assumed healthcare cost trend rates: | ||||||||||||||||
| Initial health care cost trend rate | 9.00 | % | 9.50 | % | ||||||||||||
| Ultimate rate | 4.50 | % | 5.00 | % | ||||||||||||
| Year ultimate rate is reached | 2028 | 2018 | ||||||||||||||
The Gas Company’s overall investment strategy is to achieve a mix of approximately 65% of investments in equities for long-term growth and 35% in fixed income securities for asset allocation purposes as well as near-term needs. The Gas Company has instructed the trusteeinvestment manager to maintain the allocation of the DB Plan’s assets between equity mutual fund securities and fixed income (debt)mutual fund securities within the pre-approved parameters set by the management of TGC (65% equity securities and 35% fixed income securities). The pension planGas Company. The DB Plan weighted average asset allocation at December 31, 20062009 and 2008 was:
| 2009 | 2008 | |||||||
| Equity instruments | 65 | % | 57 | % | ||||
| Fixed income securities | 34 | % | 41 | % | ||||
| Cash | 1 | % | 2 | % | ||||
| Total | 100 | % | 100 | % | ||||
MACQUARIE INFRASTRUCTURE COMPANY LLC
NOTES TO CONSOLIDATED FINANCIAL STATEMENTS
20. Employee Benefit Plans – (continued)
The expected return on plan assets of 8.25%7.25% was estimated based on the allocation of assets and management’s expectations regarding future performance of the investments held in the investment portfolio. The asset allocations of The Gas Company’s pension benefits as of December 31, 2009 measurement dates were as follows ($ in thousands):
| Fair Value Measurements at December 31, 2009 | ||||||||||||||||
| Pension Benefits – Plan Assets | ||||||||||||||||
| Total | Quoted Prices in Active Markets for Identical Assets (Level 1) | Significant Observable Inputs (Level 2) | Significant Unobservable Inputs (Level 3) | |||||||||||||
| Asset category: | ||||||||||||||||
| Cash and money market | $ | 315 | $ | 26 | $ | 289 | $ | — | ||||||||
| Equity securities: | ||||||||||||||||
| U.S. large-cap growth(a) | 1,980 | 1,980 | — | — | ||||||||||||
| U.S. large-cap blend(b) | 5,663 | 5,663 | — | — | ||||||||||||
| U.S. large-cap value(c) | 1,983 | 1,983 | — | — | ||||||||||||
| U.S. mid-cap blend(d) | 846 | 846 | — | — | ||||||||||||
| U.S. small-cap growth(e) | 849 | 849 | — | — | ||||||||||||
| International large-cap blend(f) | 2,801 | 2,801 | — | — | ||||||||||||
| Fixed income securities: | ||||||||||||||||
| Intermediate term corporate bonds(g) | 5,969 | 5,969 | — | — | ||||||||||||
| Short term corporate bonds(h) | 1,505 | 1,505 | — | — | ||||||||||||
| Total | $ | 21,911 | $ | 21,622 | $ | 289 | $ | — | ||||||||
| (a) | This fund seeks to track the performance of the MSCI U.S. Prime Market Growth Index, a broadly diversified index of growth stocks of large U.S. companies. |
| (b) | This fund seeks to track the performance of the MSCI U.S. Broad Market Index, which consists of all the U.S. common stocks traded regularly on the New York Stock Exchange and the Nasdaq over-the-counter market. |
| (c) | This fund seeks long-term capital appreciation and income. The fund invests mainly in mid- and large- capitalization companies whose stocks are considered by an advisor to be undervalued. |
| (d) | This fund seeks long-term capital appreciation. The fund normally invests in small- and mid- capitalization domestic stocks based on an advisor’s assessment of the relative return potential of the securities. |
| (e) | This fund seeks to provide long-term capital appreciation. The fund invests mainly in the stocks of small companies. |
| (f) | This fund seeks to track the performance of a benchmark index that measures the investment return of stocks issued by companies located in Europe, the Pacific region, and emerging markets countries. |
| (g) | These funds seek to provide a moderate and sustainable level of current income by investing in bonds with an average weighted maturity of between five and ten years. |
| (h) | This fund seeks to provide current income. It invests at least 80% of assets in short and intermediate term corporate bonds and other corporate fixed income obligations. It typically maintains an average weighted maturity of between one and four years. |
MACQUARIE INFRASTRUCTURE COMPANY LLC
NOTES TO CONSOLIDATED FINANCIAL STATEMENTS
20. Employee Benefit Plans – (continued)
The discount raterates of 6% was5.70% and 5.60% for the DB Plan and PMLI Plan, respectively, were based on high quality corporate bond rates that approximate the expected settlement of obligations.
| DB Plans Benefits | PMLI Benefits | |||||||
| 2010 | $ | 1,980 | $ | 120 | ||||
| 2011 | 2,133 | 176 | ||||||
| 2012 | 2,227 | 177 | ||||||
| 2013 | 2,298 | 187 | ||||||
| 2014 | 2,368 | 161 | ||||||
| Thereafter | 12,058 | 882 | ||||||
Pension Benefits | Other Benefits | ||||||
| 2007 | $ | 1,705 | $ | 100 | |||
| 2008 | 1,782 | 103 | |||||
| 2009 | 1,895 | 94 | |||||
| 2010 | 1,991 | 95 | |||||
| 2011 | 2,105 | 129 | |||||
| 2012-2016 | 11,487 | 703 | |||||
21. Legal Proceedings and Contingencies
The subsidiaries of MIC Inc. are subject to legal proceedings arising in the ordinary course of business. In management’s opinion, the companyCompany has adequate legal defensesdefences and/or insurance coverage with respect to the eventuality of such actions, and does not believe the outcome of any pending legal proceedings will be material to the company’sCompany’s financial position or results of operations.
There are no material legal proceedings pending other than ordinary routine litigation incidental to ourthe Company’s businesses. During 2006, we sold our interests in South East Water and our toll road business.
22. Dividends
The Company’s Board of Directors have declared the following dividends during 20052007 and 2006:2008:
| Date Declared | Quarter Ended | Holders of Record Date | Payment Date | Dividend per LLC Interest | ||||
| February 27, 2007 | December 31, 2006 | April 4, 2007 | April 9, 2007 | 0.57 | ||||
| May 3, 2007 | March 31, 2007 | June 5, 2007 | June 8, 2007 | 0.59 | ||||
| August 7, 2007 | June 30, 2007 | September 6, 2007 | September 11, 2007 | 0.605 | ||||
| November 6, 2007 | September 30, 2007 | December 5, 2007 | December 10, 2007 | 0.62 | ||||
| February 25, 2008 | December 31, 2007 | March 5, 2008 | March 10, 2008 | 0.635 | ||||
| May 5, 2008 | March 31, 2008 | June 4, 2008 | June 10, 2008 | 0.645 | ||||
| August 4, 2008 | June 30, 2008 | September 4, 2008 | September 11, 2008 | 0.645 | ||||
| November 4, 2008 | September 30, 2008 | December 3, 2008 | December 10, 2008 | 0.20 |
Date Declared | Quarter Ended | Holders of Record Date | Payment Date | Dividend Per Share | |||||||||
| May 14, 2005 | December 31, 2004 | June 2, 2005 | June 7, 2005 | $ | 0.0877 | ||||||||
| May 14, 2005 | March 31, 2005 | June 2, 2005 | June 7, 2005 | 0.50 | |||||||||
| August 8, 2005 | June 30, 2005 | September 6, 2005 | September 9, 2005 | 0.50 | |||||||||
| November 7, 2005 | September 30, 2005 | December 6, 2005 | December 9, 2005 | 0.50 | |||||||||
| March 14, 2006 | December 31, 2005 | April 5, 2006 | April 10, 2006 | 0.50 | |||||||||
| May 4, 2006 | March 31, 2006 | June 5, 2006 | June 9, 2006 | 0.50 | |||||||||
| August 7, 2006 | June 30, 2006 | September 6, 2006 | September 11, 2006 | 0.525 | |||||||||
| November 8, 2006 | September 30, 2006 | December 5, 2006 | December 8, 2006 | 0.55 | |||||||||
The distributions declared have been recorded as a reduction to trust stockLLC interests or accumulated (deficit) gain in the stockholders’members’ equity section or accumulated gain (deficit), of the accompanying consolidated balance sheets at December 31, 2006sheets.
The declaration and 2005.
MACQUARIE INFRASTRUCTURE COMPANY LLC
NOTES TO CONSOLIDATED FINANCIAL STATEMENTS
23. Subsequent Events
The Company evaluated and disclosed the following events through February 25, 2010:
Atlantic Aviation’s Credit Facility
In February 2010, per sharethe revised terms of the term loan agreement, as described in Note 12, “Long-Term Debt”, Atlantic Aviation used $17.1 million of excess cash flow to prepay $15.5 million of the outstanding principal balance of its term loan debt and incurred $1.6 million in interest rate swap breakage fees.
PCAA Asset Purchase Agreement
On January 28, 2010, the Company announced that PCAA had entered into an asset purchase agreement with Bainbridge ZKS — Corinthian Holdings, LLC. This agreement, which is subject to approval by the bankruptcy court, will result in the sale of the assets of PCAA for $111.5 million, subject to certain adjustments and will result in the quarter ended December 31, 2006, payableelimination of $201.0 million of current debt from the liabilities of discontinued operations held for sale in the consolidated balance sheet. The cancelled debt in excess of the sale proceeds used to repay such debt would result in cancellation of debt income and the proceeds in excess of the business’ assets as a gain on April 9, 2007sale. As a part of the bankruptcy sale process, all cash proceeds would be paid to holderscreditors of recordthe business. PCAA also commenced a voluntary Chapter 11 case with the bankruptcy court. If approved, the Company expects to complete the sale of the business in the first half of 2010.
As part of the bankruptcy filing, the Company has no obligation to and has no intention of committing additional capital to this business. Creditors of this business do not have recourse to any assets of the holding company or any assets of the other Company’s businesses, other than approximately $5.3 million relating to a guarantee of a single parking facility lease.
Results for PCAA are reported separately as discontinued operations for all periods presented. The assets and liabilities of the business being sold are included in assets of discontinued operations held for sale and liabilities of discontinued operations held for sale on April 4, 2007.
24. Quarterly Data (Unaudited)
The data shown below relates to the Company’s continuing operations and includes all adjustments which the Company considers necessary for a fair presentation of such amounts.
| Operating Revenue | Operating (Loss) Income | Net (Loss) Income | ||||||||||||||||||||||||||||||||||
| 2009 | 2008 | 2007 | 2009 | 2008 | 2007 | 2009 | 2008 | 2007 | ||||||||||||||||||||||||||||
| ($ in Thousands) | ||||||||||||||||||||||||||||||||||||
| Quarter ended: | ||||||||||||||||||||||||||||||||||||
| March 31 | $ | 167,496 | $ | 259,808 | $ | 150,171 | $ | (26,792 | ) | $ | 26,842 | $ | 17,677 | $ | (46,601 | ) | $ | 698 | $ | 9,624 | ||||||||||||||||
| June 30 | 163,408 | 267,123 | 157,137 | (39,489 | ) | 24,264 | (24,894 | ) | (27,013 | ) | 10,184 | (24,207 | ) | |||||||||||||||||||||||
| September 30 | 185,562 | 258,312 | 202,116 | 22,046 | 24,569 | 21,926 | (16,890 | ) | 2,368 | (17,013 | ) | |||||||||||||||||||||||||
| December 31 | 193,610 | 192,118 | 244,790 | 16,987 | (70,232 | ) | 15,597 | (18,666 | ) | (83,431 | ) | (11,533 | ) | |||||||||||||||||||||||
Operating Revenue | Operating Income (Loss) | Net Income (Loss) | ||||||||||||||||||||||||||
2006 | 2005 | 2004 | 2006 | 2005 | 2004 | 2006 | 2005 | 2004 | ||||||||||||||||||||
| ($ in thousands) | ||||||||||||||||||||||||||||
| Quarter ended: | ||||||||||||||||||||||||||||
| March 31 | $ | 86,194 | $ | 65,735 | $ | — | $ | 4,309 | $ | 5,867 | $ | — | $ | 7,561 | $ | 4,238 | $ | — | ||||||||||
| June 30 | 105,933 | 72,519 | — | 13,578 | 7,513 | — | 9,437 | 3,349 | — | |||||||||||||||||||
| September 30 | 163,260 | 79,935 | — | 13,808 | 6,451 | — | (10,018 | ) | 2,575 | — | ||||||||||||||||||
| December 31 | 164,644 | 86,554 | 5,064 | (5,619 | ) | 5,520 | (18,250 | ) | 42,938 | 5,034 | (17,588 | ) | ||||||||||||||||
North America Capital Holding Company | Executive Air Support, Inc. | ||||||
July 30, 2004 to December 22, 2004 | January 1, 2004 to July 29, 2004 | ||||||
| ($ in thousands) | |||||||
| Fuel revenue | $ | 29,465 | $ | 41,146 | |||
| Service revenue | 9,839 | 14,616 | |||||
| Total revenue | 39,304 | 55,762 | |||||
| Cost of revenue – fuel | 16,599 | 21,068 | |||||
| Cost of revenue – service | 849 | 1,428 | |||||
| Gross profit | 21,856 | 33,266 | |||||
| Selling, general, and administrative expenses | 13,942 | 22,378 | |||||
| Depreciation | 1,287 | 1,377 | |||||
| Amortization | 2,329 | 849 | |||||
| Operating profit | 4,298 | 8,662 | |||||
| Other income (expense): | |||||||
| Other expense | (39 | ) | (5,135 | ) | |||
| Finance fees | (6,650 | ) | — | ||||
| Interest expense | (2,907 | ) | (4,655 | ) | |||
| Interest income | 28 | 17 | |||||
| Loss from continuing operations before income taxes | (5,270 | ) | (1,111 | ) | |||
| Income taxes | 286 | (597 | ) | ||||
| Loss from continuing operations | (5,556 | ) | (514 | ) | |||
| Discontinued operations: | |||||||
| Net income from operations of discontinued operations (net of applicable tax provision (benefit) of $80 and ($194), respectively) | 116 | 159 | |||||
| Net loss | $ | (5,440 | ) | $ | (355 | ) | |
| Net loss applicable to common stockholders: | |||||||
| Net loss | $ | (5,440 | ) | $ | (355 | ) | |
| Less preferred stock dividends | — | 3,102 | |||||
| Net loss applicable to common stockholders | $ | (5,440 | ) | $ | (3,457 | ) | |
Shares | Par Value | Paid in Capital | Accumulated Deficit | Accumulated Other Comprehensive Income (Loss) | Total Stockholders’ Equity (Deficit) | |||||||||||||||||||||||||
| ($ in thousands) | ||||||||||||||||||||||||||||||
| Executive Air Support, Inc. | ||||||||||||||||||||||||||||||
| Balance, December 31, 2003 | 1,895,684 | 19 | 195 | (3,787 | ) | (685 | ) | (4,258 | ) | |||||||||||||||||||||
| Net loss, period January 1, 2004, through July 29, 2004 | — | — | — | (355 | ) | — | (355 | ) | ||||||||||||||||||||||
| Interest rate swap agreement, net of tax provision of $189 | — | — | — | — | 283 | 283 | ||||||||||||||||||||||||
| Reclassification adjustment for realized loss on interest rate swap included in net loss, net of tax benefit of $268 | — | — | — | — | 402 | 402 | ||||||||||||||||||||||||
| Comprehensive income | 330 | |||||||||||||||||||||||||||||
| Tax benefit from exercise of stock options | — | — | 1,781 | — | — | 1,781 | ||||||||||||||||||||||||
| Elimination of stockholders’ equity (deficit) balances upon acquisition of Executive Air Support, Inc. by North America Capital Holding Company | (1,895,684 | ) | (19 | ) | (1,976 | ) | 4,142 | — | 2,147 | |||||||||||||||||||||
| Adjusted balance, July 29, 2004 | — | $ | — | $ | — | $ | — | $ | — | $ | — | |||||||||||||||||||
| North America Capital Holding Company | ||||||||||||||||||||||||||||||
| Issuance of common stock | 544,273 | $ | 5 | $ | 108,830 | $ | — | $ | — | $ | 108,835 | |||||||||||||||||||
| Net loss, period July 30, 2004 through December 22, 2004 | — | — | — | (5,440 | ) | — | (5,440 | ) | ||||||||||||||||||||||
| Interest rate swap agreement, net of tax provision of $28 | — | — | — | — | 41 | 41 | ||||||||||||||||||||||||
| Comprehensive loss | (5,399 | ) | ||||||||||||||||||||||||||||
| Balance, December 22, 2004 | 544,273 | $ | 5 | $ | 108,830 | $ | (5,440 | ) | $ | 41 | $ | 103,436 | ||||||||||||||||||
North America Capital Holding Company | Executive Air Support, Inc. | ||||||
July 30, 2004 to December 22, 2004 | January 1, 2004 to July 29, 2004 | ||||||
| ($ in thousands) | |||||||
| Cash flows from operating activities: | |||||||
| Net loss | $ | (5,440 | ) | (355 | ) | ||
| Adjustments to reconcile net loss to net cash (used in) provided by operating activities: | |||||||
| Fair value adjustment for outstanding warrant liability | — | 5,280 | |||||
| Depreciation and amortization | 3,616 | 2,226 | |||||
| Noncash interest expense and other | (240 | ) | 2,760 | ||||
| Deferred income taxes | (954 | ) | (953 | ) | |||
| Changes in assets and liabilities, net of acquisition: | |||||||
| Accounts receivable | (304 | ) | (127 | ) | |||
| Inventories | (447 | ) | 3 | ||||
| Prepaid expenses and other | (659 | ) | 1,049 | ||||
| Liabilities from discontinued operations | (177 | ) | (131 | ) | |||
| Accounts payable | 1,575 | 572 | |||||
| Accrued payroll, payroll related, environmental, interest, & other | 1,007 | 191 | |||||
| Customer deposits and deferred hangar rent | 20 | 24 | |||||
| Receivable from related party | 301 | (734 | ) | ||||
| Income taxes | 1,125 | (2,048 | ) | ||||
| Net cash (used in) provided by operating activities | (577 | ) | 7,757 | ||||
| Cash flows from investing activities: | |||||||
| Purchase of Executive Air Support, net of cash acquired | (218,544 | ) | — | ||||
| Funds received on July 29, 2004 for option and warrant payments made on July 30, 2004 | (6,015 | ) | 6,015 | ||||
| Capital expenditures | (3,198 | ) | (3,049 | ) | |||
| Collections on note receivable from sale of division | 47 | 45 | |||||
| Other | (435 | ) | — | ||||
| Net cash (used in) provided by investing activities | (228,145 | ) | 3,011 | ||||
| Cash flows from financing activities: | |||||||
| Proceeds from issuance of common stock | 108,835 | — | |||||
| Proceeds from issuance of redeemable preferred stock | 1,023 | — | |||||
| Proceeds from debt | 130,000 | — | |||||
| Deferred financing costs | (4,014 | ) | — | ||||
| Restricted cash | (3,856 | ) | — | ||||
| Repayment of short-term note | — | (2,354 | ) | ||||
| Payments on capital lease obligations | (145 | ) | (325 | ) | |||
| Payments under revolving credit agreement | — | (1,000 | ) | ||||
| Repayment on subordinated debt | — | (17,850 | ) | ||||
| Repayments of borrowings under bank term loans | — | (17,753 | ) | ||||
| Purchase of common stock warrants | — | (7,525 | ) | ||||
| Termination of interest rate swap | — | (670 | ) | ||||
| Deemed capital contribution from parent company for debt and warrant payments | — | 41,736 | |||||
| Net cash provided by (used in) financing activities | 231,843 | (5,741 | ) | ||||
| Net change in cash and cash equivalents | 3,121 | 5,027 | |||||
| Cash and cash equivalents at beginning of period | — | 2,438 | |||||
| Cash and cash equivalents at end of period | $ | 3,121 | 7,465 | ||||
| Supplemental disclosure of cash flow information: | |||||||
| Cash paid during the period for: | |||||||
| Interest | $ | 1,447 | $ | 2,550 | |||
| Income taxes | $ | 134 | $ | 2,601 | |||
| Net working capital | $ | 1,988 | ||
| Airport contract rights | 132,120 | |||
| Plant and equipment | 42,700 | |||
| Customer relationships | 3,900 | |||
| Tradename | 6,800 | |||
| Technology (intangible asset) | 500 | |||
| Noncompete agreements | 4,310 | |||
| Other | 404 | |||
| Goodwill | 93,205 | |||
| Total assets acquired | 285,927 | |||
| Long-term liabilities assumed | (1,757 | ) | ||
| Deferred income taxes | (61,051 | ) | ||
| Net assets acquired | $ | 223,119 |
North America Capital Holding Company | Executive Air Support, Inc. | ||||||
July 30, 2004 to December 22, 2004 | January 1, 2004 to July 29, 2004 | ||||||
| Continuing operations: | |||||||
| Federal – current | $ | 966 | $ | (10 | ) | ||
| Federal – deferred | (672 | ) | (281 | ) | |||
| State – current | 274 | 366 | |||||
| State – deferred | (282 | ) | (672 | ) | |||
| 286 | (597 | ) | |||||
| Discontinued operations | 80 | (194 | ) | ||||
| Total provision (benefit) for income taxes | $ | 366 | $ | (791 | ) | ||
North America Capital Holding Company | Executive Air Support, Inc. | ||||||
July 30, 2004 to December 22, 2004 | January 1, 2004 to July29, 2004 | ||||||
| Provision (benefit) for federal income taxes at statutory rate | $ | (1,844 | ) | $ | (378 | ) | |
| State income taxes, net of federal tax benefit | (6 | ) | (675 | ) | |||
| Nondeductible transaction costs | 1,805 | 87 | |||||
| Nondeductible warrant liability | — | 1,795 | |||||
| Resolution of tax contingency | — | (915 | ) | ||||
| Other | 331 | (511 | ) | ||||
| Provision (benefit) for income taxes for continuing operations | $ | 286 | $ | (597 | ) | ||
Number of Shares | Weighted Average Exercise Price | ||||||
| Outstanding, December 31, 2003 | 1,398,848 | $ | 3.62 | ||||
| Granted at fair value | — | — | |||||
| Forfeited | — | — | |||||
| Exercised | 1,398,848 | 3.62 | |||||
| Outstanding, July 29, 2004 | — | — | |||||
| Granted at fair value | — | — | |||||
| Forfeited | — | — | |||||
| Exercised | — | — | |||||
| Outstanding, December 22, 2004 | — | $ | — | ||||
Balance at Beginning of Period | Charged to Costs and Expenses | Other | Deductions | Balance at End of Period | ||||||||||||
| (in thousands) | ||||||||||||||||
| Allowance for Doubtful Accounts | ||||||||||||||||
| For the Period April 13, 2004 (inception) to December 31, 2004: | $ | — | $ | 26 | $ | 1,333 | $ | — | $ | 1,359 | ||||||
| For the Year Ended December 31, 2005: | $ | 1,359 | $ | 4 | $ | — | $ | (524 | ) | $ | 839 | |||||
| For the Year Ended December 31, 2006: | $ | 839 | $ | 635 | $ | 64 | $ | (103 | ) | $ | 1,435 | |||||
| Balance at Beginning of Year | Charged to Costs and Expenses | Deductions | Balance at End of Year | |||||||||||||||||
| ($ in Thousands) | ||||||||||||||||||||
| Allowance for Doubtful Accounts | ||||||||||||||||||||
| For the Year Ended December 31, 2007 | $ | 1,319 | $ | 593 | $ | (13 | ) | $ | 1,899 | |||||||||||
| For the Year Ended December 31, 2008 | $ | 1,899 | $ | 1,543 | $ | (1,301 | ) | $ | 2,141 | |||||||||||
| For the Year Ended December 31, 2009 | $ | 2,141 | $ | 3,401 | $ | (3,913 | ) | $ | 1,629 | |||||||||||
None.
(a) Management’s Evaluation of Disclosure Controls and Procedures
Under the direction and with the participation of our chief executive officer and chief financial officer, we evaluated our disclosure controls and procedures (as such term is defined under Rule 13a-15(e)13(a)-15(e) of the Exchange Act) as of the end of the period covered by this report under the direction. Based on that evaluation, our chief executive officer and with the participation of our Chief Executive Officer and Chief Financial Officer, and havechief financial officer concluded that our disclosure controls and procedures were effective as of December 31, 2006.
(b) Management’s Annual Report on Internal Control over Financial Reporting
Management of the Company is responsible for establishing and maintaining effective internal control over financial reporting, and for performing an assessment of the effectiveness of internal control over financial reporting as of December 31, 2006.2009. Internal control over financial reporting is defined in Rule 13a-15(f) or 15d-15(f) promulgated under the Securities Exchange Act of 1934 as a process designed by, or under the supervision of, the Company’s principal executive and principal financial officers and effected by the Company’s boardBoard of directors,Directors, management and other personnel, to provide reasonable assurance regarding the reliability of financial reporting and the preparation of financial statements for external purposes in accordance with U.S. generally accepted accounting principles.
Internal control over financial reporting includes those policies and procedures that (1) pertain to the maintenance of records that, in reasonable detail, accurately and fairly reflect the transactions and dispositions of the assets of the Company; (2) provide reasonable assurance that transactions are recorded as necessary to permit the preparation of financial statements in accordance with U.S. generally accepted accounting principles, and that receipts and expenditures of the Company are being made only in accordance with authorizations of management and directors of the Company; and (3) provide reasonable assurance regarding prevention or timely detection of unauthorized acquisition, use or disposition of the Company’s assets that could have a material effect on the financial statements.
All internal control systems, no matter how well designed, have inherent limitations. Because of the inherent limitations, internal control over financial reporting may not prevent or detect misstatements. Projections of any evaluation of effectiveness to future periods are subject to the risk that controls may become inadequate because of changes in conditions, or the degree of compliance with the policies or procedures may deteriorate. Accordingly, even those systems determined to be effective can provide only reasonable assurance with respect to financial statement preparation and presentation.
Management used the framework set forth in the report entitled “Internal Control-Integrated Framework” published by the Committee of Sponsoring Organizations of the Treadway Commission (referred to as “COSO”) to evaluate the effectiveness of the Company’s internal control over financial reporting as of December 31, 2006. As permitted under the guidance of the SEC released October 16, 2004, in Question 3 of its “Frequently Asked Questions” regarding Securities Exchange Act Release No. 34-47986, Management’s Report on Internal Control Over Financial Reporting and Certification of Disclosure in Exchange Act Periodic Reports, the scope of management’s evaluation excluded the business acquired through the purchase of Macquarie HGC Investment LLC, acquisition date June 7, 2006, and the purchase of Trajen Holdings, Inc., acquisition date July 11, 2006. Accordingly, management’s assessment of the Company’s internal control over financial reporting does not include internal control over financial reporting of Macquarie HGC Investment LLC and Trajen Holdings, Inc. The assets of Macquarie HGC Investment LLC represent 15% of the Company’s total assets at December 31, 2006 and generated 17% of the Company’s total revenue during the year ended December 31, 2006. The assets of Trajen Holdings, Inc. represent 20% of the Company’s total assets at December 31, 2006 and generated 13% of the Company’s total revenue during the year ended December 31, 2006.
As a result of its evaluation, management has concluded that the Company’s internal control over financial reporting was effective as of December 31, 2006.
The effectiveness of the financial statements included in this report, has issued an audit report on management’s assessment of our internal control over financial reporting.
(c) Attestation Report of Registered Public Accounting Firm
REPORT OF INDEPENDENT REGISTERED PUBLIC ACCOUNTING FIRM
The Board of Directors and Stockholders
Macquarie Infrastructure Company LLC:
We have audited Macquarie Infrastructure Company LLC’s internal control over financial reporting as of December 31, 2009, based on criteria established in Internal Control—Control — Integrated Framework issued by the Committee of Sponsoring Organizations of the Treadway Commission (COSO). Macquarie Infrastructure Company Trust’sLLC’s management is responsible for maintaining effective internal control over financial reporting and for its assessment of the effectiveness of internal control over financial reporting.reporting, included in the accompanying Management’s Annual Report on Internal Control over Financial Reporting. Our responsibility is to express an opinion on management’s assessment and an opinion on the effectiveness of the Company’s internal control over financial reporting based on our audit.
We conducted our audit in accordance with the standards of the Public Company Accounting Oversight Board (United States). Those standards require that we plan and perform the audit to obtain reasonable assurance about whether effective internal control over financial reporting was maintained in all material respects. Our audit included obtaining an understanding of internal control over financial reporting, evaluating management’s assessment,assessing the risk that a material weakness exists, and testing and evaluating the design and operating effectiveness of internal control andbased on the assessed risk. Our audit also included performing such other procedures as we considered necessary in the circumstances. We believe that our audit provides a reasonable basis for our opinion.
A company’s internal control over financial reporting is a process designed to provide reasonable assurance regarding the reliability of financial reporting and the preparation of financial statements for external purposes in accordance with generally accepted accounting principles. A company’s internal control over financial reporting includes those policies and procedures that (1) pertain to the maintenance of records that, in reasonable detail, accurately and fairly reflect the transactions and dispositions of the assets of the company; (2) provide reasonable assurance that transactions are recorded as necessary to permit preparation of financial statements in accordance with generally accepted accounting principles, and that receipts and expenditures of the company are being made only in accordance with authorizations of management and directors of the company; and (3) provide reasonable assurance regarding prevention or timely detection of unauthorized acquisition, use, or disposition of the company’s assets that could have a material effect on the financial statements.
Because of its inherent limitations, internal control over financial reporting may not prevent or detect misstatements. Also, projections of any evaluation of effectiveness to future periods are subject to the risk that controls may become inadequate because of changes in conditions, or that the degree of compliance with the policies or procedures may deteriorate.
In our opinion, management’s assessment that Macquarie Infrastructure Company Trust maintained effective internal control over financial reporting as of December 31, 2006, is fairly stated, in all material respects, based on criteria established in Internal Control — Integrated Framework issued by the Committee of Sponsoring Organizations of the Treadway Commission (COSO). Also, in our opinion, Macquarie Infrastructure Company TrustLLC maintained, in all material respects, effective internal control over financial reporting as of December 31, 2006,2009, based on criteria established inInternal Control — Integrated Framework issued by the Committee of Sponsoring Organizations of the Treadway Commission (COSO).
We also have audited, in accordance with the standards of the Public Company Accounting Oversight Board (United States), the consolidated balance sheets of Macquarie Infrastructure Company TrustLLC and subsidiaries as of December 31, 20062009 and 2005,2008, and the related consolidated statements of operations, stockholders’members’ equity and comprehensive income (loss), and cash flows andfor each of the related financial statement schedule foryears in the yearsthree-year period ended December 31, 2006 and 2005 and the period April 13, 2004 (inception) to December 31, 2004,2009, and our report dated February 28, 200725, 2010 expressed an unqualified opinion on those consolidated financial statements.
As discussed in Note 2 to the consolidated financial statements, and financial statement schedule.
/s/KPMG LLP
Dallas, Texas
February
(d) Changes in Internal Control Over Financial Reporting
No change in our internal control over financial reporting (as such term is defined in Exchange Act Rule 13a-15(f)) was identified in connection with the existing shareholders’ agreement between our wholly-owned subsidiary Macquarie Terminal Holdings LLC, IMTT andevaluation described in (b) above during the other shareholders of IMTT. The amendment provides for the following:
PART III
The companyCompany will furnish to the Securities and Exchange Commission a definitive proxy statement not later than 120 days after the end of the fiscal year ended December 31, 2006.2009. The information required by this item is incorporated herein by reference to the proxy statement.
The information required by this item is incorporated herein by reference to the proxy statement.
ITEM 12. Security Ownership of Certain Beneficial Owners and Management and Related Stockholder Matters
The information required by this item is incorporated herein by reference to the proxy statement.
The information required by this item is incorporated herein by reference to the proxy statement.
The information required by this item is incorporated herein by reference to the proxy statement.
PART IV
Financial Statements and Schedules
The consolidated financial statements in Part II, Item 8, and schedule listed in the accompanying exhibit index are filed as part of this report.
Exhibits
The exhibits listed on the accompanying exhibit index are filed as a part of this report.
SIGNATURES
Pursuant to the requirements of Section 13 or 15(d) of the Securities Exchange Act of 1934, each RegistrantMacquarie Infrastructure Company LLC has duly caused this report to be signed on its behalf by the undersigned, thereunto duly authorized, on March 1, 2007.
| MACQUARIE INFRASTRUCTURE COMPANY LLC (Registrant) | ||
By: | /s/ | |
| Chief Executive Officer | ||
We, the undersigned directors and executive officers of Macquarie Infrastructure Company LLC, hereby severally constitute Peter StokesJames Hooke and Francis T. Joyce,Todd Weintraub, and each of them singly, our true and lawful attorneys with full power to them and each of them to sign for us, and in our names in the capacities indicated below, any and all amendments to the Annual Report on Form 10-K filed with the Securities and Exchange Commission, hereby ratifying and confirming our signatures as they may be signed by our said attorneys to any and all amendments to said Annual Report on Form 10-K.
Pursuant to the requirements of the Securities Exchange Act of 1934, this report has been signed below by the following persons on behalf of Macquarie Infrastructure Company LLC and in the capacities indicated on the 1st25th day of March 2007.
| Signature | Title | |
| /s/ James Hooke | Chief Executive Officer (Principal Executive Officer) | |
| /s/ Todd Weintraub | Chief Financial Officer (Principal Financial Officer) | |
| /s/ | ||
| John Roberts | Chairman of the Board of Directors | |
| /s/ Norman H. Brown, Jr.Norman H. Brown, Jr. | Director | |
| /s/ George W. Carmany IIIGeorge W. Carmany III | Director | |
| /s/ William H. WebbWilliam H. Webb | Director |
EXHIBIT INDEX
| 2.1* | Asset Purchase Agreement, dated as of January 28, 2010 between PCAA Parent, LLC, a subsidiary of the holding company for Macquarie Infrastructure Company’s airport parking business, and certain of its subsidiaries, and Corinthian-Bainbridge ZKS Holdings, LLC, a Delaware limited liability company, formed by Corinthian Equity Fund, L.P. and Bainbridge ZKS Funds, LP† | |
| Purchase | ||
| 2.3* | Amendment to Purchase Agreement, dated as of December 21, 2009, regarding the | |
| 3.1 | Third Amended and Restated Operating Agreement of Macquarie | |
| 3.2 | ||
| Amended and Restated Certificate of Formation of Macquarie Infrastructure Assets LLC (incorporated by reference to Exhibit 3.8 of Amendment No. | ||
| Specimen certificate evidencing | ||
| 10.1 | Amended and Restated Management Services Agreement, dated as of June 22, 2007, among Macquarie Infrastructure Company LLC, Macquarie Infrastructure Company Inc., Macquarie Yorkshire LLC, South East Water LLC, Communications Infrastructure LLC and Macquarie Infrastructure Management (USA) Inc. (incorporated by reference to Exhibit | |
| 10.2 | Amendment No. 1 to the Amended and Restated Management Services Agreement, dated as of February 7, 2008, among Macquarie Infrastructure Company LLC, Macquarie Infrastructure Company Inc., Macquarie Yorkshire LLC, South East Water LLC, Communications Infrastructure LLC and Macquarie Infrastructure Management (USA) Inc. (incorporated by reference to Exhibit 10.2 to the Registrant’s Annual Report on Form 10-K for the year ended December 31, | |
| 10.3 | Registration Rights Agreement among Macquarie Infrastructure Company Trust, Macquarie Infrastructure Company LLC and Macquarie Infrastructure Management (USA) Inc., dated as of December 21, 2004 (incorporated by reference to Exhibit 99.4 of the | |
| 10.4 | Macquarie Infrastructure Company LLC — Independent Directors Equity Plan (incorporated by reference to Exhibit 10.1 to the Registrant’s Quarterly Report on Form 10-Q for the quarter ended September 30, 2008) | |
| Second Amended and Restated Credit Agreement, dated as of February 13, 2008, among Macquarie Infrastructure Company Inc., Macquarie Infrastructure Company LLC, the Lenders (as defined therein), the Issuers (as defined therein) and Citicorp North America, Inc., as administrative agent (incorporated by reference to Exhibit 10.5 to the Registrant’s 2007 Annual Report) | ||
| 10.6 | Loan Agreement, dated as of September 1, 2006 between Parking Company of America Airports, LLC, Parking Company of America Airports Phoenix, LLC, PCAA SP, LLC and PCA Airports, Ltd., as borrowers, and Capmark Finance Inc., as lender (incorporated by reference to Exhibit 10.1 of the | |
| District Cooling System Use Agreement, dated as of October 1, 1994, between the City of Chicago, Illinois and MDE Thermal Technologies, Inc., as amended on June 1, 1995, July 15, 1995, February 1, 1996, April 1, 1996, October 1, 1996, November 7, 1996, January 15, 1997, May 1, 1997, August 1, 1997, October 1, 1997, March 12, 1998, June 1, 1998, October 8, 1998, April 21, 1999, March 1, 2000, March 15, 2000, June 1, 2000, August 1, 2001, November 1, 2001, June 1, 2002, and June 30, 2004 (incorporated by reference to Exhibit 10.25 of Amendment No. 2) |
| Twenty-Third Amendment to the District Cooling System Use Agreement, dated as of November 1, 2005, by and between the City of Chicago and Thermal Chicago Corporation (incorporated by reference to Exhibit 10.5 | ||
| 10.9 | Twenty-Fourth Amendment to District Cooling System Use Agreement, dated as of November 1, 2006, by and between the City of Chicago, Illinois and MDE Thermal Technologies, Inc. (incorporated by reference to Exhibit 10.3 to the Registrant’s Quarterly Report on Form 10-Q for the quarter ended March 31, 2007 (the “March 2007 Quarterly Report”)) | |
| 10.11 | Loan Agreement, dated as of September | |
| 10.12 | ||
| Amendment Number One to Loan Agreement, dated as of December 21, 2007, among Macquarie | ||
| 10.13 | Amendment Number Two to Loan Agreement, dated as of February 22, 2008, among Macquarie District Energy, Inc., the several banks and other financial institutions signatories thereto; LaSalle Bank National Association, as Issuing Bank and Dresdner Bank AG New York Branch, as Administrative Agent (incorporated by reference to Exhibit 10.12 to the Registrant’s 2007 Annual Report) | |
| Letter Agreement, dated January 23, 2007, between Macquarie Terminal Holdings LLC, IMTT Holdings Inc., the Current Shareholders and the Current Beneficial Owners named | ||
| 10.16 | Letter Agreement entered into as of June 20, 2007 among IMTT Holdings Inc. (IMTT Holdings), Macquarie Terminal Holdings LLC and the Current Beneficial Shareholders of IMTT Holdings, amending the Shareholders Agreement dated April 14, 2006 (as amended) between IMTT Holdings and the Shareholders thereof (incorporated by reference to Exhibit 10.5 to the June 2007 Quarterly Report) | |
| 10.18 | ||
| 10.19 | Waiver and Amendment Number Three to Loan Agreement, dated as of November 30, 2007, among Atlantic Aviation FBO Inc., the several banks and other financial institutions signatories thereto and Depfa Bank plc, as Administrative Agent (incorporated by reference to Exhibit 10.19 to the Registrant’s 2007 Annual Report) |
| 10.20 | Waiver and Amendment Number Four to Loan Agreement, dated as of December 27, 2007, among Atlantic Aviation FBO INC. and the several banks and other financial institutions signatories thereto (incorporated by reference to Exhibit 10.20 to the Registrant’s 2007 Annual Report) | |
| Consent and Amendment Number Five to Loan Agreement, dated as of January 31, 2008, among Atlantic Aviation FBO INC., Atlantic Aviation FBO Holdings LLC (formerly known as Macquarie FBO Holdings LLC) and the several banks and other financial institutions signatories thereto (incorporated by reference to Exhibit 10.21 to the Registrant’s 2007 Annual Report). | ||
| 10.22 | Amendment Number Six to Loan Agreement, dated as of February 25, 2009, among Atlantic Aviation FBO Inc and the bank or banks and other financial institutions signatories thereto (incorporated by reference to Exhibit 10.29 to the 2009 10-K Report) | |
| 10.23 | Amended and Restated Loan Agreement, dated as of June 7, 2006, among HGC Holdings LLC, Macquarie Gas Holdings LLC, the Lenders named herein and Dresdner Bank AG London Branch (incorporated by reference to Exhibit 10.1 of the | |
| Amended and Restated Loan Agreement, dated as of June 7, 2006, among The Gas Company LLC, Macquarie Gas Holdings LLC, the Lenders defined therein and Dresdner Bank AG London Branch (incorporated by reference to Exhibit 10.2 of the | ||
| 10.25 | ||
| 10.26 | ||
| 21.1* | Subsidiaries of the | |
| Registrant | ||
| 23.1* | Consent of KPMG LLP | |
| 23.2* | Consent of KPMG LLP (IMTT) | |
| 24.1* | Powers of Attorney (included in signature pages) | |
| 31.1* | Rule 13a-14(a)/15d-14(a) Certification of the Chief Executive Officer | |
| 31.2* | Rule 13a-14(a)/15d-14(a) Certification of the Chief Financial Officer | |
| 32.1* | Section 1350 | |
| 32.2* | Section 1350 Certification of Chief Financial Officer | |
| 99.1* |
| * | Filed herewith. |
| † | Certain schedules and exhibits have been omitted pursuant to Item 601(b)(2) of Regulation S-K. The Registrant hereby undertakes to furnish supplemental copies of any of the omitted schedules and exhibits upon request by the Securities and Exchange Commission. |