In lieu of actually distributing our realized net capital gains, we as a RIC may retain all or part of our net capital gains and elect to be deemed to have made a distribution of the retained portion to our shareholders under the "designated undistributed capital gain" rules of the Code. We currently intend to retain and designate all of our net capital gains. In this case, the "deemed dividend" generally is taxable to our shareholders as long-term capital gains. Although we pay tax at the corporate rate on the amount deemed to have been distributed, our shareholders receive a tax credit equal to their proportionate share of the tax paid and an increase in the tax basis of their shares by the amount per share retained by the Company.
To the extent that we declare a deemed dividend, each shareholder will receive an IRS Form 2439 that will reflect each shareholder's receipt of the deemed dividend income and a tax credit equal to each shareholder's proportionate share of the tax paid by us. This tax credit, which is paid at the corporate rate, is often credited at a higher rate than the actual tax due by a shareholder on the deemed dividend income. The "residual" credit can be used by the shareholder to offset other taxes due in that year or to generate a tax refund to the shareholder. Tax exempt investors may file for a refund.
The following simplified examples illustrate the tax treatment under Subchapter M of the Code for us and our individual shareholders with regard to three possible distribution alternatives, assuming a net capital gain of $1.00 per share, consisting entirely of sales of non-real property assets held for more than 12 months.
Under Alternative A: 100 percent of net capital gain declared as a cash dividend and distributed to shareholders:
1.No federal taxation at the Company level.
Under Alternative B: 100 percent of net capital gain retained by the Company and designated as "undistributed capital gain" or deemed dividend:
12
3. Non-taxable shareholders that file a federal tax return receive a tax refund equal to $0.35$.35 per share.
*Assumes all capital gains qualify for long-term rates of 15 percent.
Under Alternative C: 100 percent of net capital gain retained by the Company, with no designated undistributed capital gain or deemed dividend:
1. The Company pays a corporate-level federal income tax of 35 percent on the retained gain or $.35 per share plus an excise tax of four percent of $.98 per share, or about $.04 per share.
2. There is no tax consequence at the shareholder level.
Although we may retain income and gains subject to the limitations described above (including paying corporate level tax on such amounts), we could be subject to an additional four percent excise tax if we fail to distribute 98 percent of our aggregate annual taxable income.
As noted above, in order to qualify as a RIC, we must meet certain investment asset diversification requirements each quarter. Because of the specialized nature of our investment portfolio, in some years we have been able to satisfy the diversification requirements under Subchapter M of the Code primarily as a result of receiving certifications from the SEC under the Code with respect to each taxable year beginning after 1998 that we were "principally engaged in the furnishing of capital to other corporations which are principally engaged in the development or exploitation of inventions, technological improvements, new processes, or products not previously generally available" for such year.
Although we received SEC certifications for 1999-2005,1999-2006, there can be no assurance that we will receive such certification for 20062007 or subsequent years (to the extent we need additional certifications as a result of changes in our portfolio). If we require, but fail to obtain, the SEC certification for a taxable year, we may fail to qualify as a RIC for such year. We will also fail to qualify as a RIC for a taxable year if we do not satisfy the Income Source Rule or Income Distribution Rule for such year. In the event we do not qualify as a RIC for any taxable year, we will be subject to federal tax with respect to all of our taxable income, whether or not distributed. In addition, all our distributions to shareholders in that situation generally will be taxable as ordinary dividends.
Although we generally intend to qualify as a RIC for each taxable year, under certain circumstances we may choose to take action with respect to one or more taxable years to ensure that we would be taxed under Subchapter C of the Code (rather than Subchapter M) for such year or years. We will choose to take such action only if we determine that the result of the action will benefit us and our shareholders.
13
Prior to 1999, we were taxable under Subchapter C of the Code (a "C Corporation"). Under the Code, a C Corporation that elects to be treated as a RIC for federal tax purposes is taxable on the effective date of the election to the extent of any gain built into its assets ("C Corporation Assets") on such date ("Built-In Gain"). However, a C Corporation may elect alternatively to be taxable on such Built-In Gain as such gain is realized during the 10-year period beginning on the effective date of its RIC election (the "Inclusion Period"). We had Built-In Gains at the time of our qualification as a RIC and elected to be taxed on any Built-In Gain realized during the Inclusion Period. Prior to 1999, we carried forward ordinary and capital losses from our operations. After our election of RIC status, those losses remained available to be carried forward to subsequent taxable years. Recently issued Internal Revenue Service regulations confirm that such losses may be used to offset realized Built-In Gains and, to the extent so used, to eliminate C Corporation taxation of such gains. We have previously used loss carryforwards to offset Built-In Gains. As of January 1, 2006, the Company had utilized all of its remaining pre-1999 loss carryforwards and unrealized Built-In Gains.
Subsidiaries
Harris & Harris Enterprises, Inc. ("Enterprises"), is a 100 percent wholly owned subsidiary of the Company and is consolidated in our financial statements. Enterprises is a partner in Harris Partners I, L.P., and is taxed as a C Corporation. Harris Partners I, L.P., is a limited partnership. Currently, Harris Partners I, L.P., ownsowned our interest in AlphaSimplex Group, LLC.LLC, until AlphaSimplex was sold to Natixis Global Asset Management. We received our share of the proceeds on October 30, 2007. The partners of Harris Partners I, L.P., are Harris & Harris Enterprises, Inc. (sole general partner) and the Company (sole limited partner).
Available Information
Additional information about us, including our annual report on Form 10-K, quarterly reports on Form 10-Q, current reports on Form 8-K and amendments to those reports filed or furnished pursuant to Section 13(a) or 15(d) of the Securities Exchange Act of 1934, are available on our website at www.TinyTechVC.com. Information on our website is not part of this annual report on Form 10-K.
Employees
We currently employ directly ten13 full-time employees and one part-time employee.employees.
14
Investing in our common stock involves significant risks relating to our business and investment objective. You should carefully consider the risks and uncertainties described below before you purchase any of our common stock. These risks and uncertainties are not the only ones we face. Unknown additional risks and uncertainties, or ones that we currently consider immaterial, may also impair our business. If any of these risks or uncertainties materialize, our business, financial condition or results of operations could be materially adversely affected. In this event, the trading price of our common stock could decline, and you could lose all or part of your investment.
Risks related to the companies in our portfolio.
A continuing lack of initial public offering opportunities may cause companies to stay in our portfolio longer, leading to lower returns, write-downs and write-offs.
Beginning in about 2001, many fewer venture capital-backed companies per annum have been able to complete initial public offerings (IPOs) than in the years of the previous decade. Moreover, in 2006,2007, according to VentureSource, the venture capital-backed companies that completed IPOs had a median age of about eight8.3 years, which was older than the median age of venture capital-backed IPOs in any period since 2001-2002. Now that some of our companies are becoming more mature, a continuing lack of IPO opportunities for venture capital-backed companies could lead to companies staying longer in our portfolio as private entities still requiring funding. In the best case, such stagnation would dampen returns, and in the worst case, could lead to write-downs and write-offs as some companies ranrun short of cash and hadhave to accept lower valuations in private fundings or wereare not able to access additional capital at all. A continuing lack of IPO opportunities for venture capital-backed companies is also causing some venture capital firms to change their strategies, which is causing some of them to reduce funding of their portfolio companies, making it more difficult for such companies to access capital and to fulfill their potential, leading in some cases to write-downs and write-offs of such companies by other venture capital firms, such as ourselves, who are co-investors in such companies.
Investing in small, private companies involves a high degree of risk and is highly speculative.
We have invested a substantial portion of our assets in privately held development stage or start-up companies, the securities of which are inherently illiquid. These businesses tend to lack management depth, to have limited or no history of operations and to have not attained profitability. Tiny technology companies are especially risky, involving scientific, technological and commercialization risks. Because of the speculative nature of these investments, these securities have a significantly greater risk of loss than traditional investment securities. Some of our venture capital investments are likely to be complete losses or unprofitable, and some will never realize their potential. We have been and will continue to be risk seeking rather than risk averse in our approach to venture capital and other investments. Neither our investments nor an investment in our common stock is intended to constitute a balanced investment program.
15
We may invest in companies working with technologies or intellectual property that currently have few or no proven commercial applications.
Nanotechnology, in particular, is a developing area of technology, of which much of the future commercial value is unknown, difficult to estimate and subject to widely varying interpretations. There are as of yet relatively few nanotechnologynanotechnology-enabled products commercially available. The timing of additional future commercially available nanotechnology products is highly uncertain.
Our portfolio companies may not successfully develop, manufacture or market their products.
The technology of our portfolio companies is new and in many cases unproven. Their potential products require significant and lengthy product development, manufacturing and marketing efforts. To date, many of our portfolio companies have not developed any commercially available products. In addition, our portfolio companies may not be able to manufacture successfully or to market their products in order to achieve commercial success. Further, the products may never gain commercial acceptance. If our portfolio companies are not able to develop, manufacture or market successful tiny technology-enabled products, they will be unable to generate product revenue or build sustainable or profitable businesses. Adverse conditions in the target markets of our portfolio companies may limit or prevent commercial success regardless of the contribution of tiny technology to these products.
Our portfolio companies working with tiny technology may be particularly susceptible to intellectual property litigation.
Research and commercialization efforts in tiny technology are being undertaken by a wide variety of government, academic and private corporate entities. As additional commercially viable applications of tiny technology emerge, ownership of intellectual property on which these products are based may be contested. From time to time, our portfolio companies are or have been involved in intellectual property disputes and litigation. Any litigation over the ownership of, or rights to, any of our portfolio companies’ technologies or products could have a material adverse effect on those companies’ values.
Unfavorable general economic conditions, as well as unfavorable conditions specific to the venture capital industry or a segment of portfolio companies, could result in the inability of our portfolio companies to access additional capital, leading to financial losses in our portfolio.
Most of the companies in which we have made or will make investments are susceptible to economic slowdowns or recessions. An economic slowdown or adverse capital or credit market conditions may affect the ability of a company in our portfolio to raise additional capital from venture capital or other sources or to engage in a liquidity event such as an initial public offering or merger. Certain types of portfolio companies, such as those engaged in solar, solid-state lighting and other alternative energy (cleantech) applications, which are currently in favor with the media and investors generally, may have a harder time accessing capital in the future if their industries subsequently fall out of fashion. Adverse economic, capital or credit market conditions may lead to financial losses in our portfolio.
16
The value of our portfolio could be adversely affected if the technologies utilized by our portfolio companies are found, or even rumored or feared, to cause health or environmental risks,, or if legislation is passed that limits the commercialization of any of these technologies.
Our portfolio companies or lead to new government regulationmay generate revenues from the sale of nanotechnology-enablednon-tiny technology-enabled products. For example, debate regarding the production of materials that could cause harm to the environment or the health of individuals could raise concerns in the public’s perception of nanotechnology, not all of which might be rational or scientifically based.
We consider a company to be a tiny technology company if a product or products, or intellectual property covering a product or products, that we consider to be at the microscale or smaller is material to its business plan. The core business of some of these companies may not be tiny technology-enabled products, and therefore their success or failure may not be dependent upon the tiny technology aspects of their business. In addition to developing products that we consider tiny technology, some of these companies may also develop products that we do not consider enabled by tiny technology. Some of these companies will generate revenues from the sale of non-tiny technology-enabled products. Additionally, it is possible that a portfolio company may decide to change its business focus after our initial investment and decide to develop and commercialize non-tiny technology-enabled products.
Risks related to the illiquidity of our investments.
We invest in illiquid securities and may not be able to dispose of them when it is advantageous to do so, or ever.
Most of our investments are or will be equity or equity-linked securities acquired directly from small companies. These equity securities are generally subject to restrictions on resale or otherwise have no established trading market. The illiquidity of most of our portfolio of equity securities may adversely affect our ability to dispose of these securities at times when it may be advantageous for us to liquidate these investments. We may never be able to dispose of these securities.
17
Unfavorable economic conditions and regulatory changes could impair our ability to engage in liquidity events.
Our business of making private equity investments and positioning our portfolio companies for liquidity events might be adversely affected by current and future capital markets and economic conditions. The public equity markets currently provide less opportunity for liquidity events than at times in the past when there was more robust demand for initial public offerings, even for more mature technology companies than those in which we typically invest. The potential for public market liquidity could further decrease and could lead to an inability to realize potential gains or could lead to financial losses in our portfolio and a decrease in our revenues, net income and assets. Recent government reforms affecting publicly traded companies, stock markets, investment banks and securities research practices have made it more difficult for privately held companies to complete successful initial public offerings of their equity securities, and such reforms have increased the expense and legal exposure of being a public company. Slowdowns in initial public offerings may also be having an adverse effect on the frequency and prices of acquisitions of privately held companies. A lack of merger and/or acquisition opportunities for privately held companies also may be having an adverse effect on the ability of these companies to raise capital from private sources. Public equity market response to companies offering nanotechnology-enabled products is uncertain. An inability to engage in liquidity events could negatively affect our liquidity, our reinvestment rate in new and follow-on investments and the value of our portfolio.
Even if some of our portfolio companies complete initial public offerings, the returns on our investments in those companies would be uncertain.
When companies in which we have invested as private entities complete initial public offerings of their securities, these newly issued securities are by definition unseasoned issues. Unseasoned issues tend to be highly volatile and have uncertain liquidity, which may negatively affect their price. In addition, we are typically subject to lock-up provisions that prohibit us from selling our investments into the public market for specified periods of time after initial public offerings. The market price of securities that we hold may decline substantially before we are able to sell these securities. Most initial public offerings of technology companies in the United States are listed on the Nasdaq Global Market. Government reforms of the Nasdaq Global Market have made market-making by broker-dealers less profitable, which has caused broker-dealers to reduce their market-making activities, thereby making the market for unseasoned stocks less liquid than they might be otherwise.
18
Risks related to our Company.
Because there is generally no established market in which to value our investments, our Valuation Committee’s value determinations may differ materially from the values that a ready market or third party would attribute to these investments.
There is generally no public market for the equity securities in which we invest. Pursuant to the requirements of the 1940 Act, we value all of the private equity securities in our portfolio at fair value as determined in good faith by a committee of independent members of our Board of Directors, which we call the Valuation Committee, pursuant to Valuation Procedures established by the Board of Directors. As a result, determining fair value requires that judgment be applied to the specific facts and circumstances of each portfolio investment pursuant to specified valuation principles and processes. We are required by the 1940 Act to value specifically each individual investment on a quarterly basis and record unrealized depreciation for an investment that we believe has become impaired. Conversely, we must record unrealized appreciation if we believe that our securities have appreciated in value. Our valuations, although stated as a precise number, are necessarily within a range of values that vary depending on the significance attributed to the various factors being considered.
We use the Black-Scholes option pricing model to determine the fair value of warrants held in our portfolio. Option pricing models, including the Black-Scholes model, require the use of subjective input assumptions, including expected volatility, expected life, expected dividend rate, and expected risk-free rate of return. In the Black-Scholes model, variations in the expected volatility or expected term assumptions have a significant impact on fair value. Because the securities underlying the warrants in our portfolio are not publicly traded, many of the required input assumptions are more difficult to estimate than they would be if a public market for the underlying securities existed.
Without a readily ascertainable market value and because of the inherent uncertainty of valuation, the fair value that we assign to our investments may differ from the values that would have been used had an efficient market existed for the investments, and the difference could be material. Any changes in fair value are recorded in our consolidated statements of operations as a change in the "Net (decrease) increase in unrealized appreciation on investments." See "Determination of Net Asset Value."
In the venture capital industry, even when a portfolio of early-stage, high-technology venture capital investments proves to be profitable over the portfolio's lifetime, it is common for the portfolio's value to undergo a so-called "J-curve" valuation pattern. This means that when reflected on a graph, the portfolio’s valuation would appear in the shape of the letter "J," declining from the initial valuation prior to increasing in valuation. This J-curve valuation pattern results from write-downs and write-offs of portfolio investments that appear to be unsuccessful, prior to write-ups for portfolio investments that prove to be successful. Because early-stage companies typically have negative cash flow and are by their nature inherently fragile, a valuation process can more readily substantiate a loss of value than an increase in value, absent a substantial investment at a higher valuation by a third-party, knowledgeable, non-strategic investor.value. Even if our venture capital investments prove to be profitable in the long run, such J-curve valuation patterns could have a significant adverse effect on our net asset value per share and the value of our common stock in the interim. Over time, as we continue to make additional tiny technology investments, this J-curve pattern may be less relevant for our portfolio as a whole, because the individual J-curves for each investment, or series of investments, may overlap with previous investments at different stages of their J-curves.
19
Changes in valuations of our privately held, early stage companies tend to be more volatile than changes in prices of publicly traded securities.
Investments in privately held, early stage companies are inherently more volatile than investments in more mature businesses. Such immature businesses are inherently fragile and easily affected by both internal and external forces. Our investee companies can lose much or all of their value suddenly in response to an internal or external adverse event. Conversely, these immature businesses can gain suddenly in value in response to an internal or external positive development. Moreover, because our ownership interests in such investments are valued only at quarterly intervals by our Valuation Committee, a committee made up of all of our independent members of our Board of Directors, changes in valuations from one valuation point to another tend to be larger than changes in valuations of marketable securities which are revalued in the marketplace much more frequently, in some highly liquid cases, virtually continuously.
We expect to continue to experience material write-downs of securities of portfolio companies.
Write-downs of securities of our privately held companies have always been a by-product and risk of our business. We expect to continue to experience material write-downs of securities of privately held portfolio companies. Write-downs of such companies occur at all stages of their development. Such write-downs may increase in dollar terms, frequency and as a percentage of our net asset value as our dollar investment activity in privately held companies continues to increase, and the number of such holdings in our portfolio continues to grow. Because the average size of each of our investments in tiny technology has increased from year to year and continues to increase, the average size of our write-downs will probably also increase.
Because we aredo not choose investments based on a non-diversified company with a relatively concentrated portfolio,strategy of diversification, the value of our business is subject to greater volatility than the value of companies with more broadly diversified investments.
20
We are dependent upon key management personnel for future success, and may not be able to retain them.
We are dependent upon the diligence and skill of our senior management and other key advisers for the selection, structuring, closing and monitoring of our investments. We utilize lawyers, and we utilize outside consultants, including twoone of our directors, Dr. Kelly S. Kirkpatrick and Lori D. Pressman, to assist us in conducting due diligence when evaluating potential investments. There is generally no publicly available information about the companies in which we invest, and we rely significantly on the diligence of our employees and advisers to obtain information in connec-tionconnection with our investment decisions. Our future success to a significant extent depends on the continued service and coordination of our senior management team, and particularly on Charles E. Harris, our Chairman, and Chief Executive Officer Charles E. Harris,and a Managing Director, who will be subject to mandatory retirement pursuant to the Company's mandatory retirement policy for senior executives on December 31, 2008; on Douglas W. Jamison, our President, Chief Operating Officer and Chief Financial Officer, Douglas W. Jamison,a Managing Director, who has been designated by our Board of Directors as the successor to Mr. Harris in his positions of Chairman and Chief Executive Officer as of January 1, 2009 upon his retirement; on Daniel B. Wolfe, our Chief Financial Officer and a Managing Director; on Alexei A. Andreev and Michael A. Janse, each an Executive Vice President and Managing Director; and on Sandra M. Forman, our General Counsel, Chief Compliance Officer and Director of Human Resources, Sandra M. Forman.Resources. The departure of any of our executive officers, key employees or advisers could materially adversely affect our ability to implement our business strategy. We do not maintain for our benefit any key mankey-man life insurance on any of our officers or employees.
We will need to hire additional employees as the size of our portfolio increases.
We anticipate that it will be necessary for us to add investment professionals with expertise in venture capital and/or tiny technology and administrative and support staff to accommodate the increasing size of our portfolio. We may need to provide additional scientific, business, accounting, legal or investment training for our hires. There is competition for highly qualified personnel. We may not be successful in our efforts to recruit and retain highly qualified personnel because the expenses that we incur as a heavily regulated, publicly held company preclude our paying as high a percentage of our total expenses in cash compensation for employees as the private partnerships with which we compete. Although we have the advantage of offering equity incentive compensation, unlike those private partnerships, we cannot permit co-investment in our investments by our employees, and we cannot give our employees 20 percent or higher carried interests in our investments as incentive compensation taxable as long-term capital gains.
The market for venture capital investments, including tiny technology investments, is highly competitive.
We face substantial competition in our investing activities from many competitors, including but not limited to: private venture capital funds; investment affiliates of large industrial, technology, service and financial companies; small business investment companies; hedge funds; wealthy individuals; and foreign investors. Our most significant competitors typically have significantly greater financial resources than we do. Greater financial resources are particularly advantageous in securing lead investor roles in venture capital syndicates. Lead investors typically negotiate the terms and conditions of such financings. Many sources of funding compete for a small number of attractive investment opportunities. Hence, we face substantial competition in sourcing good investment opportunities on terms of investment that are commercially attractive.
21
In addition to the difficulty of finding attractive investment opportunities, our status as a regulated business development company may hinder our ability to participate in investment opportunities or to protect the value of existing investments.
We are required to disclose on a quarterly basis the names and business descriptions of our portfolio companies and the type and value of our portfolio securities. Most of our competitors are not subject to these disclosure requirements. Our obligation to disclose this information could hinder our ability to invest in some portfolio companies. Additionally, other current and future regulations may make us less attractive as a potential investor than a competitor not subject to the same regulations.
Our failure to make follow-on investments in our portfolio companies could impair the value of our portfolio.
Following an initial investment in a portfolio company, we may make additional investments in that portfolio company as "follow-on" investments, in order to: (1) increase or maintain in whole or in part our ownership percentage; (2) exercise warrants, options or convertible securities that were acquired in the original or subsequent financing; or (3) attempt to preserve or enhance the value of our investment. "Pay-to-play" provisions have become common in venture capital transactions. These provisions require proportionate investment in subsequent rounds of financing in order to preserve preferred rights such as anti-dilution protection or even to prevent preferred shares from being converted to common shares.
We may elect not to make follow-on investments or lack sufficient funds to make such investments. We have the discretion to make any follow-on investments, subject to the availability of capital resources. The failure to make a follow-on investment may, in some circumstances, jeopardize the continued viability of a portfolio company and our initial investment, or may result in a missed opportunity for us to increase our participation in a successful operation, or may cause us to lose some or all preferred rights or even substantially all of our equity ownership in it, pursuant to "pay-to-play" provisions.provisions that have become common in venture capital transactions. These provisions require proportionate investment in subsequent rounds of financing in order to preserve preferred rights such as anti-dilution protection, liquidation preferences and preemptive rights to invest in future rounds of financing. Even if we have sufficient capital to make a desired follow-on investment, we may elect not to make a follow-on investment because we may not want to increase our concentration of risk, because we prefer other opportunities or because we are inhibited by compliance with business development company requirements or the desire to maintain our tax status.
Bank borrowing or the issuance of debt securities or preferred stock by us, to fund investments in portfolio companies or to fund our operating expenses, would make our total return to common shareholders more volatile.
Use of debt or preferred stock as a source of capital entails two primary risks. The first is the risk of leverage, which is the use of debt to increase the pool of capital available for investment purposes. The use of debt leverages our available common equity capital, magnifying the impact on net asset value of changes in the value of our investment portfolio. For example, a business development company that uses 33 percent leverage (that is, $50 of leverage per $100 of common equity) will show a 1.5 percent increase or decline in net asset value for each 1 percent increase or decline in the value of its total assets. The second risk is that the cost of debt or preferred stock financing may exceed the return on the assets the proceeds are used to acquire, thereby diminishing rather than enhancing the return to common shareholders. If we issue preferred shares or debt, the common shareholders would bear the cost of this leverage. To the extent that we utilize debt or preferred stock financing for any purpose, these two risks would likely make our total return to common shareholders more volatile. In addition, we might be required to sell investments, in order to meet dividend, interest or principal payments, when it might be disadvantageous for us to do so.
22
As provided in the 1940 Act and subject to some exceptions, we can issue debt or preferred stock so long as our total assets immediately after the issuance, less some ordinary course liabilities, exceed 200 percent of the sum of the debt and any preferred stock outstanding. The debt or preferred stock may be convertible in accordance with SEC guidelines, which might permit us to obtain leverage at more attractive rates. The requirement under the 1940 Act to pay, in full, dividends on preferred shares or interest on debt before any dividends may be paid on our common stock means that dividends on our common stock from earnings may be reduced or eliminated. An inability to pay dividends on our common stock could conceivably result in our ceasing to qualify as a regulated investment company, or RIC, under the Code, which would in most circumstances be materially adverse to the holders of our common stock. As of the date hereof, we do not have any debt or preferred stock outstanding.
We are authorized to issue preferred stock, which would convey special rights and privileges to its owners senior to those of common stock shareholders.
We are currently authorized to issue up to 2,000,000 shares of preferred stock, under terms and conditions determined by our Board of Directors. These shares would have a preference over our common stock with respect to dividends and liquidation. The statutory class voting rights of any preferred shares we would issue could make it more difficult for us to take some actions that might, in the future, be proposed by the Board and/or holders of common stock, such as a merger, exchange of securities, liquidation or alteration of the rights of a class of our securities, if these actions were perceived by the holders of the preferred shares as not in their best interests. The issuance of preferred shares convertible into shares of common stock might also reduce the net income and net asset value per share of our common stock upon conversion.
Loss of status as a RIC would reduce our net asset value and distributable income.
We currently intend to qualify as a RIC for 20062007 under the Code. As a RIC, we do not have to pay federal income taxes on our income (including realized gains) that is distributed to our shareholders. Accordingly, we are not permitted under accounting rules to establish reserves for taxes on our unrealized capital gains. If we failed to qualify for RIC status in 20062007 or beyond, to the extent that we had unrealized gains, we would have to establish reserves for taxes, which would reduce our net asset value, accordingly. In addition, if we, as a RIC, were to decide to make a deemed distribution of net realized capital gains and retain the net realized capital gains, we would have to establish appropriate reserves for taxes that we would have to pay on behalf of shareholders. It is possible that establishing reserves for taxes could have a material adverse effect on the value of our common stock. See "Taxation."
23
We operate in a heavily regulated environment, and changes to, or non-compliance with, regulations and laws could harm our business.
We are subject to substantive SEC regulations as a business development company. Securities and tax laws and regulations governing our activities may change in ways adverse to our and our shareholders’ interests, and interpretations of these laws and regulations may change with unpredictable consequences. Any change in the laws or regulations that govern our business could have an adverse impact on us or on our operations. Changing laws, regulations and standards relating to corporate governance, valuation and public disclosure, including the Sarbanes-Oxley Act of 2002, new SEC regulations, new federal accounting standards and Nasdaq Global Market rules, are creating additional expense and uncertainty for publicly held companies in general, and for business development companies in particular. These new or changed laws, regulations and standards are subject to varying interpretations in many cases because of their lack of specificity, and as a result, their application in practice may evolve over time, which may well result in continuing uncertainty regarding compliance matters and higher costs necessitated by ongoing revisions to disclosure and governance practices.
We are committed to maintaining high standards of corporate governance and public disclosure. As a result, our efforts to comply with evolving laws, regulations and standards have and will continue to result in increased general and administrative expenses and a diversion of management time and attention from revenue-generating activities to compliance activities. In particular, our efforts to comply with Section 404 of the Sarbanes-Oxley Act of 2002 and the related regulations regarding our required assessment of our internal controls over financial reporting and our external auditors' audit of that assessment has required the commitment of significant financial and managerial resources.
Moreover, even though business development companies are not mutual funds, they must comply with several of the regulations applicable to mutual funds, such as the requirement for the implementation of a comprehensive compliance program and the appointment of a Chief Compliance Officer. Further, our Board members, Chief Executive Officer and Chief Financial Officer could face an increased risk of personal liability in connection with the performance of their duties. As a result, we may have difficulty attracting and retaining qualified board members and executive officers, which could harm our business, and we have significantly increased both our coverage under, and the related expense for, directors' and officers' liability insurance. If our efforts to comply with new or changed laws, regulations and standards differ from the activities intended by regulatory or governing bodies, our reputation may be harmed. Also, as business and financial practices continue to evolve, they may render the regulations under which we operate less appropriate and more burdensome than they were when originally imposed. This increased regulatory burden is causing us to incur significant additional expenses and is time consuming for our management, which could have a material adverse effect on our financial performance.
Market prices of our common stock will continue to be volatile.
We expect that the market price of our common stock price will continue to be volatile. The price of the common stock may be higher or lower than the price you pay for your shares, depending on many factors, some of which are beyond our control and may not be directly related to our operating performance. These factors include the following:
stock market and capital markets conditions;
internal developments in our Company with respect to our personnel, financial condition and compliance with all applicable regulations;
announcements regarding any of our portfolio companies;
announcements regarding developments in the nanotechnology field in general;
environmental and health concerns regarding nanotechnology, whether real or perceptual;
announcements regarding government funding and initiatives related to the development of nanotechnology;
general economic conditions and trends; and/or
departures of key personnel.
We will not have control over many of these factors, but expect that our stock price may be influenced by them. As a result, our stock price may be volatile, and you may lose all or part of your investment.
Quarterly results fluctuate and are not indicative of future quarterly performance.
Our quarterly operating results fluctuate as a result of a number of factors. These factors include, among others, variations in and the timing of the recognition of realized and unrealized gains or losses, the degree to which we and our portfolio companies encounter competition in our markets and general economic and capital markets conditions. As a result of these factors, results for any one quarter should not be relied upon as being indicative of performance in future quarters.
To the extent that we do not realize income or choose not to retain after-tax realized capital gains, we will have a greater need for additional capital to fund our investments and operating expenses.
As a RIC, we must annually distribute at least 90 percent of our investment company taxable income as a dividend and may either distribute or retain our realized net capital gains from investments. As a result, these earnings may not be available to fund investments. If we fail to generate net realized capital gains or to obtain funds from outside sources, it would have a material adverse effect on our financial condition and results of operations as well as our ability to make follow-on and new investments. Because of the structure and objectives of our business, we generally expect to experience net operating losses and rely on proceeds from sales of investments, rather than on investment income, to defray a significant portion of our operating expenses. These sales are unpredictable and may not occur. In addition, as a business development company, we are generally required to maintain a ratio of at least 200 percent of total assets to total borrowings and preferred stock, which may restrict our ability to borrow to fund these requirements. Lack of capital could curtail our investment activities or impair our working capital.
25
Investment in foreign securities could result in additional risks.
We may invest in foreign securities, and we currently have one investment in a foreign security. When we invest in securities of foreign issuers, we may be subject to risks not usually associated with owning securities of U.S. issuers. These risks can include fluctuations in foreign currencies, foreign currency exchange controls, social, political and economic instability, differences in securities regulation and trading, expropriation or nationalization of assets and foreign taxation issues. In addition, changes in government administrations or economic or monetary policies in the United States or abroad could result in appreciation or depreciation of our securities and could favorably or unfavorably affect our operations. It may also be more difficult to obtain and enforce a judgment against a foreign issuer. Any foreign investments made by us must be made in compliance with U.S. and foreign currency restrictions and tax laws restricting the amounts and types of foreign investments.
Although most of our investments are denominated in U.S. dollars, our investments that are denominated in a foreign currency are subject to the risk that the value of a particular currency may change in relation to the U.S. dollar, in which currency we maintain financial statements and valuations. Among the factors that may affect currency values are trade balances, the level of short-term interest rates, differences in relative values of similar assets in different currencies, long-term opportunities for investment and capital appreciation and political developments.
Investing in our stock is highly speculative and an investor could lose some or all of the amount invested.
Our investment objective and strategies result in a high degree of risk in our investments and may result in losses in the value of our investment portfolio. Our investments in portfolio companies are highly speculative and, therefore, an investor in our common stock may lose his or her entire investment. The value of our common stock may decline and may be affected by numerous market conditions, which could result in the loss of some or all of the amount invested in our common stock. The securities markets frequently experience extreme price and volume fluctuations that affect market prices for securities of companies in general, and technology and very small capitalization companies in particular. Because of our focus on the technology and very small capitalization sectors, and because we are a very small capitalization company ourselves, our stock price is especially likely to be affected by these market conditions. General economic conditions, and general conditions in tiny technology in general and nanotechnology in particular and in the semi-conductor and information technology, life sciences, materials science and other high technology industries, may also affect the price of our common stock.
26
Our shares might trade at discounts from net asset value or at premiums that are unsustainable over the long term.
Shares of business development companies like us may, during some periods, trade at prices higher than their net asset value and during other periods, as frequently occurs with closed-end investment companies, trade at prices lower than their net asset value. The possibility that our shares will trade at discounts from net asset value or at premiums that are unsustainable over the long term are risks separate and distinct from the risk that our net asset value per share will decrease. The risk of purchasing shares of a business development company that might trade at a discount or unsustainable premium is more pronounced for investors who wish to sell their shares in a relatively short period of time because, for those investors, realization of a gain or loss on their investments is likely to be more dependent upon changes in premium or discount levels than upon increases or decreases in net asset value per share. Our common stock may not trade at a price higher than or equal to net asset value per share. On December 31, 2006,2007, our stock closed at $12.09$8.79 per share, a premium of $6.67$2.86 over our net asset value per share of $5.42$5.93 as of December 31, 2006.2007.
The Board of Directors intends to grant stock options to our employees pursuant to the Company's Equity Incentive Plan. When exercised, these options may have a dilutive effect on existing shareholders.
In accordance with the Company’s Equity Incentive Plan, the Company’s Compensation Committee may grant options from time to time for up to 20 percent of the total shares of stock issued and outstanding. When options are exercised, net asset value per share will decrease if the net asset value per share at the time of exercise is higher than the exercise price. Alternatively, net asset value per share will increase if the net asset value per share at the time of exercise is lower than the exercise price. Therefore, existing shareholders will be diluted if the net asset value per share at the time of exercise is higher than the exercise price of the options. Even though issuance of shares pursuant to exercises of options increases the Company's capital, and regardless of whether such issuance results in increases or decreases in net asset value per share, such issuance results in existing shareholders owning a smaller percentage of the shares outstanding.
You have no right to require us to repurchase your shares.
You do not have the right to require us to repurchase your shares of common stock.
Item 1B. Unresolved Staff CommentsComments.
None.
Item 2. PropertiesProperties.
The Company maintains its offices at 111 West 57th Street, New York, New York 10019, where it leases approximately 3,540 square feet of office space pursuant to lease agreements expiring in 2010. (See "Note 89 of Notes to Consolidated Financial Statements and Schedules"Statements" contained in Item"Item 8. "ConsolidatedConsolidated Financial Statements and Supplementary Data.")
Item 3. Legal ProceedingsProceedings.
The Company is not a party to any legal proceedings.
Item 4. Submission of Matters to a Vote of Security HoldersHolders.
None.
28
PART II
| Item 5. | Market for Registrant's Common Equity, Related Stockholder Matters and Issuer Purchases of Equity Securities. |
Market Information
Our common stock is traded on the Nasdaq Global Market under the symbol "TINY." The following table sets forth the range of the high and low sales price of the Company's shares during each quarter of the last two fiscal years, as reported by Nasdaq Global Market. The quarterly stock prices quoted represent interdealer quotations and do not include markups, markdowns or commissions.
2007 Quarter Ending | Low | High | |||||
| March 31 | $ | 11.00 | $ | 13.58 | |||
| June 30 | $ | 11.01 | $ | 14.32 | |||
| September 30 | $ | 9.51 | $ | 11.79 | |||
| December 31 | $ | 8.00 | $ | 11.10 | |||
2006 Quarter Ending | Low | High | |||||
| March 31 | $ | 12.75 | $ | 16.10 | |||
| June 30 | $ | 9.57 | $ | 14.26 | |||
| September 30 | $ | 9.38 | $ | 12.99 | |||
| December 31 | $ | 11.80 | $ | 15.16 | |||
Shareholders
As of March 12, 2008, there were approximately 134 holders of record of the Company's common stock which, the Company has been informed, hold the Company's common stock for approximately 20,971 beneficial owners.
Dividends
We did not pay a cash dividend or declare a deemed dividend for 2007 or 2006. For more information about deemed dividends, please refer to the discussion under “Subchapter M Status.”
EQUITY COMPENSATION PLAN INFORMATION As of December 31, 2007 |
Number of securities to be issued upon exercise of out- standing options, warrants and rights | Weighted-average exercise price of outstanding options, warrants and rights | Number of securities remaining available for future issuance under equity compensation plans (excluding securities reflected in Column (a)) | ||||||||
Plan category | (a) | (b) | (c) | |||||||
| Equity compensation plans approved by security holders | 3,967,744 | $ | 10.54 | (1) | ||||||
| Equity compensation plans not approved by security holders | ||||||||||
| TOTAL | 3,967,744 | $ | 10.54 | (1) | ||||||
The Company did not sell any equity securities during 2007 that were not registered under the Securities Act of 1933.
Performance Graph
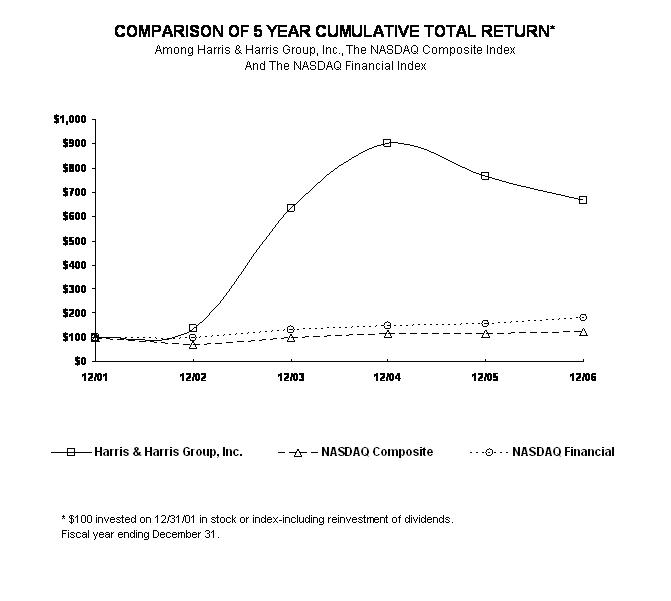
The graph below matches the cumulative five-year total return of holders of the Company's common stock with the cumulative total returns of the Nasdaq Composite index and the Nasdaq Financial index. The graph assumes that the value of the investment in the Company's common stock and in each of the indexes (including reinvestment of dividends) was $100 on December 31, 2002 and tracks it through December 31, 2007.
30

12/02 | 12/03 | 12/04 | 12/05 | 12/06 | 12/07 | ||||||||||||||
Harris & Harris Group, Inc. | 100.00 | 468.70 | 665.85 | 565.04 | 491.46 | 357.32 | |||||||||||||
NASDAQ Composite | 100.00 | 149.75 | 164.64 | 168.60 | 187.83 | 205.22 | |||||||||||||
NASDAQ Financial | 100.00 | 133.86 | 149.89 | 156.52 | 178.54 | 157.20 | |||||||||||||
The stock price performance included in this graph is not necessarily indicative of future stock price performance.
Source: Research Data Group, Inc.
Stock Transfer Agent
American Stock Transfer & Trust Company, 59 Maiden Lane, New York, New York 10038 (Telephone 800-937-5449, Attention: Mr. Joe Wolf) serves as transfer agent for our common stock. Certificates to be transferred should be mailed directly to the transfer agent, preferably by registered mail.
2006 Quarter Ending | Low | High | |||||
| March 31 | $ | 12.75 | $ | 16.10 | |||
| June 30 | $ | 9.57 | $ | 14.26 | |||
| September 30 | $ | 9.38 | $ | 12.99 | |||
| December 31 | $ | 11.80 | $ | 15.16 | |||
2005 Quarter Ending | Low | High | |||||
| March 31 | $ | 11.30 | $ | 16.80 | |||
| June 30 | $ | 10.01 | $ | 13.38 | |||
| September 30 | $ | 10.70 | $ | 13.85 | |||
| December 31 | $ | 10.15 | $ | 14.95 | |||
Number of securities to be issued upon exercise of outstanding options, warrants and rights | Weighted average exercise price of outstanding options, warrants and rights | Number of securities remaining available for future issuance | ||||||||
| Plan category | (a) | (b) | (c) | |||||||
Equity compensation plans approved by security holders | 3,699,611 | $ | 10.11 | 192,986 | ||||||
Equity compensation plans not approved by security holders | ||||||||||
TOTAL | 3,699,611 | $ | 10.11 | 192,986 | ||||||
Item 6. Selected Financial DataData.
The information below was derived from the audited Consolidated Financial Statements included in this report and in previous annual reports filed with the SEC. This information should be read in conjunction with those Consolidated Financial Statements and Supplementary Data and the notes thereto. These historical results are not necessarily indicative of the results to be expected in the future.
Financial Position as of December 31:
2006 | 2005 | 2004 | 2003 | 2002 | 2007 | 2006 | 2005 | 2004 | 2003 | |||||||||||||||||||||||
| Total assets | $ | 118,328,590 | $ | 132,938,120 | $ | 79,361,451 | $ | 44,115,128 | $ | 35,951,969 | $ | 142,893,332 | $ | 118,328,590 | $ | 132,938,120 | $ | 79,361,451 | $ | 44,115,128 | ||||||||||||
| Total liabilities | $ | 4,398,287 | $ | 14,950,378 | $ | 4,616,652 | $ | 3,432,390 | $ | 8,695,923 | $ | 4,529,988 | $ | 4,398,287 | $ | 14,950,378 | $ | 4,616,652 | $ | 3,432,390 | ||||||||||||
| Net assets | $ | 113,930,303 | $ | 117,987,742 | $ | 74,744,799 | $ | 40,682,738 | $ | 27,256,046 | $ | 138,363,344 | $ | 113,930,303 | $ | 117,987,742 | $ | 74,744,799 | $ | 40,682,738 | ||||||||||||
| Net asset value per outstanding share | $ | 5.42 | $ | 5.68 | $ | 4.33 | $ | 2.95 | $ | 2.37 | $ | 5.93 | $ | 5.42 | $ | 5.68 | $ | 4.33 | $ | 2.95 | ||||||||||||
| Cash dividends paid | $ | 0.00 | $ | 0.00 | $ | 0.00 | $ | 0.00 | $ | 0.00 | $ | 0.00 | $ | 0.00 | $ | 0.00 | $ | 0.00 | $ | 0.00 | ||||||||||||
| Cash dividends paid per outstanding share | $ | 0.00 | $ | 0.00 | $ | 0.00 | $ | 0.00 | $ | 0.00 | $ | 0.00 | $ | 0.00 | $ | 0.00 | $ | 0.00 | $ | 0.00 | ||||||||||||
| Shares outstanding, end of year | 21,015,017 | 20,756,345 | 17,248,845 | 13,798,845 | 11,498,845 | 23,314,573 | 21,015,017 | 20,756,345 | 17,248,845 | 13,798,845 | ||||||||||||||||||||||
Operating Data for year endedYear Ended December 31:
2006 | 2005 | 2004 | 2003 | 2002 | ||||||||||||
| Total investment income | $ | 3,028,761 | $ | 1,540,862 | $ | 637,562 | $ | 167,785 | $ | 253,461 | ||||||
Total expenses1 | $ | 10,641,696 | $ | 7,006,623 | $ | 4,046,341 | $ | 2,731,527 | $ | 2,124,549 | ||||||
| Net operating (loss) income | $ | (7,612,935 | ) | $ | (5,465,761 | ) | $ | (3,408,779 | ) | $ | (2,563,742 | ) | $ | (1,871,088 | ) | |
Total tax (benefit) expense2 | $ | (227,355 | ) | $ | 8,288,778 | $ | 650,617 | $ | 13,761 | $ | 199,309 | |||||
| Net realized income (loss) from | ||||||||||||||||
| investments | $ | 258,693 | $ | 14,208,789 | $ | 858,503 | $ | (984,925 | ) | $ | 2,390,302 | |||||
| Net (increase) decrease in unrealized | ||||||||||||||||
| depreciation on investments | $ | (4,418,870 | ) | $ | (2,026,652 | ) | $ | 484,162 | $ | 343,397 | $ | (3,241,408 | ) | |||
| Net (decrease) increase in net assets | ||||||||||||||||
| resulting from operations | $ | (11,773,112 | ) | $ | 6,716,376 | $ | (2,066,114 | ) | $ | (3,205,270 | ) | $ | (2,722,194 | ) | ||
| (Decrease) increase in net assets | ||||||||||||||||
| resulting from operations per | ||||||||||||||||
| average outstanding share | $ | (0.57 | ) | $ | 0.36 | $ | (0.13 | ) | $ | (0.28 | ) | $ | (0.27 | ) | ||
2007 | 2006 | 2005 | 2004 | 2003 | ||||||||||||
| Total investment income | $ | 2,705,636 | $ | 3,028,761 | $ | 1,540,862 | $ | 637,562 | $ | 167,785 | ||||||
Total expenses1 | $ | 14,533,179 | $ | 10,641,696 | $ | 7,006,623 | $ | 4,046,341 | $ | 2,731,527 | ||||||
| Net operating (loss) income | $ | (11,827,543 | ) | $ | (7,612,935 | ) | $ | (5,465,761 | ) | $ | (3,408,779 | ) | $ | (2,563,742 | ) | |
Total tax (benefit) expense2 | $ | 87,975 | $ | (227,355 | ) | $ | 8,288,778 | $ | 650,617 | $ | 13,761 | |||||
| Net realized income (loss) from investments | $ | 30,162 | $ | 258,693 | $ | 14,208,789 | $ | 858,503 | $ | (984,925 | ) | |||||
| Net decrease (increase) in unrealized depreciation on investments | $ | 5,080,936 | $ | (4,418,870 | ) | $ | (2,026,652 | ) | $ | 484,162 | $ | 343,397 | ||||
| Net (decrease) increase in net assets resulting from operations | $ | (6,716,445 | ) | $ | (11,773,112 | ) | $ | 6,716,376 | $ | (2,066,114 | ) | $ | (3,205,270 | ) | ||
| (Decrease) increase in net assets resulting from operations per average outstanding share | $ | (0.30 | ) | $ | (0.57 | ) | $ | 0.36 | $ | (0.13 | ) | $ | (0.28 | ) | ||
1Included in total expenses are the following profit-sharing expenses/(reversals): $50,875 in 2006; $1,796,264 in 2005; $311,594 in 2004; and ($163,049) in 2002. Also included in total expenses is non-cash, stock-based, compensation expense of $8,050,807 in 2007 and $5,038,956 in 2006. Also included in total expenses are the following profit-sharing expenses: $0 in 2007; $50,875 in 2006; $1,796,264 in 2005; and $311,594 in 2004. There was no stock-based compensation expense in 2005, 2004, 2003 or 2002.2003.
2Included in total tax expense are the following taxes paid by the Company on behalf of shareholders: $0 in each of 2007 and 2006; $8,122,367 in 2005; $0 in each of 2004 2003, and 2002.2003.
| Item 7. | Management's Discussion and Analysis of Financial Condition and Results of Operations. |
The information contained in this section should be read in conjunction with the Company's 20062007 Consolidated Financial Statements and notes thereto.
Forward-Looking Statements
The information contained herein contains certain forward-looking statements. These statements include the plansmay contain "forward-looking statements" based on our current expectations, assumptions and objectives of management for future operationsestimates about us and financial objectives, portfolio growth and availability of funds.our industry. These forward-looking statements involve risks and uncertainties. Words such as "believe," "anticipate," "estimate," "expect," "intend," "plan," "will," "may," "might," "could," "continue" and other similar expressions identify forward-looking statements. In addition, any statements that refer to expectations, projections or other characterizations of future events or circumstances are subject to the inherent uncertainties in predicting future results and conditions. Certain factors that could causeforward-looking statements. Our actual results and conditions tocould differ materially from those projectedanticipated in these forward-looking statements are set forth herein. Other factors that could cause actual results to differ materially include the uncertainties of economic, competitive and market conditions, and future business decisions, all of which are difficult or impossible to predict accurately and many of which are beyond our control. Although we believe that the assumptions underlying the forward-looking statements included herein are reasonable, anyas a result of several factors more fully described in "Risk Factors" and elsewhere in this Form 10-K. The forward-looking statements made in this Form 10-K relate only to events as of the assumptions could be inaccurate and, therefore, there can bedate on which the statements are made. We undertake no assurance that theobligation to update publicly any forward-looking statements includedfor any reason, even if new information becomes available or incorporated by reference herein will prove to be accurate. Therefore,other events occur in the inclusion of such information should not be regarded as a representation by us or any other person that our plans will be achieved.future.
Background and Overview
We incorporated under the laws of the state of New York in August 1981. In 1983, we completed an initial public offering and invested $406,936 in Otisville BioTech, Inc., which also completed an initial public offering later that year. In 1984, Charles E. Harris purchased a controlling interest in us which also made him the control person of Otisville. We then divested our other assets and became a financial services company, with the investment in Otisville as the initial focus of our business activity.
In 1992, we registered as an investment company under the 1940 Act, commencing operations as a closed-end, non-diversified investment company. In 1995, we elected to become a business development company subject to the provisions of Sections 55 through 65 of the 1940 Act.
Throughout our corporate history, we have made early stage venture capital investments in a variety of industries. We define venture capital investments as investments in start-up firms and small businesses with exceptional growth potential. We have invested a substantial portion of our assets in venture capital investments of private, development stage or start-up companies. These private businesses tend to be thinly capitalized, unproven, small companies that lack management depth, have little or no history of operations and are developing unproven technologies. At December 31, 2007, $78,110,384, or 56.5 percent, of our net assets at fair value consisted of private venture capital investments, net of unrealized depreciation of $4,567,144. At December 31, 2006, $53,667,831, or 47.1 percent, of our net assets at fair value consisted of private venture capital investments, net of unrealized depreciation of $8,450,969. At December 31, 2005, $33,187,333, or 28.1 percent, of our net assets at fair value consisted of private venture capital investments, net of unrealized depreciation of $4,519,009.
Since our investment in Otisville in 1983 through December 31, 2006,2007, we have made a total of 7380 venture capital investments, including four private placement investments in securities of publicly traded companies. We have sold 4445 of these 7380 investments, realizing total proceeds of $143,614,382$143,737,906 on our invested capital of $51,229,202. As measured from first dollar in to last dollar out, the average and median holding periods for these 4445 investments were 3.633.69 years and 3.193.11 years, respectively. As measured by the 149150 separate rounds of investment within these 4445 investments, the average and median holding periods for the 149150 separate rounds of investment were 2.842.87 years and 2.442.49 years, respectively.
In 1994, we made our first tiny technology investment. From August 2001 through December 31, 2006,2007, all 3138 of our initial investments have been in tiny technology. From August 2001 through December 31, 2006,2007, we have invested a total (before any subsequent write-ups, write-downs or dispositions) of $66,040,089$86,635,250 in tiny technology.


34
The following is a summary of our initial and follow-on investments in tiny technology from 2001 to the present. We consider a "round led" to be a round where we were the new investor or the leader of a set of new investors in an investee company. Typically, but not always, the lead investor negotiates the price and terms of a deal with the investee company.
2001 | 2002 | 2003 | 2004 | 2005 | 2006 | 2001 | 2002 | 2003 | 2004 | 2005 | 2006 | 2007 | ||||||||||||||||
| Total Incremental Investments | $489,999 | $6,240,118 | $3,812,600 | $14,837,846 | $16,251,339 | $24,408,187 | $ | 489,999 | $ | 6,240,118 | $ | 3,812,600 | $ | 14,837,846 | $ | 16,251,339 | $ | 24,408,187 | $ | 20,595,161 | ||||||||
| No. of New Investments | 1 | 7 | 5 | 8 | 4 | 6 | 1 | 7 | 5 | 8 | 4 | 6 | 7 | |||||||||||||||
| No. of Follow-On Investment Rounds | 0 | 1 | 5 | 21 | 13 | 14 | 0 | 1 | 5 | 21 | 13 | 14 | 20 | |||||||||||||||
| No. of Rounds Led | 0 | 1 | 0 | 2 | 0 | 7 | 0 | 1 | 0 | 2 | 0 | 7 | 3 | |||||||||||||||
| Average Dollar Amount - Initial | $489,999 | $784,303 | $437,156 | $911,625 | $1,575,000 | $2,383,424 | ||||||||||||||||||||||
Average Dollar Amount – Initial | $ | 489,999 | $ | 784,303 | $ | 437,156 | $ | 911,625 | $ | 1,575,000 | $ | 2,383,424 | $ | 1,086,441 | ||||||||||||||
| Average Dollar Amount - Follow-On | N/A | $750,000 | $325,364 | $359,278 | $765,488 | $721,974 | ||||||||||||||||||||||
| Average Dollar Amount – Follow- On | N/A | $ | 750,000 | $ | 325,364 | $ | 359,278 | $ | 765,488 | $ | 721,974 | $ | 649,504 | |||||||||||||||
We value our private venture capital investments each quarter as determined in good faith by our Valuation Committee, a committee of independent directors, within guidelines established by our Board of Directors in accordance with the 1940 Act. (See "Footnote to Consolidated Schedule of Investments" contained in "Consolidated"Item 8. Consolidated Financial Statements.Statements and Supplementary Data.")
In the years 2001 2002, 2003, 2004, 2005 and 2006,through 2007, the Company recorded the following gross write-ups in privately held securities as a percentage of net assets at the beginning of the year ("BOY"), gross write-downs in privately held securities as a percentage of net assets at the beginning of the year:year, and net write-ups/(write-downs) in privately held securities as a percentage of net assets at the beginning of the year.
2001 | 2002 | 2003 | 2004 | 2005 | 2006 | ||||||||||||||
| Net Asset Value, Beginning of Year | 31,833,475 | 24,334,770 | 27,256,046 | 40,682,738 | 74,744,799 | 117,987,742 | |||||||||||||
| Gross Write-Downs During Year | (2,532,730 | ) | (5,400,005 | ) | (1,256,102 | ) | (5,711,229 | ) | (3,450,236 | ) | (4,211,323 | ) | |||||||
| Gross Write-Downs as a Percentage of Net Asset Value | -7.96 | % | -22.19 | % | -4.61 | % | -14.04 | % | -4.62 | % | -3.57 | % | |||||||
31-Dec-00 | 31-Mar-01 | 30-June-01 | 30-Sep-01 | 31-Dec-01 | ||||||||||||
| NAV per Share | 3.51 | 3.09 | 3.29 | 2.92 | 2.75 | |||||||||||
| $ Change | (0.42 | ) | 0.20 | (0.37 | ) | (0.17 | ) | |||||||||
| % Change | -11.97 | % | 6.47 | % | -11.25 | % | -5.82 | % | ||||||||
31-Mar-02 | 30-June-02 | 30-Sep-02(1 | ) | 31-Dec-02 | ||||||||||||
| NAV per Share | 2.63 | 2.68 | 2.61 | 2.37 | ||||||||||||
| $ Change | (0.12 | ) | 0.05 | (0.07 | ) | (0.24 | ) | |||||||||
| % Change | -4.36 | % | 1.90 | % | -2.61 | % | -9.20 | % | ||||||||
31-Mar-03 | 30-June-03 | 30-Sep-03 | 31-Dec-03(1 | ) | ||||||||||||
| NAV per Share | 2.26 | 2.22 | 2.11 | 2.95 | ||||||||||||
| $ Change | (0.11 | ) | (0.04 | ) | (0.11 | ) | 0.84 | |||||||||
| % Change | -4.64 | % | -1.77 | % | -4.95 | % | 39.81 | % | ||||||||
31-Mar-04 | 30-June-04 | 30-Sep-04(1 | ) | 31-Dec-04 | ||||||||||||
| NAV per Share | 3.01 | 2.85 | 4.44 | 4.33 | ||||||||||||
| $ Change | 0.06 | (0.16 | ) | 1.59 | (0.11 | ) | ||||||||||
| % Change | 2.03 | % | -5.32 | % | 55.79 | % | -2.48 | % | ||||||||
31-Mar-05 | 30-June-05 | 30-Sep-05(1 | ) | 31-Dec-05 | ||||||||||||
| NAV per Share | 4.20 | 4.61 | 5.94 | 5.68 | ||||||||||||
| $ Change | (0.13 | ) | 0.41 | 1.33 | (0.26 | ) | ||||||||||
| % Change | -3.00 | % | 9.76 | % | 28.85 | % | -4.38 | % | ||||||||
31-Mar-06 | 30-June-06 | 30-Sep-06 | 31-Dec-06 | |||||||||||||
| NAV per Share | 5.6 | 5.54 | 5.54 | 5.42 | ||||||||||||
| $ Change | (0.08 | ) | (0.06 | ) | 0.00 | (0.12 | ) | |||||||||
| % Change | -1.41 | % | -1.07 | % | 0.00 | % | -2.17 | % | ||||||||
2001 | 2002 | 2003 | 2004 | 2005 | 2006 | 2007 | ||||||||||||||||
| Net Asset Value, BOY | $ | 31,833,475 | $ | 24,334,770 | $ | 27,256,046 | $ | 40,682,738 | $ | 74,744,799 | $ | 117,987,742 | $ | 113,930,303 | ||||||||
| Gross Write-Downs During Year | $ | (2,532,730 | ) | $ | (5,400,005 | ) | $ | (1,256,102 | ) | $ | (5,711,229 | ) | $ | (3,450,236 | ) | $ | (4,211,323 | ) | $ | (7,810,794 | ) | |
| Gross Write-Ups During Year | $ | 1,528,866 | $ | 285 | $ | 847,578 | $ | 6,288,397 | $ | 23,485,176 | $ | 279,363 | $ | 11,694,618 | ||||||||
| Gross Write-Downs as a Percentage of Net Asset Value, BOY | -7.96 | % | -22.19 | % | -4.61 | % | -14.04 | % | -4.62 | % | -3.57 | % | -6.86 | % | ||||||||
| Gross Write-Ups as a Percentage of Net Asset Value, BOY | 4.80 | % | 0 | % | 3.11 | % | 15.46 | % | 31.42 | % | 0.24 | % | 10.26 | % | ||||||||
| Net Write-Downs/Write-Ups as a Percentage of Net Asset Value, BOY | -3.15 | % | -22.19 | % | -1.49 | % | 1.42 | % | 26.8 | % | -3.33 | % | 3.40 | % | ||||||||
We have discretion in the investment of our capital. However, we invest primarily in illiquid equity securities of private companies. Generally, these investments take the form of preferred stock, are subject to restrictions on resale and have no established trading market. Our principal objective is to achieve long-term capital appreciation. Therefore, a significant portion of our investment portfolio provides little or no income in the form of dividends or interest. We earn interest income from fixed-income securities, including U.S. government and agency securities. The amount of interest income we earn varies with the average balance of our fixed-income portfolio and the average yield on this portfolio. Interest income is secondary to capital gains and losses in our results of operations.
We present the financial results of our operations utilizing accounting principles generally accepted in the United States for investment companies. On this basis, the principal measure of our financial performance during any period is the net increase/(decrease) in our net assets resulting from our operating activities, which is the sum of the following three elements:
Net Operating Income / (Loss) - the difference between our income from interest, dividends, and fees and our operating expenses.
36
Net Realized Income / (Loss) on Investments - the difference between the net proceeds of sales of portfolio securities and their stated cost, plus income from interests in limited liability companies.
Net Increase / (Decrease) in Unrealized Appreciation or Depreciation on Investments - the net unrealized change in the value of our investment portfolio.
Owing to the structure and objectives of our business, we generally expect to experience net operating losses and seek to generate increases in our net assets from operations through the long term appreciation of our venture capital investments. We have relied, and continue to rely, on proceeds from sales of investments, rather than on investment income, to defray a significant portion of our operating expenses. Because such sales are unpredictable, we attempt to maintain adequate working capital to provide for fiscal periods when there are no such sales.
Results of Operations
Years Ended December 31, 2007, 2006, 2005, and 20042005
During the three years ended December 31, 2007, 2006, 2005, and 2004,2005, we had net (decreases) increases in net assets resulting from operations of $(6,716,445), $(11,773,112), $6,716,376 and ($2,066,114),$6,716,376, respectively.
Investment Income and Expenses:
During the three years ended December 31, 2007, 2006, 2005, and 2004,2005, we had net operating losses of $11,827,543, $7,612,935, $5,465,761 and $3,408,779,$5,465,761, respectively. The variation in these results is primarily owing to increasesthe changes in investment income offset by increases inand operating expenses, including non-cash expense of $8,050,807 in 2007 and $5,038,956 in 2006 associated with the granting of stock options. During the three years ended December 31, 2007, 2006, 2005 and 2004,2005, total investment income was $2,705,636, $3,028,761, $1,540,862 and $637,562,$1,540,862, respectively. During the three years ended December 31, 2007, 2006, 2005 and 2004,2005, total operating expenses were $14,533,179, $10,641,696, $7,006,623 and $4,046,341,$7,006,623, respectively.
During 2007, as compared with 2006, investment income decreased from $3,028,761 to $2,705,636, reflecting a decrease in our average holdings of U.S. government and agency securities throughout the period. During the twelve months ended December 31, 2007, our average holdings of such securities were $62,184,565, as compared with $69,506,136 at December 31, 2006.
Operating expenses, including non-cash, stock-based compensation expenses, were $14,533,179 and $10,641,696 for the twelve months ended December 31, 2007, and December 31, 2006, respectively. The increase in operating expenses for the twelve months ended December 31, 2007, as compared to the twelve months ended December 31, 2006, was primarily owing to increases in salaries, benefits and stock-based compensation expenses and to increases in administration and operations expense, professional fees and directors' fees and expenses. Salaries, benefits and non-cash, stock-based compensation expense increased by $3,502,053, or 44.1 percent, through December 31, 2007, as compared to December 31, 2006, primarily as a result of an increase in non-cash expense of $3,011,851 through December 31, 2007, associated with the Harris & Harris Group, Inc. 2006 Equity Incentive Plan (the "Stock Plan"). While the non-cash, stock-based, compensation expense for the Stock Plan increased our operating expenses by $8,050,807, this increase was offset by a corresponding increase to our additional paid-in capital, resulting in no net impact to our net asset value. The non-cash, stock-based, compensation expense and corresponding increase to our additional paid-in capital may increase in future quarters. Salaries and benefits also increased for the twelve months ended December 31, 2007, owing to an increase in our headcount as compared with that of the same period in 2006. At December 31, 2007, we had 13 full-time employees, as compared with 10 full-time employees and one part-time employee at December 31, 2006. Administration and operations expense increased by $182,573, or 14.6 percent, for the twelve months ended December 31, 2007, as compared with the same period in 2006, owing to an increase in Nasdaq Global Market fees related to the increase in our number of outstanding shares and increased office-related and travel expenses related to the increase in headcount. Professional fees increased by $165,083, or 22.4 percent, primarily as a result of an increase in legal fees, an increase in audit fees and corporate consulting costs for the audit of our compliance program. Directors' fees and expenses increased by $94,310, or 27.7 percent, primarily as a result of additional meetings held in the period ended December 31, 2007, as compared with the period ended December 31, 2006, as well as an increase in the monthly retainers paid to committee chairs and to the Lead Independent Director.
During 2006, investment income increased, owing toreflecting an increase in our average holdings of U.S. government and agency securities, as our average holdings increased from $51,120,727$50,620,881 at December 31, 2005, to $67,277,409$69,506,136 at December 31, 2006, and as a result of an increase in interest rates during the year. During 2005, investment income increased, owing toreflecting an increase in our income on U.S. government and agency securities, as our holdings increased from $44,622,722 at December 31, 2004 to $96,250,864 at December 31, 2005, and as a result of an increase in interest rates during the year.
The increase in operating expenses for the year ended December 31, 2006, was primarily owing to increases in salaries, benefits and stock-based compensation expense, and directors' fees and expenses, offset by decreases in administrative and operations expenses, profit-sharing expense and professional fees. Salaries, benefits and stock-based compensation expense increased by $5,474,243, or 222.6 percent, for the year ended December 31, 2006, as compared with December 31, 2005, primarily as a result of non-cash expense of $5,038,956 associated with the Harris & Harris Group, Inc. 2006 Equity IncentiveStock Plan (the "Stock Plan") adopted during the second quarter of 2006 and secondarily as a result of an increase in the number of full-time employees. The increase in salaries, benefits and stock-based compensation expense reflects expenses associated with ten full-time employees and one part-time employee during the year ended December 31, 2006, as compared with an average of nine full-time employees during the year ended December 31, 2005. Salaries, benefits and stock-based compensation include $5,038,956 of non-cash expense associated with the Stock Plan, versus no such charge in 2005. Directors' fees and expenses increased by $31,876, or 10.3 percent, as a result of additional meetings held in 2006 related to the adoption of the Stock Plan. Administrative and operations expense decreased by $69,274, or 5.3 percent, primarily as a result of a decrease in our directors' and officers' liability insurance expense and decreases in the cost of proxy-related expenses. Profit-sharing expense for the year ended December 31, 2006, was $50,875, as compared with $1,796,264 for December 31, 2005, owing to the termination of the profit-sharing plan effective May 4, 2006. We recorded $50,875 of profit-sharing expense toward the remainder of the 2005 profit-sharing payment in the year ended December 31, 2006, because of updated estimates of our ultimate tax liability for 2005. Professional fees decreased by $92,234, or 11.1 percent, for the year ended December 31, 2006, as compared with December 31, 2005. Professional fees were lower for the year ended December 31, 2006, as compared with December 31, 2005, primarily as a result of the elimination of consulting costs incurred for a temporary Senior Controller in 2005 and the reduction of some of our Sarbanes-Oxley-related compliance costs incurred in 2005.
38
The increase in operating expenses during 2005 was primarily owing to increases in the profit-sharing provision, salaries and benefits, professional fees, administration and operations, rent expense and Directors' fees and expenses. Profit-sharing expense for 2005 was $1,796,264, an increase of $1,484,670 as compared with 2004. Profit-sharing expense increased primarily as a result of the gains realized on the sale of NeuroMetrix, Inc., offset by the taxes payable by the Company on the deemed dividend and taxes payable on Built-In Gains. The profit-sharing expense iswas also impacted by the Company's decision to retain its net realized long-term capital gains for reinvestment for growth, rather than distribute them as a cash dividend. When the Company chooses to retain its net realized long-term capital gains, it declares a deemed dividend and pays taxes on behalf of shareholders. Conversely, when the Company distributes its net realized long-term capital gains as a cash dividend, the shareholders pay all of the taxes. The taxes payable by the Company on behalf of shareholders reduce the amount of profit against which the profit-sharing payable to employees is calculated. Had the Company chosen to distribute its net realized long-term capital gains as a cash dividend, the provision for employee profit sharing would have been $3,420,737 for 2005, rather than the actual provision for employee profit sharing of $1,796,264 for 2005.
For the year ended December 31, 2005, as compared with 2004, salaries and benefits increased by $530,945, or 27.5 percent, primarily as a result of the addition of three employees. Professional fees increased by $162,751, or 24.4 percent, reflecting in part the expenses associated with ongoing compliance with the Sarbanes-Oxley Act of 2002. Administration and operations increased by $600,824, or 83.6 percent, primarily as the result of increases in travel expenses associated with additional investments in portfolio companies, increases in expenses related to the preparation and distribution of the annual and quarterly reports and proxy statement owing to the increased number of shareholders, and an increase in the premium expense for director and officer liability insurance. The premium expense for director and officer liability insurance increased by $339,810 to $512,038 in 2005, and the premium expense for 2006 is estimated to be $514,650. Rent expense increased by $60,148 or 39.7 percent, owing primarily to the leasing of additional office space in California and New York. Directors' fees and expenses in 2005 increased by $99,664 or 47.6 percent as a result of an increase in the fees paid to the directors for monthly retainer and meeting attendance.
Realized Income and Losses from Investments:on Investments:
During the years ended December 31, 2007, 2006, 2005, and 2004,2005, we had net realized income from investments of $30,162, $258,693, $14,208,789 and $858,503,$14,208,789, respectively. The variation in these results is primarily owing to variations in gross realized income from investments and income taxes in each of the three years. For the years ended December 31, 2007, 2006, 2005 and 2004,2005, realized income from investments, before taxes, was $118,137, $31,338, $23,862,037 and $813,994,$23,862,037, respectively. Income tax expense (benefit) expense for the years ended December 31, 2007, 2006, and 2005 and 2004 was $87,975, $(227,355), and $9,653,248, and ($44,509).respectively.
During the year ended December 31, 2007, we realized net gains of $118,137, consisting primarily of proceeds received from the sale of our interest in AlphaSimplex Group, LLC, and income from our investment in Exponential Business Development Company. During the year ended December 31, 2007, we recognized tax expense of $87,975, consisting of $74,454 of interest and penalties related to our 2005 tax returns and $13,521 in current year expense.
39
During the year ended December 31, 2006, we realized net gains of $31,338, consisting primarily of proceeds received from the liquidation of Optiva, Inc., proceeds received from Exponential Business Development Company, and net losses realized on our investment in AlphaSimplex Group, LLC. During 2005, we deemed the securities we held in Optiva, Inc., worthless and recorded the proceeds received and due to us on the liquidation of our bridge notes, realizing a loss of $1,619,245. At December 31, 2005, we recorded a $75,000 receivable for estimated proceeds from the final payment on the Optiva, Inc., bridge notes. During the first quarter of 2006, we received payment of $95,688 from these bridge notes, resulting in the realized gain of $20,688 on Optiva, Inc. During the year ended December 31, 2006, we realized tax benefits of $227, 355 for 2005 taxes that havehad been refunded.
During the year ended December 31, 2005, our realized income from investments before taxes of $23,862,037 consisted primarily of a realized gain of $30,179,762 from the sale of our investment in NeuroMetrix, Inc., offset by realized losses of $1,358,286, $2,093,968, $1,091,209, and $1,619,245, from the sale of our shares in Agile Materials & Technologies, Inc., Experion Systems, Inc., Nanotechnologies, Inc., and Optiva, Inc., respectively. Realized losses on U.S. government and agency securities totaled $422,383 for 2005. For the year ended December 31, 2005, our income tax expense on realized gains was $9,653,248, which includes $8,122,367 of taxes payable by the Company on behalf of shareholders in connection with the deemed dividend and $1,364,470 of taxes on Built-In Gains.
Net Unrealized Appreciation and Depreciation of Portfolio Securities:on Investments:
During the year ended December 31, 2006,2007, net unrealized depreciation on total investments increaseddecreased by $4,418,870. $5,080,936.
During the yearyears ended December 31, 2006, and 2005, net unrealized depreciation on total investments increased by $2,026,652. $4,418,870 and $2,026,652, respectively.
During the year ended December 31, 2004,2007, net unrealized depreciation on totalour venture capital investments decreased by $484,162.$3,883,825, or 46.0 percent, from $8,450,969 to $4,567,144, owing primarily to increases in the valuations of our investments in BridgeLux, Inc., of $3,699,529, Crystal IS, Inc., of $13,819, CSwitch, Inc., of $48,935, D-Wave Systems, Inc., of $202,408, Exponential Business Development Company of $2,026, Innovalight, Inc., of $3,218,216, Kovio, Inc., of $125,000, Mersana Therapeutics, Inc., of $118,378, NanoGram Corporation of $2,437,136, NeoPhotonics Corporation of $2,160, SiOnyx, Inc., of $899,566, Solazyme, Inc., of $612,291 and Zia Laser, Inc., of $6,329, offset by decreases in the valuations of our investments in Ancora Pharmaceuticals, Inc., of $100,561, Chlorogen, Inc., of $1,326,073, Evolved Nanomaterial Sciences, Inc., of $2,800,000, Kereos, Inc., of $1,340,257, Nanomix, Inc., of $459,772, NanoOpto Corporation of $1,369,885, Polatis, Inc., of $9,534 and Questech Corporation of $404,712. We also had an increase owing to foreign currency translation of $307,636 on our investment in D-Wave Systems, Inc. Unrealized depreciation on our U.S. government and agency securities portfolio decreased from $556,451 at December 31, 2006, to unrealized appreciation of $640,660 at December 31, 2007.
40
The net increase in unrealized depreciation on our venture capital investments in 2006 was owing primarily to decreases in the valuationvaluations of our investments in Nanomix, Inc., of $1,710,000, NanoOpto Corporation of $1,211,259, NeoPhotonics Corporation of $254,238, Polatis, Inc., of $145,228, SiOnyx, Inc., of $679,950 and Zia Laser, Inc., of $172,500, and an increaseto increases in the valuations of our investments in Crystal IS of $19,735 and Questech Corporation of $259,628. We also had a decrease, owing to foreign currency translation, of $34,103 on our investment in D-Wave Systems, Inc. Unrealized depreciation on our U.S. government and agency securities portfolio increased from $69,541 at December 31, 2005, to $556,451 at December 31, 2006.
The net increase in unrealized depreciation on our venture capital investments in 2005 was the result of the appreciation in value of $19,790,298 on investments held, offset by depreciation of $23,181,420 related to investments sold. The change in unrealized depreciation on investments held iswas owing to appreciation in our investment in NeuroMetrix, Inc., prior to the sale of our interest in it as well as to increases in the valuations of NanoGram Corporation, Nanosys, Inc., and Nantero, Inc., of $313,534, $870,113 and $813,771, respectively. These increases were offset by decreases in the valuations of AlphaSimplex Group LLC, CSwitch, Inc., Mersana Therapeutics, Inc., NanoOpto, Inc., Polatis, Inc., and Zia Laser, Inc., of $109,464, $500,000, $563,097, $529,997, $169,827, and $1,312,500 respectively. The change in unrealized depreciation on investments sold is owing to the realization of the gain on our investment in NeuroMetrix, Inc., offset by the realizationrealizations of losses on our investments in Agile Materials and Technologies, Inc., Experion Systems, Inc., Nanotechnologies, Inc., and Optiva, Inc.
Financial Condition
December 31, 2007
At December 31, 2007, our total assets and net assets were $142,893,332 and $138,363,344, respectively. Our net asset value ("NAV") per share at that date was $5.93, and our shares outstanding increased to 23,314,573 at December 31, 2007.
During the twelve months ended December 31, 2007, significant developments included an increase in the value of our venture capital investments of $24,442,553 and an increase in the value of our investment in U.S. government and agency obligations of $1,537,446. The increase in the value of our venture capital investments, from $53,667,831 at December 31, 2006, to $78,110,384 at December 31, 2007, resulted primarily from seven new and 20 follow-on investments and by a net increase of $3,883,825 in the net value of our venture capital investments. The increase in the value of our U.S. government and agency obligations, from $58,656,147 at December 31, 2006, to $60,193,593 at December 31, 2007, is primarily owing to the use of net proceeds of $12,993,168 received through a registered stock offering and proceeds received from stock option exercises of $10,105,511, offset by a payment of $80,236 for federal tax and interest and penalties, profit sharing payments of $261,661, net operating expenses and by new and follow-on venture capital investments totaling $20,595,161.
41
For the year ended December 31, 2007, the Company issued 999,556 shares and received proceeds of $10,105,511 as a result of employee stock option exercises.
The following table is a summary of additions to our portfolio of venture capital investments made during the twelve months ended December 31, 2007:
New Investments | Cost | |||
| Adesto Technologies Corporation | $ | 1,147,826 | ||
| Ancora Pharmaceuticals, Inc. | $ | 800,000 | ||
| BioVex Group, Inc. | $ | 2,500,000 | ||
| Ensemble Discovery Corporation | $ | 2,000,000 | ||
| Lifco, Inc. | $ | 946,528 | ||
| Phoenix Molecular Corporation | $ | 50,010 | ||
| Siluria Technologies, Inc. | $ | 160,723 | ||
Follow-on Investments | ||||
| BridgeLux, Inc. | $ | 350,877 | ||
| BridgeLux, Inc. | $ | 233,918 | ||
| BridgeLux, Inc. | $ | 916,928 | ||
| Cambrios Technologies Corporation | $ | 1,300,000 | ||
| Chlorogen, Inc. | $ | 7,042 | ||
| CSwitch, Inc. | $ | 32,624 | ||
| CSwitch, Inc. | $ | 529,852 | ||
| Innovalight, Inc. | $ | 1,993,568 | ||
| Kereos, Inc. | $ | 540,000 | ||
| Kovio, Inc. | $ | 1,000,000 | ||
| NanoGram Corporation | $ | 851,393 | ||
| Mersana Therapeutics, Inc. | $ | 500,000 | ||
| Nanomix, Inc. | $ | 680,240 | ||
| NanoOpto Corporation | $ | 268,654 | ||
| Nextreme Thermal Solutions, Inc. | $ | 750,000 | ||
| Polatis, Inc. | $ | 17,942 | ||
| Polatis, Inc. | $ | 13,454 | ||
| Polatis, Inc. | $ | 58,582 | ||
| SiOnyx, Inc. | $ | 2,445,000 | ||
| Solazyme, Inc. | $ | 500,000 | ||
| Total | $ | 20,595,161 |
The following tables summarize the fair values of our portfolios of venture capital investments and U.S. government and agency obligations, as compared with their cost, at December 31, 2007, and December 31, 2006:
42
December 31, | |||||||
2007 | 2006 | ||||||
| Venture capital investments, at cost | $ | 82,677,528 | $ | 62,118,800 | |||
Net unrealized depreciation (1) | 4,567,144 | 8,450,969 | |||||
Venture capital investments, at value | $ | 78,110,384 | $ | 53,667,831 | |||
December 31, | |||||||
2007 | 2006 | ||||||
| U.S. government and agency obligations, at cost | $ | 59,552,933 | $ | 59,212,598 | |||
Net unrealized appreciation (depreciation) (1) | 640,660 | (556,451 | ) | ||||
U.S. government and agency obligations, at value | $ | 60,193,593 | $ | 58,656,147 | |||
(1)At December 31, 2007, and December 31, 2006, the net accumulated unrealized depreciation on investments was $3,926,484 and $9,007,420, respectively.
The following table summarizes the fair value composition of our venture capital investment portfolio at December 31, 2007, and December 31, 2006.
December 31, | |||||||
Category | 2007 | 2006 | |||||
| Tiny Technology | 99.9 | % | 99.9 | % | |||
| Other Venture Capital Investments | 0.1 | % | 0.1 | % | |||
Total Venture Capital Investments | 100.0 | % | 100.0 | % | |||
December 31, 2006
At December 31, 2006, our total assets and net assets were $118,328,590 and $113,930,303, respectively. Our net asset value ("NAV")NAV per share at that date was $5.42, and our shares outstanding increased to 21,015,017 at December 31, 2006.
43
During the twelve months ended December 31, 2006, significant developments included an increase in the value of our venture capital investments of $20,480,498 and a decrease in the value of our investment in U.S. government and agency securities of $37,594,717. The increase in the value of our venture capital investments, from $33,187,333 at December 31, 2005, to $53,667,831 at December 31, 2006, resulted primarily from six new and 10 follow-on investments, partially offset by a net decrease of $3,927,689 in the net value of our previous venture capital investments. The decrease in the value of our U.S. government and agency securities, from $96,250,864 at December 31, 2005, to $58,656,147 at December 31, 2006, was primarily owing to the use of funds for investments totaling $24,408,187, tax payments of $9,425,922, profit-sharing payments of $1,897,072, an increase in unrealized losses of $486,910 and payment of net operating expenses.
During December 2006, the Company also issued stock and received proceeds upon the exercise of employee stock options. Through December 31, 2006, the Company issued 258,672 shares and received proceeds of $2,615,190 as a result of option exercises.
The Company's liabilities decreased from $14,950,378 at December 31, 2005, to $4,398,287 at December 31, 2006, primarily owing to the payment of the tax payable on behalf of shareholders of $8,122,367 in January 2006, the payment of $1,897,072 in profit sharing in March 2006 and the reversal of the accrual for federal and state taxes payable of $1,514,967 recorded at December 31, 2005.
The following table is a summary of additions to our portfolio of venture capital investments made during the twelve months ended December 31, 2006, by portfolio company:2006:
New Investments | Cost | |||
| D-Wave Systems, Inc. | $ | 1,750,547 | ||
| Evolved Nanomaterial Sciences, Inc. | 2,800,000 | |||
| Innovalight, Inc. | 2,500,000 | |||
| Metabolon, Inc. | 2,500,000 | |||
| SiOnyx, Inc. | 750,000 | |||
| Xradia, Inc. | 4,000,000 | |||
Follow-on Investments | ||||
| Chlorogen, Inc. | $ | 221,438 | ||
| Crystal IS, Inc. | 1,098,240 | |||
| CSwitch Corporation | 2,850,000 | |||
| NanoGram Corporation | 1,262,764 | |||
| NanoOpto Corporation | 433,138 | |||
| NeoPhotonics Corporation | 2,750,000 | |||
| Nextreme | 500,000 | |||
| Polatis, Inc. | 89,310 | |||
| Questech Corporation | 12,750 | |||
| SiOnyx, Inc. | 890,000 | |||
| Total | $ | 24,408,187 |
New Investments | Amount | |||
| D-Wave Systems, Inc. | $ | 1,750,547 | ||
| Evolved Nanomaterial Sciences, Inc. | 2,800,000 | |||
| Innovalight, Inc. | 2,500,000 | |||
| Metabolon, Inc. | 2,500,000 | |||
| SiOnyx, Inc. | 750,000 | |||
| Xradia, Inc. | 4,000,000 | |||
Follow-on Investments | ||||
| Chlorogen, Inc. | $ | 221,438 | ||
| Crystal IS, Inc. | 1,098,240 | |||
| CSwitch Corporation | 2,850,000 | |||
| NanoGram Corporation | 1,262,764 | |||
| NanoOpto Corporation | 433,138 | |||
| NeoPhotonics Corporation | 2,750,000 | |||
| Nextreme | 500,000 | |||
| Polatis, Inc. | 89,310 | |||
| Questech Corporation | 12,750 | |||
| SiOnyx, Inc. | 890,000 | |||
| Total | $ | 24,408,187 | ||
December 31, | |||||||
2006 | 2005 | ||||||
| Venture capital investments, | |||||||
| at cost | $ | 62,118,800 | $ | 37,706,342 | |||
| Net unrealized depreciation | 8,450,969 | 4,519,009 | |||||
Venture capital investments, | |||||||
at fair value | $ | 53,667,831 | $ | 33,187,333 | |||
December 31, | |||||||
2006 | 2005 | ||||||
| U.S. government and agency | |||||||
| securities, at cost | $ | 59,212,598 | $ | 96,320,405 | |||
| Net unrealized depreciation | 556,451 | 69,541 | |||||
U.S. government and agency | |||||||
securities, at fair value | $ | 58,656,147 | $ | 96,250,864 | |||
December 31, | |||||||
Category | 2006 | 2005 | |||||
| Tiny Technology | 99.9 | % | 99.9 | % | |||
| Other Venture Capital Investments | 0.1 | % | 0.1 | % | |||
Total Venture Capital Investments | 100.0 | % | 100.0 | % | |||
Cash provided by financing activities for the year ended December 31, 2004, to $96,250,864 at December 31, 2005, resulted primarily from the receipt of net proceeds of $36,526,567 pursuant to2007, was $23,098,679,reflecting the issuance of 3,507,500shares in connection with the Stock Plan and the net proceeds from the issuance of 1,300,000 new shares of our common stock and proceeds from the sale of NeuroMetrix of $34,591,136. These increases were partially offset by four new venture capital investments and elevenon June 25, 2007, in a registered direct follow-on investments totaling $16,251,339, as well as by operating expenses.
New Investment | Amount | |||
| eLite Optoelectronics, Inc. | $ | 1,000,000 | ||
| Kereos, Inc. | 800,000 | |||
| Kovio, Inc. | 3,000,000 | |||
| Zia Laser, Inc. | 1,500,000 | |||
Follow-on Investments | ||||
| Cambrios Technologies Corporation | $ | 511,006 | ||
| Chlorogen, Inc. | 364,261 | |||
| Kereos, Inc. | 160,000 | |||
| Molecular Imprints, Inc. | 2,500,000 | |||
| Nanomix, Inc. | 250,000 | |||
| NanoOpto Corporation | 411,741 | |||
| Mersana Therapeutics, Inc. | 683,000 | |||
| Nanosys, Inc. | 3,000,003 | |||
| Nantero, Inc. | 571,329 | |||
| NeoPhotonics Corporation | 999,999 | |||
| Starfire Systems, Inc. | 500,000 | |||
| Total | $ | 16,251,339 | ||
Year Ended December 31, 2006
Net cash used in operating activities for the year ended December 31, 2006, was $14,955,302, primarily owing both to the payment of various federal, state and local taxes, including the tax paid on behalf of shareholders for the deemed dividend, and to the payment of operating expenses.
Cash provided by investing activities for the year ended December 31, 2006, was $13,198,611, primarily reflecting net proceeds from the sale of U.S. government and agency securities of $37,593,589, less investments in private placements of $24,408,187.
Cash provided by financing activities for the year ended December 31, 2006, was $2,615,190, reflecting the issuance of shares in connection with the Stock Plan.
Year Ended December 31, 2005
Net cash used in operating activities for the year ended December 31, 2005, was $2,914,285, primarily owing to an increase in our operating expenses.
Cash used in investing activities for the year ended December 31, 2005, was $33,049,325, primarily reflecting a net increase in our investment in U.S. government and agency securities of $52,144,482 and investments in private placements of $16,251,339, less proceeds from the sale of venture capital investments of $35,392,200.
Cash provided by financing activities for the year ended December 31, 2005, was $36,526,567, reflecting net proceeds from the issuance of 3,507,500 new shares of our common stock on September 14, 2005, in an underwritten follow-on offering.
45
Liquidity and Capital Resources
Our primary sources of liquidity are cash, receivables and freely marketable securities, net of short-term indebtedness. Our secondary sources of liquidity are restricted securities of companies that are publicly traded.
December 31, 2007
At December 31, 2007, and December 31, 2006, our total net primary liquidity was $61,183,136 and $61,323,306, respectively, and our secondary liquidity was $0 and $0, respectively.
Our net primary sources of liquidity are more than adequate to cover our gross cash operating expenses over the next 12 months. Our gross cash operating expenses for 2007 and 2006 totaled $6,263,510 and $5,285,448, respectively.
The increase in our primary liquidity from December 31, 2006, to December 31, 2007, is primarily owing to the proceeds received through a registered direct stock offering from a shelf registration statement and proceeds received from stock option exercises, offset by the use of funds for investments and payment of net operating expenses. In the future, we may sell additional shares registered pursuant to our shelf registration statement.
On November 29, 2006, we filed a shelf registration statement with the SEC on Form N-2 to register 4,000,000 shares of our common stock. On December 11, 2006, and on April 23, 2007, we filed amended registration statements with the SEC. On May 11, 2007, the SEC declared the registration statement effective. The common stock may be sold at prices and on terms to be set forth in one or more supplements to the prospectus from time to time.
On June 25, 2007, we completed the sale of 1,300,000 shares of our common stock from our shelf registration statement for gross proceeds of $14,027,000; net proceeds of this offering, after placement agent fees and offering costs of $1,033,832, were $12,993,168. We intend to use, and have been using, the net proceeds of this offering to make new investments in tiny technology, as well as for follow-on investments in our existing venture capital investments and for working capital. Through December 31, 2007, we have used $9,475,687 of the net proceeds from this offering for these purposes.
On April 17, 2003, we signed a seven-year sublease for office space at 111 West 57th Street in New York City. On December 17, 2004, we signed a sublease for additional office space at our current location. The subleases expire on April 29, 2010. Total rent expense for our office space in New York City was $178,167 in 2007, $174,625 in 2006 and $171,171 in 2005. Future minimum sublease payments in each of the following years are: 2008 -- $193,083; 2009 -- $197,700; and thereafter, for the remaining term -- $65,969.
46
December 31, 2006
At December 31, 2006, and December 31, 2005, our total net primary liquidity was $61,323,306 and $97,797,219, respectively, and our secondary liquidity was $0 and $0, respectively.
Our net primary sources of liquidity arewere more than adequate to cover our gross cash operating expenses over the next 12 months. Our gross cash operating expenses for 2006 and 2005 totaled $5,285,448 and $5,021,066, respectively.
The decrease in our primary liquidity from December 31, 2005, to December 31, 2006, iswas primarily owing to the use of funds for investments, profit-sharing and tax payments, as well as net operating expenses.
Critical Accounting Policies
The Company's significant accounting policies are described in Note 2 to the Consolidated Financial Statements and in the Footnote to the Consolidated Schedule of Investments. Critical accounting policies are those that are both important to the presentation of our financial condition and results of operations and those that require management’s most difficult, complex or subjective judgments. The Company considers the following accounting policies and related estimates to be critical:
Stock-Based Compensation
Determining the appropriate fair-value model and calculating the fair value of share-based awards at the date of grant requires judgment. We use the Black-Scholes option pricing model to estimate the fair value of employee stock options, consistent with the provisions of SFAS No. 123(R). Management uses the Black-Scholes option pricing model because of the lack of the historical option data whichthat is required for use in other, more complex models. Other models may yield fair values that are significantly different from those calculated by the Black-Scholes option pricing model.
Option pricing models, including the Black-Scholes model, require the use of subjective input assumptions, including expected volatility, expected life, expected dividend rate, and expected risk-free rate of return. In the Black-Scholes model, variations in the expected volatility or expected term assumptions have a significant impact on fair value. As the volatility or expected term assumptions increase, the fair value of the stock option increases. In the Black-Scholes model, the expected dividend rate and expected risk-free rate of return are not as significant to the calculation of fair value. A higher assumed dividend rate yields a lower fair value, whereas higher assumed interest rates yield higher fair values for stock options.
We use the simplified calculation of expected life described in the SEC’s Staff Accounting Bulletin 107 because of the lack of historical information about option exercise patterns. Future exercise behavior could be materially different than that which is assumed by the model.
Expected volatility is based on the historical fluctuations in the Company's stock. The Company's stock has historically been volatile, which increases the fair value.
47
SFAS No. 123(R) requires us to develop an estimate of the number of share-based awards whichthat will be forfeited owing to employee turnover. Quarterly changes in the estimated forfeiture rate can have a significant effect on reported share-based compensation, as the effect of adjusting the rate for all expense amortization after June 30, 2006,the grant date is recognized in the period the forfeiture estimate is changed. If the actual forfeiture rate proves to be higher than the estimated forfeiture rate, then an adjustment will be made to increase the estimated forfeiture rate, which would result in a decrease to the expense recognized in the financial statements. If the actual forfeiture rate proves to be lower than the estimated forfeiture rate, then an adjustment will be made to decrease the estimated forfeiture rate, which would result in an increase to the expense recognized in the financial statements. Such adjustments would affect our operating expenses and additional paid-in capital, but would have no effect on our net asset value.
Valuation of Portfolio Investments
As a business development company, we invest in illiquid securities including debt and equity securities of private companies. These investments are generally subject to restrictions on resale and generally have no established trading market. We value substantially all of our equity investments at fair value as determined in good faith by our Valuation Committee on a quarterly basis. The Valuation Committee, comprised of three or moreall of our non-interested Board members, reviews and approves the valuation of our investments within the valuation procedures established by the Board of Directors. Fair value is generally defined as the amount that an investment could be sold for in an orderly disposition over a reasonable time. Generally, to increase objectivity in valuing our assets, external measures of value, such as public markets or third partythird-party transactions, are utilized whenever possible. Valuation is not based on long-term work-out value, nor immediate liquidation value, nor incremental value for potential changes that may take place in the future. Upon sale of investments, the values that are ultimately realized may be different from what is presently estimated. This difference could be material.
Pension and Post-Retirement Benefit Plan Assumptions
The Company provides a Retiree Medical Benefit Plan for employees who meet certain eligibility requirements. Several statistical and other factors that attempt to anticipate future events are used in calculating the expense and liability values related to our post-retirement benefit plans. These factors include assumptions we make about the discount rate, the rate of increase in healthcare costs, and mortality, among others.
The discount rate reflects the current rate at which the post-retirement benefit liabilities could be effectively settled considering the timing of expected payments for plan participants. In estimating this rate, we consider rates of return on high quality fixed-income investments included in published bond indexes. We consider the Moody’s Aa Corporate Bond Index and the Citigroup Pension Liability Index in the determination of the appropriate discount rate assumptions. The weighted average rate we utilized to measure our post retirement benefit obligation as of December 31, 2006,2007, and to calculate our 20072008 expense was 5.756.55 percent, which is an increase from the 5.55.75 percent rate used in determining the 20062007 expense.
48
Recent Developments — Portfolio Companies
Two of our portfolio companies have been considering with their advisors the possibility of filing for initial public offerings (IPOs) in 2008. There can be no assurance that either of them will file for an IPO in 2008, and a variety of factors, including stock market and general business conditions, could lead either or both of them to terminate such considerations.
On February 2, 2007,January 16, 2008, we made a $350,877$736,019 follow-on investment that has not yet been announced in a privately held tiny technology portfolio company.
On January 31, 2008, we made a $377,580 follow-on investment that has not yet been announced in a privately held tiny technology portfolio company.
On February 6, 2007,1, 2008, we made a $540,000$25,000 follow-on investment that has not yet been announced in a privately held tiny technology portfolio company.
On February 9, 2007,8, 2008, we made a $500,000 follow-on$244,500 new investment in Solazyme,PolyRemedy, Inc.
On February 15, 2007,21, 2008, we made a $268,654$1,052,174 follow-on investment that has not yet been announced in a privately held tiny technology portfolio company.
On February 20, 2007,25, 2008, we made a $1,147,826 initial$1,000,001 follow-on investment that has not yet been announced in a privately held tiny technology company.
On January 31, 2007, the Company paid the final installment of the 2005 profit-sharing balance to participants totaling $261,661.March 7, 2008, we made a $2,000,000 follow-on investment that has not yet been announced in a privately held tiny technology portfolio company.
Item 7A.Quantitative and Qualitative Disclosures About Market RiskRisk.
Our business activities contain elements of risk. We consider the principal types of market risk to be valuation risk and the risk associated with fluctuations in interest rates. Although we are risk-seeking rather than risk-averse in our investments, we consider the management of risk to be essential to our business.
Value, as defined in Section 2(a)(41) of the 1940 Act, is (i) the market price for those securities for which a market quotation isquotations are readily available and (ii) fair value as determined in good faith by, or under the direction of, the Board of Directors for all other assets. (See the "Valuation Procedures" in the "Footnote to Consolidated Schedule of Investments" contained in "Item 1.8. Consolidated Financial Statements.Statements and Supplementary Data.")
49
Neither our investments nor an investment in us is intended to constitute a balanced investment program.
We have invested a substantial portion of our assets in private development stage or start-up companies. These private businesses tend to be based on new technology and to be thinly capitalized, unproven, small companies that lack management depth and have not attained profitability or have no history of operations. Because of the speculative nature and the lack of a public market for these investments, there is significantly greater risk of loss than is the case with traditional investment securities. We expect that some of our venture capital investments will be a complete loss or will be unprofitable and that some will appear to be likely to become successful but never realize their potential. Even when our private equity investments complete initial public offerings (IPOs), we are normally subject to lock-up agreements for a period of time, and thereafter, the market for the unseasoned publicly traded securities may be relatively illiquid.
Because there is typically no public market for our interests in the small privately held companies in which we invest, the valuation of the equity interests in that portion of our portfolio is determined in good faith by our Valuation Committee, comprised of the independent members of our Board of Directors, in accordance with our Valuation Procedures. In the absence of a readily ascertainable market value, the determined value of our portfolio of equity interests may differ significantly from the values that would be placed on the portfolio if a ready market for the equity interests existed. Any changes in valuation are recorded in our consolidated statements of operations as "Net increase (decrease) in unrealized appreciation on investments." Changes in valuation of any of our investments in privately held companies from one period to another may be volatile.
We also invest in short-term money market instruments, and both short and long-term U.S. government and agency securities. To the extent that we invest in short and long-term U.S. government and agency securities, changes in interest rates may result in changes in the value of these obligations which would result in an increase or decrease of our net asset value. The level of interest rate risk exposure at any given point in time depends on the market environment, the expectations of future price and market movements, and the quantity and duration of both the short and long-term U.S. government and agency securities held by the Company, and it will vary from period to period. If the average interest rate on U. S.U.S. government and agency securities at December 31, 2006,2007, were to increase by 25, 75 and 150 basis points, the weighted average value of these securities held by us at December 31, 2006,2007, would decrease by approximately $285,108, $855,323$144,380, $433,139 and $1,710,645,$866,278, respectively, and our net asset value would decrease correspondingly.
Most of our investments are denominated in U.S. dollars. We currently have one investment denominated in Canadian dollars. We are exposed to foreign currency risk related to potential changes in foreign currency exchange rates. The potential loss in fair value on this investment resulting from a 10 percent adverse change in quoted foreign currency exchange rates is $171,644$202,408 at December 31, 2006.2007.
In addition, in the future, we may from time to time opt to borrow money to make investments. Our net investment income will be dependent upon the difference between the rate at which we borrow funds and the rate at which we invest such funds. As a result, there can be no assurance that a significant change in market interest rates will not have a material adverse effect on our net investment income in the event we choose to borrow funds for investing purposes.
50
Item 8.Consolidated Financial Statements and Supplementary DataData.
HARRIS & HARRIS GROUP, INC.
INDEX TO CONSOLIDATED FINANCIAL STATEMENTS AND SCHEDULES
The following reports and consolidated financial schedules of Harris & Harris Group, Inc. are filed herewith and included in response to Item 8.
| Documents | Page | ||
| 52 | |||
| Report of Independent Registered Public Accounting Firm | 53 | ||
Consolidated Financial Statements | |||
| Consolidated Statements of Assets and Liabilities | |||
| as of December 31, | 55 | ||
| Consolidated Statements of Operations for the | |||
| years ended December 31, 2007, 2006, 2005 | 56 | ||
| Consolidated Statements of Cash Flows for the | |||
| years ended December 31, 2007, 2006, | 57 | ||
| Consolidated Statements of Changes in Net Assets for the | |||
| years ended December 31, 2007, 2006, | 58 | ||
| Consolidated Schedule of Investments as of December 31, 2007 | 59-69 | ||
| Consolidated Schedule of Investments as of December 31, 2006 | 70-77 | ||
| Footnote to Consolidated Schedule of Investments | 78-82 | ||
| 83-102 | |||
Schedules other than those listed above have been omitted because they are not applicable or the required information is presented in the consolidated financial statements and/or related notes.
51
Management's Report on Internal Control Over Financial Reporting
Management of the Company is responsible for establishing and maintaining adequate internal control over financial reporting. Internal control over financial reporting is defined in Rules 13a-15(f) and 15d-15(f) under the Securities Exchange Act of 1934 as a process designed by, or under the supervision of, the Company's principal executive and principal financial officers and effected by the Company's Board of Directors, management and other personnel to provide reasonable assurance regarding the reliability of financial reporting and the preparation of financial statements for external purposes in accordance with generally accepted accounting principles and includes those policies and procedures that:
pertain to the maintenance of records that in reasonable detail accurately and fairly reflect the transactions and dispositions of the assets of the Company;
provide reasonable assurance that transactions are recorded as necessary to permit preparation of financial statements in accordance with generally accepted accounting principles, and that receipts and expenditures of the company are being made only in accordance with authorizations of management and directors of the Company; and
provide reasonable assurance regarding prevention or timely detection of unauthorized acquisition, use or disposition of the Company's assets that could have a material effect on the financial statements.
Because of its inherent limitations, internal control over financial reporting may not prevent or detect misstatements. Also, projections of any evaluation of effectiveness of internal control over financial reporting to future periods are subject to the risk that controls may become inadequate because of changes in conditions, or that the degree of compliance with the policies or procedures may deteriorate.
Management has assessed the effectiveness of our internal control over financial reporting as of December 31, 2006.2007. In making its assessment, management used the criteria set forth by the Committee of Sponsoring Organizations of the Treadway Commission (COSO) in Internal Control-Integrated Framework. Based on the results of this assessment, management (including our Chief Executive Officer and Chief Financial Officer) has concluded that, as of December 31, 2006,2007, the Company's internal control over financial reporting was effective.
52
Report of Independent Registered Public Accounting Firm
To the Board of Directors and Shareholders of
Harris & Harris Group, Inc.:
In our opinion, the accompanying consolidated statements of assets and liabilities including the consolidated schedules of investments, and the related consolidated statements of operations, changes in net assets, cash flows, and the financial statements listed in the accompanying index highlightspresent fairly, in all material respects, the financial position of Harris & Harris Group, Inc. (the “Company”and its subsidiaries ("the Company") at December 31, 20062007 and December 31, 2005,2006, and the results of its theiroperations, itstheir cash flows, the changes in itstheir net assets, and the financial highlights for each of the three years in the period ended December 31, 20062007, in conformity with accounting principles generally accepted in the United States of America. TheseAlso in our opinion, the Company maintained, in all material respects, effective internal control over financial reporting as of December 31, 2007, based on criteria established in Internal Control - Integrated Framework issued by the Committee of Sponsoring Organizations of the Treadway Commission (COSO). The Company's management is responsible for these financial statements, are the responsibilityfor maintaining effective internal control over financial reporting and for its assessment of the Company’s management.effectiveness of internal control over financial reporting, included in Management's Report on Internal Control over Financial Reporting appearing on page 52 of the 2007 Annual Report to Shareholders. Our responsibility is to express an opinionopinions on these financial statements and on the Company's internal control over financial reporting based on our integrated audits. We conducted our audits of these statements in accordance with the standards of the Public Company Accounting Oversight Board (United States). Those standards require that we plan and perform the auditaudits to obtain reasonable assurance about whether the financial statements are free of material misstatement. An auditmisstatement and whether effective internal control over financial reporting was maintained in all material respects. Our audits of the financial statements includesincluded examining, on a test basis, evidence supporting the amounts and disclosures in the financial statements, assessing the accounting principles used and significant estimates made by management, and evaluating the overall financial statement presentation. Our audit of internal control over financial reporting included obtaining an understanding of internal control over financial reporting, assessing the risk that a material weakness exists, and testing and evaluating the design and operating effectiveness of internal control based on the assessed risk. Our audits also included performing such other procedures as we considered necessary in the circumstances. We believe that our audits which included confirmation of securities at December 31, 2006 by correspondence with the custodian, provide a reasonable basis for our opinion.opinions.
As more fully disclosed in Note 2 of the Notes to Consolidated Financial Statements, the financial statements include investments valued at $53,667,831 (47.1%$78,110,384 (56.5% of net assets) at December 31, 2006,2007, the fair values of which have been estimated by the Board of Directors in the absence of readily ascertainable market values. ThoseThese estimated values may differ significantly from the values that would have been used had a ready market for the investments existed, and the differences could be material.
A company’s internal control over financial reporting is a process designed to provide reasonable assurance regarding the reliability of financial reporting and the preparation of financial statements for external purposes in accordance with generally accepted accounting principles. A company’s internal control over financial reporting includes those policies and procedures that (i) pertain to the maintenance of records that, in reasonable detail, accurately and fairly reflect the transactions and dispositions of the assets of the company; (ii) provide reasonable assurance that transactions are recorded as necessary to permit preparation of financial statements in accordance with generally accepted accounting principles, and that receipts and expenditures of the company are being made only in accordance with authorizations of management and directors of the company; and (iii) provide reasonable assurance regarding prevention or timely detection of unauthorized acquisition, use, or disposition of the company’s assets that could have a material effect on the financial statements.
53
Because of its inherent limitations, internal control over financial reporting may not prevent or detect misstatements. Also, projections of any evaluation of effectiveness to future periods are subject to the risk that controls may become inadequate because of changes in conditions, or that the degree of compliance with the policies or procedures may deteriorate.
/s/ PricewaterhouseCoopers LLP
New York, New York
March 15, 200712, 2008
54
HARRIS & HARRIS GROUP, INC. CONSOLIDATED STATEMENTS OF ASSETS AND LIABILITIES |
ASSETS | |||||||
December 31, 2006 | December 31, 2005 | ||||||
| Investments, at value (Cost: $121,331,398 at 12/31/06, | |||||||
| $134,026,747 at 12/31/05 | $ | 112,323,978 | $ | 129,438,197 | |||
| Cash and cash equivalents | 2,071,788 | 1,213,289 | |||||
| Restricted funds (Note 6) | 2,149,785 | 1,730,434 | |||||
| Receivable from portfolio company | 0 | 75,000 | |||||
| Receivable from broker (Note 3) | 819,905 | 0 | |||||
| Interest receivable | 625,372 | 248,563 | |||||
| Prepaid expenses | 10,945 | 2,993 | |||||
| Other assets | 326,817 | 229,644 | |||||
Total assets | $ | 118,328,590 | $ | 132,938,120 | |||
LIABILITIES & NET ASSETS | |||||||
| Accounts payable and accrued liabilities (Note 6) | $ | 4,115,300 | $ | 3,174,183 | |||
| Accrued profit sharing (Note 4) | 261,661 | 2,107,858 | |||||
| Deferred rent | 21,326 | 31,003 | |||||
| Current taxes payable | 0 | 1,514,967 | |||||
| Taxes payable on behalf of shareholders (Note 7) | 0 | 8,122,367 | |||||
Total liabilities | 4,398,287 | 14,950,378 | |||||
Net assets | $ | 113,930,303 | $ | 117,987,742 | |||
Net assets are comprised of: | |||||||
| Preferred stock, $0.10 par value, | |||||||
| 2,000,000 shares authorized; none issued | $ | 0 | $ | 0 | |||
| Common stock, $0.01 par value, 45,000,000 shares authorized at | |||||||
| 12/31/06 and 30,000,000 at 12/31/05; 22,843,757 issued at | |||||||
| 12/31/06 and 22,585,085 issued at 12/31/05 | 228,438 | 225,851 | |||||
| Additional paid in capital (Note 9) | 129,801,201 | 122,149,642 | |||||
| Accumulated net realized income (loss) | (3,747,912 | ) | 3,781,905 | ||||
| Accumulated unrealized depreciation of investments | (9,007,420 | ) | (4,764,125 | ) | |||
| Unrecognized net gain on retirement benefit plans (Note 6) | 61,527 | ||||||
| Treasury stock, at cost (1,828,740 shares at 12/31/06 and | |||||||
| 12/31/05) | (3,405,531 | ) | (3,405,531 | ) | |||
Net assets | $ | 113,930,303 | $ | 117,987,742 | |||
Shares outstanding | 21,015,017 | 20,756,345 | |||||
Net asset value per outstanding share | $ | 5.42 | $ | 5.68 | |||
December 31, 2007 | December 31, 2006 | ||||||
ASSETS | |||||||
| Investments, at value (Cost: $142,230,461 at 12/31/07, $121,331,398 at 12/31/06) | $ | 138,303,977 | $ | 112,323,978 | |||
| Cash and cash equivalents | 330,009 | 2,071,788 | |||||
| Restricted funds (Note 7) | 2,667,020 | 2,149,785 | |||||
| Receivable from portfolio company | 524 | 0 | |||||
| Receivable from broker (Note 4) | 0 | 819,905 | |||||
| Interest receivable | 647,337 | 625,372 | |||||
| Prepaid expenses | 488,667 | 10,945 | |||||
| Other assets | 455,798 | 326,817 | |||||
Total assets | $ | 142,893,332 | $ | 118,328,590 | |||
LIABILITIES & NET ASSETS | |||||||
| Accounts payable and accrued liabilities (Note 7) | $ | 4,515,463 | $ | 4,115,300 | |||
| Accrued profit sharing (Note 5) | 0 | 261,661 | |||||
| Deferred rent | 14,525 | 21,326 | |||||
Total liabilities | 4,529,988 | 4,398,287 | |||||
Net assets | $ | 138,363,344 | $ | 113,930,303 | |||
Net assets are comprised of: | |||||||
| Preferred stock, $0.10 par value, 2,000,000 shares authorized; none issued | $ | 0 | $ | 0 | |||
| Common stock, $0.01 par value, 45,000,000 shares authorized at 12/31/07 and 12/31/06; 25,143,313 issued at 12/31/07 and 22,843,757 issued at 12/31/06 | 251,434 | 228,438 | |||||
| Additional paid in capital (Note 10) | 160,927,691 | 129,801,201 | |||||
| Accumulated net realized loss | (15,483,766 | ) | (3,686,385 | ) | |||
| Accumulated unrealized depreciation of investments | (3,926,484 | ) | (9,007,420 | ) | |||
| Treasury stock, at cost (1,828,740 shares at 12/31/07 and 12/31/06) | (3,405,531 | ) | (3,405,531 | ) | |||
Net assets | $ | 138,363,344 | $ | 113,930,303 | |||
Shares outstanding | 23,314,573 | 21,015,017 | |||||
Net asset value per outstanding share | $ | 5.93 | $ | 5.42 | |||
The accompanying notes are an integral part of these consolidated financial statements.
55
HARRIS & HARRIS GROUP, INC. CONSOLIDATED STATEMENTS OF OPERATIONS |
Year Ended | Year Ended | Year Ended | Year Ended | Year Ended | Year Ended | |||||||||||||||
December 31, 2006 | December 31, 2005 | December 31, 2004 | December 31, 2007 | December 31, 2006 | December 31, 2005 | |||||||||||||||
Investment income: | ||||||||||||||||||||
| Interest from: | ||||||||||||||||||||
| Fixed-income securities | $ | 2,991,261 | $ | 1,409,273 | $ | 614,728 | $ | 2,705,597 | $ | 2,991,261 | $ | 1,409,273 | ||||||||
| Portfolio companies | 0 | 65,620 | 22,834 | 0 | 0 | 65,620 | ||||||||||||||
| Miscellaneous income | 37,500 | 65,969 | 0 | 39 | 37,500 | 65,969 | ||||||||||||||
Total investment income | 3,028,761 | 1,540,862 | 637,562 | 2,705,636 | 3,028,761 | 1,540,862 | ||||||||||||||
Expenses: | ||||||||||||||||||||
| Salaries, benefits and stock-based | ||||||||||||||||||||
| compensation (Note 3) | 7,933,276 | 2,459,033 | 1,928,088 | |||||||||||||||||
| Salaries, benefits and stock-based compensation (Note 4) | 11,435,329 | 7,933,276 | 2,459,033 | |||||||||||||||||
| Administration and operations | 1,250,080 | 1,319,354 | 718,530 | 1,432,653 | 1,250,080 | 1,319,354 | ||||||||||||||
| Profit-sharing provision (Note 4) | 50,875 | 1,796,264 | 311,594 | |||||||||||||||||
| Profit-sharing provision (Note 5) | 0 | 50,875 | 1,796,264 | |||||||||||||||||
| Professional fees | 737,828 | 830,062 | 667,311 | 902,911 | 737,828 | 830,062 | ||||||||||||||
| Rent | 239,846 | 211,582 | 151,434 | 235,998 | 239,846 | 211,582 | ||||||||||||||
| Directors' fees and expenses | 340,750 | 308,874 | 209,210 | 435,060 | 340,750 | 308,874 | ||||||||||||||
| Depreciation | 64,916 | 64,713 | 43,151 | 63,113 | 64,916 | 64,713 | ||||||||||||||
| Custodian fees | 24,125 | 16,741 | 17,023 | 28,115 | 24,125 | 16,741 | ||||||||||||||
Total expenses | 10,641,696 | 7,006,623 | 4,046,341 | 14,533,179 | 10,641,696 | 7,006,623 | ||||||||||||||
Net operating loss | (7,612,935 | ) | (5,465,761 | ) | (3,408,779 | ) | (11,827,543 | ) | (7,612,935 | ) | (5,465,761 | ) | ||||||||
Net realized gain from investments: | ||||||||||||||||||||
| Realized gain from investments | 31,338 | 23,862,037 | 813,994 | 118,137 | 31,338 | 23,862,037 | ||||||||||||||
| Income tax (benefit) expense (Note 7) | (227,355 | ) | 9,653,248 | (44,509 | ) | |||||||||||||||
| Income tax expense (benefit) (Note 8) | 87,975 | (227,355 | ) | 9,653,248 | ||||||||||||||||
Net realized gain from investments | 258,693 | 14,208,789 | 858,503 | 30,162 | 258,693 | 14,208,789 | ||||||||||||||
Net (increase) decrease in unrealized | ||||||||||||||||||||
depreciation on investments: | ||||||||||||||||||||
Net decrease (increase) in unrealized depreciation on investments: | ||||||||||||||||||||
| Change as a result of investment sales | 0 | (23,181,420 | ) | 915,118 | 0 | 0 | (23,181,420 | ) | ||||||||||||
| Change on investments held | (4,418,870 | ) | 19,790,298 | 264,170 | 5,080,936 | (4,418,870 | ) | 19,790,298 | ||||||||||||
| Change in unrealized depreciation | ||||||||||||||||||||
| on investments | (4,418,870 | ) | (3,391,122 | ) | 1,179,288 | |||||||||||||||
| Income tax (benefit) expense (Note 7) | 0 | (1,364,470 | ) | 695,126 | ||||||||||||||||
Net decrease (increase) in unrealized | ||||||||||||||||||||
depreciation on investments | (4,418,870 | ) | (2,026,652 | ) | 484,162 | |||||||||||||||
| Change in unrealized depreciation on investments | 5,080,936 | (4,418,870 | ) | (3,391,122 | ) | |||||||||||||||
| Income tax (benefit) (Note 8) | 0 | 0 | (1,364,470 | ) | ||||||||||||||||
Net decrease (increase) in unrealized depreciation on investments | 5,080,936 | (4,418,870 | ) | (2,026,652 | ) | |||||||||||||||
Net (decrease) increase in net assets | ||||||||||||||||||||
resulting from operations: | ||||||||||||||||||||
Net (decrease) increase in net assets resulting from operations: | ||||||||||||||||||||
Total | $ | (11,773,112 | ) | $ | 6,716,376 | $ | (2,066,114 | ) | $ | (6,716,445 | ) | $ | (11,773,112 | ) | $ | 6,716,376 | ||||
Per average basic and diluted outstanding share | $ | (0.57 | ) | $ | 0.36 | $ | (0. 13 | ) | $ | (0.30 | ) | $ | (0.57 | ) | $ | 0.36 | ||||
Average outstanding shares | 20,759,547 | 18,471,770 | 15,476,714 | 22,393,030 | 20,759,547 | 18,471,770 | ||||||||||||||
The accompanying notes are an integral part of these consolidated financial statements.
56
HARRIS & HARRIS GROUP, INC. CONSOLIDATED STATEMENTS OF CASH FLOWS |
Year Ended | Year Ended | Year Ended | Year Ended | Year Ended | Year Ended | |||||||||||||||
December 31, 2006 | December 31, 2005 | December 31, 2004 | December 31, 2007 | December 31, 2006 | December 31, 2005 | |||||||||||||||
Cash flows used in operating activities: | ||||||||||||||||||||
| Net (decrease) increase in net assets | ||||||||||||||||||||
| resulting from operations | $ | (11,773,112 | ) | $ | 6,716,376 | $ | (2,066,114 | ) | ||||||||||||
| Adjustments to reconcile net increase (decrease) in net assets | ||||||||||||||||||||
| resulting from operations to net cash used in operating activities: | ||||||||||||||||||||
| Net realized and unrealized loss (gain) on investments | 4,420,619 | (20,470,915 | ) | (1,993,282 | ) | |||||||||||||||
| Net (decrease) increase in net assets resulting from operations | $ | (6,716,445 | ) | $ | (11,773,112 | ) | $ | 6,716,376 | ||||||||||||
| Adjustments to reconcile net increase (decrease) in net assets resulting from operations to net cash used in operating activities: | ||||||||||||||||||||
| Net realized and unrealized (gain) loss on investments | (5,199,073 | ) | 4,420,619 | (20,470,915 | ) | |||||||||||||||
| Deferred income taxes | 0 | (1,364,470 | ) | 695,126 | 0 | 0 | (1,364,470 | ) | ||||||||||||
| Depreciation and amortization | (426,168 | ) | 346,019 | 43,151 | (60,009 | ) | (426,168 | ) | 346,019 | |||||||||||
| Taxes payable on behalf of shareholders on deemed dividend | 0 | 8,122,367 | 0 | 0 | 0 | 8,122,367 | ||||||||||||||
| Stock-based compensation expense | 5,038,956 | 0 | 0 | 8,050,807 | 5,038,956 | 0 | ||||||||||||||
| Changes in assets and liabilities: | ||||||||||||||||||||
| Restricted funds | (419,351 | ) | (138,463 | ) | (379,893 | ) | (517,235 | ) | (419,351 | ) | (138,463 | ) | ||||||||
| Receivable from portfolio company | 75,000 | (65,000 | ) | (10,000 | ) | (524 | ) | 75,000 | (65,000 | ) | ||||||||||
| Interest receivable | (376,808 | ) | (189,603 | ) | (58,510 | ) | (21,965 | ) | (376,808 | ) | (189,603 | ) | ||||||||
| Income tax receivable | 0 | (7,023 | ) | 14,895 | 0 | 0 | (7,023 | ) | ||||||||||||
| Prepaid expenses | (7,951 | ) | 539,496 | (535,648 | ) | (477,722 | ) | (7,951 | ) | 539,496 | ||||||||||
| Other receivables | (819,905 | ) | 0 | 0 | 819,905 | (819,905 | ) | 0 | ||||||||||||
| Other assets | (176,325 | ) | 11,599 | (8,666 | ) | (152,012 | ) | (176,325 | ) | 11,599 | ||||||||||
| Accounts payable and accrued liabilities | 1,002,643 | 268,525 | 182,260 | 400,163 | 1,002,643 | 268,525 | ||||||||||||||
| Accrued profit sharing | (1,846,197 | ) | 1,796,264 | 311,594 | (261,661 | ) | (1,846,197 | ) | 1,796,264 | |||||||||||
| Deferred rent | (9,677 | ) | (3,927 | ) | (4,718 | ) | (6,801 | ) | (9,677 | ) | (3,927 | ) | ||||||||
| Current income tax liability | (9,637,026 | ) | 1,524,470 | 0 | 0 | (9,637,026 | ) | 1,524,470 | ||||||||||||
Net cash used in operating activities | (14,955,302 | ) | (2,914,285 | ) | (3,809,805 | ) | (4,142,572 | ) | (14,955,302 | ) | (2,914,285 | ) | ||||||||
Cash flows from investing activities: | ||||||||||||||||||||
| Net (purchase) sale of short-term investments | ||||||||||||||||||||
| and marketable securities | 37,593,589 | (52,144,482 | ) | (17,823,606 | ) | |||||||||||||||
Net (purchase) sale of short-term investments and marketable securities | (235,754 | ) | 37,593,589 | (52,144,482 | ) | |||||||||||||||
| Investment in private placements and loans | (24,408,187 | ) | (16,251,339 | ) | (16,731,216 | ) | (20,595,161 | ) | (24,408,187 | ) | (16,251,339 | ) | ||||||||
| Proceeds from sale of investments | 28,295 | 35,392,200 | 2,530,483 | 174,669 | 28,295 | 35,392,200 | ||||||||||||||
| Purchase of fixed assets | (15,086 | ) | (45,704 | ) | (69,273 | ) | (41,640 | ) | (15,086 | ) | (45,704 | ) | ||||||||
Net cash provided by (used in) investing activities | 13,198,611 | (33,049,325 | ) | (32,093,612 | ) | |||||||||||||||
Net cash (used in) provided by investing activities | (20,697,886 | ) | 13,198,611 | (33,049,325 | ) | |||||||||||||||
Cash flows from financing activities: | ||||||||||||||||||||
| Proceeds from public offering, net (Note 9) | 0 | 36,526,567 | 36,128,175 | |||||||||||||||||
| Proceeds from stock option exercises (Note 3) | 2,615,190 | 0 | 0 | |||||||||||||||||
| Proceeds from public offering, net (Note 10) | 12,993,168 | 0 | 36,526,567 | |||||||||||||||||
| Proceeds from stock option exercises (Note 4) | 10,105,511 | 2,615,190 | 0 | |||||||||||||||||
Net cash provided by financing activities | 2,615,190 | 36,526,567 | 36,128,175 | 23,098,679 | 2,615,190 | 36,526,567 | ||||||||||||||
Net increase in cash and cash equivalents: | ||||||||||||||||||||
Net (decrease) increase in cash and cash equivalents: | ||||||||||||||||||||
| Cash and cash equivalents at beginning of the year | 1,213,289 | 650,332 | 425,574 | 2,071,788 | 1,213,289 | 650,332 | ||||||||||||||
| Cash and cash equivalents at end of the year | 2,071,788 | 1,213,289 | 650,332 | 330,009 | 2,071,788 | 1,213,289 | ||||||||||||||
Net increase in cash and cash equivalents | $ | 858,499 | $ | 562,957 | $ | 224,758 | ||||||||||||||
Net (decrease) increase in cash and cash equivalents | $ | (1,741,779 | ) | $ | 858,499 | $ | 562,957 | |||||||||||||
Supplemental disclosures of cash flow information: | ||||||||||||||||||||
| Income taxes paid | $ | 9,425,922 | $ | 0 | $ | 0 | $ | 80,236 | $ | 9,425,922 | $ | 0 | ||||||||
The accompanying notes are an integral part of these consolidated financial statements.
57
HARRIS & HARRIS GROUP, INC. CONSOLIDATED STATEMENTS OF CHANGES IN NET ASSETS |
Year Ended | Year Ended | Year Ended | ||||||||
December 31, 2006 | December 31, 2005 | December 31, 2004 | ||||||||
Changes in net assets from operations: | ||||||||||
| Net operating loss | $ | (7,612,935 | ) | $ | (5,465,761 | ) | $ | (3,408,779 | ) | |
| Net realized income (loss) on investments | 258,693 | 14,208,789 | 858,503 | |||||||
| Net increase (decrease) in unrealized | ||||||||||
| depreciation on investments as a | ||||||||||
| result of sales | 0 | (23,181,420 | ) | 915,118 | ||||||
| Net (increase) decrease in unrealized | ||||||||||
| depreciation on investments held | (4,418,870 | ) | 19,790,298 | 264,170 | ||||||
| Net change in deferred taxes | 0 | 1,364,470 | (695,126 | ) | ||||||
Net increase (decrease) in net assets resulting | ||||||||||
from operations | (11,773,112 | ) | 6,716,376 | (2,066,114 | ) | |||||
Changes in net assets from | ||||||||||
capital stock transactions: | ||||||||||
| Issuance of common stock upon the | ||||||||||
| exercise of stock options | 2,587 | 0 | 0 | |||||||
| Proceeds from sale of stock | 0 | 35,075 | 34,500 | |||||||
| Additional paid in capital on common | ||||||||||
| stock issued | 2,612,603 | 36,491,492 | 36,093,675 | |||||||
| Stock based compensation expense | 5,038,956 | 0 | 0 | |||||||
Net increase in net assets resulting | ||||||||||
from capital stock transactions | 7,654,146 | 36,526,567 | 36,128,175 | |||||||
Changes in net assets from adoption | ||||||||||
of SFAS No. 158 | 61,527 | 0 | 0 | |||||||
Net (decrease) increase in net assets | (4,057,439 | ) | 43,242,943 | 34,062,061 | ||||||
Net Assets: | ||||||||||
| Beginning of the year | 117,987,742 | 74,744,799 | 40,682,738 | |||||||
| End of the year | $ | 113,930,303 | $ | 117,987,742 | $ | 74,744,799 | ||||
Year Ended | Year Ended | Year Ended | ||||||||
December 31, 2007 | December 31, 2006 | December 31, 2005 | ||||||||
Changes in net assets from operations: | ||||||||||
| Net operating loss | $ | (11,827,543 | ) | $ | (7,612,935 | ) | $ | (5,465,761 | ) | |
| Net realized gain on investments | 30,162 | 258,693 | 14,208,789 | |||||||
| Net (increase) in unrealized depreciation on investments as a result of sales | 0 | 0 | (23,181,420 | ) | ||||||
| Net decrease (increase) in unrealized depreciation on investments held | 5,080,936 | (4,418,870 | ) | 19,790,298 | ||||||
| Net change in deferred taxes | 0 | 0 | 1,364,470 | |||||||
Net (decrease) increase in net assets resulting from operations | (6,716,445 | ) | (11,773,112 | ) | 6,716,376 | |||||
Changes in net assets from capital stock transactions: | ||||||||||
| Issuance of common stock upon the exercise of stock options | 9,996 | 2,587 | 0 | |||||||
| Issuance of common stock on offering | 13,000 | 0 | 35,075 | |||||||
| Additional paid in capital on common stock issued | 23,075,683 | 2,612,603 | 36,491,492 | |||||||
| Stock-based compensation expense | 8,050,807 | 5,038,956 | 0 | |||||||
Net increase in net assets resulting from capital stock transactions | 31,149,486 | 7,654,146 | 36,526,567 | |||||||
Changes in net assets from adoption of SFAS No. 158 | 0 | 61,527 | 0 | |||||||
Net increase (decrease) in net assets | 24,433,041 | (4,057,439 | ) | 43,242,943 | ||||||
Net Assets: | ||||||||||
| Beginning of the year | 113,930,303 | 117,987,742 | 74,744,799 | |||||||
| End of the year | $ | 138,363,344 | $ | 113,930,303 | $ | 117,987,742 | ||||
The accompanying notes are an integral part of these consolidated financial statements.
58
HARRIS & HARRIS GROUP, INC. CONSOLIDATED SCHEDULE OF INVESTMENTS AS OF DECEMBER 31, 2007 |
Method of | Shares/ | |||||||||
Valuation (1) | Principal | Value | ||||||||
Investments in Unaffiliated Companies (2)(3) – 15.25% of net assets at value | ||||||||||
Private Placement Portfolio (Illiquid) – 15.25% of net assets at value | ||||||||||
BioVex Group, Inc. (4)(5)(6)(7)(8) – Developing novel biologics for treatment of cancer and infectious disease Series E Convertible Preferred Stock | (B) | 2,799,552 | $ | 2,500,000 | ||||||
Exponential Business Development Company (4)(5) — Venture capital partnership focused on early stage companies Limited Partnership Interest | (B) | 1 | 2,026 | |||||||
| Molecular Imprints, Inc. (4)(5) — Manufacturing nanoimprint lithography capital equipment | ||||||||||
| Series B Convertible Preferred Stock | (B) | 1,333,333 | 2,000,000 | |||||||
| Series C Convertible Preferred Stock | (B) | 1,250,000 | 2,389,250 | |||||||
| Warrants at $2.00 expiring 12/31/11 | (B) | 125,000 | 110,750 | |||||||
| 4,500,000 | ||||||||||
| Nanosys, Inc. (4)(5)(7) — Developing zero and one-dimensional inorganic nanometer-scale materials and devices | ||||||||||
| Series C Convertible Preferred Stock | (B) | 803,428 | 2,370,113 | |||||||
| Series D Convertible Preferred Stock | (B) | 1,016,950 | 3,000,003 | |||||||
| 5,370,116 | ||||||||||
| Nantero, Inc. (4)(5)(7) — Developing a high-density, nonvolatile, random access memory chip, enabled by carbon nanotubes | ||||||||||
| Series A Convertible Preferred Stock | (B) | 345,070 | 1,046,908 | |||||||
| Series B Convertible Preferred Stock | (B) | 207,051 | 628,172 | |||||||
| Series C Convertible Preferred Stock | (B) | 188,315 | 571,329 | |||||||
| 2,246,409 | ||||||||||
The accompanying notes are an integral part of these consolidated financial statements.
59
HARRIS & HARRIS GROUP, INC. CONSOLIDATED SCHEDULE OF INVESTMENTS AS OF DECEMBER 31, 2007 |
Method of | Shares/ | |||||||||
Valuation (1) | Principal | Value | ||||||||
Investments in Unaffiliated Companies (2)(3) – 15.25% of net assets at value (cont.) | ||||||||||
Private Placement Portfolio (Illiquid) – 15.25% of net assets at value (cont.) | ||||||||||
| NeoPhotonics Corporation (4)(5) — Developing and manufacturing optical devices and components | ||||||||||
| Common Stock | (B) | 716,195 | $ | 133,141 | ||||||
| Series 1 Convertible Preferred Stock | (B) | 1,831,256 | 1,831,256 | |||||||
| Series 2 Convertible Preferred Stock | (B) | 741,898 | 741,898 | |||||||
| Series 3 Convertible Preferred Stock | (B) | 2,750,000 | 2,750,000 | |||||||
| Warrants at $0.15 expiring 01/26/10 | (B) | 16,364 | 1,325 | |||||||
| Warrants at $0.15 expiring 12/05/10 | (B) | 14,063 | 1,139 | |||||||
| 5,458,759 | ||||||||||
| Polatis, Inc. (4)(5)(7)(9) — Developing MEMS-based optical networking components | ||||||||||
| Series A-1 Convertible Preferred Stock | (B) | 16,775 | 0 | |||||||
| Series A-2 Convertible Preferred Stock | (B) | 71,611 | 132,653 | |||||||
| Series A-4 Convertible Preferred Stock | (B) | 4,774 | 8,768 | |||||||
| Series A-5 Convertible Preferred Stock | (B) | 16,438 | 135,105 | |||||||
| 276,526 | ||||||||||
| Starfire Systems, Inc. (4)(5)(7) — Producing ceramic-forming polymers | ||||||||||
| Common Stock | (B) | 375,000 | 150,000 | |||||||
| Series A-1 Convertible Preferred Stock | (B) | 600,000 | 600,000 | |||||||
| 750,000 | ||||||||||
Total Unaffiliated Private Placement Portfolio (cost: $21,435,392) | $ | 21,103,836 | ||||||||
Total Investments in Unaffiliated Companies (cost: $21,435,392) | $ | 21,103,836 | ||||||||
The accompanying notes are an integral part of these consolidated financial statements.
60
HARRIS & HARRIS GROUP, INC. CONSOLIDATED SCHEDULE OF INVESTMENTS AS OF DECEMBER 31, 2007 |
Method of | Shares/ | |||||||||
Valuation (1) | Principal | Value | ||||||||
Investments in Non-Controlled Affiliated Companies (2)(10) – 38.06% of net assets at value | ||||||||||
Private Placement Portfolio (Illiquid) – 38.06% of net assets at value | ||||||||||
| Adesto Technologies Corporation (4)(5)(6)(7) — Developing semiconductor-related products enabled at the nanoscale | ||||||||||
| Series A Convertible Preferred Stock | (B) | 3,416,149 | $ | 1,147,826 | ||||||
Ancora Pharmaceuticals Inc. (4)(5)(6)(7) – Developing synthetic carbohydrates for pharmaceutical markets and for internal drug development programs | ||||||||||
| Series B Convertible Preferred Stock | (B) | 909,091 | 639,062 | |||||||
| Warrants at $1.06 expiring 05/01/08 | (B) | 754,717 | 60,377 | |||||||
| 699,439 | ||||||||||
| BridgeLux, Inc. (4)(5)(11) — Manufacturing high-power light emitting diodes | ||||||||||
| Series B Convertible Preferred Stock | (B) | 1,861,504 | 2,792,256 | |||||||
| Series C Convertible Preferred Stock | (B) | 2,130,699 | 3,196,050 | |||||||
| Warrants at $0.7136 expiring 02/02/2017 | (B) | 98,340 | 138,856 | |||||||
| Warrants at $0.7136 expiring 04/26/2017 | (B) | 65,560 | 92,833 | |||||||
| 6,219,995 | ||||||||||
| Cambrios Technologies Corporation (4)(5)(7) — Developing nanowire-enabled electronic materials for the display industry | ||||||||||
| Series B Convertible Preferred Stock | (B) | 1,294,025 | 1,294,025 | |||||||
| Series C Convertible Preferred Stock | (B) | 1,300,000 | 1,300,000 | |||||||
| 2,594,025 | ||||||||||
| Chlorogen, Inc. (4)(5)(12) — Developed patented chloroplast technology to produce plant-made proteins | ||||||||||
| Series A Convertible Preferred Stock | (B) | 4,478,038 | 0 | |||||||
| Series B Convertible Preferred Stock | (B) | 2,077,930 | 0 | |||||||
| Secured Convertible Bridge Note (including interest) | (B) | $ | 176,811 | 0 | ||||||
| 0 | ||||||||||
The accompanying notes are an integral part of these consolidated financial statements.
61
HARRIS & HARRIS GROUP, INC. CONSOLIDATED SCHEDULE OF INVESTMENTS AS OF DECEMBER 31, 2007 |
Method of | Shares/ | |||||||||
Valuation (1) | Principal | Value | ||||||||
Investments in Non-Controlled Affiliated Companies (2)(10) – 38.06% of net assets at value (cont.) | ||||||||||
Private Placement Portfolio (Illiquid) – 38.06% of net assets at value (cont.) | ||||||||||
| Crystal IS, Inc. (4)(5)(7) — Developing single-crystal aluminum nitride substrates for optoelectronic devices | ||||||||||
| Series A Convertible Preferred Stock | (B) | 391,571 | $ | 305,425 | ||||||
| Series A-1 Convertible Preferred Stock | (B) | 1,300,376 | 1,014,294 | |||||||
| Warrants at $0.78 expiring 05/05/2013 | (B) | 15,231 | 9,550 | |||||||
| Warrants at $0.78 expiring 05/12/2013 | (B) | 2,350 | 1,473 | |||||||
| Warrants at $0.78 expiring 08/08/2013 | (B) | 4,396 | 2,796 | |||||||
| 1,333,538 | ||||||||||
| CSwitch, Inc. (4)(5)(7)(13) — Developing next-generation, system-on- a-chip solutions for communications-based platforms | ||||||||||
| Series A-1 Convertible Preferred Stock | (B) | 6,863,118 | 3,431,559 | |||||||
| Secured Convertible Bridge Note (including interest) | (B) | $ | 529,852 | 541,581 | ||||||
| 3,973,140 | ||||||||||
| D-Wave Systems, Inc. (4)(5)(7)(14) — Developing high- performance quantum computing systems | ||||||||||
| Series B Convertible Preferred Stock | (B) | 2,000,000 | 2,226,488 | |||||||
| Ensemble Discovery Corporation (4)(5)(6)(7) – Developing DNA Programmed Chemistry for the discovery of new classes of therapeutics and bioassays | ||||||||||
| Series B Convertible Preferred Stock | (B) | 1,449,275 | 2,000,000 | |||||||
| Innovalight, Inc. (4)(5)(7) – Developing renewable energy products enabled by silicon-based nanomaterials | ||||||||||
| Series B Convertible Preferred Stock | (B) | 16,666,666 | 5,718,216 | |||||||
| Series C Convertible Preferred Stock | (B) | 5,810,577 | 1,993,568 | |||||||
| 7,711,784 | ||||||||||
The accompanying notes are an integral part of these consolidated financial statements.
62
HARRIS & HARRIS GROUP, INC. CONSOLIDATED SCHEDULE OF INVESTMENTS AS OF DECEMBER 31, 2007 |
Method of | Shares/ | |||||||||
Valuation (1) | Principal | Value | ||||||||
Investments in Non-Controlled Affiliated Companies (2)(10) – 38.06% of net assets at value (cont.) | ||||||||||
Private Placement Portfolio (Illiquid) – 38.06% of net assets at value (cont.) | ||||||||||
| Kereos, Inc. (4)(5)(7) — Developing emulsion-based imaging agents and targeted therapeutics to image and treat cancer and cardiovascular disease | ||||||||||
| Series B Convertible Preferred Stock | (B) | 545,456 | $ | 159,743 | ||||||
| Kovio, Inc. (4)(5)(7) — Developing semiconductor products using printed electronics and thin-film technologies | ||||||||||
| Series C Convertible Preferred Stock | (B) | 2,500,000 | 3,125,000 | |||||||
| Series D Convertible Preferred Stock | (B) | 800,000 | 1,000,000 | |||||||
| 4,125,000 | ||||||||||
| Lifco, Inc. (4)(5)(6)(7)(15) — Developing energy solutions using nanostructured materials | ||||||||||
| Series A Convertible Preferred Stock | (B) | 1,208,262 | 946,528 | |||||||
| Mersana Therapeutics, Inc. (4)(5)(7)(16) — Developing advanced polymers for drug delivery | ||||||||||
| Series A Convertible Preferred Stock | (B) | 68,451 | 136,902 | |||||||
| Series B Convertible Preferred Stock | (B) | 866,500 | 1,733,000 | |||||||
| Warrants at $2.00 expiring 10/21/10 | (B) | 91,625 | 118,380 | |||||||
| 1,988,282 | ||||||||||
Metabolon, Inc. (4)(5)(7) – Discovering biomarkers through the use of metabolomics | ||||||||||
| Series B Convertible Preferred Stock | (B) | 2,173,913 | 2,500,000 | |||||||
The accompanying notes are an integral part of these consolidated financial statements.
63
HARRIS & HARRIS GROUP, INC. CONSOLIDATED SCHEDULE OF INVESTMENTS AS OF DECEMBER 31, 2007 |
Method of | Shares/ | |||||||||
Valuation (1) | Principal | Value | ||||||||
Investments in Non-Controlled Affiliated Companies (2)(10) – 38.06% of net assets at value (cont.) | ||||||||||
Private Placement Portfolio (Illiquid) – 38.06% of net assets at value (cont.) | ||||||||||
| NanoGram Corporation (4)(5)(7) — Developing a broad suite of intellectual property utilizing nanoscale materials | ||||||||||
| Series I Convertible Preferred Stock | (B) | 63,210 | $ | 124,524 | ||||||
| Series II Convertible Preferred Stock | (B) | 1,250,904 | 2,464,281 | |||||||
| Series III Convertible Preferred Stock | (B) | 1,242,144 | 2,447,024 | |||||||
| Series IV Convertible Preferred Stock | (B) | 432,179 | 851,393 | |||||||
| 5,887,222 | ||||||||||
| Nanomix, Inc. (4)(5)(7) — Producing nanoelectronic sensors that integrate carbon nanotube electronics with silicon microstructures | ||||||||||
| Series C Convertible Preferred Stock | (B) | 977,917 | 330,228 | |||||||
| Series D Convertible Preferred Stock | (B) | 6,802,397 | 680,240 | |||||||
| 1,010,468 | ||||||||||
NanoOpto Corporation (4)(5)(17) — Manufactured discrete and integrated optical communications sub-components on a chip by utilizing nano manufacturing and nano coating technology | ||||||||||
| Series A-1 Convertible Preferred Stock | (B) | 267,857 | 0 | |||||||
| Series B Convertible Preferred Stock | (B) | 3,819,935 | 0 | |||||||
| Series C Convertible Preferred Stock | (B) | 1,932,789 | 0 | |||||||
| Series D Convertible Preferred Stock | (B) | 1,397,218 | 0 | |||||||
| Warrants at $0.4359 expiring 03/15/10 | (B) | 193,279 | 0 | |||||||
| Secured Convertible Bridge Note (including interest) | (B) | $ | 268,654 | 105,714 | ||||||
| 105,714 | ||||||||||
| Nextreme Thermal Solutions, Inc. (4)(5)(7) — Developing thin-film thermoelectric devices for cooling and energy conversion | ||||||||||
| Series A Convertible Preferred Stock | (B) | 1,750,000 | 1,750,000 | |||||||
The accompanying notes are an integral part of these consolidated financial statements.
64
HARRIS & HARRIS GROUP, INC. CONSOLIDATED SCHEDULE OF INVESTMENTS AS OF DECEMBER 31, 2007 |
Method of | Shares/ | |||||||||
Valuation (1) | Principal | Value | ||||||||
Investments in Non-Controlled Affiliated Companies (2)(10) – 38.06% of net assets at value (cont.) | ||||||||||
Private Placement Portfolio (Illiquid) – 38.06% of net assets at value (cont.) | ||||||||||
| Questech Corporation (4)(5) — Manufacturing and marketing proprietary metal and stone decorative tiles | ||||||||||
| Common Stock | (B) | 655,454 | $ | 589,259 | ||||||
| Warrants at $1.50 expiring 11/19/08 | (B) | 5,000 | 1,085 | |||||||
| Warrants at $1.50 expiring 11/19/09 | (B) | 5,000 | 1,910 | |||||||
| 592,254 | ||||||||||
| Siluria Technologies, Inc. (4)(5)(6)(7) – Developing new-generation nanomaterials | ||||||||||
| Series S-2 Convertible Preferred Stock | (B) | 482,218 | 160,723 | |||||||
| Solazyme, Inc. (4)(5)(7) — Developing energy-harvesting machinery of photosynthetic microbes to produce industrial and pharmaceutical molecules | ||||||||||
| Series A Convertible Preferred Stock | (B) | 988,204 | 997,691 | |||||||
| Series B Convertible Preferred Stock | (B) | 495,246 | 500,000 | |||||||
| 1,497,691 | ||||||||||
| Xradia, Inc. (4)(5) – Designing, manufacturing and selling ultra high resolution 3D x-ray microscopes and fluorescence imaging systems | ||||||||||
| Series D Convertible Preferred Stock | (B) | 3,121,099 | 4,000,000 | |||||||
| Zia Laser, Inc. (4)(5)(18) — Developed quantum dot semiconductor lasers | ||||||||||
| Series C Convertible Preferred Stock | (B) | 1,500,000 | 21,329 | |||||||
Total Non-Controlled Private Placement Portfolio (cost: $54,306,393) | $ | 52,651,189 | ||||||||
Total Investments in Non-Controlled Affiliated Companies (cost: $54,306,393) | $ | 52,651,189 | ||||||||
The accompanying notes are an integral part of these consolidated financial statements.
65
HARRIS & HARRIS GROUP, INC. CONSOLIDATED SCHEDULE OF INVESTMENTS AS OF DECEMBER 31, 2007 |
Method of | Shares/ | |||||||||
Valuation (1) | Principal | Value | ||||||||
Investments in Controlled Affiliated Companies (2)(19) – 3.15% of net assets at value | ||||||||||
Private Placement Portfolio (Illiquid) – 3.15% of net assets at value | ||||||||||
| Evolved Nanomaterial Sciences, Inc. (4)(5)(20) — Developed nanoscale-enhanced approaches for the resolution of chiral molecules | ||||||||||
| Series A Convertible Preferred Stock | (B) | 5,870,021 | $ | 0 | ||||||
| Phoenix Molecular Corporation (4)(5)(6)(7) – Developing technology to enable the separation of difficult-to-separate materials. | ||||||||||
| Common Stock | (B) | 1,000 | 10 | |||||||
| Unsecured Convertible Bridge Note (including interest) | (B) | $ | 50,000 | 50,733 | ||||||
| 50,743 | ||||||||||
| SiOnyx, Inc. (4)(5)(7) — Developing silicon-based optoelectronic products enabled by its proprietary "Black Silicon" | ||||||||||
| Series A Convertible Preferred Stock | (B) | 233,499 | 135,686 | |||||||
| Series A-1 Convertible Preferred Stock | (B) | 2,966,667 | 1,723,930 | |||||||
| Series A-2 Convertible Preferred Stock | (B) | 4,207,537 | 2,445,000 | |||||||
| 4,304,616 | ||||||||||
Total Controlled Private Placement Portfolio (cost: $6,935,743) | $ | 4,355,359 | ||||||||
Total Investments in Controlled Affiliated Companies (cost: $6,935,743) | $ | 4,355,359 | ||||||||
Total Private Placement Portfolio (cost: $82,677,528) | $ | 78,110,384 | ||||||||
The accompanying notes are an integral part of these consolidated financial statements.
66
HARRIS & HARRIS GROUP, INC. CONSOLIDATED SCHEDULE OF INVESTMENTS AS OF DECEMBER 31, 2007 |
U.S. Government and Agency Securities –43.50% of net assets at value | ||||||||||
| U.S. Treasury Bill — due date 02/21/08 | (J) | $ | 2,750,000 | $ | 2,738,725 | |||||
| U.S. Treasury Notes — due date 02/15/08, coupon 3.375% | (H) | 15,005,000 | 15,006,200 | |||||||
| U.S. Treasury Notes — due date 05/15/08, coupon 3.75% | (H) | 9,000,000 | 9,010,530 | |||||||
| U.S. Treasury Notes — due date 09/15/08, coupon 3.125% | (H) | 5,000,000 | 4,991,800 | |||||||
| U.S. Treasury Notes — due date 01/15/09, coupon 3.25% | (H) | 3,000,000 | 3,005,160 | |||||||
| U.S. Treasury Notes — due date 02/15/09, coupon 4.50% | (H) | 5,100,000 | 5,176,908 | |||||||
| U.S. Treasury Notes — due date 04/15/09, coupon 3.125% | (H) | 3,000,000 | 3,001,410 | |||||||
| U.S. Treasury Notes — due date 07/15/09, coupon 3.625% | (H) | 3,000,000 | 3,023,910 | |||||||
| U.S. Treasury Notes — due date 10/15/09, coupon 3.375% | (H) | 3,000,000 | 3,018,510 | |||||||
| U.S. Treasury Notes — due date 01/15/10, coupon 3.625% | (H) | 3,000,000 | 3,034,680 | |||||||
| U.S. Treasury Notes — due date 04/15/10, coupon 4.00% | (H) | 3,000,000 | 3,060,930 | |||||||
| U.S. Treasury Notes — due date 07/15/10, coupon 3.875% | (H) | 3,000,000 | 3,060,930 | |||||||
| U.S. Treasury Notes — due date 10/15/10, coupon 4.25% | (H) | 2,000,000 | 2,063,900 | |||||||
Total Investments in U.S. Government and Agency Securities (cost: $59,552,933) | $ | 60,193,593 | ||||||||
Total Investments (cost: $142,230,461) | $ | 138,303,977 |
The accompanying notes are an integral part of these consolidated financial statements.
67
HARRIS & HARRIS GROUP, INC. CONSOLIDATED SCHEDULE OF INVESTMENTS AS OF DECEMBER 31, |
Method of | Shares/ | |||||||||
Valuation (3) | Principal | Value | ||||||||
Investments in Unaffiliated Companies (6)(7) - 15.61% of net assets | ||||||||||
Private Placement Portfolio (Illiquid) - 15.61% of net assets | ||||||||||
| AlphaSimplex Group, LLC (2) -- Investment management company headed by | ||||||||||
| Dr. Andrew W. Lo, holder of the Harris & Harris Group Chair at MIT | ||||||||||
| Limited Liability Company Interest | (B | ) | -- | $ | 10,521 | |||||
| �� | ||||||||||
| Exponential Business Development Company (1)(2) -- | ||||||||||
| Venture capital partnership focused on early stage companies | ||||||||||
| Limited Partnership Interest | (B | ) | -- | 0 | ||||||
| Molecular Imprints, Inc. (1)(2) -- Manufacturing nanoimprint lithography | ||||||||||
| capital equipment | ||||||||||
| Series B Convertible Preferred Stock | (A | ) | 1,333,333 | 2,000,000 | ||||||
| Series C Convertible Preferred Stock | (A | ) | 1,250,000 | 2,500,000 | ||||||
| Warrants at $2.00 expiring12/31/11 | (B | ) | 125,000 | 0 | ||||||
| 4,500,000 | ||||||||||
| Nanosys, Inc. (1)(2)(5) -- Developing zero and one-dimensional | ||||||||||
| inorganic nanometer-scale materials for use in nanotechnology- | ||||||||||
| enabled systems | ||||||||||
| Series C Convertible Preferred Stock | (C | ) | 803,428 | 2,370,113 | ||||||
| Series D Convertible Preferred Stock | (C | ) | 1,016,950 | 3,000,003 | ||||||
| 5,370,116 | ||||||||||
| Nantero, Inc. (1)(2)(5) -- Developing a high-density, nonvolatile, random | ||||||||||
| access memory chip, enabled by carbon nanotubes | ||||||||||
| Series A Convertible Preferred Stock | (C | ) | 345,070 | 1,046,908 | ||||||
| Series B Convertible Preferred Stock | (C | ) | 207,051 | 628,172 | ||||||
| Series C Convertible Preferred Stock | (C | ) | 188,315 | 571,329 | ||||||
| 2,246,409 | ||||||||||
Notes to Consolidated Schedule of Investments
| (1) | See Footnote to Consolidated Schedule of Investments on page 78 for a description of the Valuation Procedures. |
| (2) | Investments in unaffiliated companies consist of investments in which we own less than five percent of the voting shares of the portfolio company. Investments in non-controlled affiliated companies consist of investments in which we own five percent or more, but less than 25 percent, of the voting shares of the portfolio company, or where we hold one or more seats on the portfolio company’s Board of Directors but do not control the company. Investments in controlled affiliated companies consist of investments in which we own 25 percent or more of the voting shares of the portfolio company or otherwise control the company. |
| (3) | The aggregate cost for federal income tax purposes of investments in unaffiliated companies is $21,435,392. The gross unrealized appreciation based on the tax cost for these securities is $1,732,194. The gross unrealized depreciation based on the tax cost for these securities is $2,063,750. |
| (4) | Legal restrictions on sale of investment. |
| (5) | Represents a non-income producing security. Equity investments that have not paid dividends within the last 12 months are considered to be non-income producing. |
| (6) | Initial investment was made during 2007. |
| (7) | These investments are development stage companies. A development stage company is defined as a company that is devoting substantially all of its efforts to establishing a new business, and either it has not yet commenced its planned principal operations, or it has commenced such operations but has not realized significant revenue from them. |
| (8) | With our purchase of Series E Convertible Preferred Stock of BioVex, we received a warrant to purchase a number of shares of common stock of BioVex as determined by dividing 624,999.99 by the price per share at which the common stock is offered and sold to the public in connection with the initial public offering. The ability to exercise this warrant is therefore contingent on BioVex completing successfully an initial public offering before the expiration date of the warrant of September 27, 2012. The exercise price of this warrant shall be 110 percent of the initial public offering price. |
| (9) | Continuum Photonics, Inc., merged with Polatis, Ltd., to form Polatis, Inc. |
The accompanying notes are an integral part of these consolidated financial statements.
HARRIS & HARRIS GROUP, INC. CONSOLIDATED SCHEDULE OF INVESTMENTS AS OF DECEMBER 31, 2007 |
| (10) | The aggregate cost for federal income tax purposes of investments in non-controlled affiliated companies is $54,306,393. The gross unrealized appreciation based on the tax cost for these securities is $10,915,201. The gross unrealized depreciation based on the tax cost for these securities is $12,570,405. |
| (11) | BridgeLux, Inc., was previously named eLite Optoelectronics, Inc. |
| (12) | On November 30, 2007, Chlorogen filed a Certificate of Dissolution with the state of Delaware. |
| (13) | With our investment in a secured convertible bridge note issued by CSwitch, we received a warrant to purchase a number of shares of the class of stock sold in the next financing of CSwitch equal to $529,322.36, the principal of the note, divided by the lowest price per share of the class of stock sold in the next financing of CSwitch. The ability to exercise this warrant is therefore contingent on CSwitch completing successfully a subsequent round of financing. The warrant will expire five years from the date of the close of the next round of financing. The cost basis of this warrant is $529.32. |
| (14) | D-Wave Systems, Inc., is located and is doing business primarily in Canada. We invested in D-Wave Systems, Inc., through D-Wave USA, a Delaware company. Our investment is denominated in Canadian dollars and is subject to foreign currency translation. See "Note 2. Summary of Significant Accounting Policies." |
| (15) | On February 28, 2008, Lifco, Inc., merged with CFX Battery, Inc., to form CFX Battery, Inc. |
| (16) | Mersana Therapeutics, Inc., was previously named Nanopharma Corp. |
| (17) | On July 19, 2007, NanoOpto Corporation sold its assets to API Nanotronics, Inc. |
| (18) | On November 30, 2006, the assets of Zia Laser, Inc., were acquired by Innolume, Inc. |
| (19) | The aggregate cost for federal income tax purposes of investments in controlled affiliated companies is $6,935,743. The gross unrealized appreciation based on the tax cost for these securities is $219,616. The gross unrealized depreciation based on the tax cost for these securities is $2,800,000. |
| (20) | On September 30, 2007, Evolved Nanomaterial Sciences, Inc., filed for Chapter 7 bankruptcy. |
The accompanying notes are an integral part of this consolidated schedule.
69
HARRIS & HARRIS GROUP, INC. CONSOLIDATED SCHEDULE OF INVESTMENTS AS OF DECEMBER 31, 2006 |
Method of Valuation (3) | Shares/ Principal | Value | ||||||||
Investments in Unaffiliated Companies (6)(7) – 15.61% of net assets | ||||||||||
Private Placement Portfolio (Illiquid) – 15.61% of net assets | ||||||||||
| AlphaSimplex Group, LLC (2) — Investment management company headed by | ||||||||||
Dr. Andrew W. Lo, holder of the Harris & Harris Group Chair at MIT Limited Liability Company Interest | (B) | — | $ | 10,521 | ||||||
| Exponential Business Development Company (1)(2) — | ||||||||||
Venture capital partnership focused on early stage companies Limited Partnership Interest | (B) | — | 0 | |||||||
| Molecular Imprints, Inc. (1)(2) — Manufacturing nanoimprint lithography capital equipment | ||||||||||
| Series B Convertible Preferred Stock | (A) | 1,333,333 | 2,000,000 | |||||||
| Series C Convertible Preferred Stock | (A) | 1,250,000 | 2,500,000 | |||||||
| Warrants at $2.00 expiring12/31/11 | (B) | 125,000 | 0 | |||||||
| 4,500,000 | ||||||||||
| Nanosys, Inc. (1)(2)(5) — Developing zero and one-dimensional inorganic nanometer-scale materials for use in nanotechnology- enabled systems | ||||||||||
| Series C Convertible Preferred Stock | (C) | 803,428 | 2,370,113 | |||||||
| Series D Convertible Preferred Stock | (C) | 1,016,950 | 3,000,003 | |||||||
| 5,370,116 | ||||||||||
| Nantero, Inc. (1)(2)(5) — Developing a high-density, nonvolatile, random access memory chip, enabled by carbon nanotubes | ||||||||||
| Series A Convertible Preferred Stock | (C) | 345,070 | 1,046,908 | |||||||
| Series B Convertible Preferred Stock | (C) | 207,051 | 628,172 | |||||||
| Series C Convertible Preferred Stock | (C) | 188,315 | 571,329 | |||||||
| 2,246,409 | ||||||||||
The accompanying notes are an integral part of these consolidated financial statements.
70
HARRIS & HARRIS GROUP, INC. CONSOLIDATED SCHEDULE OF INVESTMENTS AS OF DECEMBER 31, 2006 |
Method of Valuation (3) | Shares/ Principal | Value | ||||||||
Investments in Unaffiliated Companies (6)(7) – 15.61% of net assets (cont.) | ||||||||||
Private Placement Portfolio (Illiquid) – 15.61% of net assets (cont.) | ||||||||||
| NeoPhotonics Corporation (1)(2) — Developing and manufacturing planar optical devices and components | ||||||||||
| Common Stock | (C) | 716,195 | $ | 133,141 | ||||||
| Series 1 Convertible Preferred Stock | (C) | 1,831,256 | 1,831,256 | |||||||
| Series 2 Convertible Preferred Stock | (C) | 741,898 | 741,898 | |||||||
| Series 3 Convertible Preferred Stock | (C) | 2,750,000 | 2,750,000 | |||||||
| Warrants at $0.15 expiring 01/26/10 | (C) | 16,364 | 164 | |||||||
| Warrants at $0.15 expiring 12/05/10 | (C) | 14,063 | 140 | |||||||
| 5,456,599 | ||||||||||
| Polatis, Inc. (1)(2)(5)(10) — Developing optical networking components by merging materials, MEMS and electronics technologies | ||||||||||
| Series A-1 Convertible Preferred Stock | (B) | 16,775 | 0 | |||||||
| Series A-2 Convertible Preferred Stock | (B) | 71,611 | 141,520 | |||||||
| Series A-4 Convertible Preferred Stock | (B) | 4,774 | 9,435 | |||||||
| Series A-5 Convertible Preferred Stock | (B) | 5,491 | 45,127 | |||||||
| 196,082 | ||||||||||
Total Unaffiliated Private Placement Portfolio (cost: $18,107,124) | $ | 17,779,727 | ||||||||
Total Investments in Unaffiliated Companies (cost: $18,107,124) | $ | 17,779,727 | ||||||||
Method of | Shares/ | |||||||||
Valuation (3) | Principal | Value | ||||||||
Investments in Unaffiliated Companies (6)(7) - 15.61% of net assets (cont.) | ||||||||||
Private Placement Portfolio (Illiquid) - 15.61% of net assets (cont.) | ||||||||||
| NeoPhotonics Corporation (1)(2) -- Developing and manufacturing | ||||||||||
| planar optical devices and components | ||||||||||
| Common Stock | (C | ) | 716,195 | $ | 133,141 | |||||
| Series 1 Convertible Preferred Stock | (C | ) | 1,831,256 | 1,831,256 | ||||||
| Series 2 Convertible Preferred Stock | (C | ) | 741,898 | 741,898 | ||||||
| Series 3 Convertible Preferred Stock | (C | ) | 2,750,000 | 2,750,000 | ||||||
| Warrants at $0.15 expiring 01/26/10 | (C | ) | 16,364 | 164 | ||||||
| Warrants at $0.15 expiring 12/05/10 | (C | ) | 14,063 | 140 | ||||||
| 5,456,599 | ||||||||||
| Polatis, Inc. (1)(2)(5)(10) -- Developing optical networking components | ||||||||||
| by merging materials, MEMS and electronics technologies | ||||||||||
| Series A-1 Convertible Preferred Stock | (B | ) | 16,775 | 0 | ||||||
| Series A-2 Convertible Preferred Stock | (B | ) | 71,611 | 141,520 | ||||||
| Series A-4 Convertible Preferred Stock | (B | ) | 4,774 | 9,435 | ||||||
| Series A-5 Convertible Preferred Stock | (B | ) | 5,491 | 45,127 | ||||||
| 196,082 | ||||||||||
Total Unaffiliated Private Placement Portfolio (cost: $18,107,124) | $ | 17,779,727 | ||||||||
Total Investments in Unaffiliated Companies (cost: $18,107,124) | $ | 17,779,727 | ||||||||
The accompanying notes are an integral part of these consolidated financial statements.
Method of | Shares/ | |||||||||
Valuation (3) | Principal | Value | ||||||||
Investments in Non-Controlled Affiliated Companies (6)(8) -28.20% of net assets | ||||||||||
Private Placement Portfolio (Illiquid) - 28.20% of net assets | ||||||||||
| BridgeLux, Inc. (1)(2)(11) -- Manufacturing high-power light | ||||||||||
| emitting diodes | ||||||||||
| Series B Convertible Preferred Stock | (A | ) | 1,861,504 | $ | 1,000,000 | |||||
| Cambrios Technologies Corporation (1)(2)(5) -- Developing nanowire- | ||||||||||
| enabled electronic materials for the display industry | ||||||||||
| Series B Convertible Preferred Stock | (A | ) | 1,294,025 | 1,294,025 | ||||||
| Chlorogen, Inc. (1)(2)(5) -- Developing patented chloroplast technology | ||||||||||
| to produce plant-made proteins | ||||||||||
| Series A Convertible Preferred Stock | (C | ) | 4,478,038 | 785,000 | ||||||
| Series B Convertible Preferred Stock | (C | ) | 2,077,930 | 364,261 | ||||||
| Secured Convertible Bridge Note (including interest) | (A | ) | $ | 221,438 | 225,697 | |||||
| 1,374,958 | ||||||||||
| Crystal IS, Inc. (1)(2)(5) -- Developing single-crystal | ||||||||||
| aluminum nitride substrates for optoelectronic devices | ||||||||||
| Series A Convertible Preferred Stock | (C | ) | 391,571 | 305,425 | ||||||
| Series A-1 Convertible Preferred Stock | (C | ) | 1,300,376 | 1,014,294 | ||||||
| Warrants at $0.78 expiring 05/05/2013 | (B | ) | 15,231 | 0 | ||||||
| Warrants at $0.78 expiring 05/12/2013 | (B | ) | 2,350 | 0 | ||||||
| Warrants at $0.78 expiring 08/08/2013 | (B | ) | 4,396 | 0 | ||||||
| 1,319,719 | ||||||||||
| CSwitch, Inc. (1)(2)(5) -- Developing next-generation, system-on-a-chip | ||||||||||
| solutions for communications-based platforms | ||||||||||
| Series A-1 Convertible Preferred Stock | (C | ) | 6,700,000 | 3,350,000 | ||||||
HARRIS & HARRIS GROUP, INC. CONSOLIDATED SCHEDULE OF INVESTMENTS AS OF DECEMBER 31, 2006 |
Method of Valuation (3) | Shares/ Principal | Value | ||||||||
Investments in Non-Controlled Affiliated Companies (6)(8) – 28.20% of net assets | ||||||||||
Private Placement Portfolio (Illiquid) – 28.20% of net assets | ||||||||||
| BridgeLux, Inc. (1)(2)(11) — Manufacturing high-power light emitting diodes | ||||||||||
| Series B Convertible Preferred Stock | (A) | 1,861,504 | $ | 1,000,000 | ||||||
| Cambrios Technologies Corporation (1)(2)(5) — Developing nanowire- enabled electronic materials for the display industry | ||||||||||
| Series B Convertible Preferred Stock | (A) | 1,294,025 | 1,294,025 | |||||||
| Chlorogen, Inc. (1)(2)(5) — Developing patented chloroplast technology to produce plant-made proteins | ||||||||||
| Series A Convertible Preferred Stock | (C) | 4,478,038 | 785,000 | |||||||
| Series B Convertible Preferred Stock | (C) | 2,077,930 | 364,261 | |||||||
| Secured Convertible Bridge Note (including interest) | (A) | $ | 221,438 | 225,697 | ||||||
| 1,374,958 | ||||||||||
| Crystal IS, Inc. (1)(2)(5) — Developing single-crystal aluminum nitride substrates for optoelectronic devices | ||||||||||
| Series A Convertible Preferred Stock | (C) | 391,571 | 305,425 | |||||||
| Series A-1 Convertible Preferred Stock | (C) | 1,300,376 | 1,014,294 | |||||||
| Warrants at $0.78 expiring 05/05/2013 | (B) | 15,231 | 0 | |||||||
| Warrants at $0.78 expiring 05/12/2013 | (B) | 2,350 | 0 | |||||||
| Warrants at $0.78 expiring 08/08/2013 | (B) | 4,396 | 0 | |||||||
| 1,319,719 | ||||||||||
| CSwitch, Inc. (1)(2)(5) — Developing next-generation, system-on-a-chip solutions for communications-based platforms | ||||||||||
| Series A-1 Convertible Preferred Stock | (C) | 6,700,000 | 3,350,000 | |||||||
Method of | Shares/ | |||||||||
Valuation (3) | Principal | Value | ||||||||
Investments in Non-Controlled Affiliated Companies (6)(8) - 28.20% of net assets (cont.) | ||||||||||
Private Placement Portfolio (Illiquid) - 28.20% of net assets (cont.) | ||||||||||
| D-Wave Systems, Inc. (1)(2)(4)(5)(13) -- Developing high-performance | ||||||||||
| quantum computing systems | ||||||||||
| Series B Convertible Preferred Stock | (A | ) | 2,000,000 | $ | 1,716,444 | |||||
| Warrants at $0.85 expiring 10/19/07 | (B | ) | 1,800,000 | 0 | ||||||
| 1,716,444 | ||||||||||
| Innovalight, Inc. (1)(2)(4)(5) - Developing renewable energy products | ||||||||||
| enabled by silicon-based nanomaterials | ||||||||||
| Series B Convertible Preferred Stock | (A | ) | 16,666,666 | 2,500,000 | ||||||
| Kereos, Inc. (1)(2)(5) -- Developing emulsion-based imaging | ||||||||||
| agents and targeted therapeutics to image and treat cancer | ||||||||||
| and cardiovascular disease | ||||||||||
| Series B Convertible Preferred Stock | (A | ) | 349,092 | 960,000 | ||||||
| Kovio, Inc. (1)(2)(5) -- Developing semiconductor products | ||||||||||
| using printed electronics and thin-film technologies | ||||||||||
| Series C Convertible Preferred Stock | (A | ) | 2,500,000 | 3,000,000 | ||||||
| Mersana Therapeutics, Inc. (1)(2)(5)(12) -- Developing advanced | ||||||||||
| polymers for drug delivery | ||||||||||
| Series A Convertible Preferred Stock | (C | ) | 68,452 | 136,904 | ||||||
| Series B Convertible Preferred Stock | (C | ) | 616,500 | 1,233,000 | ||||||
| Warrants at $2.00 expiring 10/21/10 | (B | ) | 91,625 | 0 | ||||||
| 1,369,904 | ||||||||||
| Metabolon, Inc. (1)(2)(4)(5) - Discovering biomarkers through | ||||||||||
| the use of metabolomics | ||||||||||
| Series B Convertible Preferred Stock | (A | ) | 2,173,913 | 2,500,000 | ||||||
The accompanying notes are an integral part of these consolidated financial statements.
HARRIS & HARRIS GROUP, INC. CONSOLIDATED SCHEDULE OF INVESTMENTS AS OF DECEMBER 31, 2006 |
Method of | Shares/ | |||||||||
Valuation (3) | Principal | Value | ||||||||
Investments in Non-Controlled Affiliated Companies (6)(8) - 28.20% of net assets (cont.) | ||||||||||
Private Placement Portfolio (Illiquid) - 28.20% of net assets (cont.) | ||||||||||
| NanoGram Corporation (1)(2)(5) -- Developing a broad suite of intellectual | ||||||||||
| property utilizing nanotechnology | ||||||||||
| Series I Convertible Preferred Stock | (C | ) | 63,210 | $ | 64,259 | |||||
| Series II Convertible Preferred Stock | (C | ) | 1,250,904 | 1,271,670 | ||||||
| Series III Convertible Preferred Stock | (C | ) | 1,242,144 | 1,262,764 | ||||||
| 2,598,693 | ||||||||||
| Nanomix, Inc. (1)(2)(5) -- Producing nanoelectronic sensors that | ||||||||||
| integrate carbon nanotube electronics with silicon microstructures | ||||||||||
| Series C Convertible Preferred Stock | (B | ) | 9,779,181 | 790,000 | ||||||
| NanoOpto Corporation (1)(2)(5) -- Manufacturing discrete and integrated | ||||||||||
| optical communications sub-components on a chip by utilizing | ||||||||||
| nano manufacturing and nano coating technology | ||||||||||
| Series A-1 Convertible Preferred Stock | (B | ) | 267,857 | 16,400 | ||||||
| Series B Convertible Preferred Stock | (B | ) | 3,819,935 | 560,328 | ||||||
| Series C Convertible Preferred Stock | (B | ) | 1,932,789 | 425,266 | ||||||
| Series D Convertible Preferred Stock | (B | ) | 1,397,218 | 204,951 | ||||||
| Warrants at $0.4359 expiring 03/15/10 | (B | ) | 193,279 | 0 | ||||||
| 1,206,945 | ||||||||||
| Nextreme Thermal Solutions, Inc. (1)(2)(5) -- Developing thin-film | ||||||||||
| thermoelectric devices | ||||||||||
| Series A Convertible Preferred Stock | (A | ) | 1,000,000 | 1,000,000 | ||||||
| Questech Corporation (1)(2) -- Manufacturing and marketing | ||||||||||
| proprietary metal and stone decorative tiles | ||||||||||
| Common Stock | (B | ) | 655,454 | 996,683 | ||||||
| Warrants at $1.50 expiring 11/21/07 | (B | ) | 3,750 | 77 | ||||||
| Warrants at $1.50 expiring 11/19/08 | (B | ) | 5,000 | 103 | ||||||
| Warrants at $1.50 expiring 11/19/09 | (B | ) | 5,000 | 103 | ||||||
| 996,966 | ||||||||||
Method of Valuation (3) | Shares/ Principal | Value | ||||||||
Investments in Non-Controlled Affiliated Companies (6)(8) – 28.20% of net assets (cont.) | ||||||||||
Private Placement Portfolio (Illiquid) – 28.20% of net assets (cont.) | ||||||||||
| D-Wave Systems, Inc. (1)(2)(4)(5)(13) — Developing high-performance quantum computing systems | ||||||||||
| Series B Convertible Preferred Stock | (A) | 2,000,000 | $ | 1,716,444 | ||||||
| Warrants at $0.85 expiring 10/19/07 | (B) | 1,800,000 | 0 | |||||||
| 1,716,444 | ||||||||||
| Innovalight, Inc. (1)(2)(4)(5) - Developing renewable energy products enabled by silicon-based nanomaterials | ||||||||||
| Series B Convertible Preferred Stock | (A) | 16,666,666 | 2,500,000 | |||||||
| Kereos, Inc. (1)(2)(5) — Developing emulsion-based imaging agents and targeted therapeutics to image and treat cancer and cardiovascular disease | ||||||||||
| Series B Convertible Preferred Stock | (A) | 349,092 | 960,000 | |||||||
| Kovio, Inc. (1)(2)(5) — Developing semiconductor products using printed electronics and thin-film technologies | ||||||||||
| Series C Convertible Preferred Stock | (A) | 2,500,000 | 3,000,000 | |||||||
| Mersana Therapeutics, Inc. (1)(2)(5)(12) — Developing advanced polymers for drug delivery | ||||||||||
| Series A Convertible Preferred Stock | (C) | 68,452 | 136,904 | |||||||
| Series B Convertible Preferred Stock | (C) | 616,500 | 1,233,000 | |||||||
| Warrants at $2.00 expiring 10/21/10 | (B) | 91,625 | 0 | |||||||
| 1,369,904 | ||||||||||
| Metabolon, Inc. (1)(2)(4)(5) - Discovering biomarkers through the use of metabolomics | ||||||||||
| Series B Convertible Preferred Stock | (A) | 2,173,913 | 2,500,000 | |||||||
The accompanying notes are an integral part of these consolidated financial statements.
HARRIS & HARRIS GROUP, INC. CONSOLIDATED SCHEDULE OF INVESTMENTS AS OF DECEMBER 31, 2006 |
Method of | Shares/ | |||||||||
Valuation (3) | Principal | Value | ||||||||
Investments in Non-Controlled Affiliated Companies (6)(8) - 28.20% of net assets (cont.) | ||||||||||
Private Placement Portfolio (Illiquid) - 28.20% of net assets (cont.) | ||||||||||
| Solazyme, Inc. (1)(2)(5) -- Developing energy-harvesting | ||||||||||
| machinery of photosynthetic microbes to produce industrial | ||||||||||
| and pharmaceutical molecules | ||||||||||
| Series A Convertible Preferred Stock | (C | ) | 988,204 | $ | 385,400 | |||||
| Starfire Systems, Inc. (1)(2)(5) --Producing ceramic-forming polymers | ||||||||||
| Common Stock | (A | ) | 375,000 | 150,000 | ||||||
| Series A-1 Convertible Preferred Stock | (C | ) | 600,000 | 600,000 | ||||||
| 750,000 | ||||||||||
| Xradia, Inc. (1)(2)(4) - Designing, manufacturing and selling ultra high | ||||||||||
| resolution 3D x-ray microscopes and fluorescence imaging systems. | ||||||||||
| Series D Convertible Preferred Stock | (A | ) | 3,121,099 | 4,000,000 | ||||||
| Zia Laser, Inc. (1)(2)(5) -- Developing quantum dot semiconductor lasers | ||||||||||
| Series C Convertible Preferred Stock | (C | ) | 1,500,000 | 15,000 | ||||||
Total Non-Controlled Private Placement Portfolio (cost: $39,571,676) | $ | 32,128,054 | ||||||||
Total Investments in Non-Controlled Affiliated Companies (cost: $39,571,676) | $ | 32,128,054 | ||||||||
Method of Valuation (3) | Shares/ Principal | Value | ||||||||
Investments in Non-Controlled Affiliated Companies (6)(8) – 28.20% of net assets (cont.) | ||||||||||
Private Placement Portfolio (Illiquid) – 28.20% of net assets (cont.) | ||||||||||
| NanoGram Corporation (1)(2)(5) — Developing a broad suite of intellectual property utilizing nanotechnology | ||||||||||
| Series I Convertible Preferred Stock | (C) | 63,210 | $ | 64,259 | ||||||
| Series II Convertible Preferred Stock | (C) | 1,250,904 | 1,271,670 | |||||||
| Series III Convertible Preferred Stock | (C) | 1,242,144 | 1,262,764 | |||||||
| 2,598,693 | ||||||||||
| Nanomix, Inc. (1)(2)(5) — Producing nanoelectronic sensors that integrate carbon nanotube electronics with silicon microstructures | ||||||||||
| Series C Convertible Preferred Stock | (B) | 9,779,181 | 790,000 | |||||||
| NanoOpto Corporation (1)(2)(5) — Manufacturing discrete and integrated optical communications sub-components on a chip by utilizing nano manufacturing and nano coating technology | ||||||||||
| Series A-1 Convertible Preferred Stock | (B) | 267,857 | 16,400 | |||||||
| Series B Convertible Preferred Stock | (B) | 3,819,935 | 560,328 | |||||||
| Series C Convertible Preferred Stock | (B) | 1,932,789 | 425,266 | |||||||
| Series D Convertible Preferred Stock | (B) | 1,397,218 | 204,951 | |||||||
| Warrants at $0.4359 expiring 03/15/10 | (B) | 193,279 | 0 | |||||||
| 1,206,945 | ||||||||||
| Nextreme Thermal Solutions, Inc. (1)(2)(5) — Developing thin-film thermoelectric devices | ||||||||||
| Series A Convertible Preferred Stock | (A) | 1,000,000 | 1,000,000 | |||||||
| Questech Corporation (1)(2) — Manufacturing and marketing proprietary metal and stone decorative tiles | ||||||||||
| Common Stock | (B) | 655,454 | 996,683 | |||||||
| Warrants at $1.50 expiring 11/21/07 | (B) | 3,750 | 77 | |||||||
| Warrants at $1.50 expiring 11/19/08 | (B) | 5,000 | 103 | |||||||
| Warrants at $1.50 expiring 11/19/09 | (B) | 5,000 | 103 | |||||||
| 996,966 | ||||||||||
The accompanying notes are an integral part of these consolidated financial statements.
HARRIS & HARRIS GROUP, INC. CONSOLIDATED SCHEDULE OF INVESTMENTS AS OF DECEMBER 31, 2006 |
Method of Valuation (3) | Shares/ Principal | Value | ||||||||
Investments in Non-Controlled Affiliated Companies (6)(8) – 28.20% of net assets (cont.) | ||||||||||
Private Placement Portfolio (Illiquid) – 28.20% of net assets (cont.) | ||||||||||
| Solazyme, Inc. (1)(2)(5) — Developing energy-harvesting machinery of photosynthetic microbes to produce industrial and pharmaceutical molecules | ||||||||||
| Series A Convertible Preferred Stock | (C) | 988,204 | $ | 385,400 | ||||||
| Starfire Systems, Inc. (1)(2)(5) —Producing ceramic-forming polymers | ||||||||||
| Common Stock | (A) | 375,000 | 150,000 | |||||||
| Series A-1 Convertible Preferred Stock | (C) | 600,000 | 600,000 | |||||||
| 750,000 | ||||||||||
| Xradia, Inc. (1)(2)(4) - Designing, manufacturing and selling ultra high resolution 3D x-ray microscopes and fluorescence imaging systems. | ||||||||||
| Series D Convertible Preferred Stock | (A) | 3,121,099 | 4,000,000 | |||||||
| Zia Laser, Inc. (1)(2)(5) — Developing quantum dot semiconductor lasers | ||||||||||
| Series C Convertible Preferred Stock | (C) | 1,500,000 | 15,000 | |||||||
Total Non-Controlled Private Placement Portfolio (cost: $39,571,676) | $ | 32,128,054 | ||||||||
Total Investments in Non-Controlled Affiliated Companies (cost: $39,571,676) | $ | 32,128,054 | ||||||||
The accompanying notes are an integral part of these consolidated financial statements.
75
HARRIS & HARRIS GROUP, INC. CONSOLIDATED SCHEDULE OF INVESTMENTS AS OF DECEMBER 31, 2006 |
Method of | Shares/ | |||||||||
Valuation (3) | Principal | Value | ||||||||
Investments in Controlled Affiliated Companies (6)(9) - 3.30% of net assets | ||||||||||
Private Placement Portfolio (Illiquid) - 3.30% of net assets | ||||||||||
| Evolved Nanomaterial Sciences, Inc. (1)(2)(4)(5) -- Developing | ||||||||||
| nanotechnology-enhanced approaches for the resolution of | ||||||||||
| chiral molecules | ||||||||||
| Series A Convertible Preferred Stock | (A | ) | 5,870,021 | $ | 2,800,000 | |||||
| SiOnyx, Inc. (1)(2)(4)(5) -- Developing silicon-based | ||||||||||
| optoelectronic products enabled by its proprietary, "Black Silicon" | ||||||||||
| Series A Convertible Preferred Stock | (C | ) | 233,499 | 70,050 | ||||||
| Series A-1 Convertible Preferred Stock | (C | ) | 2,966,667 | 890,000 | ||||||
| 960,050 | ||||||||||
Total Controlled Private Placement Portfolio (cost: $4,440,000) | $ | 3,760,050 | ||||||||
Total Investments in Controlled Affiliated Companies (cost: $4,440,000) | $ | 3,760,050 | ||||||||
U.S. Government and Agency Securities - 51.48% of net assets | ||||||||||
| U.S. Treasury Bill -- due date 1/18/07 | (J | ) | 2,217,000 | 2,212,677 | ||||||
| U.S. Treasury Notes -- due date 11/30/07, coupon 4.25% | (H | ) | 6,500,000 | 6,455,345 | ||||||
| U.S. Treasury Notes -- due date 02/15/08, coupon 3.375% | (H | ) | 9,000,000 | 8,842,860 | ||||||
| U.S. Treasury Notes -- due date 05/15/08, coupon 3.75% | (H | ) | 9,000,000 | 8,862,210 | ||||||
| U.S. Treasury Notes -- due date 09/15/08, coupon 3.125% | (H | ) | 5,000,000 | 4,861,350 | ||||||
| U.S. Treasury Notes -- due date 01/15/09, coupon 3.25% | (H | ) | 3,000,000 | 2,910,930 | ||||||
| U.S. Treasury Notes -- due date 02/15/09, coupon 4.50% | (H | ) | 5,100,000 | 5,069,145 | ||||||
| U.S. Treasury Notes -- due date 04/15/09, coupon 3.125% | (H | ) | 3,000,000 | 2,893,830 | ||||||
| U.S. Treasury Notes -- due date 07/15/09, coupon 3.625% | (H | ) | 3,000,000 | 2,920,890 | ||||||
| U.S. Treasury Notes -- due date 10/15/09, coupon 3.375% | (H | ) | 3,000,000 | 2,894,310 | ||||||
| U.S. Treasury Notes -- due date 01/15/10, coupon 3.625% | (H | ) | 3,000,000 | 2,907,420 | ||||||
| U.S. Treasury Notes -- due date 04/15/10, coupon 4.00% | (H | ) | 3,000,000 | 2,935,560 | ||||||
| U.S. Treasury Notes -- due date 07/15/10, coupon 3.875% | (H | ) | 3,000,000 | 2,920,560 | ||||||
| U.S. Treasury Notes -- due date 10/15/10, coupon 4.25% | (H | ) | 2,000,000 | 1,969,060 | ||||||
Total Investments in U.S. Government and Agency Securities (cost: $59,212,598) | $ | 58,656,147 | ||||||||
Total Investments (cost: $121,331,398) | $ | 112,323,978 | ||||||||
Method of Valuation (3) | Shares/ Principal | Value | ||||||||
Investments in Controlled Affiliated Companies (6)(9) – 3.30% of net assets | ||||||||||
Private Placement Portfolio (Illiquid) – 3.30% of net assets | ||||||||||
| Evolved Nanomaterial Sciences, Inc. (1)(2)(4)(5) — Developing nanotechnology-enhanced approaches for the resolution of chiral molecules | ||||||||||
| Series A Convertible Preferred Stock | (A) | 5,870,021 | $ | 2,800,000 | ||||||
| SiOnyx, Inc. (1)(2)(4)(5) — Developing silicon-based optoelectronic products enabled by its proprietary, "Black Silicon" | ||||||||||
| Series A Convertible Preferred Stock | (C) | 233,499 | 70,050 | |||||||
| Series A-1 Convertible Preferred Stock | (C) | 2,966,667 | 890,000 | |||||||
| 960,050 | ||||||||||
Total Controlled Private Placement Portfolio (cost: $4,440,000) | $ | 3,760,050 | ||||||||
Total Investments in Controlled Affiliated Companies (cost: $4,440,000) | $ | 3,760,050 | ||||||||
U.S. Government and Agency Securities – 51.48% of net assets | ||||||||||
| U.S. Treasury Bill — due date 1/18/07 | (J) | 2,217,000 | 2,212,677 | |||||||
| U.S. Treasury Notes — due date 11/30/07, coupon 4.25% | (H) | 6,500,000 | 6,455,345 | |||||||
| U.S. Treasury Notes — due date 02/15/08, coupon 3.375% | (H) | 9,000,000 | 8,842,860 | |||||||
| U.S. Treasury Notes — due date 05/15/08, coupon 3.75% | (H) | 9,000,000 | 8,862,210 | |||||||
| U.S. Treasury Notes — due date 09/15/08, coupon 3.125% | (H) | 5,000,000 | 4,861,350 | |||||||
| U.S. Treasury Notes — due date 01/15/09, coupon 3.25% | (H) | 3,000,000 | 2,910,930 | |||||||
| U.S. Treasury Notes — due date 02/15/09, coupon 4.50% | (H) | 5,100,000 | 5,069,145 | |||||||
| U.S. Treasury Notes — due date 04/15/09, coupon 3.125% | (H) | 3,000,000 | 2,893,830 | |||||||
| U.S. Treasury Notes — due date 07/15/09, coupon 3.625% | (H) | 3,000,000 | 2,920,890 | |||||||
| U.S. Treasury Notes — due date 10/15/09, coupon 3.375% | (H) | 3,000,000 | 2,894,310 | |||||||
| U.S. Treasury Notes — due date 01/15/10, coupon 3.625% | (H) | 3,000,000 | 2,907,420 | |||||||
| U.S. Treasury Notes — due date 04/15/10, coupon 4.00% | (H) | 3,000,000 | 2,935,560 | |||||||
| U.S. Treasury Notes — due date 07/15/10, coupon 3.875% | (H) | 3,000,000 | 2,920,560 | |||||||
| U.S. Treasury Notes — due date 10/15/10, coupon 4.25% | (H) | 2,000,000 | 1,969,060 | |||||||
Total Investments in U.S. Government and Agency Securities (cost: $59,212,598) | $ | 58,656,147 | ||||||||
Total Investments (cost: $121,331,398) | $ | 112,323,978 | ||||||||
The accompanying notes are an integral part of these consolidated financial statements.
HARRIS & HARRIS GROUP, INC. CONSOLIDATED SCHEDULE OF INVESTMENTS AS OF DECEMBER 31, 2006 |
Notes to Consolidated Schedule of Investments
| (1) | Represents a non-income producing security. Equity investments that have not paid dividends within the last 12 months are considered to be non-income producing. |
| (2) | Legal restrictions on sale of investment. |
| (3) | See Footnote to Schedule of Investments for a description of the Valuation Procedures. |
| (4) | Initial investment was made during 2006. |
| (5) | These investments are development stage companies. A development stage company is defined as a company that is devoting substantially all of its efforts to establishing a new business, and either it has not yet commenced its planned principal operations, or it has commenced such operations but has not realized significant revenue from them. |
| (6) | Investments in unaffiliated companies consist of investments in which we own less than five percent of the voting shares of the portfolio company. Investments in non-controlled affiliated companies consist of investments in which we own five percent or more, but less than 25 percent, of the voting shares of the portfolio company or where we hold one or more seats on the portfolio company’s Board of Directors. Investments in controlled affiliated companies consist of investments in which we own 25 percent or more of the voting shares of the portfolio company. |
| (7) | The aggregate cost for federal income tax purposes of investments in unaffiliated companies is $18,107,124. The gross unrealized appreciation based on the tax cost for these securities is $1,732,194. The gross unrealized depreciation based on the tax cost for these securities is $2,059,591. |
| (8) | The aggregate cost for federal income tax purposes of investments in non-controlled affiliated companies is $39,571,676. The gross unrealized appreciation based on the tax cost for these securities is $333,269. The gross unrealized depreciation based on the tax cost for these securities is $7,776,891. |
| (9) | The aggregate cost for federal income tax purposes of investments in controlled affiliated companies is $4,400,000. The gross unrealized appreciation based on the tax cost for these securities is $0. The gross unrealized depreciation based on the tax cost for these securities is $679,950. |
| (10) | Continuum Photonics, Inc., merged with Polatis, Ltd., to form Polatis, Inc. |
| (11) | BridgeLux, Inc., was previously named eLite Optoelectronics, Inc. |
| (12) | Mersana Therapeutics, Inc., was previously named Nanopharma Corp. |
| (13) | D-Wave Systems, Inc., is located and is doing business primarily in Canada. We invested in D-Wave Systems, Inc., through D-Wave USA, a Delaware company. Our investment is denominated in Canadian dollars and is subject to foreign currency translation. Refer to |
The accompanying notes are an integral part of this consolidated schedule.
Method of | Shares/ | |||||||||
Valuation (3) | Principal | Value | ||||||||
Investments in Unaffiliated Companies (6)(7) - 13.2% of net assets | ||||||||||
Private Placement Portfolio (Illiquid) - 13.2% of net assets | ||||||||||
| AlphaSimplex Group, LLC (2) -- Investment management company headed by | ||||||||||
| Dr. Andrew W. Lo, holder of the Harris & Harris Group Chair at MIT | ||||||||||
| Limited Liability Company Interest | (B | ) | -- | $ | 16,315 | |||||
| Crystal IS, Inc. (1)(2)(5) -- Developing a technology to grow | ||||||||||
| single-crystal boules of aluminum nitride for gallium nitride | ||||||||||
| electronics | ||||||||||
| Series A Convertible Preferred Stock | (A | ) | 274,100 | 199,983 | ||||||
| Exponential Business Development Company (1)(2) -- | ||||||||||
| Venture capital partnership focused on early stage companies | ||||||||||
| Limited Partnership Interest | (B | ) | -- | 0 | ||||||
| Molecular Imprints, Inc. (1)(2) -- Manufacturing nanoimprint lithography | ||||||||||
| capital equipment | ||||||||||
| Series B Convertible Preferred Stock | (A | ) | 1,333,333 | 2,000,000 | ||||||
| Series C Convertible Preferred Stock | (A | ) | 1,250,000 | 2,500,000 | ||||||
| Warrants at $2.00 expiring12/31/15 | (B | ) | 125,000 | 0 | ||||||
| 4,500,000 | ||||||||||
| Nanosys, Inc. (1)(2)(5) -- Developing nanotechnology-enabled systems | ||||||||||
| incorporating zero and one-dimensional inorganic | ||||||||||
| nanometer-scale materials | ||||||||||
| Series C Convertible Preferred Stock | (C | ) | 803,428 | 2,370,113 | ||||||
| Series D Convertible Preferred Stock | (C | ) | 1,016,950 | 3,000,003 | ||||||
| 5,370,116 | ||||||||||
| Nantero, Inc. (1)(2)(5) -- Developing a high-density, nonvolatile, random | ||||||||||
| access memory chip, using nanotechnology | ||||||||||
| Series A Convertible Preferred Stock | (C | ) | 345,070 | 1,046,908 | ||||||
| Series B Convertible Preferred Stock | (C | ) | 207,051 | 628,172 | ||||||
| Series C Convertible Preferred Stock | (C | ) | 188,315 | 571,329 | ||||||
| 2,246,409 | ||||||||||
Method of | Shares/ | |||||||||
Valuation (3) | Principal | Value | ||||||||
Investments in Unaffiliated Companies (6)(7) - 13.2% of net assets (cont.) | ||||||||||
Private Placement Portfolio (Illiquid) - 13.2% of net assets (cont.) | ||||||||||
| NeoPhotonics Corporation (1)(2) -- Developing and manufacturing | ||||||||||
| planar optical devices and components | ||||||||||
| Common Stock | (C | ) | 716,195 | $ | 67,736 | |||||
| Series 1 Convertible Preferred Stock | (C | ) | 1,831,256 | 2,014,677 | ||||||
| Series 2 Convertible Preferred Stock | (C | ) | 741,898 | 878,120 | ||||||
| Warrants at $0.15 expiring 01/26/10 | (C | ) | 16,364 | 164 | ||||||
| Warrants at $0.15 expiring 12/05/10 | (C | ) | 14,063 | 140 | ||||||
| 2,960,837 | ||||||||||
| Polatis, Inc. (1)(2)(5)(9) -- Developing optical networking components | ||||||||||
| by merging materials, MEMS and electronics technologies | ||||||||||
| Series A-1 Convertible Preferred Stock | (B | ) | 16,775 | 47,828 | ||||||
| Series A-2 Convertible Preferred Stock | (B | ) | 71,611 | 204,172 | ||||||
| 252,000 | ||||||||||
Total Unaffiliated Private Placement Portfolio (cost: $15,469,546) | $ | 15,545,660 | ||||||||
Total Investments in Unaffiliated Companies (cost: $15,469,546) | $ | 15,545,660 | ||||||||
Method of | Shares/ | |||||||||
Valuation (3) | Principal | Value | ||||||||
Investments in Non-Controlled Affiliated Companies (6)(8) - 15.0% of net assets | ||||||||||
Private Placement Portfolio (Illiquid) - 15.0% of net assets | ||||||||||
| Cambrios Technologies Corporation (1)(2)(5) -- Developing commercially | ||||||||||
| relevant materials by evolving biomolecules to express control over | ||||||||||
| nanostructure synthesis | ||||||||||
| Series B Convertible Preferred Stock | (A | ) | 1,294,025 | $ | 1,294,025 | |||||
| Chlorogen, Inc. (1)(2)(5) -- Developing patented chloroplast technology | ||||||||||
| to produce plant-made proteins | ||||||||||
| Series A Convertible Preferred Stock | (A | ) | 4,478,038 | 785,000 | ||||||
| Series B Convertible Preferred Stock | (A | ) | 2,077,930 | 364,261 | ||||||
| 1,149,261 | ||||||||||
| CSwitch, Inc. (1)(2)(5) -- Developing next-generation, system-on-a-chip | ||||||||||
| solutions for communications-based platforms | ||||||||||
| Series A Convertible Preferred Stock | (B | ) | 1,000,000 | 500,000 | ||||||
| eLite Optoelectronics Inc. (1)(2)(4) -- Manufacturing high-power light | ||||||||||
| emitting diodes | ||||||||||
| Series B Convertible Preferred Stock | (A | ) | 1,861,504 | 1,000,000 | ||||||
| Kereos, Inc. (1)(2)(4)(5) -- Developing molecular imaging agents | ||||||||||
| and targeted therapeutics to image and treat cancer and | ||||||||||
| cardiovascular disease | ||||||||||
| Series B Convertible Preferred Stock | (A | ) | 349,092 | 960,000 | ||||||
| Kovio , Inc. (1)(2)(4)(5) -- Developing semi-conductor products | ||||||||||
| using printed electronics and thin-film technologies | ||||||||||
| Series C Convertible Preferred Stock | (A | ) | 2,500,000 | 3,000,000 | ||||||
| Mersana Therapeutics, Inc. (1)(2)(5)(10) -- Developing advanced | ||||||||||
| polymers for drug delivery | ||||||||||
| Series A Convertible Preferred Stock | (C | ) | 68,452 | 136,904 | ||||||
| Series B Convertible Preferred Stock | (C | ) | 616,500 | 1,233,000 | ||||||
| Warrants at $2.00 expiring 10/21/10 | (B | ) | 91,625 | 0 | ||||||
| 1,369,904 | ||||||||||
Method of | Shares/ | |||||||||
Valuation (3) | Principal | Value | ||||||||
Investments in Non-Controlled Affiliated Companies (6)(8) - 15.0% of net assets (cont.) | ||||||||||
Private Placement Portfolio (Illiquid) - 15.0% of net assets (cont.) | ||||||||||
| NanoGram Corporation (1)(2)(5) -- Developing a broad suite of intellectual | ||||||||||
| property utilizing nanotechnology | ||||||||||
| Series I Convertible Preferred Stock | (B | ) | 63,210 | $ | 64,259 | |||||
| Series II Convertible Preferred Stock | (B | ) | 1,250,904 | 1,271,670 | ||||||
| 1,335,929 | ||||||||||
| Nanomix, Inc. (1)(2)(5) -- Producing nanoelectronic sensors that | ||||||||||
| integrate carbon nanotube electronics with silicon microstructures | ||||||||||
| Series C Convertible Preferred Stock | (A | ) | 9,779,181 | 2,500,000 | ||||||
| NanoOpto Corporation (1)(2)(5) -- Manufacturing discrete and integrated | ||||||||||
| optical communications sub-components on a chip by utilizing | ||||||||||
| nano-manufacturing technology | ||||||||||
| Series A-1 Convertible Preferred Stock | (C | ) | 267,857 | 32,490 | ||||||
| Series B Convertible Preferred Stock | (C | ) | 3,819,935 | 1,110,073 | ||||||
| Series C Convertible Preferred Stock | (C | ) | 1,932,789 | 842,503 | ||||||
| Warrants at $0.4359 expiring 03/15/10 | (C | ) | 193,279 | 0 | ||||||
| 1,985,066 | ||||||||||
| Nextreme Thermal Solutions, Inc. (1)(2)(5) -- Developing thin-film, | ||||||||||
| superlattice thermoelectric devices | ||||||||||
| Series A Convertible Preferred Stock | (A | ) | 500,000 | 500,000 | ||||||
| Questech Corporation (1)(2) -- Manufacturing and markets | ||||||||||
| proprietary metal decorative tiles | ||||||||||
| Common Stock | (C | ) | 646,954 | 724,588 | ||||||
| Warrants at $1.50 expiring 08/03/06 | (B | ) | 8,500 | 0 | ||||||
| Warrants at $1.50 expiring 11/21/07 | (B | ) | 3,750 | 0 | ||||||
| Warrants at $1.50 expiring 11/19/08 | (B | ) | 5,000 | 0 | ||||||
| Warrants at $1.50 expiring 11/19/09 | (B | ) | 5,000 | 0 | ||||||
| 724,588 | ||||||||||
Method of | Shares/ | |||||||||
Valuation (3) | Principal | Value | ||||||||
Investments in Non-Controlled Affiliated Companies (6)(8) - 15.0% of net assets (cont.) | ||||||||||
Private Placement Portfolio (Illiquid) - 15.0% of net assets (cont.) | ||||||||||
| Solazyme, Inc. (1)(2)(5) -- Developing energy-harvesting | ||||||||||
| machinery of photosynthetic microbes to produce industrial | ||||||||||
| and pharmaceutical molecules | ||||||||||
| Series A Convertible Preferred Stock | (C | ) | 988,204 | $ | 385,400 | |||||
| Starfire Systems, Inc. (1)(2)(5) --Producing ceramic-forming polymers | ||||||||||
| Common Stock | (A | ) | 375,000 | 150,000 | ||||||
| Series A-1 Convertible Preferred Stock | (A | ) | 600,000 | 600,000 | ||||||
| 750,000 | ||||||||||
| Zia Laser, Inc. (1)(2)(4)(5) -- Developing quantum dot semiconductor lasers | ||||||||||
| Series C Convertible Preferred Stock | (B | ) | 1,500,000 | 187,500 | ||||||
Total Non-Controlled Private Placement Portfolio (cost: $22,236,796) | $ | 17,641,673 | ||||||||
Total Investments in Non-Controlled Affiliated Companies (cost: $22,236,796) | $ | 17,641,673 | ||||||||
U.S. Government and Agency Securities - 81.5% of net assets | ||||||||||
| U.S. Treasury Bills -- due date 01/05/06 | (J | ) | 24,500,000 | $ | 24,495,590 | |||||
| U.S. Treasury Notes -- due date 02/28/06, coupon 1.625% | (H | ) | 810,000 | 806,963 | ||||||
| U.S. Treasury Bills -- due date 03/02/06 | (J | ) | 32,845,000 | 32,640,376 | ||||||
| U.S. Treasury Bills -- due date 03/16/06 | (J | ) | 4,750,000 | 4,712,855 | ||||||
| U.S. Treasury Notes -- due date 03/31/06, coupon 1.5% | (H | ) | 4,616,000 | 4,586,965 | ||||||
| U.S. Treasury Notes -- due date 11/30/07, coupon 4.25% | (H | ) | 6,500,000 | 6,480,955 | ||||||
| U.S. Treasury Notes -- due date 02/15/08, coupon 3.375% | (H | ) | 9,000,000 | 8,814,690 | ||||||
| U.S. Treasury Notes -- due date 05/15/08, coupon 3.75% | (H | ) | 9,000,000 | 8,872,020 | ||||||
| U.S. Treasury Notes -- due date 09/15/08, coupon 3.125% | (H | ) | 5,000,000 | 4,840,450 | ||||||
Total Investments in U.S. Government and Agency | ||||||||||
Securities (cost: $96,320,405) | $ | 96,250,864 | ||||||||
Total Investments (cost: $134,026,747) | $ | 129,438,197 | ||||||||
HARRIS & HARRIS GROUP, INC. FOOTNOTE TO CONSOLIDATED SCHEDULE OF INVESTMENTS |
VALUATION PROCEDURES
Our investments can be classified into five broad categories for valuation purposes:
Equity-Related Securities;
Investments in Intellectual Property or Patents or Research and Development in Technology or Product Development;
Long-Term Fixed-Income Securities;
Short-Term Fixed-Income Investments;Securities; and
All Other Investments.Securities.
The 1940 Act requires periodic valuation of each investment in our portfolio to determine net asset value. Under the 1940 Act, unrestricted securities with readily available market quotations are to be valued at the current market value; all other assets must be valued at "fair value" as determined in good faith by or under the direction of the Board of Directors.
Our Board of Directors is responsible for (1) determining overall valuation guidelines and (2) ensuring the valuation of investments within the prescribed guidelines.
Our Valuation Committee, comprised of three or moreall of our independent Board members, is responsible for reviewing and approving the valuation of our assets within the guidelines established by the Board of Directors.
Fair value is generally defined as the amount that an investment could be sold for in an orderly disposition over a reasonable time. Generally, to increase objectivity in valuing our assets, external measures of value, such as public markets or third-party transactions, are utilized whenever possible. Valuation is not based on long-term work-out value, nor immediate liquidation value, nor incremental value for potential changes that may take place in the future.
The values assigned to these investments are based on available information and do not necessarily represent amounts that might ultimately be realized, as these amounts depend on future circumstances and cannot reasonably be determined until the individual investments are actually liquidated or become marketable.
Our valuation policy with respect to the five broad investment categories is as follows:
Equity-Related Securities
Equity-related securities, including warrants, are valued using one or more of the following basic methods of valuation:
A. Cost. The cost method is based on our original cost. This method is generallymay be used in the early stages of a company’s development until significant positive or negative events occur subsequent to the date of the original investment that dictate a change to another valuation method. Some examples of these events are: (1) a major recapitalization; (2) a major refinancing; (3) a significant third-party transaction; (4) the development of a meaningful public market for the company’s common stock; and (5) significant positive or negative changes in a company’s business.
B. Analytical Method. The analytical method is generally used to value an investment position when there is no established public or private market in the company’s securities or when the factual information available to us dictates that an investment should no longer be valued under either the cost or private market method.securities. This valuation method is inherently imprecise and ultimately the result of reconciling the judgments of our Valuation Committee members, based on the data available to them. The resulting valuation, although stated as a precise number, is necessarily within a range of values that vary depending upon the significance attributed to the various factors being considered. Some of
The analytical method considers the factors considered may includefollowing factors:
| · | The cost of the Company’s investment; |
| · | Transactions in a company's securities or unconditional firm offers by responsible parties as a factor in determining valuation; |
| · | The financial condition and operating results of the company; |
| · | The long-term potential of the business and technology of the company; |
| · | The values of similar securities issued by companies in similar businesses; |
| · | Multiples to revenue, net income or EBITDA that similar securities issued by companies in similar businesses receive; |
| · | The proportion of the company's securities we own and the nature of any rights to require the company to register restricted securities under applicable securities laws; and |
| · | The rights and preferences of the class of securities we own as compared to other classes of securities the portfolio company has issued. |
When the financial condition and operating results ofanalytical method is used to value warrants, the company,Company utilizes the long-term potential of the business of the company, the values of similar securities issued by companies in similar businesses, the proportion of the company’s securities we own and the nature of any rights to require the company to register restricted securities under applicable securities laws.Black-Scholes model.
79
C. Private Market. The private market method uses actual, executed, historical transactions in a company’s securities by responsible third parties as a basis for valuation. The private market method may also use, where applicable, unconditional firm offers by responsible third parties as a basis for valuation.
D. Public Market. The public market method is used when there is an established public market for the class of the company’s securities held by us or into which our securities are convertible. We discount market value for securities that are subject to significant legal and contractual restrictions. Other securities, for which market quotations are readily available, are carried at market value as of the time of valuation. Market value for securities traded on securities exchanges or on the Nasdaq Global Market is the last reported sales price on the day of valuation. For other securities traded in the over-the-counter market and listed securities for which no sale was reported on that day, market value is the mean of the closing bid price and asked price on that day. This method is the preferred method of valuation when there is an established public market for a company’s securities, as that market provides the most objective basis for valuation. If for any reason, the Valuation Committee determines that market quotations are not reliable, such securities shall be fair valued by the Valuation Committee in accordance with these Valuation Procedures.
Investments in Intellectual Property or Patents or Research and Development in Technology or Product Development
These investments are carried at fair value using the following basic methods of valuation:
E. Cost. The cost method is based on our original cost. This method is generallymay be used in the early stages of commercializing or developing intellectual property or patents or research and development in technology or product development until significant positive or adverse events occur subsequent to the date of the original investment that dictate a change to another valuation method.
F. Analytical Method. The analytical method is used to value an investment after analysis of the best available outside information where the factual information available to us dictates that an investment should no longer be valued under either the cost or private market method. This valuation method is inherently imprecise and ultimately the result of reconciling the judgments of our Valuation Committee members. The resulting valuation, although stated as a precise number, is necessarily within a range of values that vary depending upon the significance attributed to the various factors being considered. Some of the factors considered may include the results of research and development, product development progress, commercial prospects, term of patent and projected markets.
80
The analytical method considers the following factors:
| · | The cost of the investment; |
| · | Investments in the same or substantially similar intellectual property or patents or research and development in technology or product development or offers by responsible third parties; |
| · | The results of research and development; |
| · | Product development progress; |
| · | Commercial prospects; |
| · | Term of patent; |
| · | Projected markets; and |
| · | Other subjective factors. |
G. Private Market. The private market method uses actual third-party investments in intellectual property or patents or research and development in technology or product development as a basis for valuation, using actual executed historical transactions by responsible third parties. The private market method may also use, where applicable, unconditional firm offers by responsible third parties as a basis for valuation.
As of December 31, 2007, and December 31, 2006, we do not have any investments in intellectual property or patents or research and development in technologies or products.
Long-Term Fixed-Income Securities
H. Readily Marketable. Fixed-incomeLong-term, fixed-income securities for which market quotations are readily available are carried at market value as of the time of valuation using the most recent bid quotations when available.
I. Not Readily Marketable. SecuritiesLong-term, fixed-income securities for which market quotations are not readily available are carried at fair value as determined in good faith by the Valuation Committee on the basis of available data, which may include credit quality and interest rate analysis, as well as quotations from dealers and brokers. Where such quotations are not available, fair value is determined using one or more of the following basic methods of valuation:
Short-Term Fixed-Income Securities
J. Short-Term Fixed-Income Securities are valued in the same manner as long-term fixed-income securities until the remaining maturity is 60 days or less, after which time such securities may be valued at amortized cost if there is no concern over payment at maturity.
All Other InvestmentsSecurities
K. All Other SecuritiesAll other investments are reported at fair value as determined in good faith by the Valuation Committee. As of December 31, 2007, and December 31, 2006, we dodid not have any of these investments.
NOTES TO CONSOLIDATED FINANCIAL STATEMENTS |