UNITED STATES
SECURITIES AND EXCHANGE COMMISSION
Washington, D.C. 20549
___________________
FORM 10-K
R
x | ANNUAL REPORT PURSUANT TO SECTION 13 OR 15(d) OF THESECURITIES EXCHANGE ACT OF 1934 |
| | |
| | For the Fiscal Year Ended December 31, 2006 2009 |
| | |
£
o | TRANSITION REPORT PURSUANT TO SECTION 13 OR 15(d) OF THE SECURITIES EXCHANGE ACT OF 1934 |
| | |
| | For the Transition Period From ____________ to ____________ |
| | |
Commission File Number 001-32216
NEW YORK MORTGAGE TRUST, INC.
(Exact name of registrant as specified in its charter)
| Maryland | | 47-0934168 |
Maryland
| | 47-0934168
|
(State or other jurisdiction of incorporation or organization) | | (I.R.S. Employer |
incorporation or organization)
| | Identification No.) |
| | |
1301
52 Vanderbilt Avenue, of the Americas, New York, New York 10019NY 10017
(Address of principal executive office) (Zip Code)
(212) 792-0107
(Registrant’s telephone number, including area code)
(212) 792-0107
Securities registered pursuant to Section 12(b) of the Act:
| | |
Title of Each Class | | Name of Each Exchange on Which Registered |
Common Stock, $0.01 par value $0.01 per share | | New YorkNASDAQ Stock Exchange |
| | Market |
Securities registered pursuant to Section 12(g) of the Act: None
Indicate by check mark if the registrant is a well-known seasoned issuer, as defined in Rule 405 of the Securities Act.
Yes o£ No xR
Indicate by check mark if the registrant is not required to file reports pursuant to Section 13 or Section 15(d) of the Act.
Yes o£ No xR
Indicate by check mark whether the registrant (1) has filed all reports required to be filed by Section 13 or 15(d) of the Securities Exchange Act of 1934 during the preceding 12 months (or for such shorter period that the registrant was required to file such reports), and (2) has been subject to such filing requirements for the past 90 days. Yes xR No o£
Indicate by check mark whether the registrant has submitted electronically and posted on its corporate Web site, if any, every Interactive Data File required to be submitted and posted pursuant to Rule 405 of Regulation S-T (§ 232.405 of this chapter) during the preceding 12 months (or for such shorter period that the registrant was required to submit and post such files). Yes o No o
Indicate by check mark if disclosure of delinquent filers pursuant to Item 405 of Regulation S-K is not contained herein, and will not be contained, to the best of registrant’s knowledge, in definitive proxy or information statements incorporated by reference in Part III of this Form 10-K or any amendment to this Form 10-K. oR
Indicate by check mark whether the registrant is a large accelerated filer, an accelerated filer, a non-accelerated filer or a non-accelerated filer.smaller reporting company. See definitiondefinitions of “accelerated filers” and “large accelerated filers”filer,” “accelerated filer” and “smaller reporting company” in Rule 12b-2 of Thethe Exchange Act. (check one):
Large Accelerated Filer o £ Accelerated Filer oR Non-Accelerated Filer x Smaller Reporting Company £o
Indicate by check mark whether the registrant is a shell company (as defined in Rule 12b-2 of the Exchange Act). Yes o£ No xR
The aggregate market value of voting stock held by non-affiliates of the registrant as of June 30, 20062009 was approximately $58.8 million based on the closing price on such date of the registrant’s common stock as reported by the New York Stock Exchange Composite Transactions.$48.1 million.
The number of shares of the Registrant’s Common Stock outstanding on March 15, 20071, 2010 was 18,077,880.9,415,094.
DOCUMENTS INCORPORATED BY REFERENCE
Document | | Where Incorporated |
1. Portions of the Registrant's Definitive Proxy Statement forrelating to its 2010 Annual Meeting of Stockholders to be held on June 14, 2007,scheduled for May 11, 2010 to be filed with the Securities and Exchange Commission by no later than April 30, 2010. | | Part III, Items 10-14 |
NEW YORK MORTGAGE TRUST, INC.
FORM 10-K
For the Fiscal Year Ended December 31, 20062009
TABLE OF CONTENTS
PART I |
| | | |
| Item 1. | Business | | 15 |
| Item 1A. | Risk Factors | | 1418 |
| Item 1B. | Unresolved Staff Comments | | 2237 |
| Item 2. | Properties | | 2237 |
| Item 3. | Legal Proceedings | | 2237 |
| Item 4. | Submission of Matters to a Vote of Security Holders(Removed and Reserved) | | 2237 |
| | | |
| PART II |
PART II
|
| | | |
| Item 5. | Market For Registrant’s Common Equity, Related Stockholder Matters and Issuer Purchases of Equity Securities | | 2337 |
| Item 6. | Selected Financial Data | | 2541 |
| Item 7. | Management’s Discussion and Analysis of Financial Condition and Results of Operations | | 2742 |
| Item 7A. | Quantitative and Qualitative Disclosures About Market Risk | | 6266 |
| Item 8. | Financial Statements and Supplementary Data | | 6971 |
| Item 9. | Changes in and Disagreements with Accountants on Accounting and Financial Disclosure | | 6971 |
| Item 9A. | Controls and Procedures | | 6972 |
| Item 9B. | Other Information | | 6972 |
| | | |
| PART III |
PART III
|
| | | |
| Item 10. | Directors and Executive Officers of the Registrant and Corporate Governance | | 7173 |
| Item 11. | Executive Compensation | | 7173 |
| Item 12. | Security Ownership of Certain Beneficial Owners and Management and Related Stockholder Matters | | 7173 |
| Item 13. | Certain Relationships and Related Party Transactions and Director Independence | | 7173 |
| Item 14. | Principal Accountant Fees and Services | | 7173 |
| | | |
| PART IV |
PART IV
|
| | | |
| Item 15. | Exhibits, and Financial Statement Schedules | | 7274 |
PART I
PART IItem 1.BUSINESS
Item 1. BUSINESS
General
New York Mortgage Trust, Inc., together with its consolidated subsidiaries (“NYMT”, the “Company”, “we”, “our”, and “us”), is a self-advised real estate investment trust, or REIT, in the business of acquiring and managing primarily residential adjustable-rate, hybrid adjustable-rate and fixed-rate mortgage-backed securities (“RMBS”), for which the principal and interest payments are guaranteed by a U.S. Government agency, such as the Government National Mortgage Association (“Ginnie Mae”), or a U.S. Government-sponsored entity (“GSE” or “Agency”), such as the Federal National Mortgage Association (“Fannie Mae”) or the Federal Home Loan Mortgage Corporation (“Freddie Mac”), which we refer to collectively as “Agency RMBS,” RMBS backed by prime jumbo and Alternative A-paper (“Alt-A”) mortgage finance company that acquiresloans (“non-Agency RMBS”), and invests in adjustable rateprime credit quality residential adjustable-rate mortgage (“ARM”) assets.loans held in securitization trusts, or prime ARM loans. The remainder of our current investment portfolio is comprised of notes issued by a collateralized loan obligation (“CLO”). We earn net interest income fromalso may opportunistically acquire and manage various other types of real estate-related and financial assets, including, among other things, certain non-rated residential mortgage assets, commercial mortgage-backed securities and adjustable-rate mortgage(“CMBS”), commercial real estate loans and securities. Until March 31, 2007, the Company originated mortgages throught its wholly-owned subsidiary,other similar investments. These assets, together with non-Agency RMBS and CLOs, typically present greater credit risk and less interest rate risk than our investments in Agency RMBS and prime ARM loans, and may also permit us to potentially utilize all or part of a significant net operating loss carry-forward held by Hypotheca Capital, LLC (“HC,” then doing business as The New York Mortgage Company LLC (“NYMC”). In this discontinued operation,LLC), our wholly-owned subsidiary and former mortgage lending business.
Our principal business objective is to generate net income for distribution to our stockholders resulting from the spread between the interest and other income we earned gainearn on sale incomeour interest-earning assets and the interest expense we pay on the borrowings that we use to finance our leveraged assets and our operating costs, which we refer to as our net interest incomeincome. We intend to achieve this objective by originatinginvesting in a varietybroad class of residentialreal estate-related and financial assets, including those listed above, that in aggregate, will generate attractive risk-adjusted total returns for our stockholders.
Prior to 2009, our investment portfolio was primarily comprised of Agency RMBS, prime ARM loans held in securitization trusts and certain non-agency RMBS rated in the highest rating category by two rating agencies. The prime ARM loans in our portfolio were purchased from third parties or originated by us through HC and were subsequently securitized by us and are held in our four securitization trusts. Beginning in the first quarter of 2009, we commenced a repositioning of our investment portfolio to transition the portfolio from one primarily focused on leveraged Agency RMBS and prime ARM loans held in securitization trusts, which primarily involve interest rate risk, to a more diversified portfolio that includes elements of credit risk with reduced leverage. The repositioning included a reduction in the Agency RMBS held in our portfolio through the disposition of $193.8 million of GSE-issued collateralized mortgage loan products. This discontinued operation also originated residential mortgage loansobligation floating rate securities, which we refer to as “Agency CMO floaters”, a net increase of approximately $27.5 million (par value) in our non-Agency RMBS position and our opportunistic purchase in March 2009 of discounted notes issued by a CLO.
We elected to be taxed as a brokerREIT for federal income tax purposes commencing with our taxable year ended on December 31, 2004. As a result, we generally will not be subject to federal income tax on our taxable income that is distributed to our stockholders.
The financial information requirements required under this Item 1 may be found in our audited consolidated financial statements beginning on page F-3.
Strategic Relationship
In connection with a $20.0 million private investment in our Series A Cumulative Convertible Redeemable preferred stock (the “Series A Preferred Stock”) by JMP Group Inc. and certain of its affiliates (collectively, the “JMP Group”) in the first quarter of 2008, we entered into an advisory agreement with Harvest Capital Strategies LLC (“HCS,” formerly known as JMP Asset Management LLC), an affiliate of the JMP Group, pursuant to which HCS advises the Company with respect to assets held by HC and New York Mortgage Funding, LLC (“NYMF”), excluding certain Agency RMBS held in these entities for regulatory compliance purposes, and assets held by any additional subsidiaries acquired or formed in the future to hold investments made on the Company’s behalf. We refer to these entities as the “Managed Subsidiaries.” We formed this relationship with HCS and the JMP Group for the purpose of obtaining broker fee income.improving our capitalization and diversifying our portfolio of investment securities away from the focused leveraged Agency RMBS strategy we employed from early 2007 and into the first quarter of 2009 to a portfolio that, as noted above, includes elements of credit risk with reduced leverage and one that may permit us to potentially utilize all or part of an approximately $62.2 million net operating loss carry-forward held by HC at December 31, 2009.
We intend to achieve our principal business objective of generating net income for distribution to our stockholders by building and managing a diversified investment portfolio comprised of a broad class of real estate-related and financial assets, that in aggregate, will generate attractive risk-adjusted total returns for our stockholders. We have invested in the past and intend to invest in the future in assets that collectively allow us to maintain our REIT status and our exemption from registration under the Investment Company Act. In building and managing our current investment portfolio, we:
| ● | invest in and manage high-credit quality Agency and non-Agency RMBS, including ARM securities, fixed rate securities, and high-credit quality ARM mortgage loans that primarily involve interest rate risk; |
| | opportunistically invest in certain other real estate-related and financial assets, including non-Agency RMBS, that further diversifies portfolio risk by introducing elements of credit risk and that may permit us to utilize all or a portion of a significant net operating loss carry-forward held by HC; |
| | |
| | leverage our investments in Agency RMBS and prime ARM loans held in securitization trusts by entering into repurchase agreements or issuing collateralized debt obligations, as applicable; |
| | generally operate as a long-term portfolio investor; and |
| | generate earnings from the return on our interest earning securities and spread income from our securitized mortgage loan portfolio. |
Prior to 2009, our investment strategy had focused on the acquisition or origination of prime ARM loans for securitization and the acquisition of RMBS, primarily Agency RMBS, for our investment portfolio. As noted above, commencing in the first quarter of 2009, we began to diversify our portfolio by disposing of Agency CMO floaters and acquiring non-Agency RMBS and discounted notes issued by a CLO. As of December 31, 2006, we had2009, our portfolio was comprised of approximately $1.32 billion$159.1 million in RMBS, of totalwhich approximately $116.2 million was Agency RMBS and $42.9 million was non-Agency RMBS, and approximately $276.2 million of prime ARM loans held in securitization trusts.
We expect that over the near term, our investment portfolio will continue to be weighted towards RMBS and prime ARM loans held in securitization trusts, with continued diversification of the portfolio to non-Agency RMBS and other real estate-related and financial assets as comparedmarket opportunities arise. If necessary, we will modify our investment allocation strategy from time to $1.79 billion at December 31, 2005 (seetime in the future as market conditions change in an effort to maximize the returns from our consolidated financial statementsportfolio of investment assets. As a result, although we focus on the assets described below, our targeted asset classes and related notes beginning on page F-1).allocation strategy may vary over time from those described herein.
Recent Events - SaleOur Targeted Asset Classes
Set forth below is a list of Mortgage Lending Businessthe asset classes we currently target, followed by a brief description of these assets and Changetheir position, if any, in Our Business Strategyour portfolio:
| Asset Class | | Principal Assets |
| Residential Mortgage-Backed Securities | | Agency RMBS, primarily issued by Fannie Mae or Freddie Mac and backed by hybrid ARM loans; |
| | |
| | Non-Agency RMBS backed by prime jumbo and Alt-A, including investment grade and non-investment grade classes. |
| | |
| Prime ARM Loans Held in Securitization Trusts | | Prime ARM loans originated by us or acquired from third parties and securitized in 2005 and early 2006 in four securitization trusts. |
| | |
| Other | | Residential whole mortgage loans (including non-rated loans), CMBS, commercial mortgages and other commercial real estate debt, CLOs and other corporate debt or corporate equity securities and other similar investments. |
On February 7, 2007, we announced that, asRMBS Issued by Fannie Mae or Freddie Mac and Collateralized by Hybrid ARM Loans. Agency RMBS consists of Agency pass-through certificates and CMOs issued or guaranteed by an Agency. Pass-through certificates provide for a part of our previously announced exploration of strategic alternatives for the Company, we had entered into a definitive agreement to sell substantially allpass-through of the retailmonthly interest and principal payments made by the borrowers on the underlying mortgage lending platformloans to the holders of NYMC to IndyMac Bank, F.S.B., (“Indymac”),the pass-through certificate. CMOs divide a wholly owned subsidiarypool of Indymac Bancorp, Inc, for an estimated purchase price of $13.5 million in cashmortgage loans into multiple tranches with different principal and the assumption of certain of our liabilities by Indymac. Oninterest payment characteristics.
Between March 31, 2007 Indymac purchased substantially all of the operating assets related to NYMC’s retail mortgage lending platform, including, among other things, assuming leases held by NYMC for approximately 20 full service and approximately 10 satellite retail mortgage lending offices (excluding the lease for the Company’s corporate headquarters, which is being assigned, as previously announced, under a separate agreement to Lehman Brothers Holding, Inc.), the tangible personal property located in those approximately 30 retail mortgage banking offices, NYMC’s pipeline of residential mortgage loan applications (the “Pipeline Loans”), escrowed deposits related to the Pipeline Loans, customer lists and intellectual property and information technology systems used by NYMC in the conduct of its retail mortgage banking platform. Indymac assumed the obligations of NYMC under the Pipeline Loans and substantially all of NYMC’s liabilities under the purchased contracts and purchased assets arising after the closing date. Indymac has also agreed to pay (i) the first $500,000 in severance expenses with respect to “transferred employees” (as defined inquarter of 2009, we focused a significant amount of our resources and efforts on the asset purchase agreement filed as Exhibit 10.62 to this Annual Report on Form 10-K) and (ii) severance expenses in excessmanagement of $1.1 million arising after the closing with respect to transferred employees. As part of the Indymac transaction, the Company has agreed,hybrid ARM RMBS issued by either Fannie Mae or Freddie Mac, including both pass-through certificates and Agency CMO floaters. Hybrid ARM RMBS are adjustable rate mortgage assets that have a rate that is fixed for a period of 18 months, notthree to compete with Indymac otherten years initially, before becoming annual or semi-annual adjustable rate mortgage assets. Because the coupons earned on Agency RMBS collateralized by ARM loans adjust over time as interest rates change (typically after an initial fixed-rate period), the market values of these assets are generally less sensitive to changes in interest rates than are Agency RMBS collateralized by fixed-rate residential mortgage loans. In addition, the hybrid ARMs that collateralize our Agency RMBS typically have interim and lifetime caps on interest rate adjustments.
Fannie Mae guarantees to the holder of Fannie Mae RMBS that it will distribute amounts representing scheduled principal and interest on the mortgage loans in the purchase, sale,pool underlying the Fannie Mae certificate, whether or retentionnot received, and the full principal amount of any such mortgage loan foreclosed or otherwise finally liquidated, whether or not the principal amount is actually received. Freddie Mac guarantees to each holder of certain Freddie Mac certificates the timely payment of interest at the applicable pass-through rate and principal on the holder’s pro rata share of the unpaid principal balance of the related mortgage loans. We prefer Fannie Mae-issued RMBS collateralized by ARM loans due to their shorter remittance cycle; which is the time between when a borrower makes a payment and the investor receives the net payment.
Typically, we seek to acquire Agency RMBS collateralized by hybrid ARM loans with fixed periods of five years of less. In most cases we are required to pay a premium above the par value for these assets, the amount of which generally depends on the pass-through rates of the security, the months remaining before the mortgage loan converts to an ARM, and other considerations. As noted above, commencing in the first quarter of 2009, we initiated a program to dispose of the Agency CMO floaters in our investment portfolio. However, we may invest in Agency CMO floaters in the future should the returns on such securities again become attractive.
Non-Agency RMBS. The Company may invest in residential non-Agency RMBS, including investment-grade (AAA through BBB rated) and non-investment grade (BB and B rated and unrated) classes. The mortgage loan collateral for residential non-Agency RMBS consists of residential mortgage loans that do not generally conform to underwriting guidelines issued by Fannie Mae, Freddie Mac or Ginnie Mae due to certain factors, including a mortgage balance in excess of Agency underwriting guidelines, borrower characteristics, loan characteristics and insufficient documentation. Consequently, the principal and interest on non-Agency RMBS are not guaranteed by GSEs, such as Fannie Mae and Freddie Mac, or in the case of Ginnie Mae, the U.S. Government.
Prime ARM Loans Held in Securitization Trusts. Our portfolio also includes prime ARM loans held in four securitization trusts. The loans held in securitization trusts are loans that primarily were originated by our discontinued mortgage lending business, and to a lesser extent purchased from third parties, that we securitized in 2005 and early 2006. These loans are substantially prime full documentation interest only hybrid ARMs on residential properties and are all are first lien mortgages. The Company maintained the ownership trust certificates, or equity, of these securitizations which includes rights to excess interest, if any. Subject to market conditions, we may acquire mortgage loans in the future and subsequently securitize these loans.
Commercial Mortgage-Backed Securities. We may invest in commercial mortgage-backed securities, or CMBS, through the purchase of mortgage loans. Indymacpass-through notes. CMBS are secured by, or evidence ownership interests in, a single commercial mortgage loan or a pool of mortgage loans secured by commercial properties. These securities may be senior, subordinated, investment grade or non-investment grade. We expect that most of our CMBS investments will be part of a capital structure or securitization where the rights of the class in which we invest are subordinated to senior classes but senior to the rights of lower rated classes of securities, although we may invest in the lower rated classes of securities if we believe the risk adjusted returns are attractive. We generally intend to invest in CMBS that will yield high current interest income and where we consider the return of principal to be likely. We may acquire CMBS from private originators of, or investors in, mortgage loans, including savings and loan associations, mortgage bankers, commercial banks, finance companies, investment banks and other entities.
The yields on CMBS depend on the timely payment of interest and principal due on the underlying mortgage loans and defaults by the borrowers on such loans may ultimately result in defaults on the CMBS. In the event of a default, the trustee for the benefit of the holders of CMBS has hired substantiallyrecourse only to the underlying pool of mortgage loans and, if a loan is in default, to the mortgaged property securing such mortgage loan. After the trustee has exercised all of the rights of a lender under a defaulted mortgage loan and the related mortgaged property has been liquidated, no further remedy will be available. However, holders of relatively senior classes of CMBS will be protected to a certain degree by the structural features of the securitization transaction within which such CMBS were issued, such as the subordination of the more junior classes of the CMBS.
High Yield Corporate Bonds. We may invest in high yield corporate bonds, which are below investment grade debt obligations of corporations and other nongovernmental entities. We expect that a significant portion of such bonds we may invest in will not be secured by mortgages or liens on assets, and may have an interest-only payment schedule, with the principal amount staying outstanding and at risk until the bond’s maturity. High yield bonds are typically issued by companies with significant financial leverage.
Collateralized Loan Obligations. We may invest in debentures, subordinated debentures or equity interests in a CLO. A CLO is secured by, or evidences ownership interests in, a pool of assets that may include RMBS, non-agency RMBS, CMBS, commercial real estate loans or corporate loans. Typically a CLO is collateralized by a diversified group of assets either within a particular asset class or across many asset categories. These securities may be senior, subordinated, investment grade or non-investment grade. We expect the majority of our branch employeesCLO investments to be part of a capital structure or securitization where the rights of the class in which we will invest to receive principal and interest are subordinated to senior classes but senior to the rights of lower rated classes of securities, although we may invest in the lower rated classes of securities if we believe the risk adjusted return is attractive.
Equity Securities. To a lesser extent, subject to maintaining our qualification as a REIT, we also may invest in common and preferred equity, which may or may not be related to real estate. These investments may include direct purchases of common or preferred equity or other equity type investments. We will follow a value-oriented investment approach and focus on the anticipated cash flows generated by the underlying business, discounted by an appropriate rate to reflect both the risk of achieving those cash flows and the alternative uses for the capital to be invested. We will also consider other factors such as the strength of management, the liquidity of the investment, the underlying value of the assets owned by the issuer and prices of similar or comparable securities.
Other Assets. We also may from time to time opportunistically acquire other mortgage-related and financial assets that may include, among others: residential whole mortgage loans, commercial mortgages and other commercial real estate debt and other similar assets.
Our Financing Strategy
Given the continued uncertainty in the credit markets, we believe that maintaining a maximum leverage ratio in the range of 6 to 8 times for our Agency RMBS portfolio and an overall Company leverage ratio of 4 to 5 times is appropriate at this time. At December 31, 2009 the leverage ratio for our portfolio of Agency RMBS, which we define as our outstanding indebtedness under repurchase agreements divided by the sum of total stockholders’ equity and our Series A Preferred Stock, was 1 to 1 and, excluding our Series A Preferred Stock, the leverage ratio was 1.4 to 1. We also have $44.9 million of subordinated trust preferred securities outstanding and $266.8 million of collateralized debt obligations (“CDO”) outstanding, both of which are not dependent on market values of pledged securities or changing credit conditions by our lenders.
We strive to maintain and achieve a balanced and diverse funding mix to finance our investment portfolio. We rely primarily on repurchase agreements collateralized by Agency RMBS and CDOs in order to finance the Agency RMBS in our investment portfolio and prime ARM loans held in our securitization trusts. Repurchase agreements provide us with short-term borrowings that bear interest rates that are linked to the London Interbank Offered Rate (“LIBOR”), a short term market interest rate used to determine short term loan officersrates. Pursuant to these repurchase agreements, the financial institution that serves as a counterparty will generally agree to provide us with financing based on the market value of the securities that we pledge as collateral, less a “haircut.” Our repurchase agreements may require us to deposit additional collateral pursuant to a margin call if the market value of our pledged collateral declines or if unscheduled principal payments on the mortgages underlying our pledged securities increase at a higher than anticipated rate. To reduce the risk that we would be required to sell portions of our portfolio at a loss to meet margin calls, we intend to maintain a balance of cash or cash equivalent reserves and a majoritybalance of NYMC employees based outunpledged mortgage securities to use as collateral for additional borrowings. As of December 31, 2009, we had repurchase agreements outstanding with five different counterparties totaling $85.1 million. As of December 31, 2009, we financed approximately $276.2 million of loans we hold in securitization trusts permanently with approximately $9.9 million of our corporate headquarters. Asown equity investment in the securitization trusts and the issuance of April 1, 2007,approximately $266.8 million of CDOs.
Since the Company has approximately 40 employees.first quarter of 2009, we have used cash from operating activities to purchase non-Agency RMBS and the discounted notes issued by a CLO. However, should the prospects for stable, reliable and favorable repurchase agreement financing for non-Agency RMBS develop in the future, we would expect to increase our repurchase agreement borrowings collateralized by non-Agency RMBS. See “Management’s Discussion and Analysis of Results of Operations and Financial Condition― Liquidity and Capital Resources” for further discussion on our financing activities.
Our Hedging and Interest Rate Risk Management Strategies
A significant risk to our operations, relating to our portfolio management, is the risk that interest rates on our assets will not adjust at the same times or amounts that rates on our liabilities adjust. Even though we entered into a definitive agreement with Tribeca Lending Corp., a subsidiary of Franklin Credit Management Corporation (“Tribeca Lending”) to sell our wholesale lending business for an estimated purchase price of $485,000. This transaction closed on February 22, 2007. Together, the closingretain and invest in securities collateralized by ARM loans, many of the saleunderlying hybrid ARM loans that back the RMBS in our portfolio have initial fixed rates of interest for a period of time ranging from two to five years. Our funding costs are variable and the maturities are short term in nature. We use hedging instruments to reduce our risk associated with changes in interest rates that could affect our RMBS assets and prime ARM loans held in securitization trusts. Typically, we utilize interest rate swaps to effectively extend the maturity of our retail mortgage banking platformshort term borrowings to Indymacbetter match the interest rate sensitivity to the underlying assets being financed. By extending the maturities on our short term borrowings, we attempt to lock in a spread between the interest income generated by the RMBS in our portfolio and the saleinterest expense related to the financing of such assets in order to maintain a net duration gap of less than one year. As we acquire RMBS, we seek to hedge interest rate risk in order to stabilize net asset values and earnings during periods of rising interest rates. To do so, we use hedging instruments in conjunction with our borrowings to approximate the re-pricing characteristics of such assets. We utilize a model based risk analysis system to assist in projecting portfolio performances over a variety of different interest rates and market stresses. The model incorporates shifts in interest rates, changes in prepayments and other factors impacting the valuations of our wholesale lending businessfinancial securities, including mortgage-backed securities, repurchase agreements, interest rate swaps and interest rate caps. However, given the prepayment uncertainties on our RMBS, it is not possible to Tribeca Lending has resulted in gross proceedsdefinitively lock-in a spread between the earnings yield on our portfolio and the related cost of borrowings. Nonetheless, through active management and the use of evaluative stress scenarios of the portfolio, we believe that we can mitigate a significant amount of both value and earnings volatility.
Our Investment Guidelines
In acquiring assets for our portfolio and subsequently managing those assets, management is required to NYMT of approximately $14.0 million before fees and expenses, and before deduction of approximately $2.3 million, which will be held in escrowadhere to support warranties and indemnifications provided to Indymacinvestment guidelines adopted by NYMC as well as other purchase price adjustments. NYMC will record a one time taxable gain on the sale of these assets. NYMC’s deferred tax asset will absorb any taxable gain from the sale.
We expect to redeploy the net proceeds from the sale of our retail mortgage banking platform in high quality mortgage loan securities. We will liquidate the remaining inventory of loans held for sale in the ordinary course of business. Our Board of Directors, together withunless such guidelines are amended, repealed, modified or waived by our management,Board. Pursuant to our investment guidelines, we will continue to consider strategic options for NYMT, including a possible sale or merger or raising capital under a passive REIT business model.
We believe that the disposition of our mortgage lending business will allow us to meetfocus on acquiring assets in the following business objectives:categories:
| · | reduce,Category I investments are RMBS that are either rated within one of the two highest rating categories by either Moody’s Investor Services or Standard and ultimately eliminate, our taxable REIT subsidiary’s operating losses;Poor’s (the “Ratings Agencies”), or have their repayment guaranteed by Freddie Mac, Fannie Mae or Ginnie Mae; |
| · | enable NYMC to retain the economic value of its accumulated net operating losses;Category II investments are all residential mortgage-related securities that do not fall within Category I; and |
| · | increase NYMT’s investable capitalCategory III investments are all CMBS and financial flexibility;non-mortgage-related securities, including, without limitation, subordinated debentures or equity interests in a CLO, high yield corporate bonds and equity securities. |
The investment guidelines provide the following investment limitations:
| · | lower NYMT’s executive management compensation expenses;no investment shall be made which would cause us to fail to qualify as a REIT; |
| · | significantly reduceno investment shall be made which would cause us or our potential severance obligations;subsidiaries to register as an investment company under the Investment Company Act; |
Certain of our officers have the authority to approve, without the need of further authorization of our Board of Directors, the following transactions from time to time, any of which may be entered into by us or any of our subsidiaries:
| · | the purchase and sale of Category I investments, subject to the limitations described above; |
| · | the purchase and sale of agency debt, U.S. Treasury securities, overnight investments and money market funds; |
| · | certain hedging arrangements; and |
| · | enable our management to focus on our mortgage portfolio management operations, which consistedthe incurrence of a $1.1 billion portfolio of investment securities as of December 31, 2006. |
Upon consummation of the transaction with Indymac on March 31, 2007, Steven B. Schnall, our Chairman, President and Co-Chief Executive Officer, and Joseph V. Fierro, the Chief Operating Officer of NYMC, resigned from their executive positions with us and assumed roles with Indymac. Concurrent with Mr. Schnall’s resignation, Steven R. Mumma, presently our Chief Financial Officer, will also assume the roles of President and Co-Chief Executive Officer. Mr. Schnall continues to serve our Board of Directors as its non-executive Chairman, and David A. Akre continues to serve as Vice Chairman and Co-Chief Executive Officer.
In connection with the sale of our wholesale mortgage origination platform assets on February 22, 2007 and the transaction with Indymac, during the fourth quarter of 2006, we classified substantially all of the assets, liabilities and operations of our Mortgage Lending segment as a discontinued operation in accordance with the provisions of Statement of Financial Accounting Standards No. 144, “Accounting for the Impairment or Disposal of Long-Lived Assets” (“SFAS No. 144”). As a result, we have reported revenues and expenses related to the segment as a discontinued operation and the related assets and liabilities as assets and liabilities related to a discontinued operation for all periods presented in the accompanying consolidated financial statements. Certain assets, such as the deferred tax asset, and certain liabilities, such as subordinated debt and liabilities related to leased facilities not assigned to Indymac will become part of the ongoing operations of NYMT and accordingly, we have not classified as a discontinued in accordance with the provisions of SFAS No. 144. See Note 12 in the notes of our consolidated financial statements.
Following our exit from the mortgage lending business, we will exclusively focus our resources and efforts on the business that we refer to as our Mortgage Portfolio Management segment, which will primarily involve investing, on a leveraged basis, in residential mortgage backed securities, and our revenues will be derived primarily from the difference between the interest income we earn on our mortgage assets and the costs of our borrowings (net of hedging expenses). Because the mortgage lending business represented a significant part of our operations, our historic operations (since completion of our initial public offering) may not be necessarily comparable to our financial operations following consummation of the transactions described above.
Our Mortgage Portfolio Management Business
Our residential mortgage investments are comprised of ARM loans, ARM securities and floating rate collateralized mortgage obligations (“CMO Floaters”). The ARM loans and securities have interest rates that reset in a year or less, and “hybrid” ARM loans and securities have a fixed interest rate for an initial period of two to seven years before converting to ARM loans and securities whose rates will reset each year or shorter. ARM securities represent interests in pools of ARM loans. The ARM securities are rated by at least one of two nationally recognized rating agencies, Standard & Poor’s, Inc. or Moody’s Investors Service, Inc. (the “Rating Agencies”), or issued by Freddie Mac (“FHLMC”), Fannie Mae (“FNMA”) or Ginnie Mae (“GNMA”). The securitizations result in a series of rated mortgage securities backed by the ARM loans. The CMO Floaters are mortgage securities backed by a pool of FNMA, FHLMC or GNMA fixed rate mortgage loans the cash flows from which have interest rates that adjust monthly. As an investor in residential mortgage assets, our net income is generated primarily from the difference between the interest income we earn on our mortgage assets and the cost of our borrowings (net of hedging expenses), commonly referred to as the “Net Spread.” Our goal is to maximize the long-term sustainable difference between the yield on our investments and the cost of financing these assets through the following strategies:
· | earning net interest spread between the yield of mortgage assets we own and the cost to finance such assets;indebtedness using: |
· | focusing on purchasing high credit quality residential mortgage loans through third parties that we believe can be retained in our portfolio;· repurchase agreements; and |
| · term repurchase agreements. |
Until further modified by our Board of Directors, our Category II and Category III investments will require the approval of our Board of Directors.
Our Relationship with HCS and the Advisory Agreement
HCS, an external advisor to the managed subsidiaries, is a wholly-owned subsidiary of JMP Group Inc. that manages a family of single-strategy and multi-manager hedge fund products. HCS also sponsors and partners with other investment firms. As of December 31, 2009, HCS had $443.0 million in client assets under management.
Concurrent and in connection with the issuance of our Series A Preferred Stock in January 2008, we entered into an advisory agreement with HCS pursuant to which HCS advises the Managed Subsidiaries with respect to assets held by the Managed Subsidiaries, excluding Agency RMBS held by the Managed Subsidiaries for regulatory compliance purposes and certain non-Agency RMBS. In addition, pursuant to the stock purchase agreement providing for the sale of the Series A Preferred Stock to the JMP Group, James J. Fowler was appointed Chairman of our Board of Directors. Mr. Fowler, who also serves as the non-compensated Chief Investment Officer of the Managed Subsidiaries, is a managing director of HCS, a subsidiary of JMP Group Inc. and a significant investor in our Series A Preferred Stock.
As of December 31, 2009, HCS, JMP Group Inc. and Joseph A. Jolson, the Chairman and Chief Executive Officer of JMP Group Inc., collectively beneficially owned a significant percentage of our outstanding capital stock. See “―Conflicts of Interest with HCS; Equitable Allocation of Investment Opportunities” below for more information. In addition, in November 2008 our Board of Directors approved an exemption from the ownership limitations contained in our charter to permit Mr. Jolson to beneficially own up to 25% of the aggregate value of our outstanding capital stock. As a result, these stockholders exert significant influence over us.
Advisory Agreement
As described above, in January 2008, we entered into an advisory agreement with HCS. The following is a summary of the key economic terms of the advisory agreement:
· Type | using hedging instruments | Description |
Base Advisory Fee | | A base advisory fee of 1.50% per annum of the “equity capital” of the Managed Subsidiaries is payable by us to better matchHCS in cash, quarterly in arrears. Equity capital of the Managed Subsidiaries is defined as, for any fiscal quarter, the greater of (i) the net asset value of the investments of the Managed Subsidiaries as of the end of the fiscal quarter, excluding any investments made prior to the date of the advisory agreement and liability durations;any assets contributed by us to the Managed Subsidiaries for the purpose of facilitating compliance with our exclusion from regulation under the Investment Company Act, or (ii) the sum of $20,000,000 plus 50% of the net proceeds to us or our subsidiaries of any offering of common or preferred stock completed by us during the term of the advisory agreement. |
Incentive Compensation | | The advisory agreement calls for incentive compensation to be paid by us to HCS under certain circumstances. If earned, incentive compensation is paid quarterly in arrears in cash; provided, however, that a portion of the incentive compensation may be paid in shares of our common stock. For the first three fiscal quarters of each fiscal year, 25% of the core earnings of the Managed Subsidiaries attributable to the investments that are managed by HCS that exceed a hurdle rate equal to the greater of (i) 2.00% or (ii) 0.50% plus one-fourth of the ten year treasury rate for such quarter. For the fourth fiscal quarter of each fiscal year, the difference between (i) 25% of the GAAP (as defined in Item 7 below) net income of the Managed Subsidiaries attributable to the investments that are managed by HCS that exceeds a hurdle rate equal to the greater of (a) 8.00% and (b) 2.00% plus the ten year treasury rate for such fiscal year, and (ii) the amount of incentive compensation paid for the first three fiscal quarters of such fiscal year. |
· Term | leveraging our portfolio | December 31, 2010, unless terminated earlier. The advisory agreement shall be automatically renewed for a one-year term each anniversary after the initial term unless we deliver prior written notice to increase its size withHCS of the intentnon-renewal not less than 180 days prior to enhance our returns while at the same time managingexpiration of the increased riskterm (or any extension). |
Termination Fee | | If we terminate the advisory agreement for cause, no termination fee is payable. Otherwise, if we terminate the advisory agreement or elect not to renew it, we will pay a cash termination fee equal to the sum of loss associated with this leverage;(i) the average annual base advisory fee and (ii) the average annual incentive compensation earned during the 24-month period immediately preceding the date of termination. |
· | utilizing hedging strategies that we consider appropriate to minimize exposure to interest rate changes. |
For the years ended December 31, 2009 and 2008, HCS was paid a base advisory fee of $0.8 million and $0.7 million, respectively, and an incentive compensation fee of $0.5 million for the year ended December 31, 2009. There was no incentive fee paid for the year ended December 31, 2008.
Conflicts of Interest with HCS; Equitable Allocation of Investment Opportunities
HCS manages, and is expected to continue to manage, other client accounts with similar or overlapping investment strategies. HCS has agreed to make available to the Managed Subsidiaries all investment opportunities that it determines, in its reasonable and good faith judgment, based on their investment objectives, policies and strategies, and other relevant factors, are appropriate for them in accordance with HCS’s written allocation procedures and policies.
Since certain of the Managed Subsidiaries’ targeted investments are typically available only in specified quantities and since certain of their targeted investments may also be targeted investments for other HCS accounts, HCS may not be able to buy as much of certain investments as required to satisfy the needs of all of its clients’ accounts. In these cases, HCS’s allocation procedures and policies would typically allocate such investments to multiple accounts in proportion to the needs of each account. The policies permit departure from proportional allocation when the total HCS allocation would result in an inefficiently small amount of the security being purchased for an account. In that case, the policy allows for a “rotational” protocol of allocating subsequent investments so that, on an overall basis, each account is treated equitably.
We expect that HCS will source substantially all of the non-RMBS investments made by the Managed Subsidiaries as advisor to those entities. HCS is authorized to follow broad investment guidelines determining which assets the Managed Subsidiaries will invest in, subject to the approval of our Board of Directors to our investment guidelines. However, as we diversify our investment portfolio in the future, our Board of Directors may elect to not review individual investments. In conducting their review of the investments held by our Managed Subsidiaries, our directors will rely primarily on information provided to them by HCS and our management. Furthermore, the Managed Subsidiaries may use complex investment strategies and transactions, which may be difficult or impossible to unwind. Although our Board of Directors must first approve an investment opportunity that falls under the advisory agreement, HCS has great latitude to determine the types of assets it may decide are proper investments for the Managed Subsidiaries. The investment guidelines do not permit HCS to invest in Agency RMBS, since these investments are made by us.
The advisory agreement does not restrict the ability of HCS or its affiliates from engaging in other business ventures of any nature (including other REITs), whether or not such ventures are competitive with the Managed Subsidiaries’ business so long as HCS’s management of other REITs or funds does not disadvantage us or the Managed Subsidiaries.
HCS may engage other parties, including its affiliates, to provide services to us or our subsidiaries; provided that any such agreements with affiliates of HCS shall be on terms no more favorable to such affiliate than would be obtained from a third party on an arm’s-length basis and, in certain circumstances, approved by a majority of our independent directors. With respect to portfolio management services, any agreements with affiliates shall be subject to our prior written approval and HCS shall remain liable for the performance of such services. With respect to monitoring services, any agreements with affiliates shall be subject to our prior written approval and the base advisory fee payable to HCS shall be reduced by the amount of any fees payable to such other parties, although we will reimburse any out-of-pocket expenses incurred by such other parties that are reimbursable by us.
We finance the purchases of ARM loans, ARM securities and CMO Floaters (collectively “ARM Assets”) with equity capital, unsecured debt and short-term borrowings such as repurchase agreements, securitizations resulting in floating-rate long-term collateralized debt obligations (“CDOs”) and other collateralized financings. For hedging purposes, and to the extent we feel is necessary, we enter into swap agreements whereby we receive floating rate payments in exchange for fixed rate payments, effectively converting the borrowings to a fixed rate. We believe our exposure and risks related to changes in interest rates can be prudently managed through holding ARM Assets and attempting to match the duration of our liabilities with the duration of our ARM Assets. From a credit risk perspective, we retain high quality assets and follow strict credit underwriting standards.
Our Mortgage Lending Business (Discontinued Operation)
Until March 31, 2007, we originated mortgage loans through NYMC. Licensed or exempt from licensing in 44 statesPursuant to Schedules 13D filed with the SEC on February 17, 2009, and a Schedule 13G/A filed on February 16, 2010, HCS, JMP Group, Inc. and Joseph A. Jolson, the DistrictChairman and Chief Executive Officer of ColumbiaJMP Group Inc., beneficially owned approximately 16.7%, 12.1% and through a network6.7%, respectively, of 25 full service branch loan origination locations and 22 satellite loan origination locations that were licensed or pending state license approvalour outstanding common stock as of December 31, 2006, NYMC offered2008 in the case of HCS and JMP Group Inc., and as of December 31, 2009 in the case of Mr. Jolson. In addition, as of December 31, 2009, HCS and JMP Group Inc. collectively beneficially owned 100% of outstanding Series A Preferred Stock. Any outstanding shares of our Series A Preferred Stock at December 31, 2010 must be redeemed for the purchase price plus any accrued or unpaid dividends on the Series A Preferred Stock as of that date. As of February 28, 2010, $20.0 million of the Series A Preferred Stock remained outstanding. HCS is an investment adviser that manages investments and trading accounts of other persons, including certain accounts affiliated with JMP Group, Inc., and is deemed the beneficial owner of shares of our common stock held by these accounts. As noted above, Mr. Fowler and Joseph A. Jolson are affiliates of JMP Group, Inc and HCS. As a broad rangeresult of the combined voting power of HCS, JMP Group, Inc. and Joseph A. Jolson, these stockholders exert significant influence over matters submitted to a vote of stockholders, including the election of directors and approval of a change in control or business combination of our company, and strategic direction of our Company. This concentration of ownership may result in decisions affecting us that are not in the best interests of all our stockholders. In addition, Mr. Fowler may have a conflict of interest in situations where the best interests of our company and stockholders do not align with the interests of HCS, JMP Group, Inc. or its affiliates, which may result in decisions that are not in the best interests of all our stockholders.
Company History
We were formed as a Maryland corporation in September 2003. In June 2004, we completed our initial public offering, or IPO, that resulted in approximately $122 million in net proceeds to our company. Prior to the IPO, we did not have recurring business operations. As part of our formation transactions, concurrent with our IPO, we acquired 100% of the equity interests in HC, which at the time was a residential mortgage products, with a primary focus on prime,origination company that historically had sold or high credit quality, residentialbrokered all of the mortgage loans. We sell the fixed-rate loans that weit originated to third partiesparties. Effective with the completion of our IPO, we operated two business segments: (i) our mortgage portfolio management segment and (ii) our mortgage lending segment. Under this business model, we would retain and either finance in our portfolio selected adjustable-rate and hybrid mortgage loans that we originated or we would sell them to third parties, while continuing to sell all fixed-rate loans originated by HC to third parties. As of
Commencing in March 2006, we began to sellstopped retaining all loans originated by NYMCHC and began to sell these loans to third parties. With the mortgage lending business facing increasingly difficult operating conditions, we began considering strategic alternatives for our mortgage lending business in mid-2006. In the first quarter of 2007, we completed the sale of substantially all of the assets related to our retail and wholesale residential mortgage lending platform, thereby marking our exit from the mortgage lending business.
In January 2008 we formed a strategic relationship with the JMP Group, whereby HCS became the contractual advisor to the Managed Subsidiaries and the JMP Group purchased 1.0 million shares of our Series A Preferred Stock for an effortaggregate purchase price of $20.0 million. The Series A Preferred Stock entitles the holders to receive a cumulative dividend of 10% per year, subject to an increase gainto the extent any future quarterly common stock dividends exceed $0.20 per share. The Series A Preferred Stock is convertible into shares of the Company's common stock based on sale revenue in current periods due to decreased spreads availablea conversion price of $8.00 per share of common stock, which represents a conversion rate of two and one-half (2 ½) shares of common stock for each share of Series A Preferred Stock. The Series A Preferred Stock matures on December 31, 2010, at which time any outstanding shares must be redeemed by holding the loans in portfolio. Our portfolio of loans is heldCompany at the real estate$20.00 per share liquidation preference. Pursuant to Statement of Financial Accounting Standards (“SFAS”) No.150, Accounting for Certain Financial Instruments with Characteristics of both Liabilities and Equity, because of this mandatory redemption feature, the Company classifies these securities as a liability on its balance sheet.
In February 2008, we completed the issuance and sale of 7.5 million shares of our common stock to certain accredited investors in a private placement at a price of $8.00 per share, generating net proceeds to us of $56.5 million after payment of private placement fees and expenses.
The Company’s shares of common stock are currently listed on the NASDAQ Capital Market (“NASDAQ”) under the symbol “NYMT.” In connection with the minimum listing price requirements of NASDAQ, we have completed two separate reverse stock splits on our common stock; a 1-for-5 reverse split in October 2007 and a 1-for-2 reverse split in May 2008. The information in this Annual Report on Form 10-K gives effect to these reverse stock splits as if they occurred at the Company’s inception.
Our Structure
We conduct our business through New York Mortgage Trust, Inc., which serves as the parent company, and several of our subsidiaries, including special purpose subsidiaries established for loan securitization purposes. We conduct certain of our portfolio investment trust (“REIT”operations through our wholly-owned taxable REIT subsidiary ("TRS") level, HC, in order to utilize, to the extent permitted by law, some or byall of a net operating loss carry-forward held in HC that resulted from HC’s exit from the mortgage lending business. Our wholly-owned qualified REIT subsidiary ("QRS"), NYMF, currently holds certain mortgage-related assets for regulatory compliance purposes. The Company consolidates all of its subsidiaries under generally accepted accounting principles in the United States of America (“QRS”GAAP”). We relied on our own underwriting criteria with respect to the mortgage loans we retained and relied on the underwriting criteria of the institutions to which we sell our loans with respect to the loans we intend to sell. In either case, we directly performed the underwriting of such loans with our own experienced underwriters.
Certain Federal Income Tax Considerations and Our Tax Status as a REIT
Unlike banks, savings and loans or most mortgage originators, we are structured as a REIT for federal income tax purposes. We have elected to be taxed as a REIT under Sections 856-860 of the Internal Revenue Code (IRC) of 1986, as amended, for federal income tax purposes, commencing with our taxable year ended December 31, 2004, and we operate so asbelieve that our current and proposed method of operation will enable us to continue to qualify as a real estate investment trust (“REIT”)REIT for federal income tax purposes.our taxable year ended December 31, 2010 and thereafter. We hold our investment in ARM Assetsmortgage portfolio investments directly or in a qualified REIT subsidiary, or QRS. Accordingly, the net interest income we earn on our ARM Assetsthese assets is generally not subject to federal income tax as long as we distribute at least 90% of our REIT taxable income in the form of a dividend to our stockholders each year and comply with various other requirements. Failure to qualify as a REIT would subject the Company to federalTaxable income tax (including any applicable minimum tax) on its taxable income at regular corporate rates and distributions to its stockholders in any such year would not be deductiblegenerated by the Company.
NYMC isHC, our taxable REIT subsidiary, (“TRS”). The activities we conduct through NYMC, including purchasing mortgage loans from and selling mortgage loans sold to third parties, are subject to federal and state corporate income tax. We may elect to retain any after tax income generated by NYMC, and, as a result, may increase our consolidated capital and grow our business through retained earnings or distribute all or a portion of our after-tax NYMC earnings to our stockholders.
Access to our Periodic SEC Reports and Other Corporate Information
Our internet website address is www.nymtrust.com. We make available free of charge, through our internet website, our annual report on Form 10-K, our quarterly reports on Form 10-Q, current reports on Form 8-K and any amendments thereto that we file or furnish pursuant to Section 13(a) or 15(d) of the Securities Exchange Act of 1934 as soon as reasonably practicable after we electronically file such material with, or furnish it to, the Securities and Exchange Commission (the “SEC”). Our Corporate Governance Guidelines and Code of Business Conduct and Ethics and the charters of our Audit, Compensation and Nominating and Corporate Governance Committees are also available on our website and are available in print to any stockholder upon request in writing to New York Mortgage Trust, Inc., c/o Chief Financial Officer and Secretary, 1301 Avenue of the Americas, 7th floor, New York, New York 10019. Information on our website is neither part of nor incorporated into this annual report on Form 10-K.
Corporate Governance
We operate our business with a focus on high standards in business practices and professional conduct. The following are some of the highlights relating to our corporate governance:
· | Our board of directors is composed of a super-majority of independent directors. As per guidelines established by the SEC and NYSE, the Audit, Nominating/Governance and Compensation Committees are composed exclusively of independent directors. |
· | We have adopted a Code of Business Conduct and Ethics and Corporate Governance Guidelines that apply to all officers, directors and employees (as well as a supplemental Code of Ethics for Senior Financial Officers) to promote the highest standard of conduct and ethics in our dealings with our customers, stockholders, vendors, the public and our employees. |
· | Our Insider Trading Policy prohibits any of the directors, officers or employees of the Company from buying or selling our stock on the basis of material nonpublic information, and in conjunction with our Regulation FD policy, prohibits communicating material nonpublic information to others. Trading of our securities by directors, officers or employees is allowed only during a discreet narrow open period after our quarterly report on Form 10-Q or annual report on Form 10-K is filed with the SEC. |
· | We have established a formal internal audit function to monitor and test the efficiency of our internal controls and procedures as well as the implementation of Section 404 of the Sarbanes-Oxley Act of 2002. |
· | We have made publicly available, through our website www.nymtrust.com, the charters of the independent committees of our Board of Directors (Audit Committee, Compensation Committee, Nominating and Corporate Governance Committee) and other corporate governance materials, including our Code of Business Conduct and Ethics, our Corporate Governance Guidelines, our Insider Trading Policy, and other corporate governance policies. |
Company History
We were formed as a Maryland corporation in September 2003. On January 9, 2004, we capitalized New York Mortgage Funding, LLC (“NYMF”) as a wholly-owned subsidiary of our company. NYMF is a qualified REIT subsidiary (“QRS”), in which we accumulate mortgage loans that the Company intends to securitize. In June 2004, we sold 15 million shares of our common stock in an IPO at a price to the public of $9.00 per share, for net proceeds of approximately $122 million after deducting the underwriters’ discount and other offering expenses. Concurrent with our IPO, we issued 2,750,000 shares of common stock in exchange for the contribution to us of 100% of the equity interests of NYMC. Prior to the IPO, we did not have recurring business operations.
Prior to being acquired by us, NYMC’s business strategy was to sell or broker all of the loans it originated to third parties and the largest component of NYMC’s net income was generated by the gain on sale of such loans. For accounting purposes and reporting purposes, the combination of our company and NYMC is accounted for as a reverse merger and the related transfer of loans originated by NYMC to us is accounted for as a transfer of assets between entities under common control. Accordingly, we have recorded assets and liabilities transferred from NYMC at their carrying amounts in the accounts of NYMC at the date of transfer. The consolidated financial statements include the accounts of our Company subsequent to the IPO and also include the accounts of NYMC and NYMF prior to the IPO. As a result, our historical financial results prior to the IPO reflect the financial operations of this prior business strategy of selling virtually all of the loans originated by NYMC to third parties. Furthermore, the ARM loans we originated and securitized in the securitizations completed in 2005 were recorded at cost with no gain on sale recognized, as would be the case if sold to third parties. Since our IPO, our business strategy has been to invest in ARM loans and securitize them to generate net interest income. As a result, our historic operations prior to the IPO and current financial operations are not necessarily comparable.
Our Industry
With the closing of the transaction under which we sold substantially all of the assets of the retail mortgage lending platform to Indymac, we are now principally a residential portfolio manager. Our portfolio is comprised of residential adjustable rate mortgage loans and securities. As of December 31, 2006 approximately 98% of our assets are rated either “AA” or “AAA” by either Standard & Poor’s or Moody’s, or are obligations issued by either Fannie Mae or Freddie Mac. Besides continuing to manage our existing portfolio, our future strategy will most likely involve the purchase or high quality residential mortgage loans in bulk, and the securitization of same.
Operating Policies, Strategies and Business Segments
Until March 31, 2007, the Company operated two segments, the Mortgage Portfolio Management segment and the Mortgage Lending segment. Upon the sale of substantially all of its mortgage lending operating assets to Indymac as of March 31, 2007, the Company exited the mortgage lending business and accordingly will no longer report segment information.
Mortgage Portfolio Management
Prior to the completion of our IPO on June 29, 2004, our operations were limited to the mortgage operations described in the section below entitled “Mortgage Lending.” Beginning in July 2004, we began to implement our business plan of investing in high quality, adjustable rate mortgage loan securities. Our portfolio management strategy is to acquire ARM Assets from third parties to hold in our portfolio, fund them using equity capital and borrowings and to generate net interest income from the difference, or net spread, between the yield on these assets and our cost of financing. Prior to March 2006, we invested in ARM Assets originated by NYMC, but have since ceased this activity in an effort to increase gain on sale revenue due to a reduction in spreads available by holding loans in portfolio. In order to accomplish this, our:
· | Acquired ARM Assets are replaced with high-quality mortgage securities ARM loans acquired from third parties, (and in the past acquired ARM Assets were replaced with ARM loans originated by NYMC). |
· | Mortgage portfolio management operates with a long-term investment outlook. |
· | Short-term financing of ARM loans to be securitized is provided by secured warehouse and aggregation lines. |
· | Ultimate financing for ARM loans is provided by either issuing collateralized debt obligations or by repurchase financing facilities. |
We seek to have a portfolio consisting of high quality mortgage-backed securities and loans. We believe that retaining high quality assets in our portfolio helps us mitigate risks associated with market disruptions. Our investment guidelines define the following classifications for securities we own:
· | Category I investments are mortgage-backed securities that are either rated within one of the two highest rating categories by at least one of the Rating Agencies, or have their repayment guaranteed by FHLMC, FNMA or GNMA. |
· | Category II investments are mortgage-backed securities with an investment grade rating of BBB/Baa or better by at least one of the Rating Agencies. |
· | Category III investments are mortgage-backed securities that have no rating from, or are rated below investment grade by at least one of the Rating Agencies. |
The investment policy adopted by our Board of Directors provides, among other things, that:
· | no investment shall be made which would cause us to fail to qualify as a REIT; |
· | no investment shall be made which would cause us to be regulated as an investment company; |
· | at least 70% of our assets will be Category I investments or loans that back or will back such investments; and |
· | no more than 7.5% of our assets will be Category III investments. |
Our Board of Directors may amend or waive compliance with this investment policy at any time without the consent of our stockholders.
To achieve our portfolio strategy and mitigate risk, we:
· | attempt to maintain a net duration, or duration gap, of one year or less on our ARM portfolio, related borrowings and hedging instruments; |
· | structure our liabilities to mitigate potential negative effects of changes in the relationship between short- and longer-term interest rates; |
· | focus on holding ARM loans rather than fixed-rate loans, as we believe we will be adversely affected to a lesser extent by early repayments due to falling interest rates or a reduction in our net interest income due to rising interest rates. |
Our Board of Directors has also established an investment and leverage committee for the purpose of approving certain investment transactions and the incurrence of indebtedness. This committee is comprised of our co-chief executive officers, and our chief financial officer. The committee has the authority to approve, without the need of further approval of our board of directors, the following transactions from time to time, any of which may be entered into by us or any of our subsidiaries:
· | the purchase and sale of agency and private label mortgage-backed securities, subject to the limitations described above; |
· | securitizations of our mortgage loan portfolio; |
· | the purchase and sale of agency debt; |
· | the purchase and sale of U.S. Treasury securities; |
· | the purchase and sale of overnight investments; |
· | the purchase and sale of money market funds; |
· | hedging arrangements using: |
·interest rate swaps and Eurodollar contracts;
·caps, floors and collars;
·financial futures; and
·options on any of the above; and
· | the incurrence of indebtedness using: |
·repurchase agreements;
·bank loans, up to an aggregate of $100 million; and
·term repurchase agreements.
Initially, the loans held for investment are funded through warehouse facilities and repurchase agreements. We ultimately finance the loans that we retain in our portfolio through securitization transactions. Upon securitization, we expect that a vast majority of the resulting mortgage-backed securities will become eligible for inclusion in Category I.
The only subordinate classes of mortgage-backed securities that we will hold (Category III investments) are subordinate classes that result from securitizations of the mortgage loans in our portfolio. We do not seek to acquire subordinated mortgage-backed securities as investments but instead acquire them only in connection with our mortgage loan securitizations or in order to help us meet our asset tests as a REIT.
Our liabilities are primarily termed repurchase agreements with maturities ranging from one to twelve months. A significant risk to our operations, relating to our portfolio management, is the risk that interest rates on our assets will not adjust at the same times or amounts that rates on our liabilities adjust. Even though we have retained and invested in ARM loans, many of the hybrid ARM loans in our portfolio have fixed rates of interest for a period of time ranging from two to seven years. We use interest rate swaps to extend the duration of our liabilities to attempt to match the duration of our assets and we use termed repurchase agreements with laddered maturities to reduce the risk of a disruption in the repurchase market. Since we hold primarily ARM Assets rated AAA and agency securities (FHLMC or FNMA), we believe we are less susceptible to a disruption in the repurchase market as these types of securities have typically been eligible for repurchase market financing even when repurchase financing was not available for other classes of mortgage assets or asset backed bonds.
Mortgage Lending (Discontinued Operation)
The origination of mortgage loans through NYMC has a significant impact on our financial results in that:
· | Loans we originate and sell generate gain on sale income at the TRS. |
· | Certain ARM loans may be held in portfolio rather than be sold, thus reducing current period gain on sale income. |
· | A majority of the Company’s overhead is associated with the mortgage lending segment. |
· | Any early payment defaults and resulting loss in 2006 will come from our mortgage lending segment |
Until March 31, 2007, through NYMC, we originated primarily first mortgages on one-to-four family dwellings through our retail loan production offices and supplemented this origination production through our internet channel (www.MortgageLine.com). On February 22, 2007 we closed an asset sale transaction with Tribeca Lending for our wholesale origination business, and as of that date, no longer originate loans in a wholesale capacity. As of March 31, 2007, we closed an asset sale transaction with Indymac for substantially all of the operating assets of the Company’s mortgage lending business and as of that date exited the mortgage lending business.
The following table details the payment stream, loan purpose and documentation type of our mortgage loan originations for the year ended December 31, 2006:
MORTGAGE LOAN ORIGINATION SUMMARY
For the fiscal year ended December 31, 2006
| | | Number of Loans | | Dollar Value (in thousands) | | % of Total | |
Payment Stream | | | | | | | |
Fixed Rate | | | | | | | |
| FHA/VA | | | 477 | | $ | 78,899 | | | 3.1 | % |
| Conventional: | | | | | | | | | | |
| Conforming | | | 5,942 | | | 1,044,537 | | | 41.1 | % |
| Conventional Jumbo | | | 505 | | | 318,346 | | | 12.5 | % |
| Total Fixed Rate | | | 6,924 | | $ | 1,441,782 | | | 56.7 | % |
ARMs | | | | | | | | | | |
| FHA/VA | | | 12 | | $ | 3,423 | | | 0.1 | % |
| Conventional | | | 3,386 | | | 1,098,798 | | | 43.2 | % |
| Total ARMs | | | 3,398 | | | 1,102,221 | | | 43.3 | % |
| Annual Total | | | 10,322 | | $ | 2,544,003 | | | 100.0 | % |
Loan Purpose | | | | | | | | | | |
| Conventional | | | 9,833 | | $ | 2,461,681 | | | 96.8 | % |
| FHA/VA | | | 489 | | | 82,322 | | | 3.2 | % |
| Total | | | 10,322 | | $ | 2,544,003 | | | 100.0 | % |
Documentation Type | | | | | | | | | | |
| Full Documentation | | | 5,317 | | $ | 1,265,453 | | | 49.7 | % |
| Stated Income | | | 2,167 | | | 610,235 | | | 24.0 | % |
| Stated Income/Stated Assets | | | 1,259 | | | 293,454 | | | 11.5 | % |
| No Documentation | | | 925 | | | 231,244 | | | 9.1 | % |
| No Ratio | | | 445 | | | 101,868 | | | 4.0 | % |
| Stated Assets | | | 15 | | | 2,329 | | | 0.1 | % |
| Other | | | 194 | | | 39,420 | | | 1.6 | % |
| Total | | | 10,322 | | $ | 2,544,003 | | | 100.00 | % |
Retail Loan Origination
Our loan origination strategy is predominantly retail, referral-based, mortgage banking. Our loan officers rely primarily on the various relationships they have established with their clientele, realtors, attorneys and others who routinely interact with those who may need mortgage financing. Retail loan origination allows us to provide a variety of attractive and innovative mortgage products at competitive rates. Unlike many banks and financial institutions which focus solely on loan products to retain in their portfolios, we offer a wide range of products — products that we have retained in the past and may retain in portfolio in the future, and products that we will sell to third parties if such loans do not meet our investment parameters.
Because we are predominately referral-based, our cost of sourcing potential retail clients, we believe, is less than an organization that relies heavily on concentrated broadcast, print or internet media advertising. By eliminating intermediaries between the borrower and us, we can both originate high quality mortgage loans for retention in our portfolio at attractive yields or offer loans that may be sold to third parties, while at the same time offering our customers a variety of mortgage products at competitive rates and fees.
On March 31, 2007, we closed an asset sale transaction with Indymac for substantially all of the operating assets of our retail mortgage lending business and as of that date we have exited the mortgage lending business.
Wholesale Loan Origination
Our wholesale lending strategy has historically been a small component of our loan origination operations. Our wholesale lending business was driven by a network of non-affiliated wholesale loan brokers and mortgage lenders who submitted loans to us. We maintained relationships with these wholesale brokers and, as with retail loan originations, underwrote, processed, and funded wholesale loans through our centralized facilities and processing systems. In order to further diversify our origination network, during 2005, we expanded our wholesale loan origination capacity with the creation of a division specifically for wholesale loan originations.
On February 22, 2007, we closed an asset sale transaction with Tribeca Lending for our wholesale origination business, and as of that date, no longer originate loans in a wholesale capacity.
Correspondent Lending
Until March 31, 2007, through our correspondent lending channels, from time to time we acquired bulk mortgage loan packages from Company-approved correspondent lenders. To date these purchases have been to supplement loans put into our securitizations. We reviewed our correspondents for the soundness of their in-house mortgage lending procedures and their ability to fulfill their representations and warranties to us. Generally, loans acquired from correspondents were originated according to the correspondents’ product specifications and underwriting guidelines that we have approved and accepted.
A full loan collateral review of each loan file, was performed to assess note and mortgage documentation sufficiency and compliance, to verify product quality and compliance with our investment guidelines, we performed a full review of substantially all moderate to high credit risk loans.
Underwriting
Historically, NYMC’s underwriting philosophy has been to underwrite loans according to the guidelines established by the available purchasers of its loans. However, the Company underwrites to its own guidelines select ARM loans it retains for its investment portfolio. We believe that proper underwriting for such loans was critical to managing the credit risk inherent in a loan portfolio.
Typically, mortgage underwriting guidelines provide a framework for determining whether a proposed mortgage loan to a potential borrower will be approved. The key points in this framework are the borrower’s credit scores and other indications of the borrower’s ability and willingness to repay the loan, such as the borrower’s employment and income, the amount of the borrower’s equity in and the value of the borrower’s property securing the loan, the borrower’s debt to income and other debt ratios, the loan to value (“LTV”) of the loan, the amount of funds available to the borrower for closing and the borrower’s post-closing liquidity.
Until March 31, 2007 when the Company exited the mortgage lending business, they Company followed the underwriting guidelines established by available purchasers with respect to the loans we intend to sell. Furthermore, for mortgage loans we have retained in the past, the Company followed a specific underwriting methodology based on the following philosophy — first evaluate the borrower’s ability and willingness to repay the loan, and then evaluate the value of the property securing the loan. Our strategy has been to only retain mortgage loans that we believed had low risk of default and resultant loss. As underwriting basically seeks to predict future borrower payment patterns and ability based on the borrower’s history and current financial information and the lender’s ability to be made whole in the future through foreclosure in the event a default does occur, no assurance can be made that every loan originated or purchased will perform as anticipated. In March 2006, we ceased our practice of retaining loans originated by NYMC to hold in our portfolio and as of March 31, 2007 we exited the mortgage lending business.
The key aspects of our underwriting guidelines were as follows:
Borrower—In evaluating the borrower’s ability and willingness to repay a loan, we reviewed and analyzed the following aspects of the borrower: credit score, income and its source, employment history, debt levels in revolving, installment and other mortgage loans, credit history and use of credit in the past, and finally the ability and/or willingness to provide verification for the above. Credit scores, credit history, use of credit in the past and information as to debt levels can be typically obtained from a third party credit report through a credit repository. Those sources were used in all cases, as available. In certain cases, borrowers had little or no credit history that can be tracked by one of the primary credit repositories. In these cases, the reason for the lack of history was considered and taken into account. In our experience, more than 95% of prospective borrowers have accessible credit histories. In other cases borrowers are not required, per the loan program, to provide proof of either their stated incomes and or stated assets as found on their mortgage applications. These loan types can make assessment of the borrower's credit profile more difficult.
Property—In evaluating a potential property to be used as collateral for a mortgage loan, we consider all of the following aspects of the property: the loan balance versus the property value, or LTV, the property type, how the property will be occupied (a primary residence, second home or investment property), if the property’s apparent value is supported by recent sales of similar properties in the same or a nearby area, any unique characteristics of the property and our confidence in the above data and their sources.
Other Considerations—Other considerations that impact our decision regarding a borrower’s loan application include the borrower’s purpose in requesting the loan (purchase of a home as opposed to cashing equity out of the home through a refinancing for example), the loan type (adjustable-rate, including adjustment periods and loan life rate caps, or fixed-rate), and any items unique to a loan that we believe could affect credit performance.
In addition, we worked with nationally recognized providers of appraisal, credit, and title insurance. We oversaw the activities of these service providers through on-site visits, report monitoring, customer service surveys, post-closing quality control, and periodic direct participation and conversations with our customers. A significant amount of our settlement services were performed by in-house professionals. We maintained an extensive quality control review process that was contracted with a third party in order to verify that selected loans were properly underwritten, executed and documented. All loans retained in portfolio and a selection of other loans sold to third parties were reviewed for quality control.
Our Loan Origination Financing Strategy
We financed our loan originations utilizing warehouse agreements as well as other similar financing arrangements. The agreements are each renewable annually, but are not committed, meaning that the counterparties to the agreements may withdraw access to the credit facilities at any time.
Warehouse Facilities—Non-depository mortgage lenders, such as NYMC, typically rely on credit facilities for capital needed to fund new mortgage loans. These facilities are typically lines of credit or master repurchase agreements from other financial institutions that the mortgage banker can draw from in order to fund new mortgage loans. These facilities are referred to as warehouse lines or warehouse facilities.
Warehouse lines are typically collateralized loans made to mortgage bankers that in turn pledge the resulting loans to the warehouse lender. Third-party mortgage custodians, usually large banks, typically hold the mortgage loans, including the notes, mortgages and other important loan documentation, for the benefit of the mortgage lender who is deemed to own the loan and, if there is a default under the warehouse line, for the benefit of the warehouse lender.
As of December 31, 2006 we had a $250 million warehouse facility with Greenwich Capital Financial Products, Inc, a $200 million warehouse facility with Credit Suisse First Boston Mortgage Capital, LLC, and a $300 million master repurchase agreement with Deutsche Bank Structured Products, Inc. The Deutsche Bank facility became operational in January 2006 and has expired on March 26, 2007. The Greenwich Capital facility has expired as of February 4, 2007.
Loan Servicing
Loan servicing is the administration function of a mortgage loan whereby an entity collects monthly payments from a mortgage borrower and disburses those funds to the appropriate parties. The servicer has to account for all payments, maintain balances in certain accounts for each loan, maintain escrow accounts for real estate taxes and insurance, remit the correct amount of principal and interest monthly to the holder of the loan and handle foreclosures as required.
Any loans that we originated and retained for our portfolio have their servicing handled by Cenlar Federal Savings Bank (“Cenlar”), a wholesale bank specializing in mortgage sub-servicing nationwide. Under this arrangement, Cenlar acts as an intermediary between us and the borrower. It collects payments from borrowers, handles accounting and remittance of the payments, handles escrow accounts and does certain tax reporting. As our retained loans are securitized, Cenlar continues to service those loans and reports to the securities trustee or master servicer, as appropriate.
For a loan originated and sold to third parties, the servicing rights are sold upon the sale of the loan. We may choose to own in NYMC, for periods usually not more than 90 days, certain loans designated as held for sale to third parties in order to increase earnings. In these cases, we believe there is a large enough spread between the mortgage loan interest rate and the interest rate paid on the applicable warehouse line to make any additional risk in carrying those loans on our balance sheet worthwhile. In these cases, and during the interim period between the time we fund (and subsequently own) a loan and sell the loan to a third party, we service loans through Cenlar as well.
Loan servicing provided by Cenlar is provided on a private label basis, meaning that Cenlar employees will identify themselves as being our representatives and correspondence regarding loans is on our letterhead. The benefit to us of this arrangement is that we pay for loan services as we use them, without a significant investment in personnel, systems and equipment. In addition, since Cenlar sub-services on our behalf and reports directly to us, we are quickly made aware of any customer wishing for an early payoff of their loan through refinancing or sale of their home. As a result, we can quickly respond to customer needs and make immediate efforts reestablishing customer contact in order to capture the potential payoff of a customer’s loan with another loan product (potential refinancing, modification or new purchase mortgage) that suits their needs.
CAUTIONARY NOTE REGARDING FORWARD-LOOKING STATEMENTS
This Annual Report on Form 10-K contains certain forward-looking statements. Forward looking statements are those which are not historical in nature. They can often be identified by their inclusion of words such as “will,” “anticipate,” “estimate,” “should,” “expect,” “believe,” “intend” and similar expressions. Any projection of revenues, earnings or losses, capital expenditures, distributions, capital structure or other financial terms is a forward-looking statement. Certain statements regarding the following particularly are forward-looking in nature:
· | the potential consummation of the disposition of each of our retail and wholesale mortgage lending businesses; |
· | our consideration of strategic options, including the possible sale or merger of NYMT or raising capital under a passive REIT business model; |
· | future performance, developments, market forecasts or projected dividends; and |
· | projected capital expenditures. |
It is important to note that the description of our business in general and our investment in mortgage loans and mortgage-backed securities holdings in particular, is a statement about our operations as of a specific point in time. It is not meant to be construed as an investment policy, and the types of assets we hold, the amount of leverage we use, the liabilities we incur and other characteristics of our assets and liabilities are subject to reevaluation and change without notice.
Our forward-looking statements are based upon our management’s beliefs, assumptions and expectations of our future operations and economic performance, taking into account the information currently available to us. Forward-looking statements involve risks and uncertainties, some of which are not currently known to us that might cause our actual results, performance or financial condition to be materially different from the expectations of future results, performance or financial condition we express or imply in any forward-looking statements. Some of the important factors that could cause our actual results, performance or financial condition to differ materially from expectations are:
· | our proposed portfolio strategy may be changed or modified by our management without advance notice to stockholders, and that we may suffer losses as a result of such modifications or changes; |
· | risks associated with the availability of liquidity; |
· | risks associated with the use of leverage; |
· | risks associated with non-performing assets; |
· | interest rate mismatches between our mortgage-backed securities and our borrowings used to fund such purchases; |
· | changes in interest rates and mortgage prepayment rates; |
· | effects of interest rate caps on our adjustable-rate mortgage-backed securities; |
· | the degree to which our hedging strategies may or may not protect us from interest rate volatility; |
· | potential impacts of our leveraging policies on our net income and cash available for distribution; |
· | our board’s ability to change our operating policies and strategies without notice to you or stockholder approval; |
· | the other important factors described in this Annual Report on Form 10-K, including those under the captions “Management’s Discussion and Analysis of Financial Condition and Results of Operations,” “Risk Factors,” and “Quantitative and Qualitative Disclosures about Market Risk.” |
We undertake no obligation to publicly update or revise any forward-looking statements, whether as a result of new information, future events or otherwise. In light of these risks, uncertainties and assumptions, the events described by our forward-looking events might not occur. We qualify any and all of our forward-looking statements by these cautionary factors. In addition, you should carefully review the risk factors described in other documents we file from time to time with the Securities and Exchange Commission, including the Company’s registration statement on Form S-3 (File No. 333-127400).
This Annual Report on Form 10-K contains market data, industry statistics and other data that have been obtained from, or compiled from, information made available by third parties. We have not independently verified their data.
Competition
When we invest in mortgage-backed securities, mortgage loans and other investment assets, we compete with a variety of institutional investors, including other REITs, insurance companies, mutual funds, hedge funds, pension funds, investment banking firms, banks and other financial institutions that invest in the same types of assets. As we seek to expand our business, we face a greater number of competitors, many of whom are well-established in the markets we seek to penetrate. Many of these investors have greater financial resources and access to lower costs of capital than we do. The existence of these competitive entities, as well as the possibility of additional entities forming in the future, may increase the competition for the acquisition of mortgage assets, resulting in higher prices and lower yields on assets.
As of December 31, 2006, we employed 616 people. Of this number, 327 were loan officers dedicated to originating loans.
As part of the sale of the wholesale lending business, Tribeca Lending hired approximately 62 employees.
Upon the sale of the retail mortgage lending platform and related assets to Indymac, substantially all retail mortgage lending related employees were hired by Indymac.
As of the completion of these two transactions, we will employ approximately 40 people.
Certain Federal Income Tax Considerations and Our Status as a REIT
We have elected to be taxed as a REIT under the federal income tax laws. As such, we operate in such a manner as to qualify for taxation as a REIT under the federal income tax laws, and we intend to continue to operate in such a manner, but no assurance can be given that we will operate in a manner so as to qualify or remain qualified as a REIT.
As a REIT, we generally will not be subject to federal income tax on the REIT taxable income that we distribute to our stockholders, but taxable income generated by NYMC, our taxable REIT subsidiary,TRS, is subject to regular corporate income tax.
The benefit of REIT tax status is a tax treatment that avoids “double taxation,” or taxation at both the corporate and stockholder levels, that generally applies to distributions by a corporation to its stockholders. Failure to qualify as a REIT would subject our Company to federal income tax (including any applicable minimum tax) on its taxable income at regular corporate rates and distributions to its stockholders in any such year would not be deductible by our Company.
Summary Requirements for Qualification
Organizational Requirements
A REIT is a corporation, trust, or association that meets each of the following requirements:
1) It is managed by one or more trustees or directors.
2) Its beneficial ownership is evidenced by transferable shares, or by transferable certificates of beneficial interest.
3) It would be taxable as a domestic corporation, but for the REIT provisions of the federal income tax laws.
4) It is neither a financial institution nor an insurance company subject to special provisions of the federal income tax laws.
5) At least 100 persons are beneficial owners of its shares or ownership certificates.
6) Not more than 50% in value of its outstanding shares or ownership certificates is owned, directly or indirectly, by five or fewer individuals, which the federal income tax laws define to include certain entities, during the last half of any taxable year.
7) It elects to be a REIT, or has made such election for a previous taxable year, and satisfies all relevant filing and other administrative requirements established by the IRS that must be met to elect and maintain REIT status.
8) It meets certain other qualification tests, described below, regarding the nature of its income and assets.
We must meet requirements 1 through 4 during our entire taxable year and must meet requirement 5 during at least 335 days of a taxable year of 12 months, or during a proportionate part of a taxable year of less than 12 months.
Qualified REIT SubsidiariesSubsidiaries.. A corporation that is a “qualified REIT subsidiary” is not treated as a corporation separate from its parent REIT. All assets, liabilities, and items of income, deduction, and credit of a “qualified REIT subsidiary” are treated as assets, liabilities, and items of income, deduction, and credit of the REIT. A “qualified REIT subsidiary” is a corporation, all of the capital stock of which is owned by the REIT. Thus, in applying the requirements described herein, any “qualified REIT subsidiary” that we own will be ignored, and all assets, liabilities, and items of income, deduction, and credit of such subsidiary will be treated as our assets, liabilities, and items of income, deduction, and credit.
Taxable REIT Subsidiaries. A REIT is permitted to own up to 100% of the stock of one or more “taxable REIT subsidiaries,” or TRSs. A TRS is a fully taxable corporation that may earn income that would not be qualifying income if earned directly by the parent REIT. Overall, no more than 20% of the value of a REIT’s assets may consist of stock or securities of one or more TRSs.
A TRS will pay income tax at regular corporate rates on any income that it earns. In addition, the TRS rules limit the deductibility of interest paid or accrued by a TRS to its parent REIT to assure that the TRS is subject to an appropriate level of corporate taxation. We have elected for NYMCHC to be treated as a TRS. NYMCHC is subject to corporate income tax on its taxable income, which is its net income from loan originations and sales.income.
Qualified REIT Assets
. On the last day of each calendar quarter, at least 75% of the value of our assets (which includes any assets held through a qualified REIT subsidiary) must consist of qualified REIT assets — primarily, real estate, mortgage loans secured by real estate, and certain mortgage-backed securities (“Qualified REIT Assets”), government securities, cash, and cash items. We believe that substantially all of our assets are and will continue to be Qualified REIT Assets. On the last day of each calendar quarter, of the assets not included in the foregoing 75% asset test, the value of securities that we hold issued by any one issuer may not exceed 5% in value of our total assets and we may not own more than 10% of the voting power or value of any one issuer’s outstanding securities (with an exception for securities of a qualified REIT subsidiary or of a taxable REIT subsidiary). In addition, the aggregate value of our securities in taxable REIT subsidiaries cannot exceed 20% of our total assets. We monitor the purchase and holding of our assets for purposes of the above asset tests and seek to manage our portfolio to comply at all times with such tests.
We intend to limit substantially all of the assets that we acquire to Qualified REIT Assets. Our strategy to maintain REIT status may limit the type of assets, including hedging contracts and other assets that we otherwise might acquire.
We may from time to time hold, through one or more taxable REIT subsidiaries, assets that, if we held them directly, could generate income that would have an adverse effect on our qualification as a REIT or on certain classes of our stockholders.
Gross Income Tests
We must meet the following separate income-based tests each year:
1.The 75% Test. At least 75% of our gross income for the taxable year must be derived from Qualified REIT Assets. Such income includes interest (other than interest based in whole or in part on the income or profits of any person) on obligations secured by mortgages on real property, rents from real property, gain from the sale of Qualified REIT Assets, and qualified temporary investment income or interests in real property. The investments that we have made and intend to continue to make will give rise primarily to mortgage interest qualifying under the 75% income test.
2.The 95% Test. At least 95% of our gross income for the taxable year must be derived from the sources that are qualifying for purposes of the 75% test, and from dividends, interest or gains from the sale or disposition of stock or other assets that are not dealer property.
Distributions
We must distribute to our stockholders on a pro rata basis each year an amount equal to at least (i) 90% of our taxable income before deduction of dividends paid and excluding net capital gain, plus (ii) 90% of the excess of the net income from foreclosure property over the tax imposed on such income by the Internal Revenue Code, less (iii) any “excess non-cash income.” We have made and intend to continue to make distributions to our stockholders in sufficient amounts to meet the distribution requirement for REIT qualification.
Item 1A. RISK FACTORSIRS guidance allows us to pay a portion of our annual distributions in shares of common stock rather than cash (generally up to 90% in 2010) if we meet certain requirements. In the event we need to preserve liquidity, we may pay a portion of our distributions in shares of our common stock.
Investment Company Act Exemption
We operate our business so as to be exempt from registration under the Investment Company Act. We rely on the exemption provided by Section 3(c)(5)(C) of the Investment Company Act. We monitor our portfolio periodically and prior to each investment to confirm that we continue to qualify for the exemption. To qualify for the exemption, we make investments so that at least 55% of the assets we own consist of qualifying mortgages and other liens on and interests in real estate, which are collectively referred to as “qualifying real estate assets,” and so that at least 80% of the assets we own consist of real estate-related assets (including our qualifying real estate assets, both as measured on an unconsolidated basis). We generally expect that our investments will be considered either qualifying real estate assets or real estate-related assets under Section 3(c)(5)(C) of the Investment Company Act. Qualification for the Section 3(c)(5)(C) exemption may limit our ability to make certain investments. In addition, we must ensure that each of our subsidiaries qualifies for the Section 3(c)(5)(C) exemption or another exemption available under the Investment Company Act.
Competition
Our success depends, in large part, on our ability to acquire assets at favorable spreads over our borrowing costs. When we invest in mortgage-backed securities, mortgage loans and other investment assets, we compete with a variety of institutional investors, including other REITs, insurance companies, mutual funds, hedge funds, pension funds, investment banking firms, banks and other financial institutions that invest in the same types of assets. Many of these investors have greater financial resources and access to lower costs of capital than we do.
AnCorporate Offices and PersonnelOur corporate headquarters are located at 52 Vanderbilt Avenue, Suite 403, New York, New York, 10017 and our telephone number is (212) 792-0107. As of December 31, 2009 we employed four full-time employees.
Access to our Periodic SEC Reports and Other Corporate Information
Our internet website address is www.nymtrust.com. We make available free of charge, through our internet website, our annual report on Form 10-K, our quarterly reports on Form 10-Q, current reports on Form 8-K and any amendments thereto that we file or furnish pursuant to Section 13(a) or 15(d) of the Securities Exchange Act of 1934 as soon as reasonably practicable after we electronically file such material with, or furnish it to, the SEC. Our Corporate Governance Guidelines and Code of Business Conduct and Ethics and the charters of our Audit, Compensation and Nominating and Corporate Governance Committees are also available on our website and are available in print to any stockholder upon request in writing to New York Mortgage Trust, Inc., c/o Secretary, 52 Vanderbilt Avenue, Suite 403, New York, New York, 10017. Information on our website is neither part of nor incorporated into this Annual Report on Form 10-K.
CAUTIONARY NOTE REGARDING FORWARD-LOOKING STATEMENTS
This Annual Report on Form 10-K contains certain forward-looking statements. Forward looking statements are those which are not historical in nature and can often be identified by their inclusion of words such as “will,” “anticipate,” “estimate,” “should,” “expect,” “believe,” “intend” and similar expressions. Any projection of revenues, earnings or losses, capital expenditures, distributions, capital structure or other financial terms is a forward-looking statement. Certain statements regarding the following particularly are forward-looking in nature:
| · | our business and investment strategy; |
| · | future performance, developments, market and industry forecasts or projected dividends; |
| · | future interest rate and credit environments; and |
| · | projected acquisitions or joint ventures. |
It is important to note that the description of our business is general and our investment in real estate-related and financial assets in particular, is a statement about our securities involves various risks.operations as of a specific point in time and is not meant to be construed as an investment policy. The types of assets we hold, the amount of leverage we use or the liabilities we incur and other characteristics of our assets and liabilities disclosed in this report as of a specified period of time are subject to reevaluation and change without notice.
Our forward-looking statements are based upon our management's beliefs, assumptions and expectations of our future operations and economic performance, taking into account the information currently available to us. Forward-looking statements involve risks and uncertainties, some of which are not currently known to us and many of which are beyond our control and that might cause our actual results, performance or financial condition to be materially different from the expectations of future results, performance or financial condition we express or imply in any forward-looking statements. Some of the important factors that could cause our actual results, performance or financial condition to differ materially from expectations are:
| · | our portfolio strategy and operating strategy may be changed or modified by our management without advance notice to you or stockholder approval and we may suffer losses as a result of such modifications or changes; |
| · | our ability to successfully diversify our investment portfolio and identify suitable assets for investments; |
| · | market changes in the terms and availability of repurchase agreements used and other funding sources to finance our investment portfolio activities; |
| · | reduced demand for our securities in the mortgage securitization and secondary markets; |
| · | interest rate mismatches between our mortgage-backed securities and our borrowings used to fund such purchases; |
| · | changes in interest rates and mortgage prepayment rates; |
| · | Increased rates of default and/or decreased recovery rates on our assets; |
| · | changes in the financial markets and economy generally; |
| · | effects of interest rate caps on our adjustable-rate mortgage-backed securities; |
| · | the degree to which our hedging strategies may or may not protect us from interest rate volatility; |
| · | potential impacts of our leveraging policies on our net income and cash available for distribution; |
| · | our board's ability to change our operating policies and strategies without notice to you or stockholder approval; |
| · | our ability to successfully implement and grow our alternative investment strategy; |
| · | our ability to manage, minimize or eliminate liabilities stemming from the discontinued operations including, among other things, litigation and repurchase obligations on the sale of mortgage loans; and |
| · | the other important factors identified, or incorporated by reference into this report, including, but not limited to those under the captions “Management's Discussion and Analysis of Financial Condition and Results of Operations” and “Quantitative and Qualitative Disclosures about Market Risk”, and those described in Part I, Item 1A – “Risk Factors” of this report and the various other factors identified in any other documents filed by us with the SEC. |
We undertake no obligation to publicly update or revise any forward-looking statements, whether as a result of new information, future events or otherwise. In light of these risks, uncertainties and assumptions, the events described by our forward-looking events might not occur. We qualify any and all of our forward-looking statements by these cautionary factors. In addition, you should carefully review the risk factors described in other documents we file from time to time with the SEC.
Item 1A. RISK FACTORS
Set forth below are the risks that we believe are material to stockholders. You should carefully consider the following risk factors and the various other factors identified in or incorporated by reference into any other documents filed by us with the SecuritiesSEC in evaluating our company and Exchange Commissionbefore making an investment decision involving our securities.business. The risks discussed herein can adversely affect our business, liquidity, operating results, prospects, and financial condition. This could cause the market price of our securities to decline and could cause you to lose all or part of your investment.decline. The risk factors described below are not the only risks that may affect us. Additional risks and uncertainties not presently known to us also may adversely affect our business, liquidity, operating results, prospects, and financial condition.
Holding loans for sale or securitization requires a significant amount of cash or warehouse facility capacity which if not available, could cause our business and financial performance to be significantly harmed.
By holding loans pending sale or securitization, we may also require cash in the event our warehouse facilities elect to not fund the entire principal balance of our loans, or if our loans are financed past the permitted term under our warehouse lines, or decline in value, we may need cash to reduce our borrowings under the warehouse facilities to the permitted level. We also need cash to fund or satisfy, as the case may be, our working capital, financial covenants in our warehouse facilities and other needs. We finance the majority of the loans we hold for sale or securitization by borrowing from our warehouse facilities and pledging the loans made as collateral. If the value of the loans we pledge as collateral declines, we may need cash to offset any decline in value.
Our primary sources of cash consist of:
· | borrowings, including under our warehouse facilities; |
· | our net interest income; |
· | the proceeds from the sale of our loans; and |
· | net proceeds from the sale of our securities. |
It is possible that our warehouse lenders could experience changes in their ability to advance funds to us, independent of our performance or the performance of our loans. In addition, if the regulatory capital requirements imposed on our lenders change, our lenders may be required to increase significantly the cost of the lines of credit that they provide to us.
As of December 31, 2006, we financed substantially all of our loan originations through warehouse facilities. Each of these facilities may be terminated by the lender upon an event of default, subject in some cases to cure periods. As of December 31, 2006, the aggregate balance outstanding under these facilities was approximately $173.0million. As of April 1, 2007, we have exited the mortgage lending business and accordingly have terminated two of our three warehouse facilities. If we are not able to renew this remaining warehouse facility or arrange for new financing on terms acceptable to us, or if we default on our covenants or are otherwise unable to access funds under this facility, we may not be able to continue to finance mortgage loans held for sale, which would have a material adverse effect on our business, financial condition, liquidity and results of operations. During the year ended December 31, 2006, we determined that we were not in compliance with certain of these financial covenants (primarily profitability and total net worth covenants). We received waivers from all lenders concerning such non-compliance. If we fail to comply with financial covenants in any of our warehouse facility in the future and are not able to cure the non-compliance or obtain the necessary waivers, this facility may be terminated by the lender.
We generally fund less than 100% of a loan balance with warehouse debt, requiring us to invest cash to the extent the originated balance is not funded by the warehouse facility. This funding shortfall ranges from 0% to 2% on loans financed under warehouse facilities. The longer loans remain funded by a warehouse facility the more our warehouse lenders require us to advance against the loans. In addition, our warehouse lenders will require us to have on deposit a cash margin against funded loans based upon the loan’s estimated market value.
In the event that our liquidity needs exceed our access to liquidity, we may need to sell assets at an inopportune time, thus reducing our earnings. Adverse cash flow could threaten our continued ability to satisfy the income and asset tests necessary to maintain our status as a REIT or our solvency.
Risks Related to Our Business and Our Company
Our common stock could be delisted byInterest rate mismatches between the New York Stock Exchange if we do not comply with its continued listing standards.interest-earning assets held in our investment portfolio, particularly RMBS, and the borrowings used to fund the purchases of those assets may reduce our net income or result in a loss during periods of changing interest rates.
Our common stock is listed onCertain of the New York Stock Exchange,RMBS held in our investment portfolio have a fixed coupon rate, generally for a significant period, and in some cases, for the average maturity of the asset. At the same time, our repurchase agreements and other borrowings typically provide for a payment reset period of 30 days or NYSE. Underless. In addition, the NYSE’s current listing standards,average maturity of our borrowings generally will be shorter than the average maturity of the RMBS in our portfolio and in which we are requiredseek to invest. Historically, we have market capitalization or shareholders' equityused swap agreements as a means for attempting to fix the cost of more than $25 million in ordercertain of our liabilities over a period of time; however, these agreements will generally not be sufficient to maintain compliance with continued listing standards. Asmatch the cost of March 28, 2007,all our market capitalization was approximately $42.7 million. We cannot assure you that we can continue to comply with the listing procedures and that the NYSE will maintainliabilities against all of our listing in the future.investment securities. In the event thatwe experience unexpectedly high or low prepayment rates on our common stockRMBS, our strategy for matching our assets with our liabilities is delisted by the NYSE, or if it becomes apparentmore likely to us that webe unsuccessful.
Interest rate fluctuations will be unable to meet the NYSE’s continued listing criteriaalso cause variances in the foreseeable future, we will seekyield curve, which may reduce our net income. The relationship between short-term and longer-term interest rates is often referred to haveas the “yield curve.” If short-term interest rates rise disproportionately relative to longer-term interest rates (a flattening of the yield curve), our stock listed or quoted on another national securities exchange or quotation system. However, we cannot assure you that, if our common stock is listed or quoted on such other exchange or system,borrowing costs may increase more rapidly than the market for our common stock will be as liquid as it has beeninterest income earned on the NYSE. As a result, if we are delisted by the NYSE or transfer our listing to another exchange or quotation system, the market price for our common stock may become more volatile than it has been historically.
Delisting of our common stock would likely cause a reduction in the liquidity of an investmentRMBS and other interest-earning assets in our common stock. Delisting also could reduceinvestment portfolio. Because the abilityRMBS in our investment portfolio typically bear interest based on longer-term rates while our borrowings typically bear interest based on short-term rates, a flattening of holders ofthe yield curve would tend to decrease our common stock to purchase or sell our securities as quicklynet income and inexpensively as they would have been able to do had our common stock remained listed. This lack of liquidity also could make it more difficult for us to raise capital in the future.
We may experience a decline in the market value of these securities. Additionally, to the extent cash flows from investments that return scheduled and unscheduled principal are reinvested, the spread between the yields of the new investments and available borrowing rates may decline, which would likely decrease our net income. It is also possible that short-term interest rates may exceed longer-term interest rates (a yield curve inversion), in which event our borrowing costs may exceed our interest income and we could incur significant operating losses. A flat or inverted yield curve may also result in an adverse environment for adjustable-rate RMBS volume, as there may be little incentive for borrowers to choose the underlying mortgage loans over a longer-term fixed-rate loan. If the supply of adjustable-rate RMBS decreases, yields may decline due to market forces.
Declines in the market values of assets in our investment portfolio may adversely affect periodic reported results and credit availability, which may reduce earnings and, in turn, cash available for distribution to our stockholders.
The market value of the interest-bearing assets thatin which we have acquired and intend to continue to acquire,invest, most notably mortgage-backed securitiesRMBS and originated or purchased residential mortgageprime ARM loans and any related hedging instruments, may move inversely with changes in interest rates. We anticipate that increases in interest rates will tend to decrease our net income. income and the market value of our interest-bearing assets. Substantially all of the RMBS and CLO within our investment portfolio is classified for accounting purposes as “available for sale.” Changes in the market values of trading securities will be reflected in earnings and changes in the market values of available for sale securities will be reflected in stockholders’ equity. As a result, a decline in market values may reduce the book value of our assets. Moreover, if the decline in market value of an available for sale security is other than temporary, such decline will reduce earnings.
A decline in the market value of our investmentsRMBS and other interest-bearing assets, such as the decline we experienced during the market disruption in March 2008, may adversely affect us, particularly in instances where we have borrowed money based on the market value of those assets. If the market value of those assets declines, the lender may require us to post additional collateral to support the loan, which would reduce our liquidity and limit our ability to leverage our assets.
In addition, if we are, or anticipate being, unable to post the additional collateral, we would have to sell the assets at a time when we might not otherwise choose to do so. In the event that we do not have sufficient liquidity to meet such requirements, lending institutions may accelerate indebtedness, increase interest rates and terminate our ability to borrow, orany of which could result in lenders requiring additional collateral or initiating margin calls under our repurchase agreements. As a result, we could be required to sell somerapid deterioration of our investments under adverse market conditions in orderfinancial condition and cash available for distribution to maintain liquidity. If such sales are madeour stockholders. Moreover, if we liquidate the assets at prices lower than the amortized costscost of such investments,assets, we will incur losses.
We may change our investment strategy, operating policies and/or asset allocations without stockholder consent, any of which could result in losses.
We may change our investment strategy, operating policies and/or asset allocation with respect to investments, acquisitions, leverage, growth, operations, indebtedness, capitalization and distributions at any time without the consent of our stockholders, which may result in riskier investments. For example, during 2009, we commenced investments pursuant to an alternative investment strategy adopted by our company that was focused on a broad range of real estate- and financial-related assets that differ in structure, risk and potential return, among other things, from the Agency RMBS that we had focused our investment efforts on since 2007. We will continue to consider a broad range of assets for investment, including those outside of our targeted asset class, that we believe will be accretive to earnings and may allow us to utilize all or a portion of an approximately $62.2 million net operating loss carry-forward. The assets we may acquire in the future are comprised of a broad range of asset classes and types and may be different than our historical investments. A change in our investment strategy may increase our exposure to interest rate and/or credit risk, default risk and real estate market fluctuations. Furthermore, a change in our asset allocation could result in our making investments in asset categories different from our historical investments and in which we have limited or no investment experience. These changes could result in a decline in earnings or losses which could adversely affect our financial condition, results of operations, the market price of our common stock or our ability to pay dividends.
Continued adverse developments in the residential mortgage market, and the economy generally, may adversely affect our business, particularly our ability to acquire RMBS and the value of the RMBS that we hold in our portfolio as well as our ability to finance or sell our RMBS.
In recent years, the residential mortgage market in the United States has experienced a variety of difficulties and changed economic conditions, including declining home values, heightened defaults, credit losses and liquidity concerns. News of potential and actual security liquidations as a result of those economic difficulties has increased the volatility of many financial assets, including RMBS. These disruptions materially adversely affected the performance and market value in recent years of the RMBS in our portfolio and prime ARM loans held in securitization trusts, as well as other interest-earning assets that we may consider acquiring in the future. Securities backed by residential mortgage loans originated in 2006 and 2007 have had higher and earlier than expected rates of delinquencies. In addition, while some economists believe the recession ended in the fourth quarter of 2009, housing prices continue to fall in certain areas around the country while unemployment rates have risen sharply during the past year, which will further increase the risk for higher delinquency rates. Many RMBS and other interest-earning assets have been downgraded by rating agencies in recent years, and rating agencies may further downgrade these securities in the future. Lenders have imposed additional and more stringent equity requirements necessary to finance these assets, particularly in the case of non-Agency securities, and frequent impairments based on mark-to-market valuations have generated substantial collateral calls in the industry. As a result of these difficulties and changed economic conditions, many companies operating in the mortgage specialty finance sectors have failed and others, including Fannie Mae and Freddie Mac, continue to face serious operating and financial challenges. While the U.S. Federal Reserve has taken certain actions in an effort to ameliorate the current market conditions, and the U.S. Treasury and the Federal Housing Finance Agency, or FHFA, which is the federal regulator now assigned to oversee Fannie Mae and Freddie Mac, are also taking actions, despite reported stabilization in some sectors, these efforts may ultimately be ineffective. As a result of these factors, among others, the market for these securities may be adversely affected for a significant period of time.
During the past two years, housing prices and appraisal values in many states have declined or stopped appreciating, after extended periods of significant appreciation. A continued decline or an extended flattening of those values may result in additional increases in delinquencies and losses on residential mortgage loans generally, particularly with respect to second homes and investor properties and with respect to any residential mortgage loans, the aggregate loan amounts of which (including any subordinate liens) are close to or greater than the related property values.
Fannie Mae and Freddie Mac guarantee the payments of principal and interest on the Agency RMBS in our portfolio even if the borrowers of the underlying mortgage loans default on their payments. However, rising delinquencies and market perception can still negatively affect the value of our Agency RMBS or create market uncertainty about their true value. While the market disruptions have been most pronounced in the non-Agency RMBS market, the impact has extended to Agency RMBS. During a significant portion of 2008, the value of Agency RMBS were unstable and relatively illiquid compared to prior periods.
Agency RMBS guaranteed by Fannie Mae and Freddie Mac are not supported by the full faith and credit of the United States. Fannie Mae and Freddie Mac have suffered significant losses and, despite significant steps taken by the U.S. government to stabilize these entities, Fannie Mae and Freddie Mac could default on their guarantee obligations, which would materially and adversely affect the value of our RMBS or other Agency indebtedness in which we may invest in the future. The U.S. Treasury plans to release a preliminary report on the future of Fannie Mae and Freddie Mac in the near future, which report may recommend the abolishment of Fannie Mae and Freddie Mac in favor of a new system.
We generally post our Agency RMBS, and we may in the future post non-Agency RMBS, as collateral for our borrowings under repurchase agreements. Any decline in their value, or perceived market uncertainty about their value, would make it more difficult for us to obtain financing on favorable terms or at all, or to maintain our compliance with the terms of any financing arrangements. The value of RMBS may decline for several reasons, including, for example, rising delinquencies and defaults, increases in interest rates, falling home prices and credit uncertainty at Fannie Mae or Freddie Mac. In addition, in recent years, repurchase agreementslenders have been requiring higher levels of collateral to support loans collateralized by RMBS than they have in the past, making borrowings more difficult and expensive. At the same time, market uncertainty about residential mortgage loans in general could continue to depress the market for RMBS, which means that it may be more difficult for us to sell RMBS on favorable terms or at all. Further, a decline in the value of RMBS, particularly Agency RMBS, could subject us to margin calls, for which we may have insufficient liquidity to support, resulting in forced sales of our assets at inopportune times. If market conditions result in a decline in available purchasers of RMBS or the value of our RMBS, our financial position and results of operations could be adversely affected.
The conservatorship of Fannie Mae and Freddie Mac and related efforts, along with any changes in laws and regulations affecting the relationship between Fannie Mae and Freddie Mac and the U.S. government, may adversely affect our business.
The payments we expect to receive on the Agency RMBS we hold in our portfolio and in which we invest depend upon a steady stream of payments on the mortgages underlying the securities and are guaranteed by Ginnie Mae, Fannie Mae and Freddie Mac. Ginnie Mae is part of a U.S. government agency and its guarantees are backed by the full faith and credit of the United States. Fannie Mae and Freddie Mac are U.S. government-sponsored enterprises, but their guarantees are not backed by the full faith and credit of the United States.
Since 2007, Fannie Mae and Freddie Mac have reported substantial losses and a need for substantial amounts of additional capital. In response to the deteriorating financial condition of Fannie Mae and Freddie Mac and the recent credit market disruption, Congress and the U.S. Treasury undertook a series of actions to stabilize these government-sponsored entities and the financial markets, generally, including placing Fannie Mae and Freddie Mac into conservatorship on September 7, 2008. The conservatorship of Fannie Mae and Freddie Mac and certain other actions taken by the U.S. Treasury and U.S. Federal Reserve were designed to boost investor confidence in Fannie Mae’s and Freddie Mac’s debt and mortgage-backed securities. The U.S. government program includes contracts between the U.S. Treasury and each government-sponsored enterprise to seek to ensure that each enterprise maintains a positive net worth. Each contract had an original capacity of $200 billion, but now has no cap. Each contract provides for the provision of cash by the U.S. Treasury to the government-sponsored enterprise if FHFA determines that its liabilities exceed its assets. Freddie Mac has drawn $60 billion and Fannie Mae has drawn $51 billion under these contracts. Both Fannie Mae and Freddie Mac have indicated they will need to request additional draws this year, and it is possible the draw request will not be granted. Although the U.S. government has described some specific steps and reforms that it intends to take as part of the conservatorship process, efforts to stabilize these entities may not be successful and the outcome and impact of these events remain highly uncertain.
Although the U.S. government has committed capital to Fannie Mae and Freddie Mac, there can be no assurance that the capital infusions will be adequate for their needs. If the financial support is inadequate, these companies could continue to suffer losses and could fail to honor their guarantees and other obligations. In June 2009, as part of the Obama administration’s far-reaching financial industry recovery proposal, the U.S. Treasury announced that it and the Department of Housing and Urban Development, in consultation with other government agencies, plans to engage in a wide-ranging initiative to develop recommendations on the future of Fannie Mae and Freddie Mac, and the Federal Home Loan Bank System. The future roles of Fannie Mae and Freddie Mac could be significantly reduced and the nature of their guarantees could be considerably limited relative to historical measurements. A preliminary report on these future roles is expected to be released by the U.S. Treasury in the near future. Any changes to the nature of the guarantees provided by Fannie Mae and Freddie Mac could redefine what constitutes Agency RMBS and could have broad adverse implications for the market and for our business.
The U.S. Treasury’s RMBS purchase program is expected to end in the first quarter of 2010. The U.S. Treasury will have purchased $220 billion in RMBS when this program ends. The U.S. Treasury can hold its portfolio of RMBS to maturity and, based on mortgage market conditions, may make adjustments to the portfolio. This flexibility may adversely affect the pricing and availability for RMBS, particularly Agency RMBS. It is also possible that the U.S. Treasury could decide to purchase Agency securities in the future, which could create additional demand that would negatively affect the pricing of RMBS that we seek to acquire.
The U.S. Treasury could also stop providing credit support to Fannie Mae and Freddie Mac in the future. The problems faced by Fannie Mae and Freddie Mac resulting in their being placed into conservatorship have stirred debate among some federal policy makers regarding the continued role of the U.S. government in providing liquidity for mortgage loans. The U.S. Treasury plans to release a preliminary report of the future of Fannie Mae and Freddie Mac in February 2010. Each of Fannie Mae and Freddie Mac could be dissolved and the U.S. government could determine to stop providing liquidity support of any kind to the mortgage market. If Fannie Mae or Freddie Mac were eliminated, we would not be able, or if their structures were to change radically, we might not be able, to acquire Agency RMBS from these companies, which would adversely affect our current business model.
Our income also could be negatively affected in a number of ways depending on the manner in which related events unfold. For example, the current credit support provided by the U.S. Treasury to Fannie Mae and Freddie Mac, and any additional credit support it may provide in the future, could have the effect of lowering the interest rates we expect to receive from the Agency RMBS in our portfolio and in which we invest, thereby tightening the spread between the interest we earn on our portfolio of targeted assets and our cost of financing that portfolio. A reduction in the supply of Agency RMBS could also negatively affect the pricing of the Agency RMBS held in our portfolio and in which we invest by reducing the spread between the interest we earn on our portfolio of targeted assets and our cost of financing that portfolio.
As indicated above, recent legislation has changed the relationship between Fannie Mae and Freddie Mac and the U.S. government. Future legislation could further change the relationship between Fannie Mae and Freddie Mac and the U.S. government, and could also nationalize or eliminate such entities entirely. In January 2010, House Financial Services Committee Chairman, Barney Frank, was reported to have indicated that his Committee would recommend abolishing Fannie Mae and Freddie Mac in their current form in favor of a whole new system of housing finance. Any law affecting these government-sponsored enterprises may create market uncertainty and have the effect of reducing the actual or perceived credit quality of securities issued or guaranteed by Fannie Mae or Freddie Mac. As a result, such laws could increase the risk of loss on investments in Fannie Mae and/or Freddie Mac Agency RMBS. It also is possible that such laws could adversely impact the market for RMBS and spreads at which such securities trade. All of the foregoing could materially adversely affect our business, operations and financial condition.
There can be no assurance that the actions taken by the U.S. and foreign governments, central banks and other governmental and regulatory bodies for the purpose of seeking to stabilize the financial markets will achieve the intended effect or benefit our business, and further government or market developments could adversely affect us.
In response to the financial issues affecting the banking system, the financial and housing markets and the economy as a whole, the U.S. government has implemented a number of initiatives intended to bolster the banking system, the financial and housing markets and the economy as a whole. These actions include: (i) the Emerging Economic Stabilization Act of 2008, or ESSA, which established the Troubled-Asset Relief Program, or TARP; (ii) the voluntary Capital Purchase Program, or the CPP, which was implemented under authority provided in the EESA and gives the U.S. Treasury the authority to purchase up to $250 billion of senior preferred shares in qualifying U.S.-controlled banks, saving associations, and certain bank and savings and loan holding companies engaged only in financial activities; (iii) a program to purchase $200 billion in direct obligations of Fannie Mae, Freddie Mac and the Federal Home Loan Banks and $1.25 trillion in RMBS issued or guaranteed by Fannie Mae, Freddie Mac or Ginnie Mae; (iv) the creation of a new funding mechanism, the Financial Stability Trust, that will provide financial institutions with bridge financing until such institutions can raise capital in the capital markets; (v) the creation of a Public-Private Investment Fund for private investors to purchase mortgages and mortgage-related assets from financial institutions; (vi) the Term Asset-Backed Securities Loan Facility with the goal of increasing securitization activity for various consumer and commercial loans and other financial assets, including student loans, automobile loans and leases, credit card receivables, SBA small business loans and commercial mortgage-backed securities; and (vii) the American Recovery and Reinvestment Act of 2009, or the ARRA, which includes a wide variety of programs intended to stimulate the economy and provide for extensive infrastructure, energy, health and education needs. For a more detailed description of certain of these initiatives, see “Management’s Discussion and Analysis of Financial Condition and Results of Operations—Current Market Conditions and Known Material Trends.”
Despite reports of stabilization in some sectors, no assurance can be given that these initiatives will have a beneficial impact on the banking system, financial market or housing market. To the extent the markets do not respond favorably to these initiatives or if these initiatives do not function as intended, the pricing, supply, liquidity and value of our assets and the availability of financing on attractive terms may be materially adversely affected.
Mortgage loan modification programs and future legislative action may adversely affect the value of, and the returns, on the interest-earning assets in which we invest.
In late 2008, the U.S. government, through the Federal Housing Authority and the Federal Deposit Insurance Corporation, or FDIC, commenced implementation of programs designed to provide homeowners with assistance in avoiding residential mortgage loan foreclosures. The programs involve, among other things, modifications of mortgage loans to reduce the principal amount of the loans or the rate of interest payable on the loans, or to extend the payment terms of the loans. In addition, members of the U.S. Congress have indicated support for additional legislative relief for homeowners, including an amendment of the bankruptcy laws to permit the modification of mortgage loans in bankruptcy proceedings. These loan modification programs, as well as future legislative or regulatory actions, including amendments to the bankruptcy laws, that result in the modification of outstanding mortgage loans may as well as changes in the requirements necessary to qualify for refinancing a mortgage with Fannie Mae, Freddie Mac or Ginnie Mae adversely affect the value of, and the returns on, the interest-earning assets in which we invest, including through prepayments on the mortgage loans underlying our RMBS and the mortgage loans held in our securitization trusts.
The principal and interest payments on our non-Agency RMBS are not guaranteed by any entity, including any government sponsored entity or agency, and, therefore, are subject to increased risks, including credit risk.
Our portfolio includes non-Agency RMBS which are backed by residential mortgage loans that do not conform to the Fannie Mae or Freddie Mac underwriting guidelines. Consequently, the principal and interest on non-Agency RMBS, unlike those on Agency RMBS, are not guaranteed by government-sponsored entities such as Fannie Mae and Freddie Mac or, in the case of Ginnie Mae, the U.S. Government.
Changes in prepayment rates on our RMBS may decrease our net interest income.
Pools of mortgage loans underlie the mortgage-backed securities that we hold in our investment portfolio and in which we invest. We will generally receive principal distributions from the principal payments that are made on these underlying mortgage loans. When borrowers repay their mortgage loans faster than expected, this will result in prepayments that are faster than expected on the related-RMBS. Prepayment rates are influenced by changes in current interest rates and a variety of economic, geographic and other factors, all of which are beyond our control. Prepayment rates generally increase when interest rates fall and decrease when interest rates rise, but changes in prepayment rates are difficult to predict. Prepayment rates also may be affected by conditions in the housing and financial markets, general economic conditions and the relative interest rates on fixed-rate and adjustable-rate mortgage loans. Faster than expected prepayments could adversely affect our profitability, including in the following ways:
We have purchased RMBS, and may purchase in the future investment securities, that have a higher interest rate than the market interest rate at the time of purchase. In exchange for this higher interest rate, we are required to pay a premium over the face amount of the security to acquire the security. In accordance with accounting rules, we amortize this premium over the anticipated term of the mortgage security. If principal distributions are received faster than anticipated, we would be required to expense the premium faster. We may not be able to reinvest the principal distributions received on these investment securities in similar new mortgage-related securities and, to the extent that we can do so, the effective interest rates on the new mortgage-related securities will likely be lower than the yields on the mortgages that were prepaid.
We also may acquire RMBS or other investment securities at a discount. If the actual prepayment rates on a discount mortgage security are slower than anticipated at the time of purchase, we would be required to recognize the discount as income more slowly than anticipated. This would adversely affect our profitability. Slower than expected prepayments also may adversely affect the market value of a discount mortgage security.
On February 10, 2010, Fannie Mae and Freddie Mac announced their intention to significantly increase their purchases of delinquent loans from the pools of mortgages collateralizing their Agency RMBS beginning March 2010. Their program to purchase delinquent loans is expected to impact the rate of principal prepayments on our Agency RMBS.
A flat or inverted yield curve may adversely affect prepayment rates on and supply of our RMBS.
Our net interest income varies primarily as a result of changes in interest rates as well as changes in interest rates across the yield curve. We believe that when the yield curve is relatively flat, borrowers have an incentive to refinance into hybrid mortgages with longer initial fixed rate periods and fixed rate mortgages, causing our RMBS, or investment securities, to experience faster prepayments. In addition, a flatter yield curve generally leads to fixed-rate mortgage rates that are closer to the interest rates available on hybrid ARMs and ARMs, possibly decreasing the supply of the RMBS we seek to acquire. At times, short-term interest rates may increase and exceed long-term interest rates, causing an inverted yield curve. When the yield curve is inverted, fixed-rate mortgage rates may approach or be lower than hybrid ARMs or ARM rates, further increasing prepayments on, and negatively impacting the supply of, our RMBS. Increases in prepayments on our portfolio will cause our premium amortization to accelerate, lowering the yield on such assets. If this happens, we could experience a decrease in net income or incur a net loss during these periods, which may negatively impact our distributions to stockholders.
Interest rate caps on our adjustable-rate RMBS may reduce our income or cause us to suffer a loss during periods of rising interest rates.
The mortgage loans underlying our adjustable-rate RMBS typically will be subject to periodic and lifetime interest rate caps. Additionally, we may invest in ARMs with an initial “teaser” rate that will provide us with a lower than market interest rate initially, which may accordingly have lower interest rate caps than ARMs without such teaser rates. Periodic interest rate caps limit the amount an interest rate can increase during a given period. Lifetime interest rate caps limit the amount an interest rate can increase through maturity of a mortgage loan. If these interest rate caps apply to the mortgage loans underlying our adjustable-rate RMBS, the interest distributions made on the related RMBS will be similarly impacted. Our borrowings may not be subject to similar interest rate caps. Accordingly, in a period of rapidly increasing interest rates, the interest rates paid on our borrowings could increase without limitation while caps would limit the interest distributions on our adjustable-rate RMBS. Further, some of the mortgage loans underlying our adjustable-rate RMBS may be subject to periodic payment caps that result in a portion of the interest on those loans being deferred and added to the principal outstanding. As a result, we could receive less interest distributions on adjustable-rate RMBS, particularly those with an initial teaser rate, than we need to pay interest on our related borrowings. These factors could lower our net interest income, cause us to suffer a net loss or cause us to incur additional borrowings to fund interest payments during periods of rising interest rates or sell our investments at a loss.
Competition may prevent us from acquiring mortgage-related assets at favorable yields, which would negatively impact our profitability.
Our net income largely depends on our ability to acquire mortgage-related assets at favorable spreads over our borrowing costs. In acquiring mortgage-related assets, we compete with other REITs, investment banking firms, savings and loan associations, banks, insurance companies, mutual funds, other lenders and other entities that purchase mortgage-related assets, many of which have greater financial resources than us. Additionally, many of our potential competitors are not subject to REIT tax compliance or required to maintain an exemption from the Investment Company Act. As a result, we may not in the future be able to acquire sufficient mortgage-related assets at favorable spreads over our borrowing costs which, would adversely affect our profitability.
We may experience periods of illiquidity for our assets which could adversely affect our ability to finance our business or operate profitably.
We bear the risk of being unable to dispose of our interest-earning assets at advantageous times or in a timely manner because these assets generally experience periods of illiquidity. The lack of liquidity may result from the absence of a willing buyer or an established market for these assets, legal or contractual restrictions on resale or disruptions in the secondary markets. This illiquidity may adversely affect our profitability and our ability to finance our business and could cause us to incur substantial losses.
An increase in interest rates can have negative effects on us, including causing a decrease in the volume of newly-issued, or investor demand for, RMBS, which could harm our financial condition and adversely affect our operations.
An increase in interest rates can have various negative affects on us. Increases in interest rates may negatively affect the fair market value of our RMBS and other interest-earning assets. When interest rates rise, the value of RMBS and fixed-rate investment securities generally declines. Typically, as interest rates rise, prepayments on the underlying mortgage loans tend to slow. The combination of rising interest rates and declining prepayments may negatively affect the price of RMBS, and the effect can be particularly pronounced with fixed-rate RMBS. In accordance with GAAP, we will be required to reduce the carrying value of our RMBS by the amount of any decrease in the fair value of our RMBS compared to amortized cost. If unrealized losses in fair value occur, we will either have to reduce current earnings or reduce stockholders’ equity without immediately affecting current earnings, depending on how we classify our assets under GAAP. In either case, our net stockholders’ equity will decrease to the extent of any realized or unrealized losses in fair value and our financial position will be negatively impacted.
Furthermore, rising interest rates generally reduce the demand for consumer and commercial credit, including mortgage loans, due to the higher cost of borrowing. A reduction in the volume of mortgage loans originated may affect the volume of RMBS available to us, which could adversely affect our ability to acquire assets that satisfy our investment objectives. Rising interest rates may also cause RMBS and other interest-earning assets that were issued prior to an interest rate increase to provide yields that are below prevailing market interest rates. If rising interest rates cause us to be unable to acquire a sufficient volume of RMBS and other interest-earning assets with a yield that is above our borrowing cost, our ability to satisfy our investment objectives and to generate income and pay dividends, may be materially and adversely affected.
Changes in interest rates, particularly higher interest rates, can also harm the credit performance of our interest-earning assets. Higher interest rates could reduce the ability of borrowers to make interest payments or to refinance their loans and could reduce property values, all of which could increase our credit losses. In the event we experience a significant increase in credit losses as a result of higher interest rates, our earnings and financial condition will be materially adversely affected.
Market conditions may upset the historical relationship between interest rate changes and prepayment trends, which would make it more difficult for us to analyze our investment portfolio.
Our success depends on our ability to analyze the relationship of changing interest rates on prepayments of the mortgage loans that underlie our RMBS. Changes in interest rates and prepayments affect the market price of the RMBS that we hold in our portfolio and in which we intend to invest. In managing our investment portfolio, to assess the effects of interest rate changes and prepayment trends on our investment portfolio, we typically rely on certain assumptions that are based upon historical trends with respect to the relationship between interest rates and prepayments under normal market conditions. If the dislocations in the residential mortgage market over the last few years or other developments change the way that prepayment trends have historically responded to interest rate changes, our ability to (i) assess the market value of our investment portfolio, (ii) effectively hedge our interest rate risk and (iii) implement techniques to reduce our prepayment rate volatility would be significantly affected, which could materially adversely affect our financial position and results of operations.
A substantial majority of the RMBS within our investment portfolio is recorded at fair value as determined in good faith by our management based on market quotations from brokers and dealers. Although we currently are able to obtain market quotations for assets in our portfolio, we may be unable to obtain quotations from brokers and dealers for certain assets within our investment portfolio in the future, in which case our management may need to determine in good faith the fair value of these assets.
Substantially all of the assets held within our investment portfolio are in the form of securities that are not publicly traded on a national securities exchange or quotation system. The fair value of securities and other assets that are not publicly traded in this manner may not be readily determinable. A substantial majority of the assets in our investment portfolio are valued by us at fair value as determined in good faith by our management based on market quotations from brokers and dealers. Although we currently are able to obtain quotations from brokers and dealers for substantially all of the assets within our investment portfolio, we may be unable to obtain such quotations on other assets in our investment portfolio in the future, in which case, our manager may need to determine in good faith the fair value of these assets. Because such quotations and valuations are inherently uncertain, may fluctuate over short periods of time and may be based on estimates, our determinations of fair value may differ materially from the values that would have been used if a public market for these securities existed. The value of our common stock could be adversely affected if our determinations regarding the fair value of these assets are materially higher than the values that we ultimately realize upon their disposal. Misjudgments regarding the fair value of our assets that we subsequently recognize may also result in impairments that we must recognize.
Loan delinquencies on our prime ARM loans held in securitization trusts may increase as a result of significantly increased monthly payments required from ARM borrowers after the liquidationinitial fixed period.
The scheduled increase in monthly payments on certain adjustable rate mortgage loans held in our securitization trusts may result in higher delinquency rates on those mortgage loans and could have a material adverse affect on our net income and results of operations. This increase in borrowers' monthly payments, together with any increase in prevailing market interest rates, may result in significantly increased monthly payments for borrowers with adjustable rate mortgage loans. Borrowers seeking to avoid these increased monthly payments by refinancing their mortgage loans may no longer be able to fund available replacement loans at comparably low interest rates or at all. A decline in housing prices may also leave borrowers with insufficient equity in their homes to permit them to refinance their loans or sell their homes. In addition, these mortgage loans may have prepayment premiums that inhibit refinancing.
We may be required to repurchase loans if we breached representations and warranties from loan sale transactions, which could harm our profitability and financial condition.
Loans from our discontinued mortgage lending operations that were sold to third parties under agreements include numerous representations and warranties regarding the manner in which the loan was originated, the property securing the loan and the borrower. If these representations or warranties are found to have been breached, we may be required to repurchase the loan. We may be forced to resell these repurchased loans at a loss, which could harm our profitability and financial condition.
The mortgage loans we may invest directly in and those underlying our CMBS and RMBS are subject to delinquency, foreclosure and loss, which could result in losses to us.
Our investment strategy permits us to consider a broad range of asset types, including CMBS, non-Agency RMBS and other mortgage assets, including mortgage loans. Commercial mortgage loans are secured by multi-family or commercial property. They are subject to risks of delinquency and foreclosure, and risks of loss that are greater than similar risks associated with loans made on the security of single-family residential property. The ability of a borrower to repay a loan secured by an income-producing property typically is dependent primarily upon the successful operation of the underlying investments used as collateralproperty rather than upon the existence of independent income or assets of the borrower. If the net operating income of the property is reduced, the borrower’s ability to repay the loan may be impaired. Such income can be affected by many factors.
Residential mortgage loans are secured by single-family residential property. They are subject to risks of delinquency and result inforeclosure, and risks of loss. The ability of a borrower to repay a loan secured by a residential property depends on the income or assets of the borrower. Many factors may impair borrowers’ abilities to repay their loans. ABS are bonds or notes backed by loans or other financial assets.
In the event of any default under a mortgage loan held directly by us, we will bear a risk of loss equalof principal to the differenceextent of any deficiency between the value of the collateral and the principal and accrued interest of the mortgage loan. This could impair our cash flow from operations. In the event of the bankruptcy of a mortgage loan borrower, the loan will be deemed secured only to the extent of the value of the underlying collateral at the time of bankruptcy (as determined by the bankruptcy court). The lien securing the mortgage loan will be subject to the avoidance powers of the bankruptcy trustee or debtor-in-possession to the extent the lien is unenforceable under state law.
Foreclosure of a mortgage loan can be expensive and lengthy. This could impair our anticipated return on the foreclosed mortgage loan. Moreover, RMBS represent interests in or are secured by pools of residential mortgage loans and CMBS represent interests in or are secured by a single commercial mortgage loan or a pool of commercial mortgage loans. To the extent a foreclosure or loss occurs on the underlying mortgage loan, we will receive less principal and interest from that security in the future. Accordingly, the CMBS and non-Agency RMBS we may invest in are subject to all of the risks of the underlying mortgage loans.
Our investments in subordinated CMBS or RMBS could subject us to increased risk of losses.
We may also invest in securities that represent subordinated tranches of CMBS or non-Agency RMBS. In general, losses on an asset securing a mortgage loan included in a securitization will be borne first by the equity holder of the property, then by any cash reserve fund or letter of credit provided by the borrower, and then by the first loss subordinated security holder. In the event of default and the exhaustion of any equity support, reserve fund, letter of credit—and any classes of securities junior to those in which we invest—we may not be able to recover all of our investment in the securities we purchase. In addition, if the underlying mortgage portfolio has been overvalued by the originator, or if the values subsequently decline and, as a result, less collateral is available to satisfy delinquent interest and principal payments due on the related CMBS or RMBS, the securities in which we invest may effectively become the first loss position behind the more senior securities, which may result in significant losses to us.
The prices of lower credit quality securities are generally less sensitive to interest rate changes than more highly rated investments, but more sensitive to adverse economic downturns or individual issuer developments. A projection of an economic downturn, for example, could cause a decline in the price of lower credit quality securities because the ability of obligors of mortgages underlying mortgage-backed securities to make principal and interest payments or to refinance may be impaired. In this case, existing credit support in the securitization structure may be insufficient to protect us against loss of our principal on these securities.
We may invest in high yield or subordinated and lower rated securities that have greater risks of loss than other investments, which could adversely affect our business, financial condition and cash available for dividends.
We may invest in high yield or subordinated or lower rated securities, which involve a higher degree of risk than other investments. Numerous factors may affect a company’s ability to repay its high yield or subordinated securities, including the failure to meet its business plan, a downturn in its industry or negative economic conditions. These securities may not be secured by mortgages or liens on assets. Our right to payment and security interest with respect to such securities may be subordinated to the payment rights and security interests of the senior lender. Therefore, we may be limited in our ability to enforce our rights to collect these loans and to recover any of the loan balance through a foreclosure of collateral.
Our real estate assets are subject to risks particular to real property.
We own assets secured by real estate and may own real estate directly in the future, either through direct acquisitions or upon a default of mortgage loans. Real estate assets are subject to various risks, including:
| · | acts of God, including earthquakes, floods and other natural disasters, which may result in uninsured losses; |
| · | acts of war or terrorism, including the consequences of terrorist attacks, such as those that occurred on September 11, 2001; |
| · | adverse changes in national and local economic and market conditions; and |
| · | changes in governmental laws and regulations, fiscal policies and zoning ordinances and the related costs of compliance with laws and regulations, fiscal policies and ordinances; |
The occurrence of any of the foregoing or similar events may reduce our return from an affected property or asset and, consequently, materially adversely affect our business, financial condition and results of operations and our ability to make distributions to our shareholders.
We are highly dependent on information systems and system failures could significantly disrupt our business, which may, in turn, materially adversely affect our business, financial condition and results of operations and our ability to make distributions to our shareholders.
Our business is highly dependent on communications and information systems. Any failure or interruption of our systems could cause delays or other problems in our securities trading activities, including RMBS trading activities, which could materially adversely affect on our business, financial condition and results of operations and our ability to make distributions to our stockholders.
Our due diligence may not reveal all the liabilities associated with an investment and may not reveal other investment performance issues.
Before investing in an asset, we review the loans or other assets comprising the investment and other factors that we believe are material to the performance of the investment. In this process, we rely on the resources available to us and, in some cases, an investigation by HCS, its affiliates or third parties. This process is particularly important and subjective with respect to new or private companies because there may be little or no information publicly available about them. Our due diligence processes might not uncover all relevant facts, thus resulting in investment losses.
Risk Related to Our Debt Financing
Continued adverse developments in the residential mortgage market and financial markets, including recent mergers, acquisitions or bankruptcies of potential repurchase agreement counterparties, as well as defaults, credit losses and liquidity concerns, could make it difficult for us to borrow money to fund our investment strategy or continue to fund our investment portfolio on a leveraged basis, on favorable terms or at all, which could adversely affect our profitability.
We rely on the availability of financing to acquire Agency RMBS and to fund our investment portfolio on a leveraged basis. Since March 2008, there have been several announcements of proposed mergers, acquisitions or bankruptcies of investment banks and commercial banks that have historically acted as repurchase agreement counterparties. This has resulted in a fewer number of potential repurchase agreement counterparties operating in the market and reduced financing capacity. In addition, many commercial banks, investment banks and insurance companies have announced extensive losses from exposure to the residential mortgage market. These losses have reduced financial industry capital, leading to reduced liquidity for some institutions. Institutions from which we seek to obtain financing may have owned or financed RMBS which have declined in value and caused them to suffer losses as a result of the recent downturn in the residential mortgage market. If these conditions persist, these institutions may be forced to exit the repurchase market, merge with another counterparty, become insolvent or further tighten their lending standards or increase the amount owedof equity capital or haircut required to obtain financing. Moreover, because our equity market capitalization places us at the low end of market capitalization among all mortgage REITs, continued adverse developments in the residential mortgage market may cause some of our lenders to reduce or terminate our access to future borrowings before those of our competitors. Any of these events could make it more difficult for us to obtain financing on favorable terms or at all. Our profitability will be adversely affected if we are unable to obtain cost-effective financing for our investments.
We may incur increased borrowing costs related to repurchase agreements and that would adversely affect our profitability.
Currently, a significant portion of our borrowings are collateralized borrowings in the form of repurchase agreements. If the interest rates on these agreements increase at a rate higher than the increase in rates payable on our investments, our profitability would be adversely affected.
Our borrowing costs under repurchase agreements generally correspond to short-term interest rates such as LIBOR or a short-term Treasury index, plus or minus a margin. The margins on these borrowings over or under short-term interest rates may vary depending upon a number of factors, including, without limitation:
| · | the movement of interest rates; |
| · | the availability of financing in the market; and |
| · | the value and liquidity of our mortgage-related assets. |
Currently, repurchase agreement lenders are requiring higher levels of collateral than they have required in the past to support repurchase agreements collateralized by Agency RMBS and if this continues it will make our borrowings and use of leverage less attractive and more expensive. Many financial institutions have increased lending margins for Agency RMBS to approximately 5.0% on average, which means that we are required to pledge Agency RMBS having a value of 105% of the amount of our borrowings. These increased lending margins may require us to post additional cash collateral for our Agency RMBS. If the interest rates, lending margins or collateral requirements under these repurchase agreements increase, or if lenders impose other onerous terms to obtain this type of financing, our results of operations will be adversely affected.
Failure to procure adequate debt financing, or to renew or replace existing debt financing as it matures, would adversely affect our results and may, in turn, negatively affect the value of our common stock and our ability to distribute dividends.
We use debt financing as a strategy to increase our return on investment securities in our investment portfolio. However, we may not be able to achieve our desired debt-to-equity ratio for a number of reasons, including the following:
| · | our lenders do not make debt financing available to us at acceptable rates; or |
| · | our lenders require that we pledge additional collateral to cover our borrowings, which we may be unable to do. |
The dislocations in the residential mortgage market and credit markets have led lenders, including the financial institutions that provide financing for our investment securities, to heighten their credit review standards, and, in some cases, to reduce or eliminate loan amounts available to borrowers. As a result, we cannot assure you that any, or sufficient, debt funding will be available to us in the future on terms that are acceptable to us. In the event that we cannot obtain sufficient funding on acceptable terms, there may be a negative impact on the value of our common stock and our ability to make distributions, and you may lose part or all of your investment.
Furthermore, because we rely primarily on short-term borrowings to finance our investment securities, our ability to achieve our investment objective depends not only on our ability to borrow money in sufficient amounts and on favorable terms, but also on our ability to renew or replace on a continuous basis our maturing short-term borrowings. As of December 31, 2009, substantially all of our borrowings under repurchase agreements bore maturities of 30 days or less. If we are not able to renew or replace maturing borrowings, we will have to sell some or all of our assets, possibly under adverse market conditions.
The repurchase agreements that we use to finance our investments may require us to provide additional collateral, which could reduce our liquidity and harm our financial condition.
We intend to use repurchase agreements to finance our investments. If the market value of the loans or securities pledged or sold by us to a funding source decline in value, we may be required by the lending institution to provide additional collateral or pay down a portion of the funds advanced, but we may not have the funds available to do so. Posting additional collateral to support our repurchase agreements will reduce our liquidity and limit our ability to leverage our assets. In the event we do not have sufficient liquidity to meet such requirements, lending institutions can accelerate our indebtedness, increase our borrowing rates, liquidate our collateral at inopportune times and terminate our ability to borrow. This could result in a rapid deterioration of our financial condition and possibly require us to file for protection under the U.S. Bankruptcy Code.
We currently leverage our equity, which will exacerbate any losses we incur on our current and future investments and may reduce cash available for distribution to our stockholders.
We currently leverage our equity through borrowings, generally through the use of repurchase agreements and CDOs, which are obligations issued in multiple classes secured by an underlying portfolio of securities, and we may, in the future, utilize other forms of borrowing. The amount of leverage we incur varies depending on our ability to obtain credit facilities and our lenders’ estimates of the value of our portfolio’s cash flow. The return on our investments and cash available for distribution to our stockholders may be reduced to the extent that changes in market conditions cause the cost of our financing to increase relative to the income that can be derived from the assets we hold in our investment portfolio. Further, the leverage on our equity may exacerbate any losses we incur.
Our debt service payments will reduce the net income available for distribution to our stockholders. We may not be able to meet our debt service obligations and, to the extent that we cannot, we risk the loss of some or all of our assets to sale to satisfy our debt obligations. A decrease in the value of the assets may lead to margin calls under our repurchase agreements.agreements which we will have to satisfy. Significant decreases in asset valuation, such as occurred during March 2008, could lead to increased margin calls, and we may not have the funds available to satisfy any such margin calls. We have a target overall leverage amount for our RMBS investment portfolio of seven to nine times our equity, but there is no established limitation, other than may be required by our financing arrangements, on our leverage ratio or on the aggregate amount of our borrowings.
If we are unable to leverage our equity to the extent we currently anticipate, the returns on our RMBS portfolio could be diminished, which may limit or eliminate our ability to make distributions to our stockholders.
If we are limited in our ability to leverage our assets, the returns on our portfolio may be harmed. A key element of our strategy is our use of leverage to increase the size of our RMBS portfolio in an attempt to enhance our returns. AsGiven the continued uncertainty in the credit markets, we believe that maintaining a maximum leverage ratio in the range of six to eight times for our Agency RMBS portfolio and an overall leverage ratio of four to five times is appropriate at this time. At December 31, 2006,2009, our leverage ratio definedfor our RMBS investment portfolio, which we define as total financing facilities less subordinated debenturesour outstanding indebtedness under repurchase agreements divided by total stockholders'stockholders’ equity plus subordinated debentures at December 31, 2006and our Series A Preferred Stock, was 101 to 1. This definition of the leverage ratio is consistent with the manner in which the credit providers under our repurchase agreements calculate our leverage. Our repurchase agreements are not currently committed facilities, meaning that the counterparties to these agreements may at any time choose to restrict or eliminate our future access to the facilities and we have no other committed credit facilities through which we may leverage our equity. If we are unable to leverage our equity to the extent we currently anticipate, the returns on our portfolio could be diminished, which may limit or eliminate our ability to make distributions to our stockholders.
We currently leverageIf a counterparty to our equity, which will exacerbaterepurchase transactions defaults on its obligation to resell the underlying security back to us at the end of the transaction term or if we default on our obligations under the repurchase agreement, we would incur losses.
When we engage in repurchase transactions, we generally sell RMBS to lenders (i.e., repurchase agreement counterparties) and receive cash from the lenders. The lenders are obligated to resell the same RMBS back to us at the end of the term of the transaction. Because the cash we receive from the lender when we initially sell the RMBS to the lender is less than the value of those RMBS (this difference is referred to as the “haircut”), if the lender defaults on its obligation to resell the same RMBS back to us we would incur a loss on the transaction equal to the amount of the haircut (assuming there was no change in the value of the RMBS). Further, if we default on one of our obligations under a repurchase transaction, the lender can terminate the transaction and cease entering into any other repurchase transactions with us. Our repurchase agreements contain cross-default provisions, so that if a default occurs under any one agreement, the lenders under our other agreements could also declare a default. Any losses we incur on our currentrepurchase transactions could adversely affect our earnings and future investments and may reducethus our cash available for distribution to our stockholders.
We currently leverageOur use of repurchase agreements to borrow funds may give our equity throughlenders greater rights in the event that either we or a lender files for bankruptcy.
Our borrowings generally throughunder repurchase agreements may qualify for special treatment under the bankruptcy code, giving our lenders the ability to avoid the automatic stay provisions of the bankruptcy code and to take possession of and liquidate our collateral under the repurchase agreements without delay in the event that we file for bankruptcy. Furthermore, the special treatment of repurchase agreements under the bankruptcy code may make it difficult for us to recover our pledged assets in the event that a lender files for bankruptcy. Thus, the use of repurchase agreements bank credit facilities, securitizations, includingexposes our pledged assets to risk in the issuanceevent of collateralized debt securities, whicha bankruptcy filing by either a lender or us.
Our liquidity may be adversely affected by margin calls under our repurchase agreements because we are obligations issueddependent in multiple classes secured by an underlying portfolio of securities, and other borrowings. The amount of leverage we incur varies dependingpart on our ability to obtain credit facilities and our lenders’ estimatesthe lenders' valuation of the value of our portfolio’s cash flow. The return on our investments and cash available for distribution to our stockholders may be reduced tocollateral securing the extent that changes in market conditions cause the cost of our financing to increase relative to the income that can be derived from the assets we hold in our portfolio. Further, the leverage on our equity may exacerbate any losses we incur.financing.
Our debt service payments will reduceEach of these repurchase agreements allows the net income available for distributionslender, to our stockholders. We may not be ablevarying degrees, to meet our debt service obligations and,revalue the collateral to values that the extentlender considers to reflect market value. If a lender determines that we cannot, we risk the loss of some or all of our assets to foreclosure or sale to satisfy our debt obligations. We currently leverage through repurchase agreements. A decrease in the value of the assetscollateral has decreased, it may leadinitiate a margin call requiring us to post additional collateral to cover the decrease. When we are subject to such a margin calls whichcall, we will havemust provide the lender with additional collateral or repay a portion of the outstanding borrowings with minimal notice. Any such margin call could harm our liquidity, results of operation and financial condition. Additionally, in order to satisfy. While we have experienced normal course of business margin calls primarily related to the changing interest rate environment, significant decreases in asset valuation could lead to increased margin calls. We may not have the funds availableobtain cash to satisfy any sucha margin calls. We have a target overall leverage amount of 8 to 12 times our equity, but there is no established limitation, other thancall, we may be required by our financing arrangements, on our leverage ratio or on the aggregate amount of our borrowings.
Interest rate fluctuations mayto liquidate assets at a disadvantageous time, which could cause losses.
We believe our primary interest rate exposure relatesit to our mortgage loans, mortgage-backed securities and variable-rate debt, as well as the interest rate swaps and caps that we utilize for risk management purposes. Changes in interest rates may affect our net interest income, which is the difference between the interest income we earn on our interest-earning assets and the interest expense we incur in financing these assets. Changes in the level of interest rates also can affect our ability to acquire mortgage loans or mortgage-backed securities, the value of our assets and our ability to realize gains from the sale of such assets. In a period of rising interest rates, our interest expense could increase while the interest we earn on our assets would not change as rapidly. This would adversely affect our profitability.
Our operating results depend in large part on differences between income received from our assets, net of creditfurther losses and our financing costs. We anticipate that in most cases, for any period during which our assets are not match-funded, the income from such assets will adjust more slowly to interest rate fluctuations than the cost of our borrowings. Consequently, changes in interest rates, particularly short-term interest rates, may significantly influence our net income. We anticipate that increases in interest rates will tend to decrease our net income. Interest rate fluctuations resulting in our interest expense exceeding our interest income would result in operating losses for us and may limit or eliminate our ability to make distributions to our stockholders.
We have a limited operating history with respect to securitizing mortgage loans or managing a portfolio of mortgage securities and we may not be able to complete loan securitizations in the future on favorable terms, or at all, the result of which would have a material adverse effect on our results of operations and limit our ability to make cash available for distribution to our stockholders.
Historically, NYMC’s business has consisted of the origination and sale of mortgage loans of all types, with a particular focus on prime adjustable- and fixed-rate, first lien, residential purchase mortgage loans. Our strategy includes building a leveraged portfolio of residential mortgage loans comprised of prime adjustable-rate mortgage loans, including hybrid adjustable-rate loans that have an initial fixed-rate period, and other qualifying loans or securities. We have a limited history with respect to securitizing mortgage loans or managing a portfolio of mortgage securities, having completed just four securitizations and having managed an investment portfolio of mortgages and mortgage securities commencing only after the completion of our initial public offering in June 2004. Our ability to complete securitizations in the future on favorable terms will depend upon a number of factors, including the experience and ability of our management team, conditions in the securities markets generally, conditions in the mortgage-backed securities market specifically, the performance of our portfolio of securitized loans and our ability to obtain leverage. In addition, poor performance of any pool of loans we do securitize could increase the expense of any subsequent securitization we bring to market. Accordingly, a decline in the securitization market or a change in the market’s demand for our shares of common stock could have a material adverse effect on our results of operations, financial condition and business prospects. If we are unable to securitize efficiently the adjustable-rate and hybrid mortgage loans that we acquire, then our revenues for the duration of our investment in those loans would decline, which would lower our earnings for the time the loans remain in our portfolio. We cannot assure you that we will be able to complete loan securitizations in the future on favorable terms, or at all.
Excessive supply of or reduced demand for mortgage-backed securities in the market for these securities may cause the market to require a higher yield on our mortgage-backed securities and thereby cause a decline in the value of our portfolio.
The mortgage-backed securities we own, or will own, are also subject to spread risk. The majority of these securities are, or will be, adjustable-rate securities valued based on a market credit spread to U.S. Treasury security yields. In other words, their value is dependent on the yield demanded on such securities by the market based on their credit relative to U.S. Treasury securities. Excessive supply of such securities combined with reduced demand will generally cause the market to require a higher yield on such securities, resulting in the use of a higher or wider spread over the benchmark rate (usually the applicable U.S. Treasury security yield) to value such securities. Under such conditions, the value of our securities portfolio will tend to decline. Conversely, if the spread used to value such securities were to decrease or tighten, the value of our securities portfolio will tend to increase. Such changes in the market value of our portfolio could adversely affect our net equity, net income or cash flow directly through their impact on unrealized gains or losses on available-for-sale securities, and therefore our ability to realize gains on such securities, or indirectly through their impact on our ability to borrow and access capital, all of which could adversely affect our results of operations and ability to make cash distributions to our stockholders.financial condition.
In addition, upward shifts in the U.S. Treasury yield curve, which represents the market’s expectations of future interest rates, would generally cause investors to demand a higher yield on our mortgage-backed securities. Such events would affect our portfolio, financial position and results of operations in a manner similar to those described above.
Loan prepayment rates may increase, adversely affecting yields on our planned investments.
The value of the assets we have acquired and intend to continue to acquire may be affected by prepayment rates on mortgage loans. Prepayment rates on mortgage loans are influenced by changes in current interest rates and a variety of economic, geographic and other factors beyond our control, and consequently, such prepayment rates cannot be predicted with certainty. In periods of declining mortgage loan interest rates, prepayments on mortgage loans generally increase. If general interest rates decline as well, the proceeds of such prepayments received during such periods are likely to be reinvested by us in assets with lower yields than the yields on the assets that were prepaid. In addition, the market value of any mortgage assets may, because of the risk of prepayment, benefit less than other fixed-income securities from declining interest rates. Conversely, in periods of rising interest rates, prepayments on mortgage loans generally decrease, in which case we would not have the prepayment proceeds available to invest in assets with higher yields. Under certain interest rate and prepayment scenarios, we may fail to recoup fully our cost of acquisition of certain investments.
Our hedging transactions may limit our gains or result in losses.
We use derivatives, primarily interest rate swaps and caps, to hedge our liabilities and this has certain risks, including the risk that losses on a hedging transaction will reduce the amount of cash available for distribution to our stockholders and that such losses may exceed the amount invested in such instruments. Our boardBoard of directorsDirectors has adopted a general policy with respect to the use of derivatives, and which generally allows us to use derivatives when we deem appropriate for risk management purposes, but does not set forth specific guidelines. To the extent consistent with maintaining our status as a REIT, we may use derivatives, including interest rate swaps and caps, options, term repurchase contracts, forward contracts and futures contracts, in our risk management strategy to limit the effects of changes in interest rates on our operations. However, a hedge may not be effective in eliminating the risks inherent in any particular position. Our profitability may be adversely affected during any period as a result of the use of derivatives in a hedging transaction.
Our use of hedging strategies to mitigate our interest rate exposure may not be effective and may expose us to counterparty risks.
In accordance with our operating policies, we may pursue various types of hedging strategies, including swaps, caps and other derivative transactions, to seek to mitigate or reduce our exposure to losses from adverse changes in interest rates. Our hedging activity will vary in scope based on the level and volatility of interest rates, the type of assets held and financing sources used and other changing market conditions. No hedging strategy, however, can completely insulate us from the interest rate risks to which we are exposed or that the implementation of any hedging strategy would have the desired impact on our results of operations or financial condition. Certain of the U.S. federal income tax requirements that we must satisfy in order to qualify as a REIT may limit our ability to hedge against such risks. We will not enter into derivative transactions if we believe that they will jeopardize our qualification as a REIT.
Interest rate hedging may fail to protect or could adversely affect us because, among other things:
| · | interest rate hedging can be expensive, particularly during periods of rising and volatile interest rates; |
| · | available interest rate hedges may not correspond directly with the interest rate risk for which protection is sought; |
| · | the duration of the hedge may not match the duration of the related liability; |
| · | the amount of income that a REIT may earn from hedging transactions (other than through taxable REIT subsidiaries (or TRSs)) to offset interest rate losses is limited by U.S. federal tax provisions governing REITs; |
| · | the credit quality of the party owing money on the hedge may be downgraded to such an extent that it impairs our ability to sell or assign our side of the hedging transaction; and |
| · | the party owing money in the hedging transaction may default on its obligation to pay. |
We primarily use swaps to hedge against anticipated future increases in interest rates on our repurchase agreements. Should a swap counterparty be unable to make required payments pursuant to such swap, the hedged liability would cease to be hedged for the remaining term of the swap. In addition, we may be at risk for any collateral held by a hedging counterparty to a swap, should such counterparty become insolvent or file for bankruptcy. Our hedging transactions, which are intended to limit losses, may actually adversely affect our earnings, which could reduce our cash available for distribution to our stockholders.
Hedging instruments involve risk since they often are not traded on regulated exchanges, guaranteed by an exchange or its clearing house, or regulated by any U.S. or foreign governmental authorities. Consequently, there are no requirements with respect to record keeping, financial responsibility or segregation of customer funds and positions. Furthermore, the enforceability of hedging instruments may depend on compliance with applicable statutory and commodity and other regulatory requirements and, depending on the identity of the counterparty, applicable international requirements. The mortgage loansbusiness failure of a hedging counterparty with whom we typically investenter into a hedging transaction will most likely result in its default. Default by a party with whom we enter into a hedging transaction may result in the loss of unrealized profits and force us to cover our commitments, if any, at the mortgage loans underlyingthen current market price. Although generally we will seek to reserve the mortgage-backed securitiesright to terminate our hedging positions, it may not always be possible to dispose of or close out a hedging position without the consent of the hedging counterparty and we typically investmay not be able to enter into an offsetting contract in are subjectorder to risks of delinquency, foreclosurecover our risk. We cannot assure you that a liquid secondary market will exist for hedging instruments purchased or sold, and loss,we may be required to maintain a position until exercise or expiration, which could result in losses to us.losses.
Residential mortgage loansRisks Related to the Advisory Agreement with HCS
We are secured by residential propertiesdependent on HCS and certain of its key personnel and may not find a suitable replacement if HCS terminates the advisory agreement or such key personnel are no longer available to us.
Pursuant to the advisory agreement, subject to risksoversight by our Board of delinquencyDirectors, HCS advises the Managed Subsidiaries. HCS identifies, evaluates, negotiates, structures, closes and foreclosure, and risksmonitors investments of loss.the Managed Subsidiaries, other than assets that we contributed to the Managed Subsidiaries to facilitate compliance with our exclusion from regulation under the Investment Company Act. The abilitydeparture of any of the senior officers of HCS, or of a borrower to repay a loan secured by residential property typically is dependent primarily upon the incomesignificant number of investment professionals or assetsprincipals of the borrower, but also may be affected by property location and condition, competition and demand for comparable properties, changes in zoning laws, environmental contamination, changes in national, regional or local economic conditions, declines in regional or local real estate values, increases in interest rates, real estate tax rates, changes in governmental rules and regulations and acts of God, terrorism, social unrest and civil disturbances.
In the event of any default under a mortgage loan held directly by us, we will bear a risk of loss of principal to the extent of any deficiency between the value of the collateral that we can realize upon foreclosure and sale and the principal and accrued interest of the mortgage loan. In the event of the bankruptcy of a mortgage loan borrower, the mortgage loan to such borrower will be deemed to be secured only to the extent of the value of the underlying collateral at the time of bankruptcy (as determined by the bankruptcy court), and the lien securing the mortgage loan will be subject to the avoidance powers of the bankruptcy trustee or debtor-in-possession to the extent the lien is unenforceable under state law. Foreclosure of a mortgage loan can be an expensive and lengthy process. The occurrence of an event of default or foreclosureHCS, could have a material adverse effect on our cash flowability to achieve our investment objectives. We are subject to the risk that HCS will terminate the advisory agreement or that we may deem it necessary to terminate the advisory agreement or prevent certain individuals from operationsperforming services for us, and that no suitable replacement will be found to manage the Managed Subsidiaries.
Pursuant to the advisory agreement, HCS is entitled to receive an advisory fee payable regardless of the performance of the assets of the Managed Subsidiaries.
We will pay HCS substantial advisory fees, based on the Managed Subsidiaries’ equity capital (as defined in the advisory agreement), regardless of the performance of the Managed Subsidiaries’ portfolio. In addition, pursuant to the advisory agreement, we will pay HCS a base advisory fee even if they are not managing any assets of the Managed Subsidiaries' portfolio. HCS’s entitlement to non-performance based compensation may reduce its incentive to devote the time and effort of its professionals to seeking profitable opportunities for the Managed Subsidiaries’ portfolio, which could limitresult in a lower performance of their portfolio and negatively affect our ability to pay distributions to our stockholders or to achieve capital appreciation.
Pursuant to the amount we have availableadvisory agreement, HCS is entitled to receive an incentive fee, which may induce it to make certain investments, including speculative or high risk investments.
In addition to its advisory fee, HCS is entitled to receive incentive compensation based, in part, upon the Managed Subsidiaries’ achievement of targeted levels of net income. In evaluating investments and other management strategies, the opportunity to earn incentive compensation based on net income may lead HCS to place undue emphasis on the maximization of net income at the expense of other criteria, such as preservation of capital, maintaining liquidity and/or management of credit risk or market risk, in order to achieve higher incentive compensation. Investments with higher yield potential are generally riskier or more speculative. In addition, HCS has broad discretion regarding the types of investments it will make pursuant to the advisory agreement. This could result in increased risk to the value of the Managed Subsidiaries’ invested portfolio.
We compete with HCS’s other clients for paymentaccess to HCS.
HCS has sponsored and/or currently manages other pools of capital and investment vehicles with an investment focus that overlaps with the Managed Subsidiaries’ investment focus, and is expected to continue to do so in the future. Furthermore, HCS is not restricted in any way from sponsoring or accepting capital from new clients or vehicles, even for investing in asset classes or investment strategies that are similar to, or overlapping with, the Managed Subsidiaries’ asset classes or investment strategies. Therefore, the Managed Subsidiaries compete for access to the benefits that their relationship with HCS provides them. For the same reasons, the personnel of HCS may be unable to dedicate a substantial portion of their time managing the Managed Subsidiaries’ investments if HCS manages any future investment vehicles.
There are conflicts of interest in our relationship with HCS, which could result in decisions that are not in the best interests of our debtstockholders.
The Managed Subsidiaries may have or pursue investments in securities in which HCS or certain of its affiliates have or are seeking an interest. Similarly, HCS or certain of its affiliates may invest in securities in which the Managed Subsidiaries have or may have an interest. Although such investments may present conflicts of interest, we nonetheless may pursue and consummate such transactions. Additionally, the Managed Subsidiaries may engage in transactions directly with HCS or any of its affiliates, including the purchase and sale of all or a portion of a portfolio investment.
HCS may from time to time simultaneously seek to purchase investments for the Managed Subsidiaries and other entities with similar investment objectives for which it serves as a manager, or for its clients or affiliates and has no duty to allocate such investment opportunities in a manner that favors the Managed Subsidiaries. Additionally, such investments for entities with similar investment objectives may be different from those made on the Managed Subsidiaries’ behalf. HCS may have economic interests in or other relationships with others in whose obligations or securities the Managed Subsidiaries may invest. Each of such ownership and distributionother relationships may result in securities laws restrictions on transactions in such securities and otherwise create conflicts of interest. In such instances, HCS may in its discretion make investment recommendations and decisions that may be the same as or different from those made with respect to the Managed Subsidiaries’ investments and may take actions (or omit to take actions) in the context of these other economic interests or relationships the consequences of which may be adverse to the Managed Subsidiaries’ interests.
Although the officers and employees of HCS devote as much time to the Managed Subsidiaries as HCS deems appropriate, the officers and employees may have conflicts in allocating their time and services among the Managed Subsidiaries and HCS’s and its affiliates' other accounts. In addition, HCS and its affiliates, in connection with their other business activities, may acquire material non-public confidential information that may restrict HCS from purchasing securities or selling securities for itself or its clients (including the Managed Subsidiaries) or otherwise using such information for the benefit of its clients or itself.
HCS and JMP Group, Inc. beneficially owned approximately 16.7% and 12.1%, respectively, of our outstanding common stock as of December 31, 2009. HCS is an investment adviser that manages investments and trading accounts of other persons, including certain accounts affiliated with JMP Group, Inc., and is deemed the beneficial owner of shares of our common stock held by these accounts. James J. Fowler, the Non-Executive Chairman of our Board of Directors and also the non-compensated chief investment officer of the Managed Subsidiaries, is a managing director of HCS. HCS is an affiliate of JMP Group, Inc. Joseph A. Jolson, the Chairman and Chief Executive Officer of JMP Group Inc. and HCS, beneficially owned approximately 6.7% of the Company’s outstanding common stock as of December 3, 2009. In addition, in November 2008, our Board of Directors approved an exemption from the ownership limitations contained in our Charter, to permit Mr. Jolson to beneficially own up to 25% of the aggregate value of our outstanding capital stock. As a result of the combined voting power of HCS, JMP Group, Inc. and Mr. Jolson, these stockholders exert significant influence over matters submitted to a vote of stockholders, including the election of directors and approval of a change in control or business combination of our company. This concentration of ownership may result in decisions affecting us that are not in the best interests of all our stockholders. In addition, residential mortgage-backed securities evidenceMr. Fowler may have a conflict of interest in situations where the best interests of our company and stockholders do not align with the interests of HCS, JMP Group, Inc. or its affiliates, which may result in ordecisions that are secured by poolsnot in the best interests of residential mortgage loans. Accordingly,all our stockholders.
Termination of the mortgage-backed securities we typically invest in areadvisory agreement may be difficult and costly.
Termination of the advisory agreement without cause is subject to several conditions which may make such a termination difficult and costly. The advisory agreement provides that it may only be terminated without cause following the initial three-year period, which ends on December 31, 2010, upon the affirmative vote of at least two-thirds of our independent directors, based either upon unsatisfactory performance by HCS that is materially detrimental to us or upon a determination that the management fee payable to HCS is not fair, subject to HCS’s right to prevent such a termination by accepting a mutually acceptable reduction of management fees. HCS will be paid a termination fee equal to the sum of the average annual base advisory fee and the average annual incentive compensation earned by it during the 24-month period immediately preceding the date of termination, calculated as of the end of the most recently completed fiscal quarter prior to the date of termination. Thus, in the event we elect not to renew the advisory agreement for any reason other than cause (as defined in the advisory agreement), we will be required to pay this termination fee. These provisions may increase the effective cost to us of terminating the advisory agreement, thereby adversely affecting our ability to terminate HCS without cause.
Risks Related to an Investment in Our Capital Stock The market price and trading volume of our common stock may be volatile.
The market price of our common stock is highly volatile and subject to wide fluctuations. In addition, the trading volume in our common stock may fluctuate and cause significant price variations to occur. Some of the factors that could result in fluctuations in the price or trading volume of our common stock include, among other things: actual or anticipated changes in our current or future financial performance; changes in market interest rates and general market and economic conditions. We cannot assure you that the market price of our common stock will not fluctuate or decline significantly.
No active trading market for the Series A Preferred Stock currently exists and one may not develop in the future.
The shares of Series A Preferred Stock were issued in a private placement transaction pursuant to Section 4(2) of the Securities Act of 1933, as amended, and are not listed on the NASDAQ Capital Market or any other market. Furthermore, even if the Series A Preferred Stock is accepted for listing on the NASDAQ Capital Market or another securities exchange, an active trading market may not develop and the market price of the Series A Preferred Stock may be volatile. As a result, an investor in our Series A Preferred Stock may be unable to sell his/her shares of Series A Preferred Stock at a price equal to or greater than that which the investor paid, if at all.
We have not established a minimum dividend payment level for our common stockholders and there are no assurances of our ability to pay dividends to common or preferred stockholders in the future.
We intend to pay quarterly dividends and to make distributions to our common stockholders in amounts such that all or substantially all of our taxable income in each year, subject to certain adjustments, is distributed. This, along with other factors, should enable us to qualify for the riskstax benefits accorded to a REIT under the Internal Revenue Code of 1986, as amended, or Internal Revenue Code. We have not established a minimum dividend payment level for our common stockholders and our ability to pay dividends may be harmed by the risk factors described herein. From July 2007 until April 2008, our Board of Directors elected to suspend the payment of quarterly dividends on our common stock. Our Board’s decision reflected our focus on the elimination of operating losses through the sale of our mortgage lending business and the conservation of capital to build future earnings from our portfolio management operations. All distributions to our common stockholders will be made at the discretion of our Board of Directors and will depend on our earnings, our financial condition, maintenance of our REIT status and such other factors as our Board of Directors may deem relevant from time to time. There are no assurances of our ability to pay dividends in the future.
In addition, in the event that we do not have legally available funds, or any of our financing agreements in the future restrict our ability, to pay cash dividends on shares of our Series A Preferred Stock, we will be unable to pay cash dividends on our Series A Preferred Stock, unless, in the case of restrictions imposed by our financing agreements, we can refinance amounts outstanding under those agreements. Although the dividends on our Series A Preferred Stock would continue to accrue, we may pay dividends on shares of our Series A Preferred Stock only if we have legally available funds for such payment.
Upon conversion of our Series A Preferred Stock, we will be required to issue shares of common stock to holders of our Series A Preferred Stock, which will dilute the holders of our outstanding common stock. Our outstanding shares of Series A Preferred Stock are senior to our common stock for purposes of dividend and liquidation distributions and have voting rights equal to those of our common stock.
On January 18, 2008, we completed the issuance and sale of 1.0 million shares of Series A Preferred Stock to the JMP Group for an aggregate purchase price of $20.0 million. The Series A Preferred Stock entitles the holders to receive a cumulative dividend of 10% per year, subject to an increase to the extent any future quarterly common stock dividends exceed $0.20 per share. Holders of our Series A Preferred Stock have dividend and liquidating distribution preferences over holders of our common stock, which may negatively affect a Series A Preferred Stockholder’s ability to receive dividends or liquidating distributions on his or her shares. The Series A Preferred Stock also has voting rights equal to the voting rights attached to our common stock, except that each share of Series A Preferred Stock is entitled to a number of votes equal to the conversion rate for the Series A Preferred Stock.
The shares of Series A Preferred Stock are convertible into shares of our common stock based on a conversion price of $8.00 per share of common stock, which represents a conversion rate of two and one-half (2 ½) shares of common stock for each share of Series A Preferred Stock. Upon conversion of the underlying mortgage loans.Series A Preferred Stock, we will issue common stock to the holders of our Series A Preferred Stock, which will dilute the holders of our outstanding common stock.
The Series A Preferred Stock represents approximately 21% of our outstanding capital stock, on a fully diluted basis, as of February 15, 2010. Therefore, the holders of our Series A Preferred Stock have voting control over us.
The Series A Preferred Stock represents approximately 21% of our outstanding capital stock, on a fully diluted basis, as of February 15, 2010. The Series A Preferred Stock also has voting rights equal to the voting rights attached to our common stock, except that each share of Series A Preferred Stock is entitled to a number of votes equal to the conversion rate. Therefore, the holders of our Series A Preferred Stock have voting control over us, which may limit your ability to effect corporate change through the shareholder voting process.
Future offerings of debt securities, which would rank senior to our common stock and preferred stock upon our liquidation, and future offerings of equity securities, which would dilute our existing stockholders and may be senior to our common stock for the purposes of dividend and liquidating distributions, may adversely affect the market price of our common stock.
In the future, we may attempt to increase our capital resources by making offerings of debt or additional offerings of equity securities, including commercial paper, medium-term notes, senior or subordinated notes and classes of preferred stock or common stock. Upon liquidation, holders of our debt securities and lenders with respect to other borrowings will receive a distribution of our available assets prior to the holders of our preferred stock and common stock, with holders of our preferred stock having priority over holders of our common stock. Additional equity offerings may dilute the holdings of our existing stockholders or reduce the market price of our common stock, or both. Our Series A Preferred Stock has a preference on liquidating distributions or a preference on dividend payments that could limit our ability to make a dividend distribution to the holders of our common stock, and any preferred stock issued by us in the future could have similar terms. Because our decision to issue securities in any future offering will depend on market conditions and other factors beyond our control, we cannot predict or estimate the amount, timing or nature of our future offerings. Thus, holders of our common stock bear the risk of our future offerings reducing the market price of our common stock and diluting their stock holdings in us.
We may not be able to pay the redemption price of our Series A Preferred Stock on the redemption date.
We have an obligation to redeem any remaining outstanding shares of our Series A Preferred Stock on or about December 31, 2010, at a redemption price equal to 100% of the $20.00 per share liquidation preference, plus all accrued and unpaid dividends. Our common stock is currently trading below the conversion price for our Series A Preferred Stock. As a result, as of December 31, 2009, 100% of the Series A Preferred Stock remained outstanding, which represents an aggregate redemption price (excluding accrued and unpaid dividends) of approximately $20.0 million. We may be unable to finance the redemption on favorable terms, or at all. Consequently, we may not have sufficient cash to purchase the shares of our Series A Preferred Stock.
We may not issue preferred stock that is senior to the Series A Preferred Stock without the consent of the holders of 66 2/3% of the shares of Series A Preferred Stock, which limits the flexibility of our capital structure.
As long as the Series A Preferred Stock is outstanding, we may not issue preferred stock that is senior to the Series A Preferred Stock with respect to dividend or liquidation rights without the consent of the holders of 66 2/3% of the shares of Series A Preferred Stock. This limitation restricts the flexibility of our capital structure and may prevent us from issuing equity that would otherwise be in the best interests of our company and common stockholders.
Future sales of our common stock could have an adverse effect on our common stock price.
We cannot predict the effect, if any, of future sales of common stock, or the availability of shares for future sales, on the market price of our common stock. For example, upon conversion of our Series A Preferred Stock, we will be required to issue shares of our common stock to holders of our Series A Preferred Stock, which will increase the number of shares available for sale and dilute existing holders of our common stock. Sales of substantial amounts of common stock, or the perception that such sales could occur, may adversely affect prevailing market prices for our common stock.
Risks Related to Our Company, Structure and Change in Control Provisions
Our directors have approved broad investment guidelines for us and do not approve each investment we make.
Our boardBoard of directorsDirectors has given us substantial discretion to invest in accordance with our broad investment guidelines. Our boardBoard of directorsDirectors periodically reviews our investment guidelines and our portfolio. However, our boardBoard of directorsDirectors does not review each proposed investment. In addition, in conducting periodic reviews, our directors rely primarily on information provided to them by our executive officers.officers and HCS. Furthermore, transactions entered into by us may be difficult or impossible to unwind by the time they are reviewed by our directors. WeOur management and HCS have substantial discretion within our broad investment guidelines in determining the types of assets we may decide are proper investments for us.
We are dependent on certain key personnel.
We may be required to repurchase mortgage loans that we have sold or to indemnify holdersare a small company and are dependent upon the efforts of certain key individuals, including James J. Fowler, the Chairman of our mortgage-backed securities.Board of Directors, and Steven R. Mumma, our Chief Executive Officer, President and Chief Financial Officer. The loss of any key personnel or their services could have an adverse effect on our operations.
If any of the mortgage loansOur Chief Executive Officer has an agreement with us that we originated and sold, or that we pledge or pledged to secure mortgage-backed securities that we issue in our securitizations, do not comply with the representations and warranties that we make about the characteristics of the loans, the borrowers and the properties securing the loans, we may be required to repurchase those loans in the case of the loans that we have sold, or replace them with substitute loans or cash in the case of securitized loans. If this occurs, we may have to bear any associated losses directly. In addition, in the case of loans that we have sold, we may be required to indemnify the purchasers of such loans for losses or expenses incurred as a result of a breach of a representation or warranty made by us. Repurchased loans typically require an allocation of working capital to carry on our books, and our ability to borrow against such assets is limited, which could limit the amount by which we can leverage our equity. Any significant repurchases or indemnification payments could significantly harm our cash flow and results of operations and limit our ability to make distributions to our stockholders.
Risks Related to Our Company, Structure and Change in Control Provisions
Our executive officers have agreements that provide themprovides him with benefits in the event theirhis employment is terminated following a change in control.
We have entered into agreementsan agreement with the members of our senior management team, Messrs. Akre,Chief Executive Officer, Steven R. Mumma, and Howe that provides themhim with severance benefits if theirhis employment ends under specified circumstances following a change in control. These benefits could increase the cost to a potential acquirer of us and thereby prevent or discourage a change in control that might involve a premium price for your shares or otherwise be in your best interest.
The stock ownership limit imposed by our charter may inhibit market activity in our common stock and may restrict our business combination opportunities.
In order for us to maintain our qualification as a REIT under the Internal Revenue Code, not more than 50% in value of the issued and outstanding shares of our capital stock may be owned, actually or constructively, by five or fewer individuals (as defined in the Internal Revenue Code to include certain entities) at any time during the last half of each taxable year (other than our first year as a REIT). This test is known as the “5/50 test.” Attribution rules in the Internal Revenue Code apply to determine if any individual or entity actually or constructively owns our capital stock for purposes of this requirement. Additionally, at least 100 persons must beneficially own our capital stock during at least 335 days of each taxable year (other than our first year as a REIT). To help ensure that we meet these tests, our charter restricts the acquisition and ownership of shares of our capital stock. Our charter, with certain exceptions, authorizes our directors to take such actions as are necessary and desirable to preserve our qualification as a REIT and provides that, unless exempted by our boardBoard of directors,Directors, no person other than Mr. Schnall may own more than 9.4%5.0% in value of the outstanding shares of our capital stock. Our charter provides that Mr. Schnall may own up to 12.0% of our outstanding common stock. Our board of directors may grant an exemption from thatThe ownership limit contained in its sole discretion, subject to such conditions, representations and undertakings as it may determine. This ownership limitour charter could delay or prevent a transaction or a change in control of our company under circumstances that otherwise could provide our stockholders with the opportunity to realize a premium over the then current market price for our common stock or would otherwise be in the best interests of our stockholders.
Certain provisions of Maryland law and our charter and bylaws could hinder, delay or prevent a change in control which could have an adverse effect on the value of our securities.
Certain provisions of Maryland law, our charter and our bylaws may have the effect of delaying, deferring or preventing transactions that involve an actual or threatened change in control. These provisions include the following, among others:
| · | our charter provides that, subject to the rights of one or more classes or series of preferred stock to elect one or more directors, a director may be removed with or without cause only by the affirmative vote of holders of at least two-thirds of all votes entitled to be cast by our stockholders generally in the election of directors; |
| · | our bylaws provide that only our boardBoard of directorsDirectors shall have the authority to amend our bylaws; |
| · | under our charter, our boardBoard of directorsDirectors has authority to issue preferred stock from time to time, in one or more series and to establish the terms, preferences; |
· | preferences and rights of any such series, all without the approval of our stockholders; |
| · | the Maryland Business Combination Act; and |
| · | the Maryland Control Share Acquisition Act. |
Although our boardBoard of directorsDirectors has adopted a resolution exempting us from application of the Maryland Business Combination Act and our bylaws provide that we are not subject to the Maryland Control Share Acquisition Act, our boardBoard of directorsDirectors may elect to make the “business combination” statute and “control share” statute applicable to us at any time and may do so without stockholder approval.
Maintenance of our Investment Company Act exemption imposes limits on our operations.
We have conducted and intend to continue to conduct our operations so as not to become regulated as an investment company under the Investment Company Act of 1940, as amended.Act. We believe that there are a number of exemptions under the Investment Company Act that are applicable to us. To maintain the exemption, the assets that we acquire are limited by the provisions of the Investment Company Act and the rules and regulations promulgated under the Investment Company Act. In addition, we could, among other things, be required either (a) to change the manner in which we conduct our operations to avoid being required to register as an investment company or (b) to register as an investment company, either of which could have an adverse effect on our operations and the market price for our securities.
Tax Risks Related to Our Business and Structure
Failure to qualify as a REIT would adversely affect our operations and ability to make distributions.
We have operated and intend to continue to operate so to qualify as a REIT for federal income tax purposes. Our continued qualification as a REIT will depend on our ability to meet various requirements concerning, among other things, the ownership of our outstanding stock, the nature of our assets, the sources of our income, and the amount of our distributions to our stockholders. In order to satisfy these requirements, we might have to forego investments we might otherwise make. Thus, compliance with the REIT requirements may hinder our investment performance. Moreover, while we intend to continue to operate so to qualify as a REIT for federal income tax purposes, given the highly complex nature of the rules governing REITs, there can be no assurance that we will so qualify in any taxable year.
If we fail to qualify as a REIT in any taxable year and we do not qualify for certain statutory relief provisions, we would be subject to federal income tax (including any applicable alternative minimum tax) on our taxable income at regular corporate rates. In addition,We might be required to borrow funds or liquidate some investments in order to pay the applicable tax. Our payment of income tax would reduce our net earnings available for investment or distribution to stockholders. Furthermore, if we fail to qualify as a REIT and do not qualify for certain statutory relief provisions, we would no longer be required to make distributions to stockholders. Unless our failure to qualify as a REIT were excused under the federal income tax laws, we generally would be disqualified from treatment as a REIT for the four taxable years following the year in which we lost our REIT status. Losing our REIT status would reduce our net earnings available for investment or distribution to stockholders because of the additional tax liability, and we would no longer be required to make distributions to stockholders. Additionally, we might be required to borrow funds or liquidate some investments in order to pay the applicable tax.
REIT distribution requirements could adversely affect our liquidity.
In order to qualify as a REIT, we generally are required each year to distribute to our stockholders at least 90% of our REIT taxable income, excluding any net capital gain. To the extent that we distribute at least 90%, but less than 100% of our REIT taxable income, we will be subject to corporate income tax on our undistributed REIT taxable income. In addition, we will be subject to a 4% nondeductible excise tax on the amount, if any, by which certain distributions paid by us with respect to any calendar year are less than the sum of (i) 85% of our ordinary REIT income for that year, (ii) 95% of our REIT capital gain net income for that year, and (iii) 100% of our undistributed REIT taxable income from prior years.
We have made and intend to continue to make distributions to our stockholders to comply with the 90% distribution requirement and to avoid corporate income tax and the nondeductible excise tax. However, differences in timing between the recognition of REIT taxable income and the actual receipt of cash could require us to sell assets or to borrow funds on a short-term basis to meet the 90% distribution requirement and to avoid corporate income tax and the nondeductible excise tax.
Certain of our assets may generate substantial mismatches between REIT taxable income and available cash. Such assets could include mortgage-backed securities we hold that have been issued at a discount and require the accrual of taxable income in advance of the receipt of cash. As a result, our taxable income may exceed our cash available for distribution and the requirement to distribute a substantial portion of our net taxable income could cause us to:
| · | sell assets in adverse market conditions, |
| · | borrow on unfavorable terms or |
| · | distribute amounts that would otherwise be invested in future acquisitions, capital expenditures or repayment of debt |
in order to comply with the REIT distribution requirements.
Further, amounts distributed will not be availableour lenders could require us to fund investment activities. We expect to fund our investments generally through borrowings from financial institutions, along with securitization financings. If we fail to obtain debt or equity capital in the future, it could limitenter into negative covenants, including restrictions on our ability to grow,distribute funds or to employ leverage, which could have a material adverse effect oninhibit our ability to satisfy the value of our common stock.90% distribution requirement.
Dividends payable by REITs do not qualify for the reduced tax rates on dividend income from regular corporations.
The maximum U.S. federal income tax rate for dividends payable to domestic shareholders that are individuals, trust and estates is 15% (through 2008)2010). Dividends payable by REITs, however, are generally not eligible for the reduced rates. Although the reduced U.S. federal income tax rate applicable to dividend income from regular corporate dividends does not adversely affect the taxation of REITs or dividends paid by REITs, the more favorable rate applicable to regular corporate dividends could cause investors who are individuals, trusts and estates to perceive investments in REITs to be relatively less attractive than investments in the stocks of non-REIT corporations that pay dividends, which could adversely affect the value of the shares of REITs, including our common shares.
Risks RelatedComplying with REIT requirements may limit our ability to an Investment in Our Common Stockhedge effectively.
The REIT provisions of the Code substantially limit our ability to hedge the RMBS in our investment portfolio. Our common stock tradesaggregate gross income from non-qualifying hedges, fees, and certain other non-qualifying sources cannot exceed 5% of our annual gross income. As a result, we might have to limit our use of advantageous hedging techniques or implement those hedges through a TRS. Any hedging income earned by a TRS would be subject to federal, state and local income tax at regular corporate rates. This could increase the cost of our hedging activities or expose us to greater risks associated with changes in interest rates than we would otherwise want to bear.
A decline in the value of the real estate securing the mortgage loans that back RMBS could cause a limited marketportion of our income from such securities to be nonqualifying income for purposes of the REIT 75% gross income test, which could hinder your abilitycause us to sellfail to qualify as a REIT.
Pools of mortgage loans back the RMBS that we hold in our common stock.
Our equity market capitalization places usinvestment portfolio and in which we invest. In general, the interest income from a mortgage loan is qualifying income for purposes of the 75% gross income test applicable to REITs to the extent that the mortgage loan is secured by real property. If a mortgage loan has a loan-to-value ratio greater than 100%, however, then only a proportionate part of the interest income is qualifying income for purposes of the 75% gross income test and only a proportionate part of the value of the loan is treated as a “real estate asset” for purposes of the 75% asset test applicable to REITs. This loan-to-value ratio is generally measured at the low end of market capitalization among all public REITs. Our common stock experiences limited trading volume, and many investors may not be interested in owning our common stock becausetime that the REIT commits to acquire the loan. Although the IRS has ruled generally that the interest income from non-collateralized mortgage obligation (“CMO”) RMBS is qualifying income for purposes of the inability75% gross income test, it is not entirely clear how this guidance would apply if we purchase non-CMO RMBS in the secondary market at a time when the loan-to-value ratio of one or more of the mortgage loans backing the non-CMO RMBS is greater than 100%, and, accordingly, a portion of any income from such non-CMO RMBS may be treated as non-qualifying income for purposes of the 75% gross income test. In addition, that guidance does not apply to acquire or sellCMO RMBS. In the case of CMO RMBS, if less than 95% of the assets of the issuer of the CMO RMBS constitute “real estate assets,” then only a substantial blockproportionate part of our common stock at one time. This illiquidityincome derived from the CMO RMBS will qualify for purposes of the 75% gross income test. Although the law is not clear, the IRS may take the position that the determination of the loan-to-value ratio for mortgage loans that back CMO RMBS is to be made on a quarterly basis. A decline in the value of the real estate securing the mortgage loans that back our CMO RMBS could have an adverse effect oncause a portion of the market priceinterest income from those RMBS to be treated as non-qualifying income for purposes of our common stock. A substantial sale, or series of sales, of our common stock could havethe 75% gross income test. If such non-qualifying income caused us to fail the 75% gross income test and we did not qualify for certain statutory relief provisions, we would fail to qualify as a material adverse effect on the market price of our common stock.REIT.
Item 1B. UNRESOLVED STAFF COMMENTS
None.
The market price and trading volume of our common stock may be volatile.Item 2.PROPERTIES
The market priceOther than real estate owned, acquired through, or in lieu of, our common stock may become highly volatile and subject to wide fluctuations. In addition,foreclosures on mortgage loans, the trading volume in our common stock may fluctuate and cause significant price variations to occur. Some of the factors that could result in fluctuations in the price or trading volume of our common stock include, among other things: actual or anticipated changes in our current or future financial performance; changes in market interest rates and general market and economic conditions. We cannot assure you that the market price of our common stock willCompany does not fluctuate or decline significantly.
Item 1B. UNRESOLVED STAFF COMMENTS
None.
Item 2. PROPERTIES
own any properties. As of MarchDecember 31, 2007,2009, our principal executive and administrative offices are located in leased space at 130152 Vanderbilt Avenue, of the Americas, 7th floor,Suite 403, New York, New York 10019. On November 13, 2006, we entered into an Assignment and Assumption of Sublease with Lehman Brothers Holdings Inc. (“Lehman”). Under the agreement, we assigned the sublease for this space to Lehman. We intend to relocate our corporate headquarters to a smaller facility at a location that is yet to be determined.
Until March 31, 2007 we also operated retail loan origination sales offices at 47 (25 branches and 22 branch satellite) locations in 14 states. All of our facilities were leased. The aggregate annual rent for these locations was approximately $4.8 million. Upon consummation of the sale of our retail mortgage origination platform assets to Indymac, we assigned substantially all of the leases for the branch offices to Indymac.
Further details of our facilities are as follows: 10017.
LocationItem 3.LEGAL PROCEEDINGS
| | Business Activity
| | Business Segment
|
| | | | |
New York City | | Corporate Headquarters and
Mortgage Origination
| | Mortgage Portfolio
Management and
Mortgage Lending
|
| | | | |
Bridgewater, New Jersey(1) | | Wholesale Lending | | Mortgage Lending |
| | | | |
Various-47 locations in 14 states(2) | | Retail Mortgage Origination | | Mortgage Lending |
(1) This lease was assigned to and assumed by Tribeca Lending effective February 22, 2007 in connection with the sale of the wholesale mortgage origination platform described further in note 22 of the consolidated financial statements.
(2) Substantially all of these leases were assigned and assumed by Indymac effective March 31, 2007 in connection with the sale of substantially all of the operating assets of our retail mortgage lending platform described further in note 22 of the consolidated financial statements.
Item 3. LEGAL PROCEEDINGS
The Company isWe are at times subject to various legal proceedings arising in the ordinary course of our business. The Company doesAs of the date of this report, we do not believe that any of itsour current legal proceedings, individually or in the aggregate, will have a material adverse effect on itsour operations, financial condition or financial condition.cash flows
Item 4. SUBMISSION OF MATTERS TO A VOTE OF SECURITY HOLDERS(REMOVED AND RESERVED)
None.
PART II
Item 5.MARKET FOR REGISTRANT’S COMMON EQUITY, RELATED STOCKHOLDER MATTERS AND ISSUER PURCHASES OF EQUITY SECURITIES
Market Price of and Dividends on the Registrant’s Common Equity and Related Stockholder Matters
Our common stock is traded on the New York Stock ExchangeNASDAQ under the trading symbol “NTR”“NYMT”. As of March 15, 2007,December 31, 2009, we had 18,077,8809,415,094 shares of common stock outstanding and as of March 5, 2007,1, 2010, there were 87approximately 30 holders of record.record of our common stock. This figure does not reflect the beneficial ownership of shares held in nominee name.
The following table sets forth, for the periods indicated, the high, low and quarter end closing sales prices per share of our common stock on the NYSE and the cash dividends paid or payable on our common stock on a per share of common stock.basis. The data below has been sourced from http://www.bloomberg.com.
| | | Common Stock Prices | | Cash Dividends | | Common Stock Prices | | Cash Dividends | |
| | | High | | Low | | Close | | Declared | | Paid or Payable | | Amount per Share | | High | | Low | | Close | | Declared | | Paid or Payable | | Amount per Share | |
Year Ended December 31, 2006 | | | | | | | | | | | | | | |
| Year Ended December 31, 2009 | | | | | | | | | | | | | |
| Fourth quarter | | $ | 4.04 | | $ | 2.60 | | $ | 3.05 | | 12/18/06 | | 1/26/07 | | $ | 0.05 | | $ | 8.75 | | $ | 5.74 | | $ | 7.19 | | 12/21/09 | | 01/26/10 | | $ | 0.25 | |
| Third quarter | | | 4.85 | | 3.65 | | 3.86 | | 9/18/06 | | 10/26/06 | | 0.14 | | | 8.03 | | | 5.05 | | | 7.60 | | 09/28/09 | | 10/26/09 | | | 0.25 | |
| Second quarter | | | 5.56 | | 3.80 | | 4.00 | | 6/15/06 | | 7/26/06 | | 0.14 | | | 5.97 | | | 2.23 | | | 5.16 | | 06/14/09 | | 07/27/09 | | | 0.23 | |
| First quarter | | | 6.88 | | 4.15 | | 5.40 | | 3/6/06 | | 4/26/06 | | 0.14 | | | 3.80 | | | 1.82 | | | 3.80 | | 03/25/09 | | 04/27/09 | | | 0.18 | |
| | Common Stock Prices(1) | | Cash Dividends | |
| | High | | Low | | Close | | Declared | | Paid or Payable | | Amount per Share | |
| Year Ended December 31, 2008 | | | | | | | | | | | | |
| Fourth quarter | $ | 4.37 | | $ | 1.51 | | $ | 2.20 | | 12/23/08 | | 01/26/09 | | $ | 0.10 | |
| Third quarter | | 5.99 | | | 2.50 | | | 3.17 | | 09/29/08 | | 10/27/08 | | | 0.16 | |
| Second quarter | | 6.24 | | | 4.00 | | | 6.20 | | 06/30/08 | | 07/25/08 | | | 0.16 | |
| First quarter | | 9.80 | | | 4.40 | | | 5.40 | | 04/21/08 | | 05/15/08 | | | 0.12 | |
(1) Our common stock was reported on the OTCBB from January 1, 2008 through June 4, 2008. Our common stock has been listed on the NASDAQ since June 5, 2008. | |
| | | Common Stock Prices | | Cash Dividends | |
| | | High | | Low | | Close | | Declared | | Paid or Payable | | Amount per Share | |
Year Ended December 31, 2005 | | | | | | | | | | | | | |
| Fourth quarter | | $ | 7.50 | | $ | 5.51 | | $ | 6.62 | | | 12/09/05 | | | 1/26/06 | | $ | 0.21 | |
| Third quarter | | | 9.20 | | | 7.00 | | | 7.47 | | | 9/26/05 | | | 10/26/05 | | | 0.21 | |
| Second quarter | | | 10.23 | | | 9.04 | | | 9.07 | | | 6/02/05 | | | 07/26/05 | | | 0.25 | |
| First quarter | | | 11.30 | | | 9.90 | | | 10.22 | | | 03/11/05 | | | 04/26/05 | | | 0.25 | |
In orderWe intend to qualify for the tax benefits accorded to a REIT under the Code, we intendcontinue to pay quarterly dividends such that all or substantially allto holders of our taxable income each year (subject to certain adjustments) is distributed to our stockholders. Allshares of the distributions that we makecommon stock. Future dividends will be at the discretion of ourthe Board of Directors and will depend on our earnings and financial condition, maintenance of our REIT statusqualification, restrictions on making distributions under Maryland law and anysuch other factors that theas our Board of Directors deems relevant.
During 2006, taxable dividend distributions for the Company’s common stock were $0.63 per share. The Company’s common stock is currently listed under the CUSIP #649604-10-5 and trades under the NYSE ticker symbol NTR. For tax reporting purposes, the 2006 taxable dividend distributions will be classified as follows: $0.02401 as ordinary income and $0.60599 as a return of capital. The following table contains this information on a quarterly basis.| Declaration Date | | Record Date | | Payment Date | | Cash Distribution per share | | Income Dividends | | Short-term Capital Gain | | Total Taxable Ordinary Dividend | | Return of Capital | |
| | | | | | | | | | | | | | | | |
| 12/23/08 | | 01/07/09 | | 01/26/09 | | $ | 0.1000 | | $ | 0.1000 | | $ | 0.0000 | | $ | 0.1000 | | $ | 0.0000 | |
| 03/25/09 | | 04/06/09 | | 04/27/09 | | $ | 0.1800 | | $ | 0.1800 | | $ | 0.0000 | | $ | 0.1800 | | $ | 0.0000 | |
| 06/14/09 | | 06/26/09 | | 07/27/09 | | $ | 0.2300 | | $ | 0.2300 | | $ | 0.0000 | | $ | 0.2300 | | $ | 0.0000 | |
| 09/28/09 | | 10/13/09 | | 10/26/09 | | $ | 0.2500 | | $ | 0.2500 | | $ | 0.0000 | | $ | 0.2500 | | $ | 0.0000 | |
| Total 2009 Cash Distributions | | $ | 0.7600 | | $ | 0.7600 | | $ | 0.0000 | | $ | 0.7600 | | $ | 0.0000 | |
Declaration Date | | Record Date | | Payment Date | | Cash Distribution per share | | Income Dividends | | Short-term Capital Gain | | Total Taxable Ordinary Dividend | | Return of Capital | |
| | | | | | | | | | | | | | | | |
| 12/09/05 | | | 1/6/06 | | | 1/26/06 | | $ | 0.21 | | $ | 0.00000 | | $ | 0.00000 | | $ | 0.00000 | | $ | 0.21000 | |
| 3/6/06 | | | 4/6/06 | | | 4/26/06 | | $ | 0.14 | | $ | 0.00000 | | $ | 0.00000 | | $ | 0.00000 | | $ | 0.14000 | |
| 6/15/06 | | | 7/6/06 | | | 7/26/06 | | $ | 0.14 | | $ | | | $ | 0.02401 | | $ | 0.02401 | | $ | 0.11599 | |
| 9/18/06 | | | 10/6/06 | | | 10/26/06 | | $ | 0.14 | | $ | 0.00000 | | $ | 0.00000 | | $ | 0.00000 | | $ | 0.14000 | |
| Total 2006 Cash Distributions | $ | 0.63 | | $ | | | $ | 0.02401 | | $ | 0.02401 | | $ | 0.60599 | |
Purchases of Equity Securities by the Issuer and Affiliated Purchasers
During the year ended December 31, 2006 theThe Company purchased and retiredhas a total of 67,000 shares of its common stock in open market transactions as part of the share repurchase program, which it previously announced onin November 10, 2005.
The shares were repurchased though a broker on the open-market. The plan, funded from available capital, provides that At management’s discretion, the Company at management’s discretion, is authorized to repurchase shares of Company common stock from time to time, in the open market or through privately negotiated transactions through December 31, 2015. The plan may be temporarily or permanently suspended or discontinued at any time. The Company has not repurchased any shares since March 2006.2006 and currently has no intention to recommence repurchases in the near-term..
38
Period | | Total Number of Shares Purchased as Part of Publicly Announced Plan | | Average Price Paid Per Share | | Maximum Number of Shares that May yet be Purchased Under Plan | |
| 1/1/06 to 1/31/06 | | | ¾ | | | ¾ | | | 10,000,000 | |
| 2/1/06 to 2/28/06 | | | ¾ | | | ¾ | | | 10,000,000 | |
| 3/1/06 to 3/31/06 | | | 67,000 | | $ | 4.43 | | | 9,933,000 | |
| Total/Weighted Avg. | | | 67,000 | | $ | 4.43 | | | 9,933,000 | |
Securities Authorized for Issuance Under Equity Compensation Plans
The following table sets forth information as of December 31, 20062009 with respect to compensation plans under which equity securities of the Company are authorized for issuance. The Company has no such plans that were not approved by security holders.
Plan Category | | Number of Securities to be Issued upon Exercise of Outstanding Options, Warrants and Rights | | Weighted Average Exercise Price of Outstanding Options, Warrants and Rights | | Number of Securities Remaining Available for Future Issuance under Equity Compensation Plans | |
| Equity compensation plans approved by security holders | | | 466,500 | | $ | 9.52 | | | 878,496 | |
Plan Category | | Number of Securities to be Issued upon Exercise of Outstanding Options, Warrants and Rights | | Weighted Average Exercise Price of Outstanding Options, Warrants and Rights | | Number of Securities Remaining Available for Future Issuance under Equity Compensation Plans | |
| Equity compensation plans approved by security holders | | — | | $ | — | | 8,111 | |
The following line graph sets forth, for the period December 31, 2004 through December 31, 2009, a comparison of the percentage change in the cumulative total stockholder return on the Company's common stock compared to the cumulative total return of the NYSE Composite Index and the National Association of Real Estate Investment Trusts ("NAREIT") Mortgage REIT Index. The graph assumes that the value of the investment in each of the Company's common stock and the indices was $100 as of December 31, 2004 and that all dividends were reinvested. The performance reflected in the graph is not necessarily indicative of future performance.
Performance Graph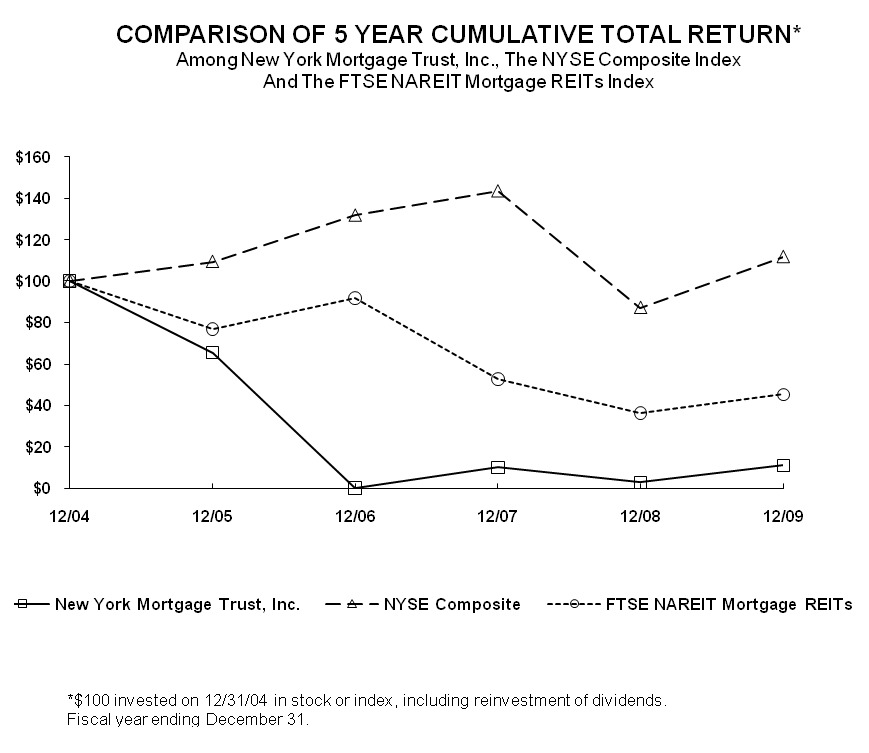
The foregoing graph and chart shall not be deemed incorporated by reference by any general statement incorporating by reference this Annual Report on Form 10-K into any filing under the Securities Act of 1933 or under the Securities Exchange Act of 1934, except to the extent we specifically incorporate this information by reference, and shall not otherwise be deemed filed under those acts.
Item 6.SELECTED FINANCIAL DATA
The following selected consolidated financial data is derived from our audited consolidated financial statements and the notes thereto for the periods presented and should be read in conjunction with the more detailed information therein and “Management’s Discussion and Analysis of Financial Condition and Results of Operations” included elsewhere in this annual report. Operating results are not necessarily indicative of future performance.
In connection with the sale of the Company's wholesale mortgage origination platform assets on February 22, 2007 and the sale of its retail mortgage origination platform assets on March 31, 2007, we are required to classify our Mortgage Lending segment as a discontinued operation in accordance with Statement of Financial Accounting Standards No. 144 (see note 12 in the notes to our consolidated financial statements). In connection with this reclassification, we have presented selected financial data below in two different formats. Table 1 provides summary level data for the continuing and discontinued business segments of our company (after giving effect to the reclassification of the Mortgage Lending segment). Table 2 provides selected financial data in greater detail in a form of presentation that is consistent with our prior disclosures under this Item 6.
The selected financial data as of and for the years ended December 31, 2006, December 31, 2005 and December 31, 2004, include the operations of NYMT and its consolidated subsidiaries. Included in the selected financial data for the year ended December 31, 2004 are the results of NYMT for the period beginning June 29, 2004 (the closing date of our IPO) and NYMC for the year-to-date period beginning January 1, 2004. Prior to our IPO, NYMT had no operations and, as a result, for all years prior to 2004, the financial data presented is for NYMC only.| | | As of and For the Year Ended December 31, | |
| (Dollar amounts in thousands, except per share amounts) | | 2009 | | | 2008 | | | 2007 | | | 2006 | | | 2005 | |
| Operating Data: | | | | | | | | | | | | | | | |
| Revenues: | | | | | | | | | | | | | | | |
| Interest income | | $ | 31,095 | | | $ | 44,123 | | | $ | 50,564 | | | $ | 64,881 | | | $ | 62,725 | |
| Interest expense | | | 14,235 | | | | 36,260 | | | | 50,087 | | | | 60,097 | | | | 49,852 | |
| Net interest income | | | 16,860 | | | | 7,863 | | | | 477 | | | | 4,784 | | | | 12,873 | |
| Provision for loan losses | | | (2,262 | ) | | | (1,462 | ) | | | (1,683 | ) | | | (57 | ) | | | — | |
| Realized gains (losses) on securities and related hedges | | | 3,282 | | | | (19,977 | ) | | | (8,350 | ) | | | (529 | ) | | | 2,207 | |
| Impairment loss on investment securities | | | (119 | ) | | | (5,278 | ) | | | (8,480 | ) | | | — | | | | (7,440 | ) |
| Total other income (expenses) | | | 901 | | | | (26,717 | ) | | | (18,513 | ) | | | (586 | ) | | | (5,233 | ) |
| Expenses: | | | | | | | | | | | | | | | | | | | | |
| Salaries and benefits | | | 2,118 | | | | 1,869 | | | | 865 | | | | 714 | | | | 1,934 | |
| General and administrative expenses | | | 4,759 | | | | 5,041 | | | | 1,889 | | | | 1,318 | | | | 2,384 | |
| Total expenses | | | 6,877 | | | | 6,910 | | | | 2,754 | | | | 2,032 | | | | 4,318 | |
| Income (loss) before from continuing operations | | | 10,884 | | | | (25,764 | ) | | | (20,790 | ) | | | 2,166 | | | | 3,322 | |
| Income (loss) from discontinued operation – net of tax (1) | | | 786 | | | | 1,657 | | | | (34,478 | ) | | | (17,197 | ) | | | (8,662 | ) |
| Net income (loss) | | $ | 11,670 | | | $ | (24,107 | ) | | $ | (55,268 | ) | | $ | (15,031 | ) | | $ | (5,340 | ) |
| Basic net income (loss) per share | | $ | 1.25 | | | $ | (2.91 | ) | | $ | (30.47 | ) | | $ | (8.33 | ) | | $ | (2.96 | ) |
| Diluted net income (loss) income per share | | $ | 1.19 | | | $ | (2.91 | ) | | $ | (30.47 | ) | | $ | (8.33 | ) | | $ | (2.96 | ) |
| Dividends declared per common share | | $ | 0.91 | | | $ | 0.54 | | | $ | 0.50 | | | $ | 4.70 | | | $ | 9.20 | |
| Balance Sheet Data: | | | | | | | | | | | | | | | | | | | | |
| Cash and cash equivalents | | $ | 24,522 | | | $ | 9,387 | | | $ | 5,508 | | | $ | 969 | | | $ | 9,056 | |
| Investment securities available for sale | | | 176,691 | | | | 477,416 | | | | 350,484 | | | | 488,962 | | | | 716,482 | |
| Mortgage loans held in securitization trusts | | | 276,176 | | | | 346,972 | | | | 428,030 | | | | 587,535 | | | | 780,670 | |
| Assets related to discontinued operation (1) | | | 4,217 | | | | 5,854 | | | | 8,876 | | | | 212,805 | | | | 248,871 | |
| Total assets | | | 488,814 | | | | 853,300 | | | | 808,606 | | | | 1,321,979 | | | | 1,789,943 | |
| Financing arrangements, portfolio investments | | | 85,106 | | | | 402,329 | | | | 315,714 | | | | 815,313 | | | | 1,166,499 | |
| Collateralized debt obligations | | | 266,754 | | | | 335,646 | | | | 417,027 | | | | 197,447 | | | | 228,226 | |
| Subordinated debentures (net) | | | 44,892 | | | | 44,618 | | | | 44,345 | | | | 44,071 | | | | 43,650 | |
| Convertible preferred debentures | | | 19,851 | | | | 19,702 | | | | — | | | | — | | | | — | |
| Liabilities related to discontinued operation (1) | | | 1,778 | | | | 3,566 | | | | 5,833 | | | | 187,705 | | | | 231,925 | |
| Total liabilities | | | 425,827 | | | | 814,052 | | | | 790,188 | | | | 1,250,407 | | | | 1,688,985 | |
| Total stockholders’ equity | | $ | 62,987 | | | $ | 39,248 | | | $ | 18,418 | | | $ | 71,572 | | | $ | 100,958 | |
Table 1:
| | | For the Year Ended December 31, | |
| | | 2006 | | 2005 | | 2004 | | 2003 | | 2002 | |
| | | (Dollar amounts in thousands, except per share data) | |
Operating Data: | | | | | | | | | | | |
Revenues: | | | | | | | | | | | |
| Net interest income | | $ | 4,784 | | $ | 12,873 | | $ | 7,924 | | $ | — | | $ | — | |
| Income from continuing operations | | | 2,166 | | | 3,322 | | | 6,899 | | | — | | | — | |
| (Loss)/income from discontinued operation-net of tax | | | (17,197 | ) | | (8,662 | ) | | (1,952 | ) | | 13,726 | | | 3,750 | |
| Net (loss)/income | | | (15,031 | ) | | (5,340 | ) | | 4,947 | | | 13,726 | | | 3,750 | |
| Basic (loss)/income per share EPS | | | (0.83 | ) | | (0.30 | ) | | 0.28 | | | — | | | — | |
| Total assets continuing operations | | | 1,107,983 | | | 1,542,422 | | | 1,413,729 | | | — | | | — | |
| Total assets discontinued operation | | | 214,925 | | | 248,871 | | | 201,034 | | | 110,081 | | | 83,004 | |
| Total liabilities continuing operations | | | 1,063,349 | | | 1,458,410 | | | 1,306,185 | | | — | | | — | |
| Total liabilities discontinued operation | | $ | 187,987 | | $ | 231,925 | | $ | 189,095 | | $ | 90,425 | | $ | 73,016 | |
| (1) | In connection with the sale of our wholesale mortgage origination platform assets on February 22, 2007 and the sale of our retail mortgage origination platform assets on March 31, 2007, we classify our mortgage lending business as a discontinued operation in (see note 8 in the notes to our consolidated financial statements). |
Table 2:
| | | For the Year Ended December 31, | |
| | | 2006 | | 2005 | | 2004 | | 2003 | | 2002 | |
| | | (Dollar amounts in thousands, except per share data) | |
Operating Data: | | | | | | | | | | | |
Revenues: | | | | | | | | | | | |
| Interest income | | $ | 81,247 | | $ | 77,476 | | $ | 27,299 | | $ | 7,609 | | $ | 2,986 | |
| Interest expense | | | 72,940 | | | 60,104 | | | 16,013 | | | 3,266 | | | 1,673 | |
| Net Interest Income | | | 8,307 | | | 17,372 | | | 11,286 | | | 4,343 | | | 1,313 | |
| | | | | | | | | | | | | | | | | |
| Gains on sales of mortgage loans | | | 17,987 | | | 26,783 | | | 20,835 | | | 23,031 | | | 9,858 | |
| Brokered loan fees | | | 10,937 | | | 9,991 | | | 6,895 | | | 6,683 | | | 5,241 | |
| (Loss)/gain on sale of securities and related hedges | | | (529 | ) | | 2,207 | | | 774 | | | — | | | — | |
| Loss on sale of current period securitized loans | | | (747 | ) | | — | | | — | | | — | | | — | |
| Loan/impairment loss on investment securities | | | (8,285 | ) | | (7,440 | ) | | — | | | — | | | — | |
| Miscellaneous | | | 453 | | | 232 | | | 227 | | | 45 | | | 15 | |
| Total other income | | | 19,816 | | | 31,773 | | | 28,731 | | | 29,759 | | | 15,114 | |
Expenses: | | | | | | | | | | | | | | | | |
| Salaries and benefits | | | 22,425 | | | 30,979 | | | 17,118 | | | 9,247 | | | 5,788 | |
| Brokered loan expenses | | | 8,277 | | | 7,543 | | | 5,276 | | | 3,734 | | | 2,992 | |
| General and administrative expenses | | | 20,946 | | | 24,512 | | | 13,935 | | | 7,395 | | | 3,897 | |
| Total expenses | | | 51,648 | | | 63,034 | | | 36,329 | | | 20,376 | | | 12,677 | |
| (Loss)/income before income tax benefit | | | (23,525 | ) | | (13,889 | ) | | 3,688 | | | 13,726 | | | 3,750 | |
| Income tax benefit | | | 8,494 | | | 8,549 | | | 1,259 | | | — | | | — | |
| Net (loss)/income | | $ | (15,031 | ) | $ | (5,340 | ) | $ | 4,947 | | $ | 13,726 | | $ | 3,750 | |
| Basic (loss)/income per share | | $ | (0.83 | ) | $ | (0.30 | ) | $ | 0.28 | | | — | | | — | |
| Diluted (loss)/income per share | | $ | (0.83 | ) | $ | (0.30 | ) | $ | 0.27 | | | — | | | — | |
Balance Sheet Data: | | | | | | | | | | | | | | | | |
| Cash and cash equivalents | | $ | 969 | | $ | 9,056 | | $ | 7,613 | | $ | 4,047 | | $ | 2,746 | |
| Mortgage loans held in securitization trusts or held for investment | | | 588,160 | | | 780,670 | | | 190,153 | | | — | | | — | |
| Investment securities available for sale | | | 488,962 | | | 716,482 | | | 1,204,745 | | | — | | | — | |
| Mortgage loans held for sale | | | 106,900 | | | 108,271 | | | 85,385 | | | 36,169 | | | 34,039 | |
| Due from loan purchasers and escrow deposits pending loan closings | | | 88,351 | | | 123,247 | | | 96,140 | | | 58,862 | | | 40,621 | |
| Total assets | | | 1,322,908 | | | 1,791,293 | | | 1,614,762 | | | 110,081 | | | 83,004 | |
| Financing arrangements | | | 988,285 | | | 1,391,685 | | | 1,470,596 | | | 90,425 | | | 73,016 | |
| Collateralized debt obligations | | | 197,447 | | | 228,226 | | | — | | | — | | | — | |
| Subordinated debentures | | | 45,000 | | | 45,000 | | | — | | | — | | | — | |
| Subordinated notes due to members | | | — | | | — | | | — | | | 14,707 | | | — | |
| Total liabilities | | | 1,251,336 | | | 1,690,335 | | | 1,495,280 | | | 110,555 | | | 76,504 | |
| Equity/(deficit) | | $ | 71,572 | | $ | 100,958 | | $ | 119,482 | | $ | (474 | ) | $ | 6,500 | |
Investment Portfolio Data: | | | | | | | | | | | | | | | | |
| Average yield on investment portfolio | | | 5.10 | % | | 4.05 | % | | 3.90 | % | | — | | | — | |
| Net duration of interest earning assets to liabilities | | | 0.52 | yrs | | 0.91 | yrs | | 0.42 | yrs | | — | | | — | |
Originations Data: | | | | | | | | | | | | | | | | |
| Purchase originations | | $ | 1,483,966 | | $ | 1,985,651 | | $ | 1,089,499 | | $ | 803,446 | | $ | 469,404 | |
| Refinancing originations | | | 1,060,037 | | | 1,451,720 | | | 756,006 | | | 796,879 | | | 407,827 | |
| Total originations | | $ | 2,544,003 | | $ | 3,437,371 | | $ | 1,845,505 | | $ | 1,600,325 | | $ | 877,231 | |
| Fixed-rate originations | | $ | 1,441,782 | | $ | 1,562,151 | | $ | 878,749 | | $ | 890,172 | | $ | 518,382 | |
| Adjustable-rate originations | | | 1,102,221 | | | 1,875,220 | | | 966,756 | | | 710,153 | | | 358,849 | |
| Total originations | | $ | 2,544,003 | | $ | 3,437,371 | | $ | 1,845,505 | | $ | 1,600,325 | | $ | 877,231 | |
| Total mortgage sales | | $ | 1,841,012 | | $ | 2,875,288 | | $ | 1,435,340 | | $ | 1,234,848 | | $ | 633,223 | |
| Brokered originations | | | 702,991 | | | 562,083 | | | 410,165 | | | 365,477 | | | 244,008 | |
| Total originations | | $ | 2,544,003 | | $ | 3,437,371 | | $ | 1,845,505 | | $ | 1,600,325 | | $ | 877,231 | |
Originated Mortgage Loans Retained for Investment: | | | | | | | | | | | | | | | | |
| Par amount | | $ | 69.7 | | $ | 555.2 | | $ | 95.1 | | | n/a | | | n/a | |
| Weighted average middle credit score | | | 738 | | | 734 | | | 743 | | | n/a | | | n/a | |
| Weighted average LTV | | | 68.02 | % | | 69.62 | % | | 66.58 | % | | n/a | | | n/a | |
Mortgage Loans Sold: | | | | | | | | | | | | | | | | |
| Weighted average whole loan sales price over par - all mortgage loans sold | | | 1.45 | % | | 1.52 | % | | 2.02 | % | | 1.75 | % | | 1.52 | % |
| Weighted average middle credit score all mortgage loans sold | | | 707 | | | 696 | | | 703 | | | 719 | | | 716 | |
Weighted average LTV non-FHA(1) | | | 73.88 | % | | 74.58 | % | | 71.95 | % | | 68.47 | % | | 67.23 | % |
Weighted average LTV FHA(1) | | | 93.81 | % | | 92.76 | % | | 92.12 | % | | 88.82 | % | | 91.78 | % |
| Weighted average LTV all mortgage loans sold | | | 74.53 | % | | 76.65 | % | | 75.88 | % | | 68.67 | % | | 67.42 | % |
Operational/Performance Data: | | | | | | | | | | | | | | | | |
| Salaries, general and administrative expense as a percentage of total loans originated | | | 1.70 | % | | 1.61 | % | | 1.68 | % | | 1.04 | % | | 1.10 | % |
| Number of states licensed in or exempt from licensing at period end | | | 44 | | | 43 | | | 40 | | | 15 | | | 13 | |
| Number of locations at period end | | | 47 | | | 54 | | | 66 | | | 15 | | | 13 | |
| Number of employees at period end | | | 616 | | | 802 | | | 782 | | | 335 | | | 184 | |
| Dividends declared per common share | | $ | 0.47 | | $ | 0.92 | | $ | 0.40 | | | — | | | — | |
(1) | Beginning near the end of the first quarter of 2004, our volume of FHA loans increased; prior to such time the volume of FHA loan originations was immaterial. Generally, FHA loans have lower average balances and FICO scores which are reflected in the statistics above. All FHA loans are currently and will be in the future sold or brokered to third parties. |
Item 7. MANAGEMENT’S DISCUSSION AND ANALYSIS OF FINANCIAL CONDITION AND RESULTSOF OPERATIONS
General
New York Mortgage Trust, Inc., together with its consolidated subsidiaries (“NYMT,”NYMT”, the “Company,” “we,”“Company”, “we”, “our”, and “us”), is a self-advised real estate investment trust, or REIT, in the business of acquiring and managing primarily residential adjustable-rate, hybrid adjustable-rate and fixed-rate mortgage-backed securities (“RMBS”), for which the principal and interest payments are guaranteed by a U.S. Government agency, such as the Government National Mortgage Association (“Ginnie Mae”) or a U.S. Government-sponsored entity (“GSE” or “Agency”), such as the Federal National Mortgage Association (“Fannie Mae”) or the Federal Home Loan Mortgage Corporation (“Freddie Mac”), which we refer to collectively as “Agency RMBS,” RMBS backed by prime jumbo and Alternative A-paper (“Alt-A”) mortgage loans (“non-Agency RMBS”), and prime credit quality residential adjustable-rate mortgage (“ARM”) loans held in securitization trusts, or prime ARM loans. The remainder of our current investment portfolio is comprised of notes issued by a collateralized loan obligation (“CLO”). We also may opportunistically acquire and manage various other types of real estate-related and financial assets, including, among other things, certain non-rated residential mortgage finance company that acquires, retains and securitizes mortgageassets, commercial mortgage-backed securities (“CMBS”), commercial real estate loans and mortgage-backed securities. Until March 31, 2007, the Company through its wholly-owned subsidiary, its taxable REIT subsidiaryother similar investments. These assets, together with non-Agency RMBS and CLOs, typically present greater credit risk and less interest rate risk than our investments in Agency RMBS and prime ARM loans, and may also permit us to potentially utilize all or part of a significant net operating loss carry-forward held by Hypotheca Capital, LLC (“TRS”),HC,” then doing business as The New York Mortgage Company LLC (“NYMC”)LLC), our wholly-owned subsidiary and former mortgage lending business.
Our principal business objective is to generate net income for distribution to our stockholders resulting from the spread between the interest and other income we earn on our interest-earning assets and the interest expense we pay on the borrowings that we use to finance our leveraged assets and our operating costs, which we refer to as our net interest income. We intend to achieve this objective by investing in a broad class of real estate-related and financial assets, including those listed above, that in aggregate, will generate attractive risk-adjusted total returns for our stockholders.
Prior to 2009, our investment portfolio was primarily comprised of Agency RMBS, prime ARM loans held in securitization trusts and certain non-agency RMBS rated in the highest rating category by two rating agencies. The prime ARM loans in our portfolio were purchased from third parties or originated by us through HC and were subsequently securitized by us and are held in our four securitization trusts. Beginning in the first quarter of 2009, we commenced a residentialrepositioning of our investment portfolio to transition the portfolio from one primarily focused on leveraged Agency RMBS and prime ARM loans held in securitization trusts, which primarily involve interest rate risk, to a more diversified portfolio that includes elements of credit risk with reduced leverage. The repositioning included a reduction in the Agency RMBS held in our portfolio through the disposition of $193.8 million of GSE-issued collateralized mortgage banking company that originatedobligation floating rate securities, which we refer to as “Agency CMO floaters”, a wide rangenet increase of mortgage loans, withapproximately $27.5 million (par value) in our non-Agency RMBS position and our opportunistic purchase in March 2009 of discounted notes issued by a particular focus on prime adjustable- and fixed-rate, first lien, residential purchase mortgage loans. The discontinued operation also originated residential mortgage loansCLO.
We elected to be taxed as a brokerREIT for the purpose of obtaining broker fee income.federal income tax purposes commencing with our taxable year ended on December 31, 2004. As a result, we generally will not be subject to federal income tax on our taxable income that is distributed to our stockholders.
Factors that Affect our Results of Operations and Financial Condition
Our results of operations and financial condition are affected by various factors, including, among other things:
| · | changes in interest rates; |
| · | rates of prepayment, default and recovery on our assets or the mortgages or loans that underlie such assets; |
| · | general economic and financial and credit market conditions; |
| · | our leverage, our access to funding and our borrowing costs; |
| · | our hedging activities; |
| · | changes in the credit ratings of the loans, securities, and other assets we own; |
| · | the market value of our investments; |
| · | liabilities related to our discontinued operation, including repurchase obligations on the sales of mortgage loans; and |
| · | requirements to maintain REIT status and to qualify for an exemption from registration under the Investment Company Act. |
Recent Events - SaleWe earn income and generate cash through our investments. Our income is generated primarily from the net spread, which we refer to as net interest income, which is the difference between the interest income we earn on our investment portfolio and the cost of Mortgage Lending Businessour borrowings and Changehedging activities and other operating costs. Our net interest income will vary based upon, among other things, the difference between the interest rates earned on our interest-earning assets and the borrowing costs of the liabilities used to finance those investments, prepayment speeds and default and recovery rates on the assets or the loans underlying such assets. Because changes in Our Business Strategyinterest rates may significantly affect our activities, our operating results depend, in large part, upon our ability to manage interest rate risks and prepayment risks effectively while maintaining our status as a REIT.
On February 7, 2007, we announcedWe anticipate that, as a partfor any period during which changes in the interest rates earned on our assets do not coincide with interest rate changes on our borrowings, such assets will reprice more slowly than the corresponding liabilities. Consequently, changes in interest rates, particularly short-term interest rates, may significantly influence our net interest income. With the maturities of our previously announced explorationassets generally of strategic alternatives for the Company, we had entered into a definitive agreement to sell substantially all of the retail mortgage lending platform of NYMC to IndyMac Bank, F.S.B., (“Indymac”), a wholly owned subsidiary of Indymac Bancorp, Inc, for an estimated purchase price of $13.5 million in cash and the assumption of certainlonger duration than those of our liabilities, interest rate increases will tend to decrease the net interest income we derive from, and the market value of our interest rate sensitive assets (and therefore our book value), including Agency RMBS, prime ARM loans and certain non-Agency RMBS. Such rate increases could possibly result in operating losses or adversely affect our ability to make distributions to our stockholders.
The yield on our assets may be affected by Indymac. On March 31, 2007, Indymac purchased substantially alla difference between the actual prepayment rates and our projections. Prepayment rates, as reflected by the rate of the operating assets related to NYMC’s retail mortgage lending platform, including, among other things, assuming leases held by NYMC for approximately 20 full serviceprincipal paydown, and approximately 10 satellite retail mortgage lending offices (excluding the lease for the Company’s corporate headquarters, which is being assigned, as previously announced, under a separate agreement to Lehman Brothers Holding, Inc.), the tangible personal property located in those approximately 30 retail mortgage banking offices, NYMC’s pipeline of residential mortgage loan applications (the “Pipeline Loans”), escrowed deposits relatedinterest rates vary according to the Pipeline Loans, customer lists and intellectual property and information technology systems used by NYMCtype of investment, conditions in the conducteconomy and financial markets, competition and other factors, none of its retailwhich can be predicted with any certainty. To the extent we have acquired assets at a premium or discount to par, or face value, changes in prepayment rates may impact our anticipated yield. In periods of declining interest rates, prepayments on our mortgage banking platform. Indymac assumedrelated assets will likely increase. If we are unable to reinvest the obligationsproceeds of NYMC under the Pipeline Loans and substantially allsuch prepayments at comparable yields, our net interest income will be negatively impacted. The current climate of NYMC’s liabilities under the purchased contracts and purchased assets arising after the closing date. Indymac has also agreed to pay (i) the first $500,000 in severance expenses with respect to “transferred employees” (as definedgovernment intervention in the asset purchase agreement filed as Exhibit 10.62mortgage markets significantly increases the risk associated with prepayments.
While we historically have used, and intend to this Annual Report on Form 10-K) and (ii) severance expenses in excess of $1.1 million arising after the closing with respect to transferred employees. As part of the Indymac transaction, the Company has agreed, for a period of 18 months, not to compete with Indymac other thanuse in the purchase, sale, or retentionfuture, hedging to mitigate some of mortgage loans. Indymac has hired substantiallyour interest rate risk, we do not hedge all of our branch employeesexposure to changes in interest rates and loan officers andprepayment rates, as there are practical limitations on our ability to insulate our portfolio from all potential negative consequences associated with changes in short-term interest rates in a majority of NYMC employees based out of our corporate headquarters. As of April 1, 2007, the Company has approximately 40 employees.
On February 14, 2007, we entered into a definitive agreement with Tribeca Lending Corp., a subsidiary of Franklin Credit Management Corporation (“Tribeca Lending”) to sell our wholesale lending business for an estimated purchase price of $485,000. This transaction closed on February 22, 2007. Together, the closing of the sale of our retail mortgage banking platform to Indymac and the sale of our wholesale lending business to Tribeca Lending has resulted in gross proceeds to NYMT of approximately $14.0 million before fees and expenses, and before deduction of approximately $2.3 million, which will be held in escrow to support warranties and indemnifications provided to Indymac by NYMC as well as other purchase price adjustments. NYMC will record a one time taxable gain on the sale of these assets. NYMC’s deferred tax asset will absorb any taxable gain from the sale.
We expect to redeploy the net proceeds from the sale of our retail mortgage banking platform in high quality mortgage loan securities. We will liquidate the remaining inventory of loans held for sale in the ordinary course of business. Our Board of Directors, together with our management, will continue to consider strategic options for NYMT, including a possible sale or merger or raising capital under a passive REIT business model.
We believemanner that the disposition of our mortgage lending business will allow us to meetseek attractive net spreads on our assets.
In addition, our returns will be affected by the followingcredit performance of our non-agency RMBS and other investments. Our non-Agency RMBS and CLO investments expose us to credit risk; however, the credit support built into non-Agency RMBS deal structures is designed to provide a level of protection against potential credit losses. In addition, the discounted purchase prices paid for the non-Agency RMBS and CLO investments in our portfolio provide further insulation from credit losses in the event, as we expect, that we receive less than 100% of par value on such assets. Nevertheless, if credit losses on our investments, loans, or the loans underlying our investments exceed our expectations, it may have an adverse effect on our performance and our earnings.
As it relates to loans sold previously under certain loan sale agreements by our discontinued mortgage lending business, objectives:we may be required to repurchase some of those loans or indemnify the loan purchaser for damages caused by a breach of the loan sale agreement. While in the past we complied with the repurchase demands by repurchasing the loan with cash and reselling it at a loss, thus reducing our cash position. More recently, we have addressed these requests by negotiating a net cash settlement based on the actual or assumed loss on the loan in lieu of repurchasing the loans. As of December 31, 2009, the amount of repurchase requests outstanding was approximately $2.0 million, against which we had a reserve of approximately $0.3 million. We cannot assure you that we will be successful in settling the remaining repurchase demands on favorable terms, or at all. If we are unable to continue to resolve our current repurchase demands through negotiated net cash settlements, our liquidity could be adversely affected.
· | reduce, and ultimately eliminate, our taxable REIT subsidiary’s operating loses; |
For more information regarding the factors and risks that affect our operations and performance, see “Item 1A. Risk Factors” above and “Item 7A. Quantitative and Qualitative Disclosures About Market Risk” below.
· | enable NYMC to retain the economic value of its accumulated net operating losses; |
Current Market Conditions and Known Material Trends
· | increase NYMT’s investable capital and financial flexibility; |
In recent years, the residential housing and mortgage and credit and financial markets in the United States and globally have experienced a variety of difficulties and changed economic conditions, including loan defaults, credit losses and decreased liquidity. These conditions, together with liquidating sales by several large institutions, have resulted in volatility in the value of most real estate-related and financial assets, including many of the assets in our portfolio, and reduced available financing for certain assets. In response to these conditions, the U.S. Government, Federal Reserve, U.S. Treasury, FDIC and other governmental and regulatory bodies have taken or are considering taking other actions in an effort to stabilize the credit and financial markets and stimulate the economy. These actions include, among other things, the conservatorship of Fannie Mae and Freddie Mac, EESA, TARP, the CPP, TALF, ARRA and the Homeowner Affordability and Stability Plan, or HASP. Although the impact from many of these actions remains uncertain, certain sectors have reported signs of stabilizing recently, including the Agency RMBS market.
· | lower NYMT’s executive management compensation expenses; |
Developments at Fannie Mae and Freddie Mac. Payments on the Agency RMBS in which we invest are guaranteed by Fannie Mae and Freddie Mac. Because of the guarantee and the underwriting standards associated with mortgages underlying Agency RMBS, they have historically had high price stability and been considered to present low credit risk. However, the recent turmoil in the residential mortgage sector severely weakened the financial condition of Fannie Mae and Freddie Mac. As a result, Agency RMBS experienced increased price volatility. In response to the severely weakened financial condition of Fannie Mae and Freddie Mac and the corresponding impact that this weakened condition was having on the U.S. mortgage, credit and financial markets, in 2008 the U.S. Government placed Fannie Mae and Freddie Mac under federal conservatorship. In connection with the placement of Fannie Mae and Freddie Mac in conservatorship, the U.S. Treasury agreed to provide certain financial support to these entities, including a larger-scale Agency RMBS purchasing program that is scheduled to terminate during the 2010 first quarter. We expect that the U.S. Government’s conservatorship of Fannie Mae and Freddie Mac will allow these institutions to continue to issue Agency RMBS. However, no assurance can be given that the conservatorship of Fannie Mae and Freddie Mac will continue to have a positive effect on the supply of Agency RMBS. For example, at a hearing on January 22, 2010, the Chairman of the House Financial Services Committee stated that the committee will be recommending to the U.S. Congress to abolish Fannie Mae and Freddie Mac in favor of a new system of providing housing finance.
· | significantly reduce our potential severance obligations; |
Prior to December 2009, the financing arrangement between the U.S. Treasury and Fannie Mae and Freddie Mac required these entities to cap their Agency RMBS portfolio at $900 billion each and then begin reducing their portfolio of Agency RMBS by 10% per year beginning in 2010. In December 2009, the U.S. Treasury loosened this requirement by allowing the portfolio reduction requirements to be applied to the maximum allowable size of the portfolios, rather than the actual size of the portfolios. Also, the U.S. Treasury originally was going to require Fannie Mae and Freddie Mac to pay a quarterly commitment fee to the U.S. Treasury beginning on March 31, 2010. The U.S. Treasury subsequently postponed that start date to December 31, 2010. The change to Fannie Mae and Freddie Macs portfolio reduction requirements could extend the time period by which these entities sell portions of their Agency RMBS portfolios in the market, which, in turn, could cause the supply of Agency RMBS to be smaller than we originally anticipated.More recently, in February of this year, Fannie Mae and Freddie Mac announced that the GSEs will be purchasing delinquent loans from mortgage pools guaranteed by them. Delinquent loans for this program will be those that are 120 days or greater delinquent as of measurement date. Freddie Mac stated that it will be consummating all of its purchases at once, based on the delinquencies as of February 2010, with payments to securities holders on March 15th and April 15th. On March 1, 2010, Fannie Mae reported that it would buy approximately $127 billion of loans out of guaranteed RMBS pools beginning in March and running through about June of this year. These actions could decrease the net income derived from our Agency RMBS.
Mortgage asset values. During 2009, the market value of the Agency RMBS in our portfolio was positively impacted by the Federal Reserve’s program to purchase $1.25 trillion of Agency MBS. This purchase program implemented by the Federal Reserve increased market prices of Agency RMBS during 2009, thereby reducing their market yield. As a result, we did not acquire any Agency RMBS during 2009, and instead opportunistically disposed of the Agency CMO floaters in our portfolio. The Federal Reserve has indicated it will complete its planned purchases of Agency RMBS by the end of the 2010 first quarter. If no further action is taken by the Federal Reserve, the market value of Agency RMBS may decline, which among other things, could cause the market value of our Agency RMBS to decline.
Market demand for non-Agency RMBS increased over the course of 2009 due to increased demand and the reduced market yields for Agency RMBS. Accordingly, while non-Agency RMBS remain available at a discount, such discounts have narrowed relative to discounts available in early 2009 and late 2008 and may continue to narrow in the future, reducing the market yields on these assets. Nevertheless, we believe that despite higher market prices and lower yields, that risk-adjusted returns on non-Agency RMBS continue to represent attractive investment opportunities.
Credit Quality. The deterioration of the U.S. housing market as well as the recent economic downturn have caused U.S. residential mortgage delinquency rates to remain at high levels for various types of mortgage loans. Recent months have seen some stabilization or improvement of certain measures of credit quality, although this stabilization and/or improvement may ultimately prove to be temporary
Financing markets and liquidity. Actions by the Federal Reserve and the U.S. Treasury over the past two years appear to have stabilized the financing and liquidity environment for Agency RMBS. The liquidity facilities created by the Federal Reserve during 2007 and 2008 and its lowering of the Federal Funds Target Rate to 0 – 0.25%, along with the reduction of the 30-day LIBOR to 0.23% as of December 31, 2009, have lowered our financing costs (which most closely correlates with the 30-day LIBOR) and stabilized the availability of repurchase agreement financing for Agency RMBS. Moreover, collateral requirements improved throughout 2009. However, available leverage for non-Agency RMBS and other financial assets has remained scarce during 2009 due to the recent conditions in the housing and credit markets. More recently, some investment banks have, to a limited extent, begun making term financing available for non-Agency RMBS. As of the date of this report, our investment in Agency RMBS and a CLO remained unlevered; however, should the prospects for stable, reliable and favorable repurchase agreement financing for non-Agency RMBS develop in the future, we would expect to increase our repurchase agreement borrowings collateralized by non-Agency RMBS.
In addition to a stabilizing financing environment for Agency RMBS, collateral requirements improved throughout 2009. With respect to interest rates, because of continued uncertainty in the credit markets and difficult U.S. economic conditions, we expect that interest rates are likely to remain at these historically low levels until such time as the economic data begin to confirm a sustainable improvement in the overall economy.
Prepayment rates. As a result of various government initiatives, including HASP and the reduction in intermediate and longer-term treasury yields, rates on conforming mortgages have declined, nearing historical lows during 2009. Hybrid and adjustable-rate mortgage originations have declined substantially, as rates on these types of mortgages are comparable with rates available on 30-year fixed-rate mortgages. We experienced similar prepayment rates on both our Agency RMBS and prime ARM loans during the second, third and fourth quarters of 2009. We expect speeds to be higher in the first half of 2010 due to the announced delinquent loan buyback program from Fannie Mae. We do not expect this will have a material impact on the Company.
· | enable our management to focus on our mortgage portfolio management operations, which consisted of a $1.1 billion portfolio of investment securities as of December 31, 2006; and |
· | enable us to continue to acquire loans for securitization. |
Note Regarding Discontinued Operation
In connection with the sale of our wholesale mortgage lending platform assets on February 22, 2007 and the sale of our retail mortgage lending platform assets to Indymac on March 31,in the first quarter of 2007, during the fourth quarter of 2006, we classified our Mortgage Lending segmentmortgage lending business as a discontinued operation in accordance with the provisions of Statement of Financial Accounting Standards No. 144.operation. As a result, we have reported revenues and expenses related to the segmentmortgage lending business as a discontinued operation and the related assets and liabilities as assets and liabilities related to a discontinued operation for all periods presented in the accompanying consolidated financial statements. Certain assets, such as the deferred tax asset, and certain liabilities, such as subordinated debt and liabilities related to leased facilities not assigned to Indymac will becomeare part of theour ongoing operations of NYMT and accordingly, we have not classified as a discontinued operation in accordance with the provisions of Statement of Financial Accounting Standards No. 144.operation. See note 128 in the notes to our consolidated financial statements.
Strategic OverviewUntil March 31, 2007, our discontinued mortgage lending operation contributed to our then current period financial results. Subsequent to March 31, 2007, our discontinued mortgage lending operation has impacted our financial results due to liabilities remaining after the sale of the operation’s assets. As of December 31, 2009 discontinued operations consist of $4.2 million in assets and $1.8 million in liabilities, down from $5.9 million in assets and $3.6 million in liabilities at December 31, 2008.
Our operations were conducted in 2006 such that we are considered an “active” mortgage REIT in that NYMC, our TRS, originated loans that may either be held in portfolio, aggregated and subsequently securitized for long-term investment, or soldPrior to third parties for gain on sale revenue. The leveraged portfolio is comprised largely of prime adjustable-rate mortgage loans that we either originate or acquire from third parties. Starting in March of 2006, we began to sell all loans originated by NYMC in an effort to increase gain on sale income in current periods. On March 31, 2007, we concluded theoriginated a wide range of residential mortgage loan products including prime, alternative-A, and to a lesser extent sub-prime loans, home equity lines of credit, second mortgages, and bridge loans. We originated $0.4 billion in mortgage loans during three months ended March 31, 2007. Our sale of substantialy all of the operating assets of NYMC's retail mortgage lending platform and exitedassets on March 31, 2007 marked our exit from the mortgage lending business.
We aggregate a portfolio comprised mainly of high credit quality, adjustable-rate mortgage loans until the portfolio reaches a size sufficient for us to securitize such loans. Historically, we obtained the loans we securitize from either our TRS or from third parties. As of April 1, 2007, we obtain the loans we securitize exclusively from third parties. Our first securitization occurred on February 25, 2005 and we completed our second and third loan securitizations on July 28, 2005 and December 20, 2005, respectively. These securitization transactions, through which we financed the adjustable-rate and hybrid mortgage loans that we retained, were structured as financings for both tax and financial accounting purposes. Therefore, we do not expect to generate a gain or loss on sales from these activities, and, following the securitizations, the loans are classified on our consolidated balance sheet as loans held in securitization trusts. For our first two securitizations, we retained all of the resultant securities and financed such securities with repurchase agreements; for our third securitization we issued investment grade securities to third parties and recorded the securitization debt is recorded as a liability. On March 30, 2006 we completed our fourth securitization, New York Mortgage Trust 2006-1. This securitization was structured as a sale for accounting purposes. The Company holds certain AAA tranches as well as all the subordinate interests in this transaction.
We earn net interest income from purchased residential mortgage-backed securities and adjustable-rate mortgage loans and securitized loans. We have acquired and increasingly seek to acquire additional assets that will produce competitive returns, taking into consideration the amount and nature of the anticipated returns from the investment, our ability to pledge the investment for secured, collateralized borrowings and the costs associated with originating, financing, managing, securitizing and reserving for these investments.
Funding Diversification. We strive to maintain and achieve a balanced and diverse funding mix to finance our investment portfolio and assets. Until March 31, 2007 when we exited the mortgage lending business, we relied primarily on secured warehouse lines of credit for our funding needs on loans held for sale to third parties. Since our IPO in June 2004, we rely primarily on repurchase agreements in order to finance our investment portfolio of residential loans and mortgage-backed securities. As of December 31, 2006,2009, the Company had $4.2 million in assets related to discontinued operations, including $3.8 million in loans held for sale. The discontinued operations had net income of $0.8 million for the year ended December 31, 2009. The Company continues to wind down the discontinued operations and anticipates to be substantially complete by the end of 2010.
Balance Sheet Analysis
Investment Securities - Available for Sale. At December 31, 2009 our securities portfolio consists of Agency RMBS, Non-agency RMBS, originally rated AAA and Collateralized Loan Obligations. At December 31, 2009, we have $5.1 billionhad no investment securities in a single issuer or entity, other than Fannie Mae, that had an aggregate book value in excess of commitments to provide repurchase agreement financing through 23 different counterparties with approximately $0.8 billion outstanding10% of our total assets. The following tables set forth the credit characteristics of our investment securities available for sale as of December 31, 2006. During 2005, we further diversified2009 and December 31, 2008:
Credit Characteristics of Our Investment Securities (dollar amounts in thousands):
| December 31, 2009 | | Sponsor or Rating (1) | | Par Value | | Carrying Value | | % of Portfolio | | | Coupon | | | Yield | |
| Credit | | | | | | | | | | | | | | | |
| Agency RMBS | | FNMA | | $ | 110,324 | | $ | 116,226 | | 65.8 | % | | 5.14 | % | | 2.37 | % |
| Non-Agency RMBS | | AAA | | | 2,195 | | | 1,717 | | 1.0 | % | | 4.97 | % | | 11.26 | % |
| | | AA | | | 1,270 | | | 886 | | 0.5 | % | | 5.18 | % | | 15.03 | % |
| | | A | | | 364 | | | 321 | | 0.2 | % | | 4.43 | % | | 4.92 | % |
| | | BB | | | 13,384 | | | 11,336 | | 6.3 | % | | 1.65 | % | | 12.79 | % |
| | | B | | | 11,743 | | | 8,812 | | 5.0 | % | | 4.03 | % | | 9.57 | % |
| | | CCC or Below | | | 28,028 | | | 19,794 | | 11.2 | % | | 5.13 | % | | 7.49 | % |
| Collateralized Loan Obligation | | BBB | | | 10,400 | | | 5,408 | | 3.1 | % | | 1.37 | % | | 15.20 | % |
| | | BB | | | 15,300 | | | 5,508 | | 3.1 | % | | 2.67 | % | | 23.45 | % |
| | | B | | | 20,250 | | | 6,683 | | 3.8 | % | | 5.27 | % | | 30.22 | % |
| Total/Weighted Average | | | | $ | 213,258 | | $ | 176,691 | | 100.0 | % | | 4.51 | % | | 6.23 | % |
(1) – Ratings based on S&P categories, however securities may have been rated by either Fitch or Moody’s.
| December 31, 2008 | | Sponsor or Rating (1) | | Par Value | | Carrying Value | | % of Portfolio | | | Coupon | | | Yield | |
| Credit | | | | | | | | | | | | | | | |
| Agency RMBS | | FNMA/FHLMC | | $ | 455,447 | | $ | 455,871 | | 95 | % | | 3.67 | % | | 5.99 | % |
| Non-Agency RMBS | | AAA | | | 23,289 | | | 18,118 | | 4 | % | | 1.27 | % | | 15.85 | % |
| | | AA | | | 609 | | | 530 | | 0 | % | | 1.22 | % | | 4.32 | % |
| | | A | | | 3,648 | | | 2,828 | | 1 | % | | 2.30 | % | | 4.08 | % |
| | | CCC or Below | | | 2,058 | | | 69 | | 0 | % | | 5.67 | % | | 20.33 | % |
| | | Not Rated | | | 405 | | | — | | 0 | % | | 5.67 | % | | 0 | % |
| Total/Weighted Average | | | | $ | 485,456 | | $ | 477,416 | | 100 | % | | 3.55 | % | | 6.51 | % |
(1) – Ratings based on S&P categories, however securities may have been rated by either Fitch or Moody’s.
The following table sets forth the stated reset periods and weighted average yields of our sources of financing with the issuance of $45 million of trust preferredinvestment securities classified as subordinated debentures.available for sale at December 31, 2009 and December 31, 2008 (dollar amounts in thousands):
| | | Less than 6 Months | | | More than 6 Months To 24 Months | | | More than 24 Months To 60 Months | | | Total | |
| December 31, 2009 | | Carrying Value | | | Weighted Average Yield | | | Carrying Value | | | Weighted Average Yield | | | Carrying Value | | | Weighted Average Yield | | | Carrying Value | | | Weighted Average Yield | |
| Agency RMBS | | $ | — | | | | — | % | | $ | 42,893 | | | | 2.07 | % | | $ | 73,333 | | | | 2.54 | % | | $ | 116,226 | | | | 2.37 | % |
| Non-Agency RMBS | | | 22,065 | | | | 10.15 | % | | | 4,865 | | | | 7.23 | % | | | 15,936 | | | | 9.57 | % | | | 42,866 | | | | 9.61 | % |
| Collateralized Loan Obligation | | | 17,599 | | | | 23.48 | % | | | — | | | | — | % | | | — | | | | — | % | | | 17,599 | | | | 23.48 | % |
| | | | | | | | | | | | | | | | | | | | | | | | | | | | | | | | | |
| Total/Weighted Average | | $ | 39,664 | | | | 16.07 | % | | $ | 47,758 | | | | 2.60 | % | | $ | 89,269 | | | | 3.80 | % | | $ | 176,691 | | | | 6.23 | % |
| | Less than 6 Months | | More than 6 Months To 24 Months | | More than 24 Months To 60 Months | | Total | |
| December 31, 2008 | Carrying Value | | | Weighted Average Yield | | Carrying Value | | | Weighted Average Yield | | Carrying Value | | | Weighted Average Yield | | Carrying Value | | | Weighted Average Yield | |
| Agency RMBS | | $ | 197,675 | | | | 8.54 | % | | $ | 66,910 | | | | 3.69 | % | | $ | 191,286 | | | | 4.02 | % | | $ | 455,871 | | | | 5.99 | % |
| Non-Agency RMBS | | | 21,476 | | | | 14.11 | % | | | — | | | | — | % | | | 69 | | | | 16.99 | % | | | 21,545 | | | | 14.35 | % |
| Total/Weighted Average | | $ | 219,151 | | | | 9.21 | % | | $ | 66,910 | | | | 3.69 | % | | $ | 191,355 | | | | 4.19 | % | | $ | 477,416 | | | | 6.51 | % |
Performance characteristics of non-Agency RMBS
The following table details performance characteristics of our non-Agency RMBS portfolio as of December 31, 2009 (amounts in thousands):
| | | Acquired in 2009 | | | Acquired prior to 2009 | |
| Current Par Value | | $ | 38,682 | | | $ | 18,302 | |
| Collateral Type: | | | | | | | | |
| Fixed Rate | | $ | 3,738 | | | $ | 17,693 | |
| Arms | | $ | 34,944 | | | $ | 609 | |
| Weighted average Purchase Price | | | 60.51 | % | | | 92.05 | % |
| Weighted average Credit Support | | | 8.76 | % | | | 4.06 | % |
| Weighted average 60++ Delinquencies (including 60+, REO and Foreclosure) | | | 20.61 | % | | | 3.66 | % |
| Weighted average 3 month Constant Prepayment Rate | | | 16.24 | % | | | 17.46 | % |
| Weighted average 3 month Voluntary Prepayment Rate | | | 9.78 | % | | | 15.84 | % |
Detailed composition of loans securitizing our collateralized loan obligations
The following tables summarize the loans securitizing our CLOs grouped by range of outstanding balance, industry and Moody’s Investors Services, Inc's (“Moody’s”) rating category as of December 31, 2009.
| | As of December 31, 2009 (amounts in thousands) | |
| Range of Outstanding Balance | Number of Loans | | Maturity Date | | Total Principal | |
| | | | | | | | | |
| $0 - $500,000 | | 7 | | 03/2014 - 03/2017 | | $ | 3,471 | |
| $500,001 - $2,000,000 | | 18 | | 12/2011 - 12/2015 | | | 24,722 | |
| $2,000,001 - $5,000,000 | | 55 | | 5/2011 - 2/2016 | | | 198,895 | |
| $5,000,001 - $10,000,000 | | 28 | | 11/2010 - 10/2014 | | | 202,080 | |
| +$10,000,000 | | 3 | | 12/2009 - 10/2012 | | | 32,292 | |
| Total | | 111 | | | | $ | 461,460 | |
On our first two securitizations (collateralized debt obligations, or ”CDO”) of mortgage loans, we retained 100% of the issued securities and financed such securities with repurchase agreements. The creation of mortgage-backed securities from self-originated mortgage loans in this manner provides an asset with better liquidity and longer-term financing at better rates as opposed to financing whole loans through warehouse lines. In December, 2005 we completed our third securitization of $235.0 million of self-originated ARM loans and sold the majority of the securities to third parties. Because we did not retain all of the resultant securities as in prior CDOs, this securitization eliminated the risk of short-term financing and the mark-to-market pricing risk inherent in financing through repurchase agreements or warehouse lines of credit; as a result of this permanent financing we are not subject to margin calls on the assets of this CDO.| | | As of December 31, 2009 | |
| Industry | | Number of Loans | | | Outstanding Balance | | | % of Outstanding Balance | |
| | | | | | | (amounts in thousands) | | | | | |
| Healthcare, Education & Childcare | | | 14 | | | $ | 57,190 | | | | 12.4 | % |
| Diversified/Conglomerate Service | | | 6 | | | | 42,348 | | | | 9.2 | % |
| Personal, Food & Misc Services | | | 6 | | | | 38,638 | | | | 8.4 | % |
| Electronics | | | 7 | | | | 26,532 | | | | 5.7 | % |
| Printing & Publishing | | | 4 | | | | 23,990 | | | | 5.2 | % |
| Telecommunications | | | 6 | | | | 23,098 | | | | 5.0 | % |
| Insurance / Finance | | | 5 | | | | 22,915 | | | | 5.0 | % |
| Utilities / Oil & Gas | | | 6 | | | | 21,782 | | | | 4.7 | % |
| Personal & Non-Durable Consumer Products | | | 6 | | | | 21,298 | | | | 4.6 | % |
| Retail Store | | | 6 | | | | 21,211 | | | | 4.6 | % |
| Aerospace & Defense | | | 6 | | | | 20,462 | | | | 4.4 | % |
| Cargo Transport / Personal Transportation | | | 3 | | | | 19,499 | | | | 4.2 | % |
| Chemicals, Plastics and Rubber | | | 6 | | | | 18,532 | | | | 4.0 | % |
| Hotels, Motels, Inns and Gaming | | | 4 | | | | 18,183 | | | | 3.9 | % |
| Broadcasting & Entertainment | | | 3 | | | | 16,496 | | | | 3.6 | % |
| Beverage, Food & Tobacco | | | 6 | | | | 15,880 | | | | 3.4 | % |
| Leisure, Amusement, Motion Pictures & Entertainment | | | 4 | | | | 11,146 | | | | 2.4 | % |
| Other | | | 13 | | | | 42,260 | | | | 9.3 | % |
| Total | | | 111 | | | $ | 461,460 | | | | 100.0 | % |
Risk Management. As a manager of mortgage loan investments, we must mitigate key risks inherent in these businesses, principally credit risk and interest rate risk.| | | As of December 31, 2009 | |
| Moody's Rating Category | | Number of Loans | | | Outstanding Balance | | | % of Outstanding Balance | |
| | | | | | | (amounts in thousands) | | | | | |
| Baa3 | | | 2 | | | $ | 6,955 | | | | 1.5 | % |
| Ba1 | | | 9 | | | | 28,242 | | | | 6.1 | % |
| Ba2 | | | 9 | | | | 26,418 | | | | 5.7 | % |
| Ba3 | | | 15 | | | | 44,374 | | | | 9.6 | % |
| B1 | | | 17 | | | | 51,355 | | | | 11.1 | % |
| B2 | | | 28 | | | | 106,325 | | | | 23.0 | % |
| B3 | | | 21 | | | | 137,531 | | | | 29.8 | % |
| Caa1 | | | 5 | | | | 23,850 | | | | 5.2 | % |
| Caa2 | | | 3 | | | | 26,311 | | | | 5.7 | % |
| Caa3 | | | 1 | | | | 540 | | | | 0.1 | % |
| D | | | 1 | | | | 9,559 | | | | 2.2 | % |
| Total | | | 111 | | | $ | 461,460 | | | | 100.0 | % |
Investment Portfolio Credit Quality.We retain in our portfolio only selected, high-quality loans that we originated or may acquire from third parties. As a result, our investment portfolio consists of high-quality loans that we have either securitized for our own portfolio or that collateralize our CDO financings. High credit quality creates improved portfolio liquidity and provides for financing opportunities that are available on generally favorable terms. When we retain loans for investment, either whole loans being aggregated for securitization or CDOs in which we retain all resultant securities or below A-rated tranches, we retain the risk of potential credit losses relative to the agency or higher rated securities we may purchase from time-to-time. Since we began our portfolio investment operations, we have experienced approximately $57,000 to date of credit losses in our portfolio.
We believe that our credit performance is reflective of the high credit quality of the loans we originated or acquire for securitization, our prudent in-house underwriting, property valuation methods and review, our overall investment policies and prudent management of our delinquent loan portfolio. We believe that our delinquencies of $6.8 million, or 1.16% of the total par balance of our investment portfolio of residential loans at December 31, 2006, reflect strong credit characteristics and the credit culture of our underwriting and investment philosophy. The weighted average seasoning of loans in our investment portfolio of mortgage loans was approximately 19 months at December 31, 2006.
Interest Rate Risk Management. Another primary risk to our investment portfolio of mortgage loans and mortgage-backed securities is interest rate risk. We use hedging instruments to fix or cap the interest rates on our short-term, CDO and other financing arrangements that finance our investment portfolio of mortgage loans and securities. We hedge our financing costs in an attempt to maintain a net duration gap of less than one year; as of December 31, 2006, our net duration gap was approximately 6 months.
As we acquire mortgage-backed securities or loans, we seek to hedge interest rate risk in order to stabilize net asset values and earnings during periods of rising interest rates. To do so, we use hedging instruments in conjunction with our borrowings to approximate the repricing characteristics of such assets. The Company utilizes a model based risk analysis system to assist in projecting portfolio performances over a scenario of different interest rates and market stresses. The model incorporates shifts in interest rates, changes in prepayments and other factors impacting the valuations of our financial securities, including mortgage-backed securities, repurchase agreements, interest rate swaps and interest rate caps. However, given the prepayment uncertainties on our mortgage assets, it is not possible to definitively lock-in a spread between the earnings yield on our investment portfolio and the related cost of borrowings. Nonetheless, through active management and the use of evaluative stress scenarios of the portfolio, we believe that we can mitigate a significant amount of both value and earnings volatility. See further discussion of interest rate risk at the “Quantitative And Qualitative Disclosures About Market Risk - Interest Rate Risk” section of this document.
Other Risk Considerations: Our business is affected by a variety of economic and industry factors. Management periodically reviews and assesses these factors and their potential impact on our business. The most significant risk factors management considers while managing the business and which could have a material adverse effect on our financial condition and results of operations are
· | a decline in the market value of our assets due to rising interest rates; |
· | increasing or decreasing levels of prepayments on the mortgages underlying our mortgage-backed securities; |
· | our ability to obtain financing to hold mortgage loans prior to their sale or securitization; |
· | the overall leverage of our portfolio and the ability to obtain financing to leverage our equity; |
· | the potential for increased borrowing costs and its impact on net income; |
· | the concentration of our mortgage loans in specific geographic regions; |
· | our ability to use hedging instruments to mitigate our interest rate and prepayment risks; |
· | a prolonged economic slow down, a lengthy or severe recession or declining real estate values could harm our operations; |
· | if our assets are insufficient to meet the collateral requirements of our lenders, we might be compelled to liquidate particular assets at inopportune times and at disadvantageous prices; |
· | if we are disqualified as a REIT, we will be subject to tax as a regular corporation and face substantial tax liability; and |
· | compliance with REIT requirements might cause us to forgo otherwise attractive opportunities. |
Financial Overview
RevenuesPrepayment Experience. Our primary sources of income are net interest incomeThe constant prepayment rate (“CPR”) on our loans and residentialoverall portfolio averaged approximately 19% during 2009 as compared to 12% during 2008. CPRs on our purchased portfolio of investment securities and gainaveraged approximately 18% while the CPRs on saleloans held in our securitization trusts averaged approximately 19% during 2009. When prepayment expectations over the remaining life of mortgage loans. Net interest income is the difference between interest income, which is the income thatassets increase, we earnhave to amortize premiums over a shorter time period resulting in a reduced yield to maturity on our loansinvestment assets. Conversely, if prepayment expectations decrease, the premium would be amortized over a longer period resulting in a higher yield to maturity. We monitor our prepayment experience on a monthly basis and residential investment securities and interest expense, which isadjust the interest we pay on borrowings and subordinated debt. Net interest income is also earned on the banked loan origination production of our TRS for the period of time from when a loan is closedamortization rate to the sale of such loan to a third party.reflect current market conditions.
Income from the gain on sale of mortgage loans to third parties is the difference between the sales price and the adjusted cost basis of originated loans when title transfers. The adjusted cost basis of the loans includes the original principal amount adjusted for deferrals of origination and commitment fees received, net of direct loan origination costs (including commissions and salaries for employees directly responsible for such originations) paid.
Other Income (Expense). Loan losses include reserves for, or actual costs incurred with respect to, the disposition of non-performing or early payment default loans we have originated or purchased from third parties.
Other significant sources of other income (expense) include fees received on brokered loans and income from the sale of securities and related hedges.
Expenses. Non-interest expenses we incur in operating our business consist primarily of salary and employee benefits, brokered loan expenses, occupancy and equipment expenses, marketing and promotion expenses, and other general and administrative expenses.
Salary and employee benefits consist primarily of the salaries and wages paid to our employees (exclusive of salaries and wages allocated to net gain on sale of mortgage loans), payroll taxes and expenses for health insurance, retirement plans and other employee benefits.
Brokered loan expenses are primarily direct commissions and other costs associated with brokered loans when such loans are closed with the borrower. Costs associated with brokered loans are expensed when incurred.
Occupancy and equipment expenses, which are the fixed and variable costs of buildings and equipment, consist of building lease expenses, furniture and equipment expenses, maintenance, real estate taxes and other associated costs of occupancy.
Marketing and promotion expenses include the cost of print, radio and internet advertisements, promotions, third-party marketing services, public relations and sponsorships.
Other general and administrative expenses include expenses for professional fees, office supplies, postage and shipping, telephone, insurance, travel and entertainment and other miscellaneous operating expenses.
Many of our expenses are variable in nature and are relative to our loan origination production volumes. Variable expenses include commissions on loan originations, brokered loan costs and, to a lesser degree, office supplies, marketing and promotion and other miscellaneous expenses. Fixed expenses are primarily occupancy and equipment lease expenses and data processing and communications expenses.
Loss from discontinued operation: Loss from discontinued operation includes all revenues and expenses related to our mortgage lending segment excluding those costs that will be retained by the ongoing Company. Primarily, expenses related rent expense for locations not being purchased and certain allocated payroll expenses for employees remaining with the Company.
Description of Business
Mortgage Lending (Discontinued Operation)
Until March 31, 2007, our mortgage lending operation contributed to our financial results as it either produced the loans that ultimately collateralized the mortgage securities that we hold in our portfolio or it provided us the flexibility to sell the loans for gain on sale revenue. We primarily originated prime, first-lien, residential mortgage loans and, to a lesser extent, second lien mortgage loans, home equity lines of credit, and bridge loans. We originated a wide range of mortgage loan products including adjustable-rate mortgage (“ARM”) loans which may have an initial fixed rate period, and fixed-rate mortgages. Historically, we sold or retained and aggregated our self-originated, high-quality, shorter-term ARM loans in order to pool them into mortgage securities. Due to market conditions, starting in March, 2006, NYMC increased the number of loans originated by it that it would sell to third parties for gain on sale revenue rather than aggregating lower cost assets. For the years ended December 31, 2006 and 2005, we originated $2.5 billion and $2.9 billion in mortgage loans for sale to third parties, respectively. We recognized gains on sales of mortgage loans totaling $18.0 million and $26.8 million for the years ended December 31, 2006 and 2005, respectively.
Subsequent to our IPO in June 2004, we have sold or retained for our portfolio the high quality, adjustable-rate mortgage loans that we originated. For the years ended December 31, 2006 and 2005, we originated and retained $69.7 million and $555.2 million of such loans, respectively. When we retain mortgage loans that we originated, we record such assets at historical cost in accordance with GAAP (“GAAP” means generally accepted accounting principles). The cost of each loan is then amortized on the effective interest method over the estimated lives of the retained loans. Furthermore, when we retain loans that we originated, we are not able to recognize a gain on sale of these loans (and thus higher GAAP net income) as we would have if such loans were sold to third parties. Instead, the value of the gain on sale revenue inures to the benefit of our investment portfolio in the form of a lower cost asset and thus incrementally higher yield during the lives of retained loans. We estimate that the foregone premium we would have otherwise received had retained loans been sold to third parties is approximately $0.4 million and $7.5 million for the years ended December 31, 2006 and 2005, respectively. On March 31, 2007, the Company sold substantially all of the operating assets of the mortgage lending business to Indymac and exited the mortgage lending business.
Our wholesale lending strategy has been a small component of our loan origination operations. We have a network of non-affiliated wholesale loan brokers and mortgage lenders who submit loans to us. We maintain relationships with these wholesale brokers and, as with retail loan originations, will underwrite, process, and fund wholesale loans through our centralized facilities and processing systems. On February 22, 2007, we sold all of the assets of our wholesale operations to Tribeca Lending. We also sold broker loans to third party mortgage lenders for which we receive a broker fee. For the years ended December 31, 2006 and 2005, we originated $703.0 million and $562.1 million in brokered loans, respectively. We recognized net brokering income totaling $2.7 million and $2.4 million during the years ended December 31, 2006 and 2005, respectively.
A significant risk to our mortgage lending operations is liquidity risk - the risk that we will not have financing facilities and cash available to fund and hold loans prior to their sale or securitization. We maintain lending facilities with large banking and investment institutions to reduce this risk. On a short-term basis, we finance mortgage loans using warehouse lines of credit and repurchase agreements. Details regarding available financing arrangements and amounts outstanding under those arrangements are included in “Liquidity and Capital Resources” below.
Mortgage Portfolio Management
Prior to the completion of our IPO on June 29, 2004, our operations were limited to the mortgage operations described in the preceding section. Beginning in July 2004, we began to implement our business plan of investing in high-quality, adjustable rate mortgage related securities and residential loans. Our mortgage portfolio, consisting primarily of residential mortgage-backed securities and mortgage loans held for investment, currently generates a substantial portion of our earnings. In managing our investment in a mortgage portfolio, we:
· | invest in mortgage-backed securities originated by others, including ARM securities and collateralized mortgage obligation floaters (“CMO Floaters”); |
· | generally operate as a long-term portfolio investor; |
· | finance our portfolio by entering into repurchase agreements, warehouse facilities for loan aggregation or issue collateral debt obligations relating to our securitizations; and |
· | generate earnings from the return on our mortgage securities and spread income from our mortgage loan portfolio. |
A significant risk to our operations, relating to our portfolio management, is the risk that interest rates on our assets will not adjust at the same times or amounts that rates on our liabilities adjust. Even though we retain and invest in ARMs, many of the hybrid ARM loans in our portfolio have fixed rates of interest for a period of time ranging from two to seven years. Our funding costs are variable and the maturities are short term in nature. As a result, we use derivative instruments (interest rate swaps and interest rate caps) to mitigate, but not eliminate, the risk of our cost of funding increasing or decreasing at a faster rate than the interest on our investment assets.
As of December 31, 2006, our mortgage securities portfolio consisted of 98% AAA- rated or Fannie Mae, Freddie Mac or Ginnie Mae-guaranteed (“FNMA/FHLMC/GNMA”) mortgage securities as compared to financing rates or lower rated securities. The loans held in securitization trusts and mortgage loans held for investment consisted of high-credit quality prime adjustable rate mortgages with initial reset periods of no greater than five years or less. Our portfolio strategy for ARM loan originations is to acquire high-credit quality ARM loans for our securitization process thereby limiting future potential losses.
Such assets are evaluated for impairment on a quarterly basis or, if events or changes in circumstances indicate that these assets or the underlying collateral may be impaired, on a more frequent basis. We evaluate whether these assets are considered impaired, whether the impairment is other-than-temporary and, if the impairment is other-than-temporary, recognize an impairment loss equal to the difference between the asset’s amortized cost basis and its fair value. We recorded an impairment loss of $7.4 million in the fourth quarter of 2005 because we concluded that we no longer had the intent to hold certain lower-yielding mortgage-backed securities until their values recovered. This impairment was not due to any underlying credit issues but was related to our intent to no longer hold identified lower-yield securities and to re-position our portfolio by selling such securities and replacing them with higher yield securities with similar credit characteristics in order to earn higher net interest spread in the future. The securities were disposed of during the first quarter of 2006 resulting in an additional loss of $1.0 million.
Known Material Trends and Commentary
For the year ended December 31, 2006, our originations of residential mortgage loans totaled $2.5 billion. The following chart summarizes the our loan origination volume and characteristics for each of the four quarters of 2006 relative to our 2005 historical origination production:
For the year ended December 31, 2006, NYMC’s total loan originations decreased to $2.5 billion from $3.4 billion in 2005, a decrease of 26%. This compares to total originations for the industry as a whole of $2.5 trillion in 2006 versus $3.0 trillion in 2005, a decrease of 17%, as reported by the MBA’s Mortgage Finance Forecast. The reason for this larger than industry decrease is primarily due to a meaningful number of our seasoned loan officers being recruited and hired by other large lenders in the first half of 2006.
In the February 12, 2007 forecast, the MBA projects that mortgage loan volumes will decrease to $2.4 trillion in 2007 from $2.5 trillion in 2006, primarily due to an expected continued decline in the volume of loan refinancings. We believe that the market for mortgage loans for home purchases is less susceptible than the refinance market to downturns during periods of increasing interest rates, because borrowers seeking to purchase a home do not generally base their decision to purchase on changes in interest rates alone, while borrowers that refinance their mortgage loans often make their decision as a direct result of changes in interest rates. Consequently, we are hopeful that our referral-based marketing strategy and a concentration on purchase loan originations will help mitigate further origination decreases relative to the industry.
State and local governing bodies are focused on certain practices engaged in by certain participants in the mortgage lending business relating to fees borrowers incur in obtaining a mortgage loan - generally termed “predatory lending” within the mortgage industry. In several instances, states or local governing bodies have imposed strict laws on lenders to curb such practices. To date, these laws have had an insignificant impact on our business. We have capped fee structures consistent with those adopted by federal mortgage agencies and have implemented rigid processes to ensure that our lending practices are not predatory in nature.
Results of Operations. We expect that our revenues will derive primarily from the difference between the interest income we earn on our mortgage assets and the costs of our borrowings (net of hedging expenses). We expect that our operating expenses will reduce in the future due to the elimination of compensation expense attributable to our mortgage origination platform. The sale of each of our retail and wholesale mortgage banking platforms, has resulted in gross proceeds to NYMT of approximately $14.0 million before fees and expenses, and before deduction of approximately $2.3 million, which will be held in escrow to support warranties and indemnifications provided to Indymac by NYMC as well as other purchase price adjustments. NYMC expects to record a one time taxable gain on the sale of its assets to Indymac. NYMC’s deferred tax asset will absorb any taxable gain from sale.
Liquidity. We depend on the capital markets to finance our investments in mortgage-backed securities and mortgage loans held for sale. We finance our mortgage loans held for sale using “warehouse” facilities provided by commercial or investment banks. As it relates to our investment portfolio, we have either issued bonds from our loan securitizations and will either own such bonds or sell them to institutional investors via intermediaries, or use repurchase agreements for short term financing. The provider of our warehouse facilities are well capitalized investment or commercial banks. Commercial and investment banks have provided significant liquidity to finance our operations, and while management cannot predict the future liquidity environment, we are currently unaware of any material reason to prevent continued liquidity support in the capital markets for our business. See “Liquidity and Capital Resources” below for further discussion of liquidity risks and resources available to us.
Loan Loss Reserves on Mortgage Loans. Currently, conditions in the mortgage market remain challenging due a significant increase in demands for indemnification and loan repurchases form third party loan investors. A large portion of these demands come as a result of borrowers failing to timely make their first three to six mortgage loan payments, commonly known as early payment defaults (“EPDs”). This is evident throughout the mortgage industry as many local, regional and national mortgage lenders have announced plans to exit the mortgage lending business in part or in whole. Many of these announcements come as a result of liquidity problems caused by a significant increase in repurchase demands due to EPDs.
With respect to the loans originated by our discontinued operations, in 2006, we repurchased a total of $28.9 million of mortgage loans that were originated in both 2005 and 2006, the majority of which were due to EPDs. Of the repurchased loans originated in 2006, most were Alternative-A (“Alt-A”), as sub-prime comprised only approximately 10% of our 2006 originations. In 2006, the percentage of Alt-A loans we originated was approximately 26%.
Generally, under the terms of the agreements with the investors to whom we sell our loans, we are required to repurchase loans if the borrower misses one of his or her first three payments. The increased use of limited documentation underwriting associated with Alt-A loans, as offered by many investor programs under which we originate loans, in concert with reduced amounts of down payments required under many of those same programs, have made it easier for many borrowers to obtain mortgage financing.
As with any mortgage loan asset in either NYMT or NYMC, we have policies and procedures in place to determine the appropriate levels of reserves relative to non-performing assets or losses associated with indemnifications or repurchase demands. Our approach looks at individual loans for which we have received indemnification or repurchase demands, rather than using a model based macro approach based on historic performance. Note however that in volatile times such as these, a historical based approach would not likely result in adequate reserves. And while we feel that we are using a prudent approach to reserving for EPDs and non-performing loans, no assurance can be made as to the adequacies of those reserves.
In determining reserves we generally rely on management’s judgment and estimates of credit losses inherent in each individual non-performing loan held for sale and each mortgage loan held in securitization trusts. Estimation involves the consideration of various credit-related factors including but not limited to, the current housing market conditions, loan-to-value ratios, delinquency status, historical credit loss severity rates, purchased mortgage insurance, the borrower’s credit and other factors deemed to warrant consideration. Additionally, we look at the balance of any delinquent loan and compare that to the value of the property. As many of the loans involved in current reserve process were funded in the past six to twelve months, we typically rely on the original appraised value of the property, unless there is evidence that the original appraisal should not be relied upon. If there is a doubt to the objectivity of the original property value assessment, we either utilize various internet based property data services to look at comparable properties in the same area, or consult with a realtor in the property’s area.
Comparing the current loan balance to the original property value determines the current loan-to-value (“LTV”) ratio of the loan. Generally we estimate that any first lien loan that goes through a foreclosure process and results in Real Estate Owned (“REO”) results is the property being disposed of at approximately 68% of the property’s original value. That number is based on management’s long term experience in similar market conditions in past difficult real estate markets. Thus, for a first lien loan that is delinquent, we will adjust the property value down to approximately 68% of the original and compare that to the current balance of the loan. The difference, plus an estimate of past interest due, determines the base reserve taken for that loan. This base reserve for a particular loan may be adjusted if we are aware of specific circumstances that may affect the outcome of the loss mitigation process for that loan. Predominately, however, we use the base reserve number for our reserve.
Reserves for second liens are larger than that for first liens as second liens are in a junior position and only receive proceeds after the claims of the first lien holder are satisfied. As with first liens, we may occasionally alter the base reserve calculation but that is in a minority of the cases and only if we are aware of specific circumstances that pertain to that specific loan.
While we feel these policies are prudent, we can make no assurance that this policy will be adequate to cover future losses.
Significance of Estimates and Critical Accounting Policies
We prepare our consolidated financial statements in conformity with accounting principles generally accepted in the United States of America, or GAAP, many of which require the use of estimates, judgments and assumptions that affect reported amounts. These estimates are based, in part, on our judgment and assumptions regarding various economic conditions that we believe are reasonable based on facts and circumstances existing at the time of reporting. The results of these estimates affect reported amounts of assets, liabilities and accumulated other comprehensive income at the date of the consolidated financial statements and the reported amounts of income, expenses and other comprehensive income during the periods presented.
Changes in the estimates and assumptions could have a material effect on these financial statements. Accounting policies and estimates related to specific components of our consolidated financial statements are disclosed in the notes to our consolidated financial statements. In accordance with SEC guidance, those material accounting policies and estimates that we believe are most critical to an investor’s understanding of our financial results and condition and which require complex management judgment are discussed below.
Revenue Recognition. Interest income on our residential mortgage loans and mortgage-backed securities is a combination of the interest earned based on the outstanding principal balance of the underlying loan/security, the contractual terms of the assets and the amortization of yield adjustments, principally premiums and discounts, using generally accepted interest methods. The net GAAP cost over the par balance of self-originated loans held for investment and premium and discount associated with the purchase of mortgage-backed securities and loans are amortized into interest income over the lives of the underlying assets using the effective yield method as adjusted for the effects of estimated prepayments. Estimating prepayments and the remaining term of our interest yield investments require management judgment, which involves, among other things, consideration of possible future interest rate environments and an estimate of how borrowers will react to those environments, historical trends and performance. The actual prepayment speed and actual lives could be more or less than the amount estimated by management at the time of origination or purchase of the assets or at each financial reporting period.
Fair Value. Generally, the financial instruments we utilize are widely traded and there is a ready and liquid market in which these financial instruments are traded. The fair values for such financial instruments are generally based on market prices provided by five to seven dealers who make markets in these financial instruments. If the fair value of a financial instrument is not reasonably available from a dealer, management estimates the fair value based on characteristics of the security that the Company receives from the issuer and on available market information.
In the normal course of our discontinued mortgage lending business, we enter into contractual interest rate lock commitments, or (“IRLCs”), to extend credit to finance residential mortgages. Mark-to-market adjustments on IRLCs are recorded from the inception of the interest rate lock through the date the underlying loan is funded. The fair value of the IRLCs is determined by an estimate of the ultimate gain on sale of the loans net of estimated net costs to originate the loan. To mitigate the effect of the interest rate risk inherent in issuing an IRLC from the lock-in date to the funding date of a loan, we generally enter into forward sale loan contracts, or (“FSLCs”). Since the FSLCs are committed prior to mortgage loan funding and thus there is no owned asset to hedge, the FSLCs in place prior to the funding of a loan are undesignated derivatives under SFAS No. 133 and are marked to market with changes in fair value recorded to current earnings.
Impairment of and Basis Adjustments on Securitized Financial Assets. As previously described herein, we regularly securitize our mortgage loans and retain the beneficial interests created. Such assets are evaluated for impairment on a quarterly basis or, if events or changes in circumstances indicate that these assets or the underlying collateral may be impaired, on a more frequent basis. We evaluate whether these assets are considered impaired, whether the impairment is other-than-temporary and, if the impairment is other-than-temporary, recognize an impairment loss equal to the difference between the asset’s amortized cost basis and its fair value. These evaluations require management to make estimates and judgments based on changes in market interest rates, credit ratings, credit and delinquency data and other information to determine whether unrealized losses are reflective of credit deterioration and our ability and intent to hold the investment to maturity or recovery. This other-than-temporary impairment analysis requires significant management judgment and we deem this to be a critical accounting estimate. We recorded an impairment loss of $7.4 million during 2005, because we concluded that we no longer had the intent to hold certain lower-yielding mortgage-backed securities until their values recovered. At December 31, 2006, we have an unrealized loss of $3.85 million on the remaining securities in our portfolio, which we do not consider to represent an other than temporary impairment.
Loan Loss Reserves on Mortgage Loans. We evaluate a reserve for loan losses based on management’s judgment and estimate of credit losses inherent in our portfolio of residential mortgage loans held for sale and mortgage loans held in securitization trusts. The estimation involves the consideration of various credit-related factors including loans held for investment, but not limited to, current economic conditions, loan-to-value ratios, delinquency status, historical credit losses, purchased mortgage insurance and other factors deemed to warrant consideration. If the credit performance of any of our mortgage loans deviates from expectations, the allowance for loan losses is adjusted to a level deemed appropriate by management to provide for estimated probable losses in the portfolio. One of the critical assumptions used in estimating the loan loss reserve is severity. Severity represents the expected rate of realized loss upon disposition/resolution of the collateral that has gone into foreclosure.
Securitizations. We create securitization entities as a means of either:
· | creating securities backed by mortgage loans which we will continue to hold and finance that will be more liquid than holding whole loan assets; or |
· | securing long-term collateralized financing for our residential mortgage loan portfolio and matching the income earned on residential mortgage loans with the cost of related liabilities, otherwise referred to a match funding our balance sheet. |
Residential mortgage loans are transferred to a separate bankruptcy-remote legal entity from which private-label multi-class mortgage-backed notes are issued. On a consolidated basis, securitizations are accounted for as secured financings as defined by SFAS No. 140, “Accounting for Transfers and Servicing of Financial Assets and Extinguishments of Liabilities”, and, therefore, no gain or loss is recorded in connection with the securitizations. Each securitization entity is evaluated in accordance with Financial Accounting Standards Board Interpretation, or FIN, 46(R), “Consolidation of Variable Interest Entities”, and we have determined that we are the primary beneficiary of the securitization entities. As such, the securitization entities are consolidated into our consolidated balance sheet subsequent to securitization. Residential mortgage loans transferred to securitization entities collateralize the mortgage-backed notes issued, and, as a result, those investments are not available to us, our creditors or stockholders. All discussions relating to securitizations are on a consolidated basis and do not necessarily reflect the separate legal ownership of the loans by the related bankruptcy-remote legal entity.
Derivative Financial Instruments - The Company has developed risk management programs and processes, which include investments in derivative financial instruments designed to manage market risk associated with its mortgage banking and its mortgage-backed securities investment activities.
All derivative financial instruments are reported as either assets or liabilities in the consolidated balance sheet at fair value. The gains and losses associated with changes in the fair value of derivatives not designated as hedges are reported in current earnings. If the derivative is designated as a fair value hedge and is highly effective in achieving offsetting changes in the fair value of the asset or liability hedged, the recorded value of the hedged item is adjusted by its change in fair value attributable to the hedged risk. If the derivative is designated as a cash flow hedge, the effective portion of change in the fair value of the derivative is recorded in OCI and is recognized in the income statement when the hedged item affects earnings. The Company calculates the effectiveness of these hedges on an ongoing basis, and, to date, has calculated effectiveness of approximately 100%. Ineffective portions, if any, of changes in the fair value or cash flow hedges are recognized in earnings.
New Accounting Pronouncements - In February 2007, the FASB issued SFAS No. 159, “The Fair Value Option for Financial Assets and Financial Liabilities” (“SFAS No. 159”), which provides companies with an option to report selected financial assets and liabilities at fair value. The objective of SFAS No. 159 is to reduce both complexity in accounting for financial instruments and the volatility in earnings caused by measuring related assets and liabilities differently. SFAS No. 159 establishes presentation and disclosure requirements and requires companies to provide additional information that will help investors and other users of financial statements to more easily understand the effect of the company's choice to use fair value on its earnings. SFAS No. 159 also requires entities to display the fair value of those assets and liabilities for which the company has chosen to use fair value on the face of the balance sheet. SFAS No. 159 is effective for financial statements issued for fiscal years beginning after November 15, 2007 and early adoption is permitted for fiscal years beginning on or before November 15, 2007 provided that the entity makes that choice in the first 120 days of the fiscal year, has not issued financial statements for any interim period of the fiscal year of adoption and also elects to apply the provisions of SFAS No. 157. The Company is in the process of analyzing the impact of SFAS No. 159 on its consolidated financial statements.
In September 2006, the FASB issued SFAS No. 157, “Fair Value Measurements” (“SFAS No.157”). SFAS No.157 defines fair value, establishes a framework for measuring fair value in generally accepted accounting principles and expands disclosures about fair value measurements. SFAS No.157 will be applied under other accounting principles that require or permit fair value measurements, as this is a relevant measurement attribute. This statement does not require any new fair value measurements. We will adopt the provisions of SFAS No.157 beginning January 1, 2008. We are currently evaluating the impact of this statement on our consolidated financial statements.
In September 2006, the SEC issued SAB No. 108, “Considering the Effects of Prior Year Misstatements when Quantifying Misstatements in Current Year Financial Statement” (“SAB 108”), on quantifying financial statement misstatements. In summary, SAB 108 was issued to address the diversity in practice of evaluating and quantifying financial statement misstatements and the related accumulation of such misstatements. SAB 108 states that both a balance sheet approach and an income statement approach should be used when quantifying and evaluating the materiality of a potential misstatement and contains guidance for correcting errors under this dual perspective. SAB 108 is effective for financial statements issued for fiscal years ending after November 15, 2006. The adoption of SAB 108 did not have a material effect on the Company's consolidated financial statements.
In June 2006, FASB issued FASB Interpretation No. 48, “Accounting for Uncertainty in Income Taxes — an interpretation of FASB Statement No. 109” (“FIN 48”). This interpretation increases the relevancy and comparability of financial reporting by clarifying the way companies account for uncertainty in income taxes. FIN 48 prescribes a consistent recognition threshold and measurement attribute, as well as clear criteria for subsequently recognizing, derecognizing and measuring such tax positions for financial statement purposes. The interpretation also requires expanded disclosure with respect to the uncertainty in income taxes. FIN 48 is effective for us on January 1, 2007. The Company does not expect the adoption of FIN 48 to have a material effect on the Company’s consolidated financial statements.
In March 2006, the FASB issued SFAS No. 156, “Accounting for Servicing of Financial Assets an amendment of FASB Statement No. 140.” Effective at the beginning of the first quarter of 2006, the Company early adopted the newly issued statement and elected the fair value option to subsequently measure its mortgage servicing rights (“MSRs”). Under the fair value option, all changes in the fair value of MSRs are reported in the statement of operations. The initial implementation of SFAS 156 did not have a material impact on the Company’s financial statements.
In February 2006, the FASB issued SFAS No.155, “Accounting for Certain Hybrid Financial Instruments”. Key provisions of SFAS No.155 include: (1) a broad fair value measurement option for certain hybrid financial instruments that contain an embedded derivative that would otherwise require bifurcation; (2) clarification that only the simplest separations of interest payments and principal payments qualify for the exception afforded to interest-only strips and principal-only strips from derivative accounting under paragraph 14 of FAS No.133 (thereby narrowing such exception); (3) a requirement that beneficial interests in securitized financial assets be analyzed to determine whether they are freestanding derivatives or whether they are hybrid instruments that contain embedded derivatives requiring bifurcation; (4) clarification that concentrations of credit risk in the form of subordination are not embedded derivatives; and (5) elimination of the prohibition on a QSPE holding passive derivative financial instruments that pertain to beneficial interests that are or contain a derivative financial instrument. In general, these changes will reduce the operational complexity associated with bifurcating embedded derivatives, and increase the number of beneficial interests in securitization transactions, including interest-only strips and principal-only strips, required to be accounted for in accordance with FAS No.133. Management does not believe that SFAS No.155 will have a material effect on the Company’s consolidated financial statements.
Overview of Performance
For the year ended December 31, 2006, we reported a net loss of $15.0 million, as compared to a net loss of $5.3 million for the year ended December 31, 2005. The increase in net loss is attributed to a decrease in gain on sale revenues and net interest income from our investment portfolio. Our revenues were driven largely from increases in interest income on investments in mortgage loans and mortgage securities (our “mortgage portfolio management” segment). In addition, the Company incurred a $8.3 million charge attributable to loan losses.
For the year ended December 31, 2006, total residential originations, including brokered loans, were $2.5 billion as compared to $3.4 billion and $1.8 billion for the same period of 2005 and 2004, respectively. The decrease in our loan origination levels for the year ended December 31, 2006 as compared to the same period of 2005 is the result of the loss of experienced loan officers to competitors as well as an overall market decline. Total employees decreased to 616 at December 31, 2006 from 802 at December 31, 2005; full-service loan origination locations decreased to 25 offices and 22 satellite loan origination locations at December 31, 2006 from 28 full service locations and 26 satellite loan origination locations at December 31, 2005.
Summary of Operations and Key Performance Measurements
For the year ended December 31, 2006, our net income was dependent upon our mortgage portfolio management operations and the net interest (interest income on portfolio assets net of the interest expense and hedging costs associated with the financing of such assets) generated from our portfolio of mortgage loans held for investment, mortgage loans held in the securitization trusts and residential mortgage-backed securities in our portfolio management segment. The following table presents the components of our net interest income from our investment portfolio of mortgage securities and loans for the year ended December 31, 2006:
| | Amount | | Average Outstanding Balance | | Effective Rate | |
| | | (Dollars in Millions) | |
Net Interest Income Components: | | | | | | | |
Interest Income | | | | | | | | | | |
| Investment securities and loans held in the securitization trusts | | $ | 66,973 | | $ | 1,266.4 | | | 5.29 | % |
| Amortization of premium | | | (2,092 | ) | | 5.9 | | | (0.16 | )% |
Total interest income | | $ | 64,881 | | $ | 1,272.3 | | | 5.13 | % |
Interest Expense | | | | | | | | | | |
| Repurchase agreements | | $ | 62,437 | | $ | 1,201.2 | | | 5.12 | % |
| Interest rate swaps and caps | | | (5,884 | ) | | — | | | (0.48 | )% |
Total interest expense | | $ | 56,553 | | $ | 1,201.2 | | | 4.64 | % |
Net Interest Income | | $ | 8,328 | | | | | | 0.49 | % |
The key performance measures for our portfolio management activities are:
· | net interest spread on the portfolio; |
· | characteristics of the investments and the underlying pool of mortgage loans including but not limited to credit quality, coupon and prepayment rates; and |
· | return on our mortgage asset investments and the related management of interest rate risk. |
For the year ended December 31, 2006, our net income was also dependent upon our mortgage lending operations and originations from our mortgage lending segment, which include the mortgage loan sales (“mortgage banking”) and mortgage brokering activities on residential mortgages sold or brokered to third parties. Our mortgage banking activities generate revenues in the form of gains on sales of mortgage loans to third parties and ancillary fee income and interest income from borrowers. Our mortgage brokering operations generate brokering fee revenues from third party buyers. When we retain a portion of our loan originations for our investment portfolio, we do not realize the gain on sale premiums we would have otherwise recognized had these loans been sold to third parties and such loans retained on our balance sheet at cost. As a result, revenues in our mortgage banking segment are lower and the book value of these assets on our balance sheet, which are accounted for on a cost basis, will differ from their fair market value.
A breakdown of our loan originations for the year ended December 31, 2006 follows:
Description | | Number of Loans | | Aggregate Principal Balance ($000’s) | | Percentage of Total Principal | | Weighted Average Interest Rate | | Average Loan Size | |
| Purchase mortgages | | | 6,485 | | $ | 1,484.0 | | | 58.3 | % | | 7.15 | % | $ | 228,831 | |
| Refinancings | | | 3,837 | | | 1,060.0 | | | 41.7 | % | | 6.98 | % | | 276,267 | |
| Total | | | 10,322 | | $ | 2,544.0 | | | 100.0 | % | | 7.08 | % | | 246,464 | |
| Adjustable rate or hybrid | | | 3,398 | | $ | 1,102.2 | | | 43.3 | % | | 6.94 | % | | 324,373 | |
| Fixed rate | | | 6,924 | | | 1,441.8 | | | 56.7 | % | | 7.18 | % | | 208,230 | |
| Total | | | 10,322 | | $ | 2,544.0 | | | 100.0 | % | | 7.08 | % | | 246,464 | |
| Banked | | | 8,018 | | $ | 1,841.0 | | | 72.4 | % | | 7.16 | % | | 229,610 | |
| Brokered | | | 2,304 | | | 703.0 | | | 27.6 | % | | 6.86 | % | | 305,118 | |
| Total | | | 10,322 | | $ | 2,544.0 | | | 100.0 | % | | 7.08 | % | $ | 246,464 | |
The key performance measures for our origination activities are:
· | dollar volume of mortgage loans originated; |
· | relative cost of the loans originated; |
· | characteristics of the loans, including but not limited to the coupon and credit quality of the loan, which will indicate their expected yield; |
· | return on our mortgage asset investments and the related management of interest rate risk; and |
· | frequency of early payment defaults which result in loan losses. |
Management’s discussion and analysis of financial condition and results of operations, along with other portions of this report, are designed to provide information regarding our performance and these key performance measures.
Year Ended December 31, 2006 Financial Highlights
· | Net income for the Company’s Mortgage Portfolio Management segment totaled $6.0 million for the year ended December 31, 2006. |
· | Consolidated net loss totaled $15.0 million for the year ended December 31, 2006. |
· | Discontinued operations net loss totaled $17.2 million net of tax for the year ended December 31, 2006. |
Financial Condition
Balance Sheet Analysis - Asset Quality
Investment Portfolio Related Assets
Mortgage Loans Held in Securitization Trusts and Mortgage Loans Held for Investment.Included in our portfolio are adjustable-rate mortgageARM loans that we originated or purchased in bulk from third parties that meetmet our investment criteria and portfolio requirements. These loans arerequirements and that we subsequently securitized. The Company has completed four securitizations; three were classified as “mortgage loans held for investment” during a period of aggregationfinancings and until the portfolio reaches a size sufficient for us to securitize such loans. If the securitization qualifiesone, New York Mortgage Trust 2006-1, qualified as a financing for SFAS No. 140 purposes the loans are classified as “mortgage loans held in securitization trusts.”
The NYMT 2006-1 securitization qualifies as a sale, under SFAS No. 140, which resulted in the recording of residual assets and mortgage servicing rights. The Company sold all the residual assets total $2.0 million and are included in investment securities available for sale (see note 2 in our consolidated financial statements).
There were no Mortgage Loans Held for Investment at December 31, 2006.related to the 2006-1 securitization during the third quarter ended September 30, 2009 incurring a realized loss of approximately $32,000.
The following table details Mortgage Loans Held for Investment at December 31, 2005 (dollar amounts in thousands):
Category | | Par Value | | Coupon | | Carrying Value | | Yield | |
| Mortgage Loans Held for Investment | | $ | 4,054 | | | 5.84 | % | $ | 4,060 | | | 5.56 | % |
The following table details Mortgage Loans Held in Securitization Trusts (dollar amounts in thousands):
| | | Par Value | | Coupon | | Carrying Value | | Yield | |
| December 31, 2006 | $ | 584,358 | | 5.56% | $ | 588,160 | | 5.56% | |
| December 31, 2005 | $ | 771,451 | | 5.17% | $ | 776,610 | | 5.49% | |
At December 31, 20062009, mortgage loans held in securitization trusts totaled $588.2approximately $276.2 million, or 45%56.5% of our total assets. Of thisthe mortgage loan investment portfolioloans held in securitized trusts, 100% are traditional ARMs or hybrid ARMs, and 75.9%80.9% of which are ARM loans that are interest only. On our hybrid ARMs, interest rate reset periods are predominately sevenfive years or less and the interest-only/amortizationinterest-only period is typically 10 years, which mitigates the “payment shock” at the time of interest rate reset. No loans in our investment portfolioNone of the mortgage loans held in securitization trusts are payment option-ARMs or ARMs with negative amortization.
The following table details mortgage loans held in securitization trusts at December 31, 2009 and December 31, 2008 (dollar amounts in thousands):
| | | # of Loans | | | Par Value | | | Coupon | | | Carrying Value | | | Yield | |
| December 31, 2009 | | | 647 | | | $ | 277,007 | | | | 5.19 | % | | $ | 276,176 | | | | 5.40 | % |
| December 31, 2008 | | | 789 | | | $ | 345,619 | | | | 5.56 | % | | $ | 346,972 | | | | 3.96 | % |
Securitization Trusts and Retained Interest in Securitization:
The following table sets forth the composition of our loans held for investment and in securitization trusts as of December 31, 20062009 (dollar amounts in thousands):
| | | # of Loans | | Par Value | | Carrying Value | |
Loan Characteristics: | | | | | | | |
| Mortgage loans held in securitization trusts | | | 1,259 | | $ | 584,358 | | $ | 588,160 | |
| Retained interest in securitization (included in Investment securities available for sale) | | | 458 | | | 249,627 | | | 23,930 | |
| Total Loans Held | | | 1,717 | | $ | 833,985 | | $ | 612,090 | |
Loans Held in Securitization Trusts: | | | Average | | High | | Low | | Average | | | High | | | Low | |
General Loan Characteristics: | | | | | | | | | | | | | | | |
| Original Loan Balance | | $ | 501 | | $ | 3,500 | | $ | 25 | | |
| Coupon Rate | | | 5.67 | % | | 8.13 | % | | 3.88 | % | |
| Original Loan Balance (dollar amounts in thousands) | | $ | 456 | | | $ | 2,950 | | | $ | 48 | |
| Current Coupon Rate | | | 5.19 | % | | | 7.25 | % | | | 1.38 | % |
| Gross Margin | | | 2.36 | % | | 6.50 | % | | 1.13 | % | | 2.37 | % | | | 5.00 | % | | | 1.13 | % |
| Lifetime Cap | | | 11.14 | % | | 13.75 | % | | 9.00 | % | | 11.26 | % | | | 13.25 | % | | | 9.13 | % |
| Original Term (Months) | | | 360 | | | 360 | | | 360 | | | 360 | | | | 360 | | | | 360 | |
| Remaining Term (Months) | | | 341 | | | 351 | | | 307 | | | 304 | | | | 312 | | | | 271 | |
| Average Months to Reset | | | 6 | | | | 12 | | | | 1 | |
| Original Average FICO Score | | | 732 | | | | 820 | | | | 593 | |
| Original Average LTV (% of original home value) | | | 70.3 | | | | 95.0 | | | | 13.9 | |
Index / Reset Characteristics:
| | | % of Outstanding Loan Balance | | | Weighted Average Gross Margin (%) | |
| General Loan Characteristics: | | | | | | |
| One Month Libor | | | 3.0 | % | | | 1.67 | % |
| Six Month Libor | | | 71.8 | % | | | 2.40 | % |
| One Year Libor | | | 16.6 | % | | | 2.27 | % |
| One Year CMT | | | 8.6 | % | | | 2.66 | % |
| Total / Weighted Average | | | 100.0 | % | | | 2.37 | % |
The following tabletables sets forth the composition of our loans held in securitization trusts and loans backing the retained interests from our securitizations as of December 31, 2008 (dollar amounts in thousands):
Loans Held in Securitization Trusts:
| | Average | | | High | | | Low | |
| General Loan Characteristics: | | | | | | | | |
| Original Loan Balance (dollar amounts in thousands) | $ | 468 | | | $ | 3,500 | | | $ | 48 | |
| Current Coupon Rate | | 5.56 | % | | | 8.13 | % | | | 4.00 | % |
| Gross Margin | | 2.36 | % | | | 5.00 | % | | | 1.13 | % |
| Lifetime Cap | | 11.21 | % | | | 13.38 | % | | | 9.13 | % |
| Original Term (Months) | | 360 | | | | 360 | | | | 360 | |
| Remaining Term (Months) | | 316 | | | | 324 | | | | 283 | |
| Average Months to Reset | | 15 | | | | 24 | | | | 1 | |
| Original Average FICO Score | | 735 | | | | 820 | | | | 593 | |
| Original Average LTV (% of original home value) | | 69.6 | | | | 95.0 | | | | 13.9 | |
Index / Reset Characteristics:
| | | % of Outstanding Loan Balance | | | Weighted Average Gross Margin (%) | |
| General Loan Characteristics: | | | | | | |
| One Month Libor | | 2.6 | % | | 1.69 | % |
| Six Month Libor | | 71.6 | % | | 2.41 | % |
| One Year Libor | | 16.3 | % | | 2.27 | % |
| One Year CMT | | 9.5 | % | | 2.65 | % |
| Total / Weighted Average | | 100.0 | % | | 2.39 | % |
The following table details loan summary information for investmentloans held in securitization trust at December 31, 2009 (all amounts in thousands)
| | | | | | | | | | | | | | | | | | | | | | | | | | Principal Amount of Loans | |
| | | | | | | | | | | | | | | | | | | | | | | | | | Subject to | |
| | | | | | | | | | | | | | | | | | Periodic | | | | | | | | Delinquent | |
| Description | | Interest Rate | | Final Maturity | | Payment | | | | Original | | Current | | Principal | |
| Property | | | | Loan | | | | | | | | | | | | | Term | | Prior | | Amount of | | Amount of | | or | |
| Type | | Balance | | Count | | Max | | Min | | | Avg | | Min | | Max | | (months) | | Liens | | Principal | | Principal | | Interest | |
| Single | | <= $100,000 | | 11 | | 5.88 | | 3.38 | | | 4.97 | | 12/01/34 | | 11/01/35 | | 360 | | NA | | $ | 1,724 | | $ | 766 | | $ | - | |
| FAMILY | | <= $250,000 | | 71 | | 7.25 | | 3.13 | | | 5.33 | | 09/01/32 | | 12/01/35 | | 360 | | NA | | | 14,605 | | | 12,765 | | | 640 | |
| �� | | <= $500,000 | | 121 | | 7.13 | | 2.75 | | | 5.21 | | 10/01/32 | | 01/01/36 | | 360 | | NA | | | 45,220 | | | 42,278 | | | 5,471 | |
| | | <=$1,000,000 | | 50 | | 6.38 | | 1.63 | | | 4.99 | | 12/01/34 | | 12/01/35 | | 360 | | NA | | | 38,363 | | | 36,553 | | | 2,186 | |
| | | >$1,000,000 | | 26 | | 6.25 | | 1.50 | | | 5.47 | | 01/01/35 | | 01/01/36 | | 360 | | NA | | | 45,082 | | | 44,329 | | | 6,246 | |
| | | Summary | | 279 | | 7.25 | | 1.50 | | | 5.22 | | 09/01/32 | | 01/01/36 | | 360 | | NA | | $ | 144,994 | | $ | 136,691 | | $ | 14,543 | |
| 2-4 | | <= $100,000 | | 1 | | 6.63 | | 6.63 | | | 6.63 | | 02/01/35 | | 02/01/35 | | 360 | | NA | | $ | 80 | | $ | 75 | | $ | 76 | |
| FAMILY | | <= $250,000 | | 6 | | 6.75 | | 4.38 | | | 5.75 | | 12/01/34 | | 07/01/35 | | 360 | | NA | | | 1,115 | | | 996 | | | - | |
| | | <= $500,000 | | 18 | | 7.25 | | 2.13 | | | 4.98 | | 09/01/34 | | 01/01/36 | | 360 | | NA | | | 6,262 | | | 6,012 | | | 254 | |
| | | <=$1,000,000 | | 3 | | 5.75 | | 4.63 | | | 5.25 | | 12/01/34 | | 08/01/35 | | 360 | | NA | | | 2,540 | | | 2,539 | | | - | |
| | | >$1,000,000 | | 0 | | - | | - | | | - | | - | | - | | 360 | | NA | | | - | | | - | | | - | |
| | | Summary | | 28 | | 7.25 | | 2.13 | | | 5.23 | | 09/01/34 | | 01/01/36 | | 360 | | NA | | $ | 9,997 | | $ | 9,622 | | $ | 330 | |
| Condo | | <= $100,000 | | 16 | | 6.38 | | 3.00 | | | 4.99 | | 01/01/35 | | 12/01/35 | | 360 | | NA | | $ | 2,707 | | $ | 1,150 | | $ | - | |
| | | <= $250,000 | | 82 | | 6.50 | | 2.88 | | | 5.37 | | 08/01/32 | | 01/01/36 | | 360 | | NA | | | 15,859 | | | 14,747 | | | 1,024 | |
| | | <= $500,000 | | 74 | | 6.88 | | 1.50 | | | 4.93 | | 09/01/32 | | 12/01/35 | | 360 | | NA | | | 25,467 | | | 24,445 | | | 919 | |
| | | <=$1,000,000 | | 27 | | 6.13 | | 1.63 | | | 5.08 | | 08/01/33 | | 11/01/35 | | 360 | | NA | | | 19,442 | | | 18,490 | | | 546 | |
| | | > $1,000,000 | | 12 | | 6.13 | | 3.88 | | | 5.44 | | 07/01/34 | | 09/01/35 | | 360 | | NA | | | 18,773 | | | 18,186 | | | 1,669 | |
| | | Summary | | 211 | | 6.88 | | 1.50 | | | 5.15 | | 08/01/32 | | 01/01/36 | | 360 | | NA | | $ | 82,248 | | $ | 77,018 | | $ | 4,158 | |
| CO-OP | | <= $100,000 | | 4 | | 5.50 | | 3.00 | | | 4.56 | | 09/01/34 | | 06/01/35 | | 360 | | NA | | $ | 1,350 | | $ | 221 | | $ | - | |
| | | <= $250,000 | | 21 | | 6.13 | | 2.88 | | | 5.02 | | 10/01/34 | | 12/01/35 | | 360 | | NA | | | 4,089 | | | 3,662 | | | 212 | |
| | | <= $500,000 | | 34 | | 6.38 | | 1.38 | | | 5.02 | | 08/01/34 | | 12/01/35 | | 360 | | NA | | | 13,817 | | | 12,474 | | | - | |
| | | <=$1,000,000 | | 16 | | 5.63 | | 4.75 | | | 5.40 | | 11/01/34 | | 11/01/35 | | 360 | | NA | | | 11,284 | | | 11,082 | | | - | |
| | | > $1,000,000 | | 5 | | 6.00 | | 2.25 | | | 4.38 | | 11/01/34 | | 12/01/35 | | 360 | | NA | | | 7,544 | | | 6,992 | | | - | |
| | | Summary | | 80 | | 6.38 | | 1.38 | | | 5.12 | | 08/01/34 | | 12/01/35 | | 360 | | NA | | $ | 38,084 | | $ | 34,431 | | $ | 212 | |
| PUD | | <= $100,000 | | 1 | | 5.63 | | 5.63 | | | 5.63 | | 07/01/35 | | 07/01/35 | | 360 | | NA | | $ | 100 | | $ | 94 | | $ | - | |
| | | <= $250,000 | | 20 | | 6.50 | | 2.75 | | | 5.23 | | 01/01/35 | | 12/01/35 | | 360 | | NA | | | 4,439 | | | 3,836 | | | - | |
| | | <= $500,000 | | 21 | | 6.88 | | 2.75 | | | 4.78 | | 08/01/32 | | 12/01/35 | | 360 | | NA | | | 7,168 | | | 6,857 | | | 183 | |
| | | <=$1,000,000 | | 5 | | 5.88 | | 3.40 | | | 4.83 | | 09/01/33 | | 12/01/35 | | 360 | | NA | | | 3,432 | | | 3,286 | | | 455 | |
| | | > $1,000,000 | | 4 | | 6.13 | | 3.22 | | | 5.21 | | 04/01/34 | | 12/01/35 | | 360 | | NA | | | 5,233 | | | 5,172 | | | - | |
| | | Summary | | 51 | | 6.88 | | 2.75 | | | 5.01 | | 08/01/32 | | 01/01/36 | | 360 | | NA | | $ | 20,372 | | $ | 19,245 | | $ | 638 | |
| Summary | | <= $100,000 | | 33 | | 6.63 | | 3.00 | | | 5.00 | | 10/01/34 | | 12/01/35 | | 360 | | NA | | $ | 5,961 | | $ | 2,306 | | $ | 76 | |
| | | <= $250,000 | | 200 | | 7.25 | | 2.75 | | | 5.32 | | 08/01/32 | | 01/01/36 | | 360 | | NA | | | 40,107 | | | 36,006 | | | 2,059 | |
| | | <= $500,000 | | 268 | | 7.25 | | 1.38 | | | 5.21 | | 08/01/32 | | 01/01/36 | | 360 | | NA | | | 97,934 | | | 92,066 | | | 7,099 | |
| | | <=$1,000,000 | | 101 | | 6.38 | | 1.63 | | | 5.08 | | 07/01/33 | | 12/01/35 | | 360 | | NA | | | 75,061 | | | 71,950 | | | 2,732 | |
| | | > $1,000,000 | | 47 | | 6.25 | | 1.50 | | | 5.32 | | 04/01/34 | | 01/01/36 | | 360 | | NA | | | 76,632 | | | 74,679 | | | 7,915 | |
| | | Grand Total | | 649 | | 7.25 | | 1.38 | | | 5.19 | | 08/01/32 | | 01/01/36 | | 360 | | NA | | $ | 295,695 | | $ | 277,007 | | $ | 19,881 | |
The following table details activity for loans held in securitization trust (net) for the year ended December 31, 2009.
| | | Principal | | | Premium | | | Allowance for Loan Losses | | | Net Carrying Value | |
| Balance, December 31, 2008 | | $ | 345,619 | | | $ | 2,197 | | | $ | (844 | ) | | $ | 346,972 | |
| Additions | | | — | | | | — | | | | — | | | | — | |
| Principal repayments | | | (67,380 | ) | | | — | | | | — | | | | (67,380 | ) |
| Provision for loan loss | | | — | | | | — | | | | (2,192 | ) | | | (2,192 | ) |
| Transfer to real estate owned | | | (1,232 | ) | | | — | | | | 406 | | | | (826 | ) |
| Charge-Offs | | | — | | | | — | | | | 49 | | | | 49 | |
| Amortization for premium | | | — | | | | (447 | ) | | | — | | | | (447 | ) |
| Balance, December 31, 2009 | | $ | 277,007 | | | $ | 1,750 | | | $ | (2,581 | ) | | $ | 276,176 | |
Delinquency Status
As of December 31, 2009, we had 41 delinquent loans totaling approximately $19.9 million categorized as Mortgage Loans Held in Securitization Trusts (net). In addition we had two REO properties totaling approximately $0.7 million included in prepaid and other assets. The number of delinquent loans in our securitization trusts was significantly higher as of December 31, 2009 as compared to delinquencies as of December 31, 2008. The increase was due, in part, to higher delinquency rates nationally, which equaled approximately 9.5% of all loans outstanding as of the end of the 2009 fourth quarter, and also as a result of the services of our loans treating as delinquent certain of the loans in our portfolio that are subject to, temporary modification plans. Excluding this treatment of loans subject to temporary modification plans the delinquency rate on the loans held in our securitization trusts as of December 31, 20052009 would have been lower. The table below shows delinquencies in our loan portfolio as of December 31, 2009 (dollar amounts in thousands):
| | | # of Loans | | Par Value | | Carrying Value | |
Loan Characteristics: | | | | | | | |
| Mortgage loans held in securitization trusts | | | 1,609 | | $ | 771,451 | | $ | 776,610 | |
| Mortgage loans held for investment | | | 11 | | | 4,054 | | | 4,060 | |
| Total Loans Held | | | 1,620 | | $ | 775,505 | | $ | 780,670 | |
| Days Late | | Number of Delinquent Loans | | Total Dollar Amount | | % of Loan Portfolio | |
| 30-60 | | 5 | | $ | 2,816 | | 1.01 | % |
| 61-90 | | 4 | | $ | 1,150 | | 0.41 | % |
| 90+ | | 32 | | $ | 15,915 | | 5.73 | % |
| Real Estate Owned (REO) | | 2 | | $ | 739 | | 0.27 | % |
| | | Average | | High | | Low | |
General Loan Characteristics: | | | | | | | |
| Original Loan Balance | | $ | 486 | | $ | 3,500 | | $ | 25 | |
| Coupon Rate | | | 5.26 | % | | 7.75 | % | | 3.00 | % |
| Gross Margin | | | 2.40 | % | | 7.01 | % | | 1.13 | % |
| Lifetime Cap | | | 11.08 | % | | 13.75 | % | | 9.00 | % |
| Original Term (Months) | | | 360 | | | 360 | | | 359 | |
| Remaining Term (Months) | | | 348 | | | 360 | | | 319 | |
| | December 31, 2006 Percentage | | | December 31, 2005 Percentage | |
Arm Loan Type | | | | | |
| Traditional ARMs | 2.9 | % | | | 4.7 | % |
| 2/1 Hybrid ARMs | 3.8 | % | | | 5.3 | % |
| 3/1 Hybrid ARMs | 16.8 | % | | | 32.4 | % |
| 5/1 Hybrid ARMs | 74.5 | % | | | 57.3 | % |
| 7/1 Hybrid ARMs | 2.0 | % | | | 0.3 | % |
| Total | 100.0 | % | | | 100.0 | % |
| Percent of ARM loans that are Interest Only | 75.9 | % | | | 74.9 | % |
| Weighted average length of interest only period | 8.0 years | | | | 8.2 years | |
| | December 31, 2006 Percentage | | December 31, 2005 Percentage | |
Traditional ARMs - Periodic Caps | | | | |
| None | 61.9 | % | | 64.5 | % |
| 1% | 8.8 | % | | 19.4 | % |
| Over 1% | 29.3 | % | | 16.1 | % |
| Total | 100.0 | % | | 100.0 | % |
| | December 31, 2006 Percentage | | | December 31, 2005 Percentage | |
Hybrid ARMs - Initial Cap | | | | | |
| 3.00% or less | 14.8 | % | | | 29.6 | % |
| 3.01%-4.00% | 7.5 | % | | | 10.7 | % |
| 4.01%-5.00% | 76.6 | % | | | 58.2 | % |
| 5.01%-6.00% | 1.1 | % | | | 1.5 | % |
| Total | 100.0 | % | | | 100.0 | % |
| | December 31, 2006 Percentage | | | December 31, 2005 Percentage | |
FICO Scores | | | | | |
| 650 or less | 3.8 | % | | | 5.0 | % |
| 651 to 700 | 16.9 | % | | | 18.0 | % |
| 701 to 750 | 34.0 | % | | | 35.4 | % |
| 751 to 800 | 41.5 | % | | | 38.2 | % |
| 801 and over | 3.8 | % | | | 3.4 | % |
| Total | 100.0 | % | | | 100.0 | % |
| Average FICO Score | 737 | | | | 733 | |
| | December 31, 2006 Percentage | | | December 31, 2005 Percentage | |
Loan to Value (LTV) | | | | | |
| 50% or less | 9.8 | % | | | 9.5 | % |
| 50.01%-60.00% | 8.8 | % | | | 9.4 | % |
| 60.01%-70.00% | 28.1 | % | | | 28.6 | % |
| 70.01%-80.00% | 51.1 | % | | | 49.7 | % |
| 80.01% and over | 2.2 | % | | | 2.8 | % |
| Total | 100.0 | % | | | 100.0 | % |
| Average LTV | 69.4 | % | | | 69.3 | % |
| | December 31, 2006 Percentage | | | December 31, 2005 Percentage | |
Property Type | | | | | |
| Single Family | 52.3 | % | | | 53.7 | % |
| Condominium | 22.9 | % | | | 23.1 | % |
| Cooperative | 8.8 | % | | | 10.1 | % |
| Planned Unit Development | 13.0 | % | | | 9.2 | % |
| Two to Four Family | 3.0 | % | | | 3.9 | % |
| Total | 100.0 | % | | | 100.0 | % |
| | December 31, 2006 Percentage | | | December 31, 2005 Percentage | |
Occupancy Status | | | | | |
| Primary | 85.3 | % | | | 84.2 | % |
| Secondary | 10.7 | % | | | 10.7 | % |
| Investor | 4.0 | % | | | 5.1 | % |
| Total | 100.0 | % | | | 100.0 | % |
| | December 31, 2006 Percentage | | | December 31, 2005 Percentage | |
Documentation Type | | | | | |
| Full Documentation | 70.1 | % | | | 61.8 | % |
| Stated Income | 21.3 | % | | | 24.1 | % |
| Stated Income/ Stated Assets | 7.2 | % | | | 11.8 | % |
| No Documentation | 0.9 | % | | | 1.6 | % |
| No Ratio | 0.5 | % | | | 0.7 | % |
| Total | 100.0 | % | | | 100.0 | % |
| | December 31, 2006 Percentage | | | December 31, 2005 Percentage | |
Loan Purpose | | | | | |
| Purchase | 57.3 | % | | | 60.0 | % |
| Cash out refinance | 26.1 | % | | | 25.2 | % |
| Rate & term refinance | 16.6 | % | | | 14.8 | % |
| Total | 100.0 | % | | | 100.0 | % |
| | December 31, 2006 Percentage | | | December 31, 2005 Percentage | |
Geographic Distribution: 5% or more in any one state | | | | | |
| NY | 26.2 | % | | | 32.7 | % |
| MA | 14.4 | % | | | 19.4 | % |
| CA | 6.8 | % | | | 14.1 | % |
| NJ | ─ | | | | 5.8 | % |
| FL | ─ | | | | 5.4 | % |
| Other (less than 5% individually) | 52.6 | % | | | 22.6 | % |
| Total | 100.0 | % | | | 100.0 | % |
Delinquency Status
As of December 31, 2006,2008, we had seven17 delinquent loans totaling $6.8approximately $7.4 million categorized as Mortgage Loans Held in Securitization Trusts. The table below shows delinquencies in our loan portfolio as of December 31, 20062008 (dollar amounts in thousands):
Days Late | | Number of Delinquent Loans | | Total Dollar Amount | | % of Loan Portfolio | |
| 30-60 | | | 1 | | $ | 166.4 | | | 0.03 | % |
| 61-90 | | | 1 | | | 193.1 | | | 0.03 | % |
| 90+ | | | 5 | | $ | 6,444.5 | | | 1.10 | % |
As of December 31, 2005, we had four delinquent loans totaling $2.0 million categorized as Mortgage Loans Held in Securitization Trusts. The table below shows delinquencies in our loan portfolio as of December 31, 2005 (dollar amounts in thousands):
Days Late | | Number of Delinquent Loans | | Total Dollar Amount | | % of Loan Portfolio | |
| 30-60 | | | 1 | | $ | 193.1 | | | 0.02 | % |
| 61-90 | | | ─ | | | ─ | | | ─ | |
| 90+ | | | 3 | | $ | 1,771.0 | | | 0.23 | % |
| Days Late | | Number of Delinquent Loans | | Total Dollar Amount | | % of Loan Portfolio | |
| 30-60 | | 3 | | $ | 1,363 | | 0.39 | % |
| 61-90 | | 1 | | $ | 263 | | 0.08 | % |
| 90+ | | 13 | | $ | 5,734 | | 1.65 | % |
| Real Estate Owned (REO) | | 4 | | $ | 1,927 | | 0.55 | % |
Interest is recognized as revenue when earned according to the terms of the mortgage loans and when, in the opinion of management, it is collectible. The accrual of interest on loans is discontinued when, in management’s opinion, the interest is not collectible in the normal course of business, but in no case beyond when payment on a loan becomes 90 days delinquent. Interest collected on loans for which accrual has been discontinued is recognized as income upon receipt.
Investment Securities - Available for Sale. Our securities portfolio consists of agency securities or AAA-rated residential mortgage-backed securities. At December 31, 2006, we had no investment securities in a single issuer or entity (other than a government sponsored agency of the U.S. Government) that had an aggregate book value in excess of 10% of our total assets. The following tables set forth the credit characteristics of our securities portfolio as of December 31, 2006 and December 31, 2005:
Characteristics of Our Investment Securities (dollar amounts in thousands):
December 31, 2006 | | | Sponsor or Rating | | | Par Value | | | Carrying Value | | | % of Portfolio | | | Coupon | | | Yield | |
| Credit | | | | | | | | | | | | | | | | | | | |
| Agency REMIC CMO Floating Rate | | | FNMA/FHLMC/GNMA | | $ | 163,121 | | $ | 163,898 | | | 34 | % | | 6.72 | % | | 6.40 | % |
| Private Label Floating Rate | | | AAA | | | 22,392 | | | 22,284 | | | 5 | % | | 6.12 | % | | 6.46 | % |
| Private Label ARMs | | | AAA | | | 287,018 | | | 284,874 | | | 58 | % | | 4.82 | % | | 5.71 | % |
| NYMT Retained Securities | | | AAA-BBB | | | 15,996 | | | 15,894 | | | 3 | % | | 5.67 | % | | 6.02 | % |
| NYMT Retained Securities | | | Below Investment Grade | | | 2,767 | | | 2,012 | | | 0 | % | | 5.67 | % | | 18.35 | % |
| Total/Weighted Average | | | | | $ | 491,294 | | $ | 488,962 | | | 100 | % | | 5.54 | % | | 6.06 | % |
Characteristics of Our Investment Securities (dollar amounts in thousands):
December 31, 2005 | | Sponsor or Rating | | Par Value | | Carrying Value | | % of Portfolio | | Coupon | | Yield | |
Credit | | | | | | | | | | | | | |
| Agency REMIC CMO Floating Rate | | | FNMA/FHLMC/GNMA | | $ | 13,505 | | $ | 13,535 | | | 2 | % | | 5.56 | % | | 5.45 | % |
| FHLMC Agency ARMs | | | FHLMC | | | 91,835 | | | 91,217 | | | 13 | % | | 4.28 | % | | 3.82 | % |
| FNMA Agency ARMs | | | FNMA | | | 298,526 | | | 297,048 | | | 41 | % | | 4.18 | % | | 3.91 | % |
| Private Label ARMs | | | AAA | | | 315,835 | | | 314,682 | | | 44 | % | | 4.74 | % | | 4.51 | % |
| Total/Weighted Average | | | | | $ | 719,701 | | $ | 716,482 | | | 100 | % | | 4.47 | % | | 4.19 | % |
The following table sets forth the stated reset periods and weighted average yields of our investment securities at December 31, 2006 and December 31, 2005 (dollar amounts in thousands):
| | | Less than 6 Months | | More than 6 Months To 24 Months | | More than 24 Months To 60 Months | | Total | |
December 31, 2006 | | Carrying Value | | Weighted Average Yield | | Carrying Value | | Weighted Average Yield | | Carrying Value | | Weighted Average Yield | | Carrying Value | | Weighted Average Yield | |
| | | | | | | | | | | | | | | | | | |
| Agency REMIC CMO Floating Rate | | $ | 163,898 | | | 6.40 | % | $ | — | | | — | | $ | — | | | — | | $ | 163,898 | | | 6.40 | % |
| Private Label Floating Rate | | | 22,284 | | | 6.46 | % | | — | | | — | | | — | | | — | | | 22,284 | | | 6.46 | % |
| Private Label ARMs | | | 16,673 | | | 5.60 | % | | 78,565 | | | 5.80 | % | | 183,612 | | | 5.64 | % | | 278,850 | | | 5.68 | % |
| NYMT Retained Securities | | | 6,024 | | | 7.12 | % | | — | | | — | | | 17,906 | | | 7.83 | % | | 23,930 | | | 7.66 | % |
| Total | | $ | 208,879 | | | 6.37 | % | $ | 78,565 | | | 5.80 | % | $ | 201,518 | | | 5.84 | % | $ | 488,962 | | | 6.06 | % |
| | | Less than 6 Months | | More than 6 Months To 24 Months | | More than 24 Months To 60 Months | | Total | |
December 31, 2005 | | Carrying Value | | Weighted Average Yield | | Carrying Value | | Weighted Average Yield | | Carrying Value | | Weighted Average Yield | | Carrying Value | | Weighted Average Yield | |
| | | | | | | | | | | | | | | | | | |
| Agency REMIC CMO Floating Rate | | $ | 13,535 | | | 5.45 | % | $ | — | | | | | $ | — | | | — | | $ | 13,535 | | | 5.45 | % |
| FHLMC Agency ARMs | | | — | | | — | | | 91,217 | | | 3.82 | % | | — | | | — | | | 91,217 | | | 3.82 | % |
| FNMA Agency ARMs | | | — | | | — | | | 297,048 | | | 3.91 | % | | — | | | — | | | 297,048 | | | 3.91 | % |
| Private Label ARMs | | | — | | | — | | | 57,605 | | | 4.22 | % | | 257,077 | | | 4.57 | % | | 314,682 | | | 4.51 | % |
| Total | | $ | 13,535 | | | 5.45 | % | $ | 445,870 | | | 3.93 | % | $ | 257,077 | | | 4.57 | % | $ | 716,482 | | | 4.19 | % |
Mortgage Lending Related Assets
Mortgage Loans Held for Sale. Mortgage loans that we have originated but do not intend to hold for investment and are held pending sale to investors are classified as “mortgage loans held for sale.” We had mortgage loans held for sale of $106.9 million at December 31, 2006 as compared to $108.3 million at December 31, 2005. We use warehouse lines of credit and loan aggregation facilities to finance our mortgage loans held for sale. Fluctuations in mortgage loans held for sale, warehouse lines of credit, due to/from loan purchasers and related accounts are dependent on factors such as loan production, seasonality and our investor’s ability to purchase loans on a timely basis.
Due from Purchasers.We had amounts due from loan purchasers totaling $88.4 million at December 31, 2006 as compared to $121.8 million at December 31, 2005. Amounts due from loan purchasers are a receivable for the principal and premium due to us for loans that have been shipped to permanent investors but for which payment has not yet been received at period end.
Escrow Deposits - Pending Loan Closings. We had escrow deposits pending loan closing of $3.8 million at December 31, 2006 as compared to $1.4 million at December 31, 2005. Escrow deposits pending loan closing are advance cash fundings by us to escrow agents to be used to close loans within the next one to three business days.
Non-Loan or Investment Assets
Cash and Cash Equivalents.We had unrestricted cash and cash equivalents of $0.9$24.5 million at December 31, 2006 versus $9.1 million at December 31, 2005.2009.
Restricted Cash. Restricted cash totaled $3.0 million as of December 31, 2009. Included in restricted cash was $2.9 million related to amounts deposited to meet margin calls on interest rate swaps and $0.1 million related to a letter of credit for the corporate headquarter lease.
Prepaid and Other Assets. Prepaid and other assets totaled $20.5$2.1 million as of December 31, 2006. Prepaid2009 and other assets consist primarilyconsisted mainly of a deferred tax benefit of $18.4$0.5 million andreal estate owned (“REO”), $0.2 million in escrow advances related to mortgage loans held by us which are pending remedial action (such as updating loan documentation) or which do not currently meet third-party investor criteria.in securitization trust, $0.5 million of capitalization expenses related to equity and bond issuance cost and $0.3 million prepaid insurance.
Property and Equipment, Net - Property and equipment totaled $6.5 million as of December 31, 2006 and have estimated lives ranging from three to ten years, and are stated at cost less accumulated depreciation and amortization. Depreciation is determined in amounts sufficient to charge the cost of depreciable assets to operations over their estimated service lives using the straight-line method. Leasehold improvements are amortized over the lesser of the life of the lease or service lives of the improvements using the straight-line method.
Balance Sheet Analysis - Financing Arrangements
Financing Arrangements, Mortgage Loans Held for Sale/for Investment.Portfolio Investments.We had debt outstanding on our financing facilities which finance our mortgage loans held for sale of $173.0 million at December 31, 2006 as compared to $225.2 million at December 31, 2005. As of December 31, 2006,2009, there were approximately $85.1 million of repurchase agreement borrowings outstanding. Our repurchase agreements typically provide for terms of 30 days. As of December 31, 2009, the current weighted average borrowing rate on these financing facilities is 5.93%was 0.27%. The fluctuations in mortgage loans held for sale and short-term borrowings are dependent on loans we have originated during the period as well as loans we have sold outright.
Financing Arrangements, Portfolio InvestmentsCollateralized Debt Obligations.We have arrangements to enter into repurchase agreements with 23 different financial institutions having a total line capacity of $5.1 billion. As of December 31, 2006 and December 31, 2005, there were $0.8 billion and $1.2 billion, respectively,2009, we had $266.8 million of repurchase borrowings outstanding. Our repurchase agreements typically have termsCDOs outstanding with a weighted average interest rate of 30 days.0.61%.
Subordinated Debentures. As of December 31, 2006, the current weighted average borrowing rate on these financing facilities is 5.37%.
Collateralized Debt Obligations. There were no new securitization transactions accounted for as a financing during 2006. On December 20, 2005 we issued CDOs secured by ARM loans and restricted cash placed as collateral for prefunded loans which will be replaced by ARM loans within 30 days. For financial reporting purposes, the ARM loans and restricted cash held as collateral are recorded as assets of the Company and the CDO is recorded as the Company’s debt. The transaction includes interest rate caps and are held by the trust and recorded as an asset or liability of the Company. The interest rate cap limits the interest rate exposure on these transactions. As of December 31, 2006 we have CDO outstanding of $197.4 million with an average interest rate of 5.72%.
Subordinated Debentures. As of December 31, 2006, we have2009, our wholly owned subsidiary, HC, had trust preferred securities outstanding of $45.0 million.$44.9 million net of deferred bond issuance costs of $0.1 million, with a weighted average interest rate of 5.93%. The securities are fully guaranteed by the Companyour company with respect to distributions and amounts payable upon liquidation, redemption or repayment. These securities are classified as subordinated debentures in the liability section of the Company’sour consolidated balance sheet.
$25.0 million of our subordinated debentures have a floating interest rate equal to three-month LIBOR plus 3.75%, resetting quarterly, (9.12%(4.00% at December 31, 2006)2009). These securities mature on March 15, 2035 and may be called at par by the Companyus any time after March 15, 2010. NYMCHC entered into an interest rate cap agreement to limit the maximum interest rate cost of thethese trust preferred securities to 7.5%. through March 15, 2010. The term of the interest rate cap agreement is five years and resets quarterly in conjunction with the reset periods of the trust preferred securities.securities and is schedule to mature in March 2010.
$2020.0 million of our subordinated debentures have a fixed interest rate equal to 8.35% up to and including July 30, 2010, at which point the interest rate is converted to a floating rate equal to one-month LIBOR plus 3.95% until maturity. The securities mature on October 30, 2035 and may be called at par by the Companyus any time after October 30, 2010.
Convertible Preferred Debentures. At December 31, 2009 we had $19.9 million of convertible preferred debentures outstanding, net of $0.1 million of deferred debt issuance cost. We issued these shares of Series A Preferred Stock to JMP Group Inc. and certain of its affiliates for an aggregate purchase price of $20.0 million. The Series A Preferred Stock entitles the holders to receive a cumulative dividend of 10% per year, subject to an increase to the extent any quarterly common stock dividends exceed $0.20 per share. The current dividend rate is 12.5% based on the fourth quarter common stock dividend of $0.25. The Series A Preferred Stock is convertible into shares of our common stock based on a conversion price of $8.00 per share of common stock, which represents a conversion rate of two and one-half (2 ½) shares of common stock for each share of Series A Preferred Stock. Any shares of Series A Preferred Stock that remain outstanding on December 31, 2010 must be redeemed in exchange for the liquidation amount, which is $20.0 million plus all accrued and unpaid dividends. Because of this mandatory redemption feature, we classify these securities as a liability on our balance sheet.
Derivative Assets and Liabilities.We generally hedge only the risk related to changes in the benchmark interest rate used in the variable rate index, usually a London Interbank Offered Rate known as LIBOR, or a U.S. Treasury rate.(“LIBOR”).
In order to reduce these risks, we enter into interest rate swap agreements whereby we receive floating rate payments in exchange for fixed rate payments, effectively converting theour short term repurchase agreement borrowing or CDOs to a fixed rate. We also enter into interest rate cap agreements whereby, in exchange for a fee, we are reimbursed for interest paid in excess of a contractually specified capped rate.
Derivative financial instruments contain credit risk to the extent that the institutional counterparties may be unable to meet the terms of the agreements. We minimize this risk by using multiple counterparties and limiting our counterparties to major financial institutions with good credit ratings. In addition, we regularly monitor the potential risk of loss with any one party resulting from this type of credit risk. Accordingly, we do not expect any material losses as a result of default by other parties.parties, but can not guaranty we do not have counterparty failures.
We enter into derivative transactions solely for risk management purposes. The decision of whether or not a given transaction, (oror a portion thereof)thereof, is hedged is made on a case-by-case basis, based on the risks involved and other factors as determined by senior management, including the financial impact on income and asset valuation and the restrictions imposed on REIT hedging activities by the Internal Revenue Code, among others. In determining whether to hedge a risk, we may consider whether other assets, liabilities, firm commitments and anticipated transactions already offset or reduce the risk. All transactions undertaken as a hedge are entered into with a view towards minimizing the potential for economic losses that could be incurred by us. Generally, all derivatives entered into are intended to qualify as hedges in accordance with GAAP, unless specifically precluded under SFAS No. 133 Accounting for Derivative Instruments and Hedging Activities.cash flow hedges. To this end, terms of the hedges are matched closely to the terms of hedged items.
We have also developed risk management programs and processes designed to manage market risk associated with normal mortgage banking and mortgage-backed securities investment activities.
In the normal course of our mortgage loan origination business, we enter into contractual interest rate lock commitments, or IRLCs, to extend credit to finance residential mortgages. These commitments, which contain fixed expiration dates, become effective when eligible borrowers lock-in a specified interest rate within time frames established by our origination, credit and underwriting practices. Interest rate risk arises if interest rates change between the time of the lock-in of the rate by the borrower and the sale of the loan.
To mitigate the effect of the interest rate risk inherent in issuing an IRLC from the lock-in date to the funding date of a loan, we generally enter into forward sale loan contracts, or FSLCs. Once a loan has been funded, our risk management objective for our mortgage loans held for sale is to protect earnings from an unexpected charge due to a decline in value of such mortgage loans. Our strategy is to engage in a risk management program involving the designation of FSLCs (the same FSLCs entered into at the time of the IRLC) to hedge most of our mortgage loans held for sale.
The following table summarizes the estimated fair value of derivative assets and liabilities as of December 31, 20062009 and December 31, 20052008 (dollar amounts in thousands):
| | | December 31, 2006 | | December 31, 2005 | |
Derivative Assets: | | | | | |
| Continuing Operations: | | | | | |
| Interest rate caps | | $ | 1,045 | | $ | 2,163 | |
| Interest rate swaps | | | 621 | | | 6,383 | |
Total derivative assets, continuing operations | | | 1,666 | | | 8,546 | |
| | | | | | | | |
| Discontinued Operation: | | | | | | | |
| Interest rate caps | | | 966 | | | 1,177 | |
| Forward loan sale contracts - loan commitments | | | 48 | | | — | |
| Forward loan sale contracts - mortgage loans held for sale | | | 39 | | | — | |
| Forward loan sale contracts - TBA securities | | | 84 | | | — | |
| Interest rate lock commitments - loan commitments | | | — | | | 123 | |
Total derivative assets, discontinued operation | | | 1,137 | | | 1,300 | |
| | | | | | | | |
Total derivative assets | | $ | 2,803 | | $ | 9,846 | |
| | | | | | | | |
Derivative liabilities: | | | | | | | |
| Discontinued Operation: | | | | | | | |
| Forward loan sale contracts - loan commitments | | $ | — | | $ | (38 | ) |
| Forward loan sale contracts - mortgage loans held for sale | | | — | | | (18 | ) |
| Forward loan sale contracts - TBA securities | | | — | | | (324 | ) |
| Interest rate lock commitments - loan commitments | | | (118 | ) | | — | |
| Interest rate lock commitments - mortgage loans held for sale | | | (98 | ) | | (14 | ) |
Total derivative liabilities, discontinued operation | | $ | (216 | ) | $ | (394 | ) |
| | | December 31, 2009 | | | December 31, 2008 | |
| Derivative assets: | | | | | | |
| Interest rate caps | | $ | 4 | | | $ | 22 | |
| Total derivative assets | | $ | 4 | | | $ | 22 | |
| | | | | | | | | |
| Derivative liabilities: | | | | | | | | |
| Interest rate swaps | | $ | 2,511 | | | $ | 4,194 | |
| Total derivative liabilities | | $ | 2,511 | | | $ | 4,194 | |
Balance Sheet Analysis - Stockholders’ Equity
Stockholders’ equity at December 31, 20062009 was $71.6$63.0 million and included $4.4$11.8 million of net unrealized gains, $2.9 million in unrealized derivative losses onrelated to cash flow hedges and $14.7 million in unrealized gains related to available for sale securities and cash flow hedges presented as accumulated other comprehensive income.
Statement of Operations Analysis
SecuritizationsThe following is a brief description of key terms from our statements of operations:
NYMT 2006-1-RevenuesDuring. Our primary source of income is net interest income on our portfolio of assets. Net interest income is the twelve monthdifference between interest income, which is the income that we earn on our assets, and interest expense, which is the expense we pay on our portfolio borrowings, subordinated debt and convertible preferred debentures. Prior to our exit from the mortgage lending business in March 2007, net interest income was also earned on the majority of loan originations by HC for the period of time commencing upon the closing of a loan and ending upon the sale of such loan to a third party.
Other Income (expense). Other income (expense) includes loan losses for costs incurred with respect to the disposition of non-performing or early payment default loans we have originated or purchased from third parties or from losses incurred on non-performing loans held in securitization trusts. In addition, other income (expense) includes net gains (losses) from the sale of investments securities or the early termination of interest rate swaps.
Expenses. Expenses we incur in our business consist primarily of salary and employee benefits, rent for office space and equipment expenses, and other general and administrative expenses. Other general and administrative expenses include expenses for professional fees, office supplies, postage and shipping, telephone, insurance, travel and entertainment and other miscellaneous operating expenses. Beginning in 2008, expenses include the fees payable to HCS pursuant to the advisory agreement.
Income (loss) from discontinued operation. Income (loss) from discontinued operations includes all revenues and expenses related to our discontinued mortgage lending business excluding those costs that will be retained by us. See note 8 to our consolidated financial statements included in this Annual Report on Form 10-K for more information regarding our discontinued operations.
Results of Operations - Comparison of Years Ended December 31, 2009, 2008 and 2007
| (dollar amounts in thousands) | | For the Years Ended December 31, | |
| | | 2009 | | | 2008 | | | % Change | | | 2007 | | | % Change | |
| Net interest income | | $ | 16,860 | | | $ | 7,863 | | | | 114.4 | % | | $ | 477 | | | | 1,548.4 | % |
| Other income (expense) | | $ | 901 | | | $ | (26,717 | ) | | | (103.4 | )% | | $ | (18,513 | ) | | | 44.3 | % |
| Total expenses | | $ | 6,877 | | | $ | 6,910 | | | | (0.5 | )% | | $ | 2,754 | | | | 150.9 | % |
| Income (loss) for continuing operations | | $ | 10,884 | | | $ | (25,764 | ) | | | (142.2 | )% | | $ | (20,790 | ) | | | 23.9 | % |
| Income (loss) from discontinued operations | | $ | 786 | | | $ | 1,657 | | | | (52.6 | )% | | $ | (34,478 | ) | | | (104.8 | )% |
| Net gain (loss) | | $ | 11,670 | | | $ | (24,107 | ) | | | (148.4 | )% | | $ | (55,268 | ) | | | (56.4 | )% |
| Basic gain (loss) per share | | $ | 1.25 | | | $ | (2.91 | ) | | | (143.0 | )% | | $ | (30.47 | ) | | | (90.4 | )% |
| Diluted gain (loss) per share | | $ | 1.19 | | | $ | (2.91 | ) | | | (140.9 | )% | | $ | (30.47 | ) | | | (90.4 | )% |
For the year ended December 31, 2006,2009, we completedreported net income of $11.7 million as compared to a net loss of $24.1 million for the securitization of approximately $277.4year ended December 31, 2008, which represents a $35.8 million of high-credit quality, first-lien, adjustable rate mortgageimprovement. The increase in net income was due primarily to significantly improved operating conditions, a first quarter 2009 portfolio restructuring that resulted in increased portfolio yields, and hybrid adjustable rate mortgages. We accounted for this securitization asreduced borrowing costs that have resulted from a non-recourse sale in accordance with SFAS 140, “Accounting for Transfers and Servicing of Financial Assets and Extinguishments of Liabilities.”
The amount of each class of notes, together with thelower interest rate and credit ratings for each class are set forth below (dollar amountsenvironment. The large realized loss recorded in thousands):
Class | | | Approximate Principal Amount | | | Interest Rate (%) | | | Moody’s/Fitch Rating | |
| 1-A-1 | | $ | 6,726 | | | 5.648 | | | Aaa/AAA | |
| 2-A-1 | | | 148,906 | | | 5.673 | | | Aaa/AAA | |
| 2-A-2 | | | 20,143 | | | 5.673 | | | Aaa/AAA | |
| 2-A-3 | | | 65,756 | | | 5.673 | | | Aaa/AAA | |
| 2-A-4 | | | 9,275 | | | 5.673 | | | Aa1/AAA | |
| 3-A-1 | | | 16,055 | | | 5.855 | | | Aaa/AAA | |
| B-1 | | | 3,746 | | | 5.683 | | | Aa2/AA | |
| B-2 | | | 2,497 | | | 5.683 | | | A2/A | |
| B-3 | | | 1,525 | | | 5.683 | | | Baa2/BBB | |
| B-4 | | | 1,387 | | | 5.683 | | | NR/BB | |
| B-5 | | | 694 | | | 5.683 | | | NR/B | |
| B-6 | | $ | 693 | | | 5.683 | | | NR | |
NR-such rating agency has not been asked to rate these certificates.
During 2005, we completed three CDO transactions in which we securitized $896.9 million of our residential mortgage loans into a series of multi-class adjustable rate securities. In the first two CDOs, we elected to retain 100% of the resultant securities and finance them through repurchase agreements. The creation of mortgage-backed securities of our mortgage loans in this manner provides an asset with better liquidity and longer-term financing at better rates as opposed to financing whole loans through warehouse lines. Beginning with our third CDO of self-originated mortgage loans in December 2005, $235 million of ARM loans were permanently financed through the issuance of securities to third parties. Because we did not retain all of the resultant securities as in prior CDOs, this securitization eliminated the risk of short-term financing (eliminating the asset to liability duration gap) and the mark-to-market pricing risk inherent in financing through repurchase agreements or warehouse lines of credit; as2008 was primarily a result of this permanent financing we are not subjectthe March 2008 market disruption and the Company’s response to margin calls.
We did not account for these securitizations as sales because the transactions are secured borrowings under SFAS 140, “Accounting for Transfers and Servicingthat disruption. The Company sold an aggregate of Financial Assets and Extinguishments of Liabilities.” A summary of the three CDOs completed in 2005 follows.
New York Mortgage Trust 2005-1. February 25, 2005 - securitization of approximately $419.0$592.8 million of high-credit quality, first-lien, adjustable rate mortgageAgency RMBS in its portfolio during March 2008 in an effort to reduce its leverage and hybrid adjustable rate mortgages. The amountimprove its liquidity position in response to the market disruption and incurred a loss of each class$15.0 million. In addition, the Company terminated a total of notes, together with the$517.7 million of notional interest rate and credit ratings for each class as rated by S&P, are set forth below (dollar amountsswaps in thousands):the quarter ended March 31, 2008, resulting in a realized loss of $4.8 million.
Class | | | Approximate Principal Amount | | | Interest Rate | | | S&P Rating | |
| A | | $ | 391,761 | | | LIBOR + 27bps | | | AAA | |
| M-1 | | $ | 18,854 | | | LIBOR + 50bps | | | AA | |
| M-2 | | $ | 6,075 | | | LIBOR + 85bps | | | A | |
AtFor the timeyear ended December 31, 2008, we reported a net loss of securitization,$24.1 million, as compared to a net loss of $55.3 million for the weighted average loan-to-valueyear ended December 31, 2007. The decrease in net loss of $31.2 million was due to the following factors: $7.4 million improvement in net interest margin due mainly from reduced financing costs, $36.1 million net earnings improvement in our discontinued operations which was due to the sale of the mortgage loansorigination business in the trust was approximately 68.8%March of 2007, offset by an increase in realized losses from sale of securities and the weighted average FICO score was approximately 729. The weighted average current loan ratetermination of the pool of mortgage loans is approximately 5.36% and the weighted average maximum loan rate (after periodic rate resets) is 10.62%, and weighted average months to roll of 17months with 64% rolling in 6 months.
New York Mortgage Trust 2005-2. July 29, 2005 - securitization of approximately $242.9 million of high-credit quality, first-lien, adjustable rate mortgage and hybrid adjustable rate mortgages. The amount of each class of notes, together with the interest rate and credit ratings for each class as rated by S&P, are set forth below (dollar amountsswaps in thousands):
Class | | Approximate Principal Amount | | Interest Rate | | S&P Rating | |
| A | | $ | 217,126 | | | LIBOR + 33bps | | | AAA | |
| M-1 | | $ | 16,029 | | | LIBOR + 60bps | | | AA | |
| M-2 | | $ | 6,314 | | | LIBOR + 100bps | | | A | |
At the time of securitization, the weighted average loan-to-value of the mortgage loans in the trust was approximately 69.8% and the weighted average FICO score was approximately 736. The weighted average current loan rate of the pool of mortgage loans is approximately 5.46% and the weighted average maximum loan rate (after periodic rate resets) is 11.22%.2008.
Comparative Net Interest Income
New York Mortgage Trust 2005-3.| | | For the years ended December 31, | |
| | | 2009 | | | 2008 | | | 2007 | |
| | | Average Balance | | | Amount | | | Yield/ Rate | | | Average Balance | | | Amount | | | Yield/ Rate | | | Average Balance | | | Amount | | | Yield/ Rate | |
| | | ($Millions) | | | | | | | | | ($Millions) | | | | | | | | | ($Millions) | | | | | | | |
| Interest Income: | | | | | | | | | | | | | | | | | | | | | | | | | | | |
| Investment securities and loans held in the securitization trusts | | $ | 643.2 | | | $ | 30,085 | | | | 4.68 | % | | $ | 907.3 | | | $ | 44,778 | | | | 4.94 | % | | $ | 907.0 | | | $ | 52,180 | | | | 5.74 | % |
| Amortization of net premium | | | (31.3 | ) | | | 1,010 | | | | 0.40 | % | | | 1.4 | | | | (655 | ) | | | (0.08 | )% | | | 2.4 | | | | (1,616 | ) | | | (0.18 | %) |
| Interest income | | $ | 611.9 | | | $ | 31,095 | | | | 5.08 | % | | $ | 908.7 | | | $ | 44,123 | | | | 4.86 | % | | $ | 909.4 | | | $ | 50,564 | | | | 5.56 | % |
| | | | | | | | | | | | | | | | | | | | | | | | | | | | | | | | | | | | | |
| Interest Expense: | | | | | | | | | | | | | | | | | | | | | | | | | | | | | | | | | | | | |
| Investment securities and loans held in the securitization trusts | | $ | 537.0 | | | $ | 8,572 | | | | 1.57 | % | | $ | 820.5 | | | $ | 30,351 | | | | 3.65 | % | | $ | 864.7 | | | $ | 46,529 | | | | 5.31 | % |
| Subordinated debentures | | | 45.0 | | | | 3,189 | | | | 6.99 | % | | | 45.0 | | | | 3,760 | | | | 8.24 | % | | | 45.0 | | | | 3,558 | | | | 7.80 | % |
| Convertible preferred debentures | | | 20.0 | | | | 2,474 | | | | 12.20 | % | | | 20.0 | | | | 2,149 | | | | 10.60 | % | | | — | | | | — | | | | — | |
| Interest expense | | $ | 602.0 | | | $ | 14,235 | | | | 2.33 | % | | $ | 885.5 | | | $ | 36,260 | | | | 4.09 | % | | $ | 909.7 | | | $ | 50,087 | | | | 5.43 | % |
| Net interest income | | | | | | $ | 16,860 | | | | 2.75 | % | | | | | | $ | 7,863 | | | | 0.77 | % | | | | | | $ | 477 | | | | 0.13 | % |
The increase in net interest income for the year ended December 20, 2005 - securitization31, 2009 as compared to the year ended December 31, 2008 was primarily the result of the restructuring of our investment securities portfolio during 2009, which included the sale of $193.8 million of lower yielding Agency CMO floaters, the purchase of $46.0 million of CLO's that generally return a higher-yield than the Agency CMO floaters we sold and the addition of approximately $235.0$27.5 million of high-credit quality, first-lien, adjustable rate mortgage and hybrid adjustable rate mortgages. The amountnon-Agency RMBS at a discounted price of each class60% of notes, together withpar value. In addition, our loans held in securitization trusts contributed to the improvement in net interest rate and credit ratingsincome for each class as rated by S&P and Moody’s, are set forth below (dollar amountsthe year ended December 31, 2009. Our portfolio of loans held in thousands):
Class | | Approximate Principal Amount | | Interest Rate | | S&P/Moody’s Rating | |
| A-1 | | $ | 70,000 | | | LIBOR + 24bps | | | AAA / Aaa | |
| A-2 | | $ | 98,267 | | | LIBOR + 23bps | | | AAA / Aaa | |
| A-3 | | $ | 10,920 | | | LIBOR + 32bps | | | AAA / Aaa | |
| M-1 | | $ | 25,380 | | | LIBOR + 45bps | | | AA+ / Aa2 | |
| M-2 | | $ | 24,088 | | | LIBOR + 68bps | | | AA / A2 | |
Atsecuritization trusts realized net margins of approximately 387 basis points for the time of securitization, the weighted average loan-to-value of the mortgage loans in the Trust was approximately 69.5% and the weighted average FICO score was approximately 732. The weighted average current loan rate of the pool of mortgage loans is approximately 5.79% and the weighted average maximum loan rate (after periodic rate resets) is 11.58%.
Prepayment Experienceyear ended December 31, 2009.
The cumulative prepayment rate (“CPR”) on our mortgage loan portfolio averaged approximately 19% during 2006 as compared to 27% during 2005. CPRs on our purchased portfolio of investment securities averaged approximately 16% while the CPRs on loans held for investment or held in our securitization trusts averaged approximately 22% during 2006. When prepayment expectations over the remaining life of assets increase, we have to amortize premiums over a shorter time period resulting in a reduced yield to maturity on our investment assets. Conversely, if prepayment expectations decrease, the premium would be amortized over a longer period resulting in a higher yield to maturity. We monitor our prepayment experience on a monthly basis and adjust the amortization of our net premiums accordingly.
Results of Operations
Ouroperating results of operations for our mortgage portfolio management segmentbusiness during a given period typically reflect the net interest spread earned on our investment portfolio of residential mortgage securities and loans and mortgage-backed securities.as well as CLO. The net interest spread is impacted by factors such as our cost of financing, the interest rate our investments are earning and our interest hedging strategies. Furthermore, the cost of originating loans held in our portfolio, the amount of premium or discount paid on purchased portfolio investments and the prepayment rates on portfolio investments will impact the net interest spread as such factors will be amortized over the expected term of such investments.
Our results of operations for our mortgage lending segment during a given period typically reflect the total volume of loans originated and closed by us during that period. The volume of closed loan originations generated by us in any period is impacted by a variety of factors. These factors include:
· | The demand for new mortgage loans. Reduced demand for mortgage loans causes closed loan origination volume to decline. Demand for new mortgage loans is directly impacted by current interest rate trends and other economic conditions. Rising interest rates tend to reduce demand for new mortgage loans, particularly loan refinancings, and falling interest rates tend to increase demand for new mortgage loans, particularly loan refinancings. |
· | Loan refinancing and home purchase trends. As discussed above, the volume of loan refinancings tends to increase following declines in interest rates and to decrease when interest rates rise. The volume of home purchases is also affected by interest rates, although to a lesser extent than refinancing volume. Home purchase trends are also affected by other economic changes such as inflation, improvements in the stock market, unemployment rates and other similar factors. |
· | Seasonality. Historically, according to the MBA, loan originations during late November, December, January and February of each year are typically lower than during other months in the year due, in part, to inclement weather, fewer business days (due to holidays and the short month of February), and the fact that home buyers tend to purchase homes during the warmer months of the year. As a result, loan volumes tend to be lower in the first and fourth quarters of a year than in the second and third quarters. |
· | Occasional spikes in volume resulting from isolated events. Mortgage lenders may experience spikes in loan origination volume from time to time due to non-recurring events or transactions, such as a large mass closing of a condominium project for which a bulk end-loan commitment was negotiated. |
In its February 12, 2007 Mortgage Finance Forecast, the MBA estimated that closed loan originations in the industry declined to $3.03 trillion in 2005 and $2.51 trillion in 2006. Although not forecast, a decline in the overall volume of closed loan originations may have a negative effect on our loan origination volume and net income.
The volume and cost of our loan production is critical to our financial results. The loans we produce generate gains as they are sold to third parties. Loans we retain for securitization serve as collateral for our mortgage securities. We do not recognize gain on sale income on loans originated by us and retained in our investment portfolio as they are recorded at cost and will generate revenues through their maturity and ultimate repayment. As the cost basis of a retained loan is typically lower than loans purchased from third parties or already placed in a securitization, we would expect an incremental yield increase on these loans relative to their purchased counterparts.
The cost of our production is also critical to our financial results as it is a significant factor in the gains we recognize. In addition, the type of loan production is an important factor in recognizing gain on sale premiums. Beginning near the end of the first quarter of 2004, our volume of FHA loans increased. Generally, FHA loans have lower average balances and FICO scores which are reflected in the statistics above. All FHA loans are currently and will be in the future sold or brokered to third parties. The following table summarizes our loan production for each quarter of 2006, 2005 and 2004.
| | | Number of Loans | | Aggregate Principal Balance ($ in millions) | | Percentage Of Total Principal | | Weighted Average Interest Rate | | Average Principal Balance | | Weighted Average | |
LTV | | FICO |
2006: | | | | | | | | | | | | | | | |
Fourth Quarter | | | | | | | | | | | | | | | |
| ARM | | | 647 | | $ | 218.2 | | | 37.3 | % | | 7.10 | % | $ | 337,270 | | | 73.5 | | | 699 | |
| Fixed-rate | | | 1,609 | | | 353.7 | | | 60.4 | % | | 7.14 | % | | 219,835 | | | 75.8 | | | 712 | |
Subtotal-non-FHA | | | 2,256 | | | 571.9 | | | 97.7 | % | | 7.13 | % | | 253,514 | | | 74.9 | | | 707 | |
| FHA - ARM | | | — | | | — | | | — | | | — | | | — | | | — | | | — | |
| FHA - fixed-rate | | | 83 | | | 13.7 | | | 2.3 | % | | 6.42 | % | | 164,723 | | | 94.6 | | | 650 | |
Subtotal - FHA | | | 83 | | | 13.7 | | | 2.3 | % | | 6.42 | % | | 164,723 | | | 94.6 | | | 650 | |
| Total ARM | | | 647 | | | 218.2 | | | 37.3 | % | | 7.10 | % | | 337,270 | | | 73.5 | | | 699 | |
| Total fixed-rate | | | 1,692 | | | 367.4 | | | 62.7 | % | | 7.11 | % | | 217,132 | | | 76.5 | | | 709 | |
Total Originations | | | 2,339 | | $ | 585.6 | | | 100.0 | % | | 7.11 | % | $ | 250,364 | | | 75.4 | | | 706 | |
| | | | | | | | | | | | | | | | | | | | | | | |
| Purchase mortgages | | | 1,350 | | $ | 306.0 | | | 52.3 | % | | 7.22 | % | $ | 226,633 | | | 80.2 | | | 720 | |
| Refinancings | | | 906 | | | 265.9 | | | 45.4 | % | | 7.02 | % | | 293,570 | | | 68.8 | | | 693 | |
Subtotal-non-FHA | | | 2,256 | | | 571.9 | | | 97.7 | % | | 7.13 | % | | 253,514 | | | 74.9 | | | 707 | |
| FHA - purchase | | | 71 | | | 11.3 | | | 1.9 | % | | 6.35 | % | | 159,550 | | | 96.9 | | | 661 | |
| FHA - refinancings | | | 12 | | | 2.4 | | | 0.4 | % | | 6.74 | % | | 195,333 | | | 83.4 | | | 597 | |
Subtotal - FHA | | | 83 | | | 13.7 | | | 2.3 | % | | 6.42 | % | | 164,723 | | | 94.6 | | | 650 | |
| Total purchase | | | 1,421 | | | 317.3 | | | 54.2 | % | | 7.19 | % | | 223,281 | | | 80.8 | | | 717 | |
| Total refinancings | | | 918 | | | 268.3 | | | 45.8 | % | | 7.02 | % | | 292,286 | | | 69.0 | | | 692 | |
Total Originations | | | 2,339 | | $ | 585.6 | | | 100.0 | % | | 7.11 | % | $ | 250,364 | | | 75.4 | | | 706 | |
Third Quarter | | | | | | | | | | | | | | | |
| ARM | | | 794 | | $ | 237.6 | | | 39.4 | % | | 7.27 | % | $ | 299,209 | | | 72.8 | | | 704 | |
| Fixed-rate | | | 1,709 | | | 351.1 | | | 58.2 | % | | 7.48 | % | | 205,433 | | | 75.6 | | | 711 | |
Subtotal-non-FHA | | | 2,503 | | | 588.7 | | | 97.6 | % | | 7.39 | % | | 235,180 | | | 74.5 | | | 708 | |
| FHA - ARM | | | 3 | | | 1.2 | | | 0.2 | % | | 6.06 | % | | 423,701 | | | 96.1 | | | 681 | |
| FHA - fixed-rate | | | 82 | | | 12.9 | | | 2.2 | % | | 6.61 | % | | 157,096 | | | 96.1 | | | 652 | |
Subtotal - FHA | | | 85 | | | 14.1 | | | 2.4 | % | | 6.56 | % | | 166,506 | | | 95.7 | | | 654 | |
| Total ARM | | | 797 | | | 238.8 | | | 39.6 | % | | 7.27 | % | | 299,678 | | | 72.9 | | | 704 | |
| Total fixed-rate | | | 1,791 | | | 364.0 | | | 60.4 | % | | 7.45 | % | | 203,220 | | | 76.4 | | | 709 | |
Total Originations | | | 2,588 | | $ | 602.8 | | | 100.0 | % | | 7.38 | % | $ | 232,925 | | | 75.0 | | | 707 | |
| | | | | | | | | | | | | | | | | | | | | | | |
| Purchase mortgages | | | 1,594 | | $ | 352.6 | | | 58.5 | | | 7.47 | % | $ | 221,215 | | | 79.0 | | | 718 | |
| Refinancings | | | 909 | | | 236.1 | | | 39.1 | | | 7.28 | % | | 259,670 | | | 67.8 | | | 693 | |
Subtotal-non-FHA | | | 2,503 | | | 588.7 | | | 97.6 | % | | 7.39 | % | | 235,180 | | | 74.5 | | | 708 | |
| FHA - purchase | | | 70 | | | 11.9 | | | 2.0 | | | 6.50 | % | | 170,453 | | | 96.5 | | | 664 | |
| FHA - refinancings | | | 15 | | | 2.2 | | | 0.4 | | | 6.84 | % | | 148,087 | | | 91.4 | | | 604 | |
Subtotal - FHA | | | 85 | | | 14.1 | | | 2.4 | | | 6.56 | % | | 166,506 | | | 95.7 | | | 654 | |
| Total purchase | | | 1,664 | | | 364.5 | | | 60.5 | | | 7.44 | % | | 219,079 | | | 79.5 | | | 716 | |
| Total refinancings | | | 924 | | | 238.3 | | | 39.5 | | | 7.27 | % | | 257,858 | | | 68.0 | | | 692 | |
Total Originations | | | 2,588 | | $ | 602.8 | | | 100.0 | % | | 7.38 | % | $ | 232,925 | | | 75.0 | | | 707 | |
| | | | | | | | | | | | | | | | | | | | | | | |
Second Quarter | | | | | | | | | | | | | | | | | | | | | | |
| ARM | | | 1,021 | | $ | 352.4 | | | 47.5 | % | | 6.83 | % | $ | 345,116 | | | 72.2 | | | 711 | |
| Fixed-rate | | | 1,687 | | | 358.8 | | | 48.4 | % | | 7.21 | % | | 212,710 | | | 75.1 | | | 713 | |
Subtotal-non-FHA | | | 2,708 | | | 711.2 | | | 95.9 | % | | 7.02 | % | | 262,631 | | | 73.7 | | | 712 | |
| FHA - ARM | | | 7 | | | 1.7 | | | 0.2 | % | | 5.60 | % | | 242,250 | | | 95.8 | | | 608 | |
| FHA - fixed-rate | | | 170 | | | 28.9 | | | 3.9 | % | | 6.32 | % | | 169,950 | | | 93.3 | | | 662 | |
Subtotal - FHA | | | 177 | | | 30.6 | | | 4.1 | % | | 6.28 | % | | 172,809 | | | 93.4 | | | 659 | |
| Total ARM | | | 1,028 | | | 354.1 | | | 47.7 | % | | 6.82 | % | | 344,415 | | | 72.3 | | | 711 | |
| Total fixed-rate | | | 1,857 | | | 387.7 | | | 52.3 | % | | 7.14 | % | | 208,795 | | | 76.5 | | | 709 | |
Total Originations | | | 2,885 | | $ | 741.8 | | | 100.0 | % | | 6.99 | % | $ | 257,120 | | | 74.5 | | | 710 | |
| | | | | | | | | | | | | | | | | | | | | | | |
| Purchase mortgages | | | 1,792 | | $ | 434.7 | | | 58.6 | % | | 7.10 | % | $ | 242,591 | | | 78.7 | | | 720 | |
| Refinancings | | | 916 | | | 276.5 | | | 37.3 | % | | 6.89 | % | | 301,836 | | | 65.8 | | | 698 | |
Subtotal-non-FHA | | | 2,708 | | | 711.2 | | | 95.9 | % | | 7.02 | % | | 262,631 | | | 73.7 | | | 712 | |
| FHA - purchase | | | 108 | | | 19.2 | | | 2.6 | % | | 6.23 | % | | 178,164 | | | 96.6 | | | 669 | |
| FHA - refinancings | | | 69 | | | 11.4 | | | 1.5 | % | | 6.38 | % | | 164,429 | | | 88.0 | | | 642 | |
Subtotal - FHA | | | 177 | | | 30.6 | | | 4.1 | % | | 6.28 | % | | 172,809 | | | 93.4 | | | 659 | |
| Total purchase | | | 1,900 | | | 453.9 | | | 61.2 | % | | 7.07 | % | | 238,929 | | | 79.4 | | | 718 | |
| Total refinancings | | | 985 | | | 287.9 | | | 38.8 | % | | 6.87 | % | | 292,210 | | | 66.7 | | | 696 | |
Total Originations | | | 2,885 | | $ | 741.8 | | | 100.0 | % | | 6.99 | % | $ | 257,120 | | | 74.5 | | | 710 | |
First Quarter | | | | | | | | | | | | | | | | | | | | | | |
| ARM | | | 924 | | $ | 290.6 | | | 47.3 | % | | 6.71 | % | $ | 314,555 | | | 71.6 | | | 705 | |
| Fixed-rate | | | 1,442 | | | 299.2 | | | 48.8 | % | | 7.06 | % | | 207,519 | | | 73.3 | | | 712 | |
Subtotal-non-FHA | | | 2,366 | | | 589.8 | | | 96.1 | % | | 6.89 | % | | 249,320 | | | 72.5 | | | 709 | |
| FHA - ARM | | | 2 | | | 0.5 | | | 0.1 | % | | 5.57 | % | | 228,253 | | | 93.0 | | | 646 | |
| FHA - fixed-rate | | | 142 | | | 23.5 | | | 3.8 | % | | 6.13 | % | | 165,161 | | | 92.7 | | | 650 | |
Subtotal - FHA | | | 144 | | | 24.0 | | | 3.9 | % | | 6.12 | % | | 166,037 | | | 92.7 | | | 650 | |
| Total ARM | | | 926 | | | 291.1 | | | 47.4 | % | | 6.71 | % | | 314,369 | | | 71.7 | | | 705 | |
| Total fixed-rate | | | 1,584 | | | 322.7 | | | 52.6 | % | | 6.99 | % | | 203,722 | | | 74.7 | | | 708 | |
Total Originations | | | 2,510 | | $ | 613.8 | | | 100.0 | % | | 6.86 | % | $ | 244,542 | | | 73.2 | | | 706 | |
| | | | | | | | | | | | | | | | | | | | | | | |
| Purchase mortgages | | | 1,430 | | $ | 335.5 | | | 54.7 | % | | 6.94 | % | $ | 234,600 | | | 77.2 | | | 722 | |
| Refinancings | | | 936 | | | 254.3 | | | 41.4 | % | | 6.81 | % | | 271,809 | | | 66.2 | | | 692 | |
Subtotal-non-FHA | | | 2,366 | | | 589.8 | | | 96.1 | % | | 6.89 | % | | 249,320 | | | 72.5 | | | 709 | |
| FHA - purchase | | | 70 | | | 12.7 | | | 2.1 | % | | 6.07 | % | | 181,325 | | | 96.4 | | | 655 | |
| FHA - refinancings | | | 74 | | | 11.3 | | | 1.8 | % | | 6.17 | % | | 151,576 | | | 88.6 | | | 645 | |
Subtotal - FHA | | | 144 | | | 24.0 | | | 3.9 | % | | 6.12 | % | | 166,037 | | | 92.7 | | | 650 | |
| Total purchase | | | 1,500 | | | 348.2 | | | 56.7 | % | | 6.91 | % | | 232,144 | | | 77.9 | | | 719 | |
| Total refinancings | | | 1,010 | | | 265.6 | | | 43.3 | % | | 6.78 | % | | 263,000 | | | 67.1 | | | 690 | |
Total Originations | | | 2,510 | | $ | 613.8 | | | 100.0 | % | | 6.86 | % | $ | 244,542 | | | 73.2 | | | 706 | |
| | | Number of Loans | | Aggregate Principal Balance ($ in millions) | | Percentage Of Total Principal | | Weighted Average Interest Rate | | Average Principal Balance | | Weighted Average | |
LTV | | FICO |
2005: | | | | | | | | | | | | | | | |
Fourth Quarter | | | | | | | | | | | | | | | |
| ARM | | | 1,321 | | $ | 452.5 | | | 55.0 | | | 6.33 | % | $ | 342,551 | | | 71.9 | | | 700 | |
| Fixed-rate | | | 1,617 | | | 343.7 | | | 41.8 | % | | 6.79 | % | | 212,524 | | | 72.2 | | | 712 | |
Subtotal-non-FHA | | | 2,938 | | | 796.2 | | | 96.8 | % | | 6.53 | % | | 270,987 | | | 72.1 | | | 705 | |
| FHA - ARM | | | 1 | | | 0.2 | | | 0.0 | % | | 5.80 | % | | 157,545 | | | 84.6 | | | 655 | |
| FHA - fixed-rate | | | 194 | | | 26.5 | | | 3.2 | % | | 6.06 | % | | 136,820 | | | 93.5 | | | 639 | |
Subtotal - FHA | | | 195 | | | 26.7 | | | 3.2 | % | | 6.06 | % | | 136,927 | | | 93.4 | | | 639 | |
| Total ARM | | | 1,322 | | | 452.7 | | | 55.0 | % | | 6.33 | % | | 342,411 | | | 72.0 | | | 700 | |
| Total fixed-rate | | | 1,811 | | | 370.2 | | | 45.0 | % | | 6.74 | % | | 204,414 | | | 73.7 | | | 707 | |
Total Originations | | | 3,133 | | $ | 822.9 | | | 100.0 | % | | 6.52 | % | $ | 262,643 | | | 72.7 | | | 703 | |
| | | | | | | | | | | | | | | | | | | | | | | |
| Purchase mortgages | | | 1,949 | | $ | 426.8 | | | 51.9 | % | | 6.73 | % | $ | 218,995 | | | 78.5 | | | 716 | |
| Refinancings | | | 989 | | | 369.4 | | | 44.9 | % | | 6.29 | % | | 373,447 | | | 64.5 | | | 692 | |
Subtotal-non-FHA | | | 2,938 | | | 796.2 | | | 96.8 | % | | 6.53 | % | | 270,987 | | | 72.1 | | | 705 | |
| FHA - purchase | | | 38 | | | 6.1 | | | 0.7 | % | | 6.40 | % | | 161,278 | | | 97.4 | | | 649 | |
| FHA - refinancings | | | 157 | | | 20.6 | | | 2.5 | % | | 5.95 | % | | 131,033 | | | 92.1 | | | 636 | |
Subtotal - FHA | | | 195 | | | 26.7 | | | 3.2 | % | | 6.06 | % | | 136,927 | | | 93.4 | | | 639 | |
| Total purchase | | | 1,987 | | | 433.0 | | | 52.6 | % | | 6.72 | % | | 217,891 | | | 78.8 | | | 715 | |
| Total refinancings | | | 1,146 | | | 389.9 | | | 47.4 | % | | 6.28 | % | | 340,237 | | | 66.0 | | | 689 | |
Total Originations | | | 3,133 | | $ | 822.9 | | | 100.0 | % | | 6.52 | % | $ | 262,643 | | | 72.7 | | | 703 | |
Third Quarter | | | | | | | | | | | | | | | |
| ARM | | | 1,727 | | $ | 513.3 | | | 51.2 | % | | 6.10 | % | $ | 297,213 | | | 73.8 | | | 705 | |
| Fixed-rate | | | 1,946 | | | 392.2 | | | 39.1 | % | | 6.43 | % | | 201,537 | | | 73.2 | | | 717 | |
Subtotal-non-FHA | | | 3,673 | | | 905.5 | | | 90.3 | % | | 6.25 | % | | 246,522 | | | 73.5 | | | 710 | |
| FHA - ARM | | | 4 | | �� | 0.8 | | | 0.1 | % | | 5.80 | % | | 217,202 | | | 94.7 | | | 642 | |
| FHA - fixed-rate | | | 700 | | | 95.9 | | | 9.6 | % | | 5.72 | % | | 136,954 | | | 92.9 | | | 633 | |
Subtotal - FHA | | | 704 | | | 96.7 | | | 9.7 | % | | 5.72 | % | | 137,410 | | | 93.0 | | | 633 | |
| Total ARM | | | 1,731 | | | 514.1 | | | 51.3 | % | | 6.10 | % | | 297,028 | | | 73.8 | | | 705 | |
| Total fixed-rate | | | 2,646 | | | 488.1 | | | 48.7 | % | | 6.29 | % | | 184,451 | | | 77.1 | | | 700 | |
Total Originations | | | 4,377 | | $ | 1,002.2 | | | 100.0 | % | | 6.19 | % | $ | 228,973 | | | 75.4 | | | 703 | |
| | | | | | | | | | | | | | | | | | | | | | | |
| Purchase mortgages | | | 2,568 | | $ | 558.1 | | | 55.7 | % | | 6.39 | % | $ | 217,314 | | | 78.1 | | | 719 | |
| Refinancings | | | 1,105 | | | 347.4 | | | 34.6 | % | | 6.01 | % | | 314,402 | | | 66.2 | | | 696 | |
Subtotal-non-FHA | | | 3,673 | | | 905.5 | | | 90.3 | % | | 6.25 | % | | 246,522 | | | 73.5 | | | 710 | |
| FHA - purchase | | | 71 | | | 11.7 | | | 1.2 | % | | 6.05 | % | | 165,045 | | | 96.3 | | | 659 | |
| FHA - refinancings | | | 633 | | | 85.0 | | | 8.5 | % | | 5.67 | % | | 134,310 | | | 92.5 | | | 630 | |
Subtotal - FHA | | | 704 | | | 96.7 | | | 9.7 | % | | 5.72 | % | | 137,410 | | | 93.0 | | | 633 | |
| Total purchase | | | 2,639 | | | 569.8 | | | 56.9 | % | | 6.38 | % | | 215,908 | | | 78.5 | | | 718 | |
| Total refinancings | | | 1,738 | | | 432.4 | | | 43.1 | % | | 5.94 | % | | 248,811 | | | 71.4 | | | 683 | |
Total Originations | | | 4,377 | | $ | 1,002.2 | | | 100.0 | % | | 6.19 | % | $ | 228,973 | | | 75.4 | | | 703 | |
| | | | | | | | | | | | | | | | | | | | | | | |
Second Quarter | | | | | | | | | | | | | | | | | | | | | | |
| ARM | | | 1,839 | | $ | 537.9 | | | 57.2 | % | | 5.90 | % | $ | 292,482 | | | 72.7 | | | 709 | |
| Fixed-rate | | | 1,777 | | | 337.1 | | | 35.9 | % | | 6.47 | % | | 189,732 | | | 72.7 | | | 718 | |
Subtotal-non-FHA | | | 3,616 | | | 875.0 | | | 93.1 | % | | 6.12 | % | | 241,988 | | | 72.7 | | | 712 | |
| FHA - ARM | | | 30 | | | 4.8 | | | 0.5 | % | | 5.34 | % | | 159,088 | | | 93.7 | | | 611 | |
| FHA - fixed-rate | | | 449 | | | 59.9 | | | 6.4 | % | | 5.97 | % | | 133,408 | | | 92.6 | | | 624 | |
Subtotal - FHA | | | 479 | | | 64.7 | | | 6.9 | % | | 5.92 | % | | 135,016 | | | 92.7 | | | 623 | |
| Total ARM | | | 1,869 | | | 542.7 | | | 57.8 | % | | 5.89 | % | | 290,341 | | | 72.8 | | | 708 | |
| Total fixed-rate | | | 2,226 | | | 397.0 | | | 42.2 | % | | 6.39 | % | | 178,371 | | | 75.7 | | | 704 | |
Total Originations | | | 4,095 | | $ | 939.7 | | | 100.0 | % | | 6.10 | % | $ | 229,475 | | | 74.0 | | | 706 | |
| | | | | | | | | | | | | | | | | | | | | | | |
| Purchase mortgages | | | 2,652 | | $ | 587.8 | | | 62.6 | % | | 6.21 | % | $ | 221,657 | | | 76.4 | | | 720 | |
| Refinancings | | | 964 | | | 287.2 | | | 30.5 | % | | 5.94 | % | | 297,918 | | | 65.1 | | | 695 | |
Subtotal-non-FHA | | | 3,616 | | | 875.0 | | | 93.1 | % | | 6.12 | % | | 241,988 | | | 72.7 | | | 712 | |
| FHA - purchase | | | 85 | | | 13.9 | | | 1.5 | % | | 5.99 | % | | 163,693 | | | 96.3 | | | 644 | |
| FHA - refinancings | | | 394 | | | 50.8 | | | 5.4 | % | | 5.91 | % | | 128,829 | | | 91.7 | | | 617 | |
Subtotal - FHA | | | 479 | | | 64.7 | | | 6.9 | % | | 5.92 | % | | 135,016 | | | 92.7 | | | 623 | |
| Total purchase | | | 2,737 | | | 601.7 | | | 64.0 | % | | 6.20 | % | | 219,857 | | | 76.8 | | | 719 | |
| Total refinancings | | | 1,358 | | | 338.0 | | | 36.0 | % | | 5.93 | % | | 248,860 | | | 69.1 | | | 684 | |
| Total Originations | | | 4,095 | | $ | 939.7 | | | 100.0 | % | | 6.10 | % | $ | 228,973 | | | 74.0 | | | 706 | |
First Quarter | | | | | | | | | | | | | | | | | | | | | | |
| ARM | | | 1,313 | | $ | 355.3 | | | 52.8 | % | | 5.61 | % | $ | 270,603 | | | 72.7 | | | 708 | |
| Fixed-rate | | | 1,274 | | | 247.8 | | | 36.9 | % | | 6.31 | % | | 194,541 | | | 71.4 | | | 719 | |
Subtotal-non-FHA | | | 2,587 | | | 603.1 | | | 89.7 | % | | 5.90 | % | | 233,145 | | | 72.2 | | | 712 | |
| FHA - ARM | | | 59 | | | 9.5 | | | 1.4 | % | | 5.10 | % | | 160,093 | | | 93.8 | | | 648 | |
| FHA - fixed-rate | | | 462 | | | 59.9 | | | 8.9 | % | | 5.85 | % | | 129,756 | | | 92.2 | | | 635 | |
Subtotal - FHA | | | 521 | | | 69.4 | | | 10.3 | % | | 5.75 | % | | 133,191 | | | 92.4 | | | 637 | |
| Total ARM | | | 1,372 | | | 364.8 | | | 54.2 | % | | 5.60 | % | | 265,851 | | | 73.2 | | | 706 | |
| Total fixed-rate | | | 1,736 | | | 307.7 | | | 45.8 | % | | 6.22 | % | | 177,299 | | | 75.5 | | | 703 | |
Total Originations | | | 3,108 | | $ | 672.5 | | | 100.0 | % | | 5.88 | % | $ | 216,390 | | | 74.3 | | | 705 | |
| | | | | | | | | | | | | | | | | | | | | | | |
| Purchase mortgages | | | 1,717 | | $ | 365.9 | | | 54.4 | % | | 6.03 | % | $ | 213,081 | | | 76.2 | | | 723 | |
| Refinancings | | | 870 | | | 237.2 | | | 35.3 | % | | 5.69 | % | | 272,743 | | | 66.0 | | | 696 | |
Subtotal-non-FHA | | | 2,587 | | | 603.1 | | | 89.7 | % | | 5.90 | % | | 233,145 | | | 72.2 | | | 712 | |
| FHA - purchase | | | 95 | | | 15.1 | | | 2.2 | % | | 5.66 | % | | 158,699 | | | 97.2 | | | 672 | |
| FHA - refinancings | | | 426 | | | 54.3 | | | 8.1 | % | | 5.78 | % | | 127,503 | | | 91.0 | | | 627 | |
Subtotal - FHA | | | 521 | | | 69.4 | | | 10.3 | % | | 5.75 | % | | 133,191 | | | 92.4 | | | 637 | |
| Total purchase | | | 1,812 | | | 381.0 | | | 56.6 | % | | 6.02 | % | | 210,230 | | | 77.0 | | | 721 | |
| Total refinancings | | | 1,296 | | | 291.5 | | | 43.4 | % | | 5.71 | % | | 225,002 | | | 70.7 | | | 683 | |
Total Originations | | | 3,108 | | $ | 672.5 | | | 100.0 | % | | 5.88 | % | $ | 216,390 | | | 74.3 | | | 705 | |
2004: | | | | | | | | | | | | | |
Fourth Quarter | | | | | | | | | | | | | |
| ARM | | | 1,094 | | $ | 330.1 | | | 52.2 | % | | 5.23 | % | $ | 301,765 | | | 71.1 | | | 714 | |
| Fixed-rate | | | 956 | | | 206.8 | | | 32.7 | % | | 6.32 | % | | 216,266 | | | 72.1 | | | 714 | |
Subtotal-non-FHA | | | 2,050 | | | 536.9 | | | 84.9 | % | | 5.65 | % | | 261,893 | | | 71.5 | | | 714 | |
| FHA - ARM | | | 150 | | | 19.5 | | | 3.1 | % | | 5.20 | % | | 130,215 | | | 92.7 | | | 627 | |
| FHA - fixed-rate | | | 599 | | | 76.2 | | | 12.0 | % | | 6.04 | % | | 127,281 | | | 92.0 | | | 622 | |
Subtotal - FHA | | | 749 | | | 95.7 | | | 15.1 | % | | 5.87 | % | | 127,868 | | | 92.1 | | | 623 | |
| Total ARM | | | 1,244 | | | 349.6 | | | 55.3 | % | | 5.23 | % | | 281,080 | | | 72.3 | | | 709 | |
| Total fixed-rate | | | 1,555 | | | 283.0 | | | 44.7 | % | | 6.24 | % | | 181,988 | | | 77.5 | | | 689 | |
Total Originations | | | 2,799 | | $ | 632.6 | | | 100.0 | % | | 5.68 | % | $ | 226,029 | | | 74.6 | | | 700 | |
| | | | | | | | | | | | | | | | | | | | | | | |
| Purchase mortgages | | | 1,426 | | $ | 353.3 | | | 55.9 | % | | 5.65 | % | $ | 247,722 | | | 75.1 | | | 724 | |
| Refinancings | | | 624 | | | 183.6 | | | 29.0 | % | | 5.65 | % | | 294,278 | | | 64.4 | | | 694 | |
Subtotal-non-FHA | | | 2,050 | | | 536.9 | | | 84.9 | % | | 5.65 | % | | 261,893 | | | 71.5 | | | 714 | |
| FHA - purchase | | | 82 | | | 13.3 | | | 2.1 | % | | 5.93 | % | | 162,494 | | | 96.4 | | | 647 | |
| FHA - refinancings | | | 667 | | | 82.4 | | | 13.0 | % | | 5.86 | % | | 123,611 | | | 91.4 | | | 619 | |
Subtotal - FHA | | | 749 | | | 95.7 | | | 15.1 | % | | 5.87 | % | | 127,868 | | | 92.1 | | | 623 | |
| Total purchase | | | 1,508 | | | 366.6 | | | 57.9 | % | | 5.66 | % | | 243,088 | | | 75.9 | | | 721 | |
| Total refinancings | | | 1,291 | | | 266.0 | | | 42.1 | % | | 5.71 | % | | 206,102 | | | 72.8 | | | 671 | |
Total Originations | | | 2,799 | | $ | 632.6 | | | 100.0 | % | | 5.68 | % | $ | 226,029 | | | 74.6 | | | 700 | |
Third Quarter | | | | | | | | | | | | | | | | | | | | | | |
| ARM | | | 692 | | $ | 208.9 | | | 50.3 | % | | 5.06 | % | $ | 301,879 | | | 70.7 | | | 718 | |
| Fixed-rate | | | 639 | | | 145.7 | | | 35.1 | % | | 6.70 | % | | 228,013 | | | 71.0 | | | 714 | |
Subtotal-non-FHA | | | 1,331 | | | 354.6 | | | 85.4 | % | | 5.73 | % | | 266,416 | | | 70.8 | | | 716 | |
| FHA - ARM | | | 52 | | | 6.8 | | | 1.6 | % | | 5.29 | % | | 130,769 | | | 92.2 | | | 597 | |
| FHA - fixed-rate | | | 429 | | | 54.0 | | | 13.0 | % | | 6.33 | % | | 125,874 | | | 92.2 | | | 612 | |
Subtotal - FHA | | | 481 | | | 60.8 | | | 14.6 | % | | 6.21 | % | | 126,403 | | | 92.2 | | | 610 | |
| Total ARM | | | 744 | | | 215.7 | | | 51.9 | % | | 5.07 | % | | 289,919 | | | 71.4 | | | 714 | |
| Total fixed-rate | | | 1,068 | | | 199.7 | | | 48.1 | % | | 6.60 | % | | 186,985 | | | 76.7 | | | 687 | |
Total Originations | | | 1,812 | | $ | 415.4 | | | 100.0 | % | | 5.80 | % | $ | 229,249 | | | 73.9 | | | 701 | |
| | | | | | | | | | | | | | | | | | | | | | | |
| Purchase mortgages | | | 1,019 | | $ | 265.9 | | | 64.0 | % | | 5.78 | % | $ | 260,942 | | | 73.4 | | | 725 | |
| Refinancings | | | 312 | | | 88.7 | | | 21.4 | % | | 5.59 | % | | 284,295 | | | 63.1 | | | 691 | |
Subtotal-non-FHA | | | 1,331 | | | 354.6 | | | 85.4 | % | | 5.73 | % | | 266,416 | | | 70.8 | | | 716 | |
| FHA - purchase | | | 54 | | | 8.7 | | | 2.1 | % | | 6.36 | % | | 161,111 | | | 95.0 | | | 637 | |
| FHA - refinancings | | | 427 | | | 52.1 | | | 12.5 | % | | 6.18 | % | | 122,014 | | | 91.8 | | | 605 | |
Subtotal - FHA | | | 481 | | | 60.8 | | | 14.6 | % | | 6.21 | % | | 126,403 | | | 92.2 | | | 610 | |
| Total purchase | | | 1,073 | | | 274.6 | | | 66.1 | % | | 5.80 | % | | 255,918 | | | 74.1 | | | 722 | |
| Total refinancings | | | 739 | | | 140.8 | | | 33.9 | % | | 5.81 | % | | 190,528 | | | 73.7 | | | 660 | |
Total Originations | | | 1,812 | | $ | 415.4 | | | 100.0 | % | | 5.80 | % | $ | 229,249 | | | 73.9 | | | 701 | |
Second Quarter | | | | | | | | | | | | | | | |
| ARM | | | 781 | | $ | 253.4 | | | 49.3 | % | | 4.91 | % | $ | 324,456 | | | 69.8 | | | 722 | |
| Fixed-rate | | | 797 | | | 167.2 | | | 32.5 | % | | 6.31 | % | | 209,787 | | | 70.6 | | | 720 | |
Subtotal-non-FHA | | | 1,578 | | | 420.6 | | | 81.8 | % | | 5.47 | % | | 266,540 | | | 70.1 | | | 721 | |
| FHA - ARM | | | 29 | | | 4.1 | | | 0.8 | % | | 4.37 | % | | 141,379 | | | 93.5 | | | 653 | |
| FHA - fixed-rate | | | 764 | | | 89.3 | | | 17.4 | % | | 5.87 | % | | 116,885 | | | 91.9 | | | 655 | |
Subtotal - FHA | | | 793 | | | 93.4 | | | 18.2 | % | | 5.81 | % | | 117,781 | | | 92.0 | | | 654 | |
| Total ARM | | | 810 | | | 257.5 | | | 50.1 | % | | 4.90 | % | | 317,901 | | | 70.1 | | | 721 | |
| Total fixed-rate | | | 1,561 | | | 256.5 | | | 49.9 | % | | 6.16 | % | | 164,318 | | | 78.0 | | | 697 | |
Total Originations | | | 2,371 | | $ | 514.0 | | | 100.0 | % | | 5.53 | % | $ | 216,786 | | | 74.1 | | | 709 | |
| | | | | | | | | | | | | | | | | | | | | | | |
| Purchase mortgages | | | 1,021 | | $ | 262.7 | | | 51.1 | % | | 5.46 | % | $ | 257,297 | | | 74.8 | | | 728 | |
| Refinancings | | | 557 | | | 157.9 | | | 30.7 | % | | 5.48 | % | | 283,483 | | | 62.2 | | | 711 | |
Subtotal-non-FHA | | | 1,578 | | | 420.6 | | | 81.8 | % | | 5.47 | % | | 266,540 | | | 70.1 | | | 721 | |
| FHA - purchase | | | 71 | | | 10.6 | | | 2.1 | % | | 6.25 | % | | 149,296 | | | 96.1 | | | 633 | |
| FHA - refinancings | | | 722 | | | 82.8 | | | 16.1 | % | | 5.75 | % | | 114,681 | | | 91.4 | | | 657 | |
Subtotal - FHA | | | 793 | | | 93.4 | | | 18.2 | % | | 5.81 | % | | 117,781 | | | 92.0 | | | 654 | |
| Total purchase | | | 1,092 | | | 273.3 | | | 53.2 | % | | 5.49 | % | | 250,275 | | | 75.6 | | | 724 | |
| Total refinancings | | | 1,279 | | | 240.7 | | | 46.8 | % | | 5.57 | % | | 188,194 | | | 72.3 | | | 693 | |
Total Originations | | | 2,371 | | $ | 514.0 | | | 100.0 | % | | 5.53 | % | $ | 216,786 | | | 74.1 | | | 709 | |
| | | | | | | | | | | | | | | | | | | | | | | |
First Quarter | | | | | | | | | | | | | | | | | | | | | | |
| ARM | | | 458 | | $ | 121.8 | | | 43.0 | % | | 5.55 | % | $ | 265,982 | | | 83.8 | | | 839 | |
| Fixed-rate | | | 578 | | | 151.8 | | | 53.5 | % | | 5.43 | % | | 262,547 | | | 60.1 | | | 611 | |
Subtotal-non-FHA | | | 1,036 | | | 273.6 | | | 96.5 | % | | 5.48 | % | | 264,066 | | | 70.7 | | | 713 | |
| FHA - ARM | | | — | | | — | | | — | | | — | | | — | | | — | | | — | |
| FHA - fixed-rate | | | 35 | | | 9.8 | | | 3.5 | % | | 4.48 | % | | 281,445 | | | 68.0 | | | 445 | |
Subtotal - FHA | | | 35 | | | 9.8 | | | 3.5 | % | | 4.48 | % | | 281,445 | | | 68.0 | | | 445 | |
| Total ARM | | | 458 | | | 121.8 | | | 43.0 | % | | 5.55 | % | | 265,982 | | | 83.8 | | | 839 | |
| Total fixed-rate | | | 613 | | | 161.6 | | | 57.0 | % | | 5.38 | % | | 263,626 | | | 60.6 | | | 601 | |
Total Originations | | | 1,071 | | $ | 283.4 | | | 100.0 | % | | 5.45 | % | $ | 264,633 | | | 70.6 | | | 703 | |
| | | | | | | | | | | | | | | | | | | | | | | |
| Purchase mortgages | | | 623 | | $ | 164.2 | | | 57.9 | % | | 5.42 | % | $ | 263,586 | | | 74.1 | | | 711 | |
| Refinancings | | | 413 | | | 109.4 | | | 38.6 | % | | 5.58 | % | | 264,789 | | | 65.5 | | | 715 | |
Subtotal-non-FHA | | | 1,036 | | | 273.6 | | | 96.5 | % | | 5.48 | % | | 264,066 | | | 70.7 | | | 713 | |
| FHA - purchase | | | 27 | | | 7.8 | | | 2.8 | % | | 4.73 | % | | 289,221 | | | 73.2 | | | 462 | |
| FHA - refinancings | | | 8 | | | 2.0 | | | 0.7 | % | | 3.55 | % | | 255,200 | | | 48.3 | | | 380 | |
Subtotal - FHA | | | 35 | | | 9.8 | | | 3.5 | % | | 4.48 | % | | 281,445 | | | 68.0 | | | 445 | |
| Total purchase | | | 650 | | | 172.0 | | | 60.7 | % | | 5.39 | % | | 264,651 | | | 74.1 | | | 700 | |
| Total refinancings | | | 421 | | | 111.4 | | | 39.3 | % | | 5.54 | % | | 264,607 | | | 65.2 | | | 708 | |
Total Originations | | | 1,071 | | $ | 283.4 | | | 100.0 | % | | 5.45 | % | $ | 264,633 | | | 70.6 | | | 703 | |
Any change in loan origination volume and other operational and financial performance results was primarily dependent on the number of offices and our level of staffing these offices. Our personnel costs are largely variable in that loan origination personnel are paid commissions on loan production volume and the related operations personnel are somewhat variable in terms of have flexibility to scale operations based on volume levels. Our staffing levels also have a high correlation to levels of expense for marketing and promotion, office supplies, data processing, and travel and entertainment expenses. Likewise, the number of offices and branches which we operate has a high correlation to occupancy and equipment expense.
Other Operational Information
| | | As of December 31, | |
| | | 2006 | | 2005 | | % Change | | 2004 | | % Change | |
| Loan officers | | | 327 | | | 329 | | | (0.6 | )% | | 344 | | | (4.4 | )% |
| Other employees | | | 289 | | | 473 | | | (38.9 | )% | | 438 | | | 8.0 | % |
| Total employees | | | 616 | | | 802 | | | (23.2 | )% | | 782 | | | 2.6 | % |
| | | | | | | | | | | | | | | | | |
| Number of sales locations | | | 47 | | | 54 | | | (13.0 | )% | | 66 | | | (18.2 | )% |
Results of Operations - Comparison of Years Ended December 31, 2006, 2005 and 2004
Net Income - Overview
Comparative Net Income
| | | | | | | | | | | | |
| (dollar amounts in thousands) | | For the Year Ended December 31, | |
| | | 2006 | | 2005 | | % Change | | 2004 | | % Change | |
| Net (loss)/income | | $ | (15,031 | ) | $ | (5,340 | ) | | (181.5 | )% | $ | 4,947 | | | (207.9 | )% |
| EPS (Basic) | | $ | (0.83 | ) | $ | (0.30 | ) | | (176.7 | )% | $ | 0.28 | | | (207.1 | )% |
| EPS (Diluted) | | $ | (0.83 | ) | $ | (0.30 | ) | | (176.7 | )% | $ | 0.27 | | | (211.1 | )% |
For the year ended December 31, 2006, we reported net loss of $15.0 million, as compared to net loss of $5.3 million for the year ended December 31, 2005. The increase in net loss is attributable to a reduction in gain on sale income from the mortgage lending segment as well as a reduction in net interest income from the investment portfolio. In addition the mortgage lending segment incurred a $7.4 million charge related to loan loss reserves.
For the year ended December 31, 2005, we reported net loss of $5.3 million, as compared to net income of $4.9 million for the year ended December 31, 2004. The change in net loss is attributed to an increase in gain on sale income and net interest income from our investment portfolio. These gains were offset by the execution of our core business strategy to retain selected originated loans in our portfolio (thus forgoing the gain on sale premiums we would have otherwise received when such loans are sold to third parties), an impairment charge of $7.4 million in the fourth quarter related to $388.3 million of available for sale securities that we now anticipate selling in 2006 in order to rebalance our portfolio with higher yielding assets, one-time severance charges of $3.0 million, and increased expenses incurred for and subsequent to the acquisition of multiple retail loan origination locations during 2004.
Comparative Net Interest Income
| | | | | | | | | | | | |
| (dollar amounts in thousands) | | For the Year Ended December 31, | |
| | | 2006 | | 2005 | | % Change | | 2004 | | % Change | |
| Interest income | | $ | 64,881 | | $ | 62,725 | | | 3.4 | % | $ | 20,394 | | | 207.6 | % |
| Interest expense | | | 60,097 | | | 49,852 | | | 20.6 | % | | 12,470 | | | 299.8 | % |
| Net interest income | | $ | 4,784 | | $ | 12,873 | | | (62.8 | )% | $ | 7,924 | | | 62.5 | % |
Net interest income was $4.8 million, $12.9 million and $7.9 million for the years ended December 31, 2006, 2005 and 2004. Net interest income decreased by $8.1 million in 2006 from 2005. The change was primarily due to an increase interest expense without the corresponding increase in interest income on the portfolio assets. In addition, the amount invested in the investment securities portfolio and mortgage loans held in securitization trust decreased by approximately $416.0 million as compared to December 31, 2005.
Net interest income increased by $5.0 million from 2004 to 2005 and was primarily due to an increase in portfolio assets as the Company continued to implement its investment strategy following the IPO in 2004. In addition, the Company raised $45 million in subordinated debt during 2005 that allowed the Company to increase the portfolio.
Revenues
Net Interest Income. The following table summarizes the changes in net interest income for 2006, 2005 and 2004:
Yields Earned on Mortgage Loans and Securities and Rates on Financial Arrangements
(dollar amounts in thousands) | | 2006 | | 2005 | | 2004 | |
| | | Average Balance | | Amount | | Yield/ Rate | | Average Balance | | Amount | | Yield/ Rate | | Average Balance | | Amount | | Yield/ Rate | |
| | | ($ Millions) | | | | | | ($ Millions) | | | | | | ($ Millions) | | | | | |
| Interest Income: | | | | | | | | | | | | | | | | | | | |
| Investment securities and loans held in the securitization trusts | | $ | 1,266.4 | | $ | 66,973 | | | 5.29 | % | $ | 1,347.4 | | $ | 60,988 | | | 4.53 | % | $ | 1,006.8 | | $ | 21,338 | | | 4.24 | % |
| Loans held for investment | | | — | | | — | | | — | % | | 145.7 | | | 7,778 | | | 5.34 | % | | 32.9 | | | 723 | | | 4.09 | % |
| Amortization of net premium | | | 5.9 | | $ | (2,092 | ) | | (0.16 | )% | $ | 14.7 | | $ | (6,041 | ) | | (0.42 | )% | $ | 11.5 | | $ | (1,667 | ) | | (0.46 | )% |
| Interest income | | $ | 1,272.3 | | $ | 64,881 | | | 5.13 | % | $ | 1,507.8 | | $ | 62,725 | | | 4.16 | % | $ | 1,051.2 | | $ | 20,394 | | | 3.89 | % |
| | | | | | | | | | | | | | | | | | | | | | | | | | | | | |
| Interest Expense: | | | | | | | | | | | | | | | | | | | | | | | | | | | | |
| Investment securities and loans held in the securitization trusts | | $ | 1,201.2 | | $ | 56,553 | | | 4.64 | % | $ | 1,283.3 | | $ | 42,001 | | | 3.23 | % | $ | 930.1 | | $ | 11,982 | | | 2.57 | % |
| Loans held for investment | | | — | | | — | | | — | | | 142.7 | | | 5,847 | | | 4.04 | % | | 32.7 | | | 488 | | | 2.72 | % |
| Subordinated debentures | | | 45.0 | | | 3,544 | | | 7.77 | % | | 26.6 | | | 2,004 | | | 7.54 | % | | — | | | — | | | — | |
| Interest expense | | $ | 1,246.2 | | $ | 60,097 | | | 4.76 | % | $ | 1,452.6 | | $ | 49,852 | | | 3.39 | % | $ | 962.8 | | $ | 12,470 | | | 2.58. | % |
| Net interest income | | $ | 26.1 | | $ | 4,784 | | | 0.37 | % | $ | 55.2 | | $ | 12,873 | | | 0.77 | % | $ | 88.4 | | $ | 7,924 | | | 1.31 | % |
For our portfolio investments of investment securities, mortgage loans held for investments and loans held in securitization trusts, our net interest spread for eachas well as average CPR by quarter since we began our portfolio investment activities is as follows:
As of the Quarter Ended | | Average Interest Earning Assets ($ millions) | | Weighted Average Coupon | | Weighted Average Yield on Interest Earning Assets | | Cost of Funds | | Net Interest Spread | | |
| Quarter Ended | | | Average Interest Earning Assets ($ millions) | | Weighted Average Coupon | | Weighted Average Cash Yield on Interest Earning Assets | | Cost of Funds | | Net Interest Spread | | Constant Prepayment Rate (CPR) |
| December 31, 2009 | | | $ | 476.8 | | 4.75% | | 5.78% | | 1.45% | | 4.33% | | 18.1% |
| September 30, 2009 | | | $ | 571.0 | | 4.98 % | | 5.60 % | | 1.47 % | | 4.13 % | | 22.5 % |
| June 30, 2009 | | | $ | 600.5 | | 4.99 % | | 5.09 % | | 1.48 % | | 3.61 % | | 21.4 % |
| March 31, 2009 | | | $ | 797.2 | | 4.22 % | | 4.31 % | | 1.79 % | | 2.52 % | | 12.3 % |
| December 31, 2008 | | | $ | 841.7 | | 4.77 % | | 4.65 % | | 3.34 % | | 1.31 % | | 9.2 % |
| September 30, 2008 | | | $ | 874.5 | | 4.81 % | | 4.72 % | | 3.36 % | | 1.36 % | | 13.8 % |
| June 30, 2008 | | | $ | 899.3 | | 4.86 % | | 4.78 % | | 3.35 % | | 1.43 % | | 14.0 % |
| March 31, 2008 | | | $ | 1,019.2 | | 5.24 % | | 5.20 % | | 4.35 % | | 0.85 % | | 13.0 % |
| December 31, 2007 | | | $ | 799.2 | | 5.90 % | | 5.79 % | | 5.33 % | | 0.46 % | | 19.0 % |
| September 30, 2007 | | | $ | 865.7 | | 5.93 % | | 5.72 % | | 5.38 % | | 0.34 % | | 21.0 % |
| June 30, 2007 | | | $ | 948.6 | | 5.66 % | | 5.55 % | | 5.43 % | | 0.12 % | | 21.0 % |
| March 31, 2007 | | | $ | 1,022.7 | | 5.59 % | | 5.36 % | | 5.34 % | | 0.02 % | | 19.2 % |
| December 31, 2006 | | $ | 1,111.0 | | 5.53 | % | | 5.35 | % | | 5.26 | % | | 0.09 | % | | $ | 1,111.0 | | 5.53 % | | 5.35 % | | 5.26 % | | 0.09 % | | 17.2 % |
| September 30, 2006 | | $ | 1,287.6 | | 5.50 | % | | 5.28 | % | | 5.12 | % | | 0.16 | % | | $ | 1,287.6 | | 5.50 % | | 5.28 % | | 5.12 % | | 0.16 % | | 20.7 % |
| June 30, 2006 | | $ | 1,217.9 | | 5.29 | % | | 5.08 | % | | 4.30 | % | | 0.78 | % | | $ | 1,217.9 | | 5.29 % | | 5.08 % | | 4.30 % | | 0.78 % | | 19.8 % |
| March 31, 2006 | | $ | 1,478.6 | | 4.85 | % | | 4.75 | % | | 4.04 | % | | 0.71 | % | | $ | 1,478.6 | | 4.85 % | | 4.75 % | | 4.04 % | | 0.71 % | | 18.7 % |
| December 31, 2005 | | $ | 1,499.0 | | 4.84 | % | | 4.43 | % | | 3.81 | % | | 0.62 | % | | $ | 1,499.0 | | 4.84 % | | 4.43 % | | 3.81 % | | 0.62 % | | 26.9 % |
| September 30, 2005 | | $ | 1,494.0 | | 4.69 | % | | 4.08 | % | | 3.38 | % | | 0.70 | % | | $ | 1,494.0 | | 4.69 % | | 4.08 % | | 3.38 % | | 0.70 % | | 29.7 % |
| June 30, 2005 | | $ | 1,590.0 | | 4.50 | % | | 4.06 | % | | 3.06 | % | | 1.00 | % | | $ | 1,590.0 | | 4.50 % | | 4.06 % | | 3.06 % | | 1.00 % | | 30.5 % |
| March 31, 2005 | | $ | 1,447.9 | | 4.39 | % | | 4.01 | % | | 2.86 | % | | 1.15 | % | | $ | 1,447.9 | | 4.39 % | | 4.01 % | | 2.86 % | | 1.15 % | | 29.2 % |
| December 31, 2004 | | $ | 1,325.7 | | 4.29 | % | | 3.84 | % | | 2.58 | % | | 1.26 | % | | $ | 1,325.7 | | 4.29 % | | 3.84 % | | 2.58 % | | 1.26 % | | 23.7 % |
| September 30, 2004 | | $ | 776.5 | | 4.04 | % | | 3.86 | % | | 2.45 | % | | 1.41 | % | | $ | 776.5 | | 4.04 % | | 3.86 % | | 2.45 % | | 1.41 % | | 16.0 % |
| | | | | | | | | | | | | | | For the Year Ended December 31, | |
| (dollar amounts in thousands) | | For the Year Ended December 31, | | | 2009 | | | 2008 | | | % Change | | | 2007 | | | % Change | |
| | | 2006 | | 2005 | | % Change | | | 2004 | | | | |
| | | | | | | | | | | | | | | | |
| Salaries, commissions and benefits | | $ | 714 | | $ | 1,934 | | (63.1 | )% | | $ | 382 | | 406.3 | % | |
| Salaries and benefits | | | $ | 2,118 | | | $ | 1,869 | | | | 13.3 | % | | $ | 865 | | | | 116.1 | % |
| Professional fees | | | 598 | | 853 | | (30.0 | ) | | | 149 | | 472.5 | % | | | 1,284 | | | | 1,212 | | | | 5.9 | % | | | 612 | | | | 98.0 | % |
| Depreciation and amortization | | | 276 | | 171 | | 61.4 | | | | 1 | | 17,000 | % | |
| Insurance | | | | 524 | | | | 948 | | | | (44.7 | )% | | | 474 | | | | 100.0 | % |
| Management fees | | | | 1,252 | | | | 665 | | | | 88.3 | % | | | — | | | | 100.0 | % |
| Other | | $ | 82 | | $ | 1,011 | | (91.9 | | | $ | 45 | | 2146.6 | % | | | 1,699 | | | | 2,216 | | | | (23.3 | )% | | | 803 | | | | 176.0 | % |
| Total Expenses | | | $ | 6,877 | | | $ | 6,910 | | | | (0.5 | )% | | $ | 2,754 | | | | 150.9 | % |
The 63.1% decreasechanges in salaries from December 31, 2005 was primarily due to the severance paid to an executive who left the Company during 2005. Professional fees decreased by $255 thousand or 30% due to a decrease in general legal advisory fees as well as and a reduction in legal fees related to public filings in 2005. Depreciation and amortization increase was primarily due to an upgrade of computer equipment during the year. Other Expense decrease of 92% is due mainly to the reserve charge incurredexpenses for the sublease of the previous corporate headquarters. (See note 13)
It should be noted that certain expenses are shared by the Company and are included as a discontinued operation for this presentation.
Income (loss) from discontinued operation
| | | | | | | | | | | | |
| (dollar amounts in thousands) | | For the Year Ended December 31, | |
| | | 2006 | | 2005 | | % Change | | 2004 | | | |
| Loss from discontinued operation-net of tax | | $ | (17,197) | | $ | (8,662) | | | (98.5) | % | $ | (1,952) | | | 343.7 | % |
In connection with the sale of the Company's wholesale mortgage origination platform assets on February 22, 2007 and the sale of its retail mortgage lending platform assets on March 31, 2007, we are required to classify our Mortgage Lending segment as a discontinued operation in accordance with Statement of Financial Accounting Standards No. 144 (see note 12 in the notes to our consolidated financial statements).
The increase in loss from the discontinued operation of $8.5 in the year ended December 31, 2006 from the previous year is mainly attributable to the $8.2 loan loss charge we incurred during the second half of the 2006. In addition, the mortgage lending segment experienced decreased origination volume, increased pricing pressures and changes in product mix which reduced overall profitability.
The following is selected financial data detail that is included in income (loss) from the discontinued operation for the years ending December 31, 2006, 2005 and 2004:
| | | | | | | | | | | | |
| (dollar amounts in thousands) | | For the Year Ended December 31, | |
| | | 2006 | | 2005 | | % Change | | 2004 | | % Change | |
| Net interest income | | $ | 3,524 | | $ | 4,499 | | | (21.7) | % | $ | 3,362 | | | 33.8 | % |
Net interest income: For the year ending December 31, 2006 net interest income decreased by 21.7%2009 as compared to the previous year. This is mainly due to two factors: the first was an increase in the cost of funds during the first six months of the year without a corresponding increase in average loan coupon and second, the overall average amount of loans held for sale outstanding during the year was lower due to the decrease in origination volume.
Gain on Sales of Mortgage Loans. The following table summarizes the gain on sales of mortgage loans for 2006, 2005 and 2004:
Gain on Sales of Mortgage Loans
| (dollar amounts in thousands) | | For the Year Ended December 31, | |
| | | 2006 | | 2005 | | % Change | | 2004 | | % Change | |
| Total banked loan volume | | $ | 1,841,012 | | $ | 2,875,288 | | | (36.0) | % | $ | 1,435,340 | | | 100.3 | % |
| Total banked loan volume - units | | | 8,018 | | | 12,654 | | | (36.6) | % | | 6,882 | | | 83.9 | % |
| | | | | | | | | | | | | | | | | |
| Banked originations retained in portfolio | | $ | 69,739 | | $ | 555,189 | | | (87.4) | % | $ | 95,077 | | | 483.9 | % |
| Banked originations retained in portfolio - units | | | 134 | | | 1,249 | | | (89.3) | % | | 187 | | | 567.9 | % |
| | | | | | | | | | | | | | | | | |
| Net banked loan volume | | $ | 1,771,273 | | $ | 2,320,099 | | | (23.7) | % | $ | 1,340,263 | | | 73.1 | % |
| Net banked loan volume - units | | | 7,884 | | | 11,405 | | | (30.9) | % | | 6,695 | | | 70.45 | % |
| | | | | | | | | | | | | | | | | |
| Gain on sales of mortgage loans | | $ | 17,987 | | $ | 26,783 | | | (32.8 | )% | $ | 20,835 | | | 28.6 | % |
The 32.8% decreased in 2006 banked loan volumes was due to an overall industry decline as well as increased competition for our senior loan officers which lead to several departures. The increase in banked loan volumes during the years ended 2005 and 2004 is due to increased loan origination personnel and branch offices as compared to each prior year. The year ended 2005 includes full year utilization of increased personnel and branches while the increases for year ended 2004 primarily occurred in the latter half of the year.
The 36% decrease in gain on sales of mortgage loans for the year ending December 31, 2006 is directly related to the decrease in banked origination volume of 33%.
Furthermore, gain on sale revenues in 2005 and 2004 are impacted by the execution of our core business strategy: retaining selected adjustable rate mortgages for our investment portfolio. The execution of this strategy, which began in the third quarter of 2004 after our IPO, requires that we forgo the gain on sale premiums (revenues) we would otherwise receive when we sell these loans to third-parties. Instead, the cost basis of these loans, which is far lower than the loan and its associated third-party premium, is retained in our investment portfolio with the inherent value of the loan realized over time.
For the years ended December 31, 2006, 2005 and 2004, we originated and retained $69.7 million, $555.2 million and $95.1 million respectively, of loans in our investment portfolio or in the case of 2006 deposited into a REMIC transaction and estimate that the forgone gain on sale premium, net of the cost basis of these loans when retained in our securitization, was $.4 million, $7.5 million and $2.0 million, respectively.
The following table summarizes brokered loan volume, fees and related expenses for the fiscal years ended 2006, 2005 and 2004:
Brokered Loan Fees and Brokered Loan Expense
| (dollar amounts in thousands) | | For the Year Ended December 31, | |
| | | 2006 | | 2005 | | % Change | | 2004 | | % Change | |
| Total brokered loan volume | | $ | 703.0 | | $ | 562.1 | | | 25.07 | % | $ | 410.1 | | | 37.1 | % |
| Total brokered loan volume - units | | | 2,304 | | | 2,059 | | | 11.90 | % | | 1,171 | | | 75.8 | % |
| | | | | | | | | | | | | | | | | |
| Brokered loan fees | | $ | 10,937 | | $ | 9,991 | | | 9.5 | % | $ | 6,895 | | | 44.9 | % |
| Brokered loan expenses | | $ | 8,277 | | $ | 7,543 | | | 9.7 | % | $ | 5,276 | | | 43.0 | % |
The increase in brokered loan volume for the year ended 2006 relative to a decrease in overall origination volume for the same period is due to the discontinuance to bank sub-prime and certain other types of mortgage products. The increase in the years ended 2005 and 2004 is due to increased loan origination personnel and branch offices as compared to each prior year. The year ended 2005 includes full year utilization of increased personnel and branches while the increases for year ended 2004 primarily occurred in the latter half of the year. While brokered loan volumes have increased, brokered loan revenues have not had a correlating increase due to lower lender rebates/premiums.
Expenses
Most of our expenses are directly correlated to our staffing levels and our number of offices:
| (dollar amounts in thousands) | | For the Year Ended December 31, | |
| | | 2006 | | 2005 | | % Change | | 2004 | | % Change | |
| Loan officers | | | 327 | | | 329 | | | (0.6 | )% | | 344 | | | (4.4) | % |
| Other employees | | | 289 | | | 473 | | | (38.9 | | | 438 | | | 8.0 | % |
| Total employees | | | 616 | | | 802 | | | (23.2 | | | 782 | | | 2.6 | % |
| | | | | | | | | | | | | | | | | |
| Number of sales locations | | | 47 | | | 54 | | | (13.0 | | | 66 | | | (18.2) | % |
| | | | | | | | | | | | | | | | | |
| Salaries and benefits | | $ | 21,711 | | $ | 29,045 | | | (25.3 | | $ | 16,736 | | | 73.5 | % |
| Occupancy and equipment | | | 5,077 | | | 6,094 | | | (16.7 | | | 3,519 | | | 73.2 | % |
| Marketing and promotion | | | 2,012 | | | 4,736 | | | (57.5 | | | 3,519 | | | 34.6 | % |
| Data processing and communications | | | 2,431 | | | 2,223 | | | 9.4 | % | | 1,424 | | | 56.1 | % |
| Office supplies and expenses | | | 1,896 | | | 2,312 | | | (18.0 | | | 1,515 | | | 52.6 | % |
| Professional fees | | | 4,144 | | | 3,889 | | | 6.6 | % | | 1,856 | | | 109.5 | % |
| Depreciation and amortization | | $ | 2,106 | | $ | 1,708 | | | 23.3 | % | $ | 689 | | | 147.9 | % |
The majority of the category changes noted above is in direct correlation to the change in loan origination volume of (36%), 100% and 16% for the years ended December 31, 2006, 2005 and 2004 respectively.
Professional Fees Expense. During the year ended December 31, 2006, we had professional fees expense of $4.12008 are due to the following:
| ● | $0.2 million increase in payroll due to increased compensation for performance related bonuses in 2009. |
| ● | $0.6 million increase in management fees related to incentive fee payments earned in 2009. |
| ● | $0.5 million decrease in other expenses due to one-time penalty fees of $0.7 million paid in 2008 related to delayed shelf registration filing for our private placement of common stock. |
The increase in total expenses for the year ended December 31, 2008 as compared to $3.9 milliontotal expenses for the same period of 2005, an increase of less than 7%. The 110% increase in 2005year ended December 31, 2007 was primarily duethe result of the sale of our mortgage lending business and the classification of that business in 2007 as a discontinued operation. Prior to increase spendingthe sale of our mortgage lending business, certain expenses of our Company were part of our discontinued mortgage lending business and are included as expenses of our discontinued operation for costs of compliance with various regulatory and public company requirements, such as the Sarbanes-Oxley Act of 2002 and increases in dues, licenses and permits in states where NYMC has a new presence.
Off-Balance Sheet Arrangementsyear ended December 31, 2007.
| Discontinued Operations | | | | | | | | | | | | | | | |
| | | For the Year Ended December 31, | |
| (dollar amounts in thousands) | | 2009 | | | 2008 | | | % Change | | | 2007 | | | % Change | |
| Revenues: | | | | | | | | | | | | | | | |
| Net interest income | | $ | 235 | | | $ | 419 | | | | (43.9 | )% | | $ | 1,070 | | | | (60.8 | )% |
| Gain on sale of mortgage loans | | | — | | | | 46 | | | | (100.0 | )% | | | 2,561 | | | | (98.2 | )% |
| Loan losses | | | (280 | ) | | | (433 | ) | | | (35.3 | )% | | | (8,874 | ) | | | (95.1 | )% |
| Brokered loan fees | | | — | | | | — | | | | — | | | | 2,318 | | | | (100.0 | )% |
| Gain on sale of retail lending segment | | | — | | | | — | | | | — | | | | 4,368 | | | | (100.0 | )% |
| Other income (expense) | | | 1,290 | | | | 1,463 | | | | (11.8 | )% | | | (67 | ) | | | 2,283.6 | % |
| Total net revenues | | $ | 1,245 | | | $ | 1,495 | | | | (16.7 | )% | | $ | 1,376 | | | | 8.6 | % |
| | | | | | | | | | | | | | | | | | | | | |
| Expenses: | | | | | | | | | | | | | | | | | | | | |
| Salaries, commissions and benefits | | $ | 4 | | | $ | 63 | | | | (93.7 | )% | | $ | 7,209 | | | | (99.1 | )% |
| Brokered loan expenses | | | — | | | | — | | | | — | | | | 1,731 | | | | (100.0 | )% |
| Occupancy and equipment | | | 1 | | | | (559 | ) | | | 100.2 | % | | | 1,819 | | | | (130.7 | )% |
| General and administrative | | | 454 | | | | 334 | | | | 35.9 | % | | | 6,743 | | | | (95.0 | )% |
| Total expenses | | | 459 | | | | (162 | ) | | | 383.3 | % | | | 17,502 | | | | (100.9 | )% |
| Income (loss) before income tax (provision) benefit | | | 786 | | | | 1,657 | | | | (52.6 | )% | | | (16,126 | ) | | | (110.3 | )% |
| Income tax (provision) benefit | | | — | | | | — | | | | — | | | | (18,352 | ) | | | (100.0 | )% |
| Gain (loss) from discontinued operations – net of tax | | $ | 786 | | | $ | 1,657 | | | | (52.6 | ) % | | $ | (34,478 | ) | | | 104.8 | % |
Off-Balance Sheet Arrangements Since inception, we have not maintained any relationships with unconsolidated entities or financial partnerships, such as entities often referred to as structured finance or special purpose entities, established for the purpose of facilitating off-balance sheet arrangements or other contractually narrow or limited purposes. Further, we have not guaranteed any obligations of unconsolidated entities nor do we have any commitment or intent to provide funding to any such entities. Accordingly, we are not materially exposed to any market, credit, liquidity or financing risk that could arise if we had engaged in such relationships.
Liquidity and Capital Resources
Liquidity is a measure of our ability to meet potential cash requirements, including ongoing commitments to repay borrowings, fund and maintain investments, fund our operations, pay dividends to our stockholders and other general business needs. We recognize the need to have funds available for our operating businesses and ourmeet these potential cash requirements. Our investments and assets generate liquidity on an ongoing basis through mortgage principal and interest payments, prepayments and net earnings held prior to payment of dividends. In addition, depending on market conditions, the sale of investment portfolio.securities or capital market transactions may provide additional liquidity. We planintend to meet our liquidity needs through normal operations with the goal of avoiding unplanned sales of assets or emergency borrowing of funds. At December 31, 2009, we had cash balances of $24.5 million, $85.6 million in unencumbered securities, including $25.2 million of agency RMBS and borrowings of $85.1 million under outstanding repurchase agreements. At December 31, 2009, we also had longer-term capital resources, including CDOs outstanding of $266.8 million and subordinated debt of $44.9 million.
Current market conditions relative to early payment defaults (“EPD”) 0n mortgage loans have made EPDsThe Company also has $19.9 million of its Series A Convertible Preferred Stock outstanding, net of deferred issuance costs. The Series A Preferred Stock matures on December 31, 2010, at which time we must redeem any outstanding shares at the $20.00 per share liquidation preference plus any accrued and unpaid dividends at that time. The Series A Preferred Stock is convertible into shares of the Company’s common stock based on a conversion price of $8.00 per share of common stock, which represents a conversion rate of two and one-half (2 ½) shares of common stock for each share of Series A Preferred Stock. As of March 1, 2010, our common stock was trading below the $8.00 conversion price for our Series A Preferred Stock. As a result, as of December 31, 2009, 100% of the Series A Preferred Stock remained outstanding, which represents an important factor affecting our liquidity. As more fully described in section Loan Loss Reserves on Mortgage Loans,aggregate redemption price (excluding accrued and unpaid dividends) of approximately $20.0 million. In the event we are generally required to repurchase loans where the borrowers have not timely made someredeem all or all of their first three mortgage payments. As the incidence of EPDs has recently increased dramatically, the frequency of loans we are requested to repurchase has increased. These repurchases are predominately made with cash and the loans are held on the balance sheet until they can be sold. EPD loans are sold at a discount to the current balanceportion of the loan, thus reducingoutstanding Series A Preferred Stock at December 31, 2010, we expect to use working capital to satisfy the redemption terms. Based on our cash position.
Wecurrent investment portfolio, leverage ratio and available borrowing arrangements, we believe our existing cash balances, and funds available under our warehouse facilitycurrent repurchase agreements and cash flows from operations will be sufficient formeet our liquidity requirements for at least the next 12 months. Unused borrowing capacity will vary as
Given the market values of our securities vary. Our investments and assets will also generate liquidity on an ongoing basis through mortgage principal and interest payments, pre-payments and net earnings held prior to payment of dividends. Should our liquidity needs ever exceedcontinued uncertainty in the on-going or immediate sources of liquidity discussed above,credit markets, we believe that maintaining a maximum leverage ratio in the range of 6 to 8 times for our securities could be soldAgency RMBS portfolio and an overall Company leverage ratio of 4 to raise additional cash.5 times is appropriate at this time. At December 31, 2006, we had no commitments for any additional financings, however we cannot ensure that we will be able to obtain any future additional financing if and when required and on terms and conditions acceptable to us.
To finance our investment portfolio, we generally seek to borrow between eight and 12 times2009 the amount of our equity. At December 31, 2006 our leverage ratio definedfor our portfolio of Agency RMBS, which we define as total financing facilitiesour outstanding indebtedness under repurchase agreements divided by the sum of total stockholders’ equity and our Series A Preferred Stock, was 17. We,1 to 1 and, the providers ofexcluding our finance facilities, generally view our $45.0 million of subordinated trust preferred debentures outstanding at December 31, 2006 as a form of equity which would result in an adjustedSeries A Preferred Stock, the leverage ratio of 10was 1.4 to 1.
We have arrangements to enter intohad outstanding repurchase agreements, a form of collateralized short-term borrowing, with 23five different financial institutions with total borrowing capacity of $5.1 billion; as of December 31, 2006 we had $0.8 billion outstanding from six of these firms.2009. These agreements are secured by our mortgage-backed securitiesAgency RMBS and bear interest rates that have historically moved in close relationship to LIBOR. Under theseOur borrowings under repurchase agreements are based on the financial institutions lend money versus the marketfair value of our mortgage-backedmortgage backed securities portfolio, and, accordingly, an increase in interest ratesportfolio. Interest rate changes can have a negative impact on the valuation of these securities, resulting inreducing the amount we can borrow under these agreements. Moreover, our repurchase agreements allow the counterparties to determine a potentialnew market value of the collateral to reflect current market conditions and because these lines of financing are not committed, the counterparty can call the loan at any time. If a counterparty determines that the value of the collateral has decreased, the counterparty may initiate a margin call and require us to either post additional collateral to cover such decrease or repay a portion of the outstanding borrowing, on minimal notice. Moreover, In the event an existing counterparty elected to not reset the outstanding balance at its maturity into a new repurchase agreement, we would be required to repay the outstanding balance with cash or proceeds received from a new counterparty or to surrender the financial institution. We monitormortgage-backed securities that serve as collateral for the market valuation fluctuation as well as other liquidity needsoutstanding balance, or any combination thereof. If we are unable to ensure there is adequatesecure financing from a new counterparty and had to surrender the collateral, availablewe would expect to meet any additional margin calls or liquidity requirements.incur a significant loss.
We enter into interest rate swap agreements to extend the maturity of our repurchase agreements as a mechanism to reduce the interest rate risk of the securitiesRMBS portfolio. At December 31, 20062009, we had $285.0$107.4 million in notional interest rate swaps outstanding with two different financial institutions.outstanding. Should market rates for similar term interest rate swaps drop below the fixed rates we have agreed to on our interest rate swaps, we will be required to post additional margin to the swap counterparty, reducing available liquidity. At December 31, 2009 the Company pledged $2.9 million in cash margin to cover decreased valuation of the interest rate swaps. The weighted average maturity of the swaps was 694 days2.6 years at December 31, 2006. The impact of the interest swaps extends the maturity of the repurchase agreements to six months.
As of December 31, 2006, the Company had three warehouse facilities totaling $750 million, all of which were uncommitted.
The documents governing these facilities contains a number of compensating balance requirements and restrictive financial and other covenants that, among other things, require us to maintain a maximum ratio of total liabilities to tangible net worth, of 20 to 1 in the case of each of the CSFB facility and the Greenwich Capital facility and 15 to 1 in the for Deutsche Bank, as well as to comply with applicable regulatory and investor requirements. These facilities also contain various covenants pertaining to, among other things, the maintenance of certain periodic income thresholds and working capital, and maintenance of certain amounts of net worth. As of December 31, 2006, the Company was in compliance with all covenants with the exception of the net income covenant on all three facilities as well as a stockholder’s equity covenant on the CSFB facility. Waivers have been obtained from these institutions for these matters.
The agreements also contained covenants limiting the ability of our subsidiaries to:
| · | transfer or sell assets; |
| · | create liens on the collateral; |
| · | incur additional indebtedness without obtaining prior consent of lenders. |
These limits may in turn restrict our ability to pay cash or stock dividends on our stock. In addition, under our warehouse facilities, we cannot continue to finance a mortgage loan that we hold through the warehouse facility if:
| · | the loan is rejected as “unsatisfactory for purchase” by the ultimate investor and has exceeded its permissible warehouse period which varies by facility; |
| · | we fail to deliver the applicable note, mortgage or other documents evidencing the loan within the requisite time period; |
| · | the underlying property that secures the loan has sustained a casualty loss in excess of 5% of its appraised value; or |
| · | the loan ceases to be an eligible loan (as determined pursuant to the warehouse facility agreement). |
The Greenwich Capital facility is a master loan and security agreement totaling $250 million. Under this agreement, the counterparty provides financing to us for the origination or acquisition of certain mortgage loans, to be sold to third parties or contributed for future securitizations. We repay advances under this credit facility with a portion of the proceeds from the sale of all mortgage-backed securities issued by the trust or other entity, along with a portion of the proceeds resulting from permitted whole loan sales. Advances under this facility bare interest at a floating rate initially equal to LIBOR plus a spread (starting at 0.75%) that varies depending on the types of mortgage loans securing these facilities. As of December 31, 2006 there were no outstanding balances on the Greenwich facility. This facility expired as of February 4, 2007.
The master loan and security agreement with Deutsche Bank Structured Products, Inc is for $300 million. Under this agreement, the counterparty provides financing to us for the origination or acquisition of certain mortgage loans, which then are sold to third parties or contributed for future securitizations. We will repay advances under this credit facility with a portion of the proceeds from the sale of all mortgage-backed securities issued by the trust or other entity, along with a portion of the proceeds resulting from permitted whole loan sales. Advances under this facility bare interest at a floating rate initially equal to LIBOR plus a spread (starting at 0.625%) that varies depending on the types of mortgage loans securing the facility. Advances under this facility are subject to lender approval of the mortgage loans intended for origination or acquisition, advance rates and the then ratio of our liabilities to our tangible net worth. As of December 31, 2006 the outstanding balance of this facility was $66.2 million with the maximum aggregate amount available for additional borrowings of $233.8 million. As of March 26, 2007, under the terms of a termination agreement between us and the counterparty, and with no loans remaining financed by the counterparty, this facility was terminated.
The repurchase facility with Credit Suisse First Boston Mortgage Capital, LLC, or CSFB, at December 31, 2006 totaled $200.0 million. This facility is secured by the mortgage loans owned by the Company. Advances under this facility bear interest at a floating rate initially equal to LIBOR plus a spread (starting at .75%) that varies depending on the types of mortgage loans securing the facility. Additionally advance rates and terms may vary depending on the ratio of our liabilities to our tangible net worth. As of December 31, 2006, the aggregate outstanding balance under this facility was $106.8 million and the aggregate maximum amount available for additional borrowings was $93.2 million. An amendment pertaining to this facility was entered into between us and the counterparty on March 23, 2007 that limited the facility to $120 million, and specified a termination date of June 29, 2007, at which time we expect to have all loans currently financed with this facility to be sold, or reduced to an amount that would enable us to pay the loans off of the facility.
As it relates to our purchasing bulk packages of loans for securitizations going forward, we anticipate continuing relationships with one or more of our current or previous warehouse facility providers, although no formal agreements have been entered into at this time.2009.
We expect thatalso own approximately $3.8 million of loans held for sale. Our inability to sell these loans at all or on favorable terms could adversely affect our profitability as any sale for less than the CSFB facility will be sufficient to meet our capital and financing needs as we no longer operate a mortgage lending business as of March 31, 2007.
As of December 31, 2006, our aggregate repurchase facility borrowings related to our discontinued operation were $173.0 million at an average interest rate of approximately 5.93%.
As of December 31, 2006, our aggregate financing arrangements secured by portfolio investments were $815.3 million at an average interest rate of approximately 5.37%.
Our borrowings are secured by either portfolio investments or residential mortgage loans, the value of which may move inversely with changes in interest rates. A decline in the market value of our portfolio investments or mortgage loans investments in the future may limit our ability to borrow under these facilities orcurrent reserved balance would result in lenders requiring additional collaterala loss. Currently, these loans are not financed or initiating margin calls under our borrowing facilities. As a result, we could be required to sell some of our investments under adverse market conditions in order to maintain liquidity. If such sales are made at prices lower than the amortized costs of such investments, we will incur losses.
Our ability to sell the mortgage loans we own at cost or for a premium in the secondary market so that we may generate cash proceeds to repay borrowings under our repurchase facilities, depends on a number of factors, including:
| · | the program parameters under which the loan was originated under and the continuation of that program by the investor; |
| · | the loan’s conformity with the ultimate investors’ underwriting standards; |
| · | the credit quality of the loans; and |
| · | our compliance with laws and regulations as it relates to lending practices; |
pledged.
As it relates to loans sold previously under certain loan sale agreements and in the event of a breach of a representation, warranty or covenant under such agreement, or in the event of an EPD,by our discontinued mortgage lending business, we may be required to repurchase some of those loans or indemnify the loan purchaser for damages caused by that breach. We have been required toa breach of the loan sale agreement. While in the past we complied with the repurchase loansdemands by repurchasing the loan with cash and reselling it at a loss, thus reducing our cash position; more recently we have sold from timeaddressed these requests by negotiating a net cash settlement based on the actual or assumed loss on the loan in lieu of repurchasing the loans. The Company periodically receives repurchase requests, each of which management reviews to time; these repurchasesdetermine, based on management’s experience, whether such request may reasonably be deemed to have resultedmerit. As of December 31, 2009, we had a total of $2.0 million of unresolved repurchase requests that management concluded may reasonably be deemed to have merit, against which we had a reserve of approximately $0.3 million.
We paid quarterly cash dividends of $0.10, $0.18, $0.23 and $0.25 per common share in January, April, July, and October 2009, respectively. On December 21, 2009, we declared a loss2009 fourth quarter cash dividend of $7.5$0.25 per common share. The dividend was paid on January 26, 2010 to common stockholders of record as of January 7, 2010. On January 30, 2010, we paid a $0.63 per share cash dividend, or approximately $0.6 million in 2006.the aggregate, on shares of our Series A Preferred Stock to holders of record as of December 31, 2009. We also paid a $0.50, $0.50, $0.58 and $0.63 per share cash dividend on shares of our Series A Preferred Stock in January, April, July, and October 2009, respectively. Each of these dividends was paid out of the Company’s working capital. We expect to continue to pay quarterly cash dividends on our common stock and our Series A Preferred Stock during it term. However, our Board of Directors will continue to evaluate our dividend policy each quarter and will make adjustments as necessary, based on a variety of factors, including, among other things, the need to maintain our REIT status, our financial condition, liquidity, earnings projections and business prospects. Our dividend policy does not constitute an obligation to pay dividends, which only occurs when our Board of Directors declares a dividend.
We intend to make distributions to our stockholders to comply with the various requirements to maintain our REIT status and to minimize or avoid corporate income tax and the nondeductible excise tax. However, differences in timing between the recognition of REIT taxable income and the actual receipt of cash could require us to sell assets or to borrow funds on a short-term basis to meet the REIT distribution requirements and to avoid corporate income tax and the nondeductible excise tax.
Certain of our assets may generate substantial mismatches between REIT taxable income and available cash. These assets could include mortgage-backed securities we hold that have been issued at a discount and require the accrual of taxable income in advance of the receipt of cash. As a result, our REIT taxable income may exceed our cash available for distribution and the requirement to distribute a substantial portion of our net taxable income could cause us to:
| · | sell assets in adverse market conditions; |
| · | borrow on unfavorable terms; |
| · | distribute amounts that would otherwise be invested in assets or repayment of debt, in order to comply with the REIT distribution requirements. |
Inflation
For the periods presented herein, inflation has been relatively low and we believe that inflation has not had a material effect on our results of operations. The impact of inflation is primarily reflected in the increased costs of our operations. Virtually all our assets and liabilities are financial in nature. Our consolidated financial statements and corresponding notes thereto have been prepared in accordance with GAAP, which require the measurement of financial position and operating results in terms of historical dollars without considering the changes in the relative purchasing power of money over time due to inflation. As a result, interest rates and other factors influence our performance far more than inflation. Inflation affects our operations primarily through its effect on interest rates, since interest rates typically increase during periods of high inflation and decrease during periods of low inflation. During periods of increasing interest rates, demand for mortgages and a borrower’s ability to qualify for mortgage financing in a purchase transaction may be adversely affected. During periods of decreasing interest rates, borrowers may prepay their mortgages, which in turn may adversely affect our yield and subsequently the value of our portfolio of mortgage assets.
Contractual Obligations
and Commitments
The Company had the following contractual obligations (excluding derivative financial instruments) at December 31, 2006:2009:
($ in thousands) | | Total | | Less Than 1 Year | | 1 to 3 Years | | 4 to 5 Years | | After 5 Years | |
| Reverse repurchase agreements | | $ | 818,974 | | $ | | | | — | | | — | | | — | |
| Operating leases | | | 9,835 | | | 2,550 | | | 4,908 | | | 2,377 | | | — | |
| Collateralized debt obligations(1)(2) | | | 240,944 | | | 47,690 | | | 73,701 | | | 41,665 | | | 77,888 | |
| Subordinated debentures(1) | | | 57,156 | | | 3,594 | | | 7,198 | | | 46,364 | | | | |
| Employment agreements(3) | | | 2,256 | | | 752 | | | 1,504 | | | — | | | — | |
| Discontinued businesses | | | | | | | | | | | | | | | | |
| Warehouse facilities(5) | | | 172,972 | | | 172,972 | | | — | | | — | | | — | |
| Operating leases | | | 7,075 | | | 2,761 | | | 3,026 | | | 931 | | | 357 | |
| Employment agreements(4) | | | 2,354 | | | 785 | | | 1,569 | | | — | | | — | |
| | | $ | 1,311,566 | | $ | 1,050,078 | | $ | 91,906 | | $ | 91,337 | | $ | 78,245 | |
| ($ amounts in thousands) | | Total | | | Less than 1 year | | | 1 to 3 years | | | 3 to 5 years | | | More than 5 years | |
| Operating leases | | $ | 648 | | | $ | 190 | | | $ | 391 | | | $ | 67 | | | $ | — | |
| Repurchase agreements (1) | | | 85,124 | | | | 85,124 | | | | — | | | | — | | | | — | |
| CDOs (1)(2) | | | 281,109 | | | | 92,275 | | | | 28,726 | | | | 23,463 | | | | 136,645 | |
| Subordinated debentures (1) | | | 93,126 | | | | 2,355 | | | | 3,737 | | | | 3,732 | | | | 83,302 | |
| Convertible preferred debentures (3) | | | 22,500 | | | | 22,500 | | | | — | | | | — | | | | — | |
| Interest rate swaps (1) | | | 4,057 | | | | 2,570 | | | | 1,448 | | | | 39 | | | | — | |
| Management Fees (4) | | | 1,618 | | | | 1,618 | | | | — | | | | — | | | | — | |
| Total contractual obligations | | $ | 488,182 | | | $ | 206,632 | | | $ | 34,302 | | | $ | 27,301 | | | $ | 219,947 | |
| (1) | Amounts increaseinclude projected interest paidpayments during the period. Interest based on interest rates in effect on December 31, 2006.2009. |
| (2) | Maturities of our CDOs are dependent upon cash flows received from the underlying loans receivable. Our estimate of their repayment is based on scheduled principal payments and estimated principal prepayments based on our internal prepayment model on the underlying loans receivable. This estimate will differ from actual amounts to the extent prepayments and/or loan losses are experienced. |
| (3) | Represents base cash compensationAmounts include projected dividend payments on the Series A Preferred Stock. Quarterly dividend rate based on the quarterly dividend paid on January 26, 2010. The calculation of David Akrethe dividend rate is merely a projection for the purposes of this table and Steven Mumma.does not represent an obligation of the Company to pay all or any portion of the projected dividend amount. |
| (4) | Represents Amounts due under our advisory agreement with HCS (see below) are based on assets under management as of December 31, 2009. |
On January 18, 2008, we entered into an advisory agreement with HCS, pursuant to which HCS advises, manages and makes investments on behalf of the Managed Subsidiaries. Pursuant to the advisory agreement, HCS is entitled to receive the following compensation:
| · | base advisory fee equal to 1.50% per annum of the “equity capital” (as defined in Item 1 of this Annual Report) of the Managed Subsidiaries payable by us to HCS in cash, compensation of Steven Schnallquarterly in arrears; and Joseph Fierro. |
(5) | Excludes interest payments as the balance changes on a daily basis. |
| · | incentive compensation equal to 25% of the GAAP net income of the Managed Subsidiaries attributable to the investments that are managed by HCS that exceed a hurdle rate equal to the greater of (a) 8.00% and (b) 2.00% plus the ten year treasury rate for such fiscal year payable by us to HCS in cash, quarterly in arrears; provided, however, that a portion of the incentive compensation may be paid in shares of our common stock. |
If we terminate the advisory agreement (other than for cause) or elect not to renew it, we will be required to pay HCS a cash termination fee equal to the sum of (i) the average annual base advisory fee and (ii) the average annual incentive compensation earned during the 24-month period immediately preceding the date of termination.
Significance of Estimates and Critical Accounting Policies
We prepare our consolidated financial statements in conformity with accounting principles generally accepted in the United States of America, or GAAP, many of which require the use of estimates, judgments and assumptions that affect reported amounts. These estimates are based, in part, on our judgment and assumptions regarding various economic conditions that we believe are reasonable based on facts and circumstances existing at the time of reporting. The results of these estimates affect reported amounts of assets, liabilities and accumulated other comprehensive income at the date of the consolidated financial statements and the reported amounts of income, expenses and other comprehensive income during the periods presented.
Changes in the estimates and assumptions could have a material effect on these financial statements. Accounting policies and estimates related to specific components of our consolidated financial statements are disclosed in the notes to our consolidated financial statements. In accordance with SEC guidance, those material accounting policies and estimates that we believe are most critical to an investor’s understanding of our financial results and condition and which require complex management judgment are discussed below.
Revenue Recognition. Interest income on our prime ARM loans held in securitization trusts and RMBS is a combination of the interest earned based on the outstanding principal balance of the underlying loan/security, the contractual terms of the assets and the amortization of yield adjustments, principally premiums and discounts, using generally accepted interest methods. The net GAAP cost over the par balance of self-originated loans held for investment and premium and discount associated with the purchase of RMBS and loans are amortized into interest income over the lives of the underlying assets using the effective yield method as adjusted for the effects of estimated prepayments. Estimating prepayments and the remaining term of our interest yield investments require management’s judgment, which involves, among other things, consideration of possible future interest rate environments and an estimate of how borrowers will react to those environments, historical trends and performance. The actual prepayment speed and actual lives could be more or less than the amount estimated by management at the time of origination or purchase of the assets or at each financial reporting period.
Fair value. The Company has established and documented processes for determining fair values. Fair value is based upon quoted market prices, where available. If listed prices or quotes are not available, then fair value is based upon internally developed models that primarily use inputs that are market-based or independently-sourced market parameters, including interest rate yield curves.
A financial instrument’s categorization within the valuation hierarchy is based upon the lowest level of input that is significant to the fair value measurement. The three levels of valuation hierarchy are defined as follows:
Level 1 - inputs to the valuation methodology are quoted prices (unadjusted) for identical assets or liabilities in active markets.
Level 2 - inputs to the valuation methodology include quoted prices for similar assets and liabilities in active markets, and inputs that are observable for the asset or liability, either directly or indirectly, for substantially the full term of the financial instrument.
Level 3 - inputs to the valuation methodology are unobservable and significant to the fair value measurement.
The following describes the valuation methodologies used for the Company’s financial instruments measured at fair value, as well as the general classification of such instruments pursuant to the valuation hierarchy.
a. Investment Securities Available for Sale (RMBS) - Fair value for the RMBS in our portfolio is based on quoted prices provided by dealers who make markets in similar financial instruments. The dealers will incorporate common market pricing methods, including a spread measurement to the Treasury curve or interest rate swap curve as well as underlying characteristics of the particular security including coupon, periodic and life caps, collateral type, rate reset period and seasoning or age of the security. If quoted prices for a security are not reasonably available from a dealer, the security will be re-classified as a Level 3 security and, as a result, management will determine the fair value based on characteristics of the security that the Company receives from the issuer and based on available market information. Management reviews all prices used in determining valuation to ensure they represent current market conditions. This review includes surveying similar market transactions, comparisons to interest pricing models as well as offerings of like securities by dealers. The Company's investment securities that are comprised of RMBS are valued based upon readily observable market parameters and are classified as Level 2 fair values.
b. Investment Securities Available for Sale (CLO) - The fair value of the CLO notes, as of December 31, 2009, was based on management’s valuation determined by using a discounted future cash flows model that management believes would be used by market participants to value similar financial instruments. If a reliable market for these assets develops in the future, management will consider quoted prices provided by dealers who make markets in similar financial instruments in determining the fair value of the CLO notes. The CLO notes are classified as Level 3 fair values.
c. Interest Rate Swaps and Caps – The fair value of interest rate swaps and caps are based on using market accepted financial models as well as dealer quotes. The model utilizes readily observable market parameters, including treasury rates, interest rate swap spreads and swaption volatility curves. The Company’s interest rate caps and swaps are classified as Level 2 fair values.
Mortgage Loans Held for Sale (net) –The fair value of mortgage loans held for sale (net) are estimated by the Company based on the price that would be received if the loans were sold as whole loans taking into consideration the aggregated characteristics of the loans such as, but not limited to, collateral type, index, interest rate, margin, length of fixed interest rate period, life cap, periodic cap, underwriting standards, age and credit.
Mortgage Loans Held in Securitization Trusts (net) – Impaired Loans – Impaired mortgage loans held in the securitization trusts are recorded at amortized cost less specific loan loss reserves. Impaired loan value is based on management’s estimate of the net realizable value taking into consideration local market conditions of the distressed property, updated appraisal values of the property and estimated expenses required to remediate the impaired loan.
Real Estate Owned Held in Securitization Trusts – Real estate owned held in the securitization trusts are recorded at net realizable value. Any subsequent adjustment will result in the reduction in carrying value with the corresponding amount charge to earnings. Net realizable value based on an estimate of disposal taking into consideration local market conditions of the distressed property, updated appraisal values of the property and estimated expenses required sell the property.
Recent Accounting Pronouncements
A discussion of recent accounting pronouncements and the possible effects on our financial statements is included in Note 2 — Summary of Significant Accounting Policies included in Item 8 of this Annual Report on Form 10-K.
Item 7A.QUANTITATIVE AND QUALITATIVE DISCLOSURES ABOUT MARKET RISK
Market risk is the exposure to loss resulting from changes in interest rates, credit spreads, foreign currency exchange rates, commodity prices and equity prices. Because we are invested solely in U.S.-dollar denominated instruments, primarily residential mortgage instruments, and our borrowings are also domestic and U.S. dollar denominated, we are not subject to foreign currency exchange, or commodity and equity price risk; the primary market risk that we are exposed to is interest rate risk and its related ancillary risks. Interest rate risk is highly sensitive to many factors, including governmental monetary and tax policies, domestic and international economic and political considerations and other factors beyond our control. All of our market risk sensitive assets, liabilities and related derivative positions are for non-trading purposes only.
Management recognizes the following primary risks associated with our business and the industry in which we conduct business:
| · | Interest rate and market (fair value) risk |
| · | Liquidity and funding risk |
| · | Market (fair value) risk |
Interest Rate Risk
Our primaryInterest rates are sensitive to many factors, including governmental, monetary, tax policies, domestic and international economic conditions, and political or regulatory matters beyond our control. Changes in interest rate exposure relates torates affect the value of our investment securities and ARM loans we manage and hold in our investment portfolio, of adjustable-rate mortgage loans and mortgage-backed securities we acquire, as well as ourthe variable-rate borrowings we use to finance our portfolio, and relatedthe interest rate swaps and caps. caps we use to hedge our portfolio. All of our portfolio interest market risk sensitive assets, liabilities and related derivative positions are managed with a long term perspective and are not for trading purposes.
Interest rate risk is defined asmeasured by the sensitivity of our current and future earnings to interest rate volatility, variability of spread relationships, the difference in re-pricing intervals between our assets and liabilities and the effect that interest rates may have on our cash flows, especially the speed at which prepayments occur on our residential mortgage related assets.
Changes in the general level of interest rates can affect our net interest income, which is the difference between the interest income earned on interest earning assets and our interest expense incurred in connection with our interest bearing debt and liabilities. Changes in interest rates can also affect, among other things,borrowings.
Our adjustable-rate hybrid ARM assets reset on various dates that are not matched to the reset dates on our ability to acquire loans and securities,repurchase agreements. In general, the valuerepricing of our loans, mortgage pools and mortgage-backed securities, and our ability to realize gains fromrepurchase agreements occurs more quickly than the resale and settlement of such originated loans.
In our investment portfolio, our primary market risk is interest rate risk. Interest rate risk can be defined as the sensitivityrepricing of our portfolio, including future earnings potential, prepayments, valuations and overall liquidity to changes in interest rates. We attempt to manage interest rate risk by adjusting portfolio compositions, liability maturities and utilizing interest rate derivatives including interest rate swaps and caps. Management’s goal is to maximize the earnings potential of the portfolio while maintaining long term stable portfolio valuations.
We utilize a model based risk analysis system to assist in projecting portfolio performances over a scenario of different interest rates. The model incorporates shifts in interest rates, changes in prepayments and other factors impacting the valuations of our financial securities, including mortgage-backed securities, repurchase agreements, interest rate swaps and interest rate caps.
Based on the results of this model, as of December 31, 2006, an instantaneous shift of 100 basis points in interest rates would result in an approximate decrease in the net interest spread by 30-35 basis points as compared to our base line projections over the next year.
The following tables set forth information about financial instruments (dollar amounts in thousands):
| | | December 31, 2006 | |
| | | Notional Amount | | Carrying Amount | | Estimated Fair Value | |
| Investment securities available for sale | | $ | 491,293 | | $ | 488,962 | | $ | 488,962 | |
| Mortgage loans held in the securitization trusts | | | 584,358 | | | 588,160 | | | 582,504 | |
| Mortgage loans held for sale | | | 110,804 | | | 106,900 | | | 107,810 | |
| Commitments and contingencies: | | | | | | | | | | |
| Interest rate lock commitments - loan commitments | | | 104,334 | | | (118 | ) | | (118 | ) |
| Forward loan sales contracts | | | 142,110 | | | 171 | | | 171 | |
| Interest rate swaps | | | 285,000 | | | 621 | | | 621 | |
| Interest rate caps | | $ | 1,540,518 | | $ | 2,011 | | $ | 2,011 | |
| | | December 31, 2005 | |
| | | Notional Amount | | Carrying Amount | | Estimated Fair Value | |
| Investment securities available for sale | | $ | 719,701 | | $ | 716,482 | | $ | 716,482 | |
| Mortgage loans held for investment | | | 4,054 | | | 4,060 | | | 4,079 | |
| Mortgage loans held in the securitization trusts | | | 771,451 | | | 776,610 | | | 775,311 | |
| Mortgage loans held for sale | | | 108,244 | | | 108,271 | | | 109,252 | |
| Commitments and contingencies: | | | | | | | | | | |
| Interest rate lock commitments - loan commitments | | | 130,320 | | | 123 | | | 123 | |
| Interest rate lock commitments - mortgage loans held for sale | | | 108,109 | | | (14 | ) | | (14 | |
| Forward loan sales contracts | | | 51,763 | | | (380 | ) | | (380 | |
| Interest rate swaps | | | 645,000 | | | 6,383 | | | 6,383 | |
| Interest rate caps | | $ | 1,858,860 | | $ | 3,340 | | $ | 3,340 | |
The impact of changing interest rates may be mitigated by portfolio prepayment activity that we closely monitor and the portfolio funding strategies we employ.assets. First, our floating rate borrowings may react to changes in interest rates before our adjustable rate assets because the weighted average next repricingre-pricing dates on the related borrowings may have shorter time periods than that of the adjustable rate assets. Second, interest rates on adjustable rate assets may be limited to a “periodic cap” or an increase of typically 1% or 2% per adjustment period, while our borrowings do not have comparable limitations. Third, our adjustable rate assets typically lag changes in the applicable interest rate indices by 45 days due to the notice period provided to adjustable rate borrowers when the interest rates on their loans are scheduled to change.
We seek to manage interest rate risk in the portfolio by utilizing interest rate swaps and interest rate caps, with the goal of declining interest rates or nominal differences between long-term and short-term interest rates,optimizing the rateearnings potential while seeking to maintain long term stable portfolio values. We continually monitor the duration of prepayment on our mortgage assets may increase. Increased prepayments would cause usand have a policy to amortize any premiums paid for our mortgage assets faster, thus resulting in a reducedhedge the financing such that the net yield on our mortgage assets. Additionally, toduration of the extent proceeds of prepayments cannot be reinvested at a rate of interest at least equal to the rate previously earned on such mortgage assets, our earnings may be adversely affected.borrowed funds related to such assets, and related hedging instruments, are less than one year.
Conversely, if interest rates rise or if the differences between long-term and short-term interest rates increase the rate of prepayment on our mortgage assets may decrease. Decreased prepayments would cause us to amortize the premiums paid for our ARM assets over a longer time period, thus resulting in an increased net yield on our mortgage assets. Therefore, in rising interest rate environments where prepayments are declining, not only would the interest rate on the ARM Assets portfolio increase to re-establish a spread over the higher interest rates, but the yield also would rise due to slower prepayments. The combined effect could mitigate other negative effects that rising short-term interest rates might have on earnings.
Interest rates can also affect our net return on hybrid adjustable rate (“hybrid ARM”)ARM securities and loans net of the cost of financing hybrid ARMs. We continually monitor and estimate the duration of our hybrid ARMs and have a policy to hedge the financing of the hybrid ARMs such that the net duration of the hybrid ARMs, our borrowed funds related to such assets, and related hedging instruments are less than one year. During a declining interest rate environment, the prepayment of hybrid ARMs may accelerate (as borrowers may opt to refinance at a lower rate) causing the amount of liabilities that have been extended by the use of interest rate swaps to increase relative to the amount of hybrid ARMs, possibly resulting in a decline in our net return on hybrid ARMs as replacement hybrid ARMs may have a lower yield than those being prepaid. Conversely, during an increasing interest rate environment, hybrid ARMs may prepay slower than expected, requiring us to finance a higher amount of hybrid ARMs than originally forecast and at a time when interest rates may be higher, resulting in a decline in our net return on hybrid ARMs. Our exposure to changes in the prepayment speedspeeds of hybrid ARMs is mitigated by regular monitoring of the outstanding balance of hybrid ARMs, and adjusting the amounts anticipated to be outstanding in future periods and, on a regular basis, making adjustments to the amount of our fixed-rate borrowing obligations for future periods.
We utilize a model based risk analysis system to assist in projecting portfolio performances over a scenario of different interest rates. The model incorporates shifts in interest rates, changes in prepayments and other factors impacting the valuations of our financial securities, including mortgage-backed securities, repurchase agreements, interest rate swaps and interest rate caps. Based on the results of the model, as of December 31, 2009, instantaneous changes in interest rates would have had the following effect on net interest income: (dollar amounts in thousands):
| Changes in Net Interest Income |
| Changes in Interest Rates | | Changes in Net Interest Income |
| +200 | | $(3,009) |
| +100 | | $(1,807) |
| -100 | | $ 2,606 |
Interest rate changes may also impact our net book value as our securities, certain mortgage loansassets and related hedge derivatives are marked-to-market each quarter. Generally, as interest rates increase, the value of our fixed income investments, such as mortgage loans and mortgage-backed securities, decreasesassets decrease and as interest rates decrease, the value of such investments will increase. We seek to hedge to some degree changes in value attributable to changes in interest rates by entering into interest rate swaps and other derivative instruments. In general, we would expect however that, over time, decreases in value of our portfolio attributable to interest rate changes will be offset, to somethe degree we are hedged, by increases in value of our interest rate swaps, and vice versa. However, the relationship between spreads on securities and spreads on swaps may vary from time to time, resulting in a net aggregate book value increase or decline. However,That said, unless there is a material impairment in value that would result in a payment not being received on a security or loan, changes in the book value of our portfolio will not directly affect our recurring earnings or our ability to make a distribution to our stockholders.
In order to minimize the negative impacts of changes in interest rates on earnings and capital, we closely monitor our asset and liability mix and utilize interest rate swaps and caps, subject to the limitations imposed by the REIT qualification tests.
Movements in interest rates can pose a major risk to us in either a rising or declining interest rate environment. We depend on substantial borrowings to conduct our business. These borrowings are all made at variable interest rate terms that will increase as short term interest rates rise. Additionally, when interest rates rise, mortgage loans held for sale and any applications in process with interest rate lock commitments, or IRLCs, decrease in value. To preserve the value of such loans or applications in process with IRLCs, we may enter into forward sale loan contracts, or FSLCs, to be settled at future dates with fixed prices.
Our hedging transactions using derivative instruments also involve certain additional risks such as counterparty credit risk, the enforceabilityLiquidity Risk
Liquidity is a measure of hedging contractsour ability to meet potential cash requirements, including ongoing commitments to repay borrowings, fund and the risk that unanticipated and significant changes in interest rates will cause a significant loss of basis in the contract. The counterpartiesmaintain investments, pay dividends to our derivative arrangementsstockholders and other general business needs. We recognize the need to have funds available to operate our business. It is our policy to have adequate liquidity at all times. We plan to meet liquidity through normal operations with the goal of avoiding unplanned sales of assets or emergency borrowing of funds.
Our principal sources of liquidity are major financial institutionsthe repurchase agreements on our RMBS, the CDOs we have issued to finance our loans held in securitization trusts, the principal and interest payments from mortgage assets and cash proceeds from the issuance of equity securities dealers that are well capitalized with high credit ratings(as market and with which we may also have other financial relationships. While we do not anticipate nonperformance by any counterparty, we are exposed to potential credit losses in the event the counterparty fails to perform. Our exposure to credit risk in the event of default by a counterparty is the difference between the value of the contractconditions permit). We believe our existing cash balances and the current market price. There can be no assurance that wecash flows from operations will be able to adequately protect againstsufficient for our liquidity requirements for at least the forgoing risks and will ultimately realize an economic benefit that exceeds the related expenses incurred in connection with engaging in such hedging strategies.
Credit Spread Exposurenext 12 months.
The mortgage-backed securitiesAs it relates to our investment portfolio, derivative financial instruments we currently, and will in the future, own are alsouse to hedge interest rate risk subject us to spread“margin call” risk. The majority of these securities will be adjustable-rate securities that are valued based on a market credit spread to U.S. Treasury security yields. In other words, their value is dependent on the yield demanded on such securities by the market based on their credit relative to U.S. Treasury securities. Excessive supply of such securities combined with reduced demand will generally cause the market to require a higher yield on such securities, resulting in the use of a higher or wider spread over the benchmark rate (usually the applicable U.S. Treasury security yield) to value such securities. Under such conditions,If the value of our securitiespledged assets decrease, due to a change in interest rates, credit characteristics, or other pricing factors, we may be required to post additional cash or asset collateral, or reduce the amount we are able to borrower versus the collateral. Under our interest rate swaps typically we pay a fixed rate to the counterparties while they pay us a floating rate. If interest rates drop below the fixed rate we are paying on an interest rate swap, we may be required to post cash margin.
Prepayment Risk
When borrowers repay the principal on their mortgage loans before maturity or faster than their scheduled amortization, the effect is to shorten the period over which interest is earned, and therefore, reduce the yield for mortgage assets purchased at a premium to their then current balance, as with the majority of our assets. Conversely, mortgage assets purchased for less than their then current balance exhibit higher yields due to faster prepayments. Furthermore, prepayment speeds exceeding or lower than our modeled prepayment speeds impact the effectiveness of any hedges we have in place to mitigate financing and/or fair value risk. Generally, when market interest rates decline, borrowers have a tendency to refinance their mortgages, thereby increasing prepayments.
Our prepayment model will help determine the amount of hedging we use to off-set changes in interest rates. If actual prepayment rates are higher than modeled, the yield will be less than modeled in cases where we paid a premium for the particular mortgage asset. Conversely, when we have paid a premium, if actual prepayment rates experienced are slower than modeled, we would amortize the premium over a longer time period, resulting in a higher yield to maturity.
In an increasing prepayment environment, the timing difference between the actual cash receipt of principal paydowns and the announcement of the principal paydown may result in additional margin requirements from our repurchase agreement counterparties.
We mitigate prepayment risk by constantly evaluating our mortgage assets relative to prepayment speeds observed for assets with a similar structure, quality and characteristics. Furthermore, we stress-test the portfolio would tendas to decline. Conversely, ifprepayment speeds and interest rate risk in order to further develop or make modifications to our hedge balances. Historically, we have not hedged 100% of our liability costs due to prepayment risk.
Credit Risk
Credit risk is the spread usedrisk that we will not fully collect the principal we have invested in mortgage loans or other assets due to value such securitieseither borrower defaults, or a counterparty failure. Our portfolio of loans held in securitization trusts as of December 31, 2009 consisted of approximately $276.2 million of securitized first liens originated in 2005 and earlier. The securitized first liens were principally originated in 2005 by our subsidiary, HC, prior to decrease or tighten,our exit from the mortgage lending business. These are predominately high-quality loans with an average loan-to-value (“LTV”) ratio at origination of approximately 70.3%, and average borrower FICO score of approximately 732. In addition, approximately 67.7% of these loans were originated with full income and asset verification. While we feel that our origination and underwriting of these loans will help to mitigate the risk of significant borrower default on these loans, we cannot assure you that all borrowers will continue to satisfy their payment obligations under these loans and thereby avoid default.
As of December 31, 2009, we owned approximately $42.9 million on non-Agency RMBS senior securities. The non-Agency RMBS has a weighted average amortized purchase price of approximately 70.6% of current par value. Management believes the purchase price discount coupled with the credit support within the bond structure protects us from principal loss under most stress scenarios for these non-Agency RMBS. In addition, as of December 31, 2009 we own approximately $46.0 million of par value of ourCLOs, with a carrying value of $17.6 million and a discounted purchase price of approximately 19.99% of par. The securities are backed by a portfolio would tendof middle market corporate loans.
Market (Fair Value) Risk
Changes in interest rates also expose us to increase. Such changes inmarket risk that the market value of our portfolio may affect our net equity, net income or cash flow directly through their impact on unrealized gains or losses on available-for-sale securities, and therefore our ability to realize gains on such securities, or indirectly through their impact(fair value) on our ability to borrow and access capital.
Furthermore, shifts in the U.S. Treasury yield curve, which represents the market’s expectations of future interest rates, would also affect the yield required on our securities and therefore their value. These shifts, or a change in spreads, would have a similar effect on our portfolio, financial position and results of operations.
Market (Fair Value) Risk
assets may decline. For certain of the financial instruments that we own, fair values will not be readily available since there are no active trading markets for these instruments as characterized by current exchanges between willing parties. Accordingly, fair values can only be derived or estimated for these investments using various valuation techniques, such as computing the present value of estimated future cash flows using discount rates commensurate with the risks involved. However, the determination of estimated future cash flows is inherently subjective and imprecise. Minor changes in assumptions or estimation methodologies can have a material effect on these derived or estimated fair values. These estimates and assumptions are indicative of the interest rate environments as of December 31, 20062009, and do not take into consideration the effects of subsequent interest rate fluctuations.
We note that the values of our investments in mortgage-backed securities and in derivative instruments, primarily interest rate hedges on our debt, will be sensitive to changes in market interest rates, interest rate spreads, credit spreads and other market factors. The value of these investments can vary and has varied materially from period to period. Historically, the values of our mortgage loan portfolio have tended to vary inversely with those of its derivative instruments.
The following describes the methods and assumptions we use in estimating fair values of our financial instruments:
Fair value estimates are made as of a specific point in time based on estimates using present value or other valuation techniques. These techniques involve uncertainties and are significantly affected by the assumptions used and the judgments made regarding risk characteristics of various financial instruments, discount rates, estimatesestimate of future cash flows,cashflows, future expected loss experience and other factors.
Changes in assumptions could significantly affect these estimates and the resulting fair values. Derived fair value estimates cannot be substantiated by comparison to independent markets and, in many cases, could not be realized in an immediate sale of the instrument. Also, because of differences in methodologies and assumptions used to estimate fair values, the fair values used by us should not be compared to those of other companies.
The fair values of the Company’s residential mortgage-backedour investment securities are generally based on market prices provided by five to seven dealers who make markets in these financial instruments. If the fair value of a security is not reasonably available from a dealer, management estimates the fair value based on characteristics of the security that the Company receiveswe receive from the issuer and on available market information.
The fair value of mortgage loans held in securitization trusts is estimated using pricing models and taking into consideration the aggregated characteristics of groups of loans such as, but not limited to, collateral type, index, interest rate, margin, length of fixed-rate period, life cap, periodic cap, underwriting standards, age and credit estimated using the estimated market prices for investment are determined bysimilar types of loans. Due to significant market dislocation over the past 18 months, secondary market prices were given minimal weighting when arriving at loan pricing sheet which is based on internal management pricingvaluation at December 31, 2009 and third party competitors in similar products and markets.December 31, 2008 fair value.
The fair value of loan commitments to fund with agreed upon rates are estimated using the fees and rates currently charged to enter into similar agreements, taking into account the remaining terms of the agreements and the present creditworthiness of the counterparties. For fixed rate loan commitments, fair value also considers the difference between currentthese CDOs is based on discounted cashflows as well as market interest rates and the existing committed rates.pricing on comparable CDOs.
The fair value of commitments to deliver mortgages is estimated using current market prices for dealer or investor commitments relative to our existing positions.The market risk management discussion and the amounts estimated from the analysis that follows are forward-looking statements that assume that certain market conditions occur. Actual results may differ materially from these projected results due to changes in our ARM portfolio assets and borrowings mix and due to developments in the domestic and global financial and real estate markets. Developments in the financial markets include the likelihood of changing interest rates and the relationship of various interest rates and their impact on our ARM portfolio yield, cost of funds and cash flows. The analytical methods that we use to assess and mitigate these market risks should not be considered projections of future events or operating performance.
As a financial institution that has only invested in U.S.-dollar denominated instruments, primarily residential mortgage instruments, and has only borrowed money in the domestic market, we are not subject to foreign currency exchange or commodity price risk. Rather, our market risk exposure is largely due to interest rate risk. Interest rate risk impacts our interest income, interest expense and the market value on a large portion of our assets and liabilities. The management of interest rate risk attempts to maximize earnings and to preserve capital by minimizing the negative impacts of changing market rates, asset and liability mix, and prepayment activity.
The table below presents the sensitivity of the market value and net duration changes of our portfolio as of December 31, 2009, using a discounted cash flow simulation model.model assuming an instantaneous interest rate shift. Application of this method results in an estimation of the percentage change in thefair market value change of our assets, liabilities and hedging instruments per 100 basis point (“bp”) shift in interest rates expressed in years - a measure commonly referred to as duration. Positive portfolio duration indicates that the market value of the total portfolio will decline if interest rates rise and increase if interest rates decline. The closer duration is to zero, the less interest rate changes are expected to affect earnings. Included in the table is a “Base Case” duration calculation for an interest rate scenario that assumes future rates are those implied by the yield curve as of December 31, 2006. The other two scenarios assume interest rates are instantaneously 100 and 200 bps higher that those implied by market rates as of December 31, 2006.rates.
The use of hedging instruments is a critical part of our interest rate risk management strategies, and the effects of these hedging instruments on the market value of the portfolio are reflected in the model’smodel's output. This analysis also takes into consideration the value of options embedded in our mortgage assets including constraints on the repricingre-pricing of the interest rate of ARM Assetsassets resulting from periodic and lifetime cap features, as well as prepayment options. Assets and liabilities that are not interest rate-sensitive such as cash, payment receivables, prepaid expenses, payables and accrued expenses are excluded. The duration calculated from this model is a key measure of the effectiveness of our interest rate risk management strategies.
Changes in assumptions including, but not limited to, volatility, mortgage and financing spreads, prepayment behavior, defaults, as well as the timing and level of interest rate changes will affect the results of the model. Therefore, actual results are likely to vary from modeled results.
| Market Value Changes |
Changes in Interest Rates | | Changes in Market Value | | Net Duration |
| | | (Amount in thousands) | | |
| +200 | | | $(7,813) | | | 0.83 years |
| +100 | | | $(4,451) | | | 0.73 years |
| Base | | | — | | | 0.65 years |
| -100 | | | $ 3,384 | | | 0.36 years |
Net Portfolio Duration
December 31, 2006
| | | | Basis point increase
| |
| | Base
| | +100
| | +200
| |
Mortgage Portfolio | | | 0.95 years | | | 1.33 years | | | 1.47 years | |
Borrowings (including hedges) | | | 0.43 years | | | 0.43 years
| | | 0.43 years
| |
Net | | | 0.52 years | | | 0.90 years | | | 1.04 years | |
It should be noted that the model is used as a tool to identify potential risk in a changing interest rate environment but does not include any changes in portfolio composition, financing strategies, market spreads or changes in overall market liquidity.
Based on the assumptions used, the model output suggests a very low degree of portfolio price change given increases in interest rates, which implies that our cash flow and earning characteristics should be relatively stable for comparable changes in interest rates.
Although market value sensitivity analysis is widely accepted in identifying interest rate risk, it does not take into consideration changes that may occur such as, but not limited to, changes in investment and financing strategies, changes in market spreads and changes in business volumes. Accordingly, we make extensive use of an earnings simulation model to further analyze our level of interest rate risk.
There are a number of key assumptions in our earnings simulation model. These key assumptions include changes in market conditions that affect interest rates, the pricing of ARM products, the availability of ARM products,investment assets and the availability and the cost of financing for ARM products.portfolio assets. Other key assumptions made in using the simulation model include prepayment speeds and management’smanagement's investment, financing and hedging strategies, and the issuance of new equity. We typically run the simulation model under a variety of hypothetical business scenarios that may include different interest rate scenarios, different investment strategies, different prepayment possibilities and other scenarios that provide us with a range of possible earnings outcomes in order to assess potential interest rate risk. The assumptions used represent our estimate of the likely effect of changes in interest rates and do not necessarily reflect actual results. The earnings simulation model takes into account periodic and lifetime caps embedded in our ARM Assetsassets in determining the earnings at risk.
Liquidity and Funding Risk
Liquidity is a measure of our ability to meet potential cash requirements, including ongoing commitments to repay borrowings, fund and maintain investments, pay dividends to our stockholders and other general business needs. We recognize the need to have funds available for our operating. It is our policy to have adequate liquidity at all times. We plan to meet liquidity through normal operations with the goal of avoiding unplanned sales of assets or emergency borrowing of funds.
Our ability to hold mortgage loans held for sale require cash. Generally, we are required to have a balance of between zero and 4% of the loan’s balance funded by the Company with cash, the balance being drawn from the warehouse facility. Our operating cash inflows are predominately from cash flows from mortgage securities, principal and interest on mortgage loans, and sales of originated loans.
Loans financed on our warehouse facility are subject to changing market valuations and margin calls. The market value of our loans is dependent on a variety of economic conditions, including interest rates (and borrower demand) and end investor desire and capacity. These values can also be affected by general tightening of credit standards across the industry recently. There is no certainty that market values will remain constant going forward. To the extent the value of the loans declines significantly, we would be required to repay portions of the amounts we have borrowed.
As it relates to our investment portfolio, derivative financial instruments we use also subject us to “margin call” risk based on their market values. Under our interest rate swaps, we pay a fixed rate to the counterparties while they pay us a floating rate. When floating rates are low, on a net basis we pay the counterparty and visa-versa. In a declining interest rate environment, we would be subject to additional exposure for cash margin calls due to accelerating prepayments of mortgage assets. However, the asset side of the balance sheet should increase in value in a further declining interest rate scenario. Most of our interest rate swap agreements provide for a bi-lateral posting of margin, the effect being that either swap party must post margin, depending on the change in value of the swap over time. Unlike typical unilateral posting of margin only in the direction of the swap counterparty, this provides us with additional flexibility in meeting our liquidity requirements as we can call margin on our counterparty as swap values increase.
Incoming cash on our mortgage loans and securities is a principal source of cash. The volume of cash depends on, among other things, interest rates. The volume and quality of such incoming cash flows can be impacted by severe and immediate changes in interest rates. If rates increase dramatically, our short-term funding costs will increase quickly. While many of our investment portfolio loans are hybrid ARMs, they typically will not reset as quickly as our funding costs creating a reduction in incoming cash flow. Our derivative financial instruments are used to mitigate the effect of interest rate volatility.
We manage liquidity to ensure that we have the continuing ability to maintain cash flows that are adequate to meet commitments on a timely and cost-effective basis. Our principal sources of liquidity are the repurchase agreement market, the issuance of CDOs, loan warehouse facilities as well as principal and interest payments from portfolio Assets. We believe our existing cash balances and cash flows from operations will be sufficient for our liquidity requirements for at least the next 12 months.
Prepayment Risk
When borrowers repay the principal on their mortgage loans before maturity or faster than their scheduled amortization, the effect is to shorten the period over which interest is earned, and therefore, reduce the cash flow and yield on our ARM Assets. Furthermore, prepayment speeds exceeding or lower than our reasonable estimates for similar assets, impact the effectiveness of any hedges we have in place to mitigate financing and/or fair value risk. Generally, when market interest rates decline, borrowers have a tendency to refinance their mortgages. The higher the interest rate a borrower currently has on his or her mortgage the more incentive he or she has to refinance the mortgage when rates decline. Additionally, when a borrower has a low loan-to-value ratio, he or she is more likely to do a “cash-out” refinance. Each of these factors increases the chance for higher prepayment speeds during the term of the loan.
We mitigate prepayment risk by constantly evaluating our ARM portfolio at a range of reasonable market prepayment speeds observed at the time for assets with a similar structure, quality and characteristics. Furthermore, we stress-test the portfolio as to prepayment speeds and interest rate risk in order to develop an effective hedging strategy.
For the three months ended December 31, 2006, our mortgage assets paid down at an approximate average annualized Constant Paydown Rate (“CPR”) of 17%, compared to 21% for the three months ended September 30, 2006, to 20% for the three months ended June 30, 2006, to 19% for the three months ended March 31, 2006 and 31% for the three months ended December 31, 2005. The constant prepayment rate averaged approximately 19% during the year ended December 31, 2006. When prepayment experience increases, we have to amortize our premiums over a shorter time period, resulting in a reduced yield to maturity on our ARM Assets. Conversely, if actual prepayment experience decreases, we would amortize the premium over a longer time period, resulting in a higher yield to maturity. We monitor our prepayment experience on a monthly basis and adjust the amortization of the net premium, as appropriate.
Credit Risk
Credit risk is the risk that we will not fully collect the principal we have invested in mortgage loans or securities. As previously noted, we are predominately a high-quality loan originator and our underwriting guidelines are intended to evaluate the credit history of the potential borrower, the capacity and willingness of the borrower to repay the loan, and the adequacy of the collateral securing the loan. Along with this however, is a growing percentage of loans underwritten with stated income and/or stated assets. These loan types make credit risk assessment more difficult.
We mitigate credit risk by establishing and applying criteria that identifies high-credit quality borrowers. With regard to the purchased mortgage security portfolio, we rely on the guaranties of FNMA, FHLMC, GNMA or the AAA/Aaa rating established by the Rating Agencies.
With regard to loans included in our securitization, factors such as FICO score, LTV, debt-to-income ratio, and other borrower and collateral factors are evaluated. Credit enhancement features, such as mortgage insurance may also be factored into the credit decision. In some instances, when the borrower exhibits strong compensating factors, exceptions to the underwriting guidelines may be approved.
Our loans held in securitization are concentrated in geographic markets that are generally supply constrained. We believe that these markets have less exposure to sudden declines in housing values than those markets which have an oversupply of housing. In addition, in the supply constrained housing markets we focus on, housing values tend to be high and, generally, underwriting standards for higher value homes require lower LTVs and thus more owner equity further mitigating credit risk. For our mortgage securities that are purchased, we rely on the Fannie Mae, Freddie Mac, Ginnie Mae and AAA-rating of the securities supplemented with additional due diligence.
Item 8.FINANCIAL STATEMENTS AND SUPPLEMENTARY DATA
TheOur financial statements of the Company and the related notes, and schedules to the financial statements, together with the Report of Independent Registered Public Accounting Firm thereon, as required by this Item 8, are set forth beginning on page F-1 of this annual report on Form 10-K.10-K and are incorporated herein by reference.
Item 9.CHANGES IN AND DISAGREEMENTS WITH ACCOUNTANTS ON ACCOUNTING AND FINANCIAL DISCLOSURE.
None.
None.
Item 9A.CONTROLS AND PROCEDURES
Evaluation of Disclosure Controls and Procedures.Procedures As of the end of the period covered by this report, we carried out an evaluation, under the supervision of and with the participation of our management, including our Co-Chief Executive Officer and Chief Financial Officer, of the effectiveness of the design and operation of our - We maintain disclosure controls and procedures (as defined in Rules 13a-15(e) and 15d-15(e) under the Securities Exchange Act of 1934) as of December 31, 2006that are designed to ensure that information required to be disclosed in the reports that we file or submit under the Securities Exchange Act of 1934, as amended, is recorded, processed, summarized and reported within the time periods specified in the rules and forms of the SEC, and that such information is accumulated and communicated to our management timely.as appropriate to allow timely decisions regarding required disclosures. An evaluation was performed under the supervision and with the participation of our management, including our Chief Executive Officer and Chief Financial Officer, of the effectiveness of our disclosure controls and procedures (as defined in Rules 13a-15(e) and 15d-15(e) under the Securities Exchange Act of 1934, as amended) as of December 31, 2009. Based upon that evaluation, our management, including our Co-ChiefChief Executive Officer and our Chief Financial Officer concluded that our disclosure controls and procedures were effective as of December 31, 2006.2009.
Management’s Report on Internal Control Over Financial Reporting. Our management is responsible for establishing and maintaining adequate internal control over financial reporting, for our company, as such term is defined in Exchange Act Rule 13a-15(f). Our internal control system was designed to provide reasonable assurance to our management and Board of Directors regarding the reliability, preparation and fair presentation of published financial statements in accordance with generally accepted accounting principles. Under the supervision and with the participation of our management, including our principal executive officersofficer and principal financial officer, we conducted an evaluation of the effectiveness of our internal control over financial reporting based on the framework set forth in “Internal Control - Integrated Framework,” issued by the Committee of Sponsoring Organizations of the Treadway Commission (“COSO”) andCommission. Based on our evaluation under the framework in Internal Control -Integrated Framework, our management concluded that there was a material weakness in the operation of the Company’s internal control over financial reporting as of December 31, 2006. A material weakness is a control deficiency or combination of control deficiencies that results in more than a remote likelihood that a material misstatement of the annual or interim financial statements will not be prevented or detected. The material weakness identified was an inadequacy in the operation of our control activities involving the completion and review of the accounting period closing process. The sale of substantially all of the operating assets of our mortgage lending platform to Indymac, which closed as of March 31, 2007, significantly increased the workload demands of the existing accounting staff, thereby disrupting the timely completion and review of the accounting period closing process. In addition, in connection with the uncertainty of the consummation and effect of the Indymac transaction, the accounting department was affected by the departure of certain key accounting personnel during this time. The increased workload and decreased staff levels resulted in a significant number of post-closing journal entries and contributed to a request for additional time to file our Annual Report on Form 10-K in accordance with Rule 12b-25.
Management’s assessment of the effectiveness of our internal control over financial reporting was effective as of December 31, 2006 has been audited by Deloitte & Touche LLP,2009.
This Annual Report on Form 10-K does not include an attestation report of our independent registered public accounting firm as stated in their report which is included herein beginning on page F-2 of this annual report on Form 10-K.
Remediation Plan. With the closing of the Indymac transaction, management believes that the workload demands on the accounting staff will be greatly reduced going forward. During the first quarter of 2007, and in preparation for the completion and review of the accounting period closing process for the first quarter of 2007, management has been actively assessing the Company’s accounting needs and taking such necessary steps to retain and hire additional accounting staff with the requisite accounting experience and skill to effectively remediate this material weakness. Management believes that taking these steps will remediate the material weakness inregarding internal control over financial reporting. Management’s report was not subject to attestation by our independent registered public accounting firm pursuant to the rules of the SEC that permit us to provide only management’s report in this Annual Report on Form 10-K.
Changes in Internal Control Over Financial Reporting. There have been no changes in the Company'sour internal control over financial reporting during the quarter ended December 31, 20062009 that have materially affected, or are reasonably likely to materially affect, the Company'sour internal control over financial reporting. The changes in the Company's internal control over financial reporting described above are changes that management has implemented during the three months ended March 31, 2007.
Item 9B.OTHER INFORMATION
The table below summarizes the 2006 cash incentive bonuses granted to each of the Company’s executive officers along with 2007 contractual salaries:None.
| | | 2007 Annual Salary(1)(3)(4) | | 2006 Cash Bonus(2) | |
| Steven B. Schnall | | $ | 434,008 | | $ | ─ | |
| Chairman of the Board and Co-Chief Executive Officer(4) | | | | | | | |
| David A. Akre | | | 434,008 | | | ─ | |
| Co-Chief Executive Officer | | | | | | | |
| Joseph V. Fierro | | | 350,545 | | | ─ | |
| Chief Operating Officer of NYMC(4) | | | | | | | |
| Steven R. Mumma | | $ | 434,008 | | $ | 30,000 | |
| President, Co-Chief Executive Officer and Chief Financial Officer | | | | | | | |
(1) | Pursuant to each of the executive officer’s employment agreements, 2007 base salaries reflect a 2.5% increase over base salary as established in 2006. |
(2) | On February 5, 2007 the compensation committee of the Company’s Board of Directors granted a 2006 cash incentive bonus to Steven R. Mumma. |
(3) | On March 28, 2007, the Company's Board of Directors approved an increase in Mr Mumma's base salary to $434,008 upon the consummation of the Indymac transaction and his being named President and Co-Chief Executive in addition to his title of Chief Financial Officer. Prior to April 1, 2007, Mr Mumma's 2007 annualized salary would have been $317,954. |
(4) | Upon the consummation of the transaction with Indymac on March 31, 2007, Steven B. Schnall and Joseph V. Fierro resigned from their executive positions and assumed roles with Indymac. |
PART III
On December 13, 2005, NYMC Loan Corporation, a wholly owned subsidiary of New York Mortgage Trust, Inc. (the “Company”), and the Company entered into a $300 million master repurchase agreement (the “Agreement”) with DB Structured Products, Inc., Aspen Funding Corp. and Newport Funding Corp. (each a “Buyer” and collectively the “Buyers”) to finance, on a short-term basis, mortgage loans originated by The New York Mortgage Company, LLC (“assets”). The Company guaranteed the payment and performance of NYMC Loan Corporation, as Seller, under the Agreement. Under the Agreement, the Seller may sell assets to the Buyers and agrees to repurchase those assets on a date certain. The purchase price for assets is generally an amount equal to the product of the market value of the assets to be sold multiplied by a percentage of the purchase price that generally ranges from 75% to 98% of the asset's market value, depending on the type of mortgage asset being financed and whether the asset is performing or non-performing. In general, the repurchase price equals the original purchase price plus accrued but unpaid interest. Pursuant to the terms of the Agreement, the Seller pays interest to the Buyers at a fixed percentage over LIBOR depending on collateral type. All of the Seller's interest in the transferred assets passes to the Buyers on the purchase date. Upon receipt of the purchase price, the Buyers transfer their ownership interests in the asset back to the Seller. The Agreement is a $300 million uncommitted lending facility, meaning the Buyers must agree to each asset financed under the Agreement. If the market value of an asset financed under the facility declines to less than the related Buyer's purchase price (the “margin deficit”), then the Buyers may require that the Seller transfer cash in an amount equal to such margin deficit or additional loans or may retain any funds received by it to which the Seller would otherwise be entitled. On December 12, 2006, the facility was extended until December 12, 2007.
The Company and the Seller are required to maintain certain routine covenants during the term of the Agreement, including without limitation, maintaining a certain level of net worth, not exceeding a certain indebtedness ratio, providing financial reports, not undertaking a merger or other fundamental transaction, and maintaining a certain level of profitability. The Agreement requires that all assets subject to the facility have the related loan documents delivered to LaSalle Bank, National Association, who holds them as a custodian so long as they are subject to the facility.
In addition to being an uncommitted facility, if an event of default (as defined in the Agreement) occurs, the Seller will be unable to finance assets under the facility and its obligation to repurchase assets financed under the facility may, at the option of the Buyers, be accelerated. The definition of an event of default includes, among others, the following events: (i) failure to pay sums due under the Agreement, (ii) failure to repurchase an asset as required, (iii) a default on other obligations of the Company or Seller that involves the failure to pay a matured obligation or permits the acceleration of the maturity of the obligation, (iv) a material adverse change in the Company's or Seller's property, business, or financial condition, and (v) undergoing a change in control of the Company.
If the Seller defaults under the Agreement, then the Buyers have most standard remedies, including, demanding all assets be repurchased and selling the assets subject to the facility. Pursuant to an amended and restated guaranty of the Company, the Company fully and unconditionally guarantees the obligations of the Sellers under the terms of this Agreement.
On January 5, 2006, the Company and its wholly-owned subsidiaries, The New York Mortgage Company, LLC (“NYMC”) and New York Mortgage Funding, LLC (“NYMF”) (the Company, NYMC and NYMF, each a Seller and together, the “Sellers”), entered into a $250 million master repurchase agreement with Greenwich Capital Products, Inc. (“GCM”). The terms of the agreement between the Sellers and GCM are substantially similar to the Agreement described above. The agreement between the Sellers and GCM is a full-recourse facility against the Sellers and all obligations of the Sellers are joint and several. This agreement with GCM was set to expire on December 4, 2006. On December 1, 2006, the facility was extended until January 4, 2007 and on December 22, 2006 the facility was again extended until February 4, 2007. At that time, management decided not to seek renewal of this facility which expired on February 4, 2007.
In connection with the sale of our mortgage banking platform to Indymac and as an inducement for certain employees to accept employment with Indymac, on March 28, 2007, the Company's Board of Directors approved the acceleration of vesting of an aggregate of 46,848 performance shares and shares of restricted stock previously awarded to non-executive employees of the company. Pursuant to this action, the awards will vest and be paid in cash the 30th day following the closing of the Indymac transaction.
In connection with Mr. Mumma's appointment as President and Co-Chief Executive Officer of the Company upon consummation of the Indymac transaction, on March 28, 2007, our Board of Directors approved Amendment No. 2 to Mr. Mumma's employment agreement increasing his base salary in the manner set forth above. On the same date, our Board of Directors elected Mr. Mumma to serve on the Board, effective March 31, 2007, and to stand for election at our 2007 Annual Meeting of Shareholders in June.
PART III
Item 10.DIRECTORS, AND EXECUTIVE OFFICERS OF THE REGISTRANTOFFICER AND CORPORATE GOVERNANCE
Information on our directors and executive officers and the audit committee of our is incorporated by reference from our Proxy Statement (under the headings “Proposal 1: Election of Directors,” “Information on Our Board of Directors and its Committees,” “Section 16(a) Beneficial Ownership Reporting Compliance” and “Executive Officers and Significant Employees”Officers”) to be filed with respect to our Annual Meeting of Stockholders to be held June 14, 2007May 11, 2010 (the “2007“2009 Proxy Statement”).
Because our common stock is listed on the NYSE, our Co-Chief Executive Officers are required to make an annual certification to the NYSE stating that they are not aware of any violation by us of the corporate governance listing standards of the NYSE. Our Co-Chief Executive Officers made their annual certification to that effect to the NYSE as of June 30, 2006. In addition, we have filed, as exhibits to this Annual Report on Form 10-K, the certifications of our principal executive officers and principal financial officer required under SectionSections 302 and 906 of the Sarbanes Oxley Act of 2002.
Item 11.EXECUTIVE COMPENSATION
The information presented under the headings “Compensation of Directors”Directors,” “Executive Compensation,” “Compensation Committee Interlocks and “Executive Compensation”Insider Participation” and “Compensation Committee Report” in our 20072010 Proxy Statement to be filed with the SEC is incorporated herein by reference.
Item 12.SECURITY OWNERSHIP OF CERTAIN BENEFICIAL OWNERS AND MANAGEMENT AND RELATED STOCKHOLDER MATTERS
The information presented under the heading “Securityheadings “Share Ownership of Directors and Executive Officers” and “Share Ownership by Certain Beneficial Owners and Management”Owners” in our 20072010 Proxy Statement to be filed with the SEC is incorporated herein by reference.
The information presented under the heading “Market for the Registrant’s Common Equity and Related Stockholder Matters — Securities Authorized for Issuance Under Equity Compensation Plans” in Item 5 of Part II of this Form 10-K is incorporated herein by reference.
Item 13.CERTAIN RELATIONSHIPS AND RELATED PARTY TRANSACTIONS, AND DIRECTOR INDEPENDENCE
The information presented under the heading “Certain Relationships and Related Party Transactions” and “Information on Our Board of Directors and its Committees” in our 2007 Proxy Statement to be filed with the SEC is incorporated herein by reference.
Item 14. PRINCIPAL ACCOUNTANT FEES AND SERVICES
The information presented under the headings “Principal Accountant Fees and Services” and “Audit Committee Pre-Approval Policy” in our 20062010 Proxy Statement to be filed with the SEC is incorporated herein by reference.
Item 14.PRINCIPAL ACCOUNTANT FEES AND SERVICES
The information presented under the heading “Relationship with Independent Registered Public Accounting Firm” in our 2010 Proxy Statement to be filed with the SEC is incorporated herein by reference.
PART IV
Item 15.EXHIBITS, AND FINANCIAL STATEMENT SCHEDULES
| (a) | Financial Statements and Schedules. The following financial statements and schedules are included in this report: |
| | (a) | Page
Financial Statements |
| | FINANCIAL STATEMENTS:
| Page |
| | | |
| | Report of Independent Registered Public Accounting Firm - Grant Thornton LLP | F-2 |
| | | |
| | Report of Independent Registered Public Accounting Firm - DELOITTE & TOUCHE LLP | F-3 |
| | | |
| | Consolidated Balance Sheets | F-4 |
| | | |
| | Consolidated Statements of Operations | F-5 |
| | | |
| | Consolidated Statements of Stockholders’/Members’ Equity | F-6 |
| | | |
| | Consolidated Statements of Cash Flows | F-7 |
| | | |
| | Notes to Consolidated Financial Statements | F-8 |
The information set forth under “Exhibit Index”“Exhibit Index” below is incorporated herein by reference.
SIGNATURES
Pursuant to the requirements of Section 13 or 15(d) of the Securities Exchange Act of 1934, the Registrant has duly caused this report to be signed on its behalf by the undersigned, thereunto duly authorized.
| | | |
| |
| NEW YORK MORTGAGE TRUST, INC. |
|
|
|
Date: April 2, 2007March 8, 2010 | By: | /s/ DAVID A. AKRESteven R. Mumma |
| |
Name: David A. Akre Steven R. Mumma |
| | Title: Co-ChiefChief Executive Officer |
Pursuant to the requirements of the Securities Exchange Act of 1934, this report has been signed below by the following persons on behalf of the registrant and in the capacities and on the dates indicated.
Signature | | Title | | Date |
| | | | |
| | | | |
/s/ David A. Akre | | Co-Chief Executive Officer | | April 2, 2007 |
David A. Akre | | and Director | | |
| | (Principal Executive Officer) | | |
| | | | |
| | | | | |
| /s/ Steven R. Mumma | | President, Co-ChiefChief Executive Officer and | | April 2, 2007March 8, 2010 |
| Steven R. Mumma | | Chief Financial Officer | | |
| | (Principal Executive Officer and Principal Financial Officer) | | |
| | | | |
| | | | | |
/s/ Steven B. SchnallJames J. Fowler | | Chairman of the Board | | April 2, 2007 March 8, 2010 |
Steven B. Schnall | | | | |
| | | | |
| | | | |
/s/ David R. Bock | | Director | | April 2, 2007 |
David R. Bock | | | | |
| James J. Fowler | | | | |
| | | | | |
| /s/ Alan L. Hainey | | Director | | April 2, 2007March 8, 2010 |
| Alan L. Hainey | | | | |
| | | | |
| | | | | |
| /s/ Steven G. Norcutt | | Director | | April 2, 2007March 8, 2010 |
| Steven G. Norcutt | | | | |
| | | | | |
| | | | |
/s/ Mary Dwyer PembrokeDaniel K. Osborne | | Director | | April 2, 2007March 8, 2010 |
Mary Dwyer Pembroke | | | | |
| | | | |
| | | | |
/s/ Jerome F. Sherman | | Director | | April 2, 2007 |
Jerome F. Sherman | | | | |
| | | | |
| | | | |
/s/ Thomas W. White | | Director | | April 2, 2007 |
Thomas W. WhiteDaniel K. Osborne | | | | |
NEW YORK MORTGAGE TRUST, INC. AND SUBSIDIARIES
CONSOLIDATED FINANCIAL STATEMENTS
AND
REPORTREPORTS OF INDEPENDENT REGISTERED PUBLIC ACCOUNTING FIRM
For Inclusion in Form 10-K
Filed with
United States Securities and Exchange Commission
December 31, 20062009
NEW YORK MORTGAGE TRUST, INC. AND SUBSIDIARIES
Index to Consolidated Financial Statements
| | | Page | |
FINANCIAL STATEMENTS: | | | | |
| | | | |
| Report of Independent Registered Public Accounting Firm - Grant Thornton LLP | | | F-2 | |
| | | | |
| Report of Independent Registered Public Accounting Firm - DELOITTE & TOUCHE LLP | | | F-3 | |
| | | | |
| Consolidated Balance Sheets | | | F-4 | |
| | | | |
| Consolidated Statements of Operations | | | F-5 | |
| | | | |
Consolidated Statements of Stockholders’/Members’ Equity | | | F-6 | |
| | | | |
| Consolidated Statements of Cash Flows | | | F-7 | |
| | | | |
| Notes to Consolidated Financial Statements | | | F-8 | |
REPORT OF INDEPENDENT REGISTERED PUBLIC ACCOUNTING FIRM
To the Board of Directors and Stockholders ofShareholders
New York Mortgage Trust, Inc.
New York, New York
We have audited management's assessment, included in the accompanying Management's Report on Internal Control Over Financial Reporting, thatconsolidated balance sheet of New York Mortgage Trust, Inc. (a Maryland corporation) and subsidiaries (the “Company”) did not maintain effective internal control over financial reporting as of December 31, 2006, because2009, and the related consolidated statements of operations, stockholders’ equity, and cash flows for the year ended December 31, 2009. These financial statements are the responsibility of the effect of the material weakness identified in management's assessment based on criteria established in Internal Control-Integrated Framework issued by the Committee of Sponsoring Organizations of the Treadway Commission. The Company's management is responsible for maintaining effective internal control over financial reporting and for its assessment of the effectiveness of internal control over financial reporting.Company’s management. Our responsibility is to express an opinion on management's assessment and an opinion on the effectiveness of the Company's internal control overthese financial reportingstatements based on our audit.
We conducted our audit in accordance with the standards of the Public Company Accounting Oversight Board (United States). Those standards require that we plan and perform the audit to obtain reasonable assurance about whether effectivethe financial statements are free of material misstatement. The Company is not required to have, nor were we engaged to perform an audit of its internal control over financial reporting was maintained in all material respects.reporting. Our audit included obtaining an understandingconsideration of internal control over financial reporting evaluating management's assessment, testingas a basis for designing audit procedures that are appropriate in the circumstances, but not for the purpose of expressing an opinion on the effectiveness of the Company’s internal control over financial reporting. Accordingly, we express no such opinion. An audit also includes examining, on a test basis, evidence supporting the amounts and disclosures in the financial statements, assessing the accounting principles used and significant estimates made by management, as well as evaluating the design and operating effectiveness of internal control, and performing such other procedures as we considered necessary in the circumstances.overall financial statement presentation. We believe that our audit provides a reasonable basis for our opinions.opinion.
A company's internal control over financial reporting is a process designed by, or under the supervision of, the company's principal executive and principal financial officers, or persons performing similar functions, and effected by the company's board of directors, management, and other personnel to provide reasonable assurance regarding the reliability of financial reporting and the preparation of financial statements for external purposes in accordance with generally accepted accounting principles. A company's internal control over financial reporting includes those policies and procedures that (1) pertain to the maintenance of records that, in reasonable detail, accurately and fairly reflect the transactions and dispositions of the assets of the company; (2) provide reasonable assurance that transactions are recorded as necessary to permit preparation of financial statements in accordance with generally accepted accounting principles, and that receipts and expenditures of the company are being made only in accordance with authorizations of management and directors of the company; and (3) provide reasonable assurance regarding prevention or timely detection of unauthorized acquisition, use, or disposition of the company's assets that could have a material effect on the financial statements.
Because of the inherent limitations of internal control over financial reporting, including the possibility of collusion or improper management override of controls, material misstatements due to error or fraud may not be prevented or detected on a timely basis. Also, projections of any evaluation of the effectiveness of the internal control over financial reporting to future periods are subject to the risk that the controls may become inadequate because of changes in conditions, or that the degree of compliance with the policies or procedures may deteriorate.
A material weakness is a significant deficiency, or combination of significant deficiencies, that results in more than a remote likelihood that a material misstatement of the annual or interim financial statements will not be prevented or detected. The following material weakness in the Company's internal control over financial reporting has been identified and included in management's assessment: The material weakness related to an inadequacy in the operation of control activities relating to the completion and review of the accounting period closing process that resulted in significant post-closing journal entries and contributed to a delay in filing of the Company's Annual Report on Form 10-K. This material weakness was considered in determining the nature, timing, and extent of audit tests applied inIn our audit ofopinion, the consolidated financial statements asreferred to above present fairly, in all material respects, the financial position of New York Mortgage Trust, Inc. and for the year ended December 31, 2006 of the Company, and this report does not affect our report on such financial statements.
In our opinion, management's assessment that the Company did not maintain effective internal control over financial reportingsubsidiaries as of December 31, 2006, is fairly stated, in all material respects, based on the criteria established in Internal Control-Integrated Framework issued by the Committee of Sponsoring Organizations of the Treadway Commission. Also in our opinion, because of the effect of the material weakness described above on the achievement of the objectives of the control criteria, the Company has not maintained effective internal control over financial reporting as of December 31, 2006, based on the criteria established in Internal Control-Integrated Framework issued by the Committee of Sponsoring Organizations of the Treadway Commission.
We have also audited, in accordance with the standards of the Public Company Accounting Oversight Board (United States) the consolidated balance sheet of the Company,2009, and the related consolidated statementsresults of operation, stockholders'/members' equity,its operations and its cash flows as of and for the year then ended December 31, 2006, and our report dated April 2, 2007 expressed an unqualified opinion on those financial statements.in conformity with accounting principles generally accepted in the United States of America.
/s/DELOITTE & TOUCHE Grant Thornton LLP
New York, New York
April 2, 2007
March 8, 2010
REPORT OF INDEPENDENT REGISTERED PUBLIC ACCOUNTING FIRM
To the Board of Directors and Stockholders of
New York Mortgage Trust, Inc.
New York, New York
We have audited the accompanying consolidated balance sheetssheet of New York Mortgage Trust, Inc. and subsidiaries (the “Company”"Company") as of December 31, 2006 and 2005,2008, and the related consolidated statements of operations, stockholders'/members' equity, and cash flows for each of the threetwo years in the period ended December 31, 2006.2008. These consolidated financial statements are the responsibility of the Company's management. Our responsibility is to express an opinion on the consolidated financial statements based on our audits.
We conducted our audits in accordance with the standards of the Public Company Accounting Oversight Board (United States). Those standards require that we plan and perform the audit to obtain reasonable assurance about whether the financial statements are free of material misstatement. The Company is not required to have, nor were we engaged to perform, an audit of its internal control over financial reporting. Our audits included consideration of internal control over financial reporting as a basis for designing audit procedures that are appropriate in the circumstances, but not for the purpose of expressing an opinion on the effectiveness of the Company's internal control over financial reporting. Accordingly, we express no such opinion. An audit also includes examining, on a test basis, evidence supporting the amounts and disclosures in the financial statements. An audit also includesstatements, assessing the accounting principles used and significant estimates made by management, as well as evaluating the overall financial statement presentation. We believe that our audits provide a reasonable basis for our opinion.
In our opinion, such consolidated financial statements present fairly, in all material respects, the financial position of New York Mortgage Trust, Inc. and subsidiaries as of December 31, 2006 and 2005,2008, and the results of their operations and their cash flows for each of the threetwo years in the period ended December 31, 2006,2008, in conformity with accounting principles generally accepted in the United States of America.
We have also audited, in accordance with the standards of the Public Company Accounting Oversight Board (United States), the effectiveness of the Company's internal control over financial reporting as of December 31, 2006, based on the criteria established in Internal Control-Integrated Framework issued by the Committee of Sponsoring Organizations of the Treadway Commission and our report dated April 2, 2007 expressed an unqualified opinion on management's assessment of the effectiveness of the Company's internal control over financial reporting and an adverse opinion on the effectiveness of the Company's internal control over financial reporting because of a material weakness.
/s/DELOITTE & TOUCHE LLP
New York, New York
April 2, 2007March 31, 2009
NEW YORK MORTGAGE TRUST, INC. AND SUBSIDIARIES
CONSOLIDATED BALANCE SHEETS
(Dollar amounts in thousands)
| | | December 31, 2006 | | December 31, 2005 | |
ASSETS | | | | | |
| Cash and cash equivalents | | $ | 969 | | $ | 9,056 | |
| Restricted cash | | | 2,086 | | | 4,949 | |
| Investment securities — available for sale | | | 488,962 | | | 716,482 | |
| Accounts and accrued interest receivable | | | 5,189 | | | 9,899 | |
| Mortgage loans held in securitization trusts | | | 588,160 | | | 776,610 | |
| Mortgage loans held for investment | | | ─ | | | 4,060 | |
| Prepaid and other assets | | | 20,951 | | | 12,820 | |
| Derivative assets | | | 1,666 | | | 8,546 | |
| Assets related to discontinued operation | | | 214,925 | | | 248,871 | |
| TOTAL ASSETS | | $ | 1,322,908 | | $ | 1,791,293 | |
LIABILITIES AND STOCKHOLDERS’ EQUITY | | | | | | | |
| LIABILITIES: | | | | | | | |
| Financing arrangements, portfolio investments | | $ | 815,313 | | $ | 1,166,499 | |
| Financing arrangements, loans held for sale/for investment | | | ─ | | | 3,969 | |
| Collateralized debt obligations | | | 197,447 | | | 228,226 | |
| Accounts payable and accrued expenses | | | 5,575 | | | 14,521 | |
| Subordinated debentures | | | 45,000 | | | 45,000 | |
| Other liabilities | | | 14 | | | 195 | |
| Liabilities related to discontinued operation | | | 187,987 | | | 231,925 | |
| Total liabilities | | | 1,251,336 | | | 1,690,335 | |
| COMMITMENTS AND CONTINGENCIES | | | | | | | |
| STOCKHOLDERS’ EQUITY: | | | | | | | |
| Common stock, $0.01 par value, 400,000,000 shares authorized 18,325,187 shares issued and 18,077,880 outstanding at December 31, 2006 and 18,258,221 shares issued and 17,953,674 outstanding at December 31, 2005 | | | 183 | | | 183 | |
| Additional paid-in capital | | | 99,509 | | | 107,573 | |
| Accumulated other comprehensive (loss) income | | | (4,381 | ) | | 1,910 | |
| Accumulated deficit | | | (23,739 | ) | | (8,708 | ) |
| Total stockholders’ equity | | | 71,572 | | | 100,958 | |
| TOTAL LIABILITIES AND STOCKHOLDERS’ EQUITY | | $ | 1,322,908 | | $ | 1,791,293 | |
| | | December 31, 2009 | | | December 31, 2008 | |
| ASSETS | | | | | | |
| Cash and cash equivalents | | $ | 24,522 | | | $ | 9,387 | |
| Restricted cash | | | 3,049 | | | | 7,959 | |
| Investment securities available for sale, at fair value (including pledged assets of $91,071 and $456,506 at December 31, 2009 and 2008, respectively) | | | 176,691 | | | | 477,416 | |
| Accounts and accrued interest receivable | | | 2,048 | | | | 3,095 | |
| Mortgage loans held in securitization trusts (net) | | | 276,176 | | | | 346,972 | |
| Prepaid and other assets | | | 2,107 | | | | 2,595 | |
| Derivative assets | | | 4 | | | | 22 | |
| Assets related to discontinued operation | | | 4,217 | | | | 5,854 | |
| Total Assets | | $ | 488,814 | | | $ | 853,300 | |
| | | | | | | | | |
| LIABILITIES AND STOCKHOLDERS’ EQUITY | | | | | | | | |
| Liabilities: | | | | | | | | |
| Financing arrangements, portfolio investments | | $ | 85,106 | | | $ | 402,329 | |
| Collateralized debt obligations | | | 266,754 | | | | 335,646 | |
| Derivative liabilities | | | 2,511 | | | | 4,194 | |
| Accounts payable and accrued expenses | | | 4,935 | | | | 3,997 | |
| Subordinated debentures (net) | | | 44,892 | | | | 44,618 | |
| Convertible preferred debentures (net) | | | 19,851 | | | | 19,702 | |
| Liabilities related to discontinued operation | | | 1,778 | | | | 3,566 | |
| Total Liabilities | | | 425,827 | | | | 814,052 | |
| | | | | | | | | |
| Commitments and Contingencies | | | | | | | | |
| | | | | | | | | |
| Stockholders’ Equity: | | | | | | | | |
| Common stock, $0.01 par value, 400,000,000 shares authorized 9,415,094 shares issued and outstanding at December 31, 2009 and 9,320,094 shares issued and outstanding at December 31, 2008 | | | 94 | | | | 93 | |
| Additional paid-in capital | | | 142,519 | | | | 150,790 | |
| Accumulated other comprehensive income (loss) | | | 11,818 | | | | (8,521 | ) |
| Accumulated deficit | | | (91,444 | ) | | | (103,114 | ) |
| Total Stockholders’ Equity | | | 62,987 | | | | 39,248 | |
| Total Liabilities and Stockholders’ Equity | | $ | 488,814 | | | $ | 853,300 | |
See notes to consolidated financial statements.
NEW YORK MORTGAGE TRUST, INC. AND SUBSIDIARIES
CONSOLIDATED STATEMENTS OF OPERATIONS
(Dollar amounts in thousands, except per share data)
| | | For the Year Ended December 31, | |
| | | 2006 | | 2005 | | 2004 | |
| REVENUES: | | | | | | | |
| Interest income: | | | | | | | |
| Investment securities and loans held in securitization trusts | | $ | 64,881 | | $ | 55,050 | | $ | 19,671 | |
| Loans held for investment | | | — | | | 7,675 | | | 723 | |
| Total interest income | | | 64,881 | | | 62,725 | | | 20,394 | |
| Interest expense: | | | | | | | | | | |
| Investment securities and loans held in securitization trusts | | | 56,553 | | | 42,001 | | | 11,982 | |
| Loans held for investment | | | — | | | 5,847 | | | 488 | |
| Subordinated debentures | | | 3,544 | | | 2,004 | | | — | |
| Total interest expense | | | 60,097 | | | 49,852 | | | 12,470 | |
| Net interest income | | | 4,784 | | | 12,873 | | | 7,924 | |
| Other (expense) income: | | | | | | | | | | |
| Loan losses | | | (57 | ) | | — | | | — | |
| (Loss) gain on sale of securities and related hedges | | | (529 | ) | | 2,207 | | | 167 | |
| Impairment loss on investment securities | | | — | | | (7,440 | ) | | — | |
| Miscellaneous income | | | — | | | 1 | | | — | |
| Total other (expense) income | | | (586 | ) | | (5,232 | ) | | 167 | |
| EXPENSES: | | | | | | | | | | |
| Salaries, commissions and benefits | | | 714 | | | 1,934 | | | 382 | |
| Occupancy and equipment | | | 1 | | | 50 | | | 422 | |
| Marketing and promotion | | | 78 | | | 124 | | | 14 | |
| Data processing and communications | | | 230 | | | 149 | | | 174 | |
| Office supplies and expenses | | | 24 | | | 21 | | | 4 | |
| Professional fees | | | 598 | | | 853 | | | 149 | |
| Travel and entertainment | | | 29 | | | 6 | | | 1 | |
| Depreciation and amortization | | | 276 | | | 171 | | | 1 | |
| Other | | | 82 | | | 1,011 | | | 45 | |
| Total expenses | | | 2,032 | | | 4,319 | | | 1,192 | |
| Income from continuing operations | | | 2,166 | | | 3,322 | | | 6,899 | |
| Loss from discontinued operation - net of tax | | | (17,197 | ) | | (8,662 | ) | | (1,952 | ) |
| NET (LOSS)/INCOME | | $ | (15,031 | ) | $ | (5,340 | ) | $ | 4,947 | |
| Basic (loss)/income per share | | $ | (0.83 | ) | $ | (0.30 | ) | $ | 0.28 | |
| Diluted (loss)/income per share | | $ | (0.83 | ) | $ | (0.30 | ) | $ | 0.27 | |
| Weighted average shares outstanding-basic(1) | | | 18,038 | | | 17,873 | | | 17,797 | |
| Weighted average shares outstanding-diluted(1) | | | 18,038 | | | 17,873 | | | 18,115 | |
| | | For the Year Ended December 31, | |
| | | 2009 | | | 2008 | | | 2007 | |
| REVENUES: | | | | | | | | | |
| Interest income - investment securities and loans held in securitization trusts | | $ | 31,095 | | | $ | 44,123 | | | $ | 50,564 | |
| Interest expense - investment securities and loans held in securitization trusts | | | 8,572 | | | | 30,351 | | | | 46,529 | |
| Net interest income from investment securities and loans held in securitization trusts | | | 22,523 | | | | 13,772 | | | | 4,035 | |
| Interest expense - subordinated debentures | | | (3,189 | ) | | | (3,760 | ) | | | (3,558 | ) |
| Interest expense - convertible preferred debentures | | | (2,474 | ) | | | (2,149 | ) | | | — | |
| Net interest income | | | 16,860 | | | | 7,863 | | | | 477 | |
| OTHER INCOME (EXPENSE) | | | | | | | | | | | | |
| Provision for loan losses | | | (2,262 | ) | | | (1,462 | ) | | | (1,683 | ) |
| Realized gains (losses) on securities and related hedges | | | 3,282 | | | | (19,977 | ) | | | (8,350 | ) |
| Impairment loss on investment securities | | | (119 | ) | | | (5,278 | ) | | | (8,480 | ) |
| Total other income (expense) | | | 901 | | | | (26,717 | ) | | | (18,513 | ) |
| EXPENSES: | | | | | | | | | | | | |
| Salaries and benefits | | | 2,118 | | | | 1,869 | | | | 865 | |
| Professional fees | | | 1,284 | | | | 1,212 | | | | 612 | |
| Insurance | | | 524 | | | | 948 | | | | 474 | |
| Management fees | | | 1,252 | | | | 665 | | | | — | |
| Other | | | 1,699 | | | | 2,216 | | | | 803 | |
| Total expenses | | | 6,877 | | | | 6,910 | | | | 2,754 | |
| INCOME (LOSS) FROM CONTINUING OPERATIONS | | | 10,884 | | | | (25,764 | ) | | | (20,790 | ) |
| Income (loss) from discontinued operation - net of tax | | | 786 | | | | 1,657 | | | | (34,478 | ) |
| NET INCOME (LOSS) | | $ | 11,670 | | | $ | (24,107 | ) | | $ | (55,268 | ) |
| Basic net income (loss) per share | | $ | 1.25 | | | $ | (2.91 | ) | | $ | (30.47 | ) |
| Diluted net income (loss) per share | | $ | 1.19 | | | $ | (2.91 | ) | | $ | (30.47 | ) |
| Dividends declared per common share | | $ | 0.91 | | | $ | 0.54 | | | $ | 0.50 | |
| Weighted average shares outstanding-basic | | | 9,367 | | | | 8,272 | | | | 1,814 | |
| Weighted average shares outstanding-diluted | | | 11,867 | | | | 8,272 | | | | 1,814 | |
See notes to consolidated financial statements.
(1) | Weighted average shares outstanding-basic and diluted assume the shares outstanding upon the Company’s June 2004 initial public offering were outstanding for the full year. |
NEW YORK MORTGAGE TRUST, INC. AND SUBSIDIARIES
CONSOLIDATED STATEMENTS OF STOCKHOLDERS’ EQUITY
For the Years Ended December 31, 2009, 2008 and 2007
(Dollar amounts in thousands)
| | | | | | Additional Paid-In Capital | | | | | | Accumulated Other Comprehensive Income (Loss) | | | Comprehensive Income (Loss) | | | Total | |
| BALANCE, JANUARY 1, 2007 | | $ | 18 | | | $ | 99,674 | | | $ | (23,739 | ) | | $ | (4,381 | ) | | | — | | | $ | 71,572 | |
| Net loss | | | — | | | | — | | | | (55,268 | ) | | | — | | | $ | (55,268 | ) | | | (55,268 | ) |
| Dividends declared | | | — | | | | (909 | ) | | | — | | | | — | | | | — | | | | (909 | ) |
| Repurchase of common stock | | | — | | | | — | | | | — | | | | — | | | | — | | | | — | |
| Restricted stock | | | — | | | | 592 | | | | — | | | | — | | | | — | | | | 592 | |
| Reclassification adjustment for net loss included in net income | | | — | | | | — | | | | — | | | | 3,192 | | | | 3,192 | | | | 3,192 | |
| Decrease derivative instruments utilized for cash flow hedge | | | — | | | | — | | | | — | | | | (761 | ) | | | (761 | ) | | | (761 | ) |
| Comprehensive loss | | | — | | | | — | | | | — | | | | — | | | $ | (52,837 | ) | | | | |
| BALANCE, DECEMBER 31, 2007 | | | 18 | | | | 99,357 | | | | (79,007 | ) | | | (1,950 | ) | | | | | | | 18,418 | |
| Net loss | | | — | | | | — | | | | (24,107 | ) | | | — | | | $ | (24,107 | ) | | | (24,107 | ) |
| Dividends declared | | | — | | | | (5,033 | ) | | | — | | | | — | | | | — | | | | (5,033 | ) |
| Common stock issuance | | | 75 | | | | 56,466 | | | | — | | | | — | | | | — | | | | 56,541 | |
| Increase in net unrealized loss on available for sale securities | | | — | | | | — | | | | — | | | | (2,961 | ) | | | (2,961 | ) | | | (2,961 | ) |
| Decrease in derivative instruments utilized for cash flow hedge | | | — | | | | — | | | | — | | | | (3,610 | ) | | | (3,610 | ) | | | (3,610 | ) |
| Comprehensive loss | | | — | | | | — | | | | — | | | | — | | | $ | (30,678 | ) | | | | |
| BALANCE, DECEMBER 31, 2008 | | �� | 93 | | | | 150,790 | | | | (103,114 | ) | | | (8,521 | ) | | | | | | | 39,248 | |
| Net income | | | | | | | | | | | 11,670 | | | | | | | $ | 11,670 | | | | 11,670 | |
| Dividends declared | | | | | | | (8,531 | ) | | | | | | | | | | | | | | | (8,531 | ) |
| Restricted stock | | | 1 | | | | 260 | | | | | | | | | | | | | | | | 261 | |
| Reclassification adjustment for net gain included in net income | | | | | | | | | | | | | | | (2,657 | ) | | | (2,657 | ) | | | (2,657 | ) |
| Increase in net unrealized gain on available for sale securities | | | | | | | | | | | | | | | 20,340 | | | | 20,340 | | | | 20,340 | |
| Increase in derivative instruments utilized for cash flow hedge | | | | | | | | | | | | | | | 2,656 | | | | 2,656 | | | | 2,656 | |
| Comprehensive income | | | | | | | | | | | | | | | | | | $ | 32,009 | | | | | |
| BALANCE, DECEMBER 31, 2009 | | $ | 94 | | | $ | 142,519 | | | $ | (91,444 | ) | | $ | 11,818 | | | | | | | $ | 62,987 | |
See notes to consolidated financial statements.
NEW YORK MORTGAGE TRUST, INC. AND SUBSIDIARIES
CONSOLIDATED STATEMENTS OF STOCKHOLDERS’/MEMBERS’ EQUITYCASH FLOWS
For the Years Ended December 31, 2006, 2005 and 2004
(Dollar amounts in thousands)
| | | Common Stock | | Additional Paid-In Capital | | Stockholders’/ Members’ Equity (Deficit) | | Accumulated Other Comprehensive Income (Loss) | | Comprehensive Income (Loss) | | Total | |
| BALANCE,JANUARY 1, 2004 — | | | | | | | | | | | | | |
| Members’ Deficit | | $ | — | | $ | — | | $ | (1,339 | ) | $ | 865 | | $ | — | | $ | (474 | ) |
| Net income | | | — | | | — | | | 4,947 | | | — | | | 4,947 | | | 4,947 | |
| Contributions | | | — | | | — | | | 2,310 | | | — | | | — | | | 2,310 | |
| Distributions | | | — | | | — | | | (3,135 | ) | | — | | | — | | | (3,135 | ) |
| Forfeiture of 47,680 escrowed shares | | | — | | | (493 | ) | | | | | — | | | — | | | (493 | ) |
| Dividends declared | | | — | | | (4,470 | ) | | (2,783 | ) | | — | | | — | | | (7,253 | ) |
| Initial public offering — Common stock | | | 181 | | | 121,910 | | | — | | | — | | | — | | | 122,091 | |
| Restricted stock | | | — | | | 1,743 | | | — | | | — | | | — | | | 1,743 | |
| Performance shares | | | — | | | 249 | | | — | | | — | | | — | | | 249 | |
| Stock options | | | — | | | 106 | | | — | | | — | | | — | | | 106 | |
| Decrease in net unrealized gain on available for sale securities | | | — | | | — | | | — | | | (3,836 | ) | | (3,836 | ) | | (3,836 | ) |
| Increase derivative instruments | | | — | | | — | | | — | | | 3,227 | | | 3,227 | | | 3,227 | |
| Comprehensive income | | | — | | | — | | | — | | | — | | $ | 4,338 | | | — | |
| BALANCE, DECEMBER 31, 2004 — Stockholders’ Equity | | | 181 | | | 119,045 | | | 0 | | | 256 | | | — | | | 119,482 | |
| Net loss | | | — | | | — | | | (5,340 | ) | | — | | $ | (5,340 | ) | | (5,340 | ) |
| Dividends declared | | | — | | | (13,375 | ) | | (3,368 | ) | | — | | | — | | | (16,743 | ) |
| Restricted stock | | | 2 | | | 1,310 | | | — | | | — | | | — | | | 1,312 | |
| Performance shares | | | — | | | 549 | | | — | | | — | | | — | | | 549 | |
| Stock options | | | — | | | 44 | | | — | | | — | | | — | | | 44 | |
| Decrease in net unrealized gain on available for sale securities | | | — | | | — | | | — | | | (1,130 | ) | | (1,130 | ) | | (1,130 | ) |
| Increase derivative instruments | | | — | | | — | | | — | | | 2,784 | | | 2,784 | | | 2,784 | |
| Comprehensive loss | | | — | | | — | | | — | | | — | | $ | (3,686 | ) | | — | |
| BALANCE, DECEMBER 31, 2005 — Stockholders’ Equity | | | 183 | | | 107,573 | | | (8,708 | ) | | 1,910 | | | | | | 100,958 | |
| Net loss | | | — | | | — | | | (15,031 | ) | | — | | $ | (15,031 | ) | | (15,031 | ) |
| Dividends declared | | | — | | | (8,595 | ) | | — | | | — | | | — | | | (8,595 | ) |
| Repurchase of common stock | | | (1 | ) | | (299 | ) | | — | | | — | | | — | | | (300 | ) |
| Restricted stock | | | 1 | | | 819 | | | — | | | — | | | — | | | 820 | |
| Performance shares | | | — | | | 8 | | | — | | | — | | | — | | | 8 | |
| Stock options | | | — | | | 3 | | | — | | | — | | | — | | | 3 | |
| Decrease in net unrealized gain on available for sale securities | | | — | | | — | | | — | | | (879 | ) | | (879 | ) | | (879 | ) |
| Decrease in derivative instruments | | | — | | | — | | | — | | | (5,412 | ) | | (5,412 | ) | | (5,412 | ) |
| Comprehensive loss | | | — | | | — | | | — | | | — | | $ | (21,322 | ) | | — | |
| BALANCE, DECEMBER 31, 2006 Stockholders’ Equity | | $ | 183 | | $ | 99,509 | | $ | (23,739 | ) | $ | (4,381 | ) | | | | $ | 71,572 | |
| | | For the Years Ended December 31, | |
| | | 2009 | | | 2008 | | | 2007 | |
| CASH FLOWS FROM OPERATING ACTIVITIES: | | | | | | | | | |
| Net income (loss) | | $ | 11,670 | | | $ | (24,107 | ) | | $ | (55,268 | ) |
| Adjustments to reconcile net income (loss) to net cash provided by (used in) operating activities: | | | | | | | | | | | | |
| Depreciation and amortization | | | 1,435 | | | | 1,423 | | | | 765 | |
| Amortization of (discount) premium on investment securities and mortgage loans | | | (743 | ) | | | 997 | | | | 1,616 | |
| (Gain) loss on sale of securities, loans and related hedges | | | (3,280 | ) | | | 19,977 | | | | 8,350 | |
| Impairment loss on investment securities | | | 119 | | | | 5,278 | | | | 8,480 | |
| Origination of mortgage loans held for sale | | | — | | | | — | | | | (300,863 | ) |
| Proceeds from repayments or sales of mortgage loans | | | 1,196 | | | | 2,746 | | | | 398,678 | |
| Allowance for deferred tax asset | | | — | | | | — | | | | 18,352 | |
| Gain on sale of retail lending platform | | | — | | | | — | | | | (4,368 | ) |
| Change in value of derivatives | | | — | | | | — | | | | 785 | |
| Provision for loan losses | | | 2,262 | | | | 1,520 | | | | 2,546 | |
| Restricted stock issuance | | | 261 | | | | — | | | | — | |
| Other | | | 270 | | | | — | | | | 1,111 | |
| Changes in operating assets and liabilities: | | | | | | | | | | | | |
| Due from loan purchasers | | | — | | | | — | | | | 88,351 | |
| Escrow deposits-pending loan closings | | | — | | | | — | | | | 3,814 | |
| Accounts and accrued interest receivable | | | 1,055 | | | | 415 | | | | 4,141 | |
| Prepaid and other assets | | | (260 | ) | | | 642 | | | | 2,903 | |
| Due to loan purchasers | | | — | | | | 138 | | | | (7,115 | ) |
| Accounts payable and accrued expenses | | | (2,212 | ) | | | (2,767 | ) | | | (5,140 | ) |
| Net cash provided by operating activities | | | 11,773 | | | | 6,262 | | | | 167,138 | |
| CASH FLOWS FROM INVESTING ACTIVITIES: | | | | | | | | | | | | |
| Restricted cash | | | 4,910 | | | | (444 | ) | | | (4,364 | ) |
| Purchases of investment securities | | | (43,869 | ) | | | (850,609 | ) | | | (231,932 | ) |
| Proceeds from sale of investment securities | | | 296,553 | | | | 625,986 | | | | 246,874 | |
| Principal repayments received on loans held in securitization trust | | | 68,914 | | | | 79,951 | | | | 154,729 | |
| Proceeds from sale of retail lending platform | | | — | | | | — | | | | 12,936 | |
| Principal paydown on investment securities | | | 70,343 | | | | 74,172 | | | | 113,490 | |
| Purchases of fixed assets | | | — | | | | — | | | | (396 | ) |
| Sale of fixed assets and real estate owned property | | | — | | | | 10 | | | | 880 | |
| Net cash provided by (used in) investing activities | | | 396,851 | | | | (70,934 | ) | | | 292,217 | |
| CASH FLOWS FROM FINANCING ACTIVITIES: | | | | | | | | | | | | |
| Increase (decrease) in financing arrangements, net | | | (317,223 | ) | | | 86,615 | | | | (672,570 | ) |
| Collateralized debt obligation borrowings | | | — | | | | — | | | | 337,431 | |
| Collateralized debt obligation paydowns | | | (69,158 | ) | | | (81,725 | ) | | | (117,851 | ) |
| Dividends paid | | | (7,108 | ) | | | (4,100 | ) | | | (1,826 | ) |
| Payments made for termination of swaps | | | — | | | | (8,333 | ) | | | — | |
| Proceeds from common stock issued (net) | | | — | | | | 56,541 | | | | — | |
| Proceeds from convertible preferred debentures (net) | | | — | | | | 19,553 | | | | — | |
| Net cash (used in) provided by financing activities | | | (393,489 | ) | | | 68,551 | | | | (454,816 | ) |
| NET INCREASE IN CASH AND CASH EQUIVALENTS | | | 15,135 | | | | 3,879 | | | | 4,539 | |
| CASH AND CASH EQUIVALENTS — Beginning | | | 9,387 | | | | 5,508 | | | | 969 | |
| CASH AND CASH EQUIVALENTS — End | | $ | 24,522 | | | $ | 9,387 | | | $ | 5,508 | |
| SUPPLEMENTAL DISCLOSURE | | | | | | | | | | | | |
| Cash paid for interest | | $ | 13,456 | | | $ | 31,479 | | | $ | 41,338 | |
| NON CASH FINANCING ACTIVITIES | | | | | | | | | | | | |
| Dividends declared to be paid in subsequent period | | $ | 2,355 | | | $ | 932 | | | $ | — | |
| Grant of restricted stock | | $ | 261 | | | $ | — | | | $ | — | |
See notes to consolidated financial statements.
NEW YORK MORTGAGE TRUST, INC. AND SUBSIDIARIES
CONSOLIDATED STATEMENTS OF CASH FLOWS
(Dollar amounts in thousands)
| | | For the Years Ended December 31, | |
| | | 2006 | | 2005 | | 2004 | |
| CASH FLOWS FROM OPERATING ACTIVITIES: | | | | | | | |
| Net (loss)/income | | $ | (15,031 | ) | $ | (5,340 | ) | $ | 4,947 | |
| Adjustments to reconcile net (loss)/income to net cash provided by (used in) operating activities: | | | | | | | | | | |
| Depreciation and amortization | | | 2,106 | | | 1,716 | | | 690 | |
| Amortization of premium on investment securities and mortgage loans | | | 2,483 | | | 6,269 | | | 1,667 | |
| Loss on sale of current period securitized loans | | | 747 | | | — | | | — | |
| Gain (loss) on sale of securities and related hedges | | | 529 | | | (2,207 | ) | | (939 | ) |
| Impairment loss on investment securities | | | — | | | 7,440 | | | — | |
| Stock compensation expense | | | 832 | | | 1,905 | | | 2,099 | |
| Forfeited shares-non cash | | | — | | | | | | (493 | ) |
| Change in value of derivatives | | | 289 | | | (3,155 | ) | | (314 | ) |
| Loan losses | | | 6,800 | | | — | | | — | |
| Minority interest expense | | | (26 | ) | | — | | | — | |
| Loss on sale of fixed assets | | | — | | | 27 | | | — | |
| (Increase) decrease in operating assets: | | | | | | | | | | |
| Purchase of mortgage loans held for sale | | | (222,907 | ) | | — | | | — | |
| Origination of mortgage loans held for sale | | | (1,841,011 | ) | | (2,316,734 | ) | | (1,435,340 | ) |
| Proceeds from sales of mortgage loans | | | 2,059,981 | | | 2,293,848 | | | 1,386,124 | |
| Deferred tax benefit | | | (8,494 | ) | | (8,549 | ) | | (1,309 | ) |
| Due from loan purchasers | | | 33,462 | | | (41,909 | ) | | (21,042 | ) |
| Escrow deposits-pending loan closings | | | (2,380 | ) | | 14,802 | | | (16,236 | ) |
| Accounts and accrued interest receivable | | | 7,188 | | | 714 | | | (12,846 | ) |
| Prepaid and other assets | | | (1,586 | ) | | (3,987 | ) | | (2,211 | ) |
| Increase (decrease) in operating liabilities: | | | | | | | | | | |
| Due to loan purchasers | | | 4,209 | | | 1,301 | | | (403 | ) |
| Accounts payable and accrued expenses | | | (7,957 | ) | | 3,990 | | | 12,170 | |
| Other liabilities | | | (453 | ) | | (4,100 | ) | | 4,553 | |
| Net cash provided by (used in) operating activities | | | 18,781 | | | (53,969 | ) | | (78,883 | ) |
| CASH FLOWS FROM INVESTING ACTIVITIES: | | | | | | | | | | |
| Restricted cash | | | 2,317 | | | (3,126 | ) | | (2,124 | ) |
| Sale of investment securities | | | — | | | 225,326 | | | 197,350 | |
| Purchase of investment securities | | | (388,398 | ) | | (148,150 | ) | | (1,533,511 | ) |
| Purchase of mortgage loans held in securitization trusts | | | — | | | (167,097 | ) | | — | |
| Principal repayments received on loans held in securitization trust | | | 191,673 | | | 120,835 | | | — | |
| Proceeds from sale of investment securities | | | 452,780 | | | — | | | — | |
| Purchase of mortgage loans held for investment | | | — | | | — | | | (94,767 | ) |
| Origination of mortgage loans held for investment | | | — | | | (558,554 | ) | | (95,386 | ) |
| Proceeds from sale of marketable securities | | | — | | | — | | | 3,580 | |
| Principal paydown on investment securities | | | 162,185 | | | 399,694 | | | 126,944 | |
| Payments received on loans held for investment | | | — | | | 13,279 | | | — | |
| Purchases of property and equipment | | | (1,464 | ) | | (3,929 | ) | | (3,460 | ) |
| Sale of fixed assets | | | — | | | 75 | | | — | |
| Net cash provided by (used in) investing activities | | | 419,093 | | | (121,647 | ) | | (1,401,374 | ) |
| CASH FLOWS FROM FINANCING ACTIVITIES: | | | | | | | | | | |
| Repurchase of common stock | | | (300 | ) | | — | | | — | |
| Proceeds from issuance of common stock | | | — | | | — | | | 122,091 | |
| Members’ contributions | | | — | | | — | | | 1,309 | |
| (Decrease) increase in financing arrangements, net | | | (434,179 | ) | | 149,315 | | | 1,380,171 | |
| Payments on subordinated notes due members | | | — | | | — | | | (13,707 | ) |
| Dividends paid | | | (11,524 | ) | | (17,256 | ) | | (2,906 | ) |
| Cash distributions to members | | | — | | | — | | | (3,135 | ) |
| Issuance of subordinated debentures | | | | | | 45,000 | | | — | |
| Capital contributions from minority interest member | | | 42 | | | — | | | — | |
| Net cash (used in) provided by financing activities | | | (445,961 | ) | | 177,059 | | | 1,483,823 | |
| NET (DECREASE) INCREASE IN CASH AND CASH EQUIVALENTS | | | (8,087 | ) | | 1,443 | | | 3,566 | |
| CASH AND CASH EQUIVALENTS — Beginning of period | | | 9,056 | | | 7,613 | | | 4,047 | |
| CASH AND CASH EQUIVALENTS — End of period | | $ | 969 | | $ | 9,056 | | $ | 7,613 | |
| SUPPLEMENTAL DISCLOSURE | | | | | | | | | | |
| Cash paid for interest | | $ | 76,905 | | $ | 57,871 | | $ | 11,709 | |
| NON CASH INVESTING ACTIVITIES | | | | | | | | | | |
| Non-cash purchase of fixed assets | | $ | — | | $ | 168 | | $ | — | |
| NON CASH FINANCING ACTIVITIES | | | | | | | | | | |
| Reduction of subordinated notes due members | | $ | — | | $ | — | | $ | 1,000 | |
| Dividends declared to be paid in subsequent period | | $ | 905 | | $ | 3,834 | | $ | 4,347 | |
| Grant of restricted stock | | $ | — | | $ | 277 | | $ | 1,974 | |
See notes to consolidated financial statements.
NEW YORK MORTGAGE TRUST, INC. AND SUBSIDIARIES
NOTES TO CONSOLIDATED FINANCIAL STATEMENTS
(dollar amounts in thousands unless otherwise indicated)
1. | Summary of Significant Accounting Policies |
Organization- New York Mortgage Trust, Inc., together with its consolidated subsidiaries (“NYMT”, the “Company”, “we”, “our”, and “us”), is a self-advised real estate investment trust, or REIT, in the business of acquiring and managing primarily residential adjustable-rate, hybrid adjustable-rate and fixed-rate mortgage-backed securities (“RMBS”), for which the principal and interest payments are guaranteed by a U.S. Government agency, such as the Government National Mortgage Association (“Ginnie Mae”) or a U.S. Government-sponsored entity (“GSE” or “Agency”), such as the Federal National Mortgage Association (“Fannie Mae”) or the “Company”Federal Home Loan Mortgage Corporation (“Freddie Mac”), which we refer to collectively as “Agency RMBS,” RMBS backed by prime jumbo and Alternative A-paper (“Alt-A”) (“non-Agency RMBS”), and prime credit quality residential adjustable-rate mortgage (“ARM”) loans held in securitization trusts, or prime ARM loans. The remainder of our current investment portfolio is comprised of notes issued by a fully-integrated, self-advised,collateralized loan obligation (“CLO”). We also may opportunistically acquire and manage various other types of real estate-related and financial assets, including, among other things, certain non-rated residential mortgage assets, commercial mortgage-backed securities (“CMBS”), commercial real estate loans and other similar investments. We seek attractive long-term investment returns by investing our equity capital and borrowed funds in such securities. Our principal business objective is to generate net income for distribution to our stockholders resulting from the spread between the interest and other income we earn on our interest-earning assets and the interest expense we pay on the borrowings that we use to finance company formedthese assets and our operating costs, which we refer to as a Maryland corporation in September 2003. our net interest income.
The Company earnsconducts its business through the parent company, NYMT, and several subsidiaries, including special purpose subsidiaries established for loan securitization purposes, a taxable REIT subsidiary ("TRS") and a qualified REIT subsidiary ("QRS"). The Company conducts certain of its portfolio investment operations through its wholly-owned TRS, Hypotheca Capital, LLC (“HC”), in order to utilize, to the extent permitted by law, some or all of a net interest incomeoperating loss carry-forward held in HC that resulted from residential mortgage-backed securities and fixed-rate and adjustable-ratethe Company's exit from the mortgage loans and securities.lending business. Prior to March 31, 2007, the Company conducted substantially all of its mortgage lending business through HC. The Company's wholly-owned QRS, New York Mortgage Funding, LLC (“NYMF”), currently holds certain mortgage-related assets for regulatory compliance purposes. The Company also earns net interest income frommay conduct certain other portfolio investment operations related to its alternative investment strategy through NYMF. The Company consolidates all of its subsidiaries under generally accepted accounting principles in and the securitizationUnited States of certain self-originated adjustable rate mortgage loans that meet the Company’s investment criteria. Until March 31, 2007, when the Company exited the mortgage lending business, the Company originated mortgage loans through its wholly-owned subsidiary, The New York Mortgage Company, LLCAmerica (“NYMC”GAAP”) (see note 12 and note 21). Licensed or exempt from licensing in 44 states and the District of Columbia and through a network of 25 full service branch loan origination locations and 22 satellite loan origination locations that were licensed or pending state license approval as of December 31, 2006, NYMC offered a broad range of residential mortgage products, with a primary focus on prime, or high credit quality, residential mortgages.
The Company is organized and conducts its operations to qualify as a real estate investment trust (“REIT”)REIT for federal income tax purposes. As such, the Company will generally not be subject to federal income tax on that portion of its income that is distributed to stockholders if it distributes at least 90% of its REIT taxable income to its stockholders by the due date of its federal income tax return and complies with various other requirements.
On February 25, 2005,Basis of Presentation - The accompanying consolidated financial statements have been prepared on the Company completed its first loan securitizationaccrual basis of $419.0 million high-credit quality, first-lien, adjustable rate mortgage (“ARM”) loans, by contributing loans into New York Mortgage Trust 2005-1 (“NYMT ‘05-1 Trust”). NYMT ‘05-1 Trust is a wholly-owned subsidiary of NYMT. The securitization was structured as a secured borrowing, with the line-of-credit financing used to purchase and originate the mortgage loans and refinanced through repurchase agreements upon securitization. On March 15, 2005, the Company closed a private placement of $25.0 million of trust preferred securities issued by NYM Preferred Trust I. NYM Preferred Trust I is a wholly-owned subsidiary of NYMC. On July 28, 2005 the Company completed its second loan securitization of $242.9 million of high-credit quality, first-lien, ARM loans, by contributing loans to New York Mortgage Trust 2005-2 (“NYMT ‘05-2 Trust”). NYMT ‘05-2 Trust is a wholly-owned subsidiary of NYMT. The securitization was structured as a secured borrowing, with the line-of-credit financing used to purchase and originate the mortgage loans and refinanced through repurchase agreements upon securitization. On September 1, 2005, the Company closed a private placement of $20.0 million of preferred securities issued by NYM Preferred Trust II. NYM Preferred Trust II is a wholly-owned subsidiary of NYMC. On December 20, 2005 the Company completed its third loan securitization of $235.0 million of high-credit quality, first-lien, ARM loans, by contributing loans to New York Mortgage Trust 2005-3 (“NYMT ‘05-3 Trust”). NYMT ‘05-3 Trust is a wholly-owned subsidiary of NYMT.
In connection with the sale of our wholesale mortgage origination platform assets on February 22, 2007 and the sale of our retail mortgage lending platform on March 31, 2007 (See Note 21), during the fourth quarter of 2006, we classified our Mortgage Lending segment as a discontinued operationaccounting in accordance with the provisions of Statement of Financial Accounting Standards No. 144 "Accounting for the Impariment or Disposal of Long-Lived Assets" ("SFAS No. 144"U.S. generally accepted accounting principles (“GAAP”). As a result, we have reported revenues and expenses related to the segment as a discontinued operation and the related assets and liabilities as assets and liabilities related to the discontinued operation for all periods presented in the accompanying consolidated financial statements. . Certain assets, such as the deferred tax asset, and certain liabilities, such as subordinated debt and liabilities related to leased facilities not assigned to Indymac will become part of the ongoing operations of NYMTand accordingly, we have not classified as a discontinued operation in accordance with the provisions of SFAS No. 144. (See note 12).
As used herein, references to the “Company,” “NYMT,” “we,” “our” and “us” refer to New York Mortgage Trust, Inc., collectively with its subsidiaries.
Basis of Presentation - The consolidated financial statements include the accounts of the Company subsequent to the IPO and also include the accounts of NYMC and NYMF prior to the IPO. As a result, our historical financial results reflect the financial operations of this prior business strategy of selling virtually all of the loans originated by NYMC to third parties. All intercompany accounts and transactions are eliminated in consolidation. Certain prior period amounts have been reclassified to conform to current period classifications.
Concurrent with the closing of the Company’s initial public offering (“IPO”), 100,000 of the 2,750,000 shares exchanged for the equity interests of NYMC, were placed in escrow through December 31, 2004 and were available to satisfy any indemnification claims the Company may have had against Steven B. Schnall, the Company’s Chairman, President and Co-Chief Executive Officer, Joseph V. Fierro, the Chief Operating Officer of NYMC, and each of their affiliates, as the contributors of NYMC, for losses incurred as a result of defaults on any residential mortgage loans originated by NYMC and closed prior to the completion of the IPO. As of December 31, 2004, the amount of escrowed shares was reduced by 47,680 shares, representing $493,000 for estimated losses on loans closed prior to the Company’s IPO. Furthermore, the contributors of NYMC amended the escrow agreement to extend the escrow period to December 31, 2005 for the remaining 52,320 shares. On or about December 31, 2005, the escrow period was extended for an additional year to December 31, 2006. During 2006 the Company concluded that all indemnification claims related to the escrowed shares have been determined and that no additional losses were incurred by the Company as a result of defaults on any residential mortgage loans originated by NYMC and closed prior completion of the IPO. Accordingly, we have concluded that no further indemnification was necessary. The remaining 52,320 shares were then released from escrow.
Use of Estimates - The preparation of financial statements in conformity with accounting principles generally accepted in the United States of America (“GAAP”)GAAP requires management to make estimates and assumptions that affect the reported amounts of assets and liabilities and disclosure of contingent assets and liabilities at the date of the financial statements and the reported amounts of revenues and expenses during the reporting period. Actual results could differ from those estimates.
The Company’s estimatesconsolidated financial statements of the Company include the accounts of all subsidiaries; significant intercompany accounts and assumptions primarily arise from risks and uncertainties associated with interest rate volatility, prepayment volatility and credit exposure. Although management is not currently aware of any factors that would significantly change its estimates and assumptions in the near term, future changes in market conditions may occur which could cause actual results to differ materially.transactions have been eliminated.
Prior period amounts have been reclassified to conform to current period classifications, including $1.4 million of real estate owned previously included in mortgage loans held in securitization trusts (net) to prepaid and other assets.
Effective July 1, 2009, the Company adopted the provisions of the Financial Accounting Standards Board (“FASB”), Accounting Standards Codification, (the “Codification”), which is now the source of authoritative GAAP. While the Codification did not change GAAP, all existing authoritative accounting literature, with certain exceptions, was superseded and incorporated into the Codification. As a result, pre-Codification references to GAAP have been eliminated.
The Board of Directors declared a one for five reverse stock split of our common stock, as of October 9, 2007 and a one for two reverse stock split of our common stock, as of May 27, 2008, decreasing the number of common shares then outstanding to approximately 9.3 million. Prior and current period share amounts and earnings per share disclosures included herein have been restated to reflect the reverse stock split. In addition, the terms of our Series A Preferred Stock provide that the conversion rate for the Series A Preferred Stock be appropriately adjusted to reflect any reverse stock split. As a result, the description of our Series A Preferred Stock reflects the May 2008 reverse stock split (see note 15).
Cash and Cash Equivalents- Cash and cash equivalents include cash on hand, amounts due from banks and overnight deposits. The Company maintains its cash and cash equivalents in highly rated financial institutions, and at times these balances exceed insurable amounts.
Restricted Cash- Restricted cash isincludes $2.9 million held by counterparties as collateral for hedging instruments collateralized debt obligations or (“CDOs”) and two letters$0.1 million held as collateral for a letter of credit related to the Company’s lease of its corporate headquarters. Restricted cash collateralizing CDOs is replaced by ARM loans within 30 days.
Investment Securities Available for Sale- The Company’sCompany's investment securities are residential mortgage-backed securitiesinclude RMBS comprised of GinnieFannie Mae, (“GNMA”)Freddie Mac, non-Agency RMBS, initially rated AAA securities and “AAA”- rated adjustable-rate securities, including adjustable-rate loans that have an initial fixed-rate period.CLOs. Investment securities are classified as available for sale securities and are reported at fair value with unrealized gains and losses reported in other comprehensive income (“OCI”). Realized gains and losses recorded on the sale of investment securities available for sale are based on the specific identification method and included in realized gain (loss) on sale of securities and related hedges.hedges in the consolidated statements of operations. Purchase premiums or discounts on investment securities are accretedamortized or amortizedaccreted to interest income over the estimated life of the investment securities using the interest method. Investment securities may be subjectAdjustments to interest rate, credit and/oramortization are made for actual prepayment risk.activity.
When the fair value of an available for saleinvestment security is less than its amortized cost management considers whether thereat the balance sheet date, the security is considered impaired. The Company assesses its impaired securities on at least a quarterly basis, and designates such impairments as either “temporary” or “other-than-temporary.” If the Company intends to sell an impaired security, or it is more likely than not that it will be required to sell the impaired security before its anticipated recovery, then it must recognize an other-than-temporary impairment inthrough earnings equal to the entire difference between the investment’s amortized cost and its fair value at the balance sheet date. If the Company does not expect to sell an other-than-temporarily impaired security, only the portion of the security (e.g., whetherother-than-temporary impairment related to credit losses is recognized through earnings with the security will be sold prior toremainder recognized as a component of other comprehensive income (loss) on the recoveryconsolidated balance sheet. Impairments recognized through other comprehensive income (loss) do not impact earnings. Following the recognition of fair value). Management considers at a minimum the following factors that, both individually or in combination, could indicate the decline is “other-than-temporary:” 1) the length of time and extent to which the market value has been less than book value; 2) the financial condition and near-term prospects of the issuer; or 3) the intent and ability of the Company to retain the investment for a period of time sufficient to allow for any anticipated recovery in market value. If, in management’s judgment, an other-than-temporary impairment exists,through earnings, a new cost basis is established for the security and may not be adjusted for subsequent recoveries in fair value through earnings. However, other-than-temporary impairments recognized through earnings may be accreted back to the amortized cost basis of the security on a prospective basis through interest income. The determination as to whether an other-than-temporary impairment exists and, if so, the amount considered other-than-temporarily impaired is written down to the then-current fair value, and the unrealized loss is transferred from accumulated other comprehensive incomesubjective, as an immediate reduction of current earnings (i.e., as if the loss had been realized in the period of impairment). Even though no credit concerns exist with respect to an available for sale security, an other- than-temporary impairment may be evident if management determines that the Company does not have the intent and ability to hold an investment until a forecasted recovery of the value of the investment.
As of December 31, 2005, management concluded,such determinations are based on both factual and subjective information available at the decisiontime of assessment. As a result, the timing and amount of other-than-temporary impairments constitute material estimates that are susceptible to potentially sell in the 1st quarter of 2006 certain of its available for sale securities, that the decline in those securities was other-than-temporary. Accordingly, the cost basis of those securities of $395.7 million was written down to fair value and an unrealized loss of $7.4 million was transferred from accumulated other comprehensive income as an impairment loss on investment securities to the accompanying consolidated statement of operations.significant change (see note 2).
Due from Loan PurchasersAccounts and Escrow DepositsAccrued Interest Receivable - Pending Loan Closings - Amounts due from loan purchasers are aAccounts and accrued receivable includes interest receivable for the principalinvestment securities and premium due to us for loans sold and shipped but for which payment has not yet been received at period end. Escrow deposits pending loan closing are advance cash fundings by us to escrow agents to be used to close loans within the next one to three business days.
Mortgage Loans Held for Sale - Mortgage loans held for sale represent originated mortgage loans held for sale to third party investors. The loans are initially recorded at cost based on the principal amount outstanding net of deferred direct origination costs and fees. The loans are subsequently carried at the lower of cost or market value. Market value is determined by examining outstanding commitments from investors or current investor yield requirements, calculated on an aggregate loan basis, less an estimate of the costs to close the loan, and the deferral of fees and points received, plus the deferral of direct origination costs. Gains or losses on sales are recognized at the time title transfers to the investor which is typically concurrent with the transfer of the loan files and related documentation and are based upon the difference between the sales proceeds from the final investor and the adjusted book value of the loan sold.in securitization trusts.
Mortgage Loans Held in Securitization Trusts - Mortgage loans held in securitization trusts are certain ARMadjustable rate mortgage ("ARM") loans transferred to New York Mortgage Trust 2005-1, New York Mortgage Trust 2005-2 and New York Mortgage Trust 2005-3 that have been securitized into sequentially rated classes of beneficial interests. Mortgage loans held in securitization trusts are recordedcarried at amortized cost, using the same accounting principles as those used for mortgage loans held for investment. Currently the Company has retained 100% of the securities issued by New York Mortgage Trust 2005-1 and the New York Mortgage Trust 2005-2 and the securities have been financed as a secured borrowing under repurchase agreements. For our third securitization, New York Mortgage Trust 2005-03, we sold investment grade securities to third parties, which are recorded as collateralized debt obligations on the accompanying consolidated balance sheet. For our fourth securitization, the Company sold residential mortgage loans of $277.4 million to New York Mortgage Trust 2006-1 in a securitization transaction structured as a sale for accounting purposes on March 30, 2006.
Mortgage Loans Held for Investment - The Company retains substantially all of the adjustable-rate mortgage loans originated by NYMC that meet specific investment criteria and portfolio requirements. Loans originated and retained in the Company’s portfolio are serviced through a subservicer. Servicing is the function primarily consisting of collecting monthly payments from mortgage borrowers, and disbursing those funds to the appropriate loan investors.
Mortgage loans held for investment are recordedtheir unpaid principal balances, net of deferred loan origination fees and associated direct costs and are stated at amortized cost. Net loan origination fees and associated direct mortgageunamortized premium or discount, unamortized loan origination costs are deferred and amortized over the life of theallowance for loan as an adjustment to yield. This amortization includes the effect of projected prepayments.losses.
Interest income is accrued and recognized as revenue when earned according to the terms of the mortgage loans and when, in the opinion of management, it is collectible. The accrual of interest on loans is discontinued when, in management’s opinion, the interest is not collectible in the normal course of business, but in no case when payment becomes greater than 90 days delinquent. Loans return to accrual status when principal and interest become current and are anticipated to be fully collectible.
Credit Risk and Allowance for Loan Losses on Mortgage Loans Held in Securitization Trusts- The Company estimatesWe establish an allowance for loan losses based on management’s assessmentmanagement's judgment and estimate of probable credit losses inherent in the Company’s investmentour portfolio of residential mortgage loans, mortgage loans held for sale and mortgage loans held for investment. These loans are individually evaluated for impairment. The allowance is based upon management’s assessmentin securitization trusts.
Estimation involves the consideration of various credit-related factors including but not limited to, macro-economic conditions, the current economichousing market conditions, loan-to-value ratios, delinquency status, historical credit loss severity rates, purchased mortgage insurance, the borrower's current economic condition and other factors deemed to warrant consideration. IfAdditionally, we look at the credit performancebalance of these mortgage loans previously reserved deviates from expectations,any delinquent loan and compare that to the current value of the collateralizing property. We utilize various home valuation methodologies including appraisals, broker pricing opinions (“BPOs”), internet-based property data services to review comparable properties in the same area or consult with a realtor in the property's area.
Comparing the current loan balance to the property value determines the current loan-to-value (“LTV”) ratio of the loan. Generally, we estimate that a first lien loan on a property that goes into a foreclosure process and becomes real estate owned (“REO”), results in the property being disposed of at approximately 84% of the current appraised value. This estimate is based on management's experience as well as realized severity rates since issuance of our securitizations. During 2008, as a result of the significant deterioration in the housing market, we revised our policy to estimate recovery values based on current home valuations less expected costs to dispose. These costs typically approximate 16% of the current home value. It is possible given today's deteriorating market conditions, we may realize less than that return in certain cases. Thus, for a first lien loan that is delinquent, we will adjust the property value down to approximately 84% of the current property value and compare that to the current balance of the loan. The difference determines the base provision for the loan loss taken for that loan. This base provision for a particular loan may be adjusted if we are aware of specific circumstances that may affect the outcome of the loss mitigation process for that loan. Predominately, however, we use the base reserve number for our reserve.
The allowance for loan losses is adjusted to a level deemed appropriate by management to provide for estimated probable losses in the portfolio.
The allowance will be maintained through ongoing provisions charged to operating income and will be reduced by loans that are charged off. As of December 31, 20062009 the allowance for loan losses held in securitization trusts totaled $4.0$2.6 million. Determining theThe allowance for loan losses is subjectivewas $0.8 million at December 31, 2008.
Prepaid and Other Assets - Prepaid and other assets totaled $2.1 million as of December 31, 2009 and consist mainly of $0.5 million of real estate owned (“REO”), $0.2 million in nature dueescrow advances related to the estimation required.
Propertymortgage loans held in securitization trusts (net), $0.5 million of capitalization expenses related to equity and Equipment, Net - Propertybond issuance cost and equipment have lives ranging from three$0.3 million in prepaid insurance. Prepaid and other asset totaled $2.6 million as of December 31, 2008 and included $1.4 million of REO, $0.4 million in escrow advances related to ten years,mortgage loans held in securitization trusts (net) and are stated at cost less accumulated depreciation$0.5 million of capitalization expenses related to equity and amortization. Depreciation is determined in amounts sufficient to charge the cost of depreciable assets to operations over their estimated service lives using the straight-line method. Leasehold improvements are amortized over the lesser of the life of the lease or service lives of the improvements using the straight-line method.bond issuance cost.
Discontinued Operation: The Company entered into agreements to sell the mortgage lending operations subsequent to December 31, 2006 and accordingly, as per the provisions of SFAS No. 144 will report the activities of the Mortgage Banking Segment as a discontinued operation. (see note 12).
Financing Arrangements, Portfolio Investments— Portfolio investments - Investment securities available for sale are typically financed with repurchase agreements, a form of collateralized borrowing which is secured by portfoliothe securities on the balance sheet. Such financings are recorded at their outstanding principal balance with any accrued interest due recorded as an accrued expense.expense (see note 5).
Financing Arrangements, Loans Held for Sale/for Investment— Loans held for sale or for investment are typically financed with warehouse lines that are collateralized by loans we originated or purchased from third parties. Such financings are recorded at their outstanding principal balance with any accrued interest due recorded as an accrued expense.
Collateralized Debt Obligations (“CDO”) - We use CDOs are securities that are issued and secured by ARM loans.to permanently finance our loans held in securitization trusts. For financial reporting purposes, the ARM loans and restricted cash held as collateral are recorded as assets of the Company and the CDO is recorded as the Company’s debt. The transaction includes interest rate caps which are held by the securitization trust and recorded as an asset or liability of the Company. The Company has completed four securitizations since inception, the first three were accounted for as a permanent financing (see note 6) and the fourth was accounted for as a sale and accordingly, not included in the Company’s financial statements.
Securitized transactions - The Company, as transferor, regularly securitizes mortgage loans and securities by transferring the loans or securities to entities (“Transferees”) which generally qualify under GAAP as “qualifying special purpose entities” (“QSPE's”) as defined under Statement of Financial Accounting Standards (“SFAS”) No. 140, Accounting for Transfers and Servicing of Financial Assets and Extinguishment of Liabilities—a replacement of FASB Statement No. 125 (“Off Balance Sheet Securitizations”). The QSPEs issue investment grade and non-investment grade securities. Generally, the investment grade securities are sold to third party investors, and the Company retains the non-investment grade securities. If a transaction meets the requirements for sale recognition under GAAP, and the Transferee meets the requirements to be a QSPE, the assets transferred to the QSPE are considered sold, and gain or loss is recognized. The gain or loss is based on the price of the securities sold and the estimated fair value of any securities and servicing rights retained over the cost basis of the assets transferred net of transaction costs. If subsequently the Transferee fails to continue to qualify as a QSPE, or the Company obtains the right to purchase assets out of the Transferee, then the Company may have to include in its financial statements such assets, or potentially, all the assets of such Transferee.
Subordinated Debentures (Net) - - Subordinated debentures are trust preferred securities that are fully guaranteed by the Company with respect to distributions and amounts payable upon liquidation, redemption or repayment. These securities are classified as subordinated debentures in the liability section of the Company’s consolidated balance sheet.sheet (see note 7).
Convertible Preferred Debentures (Net) - The Company issued $20.0 million in Series A Convertible Preferred Stock that mature on December 31, 2010, at which time any outstanding shares must be redeemed by the Company at the $20.00 per share liquidations preference plus any accrued and unpaid dividends. As a result of the mandatory redemption feature, the Company classifies these securities as a liability on its balance sheet (see note 15).
Derivative Financial Instruments- The Company has developed risk management programs and processes, which include investments in derivative financial instruments designed to manage market risk associated with its mortgage banking and its mortgage-backed securities investment activities.
All derivative financial instruments are reported as either assets or liabilities in the consolidated balance sheet at fair value. The gains and losses associated with changes in the fair value of derivatives not designated as hedges are reported in current earnings. If the derivative is designated as a fair value hedge and is highly effective in achieving offsetting changes in the fair value of the asset or liability hedged, the recorded value of the hedged item is adjusted by its change in fair value attributable to the hedged risk. If the derivative is designated as a cash flow hedge, the effective portion of change in the fair value of the derivative is recorded in other comprehensive income (“OCI”) and is recognized in the income statement when the hedged item affects earnings. The Company calculates the effectiveness of these hedges on an ongoing basis, and, to date, has calculated effectiveness of approximately 100%. Ineffective portions, if any, of changes in the fair value or cash flow hedges are recognized in earnings.
Risk Management - Derivative transactions are entered into by the Company solely for risk management purposes. The decision of whether or not an economic risk within a given transaction (or portion thereof) should be hedged for risk management purposes is made on a case-by-case basis, based on the risks involved and other factors as determined by senior management, including the financial impact on income, asset valuation and restrictions imposed by the Internal Revenue Code among others. In determining whether to hedge a risk, the Company may consider whether other assets, liabilities, firm commitments and anticipated transactions already offset or reduce the risk. All transactions undertaken to hedge certain market risks are entered into with a view towards minimizing the potential for economic losses that could be incurred by the Company. Under SFAS No. 133, “Accounting for Derivative Instruments and Hedging Activities”, as amended and interpreted, (“SFAS No. 133”), the Company is required to formally document its hedging strategy before it may elect to implement hedge accounting for qualifying derivatives. Accordingly, all qualifying derivatives are intended to qualify as fair value, or cash flow hedges, or free standing derivatives. To this end, terms of the hedges are matched closely to the terms of hedged items with the intention of minimizing ineffectiveness.
In the normal course of its mortgage loan origination business, the Company enters into contractual interest rate lock commitments to extend credit to finance residential mortgages. These commitments, which contain fixed expiration dates, become effective when eligible borrowers lock-in a specified interest rate within time frames established by the Company’s origination, credit and underwriting practices. Interest rate risk arises if interest rates change between the time of the lock-in of the rate by the borrower and the sale of the loan. Under SFAS No. 133, the IRLCs are considered undesignated or free-standing derivatives. Accordingly, such IRLCs are recorded at fair value with changes in fair value recorded to current earnings. Mark to market adjustments on IRLCs are recorded from the inception of the interest rate lock through the date the underlying loan is funded. The fair value of the IRLCs is determined by the interest rate differential between the contracted loan rate and the currently available market rates as of the reporting date.
To mitigate the effect of the interest rate risk inherent in providing IRLCs from the lock-in date to the funding date of a loan, the Company generally enters into forward sale loan contracts (“FSLC”). The FSLCs in place prior to the funding of a loan are undesignated derivatives under SFAS No. 133 and are marked to market through current earnings.
Derivative instruments contain an element of risk in the event that the counterparties may be unable to meet the terms of such agreements. The Company minimizes its risk exposure by limiting the counterparties with which it enters into contracts to banks and investment banks and certain private investors who meet established credit and capital guidelines. Management does not expect any counterparty to default on its obligations and, therefore, does not expect to incur any loss due to counterparty default. These commitments and option contractsIn addition, all outstanding interest rate swap agreements have bi-lateral margin call capabilities, meaning the Company will require margin for interest rate swaps that are considered in conjunction with the Company’s lower of cost or market valuation of its mortgage loans held for sale.favor, minimizing any amounts at risk.
The Company uses other derivative instruments, including treasury, agency or mortgage-backed securities forward sale contracts which are also classified as free-standing, undesignated derivatives and thus are recorded at fair value with the changes in fair value recognized in current earnings.
Once a loan has been funded, the Company’s primary risk objective for its mortgage loans held for sale is to protect earnings from an unexpected charge due to a decline in value. The Company’s strategy is to engage in a risk management program involving the designation of FSLCs (the same FSLCs entered into at the time of rate lock) to hedge most of its mortgage loans held for sale. The FSLCs have been designated as qualifying hedges for the funded loans and the notional amount of the forward delivery contracts, along with the underlying rate and critical terms of the contracts, are equivalent to the unpaid principal amount of the mortgage loan being hedged. The FSLCs effectively fix the forward sales price and thereby offset interest rate and price risk to the Company. Accordingly, the Company evaluates this relationship quarterly and, at the time the loan is funded, classifies and accounts for the FSLCs as cash flow hedges.
Interest Rate Risk- The Company hedges the aggregate risk of interest rate fluctuations with respect to its borrowings, regardless of the form of such borrowings, which require payments based on a variable interest rate index. The Company generally intends to hedge only the risk related to changes in the benchmark interest rate (London Interbank Offered Rate (“LIBOR”) or a Treasury rate). The Company applies hedge accounting utilizing the cash flow hedge criteria.
In order to reduce such risks, the Company enters into swap agreements whereby the Company receives floating rate payments in exchange for fixed rate payments, effectively converting the borrowing to a fixed rate. The Company also enters into cap agreements whereby, in exchange for a fee,premium, the Company is reimbursed for interest paid in excess of a certain capped rate.
To qualify for cash flow hedge accounting, interest rate swaps and caps must meet certain criteria, including:
| | · | the items to be hedged expose the Company to interest rate risk; and |
| | · | the interest rate swaps or caps are expected to be and continue to be highly effective in reducing the Company’sCompany's exposure to interest rate risk. |
The fair values of the Company’sCompany's interest rate swap agreements and interest rate cap agreements are based on market values provided by dealers who are familiar with the terms of these instruments. Correlation and effectiveness are periodically assessed at least quarterly based upon a comparison of the relative changes in the fair values or cash flows of the interest rate swaps and caps and the items being hedged.
For derivative instruments that are designated and qualify as a cash flow hedge (i.e. hedging the exposure to variability in expected future cash flows that is attributable to a particular risk), the effective portion of the gain or loss on the derivative instruments are reported as a component of OCI and reclassified into earnings in the same period or periods during which the hedged transaction affects earnings. The remaining gain or loss on the derivative instruments in excess of the cumulative change in the present value of future cash flows of the hedged item, if any, is recognized in current earnings during the period of change.
With respect to interest rate swaps and caps that have not been designated as hedges, any net payments under, or fluctuations in the fair value of, such swaps and caps, will be recognized in current earnings.
Termination of Hedging Relationships- The Company employs a number of risk management monitoring procedures to ensure that the designated hedging relationships are demonstrating, and are expected to continue to demonstrate, a high level of effectiveness. Hedge accounting is discontinued on a prospective basis if it is determined that the hedging relationship is no longer highly effective or expected to be highly effective in offsetting changes in fair value of the hedged item.
Additionally, the Company may elect to undesignateun-designate a hedge relationship during an interim period and re-designate upon the rebalancing of a hedge profile and the corresponding hedge relationship. When hedge accounting is discontinued, the Company continues to carry the derivative instruments at fair value with changes recorded in current earnings.
Revenue Recognition. Interest income on our residential mortgage loans and mortgage-backed securities is a combination of the interest earned based on the outstanding principal balance of the underlying loan/security, the contractual terms of the assets and the amortization of yield adjustments, principally premiums and discounts, using generally accepted interest methods. The net GAAP cost over the par balance of self-originated loans held for investment and premium and discount associated with the purchase of mortgage-backed securities and loans are amortized into interest income over the lives of the underlying assets using the effective yield method as adjusted for the effects of estimated prepayments. Estimating prepayments and the remaining term of our interest yield investments require management judgment, which involves, among other things, consideration of possible future interest rate environments and an estimate of how borrowers will react to those environments, historical trends and performance. The actual prepayment speed and actual lives could be more or less than the amount estimated by management at the time of origination or purchase of the assets or at each financial reporting period.
Other Comprehensive Income (Loss)- Other comprehensive income (loss) is comprised primarily of net income (loss) from changes in value of the Company’s available for sale securities, and the impact of deferred gains or losses on changes in the fair value of derivative contracts hedging future cash flows.
Gain on Sale of Mortgage Loans - The Company recognizes gain on sale of loans sold to third parties as the difference between the sales price and the adjusted cost basis of the loans when title transfers. The adjusted cost basis of the loans includes the original principal amount adjusted for deferrals of origination and commitment fees received, net of direct loan origination costs paid.
Loan Origination Fees and Direct Origination Cost - The Company records loan fees, discount points and certain incremental direct origination costs as an adjustment of the cost of the loan and such amounts are included in gain on sales of loans when the loan is sold. Accordingly, salaries, compensation, benefits and commission costs have been reduced by $26.4 million, $41.2 million and $20.5 milion for the years ended December 31, 2006, 2005 and 2004, respectively, because such amounts are considered incremental direct loan origination costs.
Brokered Loan Fees and Expenses - The Company records commissions associated with brokered loans when such loans are closed with the borrower. Costs associated with brokered loans are expensed when incurred.
Loan Commitment Fees - Mortgage loans held for sale: fees received for the funding of mortgage loans to borrowers at pre-set conditions are deferred and recognized at the date at which the loan is sold. Mortgage loans held for investment: such fees are deferred and recognized into interest income over the life of the loan based on the effective yield method.
Employee Benefits Plans- The Company sponsors a defined contribution plan (the “Plan”) for all eligible domestic employees. The Plan qualifies as a deferred salary arrangement under Section 401(k) of the Internal Revenue Code. Under the Plan, participating employees may defer up to 15% of their pre-tax earnings, subject to the annual Internal Revenue Code contribution limit. The Company matchesmay match contributions up to a maximum of 25% of the first 5% of salary. Employees vest immediately in their contribution and vest in the Company’s contribution at a rate of 25% after two full years and then an incremental 25% per full year of service until fully vested at 100% after five full years of service. The Company’s total contributions to the Plan were $0.3 million, $0.4 million$0.0, $0.0 and $0.2 million$18,495 for the years ended December 31, 2006, 20052009, 2008 and 20042007 respectively.
Stock Based Compensation -Until January 1, 2006 the Company followed Compensation expense for equity based awards is recognized over the provisionsvesting period of SFAS No. 123, “Accounting for Stock-Based Compensation” (“SFAS No. 123”) and SFAS No. 148, “Accounting for Stock-Based Compensation, Transition and Disclosure” (“SFAS No. 148”). The provisions of SFAS No. 123 allow companies either to expense the estimated fair value of stock options or to continue to follow the intrinsic value method set forth in Accounting Principles Board Opinion No. 25, “Accounting for Stock Issued to Employees” (“APB No. 25”) and disclose the pro forma effects on net income (loss) hadsuch awards, based upon the fair value of the options been expensed. The Company, since its inception, has elected not to apply APB No. 25 in accounting for its stock option incentive plans and has expensed stock based compensation in accordance with SFAS No. 123.at the grant date (see note 16).
In December, 2004 the Financial Accounting Standards Board (“FASB”) issued SFAS No. 123R, “Share-Based Payment,” (“SFAS No. 123R”) which requires all companies to measure compensation costs for all share-based payments, including employee stock options, at fair value. This statement was effective for the Company with the quarter beginning January 1, 2006. The adoption of SFAS No. 123R did not have a material impact on the Company’s consolidated financial statements.
Marketing and Promotion - The Company charges the costs of marketing, promotion and advertising to expense in the period incurred.
Income Taxes- The Company operates so as to qualify as a REIT under the requirements of the Internal Revenue Code. Requirements for qualification as a REIT include various restrictions on ownership of the Company’s stock, requirements concerning distribution of taxable income and certain restrictions on the nature of assets and sources of income. A REIT must distribute at least 90% of its taxable income to its stockholders of which 85% plus any undistributed amounts from the prior year must be distributed within the taxable year in order to avoid the imposition of an excise tax. The remaining balance may extend until timely filing of the Company’s tax return in the subsequent taxable year. Qualifying distributions of taxable income are deductible by a REIT in computing taxable income.
NYMC changed its tax status upon completion of the IPO from a non-taxable limited liability company toHC is a taxable REIT subsidiary and therefore subsequent to the IPO, is subject to corporate Federalfederal income taxes. Accordingly, deferred tax assets and liabilities are recognized for the future tax consequences attributable to differences between the financial statement carrying amounts of existing assets and liabilities and their respective tax base upon the change in tax status. Deferred tax assets and liabilities are measured using enacted tax rates expected to apply to taxable income in the years in which those temporary differences are expected to be recovered or settled. The effect on deferred tax assets and liabilities of a change in tax rates is recognized in income in the period that includes the enactment date.date (see note 12).
The Company will recognize interest and penalties, if any, related to uncertain tax positions as income tax expense, which is included in other expenses.
Earnings Per Share- Basic earnings per share excludes dilution and is computed by dividing net income available to common stockholders by the weighted-average number of shares of common stock outstanding for the period. Diluted earnings per share reflects the potential dilution that could occur if securities or other contracts to issue common stock were exercised or converted into common stock or resulted in the issuance of common stock that then shared in the earnings of the Company.Company (see note 14).
NewLoans Sold to Investors - For loans originated and sold by our discontinued mortgage lending business, the Company is obligated to repurchase loans based on violations of representations and warranties in the sale agreement, or early payment defaults. The Company did not repurchase any loans during the twelve months ended December 31, 2009.
The Company periodically receives repurchase requests based on alleged violations of representations and warranties, each of which management reviews to determine, based on management’s experience, whether such requests may reasonably be deemed to have merit. As of December 31, 2009, we had a total of $2.0 million of unresolved repurchase requests that management concluded may reasonably be deemed to have merit against which the Company has a reserve of approximately $0.3 million. The reserve is based on one or more of the following factors; historical settlement rates, property value securing the loan in question and specific settlement discussions with third parties.
A Summary of Recent Accounting Pronouncements – Follows:
General Principles
Generally Accepted Accounting Principles (ASC 105)
In February 2007,June 2009, the FASBFinancial Accounting Standards Board (“FASB”) issued SFAS No. 159, “The Fair Value OptionAccounting Standards Codification and the Hierarchy of Generally Accepted Accounting Principles (Codification) which revises the framework for Financial Assets and Financial Liabilities” (“SFAS No. 159”), which provides companiesselecting the accounting principles to be used in the preparation of financial statements that are presented in conformity with an option to report selected financial assets and liabilities at fair value.Generally Accepted Accounting Principles (“GAAP”). The objective of SFAS No. 159the Codification is to reduce both complexityestablish the FASB Accounting Standards Codification (“ASC”) as the source of authoritative accounting principles recognized by the FASB. Codification is effective for the Company for this September 30, 2009 Form 10-Q. In adopting the Codification, all non-grandfathered, non-SEC accounting literature not included in the Codification is superseded and deemed non-authoritative. Codification requires any references within the Company’s consolidated financial statements be modified from FASB issues to ASC. However, in accordance with the FASB Accounting Standards Codification Notice to Constituents (v 2.0), the Company will not reference specific sections of the ASC but will use broad topic references.
The Company’s recent accounting for financial instrumentspronouncements section has been reformatted to reflect the same organizational structure as the ASC. Broad topic references will be updated with pending content as they are released.
Assets
Investments in Debt and the volatility in earnings caused by measuring related assetsEquity Securities (ASC 320)
New guidance was provided to make impairment guidance more operational and liabilities differently. SFAS No. 159 establishesto improve the presentation and disclosure requirementsof other-than-temporary impairments (“OTTI”) on debt and requires companiesequity securities in financial statements. This guidance was also the result of the Securities and Exchange Commission (“SEC”) mark-to-market study mandated under the Emergency Economic Stabilization Act of 2008 (“EESA”). The SEC’s recommendation was to “evaluate the need for modifications (or the elimination) of current OTTI guidance to provide additional informationfor a more uniform system of impairment testing standards for financial instruments.” The guidance revises the OTTI evaluation methodology. Previously the analytical focus was on whether the company had the “intent and ability to retain its investment in the debt security for a period of time sufficient to allow for any anticipated recovery in fair value”. Now the focus is on whether the company (1) has the intent to sell the Investment Securities, (2) is more likely than not that it will help investors and other users of financial statementsbe required to more easily understandsell the effectInvestment Securities before recovery, or (3) does not expect to recover the entire amortized cost basis of the company's choiceInvestment Securities. Further, the security is analyzed for credit loss, (the difference between the present value of cash flows expected to usebe collected and the amortized cost basis). The credit loss, if any, will then be recognized in the statement of operations, while the balance of impairment related to other factors will be recognized in OCI. This guidance became effective for all of the Company’s interim and annual reporting periods ending after June 15, 2009 with early adoption permitted for periods ending after March 15, 2009. The Company decided to early adopt. For the year ended December 31, 2009, the Company did not have unrealized losses in Investment Securities that were deemed other-than-temporary.
Broad Transactions
Business Combinations (ASC 805)
This guidance establishes principles and requirements for recognizing and measuring identifiable assets and goodwill acquired, liabilities assumed and any noncontrolling interest in a business combination at their fair value on its earnings. SFAS No. 159 also requires entitiesat acquisition date. ASC 805 alters the treatment of acquisition-related costs, business combinations achieved in stages (referred to displayas a step acquisition), the fair valuetreatment of those assetsgains from a bargain purchase, the recognition of contingencies in business combinations, the treatment of in-process research and liabilities for whichdevelopment in a business combination as well as the company has chosen to use fair value on the facetreatment of the balance sheet. SFAS No. 159recognizable deferred tax benefits. ASC 805 is effective for financial statements issued forbusiness combinations closed in fiscal years beginning after NovemberDecember 15, 20072008 and early adoption is permitted for fiscal years beginning on or before November 15, 2007 provided that the entity makes that choice in the first 120 days of the fiscal year, has not issued financial statements for any interim period of the fiscal year of adoption and also electsapplicable to apply the provisions of SFAS No. 157.business acquisitions completed after January 1, 2009. The Company is indid not make any business acquisitions during the process of analyzing the impact of SFAS No. 159 on its consolidated financial statements.
In September 2006, the FASB issued SFAS No. 157, “Fair Value Measurements” (“SFAS No.157”). SFAS No.157 defines fair value, establishes a framework for measuring fair value in generally accepted accounting principles and expands disclosures about fair value measurements. SFAS No.157 will be applied under other accounting principles that require or permit fair value measurements, as this is a relevant measurement attribute. This statement does not require any new fair value measurements. We will adopt the provisions of SFAS No.157 beginning January 1, 2008. We are currently evaluating the impact of this statement on our consolidated financial statements.
In September 2006, the SEC issued SAB No. 108, “Considering the Effects of Prior Year Misstatements when Quantifying Misstatements in Current Year Financial Statement” (“SAB 108”), on quantifying financial statement misstatements. In summary, SAB 108 was issued to address the diversity in practice of evaluating and quantifying financial statement misstatements and the related accumulation of such misstatements. SAB 108 states that both a balance sheet approach and an income statement approach should be used when quantifying and evaluating the materiality of a potential misstatement and contains guidance for correcting errors under this dual perspective. SAB 108 is effective for financial statements issued for fiscal years ending after November 15, 2006.year ended December 31, 2009. The adoption of SAB 108 did not have a material effect on the Company's consolidated financial statements.
In June 2006, FASB issued FASB Interpretation No. 48, “Accounting for Uncertainty in Income Taxes — an interpretation of FASB Statement No. 109” (“FIN 48”). This interpretation increases the relevancy and comparability of financial reporting by clarifying the way companies account for uncertainty in income taxes. FIN 48 prescribes a consistent recognition threshold and measurement attribute, as well as clear criteria for subsequently recognizing, derecognizing and measuring such tax positions for financial statement purposes. The interpretation also requires expanded disclosure with respect to the uncertainty in income taxes. FIN 48 is effective for us on January 1, 2007. The Company does not expect the adoption of FIN 48 to have a material effect on the Company’s consolidated financial statements.
In March 2006, the FASB issued SFAS No. 156, “Accounting for Servicing of Financial Assets an amendment of FASB Statement No. 140.” Effective at the beginning of the first quarter of 2006, the Company early adopted the newly issued statement and elected the fair value option to subsequently measure its mortgage servicing rights (“MSRs”). Under the fair value option, all changes in the fair value of MSRs are reported in the statement of operations. The initial implementation of SFAS 156ASC 805 did not have a material impact on the Company’s consolidated financial statements.
In February 2006,
Derivatives and Hedging (ASC 815)
Effective January 1, 2009 and adopted by the Company prospectively, the FASB issued SFAS No.155, “Accountingadditional guidance attempting to improve the transparency of financial reporting by mandating the provision of additional information about how derivative and hedging activities affect an entity’s financial position, financial performance and cash flows. This guidance changed the disclosure requirements for Certain Hybrid Financial Instruments”. Key provisions of SFAS No.155 include:derivative instruments and hedging activities by requiring enhanced disclosure about (1) a broadhow and why an entity uses derivative instruments, (2) how derivative instruments and related hedged items are accounted for, and (3) how derivative instruments and related hedged items affect an entity’s financial position, financial performance, and cash flows. To adhere to this guidance, qualitative disclosures about objectives and strategies for using derivatives, quantitative disclosures about fair value measurement option for certain hybrid financialamounts, gains and losses on derivative instruments, and disclosures about credit-risk-related contingent features in derivative agreements must be made. This disclosure framework is intended to better convey the purpose of derivative use in terms of the risks that contain an embedded derivativeentity is intending to manage. The effect of the adoption of this guidance was an increase in footnote disclosures is discussed in Note 4.
Fair Value Measurements and Disclosures (ASC 820)
In response to the deterioration of the credit markets, FASB issued guidance clarifying how Fair Value Measurements should be applied when valuing securities in markets that would otherwise require bifurcation; (2) clarification that only the simplest separations of interest payments and principal payments qualify for the exception afforded to interest-only strips and principal-only strips from derivative accounting under paragraph 14 of FAS No.133 (thereby narrowing such exception); (3) a requirement that beneficial interests in securitized financial assets be analyzed to determine whether they are freestanding derivatives or whether they are hybrid instruments that contain embedded derivatives requiring bifurcation; (4) clarification that concentrations of credit risk in the form of subordination are not embedded derivatives;active. The guidance provides an illustrative example, utilizing management’s internal cash flow and (5) eliminationdiscount rate assumptions when relevant observable data do not exist. It further clarifies how observable market information and market quotes should be considered when measuring fair value in an inactive market. It reaffirms the notion of fair value as an exit price as of the prohibition onmeasurement date and that fair value analysis is a QSPE holding passive derivativetransactional process and should not be broadly applied to a group of assets. The guidance was effective upon issuance including prior periods for which financial instruments that pertain to beneficial interests that are or contain a derivative financial instrument. In general, these changes will reduce the operational complexity associated with bifurcating embedded derivatives, and increase the numberstatements had not been issued. The implementation of beneficial interests in securitization transactions, including interest-only strips and principal-only strips, required to be accounted for in accordance with FAS No.133. Management doesthis guidance did not believe that SFAS No.155 will have a material effect on the fair value of the Company’s assets as the Company continued using the methodologies used in previous quarters to value assets as defined under the original Fair Value standards.
In October 2008 the EESA was signed into law. Section 133 of the EESA mandated that the SEC conduct a study on mark-to-market accounting standards. The SEC provided its study to the U.S. Congress on December 30, 2008. Part of the recommendations within the study indicated that “fair value requirements should be improved through development of application and best practices guidance for determining fair value in illiquid or inactive markets”. As a result of this study and the recommendations therein, on April 9, 2009, the FASB issued additional guidance for determining fair value when the volume and level of activity for the asset or liability have significantly decreased when compared with normal market activity for the asset or liability (or similar assets or liabilities). The guidance gives specific factors to evaluate if there has been a decrease in normal market activity and if so, provides a methodology to analyze transactions or quoted prices and make necessary adjustments to fair value. The objective is to determine the point within a range of fair value estimates that is most representative of fair value under current market conditions. This guidance became effective for the Company’s interim and annual reporting periods ending after June 15, 2009 with early adoption permitted for periods ending after March 15, 2009. The adoption does not have a major impact on the manner in which the Company estimates fair value, nor does it have any impact on our financial statement disclosures.
In August 2009, FASB provided further guidance regarding the fair value measurement of liabilities. The guidance states that a quoted price for the identical liability when traded as an asset in an active market is a Level 1 fair value measurement. If the value must be adjusted for factors specific to the liability, then the adjustment to the quoted price of the asset shall render the fair value measurement of the liability a lower level measurement. This guidance has no material effect on the fair valuation of the Company’s liabilities.
In January 2010, the FASB issued ASU 2010-06, Improving Disclosures about Fair Value Measurement, to enhance the usefulness of fair value measurements. The amended guidance requires both the disaggregation of information in certain existing disclosures, as well as the inclusion of more robust disclosures about valuation techniques and inputs to recurring and nonrecurring fair value measurements. This ASU amends ASC 820 to add new requirements for disclosures about transfers into and out of Levels 1 and 2 and separate disclosures about purchases, sales, issuances, and settlements relating to Level 3 measurements. This ASU also clarifies existing fair value disclosures about the level of disaggregation and about inputs and valuation techniques used to measure fair value. Further, this ASU amends guidance on employers’ disclosures about postretirement benefit plan assets under ASC 715 to require that disclosures be provided by classes of assets instead of by major categories of assets. This ASU is effective for the first reporting period (including interim periods) beginning after December 15, 2009, except for the requirement to provide the Level 3 activity of purchases, sales, issuances, and settlements on a gross basis, which will be effective for fiscal years beginning after December 15, 2010, and for interim periods within those fiscal years. Early adoption is permitted. The adoption of this standard may require additional disclosures, but the Company does not expect the adoption to have a material effect on our financial statements.
Financial Instruments (ASC 820-10-50)
On April 9, 2009, the FASB issued guidance which requires disclosures about fair value of financial instruments for interim reporting periods as well as in annual financial statements. The effective date of this guidance is for interim reporting periods ending after June 15, 2009 with early adoption permitted for periods ending after March 15, 2009. The adoption did not have any impact on financial reporting as all financial instruments are currently reported at fair value in both interim and annual periods.
Subsequent Events (ASC 855)
ASC 855 provides general standards governing accounting for and disclosure of events that occur after the balance sheet date but before the financial statements are issued or are available to be issued. ASC 855 also provides guidance on the period after the balance sheet date during which management of a reporting entity should evaluate events or transactions that may occur for potential recognition or disclosure in the financial statements, the circumstances under which an entity should recognize events or transactions occurring after the balance sheet date in its financial statements and the disclosures that an entity should make about events or transactions occurring after the balance sheet date. The Company adopted effective June 30, 2009, and adoption had no impact on the Company’s consolidated financial statements. The Company has evaluated all events or transactions through the date of this filing. During this period, we did not have any material subsequent events that impacted our consolidated financial statements.
2. | Investment Securities Available For Sale, at Fair Value |
Investment securities available for sale consist of the following as of December 31, 2006 and December 31, 20052009 (dollar amounts in thousands):
| | | December 31, 2006 | | December 31, 2005 | |
| Amortized cost | | $ | 492,777 | | $ | 720,583 | |
| Gross unrealized gains | | | 623 | | | 1 | |
| Gross unrealized losses | | | (4,438 | ) | | (4,102 | ) |
| Fair value | | $ | 488,962 | | $ | 716,482 | |
| | | Amortized Cost | | | Unrealized Gains | | | Unrealized Losses | | | Carrying Value | |
| Agency RMBS (1) | | $ | 112,525 | | | $ | 3,701 | | | $ | — | | | $ | 116,226 | |
| Non Agency RMBS | | | 40,257 | | | | 4,764 | | | | (2,155 | ) | | | 42,866 | |
| CLOs | | | 9,187 | | | | 8,412 | | | | — | | | | 17,599 | |
| Total | | $ | 161,969 | | | $ | 16,877 | | | $ | (2,155 | ) | | $ | 176,691 | |
| (1) | - Agency RMBS includes only Fannie Mae issued securities at December 31, 2009. |
As of December 31, 2006, none of the remaining securities with unrealized losses have been deemed to be other-than-temporarily impaired. The Company has the intent and believes it has the ability to hold such investment securities until recovery of their amortized cost. Substantially all of the Company’s investmentInvestment securities available for sale consist of the following as of December 31, 2008 (dollar amounts in thousands):
| | | Amortized Cost | | | Unrealized Gains | | | Unrealized Losses | | | Carrying Value | |
| Agency RMBS (1) | | $ | 454,653 | | | $ | 1,316 | | | $ | (98 | ) | | $ | 455,871 | |
| Non-Agency RMBS | | | 25,724 | | | | — | | | | (4,179 | ) | | | 21,545 | |
| Total | | $ | 480,377 | | | $ | 1,316 | | | $ | (4,277 | ) | | $ | 477,416 | |
| (1) | - Agency RMBS carrying value included $354.4 million of Fannie Mae issued and $101.5 million of Freddie Mac issued securities. |
The Company commenced its strategy of diversifying its portfolio to introduce more elements of credit risk by purchasing $46.0 million face amount of CLOs on March 31, 2009 at a purchase price of approximately $9.0 million. This marked the Company’s first investment outside of RMBS or other mortgage related assets. In addition, during the second and third quarters of 2009, the Company further diversified its portfolio by purchasing approximately $45.6 million current par value of non-Agency RMBS at an average cost of 60% of par. The $45.6 million current par value of non-Agency RMBS purchased were previously rated AAA (at issuance) and represent the senior cashflows of the applicable deal structures.
During March 2009, the Company determined that certain Agency RMBS, related to collateralized mortgage obligations (“CMO”) floaters in its portfolio were no longer producing acceptable returns and initiated a program for the purpose of disposing of these securities. The Company disposed of approximately $159.5 million in current par value of Agency CMO floaters during March 2009, with the balance of the Agency CMO floaters in its portfolio, or $34.3 million in current par value, being sold in April 2009, for an aggregate disposition of approximately $193.8 million in current par value of Agency CMO floaters and a net gain of approximately $0.1 million. As a result of this sale program, the Company incurred an additional impairment of $0.1 million in the quarter ended March 31, 2009 because the Company intended to sell the Agency CMO floaters.
All securities held in Investment Securities Available for Sale, including Agency, investment and non-investment grade securities, are pledgedbased on unadjusted price quotes for similar securities in active markets and are categorized as collateral for borrowings under financing arrangementsLevel 2 (see note 8)11). The amortized cost balance at December 31, 2005 included approximately $388.3 million of certain lower-yielding mortgage agency securities (with rate resets of less than two years) that the Company had concluded it no longer had the intent to hold until their values recovered. Upon such determination, the Company recorded an unrealized impairment loss of $7.4 million for the three months ended December 31, 2005. During the first quarter of 2006, all of such designated securities were sold at an additional loss of $1.0 million.
The following table setstables set forth the stated reset periods and weighted average yields of our investment securities available for sale at December 31, 20062009 (dollar amounts in thousands):
| | | Less than 6 Months | | More than 6 Months to 24 Months | | More than 24 Months to 60 Months | | Total | |
| | Carrying Value | | Weighted Average Yield | | Carrying Value | | Weighted Average Yield | | Carrying Value | | Weighted Average Yield | | Carrying Value | | Weighted Average Yield | |
| | | | | | | | | | | | | | | | | | |
| Agency REMIC CMO Floating Rate | | $ | 163,898 | | | 6.40 | % | $ | — | | | — | | $ | — | | | — | | $ | 163,898 | | | 6.40 | % |
| Private Label Floaters | | | 22,284 | | | 6.46 | % | | — | | | — | | | — | | | — | | | 22,284 | | | 6.46 | % |
| Private Label ARMs | | | 16,673 | | | 5.60 | % | | 78,565 | | | 5.80 | % | | 183,612 | | | 5.64 | % | | 278,850 | | | 5.68 | % |
| NYMT Retained Securities | | | 6,024 | | | 7.12 | % | | — | | | — | | | 17,906 | | | 7.83 | % | | 23,930 | | | 7.66 | % |
| Total/Weighted Average | | $ | 208,879 | | | 6.37 | % | $ | 78,565 | | | 5.80 | % | $ | 201,518 | | | 5.84 | % | $ | 488,962 | | | 6.06 | % |
| | | Less than 6 Months | | More than 6 Months To 24 Months | | More than 24 Months to 60 Months | | Total |
| | | Carrying Value | | Weighted Average Yield | | Carrying Value | | Weighted Average Yield | | Carrying Value | | Weighted Average Yield | | Carrying Value | | Weighted Average Yield |
| Agency RMBS | | $ | — | | — | | $ | 42,893 | | 2.07% | | $ | 73,333 | | 2.54% | | $ | 116,226 | | 2.37% |
| Non Agency RMBS | | | 22,065 | | 10.15% | | | 4,865 | | 7.23% | | | 15,936 | | 9.57% | | | 42,866 | | 9.61% |
| CLO | | | 17,599 | | 23.48% | | | — | | — | | | — | | — | | | 17,599 | | 23.48% |
| Total/Weighted Average | | $ | 39,664 | | 16.07% | | $ | 47,758 | | 2.60% | | $ | 89,269 | | 3.80% | | $ | 176,691 | | 6.23% |
The NYMT retained securities includes $2.0 million of residual interests related to the NYMT 2006-1 transaction. The residual interest carrying-values are determined by obtaining dealer quotes.
The following table sets forth the stated reset periods and weighted average yields of our investment securities available for sale at December 31, 20052008 (dollar amounts in thousands):
| | Less than 6 Months | | More than 6 Months To 24 Months | | More than 24 Months To 60 Months | | Total | |
| | | Carrying Value | | Weighted Average Yield | | Carrying Value | | Weighted Average Yield | | Carrying Value | | Weighted Average Yield | | Carrying Value | | Weighted Average Yield | |
| | | | | | | | | | | | | | | | | | |
| Agency REMIC CMO Floating Rate | | $ | 13,535 | | | 5.45 | % | $ | — | | | — | | $ | — | | | — | | $ | 13,535 | | | 5.45 | % |
| FHLMC Agency ARMs | | | — | | | — | | | 91,217 | | | 3.82 | % | | — | | | — | | | 91,217 | | | 3.82 | % |
| FNMA Agency ARMs | | | — | | | — | | | 297,048 | | | 3.91 | % | | — | | | — | | | 297,048 | | | 3.91 | % |
| Private Label ARMs | | | — | | | — | | | 57,605 | | | 4.22 | % | | 257,077 | | | 4.57 | % | | 314,682 | | | 4.51 | % |
| Total/Weighted Average | | $ | 13,535 | | | 5.45 | % | $ | 445,870 | | | 3.93 | % | $ | 257,077 | | | 4.57 | % | $ | 716,482 | | | 4.19 | % |
| | | Less than 6 Months | | More than 6 Months To 24 Months | | More than 24 Months To 60 Months | | Total |
| | | Carrying Value | | Weighted Average Yield | | Carrying Value | | Weighted Average Yield | | Carrying Value | | Weighted Average Yield | | Carrying Value | | Weighted Average Yield |
| Agency RMBS | | $ | 197,675 | | 8.54% | | $ | 66,910 | | 3.69% | | $ | 191,286 | | 4.02% | | $ | 455,871 | | 5.99% |
| Non-Agency RMBS (1) | | | 21,476 | | 14.11% | | | — | | — | | | 69 | | 16.99% | | | 21,545 | | 14.35% |
| Total/Weighted Average | | $ | 219,151 | | 9.21% | | $ | 66,910 | | 3.69% | | $ | 191,355 | | 4.19% | | $ | 477,416 | | 6.51% |
(1) The NYMT retained securities includes $0.1 million of residual interests related to the NYMT 2006-1 transaction.
The following table’stable presents the Company’sCompany's investment securities available for sale in an unrealized loss position, aggregated by investment category and length of time that individual securities have been in a continuous unrealized loss position at December 31, 20062009 and December 31, 2005 (dollar amounts in thousands):
| | | December 31, 2006 | |
| | | Less than 12 Months | | 12 Months or More | | Total | |
| | | Fair Value | | Gross Unrealized Losses | | Fair Value | | Gross Unrealized Losses | | Fair Value | | Gross Unrealized Losses | |
| | | | | | | | | | | | | | |
| Agency REMIC CMO Floating Rate | | $ | 966 | | $ | 2 | | $ | 1,841 | | $ | 4 | | $ | 2,807 | | $ | 6 | |
| Private Label Floaters | | | 22,284 | | | 80 | | | — | | | — | | | 22,284 | | | 80 | |
| Private Label ARMs | | | 30,385 | | | 38 | | | 248,465 | | | 4,227 | | | 278,850 | | | 4,265 | |
| NYMT Retained Securities | | | 7,499 | | | 87 | | | — | | | — | | | 7,499 | | | 87 | |
| Total | | $ | 61,134 | | $ | 207 | | $ | 250,306 | | $ | 4,231 | | $ | 311,440 | | $ | 4,438 | |
| | | December 31, 2005 | |
| | Less than 12 Months | | 12 Months or More | | Total | |
| | | Fair Value | | Gross Unrealized Losses | | Fair Value | | Gross Unrealized Losses | | Fair Value | | Gross Unrealized Losses | |
| | | | | | | | | | | | | | |
| Agency REMIC CMO Floating Rate | | $ | 11,761 | | $ | 19 | | $ | — | | $ | — | | $ | 11,761 | | $ | 19 | |
| Private Label ARMs | | | 48,642 | | | 203 | | | 270,124 | | | 3,880 | | | 318,766 | | | 4,083 | |
| Total | | $ | 60,403 | | $ | 222 | | $ | 270,124 | | $ | 3,880 | | $ | 330,527 | | $ | 4,102 | |
3.
| Mortgage Loans Held For Sale (discontinued, see note 12)
|
Mortgage loans held for sale consist of the following2008, respectively, as of December 31, 2006 and December 31, 2005follows (dollar amounts in thousands):
| | | December 31, 2006 | | December 31, 2005 | |
| Mortgage loans principal amount | | $ | 110,804 | | $ | 108,244 | |
| Deferred origination costs - net | | | 138 | | | 27 | |
| Allowance for loan losses | | | (4,042 | ) | | — | |
| Mortgage loans held for sale | | $ | 106,900 | | $ | 108,271 | |
Substantially all of the Company’s mortgage loans held for sale are pledged as collateral for borrowings under financing arrangements (Note 9).| December 31, 2009 | | Less than 12 Months | | | Greater than 12 months | | | Total | | |
| | | Carrying Value | | | Gross Unrealized Losses | | | Carrying Value | | | Gross Unrealized Losses | | | Carrying Value | | | Gross Unrealized Losses | | |
| Non-Agency RMBS | | $ | — | | | $ | — | | | $ | 14,693 | | | $ | 2,155 | | | $ | 14,693 | | | $ | 2,155 | |
| Total | | $ | — | | | $ | — | | | $ | 14,693 | | | $ | 2,155 | | | $ | 14,693 | | | $ | 2,155 | |
The following table presents| December 31, 2008 | Less than 12 Months | | Greater than 12 months | | Total | | |
| | Carrying Value | | Gross Unrealized Losses | | Carrying Value | | Gross Unrealized Losses | | Carrying Value | | Gross Unrealized Losses | | |
| Agency RMBS | | $ | 9,406 | | | $ | 98 | | | $ | — | | | $ | — | | | $ | 9,406 | | | $ | 98 | |
| Non-Agency RMBS | | | 18,649 | | | | 4,179 | | | | — | | | | — | | | | 18,649 | | | | 4,179 | |
| Total | | $ | 28,055 | | | $ | 4,277 | | | $ | — | | | $ | — | | | $ | 28,055 | | | $ | 4,277 | |
There were no unrealized positions for Agency CMO Floaters and the activity inresidual interests related to the Company's allowance for loan losses for the year endedNYMT 2006-1 transaction at December 31, 2006. There was no allowance for2008 as the year ended December 31, 2005.
Company incurred approximately $5.3 million impairment charge.
| | | December 31, 2006 | |
| Balance at beginning of period | | $ | - | |
| Provisions for loan losses | | | (5,040 | ) |
| Charge-offs | | | 998 | |
| Balance of the end of period | | $ | (4,042 | ) |
4.
3. | Mortgage Loans Held in Securitization Trusts |
Mortgage loans held in securitization trusts consist of the following at December 31, 20062009 and December 31, 20052008 (dollar amounts in thousands):
| | | | December 31, | |
| | | December 31, 2006 | | December 31, 2005 | | | 2009 | | | 2008 | |
| Mortgage loans principal amount | | $ | 584,358 | | $ | 771,451 | | | $ | 277,007 | | | $ | 345,619 | |
| Deferred origination costs - net | | | 3,802 | | | 5,159 | | |
| Deferred origination costs – net | | | | 1,750 | | | | 2,197 | |
| Reserve for loan losses | | | | (2,581 | ) | | | (844 | ) |
| Total mortgage loans held in securitization trusts | | $ | 588,160 | | $ | 776,610 | | | $ | 276,176 | | | $ | 346,972 | |
Substantially allAllowance for Loan losses - The following table presents the activity in the Company's allowance for loan losses on mortgage loans held in securitization trusts for the year ended December 31, 2009 and 2008 (dollar amounts in thousands):
| | | December 31, | |
| | | 2009 | | | 2008 | |
| Balance at beginning of period | | $ | 844 | | | $ | 367 | |
| Provisions for loan losses | | | 2,192 | | | | 1,187 | |
| Transfer to real estate owned | | | (406 | ) | | | (460 | ) |
| Charge-offs | | | (49 | ) | | | (250 | ) |
| Balance of the end of period | | $ | 2,581 | | | $ | 844 | |
On a ongoing basis, the Company evaluates the adequacy of its reserve for loan losses. The Company’s reserve for loan losses at December 31, 2009 was $2.6 million, representing 93 basis points of the outstanding principal balance of loans held in securitization trusts as compared to 24 basis points as of December 31, 2008. As part of the Company’s reserve adequacy analysis, management will access an overall level of reserves while also assessing credit losses inherent in each non-performing mortgage loan held in securitization trusts. These estimates involve the consideration of various credit related factors, including but not limited to, current housing market conditions, current loan to value ratios, delinquency status, borrower’s current economic and credit status and other relevant factors.
Real Estate Owned – The following table presents the activity in the Company’s real estate owned held in securitization trusts for the year ended December 31, 2009 and 2008 (dollar amounts in thousands):
| | | December 31, | |
| | | 2009 | | | 2008 | |
| Balance at beginning of period | | $ | 1,366 | | | $ | 2,865 | |
| Write downs | | | (70 | ) | | | (246 | ) |
Transfer from mortgage loans held in securitization trusts | | | 826 | | | | 1,826 | |
| Disposal | | | (1,576 | ) | | | (3,079 | ) |
| Balance of the end of period | | $ | 546 | | | $ | 1,366 | |
Real estate owned held in securitization trusts are included in the prepaid and other assets on the balance sheet and write downs are included in loan losses in the statement of operations for reporting purposes.
All of the Company’s mortgage loans and real estate owned held in securitization trusts are pledged as collateral for borrowings under financing arrangements (Note 8) or for the collateralized debt obligation (Note 10)CDOs issued by the Company (see note 6). As of December 31, 2009, the Company’s net investment in the securitization trusts, which is the maximum amount of the Company’s investment that is at risk to loss and represents the difference between the carrying amount of the loans and real estate owned held in securitization trust and the amount of CDO’s outstanding, was $10.0 million.
The following sets forth delinquent loans, including real estate owned through foreclosure (REO) in our portfolio as of December 31, 20062009 and December 31, 20052008 (dollar amounts in thousands):
December 31, 20062009
Days Late | | Number of Delinquent Loans | | Total Dollar Amount | | % of Loan Portfolio | | | Number of Delinquent Loans | | Total Dollar Amount | | % of Loan Portfolio | |
| 30-60 | | | 1 | | $ | 166 | | | 0.03 | % | | 5 | | $ | 2,816 | | 1.01 | % |
| 61-90 | | | 1 | | | 193 | | | 0.03 | % | | 4 | | $ | 1,150 | | 0.41 | % |
| 90+ | | | 5 | | $ | 6,444 | | | 1.10 | % | | 32 | | $ | 15,915 | | 5.73 | % |
| Real estate owned through foreclosure | | | 2 | | $ | 739 | | 0.27 | % |
| December 31, 200531, 2008 |
| Days Late | | Number of Delinquent Loans | | Total Dollar Amount | | % of Loan Portfolio | |
| 30-60 | | 3 | | $ | 1,363 | | 0.39 | % |
| 61-90 | | 1 | | $ | 263 | | 0.08 | % |
| 90+ | | 13 | | $ | 5,734 | | 1.65 | % |
| Real estate owned through foreclosure | | 4 | | $ | 1,927 | | 0.55 | % |
Days Late | | Number of Delinquent Loans | | Total Dollar Amount | | % of Loan Portfolio | |
| 30-60 | | | 1 | | $ | 193 | | | 0.02 | % |
| 61-90 | | | — | | | — | | | — | |
| 90+ | | | 3 | | $ | 1,771 | | | 0.23 | % |
5.
4. | Mortgage Loans Held For Investment
|
There were no Mortgage loans held for investment at December 31, 2006. Mortgage loans held for investment consist of the following at December 31, 2005 (dollar amounts in thousands):
| | | December 31, 2005 | |
| Mortgage loans principal amount | | $ | 4,054 | |
| Deferred origination cost-net | | | 6 | |
| Total mortgage loans held for investment | | $ | 4,060 | |
Substantially all of the Company’s mortgage loans held for investment as of December 31, 2005 were pledged as collateral for borrowings under financing arrangements (note 9).
6.
| Property and Equipment — Net (discontinued, see note 12)
|
Property and equipment consist of the following as of December 31, 2006 and December 31, 2005 (dollar amounts in thousands):
| | | December 31, 2006 | | December 31, 2005 | |
| Office and computer equipment | | $ | 7,800 | | $ | 6,292 | |
| Furniture and fixtures | | | 2,200 | | | 2,306 | |
| Leasehold improvements | | | 1,491 | | | 1,429 | |
| Total premises and equipment | | | 11,491 | | | 10,027 | |
| Less: accumulated depreciation and amortization | | | (4,975 | ) | | (3,145 | ) |
| Property and equipment - net | | $ | 6,516 | | $ | 6,882 | |
7.
| Derivative Instruments and Hedging Activities |
The Company enters into derivativesderivative instruments to manage its interest rate and market risk exposure associated with its mortgage banking and its mortgage-backed securities investment activities. In the normal course of its mortgage loan origination business, the Company enters into contractual IRLCs to extend credit to finance residential mortgages. To mitigate the effect of the interest rate risk inherent in providing IRLCs from the lock-in date to the funding date of a loan, the Company generally enters into FSLCs. With regard to the Company’s mortgage-backed securities investment activities, the Company usesexposure. These derivative instruments include interest rate swaps and caps entered into to mitigate the effects of majorreduce interest expense costs related to our repurchase agreements, CDOs and our subordinated debentures. The Company’s interest rate swaps are designated as cash flow hedges against the benchmark interest rate risk associated with its short term repurchase agreements. There were no costs incurred at the inception of our interest rate swaps, under which the Company agrees to pay a fixed rate of interest and receive a variable interest rate based on one month LIBOR, on the notional amount of the interest rate swaps. The Company’s interest rate swap notional amounts are based on an amortizing schedule fixed at the start date of the transaction. The Company’s interest rate cap transactions are designated as cashflow hedges against the benchmark interest rate risk associated with the CDOs and the subordinated debentures. The interest rate cap transactions were initiated with an upfront premium that is being amortized over the life of the contract.
The Company documents its risk-management policies, including objectives and strategies, as they relate to its hedging activities, and upon entering into hedging transactions, documents the relationship between the hedging instrument and the hedged liability contemporaneously. The Company assesses, both at inception of a hedge and on an on-going basis, whether or not the hedge is “highly effective” when using the matched term basis.
The Company discontinues hedge accounting on a prospective basis and recognizes changes in the fair value through earnings when: (i) it is determined that the derivative is no longer effective in offsetting cash flows of a hedged item (including forecasted transactions); (ii) it is no longer probable that the forecasted transaction will occur; or (iii) it is determined that designating the derivative as a hedge is no longer appropriate. The Company’s derivative instruments are carried on net investment spread.the Company’s balance sheet at fair value, as assets, if their fair value is positive, or as liabilities, if their fair value is negative. The Company’s derivative instruments are designated as “cash flow hedges,” changes in their fair value are recorded in accumulated other comprehensive income(loss), provided that the hedges are effective. A change in fair value for any ineffective amount of the Company’s derivative instruments would be recognized in earnings. The Company has not recognized any change in the value of its existing derivative instruments through earnings as a result of ineffectiveness of any of its hedges.
The following table summarizespresents the estimated fair value of derivative assetsinstruments and liabilities as oftheir location in the Company’s consolidated balance sheets at December 31, 20062009 and December 31, 20052008 respectively (dollar amounts in thousands):
| | | December 31, 2006 | | December 31, 2005 | |
Derivative Assets: | | | | | |
| Continuing Operation: | | | | | |
| Interest rate caps | | $ | 1,045 | | $ | 2,163 | |
| Interest rate swaps | | | 621 | | | 6,383 | |
Total derivative assets, continuing operations | | | 1,666 | | | 8,546 | |
| | | | | | | | |
| Discontinued Operation: | | | | | | | |
| Interest rate caps | | | 966 | | | 1,177 | |
| Forward loan sale contracts - loan commitments | | | 48 | | | — | |
| Forward loan sale contracts - mortgage loans held for sale | | | 39 | | | — | |
| Forward loan sale contracts - TBA securities | | | 84 | | | — | |
| Interest rate lock commitments - loan commitments | | | — | | | 123 | |
Total derivative assets, discontinued operation | | | 1,137 | | | 1,300 | |
| | | | | | | | |
Total derivative assets | | $ | 2,803 | | $ | 9,846 | |
| | | | | | | | |
Derivative liabilities: | | | | | | | |
| Discontinued Operation: | | | | | | | |
| Forward loan sale contracts - loan commitments | | $ | — | | $ | (38 | ) |
| Forward loan sale contracts - mortgage loans held for sale | | | — | | | (18 | ) |
| Forward loan sale contracts - TBA securities | | | — | | | (324 | ) |
| Interest rate lock commitments - loan commitments | | | (118 | ) | | — | |
| Interest rate lock commitments - mortgage loans held for sale | | | (98 | ) | | (14 | ) |
Total derivative liabilities, discontinued operation | | $ | (216 | ) | $ | (394 | ) |
| Derivative Designated as Hedging | | Balance Sheet Location | | December 31, 2009 | | | December 31, 2008 | |
| Interest Rate Caps | | Derivative Assets | | $ | 4 | | | $ | 22 | |
| Interest Rate Swaps | | Derivative Liabilities | | | 2,511 | | | | 4,194 | |
The notional amountsfollowing table presents the impact of the Company’s interest rate swaps, interest rate caps and forward loan sales contracts as ofderivative instruments on the Company’s accumulated other comprehensive income(loss) for the twelve months ended December 31, 2006 were $285.0 million, $1.5 billion and $142.1 million, respectively2009 (dollar amounts in thousands):
The notional amounts of the Company’s interest rate swaps, interest rate caps and forward loan sales contracts as of December 31, 2005 were $645.0 million, $1.9 billion and $51.8 million, respectively.| | | Twelve Months Ended | |
| Derivative Designated as Hedging Instruments | | December 31, 2009 | |
| Accumulated other comprehensive income(loss) for derivative instruments: | | | |
| Balance at beginning of the period | | $ | (5,560 | ) |
| Unrealized gain on interest rate caps | | | 974 | |
| Unrealized gain (loss) on interest rate swaps | | | 1,682 | |
| Reclassification adjustment for net gains(losses) included in net income for hedges | | | — | |
| Balance at end of the period | | $ | (2,904 | ) |
The Company estimates that over the next twelve12 months, approximately $1.6$2.2 million of the net unrealized gainslosses on the interest rate swaps will be reclassified from accumulated OCIother comprehensive income/(loss) into earnings.
The following table details the impact of the Company’s interest rate swaps and interest rate caps included in interest expense for the year ended December 31, 2009 (dollar amounts in thousands):
| | | Twelve Months Ended | |
| | | December 31, 2009 | |
| Interest Rate Caps: | | | |
| Interest expense-investment securities and loans held in securitization trusts | | $ | 637 | |
| Interest expense-subordinated debentures | | | 353 | |
| Interest Rate Swaps: | | | | |
| Interest expense-investment securities and loans held in securitization trusts | | | 3,228 | |
Interest Rate Swaps - The Company is required to pledge assets under a bi-lateral margin arrangement, including either cash or Agency RMBS, as collateral for its interest rate swaps, whose collateral requirements vary by counterparty and change over time based on the market value, notional amount, and remaining term of the interest rate swap (“Swap”). In the event the Company is unable to meet a margin call under one of its Swap agreements, thereby causing an event of default or triggering an early termination event under one of its Swap agreements, the counterparty to such agreement may have the option to terminate all of such counterparty’s outstanding Swap transactions with the Company. In addition, under this scenario, any close-out amount due to the counterparty upon termination of the counterparty’s transactions would be immediately payable by the Company pursuant to the applicable agreement. The Company believes it was in compliance with all margin requirements under its Swap agreements as of December 31, 2009 and December 31, 2008. The Company had $2.9 million and $4.2 million of restricted cash related to margin posted for Swaps as of December 31, 2009 and December 31, 2008, respectively.
The use of interest rate swaps exposes the Company to counterparty credit risks in the event of a default by a Swap counterparty. If a counterparty defaults under the applicable Swap agreement the Company may be unable to collect payments to which it is entitled under its Swap agreements, and may have difficulty collecting the assets it pledged as collateral against such Swaps. The Company currently has in place with all outstanding Swap counterparties bi-lateral margin agreements thereby requiring a party to post collateral to the Company for any valuation deficit. This arrangement is intended to limit the Company’s exposure to losses in the event of a counterparty default.
The following table presents information about the Company’s interest rate swaps as of December 31, 2009 (dollar amounts in thousands):
| | | December 31, 2009 | |
Maturity (1) | | Notional Amount | | Weighted Average Fixed Pay Interest Rate | |
| Within 30 Days | | $ | 2,070 | | 2.99 | % |
| Over 30 days to 3 months | | | 3,700 | | 2.99 | |
| Over 3 months to 6 months | | | 8,330 | | 2.99 | |
| Over 6 months to 12 months | | | 34,540 | | 2.98 | |
| Over 12 months to 24 months | | | 34,070 | | 3.00 | |
| Over 24 months to 36 months | | | 16,380 | | 3.01 | |
| Over 36 months to 48 months | | | 8,380 | | 2.93 | |
| Over 48 months | | | — | | — | |
| Total | | $ | 107,470 | | 2.99 | % |
8.
(1) | The Company enters into scheduled amortizing interest rate swap transactions whereby the Company pays a fixed rate of interest and receives one month LIBOR. |
Interest Rate Caps – Interest rate caps are designated by the Company as cash flow hedges against interest rate risk associated with the Company’s CDOs and the subordinated debentures. The interest rate caps associated with the CDOs are amortizing contractual notional schedules determined at origination. The Company had $364.5 million and $456.9 million of interest rate caps outstanding as of December 31, 2009 and December 31, 2008, respectively. These interest rate caps are utilized to cap the interest rate on the CDOs at a fixed-rate when one month LIBOR exceeds a predetermined rate. In addition, the Company has an interest rate cap contract on $25.0 million of subordinated debentures that effectively caps three month LIBOR at 3.75% until March 31, 2010.
| 5. | Financing Arrangements, Portfolio Investments |
The Company has entered into repurchase agreements with third party financial institutions to finance its residential mortgage-backed securities and mortgage loans held in the securitization trusts.RMBS portfolio. The repurchase agreements are short-term borrowings that bear interest rates typically based on a spread to LIBOR, and are secured by the residential mortgage-backed securities and mortgage loans held in the securitization trustsRMBS which they finance. At December 31, 2006,2009, the Company had repurchase agreements with an outstanding balance of $815.3$85.1 million and a weighted average interest rate of 5.37%0.27%. As of December 31, 2005,2008, the Company had repurchase agreements with an outstanding balance of $1.2 billion$402.3 million and a weighted average interest rate of 4.37%2.62%. At December 31, 20062009 and 2005December 31, 2008, securities and mortgage loans pledged as collateral for repurchase agreements had estimated fair values and carrying values of $850.6$91.1 million and $1.2 billion,$456.5 million, respectively. All outstanding borrowings under our repurchase agreements mature within 24 days. As of December 31, 2006 all of2009, the repurchase agreements will mature within 30 days, with weighted average days to maturity equal to 21for borrowings under the Company’s repurchase agreements was 22 days. The Company has available to it $5.1 billion in commitments to provide financings through such arrangements with 23 different counterparties.
The follow table summarizes outstanding repurchase agreement borrowings secured by portfolio investments as of December 31, 20062009 and December 31, 2005 (dollars2008 (dollar amounts in thousands):
Repurchase Agreements by Counterparty | |
| | | | | | |
Counterparty Name | | December 31, 2006 | | December 31, 2005 | |
| Citigroup Global Markets Inc. | | $ | — | | $ | 200,000 | |
| Countrywide Securities Corporation | | | 168,217 | | | 109,632 | |
| Credit Suisse First Boston LLC | | | — | | | 148,131 | |
| Deutsche Bank Securities Inc. | | | — | | | 205,233 | |
| Goldman, Sachs & Co. | | | 121,824 | | | — | |
| HSBC | | | — | | | 163,781 | |
| J.P. Morgan Securities Inc. | | | 33,631 | | | 37,481 | |
| Nomura Securities International, Inc. | | | 156,352 | | | — | |
| SocGen/SG Americas Securities | | | 87,995 | | | — | |
| WaMu Capital Corp | | | — | | | 158,457 | |
| West LB | | | 247,294 | | | 143,784 | |
Total Financing Arrangements, Portfolio Investments | | $ | 815,313 | | $ | 1,166,499 | |
| Repurchase Agreements by Counterparty | |
| | | | | | | |
| Counterparty Name | | December 31, 2009 | | | December 31, 2008 | |
| AVM, L.P. | | $ | — | | | $ | 54,911 | |
| Cantor Fitzgerald | | | 9,643 | | | | — | |
| Credit Suisse First Boston LLC | | | 20,477 | | | | 97,781 | |
| Enterprise Bank of Florida | | | — | | | | 19,409 | |
| HSBC | | | — | | | | 42,120 | |
| Jefferies & Company, Inc. | | | 17,764 | | | | — | |
| MF Global | | | — | | | | 30,272 | |
| RBS Greenwich Capital | | | 22,962 | | | | 157,836 | |
| South Street Securities LLC | | | 14,260 | | | | — | |
| Total Financing Arrangements, Portfolio Investments | | $ | 85,106 | | | $ | 402,329 | |
As of December 31, 2009, our Agency ARM RMBS are financed with $85.1 million of repurchase agreement funding with an advance rate of 94% that implies a haircut of 6%.
In the event we are unable to obtain sufficient short-term financing through repurchase agreements or otherwise, or our lenders start to require additional collateral, we may have to liquidate our investment securities at a disadvantageous time, which could result in losses. Any losses resulting from the disposition of our investment securities in this manner could have a material adverse effect on our operating results and net profitability.
As of December 31, 2009, the Company had $24.5 million in cash and $85.6 million in unencumbered securities, including $25.2 million in Agency RMBS, to meet additional haircut or market valuation requirements.
9.
| Financing Arrangements, Mortgage Loans Held for Sale/for Investment
|
Financing arrangements secured by mortgage loans held for sale or for investment consist of the following as of December 31, 2006, and December 31, 2005 (dollar amounts in thousands):
| | | December 31, 2006 | | December 31, 2005 | |
| $250 million master repurchase agreement with Greenwich Capital expired on February 4, 2007 bearing interest at one-month LIBOR plus spreads from 0.75% to 1.25% (5.137% at December 31, 2005). Principal repayments are required 120 days from the funding date. (a) | | $ | — | | $ | 81,577 | (c) |
| $200 million master repurchase agreement with CSFB expiring on June 29, 2007 bearing interest at daily LIBOR plus spreads from 0.75% to 2.000% depending on collateral (6.36% at December 31, 2006 and 5.28% at December 31, 2005). Principal repayments are required 90 days from the funding date | | | 106,801 | | | 143,609 | |
| $300 million master repurchase agreement with Deutche Bank Structured Products, Inc. expiring on March 26, 2007 bearing interest at 1 month LIBOR plus spreads from 0.625% to 1.25% depending on collateral (6.0% at December 31, 2006). Principal payments are due 120 days from the repurchase date. (b) | | | 66,171 | | | | |
| Total Financing Arrangements | | $ | 172,972 | | $ | 225,186 | |
| (a) | Management did not seek renewal of this facility which expired February 4, 2007. |
| | |
| (b) | The line was paid in full and mutually terminated on March 26, 2007. |
| 6. | (c) | Includes $3,969 of warehouse financing not related to discontinued operations. |
The lines of credit are secured by all of the mortgage loans held by the Company, except for the loans held in the securitization trusts. The lines contain various covenants pertaining to, among other things, maintenance of certain amounts of net worth, periodic income thresholds and working capital. As of December 31, 2006, the Company was in compliance with all covenants with the exception of the net income covenant on the CSFB, Greenwich and Deutche Bank facilities and waivers have been obtained from these institutions. As these annual agreements are negotiated for renewal, these covenants may be further modified. The agreements are each renewable annually, but are not committed, meaning that the counterparties to the agreements may withdraw access to the credit facilities at any time.
10.
| Collateralized Debt Obligations |
The Company’s CDOs, which are recorded as liabilities on the Company’s balance sheet, are secured by ARM loans pledged as collateral. The ARM loanscollateral, which are recorded as an assetassets of the Company and the CDOs are recorded as the Company’s debt. The CDO transaction includes an amortizing interest rate cap contract with a notional amount of $187.5 million as of December 31, 2006 and a notional amount of $230.6 million as of December 31, 2005, which is recorded as an asset of the Company. The interest rate cap limits interest rate exposure on these transactions. As of December 31, 20062009 and December 31, 2005,2008, the Company had CDOs outstanding $197.4of $266.8 million and $228.2$335.6 million, respectively. As of December 31, 20062009 and December 31, 20052008, the current weighted average interest rate on these CDOSCDOs was 5.72%0.61% and 4.74%0.85%, respectively. The CDOs are collateralized by ARM loans with a principal balance of $204.6$277.7 million and $235.0$347.5 million at December 31, 20062009 and December 31, 2005,2008, respectively. The Company retained the owner trust certificates, or residual interest for three securitizations, and, as of December 31, 2009 and December 31, 2008, had a net investment in the securitizations trusts of $10.0 million and $12.7 million, respectively.
The CDO transactions include amortizing interest rate cap contracts with an aggregate notional amount of $182.2 million as of December 31, 2009 and an aggregate notional amount of $204.3 million as of December 31, 2008, which are recorded as an asset of the Company. The interest rate caps are carried at fair value and totaled $4,476 as of December 31, 2009 and $18,575 as of December 31, 2008, respectively. The interest rate caps reduce interest rate exposure on these transactions.
11.
7. | Subordinated Debentures (Net) |
The follow table summarizes outstanding repurchase agreement borrowings secured by portfolio investments as of December 31, 2009 and December 31, 2008 (dollar amounts in thousands):
| | | December 31, | |
| | | 2009 | | | 2008 | |
| Subordinated debentures | | $ | 45,000 | | | $ | 45,000 | |
| Less: unamortized bond issuance costs | | | (108 | ) | | | (382 | ) |
| Subordinated debentures (net) | | $ | 44,892 | | | $ | 44,618 | |
On September 1, 2005 the Company closed a private placement of $20.0 million of trust preferred securities to Taberna Preferred Funding II, Ltd., a pooled investment vehicle. The securities were issued by NYM Preferred Trust II and are fully guaranteed by the Company with respect to distributions and amounts payable upon liquidation, redemption or repayment. These securities have a fixed interest rate equal to 8.35% up to and including July 30, 2010, at which point the interest rate is converted to a floating rate equal to one-monththree-month LIBOR plus 3.95% until maturity. The securities mature on October 30, 2035 and may be called at par by the Company any time after October 30, 2010. In accordance with the guidelines of SFAS No. 150 “Accounting for Certain Financial Instruments with Characteristics of both Liabilities and Equity”, the issuedThe preferred stock of NYM Preferred Trust II has been classified as subordinated debentures in the liability section of the Company’s consolidated balance sheet.
On March 15, 2005 the Company closed a private placement of $25.0 million of trust preferred securities to Taberna Preferred Funding I, Ltd., a pooled investment vehicle. The securities were issued by NYM Preferred Trust I and are fully guaranteed by the Company with respect to distributions and amounts payable upon liquidation, redemption or repayment. These securities have a floating interest rate equal to three-month LIBOR plus 3.75%, resetting quarterly (9.12%(4.00% at December 31, 20062009 and 7.77%5.22% at December 31, 2005)2008). The securities mature on March 15, 2035 and may be called at par by the Company any time after March 15, 2010. NYMCHC entered into an interest rate cap agreement to limit the maximum interest rate cost of the trust preferred securities to 7.5%. The term of the interest rate cap agreement is five years and resets quarterly in conjunction with the reset periods of the trust preferred securities. The interest rate cap agreement is accounted for as a cash flow hedge transaction in accordance with SFAS No.133. In accordance with the guidelines of SFAS No. 150 “Accounting for Certain Financial Instruments with Characteristics of both Liabilities and Equity”, the issuedtransaction. The preferred stock of NYM Preferred Trust I has been classified as subordinated debentures in the liability section of the Company’s consolidated balance sheet.
As of March 5, 2010, the Company has not been notified, and is not aware, of any event of default under the covenants for the subordinated debentures.
12.8. | Discontinued Operation |
In connection with the sale of our wholesale mortgage origination platform assets on February 22, 2007 andduring the sale of our retail mortgage lending platform onquarter ended March 31, 2007, during the fourth quarter of 2006, we classified our Mortgage Lendingmortgage lending segment as a discontinued operation in accordance with the provisions of Statement of Financial Accounting Standards No. 144.operation. As a result, we have reported revenues and expenses related to the segment as a discontinued operation and the related assets and liabilities as assets and liabilities related to a discontinued operation for all periods presented in the accompanying consolidated financial statements. Certain assets, such as the deferred tax asset, and certain liabilities, such as subordinated debt and liabilities related to leasedlease facilities not assigned to Indymac will becomesold, are part of theour ongoing operations of NYMT and accordingly, we have not included these items as part of the discontinued operation in accordance with the provisions of SFAS No. 144.operation.
Balance Sheet Data
The components of Assetsassets related to the discontinued operation as of December 31, 20062009 and 2005December 31, 2008 are as follows (dollar amounts in thousands):
| | | December 31, | |
| | | 2009 | | | 2008 | |
| Accounts and accrued interest receivable | | $ | 18 | | | $ | 26 | |
| Mortgage loans held for sale (net) | | | 3,841 | | | | 5,377 | |
| Prepaid and other assets | | | 358 | | | | 451 | |
| Total assets | | $ | 4,217 | | | $ | 5,854 | |
| | | December 31, 2006 | | December 31, 2005 | |
| Restricted cash | | $ | 1,065 | | $ | 519 | |
| Due from loan purchasers | | | 88,351 | | | 121,813 | |
| Escrow deposits-pending loan closings | | | 3,814 | | | 1,434 | |
| Accounts and accrued interest receivable | | | 2,488 | | | 4,966 | |
| Mortgage loans held for sale (see note 3) | | | 106,900 | | | 108,271 | |
| Prepaid and other assets | | | 4,654 | | | 3,686 | |
| Derivative assets | | | 1,137 | | | 1,300 | |
| Property and equipment, net (see note 6) | | | 6,516 | | | 6,882 | |
| | | $ | 214,925 | | $ | 248,871 | |
The components of Liabilitiesliabilities related to the discontinued operation as of December 31, 20062009 and 20052008 are as follows (dollar amounts in thousands):
| | | December 31, 2006 | | December 31, 2005 | |
| Financing arrangements, loans held for sale /for investment (see note 9) | | $ | 172,972 | | $ | 221,217 | |
| Due to loan purchasers | | | 8,334 | | | 1,762 | |
| Accounts payable and accrued expenses | | | 6,348 | | | 8,163 | |
| Derivative liabilities (see note 7) | | | 216 | | | 394 | |
| Other liabilities | | | 117 | | | 389 | |
| | | $ | 187,987 | | $ | 231,925 | |
| | December 31, | |
| | 2009 | | 2008 | |
| Due to loan purchasers | $ | 342 | | | $ | 708 | |
| Accounts payable and accrued expenses | | 1,436 | | | | 2,858 | |
| Total liabilities | $ | 1,778 | | | $ | 3,566 | |
Statements of Operations Data
The combined resultsstatements of operations of the assets and liabilities related to the discontinued operation for the years ended December 31, 2006, 20052009, 2008 and 20042007 are as follows (dollar(dollar amounts in thousands):
| | | For the Year Ended December 31, | |
| | | 2009 | | | 2008 | | | 2007 | |
| Revenues | | $ | 1,242 | | | $ | 1,495 | | | $ | 1,376 | |
| Expenses | | | 456 | | | | (162 | ) | | | 35,854 | |
| Income (loss) from discontinued operations – net of tax | | $ | 786 | | | $ | 1,657 | | | $ | (34,478 | ) |
| | | | |
| | | For the Year Ended December 31, | |
| | | 2006 | | 2005 | | 2004 | |
| REVENUES: | | | | | | | |
| Net interest income | | $ | 3,524 | | $ | 4,499 | | $ | 3,362 | |
| Gain on sale of mortgage loans | | | 17,987 | | | 26,783 | | | 20,835 | |
| Loan losses | | | (8,228 | ) | | — | | | — | |
| Brokered loan fees | | | 10,937 | | | 9,991 | | | 6,895 | |
| Other (expense) income | | | (294) | | | 231 | | | 834 | |
| Total net revenues | | | 23,926 | | | 41,504 | | | 31,926 | |
| EXPENSES: | | | | | | | | | | |
| Salaries, commissions and benefits | | | 21,711 | | | 29,045 | | | 16,736 | |
| Brokered loan expenses | | | 8,277 | | | 7,543 | | | 5,276 | |
| Occupancy and equipment | | | 5,077 | | | 6,076 | | | 3,107 | |
| General and administrative | | | 14,552 | | | 16,051 | | | 10,018 | |
| Total expenses | | | 49,617 | | | 58,715 | | | 35,137 | |
| (LOSS)/INCOME BEFORE INCOME TAX BENEFIT | | | (25,691 | ) | | (17,211 | ) | | (3,211 | ) |
| Income tax benefit | | | 8,494 | | | 8,549 | | | 1,259 | |
| NET (LOSS)/INCOME | | $ | (17,197 | ) | $ | (8,662 | ) | $ | (1,952 | ) |
13.
9. | Commitments and Contingencies |
Loans Sold to Investors -- The For loans originated and sold by our discontinued mortgage lending business, the Company is not exposed to long term credit risk on its loans sold to investors.risk. In the normal course of business, however, the Company is obligated to repurchase loans based on violations of representations and warranties in the sale agreement, or early payment defaults.
Loans Funding and Delivery Commitments - At The Company did not repurchase any loans during the year ended December 31, 20062009.
The Company periodically receives repurchase requests based on alleged violations of representations and warranties, each of which management reviews to determine, based on management’s experience, whether such requests may reasonably be deemed to have merit. As of December 31, 20052009, we had a total of $2.0 million of unresolved repurchase requests that management concluded may reasonably be deemed to have merit, against which the Company had commitments to fund loanshas a reserve of approximately $0.3 million. The reserve is based on one or more of the following factors; historical settlement rates, property value securing the loan in question and specific settlement discussions with agreed-upon rates totaling $104.3 million and $130.3 million, respectively. The Company hedges the interest rate risk of such commitments and the recorded mortgage loans held for sale balances primarily with FSLCs, which totaled $142.1 million and $51.8 million at December 31, 2006 and December 31, 2005, respectively. The remaining commitments to fund loans with agreed-upon rates are anticipated to be sold through optional delivery contract investor programs. The Company does not anticipate any material losses from such sales.third parties.
Outstanding Litigation- The Company is involved in litigationat times subject to various legal proceedings arising in the normalordinary course of business. Although the amountAs of any ultimate liability arising from these matters cannot presently be determined,December 31, 2009, the Company does not anticipatebelieve that any such liabilityof its current legal proceedings, individually or in the aggregate, will have a material adverse effect on its consolidatedoperations, financial statements.condition or cash flows.
Leases- The Company leases its corporate offices and certain retail facilitiesoffice and equipment under short-term lease agreements expiring at various dates through 2013. All such leases are accounted for as operating leases. Total rentallease expense for property and equipment amounted to $4.8 million, $4.6$0.2 million and $3.3$0.4 million for the years ended December 31, 2006, 20052009 and 2004,December 31, 2008, respectively. On February 11, 2005, the
Letters of Credit – The Company signedmaintains a letter of intent to enter into a sub-lease for its former headquarters space at 304 Park Avenue in New York. The Company’s remaining contractual obligation to the landlord on this lease is $1.8 million. The sub-lease tenant will have a contractual rent obligation to the Company under the sub-lease of $1.0 million. This transaction was completed in late March 2005. Accordingly, during the first quarter of 2005, the Company recognized a charge of $0.8 million to earnings.
On November 13, 2006 the Company entered into an Assignment and Assumption of Sublease and an Escrow Agreement, each with Lehman Brothers Holdings Inc. (“Lehman”) (collectively, the “Agreements”). Under the Agreements, the Company assigned and Lehman has assumed the sublease for the Company’s corporate headquarters at 1301 Avenue of the Americas. Pursuant to the Agreements, Lehman will fund an escrow accountcredit in the amount of $3.0$0.2 million in lieu of a cash security deposit for the benefit of NYMC. Pending the consent of the landlord to the assignment, the full escrow amount will be released to the Company if it vacates the leased space on or before May 1, 2007. For each month beginning in May 2007 that the Company remains in occupation of the leased space, the escrow amount payable to NYMC will be reduced by $200,000. The Company intends to relocate its current corporate headquarters, tolocated at 52 Vanderbilt Avenue in New York City, for its landlord, Vanderbilt Associates I, L.L.C, as beneficiary. This letter of credit is secured by cash deposited in a smaller facilitybank account maintained at a location that is yet to be determined.JP Morgan Chase bank.
As of December 31, 20062009 obligations under non-cancelable operating leases that have an initial term of more than one year are as follows (dollar amounts in thousands):
Year Ending December 31, | | Continuing operations | | Discontinued operation | | Total | |
| 2007 | | $ | 2,550 | | $ | 2,761 | | $ | 5,311 | |
| 2008 | | | 2,468 | | | 1,985 | | | 4,453 | |
| 2009 | | | 2,440 | | | 1,041 | | | 3,481 | |
| 2010 | | | 2,377 | | | 637 | | | 3,014 | |
| 2011 | | | — | | | 294 | | | 294 | |
| Thereafter | | | — | | | 357 | | | 357 | |
| | | $ | 9,835 | | $ | 7,075 | | $ | 16,910 | |
| Year Ending December 31, | | Total | |
| 2010 | | $ | 190 | |
| 2011 | | | 193 | |
| 2012 | | | 198 | |
| 2013 | | | 67 | |
| | | $ | 648 | |
Letters of Credit - NYMC maintains a letter of credit in the amount of $100,000 in lieu of a cash security deposit for an office lease dated June 1998 for the Company’s former headquarters located at 304 Park Avenue South in New York City. The sole beneficiary of this letter of credit is the owner of the building, 304 Park Avenue South LLC. This letter of credit is secured by cash deposited in a bank account maintained at Signature Bank.
Subsequent to the move to a new headquarters location in New York City in July 2003, in lieu of a cash security deposit for the office lease we entered into an irrevocable transferable letter of credit in the amount of $313,000 with PricewaterhouseCoopers, LLP (sublandlord),as beneficiary. This letter of credit is secured by cash deposited in a bank account maintained at HSBC bank.
14.
10. | Related Party Transactions
Concentrations of Credit Risk |
Upon completion of the Company’s IPO and acquisition of NYMC, Steven B. Schnall and Joseph V. Fierro, the former owners of NYMC, were entitled to a distribution of NYMC’s retained earnings through the close of the Company’s IPO on June 29, 2004, not to exceed $4.5 million. As a result, a distribution of $2.4 million ($0.4 million of retained earnings as of March 31, 2004 plus an estimate of $2.0 million for NYMC’s earnings through June 29, 2004) was made to the former owners upon the close of the IPO. The subsequent earnings and elimination of distributions and unrealized gains and losses attributable to NYMC for the period prior to June 29, 2004 equated to a distribution overpayment of $1.3 million, for which Messrs. Schnall and Fierro reimbursed the Company immediately upon the finalization of the overpayment calculation in July 2004.
Steven B. Schnall owns a 48% membership interest and Joseph V. Fierro owns a 12% membership interest in Centurion Abstract, LLC (“Centurion”), which provides title insurance brokerage services for certain title insurance providers. From time to time, NYMC refers its mortgage loan borrowers to Centurion for assistance in obtaining title insurance in connection with their mortgage loans, although the borrowers have no obligation to utilize Centurion’s services. When NYMC’s borrowers elect to utilize Centurion’s services to obtain title insurance, Centurion collects various fees and a portion of the title insurance premium paid by the borrower for its title insurance. Centurion received $13,323, $0.6 million and $0.6 million in fees and other amounts from NYMC borrowers for the years ended December 31, 2006, December 31, 2005 and December 31, 2004 respectively. NYMC does not economically benefit from such referrals.
15.
| Concentrations of Credit Risk
|
The Company has originated loans predominantly in the eastern United States. Loan concentrations are considered to exist when there are amounts loaned to a multiple number of borrowers with similar characteristics, which would cause their ability to meet contractual obligations to be similarly impacted by economic or other conditions. At December 31, 2006 and December 31, 2005,2009, there were geographic concentrations of credit risk exceeding 5% of the total loan balances within mortgage loans held for sale as follows:
| | | December 31, 2006 | | December 31, 2005 | |
| New York | | | 20.9 | % | | 43.0 | % |
| Massachusetts | | | 17.5 | % | | 17.8 | % |
| New Jersey | | | 12.3 | % | | 5.1 | % |
| Connecticut | | | 7.5 | % | | 5.8 | % |
| Florida | | | 6.8 | % | | 9.7 | % |
in the securitization trusts. At December 31, 2006 and December 31, 2005,2008, there were geographic concentrations of credit risk exceeding 5% of the total loan balances within mortgage loans held in the securitization trusts and mortgage loans held for investmentretained interests in our REMIC securitization, NYMT 2006-1. The Company sold all the retained interests related to NYMT 2006-1 during the quarter ended September 30, 2009. At December 31, 2009 and December 31, 2008, the geographic concentrations of credit risk exceeding 5% are as follows:
| | | | December 31, | |
| | | December 31, 2006 | | December 31, 2005 | | | 2009 | | | 2008 | |
| New York | | | 26.2 | % | | 32.7 | % | | | 38.9 | % | | | 30.7 | % |
| Massachusetts | | | 14.4 | % | | 19.4 | % | | | 24.3 | % | | | 17.2 | % |
| California | | | 6.8 | % | | 14.1 | % | |
| New Jersey | | | 4.2 | % | | 5.8 | % | | | 8.5 | % | | | 6.0 | % |
| Florida | | | 4.2 | % | | 5.4 | % | | | 5.7 | % | | | 7.8 | % |
16.
11. | Fair Value of Financial Instruments |
The Company has established and documented processes for determining fair values. Fair value estimatesis based upon quoted market prices, where available. If listed prices or quotes are made as of a specific point in time based on estimates using market quotes, present value or other valuation techniques. These techniques involve uncertainties and are significantly affected by the assumptions used and the judgments made regarding risk characteristics of various financial instruments, discount rates, estimates of future cash flows, future expected loss experience, and other factors.
Changes in assumptions could significantly affect these estimates and the resulting fair values. Derivednot available, then fair value estimates cannot be necessarily substantiated by comparisonis based upon internally developed models that primarily use inputs that are market-based or independently-sourced market parameters, including interest rate yield curves.
A financial instrument’s categorization within the valuation hierarchy is based upon the lowest level of input that is significant to independent markets and,the fair value measurement. The three levels of valuation hierarchy are defined as follows:
Level 1 - inputs to the valuation methodology are quoted prices (unadjusted) for identical assets or liabilities in many cases, could not be necessarily realized in an immediate sale ofactive markets.
Level 2 - inputs to the instrument. Also, because of differences in methodologies and assumptions used to estimate fair values, the Company’s fair values should not be compared to those of other companies.
Fair value estimates are based on existing financial instruments and do not attempt to estimate the value of anticipated future business and the value ofvaluation methodology include quoted prices for similar assets and liabilities in active markets, and inputs that are not considered financial instruments. Accordingly, the aggregate fair value amounts presented below do not represent the underlying value of the Company.
The fair value of certain assets and liabilities approximate cost due to their short-term nature, terms of repayment or interest rates associated withobservable for the asset or liability. Such assetsliability, either directly or liabilities include cash and cash equivalents, escrow deposits, unsettled mortgage loan sales, and financing arrangements. All forward delivery commitments and option contracts to buy securities are to be contractually settled within six monthsindirectly, for substantially the full term of the balance sheet date.financial instrument.
Level 3 - inputs to the valuation methodology are unobservable and significant to the fair value measurement.
The following describes the methods and assumptionsvaluation methodologies used byfor the Company in estimatingCompany’s financial instruments measured at fair valuesvalue, as well as the general classification of other financial instruments:such instruments pursuant to the valuation hierarchy.
a. Investment Securities Available for Sale (RMBS)- Fair value for the RMBS in our portfolio is generally estimated based on marketquoted prices provided by five to seven dealers who make markets in thesesimilar financial instruments. The dealers will incorporate common market pricing methods, including a spread measurement to the Treasury curve or interest rate swap curve as well as underlying characteristics of the particular security including coupon, periodic and life caps, collateral type, rate reset period and seasoning or age of the security. If the fair value ofquoted prices for a security isare not reasonably available from a dealer, the security will be re-classified as a Level 3 security and, as a result, management estimateswill determine the fair value based on characteristics of the security that the Company receives from the issuer and based on available market information. Management reviews all prices used in determining valuation to ensure they represent current market conditions. This review includes surveying similar market transactions, comparisons to interest pricing models as well as offerings of like securities by dealers. The Company's investment securities that are comprised of RMBS are valued based upon readily observable market parameters and are classified as Level 2 fair values.
b. Investment Securities Available for Sale (CLO) - The fair value of the CLO notes, as of December 31, 2009, was based on management’s valuation determined using a discounted future cash flows model that management believes would be used by market participants to value similar financial instruments. If a reliable market for these assets develops in the future, management will consider quoted prices provided by dealers who make markets in similar financial instruments in determining the fair value of the CLO notes. The CLO notes are classified as Level 3 fair values.
c. Interest Rate Swaps and Caps - The fair value of interest rate swaps and caps are based on using market accepted financial models as well as dealer quotes. The model utilizes readily observable market parameters, including treasury rates, interest rate swap spreads and swaption volatility curves. The Company’s interest rate caps and swaps are classified as Level 2 fair values.
The following table presents the Company’s financial instruments measured at fair value on a recurring basis as of December 31, 2009 and December 31, 2008 on the Company’s consolidated balance sheets (dollar amounts in thousands):
| | | Assets Measured at Fair Value on a Recurring Basis at December 31, 2009 | |
| | | Level 1 | | | Level 2 | | | Level 3 | | | Total | |
| Assets carried at fair value: | | | | | | | | | | | | | | | | |
| Investment securities available for sale | | $ | — | | | $ | 159,092 | | | $ | 17,599 | | | $ | 176,691 | |
| Derivative assets (interest rate caps) | | | — | | | | 4 | | | | — | | | | 4 | |
| Total | | $ | — | | | $ | 159,096 | | | $ | 17,599 | | | $ | 176,695 | |
| Liabilities carried at fair value: | | | | | | | | | | | | |
| Derivative liabilities (interest rate swaps) | | $ | — | | | $ | 2,511 | | | $ | — | | | $ | 2,511 | |
| Total | | $ | — | | | $ | 2,511 | | | $ | — | | | $ | 2,511 | |
| | | Assets Measured at Fair Value on a Recurring Basis at December 31, 2008 | |
| | | Level 1 | | | Level 2 | | | Level 3 | | | Total | |
| Assets carried at fair value: | | | | | | | | | | | | | | | | |
| Investment securities available for sale | | $ | — | | | $ | 477,416 | | | $ | — | | | $ | 477,416 | |
| Derivative assets (interest rate caps) | | | — | | | | 22 | | | | — | | | | 22 | |
| Total | | $ | — | | | $ | 477,438 | | | $ | — | | | $ | 477,438 | |
| Liabilities carried at fair value: | | | | | | | | | | | | |
| Derivative liabilities (interest rate swaps) | | $ | — | | | $ | 4,194 | | | $ | — | | | $ | 4,194 | |
| Total | | $ | — | | | $ | 4,194 | | | $ | — | | | $ | 4,194 | |
The following table details changes in valuation for the Level 3 assets for the year ended December 31, 2009 (dollar amounts in thousands):
Level 3 - Investment securities available for sale
| | | Year Ended December 31, 2009 | |
| Beginning Balance | | $ | — | |
| Purchases | | | 8,728 | |
| Total gains (realized/unrealized) | | | | |
| Included in earnings (1) | | | 459 | |
| Included in other comprehensive income(loss) | | | 8,412 | |
| Ending Balance | | $ | 17,599 | |
(1) - - Amounts included in interest income-investment securities and loans held in securitizations trusts.
Any changes to the valuation methodology are reviewed by management to ensure the changes are appropriate. As markets and products develop and the pricing for certain products becomes more transparent, the Company continues to refine its valuation methodologies. The methods described above may produce a fair value calculation that may not be indicative of net realizable value or reflective of future fair values. Furthermore, while the Company believes its valuation methods are appropriate and consistent with other market participants, the use of different methodologies, or assumptions, to determine the fair value of certain financial instruments could result in a different estimate of fair value at the reporting date. The Company uses inputs that are current as of each reporting date, which may include periods of market dislocation, during which time price transparency may be reduced. This condition could cause the Company’s financial instruments to be reclassified from Level 2 to Level 3 in future periods.
The following table presents assets measured at fair value on a non-recurring basis as of December 31, 2009 and December 31, 2008 on the consolidated balance sheet (dollar amounts in thousands):
| | | Assets Measured at Fair Value on a Non-Recurring Basis at December 31, 2009 |
| | | Level 1 | | Level 2 | | Level 3 | | Total |
| Mortgage loans held for sale (net) | | $ | — | | $ | — | | $ | 3,841 | | $ | 3,841 |
| Mortgage loans held in securitization trusts (net) – impaired loans | | | — | | | — | | | 7,090 | | | 7,090 |
| Real estate owned held in securitization trusts | | | — | | | — | | | 546 | | | 546 |
| | | | | | | | | | | | | |
| | | | | | | | | | | | | |
| | | Assets Measured at Fair Value on a Non-Recurring Basis at December 31, 2008 |
| | | Level 1 | | Level 2 | | Level 3 | | Total |
| Mortgage loans held for sale (net) | | $ | — | | $ | — | | $ | 5,377 | | $ | 5,377 |
| Mortgage loans held in securitization trusts (net) – impaired loans | | | — | | | — | | | 2,448 | | | 2,448 |
| Real estate owned held in securitization trusts | | | — | | | — | | | 1,366 | | | 1,366 |
The following table presents losses incurred for assets measured at fair value on a non-recurring basis for the years ended December 31, 2009 and December 31, 2008 on the Company’s consolidated statements of operations (dollar amounts in thousands):
| | | Twelve Months Ended |
| | | December 31, 2009 | | | December 31, 2008 |
| Mortgage loans held for sale (net) | | $ | 245 | | | $ | 433 | |
| Mortgage loans held in securitization trusts (net) – impaired loans | | | 2,192 | | | | 1,188 | |
| Real estate owned held in securitization trusts | | | 70 | | | | 246 | |
Mortgage Loans Held for Sale (net)- Fair –The fair value is estimated using the quoted market prices for securities backed by similar types of loans and current investor or dealer commitments to purchase loans.
c. Mortgage Loans Held for Investment - Mortgagemortgage loans held for investmentsale (net) are recorded at amortized cost. Fair value is estimated using pricing models andby the Company based on the price that would be received if the loans were sold as whole loans taking into consideration the aggregated characteristics of groups ofthe loans such as, but not limited to, collateral type, index, interest rate, margin, length of fixed-ratefixed interest rate period, life time cap, periodic cap, underwriting standards, age and credit estimated using the quoted market prices for securities backed by similar types of loans.credit.
d. Mortgage Loans Held in the Securitization Trusts (net) – Impaired Loans – Impaired mortgage loans held in the securitization trusts are recorded at amortized cost less specific loan loss reserves. Impaired loan value is based on management’s estimate of the net realizable value taking into consideration local market conditions of the distressed property, updated appraisal values of the property and estimated expenses required to remediate the impaired loan.
Real Estate Owned Held in Securitization Trusts – Real estate owned held in the securitization trusts are recorded at net realizable value. Any subsequent adjustment will result in the reduction in carrying value with the corresponding amount charge to earnings. Net realizable value based on an estimate of disposal taking into consideration local market conditions of the distressed property, updated appraisal values of the property and estimated expenses required to sell the property.
The following table presents the carrying value and estimated fair value of the Company’s financial instruments at December 31, 2009 and December 31, 2008 (dollar amounts in thousands):
| | | December 31, 2009 | | | December 31, 2008 | |
| | | Carrying Value | | | Estimated Fair Value | | | Carrying Value | | | Estimated Fair Value | |
| Financial assets: | | | | | | | | | | | | |
| Cash and cash equivalents | | $ | 24,522 | | | $ | 24,522 | | | $ | 9,387 | | | $ | 9,387 | |
| Restricted cash | | | 3,049 | | | | 3,049 | | | | 7,959 | | | | 7,959 | |
| Investment securities – available for sale | | | 176,691 | | | | 176,691 | | | | 477,416 | | | | 477,416 | |
| Mortgage loans held in securitization trusts (net) | | | 276,176 | | | | 253,833 | | | | 346,972 | | | | 341,127 | |
| Derivative assets | | | 4 | | | | 4 | | | | 22 | | | | 22 | |
| Assets related to discontinued operation-mortgage loans held for sale (net) | | | 3,841 | | | | 3,841 | | | | 5,377 | | | | 5,377 | |
| | | | | | | | | | | | | | | | | |
| Financial Liabilities: | | | | | | | | | | | | | | | | |
| Financing arrangements, portfolio investments | | $ | 85,106 | | | $ | 85,106 | | | $ | 402,329 | | | $ | 402,329 | |
| Collateralized debt obligations | | | 266,754 | | | | 211,032 | | | | 335,646 | | | | 199,503 | |
| Derivative liabilities | | | 2,511 | | | | 2,511 | | | | 4,194 | | | | 4,194 | |
| Subordinated debentures (net) | | | 44,892 | | | | 26,563 | | | | 44,618 | | | | 10,049 | |
| Convertible preferred debentures (net) | | | 19,851 | | | | 19,363 | | | | 19,702 | | | | 16,363 | |
In addition to the methodology to determine the fair value of the Company’s financial assets and liabilities reported at fair value on a recurring basis and non-recurring basis, as previously described, the following methods and assumptions were used by the Company in arriving at the fair value of the Company’s other financial instruments in the following table:
a. Cash and cash equivalents and restricted cash: Estimated fair value approximates the carrying value of such assets.
b. Mortgage Loans Held in Securitization Trusts (net) -Mortgage loans held in the securitization trusts are recorded at amortized cost. Fair value is estimated using pricing models and taking into consideration the aggregated characteristics of groups of loans such as, but not limited to, collateral type, index, interest rate, margin, length of fixed-rate period, life cap, periodic cap, underwriting standards, age and credit estimated using the quotedestimated market prices for securities backed by similar types of loans.
e. Interest Rate Swaps and Caps - The fair value of interest rate swaps and caps is based on using market accepted financial models as well as dealer quotes.
f. Interest Rate Lock Commitments - The fair value of IRLCs is estimated using the fees and rates currently charged to enter into similar agreements, taking into account the remaining terms of the agreements and the present creditworthiness of the counterparties. For fixed rate loan commitments, fair value also considers the difference between current levels of interest rates and the committed rates. The fair value of IRLCs is determined in accordance with SAB 105.
g. c. Financing arrangements, portfolio investments –Forward Sale Loan Contracts - The fair value of these instrumentsfinancing arrangements approximates cost as they are short term in nature and mature in 30 days.
d. Collateralized debt obligations – The fair value of these CDOs is estimatedbased on discounted cashflows as well as market pricing on comparable obligations.
e. Subordinated debentures (net) – The fair value of these subordinated debentures (net) is based on discounted cashflows using currentmanagement’s estimate for market pricesyields.
f. Convertible preferred debentures (net) – The fair value of the convertible preferred debentures (net) is based on discounted cashflows using management’s estimate for dealer or investor commitments relative to the Company’s existing positions.market yields.
The following tables set forth information about financial instruments, except for those noted above for which the carrying amount approximates fair value (dollar amounts in thousands):
| | | December 31, 2006 | |
| | | Notional Amount | | Carrying Amount | | Estimated Fair Value | |
Continuing Operations: | | | | | | | |
| Investment securities available for sale | | $ | 491,293 | | $ | 488,962 | | $ | 488,962 | |
| Mortgage loans held in the securitization trusts | | | 584,358 | | | 588,160 | | | 582,504 | |
| Commitments and contingencies: | | | | | | | | | | |
| Interest rate swaps | | | 285,000 | | | 621 | | | 621 | |
| Interest rate caps | | | 1,514,744 | | | 1,045 | | | 1,045 | |
| | | | | | | | | | | |
Discontinued Operation: | | | | | | | | | | |
| Mortgage loans held for sale | | | 110,804 | | | 106,900 | | | 107,810 | |
| Commitments and contingencies: | | | | | | | | | | |
| Interest rate lock commitments - loan commitments | | | 104,334 | | | (118 | ) | | (118 | ) |
| Interest rate lock commitments - mortgage loans held for sale | | | 106,312 | | | (98 | ) | | (98 | ) |
| Forward loan sales contracts | | | 142,110 | | | 171 | | | 171 | |
| Interest rate caps | | $ | 25,774 | | $ | 966 | | $ | 966 | |
| | | December 31, 2005 | |
| | | Notional Amount | | Carrying Amount | | Estimated Fair Value | |
Continuing Operations: | | | | | | | |
| Investment securities available for sale | | $ | 719,701 | | $ | 716,482 | | $ | 716,482 | |
| Mortgage loans held for investment | | | 4,054 | | | 4,060 | | | 4,079 | |
| Mortgage loans held in the securitization trusts | | | 771,451 | | | 776,610 | | | 775,311 | |
| Commitments and contingencies: | | | | | | | | | | |
| Interest rate swaps | | | 645,000 | | | 6,383 | | | 6,383 | |
| Interest rate caps | | | 1,833,086 | | | 2,163 | | | 2,163 | |
| | | | | | | | | | | |
Discontinued Operation: | | | | | | | | | | |
| Mortgage loans held for sale | | | 108,244 | | | 108,271 | | | 109,252 | |
| Commitments and contingencies: | | | | | | | | | | |
| Interest rate lock commitments - loan commitments | | | 130,320 | | | 123 | | | 123 | |
| Interest rate lock commitments - mortgage loans held for sale | | | 108,109 | | | (14 | ) | | (14 | ) |
| Forward loan sales contracts | | | 51,763 | | | (380 | ) | | (380 | ) |
| Interest rate caps | | $ | 25,774 | | $ | 1,177 | | $ | 1,177 | |
NYMT and its taxable subsidiary, NYMC, were S corporations prior to June 29, 2004 pursuant to the Internal Revenue Code of 1986, as amended, and as such did not incur any federal income tax expense. On June 29, 2004, NYMC became a C corporation for federal and state income tax purposes and, as such, is subject to federal and state income tax on its taxable income for periods after June 29, 2004.
A reconciliation of the statutory income tax provision (benefit) to the effective income tax provision for the years ended December 31, 20062009, 2008 and December 31, 2005, is2007, are as follows (dollar amounts in thousands).
| | | December 31, 2006 | | December 31, 2005 | |
| Benefit at statutory rate (35%) | | $ | (8,234 | ) | $ | (4,861 | ) |
| Non-taxable REIT loss | | | (1,891 | ) | | (2,038 | ) |
| Transfer pricing of loans sold to nontaxable parent | | | 11 | | | 555 | |
| State and local tax benefit | | | (2,663 | ) | | (1,731 | ) |
| Valuation allowance | | | 4,269 | | | — | |
| Miscellaneous | | | 14 | | | (21 | ) |
| Change in tax status | | | — | | | (453 | ) |
| Total benefit | | $ | (8,494 | ) | $ | (8,549 | ) |
| | | December 31, | |
| | | 2009 | | | 2008 | | | 2007 | |
| (Benefit) provision at statutory rate | | $ | 3,546 | | | | (35.0 | )% | | $ | (8,438 | ) | | | (35.0 | )% | | $ | (9,830 | ) | | | (35.0 | )% |
| Non-taxable REIT income (loss) | | | (3,008 | ) | | | 30.0 | % | | | 7,598 | | | | 31.5 | % | | | 3,008 | | | | 10.7 | % |
| State and local tax provision (benefit) | | | 142 | | | | (1.0 | )% | | | (221 | ) | | | (0.9 | )% | | | (1,797 | ) | | | (6.4 | )% |
| Valuation allowance | | | (680 | ) | | | 6.0 | % | | | 572 | | | | 2.4 | % | | | 26,962 | | | | 96.0 | % |
| Miscellaneous | | | — | | | | — | % | | | 489 | | | | 2.0 | % | | | 9 | | | | 0.0 | % |
| Total provision | | $ | — | | | | — | % | | $ | — | | | | — | % | | $ | 18,352 | | | | 65.3 | % |
The income tax benefitprovision for the year ended December 31, 20062009 (included in discontinued operations - see note 8) is comprised of the following components (dollar amounts in thousands):
| | | Deferred | |
| Regular tax benefit | | | |
| Federal | | $ | (6,721 | ) |
| State | | | (1,773 | ) |
| Total tax benefit | | $ | (8,494 | ) |
| | Deferred | |
| Regular tax provision | | | |
| Federal | | $ | — | |
| State | | | — | |
| Total tax provision | | $ | — | |
The income tax provision for the year ended December 31, 2008 (included in discontinued operations - see note 8) is comprised of the following components (dollar amounts in thousands).
| | Deferred | |
| Regular tax provision | | | |
| Federal | | $ | — | |
| State | | | — | |
| Total tax provision | | $ | — | |
The income tax benefit for the year ended December 31, 20052007 (included in discontinued operations - see note 8) is comprised of the following components:components (dollar amounts in thousands).
| | | Deferred | | | Deferred | |
| Regular tax benefit | | | | | | | |
| Federal | | $ | (6,818 | ) | | $ | 14,522 | |
| State | | | (1,731 | ) | | | 3,830 | |
| Total tax benefit | | $ | (8,549 | ) | | $ | 18,352 | |
The gross deferred tax asset at December 31, 2006 includes a2009 is $29.4 million; the Company continued to reserve 100% of the deferred tax asset of $18.4 million and aas the facts continue to support the Company's inability to utilize the deferred tax liability of $0.1 million which represents the tax effect of differences between tax basis and financial statement carrying amounts of assets and liabilities.asset. The major sources of temporary differences included in the deferred tax assets and their deferred tax effect atas of December 31, 20062009 are as follows (dollar amounts in thousands):
| Deferred tax assets: | | | | | | | |
| Net operating loss carryover | | $ | 19,949 | | | $ | 27,697 | |
| Restricted stock, performance shares and stock option expense | | | 410 | | |
| Mark to market adjustment | | | 2 | | | | 469 | |
| Sec. 267 disallowance | | | 268 | | | | 268 | |
| Charitable contribution carryforward | | | 35 | | | | 1 | |
| GAAP reserves | | | 1,399 | | | | 429 | |
| Rent expense | | | 518 | | | | 537 | |
| Loss on sublease | | | 121 | | |
| Gross deferred tax asset | | | 22,702 | | | | 29,401 | |
| Valuation allowance | | | (4,269 | ) | | | (29,401 | ) |
| Net deferred tax asset | | $ | 18,433 | | | $ | — | |
| | | | | | |
| Deferred tax liabilities: | | | | | |
| Management compensation | | $ | 16 | | |
| Depreciation | | | 65 | | |
| Total deferred tax liability | | $ | 81 | | |
At December 31, 2009, the Company had approximately $62.2 million of net operating loss carryforwards which may be used to offset future taxable income. The carryforwards will expire in 2024 through 2029. The Internal Revenue Code places certain limitations on the annual amount of net operating loss carryforwards that can be utilized if certain changes in the Company’s ownership occur. The Company may have undergone an ownership change within the meaning of IRC section 382 that would impose such a limitation, but a final conclusion has not been made. At this time, based on management’s assessment of the limitations, management does not believe that the limitation would cause a significant amount of the Company's net operating losses to expire unused. The Company continues to maintain a reserve for 100% of the deferred tax asset.
The gross deferred tax asset at December 31, 2005 includes a2008 is $30.1 million; the Company continued to reserve 100% of the deferred tax asset of $10.2 million and aas the facts continue to support the Company's inability to utilize the deferred tax liability of $0.3 million which represents the tax effect of differences between tax basis and financial statement carrying amounts of assets and liabilities.asset. The major sources of temporary differences included in the deferred tax assets and their deferred tax effect atas of December 31, 20052008 are as follows (dollar amounts in thousands):
| Deferred tax assets: | | | |
| Net operating loss forward | | $ | 9,560 | |
| Restricted stock, performance shares and stock option expense | | | 125 | |
| Rent expense | | | 120 | |
| Management compensation | | | 98 | |
| Loss on sublease | | | 181 | |
| Mark to market adjustments | | | 94 | |
| Total deferred tax asset | | | 10,178 | |
| Deferred tax liabilities: | | | | |
| Depreciation | | | 319 | |
| Total deferred tax liability | | | 319 | |
| Net deferred tax asset | | $ | 9,859 | |
| Deferred tax assets: | | | |
| Net operating loss carryover | | $ | 27,655 | |
| Mark to market adjustment | | | 313 | |
| Sec. 267 disallowance | | | 268 | |
| Charitable contribution carryforward | | | 1 | |
| GAAP reserves | | | 769 | |
| Rent expense | | | 1,074 | |
| Gross deferred tax asset | | | 30,080 | |
| Valuation allowance | | | (30,080 | ) |
| Net deferred tax asset | | $ | — | |
The net deferred tax asset is included in prepaid and other assets onAt December 31, 2008, the accompanying consolidated balance sheet. Management has established a valuation allowance for the portionCompany had approximately $62.1 million of the net deferred tax assets that it believes is more likely than not that, based upon the weight of available evidence, will not be realized.
Although realization is not assured, management believes it is more likely than not that the remaining deferred tax assets, for which valuation allowance has not been established, will be realized. The net operating loss carryforward expires at various intervals between 2012 and 2026. The charitable contribution carryforward will expire in 2011.carryforwards which may be used to offset future taxable income.
Until March 31, 2007, the Company operated two segments, the Mortgage Portfolio Management segmentstrategies, managing a mortgage portfolio, and the Mortgage Lending segment.operating a mortgage lending business. Upon the sale of substantially all of itsthe mortgage lending operating assets to Indymac asin the first quarter of March 31, 2007, the Company exited the mortgage lending business and accordingly will no longer reportreports segment information.
information as it only has one operating segment.
19.14. | Capital Stock and Earnings per Share |
The Company had 400,000,000 shares of common stock, par value $0.01 per share, authorized with 18,325,1879,419,094 shares issued and 18,077,880 outstanding as of December 31, 2006. Of2009 and 9,320,094 shares issued and outstanding as of December 31, 2008. The Company had 200,000,000 shares of preferred stock, par value $0.01 per share, authorized, including 2,000,000 shares of Series A Cumulative Convertible Redeemable Preferred Stock (“Series A Preferred Stock”) authorized. As of each December 31, 2009 and December 31, 2008, the common stock authorized, 1,031,111Company had issued and outstanding 1,000,000 shares wereof Series A Preferred Stock. As of December 31, 2009, 8,111 shares remain reserved for issuance as restricted stock awards to employees, officers and directors pursuant tounder the 2005 Stock Incentive Plan. As
On February 21, 2008, the Company completed the issuance and sale of 7.5 million shares of its common stock in a private placement at a price of $8.00 per share. This private offering of the Company's common stock generated net proceeds to the Company of $56.5 million after payment of private placement fees and expenses. In connection with this private offering of our common stock, we entered into a registration rights agreement pursuant to which we were required to file with the Securities and Exchange Commission, or SEC, a resale shelf registration statement registering for resale the 7.5 million shares sold in the private offering. The Company filed a resale shelf registrationstatement on Form S-3 on April 4, 2008, which became effective on April 18, 2008.
The following table presents cash dividends declared by the Company on its common stock from January 1, 2008 through December 31, 2006, 878,4962009.
| Period | | Declaration Date | | Record Date | | Payment Date | | Cash Dividend Per Share | |
| Fourth Quarter 2009 | | December 21, 2009 | | January 7, 2010 | | January 26, 2010 | | $ | 0.25 | |
| Third Quarter 2009 | | September 28, 2009 | | October 13, 2009 | | October 26, 2009 | | | 0.25 | |
| Second Quarter 2009 | | June 14, 2009 | | June 26, 2009 | | July 27, 2009 | | | 0.23 | |
| First Quarter 2009 | | March 25, 2009 | | April 6, 2009 | | April 27, 2009 | | | 0.18 | |
| | | | | | | | | | | |
| Fourth Quarter 2008 | | December 23, 2008 | | January 7, 2009 | | January 26, 2009 | | | 0.10 | |
| Third Quarter 2008 | | September 29, 2008 | | October 10, 2008 | | October 27, 2008 | | | 0.16 | |
| Second Quarter 2008 | | June 30, 2008 | | July 10, 2008 | | July 25, 2008 | | | 0.16 | |
| First Quarter 2008 | | April 21, 2008 | | April 30, 2008 | | May 15,2008 | | | 0.12 | |
The following table presents cash dividends declared by the Company on its Series A Preferred Stock from January 1, 2008 through December 31, 2009.
| Period | | Declaration Date | | Record Date | | Payment Date | | Cash Dividend Per Share | |
| Fourth Quarter 2009 | | December 21, 2009 | | December 31, 2009 | | January 29, 2010 | | $ | 0.63 | |
| Third Quarter 2009 | | September 28, 2009 | | September 30, 2009 | | October 30, 2009 | | | 0.63 | |
| Second Quarter 2009 | | June 14, 2009 | | June 30, 2009 | | July 30, 2009 | | | 0.58 | |
| First Quarter 2009 | | March 25, 2009 | | March 31, 2009 | | April 30, 2009 | | | 0.50 | |
| | | | | | | | | | | |
| Fourth Quarter 2008 | | December 23, 2008 | | December 31, 2008 | | January 30,2009 | | | 0.50 | |
| Third Quarter 2008 | | September 29, 2008 | | September 30, 2008 | | October 30, 2008 | | | 0.50 | |
| Second Quarter 2008 | | June 30, 2008 | | June 30, 2008 | | July 30, 2008 | | | 0.50 | |
| First Quarter 2008 | | April 21, 2008 | | March 31, 2008 | | April 30,2008 | | | 0.50 | |
During 2009, taxable dividends for our common stock were $0.76 per share. For tax reporting purposes, the 2009 taxable dividends were classified as ordinary income.
During 2008, taxable dividends for our common stock were $0.44 per share. For tax reporting purposes, the 2008 taxable dividends were classified as $0.26 ordinary income and $0.18 a return of capital.
The Board of Directors declared a one-for-two reverse stock split of the Company’s common stock, effective on May 27, 2008, decreasing the number of shares remain reserved for issuance.outstanding at the time to approximately 9.3 million shares.
The Board of Directors declared a one-for-five reverse stock split of the Company's common stock, effective on October 9, 2007, decreasing the number of common shares outstanding at the time to approximately 3.6 million shares.
All per share and share amounts provided in the this report have been restated to give effect to both reverse stock splits.
The Company calculates basic net income (loss) per share by dividing net income (loss) for the period by weighted-average shares of common stock outstanding for that period. Diluted net income (loss) per share takes into account the effect of dilutive instruments, such as convertible preferred stock, stock options and unvested restricted or performance stock, but uses the average share price for the period in determining the number of incremental shares that are to be added to the weighted-average number of shares outstanding. Since the Company is in a loss position for the fiscal years ended December 31, 2006 and 2005, the calculation of basic and diluted earnings per share is the same since the effect of common stock equivalents would be anti-dilutive.
The following table presents the computation of basic and diluted net earningsincome (loss) per share for the periods indicated (dollar amounts in(in thousands, except net earnings per share)share amounts):
| | | For the Year Ended December 31, 2006 | | For the Year Ended December 31, 2005 | | For the Year Ended December 31, 2004 | |
| Numerator: | | | | | | | |
| Net (loss)/income | | $ | (15,031 | ) | $ | (5,340 | ) | $ | 4,947 | |
| Denominator: | | | | | | | | | | |
| Weighted average number of common shares outstanding — basic | | | 18,038 | | | 17,873 | | | 17,797 | |
| Net effect of unvested restricted stock | | | — | | | — | | | 224 | |
| Performance shares | | | — | | | — | | | 35 | |
| Escrowed shares(1) | | | — | | | — | | | 53 | |
| Net effect of stock options(2) | | | — | | | — | | | 6 | |
| Weighted average number of common shares outstanding — dilutive | | $ | 18,038 | | | 17,873 | | | 18,115 | |
| Net (loss)/income per share — basic | | $ | (0.83 | ) | $ | (0.30 | ) | $ | 0.28 | |
| Net (loss)/income per share — diluted | | $ | (0.83 | ) | $ | (0.30 | ) | $ | 0.27 | |
During 2006, taxable dividends for New York Mortgage Trust’s common stock were $0.63 per share. For tax reporting purposes, the 2006 taxable dividend will be classified as follows: $0.02401 as ordinary income and $0.60599 as a return of capital.
During 2005, taxable dividends for New York Mortgage Trust’s common stock were $0.95 per share. For tax reporting purposes, the 2005 taxable dividend will be classified as follows: $0.81532 as ordinary income and $0.13468 as a return of capital.
| | | For the Years Ended December 31, | |
| | | 2009 | | | 2008 | | | 2007 | |
Numerator: | | | | | | | | | |
| Net (loss) income – Basic | | $ | 11,670 | | | $ | (24,107 | ) | | $ | (55,268 | ) |
| Net (loss) income from continuing operations | | | 10,884 | | | | (25,764 | ) | | | (20,790 | ) |
| Net income (loss) from discontinued operations (net of tax) | | | 786 | | | | 1,657 | | | | (34,478 | ) |
| Effect of dilutive instruments: | | | | | | | | | | | | |
| Convertible preferred debentures (1) | | | 2,474 | | | | 2,149 | | | | — | |
| Net income (loss) – Dilutive | | | 14,144 | | | | (24,107 | ) | | | (55,268 | ) |
| Net income (loss) from continuing operations | | | 13,358 | | | | (25,764 | ) | | | (20,790 | ) |
| Net income (loss) from discontinued operations (net of tax) | | $ | 786 | | | $ | 1,657 | | | $ | (34,478 | ) |
| Denominator: | | | | | | | | | | | | |
| Weighted average basis shares outstanding | | | 9,367 | | | | 8,272 | | | | 1,814 | |
| Effect of dilutive instruments: | | | | | | | | | | | | |
| Convertible preferred debentures (1) | | | 2,500 | | | | 2,384 | | | | — | |
| Weighted average dilutive shares outstanding | | | 11,867 | | | | 8,272 | | | | 1,814 | |
| EPS: | | | | | | | | | | | | |
| Basic EPS | | $ | 1.25 | | | $ | (2.91 | ) | | $ | (30.47 | ) |
| Basic EPS from continuing operations | | | 1.16 | | | | (3.11 | ) | | | (11.46 | ) |
| Basic EPS from discontinued operations (net of tax) | | | 0.09 | | | | 0.20 | | | | (19.01 | ) |
| Dilutive EPS | | $ | 1.19 | | | $ | (2.91 | ) | | $ | (30.47 | ) |
| Dilutive EPS from continuing operations | | | 1.12 | | | | (3.11 | ) | | | (11.46 | ) |
| Dilutive EPS from discontinued operations (net of tax) | | | 0.07 | | | | 0.20 | | | | (19.01 | ) |
| (1) | (1) | UponApproximately 2.4 million shares are excluded from the closing of the Company’s IPO, of the 2,750,000 shares exchangeddilutive calculation for the equity interests of NYMC, 100,000 shares were held in escrow throughyear ended December 31, 2004 and were available to satisfy any indemnification claims the Company may have had against the contributors of NYMC for losses incurred as a result of defaults on any residential mortgage loans originated by NYMC and closed prior to the completion of the IPO. As of December 31, 2004, the amount of escrowed shares was reduced by 47,680 shares, representing $492,536 for estimated losses on loans closed prior to the Company’s IPO. Furthermore, the contributors of NYMC entered into a new escrow agreement, which extended the escrow period to December 31, 2006 for the remaining 52,320 shares. In September 2006, the Company concluded all indemnification claims related to the escrowed shares were finally determined and no additional losses would be incurred. Accordingly the remaining 52,320 escrowed shares were released from escrow on October 27, 2006.2008 |
.
| 15. | Convertible Preferred Debentures (Net) |
As of December 31, 2009, there were 1.0 million shares of our Series A Preferred Stock outstanding, with an aggregate redemption value of $20.0 million and current dividend payment rate of 12.5% per year. The Series A Preferred Stock matures on December 31, 2010, at which time any outstanding shares must be redeemed by the Company at the $20.00 per share liquidation preference plus any accrued and unpaid dividends, because of this mandatory redemption feature, the Company classifies these securities as a liability on its balance sheet and, accordingly, the corresponding dividend is recorded as an interest expense.
We issued these shares of Series A Preferred Stock to JMP Group Inc. and certain of its affiliates for an aggregate purchase price of $20.0 million. The Series A Preferred Stock entitles the holders to receive a minimum cumulative dividend of 10% per year, subject to an increase to the extent any future quarterly common stock dividends exceed $0.20 per share. The Company paid a third and fourth quarter 2009 common stock dividend of $0.25, resulting in an increase in the dividend rate for the Series A Preferred Stock in the 2009 third quarter to 12.5% (per annum). The Series A Preferred Stock is convertible into shares of the Company's common stock based on a conversion price of $8.00 per share of common stock, which represents a conversion rate of two and one-half (2 ½) shares of common stock for each share of Series A Preferred Stock.
| 16. | (2) | The Company has granted 591,500 stock options under its stock incentive plans.Stock Incentive Plans |
2004 Stock Incentive Plan
The Company adoptedPursuant to the 2004 Stock Incentive Plan (the “2004 Plan”), during 2004. The 2004 Plan provided for the issuance of options to purchase shares of common stock, stock awards, stock appreciation rights and other equity-based awards, including performance shares, and all employees and non-employee directors were eligible to receive these awards under the 2004 Plan. During 2004 and 2005, the Company granted stock options, restricted stock and performance shares to certain of its employees and non-employee directors under the 2004 Plan, including performance shares awarded to certain employees in connection with the Company’s November 2004 acquisition of Guaranty Residential Lending, Inc. (“GRL”). The maximum number of options that could be issued under the 2004 Plan was 706,000 shares and the maximum number of restricted stock awards that could be granted was 794,250.
2005 Stock Incentive Plan
At the Annual Meeting of Stockholders held on May 31, 2005, the Company’s stockholders approved the adoption of the Company’s 2005 Stock Incentive Plan (the “2005 Plan”"Plan"). The 2005 Plan replaced the 2004 Plan, which was terminated on the same date. The 2005 Plan provides that up to 1,031,111 shares, eligible employees, officers and directors of the Company’sCompany are offered the opportunity to acquire the Company's common stock may be issued thereunder.through the award of restricted stock and other equity-based awards under the Plan. The 2005 Plan provides that themaximum number of shares available for issuance under the 2005 Planof common stock that may be increased by the number of shares covered by 2004 Plan awards that were forfeited or terminated after March 10, 2005. On October 12, 2006, the Company filed a registration statement on Form S-8 registering the issuance or resale of 1,031,111 shares under the 2005 Plan. As of December 31, 2006, 16,540 shares awarded under the 2004 Plan had been forfeited or terminated.
Options
Each of the 2005 and 2004 Plans provide for the exercise price of options to be determined by the Compensation Committee of the Board of Directors (“Compensation Committee”) but not to be less than the fair market value on the date the option is granted. Options expire ten years after the grant date. As of December 31, 2006, 591,500 options have been granted pursuant to the Company's stock incentive plans with a vesting period of two years.
The Company accounts for the fair value of its grants in accordance with SFAS No. 123(R). The compensation cost charged against income exclusive of option forfeitures during the twelve months ended December 31, 2006 and 2005 was approximately $32,000 and $44,000, respectively. As of December 31, 2006, there was no unrecognized compensation cost related to non-vested share-based compensation awards granted under the stock option plans. No cash was received for the exercise of stock options during the twelve month periods ended December 31, 2006, 2005 and 2004.
A summary of the status of the Company’s options as of December 31, 2006 and changes during the year then endedPlan is presented below:
| | | Number of Options | | Weighted Average Exercise Price | |
| Outstanding at beginning of year, January 1, 2006 | | | 541,500 | | $ | 9.56 | |
| Granted | | | — | | | — | |
| Canceled | | | 75,000 | | | 9.83 | |
| Exercised | | | — | | | — | |
| Outstanding at end of year, December 31, 2006 | | | 466,500 | | $ | 9.52 | |
| Options exercisable at year-end | | | 466,500 | | $ | 9.52 | |
A summary of the status of the Company’s options as of December 31, 2005 and changes during the year then ended is presented below:
| | | Number of Options | | Weighted Average Exercise Price | |
| Outstanding at beginning of year, January 1, 2005 | | | 591,500 | | $ | 9.58 | |
| Granted | | | — | | | | |
| Canceled | | | 50,000 | | | 9.83 | |
| Exercised | | | — | | | — | |
| Outstanding at end of year, December 31, 2005 | | | 541,500 | | $ | 9.56 | |
| Options exercisable at year-end | | | 403,157 | | $ | 9.47 | |
A summary of the status of the Company’s options as of December 31, 2004 and changes during the year then ended is presented below:
| | | Number of Options | | Weighted Average Exercise Price | |
| Outstanding at beginning of year, January 1, 2004 | | — | | — | |
| Granted | | | 591,500 | | $ | 9.58 | |
| Canceled | | | — | | | — | |
| Exercised | | | — | | | — | |
| Outstanding at end of year, December 31, 2004 | | | 591,500 | | $ | 9.58 | |
| Options exercisable at year-end | | | 314,828 | | $ | 9.36 | |
| Weighted-average fair value of options granted during the year | | | | | $ | 9.58 | |
The following table summarizes information about stock options at December 31, 2006:
| | | | | | | Options Outstanding Weighted Average Remaining Contractual | | | | Options Exercisable | | Fair Value of | |
Range of Exercise Prices | | Date of Grants | | Number Outstanding | | Life
(Years) | | Exercise
Price | | Number Exercisable | | Exercise
Price | | Options Granted | |
| $9.00 | | | 6/24/04 | | | 176,500 | | | 7.5 | | $ | 9.00 | | | 176,500 | | $ | 9.00 | | $ | 0.39 | |
| $9.83 | | | 12/2/04 | | | 290,000 | | | 7.9 | | | 9.83 | | | 290,000 | | | 9.83 | | | 0.29 | |
| Total | | | | | | 466,500 | | | 7.8 | | $ | 9.52 | | | 466,500 | | $ | 9.52 | | $ | 0.33 | |
The following table summarizes information about stock options at December 31, 2005:
| | | | | Options Outstanding Weighted Average Remaining Contractual | | | | Options Exercisable | | Fair Value of | |
Range of Exercise Prices | | Number Outstanding | | Life
(Years) | | Exercise Price | | Number Exercisable | | Exercise Price | | Options
Granted | |
| $9.00 | | | 176,500 | | | 8.5 | | $ | 9.00 | | | 176,500 | | $ | 9.00 | | $ | 0.39 | |
| $9.83 | | | 365,000 | | | 8.9 | | | 9.83 | | | 226,657 | | | 9.83 | | | 0.29 | |
| Total | | | 541,500 | | | 8.8 | | $ | 9.56 | | | 403,157 | | $ | 9.47 | | $ | 0.33 | |
The following table summarizes information about stock options at December 31, 2004:
Range of Exercise Prices | | Number Outstanding | | Options Outstanding Weighted Average Remaining Contractual Life (Years) | | Exercise Price | | Options Exercisable Number Exercisable | | Exercise Price | | Fair Value of Options Granted | |
| $9.00 | | | 176,500 | | | 9.5 | | $ | 9.00 | | | 176,500 | | $ | 9.00 | | $ | 0.39 | |
| $9.83 | | | 415,000 | | | 9.9 | | | 9.83 | | | 138,328 | | | 9.83 | | | 0.29 | |
| Total | | | 591,500 | | | 9.8 | | $ | 9.58 | | | 314,828 | | $ | 9.36 | | $ | 0.35 | |
The fair value of each option grant is estimated on the date of grant using the Binomial option-pricing model with the following weighted-average assumptions:
Risk free interest rate | | | 4.5 | % |
Expected volatility | | | 10 | % |
Expected life | | | 10 years | |
Expected dividend yield | | | 10.48 | % |
As of December 31, 2006, the Company has awarded 684,33399,000 shares of restricted stock under the 2005 Plan on July 13, 2009, of which 470,82634,335 shares have fully vested. As of December 31, 2006 the remaining2009, 8,111 shares of restricted stock awardedremain available for issuance under the 2005 Plan are subject to vesting periods between 3 and 24 months.including 4,000 shares forfeited during the year. During the year ended December 31, 2006,2009, the Company recognized non-cash compensation expense of $1.0$0.3 million. At December 31, 2009 the Company had unrecognized compensation expense of $0.2 million relatingrelated to the vested portionunvested shares of restricted stock grants.common stock. The unrecognized compensation expense at December 31, 2009 is expected to be recognized over a weighted average period of 1.5 years. The total fair value of restricted shares vested during the years ended December 31, 2009 was $0.2 million. Dividends are paid on all restricted stock issued, whether those shares are vested or not. In general, unvested restricted stock is forfeited upon the recipient’srecipient's termination of employment.employment or resignation from the Board of Directors.
A summary of the status of the Company’sCompany's non-vested restricted stock as of December 31, 20062009 and changes during the year then ended is presented below:
| | | Number of Non-vested Restricted Shares | | Weighted Average Grant Date Fair Value | |
| | | | | | |
| Non-vested shares at beginning of year, January 1, 2006 | | | 221,058 | | $ | 8.85 | |
| Granted | | | 129,155 | | | 4.36 | |
| Forfeited | | | (21,705 | ) | | 9.20 | |
| Vested | | | (115,001 | ) | | 8.37 | |
| Non-vested shares as of December 31, 2006 | | | 213,507 | | $ | 6.36 | |
| Weighted-average fair value of restricted stock granted during the period | | $ | 562,549 | | $ | 4.36 | |
A summary of the status of the Company’s non-vested restricted stock as of December 31, 2005 and changes during the yeartwelve months then ended is presented below:
| | | Number of Non-vested Restricted Shares | | Weighted Average Grant Date Fair Value | | | Number of Non-vested Restricted Shares | | Weighted Average Grant Date Fair Value | |
| | | | | | | |
| Non-vested shares at beginning of year, January 1, 2005 | | | 367,803 | | $ | 9.20 | | |
| Non-vested shares at beginning of year, January 1, 2009 | | | | — | | | $ | — | |
| Granted | | | 40,000 | | | 6.88 | | | | 99,000 | | | | 5.28 | |
| Forfeited | | | (26,253 | ) | | 9.83 | | | | (4,000 | ) | | | — | |
| Vested | | | (160,492 | ) | | 9.00 | | | | (34,335 | ) | | | 5.28 | |
| Non-vested shares as of December 31, 2005 | | | 221,058 | | $ | 8.85 | | |
| Non-vested shares as of December 31, 2009 | | | | 60,665 | | | $ | 5.28 | |
| Weighted-average fair value of restricted stock granted during the period | | $ | 275,000 | | $ | 6.88 | | | | 99,000 | | | $ | 5.28 | |
Performance Based Stock Awards
In November 2004, the Company acquired 15 full-service and 26 satellite retail mortgage banking offices located in the Northeast and Mid-Atlantic states from General Residential Lending, Inc. (“GRL”). Pursuant to that transaction, the Company committed to award 238,809There were no non-vested restricted shares of the Company’s stock to certain employees of those branches. Of these committed shares, 206,256 were performance based stock awards granted upon attainment of predetermined production levels and 32,553 were restricted stock awards. As of December 31, 2006, the awards range in vesting periods from 3 to 6 months with a share price set at the December 2, 2004 grant date market value of $9.83 per share. Duringoutstanding for the year ended December 31, 2006, the Company recognized non-cash compensation expense, exclusive of forfeitures of $0.1 million relating to performance based stock awards. Unvested performance share awards have no voting rights and do not earn dividends.
A summary of the status of the Company’s non-vested performance based stock awards as of December 31, 2006 and changes during the year then ended is presented below:
| | | Number of Non-vested Restricted Shares | | Weighted Average Grant Date Fair Value | |
| | | | | | |
| Non-vested shares at beginning of year, January 1, 2006 | | | 61,078 | | $ | 9.83 | |
| Granted | | | - | | | - | |
| Forfeited | | | (26,271 | ) | | 9.83 | |
| Vested | | | (9,256 | ) | | 9.83 | |
| Non-vested shares as of December 31, 2006 | | | 25,551 | | $ | 9.83 | |
A summary of the status of the Company’s non-vested performance based stock awards as of December 31, 2005 and changes during the year then ended is presented below:
| | | Number of Non-vested Restricted Shares | | Weighted Average Grant Date Fair Value | |
| | | | | | |
| Non-vested shares at beginning of year, January 1, 2005 | | | 206,256 | | $ | 9.83 | |
| Granted | | | - | | | - | |
| Forfeited | | | (107,561 | ) | | 9.83 | |
| Vested | | | (37,617 | ) | | 9.83 | |
| Non-vested shares as of December 31, 2005 | | | 61,078 | | $ | 9.83 | |
21.
17. | Quarterly Financial Data (unaudited) |
The following table is a comparative breakdown of our unaudited quarterly results for the immediately preceding eight quarters. The unaudited information provided does not consider the effects of discontinued operationsquarters (dollar amounts in thousands, except per share data):
| | | Three Months Ended | |
| | | Mar. 31, 2006 | | Jun. 30, 2006 | | Sep. 30, 2006 | | Dec. 31, 2006 | |
| REVENUES: | | | | | | | | | |
| Interest income | | $ | 22,626 | | $ | 18,701 | | $ | 20,878 | | $ | 19,042 | |
| Interest expense | | | 18,279 | | | 15,885 | | | 20,096 | | | 18,680 | |
| Net interest income | | | 4,347 | | | 2,816 | | | 782 | | | 362 | |
| Other income (expense): | | | | | | | | | | | | | |
| Gain on sales of mortgage loans | | | 4,070 | | | 5,981 | | | 4,311 | | | 3,625 | |
| Loan losses | | | — | | | — | | | (4,077 | ) | | (4,208 | ) |
| Brokered loan fees | | | 2,777 | | | 3,493 | | | 2,402 | | | 2,265 | |
| Loss on sale of current period securitized loans | | | (773 | ) | | 26 | | | — | | | — | |
| (Loss) gain on sale of marketable securities and related hedges | | | (969 | ) | | — | | | 440 | | | — | |
| Miscellaneous income loss | | | 119 | | | 148 | | | 43 | | | 143 | |
| Total other income (expense) | | | 5,224 | | | 9,648 | | | 3,119 | | | 1,825 | |
| EXPENSES: | | | | | | | | | | | | | |
| Salaries, commissions and related expenses | | | 6,341 | | | 6,001 | | | 5,378 | | | 4,705 | |
| Brokered loan expenses | | | 2,168 | | | 2,767 | | | 1,674 | | | 1,668 | |
| General and administrative expenses | | | 5,774 | | | 5,181 | | | 4,632 | | | 5,359 | |
| Total expenses | | | 14,283 | | | 13,949 | | | 11,684 | | | 11,732 | |
| Income (loss) before provision for income taxes | | | (4,712 | ) | | (1,485 | ) | | (7,783 | ) | | (9,545 | ) |
| Income tax benefit | | | 2,916 | | | 1,663 | | | 3,915 | | | — | |
| Net income (loss) | | $ | (1,796 | ) | $ | 178 | | $ | (3,868 | ) | $ | (9,545 | ) |
| Per share basic income (loss) | | $ | (0.10 | ) | $ | 0.01 | | $ | (0.21 | ) | $ | (0.53 | ) |
| Per share diluted income (loss) | | $ | (0.10 | ) | $ | 0.01 | | $ | (0.21 | ) | $ | (0.53 | ) |
| | | Three Months Ended | |
| | | Mar. 31, 2009 | | | Jun. 30, 2009 | | | Sep. 30, 2009 | | | Dec. 31, 2009 | |
| Revenues: | | | | | | | | | | | | |
| Interest income | | $ | 8,585 | | | $ | 7,621 | | | $ | 7,994 | | | $ | 6,895 | |
| Interest expense | | | 4,491 | | | | 3,463 | | | | 3,311 | | | | 2,970 | |
| Net interest income | | | 4,094 | | | | 4,158 | | | | 4,683 | | | | 3,925 | |
| Other Expense: | | | | | | | | | | | | | | | | |
| Provision for loan losses | | | (629 | ) | | | (259 | ) | | | (526 | ) | | | (848 | ) |
| Realized losses on securities and related hedges | | | 123 | | | | 141 | | | | 359 | | | | 2,659 | |
| Impairment loss on investment securities | | | (119 | ) | | | — | | | | — | | | | — | |
| Total other expense | | | (625 | ) | | | (118 | ) | | | (167 | ) | | | 1,811 | |
| Expenses: | | | | | | | | | | | | | | | | |
| Salaries and benefits | | | 541 | | | | 472 | | | | 473 | | | | 632 | |
| General and administrative expenses | | | 1,029 | | | | 1,130 | | | | 1,402 | | | | 1,198 | |
| Total expenses | | | 1,570 | | | | 1,602 | | | | 1,875 | | | | 1,830 | |
| (Loss) income from continuing operations | | | 1,899 | | | | 2,438 | | | | 2,641 | | | | 3,906 | |
| Income from discontinued operation - net of tax | | | 155 | | | | 109 | | | | 236 | | | | 286 | |
| Net (loss) income | | $ | 2,054 | | | $ | 2,547 | | | $ | 2,877 | | | $ | 4,192 | |
| Per share basic (loss) income | | $ | 0.22 | | | $ | 0.27 | | | $ | 0.31 | | | $ | 0.45 | |
| Per share diluted (loss) income | | $ | 0.22 | | | $ | 0.27 | | | $ | 0.30 | | | $ | 0.40 | |
| Dividends declared per common share | | $ | 0.18 | | | $ | 0.23 | | | $ | 0.25 | | | $ | 0.25 | |
| Weighted average shares outstanding-basic | | | 9,320 | | | | 9,320 | | | | 9,406 | | | | 9,419 | |
| Weighted average shares outstanding-diluted | | | 11,820 | | | | 11,820 | | | | 11,906 | | | | 11,919 | |
| | | Three Months Ended | |
| | | Mar. 31, 2005 | | Jun. 30, 2005 | | Sep. 30, 2005 | | Dec. 31, 2005 | |
| REVENUES: | | | | | | | | | |
| Interest income | | $ | 17,117 | | $ | 19,669 | | $ | 19,698 | | $ | 20,992 | |
| Interest expense | | | 11,690 | | | 14,531 | | | 16,159 | | | 17,724 | |
| Net interest income | | | 5,427 | | | 5,138 | | | 3,539 | | | 3,268 | |
| Other income (expense): | | | | | | | | | | | | | |
| Gain on sales of mortgage loans | | | 4,321 | | | 8,328 | | | 8,985 | | | 5,149 | |
| Brokered loan fees | | | 1,999 | | | 2,534 | | | 2,647 | | | 2,811 | |
| Gain (loss) on sale of marketable securities and related hedges | | | 377 | | | 544 | | | 1,286 | | | (7,440 | ) |
| Miscellaneous income (loss) | | | 115 | | | (10 | ) | | 91 | | | 36 | |
| Total other income (expense) | | | 6,812 | | | 11,396 | | | 13,009 | | | 556 | |
| EXPENSES: | | | | | | | | | | | | | |
| Salaries, commissions and related expenses | | | 7,143 | | | 9,430 | | | 7,302 | | | 7,104 | |
| Brokered loan expenses | | | 1,520 | | | 2,686 | | | 1,483 | | | 1,854 | |
| General and administrative expenses | | | 6,304 | | | 6,062 | | | 5,903 | | | 6,243 | |
| Total expenses | | | 14,967 | | | 18,178 | | | 14,688 | | | 15,201 | |
| Income (loss) before provision for income taxes | | | (2,728 | ) | | (1,644 | ) | | 1,860 | | | (11,377 | ) |
| Income tax benefit | | | 2,690 | | | 2,190 | | | 1,000 | | | 2,669 | |
| Net income (loss) | | $ | (38 | ) | $ | 546 | | $ | 2,860 | | $ | (8,708 | ) |
| Per share basic income (loss) | | $ | 0.00 | | $ | 0.03 | | $ | 0.16 | | $ | (0.49 | ) |
| Per share diluted income (loss) | | $ | 0.00 | | $ | 0.03 | | $ | 0.16 | | $ | (0.49 | ) |
| | | Three Months Ended | |
| | | Mar. 31, 2008 | | | Jun. 30, 2008 | | | Sep. 30, 2008 | | | Dec. 31, 2008 | |
| Revenues: | | | | | | | | | | | | |
| Interest income | | $ | 13,253 | | | $ | 10,755 | | | $ | 10,324 | | | $ | 9,791 | |
| Interest expense | | | 11,979 | | | | 8,256 | | | | 8,142 | | | | 7,883 | |
| Net interest income | | | 1,274 | | | | 2,499 | | | | 2,182 | | | | 1,908 | |
| Other expense | | | | | | | | | | | | | | | | |
| Provision for loan losses | | | (1,433 | ) | | | (22 | ) | | | (7 | ) | | | — | |
| Loss on sale of securities and related hedges | | | (19,848 | ) | | | (83 | ) | | | 4 | | | | (50 | ) |
| Impairment loss on investment securities | | | | | | | | | | | | | | | (5,278 | ) |
| Total other expense | | | (21,281 | ) | | | (105 | ) | | | (3 | ) | | | (5,328 | ) |
| Expenses: | | | | | | | | | | | | | | | | |
| Salaries and benefits | | | 313 | | | | 417 | | | | 258 | | | | 881 | |
| General and administrative expenses | | | 1,118 | | | | 1,543 | | | | 1,177 | | | | 1,203 | |
| Total expenses | | | 1,431 | | | | 1,960 | | | | 1,435 | | | | 2,084 | |
| Loss from continuing operations | | | (21,438 | ) | | | 434 | | | | 744 | | | | (5,504 | ) |
| Loss from discontinued operation - net of tax | | | 180 | | | | 829 | | | | 285 | | | | 363 | |
| Net loss | | $ | (21,258 | ) | | $ | 1,263 | | | $ | 1,029 | | | $ | (5,141 | ) |
| Per share basic and diluted loss | | $ | (4.19 | ) | | $ | 0.14 | | | $ | 0.11 | | | $ | (0.55 | ) |
| Dividends declared per common share | | $ | 0.12 | | | $ | 0.16 | | | $ | 0.16 | | | $ | 0.10 | |
| Weighted average shares outstanding-basic and diluted | | | 5,070 | | | | 9,320 | | | | 9,320 | | | | 9,320 | |
22. Subsequent events18. Related Party Transactions
On February 7, 2007, we announced that we hadJanuary 18, 2008, the Company entered into an advisory agreement with Harvest Capital Strategies LLC (“HCS”) (formerly known as JMP Asset Management LLC). The Company entered into the advisory agreement concurrent and in connection with its private placement of Series A Preferred Stock to JMP Group Inc. and certain of it affiliates. HCS is a definitive agreementwholly-owned subsidiary of JMP Group Inc. Pursuant to sell substantially allSchedule 13D’s filed with the SEC as of December 31, 2008, HCS and JMP Group Inc. as of December 31, 2009, beneficially owned approximately 16.7% and 12.1%, respectively, of the retail mortgage lending platformCompany’s common stock, and 100%, collectively, of NYMCit Series A Preferred Stock.
Pursuant to IndyMac Bank, F.S.B., (“Indymac”), a wholly owned subsidiary of Indymac Bancorp, Inc,the advisory agreement, HCS is responsible for an estimated purchase price of $13.5 millionmanaging investments made by HC and NYMF (other than certain RMBS that are held in cashthese entities for regulatory compliance purposes) as well as any additional subsidiaries acquired or formed in the future to hold investments made on the Company’s behalf by HCS. The Company refers to these subsidiaries in its periodic reports filed with the Securities and Exchange Commission as the assumption of certain of our liabilities by Indymac.“Managed Subsidiaries.” On March 31, 2007, Indymac purchased substantially all2009, the Company began acquiring assets that fall under the advisory agreement, starting with the purchase of approximately $9.0 million in CLOs. The Company’s investment in the CLOs assets was completed in connection with the acquisition by JMP Group Inc. of the operating assets relatedinvestment adviser of the CLO. The Company expects that, from time to NYMC’s retail mortgage lending platform, including, among other things, assuming leases heldtime in the future, certain of its alternative investments will take the form of a co-investment alongside or in conjunction with JMP Group Inc. or certain of its affiliates. In accordance with investment guidelines adopted by NYMC for approximately 20 full service and approximately 10 satellite retail mortgage lending offices (excluding the lease for the Company’s corporate headquarters, whichBoard of Directors, any investments by the Managed Subsidiaries that do not qualify as Category I investments (as defined by the Company’s Investment Guidelines) must be approved by the Board of Directors. The advisory agreement provides that HCS will be paid a base advisory fee that is being assigned, as previously announced, under a separate agreement to Lehman Brothers Holding, Inc.),percentage of the tangible personal property located in those approximately 30 retail mortgage banking offices, NYMC’s pipeline of residential mortgage loan applications (the “Pipeline Loans”), escrowed deposits related to the Pipeline Loans, customer lists and intellectual property and information technology systems used by NYMC in the conduct of its retail mortgage banking platform. Indymac assumed the obligations of NYMC under the Pipeline Loans and substantially all of NYMC’s liabilities under the purchased contracts and purchased assets arising after the closing date. Indymac has also agreed to pay (i) the first $500,000 in severance expenses with respect to “transferred employees”“equity capital” (as defined in the asset purchase agreement filed as Exhibit 10.62 to this Annual Report on Form 10-K) and (ii) severance expenses in excess of $1.1 million arising after the closing with respect to transferred employees. As partadvisory agreement) of the Indymac transaction,Managed Subsidiaries, which may include the company has agreed,net asset value of assets held by the Managed Subsidiaries as of any fiscal quarter end, and an incentive fee upon the Managed Subsidiaries achieving certain investment hurdles. For the year ended December 31, 2009 and December 31, 2008, HCS earned a base advisory fee of approximately $0.8 million and $0.7 million, respectively. In addition, for a periodthe year ended December 31, 2009, HCS earned an incentive fee of 18 months, not to compete with Indymac other thanapproximately $0.5 million. There was no incentive fee earned in the purchase, sale, or retention of mortgage loans. Indymac has hired substantially all of our branch employees and loan officers and a majority of NYMC employees based out of our corporate headquarters.year ended December 31, 2008. As of April 1, 2007,December 31, 2009, HCS was managing approximately $45.8 million of assets on the Company’s behalf. As of December 31, 2009 the Company has approximately 40 employees.
On February 14, 2007, we entered intohad a definitive agreement with Tribeca Lending Corp., a subsidiary of Franklin Credit Management Corporation (“Tribeca Lending”) to sell our wholesale lending business for an estimated purchase price of $485,000. This transaction closed on February 22, 2007. Together, the closing of the sale of our retail mortgage banking platform to Indymacmanagement fee payable totaling $0.3 million included in accounts payable and the sale of our wholesale lending business to Tribeca Lending has resulted in gross proceeds to NYMT of approximately $14.0 million before fees and expenses, and before deduction of approximately $2.3 million, which will be held in escrow to support warranties and indemnifications provided to Indymac by NYMC as well as other purchase price adjustments. NYMC will record a one time taxable gain on the sale of these assets. NYMC’s deferred tax asset will absorb any taxable gain from the sale.
On November 13, 2006, The New York Mortgage Company, LLC (“NYMC”), a taxable REIT subsidiary of New York Mortgage Trust, Inc. (the “Company”), entered into an Assignment and Assumption of Sublease and an Escrow Agreement, each with Lehman Brothers Holdings Inc. (“Lehman”) (collectively, the “Agreements”). Under the Agreements, NYMC assigned and Lehman has assumed the sublease for the Company's corporate headquarters at 1301 Avenue of the Americas. Pursuant to the Agreements, Lehman will fund an escrow account in the amount of $3,000,000 for the benefit of NYMC. Pending the consent of the landlord to the assignment, the full escrow amount will be released to the Company if it vacates the leased space on or before March 1, 2007. For each month beginning in March 2007 that the Company remains in occupation of the leased space, the escrow amount payable to NYMC will be reduced by $200,000. NYMC will be paid an additional (i) $100,000 if the Company vacates the leased space between February 1, 2007 and February 28, 2007, or (ii) $200,000 if the Company vacates the leased space prior to February 1, 2007. The Company intends to relocate its corporate headquarters to a smaller facility at a location that is yet to be determined.
On or about January 5 2007, NYMC and Lehman entered into a First Amendment to Assignment and Assumption of Sublease extending the date for NYMC to vacate the leased space to on or before April 1, 2007. For each month beginning in April, 2007 that NYMC remains in occupation of the leased space, the escrow amount payable to NYMC will be reduced by $200,000.
On or about February 8, 2007 NYMC and Lehman entered into a Second Amendment to the Assignment and Assumption of Sublease extending the date for NYMC to vacate the leased space on or before May 1, 2007. For each month beginning in May, 2007 that NYMC remains in occupation of the leased space, the escrow amount payable to NYMC will be reduced by $200,000.
accrued expenses.
EXHIBIT INDEX
Exhibits. The exhibits required by Item 601 of Regulation S-K are listed below. Management contracts or compensatory plans are filed as Exhibits 10.16, 10.28 - 10.34, 10.38, 10.41, 10.46, 10.60, 10.61.10.3, 10.7, 10.8, 10.10 and 10.11.
Exhibit | | Description |
| 3.1 | | Articles of Amendment and Restatement of New York Mortgage Trust, Inc. (Incorporated by reference to Exhibit 3.1 to the Company’s Registration Statement on Form S-11 as filed with the Securities and Exchange Commission (Registration No. 333-111668), effective June 23, 2004). |
| | |
| 3.1(b) | | Articles of Amendment of the Registrant (Incorporated by reference to Exhibit 3.1 to the Company’s Current Report on Form 8-K filed on October 4, 2007). |
| | |
| 3.1(c) | | Articles of Amendment of the Registrant (Incorporated by reference to Exhibit 3.2 to the Company’s Current Report on Form 8-K filed on October 4, 2007). |
| | |
| 3.1(d) | | Articles of Amendment of the Registrant (Incorporated by reference to Exhibit 3.1(d) to the Company’s Current Report on Form 8-K filed on May 16, 2008.) |
| | |
| 3.1(e) | | Articles of Amendment of the Registrant (Incorporated by reference to Exhibit 3.1(e) to the Company’s Current Report on Form 8-K filed on May 16, 2008.) |
| | |
| 3.1(f) | | Articles of Amendment of the Registrant (Incorporated by reference to Exhibit 3.1(f) to the Company’s Current Report on Form 8-K filed on June 15, 2009.) |
| | |
| 3.2(a) | | Bylaws of New York Mortgage Trust, Inc. (Incorporated by reference to Exhibit 3.2 to the Company’s Registration Statement on Form S-11 as filed with the Securities and Exchange Commission (Registration No. 333-111668), effective June 23, 2004). |
| | |
| 3.2(b) | | Amendment No. 1 to Bylaws of New York Mortgage Trust, Inc. (Incorporated by reference to Exhibit 3.2(b) to Registrant's Annual Report on Form 10-K filed on March 16, 2006). |
| | |
| 4.1 | | Form of Common Stock Certificate. (Incorporated by reference to Exhibit 4.1 to the Company’s Registration Statement on Form S-11 as filed with the Securities and Exchange Commission (Registration No. 333-111668), effective June 23, 2004). |
| | |
| 4.2(a) | | Junior Subordinated Indenture between The New York Mortgage Company, LLC and JPMorgan Chase Bank, National Association, as trustee, dated SeptemberDecember 1, 2005. (Incorporated by reference to Exhibit 4.1 to the Company’s Current Report on Form 8-K as filed with the Securities and Exchange Commission on SeptemberDecember 6, 2005). |
| | |
| 4.2(b) | | Amended and Restated Trust Agreement among The New York Mortgage Company, LLC, JPMorgan Chase Bank, National Association, Chase Bank USA, National Association and the Administrative Trustees named therein, dated SeptemberDecember 1, 2005. (Incorporated by reference to Exhibit 4.2 to the Company’s Current Report on Form 8-K as filed with the Securities and Exchange Commission on SeptemberDecember 6, 2005). |
| | | |
| 4.3(a) | | |
| | |
| | |
Exhibit
| | Description
|
10.1 | | Warehousing Credit Agreement, among The New York MortgageArticles Supplementary Establishing and Fixing the Rights and Preferences of Series A Cumulative Redeemable Convertible Preferred Stock of the Company LLC, Steven B. Schnall, Joseph V. Fierro and National City Bank of Kentucky, dated January 25, 2002. (Incorporated by reference to Exhibit 10.394.1 to the Company’s Registration StatementCurrent Report on Form S-11 as8-K filed with the Securities and Exchange Commission (Registration No. 333-111668), effective June 23, 2004). |
10.2 | | First Amendment, dated April 2002, to Warehousing Credit Agreement, among The New York Mortgage Company LLC, Steven B. Schnall, Joseph V. Fierro and National City Bank of Kentucky, datedon January 25, 2002. (Incorporated by reference to Exhibit 10.40 to the Company’s Registration Statement on Form S-11 as filed with the Securities and Exchange Commission (Registration No. 333-111668), effective June 23, 2004). |
10.3 | | Second Amendment, dated June 3, 2002, to Warehousing Credit Agreement, among The New York Mortgage Company LLC, Steven B. Schnall, Joseph V. Fierro and National City Bank of Kentucky, dated January 25, 2002. (Incorporated by reference to Exhibit 10.41 to the Company’s Registration Statement on Form S-11 as filed with the Securities and Exchange Commission (Registration No. 333-111668), effective June 23, 2004). |
10.4 | | Third Amendment, dated November , 2002, to Warehousing Credit Agreement, among The New York Mortgage Company LLC, Steven B. Schnall, Joseph V. Fierro and National City Bank of Kentucky, dated January 25, 2002. (Incorporated by reference to Exhibit 10.42 to the Company’s Registration Statement on Form S-11 as filed with the Securities and Exchange Commission (Registration No. 333-111668), effective June 23, 2004). |
10.5 | | Fourth Amendment, dated June 15, 2003, to Warehousing Credit Agreement, among The New York Mortgage Company LLC, Steven B. Schnall, Joseph V. Fierro and National City Bank of Kentucky, dated January 25, 2002. (Incorporated by reference to Exhibit 10.43 to the Company’s Registration Statement on Form S-11 as filed with the Securities and Exchange Commission (Registration No. 333-111668), effective June 23, 2004). |
10.6 | | Warehouse Promissory Note, between The New York Mortgage Company, LLC and National City Bank of Kentucky, dated January 25, 2002. (Incorporated by reference to Exhibit 10.44 to the Company’s Registration Statement on Form S-11 as filed with the Securities and Exchange Commission (Registration No. 333-111668), effective June 23, 2004). |
Exhibit
| | Description
|
10.7 | | Amended and Restated Warehouse Promissory Note, between The New York Mortgage Company, LLC and National City Bank of Kentucky, dated June 3, 2002. (Incorporated by reference to Exhibit 10.45 to the Company’s Registration Statement on Form S-11 as filed with the Securities and Exchange Commission (Registration No. 333-111668), effective June 23, 2004). |
10.8 | | Warehousing Credit Agreement, between New York Mortgage Company, LLC, Steven B. Schnall, Joseph V. Fierro and National City Bank of Kentucky, dated as of January 25, 2002. (Incorporated by reference to Exhibit 10.46 to the Company’s Registration Statement on Form S-11 as filed with the Securities and Exchange Commission (Registration No. 333-111668), effective June 23, 2004). |
10.9 | | Pledge and Security Agreement, between The New York Mortgage Company, LLC and National City Bank of Kentucky, dated as of January 25, 2002. (Incorporated by reference to Exhibit 10.47 to the Company’s Registration Statement on Form S-11 as filed with the Securities and Exchange Commission (Registration No. 333-111668), effective June 23, 2004). |
10.10 | | Unconditional and Continuing Guaranty of Payment by Steven B. Schnall to National City Bank of Kentucky, dated January 25, 2002. (Incorporated by reference to Exhibit 10.48 to the Company’s Registration Statement on Form S-11 as filed with the Securities and Exchange Commission (Registration No. 333-111668), effective June 23, 2004). |
10.11 | | Unconditional and Continuing Guaranty of Payment by Joseph V. Fierro to National City Bank of Kentucky, dated January 25, 2002. (Incorporated by reference to Exhibit 10.49 to the Company’s Registration Statement on Form S-11 as filed with the Securities and Exchange Commission (Registration No. 333-111668), effective June 23, 2004). |
10.12 | | Amended and Restated Unconditional and Continuing Guaranty of Payment by Steven B. Schnall to National City Bank of Kentucky, dated June 15, 2003. (Incorporated by reference to Exhibit 10.50 to the Company’s Registration Statement on Form S-11 as filed with the Securities and Exchange Commission (Registration No. 333-111668), effective June 23, 2004). |
10.13 | | Amended and Restated Unconditional and Continuing Guaranty of Payment by Joseph V. Fierro to National City Bank of Kentucky, dated June 15, 2003. (Incorporated by reference to Exhibit 10.51 to the Company’s Registration Statement on Form S-11 as filed with the Securities and Exchange Commission (Registration No. 333-111668), effective June 23, 2004). |
10.14 | | Whole Loan Purchase and Sale Agreement/Mortgage Loan Purchase and Sale Agreement between The New York Mortgage Company, LLC and Greenwich Capital Financial Products, Inc., dated as of September 1, 2003. (Incorporated by reference to Exhibit 10.53 to the Company’s Registration Statement on Form S-11 as filed with the Securities and Exchange Commission (Registration No. 333-111668), effective June 23, 2004). |
10.15 | | Whole Loan Custodial Agreement/Custodial Agreement between Greenwich Capital Financial Products, Inc., The New York Mortgage Company, LLC and LaSalle Bank National Association, dated as of September 1, 2003. (Incorporated by reference to Exhibit 10.54 to the Company’s Registration Statement on Form S-11 as filed with the Securities and Exchange Commission (Registration No. 333-111668), effective June 23, 2004). |
Exhibit
| | Description
|
10.16 | | Form of New York Mortgage Trust, Inc. 2004 Stock Incentive Plan. (Incorporated by reference to Exhibit 10.55 to the Company’s Registration Statement on Form S-11 as filed with the Securities and Exchange Commission (Registration No. 333-111668), effective June 23, 2004)2008). |
| | | |
| 4.3(b) | | |
| | |
| | |
| | |
| | |
| | |
| | |
| | |
| | |
Exhibit
| | Description
|
10.17 | | Guaranty between HSBC Bank USA, National City BankForm of Kentucky, The New York Mortgage Company LLC and Steven B. Schnall, dated as of December 15, 2003.Series A Cumulative Redeemable Convertible Preferred Stock Certificate (Incorporated by reference to Exhibit 10.71 to the Company’s Registration Statement on Form S-11 as filed with the Securities and Exchange Commission (Registration No. 333-111668), effective June 23, 2004). |
10.18 | | Guaranty between HSBC Bank USA, National City Bank of Kentucky, The New York Mortgage Company LLC and Joseph V. Fierro, dated as of December 15, 2003. (Incorporated by reference to Exhibit 10.72 to the Company’s Registration Statement on Form S-11 as filed with the Securities and Exchange Commission (Registration No. 333-111668), effective June 23, 2004). |
10.19 | | Credit Note by and between HSBC Bank USA and The New York Mortgage Company LLC, dated as of December 15, 2003. (Incorporated by reference to Exhibit 10.73 to the Company’s Registration Statement on Form S-11 as filed with the Securities and Exchange Commission (Registration No. 333-111668), effective June 23, 2004). |
10.20 | | Credit Note by and between National City Bank of Kentucky and The New York Mortgage Company LLC, dated as of December 15, 2003. (Incorporated by reference to Exhibit 10.74 to the Company’s Registration Statement on Form S-11 as filed with the Securities and Exchange Commission (Registration No. 333-111668), effective June 23, 2004). |
10.21 | | Swingline Note by and between HSBC Bank USA and The New York Mortgage Company LLC, dated as of December 15, 2003. (Incorporated by reference to Exhibit 10.75 to the Company’s Registration Statement on Form S-11 as filed with the Securities and Exchange Commission (Registration No. 333-111668), effective June 23, 2004). |
10.22 | | Custodial Agreement by and among Greenwich Capital Financial Products, Inc., The New York Mortgage Corporation LLC and Deutsche Bank Trust Company Americas, dated as of August 1, 2003. (Incorporated by reference to Exhibit 10.76 to the Company’s Registration Statement on Form S-11 as filed with the Securities and Exchange Commission (Registration No. 333-111668), effective June 23, 2004). |
Exhibit
| | Description
|
10.23 | | Master Mortgage Loan Purchase and Interim Servicing Agreement by and between The New York Mortgage Company L.L.C. and Greenwich Capital Financial Products, Inc., dated as of August 1, 2003. (Incorporated by reference to Exhibit 10.77 to the Company’s Registration Statement on Form S-11 as filed with the Securities and Exchange Commission (Registration No. 333-111668), effective June 23, 2004). |
10.24 | | Promissory Note, issued by New York Mortgage Funding, LLC on January 9, 2004 in the principal amount of $100,000,000.00, payable to Greenwich Capital Financial Products, Inc. (Incorporated by reference to Exhibit 10.82 to the Company’s Registration Statement on Form S-11 as filed with the Securities and Exchange Commission (Registration No. 333-111668), effective June 23, 2004). |
10.25 | | Guaranty between the New York Mortgage Company, LLC and Greenwich Capital Financial Products, Inc., dated as of January 9, 2004. (Incorporated by reference to Exhibit 10.83 to the Company’s Registration Statement on Form S-11 as filed with the Securities and Exchange Commission (Registration No. 333-111668), effective June 23, 2004). |
10.26 | | Custodial Agreement between New York Mortgage Funding, LLC, Deutche Bank Trust Company Americas and Greenwich Capital Financial Products, Inc., dated as of January 9, 2004. (Incorporated by reference to Exhibit 10.85 to the Company’s Registration Statement on Form S-11 as filed with the Securities and Exchange Commission (Registration No. 333-111668), effective June 23, 2004). |
10.27 | | Amendment Number One, dated November 24, 2003, to the Master Mortgage Loan Purchase and Interim Servicing Agreement, dated as of August 1, 2003. (Incorporated by reference to Exhibit 10.86 to the Company’s Registration Statement on Form S-11 as filed with the Securities and Exchange Commission (Registration No. 333-111668), effective June 23, 2004). |
Exhibit
| | Description
|
10.28 | | Form of Employment Agreement between New York Mortgage Trust, Inc. and Steven B. Schnall. (Incorporated by reference to Exhibit 10.92 to the Company’s Registration Statement on Form S-11 as filed with the Securities and Exchange Commission (Registration No. 333-111668), effective June 23, 2004). |
10.29 | | Form of Employment Agreement between New York Mortgage Trust, Inc. and David A. Akre. (Incorporated by reference to Exhibit 10.93 to the Company’s Registration Statement on Form S-11 as filed with the Securities and Exchange Commission (Registration No. 333-111668), effective June 23, 2004). |
10.30 | | Form of Employment Agreement between New York Mortgage Trust, Inc. and Raymond A. Redlingshafer, Jr. (Incorporated by reference to Exhibit 10.94 to the Company’s Registration Statement on Form S-11 as filed with the Securities and Exchange Commission (Registration No. 333-111668), effective June 23, 2004). |
10.31 | | Form of Employment Agreement between New York Mortgage Trust, Inc. and Michael I. Wirth. (Incorporated by reference to Exhibit 10.95 to the Company’s Registration Statement on Form S-11 as filed with the Securities and Exchange Commission (Registration No. 333-111668), effective June 23, 2004). |
10.32 | | Form of Employment Agreement between New York Mortgage Trust, Inc. and Joseph V. Fierro. (Incorporated by reference to Exhibit 10.96 to the Company’s Registration Statement on Form S-11 as filed with the Securities and Exchange Commission (Registration No. 333-111668), effective June 23, 2004). |
Exhibit
| | Description
|
10.33 | | Form of Employment Agreement between New York Mortgage Trust, Inc. and Steven R. Mumma. (Incorporated by reference to Exhibit 10.97 to the Company’s Registration Statement on Form S-11 as filed with the Securities and Exchange Commission (Registration No. 333-111668), effective June 23, 2004). |
10.34 | | Amendment No. 1 to Employment Agreement between New York Mortgage Trust, Inc. and Steven R. Mumma, dated December 2, 2004. (Incorporated by reference to Exhibit 10.98 to the Company’s Annual Report on Form 10-K as filed with the Securities and Exchange Commission on March 31, 2005). |
10.35 | | Amended and Restated Credit and Security Agreement between HSBC Bank USA, National Association, National City Bank of Kentucky, JP Morgan Chase Bank, N.A. and The New York Mortgage Company LLC, dated as of February 1, 2005. (Incorporated by reference to Exhibit 10.99 to the Company’s Annual Report on Form 10-K as filed with the Securities and Exchange Commission on March 31, 2005). |
10.36 | | Amended and Restated Master Loan and Security Agreement between New York Mortgage Funding, LLC, The New York Mortgage Company, LLC and New York Mortgage Trust, Inc. and Greenwich Capital Financial Products, Inc., dated as of December 6, 2004. (Incorporated by reference to Exhibit 10.100 to the Company’s Annual Report on Form 10-K as filed with the Securities and Exchange Commission on March 31, 2005). |
10.37 | | Amended and Restated Master Repurchase Agreement Between New York Mortgage Trust, Inc., The New York Mortgage Company, LLC, New York Mortgage Funding, LLC and Credit Suisse First Boston Mortgage Capital LLC, dated as of March 30, 2005. (Incorporated by reference to Exhibit 10.14.2 to the Company’s Current Report on Form 8-K as filed with the Securities and Exchange Commission on April 5, 2005)January 25, 2008). |
10.38 | | Separation and Release Agreement, dated June 30, 2005, by and between the Company and Raymond A. Redlingshafer, Jr. (Incorporated by reference to Exhibit 10.1 to the Company’s Current Report on Form 8-K as filed with the Securities and Exchange Commission on July 5, 2005). |
10.39 | | Parent Guarantee Agreement between New York Mortgage Trust, Inc. and JPMorgan Chase Bank, National Association, as guarantee trustee, dated SeptemberDecember 1, 2005. (Incorporated by reference to Exhibit 10.1 to the Company’s Current Report on Form 8-K as filed with the Securities and Exchange Commission on SeptemberDecember 6, 2005). |
10.40 | | |
| 10.2 | | Purchase Agreement among The New York Mortgage Company, LLC, New York Mortgage Trust, Inc., NYM Preferred Trust II and Taberna Preferred Funding II, Ltd., dated SeptemberDecember 1, 2005. (Incorporated by reference to Exhibit 10.2 to the Company’s Current Report on Form 8-K as filed with the Securities and Exchange Commission on SeptemberDecember 6, 2005). |
10.41 | | |
| 10.3 | | New York Mortgage Trust, Inc. 2005 Stock Incentive Plan. (Incorporated by reference to Exhibit 10.1 to the Company’s Registration Statement on Form S-3/A (File No. 333-127400) as filed with the Securities and Exchange Commission on SeptemberDecember 9, 2005). |
10.42 | | Master Repurchase |
| 10.4 | | Stock Purchase Agreement, among DB Structured Products, Inc., Aspen Funding Corp.by and Newport Funding Corp,among New York Mortgage Trust, Inc. and NYMC Loan Corporation,the Investors listed on Schedule I thereto, dated as of December 13, 2005.* |
10.43 | | Custodial Agreement among DB Structured Products, Inc., Aspen Funding Corp., and Newport Funding Corp., NYMC Loan Corporation, New York Mortgage Trust, Inc. and LaSalle Bank National Association, dated as of December 13, 2005.* |
10.44 | | Master Repurchase Agreement among New York Mortgage Funding, LLC, The New York Mortgage Company, LLC, New York Mortgage Trust Inc. and Greenwich Capital Financial Products, Inc. dated as of January 5, 2006.* |
Exhibit
| | Description
|
10.45 | | Amended and Restated Custodial Agreement by and among The New York Mortgage Company, LLC, New York Mortgage Funding, LLC, New York Mortgage Trust, Inc., LaSalle Bank National Association and Greenwich Capital Financial Products, Inc. dated as of January 5, 2006. |
10.46 | | Summary of 2005 Cash Bonuses Paid to Executive Officers (incorporatedNovember 30, 2007 (Incorporated by reference to Exhibit 10.1 to the Company’s Quarterly Report on Form 10-Q filed on May 10, 2006). |
10.47 | | Amendment No. 1 to Amended and Restated Master Repurchase Agreement among Credit Suisse First Boston Mortgage Capital LLC, The New York Mortgage Company, LLC, New York Mortgage Funding, LLC and New York Mortgage Trust, Inc. dated as of April 29, 2005 (incorporated by reference to Exhibit 10.110 to the Company’s Quarterly Report on Form 10-Q filed on May 10, 2006). |
10.48 | | Amendment No. 2 to Amended and Restated Master Repurchase Agreement among Credit Suisse First Boston Mortgage Capital LLC, The New York Mortgage Company, LLC, New York Mortgage Funding, LLC and New York Mortgage Trust, Inc. dated as of May 10, 2005 (incorporated by reference to Exhibit 10.111 to the Company’s Quarterly Report on Form 10-Q filed on May 10, 2006). |
10.49 | | Amendment No. 3 to Amended and Restated Master Repurchase Agreement among Credit Suisse First Boston Mortgage Capital LLC, The New York Mortgage Company, LLC, New York Mortgage Funding, LLC and New York Mortgage Trust, Inc. dated as of July 18, 2005 (incorporated by reference to Exhibit 10.112 to the Company’s Quarterly Report on Form 10-Q filed on May 10, 2006). |
10.50 | | Amendment No. 4 to Amended and Restated Master Repurchase Agreement among Credit Suisse First Boston Mortgage Capital LLC, The New York Mortgage Company, LLC, New York Mortgage Funding, LLC and New York Mortgage Trust, Inc. dated as of August 5, 2005 (incorporated by reference to Exhibit 10.113 to the Company’s Quarterly Report on Form 10-Q filed on May 10, 2006). |
10.51 | | Amendment No. 5 to Amended and Restated Master Repurchase Agreement among Credit Suisse First Boston Mortgage Capital LLC, The New York Mortgage Company, LLC, New York Mortgage Funding, LLC and New York Mortgage Trust, Inc. dated as of September 6, 2005 (incorporated by reference to Exhibit 10.114 to the Company’s Quarterly Report on Form 10-Q filed on May 10, 2006). |
10.52 | | Amendment No. 6 to Amended and Restated Master Repurchase Agreement among Credit Suisse First Boston Mortgage Capital LLC, The New York Mortgage Company, LLC, New York Mortgage Funding, LLC and New York Mortgage Trust, Inc. dated as of November 14, 2005 (incorporated by reference to Exhibit 10.115 to the Company’s Quarterly Report on Form 10-Q filed on May 10, 2006). |
10.53 | | Amendment No. 7 to Amended and Restated Master Repurchase Agreement among Credit Suisse First Boston Mortgage Capital LLC, The New York Mortgage Company, LLC, New York Mortgage Funding, LLC and New York Mortgage Trust, Inc. dated as of March 14, 2006 (incorporated by reference to Exhibit 10.116 to the Company’s Quarterly Report on Form 10-Q filed on May 10, 2006). |
10.54 | | Amendment No. 8 to Amended and Restated Master Repurchase Agreement among Credit Suisse First Boston Mortgage Capital LLC, The New York Mortgage Company, LLC, New York Mortgage Funding, LLC and New York Mortgage Trust, Inc. dated as of March 24, 2006 (incorporated by reference to Exhibit 10.117 to the Company’s Quarterly Report on Form 10-Q filed on May 10, 2006). |
10.55 | | Amendment No. 9 to Amended and Restated Master Repurchase Agreement among Credit Suisse First Boston Mortgage Capital LLC, The New York Mortgage Company, LLC, New York Mortgage Funding, LLC and New York Mortgage Trust, Inc. dated as of May 10, 2006 (incorporated by reference to Exhibit 10.118 to the Company’s Quarterly Report on Form 10-Q filed on May 10, 2006). |
10.56 | | Amendment No. 10 to Amended and Restated Master Repurchase Agreement Among Credit Suisse First Boston Mortgage Capital LLC, The New York Mortgage Company LLC, New York Mortgage Funding, LLC and New York Mortgage Trust, Inc. dated as of August 4, 2006 (incorporated by reference to Exhibit 10.119 to the Company’s Quarterly Report on Form 10-Q filed on August 9, 2006). |
10.57 | | Amendment No. 11 to Amended and Restated Master Repurchase Agreement Among Credit Suisse First Boston Mortgage Capital LLC, The New York Mortgage Company LLC, New York Mortgage Funding, LLC and New York Mortgage Trust, Inc. dated as of October 16, 2006 (incorporated by reference to Exhibit 10.120 to the Company’s Quarterly Report on Form 10-Q filed on November 9, 2006). |
10.58 | | Amendment No. 12 to Amended and Restated Master Repurchase Agreement Among Credit Suisse First Boston Mortgage Capital LLC, The New York Mortgage Company LLC, New York Mortgage Funding, LLC and New York Mortgage Trust, Inc. dated as of November 9, 2006 (incorporated by reference to Exhibit 10.121 to the Company’s Quarterly Report on Form 10-Q filed on November 9, 2006). |
10.59 | | Amendment Number One to the Master Repurchase Agreement dated as of December 13, 2005, by and among DB Structured Products, Inc., Aspen Funding Corp., Newport Funding Corp., the Company and NYMC Loan Corporation, dated as of December 12, 2006 (incorporated by reference to Exhibit 10.110.1(a) to the Company’s Current Report on Form 8-K filed on December 15, 2006)January 25, 2008). |
10.60 | | |
| 10.5 | | Registration Rights Agreement, by and among New York Mortgage Trust, Inc. and the Investors listed on Schedule I to the Stock Purchase Agreement, dated as of January 18, 2008 (Incorporated by reference to Exhibit 10.2 to the Company’s Current Report on Form 8-K filed on January 25, 2008). |
| | |
| 10.6 | | Advisory Agreement, by and among New York Mortgage Trust, Inc., Hypotheca Capital, LLC, New York Mortgage Funding, LLC and JMP Asset Management LLC, dated as of January 18, 2008 (Incorporated by reference to Exhibit 10.3 to the Company’s Current Report on Form 8-K filed on January 25, 2008). |
| | |
| 10.7 | | Separation Agreement and General Release, by and between the CompanyNew York Mortgage Trust, Inc. and Steven B. Schnall,David A. Akre, dated as of February 6, 2007 (incorporated3, 2009 (Incorporated by reference to Exhibit 10.1 to the Company’s Current Report on Form 8-K filed on February 14, 2007)4, 2009). |
10.61 | | Separation |
| 10.8 | | Amended and Restated Employment Agreement, and General Release, by and between the CompanyNew York Mortgage Trust, Inc. and Joseph V. Fierro,Steven R. Mumma, dated as of February 6, 2007 (incorporated11, 2009 (Incorporated by reference to Exhibit 10.1 to the Company’s Current Report on Form 8-K filed on February 12, 2009). |
| | |
| 10.9 | | Form of Registration Rights Agreement, by and among New York Mortgage Trust, Inc. and the Investors listed on Schedule A thereto, dated as of February 14, 2008 (Incorporated by reference to Exhibit 10.2 to the Company’s Current Report on Form 8-K filed on February 14, 2007)19, 2008). |
10.62 | | Asset Purchase Agreement, by and among IndyMac Bank, F.S.B., The New York Mortgage Company, LLC and the New York Mortgage Trust, Inc., dated as of February 6, 2007.* |
10.6310.10 | | AssignmentForm of Restricted Stock Award Agreement for Officers (Incorporated by reference to Exhibit 10-1 to the Company’s Current Report on Form 8-K as filed with the Securities and Assumption of Sublease, by and between Lehman Brothers Holdings Inc. and The New York Mortgage Company, LLC, dated as of NovemberExchange Commission on July 14, 2006.*2009.) |
10.64 | | First Amendment to Assignment and Assumption of Sublease, dated as of January 5, 2007, by and between The New York Mortgage Company, LLC and Lehman Brothers Holdings, Inc.* |
10.6510.11 | | Second AmendmentForm of Restricted Stock Award Agreement for Officers (Incorporated by reference to AssignmentExhibit 10-1 to the Company’s Current Report on Form 8-K as filed with the Securities and Assumption of Sublease, dated as of February __, 2007, by and between The New York Mortgage Company, LLC and Lehman Brothers Holdings, Inc.*Exchange Commission on July 14, 2009.) |
| | |
| 12.1 | | Computation of Ratios * |
| | |
| 21.1 | | List of Subsidiaries of the Registrant.* |
| | |
| 23.1 | | Consent of Independent Registered Public Accounting Firm (Grant Thornton LLP).* |
| | |
| 23.2 | | Consent of Independent Registered Public Accounting Firm (Deloitte & Touche LLP).* |
31.1 | | Section 302 Certification of Co-Chief Executive Officer.* |
31.231.1 | | Section 302 Certification of Chief Financial Officer.* |
32.1 | | Section 906 Certification of Co-Chief Executive Officer.* |
32.2 | | Section 906 Certification ofOfficer and Chief Financial Officer.* |
| | | |
| 32.1 | | Section 906 Certification of Chief Executive Officer and Chief Financial Officer.* |
* Filed herewith.