| (i) | ||
| Revise Item | ||
| 1 (Business) and Item | ||
| Condition and Results of |
| Revise Item | ||
| Data) and Item | ||
| (iii) | Revise Item 9A (Controls and Procedures) to clarify that internal control procedures relating to Icon were not evaluated as a part of management’s review of internal controls over financial reporting as of March 31, 2008. |
| Revise Item 15(c) (Financial Statements Required by Regulation S-X) to include the Consolidated Income Statement for the fiscal year ending March 31, 2006, and the Report of independent registered public accounting firm with respect to Eyston Company Limited (the Hong Kong Joint Venture) as required by Regulation S-X. |
Except as described above, no other amendments are being made to the Company’s Annual Report on Form 10-K, filed on July 8, 2008. This Form 10-K/A does not reflect events occurring after the July 8, 2008 filing of our Annual Report on Form 10-K or modify or update the disclosures contained in the Annual Report in any way other than required to include such conformed information as described above.
PART I
ITEM1. | BUSINESS |
General
Universal Security Instruments, Inc. (“we” or “the Company”) designs and markets a variety of popularly-priced safety products consisting primarily of smoke alarms, carbon monoxide alarms and related products. Most of our products require minimal installation and are designed for easy installation by the consumer without professional assistance, and are sold through retail stores. We also market products to the electrical distribution trade through our wholly-owned subsidiary, USI Electric, Inc. (“USI Electric”). The electrical distribution trade includes electrical and lighting distributors as well as manufactured housing companies. Products sold by USI Electric usually require professional installation.
In 1989 we formed a limited liability company under the laws of Hong Kong, as a joint venture with a Hong Kong-based partner to manufacture various products in the Peoples Republic of China (the “Hong Kong Joint Venture”). We currently own a 50% interest in the Hong Kong Joint Venture and are a significant customer of the Hong Kong Joint Venture (46.38%(68.9% and 49.60%46.4% of its sales during fiscal 20072008 and 20062007 respectively), with the balance of its sales made to unrelated customers worldwide.
We import all of our products from various foreign suppliers. For the fiscal year ended March 31, 2007,2008, approximately 65.04%80.0% of our purchases were imported from the Hong Kong Joint Venture and 4.90% of our purchases were imported from our Canadian subsidiaries.Venture.
Our sales for the year ended March 31, 20072008 were $35,823,575$33,871,362 compared to $28,894,101$32,934,388 for the year ended March 31, 2006,2007, an increase of approximately 23.98%2.8%. We reported net income from continuing operations of $5,533,258$2,824,749 in fiscal 2008 compared to income from continuing operations of $6,093,366 in fiscal 2007, compared to net incomea decrease of $4,600,352 in fiscal 2006, an increase of 20.28%53.6%. Included in the fiscal 2007 results are $4,200,921 in sales and a $570,961 net loss by our newly acquired Canadian operations.
The Company was incorporated in Maryland in 1969. Our principal executive office is located at 7-A Gwynns Mill Court, Owings Mills, Maryland 21117, and our telephone number is 410-363-3000. Information about us may be obtained from our website www.universalsecurity.com.www.universalsecurity.com. Copies of our Annual Report on Form 10-K, quarterly reports on Form 10-Q, and current reports on Form 8-K, are available free of charge on our website as soon as they are filed with the Securities and Exchange Commission (SEC) through a link to the SEC’s EDGAR reporting system. Simply select the “Investor Relations” menu item, then click on the “SEC Filings” link. The SEC’s EDGAR reporting system can also be accessed directly at www.sec.govwww.sec.gov.
Safety Products
We market a line of residential smoke alarms under the trade names “USI Electric” and “UNIVERSAL” both of which are manufactured by the Hong Kong Joint Venture.
Our line of smoke alarms consists of battery, electrical and electrical with battery backup alarms. Our products contain different types of batteries with different battery lives, and some with alarm silencers. The smoke alarms marketed to the electrical distribution trade also include hearing impaired and heat alarms with a variety of additional features. We also market outdoor floodlights under the name “Lite Aide(TM),” carbon monoxide alarms, door chimes and ground fault circuit interrupter (GFCI) units.
Our wholly-owned subsidiary, USI Electric. Inc., focuses its sales and marketing efforts to maximize safety product sales, especially smoke alarms and carbon monoxide alarms manufactured by our Hong Kong Joint Venture and marketed to the electrical distribution and retail trade.
Import Matters
We import all of our products. As an importer, we are subject to numerous tariffs which vary depending on types of products and country of origin, changes in economic and political conditions in the country of manufacture, potential trade restrictions and currency fluctuations. We have attempted to protect ourselfourselves from fluctuations in currency exchange rates to the extent possible by negotiating commitments in U.S. dollars.
Our inventory purchases are also subject to delays in delivery due to problems with shipping and docking facilities, as well as other problems associated with purchasing products abroad. Substantially all of our safety products, including products we purchase from our Hong Kong Joint Venture, are imported from the People’s Republic of China. Mechanical steel tubing manufactured for us by Icon is imported by land transport from Canada.
- 3 - -
Sales and Marketing; Customers
We sell our products to various customers, and our total sales market can be divided generally into threetwo categories; sales by the Company, and sales by our USI Electric subsidiary, and sales by Icon.subsidiary.
The Company markets our products to retailers, including wholesale distributors, chain, discount, television retailers and home center stores, catalog and mail order companies and to other distributors (“retailers”). Our products have historically been retailed to “do-it-yourself” consumers by these retailers. We do not currently market any significant portion of our products directly to end users.
The Company’s retail sales are made directly by our employees and by approximately 17 independent sales organizations who are compensated by commissions. Our agreements with these sales organizations are generally cancelable by either party upon 30 days notice. We do not believe that the loss of any one of these organizations would have a material adverse effect upon our business. Sales which are made directly by us are effected by our officers and full-time employees, seven of whom are also engaged in sales, management and training. Sales outside the United States are made by our officers and through exporters, and amounted to less than 5.0%0.3% of total sales in the fiscal years ended March 31, 20072008 and 2006.2007.
Our USI Electric subsidiary markets our products to the electrical distribution trade (primarily electrical and lighting distributors and manufactured housing companies). USI Electric has established a national distribution system with 12 regional stocking warehouses throughout the United States which generally enables customers to receive their orders the next day without paying for overnight freight charges. USI Electric engages sales personnel from the electrical distribution trade and has engaged 27 independent sales organizations which represent approximately 230 sales representatives, some of which have warehouses where USI Electric products are maintained by our sales representatives for sale.
We also market our products through our own sales catalogs and brochures, which are mailed directly to trade customers, and our website. Our customers, in turn, may advertise our products in their own catalogs and brochures and in their ads in newspapers and other media. We also exhibit and sell our products at various trade shows, including the annual National Hardware Show.
Our Icon Canadian subsidiary markets its EMT conduit, other manufactured tubing products and related security products to the electrical distribution trade utilizing its internal sales force and independent representatives.
Hong Kong Joint Venture
We have a 50% interest in the Hong Kong Joint Venture which has manufacturing facilities in the People’s Republic of China, for the manufacturing of certain of our electronic and electrical products.
We believe that the Hong Kong Joint Venture arrangement will ensure a continuing source of supply for a majority of our safety products at competitive prices. During fiscal year 2007, 65.04%2008, 80.0% of our total inventory purchases were made from the Hong Kong Joint Venture. The products produced by the Hong Kong Joint Venture include smoke alarms and carbon monoxide alarms. Changes in economic and political conditions in China or any other adversity to the Hong Kong Joint Venture will unfavorably affect the value of our investment in the Hong Kong Joint Venture and would have a material adverse effect on the Company’s ability to purchase products for distribution.
Our purchases from the Hong Kong Joint Venture represented approximately 46%68.9% of the Hong Kong Joint Venture’s total sales during fiscal 20072008 and 50%46% of total sales during fiscal 2006,2007, with the balance of the Hong Kong Joint Venture’s sales being primarily made in Europe and Australia, to unrelated customers. The Hong Kong Joint Venture’s sales to unrelated customers arewere $9,378,242 in fiscal 2008 and $22,065,702 in fiscal 2007 and $12,506,135 in fiscal 2006.2007. Please see Note D of the Financial Statements for a comparison of annual sales and earnings of the Hong Kong Joint Venture.
- 4 - -
Discontinued Operations
In October 2006, we formed 2113824 Ontario, Inc., an Ontario corporation, as a wholly-owned subsidiary of the Company for the purpose of acquiring a two-thirds interest in two Canadian corporations, International Conduits, Ltd. (Icon) and Intube, Inc. (Intube). Icon and Intube are based in Toronto, Canada and manufacture and distribute electrical mechanical tubing (EMT) steel conduit. Icon also sells home safety products, primarily purchased from the Company, in the Canadian market. The primary purpose of the Icon and Intube acquisition was to expand our product offerings to include EMT steel conduit, and to provide this product and service to the commercial construction market. On April 2, 2007, Icon and Intube were merged under the laws of Ontario to form one corporation.
At the time of our investment in Icon, we projected that our established U.S. sales network would allow us to increase sales of EMT to U.S. customers. Despite our efforts, Icon suffered continuing losses, and we were not successful in increasing Icon’s sales in the face of competition and a downturn in the housing market. On January 29, 2008, Icon received notice from CIT Financial, Ltd. (CIT Canada), Icon’s principal and secured lender, that Icon was in default under the terms of the Credit Agreement dated June 22, 2007 between Icon and CIT Canada and demanding immediate payment of all of Icon’s obligations to CIT Canada under the Credit Agreement. On February 11, 2008, the assets of Icon were placed under the direction of a court appointed receiver.
The assets held in receivership related to the discontinued Canadian operations were adjusted to net realizable value based on management’s estimates. The process of completing the liquidation of Icon’s assets is continuing and the Company believes the process will continue into the second quarter of our 2009 fiscal year. Accordingly, the actual impairment charges actually incurred could differ based on the actual results of the liquidation process.
The results of Icon for the fiscal year ended March 31, 2008 and for the six month period from the date of acquisition (October 1, 2006) to March 31, 2007 have been restated and are presented in our financial statements as the results of discontinued operations, and certain prior year amounts have been restated in order to conform with the current year’s presentation.
Other Suppliers
Certain private label products not manufactured for us by the Hong Kong Joint Venture are manufactured by other foreign suppliers. We believe that our relationships with our suppliers are good. We believe that the loss of our ability to purchase products from the Hong Kong Joint Venture would have a material adverse effect on the Company. The loss of any of our other suppliers would have a short-term adverse effect on our operations, but replacement sources for these other suppliers could be developed.
Competition
In fiscal year 2007,2008, sales of safety products accounted for substantially all of our total sales. In the sale of smoke alarms, we compete in all of our markets with First Alert Firex and Walter Kidde Safety.Portable Equipment, Inc. In the sale of GFCI units, we compete in all our markets with Leviton Manufacturing Co., Inc., Pass & Seymour, Inc., Cooper Wiring Devices and Hubbell, Inc. All of these companies have greater financial resources and financial strength than we have. We believe that our safety products compete favorably in the market primarily on the basis of styling, features and pricing.
The safety industry in general involves changing technology. The success of our products may depend on our ability to improve and update our products in a timely manner and to adapt to new technological advances.
Employees
As of March 31, 2007, including the employees or our consolidated Canadian subsidiaries,2008, we had 3419 employees, 1614 of whom are engaged in administration and sales, and the balance of whom are engaged in product development, manufacturing and servicing. Our employees are not unionized, and we believe that our relations with our employees are satisfactory.
Fiscal Year Ended March 31, 2007 | |||||||
| First Quarter | High | $ | 24.45 | ||||
| Low | $ | 17.75 | |||||
| Second Quarter | High | $ | 26.93 | ||||
| Low | $ | 20.97 | |||||
| Third Quarter | High | $ | 30.25 | ||||
| Low | $ | 20.47 | |||||
| Fourth Quarter | High | $ | 35.04 | ||||
| Low | $ | 25.80 | |||||
Fiscal Year Ended March 31, 2006 | |||||||
| First Quarter | High | $ | 14.63 | ||||
| Low | $ | 9.00 | |||||
| Second Quarter | High | $ | 14.63 | ||||
| Low | $ | 11.25 | |||||
| Third Quarter | High | $ | 14.25 | ||||
| Low | $ | 12.01 | |||||
| Fourth Quarter | High | $ | 18.12 | ||||
| Low | $ | 12.34 |
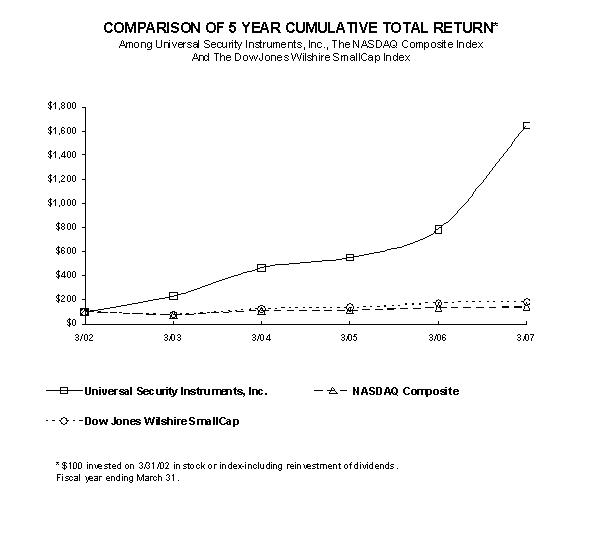
Total Return Analysis | |||||||||||||||||||
| 3/31/2002 | 3/31/2003 | 3/31/2004 | 3/31/2005 | 3/31/2006 | 3/31/2007 | ||||||||||||||
Universal Security Instruments, Inc. | $ | 100.00 | $ | 230.00 | $ | 462.16 | $ | 552.07 | $ | 785.59 | $ | 1,650.45 | |||||||
Nasdaq Composite | $ | 100.00 | $ | 72.11 | $ | 109.76 | $ | 111.26 | $ | 132.74 | $ | 139.65 | |||||||
Dow Jones Wilshire SmallCap | $ | 100.00 | $ | 75.37 | $ | 124.70 | $ | 134.62 | $ | 169.50 | $ | 182.73 | |||||||
| Year Ended March 31, | ||||||||||||||||
| 2007 | 2006 | 2005 | 2004 | 2003 | ||||||||||||
Statement of Operations Data: | ||||||||||||||||
| Net sales | $ | 35,823,575 | $ | 28,894,101 | $ | 23,465,443 | $ | 17,201,116 | $ | 15,953,883 | ||||||
| Income before equity in earnings of Hong Kong Joint Venture and income taxes | 3,008,597 | 2,394,258 | 765,742 | 429,716 | 279,615 | |||||||||||
| Net income | 5,533,258 | 4,600,352 | 3,417,854 | 2,571,026 | 2,400,318 | |||||||||||
| Per common share: | ||||||||||||||||
| Net income | - | |||||||||||||||
| Basic | 2.31 | 2.06 | 1.60 | 1.27 | 1.25 | |||||||||||
| Diluted | 2.23 | 1.89 | 1.46 | 1.12 | 1.15 | |||||||||||
| Weighted average number of common shares outstanding | ||||||||||||||||
| Basic | 2,398,284 | 2,228,908 | 2,136,599 | 2,022,461 | 1,924,585 | |||||||||||
| Diluted | 2,484,606 | 2,432,705 | 2,352,632 | 2,300,275 | 2,082,327 | |||||||||||
Balance Sheet Data: | ||||||||||||||||
| Total assets | 36,195,468 | 20,358,603 | 16,049,948 | 11,098,916 | 8,382,043 | |||||||||||
| Long-term debt (non-current) | 168,062 | - | - | - | 7,224 | |||||||||||
| Working capital (1) | 10,177,983 | 9,911,628 | 6,317,231 | 4,200,170 | 2,377,688 | |||||||||||
| Current ratio (1) | 1.90:1 | 4.60:1 | 3.00:1 | 3.21:1 | 2.26:1 | |||||||||||
| Shareholders’ equity | 24,671,881 | 17,606,569 | 12,897,668 | 9,198,273 | 6,493,415 | |||||||||||
| Quarter Ended | |||||||||||||
| June 30, | September 30, | December 31, | March 31, | ||||||||||
| 2007 | |||||||||||||
| Net sales | $ | 8,038,437 | $ | 8,018,088 | $ | 8,620,893 | $ | 11,146,157 | |||||
| Gross profit | 2,780,517 | 2,607,922 | 2,795,342 | 2,492,889 | |||||||||
| Net income | 1,577,468 | 1,416,204 | 1,712,883 | 826,703 | |||||||||
| Net income per share - basic | 0.68 | 0.59 | 0.70 | 0.34 | |||||||||
| Net income per share - diluted | 0.62 | 0.57 | 0.70 | 0.34 | |||||||||
| 2006 | |||||||||||||
| Net sales | $ | 6,923,810 | $ | 7,119,100 | $ | 7,353,597 | $ | 7,497,594 | |||||
| Gross profit | 2,048,954 | 2,278,838 | 2,549,300 | 2,580,060 | |||||||||
| Net income | 889,770 | 1,162,695 | 1,456,809 | 1,091,078 | |||||||||
| Net income per share - basic | 0.40 | 0.52 | 0.65 | 0.49 | |||||||||
| Net income per share - diluted | 0.37 | 0.48 | 0.60 | 0.44 | |||||||||
MANAGEMENT’S DISCUSSION AND ANALYSIS OF FINANCIAL CONDITION AND RESULTS OF OPERATIONS |
Forward-Looking Statements
When used in this discussion and elsewhere in this Annual Report on Form 10-K, the words or phrases “will likely result,” “are expected to,” “will continue,” “is anticipated,” “estimate,” “project” or similar expressions are intended to identify “forward-looking statements” within the meaning of the Private Securities Litigation Reform Act of 1995. We caution readers not to place undue reliance on any such forward-looking statements, which speak only as of the date made, and readers are advised that various factors, including the Risk Factors discussed elsewhere in this Annual Report and other risks, could affect our financial performance and could cause our actual results for future periods to differ materially from those anticipated or projected. We do not undertake and specifically disclaim any obligation to update any forward-looking statements to reflect occurrence of anticipated or unanticipated events or circumstances after the date of such statements.
General
We are in the business of marketing and distributing safety and security products which are primarily manufactured through our 50% owned Hong Kong Joint Venture. InFrom October 2006 through January 2008, we also were engaged in the third quartermanufacture and distribution of fiscal 2007, we expandedEMT steel conduit through Icon, our business with the acquisition of ourmajority-owned Canadian EMT conduit subsidiary. Our financial statements detail our sales and other operational results only, and report the financial results of the Hong Kong Joint Venture using the equity method. Accordingly, the following discussion and analysis of the fiscal years ended March 31, 2008, 2007 2006 and 20052006 relate to the operational results of the Company and its consolidated subsidiaries only (including our new Canadian EMT conduit business), and includes the Company’s equity share of earnings in the Hong Kong Joint Venture. A discussion and analysis of the Hong Kong Joint Venture’s operational results for these periods is presented below under the heading “Hong Kong Joint Venture.”
Discontinued Canadian Operations
In October 2006, we formed 2113824 Ontario, Inc., an Ontario corporation, as a wholly-owned subsidiary of the Company for the purpose of acquiring a two-thirds interest in two Canadian corporations, International Conduits, Ltd. (Icon) and Intube, Inc. (Intube). Icon and Intube are based in Toronto, Canada and manufacture and distribute electrical mechanical tubing (EMT) steel conduit. Icon also sells home safety products, primarily purchased from the Company, in the Canadian market. The primary purpose of the Icon and Intube acquisition was to expand our product offerings to include EMT steel conduit, and to provide this product and service to the commercial construction market. On April 2, 2007, Icon and Intube were merged under the laws of Ontario to form one corporation.
In June 2007, Icon entered into a credit agreement with CIT Financial, Ltd. to provide a term loan and a line of credit facility. These loans are secured by all of the assets of Icon and by the corporate guarantees of the Company and our USI Electric subsidiary.
As a result of continuing losses at Icon, we undertook an evaluation of the goodwill from our acquisition of Icon to determine whether the value of the goodwill has been impaired in accordance with FAS No. 142, “Goodwill and Other Intangible Assets”. Based on that evaluation, we determined that the value of the goodwill from our acquisition of Icon was impaired, and we recognized an impairment charge of US$1,926,696 for the goodwill as of December 31, 2007. The impairment has been recorded in discontinued operations in the consolidated statements of operations.
At the time of our investment in Icon, we projected that our established U.S. sales network would allow us to increase sales of EMT to U.S. customers. Despite our efforts, Icon suffered continuing losses, and we were not successful in increasing Icon’s sales in the face of competition and a weakening U.S. dollar. On January 29, 2008, Icon received notice from CIT Financial, Ltd. (CIT Canada), Icon’s principal and secured lender, that Icon was in default under the terms of the Credit Agreement dated June 22, 2007 between Icon and CIT Canada and demanding immediate payment of all of Icon’s obligations to CIT Canada under the Credit Agreement. On February 11, 2008, the assets of Icon were placed under the direction of a court appointed receiver, and the operations of Icon were suspended. Accordingly, the assets and liabilities of Icon are classified as assets held in receivership in our consolidated balance sheet. Our consolidated financial statements and the related note disclosures reflect the operations of Icon as discontinued operations for all periods presented.
- 6 - -
As a result of Icon’s receivership and the steps taken to liquidate Icon’s assets, we have written down the non cash assets of Icon to their estimated net realizable value as of March 31, 2008. At March 31, 2008, the assets of Icon held by the receiver consist of cash of $823,550, trade accounts receivable (net of allowance for doubtful accounts of $249,962) of $371,793, inventories (net of allowance for excess and obsolete inventory of $500,000) of $817,022, and prepaid expenses of $6,811, amounting to total current assets of $2,019,176. Property, plant and equipment with a book value of $4,387,536 is shown net of a an impairment charge of $3,555,981 at a contractual sales value of $831,555. The total value of assets net of applicable allowances and impairment reserves at March 31, 2008 is $2,850,731.
At March 31, 2008, the liabilities of Icon held by the receiver include trade accounts payable to unsecured creditors of $3,208,548, secured notes payable to CIT Financial, Ltd. of $4,478,826 and other secured amounts payable of $136,076. The total liabilities of Icon at March 31, 2008 are $7,823,450.
As noted above, the assets held for sale related to the discontinued Canadian operations were adjusted to net realizable value based on management’s estimates. The process of completing the liquidation of Icon’s assets is continuing and the Company believes the process will continue into the second quarter of our 2009 fiscal year. Accordingly, the actual impairment charges actually incurred could differ based on the actual results of the liquidation process.
We anticipate that Icon’s obligations will be settled in the Ontario receivership action during the Company’s fiscal year ending March 31, 2009. As a result of the settlement of Icon’s obligations, we expect that the Company will record a gain of between $3,750,000 and $4,250,000 due to the characterization of debt abatement caused by the difference between Icon’s total obligations and the net proceeds of the liquidation of Icon’s assets.
The results of Icon for the fiscal year ended March 31, 2008 and for the six month period from the date of acquisition (October 1, 2006) to March 31, 2007 have been restated and are presented in our financial statements as the results of discontinued operations, and certain prior year amounts have been restated in order to conform with the current year’s presentation.
Comparison of Results of Operations for the Years Ended March 31, 2008, 2007 2006 and 20052006
Sales. In fiscal year 2007,2008, our net sales increased by $6,929,474 (23.98%$936,974 (2.8%), from $32,934,388 in fiscal 2007 to $33,871,362 in fiscal 2008. Sales to the electrical distribution trade through our USI Electric subsidiary decreased to $15,178,930, principally due to decreased volume from the U.S. residential construction trade (from approximately $19,916,690 in 2007) and also due to our inability to import GFCI devices because the manufacturer has not yet received certifications for mandated changes to the devices. The Company increased its sales to retail and wholesale customers in the fiscal year ended March 31, 2008 to $18,692,432 from $13,017,698 at March 31, 2007, principally as a result of sales to a national home improvement retailer. This increase resulted from higher sales volume despite lower contractual pricing to the national home improvement retailer customer.
In fiscal year 2007, sales increased by $4,040,287 (13.9%) from $28,894,101 in fiscal 2006 to $35,823,575$32,934,388 in fiscal 2007. Sales to the electrical distribution trade through our USI Electric subsidiary decreased to $19,916,690, principally due to decreased volume from the U.S. residential construction trade (from approximately $21,260,000 in 2006). The Company increased its sales to retail and wholesale customers in the fiscal year ended March 31, 2007 to $11,705,964$13,017,698 from $7,634,030 at March 31, 2006, principally as a result of sales to a national home improvement retailer. Consolidated netThis increase resulted from higher sales include net sales of our Canadian subsidiary of $4,200,921.
Gross Profit. Gross profit margin is calculated as net sales less cost of goods sold expressed as a percentage of net sales. Our gross profit margin for the fiscal year ended March 31, 20072008 was 29.80%23.2% compared to 32.73%31.6% and 31.19%32.7% in fiscal 20062007 and 2005,2006, respectively. The decreasedecreases in 2008 and 2007 gross margins isfrom the respective prior years are attributed to lower gross margins on retailour increased sales to a national home improvement retailer and toour lower gross profit realized by our Canadian operations,margins on those sales, and due to significantly lower GFCI sales as further explained below. The increase in gross margin in the fiscal year ended March 31, 2006 over 2005 reflects variations in the mix of products sold and is a function of higher sales, since certain fixed costs do not increase at the same rate as sales.previously indicated.
- 7 - -
Interest Income and Expense. Interest expense for fiscal 2008 increased to $46,349 from $0 in fiscal 2007 primarily due to the timing of activity in our line of credit. Interest expense for fiscal 2007 increaseddecreased to $73,517$0 from $48,999 in fiscal 2006 primarily due to increased borrowing. Interest expense for fiscal 2006 decreased to $48,999 from $85,521the timing of activity in fiscal 2005 primarily due to less borrowing.our line of credit .. The majority of the Company’s cash balances are maintained on deposit with the Company’s factor and earn interest at the factor’s prime rate of interest minus 3%. During the fiscal year ended March 31, 2007,2008, the Company earned interest of $22,023$16,155 on these deposits and $9,668$21,991 on these deposits for the year ended March 31, 2007. The company earned interest of $21,991 for the year ended March 31, 2007 compared to net interest expense of $39,331 in fiscal 2006.
Income Taxes.For the fiscal year ended March 31, 2008, we generated a net operating loss for federal and state income tax purposes of approximately $3,320,000. The loss was generated principally as a result of the impairment of the Company’s investment in and notes and accounts receivable due from the discontinued Canadian subsidiary. Furthermore, we generated foreign tax credits of $132,439 for the fiscal year ended March 31, 2008. We will elect to carry our net operating loss of forward to offset future taxable income. In addition, we have foreign tax credits of approximately $388,744 available to offset future taxes.
During the fiscal year ended 2007, the Company offset the payment of taxes on $3,265,940 of taxable income with the difference between the option price and the exercise price recognized as an employment expense for federal income tax purposes related to employee stock options. For book purposes, this benefit has been treated as an addition to paid-in capital. In addition, the Company offset a portion of its federal taxes of approximately $731,395 with foreign tax credits available as a result of foreign taxes paid on the repatriated earnings of the Hong Kong Joint Venture. The Company hasAt March 31, 2007, we had a foreign tax credit carryforward of $190,887 available to offset future taxes at March 31, 2007.taxes. After application of the deductions and credits identified above, the Company haswe had a net tax liability for federal and state income tax purposes of approximately $337,000.$337,000 with respect to our 2007 fiscal year. The deductions and the income tax credits for foreign income taxes paid resulted in an effective income tax rate of approximately 19.28% for the fiscal year ended March 31, 2007.
Net income also was impacted byIncome. We reported a net loss from our Canadian subsidiary of $570,961. Although no assurances can be given, management believes that actions which Icon is now taking$5,568,914 for fiscal 2008 compared to increase capacity, together with sales efforts by Iconnet income of $5,533,258 for fiscal year 2007 and the Company, will have a positive impact on Icon’s financial results in future periods.
Financial Condition, Liquidity and Capital Resources
Our cash needs are currently met by funds generated from operations and from our Factoring Agreement with CIT Group, which supplies both short-term borrowings and letters of credit to finance foreign inventory purchases. The maximum we may borrow under this Agreement is $7,500,000. Based on specified percentages of our accounts receivable and inventory and letter of credit commitments, at March 31, 2007,2008, our maximum borrowing availability under this Agreement is $6,751,563.$5,200,000. Any outstanding principal balance under this Agreement is payable upon demand. The interest rate on the Factoring Agreement, on the uncollected factored accounts receivable and any additional borrowings is equal to the prime rate of interest charged by the factor which, as of March 31, 2007,2008, was 8.25%6.0%. Any borrowings are collateralized by all our accounts receivable and inventory. During the year ended March 31, 2007,2008, working capital (computed as the excess of current assets over current liabilities) increaseddecreased by $266,355,$7,210,068, from $9,911,628$14,678,615 on March 31, 2006,2007, to $10,177,983$7,468,547 on March 31, 2007.2008. This decrease in working capital is due to the decrease in working capital of the discontinued operations of the Canadian subsidiary amounting to $10,332,091, primarily relating to impairment charges recognized and the new debt related to the Canadian operations, offset by an increase in the working capital of the continuing operations of $3,122,023.
Our operating activities usedprovided cash of $3,169,647$2,349,563 for the year ended March 31, 2007.2008. For the fiscal year ended March 31, 2006,2007, operating activities providedused cash of $1,776,297. This decrease$3,372,328. The decreased use of $4,945,944cash by operating activities was primarily due to increasesan increase in deferred tax assets and a reduction in accounts receivable, inventorypayable and prepaidaccrued expenses, generated by U.S. operations associated with sales to a national home improvement retailer and associated with the Canadian operations, and to the decreased earnings of our Hong Kong Joint Venture. These decreasesuses were partially offset by increasesdecreases in accounts payablereceivable and accrued expenses associated with the Canadian operations.amounts due from factor and decreases in inventories.
Our investing activities used cash of $1,139,562$543,962 during fiscal 2007 and provided cash2008 principally as a result of $1,091,358 during fiscal 2006. This decrease resulted primarily from our acquisitionthe change in net assets of the discontinued operations of the Canadian operationssubsidiary and our subsequent purchasesused cash of machinery and equipment to be utilized in the Canadian operations, partially offset by distributions from the Hong Kong Joint Venture.$1,402,959 during fiscal 2007. During 2007,2008, as in prior years, the Company offset a portion of its distributions from the Hong Kong Joint Venture with amounts due by the Company to the Hong Kong Joint Venture for the purchase of safety products.Venture. The Company offset $250,000 during fiscal 20072008 and $458,940$250,000 during fiscal 20052007 of trade amounts due by it to the Hong Kong Joint Venture in lieu of cash distributions. The Company discloses these payments as a non-cash transaction in its statement of cash flows.
Financing activities in 20072008 provided the Company with cash of $1,566,188. Borrowings of $2,254,966 from our factor provided a portion of the cash used to repay $2,333,036 of debt acquired in the acquisition of the Canadian subsidiaries.$1,976,693. Our net debt repayment was offset by cash provided from the issuance of common stock from the exercise of employee stock options of $585,658$126,678 and the tax benefit of $92,935 associated with the deduction of employment expense related thereto. Financing activities in 20062007 provided cash of $98,549$1,782,152 which was primarily from the exercise of employee stock options.options (and the related tax benefit) and borrowings from our factor.
Hong Kong Joint Venture
The financial statements of the Hong Kong Joint Venture are included in this Form 10-K beginning on page JV-1. The reader should refer to these financial statements for additional information. There are no material Hong Kong -– US GAAP differences in the Hong Kong Joint Venture’s accounting policies.
In fiscal year 2007,2008, sales of the Hong Kong Joint Venture were $41,151,055$30,144,148 compared to $24,811,790$41,151,055 and $25,899,630$24,811,790 in fiscal years 2007 and 2006, and 2005, respectively. The decrease in sales for 2008 was primarily due to decreased sales to non-affiliated customers in Europe. The increase in sales for the 2007 period from the 2006 period was primarily due to increased sales to non-affiliated customers. The decrease in sales for the 2006 period from the 2005 period was primarily due to lower sales to unrelated third parties partially offset byand higher sales to the Company.
Net income was $8,377,365$3,270,926 for fiscal year 20072008 compared to net income of $4,160,935$8,377,365 and $5,005,886$4,160,935 in fiscal years 20062007 and 2005,2006, respectively. The increasedecrease in the current fiscal year is primarily due to increaseddecreased sales volume. Net income for the fiscal year ended March 31, 2006 was decreased by the establishment of a reserve of approximately $535,000 for previously capitalized costs associated with the Hong Kong Joint Venture’s application for listing on the Hong Kong Stock Exchange during the fourth quarter and for the fiscal year ended March 31, 2006. The increase in income for the year ended March 31, 2006 was due primarilyvolume to price increases initiated during the year.unrelated third parties.
Gross margins of the Hong Kong Joint Venture for fiscal 20072008 decreased to 33.42%25.1% from 34.69%33.4% in the prior fiscal year. The primary reason for this decrease was due to variation in product mix. The primary reason for the change in product mix is attributed to the large volume of lower margin sales to the Company designed for the U.S. retail market. At March 31, 2006,2007, the Hong Kong Joint Venture’s gross margin increaseddecreased to 34.69%33.4% from 33.55%34.7% at March 31, 2005.2006. The primary reason for this increasedecrease was higherlower gross margins attributedon sales to price increases initiated during the year.Company for the U.S. retail market.
Selling, general and administrative expenses of the Hong Kong Joint Venture were $4,408,855, $4,789,424 $4,269,714 and $3,495,678$4,269,714 for fiscal years 2008, 2007 2006 and 2005,2006, respectively. As a percentage of sales, these expenses were 12%14.6%, 17%12% and 13%17% for fiscal years 2008, 2007 2006 and 2005,2006, respectively. The increasedecrease in dollars of selling, general and administrative expenses for the year ended March 31, 20062008 was due principally to higher costs, increaseda reduction in management bonuses and legal expense and the expensing of approximately $535,000 of costs previously capitalized associated with the Hong Kong Joint Venture’s application for listing on the Hong Kong Stock Exchange.fees.
Interest expense net of interest income was $52,181$26,932 for fiscal year 2007,2008, compared to $34,130$52,181 and $30,666$34,130 in fiscal years 20062007 and 2005,2006, respectively. The increase in interest expense net of interest income for 20072008 was due to a decrease in investments. The increase from 20052006 to 20062007 is due to variations in the amount of investments in bonds during that fiscal period.
- 9 - -
Cash needs of the Hong Kong Joint Venture are currently met by funds generated from operations. During fiscal year 2007,2008, working capital increased by $5,558,281$1,501,104 from $1,826,756 on March 31, 2006 to $7,385,037 on March 31, 2007.2007 to $8,886,141 on March 31, 2008.
Contractual Obligations and Commitments
The following table presents, as of March 31, 2007,2008, our significant fixed and determinable contractual obligations to third parties by payment date. Further discussion of the nature of each obligation is included in Note F to the consolidated financial statements.
Payment due by period | ||||||||||||||||
Less than | 1-3 | 3-5 | More than | |||||||||||||
Total | 1 year | years | years | 5 years | ||||||||||||
| Operating lease obligations | $ | 765,737 | $ | 312,830 | $ | 452,907 | $ | - | $ | - | ||||||
| Capital lease obligations | 269,737 | 101,675 | 146,621 | 21,441 | - | |||||||||||
| Notes payable | 231,625 | 231,625 | - | - | - | |||||||||||
| Note payable - factor | 2,254,966 | 2,254,966 | - | - | - | |||||||||||
| $ | 3,522,065 | $ | 2,901,096 | $ | 599,528 | $ | 21,441 | $ | - | |||||||
| Payment due by period | ||||||||||||||||||||
| Less than | 1-3 | 3-5 | More than | |||||||||||||||||
| Total | 1 year | years | years | 5 years | ||||||||||||||||
| Operating lease obligations | $ | 160,793 | $ | 68,771 | $ | 62,267 | $ | 29,755 | $ | - | ||||||||||
| Guaranteed obligations of discontinued operations to CIT | 4,478,834 | 4,478,824 | - | - | - | |||||||||||||||
Critical Accounting Policies
Management’s discussion and analysis of our consolidated financial statements and results of operations are based upon our Consolidated Financial Statement included as part of this document. The preparation of these consolidated financial statements requires management to make estimates and judgments that affect the reported amounts of assets, liabilities, revenues and expenses and related disclosures of contingent assets and liabilities. On an ongoing basis, we evaluate these estimates, including those related to bad debts, inventories, income taxes, impairment of long-lived assets, and contingencies and litigation. We base these estimates on historical experiences and on various other assumptions that are believed to be reasonable under the circumstances, the results of which form the basis for making judgments about the carrying values of assets and liabilities that are not readily available from other sources. Actual results may differ from these estimates under different assumptions or conditions.
We believe that the following critical accounting policies affect management’s more significant judgments and estimates used in the preparation of its consolidated financial statements. For a detailed discussion on the application on these and other accounting policies see Note A to the consolidated financial statements included in this Annual Report. Certain of our accounting policies require the application of significant judgment by management in selecting the appropriate assumptions for calculating financial estimates. By their nature, these judgments are subject to an inherent degree of uncertainty and actual results could differ from these estimates. These judgments are based on our historical experience, terms of existing contracts, current economic trends in the industry, information provided by our customers, and information available from outside sources, as appropriate. Our critical accounting policies include:
In accordance with Statement of Financial Accounting Standards No. 94, the financial statements of the Company’s Canadian subsidiary, International Conduits, Ltd. (Icon), are not consolidated with the financial statements of the Company. As a result of the February 11, 2008 court appointed receivership of Icon’s assets, we no longer controlled Icon as of that date. Accordingly, the accounts and operations of Icon in our consolidated financial statements are presented as assets and liabilities held in receivership and as the results of discontinued operations.
Our revenue recognition policies are in compliance with Staff Accounting Bulletin No. 104, “Revenue Recognition in Financial Statements”Statements��� issued by the Securities and Exchange Commission. Revenue is recognized at the time product is shipped and title passes pursuant to the terms of the agreement with the customer, the amount due from the customer is fixed and collectibilitycollectability of the related receivable is reasonably assured. We established allowances to cover anticipated doubtful accounts and sales returns based upon historical experience.
Inventories are valued at the lower of market or cost. Cost is determined on the first-in first-out method. We have recorded a reserve for obsolescence or unmarketable inventory equal to the difference between the cost of inventory and the estimated market value based upon assumptions about future demand and market conditions. Management reviews the reserve quarterly.
We currently have a foreign tax credit carryforward and deferred tax assets resulting from deductible temporary differences, which will reduce taxable income in future periods. We had previously provided a valuation allowance on the deferred tax assets associated with the future tax benefits such as foreign tax credits, foreign net operating losses, capital losses and net operating losses. A valuation allowance is required when it is more likely than not that all or a portion of a deferred tax asset will not be realized. Forming a conclusion that a valuation allowance is not needed is difficult when there is negative evidence such as cumulative losses and losses in recent years. Cumulative losses weigh heavily in the overall assessment. As a result of management’s assessment, the allowance previously provided to offset tax benefits associated with net operating loss carryforwards and other deferred tax assets at March 31, 2007 has been reduced to zero.
- 10 - -
We are subject to lawsuits and other claims, related to patents and other matters. Management is required to assess the likelihood of any adverse judgments or outcomes to these matters, as well as potential ranges of probable losses. A determination of the amount of reserves required, if any, for these contingencies is based on a careful analysis of each individual issue with the assistance of outside legal counsel. The required reserves may change in the future due to new developments in each matter or changes in approach such as a change in settlement strategy in dealing with these matters.
Recently Issued Accounting Pronouncements
Business Combinations: In December 2007, FASB issued SFAS No. 141(R), “Business Combinations,” (“SFAS No. 141(R)”), which replaces SFAS No. 141 and issued SFAS No. 160, “Noncontrolling Interests in Consolidated Financial Statements,” (“SFAS No. 160”), an amendment of Accounting Research Bulletin No. 51. These two new standards will change the accounting for and the reporting for business combination transactions and noncontrolling (minority) interests in the consolidated financial statements, respectively. SFAS No. 141(R) will change how business acquisitions are accounted for and will impact financial statements both on the acquisition date and in subsequent periods. SFAS No. 160 will change the accounting and reporting for minority interests, which will be re-characterized as noncontrolling interests and classified as a component of equity. These two standards will be effective for the Company for financial statements issued for fiscal years beginning after December 31, 2008.
Fair Value Measurements: In September 2007, FASB issued Statement of Financial Accounting Standards No. 157, Fair Value Measurement (SFAS 157). This standard clarifies the principle that fair value should be based on the assumptions that market participants would use when pricing an asset or liability. Additionally, it establishes a fair value hierarchy that prioritizes the information used to develop those assumptions. SFAS 157 is effective for financial statements issued for fiscal years beginning after November 15, 2007.2008. The Company has not yet determined the impact that the implementation of SFAS 157 will have on its results of operations or financial condition.
The Fair Value Option for Financial Assets and Financial Liabilities: In February 2007, the2008, FASB issued SFAS No. 159, The Fair Value Option for Financial Assets and Financial Liabilities, including an amendment of FASB Statements No. 115 (SFAS No. 159). SFAS No. 159 permits entities to choose, at specified election dates, to measure eligible items at fair value (the “fair value option”). A business entity shall report unrealized gains and losses on items for which the fair value option has been elected in earnings at each subsequent reporting period. This accounting standard is effective as of the beginning of an entity’s first fiscal year that begins after November 15, 2007.2008. The effect, if any, of adopting SFAS No. 159 on the Company’s financial position and results of operations has not been finalized.
The financial statements and supplementary data required by this Item 8 are included in the Company’s Consolidated Financial Statements and set forth in the pages indicated in Item 15(a) of this Annual Report.
- 11 - -
We maintain a system of disclosure controls and procedures that is designed to provide reasonable assurance that information, which is required to be disclosed by us in the reports that we file or submit under the Securities and Exchange Act of 1934, as amended (“Exchange Act”), is recorded, processed, summarized and reported within the time periods specified in the rules and forms of the Securities and Exchange Commission, and is accumulated and communicated to management in a timely manner. Our Chief Executive Officer and Chief Financial Officer have evaluated this system of disclosure controls and procedures as of the end of the period covered by this annual report, and believehave concluded that the system is effective. During
Management’s Annual Report on Internal Control over Financial Reporting
Our management, including our Chief Executive Officer and Chief Financial Officer, is responsible for establishing and maintaining adequate internal control over financial reporting, as such term is defined in Rules 13a-15(f) and 15d-15(f) under the third quarter of fiscal 2007, we acquired Icon and Intube. Management is assessing the system of internal controls at the acquired subsidiaries.Exchange Act. Our internal control over financial reporting duringis a process designed to provide reasonable assurance regarding the most recent fiscal year hasreliability of financial reporting and the preparation of our financial statements for external reporting purposes in accordance with U.S. generally accepted accounting principles (GAAP). Internal control over financial reporting includes those policies and procedures that: (i) pertain to the maintenance of records that in reasonable detail accurately and fairly reflect the transactions and dispositions of the assets of the Company; (ii) provide reasonable assurance that transactions are recorded as necessary to permit preparation of financial statements in accordance with US GAAP, and that the Company’s receipts and expenditures are being made only in accordance with authorizations of management and directors of the Company; and (iii) provide reasonable assurance regarding prevention or timely detection of unauthorized acquisition, use, or disposition of the Company’s assets that could have a material effect on the financial statements. Because of its inherent limitations, internal control over financial reporting may not been materially affected,prevent or detect misstatements. Also, projections of any evaluation of effectiveness to future periods are reasonably likelysubject to be materially affected.the risk that controls may become inadequate because of changes in conditions, or that the degree of compliance with policies or procedures may deteriorate.
Management (with the participation of our Chief Executive Officer and Chief Financial Officer) conducted an evaluation of the effectiveness of our internal control over financial reporting based on the framework in Internal Control — Integrated Framework issued by the Committee of Sponsoring Organizations of the Treadway Commission. Based on this evaluation, management concluded that the Company’s internal control over financial reporting was effective as of March 31, 2008.
Effective February 11, 2008, the assets, liabilities and operations of Icon were placed in receivership. Accordingly, internal control procedures relating to the unconsolidated Canadian subsidiary were not evaluated as a part of management’s review of internal control over financial reporting as of March 31, 2008.
Management is aware that there is a lack of segregation of duties at the Company due to the small number of employees dealing with general administrative and financial matters. However, at this time management has decided that considering the employees involved and the control procedures in place, the risks associated with such lack of segregation are insignificant and the potential benefits of adding employees to clearly segregate duties do not justify the expenses associated with such increases. Management will periodically review this situation.
There have been no changes in our internal control over financial reporting during the fourth quarter of fiscal 2008 that have materially affected, or are reasonably likely to materially affect, our internal control over financial reporting.
(a)1. Financial Statements.
| Page | ||
| Report of Independent Registered Public Accounting Firm | F-1 | |
| Consolidated Balance Sheets as of March 31, | F-2 | |
| Consolidated Statements of | F-3 | |
| Consolidated Statements of Shareholders’ Equity for the Years Ended March 31, 2008, 2007 | F-4 | |
| Consolidated Statements of Cash Flows for the Years Ended March 31, 2008, 2007 | F-5 | |
| Notes to Consolidated Financial Statements | F-6 |
(a)3. Exhibits required to be filed by Item 601 of Regulation S-K.
| 23.1 | Consent of |
| Consent of Grant Thornton LLP (Hong Kong)* | ||
| 31.1 | Rule 13a-14(a)/15d-14(a) Certification of Chief Executive Officer* | |
| 31.2 | Rule 13a-14(a)/15d-14(a) Certification of Chief Financial Officer* | |
| 32.1 | Section 1350 Certifications (incorporated by reference to Exhibit |
*Filed herewith
(c)Financial Statements Required by Regulation S-X.
Separate financial statements of the Hong Kong Joint Venture
| Report of Independent Registered Public Accounting Firm | |
| Consolidated Income Statement | |
| Consolidated Balance Sheet | |
| Balance Sheet | |
| Consolidated Statement of Changes in Equity | |
| Consolidated Cash Flow Statement | |
SIGNATURES
Pursuant to the requirements of Section 13 or 15(d) of the Securities Exchange Act of 1934, the registrant has duly caused this report to be signed on its behalf by the undersigned thereunto duly authorized.
| UNIVERSAL SECURITY INSTRUMENTS, INC. | ||
February 13, 2009 | By: | /s/ | ||||
| Harvey B. Grossblatt | ||||||
| Harvey B. Grossblatt | ||||||
REPORT OF INDEPENDENT REGISTERED PUBLIC ACCOUNTING FIRM
To the Shareholders and Board of Directors of Universal Security Instruments, Inc.
We have audited the accompanying consolidated balance sheets of Universal Security Instruments, Inc. and subsidiaries (the Company) as of March 31, 20072008 and 2006,2007, and the related consolidated statements of income,operations, shareholders' equity, and cash flows for each of the three years in the period ended March 31, 2007.2008. Our audits of the basic financial statements included the financial statement schedule listed in the index appearing under Item 15(a)(2). These financial statements and financial statement schedule are the responsibility of the Company's management. Our responsibility is to express an opinion on these financial statements and financial statement schedule based on our audits.
We conducted our audits in accordance with the standards of the Public Company Accounting Oversight Board (United States). Those standards require that we plan and perform the audit to obtain reasonable assurance about whether the financial statements are free of material misstatement. The Company is not required to have, nor were we engaged to perform an audit of its internal control over financial reporting. Our audit included consideration of internal control over financial reporting as a basis for designing audit procedures that are appropriate in the circumstances, but not for the purpose of expressing an opinion on the effectiveness of the Company’s internal control over financial reporting. Accordingly, we express no such opinion. An audit includes examining, on a test basis, evidence supporting the amounts and disclosures in the financial statements, assessing the accounting principles used and significant estimates made by management, as well as evaluating the overall financial statement presentation. We believe that our audits provide a reasonable basis for our opinion.
In our opinion, the consolidated financial statements referred to above present fairly, in all material respects, the financial position of Universal Security Instruments, Inc. and subsidiaries as of March 31, 20072008 and 2006,2007, and the results of their operations and their cash flows for each of the three years in the period ended March 31, 2007,2008, in conformity with accounting principles generally accepted in the United States of America.
As discussed in Note A to the Notes to Consolidated Financial Statements, the Company adopted Financial Interpretation No. 48, “Accounting for Uncertainty in Income Taxes,” effective April 1, 2007.
/s/ GRANT THORNTON LLP
Baltimore, Maryland
July 11, 20073, 2008
F-1
UNIVERSAL SECURITY INSTRUMENTS, INC. AND SUBSIDIARIES
CONSOLIDATED BALANCE SHEETS
| March 31 | |||||||
| 2007 | 2006 | ||||||
ASSETS | |||||||
| CURRENT ASSETS | |||||||
Cash and cash equivalents | $ | 240,545 | $ | 3,015,491 | |||
Accounts receivable: | |||||||
Trade less allowance for doubtful accounts of $15,000 at March 31, 2007 and 2006 | 2,555,895 | 1,106,435 | |||||
Employees | 22,073 | 23,656 | |||||
| 2,577,968 | 1,130,091 | ||||||
Amount due from factor | 7,158,597 | 4,259,131 | |||||
Inventories, net of allowance for obsolete inventory of $40,000 at March 31, 2007 and 2006 | 11,318,734 | 4,062,086 | |||||
Prepaid expenses | 237,666 | 196,863 | |||||
| TOTAL CURRENT ASSETS | 21,533,510 | 12,663,662 | |||||
| DEFERRED TAX ASSET | 808,566 | 476,384 | |||||
| INVESTMENT IN HONG KONG JOINT VENTURE | 9,072,284 | 7,140,859 | |||||
| PROPERTY AND EQUIPMENT - NET | 3,030,060 | 62,212 | |||||
| GOODWILL | 1,732,562 | - | |||||
| OTHER ASSETS | 18,486 | 15,486 | |||||
| TOTAL ASSETS | $ | 36,195,468 | $ | 20,358,603 | |||
LIABILITIES AND SHAREHOLDERS’ EQUITY | |||||||
| CURRENT LIABILITIES | |||||||
| Note payable - factor | $ | 2,254,966 | $ | - | |||
| Notes payable - other | 231,625 | - | |||||
| Current portion of lease obligation | 74,394 | - | |||||
Accounts payable | 6,777,283 | 1,604,845 | |||||
Accrued liabilities: | |||||||
Litigation reserve | 703,193 | 556,787 | |||||
Payroll and employee benefits | 622,083 | 243,197 | |||||
| Commissions and other | 691,981 | 347,205 | |||||
| TOTAL CURRENT LIABILITIES | 11,355,525 | 2,752,034 | |||||
| LONG-TERM OBLIGATIONS | |||||||
| Long-term portion of lease obligation | 168,062 | - | |||||
| COMMITMENTS AND CONTINGENCIES | - | - | |||||
| Minority Interest | - | - | |||||
| SHAREHOLDERS’ EQUITY | |||||||
Common stock, $.01 par value per share; authorized 20,000,000 shares; issued and outstanding 2,475,612 and 2,258,409 shares at March 31, 2007 and March 31, 2006, respectively | 24,756 | 22,584 | |||||
Additional paid-in capital | 13,214,025 | 11,571,939 | |||||
Retained earnings | 11,545,304 | 6,012,046 | |||||
| Other comprehensive loss | (112,204 | ) | - | ||||
| TOTAL SHAREHOLDERS’ EQUITY | 24,671,881 | 17,606,569 | |||||
| TOTAL LIABILITIES AND SHAREHOLDERS’ EQUITY | $ | 36,195,468 | $ | 20,358,603 | |||
The accompanying notes are an integral part of these consolidated financial statements | |||||||
| Years Ended March 31 | ||||||||||
| 2007 | 2006 | 2005 | ||||||||
| Net sales | $ | 35,823,575 | $ | 28,894,101 | $ | 23,465,443 | ||||
| Cost of goods sold | 25,146,905 | 19,436,949 | 16,145,615 | |||||||
| GROSS PROFIT | 10,676,670 | 9,457,152 | 7,319,828 | |||||||
| Research and development expense | 296,534 | 246,875 | 277,540 | |||||||
| Selling, general and administrative expense | 7,290,469 | 6,776,688 | 6,191,025 | |||||||
| Loss on foreign currency transactions | 29,576 | - | - | |||||||
| Operating income | 3,060,091 | 2,433,589 | 851,263 | |||||||
| Other income (expense): | ||||||||||
| Interest expense | (73,517 | ) | (48,999 | ) | (85,521 | ) | ||||
| Interest income | 22,023 | 9,668 | - | |||||||
| (51,494 | ) | (39,331 | ) | (85,521 | ) | |||||
| INCOME BEFORE EQUITY IN EARNINGS OF AFFILIATES | 3,008,597 | 2,394,258 | 765,742 | |||||||
| Equity in earnings of Hong Kong Joint Venture | 3,845,960 | 2,109,594 | 2,370,975 | |||||||
| Net income before income taxes and minority interest | 6,854,557 | 4,503,852 | 3,136,717 | |||||||
| Minority interest | - | - | - | |||||||
| Provision for income tax expense (benefit) | 1,321,299 | (96,500 | ) | (281,137 | ) | |||||
| NET INCOME | $ | 5,533,258 | $ | 4,600,352 | $ | 3,417,854 | ||||
| Net income per share: | ||||||||||
| Basic | $ | 2.31 | $ | 2.06 | $ | 1.60 | ||||
| Diluted | $ | 2.23 | $ | 1.89 | $ | 1.45 | ||||
| Shares used in computing net income per share: | ||||||||||
| Basic | 2,398,284 | 2,228,908 | 2,136,599 | |||||||
| Diluted | 2,484,606 | 2,432,705 | 2,352,632 | |||||||
The accompanying notes are an integral part of these consolidated financial statements | ||||||||||
| March 31 | ||||||||
| 2008 | 2007 | |||||||
| ASSETS | ||||||||
| CURRENT ASSETS | ||||||||
| Cash and cash equivalents | $ | 3,863,784 | $ | - | ||||
| Accounts receivable: | ||||||||
| Trade less allowance for doubtful accounts of $15,000 at March 31, 2008 and 2007 | 146,022 | 1,226,917 | ||||||
| Employees and recoverable taxes | 282,083 | 22,073 | ||||||
| Receivable from Hong Kong Joint Venture | 115,656 | 65,801 | ||||||
| 543,761 | 1,314,791 | |||||||
| Amount due from factor | 5,600,408 | 7,158,597 | ||||||
| Inventories, net of allowance for obsolete inventory of $40,000 at March 31, 2008 and 2007 | 5,357,488 | 8,705,316 | ||||||
| Prepaid expenses | 206,197 | 141,577 | ||||||
| Assets held in receivership | 2,850,731 | 8,881,921 | ||||||
| TOTAL CURRENT ASSETS | 18,422,369 | 26,202,202 | ||||||
| DEFERRED TAX ASSET | 1,914,136 | 756,424 | ||||||
| INVESTMENT IN HONG KONG JOINT VENTURE | 9,986,579 | 9,072,284 | ||||||
| PROPERTY AND EQUIPMENT – NET | 130,347 | 146,072 | ||||||
| OTHER ASSETS | 15,486 | 18,486 | ||||||
| TOTAL ASSETS | $ | 30,468,917 | $ | 36,195,468 | ||||
| LIABILITIES AND SHAREHOLDERS’ EQUITY | ||||||||
| CURRENT LIABILITIES | ||||||||
| Note payable – factor | $ | - | $ | 2,254,966 | ||||
| Accounts payable | 777,342 | 779,192 | ||||||
| Accounts payable – Hong Kong Joint Venture | 1,687,950 | 3,020,091 | ||||||
| Accrued liabilities: | ||||||||
| Litigation reserve | 401,592 | 703,193 | ||||||
| Payroll and employee benefits | 158,057 | 622,083 | ||||||
| Commissions and other | 105,431 | 621,513 | ||||||
| Liabilities held in receivership | 7,823,450 | 3,522,549 | ||||||
| TOTAL CURRENT LIABILITIES | 10,953,822 | 11,523,587 | ||||||
| LONG-TERM OBLIGATIONS | ||||||||
| Long-term obligation - other | 91,160 | - | ||||||
| COMMITMENTS AND CONTINGENCIES | - | - | ||||||
| SHAREHOLDERS’ EQUITY | ||||||||
| Common stock, $.01 par value per share; authorized 20,000,000 shares; issued and outstanding 2,487,867 and 2,475,612 shares at March 31, 2008 and March 31, 2007, respectively | 24,879 | 24,756 | ||||||
| Additional paid-in capital | 13,453,378 | 13,214,025 | ||||||
| Retained earnings | 5,890,023 | 11,545,304 | ||||||
| Other comprehensive income (loss) | 55,655 | (112,204 | ) | |||||
| TOTAL SHAREHOLDERS’ EQUITY | 19,423,935 | 24,671,881 | ||||||
| TOTAL LIABILITIES AND SHAREHOLDERS’ EQUITY | $ | 30,468,917 | $ | 36,195,468 | ||||
Common Stock | |||||||||||||||||||
Shares | Amount | Additional Paid-In Capital | Retained Earnings | Other Comprehensive Income | Total | ||||||||||||||
| Balance at March 31, 2004 | 2,070,528 | $ | 20,705 | $ | 11,183,393 | ($2,005,825 | ) | - | $ | 9,198,273 | |||||||||
| Fractional shares unissued from 4-for-3 split | (173 | ) | (2 | ) | - | - | - | (2 | ) | ||||||||||
| Issuance of common stock from the exercise of employee stock options | 132,375 | 1,324 | 270,551 | (332 | ) | - | 271,543 | ||||||||||||
| Stock issued in lieu of directors’ fees | 1,267 | 13 | 9,990 | (3 | ) | - | 10,000 | ||||||||||||
| Net income | - | - | - | 3,417,854 | - | 3,417,854 | |||||||||||||
| Balance at March 31, 2005 | 2,203,997 | $ | 22,040 | $ | 11,463,934 | $ | 1,411,694 | - | $ | 12,897,668 | |||||||||
| Issuance of common stock from the exercise of employee stock options | 53,805 | 538 | 98,011 | - | - | 98,549 | |||||||||||||
| Stock issued in lieu of directors’ fees | 607 | 6 | 9,994 | - | - | 10,000 | |||||||||||||
| Net income | - | - | - | 4,600,352 | - | 4,600,352 | |||||||||||||
| Balance at March 31, 2006 | 2,258,409 | $ | 22,584 | 11,571,939 | $ | 6,012,046 | - | $ | 17,606,569 | ||||||||||
| Issuance of common stock from the exercise of employee stock options | 217,203 | 2,172 | 583,486 | - | - | 585,658 | |||||||||||||
| Net income | - | - | - | 5,533,258 | - | - | |||||||||||||
| Effect of currency translation | - | - | - | - | (112,204 | ) | - | ||||||||||||
| Comprehensive income | - | - | - | - | - | 5,421,054 | |||||||||||||
| Tax benefit from exercise of stock options | - | - | 1,058,600 | - | - | 1,058,600 | |||||||||||||
| Balance at March 31, 2007 | 2,475,612 | $ | 24,756 | $ | 13,214,025 | $ | 11,545,304 | $ | (112,204 | ) | $ | 24,671,881 | |||||||
The accompanying notes are an integral part of these consolidated financial statements
F-2
UNIVERSAL SECURITY INSTRUMENTS, INC. AND SUBSIDIARIES
CONSOLIDATED STATEMENTS OF OPERATIONS
| Years Ended March 31 | ||||||||||||
| 2008 | 2007 | 2006 | ||||||||||
| Net sales | $ | 33,871,362 | $ | 32,934,388 | $ | 28,894,101 | ||||||
| Cost of goods sold – acquired from Joint Venture | 20,765,906 | 17,399,943 | 15,355,190 | |||||||||
| Cost of goods sold - other | 5,235,400 | 5,105,129 | 4,081,759 | |||||||||
| GROSS PROFIT | 7,870,056 | 10,429,316 | 9,457,152 | |||||||||
| Research and development expense | 364,510 | 296,502 | 246,875 | |||||||||
| Selling, general and administrative expense | 6,124,213 | 6,546,609 | 6,776,688 | |||||||||
| Operating income | 1,381,333 | 3,586,205 | 2,433,589 | |||||||||
| Other income (expense): | ||||||||||||
| Interest expense | (46,349 | ) | - | (48,999 | ) | |||||||
| Interest income | 16,155 | 21,991 | 9,668 | |||||||||
| 30,194 | 21,991 | (39,331 | ) | |||||||||
| INCOME BEFORE EQUITY IN EARNINGS OF JOINT VENTURE | 1,351,139 | 3,608.196 | 2,394,258 | |||||||||
| Equity in earnings of Hong Kong Joint Venture | 1,985,845 | 3,845,960 | 2,109,594 | |||||||||
| Income from continuing operations before income taxes | 3,336,984 | 7,454,156 | 4,503,852 | |||||||||
| Provision for income tax expense (benefit) | 512,235 | 1,360,790 | (96,500 | ) | ||||||||
| INCOME FROM CONTINUING OPERATIONS | 2,824,749 | 6,093,366 | 4,600,352 | |||||||||
| Discontinued operations | ||||||||||||
| Loss from operations of the discontinued Canadian subsidiary (including impairment loss of $9,013,990 in 2008) | (10,242,663 | ) | (590,139 | ) | - | |||||||
| Income tax benefit – discontinued operations | 1,849,000 | 30,031 | - | |||||||||
| Loss from discontinued operations | (8,393,663 | ) | (560,108 | ) | - | |||||||
| NET (LOSS) INCOME | $ | (5,568,914 | ) | $ | 5,533,258 | $ | 4,600,352 | |||||
| Income (loss) per share: | ||||||||||||
| Basic – from continuing operations | $ | 1.14 | $ | 2.54 | $ | 2.06 | ||||||
| Basic – from discontinued operations | $ | (3.38 | ) | $ | (0.23 | ) | $ | - | ||||
| Basic – net (loss) income | $ | (2.24 | ) | $ | 2.31 | $ | 2.06 | |||||
| Diluted – from continuing operations | $ | 1.13 | $ | 2.45 | $ | 1.89 | ||||||
| Diluted – from discontinued operations | $ | (3.35 | ) | $ | (0.23 | ) | $ | - | ||||
| Diluted – net (loss) income | $ | (2.23 | ) | $ | 2.23 | $ | 1.89 | |||||
| Shares used in computing net income per share: | ||||||||||||
| Basic | 2,484,192 | 2,398,284 | 2,228,908 | |||||||||
| Diluted | 2,502,017 | 2,484,606 | 2,432,705 | |||||||||
The accompanying notes are an integral part of these consolidated financial statements
F-3
UNIVERSAL SECURITY INSTRUMENTS, INC. AND SUBSIDIARIES
CONSOLIDATED STATEMENTS OF SHAREHOLDERS’ EQUITY
Common Stock | ||||||||||||||||||||||||
Shares | Amount | Additional Paid-In Capital | Retained Earnings | Other Comprehensive Income | Total | |||||||||||||||||||
| Balance at April 1, 2005 | 2,203,997 | $ | 22,040 | $ | 11,463,934 | $ | 1,411,694 | - | $ | 12,897,668 | ||||||||||||||
| Issuance of common stock from the exercise of employee stock options | 53,805 | 538 | 98,011 | - | - | 98,549 | ||||||||||||||||||
| Stock issued in lieu of directors’ fees | 607 | 6 | 9,994 | - | - | 10,000 | ||||||||||||||||||
| Net income | - | - | - | 4,600,352 | - | 4,600,352 | ||||||||||||||||||
| Balance at March 31, 2006 | 2,258,409 | $ | 22,584 | 11,571,939 | $ | 6,012,046 | - | $ | 17,606,569 | |||||||||||||||
| Issuance of common stock from the exercise of employee stock options | 217,203 | 2,172 | 583,486 | - | - | 585,658 | ||||||||||||||||||
| Stock based compensation | 29,411 | 29,411 | ||||||||||||||||||||||
| Comprehensive income: | - | - | - | - | - | |||||||||||||||||||
| Effect of currency translation | - | - | - | - | (112,204 | ) | - | |||||||||||||||||
| Net income | - | - | - | 5,533,258 | - | 5,421,054 | ||||||||||||||||||
| Tax benefit from exercise of stock options | - | - | 1,029,189 | - | - | 1,029,189 | ||||||||||||||||||
| Balance at March 31, 2007 | 2,475,612 | $ | 24,756 | $ | 13,214,025 | $ | 11,545,304 | $ | (112,204 | ) | $ | 24,671,881 | ||||||||||||
| Recognition of uncertain tax provisions | (86,367 | ) | (86,367 | ) | ||||||||||||||||||||
| Issuance of common stock from the exercise of employee stock options | 12,255 | 123 | 126,555 | - | - | 126,678 | ||||||||||||||||||
| Stock based compensation | 19,863 | 19,863 | ||||||||||||||||||||||
| Comprehensive income: | - | - | - | - | - | |||||||||||||||||||
| Effect of currency translation | - | - | - | 167,859 | - | |||||||||||||||||||
| Net loss | - | - | - | (5,568,914 | ) | - | (5,401,055 | ) | ||||||||||||||||
| Tax benefit from exercise of stock options | - | - | 92,935 | - | - | 92,935 | ||||||||||||||||||
| Balance at March 31, 2008 | 2,487,867 | $ | 24,879 | $ | 13,453,378 | $ | 5,890,023 | $ | 55,655 | $ | 19,423.935 | |||||||||||||
F-4
UNIVERSAL SECURITY INSTRUMENTS, INC. AND SUBSIDIARIES
CONSOLIDATED STATEMENTS OF CASH FLOWS
| Years Ended March 31, | ||||||||||||
| 2008 | 2007 | 2006 | ||||||||||
| CASH FLOWS FROM OPERATING ACTIVITIES | ||||||||||||
| OPERATING ACTIVITIES | ||||||||||||
| Net (loss) income | $ | (5,568,914 | ) | $ | 5,533,258 | $ | 4,600,352 | |||||
| Adjustments to reconcile net income to net cash used in operating activities: | ||||||||||||
| Operations of discontinued subsidiary | 7,904,780 | (167,374 | ) | - | ||||||||
| Depreciation and amortization | 46,503 | 39,449 | 28,338 | |||||||||
| Stock based compensation | 19,863 | 29,411 | ||||||||||
| Stock issued to directors in lieu of fees | - | - | 10,000 | |||||||||
| Increase in deferred taxes | (1,157,711 | ) | (280,040 | ) | (124,604 | ) | ||||||
| Earnings of the Hong Kong Joint Venture | (1,985,845 | ) | (3,845,960 | ) | (2,109,594 | ) | ||||||
| Changes in operating assets and liabilities: | ||||||||||||
| Decrease (increase) in accounts receivable and amounts due from factor | 2,329,219 | (3,084,166 | ) | (958,878 | ) | |||||||
| Decrease (increase) in inventories | 3,347,828 | (4,643,230 | ) | 772,400 | ||||||||
| (Increase) decrease in prepaid expenses | (64,620 | ) | 55,286 | (51,469 | ) | |||||||
| (Decrease) increase in accounts payable and accrued expenses | (2,524,540 | ) | 2,994,038 | (400,248 | ) | |||||||
| Decrease (increase) in other assets | 3,000 | (3,000 | ) | - | ||||||||
| NET CASH PROVIDED (USED IN) BY OPERATING ACTIVITIES | 2,349,563 | (3,372,328 | ) | 1,766,297 | ||||||||
| INVESTING ACTIVITIES: | ||||||||||||
| Cash distributions from Joint Venture | 1,071,549 | 1,914,535 | 1,100,216 | |||||||||
| Purchase of equipment | (30,778 | ) | (123,309 | ) | (8,858 | ) | ||||||
| Activities of discontinued subsidiary | (1,584,733 | ) | (3,194,185 | ) | - | |||||||
| NET CASH (USED IN) PROVIDED BY INVESTING ACTIVITIES | (543,962 | ) | (1,402,959 | ) | 1,091,358 | |||||||
| FINANCING ACTIVITIES: | ||||||||||||
| Activities of discontinued subsidiary | 4,012,046 | (2,087,661 | ) | - | ||||||||
| Borrowing from factor | - | 2,254,966 | - | |||||||||
| Principal payment of notes payable | (2,254,966 | ) | - | - | ||||||||
| Proceeds from issuance of common stock from exercise of employee stock options | 126,678 | 585,658 | 98,549 | |||||||||
| Tax benefit from exercise of stock options | 92,935 | 1,029,189 | - | |||||||||
| NET CASH PROVIDED BY FINANCING ACTIVITIES | 1,976,693 | 1,782,152 | 98,549 | |||||||||
| Effects of exchange rate on cash | 81,490 | (22,356 | ) | - | ||||||||
| INCREASE (DECREASE) IN CASH | 3,863,784 | (3,015,491 | ) | 2,956,204 | ||||||||
| Cash at beginning of period | - | 3,015,491 | 59,287 | |||||||||
| CASH AT END OF PERIOD | $ | 3,863,784 | $ | - | $ | 3,015,491 | ||||||
| Supplemental information: | ||||||||||||
| Interest paid | $ | 30,194 | $ | 23,750 | $ | 48,999 | ||||||
| Income taxes paid | $ | 227,000 | $ | 109,500 | $ | 50,320 | ||||||
| Non-cash investing transactions: | ||||||||||||
| Issuance of 455 shares in 2007 and 950 shares in 2006 in lieu of directors’ fees and accrued compensation | $ | - | $ | - | $ | 10,000 | ||||||
| Offset of trade payables due the Hong Kong Joint Venture in lieu of cash distributions | $ | 250,000 | $ | 250,000 | $ | - | ||||||
| Years Ended March 31, | ||||||||||
| 2007 | 2006 | 2005 | ||||||||
| CASH FLOWS FROM OPERATING ACTIVITIES | ||||||||||
| OPERATING ACTIVITIES | ||||||||||
| Net income | $ | 5,533,258 | $ | 4,600,352 | $ | 3,417,854 | ||||
Adjustments to reconcile net income to net cash used in operating activities: | ||||||||||
| Depreciation and amortization | 150,972 | 28,338 | 34,048 | |||||||
| Stock issued to directors in lieu of fees | - | 10,000 | 10,000 | |||||||
| (Increase) in deferred taxes | (318,227 | ) | (124,604 | ) | (294,881 | ) | ||||
| Earnings of the Hong Kong Joint Venture | (3,845,960 | ) | (2,109,594 | ) | (2,485,302 | ) | ||||
| Changes in operating assets and liabilities: | ||||||||||
| (Increase) in accounts receivable and amounts due from factor | (3,187,222 | ) | (958,878 | ) | (1,204,719 | ) | ||||
| (Increase) decrease in inventories | (5,430,731 | ) | 772,400 | (1,966,836 | ) | |||||
| Decrease (increase) in prepaid expenses | 28,079 | (51,469 | ) | (38,342 | ) | |||||
| Increase (decrease) in accounts payable and accrued expenses | 3,903,184 | (400,248 | ) | 1,430,096 | ||||||
| Increase in other assets | (3,000 | ) | - | - | ||||||
| NET CASH (USED IN) PROVIDED BY OPERATING ACTIVITIES | (3,169,647 | ) | 1,766,297 | (1,098,082 | ) | |||||
| INVESTING ACTIVITIES: | ||||||||||
| Cash distributions from Joint Venture | 1,914,535 | 1,100,216 | 727,167 | |||||||
| Purchase of equipment | (1,130,474 | ) | (8,858 | ) | (22,307 | ) | ||||
| Acquisition of subsidiaries, net of cash acquired | (1,923,623 | ) | - | - | ||||||
| NET CASH (USED IN) PROVIDED BY INVESTING ACTIVITIES | (1,139,562 | ) | 1,091,358 | 704,860 | ||||||
| FINANCING ACTIVITIES: | ||||||||||
| Borrowing from factor | 2,254,966 | - | - | |||||||
| Principal payment of notes payable | (2,333,036 | ) | - | - | ||||||
| Principal payments of lease obligations | - | - | (7,224 | ) | ||||||
| Proceeds from issuance of common stock from exercise of employee stock options | 585,658 | 98,549 | 271,543 | |||||||
| Tax benefit from exercise of stock options | 1,058,600 | - | - | |||||||
| NET CASH PROVIDED BY FINANCING ACTIVITIES | 1,566,188 | 98,549 | 264,319 | |||||||
| Effects of exchange rate on cash | (31,925 | ) | - | - | ||||||
| (DECREASE) INCREASE IN CASH | (2,774,946 | ) | 2,956,204 | (128,903 | ) | |||||
| Cash at beginning of period | 3,015,491 | 59,287 | 188,190 | |||||||
| CASH AT END OF PERIOD | $ | 240,545 | $ | 3,015,491 | $ | 59,287 | ||||
| Supplemental information: | ||||||||||
| Interest paid | $ | 73,517 | $ | 48,999 | $ | 85,521 | ||||
| Income taxes paid | $ | 109,500 | $ | 50,320 | $ | 17,000 | ||||
| Non-cash investing transactions: | ||||||||||
Issuance of 455 shares in 2006 and 950 shares in 2005 in lieu of directors’ fees and accrued compensation | $ | - | $ | 10,000 | $ | 10,000 | ||||
| Offset of trade payables due the Hong Kong Joint Venture in lieu of cash Distributions | $ | 250,000 | $ | - | $ | 458,940 | ||||
The accompanying notes are an integral part of these consolidated financial statements | ||||||||||
The accompanying notes are an integral part of these consolidated financial statements
F-5
UNIVERSAL SECURITY INSTRUMENTS, INC. AND SUBSIDIARIES
NOTES TO CONSOLIDATED FINANCIAL STATEMENTS
NOTE A -– NATURE OF BUSINESS AND SUMMARY OF SIGNIFICANT ACCOUNTING POLICIES
Nature of Business: The Company’s primary business is the sale of smoke alarms and other safety products to retailers, wholesale distributors and to the electrical distribution trade which includes electrical and lighting distributors as well as manufactured housing companies. The Company imports all of its safety and other products from foreign manufacturers. The Company, as an importer, is subject to numerous tariffs which vary depending on types of products and country of origin, changes in economic and political conditions in the country of manufacture, potential trade restrictions and currency fluctuations. During the third quarter of fiscal 2007, the Company acquired two Canadian subsidiaries, International Conduit, Inc. (Icon) and Intube, Inc. (Intube), whose primary business is the manufacture and sale of EMT steel conduit to the commercial construction market in Canada and in the United States. On February 11, 2008, the assets of Icon were placed under the direction of a court appointed receiver, the operations of Icon were suspended and the assets of Icon are classified as Assets held for sale in the consolidated balance sheet. Accordingly, the consolidated financial statements and the related note disclosures reflect the operations of Icon as discontinued operations for all periods presented.
Principles of Consolidation: The consolidated financial statements include the accounts of the Company and its wholly owned subsidiaries. In accordance with Statement of Financial Accounting Standards No. 94, the financial statements of the Company’s Canadian subsidiary, International Conduits, Ltd. (Icon), are not consolidated with the financial statements of the Company. As a result of the February 11, 2008 court appointed receivership of Icon’s assets, we no longer controlled Icon as of that date. Accordingly, the assets, liabilities and majority owned subsidiaries.operations of Icon held in receivership are shown in the consolidated financial statements as assets and liabilities held in receivership and as the results from discontinued operations. All significant intercompany accounts and transactions have been eliminated in consolidation. We believe that our 50% ownership interest in the Hong Kong Joint Venture allows us to significantly influence the operations of the Hong Kong Joint Venture. As such, we account for our interest in the Hong Kong Joint Venture using the equity method of accounting. We have included our investment balance as a non-current asset and have included our share of the Hong Kong Joint Venture’s income in our consolidated statement of operations. The investment and earnings are adjusted to eliminate intercompany profits.
Use of Estimates: In preparing financial statements in conformity with accounting principles generally accepted in the United States of America (US GAAP), management is required to make estimates and assumptions that affect the reported amounts of assets and liabilities, the disclosure of contingent assets and liabilities at the date of the financial statements and the reported amounts of revenues and expenses during the reporting period. Actual results could differ from those estimates.
Revenue Recognition: We recognize sales upon shipment of products, when title has passed to the buyer, net of applicable provisions for any discounts or allowances. We recognize revenue when the following criterion are met: evidence of an arrangement, fixed and determinable fee, delivery has taken place, and collectibilitycollectability is reasonably assured. Customers may not return, exchange or refuse acceptance of goods without our approval. We have established allowances to cover anticipated doubtful accounts based upon historical experience.
Warranties: We generally provide warranties, on the safety products, from one to ten years to the non-commercial end user on all products sold. The manufacturers of our safety products provide us with a one-year warranty on all products we purchase for resale. Claims for warranty replacement of products beyond the one-year warranty period covered by the manufacturers have not been historically material and we do not record estimated warranty expense or a contingent liability for warranty claims.
Stock-Based Compensation: As of March 31, 2007,2008, under the terms of the Company’s Non-Qualified Stock Option Plan, as amended, 1,170,369 shares of our common stock are reserved for the granting of stock options, of which 1,166,137 have been issued, leaving 4,232 available for issuance.
Adoption of SFAS No. 123R. In December 2004, the Financial Accounting Standards Board (FASB) issued SFAS No. 123 (revised 2004), Share-Based Payment, which requires compensation costs related to share-based payment transactions to be recognized in financial statements. SFAS No. 123R eliminates the intrinsic value method of accounting available under Accounting Principles Board (APB) Opinion No. 25, Accounting for Stock Issued to Employees, which generally resulted in no compensation expense being recorded in the financial statements related to the grant of stock options to employees if certain conditions were met.
F-6
Effective April 1, 2006, we adopted SFAS No. 123R using the modified prospective method. Under this method, compensation costs for all awards granted after the date of adoption and the unvested portion of previously granted awards will be measured at an estimated fair value and included in operating expenses or capitalized as appropriate over the vesting period during which an employee provides service in exchange for the award. Accordingly, prior period amounts presented have not been restated to reflect the adoption of SFAS No. 123R.
As a result of adopting SFAS No. 123R, net income for the fiscal year ended March 31, 20072008 was reduced by $29,411.$19,863. No portion of employees’ compensation, including stock compensation expense, was capitalized during the period.
During the fiscal year ended March 31, 2007, 217,2032008, 12,255 shares of our common stock have been issued as a result of the exercise of the options granted under the plan. The tax benefit, for income tax purposes, of $1,058,600$92,935 from the exercise of these stock options is presented as a cash flow from financing activities.
Fair Value Determination. Under SFAS No. 123R, we have elected to continue using the Black-Scholes option pricing model to determine fair value of our awards on date of grant. We will reconsider the use of the Black-Scholes model if additional information becomes available in the future that indicates another model would be more appropriate, or if grants issued in future periods have characteristics that cannot be reasonably estimated under this model.
Stock Option Activity. During the fiscal yearyears ended March 31, 2008 and 2007, no stock options were granted.
Stock Compensation Expense. We have elected to continue straight-line amortization of stock-based compensation expense over the requisite service period. Prior to the adoption of SFAS No. 123R, we recognized the effect of forfeitures in our pro forma disclosures as they occurred. In accordance with the new standard, we have estimated forfeitures and are only recording expense on shares we expect to vest. For the fiscal year ended March 31, 2007,2008, we recorded $29,411$19,863 of stock-based compensation cost as general and administrative expense in our statement of operations. No forfeitures have been estimated.
As of March 31, 2007,2008, there was $27,599$7,736 of unrecognized compensation cost related to share-based compensation arrangements that we expect to vest. This cost will be fully amortized within two years.in the fiscal year ending March 31, 2009. The aggregate intrinsic value of currently exercisable options was $619,505zero at March 31, 2007.2008.
In prior periods, as permitted under Statement of Financial Accounting Standards (SFAS) No. 123, Accounting for Stock-Based Compensation, we accounted for our stock-based compensation plan using the intrinsic value method under the recognition and measurement principles of APB Opinion No. 25. In accordance with the provisions of SFAS No. 148, Accounting for Stock-Based Compensation -– Transition and Disclosure, the following table illustrates the effect on net income and earnings per share if we had applied the fair value recognition provisions of SFAS No. 123 to stock-based employee compensation for the fiscal yearsyear ended March 31, 2006 and 20052006.
| 2006 | ||||
| Net income, as reported | $ | 4,600,352 | ||
| Stock-based employee compensation costs, net of income tax, included in net income | 10,000 | |||
| Deduct: Total stock-based employee compensation expense determined under fair value, net of related tax effects | (138,846 | ) | ||
| Pro forma net income | $ | 4,471,506 | ||
| Earnings per share: | ||||
| Basic - as reported | $ | 2.06 | ||
| Basic - pro forma | 2.00 | |||
| �� | ||||
| Diluted - as reported | 1.89 | |||
| Diluted - pro forma | 1.84 | |||
| 2006 | 2005 | ||||||
| Net income, as reported | $ | 4,600,352 | $ | 3,417,854 | |||
| Stock-based employee compensation costs, net of income tax, included in net income | 10,000 | 10,000 | |||||
| Deduct: Total stock-based employee compensation expense determined under fair value, net of related tax effects | (138,846 | ) | (144,672 | ) | |||
| Pro forma net income | $ | 4,471,506 | $ | 3,283,182 | |||
| Earnings per share: | |||||||
| Basic - as reported | $ | 2.06 | $ | 1.60 | |||
| Basic - pro forma | 2.00 | 1.54 | |||||
| Diluted - as reported | 1.89 | 1.45 | |||||
| Diluted - pro forma | 1.84 | 1.40 | |||||
Research and Development: Research and development costs are charged to operations as incurred.
F-7
Discontinued operations include our unconsolidated Canadian subsidiary, Icon, which was placed into receivership in the fourth quarter of 2008. The results of this business, including the loss on impairment, have been presented as discontinued operations for all periods presented.
The consolidated statements of income include the following in discontinued operations:
| Year ended March 31, | ||||||||
| 2008 | 2007 | |||||||
| Net Sales | $ | 9,729,076 | $ | 2,889,000 | ||||
| Loss before income taxes (including asset impairment loss of $9,013,990) | (10,242,663 | ) | (590,139 | ) | ||||
| Income tax benefit | 1,849,000 | 30,031 | ||||||
| Loss from discontinued operations | $ | (8,393,663 | ) | $ | (560,198 | ) | ||
The major classes of assets and liabilities held in receivership reported as discontinued operations included in the accompanying consolidated balance sheets are shown below.
| Year ended March 31, | ||||||||
| 2008 | 2007 | |||||||
| Assets | ||||||||
| Cash | $ | 823,550 | $ | 240,545 | ||||
| Trade receivables, net | 371,793 | 1,263,177 | ||||||
| Inventories | 817,022 | 2,613,418 | ||||||
| Property, plant and equipment, net | 831,555 | 2,883,988 | ||||||
| Other assets | 6,811 | 1,880,793 | ||||||
| Assets of discontinued operations | $ | 2,850,731 | $ | 8,881,921 | ||||
| Liabilities: | ||||||||
| Accounts payable, trade and other | 3,344,624 | 3,522,549 | ||||||
| Notes payable – bank | 4,478,826 | - | ||||||
| Liabilities of discontinued operations | $ | 7,823,450 | $ | 3,522,549 | ||||
The consolidated asset impairment loss included a write down of inventories, trade accounts receivable, and other assets to their net realizable value, in addition to the write down of property, plant and equipment and the write down of goodwill. Specifically, the impairment loss recorded on the books of Icon included the following:
| Property plant and equipment | $ | 3,750,000 | ||
| Goodwill | 1,926,696 | |||
| Inventory | 1,572,249 | |||
| Accounts receivable | 441,831 | |||
| Costs of disposal | 1,323,214 | |||
| Total | $ | 9,013,990 |
On January 29, 2008, Icon received notice dated January 29, 2008 from CIT Financial, Ltd. (CIT Canada), Icon’s principal and secured lender, that Icon is in default under the terms of the Credit Agreement dated June 22, 2007 between Icon and CIT Canada and demanding immediate payment of all of Icon’s obligations to CIT Canada under the Credit Agreement. Pursuant to the CIT Canada notice, the indebtedness owed by Icon to CIT Canada is CAD $4,578,171 (US $4,478,824). The Company and its wholly owned subsidiary USI Electric, Inc., as previously mentioned, have guaranteed the obligations of Icon under the terms of the aforementioned Credit Agreement.
On February 11, 2008, the assets of Icon were placed under the direction of a court appointed receiver and the continuing operations of Icon ceased. The assets of Icon are held in receivership and proceeds thereof will be used to satisfy outstanding liabilities. The process of completing the liquidation of Icon’s assets is continuing and the Company believes the process will continue into the second quarter of our 2009 fiscal year. Accordingly, the actual impairment charges incurred could differ based on the actual results of the liquidation process.
Universal Security Instruments, Inc. had recorded an investment account, and unsecured loans and advances to the Canadian subsidiaries totaling $5,449,667. The account was written off of Universal Security Instruments, Inc. with a corresponding gain recognized on the discontinued Canadian subsidiary and amounts were netted to zero within the loss from discontinued operations. As a result of writing off this investment account the Company recognized a tax benefit of approximately $1,849,000, which was presented in the results of discontinued operations.
F-8
Business Segments: On February 11, 2008, the assets of Icon were placed under the direction of a court appointed receiver, the operations of Icon have ceased, and the assets of Icon are held in receivership. Accordingly, the results of Icon for the fiscal year ended March 31, 2007, it anticipates that it will sell EMT conduit through its distribution network. Icon’s sales2008, and the results of safety products duringIcon for the six month period endedfrom the date of acquisition to March 31, 2007, totaled $191,832.
| U.S. Operations | Canadian Operations | ||||||
| Sales to external customers | $ | 31,622,654 | $ | 4,200,921 | |||
| Cost of sales | 21,182,485 | 3,964,420 | |||||
| Gross profit | 10,440,169 | 236,501 | |||||
| Selling, general and administrative | 6,811,674 | 624,357 | |||||
| Depreciation | 31,469 | 119,503 | |||||
| Loss on foreign currency transactions | - | 29,576 | |||||
| Operating income (loss) | 3,597,026 | (536,935 | ) | ||||
| Equity in earnings of Joint Venture | 3,845,960 | - | |||||
| Interest income (expense) | 22,023 | (73,517 | ) | ||||
| Net income (loss) before taxes | 7,465,009 | (610,452 | ) | ||||
| Provision for income taxes (benefit) | 1,360,790 | (39,491 | ) | ||||
| Net income (loss) | $ | 6,104,219 | $ | (570,961 | ) | ||
| 31,639,596 | 4,556,131 | ||||||
| Expenditures for segment assets | 123,309 | 1,015,044 | |||||
Accounts Receivable: In September, 2000, the Financial Accounting Standards Board issued Statement of Financial Accounting Standards No. 140, “Accounting for Transfers and Servicing of Financial Assets and Extinguishments of Liabilities” (SFAS No. 140), which is effective for transfers of financial assets occurring after March 31, 2001.
In fiscal year 2002, the Company achieved the sales criteria of SFAS No. 140, and, as such, amounts transferred under the Company’s Factoring Agreement are treated as sales.
Beginning in fiscal year 2002, with the achievement of SFAS 140 sales criteria, the Company nets the factored accounts receivable with the corresponding advance from the Factor, showing the amount net in its consolidated balance sheet.
The Company sells trade receivables on a pre-approved non-recourse basis to the Factor under the Factoring Agreement on an ongoing basis. Factoring charges recognized on sales of receivables are included in selling, general and administrative expenses in the consolidated statements of income and amounted to $223,214, $240,342 $262,670 and $208,913$262,670 for the years ended March 31, 2008, 2007 2006 and 2005,2006, respectively. The Agreement for the sale of accounts receivable provides for continuation of the program on a revolving basis until terminated by one of the parties to the Agreement.
Shipping and Handling Fees and Costs: The Company includes shipping and handling fees billed to customers in net sales. Shipping and handling costs associated with inbound freight are included in cost of goods sold. Shipping and handling costs associated with outbound freight are included in selling, general and administrative expenses and totaled $726,660, $1,042,899 $966,981 and $702,779$966,981 in fiscal years 2008, 2007 2006 and 2005,2006, respectively.
Inventories: Inventories (consisting primarily of finished goods) and with approximately $954,000 of raw material are stated at the lower of cost (first-in, first-out method) or market. Included as a component of finished goods inventory are additional non-material costs. These costs include overhead costs, freight, import duty and inspection fees of $1,086,928$452,856 and $370,419$843,930 at March 31, 20072008 and 2006,2007, respectively. Inventories are shown net of an allowance for inventory obsolescence of $40,000 as of March 31, 20072008 and March 31, 2006.2007.
The Company reviews inventory quarterly to identify slow moving products and valuation allowances are adjusted when deemed necessary.
Property and Equipment: Property and equipment are recorded at cost, less accumulated depreciation and amortization. Depreciation and amortization are provided by using the straight-line method for financial reporting purposes and accelerated methods for income tax purposes. The estimated useful lives for financial reporting purposes are as follows:
| Automotive and truck equipment | - | Shorter of term of lease or life of asset |
| Leasehold improvements | - | Shorter of term of lease or life of asset |
| Machinery and equipment | - | 5 to 10 years |
| Furniture and fixtures | - | 5 to 15 years |
| Computer equipment | - | 5 years |
Impairment of Long-Lived Assets: The Company’s policy is to review its long-lived assets for impairment whenever events or changes in circumstances indicate that the carrying amount of an asset may not be recoverable in accordance with Statement of Financial Accounting Standards (“SFAS”), SFAS No. 144, “Accounting for Impairment or Disposal of Long-Lived Assets”, (“SFAS No. 144”). The Company recognizes an impairment loss when the sum of the expected undiscounted future cash flows is less than the carrying amount of the asset. The measurement of the impairment losses to be recognized is based upon the difference between the fair value and the carrying amount of the assets. During fiscal 2008, the company recognized impairment losses on property and equipment included in assets of approximately $3,750,000, which is included in the loss from discontinued operations.
F-9
Income Taxes: The Company recognizes a liability or asset for the deferred tax consequences of temporary differences between the tax basis of assets or liabilities and their reported amounts in the financial statements. These temporary differences will result in taxable or deductible amounts in future years when the reported amounts of the assets or liabilities are recovered or settled. The deferred tax assets are reviewed periodically for recoverability and valuation allowances are provided, as necessary.
In July 2006, the Financial Accounting Standards Board (“FASB”) issued FASB Interpretation No. 48 (“FIN 48”), “Accounting for Uncertainty in Income Taxes — An Interpretation of FASB Statement No. 109” , which clarifies the accounting for uncertainty in tax positions. FIN 48 requires that the Company recognize the impact of a tax position in the Company’s financial statements if that position is more likely than not to be sustained on audit, based on the technical merits of the position. FIN 48 also provides guidance on derecognition, measurement, classification, interest and penalties, accounting in interim periods, disclosure, and transition. The provisions of FIN 48 are effective as of the beginning of the Company’s 2007 fiscal year, with the cumulative effect of the change in accounting principle recorded as an adjustment to opening retained earnings. See Note F, Income Taxes.
Foreign currency: The Company translates the accounts of its subsidiaries denominated in foreign currencies at the applicable exchange rate in effect at the year end date for balance sheet purposes and at the average exchange rate for the period for statement of income purposes. The related translation adjustments in accumulated other comprehensive income in shareholder’s equity are reported in accumulated other comprehensive income in shareholders’ equity. Transaction gains and losses arising from transactions denominated in foreign currencies are included in the results of operations. The Company maintains cash in foreign banks of $240,545$2,639 to support its operations in Canada and Hong Kong.
Net Income per Share: The Company reports basic and diluted earnings per share. Basic earnings per share is computed by dividing net income for the period by the weighted-average number of common shares outstanding during the period. Diluted earnings per share is computed by dividing net income for the period by the weighted number of common shares and common share equivalents outstanding (unless their effect is anti-dilutive) for the period. All common share equivalents are comprised of exercisable stock options.
| March 31, | ||||||||||
| 2007 | 2006 | 2005 | ||||||||
| Common shares outstanding for basic EPS | 2,398,284 | 2,228,908 | 2,136,599 | |||||||
| Shares issued upon assumed exercise of outstanding stock options | 86,322 | 203,797 | 216,033 | |||||||
| Weighted average number of common and common equivalent shares outstanding for diluted EPS | 2,484,606 | 2,432,705 | 2,352,632 | |||||||
| March 31, | ||||||||||||
| 2008 | 2007 | 2006 | ||||||||||
| Weighted average number of common shares outstanding for basic EPS | 2,484,192 | 2,398,284 | 2,228,908 | |||||||||
| Shares issued upon assumed exercise of outstanding stock options | 17,825 | 86,322 | 203,797 | |||||||||
| Weighted average number of common and common equivalent shares outstanding for diluted EPS | 2,502,017 | 2,484,606 | 2,432,705 | |||||||||
Goodwill: Goodwill represents the excess of the purchase price above the fair value of the net assets acquired. Goodwill is evaluated for impairment annually or when events or circumstances occur indicating that goodwill might be impaired. In accordance with FAS No. 142, “Goodwill and Other Intangible Assets,” the evaluation is a two-step process that begins with an estimation of the fair value of the reporting units. The first step assesses potential impairment and the second step measures that impairment. The measurement of possible impairment is based on the comparison of the fair value of each reporting unit with the book value of its assets.
NOTE B - ACQUISITION
| 2007 | 2006 | ||||||
| Revenue | $ | 40,052,000 | $ | 37,294,000 | |||
| Net earnings | 5,483,000 | 4,694,290 | |||||
| Earnings per share (diluted) | $ | 2.21 | $ | 1.93 | |||
Assets acquired | ||||
| Cash | $ | 48,673 | ||
| Accounts receivable | 1,171,616 | |||
| Inventory | 1,825,917 | |||
| Property and equipment | 1,892,359 | |||
| Other | 82,837 | |||
$ | 5,021,402 | |||
Liabilities Assumed | ||||
| Debt | $ | (2,711,095 | ) | |
| Accounts payable and accruals | (2,123,093 | ) | ||
| Minority interest | (4,800 | ) | ||
| $ | (4,838,988 | ) | ||
| Goodwill | 1,789,882 | |||
| Total consideration | $ | 1,972,296 | ||
Property and equipment consist of the following:
| March 31, | |||||||
| 2007 | 2006 | ||||||
| Automotive and truck equipment | $ | 105,145 | $ | - | |||
| Leasehold improvements | 81,243 | 73,535 | |||||
| Machinery and equipment | 2,882,920 | 158,696 | |||||
| Furniture and fixtures | 343,919 | 197,482 | |||||
| Computer equipment | 216,563 | 88,736 | |||||
| 3,629,790 | 518,449 | ||||||
| Less accumulated depreciation and amortization | (599,730 | ) | (456,237 | ) | |||
| $ | 3,030,060 | $ | 62,212 | ||||
| March 31, | ||||||||
| 2008 | 2007 | |||||||
| Leasehold improvements | $ | 73,535 | $ | 73,535 | ||||
| Machinery and equipment | 163,106 | 163,106 | ||||||
| Furniture and fixtures | 244,994 | 214,216 | ||||||
| Computer equipment | 196,246 | 196,246 | ||||||
| 677,881 | 647,103 | |||||||
| Less accumulated depreciation and amortization | (547,534 | ) | (501,031 | ) | ||||
| $ | 130,347 | $ | 146,072 | |||||
NOTE DC - INVESTMENT IN THE HONG KONG JOINT VENTURE
The Company holds a 50% interest in a Joint Venture with a Hong Kong Corporation, which has manufacturing facilities in the People’s Republic of China, for the manufacturing of consumer electronic products. As of March 31, 2007,2008, the Company has an investment balance of $9,072,284$9,986,579 for its 50% interest in the Hong Kong Joint Venture. There are no material Hong Kong -– US GAAP differences in the Hong Kong Joint Venture’s accounting policies.policies, and there are no material reconciling items generated by Hong Kong – US GAAP differences.
The following represents summarized financial information derived from the audited financial statements of the Hong Kong Joint Venture as of March 31, 20072008 and 20062007 and for the years ended March 31, 2008, 2007 2006 and 2005.
| March 31, | |||||||
| 2007 | 2006 | ||||||
| Current assets | $ | 12,646,261 | $ | 7,402,171 | |||
| Property and other assets | 11,720,713 | 10,911,009 | |||||
| Total | $ | 24,366,974 | $ | 18,313,180 | |||
| Current liabilities | $ | 5,261,224 | $ | 5,575,415 | |||
| Non-current liabilities | 110,389 | 32,870 | |||||
| Equity | 18,995,361 | 12,704,895 | |||||
| Total | $ | 24,366,974 | $ | 18,313,180 | |||
| March 31, | ||||||||
| 2008 | 2007 | |||||||
| Current assets | $ | 14,169,626 | $ | 12,646,261 | ||||
| Property and other assets | 10,334,906 | 11,720,713 | ||||||
| Total | $ | 24,504,532 | $ | 24,366,974 | ||||
| Current liabilities | $ | 5,215,755 | $ | 5,261,224 | ||||
| Non-current liabilities | 82,314 | 110,389 | ||||||
| Equity | 19,206,463 | 18,995,361 | ||||||
| Total | $ | 24,504,532 | $ | 24,366,974 | ||||
| For the Year Ended March 31, | ||||||||||
| 2007 | 2006 | 2005 | ||||||||
| Net sales | $ | 41,151,055 | $ | 24,811,790 | $ | 25,899,630 | ||||
| Gross profit | 13,753,123 | 8,608,220 | 8,689,538 | |||||||
| Net income | 8,377,365 | 4,160,935 | 5,005,886 | |||||||
| For the Year Ended March 31, | ||||||||||||
| 2008 | 2007 | 2006 | ||||||||||
| Net sales | $ | 30,144,148 | $ | 41,151,055 | $ | 24,811,790 | ||||||
| Gross profit | 7,555,705 | 13,753,123 | 8,608,220 | |||||||||
| Net income | 3,270,926 | 8,377,365 | 4,160,935 | |||||||||
During the years ended March 31, 2008, 2007 2006 and 2005,2006, the Company purchased $20,765,906, $19,085,353 $12,321,401 and $10,513,800,$12,321,401, respectively, of finished product from the Hong Kong Joint Venture, which represents 46%79.9%, 66%46% and 68%64%, respectively, of the Company’s total finished product purchases for the years ended at March 31, 2008, 2007 2006 and 2005.2006. Amounts due the Hong Kong Joint Venture included in Accounts Payable totaled $3,270,091$1,632,066 and $500,000$3,020,091 at March 31, 20072008 and 2006,2007, respectively. Amounts due from the Hong Kong Joint Venture included in Accounts Receivable totaled $127,879$177,623 and $48,205$127,879 at March 31, 20072008 and 2006,2007, respectively.
The Company incurred interest costs charged by the Hong Kong Joint Venture of $16,964, $25,000 $37,389 and $17,581$37,389 during the years ended March 31, 2008, 2007 2006 and 2005,2006, respectively, related to its purchases.
The Company’s investment in the Hong Kong Joint Venture as recorded on the Company’s Consolidated Balance Sheets has been adjusted by the intercompany profit of the Hong Kong Joint Venture.
F-11
NOTE ED - AMOUNTS DUE FROM FACTOR
The Company sells certain of its trade receivables on a pre-approved, non-recourse basis to a Factor. Since these are sold on a non-recourse basis, the factored trade receivables and related repayment obligations are not separately recorded in the Company’s consolidated balance sheets. The Agreement provides for financing of up to a maximum of $7,500,000 with the amount available at any one time based on 85% of uncollected non-recourse receivables sold to the factor and 45% of qualifying inventory. Financing of $4,496,597$5,200,000 is available at March 31, 2007.2008. Any outstanding amounts due to the factor are payable upon demand and bear interest at the prime rate of interest charged by the factor, which is 8.25%6.0% at March 31, 2007.2008. Any amount due to the factor is also secured by the Company’s inventory. There were no borrowings of $2,254,966 outstanding under this agreement at March 31, 2007.2008.
Under this Factoring Agreement, the Company sold receivables of approximately $30,316,914$34,350,844 and $26,713,439$30,316,914 during the years ended March 31, 20072008 and 2006,2007, respectively. Gains and losses recognized on the sale of factored receivables include the fair value of the limited recourse obligation. The uncollected balance of non-recourse receivables held by the factor amounted to $7,254,275$5,600,408 and $4,259,131$7,158,597 at March 31, 20072008 and 2006.2007. The amount of the uncollected balance of non-recourse receivables borrowed by the Company as of March 31, 2008 and 2007 is $0 and 2006 is $2,254,966, and $0, respectively. Collected cash maintained on deposit with the factor earns interest at the factor’s prime rate of interest less three percentage points (5.25%(effective rate 3.0% and 5.25%) at March 31, 2008 and 2007, respectively.
NOTE E – CREDIT FACILITY
In June 2007, Icon entered into a Credit Agreement with CIT Financial, Ltd. (CIT Canada) to provide a term loan and 4.75%a line of credit facility.
The term loan in the original principal amount of US$3,000,000 is repayable in thirty-six (36) equal monthly principal installments of US$83,333 plus interest at the Canadian prime rate (effective rate 5.25% at March 31, 2006.2008). The balance outstanding at March 31, 2008 is US$2,353,298 and is included within current liabilities of discontinued operations on the consolidated balance sheet.
The line of credit facility is in the maximum amount of US$7,000,000, with borrowings based on specified percentages of accounts receivable and inventory of Icon. Amounts borrowed under the facility bear interest at the Canadian prime rate (effective rate 5.25% at March 31, 2008) and are payable with interest upon demand. The balance outstanding at March 31, 2008 is US $2,105,457. The CIT Canada loans to Icon are secured by all of the assets of Icon and by corporate guarantees of the Company and our USI Electric subsidiary. As previously disclosed, the Company received a notice of default from CIT Canada on January 29, 2008 demanding immediate payment of all of Icon’s obligations to CIT Canada under the Credit Agreement. Pursuant to the CIT Canada notice, the indebtedness owed by Icon to CIT Canada is CAD $4,578,171 (US $4,478,824) and is included in liabilities held in receivership in the Company’s Consolidated Balance Sheets. The borrowings are anticipated to be repaid in fiscal 2009.
NOTE F - LEASES
During December 1999, the Company entered into an operating lease for its office and warehouse which expires in December 2008. This lease is subject to increasing rentals at 3% per year. In February 2004, the Company entered into an operating lease for an approximately 2,600 square foot office in Naperville, Illinois. This lease expires in February 20092012 with increasing rentals at 3% per year.
| Non-Cancelable | |||||||
| Capital Leases | Operating Leases | ||||||
| 2008 | $ | 101,675 | $ | 312,830 | |||
| 2009 | 101,675 | 286,972 | |||||
| 2010 | 44,946 | 165,935 | |||||
| 2011 | 21,441 | - | |||||
| 2012 | - | - | |||||
| 269,737 | 765,737 | ||||||
| (27,281 | ) | - | |||||
| $ | 242,456 | $ | 765,737 | ||||
| 2009 | 2010 | 2011 | 2012 | Thereafter | ||||||||||||||||
| Future minimum lease payments are as follows: | $ | 96,235 | $ | 35,337 | $ | 32,382 | $ | 28,889 | $ | 0 | ||||||||||
F-12
NOTE G -– INCOME TAXES
Universal Security Instruments, Inc. (“USI”) provides for Income Taxes in accordance with Statement of Financial Accounting Standards No. 109, “Accounting for Income Taxes.” Accordingly, deferred income tax assets and liabilities are computed and recognized for those differences that have future tax consequences and will result in net taxable or deductible amounts in future periods. Deferred tax expense or benefit is the result of changes in the net asset or liability for deferred taxes. The deferred tax liabilities and assets for USI result primarily from reserves, inventories, accrued liabilities and changes in the unremitted earnings of the Hong Kong Joint Venture.
The Company adopted the provisions of FIN 48 on April 1, 2007. As a result of the implementation of FIN 48, the Company recognized a $86,000 increase in the liability for unrecognized tax benefits, which was accounted for as a reduction of the April 1, 2007 retained earnings balance. The total amount of unrecognized tax benefits as of the date of the adoption was approximately $86,000 and includes both income taxes and tax penalties. In years prior to fiscal 2008, interest and penalties related to adjustments to income taxes as filed have not been significant. The Company intends to include such interest and penalties in its tax provision.
For the fiscal year ended March 31, 2008, the Company generated a net operating loss of approximately $3,320,000 that the Company will elect to carryforward to offset future taxable income. In addition, the Company generated $132,439 of foreign tax credits for the period. Accordingly, at March 31, 2008, the Company has $388,744 of foreign tax credit carryforward available to offset future federal income taxes.
At March 31, 2006,2007, the Company had foreign tax credit carryforwards of $685,654 available as a result of foreign taxes paid on the repatriated earnings of the Hong Kong Joint Venture. In addition, the Company generated $236,628 of foreign tax credits during the fiscal year ended March 31, 2007. Approximately $731,395$534,084 of foreign tax credits were used to offset federal taxes at March 31, 2007, resulting in a remaining foreign tax credit carryforward available to offset future taxes of $190,887.
The components of income tax expense (benefit) from continuing operations for the Company are as follows:
| March 31, | ||||||||||
| 2007 | 2006 | 2005 | ||||||||
| Current expense (benefit) | ||||||||||
| U.S. Federal | $ | 1,425,522 | $ | 17,651 | $ | 21,000 | ||||
| U.S. State | 215,308 | 10,453 | 5,250 | |||||||
| Canadian Federal | - | - | - | |||||||
| Canadian Province | - | - | - | |||||||
| 1,640,830 | 28,104 | 26,250 | ||||||||
| Deferred expense (benefit) | (319,531 | ) | (124,604 | ) | (307,387 | ) | ||||
| Total income tax expense (benefit) | $ | 1,321,299 | $ | (96,500 | ) | $ | (281,137 | ) | ||
| March 31, | ||||||||||||
| 2008 | 2007 | 2006 | ||||||||||
| Current expense (benefit) | ||||||||||||
| U.S. Federal | $ | 581,300 | $ | 1,425,522 | $ | 17,651 | ||||||
| U.S. State | 62,300 | 215,308 | 10,453 | |||||||||
| 643,600 | 1,640,830 | 28,104 | ||||||||||
| Deferred expense (benefit) | (131,365 | ) | (280,040 | ) | (124,604 | ) | ||||||
| Total income tax expense (benefit) | $ | 512,235 | $ | 1,360,790 | $ | (96,500 | ) | |||||
Significant components of USI’s |
| March 31, | |||||||
| 2007 | 2006 | ||||||
| Deferred tax assets: | |||||||
| Financial statement accruals and allowances | $ | 473,132 | $ | 360,022 | |||
| Inventory uniform capitalization | 92,752 | 94,741 | |||||
| Other | 12,304 | 0 | |||||
| AMT tax credit carryforward | 0 | 21,621 | |||||
| Foreign tax credit carryforward | 190,887 | 0 | |||||
| Foreign NOL carryforward | 247,313 | 0 | |||||
| Domestic NOL carryforwards and tax credits | 0 | 0 | |||||
| Gross deferred tax assets | 1,016,388 | 476,384 | |||||
| Valuation allowance | (207,822 | ) | 0 | ||||
| Net deferred tax liability (asset) | $ | 808,566 | $ | 476,384 | |||
| March 31, | ||||||||
| 2008 | 2007 | |||||||
| Deferred tax assets: | ||||||||
| Financial statement accruals and allowances | $ | 210,297 | $ | 473,132 | ||||
| Inventory uniform capitalization | 63,052 | 92,405 | ||||||
| Stock option compensation | 7,477 | - | ||||||
| Net operating loss carryforward | 1,245,112 | - | ||||||
| Foreign tax credit carryforward | 388,198 | 190,887 | ||||||
| Net deferred tax asset | $ | 1,914,136 | $ | 756,424 | ||||
F-13
The reconciliation between the statutory federal income tax provision and the actual effective tax provision is as follows:
| Years ended March 31, | ||||||||||
| 2007 | 2006 | 2005 | ||||||||
| Federal tax expense at statutory rate (34%) before loss carryforward | $ | 2,330,549 | $ | 1,577,074 | $ | 1,066,484 | ||||
| Reduction in income taxes arising from carryforward of prior years’ operating losses | - | - | (458,200 | ) | ||||||
| Non-patriated earnings of Hong Kong Joint Venture | (635,549 | ) | (356,143 | ) | (402,855 | ) | ||||
| Employment expense of employee stock options | - | (224,592 | ) | (333,879 | ) | |||||
| Foreign tax credit net of gross up for US portion of foreign taxes | (922,282 | ) | (69,210 | ) | - | |||||
| Change in rates for deferreds | - | (264,630 | ) | - | ||||||
| State income tax expense, net of federal benefit | 195,852 | 10,453 | 5,250 | |||||||
| Change in valuation allowance | 207,822 | (776,523 | ) | (238,791 | ) | |||||
| Foreign rate difference | (5,925 | ) | - | - | ||||||
| Permanent differences | 17,418 | 10,108 | 80,854 | |||||||
| Other | 133,414 | (3,037 | ) | - | ||||||
| Provision for income tax expense (benefit) | $ | 1,321,299 | $ | (96,500 | ) | $ | (281,137 | ) | ||
| Years ended March 31, | ||||||||||||
| 2008 | 2007 | 2006 | ||||||||||
| Federal tax (benefit) expense at statutory rate (34%) before loss carryforward | $ | 1,134,575 | $ | 2,534,402 | $ | 1,577,074 | ||||||
| Non-patriated earnings of Hong Kong Joint Venture | (282,251 | ) | (635,549 | ) | (356,143 | ) | ||||||
| Employment expense of employee stock options | - | - | (224,592 | ) | ||||||||
| Foreign tax credit net of gross up for US portion of foreign taxes | (197,311 | ) | (922,282 | ) | (69,210 | ) | ||||||
| Change in rates for deferreds | - | - | (264,630 | ) | ||||||||
| Reversal of Canadian net operating loss benefit | - | 40,410 | - | |||||||||
| State income tax (benefit) expense, net of federal tax effect | 62,568 | 195,852 | 10,453 | |||||||||
| Change in valuation allowance | - | - | (776,523 | ) | ||||||||
| Foreign rate difference | - | - | - | |||||||||
| Permanent differences | 13,419 | 14,543 | 10,108 | |||||||||
| Change in temporary differences | (218,765 | ) | 133,414 | (3,037 | ) | |||||||
| Provision for income tax expense (benefit) | $ | 512,235 | $ | 1,360,790 | $ | (96,500 | ) | |||||
The Company files its income tax returns in the U.S. federal jurisdiction, and various state jurisdictions.
The Company adopted the provisions of FASB Interpretation No. 48, Accounting for Uncertainty in Income Taxes, on April 1, 2007. As a result of the implementation of Interpretation 48, the Company recognized approximately a $86,000 increase in the liability for unrecognized tax benefits, which was accounted for as a reduction to the April 1, 2007, balance of retained earnings. A reconciliation of the beginning and ending amount of unrecognized tax benefits is as follows:
| Balance at April 1, 2007 | $ | 86,000 | ||
| Additions based on tax positions related to the current year | 150,000 | |||
| Additions for tax positions of prior years | - | |||
| Reductions for tax positions of prior years | - | |||
| Settlements | - | |||
| Balance at March 31, 2008 | $ | 236,000 |
The total liability for unrecognized tax benefits, as of March 31, 2008, was $236,000. That amount, if ultimately recognized, would reduce the Company’s annual effective tax rate.
The Company recognizes interest and penalties accrued related to unrecognized tax benefits as income tax expense. At March 31, 2008, the Company accrued and recognized approximately $5,160 in interest and penalties.
NOTE H - SHAREHOLDERS’ EQUITY
Common Stock - During the year ended March 31, 2007,2008, the Company issued 217,20312,255 shares of its common stock, all of which were issued on the exercise of employee stock options for total proceeds of $585,658.$126,678.
Stock Options - Under terms of the Company’s 1978 Non-Qualified Stock Option Plan, as amended, 877,7771,170,369 shares of common stock are reserved for the granting of stock options, of which 873,5451,166,137 shares have been issued as of March 31, 2007,2008, leaving 4,232 available for issuance upon exercise of options granted, or available for future grants to employees and directors. Under provisions of the Plan, a committee of the Board of Directors determines the option price and the dates exercisable. All options expire five years from the date of grant and have an exercise price at least equal to the market price at the date of grant. The options usually vest at 25% a year over four years. Share amounts have been retroactively adjusted to reflect the 4-for-3 stock dividend paid on October 16, 2006 to shareholders of record on September 25, 2006.2007.
The following tables summarize the status of options under the Non-Qualified Stock Option Plan at March 31, 20072008 and option transactions for the three years then ended:
F-14
| Status as of March 31, 2007 | Number of Shares | |||
| Presently exercisable | 93,998 | |||
| Exercisable in future years | 8,443 | |||
| Total outstanding | 102,441 | |||
| Available for future grants | 4,232 | |||
| Shares of common stock reserved | 106,673 | |||
| Outstanding options: | ||||
| Number of holders | 17 | |||
| Average exercise price per share | $ | 12.60 | ||
| Expiration dates | October 2008 to March 2011 | |||
| Status as of March 31, 2008 | Number of Shares | |||
| Presently exercisable | 86,420 | |||
| Exercisable in future years | 2,501 | |||
| Total outstanding | 88,921 | |||
| Available for future grants | 4,232 | |||
| Shares of common stock reserved | 93,153 | |||
| Outstanding options: | ||||
| Number of holders | 17 | |||
| Average exercise price per share | $ | 12.93 | ||
| Expiration dates | October 2008 to March 2011 | |||
Transactions for the Three Years Ended March 31, 2007: | Number of Shares | Weighted Average Exercise Price | |||||
| Outstanding at April 1, 2004 | 400,149 | ||||||
| Granted | 73,333 | 10.73 | |||||
| Canceled | (445 | ) | 1.97 | ||||
| Exercised | (132,376 | ) | 2.06 | ||||
| Outstanding at March 31, 2005 | 340,661 | ||||||
| Granted | 36,667 | 10.03 | |||||
| Canceled | 0 | 0.00 | |||||
| Exercised | (54,000 | ) | 1.82 | ||||
| Outstanding at March 31, 2006 | 323,328 | ||||||
| Granted | 0 | 0.00 | |||||
| Canceled | (3,684 | ) | 8.51 | ||||
| Exercised | (217,203 | ) | 2.61 | ||||
| Outstanding at March 31, 2007 | 102,441 | ||||||
| Transactions for the Three Years Ended March 31, 2008: | Number of Shares | Weighted Average Exercise Price | ||||||
| Outstanding at April 1, 2005 | 340,661 | |||||||
| Granted | 36,667 | 10.03 | ||||||
| Canceled | 0 | 0.00 | ||||||
| Exercised | (54,000 | ) | 1.82 | |||||
| Outstanding at March 31, 2006 | 323,228 | |||||||
| Granted | 0 | 0.00 | ||||||
| Canceled | (3,684 | ) | 8.51 | |||||
| Exercised | (218,468 | ) | 2.61 | |||||
| Outstanding at March 31, 2007 | 101,176 | |||||||
| Granted | 0 | 0.00 | ||||||
| Canceled | 0 | 0.00 | ||||||
| Exercised | (12,255 | ) | 10.40 | |||||
| Outstanding at March 31, 2008 | 88,921 | |||||||
The following table summarizes information about stock options outstanding at March 31, 2007:2008:
| Options Outstanding | Options Exercisable | |||||||||||||||
Range of Exercise Price | Number of Shares | Weighted Average Exercise Price | Weighted Average Contract Life (Yrs) | Number of Shares | Weighted Average Exercise Price | |||||||||||
| $7.68 to $9.99 | 15,387 | 8.94 | 1.94 | 9,110 | 9.08 | |||||||||||
| $10.00 to $12.99 | 51,328 | 11.27 | 3.00 | 49,162 | 11.27 | |||||||||||
| $13.00 to $16.09 | 35,726 | 16.09 | 4.00 | 35,726 | 16.09 | |||||||||||
| 102,441 | 93,998 | |||||||||||||||
Options Outstanding | Options Exercisable | |||||||||||||||||||
Range of Exercise Price | Number of Shares | Weighted Average Exercise Price | Weighted Average Contract Life (Yrs) | Number of Shares | Weighted Average Exercise Price | |||||||||||||||
| $7.68 to $9.99 | 5,166 | 8.43 | 1.22 | 3,165 | 8.69 | |||||||||||||||
| $10.00 to $12.99 | 49,995 | 11.26 | 1.99 | 49,495 | 11.26 | |||||||||||||||
| $13.00 to $16.09 | 33,760 | 16.09 | 3.00 | 33,760 | 16.09 | |||||||||||||||
| 88,921 | 86,420 | |||||||||||||||||||
The fair value of each stock option is estimated on the date of grant using the Black-Scholes option-pricing model with the following weighted average assumptions in 2006 and 2005;2006; no annual dividends, expected volatility of 36% and 45%, respectively, risk-free interest rate ranging fromof 4.0% to 6.5% and expected lives of five years. The weighted-average fair valuesvalue of the stock options granted in 2006 and 2005 werewas $8.29 and $6.47 per share, respectively.share.
The Black-Scholes option valuation model was developed for use in estimating the fair value of traded options that have no vesting restrictions and are fully transferable. In addition, option valuation models require the input of highly subjective assumptions including the expected stock price volatility. Because the Company’s employee stock options have characteristics significantly different from those of normal publicly traded options, and because changes in the subjective input assumptions can materially affect the fair value estimate, in management’s opinion, the existing models do not necessarily provide a reliable single measure of the fair value of its stock options.
F-15
NOTE I - COMMITMENTS AND CONTINGENCIES
On June 11, 2003, Walter Kidde Portable Equipment, Inc. (“Kidde”) filed a civil suit against the Company in the United States District Court for the Middle District of North Carolina (Case No. 03cv00537), alleging that certain of the Company’s AC powered/battery backup smoke detectors infringe on a patent acquired by Kidde. Kidde is seeking injunctive relief and damages to be determined at trial. On March 31, 2006, following numerous procedural and substantive rulings which the Company believes were favorable to the Company, Kidde obtained dismissal, without prejudice, of its suit. On November 28, 2005, prior to the March 31, 2006 dismissal of the original suit, Kidde filed a second lawsuit in the same court (05cv1031 M.D.N.C.) based on virtually identical infringement allegations as the earlier case. Because,Discovery is now closed in this second case. Although the court dismissed the first case without conditions and without prejudice,asserted patent is now expired, prior to its expiration, the Company sought and has appealednow successfully obtained re-examination of the dismissal toasserted patent in the United States Court of Appeals forPatent and Trademark Office (USPTO) largely based on the Federal Circuit, believing that at a minimum, procedurally, conditions should have been imposed. On March 2, 2007,references cited and analysis presented by the appellate court affirmed the lower court’s dismissal of the first case, and the second case is nowCompany which correspond to defenses raised in the preliminary stages. Although some aspects oflitigation. The fact that Reexamination was granted and is still pending before the case are more complicated,USPTO supports the Company’s substantive position and its defenses to Kidde’s claims on most issues are substantially the same as the first Kidde case.Kidde. The Company and its counsel believe that regardless of the Reexamination, the Company has significant defenses relating to the patent in suit. In the event of an unfavorable outcome, the amount of any potential loss to the Company is not yet determinable.
On October 13, 2003, Maple Chase CompanyAugust 16, 2007, Pass & Seymour, Inc. filed a civil suitcomplaint under section 337 of the Tariff Act of 1930, 19 U.S.C. § 1337, in the United States District CourtInternational Trade Commission against a number of respondents including the Company. Pass & Seymour asserted infringement of a number of different patents by the Respondents for the Northern District of Illinois (Case No. 03cv07205),certain ground fault circuit interrupter (GFCI) technologies. The allegations against the Company its USI Electric subsidiary, and one former and one present Illinois-based sales representative, alleging that certainwere limited to specific claims of only a few of the Company's smoke detectors infringe on a patent owned by Maple Chase (US Reissue Patent No. Re: 33290)asserted patents. On September 18, 2007, the International Trade Commission instituted an investigation into the matter (Investigation 337-TA-615). On April 11, 2005, thisJune 6, 2008, the Company and Pass and Seymour reached agreement to settle with no cost to the Company. That Agreement and an associated Consent Judgment dismissing the action was dismissed pendingas to the Company and binding both parties to the outcome of a reexamination in the United States Patent and Trademark Office (USPTO). In April 2006, the USPTO rejected most of the claims in the patent. Maple Chase filed a substantive response which resulted in issuance of a further Official Action from the USPTO. After considering Maple Chase’s arguments, on September 29, 2006 the USPTO issued a further action confirming the patentability of many of the claims at issue and rejecting others. On October 30, 2006, Maple Chase filed a further response canceling the rejected claims. On December 19, 2006, the USPTO issued a formal notice of intent to issue a re-examination certificate for the Maple Chase Company patent on which the patent infringement suit was filed. In March 2007, the full term of the patent was reached and no Re-examination Certificate has been issued by the USPTO. Under the U.S. patent laws, a patent owner may still sue for damages for up to six years following expiration of a patent but may recover damages only for the period between six years prior to filing the suit and the date of the patent expiration. Therefore, Maple Chase may still file suit for damages and the amount of potential lossCommission decision relating to the Company, if any,remaining manufacturing Respondents is not yet determinable but declining daily.being finalized. The Company believes that it has meritorious and substantial technical defenseswill incur no liability apart from its legal costs to any action that might be fileddefend against it by Maple Chase. The Company also believes that it is entitled to a number of legal and equitable defenses due to the long period of inaction and acquiescence by Maple Chase (and its predecessors).
action.
From time to time, the Company is involved in various lawsuits and legal matters. Management has reserved $401,592 in the aggregate to cover possible losses due to any unfavorable outcome in any of the actions in which it is involved. It is the opinion of management, based on the advice of legal counsel, that these matters will not otherwise have a material adverse effect on the Company’s financial statements.
NOTE J - MAJOR CUSTOMERS
The Company is primarily a distributor of safety products for use in home and business under both its tradenames and private labels for other companies. As described in Note C, the Company’s purchased a majority of its products from its 50% owned Hong Kong Joint Venture.
The Company has one customer, The Home Depot, which represented 37.0% and 11.09% of the Company’s product sales during the period ended March 31, 2008 and 2007 and no customers that represented in excess of 10% of the Company’s product sales for the yearsyear ended March 31, 2006 and 2005.2006.
F-16
NOTE K - QUARTERLY FINANCIAL DATA (UNAUDITED)
Quarterly Results of Operations (Unaudited):
The unaudited quarterly results of operations for fiscal years 20072008 and 20062007 are summarized as follows:
| Quarter Ended | |||||||||||||
2007 | June 30, | September 30, | December 31, | March 31, | |||||||||
| Net sales | $ | 8,038,437 | $ | 8,018,088 | $ | 8,620,893 | $ | 11,146,157 | |||||
| Gross profit | 2,780,517 | 2,607,922 | 2,795,342 | 2,492,889 | |||||||||
| Net income | 1,577,468 | 1,416,204 | 1,712,883 | 826,703 | |||||||||
| Net income per share - basic | $ | 0.68 | $ | 0.59 | $ | 0.70 | $ | 0.34 | |||||
| Net income per share - diluted | $ | 0.62 | $ | 0.57 | $ | 0.70 | $ | 0.34 | |||||
2006 | |||||||||||||
| Net sales | $ | 6,923,810 | $ | 7,119,100 | $ | 7,353,597 | $ | 7,497,594 | |||||
| Gross profit | 2,048,954 | 2,278,838 | 2,549,300 | 2,580,060 | |||||||||
| Net income | 889,770 | 1,162,695 | 1,456,809 | 1,091,078 | |||||||||
| Net income per share - basic | 0.40 | 0.52 | 0.65 | 0.49 | |||||||||
| Net income per share - diluted | 0.37 | 0.48 | 0.60 | 0.44 | |||||||||
| Quarter Ended | ||||||||||||||||
| June 30, | September 30, | December 31, | March 31, | |||||||||||||
| 2008 | ||||||||||||||||
| Net sales | 10,449,343 | 8,967,740 | 7,776,986 | 6,677,293 | ||||||||||||
| Gross profit | 2,715,334 | 1,942,354 | 1,825,486 | 1,386,882 | ||||||||||||
| Income from continuing operations | 1,204,844 | 802,107 | 780,207 | (37,591 | ) | |||||||||||
| Loss from discontinued operations | (413,842 | ) | (483,977 | ) | (2,415,996 | ) | (5,079,848 | ) | ||||||||
| Income per share from continuing operations: | ||||||||||||||||
| Basic | 0.49 | 0.32 | 0.31 | 0.02 | ||||||||||||
| Diluted | 0.48 | 0.32 | 0.31 | 0.02 | ||||||||||||
| Loss per share from discontinued operations: | ||||||||||||||||
| Basic | (0.17 | ) | (0.19 | ) | (0.97 | ) | (2.04 | ) | ||||||||
| Diluted | (0.17 | ) | (0.19 | ) | (0.97 | ) | (2.04 | ) | ||||||||
| Net income (loss) – basic | 0.32 | 0.13 | (0.66 | ) | (2.02 | ) | ||||||||||
| Net income (loss) – diluted | 0.31 | 0.13 | (0.66 | ) | (2.02 | ) | ||||||||||
| 2007 | ||||||||||||||||
| Net sales | $ | 8,038,437 | $ | 8,018,088 | $ | 8,678,312 | $ | 8,199,551 | ||||||||
| Gross profit | 2,780,517 | 2,607,922 | 2,743,182 | 2,297,695 | ||||||||||||
| Income from continuing operations | 1,577,468 | 1,416,204 | 1,760,269 | 1,339,425 | ||||||||||||
| Loss from discontinued operations | - | - | (71,078 | ) | (489,030 | ) | ||||||||||
| Income per share from continuing operations: | ||||||||||||||||
| Basic | 0.68 | 0.59 | 0.72 | 0.56 | ||||||||||||
| Diluted | 0.62 | 0.57 | 0.72 | 0.53 | ||||||||||||
| Loss per share from discontinued operations: | ||||||||||||||||
| Basic | - | - | (0.01 | ) | (0.20 | ) | ||||||||||
| Diluted | - | - | (0.01 | ) | (0.19 | ) | ||||||||||
| Net income – basic | 0.68 | 0.59 | 0.71 | 0.35 | ||||||||||||
| Net income - diluted | 0.62 | 0.57 | 0.71 | 0.34 | ||||||||||||
NOTE L - SUBSEQUENT EVENTS
– RETIREMENT PLAN
The Company has a retirement savings plan under Section 401(k) of the Internal Revenue Code. All full-time employees who have completed 12 months of service are eligible to participate. Employees are permitted to contribute up to the amounts prescribed by law. The Company may provide contributions to the plan consisting of a matching amount equal to a percentage of the employee’s contribution, not to exceed four percent (4%). Employer contributions were $54,689$61,485 and $43,000$54,689 for the yearsyear’s ended March 31, 20072008 and 2006.2007.
SCHEDULE II
UNIVERSAL SECURITY INSTRUMENTS, INC. AND SUBSIDIARIES
VALUATION AND QUALIFYING ACCOUNTS
YEARS ENDED MarchMARCH 31, 2008, 2007 AND 2006 and 2005
Balance at beginning of year | Charged to cost and expenses | Deductions | Balance at end of year | ||||||||||
| Year ended March 31, 2007 | |||||||||||||
| Allowance for doubtful accounts | $ | 15,000 | $ | 0 | $ | 0 | $ | 15,000 | |||||
| Year ended March 31, 2006 | |||||||||||||
| Allowance for doubtful accounts | $ | 15,000 | $ | 0 | $ | 0 | $ | 15,000 | |||||
| Year ended March 31, 2005 | |||||||||||||
| Allowance for doubtful accounts | $ | 10,000 | $ | 5,000 | $ | 0 | $ | 15,000 | |||||
| Year ended March 31, 2007 | |||||||||||||
| Allowance for inventory reserve | $ | 40,000 | $ | 0 | $ | 0 | $ | 40,000 | |||||
| Year ended March 31, 2006 | |||||||||||||
| Allowance for inventory reserve | $ | 100,000 | $ | 0 | $ | 60,000 | $ | 40,000 | |||||
| Year ended March 31, 2005 | |||||||||||||
| Allowance for inventory reserve | $ | 100,000 | $ | 0 | $ | 0 | $ | 100,000 | |||||
Balance at beginning of year | Charged to cost and expenses | Deductions | Balance at end of year | |||||||||||||
| Year ended March 31, 2008 | ||||||||||||||||
| Allowance for doubtful accounts | $ | 15,000 | $ | 0 | $ | 0 | $ | 15,000 | ||||||||
| Year ended March 31, 2007 | ||||||||||||||||
| Allowance for doubtful accounts | $ | 15,000 | $ | 0 | $ | 0 | $ | 15,000 | ||||||||
| Year ended March 31, 2006 | ||||||||||||||||
| Allowance for doubtful accounts | $ | 10,000 | $ | 5,000 | $ | 0 | $ | 15,000 | ||||||||
| Year ended March 31, 2008 | ||||||||||||||||
| Allowance for inventory reserve | $ | 40,000 | $ | 0 | $ | 0 | $ | 40,000 | ||||||||
| Year ended March 31, 2007 | ||||||||||||||||
| Allowance for inventory reserve | $ | 40,000 | $ | 0 | $ | 0 | $ | 40,000 | ||||||||
| Year ended March 31, 2006 | ||||||||||||||||
| Allowance for inventory reserve | $ | 100,000 | $ | 0 | $ | 60,000 | $ | 40,000 | ||||||||
S-1
Report and Financial Statements
Eyston Company Limited
For the year ended 31 March 20072008
Contents
| Page | ||||
| Report of Independent Registered Public Accounting Firm | JV-1 | |||
| Consolidated Income Statement | JV-2 | |||
| Consolidated Balance Sheet | JV-3 | |||
| Balance Sheet | JV-4 | |||
| Consolidated Statement of Changes in Equity | JV-5 | |||
| Consolidated Cash Flow Statement | JV-6 | |||
| Notes to the Financial Statements | ||||
| JV-7 |
Expressed in Hong Kong dollars ("HK$")
Report of independent registered
To the membersBoard of Directors of Eyston Company Limited
We have audited the accompanying consolidated financial statementsbalance sheets of Eyston Company Limited (the "company") set out on pages 7 to 39, which comprise and subsidiaries ("the consolidatedCompany"), as of March 31, 2008 and company balance sheets as at 31 March 2007, and the related consolidated statements of income, statement, the consolidated statement of changes in equity, and cash flows for each of the consolidated cash flow statement forthree years in the year thenperiod ended and a summary of significant accounting policies and other explanatory notes.
Company's management. Our responsibility is to express an opinion on these financial statements based on our audit and to report our opinion solely to you, as a body, in accordance with section 141 of the Hong Kong Companies Ordinance, and for no other purpose. We do not assume responsibility towards or accept liability to any other person for the contents of this report.audits.
We conducted our auditaudits in accordance with Hong Kong Standards on Auditing issued by the Hong Kong Institutestandards of Certifiedthe Public Accountants.Company Accounting Oversight Board (United States). Those standards require that we comply with ethical requirements and plan and perform the audit to obtain reasonable assurance as toabout whether the financial statements are free fromof material misstatement.
An audit involves performing procedures to obtain auditincludes examining, on a test basis, evidence aboutsupporting the amounts and disclosures in the financial statements. The procedures selected depend on the auditors' judgement, including the assessment of the risks of material misstatement of the financial statements, whether due to fraud or error. In making those risk assessments, the auditors consider internal control relevant to the entity's preparation and true and fair presentation of the financial statements in order to design audit procedures that are appropriate in the circumstances, but not for the purpose of expressing an opinion on the effectiveness of the entity's internal control. An audit also includes evaluatingassessing the appropriateness of accounting policiesprinciples used and the reasonableness of accountingsignificant estimates made by the directors,management, as well as evaluating the overall presentation of the financial statements.
statement presentation. We believe that the audit evidence we have obtained is sufficient and appropriate toour audits provide a reasonable basis for our audit opinion.
In our opinion, the consolidated financial statements give a true and fair viewreferred to above present fairly, in all material respects, the consolidated financial position of the stateCompany as of affairs of the companyMarch 31, 2008 and of the group as at 31 March 2007, and the consolidated results of the group's profitits income and its cash flows for each of the year thenthree years in the period ended March 31, 2008, in accordance with Hong Kong Financial Reporting Standards and have been properly prepared in accordance with the Hong Kong Companies Ordinance.Standards.
Grant Thornton
Certified Public Accountants
13th Floor, Gloucester Tower
The Landmark
15 Queen's Road Central
Hong Kong
Consolidated income statement
for the year ended 31 March 20072008
| Notes | 2008 | 2007 | 2006 | |||||||||||||
| HK$ | HK$ | HK$ | ||||||||||||||
| Turnover | 5 | 235,060,421 | 320,142,022 | 192,697,968 | ||||||||||||
| Cost of sales | (176,141,949 | ) | (213,147,126 | ) | (125,843,197 | ) | ||||||||||
| Gross profit | 58,918,472 | 106,994,896 | 66,854,771 | |||||||||||||
| Other income | 6 | 5,350,795 | 4,693,192 | 2,798,681 | ||||||||||||
| Administrative expenses | (34,379,717 | ) | (37,260,187 | ) | (33,160,250 | ) | ||||||||||
| Profit from operations | 29,889,550 | 74,427,901 | 36,493,202 | |||||||||||||
| Finance costs | 7 | (210,016 | ) | (405,953 | ) | (265,063 | ) | |||||||||
| Profit before income tax | 8 | 29,679,534 | 74,021,948 | 36,228,139 | ||||||||||||
| Income tax expense | 9 | (4,173,251 | ) | (8,848,735 | ) | (3,912,698 | ) | |||||||||
| Profit for the year | 10 | 25,506,283 | 65,173,213 | 32,315,441 | ||||||||||||
| Dividends | 11 | 16,716,167 | 29,866,722 | 17,163,365 | ||||||||||||
2007 | 2006 | |||||||||
| Notes | HK$ | HK$ | ||||||||
Turnover | 5 | 320,142,022 | 192,697,968 | |||||||
| Cost of sales | (213,147,126 | ) | (125,843,197 | ) | ||||||
Gross profit | 106,994,896 | 66,854,771 | ||||||||
| Other income | 6 | 4,693,192 | 2,798,681 | |||||||
| Administrative expenses | (37,260,187 | ) | (33,160,250 | ) | ||||||
Profit from operations | 74,427,901 | 36,493,202 | ||||||||
| Finance costs | 7 | (405,953 | ) | (265,063 | ) | |||||
Profit before income tax | 8 | 74,021,948 | 36,228,139 | |||||||
| Income tax expense | 9 | (8,848,735 | ) | (3,912,698 | ) | |||||
Profit for the year | 10 | 65,173,213 | 32,315,441 | |||||||
Dividends | 11 | 29,866,722 | 17,163,365 | |||||||
JV-2
Consolidated balance sheet
as at 31 March 2008
| Notes | 2008 | 2007 | ||||||||||
| HK$ | HK$ | |||||||||||
| ASSETS AND LIABILITIES | ||||||||||||
| Non-current assets | ||||||||||||
| Property, plant and equipment | 12 | 59,767,941 | 55,170,184 | |||||||||
| Advanced lease payments | 13 | 14,023,266 | 9,574,779 | |||||||||
| Available-for-sale financial assets | 14 | 7,902,216 | 26,823,106 | |||||||||
| 81,693,423 | 91,568,069 | |||||||||||
| Current assets | ||||||||||||
| Inventories | 16 | 28,354,497 | 30,441,083 | |||||||||
| Available-for-sale financial assets | 14 | 15,633,540 | - | |||||||||
| Trade and other receivables | 17 | 5,674,634 | 9,209,513 | |||||||||
| Amount due from shareholder | 21 | 9,392,116 | 20,344,847 | |||||||||
| Loan to a shareholder | 19 | - | 1,950,000 | |||||||||
| Cash and cash equivalents | 20 | 50,687,596 | 36,853,474 | |||||||||
| 109,742,383 | 98,798,917 | |||||||||||
| Current liabilities | ||||||||||||
| Trade and other payables | 21,499,786 | 22,686,174 | ||||||||||
| Obligations under finance lease | 21,000 | 21,000 | ||||||||||
| Amount due to a related company | 21 | 2,329,153 | 7,113,550 | |||||||||
| Dividend payable | 22 | 11,700,000 | 11,700,000 | |||||||||
| Amount due to a director | 23 | - | 200,000 | |||||||||
| Loans from shareholders | 24 | 2,868,954 | 2,868,954 | |||||||||
| Collateralised bank advances | 25 | 971,312 | 2,853,162 | |||||||||
| Provision for taxation | 1,199,326 | 5,360,473 | ||||||||||
| 40,589,531 | 52,803,313 | |||||||||||
| Net current assets | 69,152,852 | 45,995,604 | ||||||||||
| Non-current liabilities | ||||||||||||
| Obligations under finance lease | 52,700 | 73,700 | ||||||||||
| Deferred tax liabilities | 26 | 587,877 | 788,712 | |||||||||
| Net assets | 150,205,698 | 136,701,261 | ||||||||||
| EQUITY | ||||||||||||
| Share capital | 27 | 200 | 200 | |||||||||
| Reserves | 28 | 150,205,498 | 136,701,061 | |||||||||
| 150,205,698 | 136,701,261 | |||||||||||
JV-3
2007 | 2006 | |||||||||
Notes | HK$ | HK$ | ||||||||
ASSETS AND LIABILITIES | ||||||||||
Non-current assets | ||||||||||
| Property, plant and equipment | 12 | 55,170,184 | 41,660,661 | |||||||
| Advanced lease payments | 13 | 9,574,779 | 8,708,432 | |||||||
| Available-for-sale financial assets | 14 | 26,823,106 | 34,277,991 | |||||||
91,568,069 | 84,647,084 | |||||||||
Current assets | ||||||||||
| Inventories | 16 | 30,441,083 | 18,922,905 | |||||||
| Trade and other receivables | 17 | 9,209,513 | 8,280,783 | |||||||
| Amount due from shareholder | 20,344,847 | - | ||||||||
| Loan to a shareholder | 19 | 1,950,000 | 3,900,000 | |||||||
| Cash and cash equivalents | 36,853,474 | 26,322,005 | ||||||||
98,798,917 | 57,425,693 | |||||||||
Current liabilities | ||||||||||
| Trade and other payables | 22,686,174 | 20,844,537 | ||||||||
| Obligations under finance lease | 21,000 | - | ||||||||
| Amount due to a related company | 20 | 7,113,550 | 2,914,238 | |||||||
| Dividend payable | 21 | 11,700,000 | 11,700,000 | |||||||
| Amount due to a director | 22 | 200,000 | - | |||||||
| Amount due to a shareholder | 20 | - | 409,907 | |||||||
| Loans from shareholders | 23 | 2,868,954 | 2,868,954 | |||||||
| Collateralised bank advances | 24 | 2,853,162 | 3,435,122 | |||||||
| Provision for taxation | 5,360,473 | 1,081,046 | ||||||||
52,803,313 | 43,253,804 | |||||||||
Net current assets | 45,995,604 | 14,171,889 | ||||||||
Non-current liabilities | ||||||||||
| Obligations under finance lease | 73,700 | - | ||||||||
| Deferred tax liabilities | 25 | 788,712 | 255,000 | |||||||
Net assets | 136,701,261 | 98,563,973 | ||||||||
EQUITY | ||||||||||
Share capital | 26 | 200 | 200 | |||||||
Reserves | 27 | 136,701,061 | 98,563,773 | |||||||
136,701,261 | 98,563,973 | |||||||||
Balance sheet
as at 31 March 20072008
2007 | 2006 | |||||||||
Notes | HK$ | HK$ | ||||||||
ASSETS AND LIABILITIES | ||||||||||
Non-current assets | ||||||||||
| Property, plant and equipment | 12 | 13,465,746 | 5,024,417 | |||||||
| Advanced lease payments | 13 | 930,239 | 1,191,701 | |||||||
| Available-for-sale financial assets | 14 | 26,823,106 | 34,277,991 | |||||||
| Interests in subsidiaries | 15 | 77,807,152 | 39,793,122 | |||||||
119,026,243 | 80,287,231 | |||||||||
Current assets | ||||||||||
| Inventories | 16 | 30,441,083 | 18,922,905 | |||||||
| Other receivables | 1,665,784 | 904,638 | ||||||||
| Amounts due from subsidiaries | 18 | 39,149,433 | 26,647,470 | |||||||
| Cash and cash equivalents | 11,643,897 | 20,200,914 | ||||||||
82,900,197 | 66,675,927 | |||||||||
Current liabilities | ||||||||||
| Trade and other payables | 19,896,808 | 16,817,998 | ||||||||
| Obligations under finance lease | 21,000 | - | ||||||||
| Amount due to a related company | 20 | 7,113,550 | 2,914,238 | |||||||
| Dividend payable | 21 | 11,700,000 | 11,700,000 | |||||||
| Loans from shareholders | 23 | 2,868,954 | 2,868,954 | |||||||
| Provision for taxation | 3,527,182 | 1,081,046 | ||||||||
45,127,494 | 35,382,236 | |||||||||
Net current assets | 37,772,703 | 31,293,691 | ||||||||
Non-current liabilities | �� | |||||||||
| Obligations under finance lease | 73,700 | - | ||||||||
| Deferred tax liabilities | 25 | 788,712 | 255,000 | |||||||
Net assets | 155,936,534 | 111,325,922 | ||||||||
EQUITY | ||||||||||
Share capital | 26 | 200 | 200 | |||||||
Reserves | 27 | 155,936,334 | 111,325,722 | |||||||
155,936,534 | 111,325,922 | |||||||||
| Notes | 2008 | 2007 | ||||||||||
| HK$ | HK$ | |||||||||||
| ASSETS AND LIABILITIES | ||||||||||||
| Non-current assets | ||||||||||||
| Property, plant and equipment | 12 | 10,169,509 | 13,465,746 | |||||||||
| Advanced lease payments | 13 | 668,775 | 930,239 | |||||||||
| Available-for-sale financial assets | 14 | 7,902,216 | 26,823,106 | |||||||||
| Interests in subsidiaries | 15 | 94,990,967 | 77,807,152 | |||||||||
| 113,731,467 | 119,026,243 | |||||||||||
| Current assets | ||||||||||||
| Inventories | 16 | 28,354,497 | 30,441,083 | |||||||||
| Available-for-sale financial assets | 14 | 15,633,540 | - | |||||||||
| Other receivables | 1,033,057 | 1,665,784 | ||||||||||
| Amounts due from subsidiaries | 18 | 22,846,582 | 39,149,433 | |||||||||
| Tax prepaid | 1,083,171 | - | ||||||||||
| Cash and cash equivalents | 20 | 31,612,771 | 11,643,897 | |||||||||
| 100,563,618 | 82,900,197 | |||||||||||
| Current liabilities | ||||||||||||
| Trade and other payables | 17,513,855 | 19,896,808 | ||||||||||
| Obligations under finance lease | 21,000 | 21,000 | ||||||||||
| Amount due to a related company | 21 | 2,329,153 | 7,113,550 | |||||||||
| Dividend payable | 22 | 11,700,000 | 11,700,000 | |||||||||
| Loans from shareholders | 24 | 2,868,954 | 2,868,954 | |||||||||
| Provision for taxation | - | 3,527,182 | ||||||||||
| 34,432,962 | 45,127,494 | |||||||||||
| Net current assets | 66,130,656 | 37,772,703 | ||||||||||
| Non-current liabilities | ||||||||||||
| Obligations under finance lease | 52,700 | 73,700 | ||||||||||
| Deferred tax liabilities | 26 | 587,877 | 788,712 | |||||||||
| Net assets | 179,221,546 | 155,936,534 | ||||||||||
| EQUITY | ||||||||||||
| Share capital | 27 | 200 | 200 | |||||||||
| Reserves | 28 | 179,221,346 | 155,936,334 | |||||||||
| 179,221,546 | 155,936,534 | |||||||||||
Consolidated statement of changes in equity
for the year ended 31 March 2007
Share capital | Exchange reserve | Fair value reserve | Retained profits | Total | ||||||||||||
HK$ | HK$ | HK$ | HK$ | HK$ | ||||||||||||
| Balance at 1 April 2005 | 200 | 34,233 | (251,023 | ) | 83,512,804 | 83,296,214 | ||||||||||
| Change in fair value of available-for-sale financial assets | - | - | (499,606 | ) | - | (499,606 | ) | |||||||||
| Exchange differences arising on translation of a subsidiary | - | 615,289 | - | - | 615,289 | |||||||||||
| Profit for the year | - | - | - | 32,315,441 | 32,315,441 | |||||||||||
| Dividends | - | - | - | (17,163,365 | ) | (17,163,365 | ) | |||||||||
| Balance at 31 March 2006 | 200 | 649,522 | (750,629 | ) | 98,664,880 | 98,563,973 | ||||||||||
| Change in fair value of available-for-sale financial assets | - | - | 292,456 | - | 292,456 | |||||||||||
| Exchange differences arising on translation of a subsidiary | - | 2,538,341 | - | - | 2,538,341 | |||||||||||
| Profit for the year | - | - | - | 65,173,213 | 65,173,213 | |||||||||||
| Dividends | - | - | - | (29,866,722 | ) | (29,866,722 | ) | |||||||||
Balance at 31 March 2007 | 200 | 3,187,863 | (458,173 | ) | 133,971,371 | 136,701,261 | ||||||||||
Share capital | Exchange reserve | Fair value reserve | Retained profits | Total | ||||||||||||||||
| HK$ | HK$ | HK$ | HK$ | HK$ | ||||||||||||||||
| Balance at 1 April 2005 | 200 | 34,233 | (251,023 | ) | 83,512,804 | 83,296,214 | ||||||||||||||
| Change in fair value of available-for-sale financial assets | - | - | (499,606 | ) | - | (499,606 | ) | |||||||||||||
| Exchange differences arising on translation of a subsidiary | - | 615,289 | - | - | 615,289 | |||||||||||||||
| Profit for the year | - | - | - | 32,315,441 | 32,315,441 | |||||||||||||||
| Dividends | - | - | - | (17,163,365 | ) | (17,163,365 | ) | |||||||||||||
| Balance at 31 March 2006 | 200 | 649,522 | (750,629 | ) | 98,664,880 | 98,563,973 | ||||||||||||||
| Change in fair value of available-for-sale financial assets | - | - | 292,456 | - | 292,456 | |||||||||||||||
| Exchange differences arising on translation of a subsidiary | - | 2,538,341 | - | - | 2,538,341 | |||||||||||||||
| Profit for the year | - | - | - | 65,173,213 | 65,173,213 | |||||||||||||||
| Dividends | - | - | - | (29,866,722 | ) | (29,866,722 | ) | |||||||||||||
| Balance at 31 March 2007 | 200 | 3,187,863 | (458,173 | ) | 133,971,371 | 136,701,261 | ||||||||||||||
| Change in fair value of available-for-sale financial assets | - | - | 577,549 | - | 577,549 | |||||||||||||||
| Exchange differences arising on translation of a subsidiary | - | 4,136,772 | - | - | 4,136,772 | |||||||||||||||
| Profit for the year | - | - | - | 25,506,283 | 25,506,283 | |||||||||||||||
| Dividends | - | - | - | (16,716,167 | ) | (16,716,167 | ) | |||||||||||||
| Balance at 31 March 2008 | 200 | 7,324,635 | 119,376 | 142,761,487 | 150,205,698 | |||||||||||||||
Consolidated cash flow statement
for the year ended 31 March 2007
2007 | 2006 | |||||||||
Note | HK$ | HK$ | ||||||||
Cash flows from operating activities | ||||||||||
| Profit before income tax | 74,021,948 | 36,228,139 | ||||||||
| Adjustments for : | ||||||||||
| Amortisation of advanced lease payment | 424,328 | 415,454 | ||||||||
| Depreciation of property, plant and equipment | 5,752,971 | 4,414,388 | ||||||||
| Loss on disposal of available for sale financial assets | 87,565 | - | ||||||||
| (Gain)/Loss on disposal of property, plant and equipment | (347,500 | ) | 9,985 | |||||||
| Interest expense | 405,953 | 265,063 | ||||||||
| Interest income | (2,289,039 | ) | (1,761,425 | ) | ||||||
| Operating profit before working capital changes | 78,056,226 | 39,571,604 | ||||||||
| Increase in amount due from a shareholder | (26,272,135 | ) | (3,845,777 | ) | ||||||
| Increase in inventories | (11,518,178 | ) | (624,869 | ) | ||||||
| (Increase)/Decrease in trade and other receivables | (928,730 | ) | 1,300,430 | |||||||
| Decrease in loan to a shareholder | 1,950,000 | - | ||||||||
| Increase/(Decrease) in amount due to a related company | 4,199,312 | (698,628 | ) | |||||||
| Increase in obligations under finance lease | 94,700 | - | ||||||||
| Increase in amount due to director | 200,000 | - | ||||||||
| (Decrease)/Increase in collateralised bank advances | (581,960 | ) | 3,435,122 | |||||||
| Increase in trade and other payables | 1,841,637 | 1,836,405 | ||||||||
| Cash generated from operations | 47,040,872 | 40,974,287 | ||||||||
| Interest received | 2,289,039 | 1,761,425 | ||||||||
| Interest paid | (405,953 | ) | (265,063 | ) | ||||||
| Dividends paid | 33 | (24,349,341 | ) | (13,158,676 | ) | |||||
| Hong Kong profits tax paid | (4,025,500 | ) | (4,148,883 | ) | ||||||
Net cash generated from operating activities | 20,549,117 | 25,163,090 | ||||||||
Cash flows from investing activities | ||||||||||
| Purchase of property, plant and equipment | (18,006,982 | ) | (10,630,878 | ) | ||||||
| Addition of land use right | (990,000 | ) | - | |||||||
| Purchase of available-for-sale financial assets | - | (7,729,800 | ) | |||||||
| Proceeds from disposal of available-for-sale financial assets | 7,659,776 | - | ||||||||
| Proceeds from disposal of property, plant and equipment | 363,865 | 5,919 | ||||||||
Net cash used in investing activities | (10,973,341 | ) | (18,354,759 | ) | ||||||
Net increase in cash and cash equivalents | 9,575,776 | 6,808,331 | ||||||||
Cash and cash equivalents at beginning of the year | 26,322,005 | 19,468,905 | ||||||||
Effect of foreign exchange rate changes, net | 955,693 | 44,769 | ||||||||
Cash and cash equivalents at end of the year | 36,853,474 | 26,322,005 | ||||||||
| 2008 | 2007 | 2006 | ||||||||||
| HK$ | HK$ | HK$ | ||||||||||
| Cash flows from operating activities | ||||||||||||
| Profit before income tax | 29,679,534 | 74,021,948 | 36,228,139 | |||||||||
| Adjustments for : | ||||||||||||
| Amortisation of advanced lease payment | 427,392 | 424,328 | 415,454 | |||||||||
| Depreciation of property, plant and equipment | 10,166,942 | 5,752,971 | 4,414,388 | |||||||||
| Loss on disposal of available for sale financial assets | 34,344 | 87,565 | - | |||||||||
| Gain on disposal of property, plant and equipment | (94 | ) | (347,500 | ) | 9,985 | |||||||
| Interest expense | 210,016 | 405,953 | 265,063 | |||||||||
| Interest income | (2,384,538 | ) | (2,289,039 | ) | (1,761,425 | ) | ||||||
| Operating profit before working capital changes | 38,133,596 | 78,056,226 | 39,571,604 | |||||||||
| Decrease/(Increase) in amount due from a shareholder | 8,427,746 | (26,272,135 | ) | (3,845,777 | ) | |||||||
| Decrease/(Increase) in inventories | 2,086,586 | (11,518,178 | ) | (624,869 | ) | |||||||
| Decrease/(Increase) in trade and other receivables | 3,534,879 | (928,730 | ) | 1,300,430 | ||||||||
| Decrease in loan to a shareholder | 1,950,000 | 1,950,000 | - | |||||||||
| (Decrease)/Increase in amount due to a related company | (953,842 | ) | 4,199,312 | (698,628 | ) | |||||||
| (Decrease)/Increase in obligations under finance lease | (21,000 | ) | 94,700 | - | ||||||||
| (Decrease)/Increase in amount due to director | (200,000 | ) | 200,000 | - | ||||||||
| Decrease in collateralised bank advances | (1,881,850 | ) | (581,960 | ) | 3,435,122 | |||||||
| (Decrease)/Increase in trade and other payables | (1,186,388 | ) | 1,841,637 | 1,836,405 | ||||||||
| Cash generated from operations | 49,889,727 | 47,040,872 | 40,974,287 | |||||||||
| Interest received | 2,384,538 | 2,289,039 | 1,761,425 | |||||||||
| Interest paid | (210,016 | ) | (405,953 | ) | (265,063 | ) | ||||||
| Dividends paid | (14,191,182 | ) | (24,349,341 | ) | (13,158,676 | ) | ||||||
| Hong Kong profits tax paid | (8,523,843 | ) | (4,025,500 | ) | (4,148,883 | ) | ||||||
| Net cash generated from operating activities | 29,349,224 | 20,549,117 | 25,163,090 | |||||||||
| Cash flows from investing activities | ||||||||||||
| Purchase of property, plant and equipment | (11,715,474 | ) | (18,006,982 | ) | (10,630,878 | ) | ||||||
| Addition of land use right | (3,938,000 | ) | (990,000 | ) | - | |||||||
| Purchase of available-for-sale financial assets | - | - | (7,729,800 | ) | ||||||||
| Proceeds from disposal of available-for-sale financial assets | - | 7,659,776 | - | |||||||||
| Proceeds from disposal of property, plant and equipment | 36,500 | 363,865 | 5,919 | |||||||||
| Net cash used in investing activities | (15,616,974 | ) | (10,973,341 | ) | (18,354,759 | ) | ||||||
| Net increase in cash and cash equivalents | 13,732,250 | 9,575,776 | 6,808,331 | |||||||||
| Cash and cash equivalents at beginning of the year | 36,853,474 | 26,322,005 | 19,468,905 | |||||||||
| Effect of foreign exchange rate changes, net | 101,872 | 955,693 | 44,769 | |||||||||
| Cash and cash equivalents at end of the year | 50,687,596 | 36,853,474 | 26,322,005 | |||||||||
Notes to the financial statements
for the year ended 31 March 20072008
1. | GENERAL INFORMATION |
The company is a limited liability company incorporated and domiciled in Hong Kong. The address of the company's registered office and principal place of business is B2, 3/F., Fortune Factory Building, 40 Lee Chung Street, Chai Wan, Hong Kong.
The principal activities of the company and its subsidiaries (the "group") are manufacturing and trading of consumer electronic products including smoke, fire and carbon monoxide alarms and other home safety products. Details of the company's subsidiaries are set out in note 15 to the financial statements.
The financial statements on pages 72 to 3938 have been prepared in accordance with Hong Kong Financial Reporting Standards ("HKFRSs") which collective term includes all applicable individual Hong Kong Financial Reporting Standards, Hong Kong Accounting Standards and Interpretations issued by the Hong Kong Institute of Certified Public Accountants ("HKICPA") and the requirements of the Hong Kong Companies Ordinance. The years presented are in accordance with the requirements of U.S. Securities and Exchange Commission.
The financial statements for the year ended 31 March 20072008 were approved for issue by the board of directors on 2225 June 2007.2008.
2. | ADOPTION OF NEW HKFRSs |
| 2.1 | Impact of new and revised HKFRSs which are effective during the year |
| HKAS 1 (Amendment) | Presentation of Financial Statements - Capital Disclosures | |
| HKFRS 7 | Financial Instruments : Disclosures | |
| HK(IFRIC) - Int 8 | Scope of HKFRS 2 | |
| HK(IFRIC) - Int 9 | Reassessment of Embedded Derivatives | |
| HK(IFRIC) - Int 10 | Interim Financial Reporting and Impairment | |
| HK(IFRIC) - Int 11 | HKFRS 2: Group and Treasury Share Transactions |
JV-7
| 2. | ADOPTION OF NEW AND AMENDED HKFRSs (Continued) |
| 2.1 | Impact of new and revised HKFRSs which are effective during the year (Continued) |
The adoption of these HKFRSs did not resulthad no material effect on how the results and financial position for the current or prior periods have been prepared and presented but HKAS 1 (Amendment) and HKFRS 7 resulted in any significant changes inexpanded disclosures on the group's accounting policies.capital management policies and, significance of financial instruments and the nature and extent of risk arising from financial instruments used. Accordingly, no prior period adjustment is required.
HKFRS 7 - Financial Instruments : Disclosures
HKFRS 7 - Financial Instruments: Disclosures is mandatory for reporting periods beginning on 1 January 2007 or later. The new standard replaces and amends the disclosure requirements previously set out in HKAS 32 Financial Instruments: Presentation and Disclosures and has been adopted by the group in its consolidated financial statements for the year ended 31 March 2008. All disclosures relating to financial instruments including the comparative information have been updated to reflect the new requirements. In particular, the group's financial statements now feature:
| a sensitivity analysis explaining the group's market risk exposure in regard to its financial instruments, and |
| a maturity analysis that shows the remaining contractual maturities of financial liabilities, |
each as at the balance sheet date. The first-time application of HKFRS 7, however, has not resulted in any prior-period adjustments on cash flows, net income or balance sheet line items.
| 2.2 | Impact of new and revised HKFRSs |
The group has not early adopted the following HKFRSsstandards or interpretations that have been issued but are not yet effective. The directors of the company anticipate that the adoption of such HKFRSs will not result in a material financial impact on the group's financial statements.
| HKAS 23 (Revised) | Borrowing Costs 1 | |
| HKAS 27 (Revised) | Consolidated and Separate Financial Statements 4 | |
| HKFRS | ||
| HKFRS 3 (Revised) | Business Combinations 4 | |
| HKFRS 8 | Operating Segments 1 | |
| HK(IFRIC) | ||
| HK(IFRIC) | ||
| HK(IFRIC) | ||
JV-8
| 2. | ADOPTION OF NEW AND AMENDED HKFRSs (Continued) |
| 2.2 | Impact of new and revised HKFRSs which are issued but not yet effective (Continued) |
Note
| 1 | Effective for annual periods beginning on or after 1 January |
| Effective for annual periods beginning on or after 1 January 2008 |
| 3 | Effective for annual periods beginning on or after 1 July 2008 |
| 4 | Effective for annual periods beginning on or after 1 July 2009 |
Amendment to HKAS 1 Presentation of Financial Statements
This amendment affects the presentation of owner changes in equity and introduces a statement of comprehensive income. Preparers will have the option of presenting items of income and expenses and components of other comprehensive income either in a single statement of comprehensive income with subtotals, or in two separate statements (a separate income statement followed by a statement of other comprehensive income). This amendment does not affect the financial position or results of the group but will give rise to additional disclosures. Management is currently assessing the detailed impact of this amendment on the group's financial statements.
The directors of the company are currently assessing the impact of the other new and revised HKFRSs but are not yet in a position to state whether they would have material financial impact on the group's financial statements.
3. | SUMMARY OF SIGNIFICANT ACCOUNTING POLICIES |
| 3.1 | Basis of preparation |
The significant accounting policies that have been used in the preparation of these consolidated financial statements are summarised below. These policies have been consistently applied to all the years presented unless otherwise stated.
The financial statements have been prepared on an historical cost basis except for the revaluation of certain financial assets and liabilities. The measurement bases are fully described in the accounting policies below.
It should be noted that accounting estimates and assumptions are used in preparation of the financial statements. Although these estimates are based on management's best knowledge and judgment of current events and actions, actual results may ultimately differ from those estimates. The areas involving a higher degree of judgment or complexity, or areas where assumptions and estimates are significant to the financial statements, are disclosed in note 4.
| 3.2 | Basis of consolidation |
The consolidated financial statements incorporate the financial statements of the company and its subsidiaries made up to 31 March each year.
JV-9
| 3. | SUMMARY OF SIGNIFICANT ACCOUNTING POLICIES (Continued) |
| 3.3 | Subsidiaries |
Subsidiaries are those entities (including special purpose entities) over which the group has the power to control the financial and operating policies so as to obtain benefits from their activities. The existence and effect of potential voting rights that are currently exercisable or convertible are considered when assessing whether the group controls another entity. Subsidiaries are fully consolidated from the date on which control is transferred to the group. They are excluded from consolidation from the date that control ceases.
Business combinations (other than for combining entities under common control) are accounted for by applying the purchase method. This involves the revaluation at fair value of all identifiable assets and liabilities, including contingent liabilities of the subsidiary, at the acquisition date, regardless of whether or not they were recorded in the financial statements of the subsidiary prior to acquisition. On initial recognition, the assets and liabilities of the subsidiary are included in the consolidated balance sheet at their fair values, which are also used as the bases for subsequent measurement in accordance with the group's accounting policies.
Intra-group transactions, balances and unrealised gains on transactions between group companies are eliminated in preparing the consolidated financial statements. Unrealised losses are also eliminated unless the transaction provides evidence of an impairment of the asset transferred.
In the company's balance sheet, subsidiaries are carried at cost less any impairment loss. The results of the subsidiaries are accounted for by the company on the basis of dividends received and receivable at the balance sheet date.
| 3.4 | Property, plant and equipment |
Property, plant and equipment are stated at acquisition cost less accumulated depreciation and impairment losses.
Subsequent costs are included in the asset's carrying amount or recognised as a separate asset, as appropriate, only when it is probable that future economic benefits associated with the item will flow to the group and company and the cost of the item can be measured reliably. All other repairs and maintenance are charged to the income statement during the period in which they are incurred.
JV-10
| 3. | SUMMARY OF SIGNIFICANT ACCOUNTING POLICIES (Continued) |
| 3.4 | Property, plant and equipment (Continued) |
Depreciation is provided to write off the cost of property, plant and equipment over their estimated useful lives, using the straight line method, at the following rates per annum :
| Buildings | 5% or where shorter over 16 - 19 years | ||||
| Leasehold improvements | 20 | % | |||
| Plant and machinery | % | ||||
| Furniture and fixtures | 20 | % | |||
| Motor vehicles | 20 | % | |||
| Computer equipment and software | 50 | % | |||
Construction in progress represents costs incurred in the construction of buildings. These costs are not depreciated until such time as the relevant assets are completed and put into use, at which time the relevant costs are transferred to the appropriate category of property, plant and equipment.
The assets' useful lives are reviewed, and adjusted if appropriate, at each balance sheet date.
The gain or loss arising on the retirement or disposal is determined as the difference between the sales proceeds and the carrying amount of the assets and is recognised in the consolidated income statement.
Subsequent costs are included in the assets' carrying amounts or recognized as separate assets, as appropriate, only when it is probable that future economic benefits associated with the items will flow to the group and the cost of the items can be measured reliably. All other costs, such as repairs and maintenance, are expensed in the consolidated income statement during the period in which they are incurred.
| 3.5 | Inventories |
Inventories are stated at the lower of cost and net realisable value. Cost comprises direct materials computed using first-in, first-out method and, where applicable, direct labour and those overheads that have been incurred in bringing the inventories to their present location and condition. Net realisable value is calculated as the actual or estimated selling price less all further costs of completion and estimated costs necessary to make the sale.
3. | SUMMARY OF SIGNIFICANT ACCOUNTING POLICIES (Continued) |
| 3.6 | Financial assets |
The group's accounting policies for financial assets other than investments in subsidiaries and associates are set out below.
Classification of financial assets
Financial assets other than hedging instruments are classified into the following categories: (i) loans and receivables, and (ii) available-for-sale financial assets.
Loans and receivables are non-derivative financial assets with fixed or determinable payments that are not quoted in an active market. Loans and receivables are initially recognised at fair value and subsequently measured at amortised cost using the effective interest method, less any impairment. Any changes in their valueimpairment losses. Amortised cost is calculated taking into account any discount or premium on acquisition and includes fee that are an integral part of the effective interest rate and transaction cost. Gains and losses are recognised in the income statement.
| (ii) | Available-for-sale financial assets |
Available-for-sale financial assets include non-derivative financial assets that are either designated to this category or do not qualify for inclusion in any of the other categories of financial assets. All financial assets within this category are subsequently measured at fair value. Gain or loss arising from a change in the fair value with changesis recognised directly in valueequity, except for impairment losses and foreign exchange gains and losses, until the financial asset is derecognised, at which time the cumulative gain or loss previously recognised in equity (i.e. fair value reserve).would be recognised in income statement. Upon disposal, the cumulative gain or loss previously recognised in equity is transferred to the income statement.
Management determines the classification of its financial assets at initial recognition depending on the purpose for which the financial assets were acquired and where allowed and appropriate, re-evaluates this designation at every reporting date.
Recognition and derecognition of financial assets
All financial assets are recognised when, any only when, the group becomes a party to the contractual provisions of the instrument. Regular way purchases of financial assets are recognised on trade date. When financial assets are recognised initially, they are measured at fair value, plus, in the case of investments not at fair value through profit or loss, directly attributable transaction costs.
JV-12
| 3. | SUMMARY OF SIGNIFICANT ACCOUNTING POLICIES (Continued) |
| 3.6 | Financial assets (Continued) |
Recognition and derecognition of financial assets (Continued)
Derecognition of financial assets occurs when the rights to receive cash flows from the financial assets expire or are transferred and substantially all of the risks and rewards of ownership have been transferred. At each balance sheet date, financial assets are reviewed to assess whether there is objective evidence of impairment. If any such evidence exists, impairment loss is determined and recognised based on the classification of the financial asset.
Impairment of financial assets
At each balance sheet date, financial assets other than at fair value through profit or loss are reviewed to determine whether there is any objective evidence of impairment. If any such evidence exists, the impairment loss is measured and recognised as follows:
| (i) | Loans and receivables |
A provision for impairment on loans and receivables carried at amortised cost is established when there is objective evidence that the group will not be able to collect all amounts due according to the original terms of the loans and receivables. Significant financial difficulties of the debtor, probability that the debtor will enter bankruptcy or financial reorganisation, and default or delinquency in payments are considered indicators that the loans and receivables are impaired. If there is objective evidence that an impairment loss on loans and receivables carried at amortised cost has been incurred, the amount of the loss is measured as the difference between the asset's carrying amount and the present value of estimated future cash flows (excluding future credit losses that have not been incurred) discounted at the financial asset's original effective interest rate (i.e. the effective interest rate computed at initial recognition). The carrying amount of the loans and receivables is reduced through the use of an allowance account, and the amount of the loss is recognised in the income statement of the period in which the impairment occurs.
If, in subsequent period, the amount of the impairment loss decreases and the decrease can be related objectively to an event occurring after the impairment was recognised, the previously recognised impairment loss is reversed to the extent that it does not result in a carrying amount of the financial asset exceeding what the amortised cost would have been had the impairment not been recognised at the date the impairment is reversed. The amount of the reversal is recognised in income statement of the period in which the reversal occurs.
JV-13
| 3. | SUMMARY OF SIGNIFICANT ACCOUNTING POLICIES (Continued) |
| 3.6 | Financial assets (Continued) |
(ii) Available-for-sale financial assets
When a decline in the fair value of an available-for-sale financial asset has been recognised directly in equity and there is objective evidence that the asset is impaired, the cumulative loss that had been recognised directly in equityan amount is removed from equity and recognised in the income statement even thoughas impairment loss. That amount is measured as the financialdifference between the asset's acquisition cost (net of any principal repayment and amortisation) and current fair value, less any impairment loss on that asset has not been derecognised. Impairment losses previously recognised in the income statement onstatement.
Reversals in respect of investment in equity instruments willclassified as available-for-sale are not reverserecognised in the income statement. The subsequent periods.increase in fair value is recognised directly in equity. Impairment losses previously recognised in income statementrespect of debt securities are subsequently reversed if anthe subsequent increase in the fair value of the investment can be objectively related to an event occurring after the recognitionimpairment loss were recognised. Reversal of impairment losses in such circumstances are recognised in the impairment loss.
| Cash and cash equivalents |
Cash and cash equivalents include cash at bank and in hand.hand, demand deposits with bank or financial institutions and short-terms highly liquid investments that are readily convertible into known amounts of cash and which are subject to an insignificant risk of change in value, having been within three months of maturity at acquisition.
| 3.8 | Impairment of assets |
The group's property, plant and equipment and the company's investments in subsidiaries are subject to impairment testing.
An impairment loss is recognised as an expense immediately for the amount by which the asset's carrying amount exceeds its recoverable amount. The recoverable amount is the higher of fair value, reflecting market conditions less costs to sell, and value in use. In assessing value in use, the estimated future cash flows are discounted to their present value using a pre-tax discount rate that reflects the current market assessment of the time value of money and the risk specific to the asset.
For the purposes of assessing impairment, where an asset does not generate cash inflows largely independent from those from other assets, are grouped at the lowest levelsrecoverable amount is determined for which there are separately identifiablethe smallest group of assets that generate cash flows (cash-generatinginflow independently (i.e. cash-generating units). As a result, some assets are tested individually for impairment and some are tested at the cash-generating unit level.
JV-14
| 3. | SUMMARY OF SIGNIFICANT ACCOUNTING POLICIES (Continued) |
| 3.8 | Impairment of assets (Continued) |
Impairment losses is charged pro rata to the assets in the cash generating unit.unit, except that the carrying value of an asset will not be reduced below its individual fair value less cost to sell, or value in use, if determinable.
An impairment loss is reversed if there has been a favourable change in the estimates used to determine the asset's recoverable amount and only to the extent that the asset's carrying amount does not exceed the carrying amount that would have been determined, net of depreciation or amortisation, if no impairment had been recognised.
| Financial liabilities |
The financial liabilities include trade and other payables, amounts due to group and related companies and borrowings.
Financial liabilities are recognised when the group or the company becomes a party to the contractual agreements of the instrument. All interest related charges are recognised as an expense in the income statement.
Where an existing financial liability is replaced by another from the same lender on substantially different terms, or the terms of an existing liability are substantially modified, such an exchange or modification is treated as a derecognition of the original liability and other payablesthe recognition of a new liability, and amounts due to group and related companiesthe difference in the respective carrying amount is recognised in the income statement.
Finance lease liabilities
Finance lease liabilities are recognised initially at their fair value and subsequently measured at amortised cost, usinginitial value less the effective interest method.capital element of lease repayments (see note 3.14).
Borrowings
Borrowings are recognised initially at fair value, net of transaction costs incurred. Borrowings are subsequently stated at amortised cost; any difference between the proceeds (net of transaction costs) and the redemption value is recognised in the income statement over the period of the borrowings using the effective interest method. Borrowings are classified as current liabilities unless the group has an unconditional right to defer settlement of the liability for at least twelve months after the balance sheet date.
Trade and other payables are recognised initially at their fair value and subsequently measured at amortised cost, using the effective interest method.
JV-15
| 3. | SUMMARY OF SIGNIFICANT ACCOUNTING POLICIES (Continued) |
| 3.10 | Employee benefits |
Retirement benefits costs
The company operates a defined contribution Mandatory Provident Fund retirement benefits scheme (the "MPF Scheme") under the Mandatory Provident Fund Schemes Ordinance, for all of its employees in Hong Kong. The MPF Scheme became effective on 1 December 2000. Contributions are made based on a percentage of the employees' basic salaries, limited to a maximum of HK$1,000 per month, and are charged to the income statement as they become payable in accordance with the rules of the MPF Scheme. The assets of the MPF Scheme are held separately from those of the company in an independently administered fund. The company's employer contributions vest fully with the employees when contributed into the MPF Scheme. The employees of the group's subsidiary which operates in Mainland China are required to participate in a central pension scheme operated by the local municipal government. The subsidiary is required to contribute certain percentage of its payroll costs to the central pension scheme. The contributions are charged to the income statement as they become payable in accordance with the rules of the central pension scheme.
Short-term employee benefits
Employee entitlements to annual leave are recognised when they accrue to employees. A provision is made for the estimated liability for annual leave as a result of services rendered by employees up to the balance sheet date. Non-accumulating compensated absences such as sick leave and maternity leave are not recognised until the time of leave.
| Share capital |
Ordinary shares are classified as equity. Share capital is determined using the nominal value of shares that have been issued.
The transaction costs of an equity transaction are accounted for as deduction from equity (net of any related income tax benefits) to the extent they are incremental cost directly attributable to the equity transaction that otherwise would have been avoided. The cost of an equity transaction that is abandoned are recognised as an expense.
| 3.12 | Foreign currency translation |
The consolidated financial statements are presented in Hong Kong Dollars (HK$), which is also the functional currency of the company.
In the individual financial statements of the consolidated entities, foreign currency transactions are translated into the functional currency of the individual entity using the exchange rates prevailing at the dates of the transactions. At the balance sheet date, monetary assets are liabilities denominated in foreign currencies are translated at the foreign exchange rates ruling at the balance sheet date. Foreign exchange gains and losses resulting from the settlement of such transactions and from the balance sheet date retranslation of monetary assets and liabilities are recognised in the income statement.
JV-16
| 3. | SUMMARY OF SIGNIFICANT ACCOUNTING POLICIES (Continued) |
| 3.12 | Foreign currency translation (Continued) |
Non-monetary items are carried at fair value that are denominated in foreign currencies are retranslated at the rates prevailing on the date when the fair value was determined and are reported as part of the fair value gain or loss. Non-monetary items that are measured in terms of historical cost in a foreign currency are not re-translated.
In the consolidated financial statements, all individual financial statements of foreign operations, originally presented in a currency different from the group’s presentation currency, have been converted into Hong Kong dollars. Assets and liabilities have been translated into Hong Kong dollars at the closing rate at the balance sheet date. Income and expenses have been converted into Hong Kong dollars at the exchange rates ruling at the transaction dates, or at the average rates over the reporting period, provided that the exchange rates do not fluctuate significantly. Any differences arising from this procedure have been dealt with separately in the exchange reserve in equity.
Other exchange differences arising from the translation of the net investment in foreign entities and of borrowings are taken to shareholders' equity. When a foreign operation is sold, such exchange differences are recognized in the income statement as part of the gain or loss on the sale.
| 3.13 | Accounting for income taxes |
Income tax comprises current tax and deferred tax.
Current income tax assets and/or liabilities comprise those obligations to, or claims from, tax authorities relating to the current or prior reporting period, that are unpaid at the balance sheet date. They are calculated according to the tax rates and tax laws applicable to the periods to which they relate, based on the taxable profit for the year. All changes to current tax assets or liabilities are recognised as a component of income tax expense in the income statement.
Deferred tax is calculated using the liability method on temporary differences at the balance sheet date between the carrying amounts of assets and liabilities in the financial statements with their respective tax bases. Deferred tax liabilities are generally recognised for all taxable temporary differences. Deferred tax assets are recognised for all deductible temporary differences, tax losses available to be carried forward as well as other unused tax credits, to the extent that it is probable that taxable profit will be available against which the deductible temporary differences, unused tax losses and unused tax credits can be utilised.
JV-17
| 3. | SUMMARY OF SIGNIFICANT ACCOUNTING POLICIES (Continued) |
| 3.13 | Accounting for income taxes (Continued) |
Deferred tax is calculated, without discounting, at tax rates that are expected to apply in the period the liability is settled or the asset realised, provided they are enacted or substantively enacted at the balance sheet date.
Changes in deferred tax assets or liabilities are recognised in the income statement, or in equity if they relate to items that are charged or credited directly to equity.
| 3.14 | Leases |
An arrangement, comprising a transaction or a series of transactions, is or contains a lease if the group determines that the arrangement conveys a right to use a specific asset or assets for an agreed period of time in return for a payment or a series of payments. Such a determination is made based on an evaluation of the substance of the arrangement and is regardless of whether the arrangement takes the legal form of a lease.
| (i) | Classification of assets leased to the group |
Assets that are held by the group under leases which transfer to the group substantially all the risks and rewards of ownership are classified as being held under finance leases. Leases which do not transfer substantially all the risks and rewards of assets remain withownership to the lessorgroup are accounted forclassified as operating leases. Operating
| (ii) | Assets acquired under finance leases |
Where the group acquires the use of assets under finance leases, the amounts representing the fair value of the leased assets, or, if lower, the present value of the minimum lease payments, of such assets are included in property, plant and equipment and the corresponding liabilities, net of finance charges, are recorded as obligation under finance leases.
Subsequent accounting for assets held under finance lease agreements corresponds to those applied to comparable acquired assets. The corresponding finance lease liability is reduced by lease payments less finance charges.
Finance charges implicit in the lease payments are recognisedcharged to income statement over the period of the leases so as to produce an expenseapproximately constant periodic rate of charge on a straight-line basis. Affiliated costs, such as maintenance and insurance, are expensed as incurred. Contingent rentalsthe remaining balance of the obligations for each accounting period.
| (iii) | Operating lease charges as the lessee |
Where the group has the use of assets held under operating leases, payments made under the leases are charged to the income statement inon a straight-line basis over the accounting period in which they are incurred.lease terms except where an alternative basis is more representative of the pattern of benefits to be derived from the leased assets.
| 3. | SUMMARY OF SIGNIFICANT ACCOUNTING POLICIES (Continued) |
| 3.15 | Recognition of revenue |
Revenue comprises the fair value for the sale of goods, rendering of services and the use by others of the group's assets yielding interest, net of rebates and discounts. Provided it is probable that the economic benefits will flow to the group and the revenue and costs, if applicable, can be measured reliably, revenue is recognised as follows :
Revenue from the sale of goods is recognised when the significant risks and rewards of ownership of the goods have been transferred to customers. This is usually taken as the time when the goods are delivered and the customer has accepted the goods.
Rental income from properties letting under operating leases is recognised on a straight line basis over the lease terms.
Interest income is recognised on a time proportion basis using the effective interest rate method.
| 3.16 | Related parties |
Parties are considered to be related to the group if :
| (i) | directly, or indirectly through one or more intermediaries, the party : |
| - | controls, is controlled by, or is under common control with, the group; |
| - | has an interest in the group that gives it significant influence over the group; |
| - | has joint control over the group; |
| (ii) | the party is a jointly-controlled entity; |
| (iii) | the party is an associate; |
| (iv) | the party is a member of the key management personnel of the group or its parent; |
| (v) | the party is a close member of the family of any individual referred to in (i) or (iv); |
| (vi) | the party is an entity that is controlled, jointly-controlled or significantly influenced by or for which significant voting power in such entity resides with, directly or indirectly, any individual referred to in (iv) or (v); or |
| (vii) | the party is a post-employment benefit plan for the benefit of employees of the group, or of any entity that is a related party of the group. |
3. | SUMMARY OF SIGNIFICANT ACCOUNTING POLICIES (Continued) |
| 3.17 | Provisions and contingent liabilities |
Provisions are recognised when the group has a present obligation (legal or constructive) as a result of a past event, and it is probable that an outflow of economic benefits will be required to settle the obligation and a reliable estimate can be made. Where the time value of money is material, provisions are stated at the present value of the expenditure expected to settle the obligation. All provisions are reviewed at each balance sheet date and adjusted to reflect the current best estimate.
Where it is not probable that an outflow of economic benefits will be required, or the amount cannot be estimated reliably, the obligation is disclosed as a contingent liability, unless the probability of outflow of economic benefits is a possible obligation that arises from past events andremote. Possible obligations, whose existence will only be confirmed by the occurrence or non-occurrence of one or more uncertain future events not wholly within the control of the group. It cangroup are also be a present obligation arising from past events that is not recognised because it is not probable thatdisclosed as contingent liabilities unless the probability of outflow of economic resources will be required orbenefits is remote.
Contingent liabilities are recognised in the amountcourse of obligationthe allocation of purchase price to the assets and liabilities acquired in a business combination. They are initially measured at fair value at the date of acquisition unless the fair value cannot be measured reliably.
4. | CRITICAL ACCOUNTING ESTIMATES AND JUDGEMENTS |
Estimates and judgements are continually evaluated and are based on historical experience and other factors, including expectations of future events that are believed to be reasonable under the circumstances.
The group makes estimates and assumptions concerning the future. The resulting accounting estimates will, by definition, seldom equal the related actual results. The estimates and assumptions that have a significant risk of causing a material adjustment to the carrying amounts of assets and liabilities within the next financial year are discussed below :
Depreciation and amortisation
The group and company depreciated the property, plant and equipment on a straight-line basis over the estimated useful lives, starting from the date on which the assets are placed into productive use. The estimated useful lives reflect the directors' estimate of the periods that the group intends to derive future economic benefits from the use of the group's and company's property, plant and equipment.
JV-20
| 4. | CRITICAL ACCOUNTING ESTIMATES AND JUDGEMENTS (Continued) |
Impairment of receivables
The policy for the impairment of receivables of the group is based on the evaluation of collectibility and ageing analysis of accounts and on the management's judgement. A considerable amount of judgement is required in assessing the ultimate realisation of these receivables, including the current creditworthiness and the past collection history of each debtor.
Net realisable value of inventories
Net realisable value of inventories is the actual or estimated selling price in the ordinary course of business, less further costs of completion and the estimated costs necessary to make the sale. These estimates are based on the current market condition and the historical experience of selling products of similar nature. It could change significantly as a result of competitor actions in response to the changes in market condition. Management reassess these estimations at the balance sheet date.
Current taxation and deferred taxation
The group is subject to income taxes in Hong Kong and the People's Republic of China ("PRC"). Significant judgement is required in determining the amount of the provision of taxation and the timing of payment of the related taxations. There are many transactions and calculations for which the ultimate tax determination is uncertain during the ordinary course of business. Where the final tax outcome of these matters is different from the amounts that were initially recorded, such differences will impact the income tax and deferred tax provisions in the period in which such determination is made.
5. | TURNOVER |
Revenue, which is also the group's turnover, represents total invoiced value of goods supplied, less discounts and returns.
6. | OTHER INCOME |
| 2008 | 2007 | 2006 | ||||||||||
| HK$ | HK$ | HK$ | ||||||||||
| Gain on disposal of property, plant and equipment | 94 | 347,500 | 150 | |||||||||
| Interest income | 2,384,538 | 2,289,039 | 1,761,425 | |||||||||
| Rental income, less outgoings | 268,800 | 268,800 | 268,800 | |||||||||
| Sundry income | 2,697,363 | 1,787,853 | 768,306 | |||||||||
| 5,350,795 | 4,693,192 | 2,798,681 | ||||||||||
7. | FINANCE COSTS |
| 2008 | 2007 | 2006 | ||||||||||
| HK$ | HK$ | HK$ | ||||||||||
| Interest charges on : | ||||||||||||
| - Discounted bills | 210,016 | 405,953 | 265,063 | |||||||||
JV-21
PROFIT BEFORE INCOME TAX |
| 2008 | 2007 | 2006 | ||||||||||
| HK$ | HK$ | HK$ | ||||||||||
| Profit before income tax is arrived at after charging : | ||||||||||||
| Amortisation of advanced lease payments | 427,392 | 424,328 | 415,454 | |||||||||
| Auditors' remuneration | 285,000 | 270,000 | 187,020 | |||||||||
| Cost of inventories recognised as expenses | 176,141,949 | 213,147,126 | 125,843,197 | |||||||||
| Depreciation of property, plant and equipment | 10,166,942 | 5,752,971 | 4,414,388 | |||||||||
| Exchange (gain)/loss, net | (203,865 | ) | 1,141,163 | 598,754 | ||||||||
| Loss on disposal of available for sale financial assets | 34,344 | 87,565 | 9,178 | |||||||||
| Operating lease charges in respect of land and buildings | 1,861,592 | 1,343,100 | 1,334,433 | |||||||||
| Retirement benefits scheme contributions | 277,902 | 255,399 | 226,818 | |||||||||
| Staff costs (excluding retirement benefits scheme contributions) | 23,882,056 | 23,430,733 | 14,213,294 | |||||||||
| 9. | |||||||
| INCOME TAX EXPENSE | |||||||
| 2008 | 2007 | 2006 | ||||||||||
| HK$ | HK$ | HK$ | ||||||||||
| The tax charge comprises : | ||||||||||||
| Hong Kong profits tax | ||||||||||||
| - current year | 3,908,368 | 6,480,183 | 3,922,325 | |||||||||
| - under/(over)provision in prior years | 16,512 | 1,549 | (71,627 | ) | ||||||||
| PRC Foreign Enterprise Income Tax | ||||||||||||
| - current year | 459,206 | 1,100,442 | - | |||||||||
| - (over)/under provision in prior years | (10,000 | ) | 732,849 | - | ||||||||
| 4,374,086 | 8,315,023 | 3,850,698 | ||||||||||
Deferred tax (Note 26) | ||||||||||||
| - current year | (200,835 | ) | 533,712 | 62,000 | ||||||||
| Total income tax expense | 4,173,251 | 8,848,735 | 3,912,698 | |||||||||
Hong Kong profits tax has been provided at the rate of 17.5% (2006(2007 : 17.5% and 2006 : 17.5%) on the group's estimated assessable profits arising in Hong Kong for the year.
JV-22
| 9. | INCOME TAX EXPENSE (Continued) |
Reconciliation between tax expense and accounting profit at applicable tax rates :