
[X] | ||
| ANNUAL REPORT PURSUANT TO SECTION 13 OR 15(d) OF THE SECURITIES EXCHANGE ACT OF 1934 |
[ ] | ||
| TRANSITION REPORT PURSUANT TO SECTION 13 OR 15(d) OF THE SECURITIES EXCHANGE ACT OF 1934 |
.
(Exact Name of Registrant as Specified in Its Charter)
Delaware | |||||||
43-2052503 | |||||||
| (Jurisdiction of Incorporation or Organization) | (IRS Employer Identification No.) | ||||||
125 West 55th Street New York, New York 10019 (Address of Principal Executive Offices) (Zip Code) Registrant’s Telephone Number, Including Area Code:(212) 231-1000 Securities registered pursuant to Section 12(b) of the Act: | |||||||
(Address of Principal Executive Offices) (Zip Code)
Registrant’s Telephone Number, Including Area Code:(212) 231-1000
Securities Registered Pursuant to Section 12(b) of the Act:
Title of Each Class: | Name of Exchange on Which Registered: | |||||
| Limited Liability Company Interests of Macquarie Infrastructure Company LLC (“LLC Interests”) | New York Stock Exchange | |||||
Indicate by check mark if the registrant is a well-known seasoned issuer, as defined in Rule 405 of the Securities Act.
Yeso [ ] Nox [X]
Indicate by check mark if disclosure of delinquent filers pursuant to Item 405 of Regulation S-K is not contained herein, and will not be contained, to the best of registrants’ knowledge, in definitive proxy or information statements incorporated by reference in Part III of this Form 10-K or any amendment to this Form 10-K.o
Indicate by check mark whether the registrant is a shell company (as defined in Rule 12b-2 of the Exchange Act). Yeso [ ] Nox [X]
| Page | |||||||||||||||
|---|---|---|---|---|---|---|---|---|---|---|---|---|---|---|---|
| PART I | |||||||||||||||
| Item 1. | |||||||||||||||
Business | 3 | ||||||||||||||
Item 1A.
| |||||||||||||||
| |||||||||||||||
| |||||||||||||||
| |||||||||||||||
| |||||||||||||||
| Risk Factors | 23 | ||||||||||||||
Item 1B. | Unresolved Staff Comments | 39 | |||||||||||||
| Item 2. | Properties | 39 | |||||||||||||
| Item 3. | Legal Proceedings | 41 | |||||||||||||
| Item 4. | [Removed and Reserved] | 41 | |||||||||||||
PART II | |||||||||||||||
| Item 5. | Market for Registrant’s Common Equity, Related Stockholder Matters and Issuer Purchases of Equity Securities | ||||||||||||||
Item 6.
| Selected Financial Data | 43 | |||||||||||||
Item 7. | Management’s Discussion and Analysis of Financial Condition and Results of Operations | ||||||||||||||
Item 7A. | Quantitative and Qualitative Disclosures About Market Risk | ||||||||||||||
Item 8. | Financial Statements and Supplementary Data | ||||||||||||||
Item 9. | Changes in and Disagreements With Accountants on Accounting and Financial Disclosure | ||||||||||||||
Item 9A.
| |||||||||||||||
| |||||||||||||||
| Controls and Procedures | 151 | ||||||||||||||
Item 9B. | Other Information | 153 | |||||||||||||
PART III | |||||||||||||||
| Item 10. | Directors and Executive Officers of the Registrant | ||||||||||||||
Item 11.
| Executive Compensation | 153 | |||||||||||||
Item 12. | Security Ownership of Certain Beneficial Owners and Management and Related Stockholder Matters | ||||||||||||||
Item 13.
| |||||||||||||||
| |||||||||||||||
| |||||||||||||||
| Item 14. | Principal Accountant Fees and Services | 154 | |||||||||||||
PART IV | |||||||||||||||
| Item 15. | Exhibits, Financial Statement Schedules | 154 | |||||||||||||
i
In 2007, we made an election
officer and chief financial officer and seconds or makes other personnel available as required. The services performed for the Company are provided at our Manager’s expense, and includes the compensation of our seconded personnel.
The challenges posed byAviation, the economic conditionsrevenues of which are based on patronage.
Over the medium term, subject to having access to external sources of capital at a reasonable cost, we may resume growth through acquisition of additional infrastructure businesses. Such acquisitions may be bolt-ons to existing business platforms.
We have reduced long-term debt balances through the application of accumulated cash generated by our businesses (which was historically distributed to shareholders) and proceeds from the sale of the non-controlling stake in District Energy. We have eliminated all debt at the MIC holding company level and reduced the balance outstanding on the primary facility at Atlantic Aviation. We expect to continue to reduce the debt of Atlantic Aviation through the application of cash generated by that business. This componenteach of our strategy has strengthenedbusinesses;
We intendbusiness to continue to seek opportunities to reduce expenses through rationalization of staffing and business process improvements. In addition, we are actively seeking opportunities to improve the marketing and organic growth of our businesses. We are prudently managing reinvestment in our businesses in the form of maintenance capital expenditures without compromising service levels or operational capabilities of these businesses. Executing this component of our strategy is expected to improve the generation of free cash flow by our businesses.
We have reinvested substantially all of the cash flows generated at IMTT in economically attractive growth opportunities, primarily additional storage capacity. We will continue to reinvest cash flow generated by this business in additional growth projects that we expect will also generate appropriate returns.
We have also reinvested a portion of the cash generated by each of District Energy and The Gas Company into projects that support customer acquisition. We will continue to reinvest in such opportunities in the future.
We intend to meet our contractual obligations with respect to the deployment of growth capital, such as our leasehold improvement obligations at Atlantic Aviation. We have sufficient committed financing to meet these expenditures. We expect that these projects will increase the amount of free cash flow generated by this business.
| Proportion of Terminal Revenue from Major Commodities Stored | ||||||||||||||||
|---|---|---|---|---|---|---|---|---|---|---|---|---|---|---|---|---|
| Petroleum/Asphalt | Chemical | Renewable/Vegetable & Animal Oil | Other | |||||||||||||
| 60% | 27% | 9% | 4% | |||||||||||||
| Proportion of Terminal Revenue from Major Commodities Stored | ||||||
| Petroleum/Asphalt | Chemical | Renewables/Vegetable & Animal Oil | Other | |||
| 58% | 29% | 9% | 4% | |||
Financial information for 100% of this business is as follows ($ in millions):
| As of, and for the Year Ended, December 31, | |||||||||||||||
|---|---|---|---|---|---|---|---|---|---|---|---|---|---|---|---|
| 2010 | 2009 | 2008 | |||||||||||||
| Revenue | $ | 557.2 | $ | 346.2 | $ | 352.6 | |||||||||
| EBITDA excluding non-cash items | 236.8 | 147.7 | 136.6 | ||||||||||||
| Total assets | 1,221.9 | 1,064.8 | 1,006.3 | ||||||||||||
| As of, and for the Year Ended, December 31, | ||||||||||||
| 2009 | 2008 | 2007 | ||||||||||
| Revenue | $ | 346.2 | $ | 352.6 | $ | 275.2 | ||||||
| EBITDA excluding non-cash items | 147.7 | 136.6 | 89.0 | |||||||||
| Total assets | 1,064.8 | 1,006.3 | 862.5 | |||||||||
The following table summarizes the location of each IMTT facility and the corresponding numbermillions of tanks in service,barrels of storage capacity in service and number of ship and barge docks available for product transfer. This information reflects the site assetsis as of December 31, 20092010 and does not include tanks used in packaging, recovery tanks, and/or other storage capacity not typically available for rent.
| Facility | Land | Aggregate Capacity of Storage Tanks in Service | Number of Ship & Barge Berths in Service | |||||||||||
|---|---|---|---|---|---|---|---|---|---|---|---|---|---|---|
| (Millions of Barrels) | ||||||||||||||
Facilities in the United States: | ||||||||||||||
| Bayonne, NJ | Owned | 16.0 | 20 | |||||||||||
| St. Rose, LA* | Owned | 14.7 | 16 | |||||||||||
| Gretna, LA* | Owned | 2.0 | 5 | |||||||||||
| Avondale, LA* | Owned | 1.1 | 4 | |||||||||||
| Geismar, LA* | Owned | 0.9 | 3 | |||||||||||
| Lemont, IL | Owned/Leased | 1.0 | 1 | |||||||||||
| Joliet, IL | Owned | 0.9 | 3 | |||||||||||
| Richmond, CA | Owned | 0.7 | 2 | |||||||||||
| Chesapeake, VA | Owned | 1.0 | 1 | |||||||||||
| Richmond, VA | Owned | 0.4 | 1 | |||||||||||
Facilities in Canada: | ||||||||||||||
Quebec City, Quebec(1) | Leased | 2.0 | 2 | |||||||||||
Placentia Bay, Newfoundland(2) | Leased | 3.0 | 2 | |||||||||||
| Total | 43.7 | 60 | ||||||||||||
| Facility | Land | Number of Storage Tanks in Service | Aggregate Capacity of Storage Tanks in Service | Number of Ship & Barge Berths in Service | ||||||||||||
| (Millions of Barrels) | ||||||||||||||||
| Facilities in the United States: | ||||||||||||||||
| Bayonne, NJ | Owned | 600 | 16.0 | 18 | ||||||||||||
| St. Rose, LA* | Owned | 205 | 13.4 | 16 | ||||||||||||
| Gretna, LA* | Owned | 56 | 2.0 | 5 | ||||||||||||
| Avondale, LA* | Owned | 82 | 1.1 | 4 | ||||||||||||
| Geismar, LA* | Owned | 34 | 0.9 | 3 | ||||||||||||
| Lemont, IL | Owned/Leased | 155 | 1.1 | 3 | ||||||||||||
| Joliet, IL | Owned | 71 | 0.7 | 2 | ||||||||||||
| Richmond, CA | Owned | 46 | 0.6 | 1 | ||||||||||||
| Chesapeake, VA | Owned | 23 | 1.0 | 1 | ||||||||||||
| Richmond, VA | Owned | 12 | 0.4 | 1 | ||||||||||||
| Facilities in Canada: | ||||||||||||||||
| Quebec City, Quebec(1) | Leased | 53 | 1.9 | 2 | ||||||||||||
| Placentia Bay, Newfoundland(2) | Leased | 6 | 3.0 | 2 | ||||||||||||
| Total | 1,343 | 42.1 | 58 | |||||||||||||
| * | Collectively the “Louisiana” facilities. |
| (1) | Indirectly 66.7% owned and managed by IMTT. |
| (2) | Indirectly 20.1% owned and managed by IMTT. |
IMTT-Bayonne has the capability to quickly load and unload the largest bulk liquid transport ships entering NYH. The U.S. Army Corp of Engineers (USACE) has dredged the Kill Van Kull channel passing the IMTT-Bayonne docks to 45 feet (IMTT has dredged some but not all of its docks to that depth). Most competitors in NYH have facilities located on the southern portion of the Arthur Kill (water depth of approximately 35 feet) and force large ships to transfer product through lightering (transferring cargo to barges at anchorage) before docking. This technique substantially increases the cost of loading and unloading vessels. This competitive advantage for Bayonne may improve as the USACE has announced plans to dredgeis in the process of dredging the Kill Van Kull to 50 feet (with no planned increase in the depth of the southern portion of the Arthur Kill).
Demand for third-party bulk liquid storage in NYH has remained strong during the past several years, as illustrated by the capacity utilization at the Bayonne facility. For the three years ended December 31, 2009, IMTT-Bayonne on average rented over 94% of its available storage capacity.years.
Demand for third-party bulk liquid storage on the lower Mississippi River has remained strong during the past several years, as illustrated by the capacity utilization at the IMTT Louisiana facilities. For the three years ended December 31, 2009, IMTT rented approximately 96% of the aggregate available storage capacity at St. Rose, Gretna, Avondale and Geismar.years.
The IMTT head office in New Orleans provides the business with central management, performs support functions such as accounting, tax, finance, human resources, insurance, information technology and legal services and provides support for functions that have been partially de-centralized to the terminal level such as engineering and environmental and occupational health and safety regulatory compliance. IMTT’s senior management team, other than the terminal managers, have on average 36 years experience in the bulk liquid storage industry and 2829 years service with IMTT.
The shareholders’ agreementShareholders’ Agreement is filedincluded as an exhibit to this Annual Report on Form 10-K.
Financial information for this business is as follows ($ in millions):
| As of, and for the Year Ended, December 31, | |||||||||||||||
|---|---|---|---|---|---|---|---|---|---|---|---|---|---|---|---|
| 2010 | 2009 | 2008 | |||||||||||||
| Revenue | $ | 210.6 | $ | 175.4 | $ | 213.0 | |||||||||
| EBITDA excluding non-cash items | 44.4 | 37.6 | 27.9 | ||||||||||||
| Total assets | 350.4 | 344.9 | 330.2 | ||||||||||||
| % of our consolidated revenue | 25.0 | % | 24.7 | % | 21.8 | % | |||||||||
| As of, and for the Year Ended, December 31, | ||||||||||||
| 2009 | 2008 | 2007 | ||||||||||
| Revenue | $ | 175.4 | $ | 213.0 | $ | 170.4 | ||||||
| EBITDA excluding non-cash items | 37.6 | 27.9 | 25.6 | |||||||||
| Total assets | 344.9 | 330.2 | 313.1 | |||||||||
| % of our consolidated revenue | 24.7 | % | 21.8 | % | 22.6 | % | ||||||
The Gas Company’s long-term strategy is to increase and diversify its customer base. The business intends to increase penetration of the residential, the expanding government (primarily military) and the tourism-related markets. The business also intends to invest in and promote the value of The Gas Company’s products and services and its attractiveness as a cleaner alternative to other energy sources in Hawaii.
The business’ utility rates are established by the HPUC in periodic rate cases typically initiated by The Gas Company. The business initiates a rate case by submitting a request to the HPUC for an increase in the rates based, for example, upon materially higher costs related to providing the service. Following initiation of the rate increase request by The Gas Company and submission by the Division of Consumer Advocacy and other intervening parties of their positions on the rate request, and potentially an evidentiary hearing, the HPUC issues a decision establishing the revenue requirements and the resulting rates that The Gas Company will be allowed to charge.
Any decision by Chevron regarding its operations in Hawaii could affect the business’ cost of LPG and may adversely impact its non-utility contribution margin and profitability. In an effort to mitigate the risk of supply disruption and/or a potential increase in costs, the business ishas been evaluating a number of alternatives, including additional shipments of foreign sourced product.product and additional storage.
District Energy operates the largest district cooling system in the United States. The system currently serves overapproximately 100 customers in downtown Chicago under long-term contracts and one customer outside the downtown area. District Energy produces chilled water at five plants located in downtown Chicago and distributes it through a closed loop of underground piping for use in the air conditioning systems of large commercial, retail and residential buildings in the central business district. The first of the plants became operational in 1995, and the most recent came on line in June 2002. With modifications made in 2009, the downtown system has the capacity to produce approximately 92,000 tons of chilled water, although it has approximately 102,000103,000 tons of cooling under contract. The business is able to sell continuous service capacity in excess of the total system capacity because not all customers use their full capacity at the same time.
| As of, and for the Year Ended, December 31, | |||||||||||||||
|---|---|---|---|---|---|---|---|---|---|---|---|---|---|---|---|
| 2010 | 2009 | 2008 | |||||||||||||
| Revenue | $ | 56.8 | $ | 48.6 | $ | 48.0 | |||||||||
| EBITDA excluding non-cash items | 22.8 | 20.8 | 21.1 | ||||||||||||
| Total assets | 228.5 | 234.8 | 227.1 | ||||||||||||
| % of our consolidated revenue | 6.8 | % | 6.8 | % | 4.9 | % | |||||||||
| As of, and for the Year Ended, December 31, | ||||||||||||
| 2009 | 2008 | 2007 | ||||||||||
| Revenue | $ | 48.6 | $ | 48.0 | $ | 49.5 | ||||||
| EBITDA excluding non-cash items | 20.8 | 21.1 | 5.5 | |||||||||
| Total assets | 234.8 | 227.1 | 232.6 | |||||||||
| % of our consolidated revenue | 6.8 | % | 4.9 | % | 6.6 | % | ||||||
Growth: This business intends to grow revenue and profits by marketing its services to developers in the downtown Chicago market. Its value proposition is centered on high reliability, efficiency and ease of operation and maintenance. The management team develops and maintains relationships with property developers, engineers, architects and city planners as a means of keeping District Energy and these attributes “top of mind” when they select among building cooling systems and services.
Corrective maintenance
District Energy is not subject to substantial competitive pressures. Customers are generally not allowed to cool their premises by means other than the chilled water service the business provides. In addition, the primary alternative available to building owners is the installation of a stand-alone water chilling system (self-cooling). While competition from self-cooling exists, the business expects that the vast majority of its current contracts will be renewed at maturity. Installation of a water chilling system can require significant building reconfiguration as well as space for reconfiguration, and capital expenditure, whereas District Energy has the advantage of economies of scale in terms of efficiency, staff and electricity procurement.
Financial information for this business is as follows ($ in millions):
| As of, and for the Year Ended, December 31, | |||||||||||||||
|---|---|---|---|---|---|---|---|---|---|---|---|---|---|---|---|
| 2010 | 2009 | 2008 | |||||||||||||
| Revenue | $ | 573.4 | $ | 486.1 | $ | 716.3 | |||||||||
| EBITDA excluding non-cash items | 117.5 | 106.5 | 137.1 | ||||||||||||
| Total assets | 1,410.1 | 1,473.2 | 1,660.8 | ||||||||||||
| % of our consolidated revenue | 68.2 | % | 68.5 | % | 73.3 | % | |||||||||
| As of and for the Year Ended, December 31, | ||||||||||||
| 2009 | 2008 | 2007 | ||||||||||
| Revenue | $ | 486.1 | $ | 716.3 | $ | 534.3 | ||||||
| EBITDA excluding non-cash items | 106.5 | 137.1 | 119.9 | |||||||||
| Total assets | 1,473.2 | 1,660.8 | 1,763.7 | |||||||||
| % of our consolidated revenue | 68.5 | % | 73.3 | % | 70.8 | % | ||||||
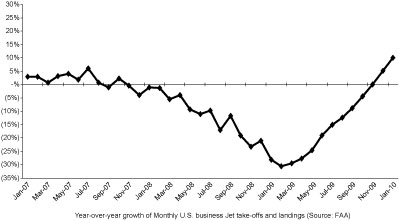
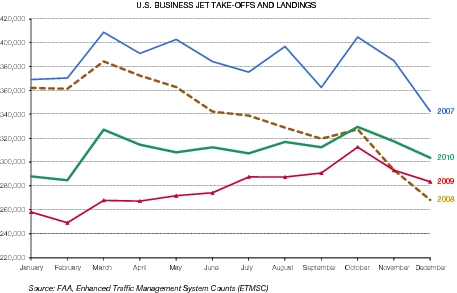
Despite improved access to general aviation resulting from an expansion of fractional and charter offerings and the challenges facing commercial aviation including potential mainline carrier consolidation and security-related delays, all of which strengthened the general aviation industry, FBO gross profit has been negatively affected by thesector. The business believes business jet traffic will continue to expand if economic downturn which resulted in a reduction in the volume of fuel sold. See “Risk Factors” in Part I, Item 1A.activity continues to recover.
In 2009, in response to customer demand,
Competition in the FBO business exists on a local basis at most of the airports at which Atlantic Aviation operates. The FBO at the East 34th Street Heliport in New York and 32 of the other FBOs in the network are the only FBOs at their respective airports. The remaining 39 FBOs have one or more competitors at the airport.locations. The FBOs compete on the basis of location of the facility relative to runways and street access, service, value-added features, reliability and price. To a lesser extent, each FBO also faces competitive pressure from the fact that aircraft may take on sufficient fuel at one location and not need to refuel at a specific destination. FBO operators also face indirect competition from facilities located at other nearby airports.
The day-to-day operations of Atlantic Aviation are managed by individual site managers who are responsible for all aspects of the operations at their site. Responsibilities include ensuring that customer requirements are met by the staff employed at the site and that revenue is collected, and expenses incurred, in accordance with internal guidelines. Local managers are, within the specified guidelines, empowered to make decisions as to fuel pricing and other services, thereby improving responsiveness and customer service. Local managers within a geographic region are supervised by one of fivefour regional managers covering the United States.
As of December 31, 2009, on a consolidated basis, continuing operations had total long-term debt outstanding of $1.2 billion, plus additional availability under existing credit facilities. In addition, IMTT had total long-term debt outstanding of $632.2 million at December 31, 2009. The terms of these debt arrangements generally require compliance with significant operating and financial covenants. The ability of each of our businesses or investments to meet their respective debt service obligations and to refinance or repay their outstanding indebtedness will depend primarily upon cash produced by that business.
This indebtedness could have important consequences, including:
If our businesses are unable to comply with the terms of any of their various debt agreements, they may be required to refinance a portion or all of the related debt or obtain additional financing. As discussed further
herein, our businesses may not be able to refinance or obtain additional financing because of their high levels of debt and debt incurrence restrictions under their debt agreements or because of adverse conditions in credit markets generally. Our businesses also may be forced to default on various debt obligations if cash flow from the relevant operating business is insufficient and refinancing or additional financing is unavailable, and, as a result, the relevant debt providers may accelerate the maturity of their obligations. If any of our businesses or investments are unable to repay their debts when due, they would become insolvent.
Our total assets reflect a substantial amount of goodwill and other intangible assets. At December 31, 2009, goodwill and other intangible assets, net, represented approximately 56.3% of total assets from continuing operations. Goodwill and other intangible assets were primarily recognized as a result of the acquisitions of our businesses and investments. Other intangible assets consist primarily of airport operating rights, trade names and customer relationships. On at least an annual basis, we assess whether there has been an impairment in the value of goodwill and assess for impairment of other intangible assets with indefinite lives when there are triggering events or circumstances. If the carrying value of the tested asset exceeds its estimated fair value, impairment is deemed to have occurred. In this event, the amount is written down to fair value. Under current accounting rules, this would result in a charge to reported earnings. We have recognized significant impairments in the past, and any future determination requiring the write-off of a significant portion of goodwill or other intangible assets would negatively affect our reported earnings and total capitalization, and could be material.
The Company is a holding company with no operations. Therefore, it is dependent upon the ability of our businesses and investments to pay dividends and make distributions to the Company to enable it to meet its expenses, reduce any outstanding debt at the holding company level and to make distributions to shareholders in the future. The ability of our operating subsidiaries and the businesses in which we will hold investments to make distributions to the Company is subject to limitations based on their operating performance, the terms of their debt agreements and the applicable laws of their respective jurisdictions. In addition, the ability of each business to reduce its outstanding debt will be similarly limited by its operating performance, as discussed below and in Part 1, Item 7, “Management’s Discussion and Analysis of Financial Condition and Results of Operations.” If, as a consequence of these various limitations and restrictions, we are unable to receive sufficient dividends and/or distributions from our businesses, we may be limited in our ability to reduce the level of any outstanding debt and declare distributions on our LLC interests. In addition, we may be unable to pay our management fees to our Manager. If our Manager resigned, it would trigger a change-in-control default provision under the credit facilities of some of our businesses, which would permit the relevant lenders to accelerate the indebtedness.
We own 50% of IMTT and 50.01% of District Energy and may acquire less than majority ownership in other businesses in the future. Our ability to influence the management of jointly owned businesses, and the ability of these businesses to continue operating without disruption, depends on our reaching agreement with our co-investors and reconciling investment and performance objectives for these businesses. To the extent that we are unable to agree with co-investors regarding the business and operations of the relevant investment, the performance of the investment and the operations may suffer, and could have a material adverse effect on our results. Furthermore, we may, from time to time, own non-controlling interests in investments. Management and controlling shareholders of these investments may develop different objectives than we have and may not make distributions to us at levels that we had anticipated. Our inability to exercise significant influence over the operations, strategies and policies of non-controlled investments means that decisions could be made that could adversely affect our results and our ability to generate cash and pay distributions on our LLC interests.
Our businesses generally are, and will continue to be, subject to substantial regulation by governmental agencies. In addition, our businesses rely on obtaining and maintaining government permits, licenses, concessions, leases or contracts. Government entities, due to the wide-ranging scope of their authority, have significant leverage over us in their contractual and regulatory relationships with us that they may exercise in a manner that causes us delays in the operation of our businesses or pursuit of our strategy, or increased administrative expense. Furthermore, government permits, licenses, concessions, leases and contracts are generally very complex, which may result in periods of non-compliance, or disputes over interpretation or enforceability. If we fail to comply with these regulations or contractual obligations, we could be subject to monetary penalties or we may lose our rights to operate the affected business, or both. Where our ability to operate an infrastructure business is subject to a concession or lease from the government, the concession or lease may restrict our ability to operate the business in a way that maximizes cash flows and profitability. Further, our ability to grow our current and future businesses will often require consent of numerous government regulators. Increased regulation restricting the ownership or management of U.S. assets, particularly infrastructure assets, by non-U.S. persons, given the non-U.S. ultimate ownership of our Manager, may limit our ability to pursue acquisitions. Any such regulation may also limit our Manager’s ability to continue to manage our operations, which could cause disruption to our businesses and a decline in our performance. In addition, any required government consents may be costly to seek and we may not be able to obtain them. Failure to obtain any required consents could limit our ability to achieve our growth strategy.
Our contracts with government entities may also contain clauses more favorable to the government counterparty than a typical commercial contract. For instance, a lease, concession or general service contract may enable the government to terminate the agreement without requiring them to pay adequate compensation. In addition, government counterparties also may have the discretion to change or increase regulation of our operations, or implement laws or regulations affecting our operations, separate from any contractual rights they may have. Governments have considerable discretion in implementing regulations that could impact these businesses. Because our businesses provide basic services, and face limited competition, governments may be influenced by political considerations to take actions that may hinder the efficient and profitable operation of our businesses and investments.
Where our businesses or investments are sole or predominant service providers in their respective service areas and provide services that are essential to the community, they are likely to be subject to rate regulation by governmental agencies that will determine the prices they may charge. We may also face fees or other charges imposed by government agencies that increase our costs and over which we have no control. We may
be subject to increases in fees or unfavorable price determinations that may be final with no right of appeal or that, despite a right of appeal, could result in our profits being negatively affected. In addition, we may have very little negotiating leverage in establishing contracts with government entities, which may decrease the prices that we otherwise might be able to charge or the terms upon which we provide products or services. Businesses and investments we acquire in the future may also be subject to rate regulation or similar negotiating limitations.
Our businessesdistributions from IMTT is limited, and investments are subject to federal, state and local safety, health and environmental laws and regulations. These laws and regulations affect all aspects of their operations and are frequently modified. There is a risk that any one of our businesses or investments may not be able to comply with some aspect of these laws and regulations, resulting in fines or penalties. Additionally, if new laws and regulations are adopted or if interpretations of existing laws and regulations change, we could be required to increase capital spending and incur increased operating expenses in order to comply. Because the regulatory environment frequently changes, we cannot predict when or how we may be affectednegatively impacted by disagreements with our co-investor regarding IMTT’s business and operations.
A significant and sustained increase in the price of oil could have a negative impact on the profitability of a number of our businesses. Higher prices for jet fuel could result in less use of aircraft by general aviation customers, which would have a negative impact on the profitability of Atlantic Aviation. Higher fuel prices could increase the cost of power to our businesses generally which they may not be able to fully pass on to customers.
the level of air travel, adversely affecting Atlantic Aviation. General aviation travel is primarily a function of economic activity. Consequently, during periods of economic downturn, FBO customers are more likely to curtail air travel.
Some of Atlantic Aviation’s competitors are pursuing more aggressive pricing strategies. These competitors operate FBOs at a number of airports where Atlantic Aviation operates or at airports near where it operates. This competition, combined with the continuation or worsening of current economic conditions, has in recent periods and may continue to result in increased focus on cost among customers and, consequently, a decline in corporate jet usage and increased price sensitivity. These factors may cause volumes of fuel sales and market share to decline and may result in increased margin pressure, adversely affecting the profitability of this business.
the relevant authority to terminate the lease at their convenience. In each case, Atlantic Aviation would then lose the income from that location and potentially the expected returns from prior capital expenditures. Atlantic Aviation would also likely be in default under the loan agreements and be obliged to repay its lenders a portion or the entire outstanding loan amount. Any such events would have a material adverse effect on Atlantic Aviation’s results of operations.
PCAA is in the process of completing a sale of its assets through a Chapter 11 bankruptcy. Creditors of the businessFAA traffic data may also attempt to seek recovery from the Company and, through the Company, seek recourse to the assets of our other businesses, regardless of the merits of such a claim or lack thereof, which could result in substantial legal costsconclusions in strategic planning, mergers and significant disruption of management time and resources, thereby adversely affecting our profitability.acquisitions or macro pricing decisions that are ultimately unfavorable.
unable to do so quickly, our operations are likely to experience a disruption, our financial results could be adversely affected, perhaps materially, and the market price of our LLC interests may decline substantially. In addition, the coordination of our internal management, acquisition activities and supervision of our businesses and investments are likely to suffer if we were unable to identify and reach an agreement with a single institution or group of executives having the expertise possessed by our Manager and its affiliates.
The operating agreement of the Company, which we refer to as the LLC agreement, contains a number of provisions that could have the effect of making it more difficult for a third-party to acquire, or discouraging a third-party from acquiring, control of the company.Company. These provisions include:
None.
A summary of property, by island, follows. For more information regarding The Gas Company’s operations, see “Our Businesses and Investments — The Gas Company — Fuel Supply, SNG Plant and Distribution System” in Part I, Item 1.
| Island | Description | Use | Own/Lease | |||||||||||
|---|---|---|---|---|---|---|---|---|---|---|---|---|---|---|
| SNG Plant | Production of SNG | Lease | ||||||||||||
| Kamakee Street Buildings and Maintenance yard | Engineering, Maintenance Facility, Warehouse | Own | ||||||||||||
| LPG Baseyard | Storage facility for tanks and cylinders | Lease | ||||||||||||
| Topa Fort Street Tower | Executive Offices | Lease | ||||||||||||
| Various Holding Tanks | Store and supply LPG to utility customers | Lease | ||||||||||||
| Maui | Office, tank storage facilities and baseyard | Island-wide operations | Lease | |||||||||||
| Kauai | Office | Island-wide operations | Own | |||||||||||
| Kauai | Tank storage facility and baseyard | Island-wide operations | Lease | |||||||||||
| Hawaii | Office, tank storage facilities and baseyard | Island-wide operations | Own | |||||||||||
| Plant Number | Ownership or Lease Information | ||||||||
|---|---|---|---|---|---|---|---|---|---|
| P-1 | The building and equipment are owned by District Energy and the business has a long-term property lease until 2043 with an option to renew for 49 years. | ||||||||
| P-2 | Property, building and equipment are owned by District Energy. | ||||||||
| P-3 | District Energy has a property lease that expires in 2033 with a right to renew for ten years. The equipment is owned by District Energy but the landlord has a purchase option over approximately one-fourth of the equipment. | ||||||||
| P-4 | District Energy has a property lease that expires in 2016 and the business may renew the lease for another 10 years for the P-4B property unilaterally, and for P-4A, with the consent of the landlord. The equipment at P-4A and P-4B is owned by District Energy. The landlord can terminate the service agreement and the P-4A property lease upon transfer of the property, on which P-4A and P-4B are located, to a third-party. | ||||||||
| P-5 | District Energy has an exclusive perpetual easement for the use of the basement where the equipment is located. The equipment is owned by District Energy. | ||||||||
| Stand-Alone | District Energy has a contractual right to use the property pursuant to a service agreement and will own the equipment until the earliest of 2025 when the equipment reverts to the customer or if the customer exercises an early purchase option. | ||||||||
There
None.
| High | Low | |||||||||
|---|---|---|---|---|---|---|---|---|---|---|
Fiscal 2009 | ||||||||||
| First Quarter | $ | 5.74 | $ | 0.79 | ||||||
| Second Quarter | 4.36 | 1.50 | ||||||||
| Third Quarter | 9.38 | 3.10 | ||||||||
| Fourth Quarter | 12.60 | 7.38 | ||||||||
Fiscal 2010 | ||||||||||
| First Quarter | $ | 14.13 | $ | 12.20 | ||||||
| Second Quarter | 16.95 | 12.79 | ||||||||
| Third Quarter | 15.50 | 12.49 | ||||||||
| Fourth Quarter | 21.17 | 15.40 | ||||||||
Fiscal 2011 | ||||||||||
| First Quarter (through February 15, 2011) | $ | 24.39 | $ | 20.56 | ||||||
| High | Low | |||||||
| Fiscal 2008 | ||||||||
| First Quarter | $ | 39.01 | $ | 29.13 | ||||
| Second Quarter | 33.24 | 25.29 | ||||||
| Third Quarter | 25.00 | 12.63 | ||||||
| Fourth Quarter | 12.90 | 2.32 | ||||||
| Fiscal 2009 | ||||||||
| First Quarter | $ | 5.74 | $ | 0.79 | ||||
| Second Quarter | 4.36 | 1.50 | ||||||
| Third Quarter | 9.38 | 3.10 | ||||||
| Fourth Quarter | 12.60 | 7.38 | ||||||
| Fiscal 2010 | ||||||||
| First Quarter (through February 18, 2010) | $ | 13.96 | $ | 12.20 | ||||
As of February 25, 2010,23, 2011, we had 45,292,91345,715,448 LLC interests issued and outstanding that we believe were held by 90105 holders of record, representing over 16,000approximately 20,000 beneficial holders.
Because our LLC interests are listed on the NYSE, our Chief Executive Officer is required to make, and on July 6, 2009 did make, an annual certification to the NYSE stating that he was not aware of any violation by the Company of the corporate governance listing standards of the NYSE. In addition, we have filed, as exhibits to this annual report on Form 10-K, the certifications of the Chief Executive Officer and Chief Financial Officer required under Section 302 of the Sarbanes-Oxley Act of 2002 to be filed with the SEC regarding the quality of our public disclosure.
Since January 1, 2008,businesses. In particular we have made or declaredstrengthened the following distributions:balance sheet of our Atlantic Aviation business by reducing its long-term debt and we have improved the financial flexibility of our bulk liquid storage by increasing the size and extending the maturity of its primary debt facility. As a result of these improvements, and taking into consideration the prospect of continued generation of excess cash by our businesses, we expect to resume payment of quarterly cash distributions to shareholders commencing with a distribution for the first quarter of 2011 to be paid during the second quarter of 2011.
| Declared | Period Covered | $ per LLC Interest | Record Date | Payable Date | ||||||||||||
| February 25, 2008 | Fourth quarter 2007 | $ | 0.635 | March 5, 2008 | March 10, 2008 | |||||||||||
| May 5, 2008 | First quarter 2008 | $ | 0.645 | June 4, 2008 | June 10, 2008 | |||||||||||
| August 4, 2008 | Second quarter 2008 | $ | 0.645 | September 4, 2008 | September 11, 2008 | |||||||||||
| November 4, 2008 | Third quarter 2008 | $ | 0.20 | December 3, 2008 | December 10, 2008 | |||||||||||
The declaration and payment of any future distribution will be subject to a decision of the Company’s Board of Directors, which includes a majority of independent directors. The Company’s Board of Directors will take into account such matters as the state of the capital markets and general business conditions, our financial condition, results of operations, capital requirements and any contractual, legal and regulatory restrictions on the payment of distributions by us to our shareholders or by our subsidiaries to us, and any other factors that the Board of Directors deems relevant. In particular, each of our businesses and investments have substantial debt commitments and restrictive covenants, which must be satisfied before any of them can pay dividends or make distributions to us. Any or all of these factors could affect both the timing and amount, if any, of future distributions. See “Management’s Discussion and Analysis of Financial Condition and Results of Operations — Liquidity and Capital Resources” in Part II, Item 7.
The table below sets forth information with respect to LLC interests authorized for issuance as of December 31, 2009:
| Macquarie Infrastructure Company LLC | |||||||||||||||||||||||
|---|---|---|---|---|---|---|---|---|---|---|---|---|---|---|---|---|---|---|---|---|---|---|---|
| Year Ended Dec 31, 2010 | Year Ended Dec 31, 2009(1) | Year Ended Dec 31, 2008(1) | Year Ended Dec 31, 2007(1) | Year Ended Dec 31, 2006(1) | |||||||||||||||||||
| ($ In Thousands, Except Per LLC Interest Data) | |||||||||||||||||||||||
Statement of operations data: | |||||||||||||||||||||||
Revenue | |||||||||||||||||||||||
| Revenue from product sales | $ | 514,344 | $ | 394,200 | $ | 586,054 | $ | 445,852 | $ | 262,432 | |||||||||||||
| Revenue from product sales – utility | 113,752 | 95,769 | 121,770 | 95,770 | 50,866 | ||||||||||||||||||
| Service revenue | 204,852 | 215,349 | 264,851 | 207,680 | 125,773 | ||||||||||||||||||
| Financing and equipment lease income | 7,843 | 4,758 | 4,686 | 4,912 | 5,118 | ||||||||||||||||||
| Total revenue | 840,791 | 710,076 | 977,361 | 754,214 | 444,189 | ||||||||||||||||||
Cost of revenue | |||||||||||||||||||||||
| Cost of product sales | 326,734 | 233,376 | 408,690 | 303,796 | 193,821 | ||||||||||||||||||
| Cost of product sales – utility | 90,542 | 73,907 | 105,329 | 66,226 | 16,127 | ||||||||||||||||||
Cost of services(2) | 53,088 | 46,317 | 63,850 | 53,387 | 37,905 | ||||||||||||||||||
Gross profit | 370,427 | 356,476 | 399,492 | 330,805 | 196,336 | ||||||||||||||||||
| Selling, general and administrative expenses | 201,787 | 209,783 | 227,288 | 181,830 | 111,006 | ||||||||||||||||||
| Fees to manager – related party | 10,051 | 4,846 | 12,568 | 65,639 | 18,631 | ||||||||||||||||||
Goodwill impairment(3) | — | 71,200 | 52,000 | — | — | ||||||||||||||||||
Depreciation(4) | 29,721 | 36,813 | 40,140 | 20,502 | 12,102 | ||||||||||||||||||
Amortization of intangibles(5) | 34,898 | 60,892 | 61,874 | 32,356 | 18,283 | ||||||||||||||||||
Loss on disposal of assets(6) | 17,869 | — | — | — | — | ||||||||||||||||||
| Total operating expenses | 294,326 | 383,534 | 393,870 | 300,327 | 160,022 | ||||||||||||||||||
Operating income (loss) | 76,101 | (27,058 | ) | 5,622 | 30,478 | 36,314 | |||||||||||||||||
| Dividend income | — | — | — | — | 8,395 | ||||||||||||||||||
| Interest income | 29 | 119 | 1,090 | 5,705 | 4,670 | ||||||||||||||||||
Interest expense(7) | (106,834 | ) | (95,456 | ) | (88,652 | ) | (65,356 | ) | (60,484 | ) | |||||||||||||
| Loss on extinguishment of debt | — | — | — | (27,512 | ) | — | |||||||||||||||||
| Equity in earnings (losses) and amortization charges of investees | 31,301 | 22,561 | 1,324 | (32 | ) | 12,558 | |||||||||||||||||
| Loss on derivative instruments | — | (25,238 | ) | (2,843 | ) | (1,362 | ) | (822 | ) | ||||||||||||||
| Gain on sale of equity investment | — | — | — | — | 3,412 | ||||||||||||||||||
| Gain on sale of investment | — | — | — | — | 49,933 | ||||||||||||||||||
| Gain on sale of marketable securities | — | — | — | — | 6,737 | ||||||||||||||||||
| Other income (expense), net | 712 | 570 | (198 | ) | (1,260 | ) | (89 | ) | |||||||||||||||
| Net income (loss) from continuing operations before income taxes | 1,309 | (124,502 | ) | (83,657 | ) | (59,339 | ) | 60,624 | |||||||||||||||
| Benefit for income taxes | 8,697 | 15,818 | 14,061 | 16,764 | 4,287 | ||||||||||||||||||
| Net income (loss) from continuing operations | $ | 10,006 | $ | (108,684 | ) | $ | (69,596 | ) | $ | (42,575 | ) | $ | 64,911 | ||||||||||
| Net income (loss) from discontinued operations, net of taxes | 81,323 | (21,860 | ) | (110,045 | ) | (9,960 | ) | (15,016 | ) | ||||||||||||||
| Net income (loss) | $ | 91,329 | $ | (130,544 | ) | $ | (179,641 | ) | $ | (52,535 | ) | $ | 49,895 | ||||||||||
| Less: net income (loss) attributable to noncontrolling interests | 659 | (1,377 | ) | (1,168 | ) | (481 | ) | (23 | ) | ||||||||||||||
| Net income (loss) attributable to MIC LLC | $ | 90,670 | $ | (129,167 | ) | $ | (178,473 | ) | $ | (52,054 | ) | $ | 49,918 | ||||||||||
| Basic income (loss) per share from continuing operations attributable to MIC LLC interest holders | $ | 0.21 | $ | (2.43 | ) | $ | (1.56 | ) | $ | (1.05 | ) | $ | 2.23 | ||||||||||
| Basic income (loss) per share from discontinued operations attributable to MIC LLC interest holders | 1.78 | (0.44 | ) | (2.41 | ) | (0.22 | ) | (0.50 | ) | ||||||||||||||
| Basic income (loss) per share attributable to MIC LLC interest holders | $ | 1.99 | $ | (2.87 | ) | $ | (3.97 | ) | $ | (1.27 | ) | $ | 1.73 | ||||||||||
| Weighted average number of shares outstanding: basic | 45,549,803 | 45,020,085 | 44,944,326 | 40,882,067 | 28,895,522 | ||||||||||||||||||
| Macquarie Infrastructure Company | ||||||||||||||||||||||
| Year Ended Dec 31, 2009 | Year Ended Dec 31, 2008(1) | Year Ended Dec 31, 2007(1) | Year Ended Dec 31, 2006(1) | Year Ended Dec 31, 2005(1) | ||||||||||||||||||
| ($ In Thousands, Except Per LLC Interest/Trust Stock Data) | ||||||||||||||||||||||
| Statement of operations data: | ||||||||||||||||||||||
| Revenue | ||||||||||||||||||||||
| Revenue from product sales | $ | 394,200 | $ | 586,054 | $ | 445,852 | $ | 262,432 | $ | 142,785 | ||||||||||||
| Revenue from product sales – utility | 95,769 | 121,770 | 95,770 | 50,866 | — | |||||||||||||||||
| Service revenue | 215,349 | 264,851 | 207,680 | 125,773 | 96,800 | |||||||||||||||||
| Financing and equipment lease income | 4,758 | 4,686 | 4,912 | 5,118 | 5,303 | |||||||||||||||||
| Total revenue | 710,076 | 977,361 | 754,214 | 444,189 | 244,888 | |||||||||||||||||
| Cost of revenue: | ||||||||||||||||||||||
| Cost of product sales | 231,139 | 406,997 | 302,283 | 192,399 | 84,480 | |||||||||||||||||
| Cost of product sales – utility | 71,252 | 103,216 | 64,371 | 14,403 | — | |||||||||||||||||
| Cost of services(2) | 46,317 | 63,850 | 53,387 | 37,905 | 37,085 | |||||||||||||||||
| Gross profit | 361,368 | 403,298 | 334,173 | 199,482 | 123,323 | |||||||||||||||||
| Selling, general and administrative expenses | 214,865 | 231,273 | 185,370 | 114,333 | 78,127 | |||||||||||||||||
| Fees to manager - related party | 4,846 | 12,568 | 65,639 | 18,631 | 9,294 | |||||||||||||||||
| Goodwill impairment(3) | 71,200 | 52,000 | — | — | — | |||||||||||||||||
| Depreciation(4) | 36,813 | 40,140 | 20,502 | 12,102 | 6,007 | |||||||||||||||||
| Amortization of intangibles(5) | 60,892 | 61,874 | 32,356 | 18,283 | 11,013 | |||||||||||||||||
| Operating (loss) income | (27,248 | ) | 5,443 | 30,306 | 36,133 | 18,882 | ||||||||||||||||
| Dividend income | — | — | — | 8,395 | 12,361 | |||||||||||||||||
| Interest income | 119 | 1,090 | 5,705 | 4,670 | 4,034 | |||||||||||||||||
| Interest expense | (91,154 | ) | (88,652 | ) | (65,356 | ) | (60,484 | ) | (23,449 | ) | ||||||||||||
| Loss on extinguishment of debt | — | — | (27,512 | ) | — | — | ||||||||||||||||
| Equity in earnings (losses) and amortization of charges of investees | 22,561 | 1,324 | (32 | ) | 12,558 | 3,685 | ||||||||||||||||
| Loss on derivative instruments | (29,540 | ) | (2,843 | ) | (1,362 | ) | (822 | ) | — | |||||||||||||
| Gain on sale of equity investment | — | — | — | 3,412 | — | |||||||||||||||||
| Gain on sale of investment | — | — | — | 49,933 | — | |||||||||||||||||
| Gain on sale of marketable securities | — | — | — | 6,737 | — | |||||||||||||||||
| Other income (expense), net | 760 | (19 | ) | (1,088 | ) | 92 | 136 | |||||||||||||||
| Net (loss) income from continuing operations before income taxes and noncontrolling interests | (124,502 | ) | (83,657 | ) | (59,339 | ) | 60,624 | 15,649 | ||||||||||||||
| Benefit for income taxes | 15,818 | 14,061 | 16,764 | 4,287 | 3,615 | |||||||||||||||||
| Net (loss) income from continuing operations before noncontrolling interests | (108,684 | ) | (69,596 | ) | (42,575 | ) | 64,911 | 19,264 | ||||||||||||||
| Noncontrolling interests | 486 | 585 | 554 | 528 | 719 | |||||||||||||||||
| Net (loss) income from continuing operations | $ | (109,170 | ) | $ | (70,181 | ) | $ | (43,129 | ) | $ | 64,383 | $ | 18,545 | |||||||||
| Discontinued operations | ||||||||||||||||||||||
| Net loss from discontinued operations before income taxes and noncontrolling interests | $ | (23,647 | ) | (180,104 | ) | $ | (9,679 | ) | $ | (27,150 | ) | $ | (3,865 | ) | ||||||||
| Benefit (provision) for income taxes | 1,787 | 70,059 | (281 | ) | 12,134 | — | ||||||||||||||||
| Macquarie Infrastructure Company LLC | |||||||||||||||||||||||
|---|---|---|---|---|---|---|---|---|---|---|---|---|---|---|---|---|---|---|---|---|---|---|---|
| Year Ended Dec 31, 2010 | Year Ended Dec 31, 2009(1) | Year Ended Dec 31, 2008(1) | Year Ended Dec 31, 2007(1) | Year Ended Dec 31, 2006(1) | |||||||||||||||||||
| ($ In Thousands, Except Per LLC Interest Data) | |||||||||||||||||||||||
| Diluted income (loss) per share from continuing operations attributable to MIC LLC interest holders | $ | 0.21 | $ | (2.43 | ) | $ | (1.56 | ) | $ | (1.05 | ) | $ | 2.23 | ||||||||||
| Diluted income (loss) per share from discontinued operations attributable to MIC LLC interest holders | 1.78 | (0.44 | ) | (2.41 | ) | (0.22 | ) | (0.50 | ) | ||||||||||||||
| Diluted income (loss) per share attributable to MIC LLC interest holders | $ | 1.99 | $ | (2.87 | ) | $ | (3.97 | ) | $ | (1.27 | ) | $ | 1.73 | ||||||||||
| Weighted average number of shares outstanding: diluted | 45,631,610 | 45,020,085 | 44,944,326 | 40,882,067 | 28,912,346 | ||||||||||||||||||
| Cash distributions declared per share | $ | — | $ | — | $ | 2.125 | $ | 2.385 | $ | 2.075 | |||||||||||||
Statement of cash flows data: | |||||||||||||||||||||||
Cash flow from continuing operations | |||||||||||||||||||||||
| Cash provided by operating activities | $ | 98,555 | $ | 82,976 | $ | 95,579 | $ | 93,499 | $ | 38,979 | |||||||||||||
| Cash used in investing activities | (24,774 | ) | (516 | ) | (56,716 | ) | (638,853 | ) | (681,994 | ) | |||||||||||||
| Cash (used in) provided by financing activities | (76,528 | ) | (117,818 | ) | 1,698 | 570,618 | 556,259 | ||||||||||||||||
| Effect of exchange rate | — | — | — | (1 | ) | (272 | ) | ||||||||||||||||
| Net (decrease) increase in cash | $ | (2,747 | ) | $ | (35,358 | ) | $ | 40,561 | $ | 25,263 | $ | (87,028 | ) | ||||||||||
Cash flow from discontinued operations | |||||||||||||||||||||||
| Cash (used in) provided by operating activities | $ | (12,703 | ) | $ | (4,732 | ) | $ | (1,904 | ) | $ | 3,051 | $ | 7,386 | ||||||||||
| Cash provided by (used in) investing activities | 134,356 | (445 | ) | (26,684 | ) | (5,157 | ) | (4,202 | ) | ||||||||||||||
| Cash (used in) provided by financing activities | (124,183 | ) | 2,144 | (1,215 | ) | (3,072 | ) | 6,069 | |||||||||||||||
Cash (used in) provided by discontinued operations(8) | $ | (2,530 | ) | $ | (3,033 | ) | $ | (29,803 | ) | $ | (5,178 | ) | $ | 9,253 | |||||||||
Change in cash of discontinued operations held for sale(8) | $ | 2,385 | $ | (208 | ) | $ | 2,459 | $ | 5,902 | $ | (2,740 | ) | |||||||||||
| Macquarie Infrastructure Company | ||||||||||||||||||||||
| Year Ended Dec 31, 2009 | Year Ended Dec 31, 2008(1) | Year Ended Dec 31, 2007(1) | Year Ended Dec 31, 2006(1) | Year Ended Dec 31, 2005(1) | ||||||||||||||||||
| ($ In Thousands, Except Per LLC Interest/Trust Stock Data) | ||||||||||||||||||||||
| Net loss from discontinued operations before noncontrolling interests | (21,860 | ) | (110,045 | ) | (9,960 | ) | (15,016 | ) | (3,865 | ) | ||||||||||||
| Noncontrolling interests | (1,863 | ) | (1,753 | ) | (1,035 | ) | (551 | ) | (516 | ) | ||||||||||||
| Net loss from discontinued operations | $ | (19,997 | ) | $ | (108,292 | ) | $ | (8,925 | ) | $ | (14,465 | ) | $ | (3,349 | ) | |||||||
| Net loss | $ | (129,167 | ) | $ | (178,473 | ) | $ | (52,054 | ) | $ | 49,918 | $ | 15,196 | |||||||||
| Basic and diluted (loss) earnings per LLC interest/trust stock from continuing operations | $ | (2.43 | ) | $ | (1.56 | ) | $ | (1.05 | ) | $ | 2.23 | $ | 0.69 | |||||||||
| Basic and diluted loss per LLC interest/trust stock from discontinued operations | (0.44 | ) | (2.41 | ) | (0.22 | ) | (0.50 | ) | (0.13 | ) | ||||||||||||
| Weighted average number of shares outstanding: basic | 45,020,085 | 44,944,326 | 40,882,067 | 28,895,522 | 26,919,608 | |||||||||||||||||
| Weighted average number of shares outstanding: diluted | 45,020,085 | 44,944,326 | 40,882,067 | 28,912,346 | 26,929,219 | |||||||||||||||||
| Cash dividends declared per LLC interest/trust stock | $ | — | $ | 2.125 | $ | 2.385 | $ | 2.0750 | $ | 1.5877 | ||||||||||||
| Statement of cash flows data: | ||||||||||||||||||||||
| Cash flow from continuing operations | ||||||||||||||||||||||
| Cash provided by operating activities | $ | 82,976 | $ | 95,579 | $ | 93,499 | $ | 38,979 | $ | 39,033 | ||||||||||||
| Cash used in investing activities | (516 | ) | (56,716 | ) | (638,853 | ) | (681,994 | ) | (126,262 | ) | ||||||||||||
| Cash (used in) provided by financing activities | (117,818 | ) | 1,698 | 570,618 | 556,259 | 77,945 | ||||||||||||||||
| Effect of exchange rate | — | — | (1 | ) | (272 | ) | (331 | ) | ||||||||||||||
| Net (decrease) increase in cash | $ | (35,358 | ) | $ | 40,561 | $ | 25,263 | $ | (87,028 | ) | $ | (9,615 | ) | |||||||||
| Cash flow from discontinuing operations | ||||||||||||||||||||||
| Cash (used in) provided by operating activities | $ | (4,732 | ) | $ | (1,904 | ) | $ | 3,051 | $ | 7,386 | $ | 4,514 | ||||||||||
| Cash used in investing activities | (445 | ) | (26,684 | ) | (5,157 | ) | (4,202 | ) | (75,688 | ) | ||||||||||||
| Cash provided by (used in) financing activities | 2,144 | (1,215 | ) | (3,072 | ) | 6,069 | 55,902 | |||||||||||||||
| Net (decrease) increase in cash(6) | (3,033 | ) | (29,803 | ) | (5,178 | ) | 9,253 | (15,272 | ) | |||||||||||||
| Change in cash of discontinued operations held for sale(6) | $ | (208 | ) | $ | 2,459 | $ | 5,902 | $ | (2,740 | ) | $ | (5,931 | ) | |||||||||
| (1) | Reclassified to conform to current period presentation. |
| (2) | Includes depreciation expense of $6.6 million, $6.1 million, $5.8 million, $5.8 |
| (3) | Reflects non-cash impairment charge of $71.2 million and $52.0 million recorded during the first six months of 2009 and the fourth quarter of 2008, respectively, at Atlantic Aviation. |
| (4) | Includes a non-cash impairment charge of $7.5 million and $13.8 million recorded during the first six months of 2009 and the fourth quarter of 2008, respectively, at Atlantic Aviation. |
| (5) | Includes a non-cash impairment charge of $23.3 million and $21.7 million for contractual arrangements recorded |
| (6) | Loss on disposal includes write-offs of intangible assets of $10.4 million, property, equipment, land and leasehold improvements of $5.6 million and goodwill of $1.9 million at Atlantic Aviation. |
| (7) | Interest expense includes non-cash losses on derivative instruments of $23.4 million and $4.3 million for the years ended December 31, 2010 and 2009, respectively. |
| (8) | Cash of discontinued operations held for sale is reported in assets of discontinued operations held for sale in our consolidated balance sheets. The net |
| Macquarie Infrastructure Company LLC | |||||||||||||||||||||||
|---|---|---|---|---|---|---|---|---|---|---|---|---|---|---|---|---|---|---|---|---|---|---|---|
| Year Ended Dec 31, 2010 | Year Ended Dec 31, 2009 | Year Ended Dec 31, 2008 | Year Ended Dec 31, 2007 | Year Ended Dec 31, 2006 | |||||||||||||||||||
| ($ In Thousands) | |||||||||||||||||||||||
Balance sheet data: | |||||||||||||||||||||||
| Assets of discontinued operations held for sale | $ | — | $ | 86,695 | $ | 105,725 | $ | 258,899 | $ | 268,327 | |||||||||||||
| Total current assets from continuing operations | 125,427 | 129,866 | 193,890 | 201,604 | 216,620 | ||||||||||||||||||
Property, equipment, land and leasehold improvements, net(1) | 563,451 | 580,087 | 592,435 | 577,498 | 425,045 | ||||||||||||||||||
Intangible assets, net(2) | 705,862 | 751,081 | 811,973 | 846,941 | 513,466 | ||||||||||||||||||
Goodwill(3) | 514,253 | 516,182 | 586,249 | 636,336 | 352,213 | ||||||||||||||||||
| Total assets | $ | 2,196,742 | $ | 2,339,221 | $ | 2,552,436 | $ | 2,813,029 | $ | 2,097,531 | |||||||||||||
| Liabilities of discontinued operations held for sale | $ | — | $ | 220,549 | $ | 224,888 | $ | 225,042 | $ | 220,452 | |||||||||||||
| Total current liabilities from continuing operations | 171,286 | 174,647 | 135,311 | 121,892 | 62,981 | ||||||||||||||||||
| Deferred income taxes | 156,328 | 107,840 | 83,228 | 202,683 | 163,923 | ||||||||||||||||||
| Long-term debt, net of current portion | 1,089,559 | 1,166,379 | 1,327,800 | 1,225,150 | 758,400 | ||||||||||||||||||
| Total liabilities | 1,510,047 | 1,764,453 | 1,918,175 | 1,841,159 | 1,227,946 | ||||||||||||||||||
| Members’ equity | $ | 691,149 | $ | 578,526 | $ | 628,838 | $ | 966,552 | $ | 864,425 | |||||||||||||
| Macquarie Infrastructure Company | ||||||||||||||||||||||
| Year Ended Dec 31, 2009 | Year Ended Dec 31, 2008(1) | Year Ended Dec 31, 2007(1) | Year Ended Dec 31, 2006(1) | Year Ended Dec 31, 2005(1) | ||||||||||||||||||
| ($ In Thousands) | ||||||||||||||||||||||
| Balance sheet data: | ||||||||||||||||||||||
| Assets of discontinued operations held for sale | $ | 86,695 | $ | 105,725 | $ | 258,899 | $ | 268,327 | $ | 288,846 | ||||||||||||
| Total current assets from continuing operations | 129,866 | 193,890 | 201,604 | 216,620 | 144,856 | |||||||||||||||||
| Property, equipment, land and leasehold improvements, net(2) | 580,087 | 592,435 | 577,498 | 425,045 | 240,260 | |||||||||||||||||
| Intangible assets, net(3) | 751,081 | 811,973 | 846,941 | 513,466 | 260,849 | |||||||||||||||||
| Goodwill(4) | 516,182 | 586,249 | 636,336 | 352,213 | 148,122 | |||||||||||||||||
| Total assets | 2,339,221 | 2,552,436 | 2,813,029 | 2,097,531 | 1,363,300 | |||||||||||||||||
| Liabilities of discontinued operations held for sale | $ | 220,549 | $ | 224,888 | $ | 225,042 | $ | 220,452 | $ | 207,321 | ||||||||||||
| Total current liabilities from continuing operations | 174,647 | 135,311 | 121,892 | 62,981 | 26,322 | |||||||||||||||||
| Deferred income taxes | 107,840 | 83,228 | 202,683 | 163,923 | 113,794 | |||||||||||||||||
| Long-term debt, including related party, net of current portion | 1,166,379 | 1,327,800 | 1,225,150 | 758,400 | 438,247 | |||||||||||||||||
| Total liabilities | 1,764,453 | 1,918,175 | 1,841,159 | 1,227,946 | 790,632 | |||||||||||||||||
| Members' equity | $ | 578,526 | $ | 628,838 | $ | 966,552 | $ | 864,425 | $ | 567,665 | ||||||||||||
| (1) |
| Includes a non-cash impairment charge of $7.5 million and $13.8 million recorded during the first six months of 2009 and the fourth quarter of 2008, respectively, at Atlantic Aviation. |
| (2) | Includes a non-cash impairment charge of $23.3 million and $21.7 million for contractual arrangements recorded |
| (3) | Reflects non-cash impairment charge of $71.2 million and $52.0 million recorded during the first six months of 2009 and the fourth quarter of 2008, respectively, at Atlantic Aviation. |
On January 28, 2010, we agreed to sell the assets of PCAA through a bankruptcy process, which we expect to complete in the first half of 2010. This business is now a discontinued operation and is therefore separately reported in our consolidated financial statements and is no longer a reportable segment.
The uncertainty and instability in the credit markets appears to be subsiding. This is evident in the increase in the volume of lending activity and the price at which such lending is occurring compared with levels during the height of the global financial crisis.
Despite the improvement in the credit markets, we expect towill continue to strengthen our consolidated balance sheet and thoseapply excess cash flow generated by Atlantic Aviation to the reduction of our operating entities through prudent reduction inthat business’ term loan principal, consistent with the amount of long-termamendments to the debt outstanding, further increasing the likelihoodfacility that we will be ableagreed to in
As part2010, the business recorded a non-cash loss on disposal of the bankruptcy filing, we have no obligation to and have no intention of committing additional capital to this business and our ongoing liabilities are expected to be no more than $5.3 million in guarantees of a single parking facility lease. Creditorsits assets totaling $4.4 million. This sale is pending as of this business do not have recourse to any assets of our holding company or any assets of our other businesses, other than approximately $5.3 millionreport date.
On December 23, 2009 we sold 49.99% ofand no amounts were outstanding under the non-controlling interest of District Energy to John Hancock Life Insurance Company and John Hancock Life Insurance Company (U.S.A.) (collectively “John Hancock”) for $29.5 million. The proceeds of the sale, along with other cash resources, were used to fully repay the $66.4 million balance on our holding company revolving credit facility as described below.
At Marchof December 31, 2009 we reclassifiedor at the outstanding balance drawn on the revolving credit facility at our non-operating holding company from long-term debt to current portion of long-term debt on our consolidated balance sheet due to its scheduledfacility’s maturity on March 31, 2010. During the year, we were in discussions with our lenders to convert theThis facility to a term loan and extend the maturity date of the $66.4 million outstanding balance.was not renewed or replaced. We have no holding company debt.
By December 2009, we had received unanimous approval from the lenders to extend the term of the facility. However, using the net cash proceeds we received from the sale of the 49.99% non-controlling interest in District Energy, and cash on hand, we paid off the outstanding principal balance on December 28, 2009 and avoided the substantial costs that would have been incurred had the terms of the facility been amended. Shortly thereafter we elected to reduce the amount available on the revolving credit facility from $97.0 million to $20.0 million through to the maturity of the facility at March 31, 2010.
in the markets serviced by IMTT’s major facilities. This condition, when combined with the attributes of IMTT’s facilities such as deep water drafts and access to land based infrastructure, have allowed IMTT to increase prices while maintaining very high storage capacity utilization rates.
Two key factors will likely have
The shareholders’ agreement between us, IMTT Holdings and its other shareholders specifies a default distribution policy for IMTT. Although the default under the shareholders’ agreement is to distribute excess cash, shareholders have indicated that they are prepared to reinvest excess cash generated during 2010 in new growth opportunities rather than pay distributions.
Thermal Chicago’s principal direct expense is electricity. Other direct expenses are water, labor, operations and maintenance and depreciation and accretion. Electricity usage, and to a lesser extent water usage, fluctuates in line with the volume of chilled water produced. Thermal Chicago focuses on minimizing the cost of electricity consumed per unit of chilled water produced by operating its plants to maximize efficient use of electricity. Other direct expenses are largely fixed regardless of the volumes of chilled water produced.
| Year Ended December 31, | Change (From 2009 to 2010) Favorable/(Unfavorable) | Change (From 2008 to 2009) Favorable/(Unfavorable) | |||||||||||||||||||||||||||||
|---|---|---|---|---|---|---|---|---|---|---|---|---|---|---|---|---|---|---|---|---|---|---|---|---|---|---|---|---|---|---|---|
| 2010 | 2009(1) | 2008(1) | $ | % | $ | % | |||||||||||||||||||||||||
| ($ In Thousands) (Unaudited) | |||||||||||||||||||||||||||||||
Revenue | |||||||||||||||||||||||||||||||
| Revenue from product sales | $ | 514,344 | $ | 394,200 | $ | 586,054 | 120,144 | 30.5 | (191,854 | ) | (32.7 | ) | |||||||||||||||||||
| Revenue from product sales – utility | 113,752 | 95,769 | 121,770 | 17,983 | 18.8 | (26,001 | ) | (21.4 | ) | ||||||||||||||||||||||
| Service revenue | 204,852 | 215,349 | 264,851 | (10,497 | ) | (4.9 | ) | (49,502 | ) | (18.7 | ) | ||||||||||||||||||||
| Financing and equipment lease income | 7,843 | 4,758 | 4,686 | 3,085 | 64.8 | 72 | 1.5 | ||||||||||||||||||||||||
| Total revenue | 840,791 | 710,076 | 977,361 | 130,715 | 18.4 | (267,285 | ) | (27.3 | ) | ||||||||||||||||||||||
Costs and expenses | |||||||||||||||||||||||||||||||
| Cost of product sales | 326,734 | 233,376 | 408,690 | (93,358 | ) | (40.0 | ) | 175,314 | 42.9 | ||||||||||||||||||||||
| Cost of product sales — utility | 90,542 | 73,907 | 105,329 | (16,635 | ) | (22.5 | ) | 31,422 | 29.8 | ||||||||||||||||||||||
| Cost of services | 53,088 | 46,317 | 63,850 | (6,771 | ) | (14.6 | ) | 17,533 | 27.5 | ||||||||||||||||||||||
Gross profit | 370,427 | 356,476 | 399,492 | 13,951 | 3.9 | (43,016 | ) | (10.8 | ) | ||||||||||||||||||||||
| Selling, general and administrative | 201,787 | 209,783 | 227,288 | 7,996 | 3.8 | 17,505 | 7.7 | ||||||||||||||||||||||||
| Fees to manager — related party | 10,051 | 4,846 | 12,568 | (5,205 | ) | (107.4 | ) | 7,722 | 61.4 | ||||||||||||||||||||||
| Goodwill impairment | — | 71,200 | 52,000 | 71,200 | NM | (19,200 | ) | (36.9 | ) | ||||||||||||||||||||||
| Depreciation | 29,721 | 36,813 | 40,140 | 7,092 | 19.3 | 3,327 | 8.3 | ||||||||||||||||||||||||
| Amortization of intangibles | 34,898 | 60,892 | 61,874 | 25,994 | 42.7 | 982 | 1.6 | ||||||||||||||||||||||||
| Loss on disposal of assets | 17,869 | — | — | (17,869 | ) | NM | — | — | |||||||||||||||||||||||
| Total operating expenses | 294,326 | 383,534 | 393,870 | 89,208 | 23.3 | 10,336 | 2.6 | ||||||||||||||||||||||||
Operating income (loss) | 76,101 | (27,058 | ) | 5,622 | 103,159 | NM | (32,680 | ) | NM | ||||||||||||||||||||||
Other income (expense) | |||||||||||||||||||||||||||||||
| Interest income | 29 | 119 | 1,090 | (90 | ) | (75.6 | ) | (971 | ) | (89.1 | ) | ||||||||||||||||||||
Interest expense(2) | (106,834 | ) | (95,456 | ) | (88,652 | ) | (11,378 | ) | (11.9 | ) | (6,804 | ) | (7.7 | ) | |||||||||||||||||
| Equity in earnings and amortization charges of investees | 31,301 | 22,561 | 1,324 | 8,740 | 38.7 | 21,237 | NM | ||||||||||||||||||||||||
| Loss on derivative instruments | — | (25,238 | ) | (2,843 | ) | 25,238 | NM | (22,395 | ) | NM | |||||||||||||||||||||
| Other income (expense), net | 712 | 570 | (198 | ) | 142 | 24.9 | 768 | NM | |||||||||||||||||||||||
| Net income (loss) from continuing operations before income taxes | 1,309 | (124,502 | ) | (83,657 | ) | 125,811 | 101.1 | (40,845 | ) | (48.8 | ) | ||||||||||||||||||||
| Benefit for income taxes | 8,697 | 15,818 | 14,061 | (7,121 | ) | (45.0 | ) | 1,757 | 12.5 | ||||||||||||||||||||||
| Net income (loss) from continuing operations | $ | 10,006 | $ | (108,684 | ) | $ | (69,596 | ) | 118,690 | 109.2 | (39,088 | ) | (56.2 | ) | |||||||||||||||||
| Net income (loss) from discontinued operations, net of taxes | 81,323 | (21,860 | ) | (110,045 | ) | 103,183 | NM | 88,185 | 80.1 | ||||||||||||||||||||||
| Net income (loss) | $ | 91,329 | $ | (130,544 | ) | $ | (179,641 | ) | 221,873 | 170.0 | 49,097 | 27.3 | |||||||||||||||||||
| Less: net income (loss) attributable to noncontrolling interests | 659 | (1,377 | ) | (1,168 | ) | (2,036 | ) | (147.9 | ) | 209 | 17.9 | ||||||||||||||||||||
| Net income (loss) attributable to MIC LLC | $ | 90,670 | $ | (129,167 | ) | $ | (178,473 | ) | 219,837 | 170.2 | 49,306 | 27.6 | |||||||||||||||||||
| Year Ended December 31 | Change (From 2008 to 2009) Favorable/(Unfavorable) | Change (From 2007 to 2008) Favorable/(Unfavorable) | ||||||||||||||||||||||||||
| 2009 | 2008(1) | 2007(1) | $ | % | $ | % | ||||||||||||||||||||||
| ($ In Thousands) | ||||||||||||||||||||||||||||
| Revenue | ||||||||||||||||||||||||||||
| Revenue from product sales | $ | 394,200 | $ | 586,054 | $ | 445,852 | (191,854 | ) | (32.7 | ) | 140,202 | 31.4 | ||||||||||||||||
| Revenue from product sales — utility | 95,769 | 121,770 | 95,770 | (26,001 | ) | (21.4 | ) | 26,000 | 27.1 | |||||||||||||||||||
| Service revenue | 215,349 | 264,851 | 207,680 | (49,502 | ) | (18.7 | ) | 57,171 | 27.5 | |||||||||||||||||||
| Financing and equipment lease income | 4,758 | 4,686 | 4,912 | 72 | 1.5 | (226 | ) | (4.6 | ) | |||||||||||||||||||
| Total revenue | 710,076 | 977,361 | 754,214 | (267,285 | ) | (27.3 | ) | 223,147 | 29.6 | |||||||||||||||||||
| Costs and expenses | ||||||||||||||||||||||||||||
| Cost of product sales | 231,139 | 406,997 | 302,283 | 175,858 | 43.2 | (104,714 | ) | (34.6 | ) | |||||||||||||||||||
| Cost of product sales – utility | 71,252 | 103,216 | 64,371 | 31,964 | 31.0 | (38,845 | ) | (60.3 | ) | |||||||||||||||||||
| Cost of services | 46,317 | 63,850 | 53,387 | 17,533 | 27.5 | (10,463 | ) | (19.6 | ) | |||||||||||||||||||
| Gross profit | 361,368 | 403,298 | 334,173 | (41,930 | ) | (10.4 | ) | 69,125 | 20.7 | |||||||||||||||||||
| Selling, general and administrative | 214,865 | 231,273 | 185,370 | 16,408 | 7.1 | (45,903 | ) | (24.8 | ) | |||||||||||||||||||
| Fees to manager – related party | 4,846 | 12,568 | 65,639 | 7,722 | 61.4 | 53,071 | 80.9 | |||||||||||||||||||||
| Goodwill impairment | 71,200 | 52,000 | — | (19,200 | ) | (36.9 | ) | (52,000 | ) | NM | ||||||||||||||||||
| Depreciation | 36,813 | 40,140 | 20,502 | 3,327 | 8.3 | (19,638 | ) | (95.8 | ) | |||||||||||||||||||
| Amortization of intangibles | 60,892 | 61,874 | 32,356 | 982 | 1.6 | (29,518 | ) | (91.2 | ) | |||||||||||||||||||
| Total operating expenses | 388,616 | 397,855 | 303,867 | 9,239 | 2.3 | (93,988 | ) | (30.9 | ) | |||||||||||||||||||
| Operating (loss) income | (27,248 | ) | 5,443 | 30,306 | (32,691 | ) | NM | (24,863 | ) | (82.0 | ) | |||||||||||||||||
| Other income (expense) | ||||||||||||||||||||||||||||
| Interest income | 119 | 1,090 | 5,705 | (971 | ) | (89.1 | ) | (4,615 | ) | (80.9 | ) | |||||||||||||||||
| Interest expense | (91,154 | ) | (88,652 | ) | (65,356 | ) | (2,502 | ) | (2.8 | ) | (23,296 | ) | (35.6 | ) | ||||||||||||||
| Loss on extinguishment of debt | — | — | (27,512 | ) | — | NM | 27,512 | NM | ||||||||||||||||||||
| Equity in earnings (losses) and amortization charges of investees | 22,561 | 1,324 | (32 | ) | 21,237 | NM | 1,356 | NM | ||||||||||||||||||||
| Loss on derivative instruments | (29,540 | ) | (2,843 | ) | (1,362 | ) | (26,697 | ) | NM | (1,481 | ) | (108.7 | ) | |||||||||||||||
| Other income (expense), net | 760 | (19 | ) | (1,088 | ) | 779 | NM | 1,069 | 98.3 | |||||||||||||||||||
| Net loss from continuing operations before noncontrolling interests | (124,502 | ) | (83,657 | ) | (59,339 | ) | (40,845 | ) | (48.8 | ) | (24,318 | ) | (41.0 | ) | ||||||||||||||
| Benefit for income taxes | 15,818 | 14,061 | 16,764 | 1,757 | 12.5 | (2,703 | ) | (16.1 | ) | |||||||||||||||||||
| Net loss from continuing operations before noncontrolling interests | (108,684 | ) | (69,596 | ) | (42,575 | ) | (39,088 | ) | (56.2 | ) | (27,021 | ) | (63.5 | ) | ||||||||||||||
| Net income attributable to noncontrolling interests | 486 | 585 | 554 | 99 | 16.9 | (31 | ) | (5.6 | ) | |||||||||||||||||||
| Net loss from continuing operations | $ | (109,170 | ) | $ | (70,181 | ) | $ | (43,129 | ) | (38,989 | ) | (55.6 | ) | (27,052 | ) | (62.7 | ) | |||||||||||
| Discontinued operations | ||||||||||||||||||||||||||||
| Net loss from discontinued operations before income taxes and noncontrolling interests | (23,647 | ) | (180,104 | ) | (9,679 | ) | 156,457 | 86.9 | (170,425 | ) | NM | |||||||||||||||||
| Benefit (provision) for income taxes | 1,787 | 70,059 | (281 | ) | (68,272 | ) | (97.4 | ) | 70,340 | NM | ||||||||||||||||||
| Net loss from discontinued operations before noncontrolling interests | (21,860 | ) | (110,045 | ) | (9,960 | ) | 88,185 | 80.1 | (100,085 | ) | NM | |||||||||||||||||
| Net loss attributable to noncontrolling interests | (1,863 | ) | (1,753 | ) | (1,035 | ) | 110 | 6.3 | 718 | 69.3 | ||||||||||||||||||
| Net loss from discontinued operations | $ | (19,997 | ) | $ | (108,292 | ) | $ | (8,925 | ) | 88,295 | 81.5 | (99,367 | ) | NM | ||||||||||||||
| Net loss | $ | (129,167 | ) | $ | (178,473 | ) | $ | (52,054 | ) | 49,306 | 27.6 | (126,419 | ) | NM | ||||||||||||||
| (1) | Reclassified to conform to current period presentation. |
| (2) | Interest expense includes non-cash losses on derivative instruments of $23.4 million and $4.3 million for the years ended December 31, 2010 and 2009, respectively. |
The fees payable to our Manager in 2008 were lower primarily due to performance fees of $44.0 million in 2007 that did not recur in 2008. Our Manager elected to reinvest these performance fees in additional LLC interests. Base fees paid to our Manager in 2008 also decreased due to our lower market capitalization.
Goodwill is considered impaired when the carrying amount of a reporting unit’s goodwill exceeds its implied fair value. Based on the testing performed, we recognized goodwill impairment charges at Atlantic Aviation in
Interest expenseterm loan debt at Atlantic Aviation and the repayment in the full amount of the outstanding balance of $66.4 million of MIC holding company debt during December 2009.
We recognized a loss on extinguishment of debt of $27.5 million in 2007, related to refinancings at Atlantic Aviation and District Energy. This loss included a $14.7 million make-whole payment for District Energy. The remainder was a non-cash write-off of previously deferred financing costs.
We discontinued hedge accounting at Atlantic Aviation as of February 25, 2009 and April 1, 2009 for our other businesses. In addition, in the first quarter of 2009, The Gas Company, District Energy and Atlantic Aviation each entered into LIBOR-based basis swaps. These basis swaps have lowered the effective cash interest rate on these businesses’ debt through March 2010.
For the year ended December 31, 2009, loss on derivative instruments represents the change in fair value of interest rate swaps from the dates that hedge accounting was discontinued. In addition, loss on derivative instruments includes the reclassification of amounts from accumulated other comprehensive loss into earnings, as Atlantic Aviation pays down its debt more quickly than anticipated.
We
Due to our NOL carryforwards, we do not expect to have regular taxable income or pay regular federal income tax payments through at least 2012. The cash state and local taxes paid by our businesses is discussed below in the sections entitledIncome Taxes for each of our individual businesses.
Further, approximately $53.4
On January 28, 2010, we agreed to sell the assets of PCAA through a bankruptcy process, which we expect to complete in the first half of 2010. Thisdebt. The results of operations from this business have beenand the gain from the bankruptcy sale are separately reported as a discontinued operationoperations in our consolidated financial statements and prior comparable periods have been re-statedrestated to conform to the current period presentation. See Note 4, “Discontinued Operations”, in our consolidated financial statements in “Financial Statements and Supplementary Data” in Part II, Item 8, of this Form 10-K for financial information and further discussions.
Corporate allocation and other intercompany fees charged to PCAA have been reported in earnings from discontinued operations in our consolidated continuing results of operations.
Effective this reporting period, we are
We define Free Cash Flow as cash from operating activities, less maintenance capital expenditures and changes in working capital. Working capital movements are excluded on the basis that these are largely timing differences in payables and receivables, and are therefore not reflective of our ability to generate cash.
A reconciliation of net lossincome (loss) attributable to MIC LLC from continuing operations to free cash flow from continuing operations, on a consolidated basis, is provided below:
| Year Ended December 31, | Change (From 2009 to 2010) Favorable/(Unfavorable) | Change (From 2008 to 2009) Favorable/(Unfavorable) | |||||||||||||||||||||||||||||
|---|---|---|---|---|---|---|---|---|---|---|---|---|---|---|---|---|---|---|---|---|---|---|---|---|---|---|---|---|---|---|---|
| 2010 | 2009(1) | 2008(1) | $ | % | $ | % | |||||||||||||||||||||||||
| ($ in Thousands) (Unaudited) | |||||||||||||||||||||||||||||||
Net income (loss) attributable to MIC LLC from continuing operations(2) | $ | 9,483 | $ | (109,170 | ) | $ | (70,181 | ) | |||||||||||||||||||||||
Interest expense, net(3) | 106,805 | 95,337 | 87,562 | ||||||||||||||||||||||||||||
| Benefit for income taxes | (8,697 | ) | (15,818 | ) | (14,061 | ) | |||||||||||||||||||||||||
Depreciation(4) | 29,721 | 36,813 | 40,140 | ||||||||||||||||||||||||||||
Depreciation – cost of services(4) | 6,555 | 6,086 | 5,813 | ||||||||||||||||||||||||||||
Amortization of intangibles(5) | 34,898 | 60,892 | 61,874 | ||||||||||||||||||||||||||||
| Goodwill impairment | — | 71,200 | 52,000 | ||||||||||||||||||||||||||||
| Loss on disposal of assets | 17,869 | — | — | ||||||||||||||||||||||||||||
| Loss on derivative instruments | — | 25,238 | 2,843 | ||||||||||||||||||||||||||||
Equity in earnings and amortization charges of investees(6) | (16,301 | ) | (15,561 | ) | — | ||||||||||||||||||||||||||
| Base management fees settled in LLC interests | 5,403 | 4,384 | — | ||||||||||||||||||||||||||||
| Other non-cash expense, net | 2,753 | 2,784 | 4,883 | ||||||||||||||||||||||||||||
| EBITDA excluding non-cash items from continuing operations | $ | 188,489 | $ | 162,185 | $ | 170,873 | 26,304 | 16.2 | (8,688 | ) | (5.1 | ) | |||||||||||||||||||
| EBITDA excluding non-cash items from continuing operations | $ | 188,489 | $ | 162,185 | $ | 170,873 | |||||||||||||||||||||||||
Interest expense, net(3) | (106,805 | ) | (95,337 | ) | (87,562 | ) | |||||||||||||||||||||||||
Interest rate swap breakage fee(3) | (5,528 | ) | (8,776 | ) | — | ||||||||||||||||||||||||||
Non-cash derivative losses recorded in interest expense(3) | 28,938 | 13,078 | — | ||||||||||||||||||||||||||||
Amortization of debt financing costs(3) | 4,347 | 5,121 | 4,762 | ||||||||||||||||||||||||||||
| Equipment lease receivables, net | 2,761 | 2,752 | 2,460 | ||||||||||||||||||||||||||||
| Provision for income taxes, net of changes in deferred taxes | (3,032 | ) | (2,105 | ) | (1,976 | ) | |||||||||||||||||||||||||
| Changes in working capital | (10,615 | ) | 6,058 | 7,022 | |||||||||||||||||||||||||||
| Cash provided by operating activities | 98,555 | 82,976 | 95,579 | ||||||||||||||||||||||||||||
| Changes in working capital | 10,615 | (6,058 | ) | (7,022 | ) | ||||||||||||||||||||||||||
| Maintenance capital expenditures | (14,509 | ) | (9,453 | ) | (14,846 | ) | |||||||||||||||||||||||||
| Free cash flow from continuing operations | $ | 94,661 | $ | 67,465 | $ | 73,711 | 27,196 | 40.3 | (6,246 | ) | (8.5 | ) | |||||||||||||||||||
| Year Ended December 31, | Change (From 2008 to 2009) Favorable/(Unfavorable) | Change (From 2007 to 2008) Favorable/(Unfavorable) | ||||||||||||||||||||||||||
| 2009 | 2008 | 2007 | $ | % | $ | % | ||||||||||||||||||||||
| ($ In Thousands) (Unaudited) | ||||||||||||||||||||||||||||
| Net loss from continuing operations | $ | (109,170 | ) | $ | (70,181 | ) | $ | (43,129 | ) | |||||||||||||||||||
| Interest expense, net | 91,035 | 87,562 | 59,651 | |||||||||||||||||||||||||
| Benefit for income taxes | (15,818 | ) | (14,061 | ) | (16,764 | ) | ||||||||||||||||||||||
| Depreciation (1) | 36,813 | 40,140 | 20,502 | |||||||||||||||||||||||||
| Depreciation - cost of services (1) | 6,086 | 5,813 | 5,792 | |||||||||||||||||||||||||
| Amortization of intangibles (2) | 60,892 | 61,874 | 32,356 | |||||||||||||||||||||||||
| Goodwill impairment | 71,200 | 52,000 | — | |||||||||||||||||||||||||
| Non-cash loss on extinguishment of debt | — | — | 12,817 | |||||||||||||||||||||||||
| Loss on derivative instruments | 29,540 | 2,843 | 1,362 | |||||||||||||||||||||||||
| Equity in (earnings) losses and amortization charges of investees(3) | (15,561 | ) | — | 32 | ||||||||||||||||||||||||
| Base management and performance fees settled/to be settled in LLC interests | 4,384 | — | 43,962 | |||||||||||||||||||||||||
| Other non-cash expense | 2,784 | 4,883 | 7,858 | |||||||||||||||||||||||||
| EBITDA excluding non-cash items from continuing operations | $ | 162,185 | $ | 170,873 | $ | 124,439 | (8,688 | ) | (5.1 | ) | 46,434 | 37.3 | ||||||||||||||||
| EBITDA excluding non-cash items from continuing operations | $ | 162,185 | $ | 170,873 | $ | 124,439 | ||||||||||||||||||||||
| Interest expense, net | (91,035 | ) | (87,562 | ) | (59,651 | ) | ||||||||||||||||||||||
| Amounts relating to foreign currency contracts | — | — | (4,055 | ) | ||||||||||||||||||||||||
| Amortization of debt financing costs | 5,121 | 4,762 | 4,429 | |||||||||||||||||||||||||
| Make-whole payment on debt financing | — | — | 14,695 | |||||||||||||||||||||||||
| Equipment lease receivables, net | 2,610 | 2,372 | 2,531 | |||||||||||||||||||||||||
| Benefit for income taxes, net of changes in deferred taxes | (2,105 | ) | (1,976 | ) | (5,772 | ) | ||||||||||||||||||||||
| Changes in working capital | 6,200 | 7,110 | 16,883 | |||||||||||||||||||||||||
| Cash provided by operating activities from continuing operations | 82,976 | 95,579 | 93,499 | |||||||||||||||||||||||||
| Changes in working capital | (6,200 | ) | (7,110 | ) | (16,883 | ) | ||||||||||||||||||||||
| Maintenance capital expenditures | (9,453 | ) | (14,846 | ) | (14,834 | ) | ||||||||||||||||||||||
| Free cash flow from continuing operations | $ | 67,323 | $ | 73,623 | $ | 61,782 | (6,300 | ) | (8.6 | ) | 11,841 | 19.2 | ||||||||||||||||
| (1) | Reclassified to conform to current period presentation. |
| (2) | Net income (loss) attributable to MIC LLC from continuing operations excludes net income attributable to noncontrolling interests of $523,000, $486,000 and $585,000 for the years ended December 31, 2010, 2009 and 2008, respectively. |
| (3) | Interest expense, net, includes non-cash losses on derivative instruments, non-cash amortization of deferred financing fees and interest rate swap breakage fees. |
| (4) | Depreciation |
| (5) | Amortization of intangibles does not include acquisition-related step-up amortization expense of $1.1 million for each year related to intangible assets in connection with our investment in IMTT, which is reported in equity in earnings |
| (6) | Equity in |
| Year Ended December 31, | |||||||||||||||||||||||||||||||||||
|---|---|---|---|---|---|---|---|---|---|---|---|---|---|---|---|---|---|---|---|---|---|---|---|---|---|---|---|---|---|---|---|---|---|---|---|
| 2010 | 2009(1) | Change Favorable/(Unfavorable) | 2009(1) | 2008 | Change Favorable/(Unfavorable) | ||||||||||||||||||||||||||||||
| $ | $ | $ | % | $ | $ | $ | % | ||||||||||||||||||||||||||||
| ($ In Thousands) (Unaudited) | |||||||||||||||||||||||||||||||||||
Revenue | |||||||||||||||||||||||||||||||||||
| Terminal revenue | 372,205 | 330,380 | 41,825 | 12.7 | 330,380 | 306,103 | 24,277 | 7.9 | |||||||||||||||||||||||||||
| Environmental response revenue | 184,979 | 15,795 | 169,184 | NM | 15,795 | 46,480 | (30,685 | ) | (66.0 | ) | |||||||||||||||||||||||||
| Total revenue | 557,184 | 346,175 | 211,009 | 61.0 | 346,175 | 352,583 | (6,408 | ) | (1.8 | ) | |||||||||||||||||||||||||
Costs and expenses | |||||||||||||||||||||||||||||||||||
| Terminal operating costs | 168,713 | 156,552 | (12,161 | ) | (7.8 | ) | 156,552 | 155,000 | (1,552 | ) | (1.0 | ) | |||||||||||||||||||||||
| Environmental response operating costs | 115,937 | 14,792 | (101,145 | ) | NM | 14,792 | 34,658 | 19,866 | 57.3 | ||||||||||||||||||||||||||
| Total operating costs | 284,650 | 171,344 | (113,306 | ) | (66.1 | ) | 171,344 | 189,658 | 18,314 | 9.7 | |||||||||||||||||||||||||
| Terminal gross profit | 203,492 | 173,828 | 29,664 | 17.1 | 173,828 | 151,103 | 22,725 | 15.0 | |||||||||||||||||||||||||||
| Environmental response gross profit | 69,042 | 1,003 | 68,039 | NM | 1,003 | 11,822 | (10,819 | ) | (91.5 | ) | |||||||||||||||||||||||||
| Gross profit | 272,534 | 174,831 | 97,703 | 55.9 | 174,831 | 162,925 | 11,906 | 7.3 | |||||||||||||||||||||||||||
| General and administrative expenses | 37,125 | 27,437 | (9,688 | ) | (35.3 | ) | 27,437 | 30,076 | 2,639 | 8.8 | |||||||||||||||||||||||||
| Depreciation and amortization | 61,277 | 55,998 | (5,279 | ) | (9.4 | ) | 55,998 | 44,615 | (11,383 | ) | (25.5 | ) | |||||||||||||||||||||||
| Operating income | 174,132 | 91,396 | 82,736 | 90.5 | 91,396 | 88,234 | 3,162 | 3.6 | |||||||||||||||||||||||||||
Interest expense, net(2) | (50,335 | ) | (2,130 | ) | (48,205 | ) | NM | (2,130 | ) | (23,540 | ) | 21,410 | 91.0 | ||||||||||||||||||||||
| Other income | 1,953 | 522 | 1,431 | NM | 522 | 2,141 | (1,619 | ) | (75.6 | ) | |||||||||||||||||||||||||
| Unrealized gains (losses) on derivative instruments | — | 3,306 | (3,306 | ) | NM | 3,306 | (46,277 | ) | 49,583 | 107.1 | |||||||||||||||||||||||||
| Provision for income taxes | (53,521 | ) | (38,842 | ) | (14,679 | ) | (37.8 | ) | (38,842 | ) | (9,452 | ) | (29,390 | ) | NM | ||||||||||||||||||||
| Noncontrolling interest | (165 | ) | 332 | (497 | ) | (149.7 | ) | 332 | 1,003 | (671 | ) | (66.9 | ) | ||||||||||||||||||||||
Net income | 72,064 | 54,584 | 17,480 | 32.0 | 54,584 | 12,109 | 42,475 | NM | |||||||||||||||||||||||||||
Reconciliation of net income to EBITDA excluding non-cash items: | |||||||||||||||||||||||||||||||||||
| Net income | 72,064 | 54,584 | 54,584 | 12,109 | |||||||||||||||||||||||||||||||
Interest expense, net(2) | 50,335 | 2,130 | 2,130 | 23,540 | |||||||||||||||||||||||||||||||
| Provision for income taxes | 53,521 | 38,842 | 38,842 | 9,452 | |||||||||||||||||||||||||||||||
| Depreciation and amortization | 61,277 | 55,998 | 55,998 | 44,615 | |||||||||||||||||||||||||||||||
| Unrealized (gains) losses on derivative instruments | — | (3,306 | ) | (3,306 | ) | 46,277 | |||||||||||||||||||||||||||||
| Other non-cash (income) expenses | (361 | ) | (590 | ) | (590 | ) | 601 | ||||||||||||||||||||||||||||
| EBITDA excluding non-cash items | 236,836 | 147,658 | 89,178 | 60.4 | 147,658 | 136,594 | 11,064 | 8.1 | |||||||||||||||||||||||||||
| EBITDA excluding non-cash items | 236,836 | 147,658 | 147,658 | 136,594 | |||||||||||||||||||||||||||||||
Interest expense, net(2) | (50,335 | ) | (2,130 | ) | (2,130 | ) | (23,540 | ) | |||||||||||||||||||||||||||
Non-cash derivative losses (gains) recorded in interest expense(2) | 15,653 | (27,380 | ) | (27,380 | ) | — | |||||||||||||||||||||||||||||
Amortization of debt financing costs(2) | 2,011 | 543 | 543 | 473 | |||||||||||||||||||||||||||||||
| Provision for income taxes, net of changes in deferred taxes | (12,514 | ) | (1,593 | ) | (1,593 | ) | (4,053 | ) | |||||||||||||||||||||||||||
| Changes in working capital | 4,536 | 16,284 | 16,284 | (15,387 | ) | ||||||||||||||||||||||||||||||
| Cash provided by operating activities | 196,187 | 133,382 | 133,382 | 94,087 | |||||||||||||||||||||||||||||||
| Changes in working capital | (4,536 | ) | (16,284 | ) | (16,284 | ) | 15,387 | ||||||||||||||||||||||||||||
| Maintenance capital expenditures | (44,995 | ) | (39,977 | ) | (39,977 | ) | (42,690 | ) | |||||||||||||||||||||||||||
| Free cash flow | 146,656 | 77,121 | 69,535 | 90.2 | 77,121 | 66,784 | 10,337 | 15.5 | |||||||||||||||||||||||||||
| (1) | Reclassified to conform to current period presentation. |
| (2) | Interest expense, net, includes non-cash gains (losses) on derivative instruments and non-cash amortization of deferred financing fees. |
| Year Ended December 31, | ||||||||||||||||||||||||||||||||
| 2009 | 2008 | Change Favorable/(Unfavorable) | 2008 | 2007 | Change Favorable/(Unfavorable) | |||||||||||||||||||||||||||
| $ | $ | $ | % | $ | $ | $ | % | |||||||||||||||||||||||||
| ($ In Thousands) (Unaudited) | ||||||||||||||||||||||||||||||||
| Revenue | ||||||||||||||||||||||||||||||||
| Terminal revenue | 330,380 | 306,103 | 24,277 | 7.9 | 306,103 | 250,733 | 55,370 | 22.1 | ||||||||||||||||||||||||
| Environmental response revenue | 15,795 | 46,480 | (30,685 | ) | (66.0 | ) | 46,480 | 24,464 | 22,016 | 90.0 | ||||||||||||||||||||||
| Total revenue | 346,175 | 352,583 | (6,408 | ) | (1.8 | ) | 352,583 | 275,197 | 77,386 | 28.1 | ||||||||||||||||||||||
| Costs and expenses | ||||||||||||||||||||||||||||||||
| Terminal operating costs | 156,552 | 155,000 | (1,552 | ) | (1.0 | ) | 155,000 | 135,726 | (19,274 | ) | (14.2 | ) | ||||||||||||||||||||
| Environmental response operating costs | 14,792 | 34,658 | 19,866 | 57.3 | 34,658 | 19,339 | (15,319 | ) | (79.2 | ) | ||||||||||||||||||||||
| Total operating costs | 171,344 | 189,658 | 18,314 | 9.7 | 189,658 | 155,065 | (34,593 | ) | (22.3 | ) | ||||||||||||||||||||||
| Terminal gross profit | 173,828 | 151,103 | 22,725 | 15.0 | 151,103 | 115,007 | 36,096 | 31.4 | ||||||||||||||||||||||||
| Environmental response gross profit | 1,003 | 11,822 | (10,819 | ) | (91.5 | ) | 11,822 | 5,125 | 6,697 | 130.7 | ||||||||||||||||||||||
| Gross profit | 174,831 | 162,925 | 11,906 | 7.3 | 162,925 | 120,132 | 42,793 | 35.6 | ||||||||||||||||||||||||
| General and administrative expenses | 27,437 | 30,076 | 2,639 | 8.8 | 30,076 | 24,435 | (5,641 | ) | (23.1 | ) | ||||||||||||||||||||||
| Depreciation and amortization | 55,998 | 44,615 | (11,383 | ) | (25.5 | ) | 44,615 | 36,025 | (8,590 | ) | (23.8 | ) | ||||||||||||||||||||
| Operating income | 91,396 | 88,234 | 3,162 | 3.6 | 88,234 | 59,672 | 28,562 | 47.9 | ||||||||||||||||||||||||
| Interest expense, net | (29,510 | ) | (23,540 | ) | (5,970 | ) | (25.4 | ) | (23,540 | ) | (14,349 | ) | (9,191 | ) | (64.1 | ) | ||||||||||||||||
| Loss on extinguishment of debt | — | — | — | NM | — | (12,337 | ) | 12,337 | NM | |||||||||||||||||||||||
| Other income | 522 | 2,141 | (1,619 | ) | (75.6 | ) | 2,141 | 4,595 | (2,454 | ) | (53.4 | ) | ||||||||||||||||||||
| Unrealized gains (losses) on derivative instruments | 30,686 | (46,277 | ) | 76,963 | 166.3 | (46,277 | ) | (21,022 | ) | (25,255 | ) | (120.1 | ) | |||||||||||||||||||
| Provision for income taxes | (38,842 | ) | (9,452 | ) | (29,390 | ) | NM | (9,452 | ) | (7,076 | ) | (2,376 | ) | (33.6 | ) | |||||||||||||||||
| Noncontrolling interest | 332 | 1,003 | (671 | ) | (66.9 | ) | 1,003 | 143 | 860 | NM | ||||||||||||||||||||||
| Net income | 54,584 | 12,109 | 42,475 | NM | 12,109 | 9,626 | 2,483 | 25.8 | ||||||||||||||||||||||||
| Reconciliation of net income to EBITDA excluding non-cash items: | ||||||||||||||||||||||||||||||||
| Net income | 54,584 | 12,109 | 12,109 | 9,626 | ||||||||||||||||||||||||||||
| Interest expense, net | 29,510 | 23,540 | 23,540 | 14,349 | ||||||||||||||||||||||||||||
| Provision for income taxes | 38,842 | 9,452 | 9,452 | 7,076 | ||||||||||||||||||||||||||||
| Depreciation and amortization | 55,998 | 44,615 | 44,615 | 36,025 | ||||||||||||||||||||||||||||
| Unrealized (gains) losses on derivative instruments | (30,686 | ) | 46,277 | 46,277 | 21,022 | |||||||||||||||||||||||||||
| Other non-cash (income) expenses | (590 | ) | 601 | 601 | 860 | |||||||||||||||||||||||||||
| EBITDA excluding non-cash items | 147,658 | 136,594 | 11,064 | 8.1 | 136,594 | 88,958 | 47,636 | 53.5 | ||||||||||||||||||||||||
| EBITDA excluding non-cash items | 147,658 | 136,594 | 136,594 | 88,958 | ||||||||||||||||||||||||||||
| Interest expense, net | (29,510 | ) | (23,540 | ) | (23,540 | ) | (14,349 | ) | ||||||||||||||||||||||||
| Amortization of debt financing costs | 543 | 473 | 473 | — | ||||||||||||||||||||||||||||
| Make-whole payment on debt financing | — | — | — | 12,337 | ||||||||||||||||||||||||||||
| Provision for income taxes, net of changes in deferred taxes | (1,593 | ) | (4,053 | ) | (4,053 | ) | (1,434 | ) | ||||||||||||||||||||||||
| Changes in working capital | 16,284 | (15,387 | ) | (15,387 | ) | 5,919 | ||||||||||||||||||||||||||
| Cash provided by operating activities | 133,382 | 94,087 | 94,087 | 91,431 | ||||||||||||||||||||||||||||
| Changes in working capital | (16,284 | ) | 15,387 | 15,387 | (5,919 | ) | ||||||||||||||||||||||||||
| Maintenance capital expenditures | (39,977 | ) | (42,690 | ) | (42,690 | ) | (32,746 | ) | ||||||||||||||||||||||||
| Free cash flow | 77,121 | 66,784 | 10,337 | 15.5 | 66,784 | 52,766 | 14,018 | 26.6 | ||||||||||||||||||||||||
NM — Not meaningful
The business files separate state income tax returns in five states. For the year ended December 31, 2009, the business expects to pay state income taxes of approximately $1.5 million.
A significant difference between the IMTT’s book and federal taxable income relates to depreciation of fixed assets. For book purposes, fixed assets are depreciated primarily over 15 to 30 years using the straight-line method of depreciation. For federal income tax purposes, fixed assets are depreciated primarily over 5 to 15 years using accelerated methods. In addition, a significant portion of the fixed assets placed in service in 2009 qualify for the 50% federal bonus depreciation. Most of the states in which the business operates allow the use of the federal depreciation calculation methods. Louisiana is the only state where the business operates that allows the bonus depreciation deduction.
The increase in terminal revenue reflects growth in all major service segments. Storage revenue grew as the average rental rates charged to customers increased by 14.8% during 2008. The increase in storage revenue also reflected a 5.3% increase in storage capacity rented to customers for 2008, as the business completed certain expansion projects and reported contributions from a facility acquired in November 2007. In addition, the commencement of storage and related logistics services for our principal customer at the new Geismar terminal contributed $12.2 million to terminal revenue in 2008.
Storage capacity utilization, defined as storage capacity rented divided by total capacity available, remained relatively constant at 94% during 2008 and 2007.
Increases in terminal revenue were offset by higher operating costs relating to the commencement of operations at Geismar, the increase in storage capacity and throughput associated with the expansion of existing facilities, the acquisition of a new facility at Joliet in November 2007 and IMTT’s extensive tank inspection and repair program being undertaken in Louisiana. Also operating costs in 2008 were increased by a $2.0 million excise tax settlement related to IMTT’s handling of alcohol during 2005 and a $1.0 million accrual for a potential air emission fee at Bayonne. Please see “Legal Proceedings” in Part I, Item 3 for discussion on the air emission fee.
Revenue and gross profit from environmental response services increased substantially during 2008 due to the central role played by Oil Mop in the response activities following the July 2008 fuel oil spill on the Mississippi River near New Orleans. Oil Mop generated $27.3 million in revenue from spill response work and ancillary services in 2008.
Increased general and administrative costs during 2008 resulted from a bad debt reserve for customers under bankruptcy protection and increased overhead costs due to the significant increase in environmental response activity.
Depreciation and amortization expense increased by $8.6 million as IMTT completed several major expansion projects.
Interest costs increased during 2008 primarily due to higher borrowings incurred to fund growth capital expenditures.
Loss on extinguishment of debt in 2007 comprised a $12.3 million make-whole payment associated with the repayment of the two tranches of senior notes in conjunction with the establishment of a new $625.0 million revolving credit facility.
Other income for 2008 declined primarily due to gains from insurance settlements in 2007, which did not recur in 2008.
| Year Ended December 31, | |||||||||||||||||||||||||||||||||||
|---|---|---|---|---|---|---|---|---|---|---|---|---|---|---|---|---|---|---|---|---|---|---|---|---|---|---|---|---|---|---|---|---|---|---|---|
| 2010 | 2009(1) | Change Favorable/(Unfavorable) | 2009(1) | 2008(1) | Change Favorable/(Unfavorable) | ||||||||||||||||||||||||||||||
| $ | $ | $ | % | $ | $ | $ | % | ||||||||||||||||||||||||||||
| ($ In Thousands) (Unaudited) | |||||||||||||||||||||||||||||||||||
Contribution margin | |||||||||||||||||||||||||||||||||||
| Revenue – utility | 113,752 | 95,769 | 17,983 | 18.8 | 95,769 | 121,770 | (26,001 | ) | (21.4 | ) | |||||||||||||||||||||||||
| Cost of revenue – utility | 76,891 | 60,227 | (16,664 | ) | (27.7 | ) | 60,227 | 91,978 | 31,751 | 34.5 | |||||||||||||||||||||||||
| Contribution margin – utility | 36,861 | 35,542 | 1,319 | 3.7 | 35,542 | 29,792 | 5,750 | 19.3 | |||||||||||||||||||||||||||
| Revenue – non-utility | 96,855 | 79,597 | 17,258 | 21.7 | 79,597 | �� | 91,244 | (11,647 | ) | (12.8 | ) | ||||||||||||||||||||||||
| Cost of revenue – non-utility | 48,896 | 36,580 | (12,316 | ) | (33.7 | ) | 36,580 | 55,504 | 18,924 | 34.1 | |||||||||||||||||||||||||
| Contribution margin – non-utility | 47,959 | 43,017 | 4,942 | 11.5 | 43,017 | 35,740 | 7,277 | 20.4 | |||||||||||||||||||||||||||
Total contribution margin | 84,820 | 78,559 | 6,261 | 8.0 | 78,559 | 65,532 | 13,027 | 19.9 | |||||||||||||||||||||||||||
| Production | 6,725 | 6,471 | (254 | ) | (3.9 | ) | 6,471 | 6,488 | 17 | 0.3 | |||||||||||||||||||||||||
| Transmission and distribution | 19,269 | 19,152 | (117 | ) | (0.6 | ) | 19,152 | 17,947 | (1,205 | ) | (6.7 | ) | |||||||||||||||||||||||
Gross profit | 58,826 | 52,936 | 5,890 | 11.1 | 52,936 | 41,097 | 11,839 | 28.8 | |||||||||||||||||||||||||||
| Selling, general and administrative expenses | 16,684 | 16,720 | 36 | 0.2 | 16,720 | 14,389 | (2,331 | ) | (16.2 | ) | |||||||||||||||||||||||||
| Depreciation and amortization | 6,649 | 6,829 | 180 | 2.6 | 6,829 | 6,739 | (90 | ) | (1.3 | ) | |||||||||||||||||||||||||
Operating income | 35,493 | 29,387 | 6,106 | 20.8 | 29,387 | 19,969 | 9,418 | 47.2 | |||||||||||||||||||||||||||
Interest expense, net(2) | (16,505 | ) | (9,250 | ) | (7,255 | ) | (78.4 | ) | (9,250 | ) | (9,390 | ) | 140 | 1.5 | |||||||||||||||||||||
| Other expense | (90 | ) | (355 | ) | 265 | 74.6 | (355 | ) | (31 | ) | (324 | ) | NM | ||||||||||||||||||||||
| Unrealized losses on derivative instruments | — | (327 | ) | 327 | NM | (327 | ) | (221 | ) | (106 | ) | (48.0 | ) | ||||||||||||||||||||||
| Provision for income taxes | (7,400 | ) | (7,619 | ) | 219 | 2.9 | (7,619 | ) | (4,044 | ) | (3,575 | ) | (88.4 | ) | |||||||||||||||||||||
Net income(3) | 11,498 | 11,836 | (338 | ) | �� | (2.9 | ) | 11,836 | 6,283 | 5,553 | 88.4 | ||||||||||||||||||||||||
Reconciliation of net income to EBITDA excluding non-cash items: | |||||||||||||||||||||||||||||||||||
Net income(3) | 11,498 | 11,836 | 11,836 | 6,283 | |||||||||||||||||||||||||||||||
Interest expense, net(2) | 16,505 | 9,250 | 9,250 | 9,390 | |||||||||||||||||||||||||||||||
| Provision for income taxes | 7,400 | 7,619 | 7,619 | 4,044 | |||||||||||||||||||||||||||||||
| Depreciation and amortization | 6,649 | 6,829 | 6,829 | 6,739 | |||||||||||||||||||||||||||||||
| Unrealized losses on derivative instruments | — | 327 | 327 | 221 | |||||||||||||||||||||||||||||||
| Other non-cash expenses | 2,384 | 1,771 | 1,771 | 1,180 | |||||||||||||||||||||||||||||||
| EBITDA excluding non-cash items | 44,436 | 37,632 | 6,804 | 18.1 | 37,632 | 27,857 | 9,775 | 35.1 | |||||||||||||||||||||||||||
| EBITDA excluding non-cash items | 44,436 | 37,632 | 37,632 | 27,857 | |||||||||||||||||||||||||||||||
Interest expense, net(2) | (16,505 | ) | (9,250 | ) | (9,250 | ) | (9,390 | ) | |||||||||||||||||||||||||||
Non-cash derivative losses recorded in interest expense(2) | 7,334 | 309 | 309 | — | |||||||||||||||||||||||||||||||
Amortization of debt financing costs(2) | 478 | 478 | 478 | 478 | |||||||||||||||||||||||||||||||
| Provision for income taxes, net of changes in deferred taxes | (4,333 | ) | (4,936 | ) | (4,936 | ) | — | ||||||||||||||||||||||||||||
| Changes in working capital | (2,079 | ) | 1,327 | 1,327 | 8,133 | ||||||||||||||||||||||||||||||
| Cash provided by operating activities | 29,331 | 25,560 | 25,560 | 27,078 | |||||||||||||||||||||||||||||||
| Changes in working capital | 2,079 | (1,327 | ) | (1,327 | ) | (8,133 | ) | ||||||||||||||||||||||||||||
| Maintenance capital expenditures | (6,275 | ) | (3,939 | ) | (3,939 | ) | (6,202 | ) | |||||||||||||||||||||||||||
| Free cash flow | 25,135 | 20,294 | 4,841 | 23.9 | 20,294 | 12,743 | 7,551 | 59.3 | |||||||||||||||||||||||||||
| (1) | Reclassified to conform to current period presentation. For the year ended December 31, 2010, payroll taxes and certain employee welfare and benefit costs that were previously recorded in selling, general and administrative costs were reclassified to production, transmission and distribution and other expense where the |
| Year Ended December 31, | ||||||||||||||||||||||||||||||||||||
| 2009 | 2008 | Change Favorable/(Unfavorable) | 2008 | 2007 | Change Favorable/(Unfavorable) | |||||||||||||||||||||||||||||||
| $ | $ | $ | % | $ | $ | $ | % | |||||||||||||||||||||||||||||
| ($ In Thousands) (Unaudited) | ||||||||||||||||||||||||||||||||||||
| Contribution margin | ||||||||||||||||||||||||||||||||||||
| Revenue – utility | 95,769 | 121,770 | (26,001 | ) | (21.4 | ) | 121,770 | 95,770 | 26,000 | 27.1 | ||||||||||||||||||||||||||
| Cost of revenue – utility | 60,227 | 91,978 | 31,751 | 34.5 | 91,978 | 64,371 | (27,607 | ) | (42.9 | ) | ||||||||||||||||||||||||||
| Contribution margin – utility | 35,542 | 29,792 | 5,750 | 19.3 | 29,792 | 31,399 | (1,607 | ) | (5.1 | ) | ||||||||||||||||||||||||||
| Revenue – non-utility | 79,597 | 91,244 | (11,647 | ) | (12.8 | ) | 91,244 | 74,602 | 16,642 | 22.3 | ||||||||||||||||||||||||||
| Cost of revenue – non-utility | 36,580 | 55,504 | 18,924 | 34.1 | 55,504 | 44,908 | (10,596 | ) | (23.6 | ) | ||||||||||||||||||||||||||
| Contribution margin – non-utility | 43,017 | 35,740 | 7,277 | 20.4 | 35,740 | 29,694 | 6,046 | 20.4 | ||||||||||||||||||||||||||||
| Total contribution margin | 78,559 | 65,532 | 13,027 | 19.9 | 65,532 | 61,093 | 4,439 | 7.3 | ||||||||||||||||||||||||||||
| Production | 5,467 | 5,717 | 250 | 4.4 | 5,717 | 4,913 | (804 | ) | (16.4 | ) | ||||||||||||||||||||||||||
| Transmission and distribution | 15,264 | 14,912 | (352 | ) | (2.4 | ) | 14,912 | 15,350 | 438 | 2.9 | ||||||||||||||||||||||||||
| Gross profit | 57,828 | 44,903 | 12,925 | 28.8 | 44,903 | 40,830 | 4,073 | 10.0 | ||||||||||||||||||||||||||||
| Selling, general and administrative expenses | 21,802 | 18,374 | (3,428 | ) | (18.7 | ) | 18,374 | 16,350 | (2,024 | ) | (12.4 | ) | ||||||||||||||||||||||||
| Depreciation and amortization | 6,829 | 6,739 | (90 | ) | (1.3 | ) | 6,739 | 6,737 | (2 | ) | NM | |||||||||||||||||||||||||
| Operating income | 29,197 | 19,790 | 9,407 | 47.5 | 19,790 | 17,743 | 2,047 | 11.5 | ||||||||||||||||||||||||||||
| Interest expense, net | (8,941 | ) | (9,390 | ) | 449 | 4.8 | (9,390 | ) | (9,195 | ) | (195 | ) | (2.1 | ) | ||||||||||||||||||||||
| Other (expense) income | (165 | ) | 148 | (313 | ) | NM | 148 | (162 | ) | 310 | 191.4 | |||||||||||||||||||||||||
| Unrealized losses on derivative instruments | (636 | ) | (221 | ) | (415 | ) | (187.8 | ) | (221 | ) | (431 | ) | 210 | 48.7 | ||||||||||||||||||||||
| Provision for income taxes(1) | (7,619 | ) | (4,044 | ) | (3,575 | ) | (88.4 | ) | (4,044 | ) | (3,115 | ) | (929 | ) | (29.8 | ) | ||||||||||||||||||||
| Net income(2) | 11,836 | 6,283 | 5,553 | 88.4 | 6,283 | 4,840 | 1,443 | 29.8 | ||||||||||||||||||||||||||||
| Reconciliation of net income to EBITDA excluding non-cash items: | ||||||||||||||||||||||||||||||||||||
| Net income(2) | 11,836 | 6,283 | 6,283 | 4,840 | ||||||||||||||||||||||||||||||||
| Interest expense, net | 8,941 | 9,390 | 9,390 | 9,195 | ||||||||||||||||||||||||||||||||
| Provision for income taxes(1) | 7,619 | 4,044 | 4,044 | 3,115 | ||||||||||||||||||||||||||||||||
| Depreciation and amortization | 6,829 | 6,739 | 6,739 | 6,737 | ||||||||||||||||||||||||||||||||
| Unrealized losses on derivative instruments | 636 | 221 | 221 | 431 | ||||||||||||||||||||||||||||||||
| Other non-cash expenses | 1,771 | 1,180 | 1,180 | 1,290 | ||||||||||||||||||||||||||||||||
| EBITDA excluding non-cash items | 37,632 | 27,857 | 9,775 | 35.1 | 27,857 | 25,608 | 2,249 | 8.8 | ||||||||||||||||||||||||||||
| EBITDA excluding non-cash items | 37,632 | 27,857 | 27,857 | 25,608 | ||||||||||||||||||||||||||||||||
| Interest expense, net | (8,941 | ) | (9,390 | ) | (9,390 | ) | (9,195 | ) | ||||||||||||||||||||||||||||
| Amortization of debt financing costs | 478 | 478 | 478 | 478 | ||||||||||||||||||||||||||||||||
| Provision for income taxes, net of changes in deferred taxes | (4,936 | ) | — | — | — | |||||||||||||||||||||||||||||||
| Changes in working capital | 1,327 | 8,133 | 8,133 | (886 | ) | |||||||||||||||||||||||||||||||
| Cash provided by operating activities | 25,560 | 27,078 | 27,078 | 16,005 | ||||||||||||||||||||||||||||||||
| Changes in working capital | (1,327 | ) | (8,133 | ) | (8,133 | ) | 886 | |||||||||||||||||||||||||||||
| Maintenance capital expenditures | (3,939 | ) | (6,202 | ) | (6,202 | ) | (5,257 | ) | ||||||||||||||||||||||||||||
| Free cash flow | 20,294 | 12,743 | 7,551 | 59.3 | 12,743 | 11,634 | 1,109 | 9.5 | ||||||||||||||||||||||||||||
NM — Not meaningful
| (2) | Interest expense, net, includes non-cash losses on derivative instruments and non-cash amortization of deferred financing fees. |
| (3) | Corporate allocation expense, other intercompany fees and the federal tax effect have been excluded from the above table as they are eliminated on consolidation at the MIC Inc. level. |
Although the presentation and analysis of contribution margin is a non-GAAP performance measure, management believes that it is meaningful to understanding the business’ performance under both a utility rate structure and a non-utility competitive pricing structure. Under aRegulation of the utility environment,portion of The Gas Company’s operations provides for the pass through of increases or decreases in feedstock costs are automatically passed through to utility customers. Changes in the cost of propane distributed to non-utility customers while non-utilitycan be recovered in pricing, may be adjusted, subject to the competitive environment, to recover changes in raw material costs.conditions generally.
Non-utility contribution margin was higher, primarily due to lower input costs, partially offset by a 0.6% volume decline from 2008. Local suppliers reduced their production of propane. To the extent that local suppliers are unable to supply The Gas Company with a sufficient amount of propane, the business believes it can supplement its supply from foreign sources. Foreign sourced propane is likely to cost more than locally produced propane, although a portion of any increased cost may be offset by improved efficiency in distribution.
Income from
Utility contribution margin decreased primarily due to lower volume of gas sold. Sales volume in 2008 was approximately 4% lower than 2007. Priorchilled water. Capacity charges are typically adjusted annually at a fixed rate or are indexed to the third quarterConsumer Price Index (CPI). The terms of 2008, a portionthe business’customer contracts provide for the pass through of utility customer fuel cost adjustments was offset by withdrawals from an acquisition funded escrow account that was fully exhaustedincreases or decreases in electricity costs, the second quarterlargest component of 2008. For 2008 and 2007, withdrawals of $1.6 million and $1.9 million, respectively, were recorded in cash flows from operating activities.the business’ direct expenses.
Non-utility contribution margin increased due to customer price increases, partially offset by higher costs of LPG and increases in the cost to transport LPG between islands. The volume of gas products sold in 2008 was approximately 2% lower than 2007.
Production costs increased primarily due to higher electricity, material and personnel costs. Transmission and distribution costs were lower due principally to lower costs related to the completion of the government required pipeline inspection, and lower adjustment to reserves for asset retirement costs, partially offset by higher personnel and rent costs. Selling, general and administrative costs were higher due to an increase in bad debt expense reserves, higher personnel costs, including overtime and fewer vacancies, higher employee benefit costs, including pension expense, and higher professional services costs.
Interest expense increased due to higher outstanding borrowings for utility capital expenditures during 2008.
| Year Ended December 31, | |||||||||||||||||||||||||||||||||||
|---|---|---|---|---|---|---|---|---|---|---|---|---|---|---|---|---|---|---|---|---|---|---|---|---|---|---|---|---|---|---|---|---|---|---|---|
| 2010 | 2009(1) | Change Favorable/(Unfavorable) | 2009(1) | 2008(1) | Change Favorable/(Unfavorable) | ||||||||||||||||||||||||||||||
| $ | $ | $ | % | $ | $ | $ | % | ||||||||||||||||||||||||||||
| ($ In Thousands) (Unaudited) | |||||||||||||||||||||||||||||||||||
| Cooling capacity revenue | 21,162 | 20,430 | 732 | 3.6 | 20,430 | 19,350 | 1,080 | 5.6 | |||||||||||||||||||||||||||
| Cooling consumption revenue | 24,386 | 20,236 | 4,150 | 20.5 | 20,236 | 20,894 | (658 | ) | (3.1 | ) | |||||||||||||||||||||||||
| Other revenue | 3,371 | 3,137 | 234 | 7.5 | 3,137 | 3,115 | 22 | 0.7 | |||||||||||||||||||||||||||
| Finance lease revenue | 7,843 | 4,758 | 3,085 | 64.8 | 4,758 | 4,686 | 72 | 1.5 | |||||||||||||||||||||||||||
| Total revenue | 56,762 | 48,561 | 8,201 | 16.9 | 48,561 | 48,045 | 516 | 1.1 | |||||||||||||||||||||||||||
| Direct expenses – electricity | 16,343 | 13,356 | (2,987 | ) | (22.4 | ) | 13,356 | 13,842 | 486 | 3.5 | |||||||||||||||||||||||||
Direct expenses – other(2) | 20,349 | 18,647 | (1,702 | ) | (9.1 | ) | 18,647 | 17,809 | (838 | ) | (4.7 | ) | |||||||||||||||||||||||
| Direct expenses – total | 36,692 | 32,003 | (4,689 | ) | (14.7 | ) | 32,003 | 31,651 | (352 | ) | (1.1 | ) | |||||||||||||||||||||||
| Gross profit | 20,070 | 16,558 | 3,512 | 21.2 | 16,558 | 16,394 | 164 | 1.0 | |||||||||||||||||||||||||||
| Selling, general and administrative expenses | 3,217 | 3,407 | 190 | 5.6 | 3,407 | 3,390 | (17 | ) | (0.5 | ) | |||||||||||||||||||||||||
| Amortization of intangibles | 1,368 | 1,368 | — | — | 1,368 | 1,372 | 4 | 0.3 | |||||||||||||||||||||||||||
| Operating income | 15,485 | 11,783 | 3,702 | 31.4 | 11,783 | 11,632 | 151 | 1.3 | |||||||||||||||||||||||||||
Interest expense, net(3) | (20,671 | ) | (8,995 | ) | (11,676 | ) | (129.8 | ) | (8,995 | ) | (10,341 | ) | 1,346 | 13.0 | |||||||||||||||||||||
| Other income | 1,804 | 1,235 | 569 | 46.1 | 1,235 | 201 | 1,034 | NM | |||||||||||||||||||||||||||
| Unrealized (losses) gains on derivative instruments | — | (1,378 | ) | 1,378 | NM | (1,378 | ) | 26 | (1,404 | ) | NM | ||||||||||||||||||||||||
| Benefit (provision) for income taxes | 1,844 | (773 | ) | 2,617 | NM | (773 | ) | (242 | ) | (531 | ) | NM | |||||||||||||||||||||||
| Noncontrolling interest | (1,284 | ) | (690 | ) | (594 | ) | (86.1 | ) | (690 | ) | (585 | ) | (105 | ) | (17.9 | ) | |||||||||||||||||||
Net (loss) income(4) | (2,822 | ) | 1,182 | (4,004 | ) | NM | 1,182 | 691 | 491 | 71.1 | |||||||||||||||||||||||||
Reconciliation of net (loss) income to EBITDA excluding non-cash items: | |||||||||||||||||||||||||||||||||||
Net (loss) income(4) | (2,822 | ) | 1,182 | 1,182 | 691 | ||||||||||||||||||||||||||||||
Interest expense, net(3) | 20,671 | 8,995 | 8,995 | 10,341 | |||||||||||||||||||||||||||||||
| (Benefit) provision for income taxes | (1,844 | ) | 773 | 773 | 242 | ||||||||||||||||||||||||||||||
Depreciation(2) | 6,555 | 6,086 | 6,086 | 5,813 | |||||||||||||||||||||||||||||||
| Amortization of intangibles | 1,368 | 1,368 | 1,368 | 1,372 | |||||||||||||||||||||||||||||||
| Unrealized losses (gains) on derivative instruments | — | 1,378 | 1,378 | (26 | ) | ||||||||||||||||||||||||||||||
| Other non-cash (income) expenses | (1,082 | ) | 1,009 | 1,009 | 2,654 | ||||||||||||||||||||||||||||||
| EBITDA excluding non-cash items | 22,846 | 20,791 | 2,055 | 9.9 | 20,791 | 21,087 | (296 | ) | (1.4 | ) | |||||||||||||||||||||||||
| EBITDA excluding non-cash items | 22,846 | 20,791 | 20,791 | 21,087 | |||||||||||||||||||||||||||||||
Interest expense, net(3) | (20,671 | ) | (8,995 | ) | (8,995 | ) | (10,341 | ) | |||||||||||||||||||||||||||
Non-cash derivative losses (gains) recorded in interest expense(3) | 10,136 | (1,158 | ) | (1,158 | ) | — | |||||||||||||||||||||||||||||
Amortization of debt financing costs(3) | 681 | 681 | 681 | 682 | |||||||||||||||||||||||||||||||
| Equipment lease receivable, net | 2,761 | 2,752 | 2,752 | 2,460 | |||||||||||||||||||||||||||||||
| Changes in working capital | (794 | ) | 377 | 377 | 3,878 | ||||||||||||||||||||||||||||||
| Cash provided by operating activities | 14,959 | 14,448 | 14,448 | 17,766 | |||||||||||||||||||||||||||||||
| Changes in working capital | 794 | (377 | ) | (377 | ) | (3,878 | ) | ||||||||||||||||||||||||||||
| Maintenance capital expenditures | (1,207 | ) | (1,001 | ) | (1,001 | ) | (989 | ) | |||||||||||||||||||||||||||
| Free cash flow | 14,546 | 13,070 | 1,476 | 11.3 | 13,070 | 12,899 | 171 | 1.3 | |||||||||||||||||||||||||||
| (1) | Reclassified to conform to current period presentation. |
| (2) | Includes depreciation expense of $6.6 million, $6.1 million and $5.8 million for the years ended December 31, 2010, 2009 and 2008, respectively. |
| (3) | Interest expense, net, includes non-cash (losses) gains on derivative instruments and non-cash amortization of deferred financing fees. |
| (4) | Corporate allocation expense and the federal tax effect have been excluded from the above table as they are eliminated on consolidation at the MIC Inc. level. |
| Year Ended December 31, | ||||||||||||||||||||||||||||||||
| 2009 | 2008 | Change Favorable/(Unfavorable) | 2008 | 2007 | Change Favorable/(Unfavorable) | |||||||||||||||||||||||||||
| $ | $ | $ | % | $ | $ | $ | % | |||||||||||||||||||||||||
| ($ In Thousands) (Unaudited) | ||||||||||||||||||||||||||||||||
| Cooling capacity revenue | 20,430 | 19,350 | 1,080 | 5.6 | 19,350 | 18,854 | 496 | 2.6 | ||||||||||||||||||||||||
| Cooling consumption revenue | 20,236 | 20,894 | (658 | ) | (3.1 | ) | 20,894 | 22,876 | (1,982 | ) | (8.7 | ) | ||||||||||||||||||||
| Other revenue | 3,137 | 3,115 | 22 | 0.7 | 3,115 | 2,864 | 251 | 8.8 | ||||||||||||||||||||||||
| Finance lease revenue | 4,758 | 4,686 | 72 | 1.5 | 4,686 | 4,912 | (226 | ) | (4.6 | ) | ||||||||||||||||||||||
| Total revenue | 48,561 | 48,045 | 516 | 1.1 | 48,045 | 49,506 | (1,461 | ) | (3.0 | ) | ||||||||||||||||||||||
| Direct expenses – electricity | 13,356 | 13,842 | 486 | 3.5 | 13,842 | 15,424 | 1,582 | 10.3 | ||||||||||||||||||||||||
| Direct expenses – other(1) | 18,647 | 17,809 | (838 | ) | (4.7 | ) | 17,809 | 17,696 | (113 | ) | (0.6 | ) | ||||||||||||||||||||
| Direct expenses – total | 32,003 | 31,651 | (352 | ) | (1.1 | ) | 31,651 | 33,120 | 1,469 | 4.4 | ||||||||||||||||||||||
| Gross profit | 16,558 | 16,394 | 164 | 1.0 | 16,394 | 16,386 | 8 | NM | ||||||||||||||||||||||||
| Selling, general and administrative expenses | 3,407 | 3,390 | (17 | ) | (0.5 | ) | 3,390 | 3,208 | (182 | ) | (5.7 | ) | ||||||||||||||||||||
| Amortization of intangibles | 1,368 | 1,372 | 4 | 0.3 | 1,372 | 1,368 | (4 | ) | (0.3 | ) | ||||||||||||||||||||||
| Operating income | 11,783 | 11,632 | 151 | 1.3 | 11,632 | 11,810 | (178 | ) | (1.5 | ) | ||||||||||||||||||||||
| Interest expense, net | (10,153 | ) | (10,341 | ) | 188 | 1.8 | (10,341 | ) | (9,009 | ) | (1,332 | ) | (14.8 | ) | ||||||||||||||||||
| Loss on extinguishment of debt | — | — | — | — | — | (17,708 | ) | 17,708 | NM | |||||||||||||||||||||||
| Other income | 1,235 | 201 | 1,034 | NM | 201 | 740 | (539 | ) | (72.8 | ) | ||||||||||||||||||||||
| Unrealized (losses) gains on derivative instruments | (220 | ) | 26 | (246 | ) | NM | 26 | (28 | ) | 54 | 192.9 | |||||||||||||||||||||
| (Provision) benefit for income taxes | (773 | ) | (242 | ) | (531 | ) | NM | (242 | ) | 5,490 | (5,732 | ) | (104.4 | ) | ||||||||||||||||||
| Noncontrolling interest | (690 | ) | (585 | ) | (105 | ) | (17.9 | ) | (585 | ) | (554 | ) | (31 | ) | (5.6 | ) | ||||||||||||||||
| Net income (loss)(2) | 1,182 | 691 | 491 | 71.1 | 691 | (9,259 | ) | 9,950 | 107.5 | |||||||||||||||||||||||
| Reconciliation of net income (loss) to EBITDA excluding non-cash items: | ||||||||||||||||||||||||||||||||
| Net income (loss)(2) | 1,182 | 691 | 691 | (9,259 | ) | |||||||||||||||||||||||||||
| Interest expense, net | 10,153 | 10,341 | 10,341 | 9,009 | ||||||||||||||||||||||||||||
| Provision (benefit) for income taxes | 773 | 242 | 242 | (5,490 | ) | |||||||||||||||||||||||||||
| Depreciation(1) | 6,086 | 5,813 | 5,813 | 5,792 | ||||||||||||||||||||||||||||
| Amortization of intangibles | 1,368 | 1,372 | 1,372 | 1,368 | ||||||||||||||||||||||||||||
| Unrealized losses (gains) on derivative instruments | 220 | (26 | ) | (26 | ) | 28 | ||||||||||||||||||||||||||
| Non-cash loss on extinguishment of debt | — | — | — | 3,013 | ||||||||||||||||||||||||||||
| Other non-cash expenses | 1,009 | 2,654 | 2,654 | 1,086 | ||||||||||||||||||||||||||||
| EBITDA excluding non-cash items | 20,791 | 21,087 | (296 | ) | (1.4 | ) | 21,087 | 5,547 | 15,540 | NM | ||||||||||||||||||||||
| EBITDA excluding non-cash items | 20,791 | 21,087 | 21,087 | 5,547 | ||||||||||||||||||||||||||||
| Interest expense, net | (10,153 | ) | (10,341 | ) | (10,341 | ) | (9,009 | ) | ||||||||||||||||||||||||
| Make-whole payment on debt financing | — | — | — | 14,695 | ||||||||||||||||||||||||||||
| Amortization of debt financing costs | 681 | 682 | 682 | 309 | ||||||||||||||||||||||||||||
| Equipment lease receivable, net | 2,610 | 2,372 | 2,372 | 2,531 | ||||||||||||||||||||||||||||
| Changes in working capital | 519 | 3,966 | 3,966 | 12 | ||||||||||||||||||||||||||||
| Cash provided by operating activities | 14,448 | 17,766 | 17,766 | 14,085 | ||||||||||||||||||||||||||||
| Changes in working capital | (519 | ) | (3,966 | ) | (3,966 | ) | (12 | ) | ||||||||||||||||||||||||
| Maintenance capital expenditures | (1,001 | ) | (989 | ) | (989 | ) | (949 | ) | ||||||||||||||||||||||||
| Free cash flow | 12,928 | 12,811 | 117 | 0.9 | 12,811 | 13,124 | (313 | ) | (2.4 | ) | ||||||||||||||||||||||
NM — Not meaningful
Due to differences in determining book and tax deductible depreciation and amortization, the business’ state taxable income is expected to exceed book income in 2009. However, as of December 31, 2009 the business had more than $20.0 million of state income tax net operating loss carryforwards that are expected to offset any state tax liability through 2011.
Gross profit was relatively flat primarily due to annual inflation-related increases of contract capacity rates in accordance with customer contract terms offset by lower cooling consumption revenue and overall electricity costs due to lower ton-hour sales resulting from cooler than average temperatures in 2008 compared with 2007. Other revenue increased due to the business’ pass-through to customers of the higher cost of natural gas consumables, which is offset in other direct expenses.
Selling, general and administrative expenses increased primarily due to the timing of audit fees in 2008 and the collection in 2007 of amounts which were previously written-off in relation to a customer bankruptcy filed in 2004.
Interest expense increased as a result of higher debt levels associated with the 2007 refinancing and higher non-cash amortization of deferred financing costs.
Loss on extinguishment of debt comprised a $14.7 million make-whole payment and a $3.0 million deferred financing costs write-off associated with the refinance of the business’ senior notes in 2007, which did not recur in 2008.
The rapidly changing conditions affecting this business warrants a discussion of current and comparable prior period performance as well as a quarter on quarter sequential analysis in order to facilitate an understanding of the stabilization of the general aviation market in recent months and its effect on the business’ financial results.
The soft economic conditions caused a lower utilization of business jets by both corporations and individuals. This lower utilization was exacerbated by the negative publicity of the general aviation sector. According to flight data reported by the FAA, the level of U.S. business jet flight activity (as measured by take-offs and landings) declined 17.3% in 2009. Quarterly activity level has increased sequentially since the second quarter of 2009. In the fourth quarter of 2009, business jet take-offs and landings were flat year-on-year but increased sequentially versus the third quarter of 2009 despite the typical seasonal business jet traffic slowdown in the fourth quarter versus the third quarter.
| Year Ended December 31, | |||||||||||||||||||||||||||||||||||
|---|---|---|---|---|---|---|---|---|---|---|---|---|---|---|---|---|---|---|---|---|---|---|---|---|---|---|---|---|---|---|---|---|---|---|---|
| 2010 | 2009(1) | Change Favorable/(Unfavorable) | 2009(1) | 2008 | Change Favorable/(Unfavorable) | ||||||||||||||||||||||||||||||
| $ | $ | $ | % | $ | $ | $ | % | ||||||||||||||||||||||||||||
| ($ In Thousands) (Unaudited) | |||||||||||||||||||||||||||||||||||
Revenue | |||||||||||||||||||||||||||||||||||
| Fuel revenue | 417,489 | 314,603 | 102,886 | 32.7 | 314,603 | 494,810 | (180,207 | ) | (36.4 | ) | |||||||||||||||||||||||||
| Non-fuel revenue | 155,933 | 171,546 | (15,613 | ) | (9.1 | ) | 171,546 | 221,492 | (49,946 | ) | (22.5 | ) | |||||||||||||||||||||||
| Total revenue | 573,422 | 486,149 | 87,273 | 18.0 | 486,149 | 716,302 | (230,153 | ) | (32.1 | ) | |||||||||||||||||||||||||
Cost of revenue | |||||||||||||||||||||||||||||||||||
| Cost of revenue-fuel | 265,493 | 184,853 | (80,640 | ) | (43.6 | ) | 184,853 | 342,102 | 157,249 | 46.0 | |||||||||||||||||||||||||
| Cost of revenue-non-fuel | 16,397 | 14,314 | (2,083 | ) | (14.6 | ) | 14,314 | 32,198 | 17,884 | 55.5 | |||||||||||||||||||||||||
| Total cost of revenue | 281,890 | 199,167 | (82,723 | ) | (41.5 | ) | 199,167 | 374,300 | 175,133 | 46.8 | |||||||||||||||||||||||||
| Fuel gross profit | 151,996 | 129,750 | 22,246 | 17.1 | 129,750 | 152,708 | (22,958 | ) | (15.0 | ) | |||||||||||||||||||||||||
| Non-fuel gross profit | 139,536 | 157,232 | (17,696 | ) | (11.3 | ) | 157,232 | 189,294 | (32,062 | ) | (16.9 | ) | |||||||||||||||||||||||
| Gross profit | 291,532 | 286,982 | 4,550 | 1.6 | 286,982 | 342,002 | (55,020 | ) | (16.1 | ) | |||||||||||||||||||||||||
Selling, general and administrative expenses(2) | 174,526 | 179,949 | 5,423 | 3.0 | 179,949 | 205,304 | 25,355 | 12.3 | |||||||||||||||||||||||||||
| Goodwill impairment | — | 71,200 | 71,200 | NM | 71,200 | 52,000 | (19,200 | ) | (36.9 | ) | |||||||||||||||||||||||||
| Depreciation and amortization | 56,602 | 89,508 | 32,906 | 36.8 | 89,508 | 93,903 | 4,395 | 4.7 | |||||||||||||||||||||||||||
| Loss on disposal of assets | 17,869 | — | (17,869 | ) | NM | — | — | — | — | ||||||||||||||||||||||||||
| Operating income (loss) | 42,535 | (53,675 | ) | 96,210 | 179.2 | (53,675 | ) | (9,205 | ) | (44,470 | ) | NM | |||||||||||||||||||||||
Interest expense, net(3) | (69,409 | ) | (72,929 | ) | 3,520 | 4.8 | (72,929 | ) | (62,967 | ) | (9,962 | ) | (15.8 | ) | |||||||||||||||||||||
| Other expense | (917 | ) | (1,451 | ) | 534 | 36.8 | (1,451 | ) | (241 | ) | (1,210 | ) | NM | ||||||||||||||||||||||
| Unrealized losses on derivative instruments | — | (23,331 | ) | 23,331 | NM | (23,331 | ) | (1,871 | ) | (21,460 | ) | NM | |||||||||||||||||||||||
| Benefit for income taxes | 9,497 | 61,009 | (51,512 | ) | (84.4 | ) | 61,009 | 29,936 | 31,073 | 103.8 | |||||||||||||||||||||||||
Net loss(4) | (18,294 | ) | (90,377 | ) | 72,083 | 79.8 | (90,377 | ) | (44,348 | ) | (46,029 | ) | (103.8 | ) | |||||||||||||||||||||
Reconciliation of net loss to EBITDA excluding non-cash items: | |||||||||||||||||||||||||||||||||||
Net loss(4) | (18,294 | ) | (90,377 | ) | (90,377 | ) | (44,348 | ) | |||||||||||||||||||||||||||
Interest expense, net(3) | 69,409 | 72,929 | 72,929 | 62,967 | |||||||||||||||||||||||||||||||
| Benefit for income taxes | (9,497 | ) | (61,009 | ) | (61,009 | ) | (29,936 | ) | |||||||||||||||||||||||||||
| Depreciation and amortization | 56,602 | 89,508 | 89,508 | 93,903 | |||||||||||||||||||||||||||||||
| Goodwill impairment | — | 71,200 | 71,200 | 52,000 | |||||||||||||||||||||||||||||||
| Loss on disposal of assets | 17,869 | — | — | — | |||||||||||||||||||||||||||||||
| Unrealized losses on derivative instruments | — | 23,331 | 23,331 | 1,871 | |||||||||||||||||||||||||||||||
| Other non-cash expenses | 1,388 | 903 | 903 | 624 | |||||||||||||||||||||||||||||||
| EBITDA excluding non-cash items | 117,477 | 106,485 | 10,992 | 10.3 | 106,485 | 137,081 | (30,596 | ) | (22.3 | ) | |||||||||||||||||||||||||
| EBITDA excluding non-cash items | 117,477 | 106,485 | 106,485 | 137,081 | |||||||||||||||||||||||||||||||
Interest expense, net(3) | (69,409 | ) | (72,929 | ) | (72,929 | ) | (62,967 | ) | |||||||||||||||||||||||||||
Interest rate swap breakage fees(3) | (5,528 | ) | (8,776 | ) | (8,776 | ) | — | ||||||||||||||||||||||||||||
Non-cash derivative losses recorded in interest expense(3) | 11,473 | 13,722 | 13,722 | — | |||||||||||||||||||||||||||||||
Amortization of debt financing costs(3) | 2,984 | 3,144 | 3,144 | 2,613 | |||||||||||||||||||||||||||||||
| Provision for income taxes, net of changes in deferred taxes | (1,486 | ) | (190 | ) | (190 | ) | (7,950 | ) | |||||||||||||||||||||||||||
| Changes in working capital | (1,476 | ) | 9,474 | 9,474 | 4,351 | ||||||||||||||||||||||||||||||
| Cash provided by operating activities | 54,035 | 50,930 | 50,930 | 73,128 | |||||||||||||||||||||||||||||||
| Changes in working capital | 1,476 | (9,474 | ) | (9,474 | ) | (4,351 | ) | ||||||||||||||||||||||||||||
| Maintenance capital expenditures | (7,027 | ) | (4,513 | ) | (4,513 | ) | (7,655 | ) | |||||||||||||||||||||||||||
| Free cash flow | 48,484 | 36,943 | 11,541 | 31.2 | 36,943 | 61,122 | (24,179 | ) | (39.6 | ) | |||||||||||||||||||||||||
The leverage covenant for Atlantic Aviation steps down on March 31, 2010 from 8.25x to 8.00x trailing twelve month EBIDTA, as defined by the terms of the debt facility. Given the performance of the business of the last three quarters of 2009, the business needs to achieve an EBITDA of approximately $24.0 million to remain covenant compliant in the first quarter of 2010. In the first quarter of 2009, EBITDA was $25.0 million. Since that time, take-offs and landings have sequentially improved by 14.4% and we have reduced our costs by 9.4%. The fourth quarter EBITDA was $26.6 million. Accordingly, we remain confident of being covenant compliant when the covenant steps down on March 31, 2010 unless there is some external shock to the industry or sudden decline in general aviation activity.
After March 31, 2010, the covenant then steps down every subsequent March until and including March 2014. Volatility in the general aviation sector in the last 18 months makes it difficult to project future take-off and landings with any degree of confidence. However, given the recent business jet traffic trajectory, and assuming no external shock to the industry, we believe that cash generation from the business will be sufficient to meet debt service obligations and the business will remain in compliance with financial covenants through the maturity of the business’ debt without any further equity contribution from MIC. Additionally, we anticipate further cost reductions which will be accelerated in an event of a decline in business activity.
| Year Ended December 31, | ||||||||||||||||
| 2009 | 2008 | Change Favorable/(Unfavorable) | ||||||||||||||
| $ | $ | $ | % | |||||||||||||
| ($ In Thousands) (Unaudited) | ||||||||||||||||
| Revenue | ||||||||||||||||
| Fuel revenue | 314,603 | 494,810 | (180,207 | ) | (36.4 | ) | ||||||||||
| Non-fuel revenue | 171,546 | 221,492 | (49,946 | ) | (22.5 | ) | ||||||||||
| Total revenue | 486,149 | 716,302 | (230,153 | ) | (32.1 | ) | ||||||||||
| Cost of revenue | ||||||||||||||||
| Cost of revenue – fuel | 184,853 | 342,102 | 157,249 | 46.0 | ||||||||||||
| Cost of revenue – non-fuel | 14,314 | 32,198 | 17,884 | 55.5 | ||||||||||||
| Total cost of revenue | 199,167 | 374,300 | 175,133 | 46.8 | ||||||||||||
| Fuel gross profit | 129,750 | 152,708 | (22,958 | ) | (15.0 | ) | ||||||||||
| Non-fuel gross profit | 157,232 | 189,294 | (32,062 | ) | (16.9 | ) | ||||||||||
| Gross profit | 286,982 | 342,002 | (55,020 | ) | (16.1 | ) | ||||||||||
| Selling, general and administrative expenses(1) | 179,949 | 205,304 | 25,355 | 12.3 | ||||||||||||
| Goodwill impairment | 71,200 | 52,000 | (19,200 | ) | (36.9 | ) | ||||||||||
| Depreciation and amortization | 89,508 | 93,903 | 4,395 | 4.7 | ||||||||||||
| Operating loss | (53,675 | ) | (9,205 | ) | (44,470 | ) | NM | |||||||||
| Interest expense, net | (67,983 | ) | (62,967 | ) | (5,016 | ) | (8.0 | ) | ||||||||
| Other expense | (1,451 | ) | (241 | ) | (1,210 | ) | NM | |||||||||
| Unrealized losses on derivative instruments | (28,277 | ) | (1,871 | ) | (26,406 | ) | NM | |||||||||
| Benefit for income taxes | 61,009 | 29,936 | 31,073 | 103.8 | ||||||||||||
| Net loss(2) | (90,377 | ) | (44,348 | ) | (46,029 | ) | (103.8 | ) | ||||||||
| Reconciliation of net loss to EBITDA excluding non-cash items: | ||||||||||||||||
| Net loss(2) | (90,377 | ) | (44,348 | ) | ||||||||||||
| Interest expense, net | 67,983 | 62,967 | ||||||||||||||
| Benefit for income taxes | (61,009 | ) | (29,936 | ) | ||||||||||||
| Depreciation and amortization | 89,508 | 93,903 | ||||||||||||||
| Goodwill impairment | 71,200 | 52,000 | ||||||||||||||
| Unrealized losses on derivative instruments | 28,277 | 1,871 | ||||||||||||||
| Other non-cash expenses | 903 | 624 | ||||||||||||||
| EBITDA excluding non-cash items | 106,485 | 137,081 | (30,596 | ) | (22.3 | ) | ||||||||||
| EBITDA excluding non-cash items | 106,485 | 137,081 | ||||||||||||||
| Interest expense, net | (67,983 | ) | (62,967 | ) | ||||||||||||
| Amortization of debt financing costs | 3,144 | 2,613 | ||||||||||||||
| Benefit for income taxes, net of changes in deferred taxes | (190 | ) | (7,950 | ) | ||||||||||||
| Changes in working capital | 9,474 | 4,351 | ||||||||||||||
| Cash provided by operating activities | 50,930 | 73,128 | ||||||||||||||
| Changes in working capital | (9,474 | ) | (4,351 | ) | ||||||||||||
| Maintenance capital expenditures | (4,513 | ) | (7,655 | ) | ||||||||||||
| Free cash flow | 36,943 | 61,122 | (24,179 | ) | (39.6 | ) | ||||||||||
NM — Not meaningful
| (1) | Reclassified to conform to current period presentation. |
| (2) | Includes $2.4 million increase in the bad debt reserve in the first quarter of 2009 due to the deterioration of accounts receivable aging. |
| (3) | Interest expense, net, includes non-cash losses on derivative instruments, non-cash amortization of deferred financing fees and interest rate swap breakage fees. |
| (4) | Corporate allocation expense and the federal tax effect have been excluded from the above table as they are eliminated on consolidation at the MIC Inc. level. |
| Year Ended December 31, | |||||||||||||||||||
|---|---|---|---|---|---|---|---|---|---|---|---|---|---|---|---|---|---|---|---|
| 2010 | 2009 | Change Favorable/(Unfavorable) | |||||||||||||||||
| $ | $ | $ | % | ||||||||||||||||
| ($ In Thousands) | |||||||||||||||||||
| Interest income | (17 | ) | (89 | ) | (72 | ) | (80.9 | ) | |||||||||||
| Interest paid on debt facility | 54,616 | 57,213 | 2,597 | 4.5 | |||||||||||||||
| Amortization of deferred financing costs | 2,984 | 3,144 | 160 | 5.1 | |||||||||||||||
| Non-cash losses on derivative instruments | 11,473 | 13,722 | 2,249 | 16.4 | |||||||||||||||
| Less: capitalized interest | 353 | (1,061 | ) | (1,414 | ) | (133.3 | ) | ||||||||||||
| Total interest expense, net | 69,409 | 72,929 | 3,520 | 4.8 | |||||||||||||||
| Year Ended December 31, | |||||||||||||||||||
|---|---|---|---|---|---|---|---|---|---|---|---|---|---|---|---|---|---|---|---|
| 2009 | 2008 | Change Favorable/(Unfavorable) | |||||||||||||||||
| $ | $ | $ | % | ||||||||||||||||
| ($ In Thousands) | |||||||||||||||||||
| Interest income | (89 | ) | (576 | ) | (487 | ) | (84.5 | ) | |||||||||||
| Interest paid on debt facility | 57,213 | 62,622 | 5,409 | 8.6 | |||||||||||||||
| Amortization of deferred financing costs | 3,144 | 2,613 | (531 | ) | (20.3 | ) | |||||||||||||
| Non-cash losses on derivative instruments | 13,722 | — | (13,722 | ) | NM | ||||||||||||||
| Less: capitalized interest | (1,061 | ) | (1,692 | ) | (631 | ) | (37.3 | ) | |||||||||||
| Total interest expense, net | 72,929 | 62,967 | (9,962 | ) | (15.8 | ) | |||||||||||||
For purposes of determining book and taxable income, depreciation of fixed assets and amortization of intangibles are calculated differently, with additional differences between federal and state taxable income.
The business has approximately $45.0 million of state NOL carryforwards. State NOL carryforwards are specific to the state in which the NOL was generated and various states impose limitations on the utilization of NOL carryforwards. Therefore, the business may incur state income tax liabilities in the near future, even if consolidated state taxable income is less than $45.0 million.
The following section summarizes the historical consolidated financial performance of Atlantic Aviation for the years ended December 31, 2008 and 2007.
The acquisition column and the total 2008 results in the table below include the operating results for:
| Year Ended December 31, | ||||||||||||||||||||||||||||||||||||||||||||||||||||||||||||||||||||||||||||||||||||||||||||||||||||||||||||||||||||||||||||||||||||||||||||||||||||||||||||||||||||||||||||||||||||||||||||||||||||||||||||||||||||||||||||||||||||||||||||||||||||||||||||||||||||||||||||||||||||||||||||||||||||||||||||||||||||||||||||||||||||||||||||||||||||||||||||||||||||||||||||||||||||||||||||||||||||||||||||
| Existing Locations(2) | Total | |||||||||||||||||||||||||||||||||||||||||||||||||||||||||||||||||||||||||||||||||||||||||||||||||||||||||||||||||||||||||||||||||||||||||||||||||||||||||||||||||||||||||||||||||||||||||||||||||||||||||||||||||||||||||||||||||||||||||||||||||||||||||||||||||||||||||||||||||||||||||||||||||||||||||||||||||||||||||||||||||||||||||||||||||||||||||||||||||||||||||||||||||||||||||||||||||||||||||||
| 2008 | 2007 | Change Favorable/ (Unfavorable) | Acquisitions(3) | 2008 | 2007 | Change Favorable/ (Unfavorable) | ||||||||||||||||||||||||||||||||||||||||||||||||||||||||||||||||||||||||||||||||||||||||||||||||||||||||||||||||||||||||||||||||||||||||||||||||||||||||||||||||||||||||||||||||||||||||||||||||||||||||||||||||||||||||||||||||||||||||||||||||||||||||||||||||||||||||||||||||||||||||||||||||||||||||||||||||||||||||||||||||||||||||||||||||||||||||||||||||||||||||||||||||||||||||||||||||||||||
| $ | $ | $ | % | $ | $ | $ | $ | % | ||||||||||||||||||||||||||||||||||||||||||||||||||||||||||||||||||||||||||||||||||||||||||||||||||||||||||||||||||||||||||||||||||||||||||||||||||||||||||||||||||||||||||||||||||||||||||||||||||||||||||||||||||||||||||||||||||||||||||||||||||||||||||||||||||||||||||||||||||||||||||||||||||||||||||||||||||||||||||||||||||||||||||||||||||||||||||||||||||||||||||||||||||||||||||||||||||||
| ($ In Thousands) (Unaudited) | ||||||||||||||||||||||||||||||||||||||||||||||||||||||||||||||||||||||||||||||||||||||||||||||||||||||||||||||||||||||||||||||||||||||||||||||||||||||||||||||||||||||||||||||||||||||||||||||||||||||||||||||||||||||||||||||||||||||||||||||||||||||||||||||||||||||||||||||||||||||||||||||||||||||||||||||||||||||||||||||||||||||||||||||||||||||||||||||||||||||||||||||||||||||||||||||||||||||||||||
| Revenue | ||||||||||||||||||||||||||||||||||||||||||||||||||||||||||||||||||||||||||||||||||||||||||||||||||||||||||||||||||||||||||||||||||||||||||||||||||||||||||||||||||||||||||||||||||||||||||||||||||||||||||||||||||||||||||||||||||||||||||||||||||||||||||||||||||||||||||||||||||||||||||||||||||||||||||||||||||||||||||||||||||||||||||||||||||||||||||||||||||||||||||||||||||||||||||||||||||||||||||||
| Fuel revenue | 365,262 | 371,250 | (5,988 | ) | (1.6 | ) | 129,548 | 494,810 | 371,250 | 123,560 | 33.3 | |||||||||||||||||||||||||||||||||||||||||||||||||||||||||||||||||||||||||||||||||||||||||||||||||||||||||||||||||||||||||||||||||||||||||||||||||||||||||||||||||||||||||||||||||||||||||||||||||||||||||||||||||||||||||||||||||||||||||||||||||||||||||||||||||||||||||||||||||||||||||||||||||||||||||||||||||||||||||||||||||||||||||||||||||||||||||||||||||||||||||||||||||||||||||||||||||
| Non-fuel revenue | 157,923 | 163,086 | (5,163 | ) | (3.2 | ) | 63,569 | 221,492 | 163,086 | 58,406 | 35.8 | |||||||||||||||||||||||||||||||||||||||||||||||||||||||||||||||||||||||||||||||||||||||||||||||||||||||||||||||||||||||||||||||||||||||||||||||||||||||||||||||||||||||||||||||||||||||||||||||||||||||||||||||||||||||||||||||||||||||||||||||||||||||||||||||||||||||||||||||||||||||||||||||||||||||||||||||||||||||||||||||||||||||||||||||||||||||||||||||||||||||||||||||||||||||||||||||||
| Total revenue | 523,185 | 534,336 | (11,151 | ) | (2.1 | ) | 193,117 | 716,302 | 534,336 | 181,966 | 34.1 | |||||||||||||||||||||||||||||||||||||||||||||||||||||||||||||||||||||||||||||||||||||||||||||||||||||||||||||||||||||||||||||||||||||||||||||||||||||||||||||||||||||||||||||||||||||||||||||||||||||||||||||||||||||||||||||||||||||||||||||||||||||||||||||||||||||||||||||||||||||||||||||||||||||||||||||||||||||||||||||||||||||||||||||||||||||||||||||||||||||||||||||||||||||||||||||||||
| Cost of revenue | ||||||||||||||||||||||||||||||||||||||||||||||||||||||||||||||||||||||||||||||||||||||||||||||||||||||||||||||||||||||||||||||||||||||||||||||||||||||||||||||||||||||||||||||||||||||||||||||||||||||||||||||||||||||||||||||||||||||||||||||||||||||||||||||||||||||||||||||||||||||||||||||||||||||||||||||||||||||||||||||||||||||||||||||||||||||||||||||||||||||||||||||||||||||||||||||||||||||||||||
| Cost of revenue-fuel | 251,084 | 237,112 | (13,972 | ) | (5.9 | ) | 91,018 | 342,102 | 237,112 | (104,990 | ) | (44.3 | ) | |||||||||||||||||||||||||||||||||||||||||||||||||||||||||||||||||||||||||||||||||||||||||||||||||||||||||||||||||||||||||||||||||||||||||||||||||||||||||||||||||||||||||||||||||||||||||||||||||||||||||||||||||||||||||||||||||||||||||||||||||||||||||||||||||||||||||||||||||||||||||||||||||||||||||||||||||||||||||||||||||||||||||||||||||||||||||||||||||||||||||||||||||||||||||||||||
| Cost of revenue-non-fuel | 16,420 | 20,568 | 4,148 | 20.2 | 15,778 | 32,198 | 20,568 | (11,630 | ) | (56.5 | ) | |||||||||||||||||||||||||||||||||||||||||||||||||||||||||||||||||||||||||||||||||||||||||||||||||||||||||||||||||||||||||||||||||||||||||||||||||||||||||||||||||||||||||||||||||||||||||||||||||||||||||||||||||||||||||||||||||||||||||||||||||||||||||||||||||||||||||||||||||||||||||||||||||||||||||||||||||||||||||||||||||||||||||||||||||||||||||||||||||||||||||||||||||||||||||||||||||
| Total cost of revenue | 267,504 | 257,680 | (9,824 | ) | (3.8 | ) | 106,796 | 374,300 | 257,680 | (116,620 | ) | (45.3 | ) | |||||||||||||||||||||||||||||||||||||||||||||||||||||||||||||||||||||||||||||||||||||||||||||||||||||||||||||||||||||||||||||||||||||||||||||||||||||||||||||||||||||||||||||||||||||||||||||||||||||||||||||||||||||||||||||||||||||||||||||||||||||||||||||||||||||||||||||||||||||||||||||||||||||||||||||||||||||||||||||||||||||||||||||||||||||||||||||||||||||||||||||||||||||||||||||||
| Fuel gross profit | 114,178 | 134,138 | (19,960 | ) | (14.9 | ) | 38,530 | 152,708 | 134,138 | 18,570 | 13.8 | |||||||||||||||||||||||||||||||||||||||||||||||||||||||||||||||||||||||||||||||||||||||||||||||||||||||||||||||||||||||||||||||||||||||||||||||||||||||||||||||||||||||||||||||||||||||||||||||||||||||||||||||||||||||||||||||||||||||||||||||||||||||||||||||||||||||||||||||||||||||||||||||||||||||||||||||||||||||||||||||||||||||||||||||||||||||||||||||||||||||||||||||||||||||||||||||||
| Non-fuel gross profit | 141,503 | 142,518 | (1,015 | ) | (0.7 | ) | �� | 47,791 | 189,294 | 142,518 | 46,776 | 32.8 | ||||||||||||||||||||||||||||||||||||||||||||||||||||||||||||||||||||||||||||||||||||||||||||||||||||||||||||||||||||||||||||||||||||||||||||||||||||||||||||||||||||||||||||||||||||||||||||||||||||||||||||||||||||||||||||||||||||||||||||||||||||||||||||||||||||||||||||||||||||||||||||||||||||||||||||||||||||||||||||||||||||||||||||||||||||||||||||||||||||||||||||||||||||||||||||||||
| Gross profit | 255,681 | 276,656 | (20,975 | ) | (7.6 | ) | 86,321 | 342,002 | 276,656 | 65,346 | 23.6 | |||||||||||||||||||||||||||||||||||||||||||||||||||||||||||||||||||||||||||||||||||||||||||||||||||||||||||||||||||||||||||||||||||||||||||||||||||||||||||||||||||||||||||||||||||||||||||||||||||||||||||||||||||||||||||||||||||||||||||||||||||||||||||||||||||||||||||||||||||||||||||||||||||||||||||||||||||||||||||||||||||||||||||||||||||||||||||||||||||||||||||||||||||||||||||||||||
| Selling, general and administrative expenses | 148,546 | 155,474 | 6,928 | 4.5 | 56,758 | 205,304 | 155,474 | (49,830 | ) | (32.1 | ) | |||||||||||||||||||||||||||||||||||||||||||||||||||||||||||||||||||||||||||||||||||||||||||||||||||||||||||||||||||||||||||||||||||||||||||||||||||||||||||||||||||||||||||||||||||||||||||||||||||||||||||||||||||||||||||||||||||||||||||||||||||||||||||||||||||||||||||||||||||||||||||||||||||||||||||||||||||||||||||||||||||||||||||||||||||||||||||||||||||||||||||||||||||||||||||||||||
| Goodwill impairment | 51,473 | — | (51,473 | ) | NM | 527 | 52,000 | — | (52,000 | ) | NM | |||||||||||||||||||||||||||||||||||||||||||||||||||||||||||||||||||||||||||||||||||||||||||||||||||||||||||||||||||||||||||||||||||||||||||||||||||||||||||||||||||||||||||||||||||||||||||||||||||||||||||||||||||||||||||||||||||||||||||||||||||||||||||||||||||||||||||||||||||||||||||||||||||||||||||||||||||||||||||||||||||||||||||||||||||||||||||||||||||||||||||||||||||||||||||||||||
| Depreciation and amortization | 77,271 | 44,753 | (32,518 | ) | (72.7 | ) | 16,632 | 93,903 | 44,753 | (49,150 | ) | (109.8 | ) | |||||||||||||||||||||||||||||||||||||||||||||||||||||||||||||||||||||||||||||||||||||||||||||||||||||||||||||||||||||||||||||||||||||||||||||||||||||||||||||||||||||||||||||||||||||||||||||||||||||||||||||||||||||||||||||||||||||||||||||||||||||||||||||||||||||||||||||||||||||||||||||||||||||||||||||||||||||||||||||||||||||||||||||||||||||||||||||||||||||||||||||||||||||||||||||||
| Operating (loss) income | (21,609 | ) | 76,429 | (98,038 | ) | (128.3 | ) | 12,404 | (9,205 | ) | 76,429 | (85,634 | ) | (112.0 | ) | |||||||||||||||||||||||||||||||||||||||||||||||||||||||||||||||||||||||||||||||||||||||||||||||||||||||||||||||||||||||||||||||||||||||||||||||||||||||||||||||||||||||||||||||||||||||||||||||||||||||||||||||||||||||||||||||||||||||||||||||||||||||||||||||||||||||||||||||||||||||||||||||||||||||||||||||||||||||||||||||||||||||||||||||||||||||||||||||||||||||||||||||||||||||||||||
| Interest expense, net | (45,847 | ) | (42,559 | ) | (3,288 | ) | (7.7 | ) | (17,120 | ) | (62,967 | ) | (42,559 | ) | (20,408 | ) | (48.0 | ) | ||||||||||||||||||||||||||||||||||||||||||||||||||||||||||||||||||||||||||||||||||||||||||||||||||||||||||||||||||||||||||||||||||||||||||||||||||||||||||||||||||||||||||||||||||||||||||||||||||||||||||||||||||||||||||||||||||||||||||||||||||||||||||||||||||||||||||||||||||||||||||||||||||||||||||||||||||||||||||||||||||||||||||||||||||||||||||||||||||||||||||||||||||||||||||
| Loss on extinguishment of debt | - | (9,804 | ) | 9,804 | NM | - | - | (9,804 | ) | 9,804 | NM | |||||||||||||||||||||||||||||||||||||||||||||||||||||||||||||||||||||||||||||||||||||||||||||||||||||||||||||||||||||||||||||||||||||||||||||||||||||||||||||||||||||||||||||||||||||||||||||||||||||||||||||||||||||||||||||||||||||||||||||||||||||||||||||||||||||||||||||||||||||||||||||||||||||||||||||||||||||||||||||||||||||||||||||||||||||||||||||||||||||||||||||||||||||||||||||||||
| Other (expense) income | (323 | ) | (775 | ) | 452 | 58.3 | 82 | (241 | ) | (775 | ) | 534 | 68.9 | |||||||||||||||||||||||||||||||||||||||||||||||||||||||||||||||||||||||||||||||||||||||||||||||||||||||||||||||||||||||||||||||||||||||||||||||||||||||||||||||||||||||||||||||||||||||||||||||||||||||||||||||||||||||||||||||||||||||||||||||||||||||||||||||||||||||||||||||||||||||||||||||||||||||||||||||||||||||||||||||||||||||||||||||||||||||||||||||||||||||||||||||||||||||||||||||
| Unrealized losses on derivative instruments | (1,709 | ) | (1,659 | ) | (50 | ) | (3.0 | ) | (162 | ) | (1,871 | ) | (1,659 | ) | (212 | ) | (12.8 | ) | ||||||||||||||||||||||||||||||||||||||||||||||||||||||||||||||||||||||||||||||||||||||||||||||||||||||||||||||||||||||||||||||||||||||||||||||||||||||||||||||||||||||||||||||||||||||||||||||||||||||||||||||||||||||||||||||||||||||||||||||||||||||||||||||||||||||||||||||||||||||||||||||||||||||||||||||||||||||||||||||||||||||||||||||||||||||||||||||||||||||||||||||||||||||||||
| Benefit (provision) for income taxes | 28,003 | (8,575 | ) | 36,578 | NM | 1,933 | 29,936 | (8,575 | ) | 38,511 | NM | |||||||||||||||||||||||||||||||||||||||||||||||||||||||||||||||||||||||||||||||||||||||||||||||||||||||||||||||||||||||||||||||||||||||||||||||||||||||||||||||||||||||||||||||||||||||||||||||||||||||||||||||||||||||||||||||||||||||||||||||||||||||||||||||||||||||||||||||||||||||||||||||||||||||||||||||||||||||||||||||||||||||||||||||||||||||||||||||||||||||||||||||||||||||||||||||||
| Net (loss) income(1) | (41,485 | ) | 13,057 | (54,542 | ) | NM | (2,863 | ) | (44,348 | ) | 13,057 | (57,405 | ) | NM | ||||||||||||||||||||||||||||||||||||||||||||||||||||||||||||||||||||||||||||||||||||||||||||||||||||||||||||||||||||||||||||||||||||||||||||||||||||||||||||||||||||||||||||||||||||||||||||||||||||||||||||||||||||||||||||||||||||||||||||||||||||||||||||||||||||||||||||||||||||||||||||||||||||||||||||||||||||||||||||||||||||||||||||||||||||||||||||||||||||||||||||||||||||||||||||||
| Reconciliation of net (loss) income to EBITDA excluding non-cash items: | ||||||||||||||||||||||||||||||||||||||||||||||||||||||||||||||||||||||||||||||||||||||||||||||||||||||||||||||||||||||||||||||||||||||||||||||||||||||||||||||||||||||||||||||||||||||||||||||||||||||||||||||||||||||||||||||||||||||||||||||||||||||||||||||||||||||||||||||||||||||||||||||||||||||||||||||||||||||||||||||||||||||||||||||||||||||||||||||||||||||||||||||||||||||||||||||||||||||||||||
| Net (loss) income(1) | (41,485 | ) | 13,057 | (2,863 | ) | (44,348 | ) | 13,057 | ||||||||||||||||||||||||||||||||||||||||||||||||||||||||||||||||||||||||||||||||||||||||||||||||||||||||||||||||||||||||||||||||||||||||||||||||||||||||||||||||||||||||||||||||||||||||||||||||||||||||||||||||||||||||||||||||||||||||||||||||||||||||||||||||||||||||||||||||||||||||||||||||||||||||||||||||||||||||||||||||||||||||||||||||||||||||||||||||||||||||||||||||||||||||||||||||||||
| Interest expense, net | 45,847 | 42,559 | 17,120 | 62,967 | 42,559 | |||||||||||||||||||||||||||||||||||||||||||||||||||||||||||||||||||||||||||||||||||||||||||||||||||||||||||||||||||||||||||||||||||||||||||||||||||||||||||||||||||||||||||||||||||||||||||||||||||||||||||||||||||||||||||||||||||||||||||||||||||||||||||||||||||||||||||||||||||||||||||||||||||||||||||||||||||||||||||||||||||||||||||||||||||||||||||||||||||||||||||||||||||||||||||||||||||||||
| (Benefit) provision for income taxes | (28,003 | ) | 8,575 | (1,933 | ) | (29,936 | ) | 8,575 | ||||||||||||||||||||||||||||||||||||||||||||||||||||||||||||||||||||||||||||||||||||||||||||||||||||||||||||||||||||||||||||||||||||||||||||||||||||||||||||||||||||||||||||||||||||||||||||||||||||||||||||||||||||||||||||||||||||||||||||||||||||||||||||||||||||||||||||||||||||||||||||||||||||||||||||||||||||||||||||||||||||||||||||||||||||||||||||||||||||||||||||||||||||||||||||||||||||
| Depreciation and amortization | 77,271 | 44,753 | 16,632 | 93,903 | 44,753 | |||||||||||||||||||||||||||||||||||||||||||||||||||||||||||||||||||||||||||||||||||||||||||||||||||||||||||||||||||||||||||||||||||||||||||||||||||||||||||||||||||||||||||||||||||||||||||||||||||||||||||||||||||||||||||||||||||||||||||||||||||||||||||||||||||||||||||||||||||||||||||||||||||||||||||||||||||||||||||||||||||||||||||||||||||||||||||||||||||||||||||||||||||||||||||||||||||||||
| Goodwill impairment | 51,473 | — | 527 | 52,000 | — | |||||||||||||||||||||||||||||||||||||||||||||||||||||||||||||||||||||||||||||||||||||||||||||||||||||||||||||||||||||||||||||||||||||||||||||||||||||||||||||||||||||||||||||||||||||||||||||||||||||||||||||||||||||||||||||||||||||||||||||||||||||||||||||||||||||||||||||||||||||||||||||||||||||||||||||||||||||||||||||||||||||||||||||||||||||||||||||||||||||||||||||||||||||||||||||||||||||||
| Non-cash loss on extinguishment of debt | — | 9,804 | — | — | 9,804 | |||||||||||||||||||||||||||||||||||||||||||||||||||||||||||||||||||||||||||||||||||||||||||||||||||||||||||||||||||||||||||||||||||||||||||||||||||||||||||||||||||||||||||||||||||||||||||||||||||||||||||||||||||||||||||||||||||||||||||||||||||||||||||||||||||||||||||||||||||||||||||||||||||||||||||||||||||||||||||||||||||||||||||||||||||||||||||||||||||||||||||||||||||||||||||||||||||||||
| Unrealized losses on derivative instruments | 1,709 | 1,659 | 162 | 1,871 | 1,659 | |||||||||||||||||||||||||||||||||||||||||||||||||||||||||||||||||||||||||||||||||||||||||||||||||||||||||||||||||||||||||||||||||||||||||||||||||||||||||||||||||||||||||||||||||||||||||||||||||||||||||||||||||||||||||||||||||||||||||||||||||||||||||||||||||||||||||||||||||||||||||||||||||||||||||||||||||||||||||||||||||||||||||||||||||||||||||||||||||||||||||||||||||||||||||||||||||||||||
| Other non-cash expenses (income) | 722 | (556 | ) | (98 | ) | 624 | (556 | ) | ||||||||||||||||||||||||||||||||||||||||||||||||||||||||||||||||||||||||||||||||||||||||||||||||||||||||||||||||||||||||||||||||||||||||||||||||||||||||||||||||||||||||||||||||||||||||||||||||||||||||||||||||||||||||||||||||||||||||||||||||||||||||||||||||||||||||||||||||||||||||||||||||||||||||||||||||||||||||||||||||||||||||||||||||||||||||||||||||||||||||||||||||||||||||||||||||||||
| EBITDA excluding non-cash items | 107,534 | 119,851 | (12,317 | ) | (10.3 | ) | 29,547 | 137,081 | 119,851 | 17,230 | 14.4 | |||||||||||||||||||||||||||||||||||||||||||||||||||||||||||||||||||||||||||||||||||||||||||||||||||||||||||||||||||||||||||||||||||||||||||||||||||||||||||||||||||||||||||||||||||||||||||||||||||||||||||||||||||||||||||||||||||||||||||||||||||||||||||||||||||||||||||||||||||||||||||||||||||||||||||||||||||||||||||||||||||||||||||||||||||||||||||||||||||||||||||||||||||||||||||||||||
| EBITDA excluding non-cash items | 107,534 | 119,851 | 29,547 | 137,081 | 119,851 | |||||||||||||||||||||||||||||||||||||||||||||||||||||||||||||||||||||||||||||||||||||||||||||||||||||||||||||||||||||||||||||||||||||||||||||||||||||||||||||||||||||||||||||||||||||||||||||||||||||||||||||||||||||||||||||||||||||||||||||||||||||||||||||||||||||||||||||||||||||||||||||||||||||||||||||||||||||||||||||||||||||||||||||||||||||||||||||||||||||||||||||||||||||||||||||||||||||||
| Interest expense, net | (45,847 | ) | (42,559 | ) | (17,120 | ) | (62,967 | ) | (42,559 | ) | ||||||||||||||||||||||||||||||||||||||||||||||||||||||||||||||||||||||||||||||||||||||||||||||||||||||||||||||||||||||||||||||||||||||||||||||||||||||||||||||||||||||||||||||||||||||||||||||||||||||||||||||||||||||||||||||||||||||||||||||||||||||||||||||||||||||||||||||||||||||||||||||||||||||||||||||||||||||||||||||||||||||||||||||||||||||||||||||||||||||||||||||||||||||||||||||||||
| Amortization of debt financing costs | 2,444 | 2,554 | 169 | 2,613 | 2,554 | |||||||||||||||||||||||||||||||||||||||||||||||||||||||||||||||||||||||||||||||||||||||||||||||||||||||||||||||||||||||||||||||||||||||||||||||||||||||||||||||||||||||||||||||||||||||||||||||||||||||||||||||||||||||||||||||||||||||||||||||||||||||||||||||||||||||||||||||||||||||||||||||||||||||||||||||||||||||||||||||||||||||||||||||||||||||||||||||||||||||||||||||||||||||||||||||||||||||
| Benefit/provision for income taxes, net of changes in deferred taxes | (7,437 | ) | (8,435 | ) | (513 | ) | (7,950 | ) | (8,435 | ) | ||||||||||||||||||||||||||||||||||||||||||||||||||||||||||||||||||||||||||||||||||||||||||||||||||||||||||||||||||||||||||||||||||||||||||||||||||||||||||||||||||||||||||||||||||||||||||||||||||||||||||||||||||||||||||||||||||||||||||||||||||||||||||||||||||||||||||||||||||||||||||||||||||||||||||||||||||||||||||||||||||||||||||||||||||||||||||||||||||||||||||||||||||||||||||||||||||
| Changes in working capital | 4,070 | 13,912 | 281 | 4,351 | 13,912 | |||||||||||||||||||||||||||||||||||||||||||||||||||||||||||||||||||||||||||||||||||||||||||||||||||||||||||||||||||||||||||||||||||||||||||||||||||||||||||||||||||||||||||||||||||||||||||||||||||||||||||||||||||||||||||||||||||||||||||||||||||||||||||||||||||||||||||||||||||||||||||||||||||||||||||||||||||||||||||||||||||||||||||||||||||||||||||||||||||||||||||||||||||||||||||||||||||||||
| Cash provided by operating activities | 60,764 | 85,323 | 12,364 | 73,128 | 85,323 | |||||||||||||||||||||||||||||||||||||||||||||||||||||||||||||||||||||||||||||||||||||||||||||||||||||||||||||||||||||||||||||||||||||||||||||||||||||||||||||||||||||||||||||||||||||||||||||||||||||||||||||||||||||||||||||||||||||||||||||||||||||||||||||||||||||||||||||||||||||||||||||||||||||||||||||||||||||||||||||||||||||||||||||||||||||||||||||||||||||||||||||||||||||||||||||||||||||||
| Changes in working capital | (4,070 | ) | (13,912 | ) | (281 | ) | (4,351 | ) | (13,912 | ) | ||||||||||||||||||||||||||||||||||||||||||||||||||||||||||||||||||||||||||||||||||||||||||||||||||||||||||||||||||||||||||||||||||||||||||||||||||||||||||||||||||||||||||||||||||||||||||||||||||||||||||||||||||||||||||||||||||||||||||||||||||||||||||||||||||||||||||||||||||||||||||||||||||||||||||||||||||||||||||||||||||||||||||||||||||||||||||||||||||||||||||||||||||||||||||||||||||
| Maintenance capital expenditures | (7,161 | ) | (8,628 | ) | (494 | ) | (7,655 | ) | (8,628 | ) | ||||||||||||||||||||||||||||||||||||||||||||||||||||||||||||||||||||||||||||||||||||||||||||||||||||||||||||||||||||||||||||||||||||||||||||||||||||||||||||||||||||||||||||||||||||||||||||||||||||||||||||||||||||||||||||||||||||||||||||||||||||||||||||||||||||||||||||||||||||||||||||||||||||||||||||||||||||||||||||||||||||||||||||||||||||||||||||||||||||||||||||||||||||||||||||||||||
| Free cash flow | 49,533 | 62,783 | (13,250 | ) | (21.1 | ) | 11,589 | 61,122 | 62,783 | (1,661 | ) | (2.6 | ) | |||||||||||||||||||||||||||||||||||||||||||||||||||||||||||||||||||||||||||||||||||||||||||||||||||||||||||||||||||||||||||||||||||||||||||||||||||||||||||||||||||||||||||||||||||||||||||||||||||||||||||||||||||||||||||||||||||||||||||||||||||||||||||||||||||||||||||||||||||||||||||||||||||||||||||||||||||||||||||||||||||||||||||||||||||||||||||||||||||||||||||||||||||||||||||||||
NM — Not meaningful
The growth in gross profit at all sites was primarily due to the inclusion of the results of sites acquired in 2007 and 2008. Gross profit at existing locations decreased mainly due to lower fuel volume resulting from lower general aviation activity (declines of 17.8% and 8.7% for the quarter and the year, respectively) and lower average general aviation fuel margins. Gross profit from other services at existing locations increased by 2.8% in 2008 as a result of higher de-icing revenue and hangar rentals in the first half of the year. For the quarter ended December 31, 2008, gross profit from other services declined as a result of lower general aviation traffic.
We attribute the volume decline primarily to a decrease in general aviation transient traffic. We believe the decline in transient traffic is due primarily to overall soft economic conditions. The slowing economy has contributed to a general decrease in corporate activity and reduction in business-related general aviation activity.
While the business seeks to maintain or increase a dollar-based margin per gallon backed by a premium services offering, increased fuel prices that peaked in mid-2008 led to an increased focus on cost by some of our customers. These customers negotiated more aggressively on fuel purchases and contributed to a decrease in our average margins through the third quarter. Declining fuel price in the fourth quarter had a favorable impact on average fuel margins. In addition, some competitors are pursuing more aggressive pricing strategies that have also contributed to increased margin pressure.
The decrease in selling, general and administrative expenses at existing locations for the year ended December 31, 2008 is due primarily to cost efficiencies resulting from integration of recently acquired businesses and management’s actions to streamline our cost structure in response to the decline in gross profit resulting from the overall slowing of the economy. For the quarter ended December 31, 2008, selling, general and administrative expenses decreased at existing locations by $6.8 million or, 12.7%, primarily as a result of the cost reduction initiatives. Declining fuel prices contributed approximately $842,000 to the decrease in operating costs in the fourth quarter due to a reduction in credit card fees. The majority of the ongoing savings were fully realized during the third quarter and therefore are not completely reflected in the full year results.
Atlantic Aviation performed an annual impairment test during the fourth quarter of 2008. Goodwill is considered impaired when the carrying amount of a reporting unit’s goodwill exceeds its implied fair value, as determined under a two-step approach. Based on the testing performed, the business recognized a goodwill impairment charge of $52.0 million during 2008.
The increase in depreciation and amortization expense was due to non-cash impairment charges of $21.7 million related to contractual arrangements and $13.8 million related to property, equipment, land and leasehold improvements recorded during the fourth quarter of 2008. Amortization expense in 2007 included a $1.3 million non-cash impairment charge relating to airport management contracts business, which was subsequently sold in 2008.
The increase in interest expense in 2008 is due to the increased debt levels used to finance a portion of our 2007 acquisitions and growth capital expenditures, as well as the refinancing of the business’ debt facilities in October 2007. The refinancing consolidated all borrowings outstanding at the time.
At March 31, 2009,
By December 2009, we had received unanimous approval from the lenders to extend the term of the facility. However, using the net cash proceeds we received from the sale of the 49.99% non-controlling interest in District Energy, and cash on hand, we paid off the outstanding principal balance on December 28, 2009 and avoided the substantial costs that would have been incurred had the terms of the facility been amended. Shortly thereafter we elected to reduce the amount available on the revolving credit facility from $97.0 million to $20.0 million through to the maturity of the facility at March 31, 2010.
Typically, we
| Payments Due by Period | |||||||||||||||||||||||
|---|---|---|---|---|---|---|---|---|---|---|---|---|---|---|---|---|---|---|---|---|---|---|---|
| Total | Less than One Year | 1–3 Years | 3–5 Years | More than 5 Years | |||||||||||||||||||
| ($ In Thousands) | |||||||||||||||||||||||
Long-term debt(1) | $ | 1,138,884 | $ | 49,325 | $ | 290,405 | $ | 799,154 | $ | — | |||||||||||||
| Interest obligations | 208,919 | 74,610 | 104,845 | 29,464 | — | ||||||||||||||||||
Capital lease obligations(2) | 148 | 85 | 50 | 13 | — | ||||||||||||||||||
| Notes payable | 1,347 | 990 | 186 | 171 | — | ||||||||||||||||||
Operating lease obligations(3) | 411,773 | 33,358 | 63,605 | 57,857 | 256,953 | ||||||||||||||||||
Time charter obligations(4) | 1,880 | 768 | 1,112 | — | — | ||||||||||||||||||
| Pension benefit obligations | 24,894 | 2,136 | 4,746 | 4,883 | 13,129 | ||||||||||||||||||
| Post-retirement benefit obligations | 2,059 | 213 | 429 | 385 | 1,032 | ||||||||||||||||||
| Other | 533 | 417 | 116 | — | — | ||||||||||||||||||
Total contractual cash obligations(5) | $ | 1,790,437 | $ | 161,902 | $ | 465,494 | $ | 891,927 | $ | 271,114 | |||||||||||||
| Payments Due by Period | ||||||||||||||||||||
| Total | Less than One Year | 1 – 3 Years | 3 – 5 Years | More than 5 Years | ||||||||||||||||
| ($ In Thousands) | ||||||||||||||||||||
| Long-term debt(1) | $ | 1,212,279 | $ | 45,900 | $ | 111,878 | $ | 1,054,501 | $ | — | ||||||||||
| Interest obligations | 296,180 | 68,677 | 138,051 | 89,452 | — | |||||||||||||||
| Capital lease obligations(2) | 101 | 59 | 42 | — | — | |||||||||||||||
| Notes payable | 1,632 | 176 | 266 | 226 | 964 | |||||||||||||||
| Operating lease obligations(3) | 425,301 | 33,238 | 60,362 | 56,828 | 274,873 | |||||||||||||||
| Time charter obligations(4) | 1,386 | 973 | 413 | — | — | |||||||||||||||
| Pension benefit obligations | 23,063 | 1,980 | 4,359 | 4,666 | 12,058 | |||||||||||||||
| Post-retirement benefit obligations | 2,054 | 187 | 444 | 405 | 1,018 | |||||||||||||||
| Other | 478 | 478 | — | — | — | |||||||||||||||
| Total contractual cash obligations(5) | $ | 1,962,474 | $ | 151,668 | $ | 315,815 | $ | 1,206,078 | $ | 288,913 | ||||||||||
| (1) | The long-term debt represents the consolidated principal obligations to various lenders. The debt facilities, which are obligations of the operating businesses and have maturities between 2013 and 2014, are subject to certain covenants, the violation of which could result in acceleration of the maturity dates. |
| (2) | Capital lease obligations are for the lease of certain transportation equipment. Such equipment could be subject to repossession upon violation of the terms of the lease agreements. |
| (3) | This represents the minimum annual rentals required to be paid under non-cancelable operating leases with terms in excess of one year. |
| (4) | The Gas Company currently has a time charter arrangement for the use of two barges for transporting liquefied petroleum gas between Oahu and its neighbor islands. |
| (5) | The above table does not reflect certain long-term obligations, such as deferred taxes, for which we are unable to estimate the period in which the obligation will be incurred. |
We have also incurred performance fees from time to time paid to our Manager. Our Manager has historically elected to reinvest these fees in our LLC interests (previously trust stock). While these fees do not directly affect cash flows when paid in equity, they do result in more outstanding LLC interests.
| Year Ended December 31, | Change (From 2008 to 2009) Favorable/(Unfavorable) | Change (From 2007 to 2008) Favorable/(Unfavorable) | ||||||||||||||||||||||||||
| 2009 | 2008 | 2007 | ||||||||||||||||||||||||||
| ($ In Thousands) | $ | $ | $ | $ | % | $ | % | |||||||||||||||||||||
| Cash provided by operating activities | 82,976 | 95,579 | 93,499 | (12,603 | ) | (13.2 | ) | 2,080 | 2.2 | |||||||||||||||||||
| Cash used in investing activities | (516 | ) | (56,716 | ) | (638,853 | ) | 56,200 | 99.1 | 582,137 | 91.1 | ||||||||||||||||||
| Cash (used in) provided by financing activities | (117,818 | ) | 1,698 | 570,618 | (119,516 | ) | NM | (568,920 | ) | (99.7 | ) | |||||||||||||||||
| Year Ended December 31, | |||||||||||||||||||||||||||||||
|---|---|---|---|---|---|---|---|---|---|---|---|---|---|---|---|---|---|---|---|---|---|---|---|---|---|---|---|---|---|---|---|
| 2010 | 2009 | 2008 | Change (From 2009 to 2010) Favorable/(Unfavorable) | Change (From 2008 to 2009) Favorable/(Unfavorable) | |||||||||||||||||||||||||||
| ($ In Thousands) | $ | $ | $ | $ | % | $ | % | ||||||||||||||||||||||||
| Cash provided by operating activities | 98,555 | 82,976 | 95,579 | 15,579 | 18.8 | (12,603 | ) | (13.2 | ) | ||||||||||||||||||||||
| Cash used in investing activities | (24,774 | ) | (516 | ) | (56,716 | ) | (24,258 | ) | NM | 56,200 | 99.1 | ||||||||||||||||||||
| Cash (used in) provided by financing activities | (76,528 | ) | (117,818 | ) | 1,698 | 41,290 | 35.0 | (119,516 | ) | NM | |||||||||||||||||||||
We believe our operating activities overall provide a source of sustainable and stable cash flows over the long-term with the opportunity for future growth due to:
The decrease in consolidated cash used in investing activities was primarily due to:
Distributions from IMTT are reflected in our consolidated cash provided by operating activities only up to our 50% share of IMTT’s positive earnings. Amounts in excess of this, and any distributions when IMTT records a net loss, are reflected in our consolidated cash from investing activities.activities as a return of investment in unconsolidated business. For 2009, $7.02010, $15.0 million in equity distributions were included in cash from operations.operating activities compared with $7.0 million in 2009. In 2008, $1.3 million of the $28.0 million dividends received were included in cash from operating activities and $26.7 million were included in cash from investing activities.
long-term cash flows our businesses have provided in the past and which we currently expect to continue in the future as discussed above. Our long-termproject finance debt is non-amortizing and we expect to be able to refinance the outstanding balances atof the term loan on or before maturity, except at Atlantic Aviation, where all excess cash flow from the business is being used to prepay the outstanding principal balance of the term loan. Similarly, excess cash flow generated at District Energy will be applied toward the principal balance of the term loan andduring the last two years before maturity at District Energy. Most of our businesses’ debt is term debt, while somematurity. The majority of our businesses also maintain revolving capital expenditure and/or working capital facilities.
Effective April 14, 2009, we elected to reduce the available principal on its revolving credit facility from $300.0 million to $97.0 million and on December 31, 2009, further reduced the available principal to $20.0 million. This revolving credit facility is with Citicorp North America Inc. (as lender and administrative agent), Wachovia Bank National Association, Credit Suisse, Cayman Islands Branch, WestLB AG, New York Branch, and Macquarie Bank Limited. The original maturity of the facility was March 2008; however, in February 2008, we amended and restated the facility, extending the maturity to March 2010. The main use of the facility is to fund acquisitions, capital expenditures and to a limited extent, working capital. The facility terminates on March 31, 2010 and currently bears interest at the rate of LIBOR plus 2.75%. Base rate borrowings would be at the base rate plus 1.75%.
On February 20, 2008, we drew $56.0 million on this facility, part of which was used to fund the acquisition of SevenBar FBOs which was completed in the first quarter of 2008, and part of which was used for other projects. On July 31, 2008, MIC Inc. drew an additional $13.0 million on this facility to fund the acquisition of SkyPark, which was completed in the third quarter of 2008. On February 25, 2009, we repaid $2.6 million of the outstanding balance on the revolving credit facility.
At March 31, 2009, we reclassified the outstanding balance drawn on the revolving credit facility at the non-operating holding company from long-term debt to current portion of long-term debt on our consolidated balance sheet due to its scheduled maturity on March 31, 2010. During the year, we were in discussions with our lenders to convert the facility to a term loan and extend the maturity date of the $66.4 million outstanding balance.
By December 2009, we had received unanimous approval from our lenders to extend the term of the facility. However, using the net cash proceeds it received from the sale of the 49.99% non-controlling interest in District Energy, and cash on hand, we paid off the outstanding principal balance on December 28, 2009 and avoided the substantial costs that would have been incurred had the terms of the facility been amended. Shortly thereafter we elected to reduce the amount available on the revolving credit facility from $97.0 million to $20.0 million through to the maturity of the facility at March 31, 2010. We expect to retain excess cash generated by the consolidated businesses over the near term.
The borrower under the facility is MIC Inc., a direct subsidiary of the Company, and the obligations under the facility are guaranteed by the Company and secured by a pledge of the equity of all current and future direct subsidiaries of MIC Inc. and the Company. The terms and conditions for the revolving facility include events of default, representations and warranties and covenants that are generally customary for a facility of this type. In addition, the revolving facility includes a restriction on cross guarantees and an event of default should the Manager or another member of the Macquarie Group cease to manage our business and operations.
The following is a summary of the material terms of the facility:
| ||
| ||
|
See below for further description of the cash flows related to our businesses.
| Year Ended December 31, | |||||||||||||||||||||||||||||||
|---|---|---|---|---|---|---|---|---|---|---|---|---|---|---|---|---|---|---|---|---|---|---|---|---|---|---|---|---|---|---|---|
| 2010 | 2009 | 2008 | Change (From 2009 to 2010) Favorable/(Unfavorable) | Change (From 2008 to 2009) Favorable/(Unfavorable) | |||||||||||||||||||||||||||
| ($ In Thousands) | $ | $ | $ | $ | % | $ | % | ||||||||||||||||||||||||
| Cash provided by operating activities | 196,187 | 133,382 | 94,087 | 62,805 | 47.1 | 39,295 | 41.8 | ||||||||||||||||||||||||
| Cash used in investing activities | (168,084 | ) | (141,216 | ) | (166,640 | ) | (26,868 | ) | (19.0 | ) | 25,424 | 15.3 | |||||||||||||||||||
| Cash (used in) provided by financing activities | (20,249 | ) | 6,262 | 71,815 | (26,511 | ) | NM | (65,553 | ) | (91.3 | ) | ||||||||||||||||||||
| Year Ended December 31, | Change (From 2008 to 2009) Favorable/(Unfavorable) | Change (From 2007 to 2008) Favorable/(Unfavorable) | ||||||||||||||||||||||||||
| 2009 | 2008 | 2007 | ||||||||||||||||||||||||||
| ($ In Thousands) | $ | $ | $ | $ | % | $ | % | |||||||||||||||||||||
| Cash provided by operating activities | 133,382 | 94,087 | 91,431 | 39,295 | 41.8 | 2,656 | 2.9 | |||||||||||||||||||||
| Cash used in investing activities | (141,216 | ) | (166,640 | ) | (264,457 | ) | 25,424 | 15.3 | 97,817 | 37.0 | ||||||||||||||||||
| Cash provided by financing activities | 6,262 | 71,815 | 142,228 | (65,553 | ) | (91.3 | ) | (70,413 | ) | (49.5 | ) | |||||||||||||||||
The increase in 2008 was primarily due to higher gross profit offset by increases in deferred revenue, working capital and increases in interest expense.
In 2010,
Since our investment in IMTT, the business has undertaken or committed to a total of approximately $534.9 million in expansion projects and acquired the Joliet facility for $18.5 million. Through December 31, 2009, these projects added and/or refurbished approximately 6.1 million barrels of storage capacity and are contributing $49.6 million to gross profit and EBITDA on an annualized basis.
In addition, IMTT currently has ongoing growth projects for the construction or refurbishment of barrels of storage that had been previously announced. In total, the projects outstanding at December 31, 2009 cost $94.2 million and added 2.2 million barrels of new storage capacity comprised primarily of 1.8 million barrels at IMTT’s St. Rose facility, of which 1.1 million barrels were on line at December 31, 2009 with the remainder expected to be fully placed into service by early 2010. Other smaller growth projects are also being pursued. On a combined basis, the projects under construction are expected to have a total cost of $129.4 million and will contribute approximately $19.2 million to gross profit and EBITDA on an annualized basis. OfThese projects were commissioned at various points in 2010 and contributed $12.2 million to the $129.42010 results.
IMTT continues to review numerous additional attractive growth opportunities. IMTT anticipates funding new growth capital expenditures with a combination of its cash flow from operating activities, existing and additional credit facilities.
It is anticipated that the existing growth capital expenditure commitments will be funded from a combination of IMTT’s existing and new debt facilities and cash from operations. In 2010, IMTT is seeking to raise additional debt financing to fund its growth capital expenditure program.
At December 31, 2009, the outstanding balance on IMTT’s debt facilities consisted of $250.9 million in revolving credit facilities, $251.3 million in bonds and $130.0 million in term loan facilities, including shareholder loans. The weighted average interest rate of the outstanding debt facilities including any interest rate swaps and fees associated with outstanding letters of credit at December 31, 2009 is 4.8%. During 2009, IMTT paid approximately $29.0 million, net of capitalized interest, in interest related to its debt facilities.
| USD Revolving Credit Facility — Extended | USD Revolving Credit Facility — Non Extended | USD DNB Nor Loans | CAD Revolving Credit Facility — Extended | ||||||||||||||||||
|---|---|---|---|---|---|---|---|---|---|---|---|---|---|---|---|---|---|---|---|---|---|
| Total Committed Amount | |||||||||||||||||||||
| $ | $ | ||||||||||||||||||||
| $ | |||||||||||||||||||||
| $ | |||||||||||||||||||||
| Maturity | June 7, 2014 | June 7, 2012 | December 31, 2012 (at which time it converts to USD Revolving Credit Facility – Extended) | June | |||||||||||||||||
| Amortization | Revolving, payable at maturity | Term loan, payable at maturity | Revolving, payable at maturity | ||||||||||||||||||
| Interest Rate | Floating at LIBOR plus a margin based on the ratio of Debt to adjusted EBITDA of | Floating at | |||||||||||||||||||
| Floating at LIBOR plus 1.0% through December 2012, thereafter per the terms of the USD Revolving Credit Facility | ||||||||||||||||||
| < 2.0x L+1.50% | < 2.0x L+0.55% | < 2.0x BA+1.50% | ||||||||||||||||
| < 2.5x L+1.75% | < 2.5x L+0.70% | < 2.5x BA+1.75% | ||||||||||||||||
| < 3.0x L+2.00% | < 3.0x L+0.85% | < 3.0x BA+2.00% | ||||||||||||||||
| < 3.75x L+2.25% | < 3.75x L+1.00% | < 3.75x BA+2.25% | ||||||||||||||||
| < 4.0x L+2.50% | < 4.0x L+1.25% | < 4.0x BA+2.50% | ||||||||||||||||
| > = 4.0x L+2.75% | > = 4.0x L+1.50% | > = 4.0x BA+2.75% | ||||||||||||||||
| Commitment Fees | A percentage of undrawn committed amounts based on the ratio of Debt to adjusted EBITDA of | A percentage of undrawn committed amounts based on the ratio of Debt to adjusted EBITDA of | ||||||||||||||||
| < 2.0x 0.125% | < 2.0x 0.250% | |||||||||||||||||
| < 2.5x 0.250% | < 2.5x 0.150% | < 2.5x 0.250% | ||||||||||||||||
| < 3.0x 0.250% | < 3.0x 0.175% | < 3.0x 0.250% | ||||||||||||||||
| < 3.75x 0.375% | < 3.75x 0.200% | < 3.75x 0.375% | ||||||||||||||||
| < 4.0x 0.375% | < 4.0x 0.250% | < 4.0x 0.375% | ||||||||||||||||
| > = 4.0x 0.500% | > = 4.0x 0.250% | > = 4.0x 0.500% | ||||||||||||||||
| Restrictions on Payments of Dividends | None, provided no default as a result of | None, provided no default as a result of | None, provided no default as a result of payment | None, provided no default as a result of payment | ||||||||||||||
| Facility Term | Gulf Opportunity Zone Bonds | Gulf Opportunity Zone | Gulf Opportunity Zone Bonds III | Gulf Opportunity Zone Bonds IV | |||||||||||||||||||
|---|---|---|---|---|---|---|---|---|---|---|---|---|---|---|---|---|---|---|---|---|---|---|---|
| Amount | $ | $ | $100.0 million | $90.0 million | |||||||||||||||||||
| Maturity | July 2043 | August 2046 | December | December 2040 | |||||||||||||||||||
| Amortization | Payable at maturity | Payable at maturity | Payable at maturity. Monthly amortization beginning July 2011 and mandatory tender for purchase by the company five years after issuance. | Payable at maturity. Monthly amortization beginning July 2011 and mandatory tender for purchase by the company five years after issuance. | |||||||||||||||||||
| Interest Rate | Floating at tax exempt bond | Floating at tax exempt bond | |||||||||||||||||||||
| Monthly at 68% of 1-month LIBOR plus 65% of LIBOR margin under Revolving Credit Agreement | |||||||||||||||||||||||
| Security | Secured (required to be supported at all times by bank letter of credit issued under the revolving credit facility) | ||||||||||||||||||||||
| Unsecured | ||||||||||||||||||
| Financial Covenants (applicable to IMTT’s key operating subsidiaries on a combined basis) | None | None | Same as Revolving Credit Facility | Same as Revolving Credit Facility | ||||||||||||||
| Restrictions on Payments of Dividends | None, provided no default as a result of payment | None, provided no default as a result of payment | None, provided no default as a result of payment | None, provided no default as a result of payment | ||||||||||||||
| Interest Rate Hedging | Hedged | None | None | |||||||||||||||
| Facility Term | New Jersey Economic Development Authority Dock Facility Revenue Refund Bonds | New Jersey Economic Development Authority Variable-Rate Demand Revenue Refunding Bond | |||||||||||
|---|---|---|---|---|---|---|---|---|---|---|---|---|---|
| Amount | $ | $6.3 million | |||||||||||
| Maturity | December 2027 | December 2021 | |||||||||||
| Amortization | Payable at maturity | Payable at maturity | |||||||||||
| Interest Rate | Floating at tax exempt bond | Floating at tax exempt bond daily tender rates | |||||||||||
| Security | |||||||||||||
| Secured (required to be supported at all times by bank letter of credit issued under the revolving credit facility) | |||||||||||||
| Financial Covenants (applicable to IMTT’s | None | None | |||||||||||
| Restrictions on Payments of Dividends | None, provided no default as a result of payment | None, provided no default as a result of payment | |||||||||||
For federal income tax purposes, interest on the GO Zone Bonds is excluded from gross income and is not an item of tax preference for purposes of federal alternative minimum tax imposed on individuals and corporations that are investors in the Go Zone Bonds; however, for purposes of computing the federal alternative minimum tax imposed on certain corporations, such interest is taken into account in determining adjusted current earnings. As a consequence of this and the credit support provided by the letters of credit issued under the U.S dollar denominated revolving credit facility, the floating interest rate applicable to similar bonds has historically averaged approximately 67% of LIBOR. Interest on the GO Zone Bonds is deductible to IMTT as incurred except to the extent capitalized and amortized as part of project costs as required, for federal income tax purposes.
To hedge the interest rate risk associated with IMTT’s GO Zone Bond borrowings, IMTT has entered into a 10 year fixed to monthly 67% of LIBOR swap, maturing in June 2017, with a notional amount of $215.0 million as of December 31, 2009, at a fixed rate of 3.662%.
On August 28, 2009, IMTT entered into a loan agreement with Regions Bank, as Administrative Agent, to provide unsecured term loan financing of $30.0 million. IMTT drew down $30.0 million on the same day and applied the funds to repay its current U.S. dollar denominated revolving credit facility.
| Interest Rate Hedging |
As discussed above, IMTT intends to seek to raise additional U.S dollar denominated debt facilities at the operating company level in 2010 to fund IMTT’s growth capital expenditure program. Due to current financial market conditions, it is anticipated that the interest rate margins payable on new debt facilities raised will be in excess of the margins payable on the existing U.S dollar denominated revolving credit facility.
In addition to the senior debt facilities discussed above, subsidiaries of IMTT Holdings Inc. that are the parent entities of IMTT’s key operating subsidiaries are the borrowers and guarantors under a debt facility with the following key terms:
| Hedged through November, 2012 with $6.3 million at 3.41% fixed vs. 67% of LIBOR interest rate swap | ||||||
| Year Ended December 31, | Change (From 2008 to 2009) Favorable/(Unfavorable) | Change (From 2007 to 2008) Favorable/(Unfavorable | ||||||||||||||||||||||||||
| 2009 | 2008 | 2007 | ||||||||||||||||||||||||||
| ($ In Thousands) | $ | $ | $ | $ | % | $ | % | |||||||||||||||||||||
| Cash provided by operating activities | 25,560 | 27,078 | 16,005 | (1,518 | ) | (5.6 | ) | 11,073 | 69.2 | |||||||||||||||||||
| Cash used in investing activities | (7,105 | ) | (9,424 | ) | (7,870 | ) | 2,319 | 24.6 | (1,554 | ) | (19.7 | ) | ||||||||||||||||
| Cash provided by financing activities | 10,000 | 2,000 | 5,000 | 8,000 | NM | (3,000 | ) | (60.0 | ) | |||||||||||||||||||
| Year Ended December 31, | |||||||||||||||||||||||||||||||
|---|---|---|---|---|---|---|---|---|---|---|---|---|---|---|---|---|---|---|---|---|---|---|---|---|---|---|---|---|---|---|---|
| 2010 | 2009 | 2008 | Change (From 2009 to 2010) Favorable/(Unfavorable) | Change (From 2008 to 2009) Favorable/(Unfavorable) | |||||||||||||||||||||||||||
| ($ In Thousands) | $ | $ | $ | $ | % | $ | % | ||||||||||||||||||||||||
| Cash provided by operating activities | 29,331 | 25,560 | 27,078 | 3,771 | 14.8 | (1,518 | ) | (5.6 | ) | ||||||||||||||||||||||
| Cash used in investing activities | (10,549 | ) | (7,105 | ) | (9,424 | ) | (3,444 | ) | (48.5 | ) | 2,319 | 24.6 | |||||||||||||||||||
| Cash (used in) provided by financing activities | (19,000 | ) | 10,000 | 2,000 | (29,000 | ) | NM | 8,000 | NM | ||||||||||||||||||||||
The following table sets forth information about capital expenditures in The Gas Company:
| Maintenance | Growth | ||||||||||||
|---|---|---|---|---|---|---|---|---|---|---|---|---|---|
| $ | |||||||||||||
| 5.8 million | $ | 3.9 million | |||||||||||
| 2009 | $3.3 million | $4.1 million | |||||||||||
| 2010 | $ | $5.5 million | |||||||||||
| $ | $6.0 million | ||||||||||||
| Commitments at December 31, | $ | $ 276,000 | |||||||||||
The change in capital expenditure from 2008 to 2009 was primarily due to:
The change in capital expenditure from 2007 to 2008 was primarily due to:
Commitments at December 31, 20092010 include renewal work on pipelines, acquisitionrenewable feedstock project and pipeline maintenance and inspection projects.
outstanding credit facilities. At December 31, 2009,2010, the outstanding balance on the business’ debt facilities consisted of $160.0 million in term loan facility borrowings andborrowings. In 2010, the business repaid $19.0 million inof its capital expenditure facility borrowings. The weighted average interest rate of theborrowings and no amount was outstanding debt facilities including any interest rate swaps at December 31, 2009 is 4.6%. For the year, the business paid approximately $8.5 million in interest expense related to its debt facilities.2010.
the capital expenditure facility of $19.0 million during 2010 compared with draw down of $10.0 million in 2009. The change from 2008 to 2009 was primarily due primarily to the timing of borrowings to fund capital expenditures.
The change from 2007
| Facility Terms | Holding Company Debt | Operating Company Debt | |||||||||||||
|---|---|---|---|---|---|---|---|---|---|---|---|---|---|---|---|
| HGC | The Gas Company, LLC | ||||||||||||||
| Facilities | $80.0 million Term Loan (fully drawn at December 31, 2010 and 2009) | $80.0 million Term Loan (fully drawn at December 31, 2010 and 2009) | $20.0 million Revolver | ||||||||||||
| Collateral | First priority security interest on HGC’s assets and equity interests | First priority security interest on The Gas Company’s assets and equity interests | |||||||||||||
| Maturity | June, 2013 | June, 2013 | June, 2013 | ||||||||||||
| Amortization | Payable at maturity | Payable at maturity | Payable at maturity for utility capital expenditures | ||||||||||||
| Facility Terms | Holding Company Debt | Operating Company Debt | |||||||||||||
|---|---|---|---|---|---|---|---|---|---|---|---|---|---|---|---|
| Interest Rate: Years | LIBOR plus 0.60% | LIBOR plus 0.40% | LIBOR plus 0.40% | ||||||||||||
| Commitment Fees: Years | — | — | 0.14% on undrawn portion | ||||||||||||
| Interest Rate: Years | LIBOR plus 0.70% | LIBOR plus 0.50% | LIBOR plus 0.50% | ||||||||||||
| Commitment Fees: Years | — | — | 0.18% on undrawn portion | ||||||||||||
| Distributions Lock-Up Test | — | 12 mo. look-forward and 12 mo. look-backward adjusted EBITDA/interest <3.5x (at December 31, | — | ||||||||||||
| Mandatory Prepayments | — | 12 mo. look-forward and 12 mo. look-backward adjusted EBITDA/interest <3.5x for 3 consecutive quarters | — | ||||||||||||
| Events of Default Financial Triggers | — | 12 mo. look-backward adjusted EBITDA/interest <2.5x | 12 mo. look-backward adjusted EBITDA/interest <2.5x | ||||||||||||
As part of the regulatory approval process of our acquisition of The Gas Company, we agreed to 14 regulatory conditions from the HPUC that address a variety of matters. The more significant conditions include:
At December 31, 2009, the consolidated debt to total capital ratio was 63.2%.
| Year Ended December 31, | Change (From 2008 to 2009) Favorable/(Unfavorable) | Change (From 2007 to 2008) Favorable/(Unfavorable) | ||||||||||||||||||||||||||
| 2009 | 2008 | 2007 | ||||||||||||||||||||||||||
| ($ In Thousands) | $ | $ | $ | $ | % | $ | % | |||||||||||||||||||||
| Cash provided by operating activities | 14,448 | 17,766 | 14,085 | (3,318 | ) | (18.7 | ) | 3,681 | 26.1 | |||||||||||||||||||
| Cash used in investing activities | (12,095 | ) | (5,378 | ) | (9,421 | ) | (6,717 | ) | (124.9 | ) | 4,043 | 42.9 | ||||||||||||||||
| Cash provided by financing activities | 17,917 | 986 | 11,637 | 16,931 | NM | (10,651 | ) | (91.5 | ) | |||||||||||||||||||
| Year Ended December 31, | |||||||||||||||||||||||||||||||
|---|---|---|---|---|---|---|---|---|---|---|---|---|---|---|---|---|---|---|---|---|---|---|---|---|---|---|---|---|---|---|---|
| 2010 | 2009 | 2008 | Change (From 2009 to 2010) Favorable/(Unfavorable) | Change (From 2008 to 2009) Favorable/(Unfavorable) | |||||||||||||||||||||||||||
| ($ In Thousands) | $ | $ | $ | $ | % | $ | % | ||||||||||||||||||||||||
| Cash provided by operating activities | 14,959 | 14,448 | 17,766 | 511 | 3.5 | (3,318 | ) | (18.7 | ) | ||||||||||||||||||||||
| Cash used in investing activities | (4,479 | ) | (12,095 | ) | (5,378 | ) | 7,616 | 63.0 | (6,717 | ) | (124.9 | ) | |||||||||||||||||||
| Cash (used in) provided by financing activities | (469 | ) | 17,917 | 986 | (18,386 | ) | (102.6 | ) | 16,931 | NM | |||||||||||||||||||||
The following table summarizes growth capital expenditures committed by
| Capital Expenditure Cost ($ Millions) | Gross Profit/ EBITDA ($ Millions)(1) | Expected Date for Gross Profit/ EBITDA | ||||||||||
| Chicago Plant and Distribution System Expansion | 7.7 | |||||||||||
| New Chicago Customer Connections and Minor System Modifications | 6.6 | |||||||||||
| 14.3 | 4.9 | 2007 – 2012 | ||||||||||
| Chicago Plant Renovation and Expansion | 10.7 | 1.3 | 2009 – 2011 | |||||||||
| Las Vegas System Expansion | 2.7 | 0.3 | 2010 | |||||||||
| Total | 27.7 | 6.5 | ||||||||||
actively market to new potential customers. New customers will typically reimburse the business for a substantial portion of expenditures related to connecting them to the business’ system, thereby reducing the impact of this element of capital expenditure. In addition, new customers generally have up to two years after their initial service date to increase capacity up to their final contracted tons which may defer a small portion of the expected gross profit and EBITDA. The business anticipates that the expanded capacity sold to new or existing customers will be under contract or subject to letters of intent prior to the business committing to the capital expenditure. As of January 26, 2010, the business has signed contracts with eleven new customers representing approximately 80% of expected additional gross profit and EBITDA relating to the Chicago projects in the table above.
The business expects to fund the capital expenditures for system expansion and interconnection by drawing on debt facilities.
| Maintenance | Growth | |||||||||
|---|---|---|---|---|---|---|---|---|---|---|
| 2008 | $ | 987,000 | $ | 4.4 | million | |||||
| 2009 | $ | 875,000 | $ | 11.2 | million | |||||
| 2010 | $ | 1.1 | million | $ | 407,000 | |||||
| 2011 projected | $ | 1.0 | million | $ | 245,000 | |||||
| Commitments at December 31, 2010 | $ | 58,000 | $ | 131,000 | ||||||
| Maintenance | Growth | |||||||
| 2007 | $ | 906,000 | $ | 8.5 million | ||||
| 2008 | $ | 987,000 | $ | 4.4 million | ||||
| 2009 | $ | 875,000 | $ | 11.2 million | ||||
| 2010 projected | $ | 1.0 million | $ | 4.1 million | ||||
| Commitments at December 31, 2009 | $ | 257,000 | $ | 2.9 million | ||||
The change from 2007 to 2008 was primarily due to the 2007 refinancing in which $150.0 million of new long-term borrowing was used to repay outstanding senior notes of $120.0 million and an $11.6 million revolver facility ($9.0 million of which was drawn in 2007), partially offset by a make-whole payment of $14.7 million.
Material terms of the facility are presented below:
| Facility Terms | ||||||
|---|---|---|---|---|---|---|
| Macquarie District Energy LLC, or MDE | ||||||
| Facilities | •
| |||||
| •
| ||||||
| •
| ||||||
| Amortization | Payable at maturity | |||||
| Interest | Floating | |||||
| Interest rate and fees | • Interest rate: | |||||
| • LIBOR plus 1.175% or | ||||||
| • Base Rate (for capital expenditure loan and revolving loan facilities only): 0.5% above the greater of the prime rate or the federal funds rate | ||||||
| • Commitment fee: 0.35% on the undrawn portion. | ||||||
| Maturity | September, | |||||
| Facility Terms | ||||||
|---|---|---|---|---|---|---|
| Mandatory prepayment | • With net proceeds that exceed $1.0 million from the sale of assets not used for replacement | |||||
| • With insurance proceeds that exceed $1.0 million not used to repair, restore or replace assets; | ||||||
| • In the event of a change of control; | ||||||
| • In years 6 and 7, with 100% of excess cash flow applied to repay the term loan and capital expenditure loan facilities; | ||||||
| • With net proceeds from equity and certain debt issuances; and | ||||||
| Mandatory prepayment (continued) | ||||||
| • With net proceeds that exceed $1.0 million in a fiscal year from contract terminations that are not reinvested. | ||||||
| Distribution covenant | Distributions permitted if the following conditions are met: | |||||
| • Backward interest coverage ratio greater than 1.5x (at December 31, | ||||||
| • Leverage ratio (funds from operations to net debt) for the previous 12 months equal to or greater than 6.0% (at December 31, | ||||||
| • No termination, non-renewal or reduction in payment terms under the service agreement with the Planet Hollywood (formerly Aladdin) hotel, casino and the shopping mall, unless MDE meets certain financial conditions on a projected basis, including through prepayment; and | ||||||
| • No default or event of default. | ||||||
| Collateral | First lien on the following (with limited exceptions): | |||||
| • Project revenues; | ||||||
| • Equity of the Borrower and its subsidiaries; | ||||||
| • Substantially all assets of the business; and | ||||||
| • Insurance policies and claims or proceeds. | ||||||
The facility includes events of default, representations and warranties and other covenants that are customary for facilities of this type. A change of control will occur if the Macquarie Group, or any fund or entity managed by the Macquarie Group, fails to control a majority of MDE.the Borrower.
To hedge the interest commitments under the new term loan, District Energy entered into interest rate swaps fixing 100% of the term loan at 5.074% (excluding the margin).
| Year Ended December 31, | Change (From 2008 to 2009) Favorable/(Unfavorable) | Change (From 2007 to 2008) Favorable/(Unfavorable) | ||||||||||||||||||||||||||
| 2009 | 2008 | 2007 | ||||||||||||||||||||||||||
| ($ In Thousands) | $ | $ | $ | $ | % | $ | % | |||||||||||||||||||||
| Cash provided by operating activities | 50,930 | 73,128 | 85,323 | (22,198 | ) | (30.4 | ) | (12,195 | ) | (14.3 | ) | |||||||||||||||||
| Cash used in investing activities | (10,817 | ) | (68,002 | ) | (704,259 | ) | 57,185 | 84.1 | 636,257 | 90.3 | ||||||||||||||||||
| Cash (used in) provided by financing activities (1) | (76,736 | ) | 27,069 | 411,191 | (103,805 | ) | NM | (384,122 | ) | (93.4 | ) | |||||||||||||||||
| Year Ended December 31, | |||||||||||||||||||||||||||||||
|---|---|---|---|---|---|---|---|---|---|---|---|---|---|---|---|---|---|---|---|---|---|---|---|---|---|---|---|---|---|---|---|
| 2010 | 2009 | 2008 | Change (From 2009 to 2010) Favorable/(Unfavorable) | Change (From 2008 to 2009) Favorable/(Unfavorable) | |||||||||||||||||||||||||||
| ($ In Thousands) | $ | $ | $ | $ | % | $ | % | ||||||||||||||||||||||||
| Cash provided by operating activities | 54,035 | 50,930 | 73,128 | 3,105 | 6.1 | (22,198 | ) | (30.4 | ) | ||||||||||||||||||||||
| Cash used in investing activities | (10,346 | ) | (10,817 | ) | (68,002 | ) | 471 | 4.4 | 57,185 | 84.1 | |||||||||||||||||||||
Cash (used in) provided by financing activities(1) | (52,424 | ) | (76,736 | ) | 27,069 | 24,312 | 31.7 | (103,805 | ) | NM | |||||||||||||||||||||
| (1) | During the first quarter of 2009, we provided Atlantic Aviation with a capital contribution of $50.0 million to pay down $44.6 million of debt. The remainder of the capital contribution was used to pay interest rate swap breakage fees and expenses. |
In response to the slowing of the overall economy and the recent decline in general aviation activity, we continue to reduce the indebtedness of
Maintenance expenditures are generally funded by cash from operating activities and growth capital expenditures are generally funded with drawdowns on capital expenditure facilities.
| Maintenance | Growth | |||||||||
|---|---|---|---|---|---|---|---|---|---|---|
| 2008 | $ | 7.7 | million | $ | 26.8 | million | ||||
| 2009 | $ | 4.5 | million | $ | 6.3 | million | ||||
| 2010 | $ | 6.8 | million | $ | 3.6 | million | ||||
| 2011 projected | $ | 12.1 | million | $ | 7.6 | million | ||||
| Commitments at December 31, 2010 | $ | 196,000 | $ | 902,000 | ||||||
| Maintenance | Growth | |||||||
| 2007 | $ | 8.6 million | $ | 19.0 million | ||||
| 2008 | $ | 7.7 million | $ | 26.8 million | ||||
| 2009 | $ | 4.5 million | $ | 6.3 million | ||||
| 2010 projected | $ | 7.6 million | $ | 1.8 million | ||||
| Commitments at December 31, 2009 | $ | 24,000 | $ | 203,000 | ||||
Growth capital expenditures incurred in 2010 primarily reflects the ongoing construction costs of a new FBO at Will Rogers Airport in Oklahoma City. The decrease in growth capital expenditures from 2009 to 2010 was primarily related to the completion of a terminal and ramp project in Nashville, Tennessee during 2009. Growth capital expenditures declined infrom 2008 to 2009 since various major projects were completed in 2008, these
facilities at a number of locations. The decreases in maintenance capital expenditures werefrom 2008 to 2009 was primarily due to the deferral of maintenance capital expenditures in response to the overall soft economy. The increase from 2010 to 2011 reflects a specific project at LAX FBO, as well as a return to historical levels of maintenance capital expenditures.
Duringprepayment in the first quarterhalf of 2009, the Company provided the business with a capital contribution of $50.0 million. The business paid down $44.6 million of debt2009. During 2010 and used the remainder of the capital contribution to pay interest rate swap breakage and debt amendment fees. In addition, during 2009, the business used $40.6pre-paid $55.0 million and $81.6 million, respectively, of debt principal. The decrease in cash provided by financing activities from 2008 to 2009 was primarily due to the debt prepayment made in 2009.
In February, 2010, Atlantic Aviation used $17.1 million of cash generated by Atlantic Aviation to repay $15.5 million of the outstanding principal balance of the term loan debt and $1.6 million of interest rate swap breakage fees. As a result of this prepayment, the proforma leverage ratio would decrease to 7.82x6.79x based upon the trailing twelve months December 200931, 2010 EBITDA, as calculated under the facility. We expectThe maximum permitted debt-to-EBITDA ratio drops to apply all excess cash flow from7.50x on March 31, 2011. The business expects to remain in compliance with the maximum leverage covenant through the maturity of its debt facilities if the performance of the business to prepay additional debt principal for the foreseeable future.remains at current levels.
The decrease in cash provided by financing activities is primarily due to the debt prepayment made in 2009.
The financial covenant requirements under Atlantic Aviation’s credit facility, and the calculation of these measures at December 31, 2009, were as follows:
The terms of the loan agreement of Atlantic Aviation have been revised in accordance with the amendment completed and effective on February 25, 2009. A comparative summary of key terms is presented below.
| Facility Terms | ||||||
|---|---|---|---|---|---|---|
| Atlantic Aviation | ||||||
| Facilities | • $900.0 million term loan facility (outstanding balance of $763.3 million and $818.4 million at December 31, | |||||
| • $50.0 million capital expenditure facility ($ | ||||||
| • $18.0 million revolving working capital and letter of credit facility ($ | ||||||
| Amortization | • Payable at maturity | |||||
| • Years 1 to 5, amortization per leverage grid below: | ||||||
| • 100% excess cash flow when Leverage Ratio is 6.0x or above | ||||||
| • 50% excess cash flow when Leverage Ratio is between 6.0x and 5.5x | ||||||
| • 100% of excess cash flow in years 6 and 7 | ||||||
| Interest type | Floating | |||||
| Interest rate and fees | • Years | |||||
| • LIBOR plus 1.6% or | ||||||
| • Base Rate (for revolving credit facility only): 0.6% above the greater of: (i) the prime rate or (ii) the federal funds rate plus 0.5% | ||||||
| • Years | ||||||
| • LIBOR plus 1.725% or | ||||||
| • Base Rate (for revolving credit facility only): 0.725% above the greater of: (i) the prime rate or (ii) the federal funds rate plus 0.5% | ||||||
| Maturity | October, 2014 | |||||
| Mandatory prepayment | • With net proceeds that exceed $1.0 million from the sale of assets not used for replacement assets; | |||||
| • With net proceeds of any debt other than permitted debt; | ||||||
| • With net insurance proceeds that exceed $1.0 million not used to repair, restore or replace assets; | ||||||
| • In the event of a change of control; | ||||||
| • Additional mandatory prepayment based on leverage grid (see distribution covenant below); | ||||||
| • With any FBO lease termination payments received; and | ||||||
| • With excess cash flows in years 6 and 7. | ||||||
| Financial covenants | • Debt service coverage ratio >1.2x (at December 31, | |||||
| • Leverage ratio (outstanding debt to EBITDA) for the trailing twelve months < 8.00x (default threshold) (at December 31, 2010: 6.91x) | ||||||
| • Maximum leverage ratio for subsequent periods modified as follows: | ||||||
| • 2009: | ||||||
| • 2010: | ||||||
| • 2011: | ||||||
| Facility Terms | |||||||
|---|---|---|---|---|---|---|---|
| Distribution covenant | Distributions permitted if the following conditions are met: | ||||||
| • Backward and forward debt service coverage ratio equal to or greater than 1.6x; | |||||||
| • No default; | |||||||
| • All mandatory prepayments have been made; | |||||||
| • Replaced by a test based on the Leverage Ratio: | |||||||
| • 100% of excess cash flow permitted to be distributed when leverage ratio is below 5.5x | |||||||
| • 50% of excess cash to be distributed when leverage ratio is equal to or greater than 5.5x and less than 6.0x | |||||||
| • No distribution permitted when leverage ratio is 6.0x or above | |||||||
| • No revolving loans outstanding. | |||||||
| Collateral | First lien on the following (with limited exceptions): | ||||||
| • Project revenues; | |||||||
| • Equity of the borrower and its subsidiaries; and | |||||||
| • Insurance policies and claims or proceeds. | |||||||
| Excludes (i) all extraordinary or non-recurring non-cash income or losses during the relevant | |||||||
fair value of each reporting unit based on a discounted cash flow model using revenue and profit forecasts and comparing those estimated fair values with the carrying values, which included the allocated goodwill. If the estimated fair value is less than the carrying value, a second step is performed to compute the amount of the impairment by determining an “implied fair value” of goodwill. The determination of a reporting unit’s “implied fair value” of goodwill requires the allocation of the estimated fair value of the reporting unit to the assets and liabilities of the reporting unit. Any unallocated fair value represents the “implied fair value” of goodwill, which is compared towith its corresponding carrying value. The Gas Company, District Energy and Atlantic Aviation are separate reporting units for purposes of this analysis. The impairment test for trademarks, and domain names, which are not amortized, requires the determination of the fair value of such assets. If the fair value of the trademarks and domain names isare less than their carrying value, an impairment loss is recognized in an amount equal to the difference. We cannot predict the occurrence of certain future events that might adversely affect the reported value of goodwill and/or intangible assets. Such events include, but are not limited to, strategic decisions made in response to economic and competitive conditions, the impact of the economic environment on our customer base, or material negative change in relationship with significant customers.
Our derivative instruments are recorded on the balance sheet at fair value with changes in fair value of interest rate swaps recorded directly through earnings. We measure derivative instruments at fair value using the income approach, which discounts the future net cash settlements expected under the derivative contracts to a present value. See Note 13,12, “Derivative Instruments and Hedging Activities”, in our consolidated financial statements
At December 31, 2009,2010, IMTT had issued $215.0$490.0 million in Gulf Opportunity Zone Bonds (GO Zone Bonds) to fund qualified project costs at its St. Rose, Gretna and Geismar storage facilities. The interest rate on the GO Zone Bonds is reset daily or weekly at IMTT’s option by tender. A 1% increase in interest rates on the outstanding GO Zone Bonds would result in a $2.2$4.9 million increase in interest cost per year and a corresponding 1% decrease would result in a $2.2$4.9 million decrease in interest cost per year. IMTT’s exposure to interest rate changes through the GO Zone Bonds has been largelypartially hedged until June 2017 through the use of an interest rate swap which has a notional value of $215.0 million. As the interest rate swap is fixed against 67% of the 30-day LIBOR rate and not the tax exempt tender rate, it does not result in a perfect hedge for short-term rates on tax exempt debt although it will largely offset any additional interest rate expense incurred as a result of increases in interest rates. If interest rates decrease, the fair market value of the interest rate swap will also decrease. A 10% relative decrease in interest rates would result in a decrease in the fair market value of the interest rate swap of $171,000$2.5 million and a corresponding 10% relative increase would result in a $170,000$2.5 million increase in the fair market value.
interest rates decrease, the fair market value of the interest rate swap will also decrease. A 10% relative decrease in interest rates would result in a decrease in the fair market value of the interest rate swap of $3.7$3.2 million and a corresponding 10% relative increase would result in a $3.6$3.2 million increase in the fair market value. Before the USD DNB Loan was incorporated into the USD Revolving Credit Facility, its interest was hedged through a swap with a notional value that matched the original amortization schedule of
On December 31, 2009, IMTT had $30.0 million outstanding under its Regions term loan facility. A 1% increase in interest rates on this debt would result in a $300,000 increase in interest cost per year and a corresponding 1% decrease would result in a $300,000 decrease in interest cost per year.
The exposure of the term loan portion of the senior debt (which at December 31, 20092010 was $818.4$763.3 million) to interest rate changes has been 100% hedged until October 2012 through the use of interest rate swaps. These hedging arrangements will offset any additional interest rate expense incurred as a result of increases in interest rates during that period. However, if interest rates decrease, the value of our hedge instruments will also decrease. A 10% relative decrease in interest rates would result in a decrease in the fair market value of the hedge instruments of $3.8$1.0 million. A corresponding 10% relative increase would result in a $3.8$1.0 million increase in the fair market value.
| Page Number | |||||||
|---|---|---|---|---|---|---|---|
| Consolidated Balance Sheets as of December 31, | 104 | ||||||
| Consolidated Statements of Operations for the Years Ended December 31, 2010, 2009 | 105 | ||||||
| Consolidated Statements of Members’ Equity and Comprehensive Income (Loss) for the Years Ended December 31, 2010, 2009 | 106 | ||||||
| Consolidated Statements of Cash Flows for the Years Ended December 31, 2010, 2009 | 108 | ||||||
| Notes to Consolidated Financial Statements | 110 | ||||||
| Schedule | 150 | ||||||
As discussed in Note 2 to the consolidated financial statements, the Company has changed its method of accounting for noncontrolling interests due to the adoption of ASC 810-10Consolidation (formerly Statement on Financial Accounting Standards No. 160,Noncontrolling Interests in Consolidated Financial Statements, an amendment of ARB No. 51) in 2009.
| December 31, 2010 | December 31, 2009 | ||||||||||
|---|---|---|---|---|---|---|---|---|---|---|---|
ASSETS | |||||||||||
| Current assets: | |||||||||||
| Cash and cash equivalents | $ | 24,563 | $ | 27,455 | |||||||
| Accounts receivable, less allowance for doubtful accounts of $613 and $1,629, respectively | 47,845 | 47,256 | |||||||||
| Inventories | 17,063 | 14,305 | |||||||||
| Prepaid expenses | 6,321 | 6,688 | |||||||||
| Deferred income taxes | 19,030 | 23,323 | |||||||||
| Other | 10,605 | 10,839 | |||||||||
| Assets of discontinued operations held for sale | — | 86,695 | |||||||||
| Total current assets | 125,427 | 216,561 | |||||||||
| Property, equipment, land and leasehold improvements, net | 563,451 | 580,087 | |||||||||
| Restricted cash | 13,780 | 16,016 | |||||||||
| Equipment lease receivables | 35,663 | 33,266 | |||||||||
| Investment in unconsolidated business | 223,792 | 207,491 | |||||||||
| Goodwill | 514,253 | 516,182 | |||||||||
| Intangible assets, net | 705,862 | 751,081 | |||||||||
| Deferred financing costs, net of accumulated amortization | 12,927 | 17,088 | |||||||||
| Other | 1,587 | 1,449 | |||||||||
| Total assets | $ | 2,196,742 | $ | 2,339,221 | |||||||
LIABILITIES AND MEMBERS’ EQUITY | |||||||||||
| Current liabilities: | |||||||||||
| Due to manager–related party | $ | 3,282 | $ | 1,977 | |||||||
| Accounts payable | 39,768 | 44,575 | |||||||||
| Accrued expenses | 19,315 | 17,432 | |||||||||
| Current portion of notes payable and capital leases | 1,075 | 235 | |||||||||
| Current portion of long-term debt | 49,325 | 45,900 | |||||||||
| Fair value of derivative instruments | 43,496 | 49,573 | |||||||||
| Customer deposits | 4,635 | 5,617 | |||||||||
| Other | 10,390 | 9,338 | |||||||||
| Liabilities of discontinued operations held for sale | — | 220,549 | |||||||||
| Total current liabilities | 171,286 | 395,196 | |||||||||
| Notes payable and capital leases, net of current portion | 420 | 1,498 | |||||||||
| Long-term debt, net of current portion | 1,089,559 | 1,166,379 | |||||||||
| Deferred income taxes | 156,328 | 107,840 | |||||||||
| Fair value of derivative instruments | 51,729 | 54,794 | |||||||||
| Other | 40,725 | 38,746 | |||||||||
| Total liabilities | 1,510,047 | 1,764,453 | |||||||||
| Commitments and contingencies | — | — | |||||||||
| Members’ equity: | |||||||||||
| LLC interests, no par value; 500,000,000 authorized; 45,715,448 LLC interests issued and outstanding at December 31, 2010 and 45,292,913 LLC interests issued and outstanding at December 31, 2009 | 964,430 | 959,897 | |||||||||
| Additional paid in capital | 21,956 | 21,956 | |||||||||
| Accumulated other comprehensive loss | (25,812 | ) | (43,232 | ) | |||||||
| Accumulated deficit | (269,425 | ) | (360,095 | ) | |||||||
| Total members’ equity | 691,149 | 578,526 | |||||||||
| Noncontrolling interests | (4,454 | ) | (3,758 | ) | |||||||
| Total equity | 686,695 | 574,768 | |||||||||
| Total liabilities and equity | $ | 2,196,742 | $ | 2,339,221 | |||||||
| December 31, 2009 | December 31, 2008(1) | |||||||
| ($ in Thousands, Except Share Data) | ||||||||
| ASSETS | ||||||||
| Current assets: | ||||||||
| Cash and cash equivalents | $ | 27,455 | $ | 66,054 | ||||
| Accounts receivable, less allowance for doubtful accounts of $1,629 and $2,141, respectively | 47,256 | 60,874 | ||||||
| Dividends receivable | — | 7,000 | ||||||
| Inventories | 14,305 | 15,968 | ||||||
| Prepaid expenses | 6,688 | 7,954 | ||||||
| Deferred income taxes | 23,323 | 21,960 | ||||||
| Income tax receivable | — | 489 | ||||||
| Other | 10,839 | 13,591 | ||||||
| Assets of discontinued operations held for sale | 86,695 | 105,725 | ||||||
| Total current assets | 216,561 | 299,615 | ||||||
| Property, equipment, land and leasehold improvements, net | 580,087 | 592,435 | ||||||
| Restricted cash | 16,016 | 15,982 | ||||||
| Equipment lease receivables | 33,266 | 36,127 | ||||||
| Investment in unconsolidated business | 207,491 | 184,930 | ||||||
| Goodwill | 516,182 | 586,249 | ||||||
| Intangible assets, net | 751,081 | 811,973 | ||||||
| Deferred financing costs, net of accumulated amortization | 17,088 | 22,209 | ||||||
| Other | 1,449 | 2,916 | ||||||
| Total assets | $ | 2,339,221 | $ | 2,552,436 | ||||
| LIABILITIES AND MEMBERS’ EQUITY | ||||||||
| Current liabilities: | ||||||||
| Due to manager – related party | $ | 1,977 | $ | 3,521 | ||||
| Accounts payable | 44,575 | 45,565 | ||||||
| Accrued expenses | 17,432 | 23,189 | ||||||
| Current portion of notes payable and capital leases | 235 | 1,914 | ||||||
| Current portion of long-term debt | 45,900 | — | ||||||
| Fair value of derivative instruments | 49,573 | 45,464 | ||||||
| Customer deposits | 5,617 | 5,457 | ||||||
| Other | 9,338 | 10,201 | ||||||
| Liabilities of discontinued operations held for sale | 220,549 | 224,888 | ||||||
| Total current liabilities | 395,196 | 360,199 | ||||||
| Notes payable and capital leases, net of current portion | 1,498 | 1,622 | ||||||
| Long-term debt, net of current portion | 1,166,379 | 1,327,800 | ||||||
| Deferred income taxes | 107,840 | 83,228 | ||||||
| Fair value of derivative instruments | 54,794 | 105,970 | ||||||
| Other | 38,746 | 39,356 | ||||||
| Total liabilities | 1,764,453 | 1,918,175 | ||||||
| Commitments and contingencies | — | — | ||||||
| Members’ equity: | ||||||||
| LLC interests, no par value; 500,000,000 authorized; 45,292,913 LLC interests issued and outstanding at December 31, 2009 and 44,948,694 LLC interests issued and outstanding at December 31, 2008 | 959,897 | 956,956 | ||||||
| Additional paid in capital | 21,956 | — | ||||||
| Accumulated other comprehensive loss | (43,232 | ) | (97,190 | ) | ||||
| Accumulated deficit | (360,095 | ) | (230,928 | ) | ||||
| Total members’ equity | 578,526 | 628,838 | ||||||
| Noncontrolling interests | (3,758 | ) | 5,423 | |||||
| Total equity | 574,768 | 634,261 | ||||||
| Total liabilities and equity | $ | 2,339,221 | $ | 2,552,436 | ||||
| Year Ended December 31, 2010 | Year Ended December 31, 2009(1) | Year Ended December 31, 2008(1) | ||||||||||||
|---|---|---|---|---|---|---|---|---|---|---|---|---|---|---|
Revenue | ||||||||||||||
| Revenue from product sales | $ | 514,344 | $ | 394,200 | $ | 586,054 | ||||||||
| Revenue from product sales — utility | 113,752 | 95,769 | 121,770 | |||||||||||
| Service revenue | 204,852 | 215,349 | 264,851 | |||||||||||
| Financing and equipment lease income | 7,843 | 4,758 | 4,686 | |||||||||||
| Total revenue | 840,791 | 710,076 | 977,361 | |||||||||||
Costs and expenses | ||||||||||||||
| Cost of product sales | 326,734 | 233,376 | 408,690 | |||||||||||
| Cost of product sales — utility | 90,542 | 73,907 | 105,329 | |||||||||||
| Cost of services | 53,088 | 46,317 | 63,850 | |||||||||||
| Selling, general and administrative | 201,787 | 209,783 | 227,288 | |||||||||||
| Fees to manager — related party | 10,051 | 4,846 | 12,568 | |||||||||||
| Goodwill impairment | — | 71,200 | 52,000 | |||||||||||
| Depreciation | 29,721 | 36,813 | 40,140 | |||||||||||
| Amortization of intangibles | 34,898 | 60,892 | 61,874 | |||||||||||
| Loss on disposal of assets | 17,869 | — | — | |||||||||||
| Total operating expenses | 764,690 | 737,134 | 971,739 | |||||||||||
Operating income (loss) | 76,101 | (27,058 | ) | 5,622 | ||||||||||
Other income (expense) | ||||||||||||||
| Interest income | 29 | 119 | 1,090 | |||||||||||
Interest expense(2) | (106,834 | ) | (95,456 | ) | (88,652 | ) | ||||||||
| Equity in earnings and amortization charges of investee | 31,301 | 22,561 | 1,324 | |||||||||||
| Loss on derivative instruments | — | (25,238 | ) | (2,843 | ) | |||||||||
| Other income (expense), net | 712 | 570 | (198 | ) | ||||||||||
| Net income (loss) from continuing operations before income taxes | 1,309 | (124,502 | ) | (83,657 | ) | |||||||||
| Benefit for income taxes | 8,697 | 15,818 | 14,061 | |||||||||||
| Net income (loss) from continuing operations | $ | 10,006 | $ | (108,684 | ) | $ | (69,596 | ) | ||||||
| Net income (loss) from discontinued operations, net of taxes | 81,323 | (21,860 | ) | (110,045 | ) | |||||||||
| Net income (loss) | $ | 91,329 | $ | (130,544 | ) | $ | (179,641 | ) | ||||||
| Less: net income (loss) attributable to noncontrolling interests | 659 | (1,377 | ) | (1,168 | ) | |||||||||
| Net income (loss) attributable to MIC LLC | $ | 90,670 | $ | (129,167 | ) | $ | (178,473 | ) | ||||||
| Basic income (loss) per share from continuing operations attributable to MIC LLC interest holders | $ | 0.21 | $ | (2.43 | ) | $ | (1.56 | ) | ||||||
| Basic income (loss) per share from discontinued operations attributable to MIC LLC interest holders | 1.78 | (0.44 | ) | (2.41 | ) | |||||||||
| Basic income (loss) per share attributable to MIC LLC interest holders | $ | 1.99 | $ | (2.87 | ) | $ | (3.97 | ) | ||||||
| Weighted average number of shares outstanding: basic | 45,549,803 | 45,020,085 | 44,944,326 | |||||||||||
| Diluted income (loss) per share from continuing operations attributable to MIC LLC interest holders | $ | 0.21 | $ | (2.43 | ) | $ | (1.56 | ) | ||||||
| Diluted income (loss) per share from discontinued operations attributable to MIC LLC interest holders | 1.78 | (0.44 | ) | (2.41 | ) | |||||||||
| Diluted income (loss) per share attributable to MIC LLC interest holders | $ | 1.99 | $ | (2.87 | ) | $ | (3.97 | ) | ||||||
| Weighted average number of shares outstanding: diluted | 45,631,610 | 45,020,085 | 44,944,326 | |||||||||||
| Cash distributions declared per share | $ | — | $ | — | $ | 2.125 | ||||||||
| (1) | Reclassified to conform to current period presentation. |
| (2) | Interest expense includes non-cash losses on derivative instruments of $23.4 million and $4.3 million for the years ended December 31, 2010 and 2009, respectively. |
| Year Ended December 31, 2009 | Year Ended December 31, 2008(1) | Year Ended December 31, 2007(1) | ||||||||||||||
| ($ in Thousands, Except Share and Per Share Data) | ||||||||||||||||
| Revenue | ||||||||||||||||
| Revenue from product sales | $ | 394,200 | $ | 586,054 | $ | 445,852 | ||||||||||
| Revenue from product sales – utility | 95,769 | 121,770 | 95,770 | |||||||||||||
| Service revenue | 215,349 | 264,851 | 207,680 | |||||||||||||
| Financing and equipment lease income | 4,758 | 4,686 | 4,912 | |||||||||||||
| Total revenue | 710,076 | 977,361 | 754,214 | |||||||||||||
| Costs and expenses | ||||||||||||||||
| Cost of product sales | 231,139 | 406,997 | 302,283 | |||||||||||||
| Cost of product sales – utility | 71,252 | 103,216 | 64,371 | |||||||||||||
| Cost of services | 46,317 | 63,850 | 53,387 | |||||||||||||
| Selling, general and administrative | 214,865 | 231,273 | 185,370 | |||||||||||||
| Fees to manager – related party | 4,846 | 12,568 | 65,639 | |||||||||||||
| Goodwill impairment | 71,200 | 52,000 | — | |||||||||||||
| Depreciation | 36,813 | 40,140 | 20,502 | |||||||||||||
| Amortization of intangibles | 60,892 | 61,874 | 32,356 | |||||||||||||
| Total operating expenses | 737,324 | 971,918 | 723,908 | |||||||||||||
| Operating (loss) income | (27,248 | ) | 5,443 | 30,306 | ||||||||||||
| Other income (expense) | ||||||||||||||||
| Interest income | 119 | 1,090 | 5,705 | |||||||||||||
| Interest expense | (91,154 | ) | (88,652 | ) | (65,356 | ) | ||||||||||
| Loss on extinguishment of debt | — | — | (27,512 | ) | ||||||||||||
| Equity in earnings (losses) and amortization charges of investee | 22,561 | 1,324 | (32 | ) | ||||||||||||
| Loss on derivative instruments | (29,540 | ) | (2,843 | ) | (1,362 | ) | ||||||||||
| Other income (expense), net | 760 | (19 | ) | (1,088 | ) | |||||||||||
| Net loss from continuing operations before income taxes and noncontrolling interests | (124,502 | ) | (83,657 | ) | (59,339 | ) | ||||||||||
| Benefit for income taxes | 15,818 | 14,061 | 16,764 | |||||||||||||
| Net loss from continuing operations before noncontrolling interests | (108,684 | ) | (69,596 | ) | (42,575 | ) | ||||||||||
| Net income attributable to noncontrolling interests | 486 | 585 | 554 | |||||||||||||
| Net loss from continuing operations | $ | (109,170 | ) | $ | (70,181 | ) | $ | (43,129 | ) | |||||||
| Discontinued operations | ||||||||||||||||
| Net loss from discontinued operations before income taxes and noncontrolling interests | (23,647 | ) | (180,104 | ) | (9,679 | ) | ||||||||||
| Benefit (provision) for income taxes | 1,787 | 70,059 | (281 | ) | ||||||||||||
| Net loss from discontinued operations before noncontrolling interests | (21,860 | ) | (110,045 | ) | (9,960 | ) | ||||||||||
| Net loss attributable to noncontrolling interests | (1,863 | ) | (1,753 | ) | (1,035 | ) | ||||||||||
| Net loss from discontinued operations | $ | (19,997 | ) | $ | (108,292 | ) | $ | (8,925 | ) | |||||||
| Net loss | $ | (129,167 | ) | $ | (178,473 | ) | $ | (52,054 | ) | |||||||
| Basic and diluted loss per share from continuing operations | $ | (2.43 | ) | $ | (1.56 | ) | $ | (1.05 | ) | |||||||
| Basic and diluted loss per share from discontinued operations | (0.44 | ) | (2.41 | ) | (0.22 | ) | ||||||||||
| Basic and diluted loss per share | $ | (2.87 | ) | $ | (3.97 | ) | $ | (1.27 | ) | |||||||
| Weighted average number of shares outstanding: basic and diluted | 45,020,085 | 44,944,326 | 40,882,067 | |||||||||||||
| Cash distributions declared per share | $ | — | $ | 2.125 | $ | 2.385 | ||||||||||
See accompanying notes to the consolidated financial statements.
| Macquarie Infrastructure Company LLC Member’s Equity | |||||||||||||||||||||||||||||||||||
|---|---|---|---|---|---|---|---|---|---|---|---|---|---|---|---|---|---|---|---|---|---|---|---|---|---|---|---|---|---|---|---|---|---|---|---|
| LLC Interests | |||||||||||||||||||||||||||||||||||
| Number of Shares | Amount | Additional Paid in Capital | Accumulated Deficit | Accumulated Other Comprehensive (Loss) Income | Total Members’ Equity | Noncontrolling Interests | Total Equity | ||||||||||||||||||||||||||||
| Balance at December 31, 2007 | 44,938,380 | $ | 1,052,062 | $ | — | $ | (52,455 | ) | $ | (33,055 | ) | $ | 966,552 | $ | 7,172 | $ | 973,724 | ||||||||||||||||||
| Offering costs related to prior period issuance of LLC interests | — | (47 | ) | — | — | — | (47 | ) | — | (47 | ) | ||||||||||||||||||||||||
| Issuance of LLC interests to independent directors | 10,314 | 450 | — | — | — | 450 | — | 450 | |||||||||||||||||||||||||||
| Distributions to holders of LLC interests (comprising $0.635 per share paid on 44,938,380 shares, $0.645 per share paid on 44,948,694 shares, $0.645 per share paid on 44,948,694 shares and $0.20 per share paid on 44,948,694 shares) | — | (95,509 | ) | — | — | — | (95,509 | ) | — | (95,509 | ) | ||||||||||||||||||||||||
| Distributions to noncontrolling interest members | — | — | — | — | — | — | (481 | ) | (481 | ) | |||||||||||||||||||||||||
| Purchase of subsidiary interest from noncontrolling interest | — | — | — | — | — | — | (100 | ) | (100 | ) | |||||||||||||||||||||||||
| Other comprehensive loss: | |||||||||||||||||||||||||||||||||||
| Net loss for the year ended December 31, 2008 | — | — | — | (178,473 | ) | — | (178,473 | ) | (1,168 | ) | (179,641 | ) | |||||||||||||||||||||||
| Translation adjustment | — | — | — | — | (4 | ) | (4 | ) | — | (4 | ) | ||||||||||||||||||||||||
| Change in fair value of derivatives, net of taxes of $49,188 | — | — | — | — | (74,267 | ) | (74,267 | ) | — | (74,267 | ) �� | ||||||||||||||||||||||||
| Reclassification of realized losses of derivatives into earnings, net of taxes of $10,255 | — | — | — | — | 15,639 | 15,639 | — | 15,639 | |||||||||||||||||||||||||||
| Unrealized loss on marketable securities | — | — | — | — | (1 | ) | (1 | ) | — | (1 | ) | ||||||||||||||||||||||||
| Change in post-retirement benefit plans, net of taxes of $3,539 | — | — | — | — | (5,502 | ) | (5,502 | ) | — | (5,502 | ) | ||||||||||||||||||||||||
| Total comprehensive loss for the year ended December 31, 2008 | (242,608 | ) | (1,168 | ) | (243,776 | ) | |||||||||||||||||||||||||||||
| Balance at December 31, 2008 | 44,948,694 | $ | 956,956 | $ | — | $ | (230,928 | ) | $ | (97,190 | ) | $ | 628,838 | $ | 5,423 | $ | 634,261 | ||||||||||||||||||
| Issuance of LLC interests to manager | 330,104 | 2,491 | — | — | — | 2,491 | — | 2,491 | |||||||||||||||||||||||||||
| Issuance of LLC interests to independent directors | 14,115 | 450 | — | — | — | 450 | — | 450 | |||||||||||||||||||||||||||
| Distributions to noncontrolling interest members | — | — | — | — | — | — | (583 | ) | (583 | ) | |||||||||||||||||||||||||
| Sale of subsidiary interest to noncontrolling interest | — | — | 21,956 | — | 4,685 | 26,641 | (7,352 | ) | 19,289 | ||||||||||||||||||||||||||
| Other comprehensive loss: | |||||||||||||||||||||||||||||||||||
| Net loss for the year ended December 31, 2009 | — | — | — | (129,167 | ) | — | (129,167 | ) | (1,377 | ) | (130,544 | ) | |||||||||||||||||||||||
| Change in fair value of derivatives, net of taxes of $1,050 | — | — | — | — | 1,498 | 1,498 | — | 1,498 | |||||||||||||||||||||||||||
| Reclassification of realized losses of derivatives into earnings, net of taxes of $31,885 | — | — | — | — | 47,857 | 47,857 | 131 | 47,988 | |||||||||||||||||||||||||||
| Change in post-retirement benefit plans, net of taxes of $53 | — | — | — | — | (82 | ) | (82 | ) | — | (82 | ) | ||||||||||||||||||||||||
| Total comprehensive loss for the year ended December 31, 2009 | (79,894 | ) | (1,246 | ) | (81,140 | ) | |||||||||||||||||||||||||||||
| Balance at December 31, 2009 | 45,292,913 | $ | 959,897 | $ | 21,956 | $ | (360,095 | ) | $ | (43,232 | ) | $ | 578,526 | $ | (3,758 | ) | $ | 574,768 | |||||||||||||||||
| Macquarie Infrastructure Company LLC Member’s Equity | ||||||||||||||||||||||||||||||||
| Trust stock and LLC interests | Additional Paid in Capital | Accumulated Deficit | Accumulated Other Comprehensive Income (Loss) | Total Members’ Equity | Noncontrolling Interests(1) | Total Equity | ||||||||||||||||||||||||||
| Number of Shares | Amount | |||||||||||||||||||||||||||||||
| ($ in Thousands, Except Share and Per Share Data) | ||||||||||||||||||||||||||||||||
| Balance at December 31, 2006 | 37,562,165 | $ | 864,233 | $ | — | $ | — | $ | 192 | $ | 864,425 | $ | 8,181 | $ | 872,606 | |||||||||||||||||
| Issuance of LLC interests, net of offering costs | 6,165,871 | 241,330 | — | — | — | 241,330 | — | 241,330 | ||||||||||||||||||||||||
| Issuance of LLC interests to manager | 1,193,475 | 43,962 | — | — | — | 43,962 | — | 43,962 | ||||||||||||||||||||||||
| Issuance of LLC interests to independent directors | 16,869 | 450 | — | — | — | 450 | — | 450 | ||||||||||||||||||||||||
| Distributions to holders of LLC interests (comprising $0.57 per share paid on 37,562,165 shares, $0.59 per share paid on 37,562,165 shares, $0.605 per share paid on 43,766,877 shares and $0.62 per share paid on 44,938,380 shares) | — | (97,913 | ) | — | — | — | (97,913 | ) | — | (97,913 | ) | |||||||||||||||||||||
| Distributions to noncontrolling interest members | — | — | — | — | — | — | (528 | ) | (528 | ) | ||||||||||||||||||||||
| Other comprehensive loss: | ||||||||||||||||||||||||||||||||
| Net loss for the year ended December 31, 2007 | — | — | — | (52,054 | ) | — | (52,054 | ) | (481 | ) | (52,535 | ) | ||||||||||||||||||||
| Retained earnings adjustment relating to income taxes (FIN 48) | — | — | — | (401 | ) | — | (401 | ) | — | (401 | ) | |||||||||||||||||||||
| Change in fair value of derivatives, net of taxes of $21,702 | — | — | — | — | (30,731 | ) | (30,731 | ) | — | (30,731 | ) | |||||||||||||||||||||
| Reclassification of realized gains of derivatives into earnings, net of taxes of $1,905 | — | — | — | — | (2,855 | ) | (2,855 | ) | — | (2,855 | ) | |||||||||||||||||||||
| Change in post-retirement benefit plans, net of taxes of $218 | — | — | — | — | 339 | 339 | — | 339 | ||||||||||||||||||||||||
| Total comprehensive loss for the year ended December 31, 2007 | �� | (85,702 | ) | (481 | ) | (86,183 | ) | |||||||||||||||||||||||||
| Balance at December 31, 2007 | 44,938,380 | $ | 1,052,062 | $ | — | $ | (52,455 | ) | $ | (33,055 | ) | $ | 966,552 | $ | 7,172 | $ | 973,724 | |||||||||||||||
| Offering costs related to prior period issuance of LLC interests | — | (47 | ) | — | — | — | (47 | ) | — | (47 | ) | |||||||||||||||||||||
| Issuance of LLC interests to independent directors | 10,314 | 450 | — | — | — | 450 | — | 450 | ||||||||||||||||||||||||
| Distributions to holders of LLC interests (comprising $0.635 per share paid on 44,938,380 shares, $0.645 per share paid on 44,948,694 shares, $0.645 per share paid on 44,948,694 shares and $0.20 per share paid on 44,948,694 shares) | — | (95,509 | ) | — | — | — | (95,509 | ) | — | (95,509 | ) | |||||||||||||||||||||
| Distributions to noncontrolling interest members | — | — | — | — | — | — | (481 | ) | (481 | ) | ||||||||||||||||||||||
| Purchase of subsidiary interest from noncontrolling interest | — | — | — | — | — | — | (100 | ) | (100 | ) | ||||||||||||||||||||||
| Other comprehensive loss: | ||||||||||||||||||||||||||||||||
| Net loss for the year ended December 31, 2008 | — | — | — | (178,473 | ) | — | (178,473 | ) | (1,168 | ) | (179,641 | ) | ||||||||||||||||||||
| Translation adjustment | — | — | — | — | (4 | ) | (4 | ) | — | (4 | ) | |||||||||||||||||||||
See accompanying notes to the consolidated financial statements.
| Macquarie Infrastructure Company LLC Member’s Equity | |||||||||||||||||||||||||||||||||||
|---|---|---|---|---|---|---|---|---|---|---|---|---|---|---|---|---|---|---|---|---|---|---|---|---|---|---|---|---|---|---|---|---|---|---|---|
| LLC Interests | |||||||||||||||||||||||||||||||||||
| Number of Shares | Amount | Additional Paid in Capital | Accumulated Deficit | Accumulated Other Comprehensive (Loss) Income | Total Members’ Equity | Noncontrolling Interests | Total Equity | ||||||||||||||||||||||||||||
| Issuance of LLC interests to manager | 294,330 | $ | 4,083 | $ | — | $ | — | $ | — | $ | 4,083 | $ | — | $ | 4,083 | ||||||||||||||||||||
| Issuance of LLC interests to independent directors | 128,205 | 450 | — | — | — | 450 | — | 450 | |||||||||||||||||||||||||||
| Distributions to noncontrolling interest members | — | — | — | — | — | — | (5,346 | ) | (5,346 | ) | |||||||||||||||||||||||||
| Contributions from noncontrolling interest members | — | — | — | — | — | — | 300 | 300 | |||||||||||||||||||||||||||
| Sale of subsidiary noncontrolling interest | — | — | — | — | — | — | 1,727 | 1,727 | |||||||||||||||||||||||||||
| Other comprehensive income: | |||||||||||||||||||||||||||||||||||
| Net income for the year ended December 31, 2010 | — | — | — | 90,670 | — | 90,670 | 659 | 91,329 | |||||||||||||||||||||||||||
| Reclassification of realized losses of derivatives into earnings, net of taxes of $11,720 | — | — | — | — | 17,572 | 17,572 | 1,964 | 19,536 | |||||||||||||||||||||||||||
| Change in post-retirement benefit plans, net of taxes of $98 | — | — | — | — | (152 | ) | (152 | ) | — | (152 | ) | ||||||||||||||||||||||||
| Total comprehensive income for the year ended December 31, 2010 | 108,090 | 2,623 | 110,713 | ||||||||||||||||||||||||||||||||
| Balance at December 31, 2010 | 45,715,448 | $ | 964,430 | $ | 21,956 | $ | (269,425 | ) | $ | (25,812 | ) | $ | 691,149 | $ | (4,454 | ) | $ | 686,695 | |||||||||||||||||
| Macquarie Infrastructure Company LLC Member’s Equity | ||||||||||||||||||||||||||||||||
| Trust stock and LLC interests | Additional Paid in Capital | Accumulated Deficit | Accumulated Other Comprehensive Income (Loss) | Total Members’ Equity | Noncontrolling Interests(1) | Total Equity | ||||||||||||||||||||||||||
| Number of Shares | Amount | |||||||||||||||||||||||||||||||
| ($ in Thousands, Except Share and Per Share Data) | ||||||||||||||||||||||||||||||||
| Change in fair value of derivatives, net of taxes of $49,188 | — | — | — | — | (74,267 | ) | (74,267 | ) | — | (74,267 | ) | |||||||||||||||||||||
| Reclassification of realized losses of derivatives into earnings, net of taxes of $10,255 | — | — | — | — | 15,639 | 15,639 | — | 15,639 | ||||||||||||||||||||||||
| Unrealized loss on marketable securities | — | — | — | — | (1 | ) | (1 | ) | — | (1 | ) | |||||||||||||||||||||
| Change in post-retirement benefit plans, net of taxes of $3,539 | — | — | — | — | (5,502 | ) | (5,502 | ) | — | (5,502 | ) | |||||||||||||||||||||
| Total comprehensive loss for the year ended December 31, 2008 | (242,608 | ) | (1,168 | ) | (243,776 | ) | ||||||||||||||||||||||||||
| Balance at December 31, 2008 | 44,948,694 | $ | 956,956 | $ | — | $ | (230,928 | ) | $ | (97,190 | ) | $ | 628,838 | $ | 5,423 | $ | 634,261 | |||||||||||||||
| Issuance of LLC interests to manager | 330,104 | 2,491 | — | — | — | 2,491 | — | 2,491 | ||||||||||||||||||||||||
| Issuance of LLC interests to independent directors | 14,115 | 450 | — | — | — | 450 | — | 450 | ||||||||||||||||||||||||
| Distributions to noncontrolling interest members | — | — | — | — | — | — | (583 | ) | (583 | ) | ||||||||||||||||||||||
| Sale of subsidiary interest to noncontrolling interest | — | — | 21,956 | — | 4,685 | 26,641 | (7,352 | ) | 19,289 | |||||||||||||||||||||||
| Other comprehensive loss: | ||||||||||||||||||||||||||||||||
| Net loss for the year ended December 31, 2009 | — | — | — | (129,167 | ) | — | (129,167 | ) | (1,377 | ) | (130,544 | ) | ||||||||||||||||||||
| Change in fair value of derivatives, net of taxes of $1,050 | — | — | — | — | 1,498 | 1,498 | — | 1,498 | ||||||||||||||||||||||||
| Reclassification of realized losses of derivatives into earnings, net of taxes of $31,885 | — | — | — | — | 47,857 | 47,857 | 131 | 47,988 | ||||||||||||||||||||||||
| Change in post-retirement benefit plans, net of taxes of $53 | — | — | — | — | (82 | ) | (82 | ) | — | (82 | ) | |||||||||||||||||||||
| Total comprehensive loss for the year ended December 31, 2009 | (79,894 | ) | (1,246 | ) | (81,140 | ) | ||||||||||||||||||||||||||
| Balance at December 31, 2009 | 45,292,913 | $ | 959,897 | $ | 21,956 | $ | (360,095 | ) | $ | (43,232 | ) | $ | 578,526 | $ | (3,758 | ) | $ | 574,768 | ||||||||||||||
| Year Ended December 31, 2010 | Year Ended December 31, 2009(1) | Year Ended December 31, 2008(1) | ||||||||||||
|---|---|---|---|---|---|---|---|---|---|---|---|---|---|---|
Operating activities | ||||||||||||||
| Net income (loss) | $ | 91,329 | $ | (130,544 | ) | $ | (179,641 | ) | ||||||
| Adjustments to reconcile net income (loss) to net cash provided by operating activities from continuing operations: | ||||||||||||||
| Net (income) loss from discontinued operations before noncontrolling interests | (81,323 | ) | 21,860 | 110,045 | ||||||||||
| Non-cash goodwill impairment | — | 71,200 | 52,000 | |||||||||||
| Depreciation and amortization of property and equipment | 36,276 | 42,899 | 45,953 | |||||||||||
| Amortization of intangible assets | 34,898 | 60,892 | 61,874 | |||||||||||
| Loss on disposal of assets | 17,869 | — | — | |||||||||||
| Equity in earnings and amortization charges of investees | (31,301 | ) | (22,561 | ) | (1,324 | ) | ||||||||
| Equity distributions from investees | 15,000 | 7,000 | 1,324 | |||||||||||
| Amortization of debt financing costs | 4,347 | 5,121 | 4,762 | |||||||||||
| Non-cash derivative loss | 23,410 | 29,540 | 2,843 | |||||||||||
| Base management fees settled in LLC interests | 5,403 | 4,384 | — | |||||||||||
| Equipment lease receivable, net | 2,761 | 2,752 | 2,460 | |||||||||||
| Deferred rent | 413 | 183 | 183 | |||||||||||
| Deferred taxes | (11,729 | ) | (17,923 | ) | (16,037 | ) | ||||||||
| Other non-cash expenses, net | 1,817 | 2,115 | 4,115 | |||||||||||
| Changes in other assets and liabilities, net of acquisitions: | ||||||||||||||
| Restricted cash | 50 | — | — | |||||||||||
| Accounts receivable | (2,424 | ) | 13,020 | 16,392 | ||||||||||
| Inventories | (2,833 | ) | 1,233 | 2,698 | ||||||||||
| Prepaid expenses and other current assets | 453 | 2,944 | 6,840 | |||||||||||
| Due to manager — related party | (15 | ) | (3,438 | ) | (2,216 | ) | ||||||||
| Accounts payable and accrued expenses | (4,821 | ) | (4,670 | ) | (17,132 | ) | ||||||||
| Income taxes payable | 1,051 | 535 | (1,108 | ) | ||||||||||
| Other, net | (2,076 | ) | (3,566 | ) | 1,548 | |||||||||
| Net cash provided by operating activities from continuing operations | 98,555 | 82,976 | 95,579 | |||||||||||
Investing activities | ||||||||||||||
| Acquisitions of businesses and investments, net of cash acquired | — | — | (41,804 | ) | ||||||||||
| Proceeds from sale of investment | — | 29,500 | 7,557 | |||||||||||
| Purchases of property and equipment | (22,690 | ) | (30,320 | ) | (49,560 | ) | ||||||||
| Investment in capital leased assets | (2,976 | ) | — | — | ||||||||||
| Return of investment in unconsolidated business | — | — | 26,676 | |||||||||||
| Other | 892 | 304 | 415 | |||||||||||
| Net cash used in investing activities from continuing operations | (24,774 | ) | (516 | ) | (56,716 | ) | ||||||||
| Year Ended December 31, 2010 | Year Ended December 31, 2009(1) | Year Ended December 31, 2008(1) | ||||||||||||
|---|---|---|---|---|---|---|---|---|---|---|---|---|---|---|
Financing activities | ||||||||||||||
| Proceeds from long-term debt | $ | 141 | $ | 10,000 | $ | 5,000 | ||||||||
| Net proceeds (payments) on line of credit facilities | 500 | (45,400 | ) | 96,150 | ||||||||||
| Offering and equity raise costs paid | — | — | (65 | ) | ||||||||||
| Distributions paid to holders of LLC interests | — | — | (95,509 | ) | ||||||||||
| Contributions received from noncontrolling interests | 300 | — | — | |||||||||||
| Distributions paid to noncontrolling interests | (5,346 | ) | (583 | ) | (481 | ) | ||||||||
| Payment of long-term debt | (74,036 | ) | (81,621 | ) | — | |||||||||
| Debt financing costs paid | (186 | ) | — | (1,879 | ) | |||||||||
| Change in restricted cash | 2,236 | (33 | ) | (865 | ) | |||||||||
| Payment of notes and capital lease obligations | (137 | ) | (181 | ) | (653 | ) | ||||||||
| Net cash (used in) provided by financing activities from continuing operations | (76,528 | ) | (117,818 | ) | 1,698 | |||||||||
| Net change in cash and cash equivalents from continuing operations | (2,747 | ) | (35,358 | ) | 40,561 | |||||||||
Cash flows (used in) provided by discontinued operations: | ||||||||||||||
| Net cash used in operating activities | (12,703 | ) | (4,732 | ) | (1,904 | ) | ||||||||
| Net cash provided by (used in) investing activities | 134,356 | (445 | ) | (26,684 | ) | |||||||||
| Net cash (used in) provided by financing activities | (124,183 | ) | 2,144 | (1,215 | ) | |||||||||
Cash used in discontinued operations(2) | (2,530 | ) | (3,033 | ) | (29,803 | ) | ||||||||
Change in cash of discontinued operations held for sale(2) | 2,385 | (208 | ) | 2,459 | ||||||||||
| Net change in cash and cash equivalent | (2,892 | ) | (38,599 | ) | 13,217 | |||||||||
| Cash and cash equivalents, beginning of period | 27,455 | 66,054 | 52,837 | |||||||||||
| Cash and cash equivalents, end of period-continuing operations | $ | 24,563 | $ | 27,455 | $ | 66,054 | ||||||||
Supplemental disclosures of cash flow information for continuing operations: | ||||||||||||||
| Non-cash investing and financing activities: | ||||||||||||||
| Accrued purchases of property and equipment | $ | 431 | $ | 1,277 | $ | 883 | ||||||||
| Acquisition of equipment through capital leases | $ | 139 | $ | — | $ | — | ||||||||
| Issuance of LLC interests to manager for base management fees | $ | 4,083 | $ | 2,490 | $ | — | ||||||||
| Issuance of LLC interests to independent directors | $ | 450 | $ | 450 | $ | 450 | ||||||||
| Taxes paid | $ | 1,655 | $ | 1,231 | $ | 3,048 | ||||||||
| Interest paid | $ | 78,718 | $ | 87,308 | $ | 84,235 | ||||||||
| (1) | Reclassified to conform to current period presentation. |
See accompanying notes to the consolidated financial statements.
| Year Ended December 31, 2009 | Year Ended December 31, 2008(1) | Year Ended December 31, 2007(1) | ||||||||||||
| ($ In Thousands) | ||||||||||||||
| Operating activities | ||||||||||||||
| Net loss | $ | (129,167 | ) | $ | (178,473 | ) | $ | (52,054 | ) | |||||
| Adjustments to reconcile net loss to net cash provided by operating activities: | ||||||||||||||
| Net loss from discontinued operations | 19,997 | 108,292 | 8,925 | |||||||||||
| Non-cash goodwill impairment | 71,200 | 52,000 | — | |||||||||||
| Depreciation and amortization of property and equipment | 42,899 | 45,953 | 26,294 | |||||||||||
| Amortization of intangible assets | 60,892 | 61,874 | 32,356 | |||||||||||
| Equity in (earnings) losses and amortization charges of investees | (22,561 | ) | (1,324 | ) | 32 | |||||||||
| Equity distributions from investees | 7,000 | 1,324 | — | |||||||||||
| Amortization of debt financing costs | 5,121 | 4,762 | 4,429 | |||||||||||
| Non-cash derivative loss (gain), net of non-cash interest expense (income) | 29,540 | 2,843 | (2,693 | ) | ||||||||||
| Base management and performance fees settled/to be settled in LLC interests | 4,384 | — | 43,962 | |||||||||||
| Equipment lease receivable, net | 2,610 | 2,372 | 2,531 | |||||||||||
| Deferred rent | 183 | 183 | 178 | |||||||||||
| Deferred taxes | (17,923 | ) | (16,037 | ) | (22,536 | ) | ||||||||
| Other non-cash expenses, net | 2,601 | 4,700 | 4,243 | |||||||||||
| Non-operating losses relating to foreign investments | — | — | 3,437 | |||||||||||
| Loss on extinguishment of debt | — | — | 27,512 | |||||||||||
| Changes in other assets and liabilities, net of acquisitions: | ||||||||||||||
| Restricted cash | — | — | 264 | |||||||||||
| Accounts receivable | 13,020 | 16,392 | (12,244 | ) | ||||||||||
| Inventories | 1,233 | 2,698 | (3,291 | ) | ||||||||||
| Prepaid expenses and other current assets | 3,086 | 6,928 | 605 | |||||||||||
| Due to manager – related party | (3,438 | ) | (2,216 | ) | 1,453 | |||||||||
| Accounts payable and accrued expenses | (4,670 | ) | (17,132 | ) | 22,923 | |||||||||
| Income taxes payable | 535 | (1,108 | ) | 4,981 | ||||||||||
| Other, net | (3,566 | ) | 1,548 | 2,192 | ||||||||||
| Net cash provided by operating activities from continuing operations | 82,976 | 95,579 | 93,499 | |||||||||||
| Investing activities | ||||||||||||||
| Acquisitions of businesses and investments, net of cash acquired | — | (41,804 | ) | (704,171 | ) | |||||||||
| Proceeds from sale of equity investment | — | — | 84,904 | |||||||||||
| Proceeds from sale of investment | 29,500 | 7,557 | 160 | |||||||||||
| Settlements of non-hedging derivative instruments | — | — | (2,530 | ) | ||||||||||
| Purchases of property and equipment | (30,320 | ) | (49,560 | ) | (45,721 | ) | ||||||||
| Return of investment in unconsolidated business | — | 26,676 | 28,000 | |||||||||||
| Other | 304 | 415 | 505 | |||||||||||
| Net cash used in investing activities from continuing operations | (516 | ) | (56,716 | ) | (638,853 | ) | ||||||||
See accompanying notes to the consolidated financial statements.
| Year Ended December 31, 2009 | Year Ended December 31, 2008(1) | Year Ended December 31, 2007(1) | ||||||||||||
| ($ In Thousands) | ||||||||||||||
| Financing activities | ||||||||||||||
| Proceeds from issuance of LLC interests | — | — | 252,739 | |||||||||||
| Proceeds from long-term debt | 10,000 | 5,000 | 1,356,625 | |||||||||||
| Net (payments) proceeds on line of credit facilities | (45,400 | ) | 96,150 | 11,560 | ||||||||||
| Offering and equity raise costs paid | — | (65 | ) | (11,392 | ) | |||||||||
| Distributions paid to holders of LLC interests | — | (95,509 | ) | (97,913 | ) | |||||||||
| Distributions paid to noncontrolling interests | (583 | ) | (481 | ) | (395 | ) | ||||||||
| Payment of long-term debt | (81,621 | ) | — | (904,500 | ) | |||||||||
| Debt financing costs paid | — | (1,879 | ) | (26,234 | ) | |||||||||
| Make — whole payment on debt refinancing | — | — | (14,695 | ) | ||||||||||
| Change in restricted cash | (33 | ) | (865 | ) | 5,367 | |||||||||
| Payment of notes and capital lease obligations | (181 | ) | (653 | ) | (544 | ) | ||||||||
| Net cash (used in) provided by financing activities from continuing operations | (117,818 | ) | 1,698 | 570,618 | ||||||||||
| Net change in cash and cash equivalents from continuing operations | (35,358 | ) | 40,561 | 25,264 | ||||||||||
| Cash flows (used in) provided by discontinued operations: | ||||||||||||||
| Net cash (used in) provided by operating activities | (4,732 | ) | (1,904 | ) | 3,051 | |||||||||
| Net cash used in investing activities | (445 | ) | (26,684 | ) | (5,157 | ) | ||||||||
| Net cash provided by (used in) financing activities | 2,144 | (1,215 | ) | (3,072 | ) | |||||||||
| Cash used in discontinued operations(2) | (3,033 | ) | (29,803 | ) | (5,178 | ) | ||||||||
| Change in cash of discontinued operations held for sale(2) | (208 | ) | 2,459 | 5,902 | ||||||||||
| Effect of exchange rate changes on cash | — | — | (1 | ) | ||||||||||
| Net change in cash and cash equivalent | (38,599 | ) | 13,217 | 25,987 | ||||||||||
| Cash and cash equivalents, beginning of period | 66,054 | 52,837 | 26,850 | |||||||||||
| Cash and cash equivalents, end of period | $ | 27,455 | $ | 66,054 | $ | 52,837 | ||||||||
| Supplemental disclosures of cash flow information for continuing operations: | ||||||||||||||
| Non-cash investing and financing activities: | ||||||||||||||
| Accrued acquisition and equity offering costs | $ | — | $ | — | $ | 1,208 | ||||||||
| Accrued purchases of property and equipment | $ | 1,277 | $ | 883 | $ | 1,647 | ||||||||
| Acquisition of equipment through capital leases | $ | — | $ | — | $ | 30 | ||||||||
| Issuance of LLC interests to manager for base management and performance fees | $ | 2,490 | $ | — | $ | 43,962 | ||||||||
| Issuance of LLC interests to independent directors | $ | 450 | $ | 450 | $ | 450 | ||||||||
| Taxes paid | $ | 1,231 | $ | 3,048 | $ | 3,632 | ||||||||
| Interest paid | $ | 87,308 | $ | 84,235 | $ | 77,914 | ||||||||
| (2) |
| Cash of discontinued operations held for sale is reported in assets of discontinued operations held for sale in the accompanying consolidated balance sheets. The cash used in discontinued operations is different than the change in cash of discontinued operations held for sale due to intercompany transactions that are eliminated in consolidation. |
Macquarie Infrastructure Company Trust, or the Trust,
On January 28, 2010, the Company agreed to sell the assets in its airport parking business (“Parking Company of America Airports” or “PCAA”) through a bankruptcy process which the Company expects to complete in the first half of 2010. This business is now a discontinued operation and is therefore separately reported in the Company’s consolidated financial statements and is no longer a reportable segment.
voting shares is a condition for consolidation. For investments in variable interest entities, the Company consolidates when it is determined to be the primary beneficiary of the variable interest entity. As of December 31, 2009,2010, the Company was not the primary beneficiary of any variable interest entity in which it did not own a majority of the outstanding voting stock.
| 10 to 68 years | |||||||
| Leasehold and land improvements | 5 to 40 years | ||||||
| Machinery and equipment | 5 to 62 years | ||||||
| Furniture and Fixtures | 3 to 25 years | ||||||
| Customer relationships | 5 to 10 years | ||||||
| Contract rights | 5 to 40 years | ||||||
| Non-compete agreements | 2 to 5 years | ||||||
| Leasehold interests | 3 to | ||||||
| Trade names | Indefinite | ||||||
| Technology | 5 years | ||||||
Previously, Atlantic Aviation also had management contracts to operate regional airports or aviation-related facilities. Management fees were recognized pro rata over the service period based on negotiated contractual terms. All costs incurred under these contracts were reimbursed entirely by the customer and were generally invoiced with the related management fee. As the business was acting as an agent in these contracts, the amount invoiced was recorded as revenue net of the reimbursable costs. In December 2008, Atlantic Aviation sold its management contracts business.
In April 2009, the Financial Accounting Standards Board, or FASB, issued ASC 825-10-65Financial Instruments (formerly FSP SFAS No. 107-1 and APB 28-1, “Interim Disclosures about Fair Value of Financial Instruments”), which is effective for interim reporting periods ending after June 15, 2009. This guidance requires disclosures about the fair value of financial instruments for interim reporting periods in addition to the current requirement to make disclosure in annual financial statements. This guidance also requires disclosure of the methods and significant assumptions used to estimate the fair value of financial instruments and description
of changes in the method and significant assumptions. The Company adopted this guidance during the second quarter of 2009. Since this guidance requires only additional disclosures, the adoption did not have a material impact on the Company’s financial results of operations and financial condition. (Continued)
In February 2008, the FASB issued ASC 820Fair Value Measurements and Disclosures (formerly FSP SFAS No. 157-1, “Application of SFAS No. 157 to SFAS No. 13 and Other Accounting Pronouncements That Address Fair Value Measurements for Purposes of Lease Classification or Measurement under SFAS No. 13”, and FSP SFAS No. 157-2, “Effective Date of FASB Statement No. 157”) affecting the implementation of SFAS No. 157. This guidance excludes ASC 840-10 Leases (formerly SFAS No. 13, “Accounting for Leases”), and other accounting pronouncements that address fair value measurements under SFAS No. 13 from the scope of SFAS No. 157. However, the scope of this exception does apply to assets acquired and liabilities assumed in a business combination that are required to be measured at fair value in accordance with ASC 805-10Business Combinations (formerly SFAS No. 141(R), “Business Combinations”) regardless of whether those assets and liabilities are related to leases. This guidance delayed the effective date of SFAS No. 157 for nonfinancial assets and nonfinancial liabilities, except for items that are recognized or disclosed at fair value on a recurring basis (at least annually), to fiscal years beginning after November 15, 2008. On January 1, 2009, the Company adopted SFAS No. 157 for all nonfinancial assets and liabilities. Major categories of nonfinancial assets and liabilities to which this accounting standard applies include, but are not limited to, the Company’s property, equipment, land and leasehold improvements, intangible assets and goodwill. See Note 10, “Nonfinancial Assets Measured at Fair Value”, for further discussion.
In March 2008, the FASB issued ASC 815-10Derivatives and Hedging (formerly SFAS No. 161, “Disclosure about Derivative Instruments and Hedging Activities — an amendment of SFAS No. 133”), which requires companies with derivative instruments to disclose information about how and why a company uses derivative instruments; how derivative instruments and related hedged items are accounted for and how derivative instruments and related hedged items affect a company’s financial position, financial performance and cash flows. The required disclosures include the fair value of derivative instruments and their gains or losses in tabular format, information about credit-risk-related contingent features in derivative agreements, counterparty credit risk, and the company’s strategies and objectives for using derivative instruments. This guidance is effective for periods beginning after November 15, 2008. The Company adopted this guidance on January 1, 2009. Since this guidance requires only additional disclosures concerning derivatives and hedging activities, the adoption did not have a material impact on the Company’s financial results of operations and financial condition. See Note 13, “Derivative Instruments and Hedging Activities”, for further discussion.
In December 2008, the FASB issued ASC 715-20Compensation — Retirement Benefits (formerly FSP SFAS No. 132(R)-1, “Employers’ Disclosures about Postretirement Benefit Plan Assets”). This guidance requires additional disclosures surrounding how investment allocation decisions are made, including the factors that are pertinent to an understanding of investment policies and strategies, the fair value of each of the major categories of plan assets, the inputs and valuation techniques used to measure the fair value of plan assets, and the significant concentration of risks in plan assets. The disclosure requirement is effective for fiscal years ending after December 15, 2009. The Company adopted this guidance for the year-ended December 31, 2009 and it did not have a material impact on the financial statements.
In November 2008, the FASB ratified ASC 323Investments — Equity Method and Joint Ventures (formerly EITF 08-6, “Equity Method Investment Accounting Considerations''). This guidance concludes that the cost basis of a new equity-method investment would be determined using a cost-accumulation model, which would continue the practice of including transaction costs in the cost of investment and would exclude the value of contingent consideration unless it is required to be recognized under other literature, such as ASC 450-20Contingencies (formerly SFAS No. 5, “Accounting for Contingencies ”). Equity-method investment should be subject to other-than-temporary impairment analysis. It also requires a gain or loss to be recognized on the portion of the investor’s ownership sold. This guidance is effective for fiscal years beginning on or
after December 15, 2008, with early adoption prohibited. The Company adopted this guidance on January 1, 2009 and the impact of the adoption did not have a material impact on the Company’s financial results of operations and financial condition.
In April 2008, the FASB issued ASC 350-30Intangibles — Goodwill and Other (formerly FSP SFAS No. 142-3, “Determination of the Useful Life of Intangible Assets”). This guidance amends the factors an entity should consider in developing renewal or extension assumptions used in determining the useful life of recognized intangible assets. Companies estimating the useful life of a recognized intangible asset must now consider their historical experience in renewing or extending similar arrangements or, in the absence of historical experience, must consider assumptions that market participants would use about renewal or extension as adjusted for entity-specific factors. This guidance is effective for financial statements issued for fiscal years and interim periods beginning after December 15, 2008. Early adoption is prohibited. The Company adopted this guidance and the impact of the adoption did not have a material impact on the Company’s financial results of operations and financial condition.
In December 2007, the FASB issued ASC 810-10Consolidation (formerly SFAS No. 160, “Noncontrolling Interests in Consolidated Financial Statements — an amendment of ARB NO. 51”), which requires noncontrolling interests (previously referred to as minority interests) to be treated as a separate component of equity, not as a liability or other item outside of permanent equity. This guidance is effective for periods beginning on or after December 15, 2008 and will be applied prospectively to all noncontrolling interests with comparative period information reclassified. The Company adopted this guidance on January 1, 2009 and adoption did not have a material impact on the Company’s financial results of operations and financial condition.
In December 2007, the FASB revised ASC 805-10Business Combinations (formerly SFAS No. 141(R)). The revised standard includes various changes to the business combination rules. Some of the changes include immediate expensing of acquisition-related costs rather than capitalization, and 100% of the fair value of assets and liabilities acquired being recorded, even if less than 100% of a controlled business is acquired. This guidance is effective for business combinations consummated in periods beginning on or after December 15, 2008. For any business combinations completed after January 1, 2009, the Company expects the revised standard to have the following material impacts on its financial statements compared with previously applicable business combination rules: (1) increased selling, general and administrative costs due to immediate expensing of acquisition costs, resulting in lower net income; (2) lower cash provided by operating activities and lower cash used in investing activities in the statements of cash flows due to the immediate expensing of acquisition costs, which under previous rules were included as cash out flows in investing activities as part of the purchase price of the business; and (3) 100% of fair values recorded for assets and liabilities including noncontrolling interests of a controlled business on the balance sheet resulting in larger assets, liability and equity balances compared with previous business combination rules. On January 1, 2009, the Company adopted this guidance. Although the Company did not complete any new business combinations during 2009, the Company used the guidance from this pronouncement to perform goodwill impairment analysis. See Note 10, “Nonfinancial Assets Measured at Fair Value”, for further discussion.
| Year Ended December 31, | |||||||||||||||
|---|---|---|---|---|---|---|---|---|---|---|---|---|---|---|---|
| 2010 | 2009 | 2008 | |||||||||||||
| Weighted average number of shares outstanding: basic | 45,549,803 | 45,020,085 | 44,944,326 | ||||||||||||
| Dilutive effect of restricted stock unit grants | 81,807 | — | — | ||||||||||||
| Weighted average number of shares outstanding: diluted | 45,631,610 | 45,020,085 | 44,944,326 | ||||||||||||
| Year Ended December 31, | ||||||||||||
| 2009 | 2008 | 2007 | ||||||||||
| Weighted average number of shares outstanding: basic | 45,020,085 | 44,944,326 | 40,882,067 | |||||||||
| Dilutive effect of restricted stock unit grants | — | — | — | |||||||||
| Weighted average number of shares outstanding: diluted | 45,020,085 | 44,944,326 | 40,882,067 | |||||||||
The 10,314 restricted stock unit grants provided toeffect of potentially dilutive shares for the Company’s independent directors on May 24, 2007, the 14,115 restricted stock unit grants provided to our independent directors on May 27, 2008 andyear ended December 31, 2010 is calculated assuming that the 128,205 restricted stock unit grants provided to ourthe independent directors on June 4, 2009, which vested in 2010, and the 31,989 restricted stock unit grants on June 3, 2010, which will vest in 2011, had been fully converted to shares on those grant dates. However, the restricted stock unit grants were anti-dilutive in 2007,for the years ended December 31, 2009 and 2008, and 2009 due to the Company’s net loss for those years.periods.
As part of the bankruptcy filing,PCAA during 2010, the Company has no obligation to and has no intentionreduced its valuation allowance on the realization of committing additional capital to this business. Creditors of this business do not have recourse to any assetsa portion of the holding company or anydeferred tax assets ofattributable to its basis in PCAA and its consolidated federal net operating losses. The change in the other Company’s businesses, other than approximately $5.3 million relating to a guarantee of a single parking facility lease.
Results for PCAA are reported separately asvaluation allowance recorded in discontinued operations was $9.6 million.
| December 31, 2009 | ||||||
|---|---|---|---|---|---|---|
| ($ in Thousands) | ||||||
Assets | ||||||
| Total current assets | $ | 7,676 | ||||
| Property, equipment, land and leasehold improvements, net | 77,524 | |||||
| Other non-current assets | 1,495 | |||||
| Total assets | $ | 86,695 | ||||
Liabilities | ||||||
| Current portion of long-term debt | $ | 200,999 | ||||
| Other current liabilities | 10,761 | |||||
| Total current liabilities | 211,760 | |||||
| Other non-current liabilities | 8,789 | |||||
| Total liabilities | 220,549 | |||||
| Noncontrolling interest | (1,863 | ) | ||||
| Total liabilities and noncontrolling interest | $ | 218,686 | ||||
| December 31, 2009 | December 31, 2008 | |||||||
| ($ in Thousands) | ||||||||
| Assets | ||||||||
| Total current assets | $ | 7,676 | $ | 5,789 | ||||
| Property, equipment, land and leasehold improvements, net | 77,524 | 93,476 | ||||||
| Other non-current assets | 1,495 | 6,460 | ||||||
| Total assets | $ | 86,695 | $ | 105,725 | ||||
| Liabilities | ||||||||
| Current portion of long-term debt | $ | 200,999 | $ | 201,344 | ||||
| Other current liabilities | 10,761 | 15,951 | ||||||
| Total current liabilities | 211,760 | 217,295 | ||||||
| Other non-current liabilities | 8,789 | 7,593 | ||||||
| Total liabilities | 220,549 | 224,888 | ||||||
| Noncontrolling interest | (1,863 | ) | — | |||||
| Total liabilities and noncontrolling interest | $ | 218,686 | $ | 224,888 | ||||
Summarized financial information for discontinued operations related to PCAA for the years ended December 31, 2010, 2009 2008 and 20072008 are as follows:
| For the Year Ended December 31, | |||||||||||||||
|---|---|---|---|---|---|---|---|---|---|---|---|---|---|---|---|
| 2010 | 2009 | 2008 | |||||||||||||
| ($ in Thousands, Except Share and Per Share Data) | |||||||||||||||
| Service revenue | $ | 28,826 | $ | 68,457 | $ | 74,692 | |||||||||
| Gain on sale of assets through bankruptcy (pre-tax) | 130,260 | — | — | ||||||||||||
| Net income (loss) from discontinued operations before income taxes and noncontrolling interest | $ | 132,709 | $ | (23,647 | ) | $ | (180,104 | ) | |||||||
| (Provision) benefit for income taxes | (51,386 | ) | 1,787 | 70,059 | |||||||||||
| Net income (loss) from discontinued operations | 81,323 | (21,860 | ) | (110,045 | ) | ||||||||||
| Less: net income (loss) attributable to noncontrolling interests | 136 | (1,863 | ) | (1,753 | ) | ||||||||||
| Net income (loss) from discontinued operations attributable to MIC LLC | $ | 81,187 | $ | (19,997 | ) | $ | (108,292 | ) | |||||||
| Basic income (loss) per share from discontinued operations attributable to MIC LLC interest holders | $ | 1.78 | $ | (0.44 | ) | $ | (2.41 | ) | |||||||
| Weighted average number of shares outstanding at the Company level: basic | 45,549,803 | 45,020,085 | 44,944,326 | ||||||||||||
| Diluted income (loss) per share from discontinued operations attributable to MIC LLC interest holders | $ | 1.78 | $ | (0.44 | ) | $ | (2.41 | ) | |||||||
| Weighted average number of shares outstanding at the Company level: diluted | 45,631,610 | 45,020,085 | 44,944,326 | ||||||||||||
| For the Year Ended December 31, 2009 | For the Year Ended December 31, 2008 | For the Year Ended December 31, 2007 | ||||||||||
| ($ in Thousands, Except Share Data) | ||||||||||||
| Service revenue | $ | 68,457 | $ | 74,692 | $ | 77,180 | ||||||
| Net loss from discontinued operations before income taxes and noncontrolling interest | $ | (23,647 | ) | $ | (180,104 | ) | $ | (9,679 | ) | |||
| Income tax benefit (provision) | 1,787 | 70,059 | (281 | ) | ||||||||
| Net loss from discontinued operations before noncontrolling interest | (21,860 | ) | (110,045 | ) | (9,960 | ) | ||||||
| Net loss attributable to noncontrolling interests | (1,863 | ) | (1,753 | ) | (1,035 | ) | ||||||
| Net loss from discontinued operations | $ | (19,997 | ) | $ | (108,292 | ) | $ | (8,925 | ) | |||
| Basic and diluted loss per share from discontinued operations | $ | (0.44 | ) | $ | (2.41 | ) | $ | (0.22 | ) | |||
| Weighted average number of shares outstanding at the Company level: basic and diluted | 45,020,085 | 44,944,326 | 40,882,067 | |||||||||
On March 4, 2008,
The cost of the acquisition, including transaction costs, was $41.9 million and the Company has pre-funded integration costs of $300,000. The Company financed the acquisition with borrowings under the MIC Inc. revolving credit facility, which was fully repaid during 2009. See Note 12, “Long-term Debt” for further discussions.
For a description of related party transactions associated with the Company’s acquisition, see Note 17, “Related Party Transactions”. The acquisition has been accounted for under the purchase method of accounting. Accordingly, the results of operations of SevenBar are included in the consolidated statementsstatement of operations and asoperations.
The initial purchase price allocation may be adjusted within one year ofin August 2007. In November 2010, the purchase date for changes in estimates of the fair value of assets acquired and liabilities assumed. The allocation of the purchase price, including transaction costs,lease was as follows ($ in thousands):
| Current assets | $ | 1,203 | ||
| Property, equipment, land and leasehold improvements | 10,353 | |||
| Intangible assets: | ||||
| Customer relationships | 750 | |||
| Contractual arrangements | 26,050 | |||
| Non-compete agreements | 50 | |||
| Goodwill(1) | 5,125 | |||
| Total assets acquired | 43,531 | |||
| Current liabilities | (1,296 | ) | ||
| Other liabilities | (370 | ) | ||
| Net assets acquired | $ | 41,865 | ||
The Company paid moretentatively awarded to a party other than the fair value of the underlying net assets asAtlantic. As a result, of the expectationin December 2010, Atlantic recorded a non-cash loss on disposal of its abilityassets totaling $3.7 million. As of February 23, 2011, Atlantic Aviation continues to earnoperate at this FBO on a higher ratemonth to month basis, while the airport negotiates with the third party.
The Company allocated $750,000 of the purchase price to customer relationships. The Company will amortize the amount allocated to customer relationships over a nine-year period.
As the Company has retained majority ownership and control in District Energy, the business continues to be reported as part of the Company’s consolidated financial statements. The noncontrolling interest portion of the business’ results are recorded in the consolidated financial statements since the date of sale. The difference between the sale price and the Company’s portion of the investment sold and associated recognition of the non-controllingnoncontrolling interests was $22.0 million (net of taxes), which has been recorded in additional paid in capital in the consolidated balance sheets in accordance with ASC 810-10.
| December 31, 2010 | December 31, 2009 | |||||||||
|---|---|---|---|---|---|---|---|---|---|---|
| Minimum lease payments receivable | $ | 65,816 | $ | 65,116 | ||||||
| Less: unearned financing lease income | (26,282 | ) | (28,481 | ) | ||||||
| Net investment in direct financing leases | $ | 39,534 | $ | 36,635 | ||||||
| Equipment lease: | ||||||||||
| Current portion | $ | 3,871 | $ | 3,369 | ||||||
| Long-term portion | 35,663 | 33,266 | ||||||||
| $ | 39,534 | $ | 36,635 | |||||||
| December 31, 2009 | December 31, 2008 | |||||||
| Minimum lease payments receivable | $ | 65,116 | $ | 69,493 | ||||
| Less: unearned financing lease income | (28,481 | ) | (30,249 | ) | ||||
| Net investment in direct financing leases | $ | 36,635 | $ | 39,244 | ||||
| Equipment lease: | ||||||||
| Current portion | $ | 3,369 | $ | 3,117 | ||||
| Long-term portion | 33,266 | 36,127 | ||||||
| $ | 36,635 | $ | 39,244 | |||||
Unearned financing lease income is recognized over the terms of the leases. Minimum lease payments to be received by the Company total approximately $65.1$65.8 million as follows ($ in thousands):
| 2011 | $ | 8,293 | ||||
| 2012 | 8,016 | |||||
| 2013 | 8,028 | |||||
| 2014 | 8,022 | |||||
| 2015 | 7,993 | |||||
| Thereafter | 25,464 | |||||
| Total | $ | 65,816 |
| 2010 | $ | 7,143 | ||
| 2011 | 7,141 | |||
| 2012 | 7,141 | |||
| 2013 | 7,141 | |||
| 2014 | 7,141 | |||
| Thereafter | 29,409 | |||
| Total | $ | 65,116 | ||
| December 31, 2010 | December 31, 2009 | |||||||||
|---|---|---|---|---|---|---|---|---|---|---|
| Land | $ | 4,618 | $ | 4,618 | ||||||
| Easements | 5,624 | 5,624 | ||||||||
| Buildings | 24,796 | 24,789 | ||||||||
| Leasehold and land improvements | 320,170 | 312,881 | ||||||||
| Machinery and equipment | 337,595 | 330,226 | ||||||||
| Furniture and fixtures | 9,240 | 9,395 | ||||||||
| Construction in progress | 17,070 | 16,519 | ||||||||
| Property held for future use | 1,573 | 1,561 | ||||||||
| 720,686 | 705,613 | |||||||||
| Less: accumulated depreciation | (157,235 | ) | (125,526 | ) | ||||||
Property, equipment, land and leasehold improvements, net(1) | $ | 563,451 | $ | 580,087 | ||||||
| December 31, 2009 | December 31, 2008 | |||||||
| Land | $ | 4,618 | $ | 4,651 | ||||
| Easements | 5,624 | 5,624 | ||||||
| Buildings | 24,789 | 24,752 | ||||||
| Leasehold and land improvements | 312,881 | 284,207 | ||||||
| Machinery and equipment | 330,226 | 307,662 | ||||||
| Furniture and fixtures | 9,395 | 8,228 | ||||||
| Construction in progress | 16,519 | 48,223 | ||||||
| Property held for future use | 1,561 | 1,540 | ||||||
| 705,613 | 684,887 | |||||||
| Less: accumulated depreciation | (125,526 | ) | (92,452 | ) | ||||
| Property, equipment, land and leasehold improvements, net(1) | $ | 580,087 | $ | 592,435 | ||||
| (1) | Includes |
| Weighted Average Life (Years) | December 31, 2010 | December 31, 2009 | ||||||||||||
|---|---|---|---|---|---|---|---|---|---|---|---|---|---|---|
| Contractual arrangements | 31.0 | $ | 762,595 | $ | 774,309 | |||||||||
| Non-compete agreements | 2.5 | 9,515 | 9,515 | |||||||||||
| Customer relationships | 10.6 | 77,842 | 78,596 | |||||||||||
| Leasehold rights | 12.5 | 3,330 | 3,331 | |||||||||||
| Trade names | Indefinite | 15,401 | 15,401 | |||||||||||
| Technology | 5.0 | 460 | 460 | |||||||||||
| 869,143 | 881,612 | |||||||||||||
| Less: accumulated amortization | (163,281 | ) | (130,531 | ) | ||||||||||
| Intangible assets, net | $ | 705,862 | $ | 751,081 | ||||||||||
| Weighted Average Life (Years) | December 31, 2009 | December 31, 2008 | ||||||||||
| Contractual arrangements | 31.2 | $ | 774,309 | $ | 802,419 | |||||||
| Non-compete agreements | 2.5 | 9,515 | 9,515 | |||||||||
| Customer relationships | 10.7 | 78,596 | 78,596 | |||||||||
| Leasehold rights | 12.5 | 3,331 | 3,331 | |||||||||
| Trade names | Indefinite | 15,401 | 15,401 | |||||||||
| Technology | 5.0 | 460 | 460 | |||||||||
| 881,612 | 909,722 | |||||||||||
| Less: accumulated amortization | (130,531 | ) | (97,749 | ) | ||||||||
| Intangible assets, net | $ | 751,081 | $ | 811,973 | ||||||||
As a result of a decline in the performance of certain asset groups during the first six months of 2009, and the quarter ended December 31, 2008, the Company evaluated such asset groups for impairment and determined that the asset groups were impaired. The Company estimated the fair value of each of the impaired asset groups using the discounted cash flow model. Accordingly, the Company recognized non-cash impairment charges of $23.3 million and $21.7 million related to contractual arrangements at Atlantic Aviation during the first six months of 2009 and during the quarter ended December 31, 2008, respectively.2009. These charges are recorded in amortization of intangibles in the consolidated statement of operations. There were no impairment charges recorded during the year ended December 31, 2010, except for the loss on disposal of assets discussed in Note 5, “Dispositions”.
Amortization expense of intangible assets for the years ended December 31, 2010, 2009 and 2008 and 2007 totaled $34.9 million, $60.9 million and $61.9 million, and $32.4 million, respectively.
The change in goodwill from December 31, 2008 to December 31, 2009 is as followsfollow ($ in thousands):
| 2011 | $ | 39,658 | ||||
| 2012 | 34,253 | |||||
| 2013 | 34,222 | |||||
| 2014 | 34,097 | |||||
| 2015 | 33,631 | |||||
| Thereafter | 514,600 | |||||
| Total | $ | 690,461 |
| Balance at December 31, 2007 | $ | 636,336 | ||
| Acquisition of SevenBar FBOs | 5,156 | |||
| Prior period acquisition purchase price adjustments | (3,243 | ) | ||
| Impairment of Atlantic Aviation’s goodwill | (52,000 | ) | ||
| Balance at December 31, 2008 | 586,249 | |||
| Impairment of Atlantic Aviation’s goodwill | (71,200 | ) | ||
| Prior period acquisition purchase price adjustments | 31 | |||
| Other | 1,102 | |||
| Balance at December 31, 2009 | $ | 516,182 | ||
| Goodwill acquired in business combinations, net of disposals | $ | 639,382 | ||||
| Less: accumulated impairment charges | (123,200 | ) | ||||
| Less: write off of goodwill with disposal of assets | (1,929 | ) | ||||
| Balance at December 31, 2010 | $ | 514,253 |
While management has a plan to return the Company’s business fundamentals to levels that support the book value per common share, there is no assurance that the plan will be successful, or that the market price of the common stock will increase to such levels in the foreseeable future. Discount rates used in recent cash flow analyses have increased and projected cash flows relating to the Company’s reporting units generally declined in the latter half of 2008 and first half of 2009 primarily as the result of negative macroeconomic factors. There is no assurance that discount rates will not increase or that the earnings, book values or projected earnings and cash flows of the Company’s individual reporting units will not decline. Management will continue to monitor the relationship of the Company’s market capitalization to its book value, the differences for which management attributes to both negative macroeconomic factors and Company specific factors, and management will continue to evaluate the carrying value of goodwill and other intangible assets. Accordingly, an additional impairment charge to goodwill and other intangible assets may be required in the foreseeable future if the Company’s common stock price continues to trade below book value per common share or the book value exceeds its estimated fair value of an individual reporting unit.
| As of, and for the Year Ended December 31, 2009 | |||||||||||||||
|---|---|---|---|---|---|---|---|---|---|---|---|---|---|---|---|
| Description | Carrying Value | Fair Value Measurements Using Significant Unobservable Inputs (Level 3)(1) | Total Losses | ||||||||||||
| ($ in Thousands) | |||||||||||||||
Property, equipment, land and leasehold improvements, net(2) | $ | 12,643 | $ | 5,122 | $ | (7,521 | ) | ||||||||
Intangible assets(3) | 37,756 | 14,430 | (23,326 | ) | |||||||||||
Goodwill(4) | 448,543 | 377,343 | (71,200 | ) | |||||||||||
| Total | $ | 498,942 | $ | 396,895 | $ | (102,047 | ) | ||||||||
| (1) | At December 31, 2009, there were no nonfinancial assets measured at fair value using quoted prices in active markets for identical assets (“level 1”) or significant other observable inputs (“level 2”). |
| (2) | The non-cash impairment charge was recorded in depreciation expense in the consolidated statement of operations. |
| (3) | The non-cash impairment charge was recorded in amortization of intangibles expense in the consolidated statement of operations. |
| (4) | The non-cash impairment charge was recorded in goodwill impairment in the consolidated statement of operations. |
| Fair Value Measurements Using | Total Losses | |||||||||||||||||||
| Description | Quoted Prices in Active Markets for Identical Assets (Level 1) | Significant Other Observable Inputs (Level 2) | Significant Unobservable Inputs (Level 3) | Quarter Ended December 31, 2009 | Year Ended December 31, 2009 | |||||||||||||||
| ($ in Thousands) | ||||||||||||||||||||
| Property, Equipment, Land and Leasehold Improvements, net | $ | — | $ | — | $ | 5,122 | $ | — | $ | (7,521 | ) | |||||||||
| Intangible Assets | — | — | 14,430 | — | (23,326 | ) | ||||||||||||||
| Goodwill | — | — | 377,343 | — | (71,200 | ) | ||||||||||||||
| Total | $ | — | $ | — | $ | 396,895 | $ | — | $ | (102,047 | ) | |||||||||
The Company estimated the fair value of each of the impaired asset groups using discounted cash flows. Property, equipment, land and leasehold improvements with a carrying amount of $12.6 million were written down to fair value of $5.1 million during 2009. This resulted in a non-cash impairment charge of $7.5 million, which is recorded in depreciation expense for Atlantic Aviation during the first six months of 2009 in the consolidated statement of operations.
Additionally, intangible assets with carrying amounts of $37.7 million were written down to their fair value of $14.4 million during the first six months of 2009 at Atlantic Aviation. This resulted in a non-cash impairment charge of $23.3 million, which is recorded in amortization of intangibles expense in the consolidated statement of operations.
As discussed in Note 9, “Intangible Assets”, the Company performed goodwill impairment analyses during the first six months of 2009. As a result of these analyses, goodwill with a carrying amount of $448.5 million was written down to its implied fair value of $377.3 million resulting in a non-cash impairment charge of $71.2 million at Atlantic Aviation. This non-cash impairment charge was included in goodwill impairment in the consolidated statement of operations.
The significant unobservable inputs (“level 3”) used for all fair value measurements in the above table included forecasted cash flows of Atlantic Aviation and its asset groups, the discount rate and, in the case of goodwill, the terminal value. The forecasted cash flows for this business were developed using actual cash flows from 2008 and 2009, forecasted jet fuel volumes from the Federal Aviation Administration, forecasted consumer price indices and forecasted LIBOR rates based on proprietary models using various published sources. The discount rate was developed using a capital asset pricing model.
| December 31, 2010 | December 31, 2009 | |||||||||
|---|---|---|---|---|---|---|---|---|---|---|
| Payroll and related liabilities | $ | 6,506 | $ | 6,030 | ||||||
| Interest | 695 | 609 | ||||||||
| Insurance | 1,446 | 1,770 | ||||||||
| Real estate taxes | 987 | 887 | ||||||||
| Other | 9,681 | 8,136 | ||||||||
| $ | 19,315 | $ | 17,432 | |||||||
| December 31, 2009 | December 31, 2008 | |||||||
| Payroll and related liabilities | $ | 6,030 | $ | 8,462 | ||||
| Interest | 609 | 1,218 | ||||||
| Insurance | 1,770 | 1,932 | ||||||
| Real estate taxes | 887 | 896 | ||||||
| Other | 8,136 | 10,681 | ||||||
| $ | 17,432 | $ | 23,189 | |||||
| December 31, 2010 | December 31, 2009 | |||||||||
|---|---|---|---|---|---|---|---|---|---|---|
| The Gas Company | $ | 160,000 | $ | 179,000 | ||||||
| District Energy | 170,000 | 170,000 | ||||||||
| Atlantic Aviation | 808,884 | 863,279 | ||||||||
Total | 1,138,884 | 1,212,279 | ||||||||
| Less: current portion | (49,325 | ) | (45,900 | ) | ||||||
| Long-term portion | $ | 1,089,559 | $ | 1,166,379 | ||||||
| December 31, 2009 | December 31, 2008 | |||||||
| MIC Inc. | $ | — | $ | 69,000 | ||||
| The Gas Company | 179,000 | 169,000 | ||||||
| District Energy | 170,000 | 150,000 | ||||||
| Atlantic Aviation | 863,279 | 939,800 | ||||||
| Total | 1,212,279 | 1,327,800 | ||||||
| Less: current portion | (45,900 | ) | — | |||||
| Long-term portion | $ | 1,166,379 | $ | 1,327,800 | ||||
At December 31, 2009,2010, future maturities of long-term debt are as follows ($ in thousands):
| 2011 | $ | 49,325 | ||||
| 2012 | 31,135 | |||||
| 2013 | 259,270 | |||||
| 2014 | 799,154 | |||||
| 2015 | — | |||||
| Total | $ | 1,138,884 |
| 2010 | $ | 45,900 | ||
| 2011 | 55,906 | |||
| 2012 | 55,972 | |||
| 2013 | 258,325 | |||
| 2014 | 796,176 | |||
| Total | $ | 1,212,279 | ||
Effective April 14, 2009, MIC Inc. elected to reduce the available principal on its revolving credit facility from $300.0 million to $97.0 million and on December 31, 2009, further reduced the available principal to $20.0 million. This revolving credit facility is with Citicorp North America Inc. (as lender and administrative agent), Wachovia Bank National Association, Credit Suisse, Cayman Islands Branch, WestLB AG, New York Branch, and Macquarie Bank Limited. The original maturity of the facility was March 2008; however, in February 2008, MIC Inc. amended and restated the facility, extending the maturity to March 2010. The main use of the facility is to fund acquisitions, capital expenditures and to a limited extent, working capital. The facility terminates on March 31, 2010 and currently bears interest at the rate of LIBOR plus 2.75%. Base rate borrowings would be at the base rate plus 1.75%.
On February 20, 2008, MIC Inc. drew $56.0 million on this facility, part of which was used to fund the acquisition of SevenBar FBOs which was completed in the first quarter of 2008, and part of which was used for other projects. On July 31, 2008, MIC Inc. drew an additional $13.0 million on this facility to fund the acquisition of SkyPark, which was completed in the third quarter of 2008. On February 25, 2009, MIC Inc. repaid $2.6 million of the outstanding balance on the revolving credit facility.
At March 31, 2009, the Company reclassified the outstanding balance drawn on the revolving credit facility at the non-operating holding company from long-term debt to current portion of long-term debt on the consolidated balance sheet due to its scheduled maturity on March 31, 2010. During the year, the Company was in discussions with its lenders to convert the facility to a term loan and extend the maturity date of the $66.4 million outstanding balance.
On December 28, 2009, the Company used the net cash proceeds it received from the sale of the 49.99% non-controlling interest in District Energy, and cash on hand, to pay off the outstanding principal balance on the revolving credit facility. Shortly thereafter the Company elected to reduce the amount available on the revolving credit facility from $97.0 million to $20.0 million through to the maturity of the facility at March 31, 2010. The Company expects to retain excess cash generated by the consolidated businesses over the near term.
See Note 17, “Related Party Transactions” for a discussion of Macquarie Group’s portion of the commitments available under the facility and the payments made to the Macquarie Group.
The obligations under the facility are guaranteed by the Company and secured by a pledge of the equity of all current and future direct subsidiaries of MIC Inc. and the Company. Among other things, the revolving facility includes an event of default should the Manager or another affiliate within the Macquarie Group cease to act as manager of the Company.
Material terms of the MIC Inc.’s revolving credit facility are presented below:
| Facility Terms | Holding Company Debt | Operating Company Debt | |||||||||||||
|---|---|---|---|---|---|---|---|---|---|---|---|---|---|---|---|
| HGC | |||||||||||||||
| Facilities | $80.0 million Term December 31, 2009) | $80.0 million Term Loan (fully drawn at December 31, 2010 and 2009) | $20.0 million Revolver December 31, 2010 and $19.0 December | ||||||||||||
| Collateral | First priority security interest on HGC’s assets and equity interests | First priority security interest on Company’s assets and equity interests | |||||||||||||
| Maturity | June, 2013 | June, 2013 | June, 2013 | ||||||||||||
| Facility Terms | Holding Company Debt | Operating Company Debt | |||||||||||||
|---|---|---|---|---|---|---|---|---|---|---|---|---|---|---|---|
| Amortization | Payable at maturity | Payable at maturity | Payable at maturity for utility capital expenditures | ||||||||||||
| LIBOR plus 0.60% | LIBOR plus 0.40% | LIBOR plus 0.40% | |||||||||||||
| Commitment Fees: Years | — | — | 0.14% on undrawn portion | ||||||||||||
| LIBOR plus 0.70% | LIBOR plus 0.50% | LIBOR plus 0.50% | |||||||||||||
| Commitment Fees: Years | — | — | 0.18% on undrawn portion | ||||||||||||
The Gas Company also has an uncommitted unsecured short-term borrowing facility of $7.5 million that was renewed during the second quarter of 2009.2010. This credit line bears interest at the lending bank’s quoted rate or prime rate. The facility is available for working capital needs. At December 31, 20092010 and December 31, 2008,2009, no amounts were outstanding.
| Facility Terms | ||||||
|---|---|---|---|---|---|---|
| Macquarie District Energy LLC, or MDE | ||||||
| Facilities | •
| |||||
| •
| ||||||
| •
| ||||||
| Amortization | Payable at maturity | |||||
| Interest | Floating | |||||
| Interest rate and fees | • Interest rate: | |||||
| • LIBOR plus 1.175% or | ||||||
| • Base Rate (for capital expenditure loan and revolving loan facilities only): 0.5% above the greater of the prime rate or the federal funds rate | ||||||
| • Commitment fee: 0.35% on the undrawn | ||||||
| Maturity | September, | |||||
| Mandatory prepayment | • With net proceeds that exceed $1.0 million from the sale of assets not used for replacement | |||||
| • With insurance proceeds that exceed $1.0 million not used to repair, restore or replace assets; | ||||||
| • In the event of a change of control; | ||||||
| • In years 6 and 7, with 100% of excess cash flow applied to repay the term loan and capital expenditure loan facilities; | ||||||
| • With net proceeds from equity and certain debt issuances; and | ||||||
| • With net proceeds that exceed $1.0 million in a fiscal year from contract terminations that are not reinvested. | ||||||
| Collateral | First lien on the following (with limited exceptions): | |||||
| • Project revenues; | ||||||
| • Equity of the Borrower and its subsidiaries; | ||||||
| • Substantially all assets of the business; and | ||||||
| • Insurance policies and claims or proceeds. | ||||||
To hedge the interest commitments under the term loan facility, District Energy entered into an interest rate swap fixing 100% of the term loan facility at 5.074% (excluding the margin).
| Facility Terms | ||||||
|---|---|---|---|---|---|---|
| Atlantic Aviation | ||||||
| Facilities | • $900.0 million term loan facility | |||||
| • $50.0 million capital expenditure facility ($45.4 million and $44.9 million drawn at December 31, 2010 and 2009, respectively) | ||||||
| • $18.0 million revolving working capital and letter of credit facility ($ | ||||||
| Amortization | • Payable at maturity | |||||
| • Years 1 to 5: | ||||||
| • 100% excess cash flow when Leverage Ratio is 6.0x or above | ||||||
| • 50% excess cash flow when Leverage Ratio is between 6.0x and 5.5x | ||||||
| • 100% of excess cash flow in years 6 and 7 | ||||||
| Interest type | Floating | |||||
| Interest rate and fees | • Years | |||||
| • LIBOR plus 1.6% or | ||||||
| • Base Rate (for revolving credit facility only): 0.6% above the greater of: (i) the prime rate or (ii) the federal funds rate plus 0.5% | ||||||
| • Years | ||||||
| • LIBOR plus 1.725% or | ||||||
| • Base Rate (for revolving credit facility only): 0.725% above the greater of: (i) the prime rate or (ii) the federal funds rate plus 0.5% | ||||||
| Maturity | October, 2014 | |||||
| Facility Terms | ||||||
|---|---|---|---|---|---|---|
| Mandatory prepayment | • With net proceeds that exceed $1.0 million from the sale of assets not used for replacement assets; | |||||
| • With net proceeds of any debt other than permitted debt; | ||||||
| • With net insurance proceeds that exceed $1.0 million not used to repair, restore or replace assets; | ||||||
| • In the event of a change of control; | ||||||
| • Additional mandatory prepayment based on leverage grid | ||||||
| • With any FBO lease termination payments received; | ||||||
| • With excess cash flows in years 6 and 7. | ||||||
| Collateral | First lien on the following (with limited exceptions): | |||||
| • Project revenues; | ||||||
| • Equity of the borrower and its subsidiaries; and | ||||||
| • Insurance policies and claims or proceeds. | ||||||
For the year ended December 31, 2009,
As of
The Company’s derivative instruments are recorded on the balance sheet at fair value with changes in fair value of interest rate swaps recorded directly through earnings since the dates that hedge accounting was discontinued.
The Company’s fair value measurements of its derivative instruments and the related location of the liabilities associated with the hedging instruments within the consolidated balance sheets at December 31, 20092010 and December 31, 20082009 were as follows:
| Liabilities at Fair Value(1) | |||||||||||
|---|---|---|---|---|---|---|---|---|---|---|---|
| Interest Rate Swap Contracts Not Designated as Hedging Instruments | |||||||||||
| Balance Sheet Location | December 31, 2010 | December 31, 2009 | |||||||||
| ($ in Thousands) | |||||||||||
| Fair value of derivative instruments – current liabilities | $ | (43,496 | ) | $ | (49,573 | ) | |||||
| Fair value of derivative instruments – non-current liabilities | (51,729 | ) | (54,794 | ) | |||||||
| Total interest rate derivative contracts | $ | (95,225 | ) | $ | (104,367 | ) | |||||
| Liabilities at Fair Value(1) | ||||||||
| Interest Rate Swap Contracts Not Designated as Hedging Instruments(2) | Interest Rate Swap Contracts Designated as Hedging Instruments | |||||||
| Balance Sheet Location | December 31, 2009 | December 31, 2008 | ||||||
| ($ in Thousands) | ||||||||
| Fair value of derivative instruments – current liabilities | $ | (49,573 | ) | $ | (45,464 | ) | ||
| Fair value of derivative instruments – non-current liabilities | (54,794 | ) | (105,970 | ) | ||||
| Total interest rate derivative contracts | $ | (104,367 | ) | $ | (151,434 | ) | ||
| (1) | Fair value measurements at reporting date were made using significant other observable inputs |
| Derivatives Designated as Hedging Instruments(1) | Derivatives Not Designated as Hedging Instruments(1) | ||||||||||||||||||||||||||||||||||
|---|---|---|---|---|---|---|---|---|---|---|---|---|---|---|---|---|---|---|---|---|---|---|---|---|---|---|---|---|---|---|---|---|---|---|---|
| Amount of Gain Recognized in OCI on Derivatives (Effective Portion) for the Year Ended December 31, | Amount of Loss Reclassified from OCI into Income (Effective Portion) for the Year Ended December 31, | Amount of Loss Recognized in Loss on Derivative Instruments (Ineffective Portion) for the Year Ended December 31, | Amount of Loss Recognized in Interest Expense for the Year Ended December 31, | ||||||||||||||||||||||||||||||||
| Financial Statement Account | 2010 | 2009 | 2010 | 2009(2) | 2010 | 2009 | 2010(3) | 2009(4) | |||||||||||||||||||||||||||
| ($ in Thousands) | |||||||||||||||||||||||||||||||||||
| Interest expense | $ | — | $ | — | $ | — | $ | (15,691 | ) | $ | — | $ | — | $ | (85,387 | ) | $ | (48,239 | ) | ||||||||||||||||
| Loss on derivative instruments | — | — | — | (25,154 | ) | — | (84 | ) | — | — | |||||||||||||||||||||||||
| Accumulated other comprehensive loss | — | 2,848 | — | — | — | — | — | — | |||||||||||||||||||||||||||
| Total | $ | — | $ | 2,848 | $ | — | $ | (40,845 | ) | $ | — | $ | (84 | ) | $ | (85,387 | ) | $ | (48,239 | ) | |||||||||||||||
| Derivatives Designated as Hedging Instruments(1) | Derivatives Not Designated as Hedging Instruments(1) | |||||||||||||||||||||||||||||||
| Amount of Gain/ (Loss) Recognized in OCI on Derivatives (Effective Portion) for the Year Ended December 31, | Amount of Loss Reclassified from OCI into Income (Effective Portion) for the Year Ended December 31, | Amount of Loss Recognized in Loss on Derivative Instruments (Ineffective Portion) for the Year Ended December 31, | Amount of Loss Recognized in Loss on Derivative Instruments for the Year Ended December 31, | |||||||||||||||||||||||||||||
| Financial Statement Account | 2009 | 2008 | 2009(2) | 2008 | 2009 | 2008 | 2009(3) | 2008 | ||||||||||||||||||||||||
| ($ in Thousands) | ||||||||||||||||||||||||||||||||
| Interest expense | $ | — | $ | — | $ | (15,691 | ) | $ | (19,798 | ) | $ | — | $ | — | $ | (43,937 | ) | $ | — | |||||||||||||
| Loss on derivative instruments | — | — | (25,154 | ) | (2,648 | ) | (84 | ) | (195 | ) | (4,302 | ) | — | |||||||||||||||||||
| Accumulated other comprehensive gain (loss) | 2,848 | (118,362 | ) | — | — | — | — | — | — | |||||||||||||||||||||||
| Total | $ | 2,848 | $ | (118,362 | ) | $ | (40,845 | ) | $ | (22,446 | ) | $ | (84 | ) | $ | (195 | ) | $ | (48,239 | ) | $ | — | ||||||||||
| (1) | All derivatives are interest rate swap contracts. |
| (2) | Includes $22.7 million of accumulated other comprehensive losses reclassified into earnings (loss |
| (3) | Loss recognized in interest expense for the year ended December 31, 2010 includes $56.5 million in interest rate swap payments and $28.9 million in unrealized derivative losses arising from: |
| (4) | Loss recognized in interest expense for the year ended December 31, 2009 |
All of the Company’s derivative instruments are collateralized by all of the assets of the respective businesses.
| Notes Payable | Capital Leases | |||||||
| 2010 | $ | 176 | $ | 59 | ||||
| 2011 | 153 | 42 | ||||||
| 2012 | 113 | — | ||||||
| 2013 | 113 | — | ||||||
| 2014 | 113 | — | ||||||
| Thereafter | 964 | — | ||||||
| Present value of minimum payments | 1,632 | 101 | ||||||
| Less: current portion | (176 | ) | (59 | ) | ||||
| Long-term portion | $ | 1,456 | $ | 42 | ||||
| Notes Payable | Capital Leases | |||||||||
|---|---|---|---|---|---|---|---|---|---|---|
| 2011 | $ | 990 | $ | 85 | ||||||
| 2012 | 93 | 36 | ||||||||
| 2013 | 93 | 14 | ||||||||
| 2014 | 93 | 7 | ||||||||
| 2015 | 78 | 6 | ||||||||
| Thereafter | — | — | ||||||||
| Present value of minimum payments | 1,347 | 148 | ||||||||
| Less: current portion | (990 | ) | (85 | ) | ||||||
| Long-term portion | $ | 357 | $ | 63 | ||||||
Prior to June 25, 2007, the Company’s publicly traded entity was the Trust. On June 25, 2007, the Trust was dissolved and all of the outstanding shares of beneficial interest in the Trust were exchanged for an equal number of LLC interests in the Company. Prior to this exchange and the dissolution of the Trust, all interests in the Company were held by the Trust. As a result of the mandatory share exchange, each shareholder of the Trust at the time of the exchange became a shareholder of, and with the same percentage interest in, the Company. The LLC interests were listed on the New York Stock Exchange under the symbol “MIC” at the time of the exchange.
On June 28, 2007, the Company entered into a Purchase Agreement (the “Purchase Agreement”) with the Manager and Citigroup Global Markets Inc., Credit Suisse Securities (USA) LLC, Merrill Lynch & Co., Merrill Lynch, Pierce, Fenner & Smith Incorporated and Macquarie Securities (USA) Inc., as representatives of the underwriters named in the Purchase Agreement (the “Underwriters”), whereby the Company and the Manager agreed to sell and the Underwriters agreed to purchase, subject to and upon terms and conditions set forth therein, 5,701,000 LLC interests and 599,000 LLC interests, respectively, of the Company under the Company’s existing shelf registration statement (Registration No. 333-138010-01). Additionally, under the Purchase Agreement, the Company granted the Underwriters an option to purchase up to 945,000 additional LLC interests solely to cover overallotments.
The offering of the LLC interests was priced at $40.99 per LLC interest and was completed in July 2007. In addition, the Underwriters exercised their overallotment option for 464,871 LLC interests. The proceeds from the equity offering was $241.3 million, net of underwriting fees and expenses. The Company used the proceeds of the offering to partially finance the acquisitions of additional FBO sites in 2007.
| Date of Grant | Stock Units Granted | Price of Stock Units Granted | Date of Vesting | |||||||||||
|---|---|---|---|---|---|---|---|---|---|---|---|---|---|---|
| December 21, 2004 | 7,644(1 | ) | $ | 25.00 | May 24, 2005 | |||||||||
| May 25, 2005 | 15,873 | $ | 28.35 | May 25, 2006 | ||||||||||
| May 25, 2006 | 16,869 | $ | 26.68 | May 23, 2007 | ||||||||||
| May 24, 2007 | 10,314 | $ | 43.63 | May 26, 2008 | ||||||||||
| May 27, 2008 | 14,115 | $ | 31.88 | June 3, 2009 | ||||||||||
| June 4, 2009 | 128,205 | $ | 3.51 | June 2, 2010 | ||||||||||
| June 3, 2010 | 31,989 | $ | 14.07 | (2) | ||||||||||
| Date of Grant | Stock Units Granted | Price of Stock Units Granted | Date of Vesting | |||||||||
| December 21, 2004 | 7,644 | (1) | $25.00 | May 24, 2005 | ||||||||
| May 25, 2005 | 15,873 | $ | 28.35 | May 25, 2006 | ||||||||
| May 25, 2006 | 16,869 | $ | 26.68 | May 23, 2007 | ||||||||
| May 24, 2007 | 10,314 | $ | 43.63 | May 26, 2008 | ||||||||
| May 27, 2008 | 14,115 | $ | 31.88 | June 3, 2009 | ||||||||
| June 4, 2009 | 128,205 | $ | 3.51 | (2) | ||||||||
| (1) | Pro rata basis relating to the period from the closing of the initial public offering through the anticipated date of the Company’s first annual meeting of stockholders. |
| (2) | Date of vesting will be the day immediately preceding the |
business, Atlantic Aviation. The energy-related businesses consist of two reportable segments: The Gas Company and District Energy. The energy-related businesses also include a 50% investment in IMTT, which is accounted for under the equity method. Financial information for IMTT’s business as a whole is presented below ($ in thousands) (unaudited):
| As of, and for the Year Ended, December 31, | |||||||||||||||
|---|---|---|---|---|---|---|---|---|---|---|---|---|---|---|---|
| 2010 | 2009 | 2008 | |||||||||||||
| Revenue | $ | 557,184 | $ | 346,175 | $ | 352,583 | |||||||||
| Net income | $ | 72,064 | $ | 54,584 | $ | 12,109 | |||||||||
| Interest expense, net | 50,335 | 2,130 | 23,540 | ||||||||||||
| Provision of income taxes | 53,521 | 38,842 | 9,452 | ||||||||||||
| Depreciation and amortization | 61,277 | 55,998 | 44,615 | ||||||||||||
| Unrealized (gains) losses on derivative instruments | — | (3,306 | ) | 46,277 | |||||||||||
| Other non-cash (income) expenses | (361 | ) | (590 | ) | 601 | ||||||||||
EBITDA excluding non-cash items(1) | $ | 236,836 | $ | 147,658 | $ | 136,594 | |||||||||
| Capital expenditures paid | $ | 107,832 | $ | 137,008 | $ | 221,700 | |||||||||
| Property, equipment, land and leasehold improvements, net | 1,041,339 | 987,075 | 912,887 | ||||||||||||
| Total assets balance | 1,221,862 | 1,064,849 | 1,006,289 | ||||||||||||
| As of, and for the Year Ended December 31, | ||||||||||||
| 2009 | 2008 | 2007 | ||||||||||
| Revenue | $ | 346,175 | $ | 352,583 | $ | 275,197 | ||||||
| Net income | $ | 54,584 | $ | 12,109 | $ | 9,626 | ||||||
| Interest expense, net | 29,510 | 23,540 | 14,349 | |||||||||
| Provision for income taxes | 38,842 | 9,452 | 7,076 | |||||||||
| Depreciation and amortization | 55,998 | 44,615 | 36,025 | |||||||||
| Unrealized (gains) losses on derivative instruments | (30,686 | ) | 46,277 | 21,022 | ||||||||
| Other non-cash income (expenses) | (590 | ) | 601 | 860 | ||||||||
| EBITDA excluding non-cash items(1) | $ | 147,658 | $ | 136,594 | $ | 88,958 | ||||||
| Capital expenditures paid | $ | 137,008 | $ | 221,700 | $ | 209,124 | ||||||
| Property, equipment, land and leasehold improvements, net | 987,075 | 912,887 | 724,806 | |||||||||
| Total assets balance | 1,064,849 | 1,006,289 | 862,534 | |||||||||
| (1) | EBITDA consists of earnings before interest, taxes, depreciation and amortization. Non-cash items that are excluded consist of impairments, derivative gains and losses and all other non-cash income and expense items. |
The aviation-related business consists of Atlantic Aviation.
| Year Ended December 31, 2010 | |||||||||||||||||||
|---|---|---|---|---|---|---|---|---|---|---|---|---|---|---|---|---|---|---|---|
| Energy-related Businesses | |||||||||||||||||||
| The Gas Company | District Energy | Atlantic Aviation | Total Reportable Segments | ||||||||||||||||
Revenue from Product Sales | |||||||||||||||||||
| Product sales | $ | 96,855 | $ | — | $ | 417,489 | $ | 514,344 | |||||||||||
| Product sales – utility | 113,752 | — | — | 113,752 | |||||||||||||||
| 210,607 | — | 417,489 | 628,096 | ||||||||||||||||
Service Revenue | |||||||||||||||||||
| Other services | — | 3,371 | 155,933 | 159,304 | |||||||||||||||
| Cooling capacity revenue | — | 21,162 | — | 21,162 | |||||||||||||||
| Cooling consumption revenue | — | 24,386 | — | 24,386 | |||||||||||||||
| — | 48,919 | 155,933 | 204,852 | ||||||||||||||||
Financing and Lease Income | |||||||||||||||||||
| Financing and equipment lease | — | 7,843 | — | 7,843 | |||||||||||||||
| — | 7,843 | — | 7,843 | ||||||||||||||||
Total Revenue | $ | 210,607 | $ | 56,762 | $ | 573,422 | $ | 840,791 | |||||||||||
| Year Ended December 31, 2009 | ||||||||||||||||
| Energy-related Businesses | Aviation-related Business | |||||||||||||||
| The Gas Company | District Energy | Atlantic Aviation | Total | |||||||||||||
| Revenue from Product Sales | ||||||||||||||||
| Product sales | $ | 79,597 | $ | — | $ | 314,603 | $ | 394,200 | ||||||||
| Product sales – utility | 95,769 | — | — | 95,769 | ||||||||||||
| 175,366 | — | 314,603 | 489,969 | |||||||||||||
| Service Revenue | ||||||||||||||||
| Other services | — | 3,137 | 171,546 | 174,683 | ||||||||||||
| Cooling capacity revenue | — | 20,430 | — | 20,430 | ||||||||||||
| Cooling consumption revenue | — | 20,236 | — | 20,236 | ||||||||||||
| — | 43,803 | 171,546 | 215,349 | |||||||||||||
| Financing and Lease Income | ||||||||||||||||
| Financing and equipment lease | — | 4,758 | — | 4,758 | ||||||||||||
| — | 4,758 | — | 4,758 | |||||||||||||
| Total Revenue | $ | 175,366 | $ | 48,561 | $ | 486,149 | $ | 710,076 | ||||||||
| Year Ended December 31, 2009 | |||||||||||||||||||
|---|---|---|---|---|---|---|---|---|---|---|---|---|---|---|---|---|---|---|---|
| Energy-related Businesses | |||||||||||||||||||
| The Gas Company | District Energy | Atlantic Aviation | Total Reportable Segments | ||||||||||||||||
Revenue from Product Sales | |||||||||||||||||||
| Product sales | $ | 79,597 | $ | — | $ | 314,603 | $ | 394,200 | |||||||||||
| Product sales – utility | 95,769 | — | — | 95,769 | |||||||||||||||
| 175,366 | — | 314,603 | 489,969 | ||||||||||||||||
Service Revenue | |||||||||||||||||||
| Other services | — | 3,137 | 171,546 | 174,683 | |||||||||||||||
| Cooling capacity revenue | — | 20,430 | — | 20,430 | |||||||||||||||
| Cooling consumption revenue | — | 20,236 | — | 20,236 | |||||||||||||||
| — | 43,803 | 171,546 | 215,349 | ||||||||||||||||
Financing and Lease Income | |||||||||||||||||||
| Financing and equipment lease | — | 4,758 | — | 4,758 | |||||||||||||||
| — | 4,758 | — | 4,758 | ||||||||||||||||
Total Revenue | $ | 175,366 | $ | 48,561 | $ | 486,149 | $ | 710,076 | |||||||||||
| Year Ended December 31, 2008 | |||||||||||||||||||
|---|---|---|---|---|---|---|---|---|---|---|---|---|---|---|---|---|---|---|---|
| Energy-related Businesses | |||||||||||||||||||
| The Gas Company | District Energy | Atlantic Aviation | Total Reportable Segments | ||||||||||||||||
Revenue from Product Sales | |||||||||||||||||||
| Product sales | $ | 91,244 | $ | — | $ | 494,810 | $ | 586,054 | |||||||||||
| Product sales – utility | 121,770 | — | — | 121,770 | |||||||||||||||
| 213,014 | — | 494,810 | 707,824 | ||||||||||||||||
Service Revenue | |||||||||||||||||||
| Other services | — | 3,115 | 221,492 | 224,607 | |||||||||||||||
| Cooling capacity revenue | — | 19,350 | — | 19,350 | |||||||||||||||
| Cooling consumption revenue | — | 20,894 | — | 20,894 | |||||||||||||||
| — | 43,359 | 221,492 | 264,851 | ||||||||||||||||
Financing and Lease Income | |||||||||||||||||||
| Financing and equipment lease | — | 4,686 | — | 4,686 | |||||||||||||||
| — | �� | 4,686 | — | 4,686 | |||||||||||||||
Total Revenue | $ | 213,014 | $ | 48,045 | $ | 716,302 | $ | 977,361 | |||||||||||
| Year Ended December 31, 2008 | ||||||||||||||||
| Energy-related Businesses | Aviation-related Business | |||||||||||||||
| The Gas Company | District Energy | Atlantic Aviation | Total | |||||||||||||
| Revenue from Product Sales | ||||||||||||||||
| Product sales | $ | 91,244 | $ | — | $ | 494,810 | 586,054 | |||||||||
| Product sales – utility | 121,770 | — | — | 121,770 | ||||||||||||
| 213,014 | — | 494,810 | 707,824 | |||||||||||||
| Service Revenue | ||||||||||||||||
| Other services | — | 3,115 | 221,492 | 224,607 | ||||||||||||
| Cooling capacity revenue | — | 19,350 | — | 19,350 | ||||||||||||
| Cooling consumption revenue | — | 20,894 | — | 20,894 | ||||||||||||
| — | 43,359 | 221,492 | 264,851 | |||||||||||||
| Financing and Lease Income | ||||||||||||||||
| Financing and equipment lease | — | 4,686 | — | 4,686 | ||||||||||||
| — | 4,686 | — | 4,686 | |||||||||||||
| Total Revenue | $ | 213,014 | $ | 48,045 | $ | 716,302 | 977,361 | |||||||||
| Year Ended December 31, 2007 | ||||||||||||||||
| Energy-related Businesses | Aviation-related Business | |||||||||||||||
| The Gas Company | District Energy | Atlantic Aviation | Total | |||||||||||||
| Revenue from Product Sales | ||||||||||||||||
| Product sales | $ | 74,602 | $ | — | $ | 371,250 | $ | 445,852 | ||||||||
| Product sales – utility | 95,770 | — | — | 95,770 | ||||||||||||
| 170,372 | — | 371,250 | 541,622 | |||||||||||||
| Service Revenue | ||||||||||||||||
| Other services | — | 2,864 | 163,086 | 165,950 | ||||||||||||
| Cooling capacity revenue | — | 18,854 | — | 18,854 | ||||||||||||
| Cooling consumption revenue | — | 22,876 | — | 22,876 | ||||||||||||
| — | 44,594 | 163,086 | 207,680 | |||||||||||||
| Financing and Lease Income | ||||||||||||||||
| Financing and equipment lease | — | 4,912 | — | 4,912 | ||||||||||||
| — | 4,912 | — | 4,912 | |||||||||||||
| Total Revenue | $ | 170,372 | $ | 49,506 | $ | 534,336 | $ | 754,214 | ||||||||
In accordance with FASB ASC 280Segment Reporting (formerly SFAS No. 131, “Disclosures about Segments of an Enterprise and Related Information''), the Company has disclosed earnings before interest, taxes, depreciation and amortization (EBITDA) excluding non-cash items.items as a key performance metric relied on by management in the evaluation of the Company’s performance. Non-cash items includesinclude impairments, derivative gains and losses and adjustments for other non-cash items reflected in the statements of operations. The Company believes EBITDA excluding non-cash items provides additional insight into the performance of the operating businesses relative to each other and similar businesses without regard to their capital structure, and their ability to service or reduce debt, fund capital expenditures and/or support distributions to the holding company. EBITDA excluding non-cash items is reconciled to net income or loss.
In 2008 and 2007, the Company disclosed EBITDA only. The following tables, reflecting results of operations for the consolidated group and for each of the businesses for the years ended December 31, 2008 and 2007, have been conformed to current periods’ presentation reflecting EBITDA excluding non-cash items.
| Year Ended December 31, 2010 | |||||||||||||||||||
|---|---|---|---|---|---|---|---|---|---|---|---|---|---|---|---|---|---|---|---|
| Energy-related Businesses | |||||||||||||||||||
| The Gas Company | District Energy | Atlantic Aviation | Total Reportable Segments | ||||||||||||||||
| Net income (loss) | $ | 11,498 | $ | (2,822 | ) | $ | (18,294 | ) | $ | (9,618 | ) | ||||||||
| Interest expense, net | 16,505 | 20,671 | 69,409 | 106,585 | |||||||||||||||
| Provision (benefit) for income taxes | 7,400 | (1,844 | ) | (9,497 | ) | (3,941 | ) | ||||||||||||
| Depreciation | 5,826 | 6,555 | 23,895 | 36,276 | |||||||||||||||
| Amortization of intangibles | 823 | 1,368 | 32,707 | 34,898 | |||||||||||||||
Loss on disposal of assets(1) | — | — | 17,869 | 17,869 | |||||||||||||||
| Other non-cash expense (income) | 2,384 | (1,082 | ) | 1,388 | 2,690 | ||||||||||||||
| EBITDA excluding non-cash items | $ | 44,436 | $ | 22,846 | $ | 117,477 | $ | 184,759 | |||||||||||
| Year Ended December 31, 2009 | ||||||||||||||||
| Energy-related Businesses | Aviation-related Business | |||||||||||||||
| The Gas Company | District Energy | Atlantic Aviation(1) | Total Reportable Segments | |||||||||||||
| Net income (loss) | $ | 11,836 | $ | 1,182 | $ | (90,377 | ) | $ | (77,359 | ) | ||||||
| Interest expense, net | 8,941 | 10,153 | 67,983 | 87,077 | ||||||||||||
| Benefit (provision) for income taxes | 7,619 | 773 | (61,009 | ) | (52,617 | ) | ||||||||||
| Depreciation | 5,991 | 6,086 | 30,822 | 42,899 | ||||||||||||
| Amortization of intangibles | 838 | 1,368 | 58,686 | 60,892 | ||||||||||||
| Goodwill impairment | — | — | 71,200 | 71,200 | ||||||||||||
| Losses on derivative instruments | 636 | 220 | 28,277 | 29,133 | ||||||||||||
| Other non-cash expense | 1,771 | 1,009 | 903 | 3,683 | ||||||||||||
| EBITDA excluding non-cash items | $ | 37,632 | $ | 20,791 | $ | 106,485 | $ | 164,908 | ||||||||
| (1) | Loss on disposal includes write-offs of intangible assets of $10.4 million, property, equipment, land and leasehold improvements of $5.6 million and goodwill of $1.9 million at Atlantic Aviation. |
| Year Ended December 31, 2009(1) | |||||||||||||||||||
|---|---|---|---|---|---|---|---|---|---|---|---|---|---|---|---|---|---|---|---|
| Energy-related Businesses | |||||||||||||||||||
| The Gas Company | District Energy | Atlantic Aviation(2) | Total Reportable Segments | ||||||||||||||||
| Net income (loss) | $ | 11,836 | $ | 1,182 | $ | (90,377 | ) | $ | (77,359 | ) | |||||||||
| Interest expense, net | 9,250 | 8,995 | 72,929 | 91,174 | |||||||||||||||
| Provision (benefit) for income taxes | 7,619 | 773 | (61,009 | ) | (52,617 | ) | |||||||||||||
| Depreciation | 5,991 | 6,086 | 30,822 | 42,899 | |||||||||||||||
| Amortization of intangibles | 838 | 1,368 | 58,686 | 60,892 | |||||||||||||||
| Goodwill impairment | — | — | 71,200 | 71,200 | |||||||||||||||
| Loss on derivative instruments | 327 | 1,378 | 23,331 | 25,036 | |||||||||||||||
| Other non-cash expense | 1,771 | 1,009 | 903 | 3,683 | |||||||||||||||
| EBITDA excluding non-cash items | $ | 37,632 | $ | 20,791 | $ | 106,485 | $ | 164,908 | |||||||||||
| (1) | Reclassified to conform to current period presentation. |
| (2) | Includes non-cash impairment charges of $102.0 million recorded during the first six months of 2009, consisting of $71.2 million related to goodwill, $23.3 million related to intangible assets (in amortization of intangibles) and $7.5 million related to property, equipment, land and leasehold improvements (in depreciation). |
| Year Ended December 31, 2008 | |||||||||||||||||||
|---|---|---|---|---|---|---|---|---|---|---|---|---|---|---|---|---|---|---|---|
| Energy-related Businesses | |||||||||||||||||||
| The Gas Company | District Energy | Atlantic Aviation(1) | Total Reportable Segments | ||||||||||||||||
| Net income (loss) | $ | 6,283 | $ | 691 | $ | (44,348 | ) | $ | (37,374 | ) | |||||||||
| Interest expense, net | 9,390 | 10,341 | 62,967 | 82,698 | |||||||||||||||
| Provision (benefit) for income taxes | 4,044 | 242 | (29,936 | ) | (25,650 | ) | |||||||||||||
| Depreciation | 5,883 | 5,813 | 34,257 | 45,953 | |||||||||||||||
| Amortization of intangibles | 856 | 1,372 | 59,646 | 61,874 | |||||||||||||||
| Goodwill impairment | — | — | 52,000 | 52,000 | |||||||||||||||
| Loss (gain) on derivative instruments | 221 | (26 | ) | 1,871 | 2,066 | ||||||||||||||
| Other non-cash expense | 1,180 | 2,654 | 624 | 4,458 | |||||||||||||||
| EBITDA excluding non-cash items | $ | 27,857 | $ | 21,087 | $ | 137,081 | $ | 186,025 | |||||||||||
| Year Ended December 31, 2008 | ||||||||||||||||
| Energy-related Businesses | Aviation-related Business | |||||||||||||||
| The Gas Company | District Energy | Atlantic Aviation(1) | Total Reportable Segments | |||||||||||||
| Net income (loss) | $ | 6,283 | $ | 691 | $ | (44,348 | ) | $ | (37,374 | ) | ||||||
| Interest expense, net | 9,390 | 10,341 | 62,967 | 82,698 | ||||||||||||
| Benefit (provision) for income taxes | 4,044 | 242 | (29,936 | ) | (25,650 | ) | ||||||||||
| Depreciation | 5,883 | 5,813 | 34,257 | 45,953 | ||||||||||||
| Amortization of intangibles | 856 | 1,372 | 59,646 | 61,874 | ||||||||||||
| Goodwill impairment | — | — | 52,000 | 52,000 | ||||||||||||
| Losses (gains) on derivative instruments | 221 | (26 | ) | 1,871 | 2,066 | |||||||||||
| Other non-cash expense | 1,180 | 2,654 | 624 | 4,458 | ||||||||||||
| EBITDA excluding non-cash items | $ | 27,857 | $ | 21,087 | $ | 137,081 | $ | 186,025 | ||||||||
| (1) | Includes non-cash impairment charges of $87.5 million recorded during the fourth quarter of 2008, consisting of $52.0 million related to goodwill, $21.7 million related to intangible assets (in amortization of intangibles) and $13.8 million related to property, equipment, land and leasehold improvements (in depreciation). |
| Year Ended December 31, 2007 | ||||||||||||||||
| Energy-related Businesses | Aviation-related Business | |||||||||||||||
| The Gas Company | District Energy | Atlantic Aviation(2) | Total Reportable Segments | |||||||||||||
| Net income (loss) | $ | 4,840 | $ | (9,259 | ) | $ | 13,057 | $ | 8,638 | |||||||
| Interest expense, net | 9,195 | 9,009 | 42,559 | 60,763 | ||||||||||||
| Benefit (provision) for income taxes | 3,115 | (5,490 | ) | 8,575 | 6,200 | |||||||||||
| Depreciation | 5,881 | 5,792 | 14,621 | 26,294 | ||||||||||||
| Amortization of intangibles | 856 | 1,368 | 30,132 | 32,356 | ||||||||||||
| Non-cash loss on extinguishment of debt(1) | — | 3,013 | 9,804 | 12,817 | ||||||||||||
| Losses on derivative instruments | 431 | 28 | 1,659 | 2,118 | ||||||||||||
| Other non-cash expense (income) | 1,290 | 1,086 | (556 | ) | 1,820 | |||||||||||
| EBITDA excluding non-cash items | $ | 25,608 | $ | 5,547 | $ | 119,851 | $ | 151,006 | ||||||||
Reconciliations of consolidated reportable segments’ EBITDA excluding non-cash items to consolidated net lossincome (loss) from continuing operations before income taxes and noncontrolling interests wereare as follows ($ in thousands) (unaudited):
| Year Ended December 31, | |||||||||||||||
|---|---|---|---|---|---|---|---|---|---|---|---|---|---|---|---|
| 2010 | 2009 | 2008 | |||||||||||||
| Total reportable segments EBITDA excluding non-cash items | $ | 184,759 | $ | 164,908 | $ | 186,025 | |||||||||
| Interest income | 29 | 119 | 1,090 | ||||||||||||
| Interest expense | (106,834 | ) | (95,456 | ) | (88,652 | ) | |||||||||
Depreciation(1) | (36,276 | ) | (42,899 | ) | (45,953 | ) | |||||||||
Amortization of intangibles(2) | (34,898 | ) | (60,892 | ) | (61,874 | ) | |||||||||
| Selling, general and administrative—corporate | (7,360 | ) | (9,707 | ) | (4,205 | ) | |||||||||
| Fees to manager | (10,051 | ) | (4,846 | ) | (12,568 | ) | |||||||||
| Equity in earnings and amortization charges of investees | 31,301 | 22,561 | 1,324 | ||||||||||||
| Goodwill impairment | — | (71,200 | ) | (52,000 | ) | ||||||||||
Loss on disposal of assets(3) | (17,869 | ) | — | — | |||||||||||
| Loss on derivative instruments | — | (25,238 | ) | (2,843 | ) | ||||||||||
| Other expense, net | (1,492 | ) | (1,852 | ) | (4,001 | ) | |||||||||
| Total consolidated net income (loss) from continuing operations before income taxes | $ | 1,309 | $ | (124,502 | ) | $ | (83,657 | ) | |||||||
| Year Ended December 31, | ||||||||||||||||
| 2009 | 2008 | 2007 | ||||||||||||||
| Total reportable segments EBITDA excluding non-cash items | $ | 164,908 | $ | 186,025 | $ | 151,006 | ||||||||||
| Interest income | 119 | 1,090 | 5,705 | |||||||||||||
| Interest expense | (91,154 | ) | (88,652 | ) | (65,356 | ) | ||||||||||
| Depreciation(1) | (42,899 | ) | (45,953 | ) | (26,294 | ) | ||||||||||
| Amortization of intangibles(2) | (60,892 | ) | (61,874 | ) | (32,356 | ) | ||||||||||
| Selling, general and administrative – corporate | (9,707 | ) | (4,205 | ) | (10,038 | ) | ||||||||||
| Fees to manager | (4,846 | ) | (12,568 | ) | (65,639 | ) | ||||||||||
| Equity in earnings (losses) and amortization charges of investees | 22,561 | 1,324 | (32 | ) | ||||||||||||
| Goodwill impairment | (71,200 | ) | (52,000 | ) | — | |||||||||||
| Non-cash loss on extinguishment of debt | — | — | (12,817 | ) | ||||||||||||
| Losses on derivative instruments | (29,540 | ) | (2,843 | ) | (1,362 | ) | ||||||||||
| Other expense, net | (1,852 | ) | (4,001 | ) | (2,156 | ) | ||||||||||
| Total consolidated net loss from continuing operations before income taxes and noncontrolling interests | $ | (124,502 | ) | $ | (83,657 | ) | $ | (59,339 | ) | |||||||
| (1) | Depreciation includes depreciation expense for District Energy, which is reported in cost of services in the consolidated |
| (2) | Amortization expense includes non-cash impairment |
| recorded |
| (3) | Loss on disposal includes write-offs of intangible assets of $10.4 million, property, equipment, land and leasehold improvements of $5.6 million and goodwill of $1.9 million at Atlantic |
| Year Ended December 31, | |||||||||||||||
|---|---|---|---|---|---|---|---|---|---|---|---|---|---|---|---|
| 2010 | 2009 | 2008 | |||||||||||||
| The Gas Company | $ | 10,755 | $ | 7,388 | $ | 9,720 | |||||||||
| District Energy | 1,504 | 12,095 | 5,378 | ||||||||||||
| Atlantic Aviation | 10,431 | 10,837 | 34,462 | ||||||||||||
| Total | $ | 22,690 | $ | 30,320 | $ | 49,560 | |||||||||
| Year Ended December 31, | ||||||||||||
| 2009 | 2008 | 2007 | ||||||||||
| The Gas Company | $ | 7,388 | $ | 9,720 | $ | 8,715 | ||||||
| District Energy | 12,095 | 5,378 | 9,421 | |||||||||
| Atlantic Aviation | 10,837 | 34,462 | 27,585 | |||||||||
| Total | $ | 30,320 | $ | 49,560 | $ | 45,721 | ||||||
Property, equipment, land and leasehold improvements, goodwill and total assets for the Company’s reportable segments as of December 31 were as follows ($ in thousands) (unaudited):
| Property, Equipment, Land and Leasehold Improvements | Goodwill | Total Assets | |||||||||||||||||||||||||
|---|---|---|---|---|---|---|---|---|---|---|---|---|---|---|---|---|---|---|---|---|---|---|---|---|---|---|---|
| 2010 | 2009(1) | 2010 | 2009(2) | 2010 | 2009 | ||||||||||||||||||||||
| The Gas Company | $ | 149,542 | $ | 143,783 | $ | 120,193 | $ | 120,193 | $ | 350,428 | $ | 344,876 | |||||||||||||||
| District Energy | 146,623 | 151,543 | 18,647 | 18,647 | 228,480 | 234,847 | |||||||||||||||||||||
| Atlantic Aviation | 267,286 | 284,761 | 375,413 | 377,342 | 1,410,052 | 1,473,228 | |||||||||||||||||||||
| Total | $ | 563,451 | $ | 580,087 | $ | 514,253 | $ | 516,182 | $ | 1,988,960 | $ | 2,052,951 | |||||||||||||||
| Includes |
| (2) |
| Includes a non-cash goodwill impairment charge of $71.2 million recorded |
| As of December 31, | |||||||||||
|---|---|---|---|---|---|---|---|---|---|---|---|
| 2010 | 2009 | ||||||||||
| Total assets of reportable segments | $ | 1,988,960 | $ | 2,052,951 | |||||||
| Investment in IMTT | 223,792 | 207,491 | |||||||||
| Assets of discontinued operations held for sale | — | 86,695 | |||||||||
| Corporate and other | (16,010 | ) | (7,916 | ) | |||||||
| Total consolidated assets | $ | 2,196,742 | $ | 2,339,221 | |||||||
| As of December 31, | ||||||||
| 2009 | 2008 | |||||||
| Total assets of reportable segments | $ | 2,052,951 | $ | 2,218,083 | ||||
| Investment in IMTT | 207,491 | 184,930 | ||||||
| Assets of discontinued operations held for sale | 86,695 | 105,725 | ||||||
| Corporate and other | (7,916 | ) | 43,698 | |||||
| Total consolidated assets | $ | 2,339,221 | $ | 2,552,436 | ||||
Reconciliation of reportable segments’ goodwill to consolidated goodwill ($ in thousands) (unaudited):
| As of December 31, | ||||||||
| 2009 | 2008 | |||||||
| Goodwill of reportable segments | $ | 516,182 | $ | 587,351 | ||||
| Corporate and other | — | (1,102 | ) | |||||
| Total consolidated goodwill | $ | 516,182 | $ | 586,249 | ||||
| Year Ended December 31, | |||||||||||||||
|---|---|---|---|---|---|---|---|---|---|---|---|---|---|---|---|
| 2010(1) | 2009(2) | 2008 | |||||||||||||
| Base management fee | $ | 10,051 | $ | 4,846 | $ | 12,568 | |||||||||
| Year Ended December 31, | ||||||||||||
| 2009(1) | 2008 | 2007(2) | ||||||||||
| Base management fee | $ | 4,846 | $ | 12,568 | $ | 21,677 | ||||||
| Performance fee | — | — | 43,962 | |||||||||
| (1) | During 2010, the Manager elected to reinvest the base management fee for the first quarter of 2010 in LLC interests and the Company issued 155,375 LLC interests to the Manager during the second quarter of 2010. The base management fee for the fourth quarter of 2010 will be reinvested in LLC interests during the first quarter of 2011. |
| (2) | During 2009, the Manager elected to reinvest the base management fee for the second, third and |
During the third quarter of 2008, the Manager had offered to reinvest its base fee for the third quarter of 2008 in additional LLC interests of the Company. However in the fourth quarter of 2008, the Board of Directors requested that the Manager reverse its decision to reinvest its base management fees in stock under the terms of the management services agreement due to the significant decline in the market price of the LLC interests between the end of the third quarter of 2008 and the time at which the Company would have issued those LLC interests and the resulting potential substantial dilution to existing shareholders. The Manager agreed to this request and subsequently, both the third and fourth quarter 2008 base fees have been paid in cash during the first quarter of 2009.
Year Ended December 31, 2010 | ||||||||||
| Holding company debt restructuring advice | — advisory services from MCUSA | $ | 500 | |||||||
Year Ended December 31, 2009 | ||||||||||
| Sale of 49.99% of | — advisory services from MCUSA | $ | 1,294 | |||||||
| interest stake of District Energy to John Hancock |
| |||||||||
— reimbursement of out-of-pocket expenses to MCUSA | 15 | |||||||||
| Strategic review of alternatives | — advisory services from MCUSA | 300 | ||||||||
| available to the Company |
| |||||||||
— reimbursement of out-of-pocket expenses to MCUSA | 2 | |||||||||
| Atlantic Aviation’s accounts receivable management consulting services | — consulting services from Macquarie Business Improvement and Strategy, or MBIS | 159 | ||||||||
| — reimbursement of out-of-pocket expenses to MBIS | 71 | |||||||||
| PCAA restructuring advice | — advisory services from MCUSA | 200 | ||||||||
| — reimbursement of out-of-pocket expenses to MCUSA | 3 | |||||||||
| Atlantic Aviation’s debt amendment | — debt arranging services from MCUSA | |||||||||
| 970 | ||||||||||
| ||||||||||
| ||||||||||
MIC Inc. has
| 2009 | ||||
| Revolving credit facility commitment provided by Macquarie Group during the period January 1, 2009 through April 13, 2009(1) | $ | 66,667 | ||
| Revolving credit facility commitment provided by Macquarie Group during the period April 14, 2009 through December 30, 2009(2) | 21,556 | |||
| Revolving credit facility commitment provided by Macquarie Group on December 31, 2009 | 4,444 | |||
| Portion of revolving credit facility commitment from Macquarie Group drawn down, as of December 31, 2009(3) | — | |||
| Macquarie Group portion of the principal payments made to the revolving credit facility during the year ended December 31, 2009(3) | 15,333 | |||
| Interest expense on Macquarie Group portion of the drawn down commitment, for the year ended December 31, 2009 | 599 | |||
| Commitment fees to the Macquarie Group, for year ended December 31, 2009 | 100 | |||
| 2008 | ||||
| Revolving credit facility commitment provided by the Macquarie Group during the period January 1, 2008 through February 11, 2008 | $ | 50,000 | ||
| Revolving credit facility commitment provided by Macquarie Group during the period February 12, 2008 through December 31, 2008 | 66,667 | |||
| Portion of credit facility commitment from Macquarie Group drawn down, as of December 31, 2008 | 15,333 | |||
| Interest expense on Macquarie Group portion of the drawn down commitment, 2008 year | 698 | |||
| Commitment fees to the Macquarie Group, year ended December 31, 2008 | 252 | |||
| Upfront fee to Macquarie Group upon renewal of facility in February 2008 | 333 | |||
Year Ended December 31, 2010 | ||||||
Revolving credit facility commitment provided by Macquarie Group during January 1, 2010 through March 30, 2010(1) | $ | 4,444 | ||||
Revolving credit facility commitment provided by Macquarie Group at March 31, 2010(2) | — | |||||
Portion of revolving credit facility commitment from Macquarie Group drawn down, as of March 31, 2010(2)(3) | — | |||||
| Interest expense on Macquarie Group portion of the drawn down commitment, for the quarter ended March 31, 2010 | — | |||||
| Commitment fees to the Macquarie Group, for quarter ended March 31, 2010 | 5 | |||||
Year Ended December 31, 2009 | ||||||
Revolving credit facility commitment provided by Macquarie Group during the period January 1, 2009 through April 13, 2009(4) | $ | 66,667 | ||||
Revolving credit facility commitment provided by Macquarie Group during the period April 14, 2009 through December 30, 2009(1) | 21,556 | |||||
| Revolving credit facility commitment provided by Macquarie Group on December 31, 2009 | 4,444 | |||||
Portion of revolving credit facility commitment from Macquarie Group drawn down, as of December 31, 2009(5) | — | |||||
Macquarie Group portion of the principal payments made to the revolving credit facility during the year ended December 31, 2009(5) | 15,333 |
| Interest expense on Macquarie Group portion of the drawn down commitment, for the year ended December 31, 2009 | 599 | |||||
| Commitment fees to the Macquarie Group, for year ended December 31, 2009 | 100 |
| (1) | On December 31, 2009, the Company elected to reduce the available principal on its revolving credit facility from $97.0 million to $20.0 million. This resulted in a decrease in the Macquarie Group’s total commitment under its revolving credit facility from $21.6 million to $4.4 million. |
| (2) | The holding company’s revolving credit facility matured on March 31, 2010. |
| (3) | On December 28, 2009, the Company repaid the entire outstanding principal balance on its revolving credit facility. |
| (4) | On April 14, 2009, the Company elected to reduce the available principal on its revolving credit facility from $300.0 million to $97.0 million. This resulted in a decrease in the Macquarie Group’s total commitment under the revolving credit facility from $66.7 million to $21.6 million. |
| (5) |
| On December 28, 2009, using the net cash proceeds from the sale of the 49.99% |
In February 2010, per the revised terms of the term loan agreement as described in Note 12, “Long-Term Debt”, Atlantic Aviation used $17.1 million of excess cash flow to prepay $15.5 million of the outstanding principal balance of the term loan debt and incurred $1.6 million in interest rate swap breakage fees, of which $215,000 was paid to MBL.
In 2008, the Company received a reimbursement of $1.4 million for due diligence expenses incurred during 2007 and the first half of 2008 from MGOP in relation to an acquisition that the Company did not complete, but which was acquired by the private equity fund.
As discussed in Note 15, “Members’ Equity”, in June 2007 the Trust was dissolved and all outstanding trust stock was exchanged for LLC interests in the Company. In addition, the Company also received permission from the Internal Revenue Service, or IRS, to elect to be treated as a corporation for U.S. federal tax purposes as of January 1, 2007. Accordingly, the
| Year Ended December 31, | |||||||||||||||
|---|---|---|---|---|---|---|---|---|---|---|---|---|---|---|---|
| 2010 | 2009 | 2008 | |||||||||||||
| Current taxes: | |||||||||||||||
| Federal | $ | — | $ | 334 | $ | — | |||||||||
| State | 2,401 | 1,859 | 2,536 | ||||||||||||
| Total current taxes | $ | 2,401 | $ | 2,193 | $ | 2,536 | |||||||||
| Deferred tax benefit: | |||||||||||||||
| Federal | $ | (6,122 | ) | $ | (20,175 | ) | $ | (12,849 | ) | ||||||
| State | (3,171 | ) | (7,333 | ) | (3,748 | ) | |||||||||
| Total deferred tax benefit | (9,293 | ) | (27,508 | ) | (16,597 | ) | |||||||||
| Change in valuation allowance | (1,805 | ) | 9,497 | — | |||||||||||
| Total tax benefit | $ | (8,697 | ) | $ | (15,818 | ) | $ | (14,061 | ) | ||||||
| Year Ended December 31, 2009 | Year Ended December 31, 2008 | Year Ended December 31, 2007 | ||||||||||
| Current taxes: | ||||||||||||
| Federal | $ | 334 | $ | — | $ | 192 | ||||||
| State | 1,859 | 2,536 | 2,113 | |||||||||
| Total current taxes | $ | 2,193 | $ | 2,536 | $ | 2,305 | ||||||
| Deferred tax benefit: | ||||||||||||
| Federal | $ | (20,175 | ) | $ | (12,849 | ) | $ | (17,545 | ) | |||
| State | (7,333 | ) | (3,748 | ) | (1,524 | ) | ||||||
| Total deferred tax benefit | (27,508 | ) | (16,597 | ) | (19,069 | ) | ||||||
| Change in valuation allowance | 9,497 | — | — | |||||||||
| Total tax benefit | $ | (15,818 | ) | $ | (14,061 | ) | $ | (16,764 | ) | |||
In connection withThe Company’s sale in 2010 of its investment in the off airport parking business, PCAA, resulted in a capital loss of approximately $10.4 million, which the Company expects to carryback to offset, in part, the 2009 capital gain on the sale of the 49.99% interest in District Energy. This carryback will reduce the federal NOL used in 2009 by approximately $10.4 million.
The tax effects of temporary differences that give rise to significant portions of the deferred tax assets and deferred tax liabilities at December 31, 20092010 and 20082009 are presented below ($ in thousands):
| At December 31, | |||||||||||
|---|---|---|---|---|---|---|---|---|---|---|---|
| 2010 | 2009 | ||||||||||
| Deferred tax assets: | |||||||||||
| Net operating loss carryforwards | $ | 66,901 | $ | 58,801 | |||||||
| Lease transaction costs | 1,478 | 1,638 | |||||||||
| Deferred revenue | 1,286 | 1,311 | |||||||||
| Accrued compensation | 9,616 | 9,136 | |||||||||
| Accrued expenses | 1,953 | 1,503 | |||||||||
| Partnership basis differences | — | 50,466 | |||||||||
| Other | 1,630 | 1,403 | |||||||||
| Unrealized losses | 38,093 | 41,904 | |||||||||
| Allowance for doubtful accounts | 244 | 653 | |||||||||
| Total gross deferred tax assets | 121,201 | 166,815 | |||||||||
| Less: valuation allowance | (9,173 | ) | (20,571 | ) | |||||||
| Net deferred tax assets after valuation allowance | $ | 112,028 | $ | 146,244 | |||||||
| Deferred tax liabilities: | |||||||||||
| Intangible assets | $ | (162,615 | ) | $ | (148,286 | ) | |||||
| Investment basis difference | (4,043 | ) | — | ||||||||
| Property and equipment | (81,500 | ) | (81,041 | ) | |||||||
| Prepaid expenses | (1,168 | ) | (1,434 | ) | |||||||
| Total deferred tax liabilities | (249,326 | ) | (230,761 | ) | |||||||
| Net deferred tax liability | (137,298 | ) | (84,517 | ) | |||||||
| Less: current deferred tax asset | (19,030 | ) | (23,323 | ) | |||||||
| Noncurrent deferred tax liability | $ | (156,328 | ) | $ | (107,840 | ) | |||||
| December 31, 2009 | December 31, 2008 | |||||||
| Deferred tax assets: | ||||||||
| Net operating loss carryforwards | $ | 58,801 | $ | 63,393 | ||||
| Lease transaction costs | 1,638 | 1,811 | ||||||
| Deferred revenue | 1,311 | 1,192 | ||||||
| Accrued compensation | 9,136 | 9,192 | ||||||
| Accrued expenses | 1,503 | 2,010 | ||||||
| Partnership basis differences | 50,466 | 49,184 | ||||||
| Other | 1,403 | 1,275 | ||||||
| Unrealized losses | 41,904 | 62,969 | ||||||
| Allowance for doubtful accounts | 653 | 859 | ||||||
| Total gross deferred tax assets | 166,815 | 191,885 | ||||||
| Less: valuation allowance | (20,571 | ) | (4,159 | ) | ||||
| Net deferred tax assets after valuation allowance | $ | 146,244 | $ | 187,726 | ||||
| Deferred tax liabilities: | ||||||||
| Intangible assets | $ | (148,286 | ) | $ | (164,851 | ) | ||
| Property and equipment | (81,041 | ) | (82,382 | ) | ||||
| Prepaid expenses | (1,434 | ) | (1,761 | ) | ||||
| Total deferred tax liabilities | (230,761 | ) | (248,994 | ) | ||||
| Net deferred tax liability | (84,517 | ) | (61,268 | ) | ||||
| Less: current deferred tax asset | (23,323 | ) | (21,960 | ) | ||||
| Noncurrent deferred tax liability | $ | (107,840 | ) | $ | (83,228 | ) | ||
At December 31, 2009,2010, the Company and its wholly owned subsidiaries had NOL carryforwards for federal income tax purposes of approximately $116.3$140.9 million, which are available to offset future taxable income, if any, through 2029. Approximately $35.0 million of these net operating lossesNOLs may be limited, on an annual basis, due to the change of control for tax purposes of the respective subsidiaries in which such losses were incurred. In addition, District Energy has NOL carryforwards of approximately $26.0$19.8 million, all of which are subject to limitations on realizationsrealization due to a change in control for tax purposes in 2009.2010.
In 2007, due to statutory limitations on the utilization of certain deferred tax assets, primarily at PCAA, the Company applied a valuation allowance on a portion of the deferred tax assets. As a result of the utilization and expirationrealization of certain state net operating lossNOL carryforwards, for a change in the state deferred income tax effective rate, and a settlement of the IRS examination of a portion of Atlantic Aviation for 2003,
management decreased its valuation allowance for capital loss and operating loss carryforwards, by approximately $5.3 million in 2007. Also in 2007, management determined that it is more likely than not that the deferred tax benefit related to the state income tax net operating loss carryforward of PCAA will not be realized. Accordingly, atotal valuation allowance of approximately $2.9$9.2 million. In 2010, the Company’s valuation allowance for both federal and state deferred tax assets decreased by approximately $11.4 million was recorded, which is alsofrom approximately $20.6 million at December 31, 2009. The net decrease includes an approximate $9.6 million decrease reflected in net income from discontinued operations, an approximate $2.5 million decrease reflected in federal tax expense or benefit from continuing operations and an increase of approximately $745,000 included in discontinued operations. This additional valuation allowance was net of the related federalstate income tax expense or benefit at the statutory rate of 35%.from continuing operations.
In 2006, the Company recognized a deferred
A reconciliation of the reported income tax expense attributable to income from continuing operations towas $8.7 million, $15.8 million and $14.1 million for the amount that would resultyears ended December 31, 2010, 2009 and 2008, respectively, and differed from the amounts computed by applying the U.S. federal income tax rate of 35% to the reported net loss ispretax income from continuing operations as follows ($ in thousands):
| Year Ended December 31, 2009 | Year Ended December 31, 2008 | Year Ended December 31, 2007 | ||||||||||
| Tax benefit at U.S. statutory rate | $ | (43,746 | ) | $ | (29,484 | ) | $ | (20,962 | ) | |||
| Tax effect of impairment of non-deductible intangibles | 18,601 | 13,684 | — | |||||||||
| Effect of permanent differences and other | 1,073 | (49 | ) | 534 | ||||||||
| State income taxes, net of federal benefit | (3,559 | ) | (788 | ) | 383 | |||||||
| Tax effect of flow-through entities | — | — | — | |||||||||
| Tax effect of IMTT taxable dividend income in excess of book income | (7,895 | ) | 5,425 | 4,456 | ||||||||
| Tax effect of federal dividends received deduction on IMTT dividend | — | (4,710 | ) | (3,556 | ) | |||||||
| Change in MDEH tax status | 10,211 | — | — | |||||||||
| Reversal of tax benefit recorded in 2006 on the excess of the tax basis over carrying value of IMTT | — | — | 2,381 | |||||||||
| True-up of deferred tax balances | — | 1,861 | — | |||||||||
| Change in valuation allowance | 9,497 | — | — | |||||||||
| Total tax benefit | $ | (15,818 | ) | $ | (14,061 | ) | $ | (16,764 | ) | |||
The Company adopted the provisions of FIN 48 on January 1, 2007. As a result of the implementation of FIN 48, the Company recorded a $510,000 increase in the liability for unrecognized tax benefits, which was offset by a reduction of the deferred tax liability of $109,000, resulting in a decrease to the January 1, 2007 retained earnings balance of $401,000. At the adoption date of January 1, 2007, the Company had $1.8 million of unrecognized tax benefits, all of which would affect the effective tax rate if recognized.following:
| Year Ended December 31, | |||||||||||||||
|---|---|---|---|---|---|---|---|---|---|---|---|---|---|---|---|
| 2010 | 2009 | 2008 | |||||||||||||
| Tax provision (benefit) at U.S. statutory rate | $ | 458 | $ | (43,746 | ) | $ | (29,484 | ) | |||||||
| Impairment of non-deductible intangibles | 675 | 18,601 | 13,684 | ||||||||||||
| Permanent and other differences between book and federal taxable income | (1,680 | ) | 1,073 | (49 | ) | ||||||||||
| State income taxes, net of federal benefit | (502 | ) | (3,559 | ) | (788 | ) | |||||||||
| Income attributable to joint venture partner in Northwind Aladdin | (449 | ) | — | — | |||||||||||
| District Energy taxable dividend income in excess of book income | 3,584 | — | — | ||||||||||||
| IMTT book income in excess of taxable dividend income | (5,693 | ) | (7,895 | ) | 5,425 | ||||||||||
| Federal dividends received deduction on IMTT and District Energy dividends | (7,068 | ) | — | (4,710 | ) | ||||||||||
| Increase in book basis in excess of tax basis in IMTT | 4,043 | — | — | ||||||||||||
| Change in District Energy tax status | — | 10,211 | — | ||||||||||||
| True-up of deferred tax balances | — | — | 1,861 | ||||||||||||
| Change in valuation allowance | (2,065 | ) | 9,497 | — | |||||||||||
| Total tax benefit | $ | (8,697 | ) | $ | (15,818 | ) | $ | (14,061 | ) | ||||||
It is expected that the amount of unrecognized tax benefits will change in the next 12 months,months; however, the Company does not expect the change to have a significant impact on the results of operations or the financial position of the Company.
During the quarter ended June 30, 2007, the IRS completed its audit of the 2003 federal income tax return for a subsidiary of Atlantic Aviation. That audit did not result in a material assessment beyond the related reserve established as of January 1, 2007, upon the adoption of FIN 48. As a result of the audit settlement, the Company no longer has a capital loss carryforward of approximately $11.9 million. The deferred tax benefit related to this carryforward loss was approximately $4.8 million, against which the Company applied a full valuation allowance. Both the carryforward loss and valuation allowance have been reversed. There are no other ongoing tax examinations of returns filed by the Company or any of its subsidiaries. Federal returns for all tax years ending after 2005, and state returns for all tax years ending in 2004 and later are subject to examination by federal and state tax authorities. There was no material change in the Company’s reserve for uncertain tax positions during 2009, except as discussed above.
As
| Balance as of January 1, 2010 | $ | 336 | ||||
| Current year increases | 32 | |||||
| Balance as of December 31, 2010 | $ | 368 |
| Balance as of January 1, 2009 | $ | 313 | ||
| Current year increases | 45 | |||
| Decreases due to the lapse of applicable statue of limitations and payments | (22 | ) | ||
| Balance as of December 31, 2009 | $ | 336 | ||
The Company leases land, buildings, office space and certain office equipment under noncancellable operating lease agreements that expire through April 2057.
| 2011 | $ | 33,358 | ||||
| 2012 | 32,322 | |||||
| 2013 | 31,283 | |||||
| 2014 | 29,969 | |||||
| 2015 | 27,888 | |||||
| Thereafter | 256,953 | |||||
| Total | $ | 411,773 |
| 2010 | $ | 33,238 | ||
| 2011 | 30,740 | |||
| 2012 | 29,622 | |||
| 2013 | 28,820 | |||
| 2014 | 28,008 | |||
| Thereafter | 274,873 | |||
| Total | $ | 425,301 | ||
Rent expense under all operating leases for the years ended December 31, 2010, 2009 and 2008 and 2007 was $35.9 million, $34.9 million and $34.2 million, and $26.4 million, respectively.
Participants will, however, continue to accrue years of service toward their final benefit. The financial effects of the new agreement are included in the tables below as “Plan amendments”.
| DB Plan Benefits | PMLI Benefits | ||||||||||||||||||
|---|---|---|---|---|---|---|---|---|---|---|---|---|---|---|---|---|---|---|---|
| 2010 | 2009 | 2010 | 2009 | ||||||||||||||||
| Change in benefit obligation: | |||||||||||||||||||
| Benefit obligation – beginning of period | $ | 35,250 | $ | 31,167 | $ | 2,095 | $ | 1,744 | |||||||||||
| Service cost | 696 | 629 | 45 | 42 | |||||||||||||||
| Interest cost | 1,950 | 1,888 | 113 | 113 | |||||||||||||||
| Participant contributions | — | — | 63 | 60 | |||||||||||||||
| Actuarial losses | 2,039 | 3,251 | 62 | 252 | |||||||||||||||
| Benefits paid | (1,718 | ) | (1,685 | ) | (141 | ) | (116 | ) | |||||||||||
| Benefit obligation – end of year | $ | 38,217 | $ | 35,250 | $ | 2,237 | $ | 2,095 | |||||||||||
| Change in plan assets: | |||||||||||||||||||
| Fair value of plan assets – beginning of period | $ | 21,911 | $ | 16,652 | $ | — | $ | — | |||||||||||
| Actual return on plan assets | 2,807 | 4,170 | — | — | |||||||||||||||
| Employer/participant contributions | 2,648 | 2,901 | 141 | 116 | |||||||||||||||
| Expenses paid | (96 | ) | (127 | ) | — | — | |||||||||||||
| Benefits paid | (1,718 | ) | (1,685 | ) | (141 | ) | (116 | ) | |||||||||||
| Fair value of plan assets – end of year | $ | 25,552 | $ | 21,911 | $ | — | $ | — | |||||||||||
| DB Plan Benefits | PMLI Benefits | |||||||||||||||
| 2009 | 2008 | 2009 | 2008 | |||||||||||||
| Change in benefit obligation: | ||||||||||||||||
| Benefit obligation – beginning of period | $ | 31,167 | $ | 29,022 | $ | 1,744 | $ | 1,641 | ||||||||
| Service cost | 629 | 631 | 42 | 39 | ||||||||||||
| Interest cost | 1,888 | 1,832 | 113 | 103 | ||||||||||||
| Plan amendments | — | 775 | — | — | ||||||||||||
| Participant contributions | — | — | 60 | 41 | ||||||||||||
| Actuarial losses | 3,251 | 488 | 252 | 32 | ||||||||||||
| Benefits paid | (1,685 | ) | (1,581 | ) | (116 | ) | (112 | ) | ||||||||
| Benefit obligation – end of year | $ | 35,250 | $ | 31,167 | $ | 2,095 | $ | 1,744 | ||||||||
| Change in plan assets: | ||||||||||||||||
| Fair value of plan assets – beginning of period | $ | 16,652 | $ | 24,358 | $ | — | $ | — | ||||||||
| Actual return (loss) on plan assets | 4,170 | (6,044 | ) | — | — | |||||||||||
| Employer/participant contributions | 2,901 | — | 116 | 112 | ||||||||||||
| Expenses paid | (127 | ) | (81 | ) | — | — | ||||||||||
| Benefits paid | (1,685 | ) | (1,581 | ) | (116 | ) | (112 | ) | ||||||||
| Fair value of plan assets – end of year | $ | 21,911 | $ | 16,652 | $ | — | $ | — | ||||||||
The funded status of theThe Gas Company’s balance sheet at December 31, 20092010 and 2008,2009, are presented in the following table ($ in thousands):
| DB Plan Benefits | PMLI Benefits | ||||||||||||||||||
|---|---|---|---|---|---|---|---|---|---|---|---|---|---|---|---|---|---|---|---|
| 2010 | 2009 | 2010 | 2009 | ||||||||||||||||
| Funded status | |||||||||||||||||||
| Funded status at end of year | $ | (12,664 | ) | $ | (13,339 | ) | $ | (2,237 | ) | $ | (2,095 | ) | |||||||
| Net amount recognized in balance sheet | $ | (12,664 | ) | $ | (13,339 | ) | $ | (2,237 | ) | $ | (2,095 | ) | |||||||
| Amounts recognized in balance sheet consists of: | |||||||||||||||||||
| Current liabilities | $ | — | $ | — | $ | (168 | ) | $ | (120 | ) | |||||||||
| Noncurrent liabilities | (12,664 | ) | (13,339 | ) | (2,069 | ) | (1,975 | ) | |||||||||||
| Net amount recognized in balance sheet | $ | (12,664 | ) | $ | (13,339 | ) | $ | (2,237 | ) | $ | (2,095 | ) | |||||||
| Amounts not yet reflected in net periodic benefit cost and included in accumulated other comprehensive loss: | |||||||||||||||||||
| Prior service cost | $ | (310 | ) | $ | (465 | ) | $ | — | $ | — | |||||||||
| Accumulated loss | (7,908 | ) | (7,379 | ) | (376 | ) | (325 | ) | |||||||||||
| Accumulated other comprehensive loss | (8,218 | ) | (7,844 | ) | (376 | ) | (325 | ) | |||||||||||
| Net periodic benefit cost in excess of cumulative employer contributions | (4,446 | ) | (5,495 | ) | (1,861 | ) | (1,770 | ) | |||||||||||
| Net amount recognized in balance sheet | $ | (12,664 | ) | $ | (13,339 | ) | $ | (2,237 | ) | $ | (2,095 | ) | |||||||
| DB Plan Benefits | PMLI Benefits | |||||||||||||||
| 2009 | 2008 | 2009 | 2008 | |||||||||||||
| Funded status | ||||||||||||||||
| Funded status at end of year | $ | (13,339 | ) | $ | (14,515 | ) | $ | (2,095 | ) | $ | (1,744 | ) | ||||
| Net amount recognized in balance sheet | $ | (13,339 | ) | $ | (14,515 | ) | $ | (2,095 | ) | $ | (1,744 | ) | ||||
| Amounts recognized in balance sheet consists of: | ||||||||||||||||
| Current liabilities | $ | — | $ | — | $ | (120 | ) | $ | (107 | ) | ||||||
| Noncurrent liabilities | (13,339 | ) | (14,515 | ) | (1,975 | ) | (1,637 | ) | ||||||||
| Net amount recognized in balance sheet | $ | (13,339 | ) | $ | (14,515 | ) | $ | (2,095 | ) | $ | (1,744 | ) | ||||
| Amounts not yet reflected in net periodic benefit cost and included in accumulated other comprehensive income: | ||||||||||||||||
| Prior service cost | $ | (465 | ) | $ | (620 | ) | $ | — | $ | — | ||||||
| Accumulated loss | (7,379 | ) | (7,362 | ) | (325 | ) | (72 | ) | ||||||||
| Accumulated other comprehensive loss | (7,844 | ) | (7,982 | ) | (325 | ) | (72 | ) | ||||||||
| Net periodic benefit cost in excess of cumulative employer contributions | (5,495 | ) | (6,533 | ) | (1,770 | ) | (1,672 | ) | ||||||||
| Net amount recognized in balance sheet | $ | (13,339 | ) | $ | (14,515 | ) | $ | (2,095 | ) | $ | (1,744 | ) | ||||
| DB Plan Benefits | PMLI Benefits | ||||||||||||||||||
|---|---|---|---|---|---|---|---|---|---|---|---|---|---|---|---|---|---|---|---|
| 2010 | 2009 | 2010 | 2009 | ||||||||||||||||
| Components of net periodic benefit cost: | |||||||||||||||||||
| Service cost | $ | 696 | $ | 629 | $ | 45 | $ | 42 | |||||||||||
| Interest cost | 1,950 | 1,888 | 113 | 113 | |||||||||||||||
| Expected return on plan assets | (1,566 | ) | (1,221 | ) | — | — | |||||||||||||
| Recognized actuarial loss | 364 | 413 | 11 | — | |||||||||||||||
| Amortization of prior service cost | 155 | 155 | — | — | |||||||||||||||
| Net periodic benefit cost | $ | 1,599 | $ | 1,864 | $ | 169 | $ | 155 | |||||||||||
| Other changes recognized in other comprehensive loss: | |||||||||||||||||||
| Prior service cost arising during period | $ | — | $ | — | $ | — | $ | — | |||||||||||
| Net loss arising during period | 894 | 429 | 62 | 253 | |||||||||||||||
| Amortization of prior service cost | (155 | ) | (155 | ) | — | — | |||||||||||||
| Amortization of loss | (364 | ) | (412 | ) | (11 | ) | — | ||||||||||||
| Total recognized in other comprehensive loss | $ | 375 | $ | (138 | ) | $ | 51 | $ | 253 | ||||||||||
| DB Plan Benefits | PML Benefits | |||||||||||||||
| 2009 | 2008 | 2009 | 2008 | |||||||||||||
| Components of net periodic benefit cost: | ||||||||||||||||
| Service cost | $ | 629 | $ | 631 | $ | 42 | $ | 39 | ||||||||
| Interest cost | 1,888 | 1,832 | 113 | 103 | ||||||||||||
| Expected return on plan assets | (1,221 | ) | (1,820 | ) | — | — | ||||||||||
| Recognized actuarial loss | 413 | — | — | — | ||||||||||||
| Amortization of prior service cost | 155 | 155 | — | — | ||||||||||||
| Net periodic benefit cost | $ | 1,864 | $ | 798 | $ | 155 | $ | 142 | ||||||||
| Other changes recognized in other comprehensive income: | ||||||||||||||||
| Prior service cost arising during period | $ | — | $ | 775 | $ | — | $ | — | ||||||||
| Net loss arising during period | 429 | 8,433 | 253 | 32 | ||||||||||||
| Amortization of prior service cost | (155 | ) | (155 | ) | — | — | ||||||||||
| Amortization of loss | (412 | ) | — | — | — | |||||||||||
| Total recognized in other comprehensive income | $ | (138 | ) | $ | 9,053 | $ | 253 | $ | 32 | |||||||
| DB Plan Benefits | PMLI Benefits | ||||||||||||||||||
|---|---|---|---|---|---|---|---|---|---|---|---|---|---|---|---|---|---|---|---|
| 2010 | 2009 | 2010 | 2009 | ||||||||||||||||
| Estimated amounts that will be amortized from accumulated other comprehensive loss over the next year: | |||||||||||||||||||
| Amortization of prior service cost | $ | 155 | $ | 155 | $ | — | $ | — | |||||||||||
| Amortization of net loss | 394 | 395 | 17 | 17 | |||||||||||||||
| Weighted average assumptions to determine benefit obligations: | |||||||||||||||||||
| Discount rate | 5.20 | % | 5.70 | % | 5.00 | % | 5.60 | % | |||||||||||
| Rate of compensation increase | N/A | N/A | N/A | N/A | |||||||||||||||
| Measurement date | December 31 | December 31 | December 31 | December 31 | |||||||||||||||
| Weighted average assumptions to determine net cost: | |||||||||||||||||||
| Discount rate | 5.70 | % | 6.20 | % | 5.60 | % | 6.30 | % | |||||||||||
| Expected long-term rate of return on plan assets during fiscal year | 7.25 | % | 7.25 | % | N/A | N/A | |||||||||||||
| Rate of compensation increase | N/A | N/A | N/A | N/A | |||||||||||||||
| Assumed healthcare cost trend rates: | |||||||||||||||||||
| Initial health care cost trend rate | 8.70 | % | 9.00 | % | |||||||||||||||
| Ultimate rate | 4.50 | % | 4.50 | % | |||||||||||||||
| Year ultimate rate is reached | 2028 | 2028 | |||||||||||||||||
| DB Plan Benefits | PMLI Benefits | |||||||||||||||
| 2009 | 2008 | 2009 | 2008 | |||||||||||||
| Estimated amounts that will be amortized from accumulated other comprehensive income over the next year: | ||||||||||||||||
| Amortization of prior service cost | $ | 155 | $ | 155 | $ | — | $ | — | ||||||||
| Amortization of net loss | 395 | 389 | 17 | — | ||||||||||||
| Weighted average assumptions to determine benefit obligations: | ||||||||||||||||
| Discount rate | 5.70 | % | 6.20 | % | 5.60 | % | 6.30 | % | ||||||||
| Rate of compensation increase | N/A | N/A | N/A | N/A | ||||||||||||
| Measurement date | December 31 | December 31 | December 31 | December 31 | ||||||||||||
| Weighted average assumptions to determine net cost: | ||||||||||||||||
| Discount rate | 6.20 | % | 6.30 | % | 6.30 | % | 6.20 | % | ||||||||
| Expected long-term rate of return on plan assets during fiscal year | 7.25 | % | 7.75 | % | N/A | N/A | ||||||||||
| Rate of compensation increase | N/A | N/A | N/A | N/A | ||||||||||||
| Assumed healthcare cost trend rates: | ||||||||||||||||
| Initial health care cost trend rate | 9.00 | % | 9.50 | % | ||||||||||||
| Ultimate rate | 4.50 | % | 5.00 | % | ||||||||||||
| Year ultimate rate is reached | 2028 | 2018 | ||||||||||||||
The Gas Company’s overall investment strategy is to achieve a mix of approximately 65% of investments in equities for long-term growth and 35% in fixed income securities for asset allocation purposes as well as near-term needs. The Gas Company has instructed the trustee, the investment manager, to maintain the allocation of the DB Plan’s assets between equity mutual fund securities and fixed income mutual fund securities within the pre-approved parameters set by the management of The Gas Company. The DB Plan weighted average asset allocation at December 31, 2010 and 2009 and 2008 was:
| 2010 | 2009 | |||||||||
|---|---|---|---|---|---|---|---|---|---|---|
| Equity instruments | 65 | % | 65 | % | ||||||
| Fixed income securities | 34 | % | 34 | % | ||||||
| Cash | 1 | % | 1 | % | ||||||
| Total | 100 | % | 100 | % | ||||||
| 2009 | 2008 | |||||||
| Equity instruments | 65 | % | 57 | % | ||||
| Fixed income securities | 34 | % | 41 | % | ||||
| Cash | 1 | % | 2 | % | ||||
| Total | 100 | % | 100 | % | ||||
The expected return on plan assets of 7.25% was estimated based on the allocation of assets and management’s expectations regarding future performance of the investments held in the investment portfolio. The asset allocations of The Gas Company’s pension benefits as of December 31, 20092010 measurement dates were as follows ($ in thousands):
| Fair Value Measurements at December 31, 2010 Pension Benefits — Plan Assets | |||||||||||||||||||
|---|---|---|---|---|---|---|---|---|---|---|---|---|---|---|---|---|---|---|---|
| Total | Quoted Prices in Active Markets for Identical Assets (Level 1) | Significant Observable Inputs (Level 2) | Significant Unobservable Inputs (Level 3) | ||||||||||||||||
| Asset category: | |||||||||||||||||||
| Cash and money market | $ | 309 | $ | 25 | $ | 284 | $ | — | |||||||||||
| Equity securities: | |||||||||||||||||||
U.S. large-cap growth(1) | 2,295 | 2,295 | — | — | |||||||||||||||
U.S. large-cap blend(2) | 6,591 | 6,591 | — | — | |||||||||||||||
U.S. large-cap value(3) | 2,309 | 2,309 | — | — | |||||||||||||||
U.S. mid-cap blend(4) | 983 | 983 | — | — | |||||||||||||||
U.S. small-cap growth(5) | 985 | 985 | — | — | |||||||||||||||
International large-cap blend(6) | 3,314 | 3,314 | — | — | |||||||||||||||
| Fixed income securities: | |||||||||||||||||||
Intermediate term corporate bonds(7) | 7,024 | 7,024 | — | — | |||||||||||||||
Short term corporate bonds(8) | 1,742 | 1,742 | — | — | |||||||||||||||
| Total | $ | 25,552 | $ | 25,268 | $ | 284 | $ | — | |||||||||||
| Fair Value Measurements at December 31, 2009 | ||||||||||||||||
| Pension Benefits – Plan Assets | ||||||||||||||||
| Total | Quoted Prices in Active Markets for Identical Assets (Level 1) | Significant Observable Inputs (Level 2) | Significant Unobservable Inputs (Level 3) | |||||||||||||
| Asset category: | ||||||||||||||||
| Cash and money market | $ | 315 | $ | 26 | $ | 289 | $ | — | ||||||||
| Equity securities: | ||||||||||||||||
| U.S. large-cap growth(a) | 1,980 | 1,980 | — | — | ||||||||||||
| U.S. large-cap blend(b) | 5,663 | 5,663 | — | — | ||||||||||||
| U.S. large-cap value(c) | 1,983 | 1,983 | — | — | ||||||||||||
| U.S. mid-cap blend(d) | 846 | 846 | — | — | ||||||||||||
| U.S. small-cap growth(e) | 849 | 849 | — | — | ||||||||||||
| International large-cap blend(f) | 2,801 | 2,801 | — | — | ||||||||||||
| Fixed income securities: | ||||||||||||||||
| Intermediate term corporate bonds(g) | 5,969 | 5,969 | — | — | ||||||||||||
| Short term corporate bonds(h) | 1,505 | 1,505 | — | — | ||||||||||||
| Total | $ | 21,911 | $ | 21,622 | $ | 289 | $ | — | ||||||||
| (1) | This fund seeks to track the performance of the MSCI U.S. Prime Market Growth Index, a broadly diversified index of growth stocks of large U.S. companies. |
| (2) | This fund seeks to track the performance of the MSCI U.S. Broad Market Index, which consists of all the U.S. common stocks traded regularly on the New York Stock Exchange and the Nasdaq |
| (3) | This fund seeks long-term capital appreciation and income. The fund invests mainly in mid- and large- capitalization companies whose stocks are considered by an advisor to be undervalued. |
| (4) | This fund seeks long-term capital appreciation. The fund normally invests in small- and mid- capitalization domestic stocks based on an advisor’s assessment of the relative return potential of the securities. |
| (5) | This fund seeks to provide long-term capital appreciation. The fund invests mainly in the stocks of small companies. |
| (6) | This fund seeks to track the performance of a benchmark index that measures the investment return of stocks issued by companies located in Europe, the Pacific region and emerging markets countries. |
| (7) | These funds seek to provide a moderate and sustainable level of current income by investing in bonds with an average weighted maturity of between five and ten years. |
| (8) | This fund seeks to provide current income. It invests at least 80% of assets in short and intermediate term corporate bonds and other corporate fixed income obligations. It typically maintains an average weighted maturity of between one and four years. |
The discount rates of 5.70%5.20% and 5.60%5.00% for the DB Plan and PMLI Plan, respectively, were based on high quality corporate bond rates that approximate the expected settlement of obligations. The estimated future benefit payments for the next ten years are as follows ($ in thousands):
| DB Plans Benefits | PMLI Benefits | |||||||||
|---|---|---|---|---|---|---|---|---|---|---|
| 2011 | 2,136 | 168 | ||||||||
| 2012 | 2,270 | 179 | ||||||||
| 2013 | 2,370 | 185 | ||||||||
| 2014 | 2,475 | 158 | ||||||||
| 2015 | 2,516 | 177 | ||||||||
| Thereafter | 13,129 | 858 | ||||||||
| DB Plans Benefits | PMLI Benefits | |||||||
| 2010 | $ | 1,980 | $ | 120 | ||||
| 2011 | 2,133 | 176 | ||||||
| 2012 | 2,227 | 177 | ||||||
| 2013 | 2,298 | 187 | ||||||
| 2014 | 2,368 | 161 | ||||||
| Thereafter | 12,058 | 882 | ||||||
There
| Date Declared | Quarter Ended | Holders of Record Date | Payment Date | Dividend per LLC Interest | |||||||||||||||||||||||
|---|---|---|---|---|---|---|---|---|---|---|---|---|---|---|---|---|---|---|---|---|---|---|---|---|---|---|---|
| February 25, 2008 | December 31, 2007 | March 5, 2008 | March 10, 2008 | $0.635 | |||||||||||||||||||||||
| May 5, 2008 | March 31, 2008 | June 4, 2008 | June 10, 2008 | $0.645 | |||||||||||||||||||||||
| August 4, 2008 | June 30, 2008 | September 4, 2008 | September 11, 2008 | $0.645 | |||||||||||||||||||||||
| November 4, 2008 | September 30, 2008 | December 3, 2008 | December 10, 2008 | ||||||||||||||||||||||||
The Company evaluated and disclosed the following events through February 25, 2010:
In February 2010, per the revised terms of the term loan agreement, as described in Note 12, “Long-Term Debt”, Atlantic Aviation used $17.1 million of excess cash flow to prepay $15.5 million of the outstanding principal balance of its term loan debt and incurred $1.6 million in interest rate swap breakage fees.
On January 28, 2010, the Company announced that PCAA had entered into an asset purchase agreement with Bainbridge ZKS — Corinthian Holdings, LLC. This agreement, which is subject to approval by the bankruptcy court, will result in the sale of the assets of PCAA for $111.5 million, subject to certain adjustments and will result in the elimination of $201.0 million of current debt from the liabilities of discontinued operations held for sale in the consolidated balance sheet. The cancelled debt in excess of the sale proceeds used to repay such debt would result in cancellation of debt income and the proceeds in excess of the business’ assets as a gain on sale. As a part of the bankruptcy sale process, all cash proceeds would be paid to creditors of the business. PCAA also commenced a voluntary Chapter 11 case with the bankruptcy court. If approved, the Company expects to complete the sale of the business in the first half of 2010.
As part of the bankruptcy filing, the Company has no obligation to and has no intention of committing additional capital to this business. Creditors of this business do not have recourse to any assets of the holding company or any assets of the other Company’s businesses, other than approximately $5.3 million relating to a guarantee of a single parking facility lease.
Results for PCAA are reported separately as discontinued operations for all periods presented. The assets and liabilities of the business being sold are included in assets of discontinued operations held for sale and liabilities of discontinued operations held for sale on the Company’s consolidated balance sheet.
| Operating Revenue | Operating Income (Loss) | Net (Loss) Income | |||||||||||||||||||||||||||||||||||||
|---|---|---|---|---|---|---|---|---|---|---|---|---|---|---|---|---|---|---|---|---|---|---|---|---|---|---|---|---|---|---|---|---|---|---|---|---|---|---|---|
| 2010 | 2009 | 2008 | 2010 | 2009 | 2008 | 2010 | 2009 | 2008 | |||||||||||||||||||||||||||||||
| ($ in Thousands) | |||||||||||||||||||||||||||||||||||||||
| Quarter ended: | |||||||||||||||||||||||||||||||||||||||
| March 31 | $ | 201,304 | $ | 167,496 | $ | 259,808 | $ | 22,476 | $ | (26,748 | ) | $ | 26,886 | $ | (5,465 | ) | $ | (46,435 | ) | $ | 843 | ||||||||||||||||||
| June 30 | 204,692 | 163,408 | 267,123 | 20,604 | (39,433 | ) | 24,308 | 400 | (26,838 | ) | 10,329 | ||||||||||||||||||||||||||||
| September 30 | 213,298 | 185,562 | 258,312 | 26,781 | 22,095 | 24,613 | 8,976 | (16,716 | ) | 2,516 | |||||||||||||||||||||||||||||
| December 31 | 221,497 | 193,610 | 192,118 | 6,240 | 17,028 | (70,185 | ) | 6,095 | (18,695 | ) | (83,284 | ) | |||||||||||||||||||||||||||
| Operating Revenue | Operating (Loss) Income | Net (Loss) Income | ||||||||||||||||||||||||||||||||||
| 2009 | 2008 | 2007 | 2009 | 2008 | 2007 | 2009 | 2008 | 2007 | ||||||||||||||||||||||||||||
| ($ in Thousands) | ||||||||||||||||||||||||||||||||||||
| Quarter ended: | ||||||||||||||||||||||||||||||||||||
| March 31 | $ | 167,496 | $ | 259,808 | $ | 150,171 | $ | (26,792 | ) | $ | 26,842 | $ | 17,677 | $ | (46,601 | ) | $ | 698 | $ | 9,624 | ||||||||||||||||
| June 30 | 163,408 | 267,123 | 157,137 | (39,489 | ) | 24,264 | (24,894 | ) | (27,013 | ) | 10,184 | (24,207 | ) | |||||||||||||||||||||||
| September 30 | 185,562 | 258,312 | 202,116 | 22,046 | 24,569 | 21,926 | (16,890 | ) | 2,368 | (17,013 | ) | |||||||||||||||||||||||||
| December 31 | 193,610 | 192,118 | 244,790 | 16,987 | (70,232 | ) | 15,597 | (18,666 | ) | (83,431 | ) | (11,533 | ) | |||||||||||||||||||||||
| Balance at Beginning of Year | Charged to Costs and Expenses | Deductions | Balance at End of Year | |||||||||||||||
|---|---|---|---|---|---|---|---|---|---|---|---|---|---|---|---|---|---|---|
| ($ in Thousands) | ||||||||||||||||||
| Allowance for Doubtful Accounts | ||||||||||||||||||
| For the Year Ended December 31, 2008 | $ | 1,899 | $ | 1,543 | $ | (1,301 | ) | $ | 2,141 | |||||||||
| For the Year Ended December 31, 2009 | 2,141 | 3,401 | (3,913 | ) | 1,629 | |||||||||||||
| For the Year Ended December 31, 2010 | 1,629 | 483 | (1,499 | ) | 613 | |||||||||||||
| Balance at Beginning of Year | Charged to Costs and Expenses | Deductions | Balance at End of Year | |||||||||||||||||
| ($ in Thousands) | ||||||||||||||||||||
| Allowance for Doubtful Accounts | ||||||||||||||||||||
| For the Year Ended December 31, 2007 | $ | 1,319 | $ | 593 | $ | (13 | ) | $ | 1,899 | |||||||||||
| For the Year Ended December 31, 2008 | $ | 1,899 | $ | 1,543 | $ | (1,301 | ) | $ | 2,141 | |||||||||||
| For the Year Ended December 31, 2009 | $ | 2,141 | $ | 3,401 | $ | (3,913 | ) | $ | 1,629 | |||||||||||
As discussed in Note 2 to the consolidated financial statements, the Company has changed its method of accounting for noncontrolling interests due to the adoption of ASC 810-10Consolidation(formerly Statement on Financial Accounting Standards No. 160,Noncontrolling Interests in Consolidated Financial Statements, an amendment of ARB No. 51)in 2009.
None.
| Plan Category | Number of Securities to Be Issued Upon Exercise of Outstanding Options, Warrants and Rights (a) | Weighted-Average Exercise Price of Outstanding Options, Warrants and Rights (b) | Number of Securities Remaining Available for Future Issuance Under Equity Compensation Plans (Excluding Securities Under Column (a)) (c) | |||||||||||
|---|---|---|---|---|---|---|---|---|---|---|---|---|---|---|
Equity compensation plans approved by securityholders(1) | 31,989 | $ | — | (1 | ) | |||||||||
| Equity compensation plans not approved by securityholders | — | — | — | |||||||||||
| Total | 31,989 | $ | — | (1 | ) | |||||||||
| (1) | Information represents number of LLC interests issuable upon the vesting of director stock units pursuant to our independent directors’ equity plan, which was approved and became effective in December 2004. Under the plan, each independent director elected at our annual meeting of shareholders is entitled to receive a number of director stock units equal to $150,000 divided by the average closing sale price of the stock during the 10-day period immediately preceding our annual meeting. The units vest on the day prior to the following year’s annual meeting. We granted 10,663 restricted stock units to each of our independent directors elected at our 2010 annual shareholders’ meeting based on the average closing price per share over a 10 trading day period of $14.07. We have 474,624 LLC interests reserved for future issuance under the plan. |
Pursuant to the requirements of Section 13 or 15(d) of the Securities Exchange Act of 1934, Macquarie Infrastructure Company LLC has duly caused this report to be signed on its behalf by the undersigned, thereunto duly authorized, on February 25, 2010.23, 2011.
/s/ James Hooke Chief Executive Officer |
| Signature | Title | ||||||||
|---|---|---|---|---|---|---|---|---|---|
/s/ James Hooke James Hooke | Chief Executive Officer (Principal Executive Officer) | ||||||||
/s/ Todd Weintraub Todd Weintraub | Chief Financial Officer (Principal Financial Officer and Principal Accounting Officer) | ||||||||
/s/ John Roberts John Roberts | Chairman of the Board of Directors | ||||||||
/s/ Norman H. Brown, Jr. Norman H. Brown, Jr. | Director | ||||||||
/s/ George W. Carmany III George W. Carmany III | Director | ||||||||
/s/ William H. Webb William H. Webb | Director | ||||||||
| Asset Purchase Agreement, dated as of | ||||||
| Purchase Agreement by and among Macquarie Infrastructure Company Inc., John Hancock Life Insurance Company, and John Hancock Life Insurance Company (U.S.A.), dated as of November 20, 2009 (the “Thermal Chicago Agreement”) (incorporated by reference to Exhibit 2.2 of the Registrant’s 2009 Annual Report on Form-10K) | ||||||
| Amendment to Purchase Agreement, dated as of December 21, 2009, regarding the Thermal Chicago Agreement (incorporated by reference to Exhibit 2.3 of the Registrant’s 2009 Annual Report on Form-10K) | ||||||
| 3.1 | Third Amended and Restated Operating Agreement of Macquarie Infrastructure Company LLC (incorporated by reference to Exhibit 3.1 of the Registrant’s Current Report on Form 8-K filed with the SEC on June 22, 2007 (the “June 22, 2007 8-K”)) | |||||
| 3.2 | Amended and Restated Certificate of Formation of Macquarie Infrastructure Assets LLC (incorporated by reference to Exhibit 3.8 of Amendment No. 2 to the Registrant’s Registration Statement on Form S-1 (Registration No. 333-116244) (“Amendment No. 2”) | |||||
| Specimen certificate evidencing LLC interests of Macquarie Infrastructure Company LLC (incorporated by reference to Exhibit 4.1 of the Registrant’s 2009 Annual Report on Form-10K) | ||||||
| 10.1 | Amended and Restated Management Services Agreement, dated as of June 22, 2007, among Macquarie Infrastructure Company LLC, Macquarie Infrastructure Company Inc., Macquarie Yorkshire LLC, South East Water LLC, Communications Infrastructure LLC and Macquarie Infrastructure Management (USA) Inc. (incorporated by reference to Exhibit 10.1 of the June 22, 2007 8-K) | |||||
| 10.2 | Amendment No. 1 to the Amended and Restated Management Services Agreement, dated as of February 7, 2008, among Macquarie Infrastructure Company LLC, Macquarie Infrastructure Company Inc., Macquarie Yorkshire LLC, South East Water LLC, Communications Infrastructure LLC and Macquarie Infrastructure Management (USA) Inc. (incorporated by reference to Exhibit 10.2 to the Registrant’s Annual Report on Form 10-K for the year ended December 31, 2007 (the “2007 Annual Report”)) | |||||
| 10.3 | Registration Rights Agreement among Macquarie Infrastructure Company Trust, Macquarie Infrastructure Company LLC and Macquarie Infrastructure Management (USA) Inc., dated as of December 21, 2004 (incorporated by reference to Exhibit 99.4 of the Registrant’s Current Report on Form 8-K, filed with the SEC on December 27, 2004) | |||||
| 10.4 | Macquarie Infrastructure Company LLC — Independent Directors Equity Plan (incorporated by reference to Exhibit 10.1 to the Registrant’s Quarterly Report on Form 10-Q for the quarter ended September 30, 2008) | |||||
| 10.5 | Second Amended and Restated Credit Agreement, dated as of February 13, 2008, among Macquarie Infrastructure Company Inc., Macquarie Infrastructure Company LLC, the Lenders (as defined therein), the Issuers (as defined therein) and Citicorp North America, Inc., as administrative agent (incorporated by reference to Exhibit 10.5 to the Registrant’s 2007 Annual Report) | |||||
| 10.6 | Loan Agreement, dated as of September 1, 2006 between Parking Company of America Airports, LLC, Parking Company of America Airports Phoenix, LLC, PCAA SP, LLC and PCA Airports, Ltd., as borrowers, and Capmark Finance Inc., as lender (incorporated by reference to Exhibit 10.1 of the Registrant’s Current Report on Form 8-K filed with the SEC on September 7, 2006) | |||||
| 10.7 | District Cooling System Use Agreement, dated as of October 1, 1994, between the City of Chicago, Illinois and MDE Thermal Technologies, Inc., as amended on June 1, 1995, July 15, 1995, February 1, 1996, April 1, 1996, October 1, 1996, November 7, 1996, January 15, 1997, May 1, 1997, August 1, 1997, October 1, 1997, March 12, 1998, June 1, 1998, October 8, 1998, April 21, 1999, March 1, 2000, March 15, 2000, June 1, 2000, August 1, 2001, November 1, 2001, June 1, 2002, and June 30, 2004 (incorporated by reference to Exhibit 10.25 of Amendment No. 2) | |||||
| Twenty-Third Amendment to the District Cooling System Use Agreement, dated as of November 1, 2005, by and between the City of Chicago and Thermal Chicago Corporation (incorporated by reference to Exhibit 10.5 to the Registrant’s Quarterly Report on Form 10-Q for the quarter ended June 30, 2006 (the “June 2006 Quarterly Report”)) | ||||||
| 10.9 | Twenty-Fourth Amendment to District Cooling System Use Agreement, dated as of November 1, 2006, by and between the City of Chicago, Illinois and MDE Thermal Technologies, Inc. (incorporated by reference to Exhibit 10.3 to the Registrant’s Quarterly Report on Form 10-Q for the quarter ended March 31, 2007 (the “March 2007 Quarterly Report”)) | |||||
| 10.10 | Twenty-Fifth Amendment to District Cooling System Use Agreement, dated as of October 1, 2008, by and between the City of Chicago, Illinois and Thermal Chicago Corporation (incorporated by reference to Exhibit 10.16 to Registrant’s Annual Report on Form 10-K for the year ended December 31, 2009 (the “2009 10-K Report”)) | |||||
| 10.11 | Loan Agreement, dated as of September 21, 2007, among Macquarie District Energy, Inc., the Lenders defined therein, Dresdner Bank AG New York Branch, as administrative agent and LaSalle Bank National Association, as issuing bank (incorporated by reference to Exhibit 10.1 to the Registrant’s Current Report on Form 8-K filed with the SEC on September 27, 2007). | |||||
| 10.12 | Amendment Number One to Loan Agreement, dated as of December 21, 2007, among Macquarie District Energy, Inc., the several banks and other financial institutions signatories hereto, LaSalle Bank National Association, as Issuing Bank and Dresdner Bank AG New York Branch, as Administrative Agent (incorporated by reference to Exhibit 10.11 to the Registrant’s 2007 Annual Report) | |||||
| 10.13 | Amendment Number Two to Loan Agreement, dated as of February 22, 2008, among Macquarie District Energy, Inc., the several banks and other financial institutions signatories thereto; LaSalle Bank National Association, as Issuing Bank and Dresdner Bank AG New York Branch, as Administrative Agent (incorporated by reference to Exhibit 10.12 to the Registrant’s 2007 Annual Report) | |||||
| 10.14 | Shareholder’s Agreement, dated April 14, 2006, between Macquarie Terminal Holdings LLC, IMTT Holdings Inc., the Current Shareholders and the Current Beneficial Owners named therein (incorporated by reference to Exhibit 10.1 of the Registrant’s Current Report on Form 8-K, filed with the SEC on April 17, 2006) | |||||
| 10.15 | Letter Agreement, dated January 23, 2007, between Macquarie Terminal Holdings LLC, IMTT Holdings Inc., the Current Shareholders and the Current Beneficial Owners named therein (incorporated by reference to Exhibit 10.10 to the Registrant’s 2006 Annual Report) | |||||
| 10.16 | Letter Agreement entered into as of June 20, 2007 among IMTT Holdings Inc. (IMTT Holdings), Macquarie Terminal Holdings LLC and the Current Beneficial Shareholders of IMTT Holdings, amending the Shareholders Agreement dated April 14, 2006 (as amended) between IMTT Holdings and the Shareholders thereof (incorporated by reference to Exhibit 10.5 to the June 2007 Quarterly Report) | |||||
| 10.17 | Letter Agreement, dated as of July 30, 2007, among IMTT Holdings Inc. (IMTT), Macquarie Terminal Holdings LLC and the other current beneficial shareholders of IMTT amending the Shareholders Agreement dated April 14, 2006 (as amended) between the same parties (incorporated by reference to Exhibit 10.6 to the June 2007 Quarterly Report) | |||||
| 10.18 | Loan Agreement, dated as of September 27, 2007, among Atlantic Aviation FBO Inc., the Lenders, as defined therein, and Depfa Bank plc, as Administrative Agent, and Amendments No. 1 and No. 2 thereto (incorporated by reference to Exhibit 10.1 of the September 2007 Quarterly Report) | |||||
| 10.19 | Waiver and Amendment Number Three to Loan Agreement, dated as of November 30, 2007, among Atlantic Aviation FBO Inc., the several banks and other financial institutions signatories thereto and Depfa Bank plc, as Administrative Agent (incorporated by reference to Exhibit 10.19 to the Registrant’s 2007 Annual Report) | |||||
| Waiver and Amendment Number Four to Loan Agreement, dated as of December 27, 2007, among Atlantic Aviation FBO INC. and the several banks and other financial institutions signatories thereto (incorporated by reference to Exhibit 10.20 to the Registrant’s 2007 Annual Report) | ||||||
| 10.21 | Consent and Amendment Number Five to Loan Agreement, dated as of January 31, 2008, among Atlantic Aviation FBO INC., Atlantic Aviation FBO Holdings LLC (formerly known as Macquarie FBO Holdings LLC) and the several banks and other financial institutions signatories thereto (incorporated by reference to Exhibit 10.21 to the Registrant’s 2007 Annual Report). | |||||
| 10.22 | Amendment Number Six to Loan Agreement, dated as of February 25, 2009, among Atlantic Aviation FBO Inc and the bank or banks and other financial institutions signatories thereto (incorporated by reference to Exhibit 10.29 to the 2009 10-K Report) | |||||
| 10.23 | Amended and Restated Loan Agreement, dated as of June 7, 2006, among HGC Holdings LLC, Macquarie Gas Holdings LLC, the Lenders named herein and Dresdner Bank AG London Branch (incorporated by reference to Exhibit 10.1 of the | |||||
| 10.24 | Amended and Restated Loan Agreement, dated as of June 7, 2006, among The Gas Company LLC, Macquarie Gas Holdings LLC, the Lenders defined therein and Dresdner Bank AG London Branch (incorporated by reference to Exhibit 10.2 of the | |||||
| 10.25 | Letter Amendment, dated August 18, 2006, amending the Amended and Restated Loan Agreement dated as of June 7, 2006, among HGC Holdings LLC, Macquarie Gas Holdings LLC, the Lenders named herein and Dresdner Bank AG London Branch and the Amended and Restated Loan Agreement, dated as of June 7, 2006, among The Gas Company LLC, Macquarie Gas Holdings LLC, the Lenders defined therein and Dresdner Bank AG London Branch (incorporated by reference to Exhibit 10.1 of the | |||||
| 10.26 | Amendment Number Two to Amended and Restated Loan Agreement, dated as of July 16, 2008, among The Gas Company, LLC, Macquarie Gas Holdings LLC, the several banks and other financial institutions signatories hereto and Dresdner Bank AG Niederlassung Luxemburg (successor administrative agent to Dresdner Bank AG London Branch) (incorporated by reference to Exhibit 10.2 of the June 2008 Quarterly Report) | |||||
| 10.27* | Loan Agreement, dated as of December 1, 2010 between Louisiana Public Facilities Authority, as issuer, IMTT Finco, LLC., and Wells Fargo Bank National Association, as trustee | |||||
| 10.28* | Loan Agreement, dated as of November 1, 2010 between Louisiana Public Facilities Authority, as issuer, IMTT Finco, LLC., and Wells Fargo Bank National Association, as trustee | |||||
| 10.29 | Loan Agreement, dated as of August 1, 2010 between Louisiana Public Facilities Authority, as issuer, IMTT Finco, LLC., and US Bank National Association, as trustee (incorporated by reference to Exhibit 10.1 of the Registrant’s Current Report on Form 10-Q for the quarter ended September 30, 2010) | |||||
| 10.30 | Second Amendment to Revolving Credit Agreement, dated as of June 18, 2010, by and among International-Matex Tank Terminals and IMTT-Bayonne as US Borrowers, IMTT-QUEBEC INC. IMTT and IMTT-NTL, LTD., as Canadian Borrowers, the several banks and other financial institutions, party and hereto, as Lenders, SunTrust Bank, in its capacity as administrative agent for the Lenders, the US issuing bank, as swingline lender, and Royal Bank of Canada, as Canadian funding agent for the Canadian Lenders and as the Canadian issuing bank and the Amended and Restated Revolving Credit Agreement, dated June 18, 2010, among the several banks and other financial institutions party thereto, Suntrust Robinson Humphrey, Inc. and Regions Capital Markets, as Joint Lead Arrangers and the U.S. Borrowers and Canadian Borrowers (incorporated by reference to Exhibit 10.1 of the Registrant’s Current Report on Form 10-Q for the quarter ended June 30, 2010) | |||||
| 21.1* | Subsidiaries of the Registrant | |||||
| 23.1* | Consent of KPMG LLP | |||||
| 23.2* | Consent of KPMG LLP (IMTT) | |||||
| 24.1* | Powers of Attorney (included in signature pages) | |||||
| 31.1* | Rule 13a-14(a)/15d-14(a) Certification of the Chief Executive Officer | |||||
| 31.2* | Rule 13a-14(a)/15d-14(a) Certification of the Chief Financial Officer | |||||
| 32.1** | Section 1350 Certification of Chief Executive Officer | |||||
| 32.2** | Section 1350 Certification of Chief Financial Officer | |||||
| 99.1* | Consolidated Financial Statements for IMTT Holdings Inc., for the Years Ended December 31, | |||||
| * | Filed herewith. |
| ** |