
| (Mark One) | ||
| x | ANNUAL REPORT PURSUANT TO SECTION 13 OR 15(d) OF THE SECURITIES EXCHANGE ACT OF 1934. |
| o | TRANSITION REPORT PURSUANT TO SECTION 13 OR 15(d) OF THE SECURITIES EXCHANGE ACT OF 1934. |
| New Jersey | 52-1273725 | |
(State or Other Jurisdiction of Incorporation or Organization) | (IRS Employer Identification Number) |
Large Accelerated Filer o | Accelerated Filer x | Non-Accelerated o | ||||
| Small Reporting Companyo |
Definitive proxy statement in connection with the 2010 Annual Stockholders Meeting to be filed with the Commission pursuant to Regulation 14A will be
| Page | |||||
| |||||
| 1 | |||||
| 6 | |||||
| 7 | |||||
| |||||
| |||||
| |||||
| |||||
| |||||
| |||||
Item 7. | 9 | ||||
| 42 | |||||
Item 8. | F-1 | ||||
| Report of Independent Registered Public Accounting Firm | F-2 | ||||
| Center Bancorp, Inc. and Subsidiaries: | |||||
| F-3 | |||||
| F-4 | |||||
| F-5 | |||||
| F-6 | |||||
| F-8 | |||||
| 44 | |||||
| |||||
| |||||
| |||||
| |||||
| |||||
| |||||
| |||||
Item 15. | 47 | ||||
| 50 | |||||
Information included in or incorporated by reference in this Annual Report on Form 10-K, other filings with the Securities and Exchange Commission and the Corporation’s press releases or other public statements, contain or may contain forward looking statements. Please refer to a discussion of the Corporation’s forward looking statements and associated risks in “Item 1 — Business — Historical Development of Business” and “Item 1A — Risk Factors” in this Annual Report on Form 10-K.
i
This report, in Item 1, Item 7 and elsewhere, includes forward-looking statements within the meaning of Sections 27A of the Securities Act of 1933, as amended, and 21E of the Securities Exchange Act of 1934, as amended, that involve inherent risks and uncertainties. This report contains certain forward-looking statements with respect to the financial condition, results of operations, plans, objectives, future performance and business of Center Bancorp, Inc. and its subsidiaries, including statements preceded by, followed by or that include words or phrases such as “believes,” “expects,” “anticipates,” “plans,” “trend,” “objective,” “continue,” “remain,” “pattern” or similar expressions or future or conditional verbs such as “will,” “would,” “should,” “could,” “might,” “can,” “may” or similar expressions. There are a number of important factors that could cause future results to differ materially from historical performance and these forward-looking statements. Factors that might cause such a difference include, but are not limited to: (1) competitive pressures among depository institutions may increase significantly; (2) changes in the interest rate environment may reduce interest margins; (3) prepayment speeds, loan origination and sale volumes, charge-offs and loan loss provisions may vary substantially from period to period; (4) general economic conditions may be less favorable than expected; (5) political developments, wars or other hostilities may disrupt or increase volatility in securities markets or other economic conditions; (6) legislative or regulatory changes or actions may adversely affect the businesses in which Center Bancorp, Inc. is engaged; (7) changes and trends in the securities markets may adversely impact Center Bancorp, Inc; (8) a delayed or incomplete resolution of regulatory issues could adversely impact our planning; (9) the impact of reputation risk created by the developments discussed above on such matters as business generation and retention, funding and liquidity could be significant; and (10) the outcome of regulatory and legal investigations and proceedings may not be anticipated. Further information on other factors that could affect the financial results of Center Bancorp, Inc. are included in Item 1A of this Annual Report on Form 10-K and in Center Bancorp’s other filings with the Securities and Exchange Commission. These documents are available free of charge at the Commission’s website at http://www.sec.gov and/or from Center Bancorp, Inc. Center Bancorp, Inc. assumes no obligation to update forward-looking statements at any time.
Center Bancorp, Inc., a one-bank holding company, was incorporated in the state of New Jersey on November 12, 1982. Center Bancorp, Inc., commenced operations on May 1, 1983, upon the acquisition of all outstanding shares of capital stock of Union Center National Bank (the “Bank”), its principal subsidiary. The holding company’s sole activity, at this time, is to act as a holding company for the Bank and other subsidiaries. As used herein, the term “Corporation” shall refer to Center Bancorp, Inc. and its direct and indirect subsidiaries and the term “Parent Corporation” shall refer to Center Bancorp, Inc. on an unconsolidated basis. In addition to its principal subsidiary, Center Bancorp, Inc. owns 100 percent of the voting shares of Center Bancorp, Inc. Statutory Trust II, through which it issued trust preferred securities. Center Bancorp, Inc. Statutory Trust II is not a consolidated subsidiary. See Note 10 of the Consolidated Financial Statements.
The Corporation’s wholly-owned subsidiaries are all included in the consolidated financial statements of Center Bancorp, Inc. These subsidiaries include an advertising subsidiary; an insurance subsidiary offering annuity products, property and casualty, life and health insurance, and various investment subsidiaries which hold, maintain and manage investment assets for the Corporation. In the past, the Corporation’s subsidiaries have also included real estate investment trust subsidiaries (the “REIT” subsidiaries) and two title insurance partnerships. The title insurance partnerships were liquidated and ceased operations in December 2009. During the fourth quarter of 2006, the Corporation effected an internal entity reorganization and adopted a plan of liquidation for its one remaining REIT subsidiary, which was completed on November 16, 2007.
During 2001 and 2003, the Corporation formed statutory business trusts, which exist for the exclusive purpose of (i) issuing trust securities representing undivided beneficial interests in the assets of a trust; (ii) investing the gross proceeds of the trust securities in junior subordinated deferrable interest debentures (subordinated debentures) of the Corporation; and (iii) engaging in only those activities necessary or incidental thereto. These subordinated debentures and the related income effects are not eliminated in the consolidated financial statements as the statutory business trusts are not consolidated in accordance with Financial Accounting Standards Board (“FASB”) FASB ASC 810-10 (previously FASB interpretation No. 46(R), “Consolidation of Variable Interest Entities.” Distributions on the subordinated debentures owned by the subsidiary trusts have been classified as interest expense in the Consolidated Statements of Income.
The Corporation issued $10.3 million of subordinated debentures in 2001 and $5.2 million of subordinated debentures in 2003. On December 18, 2006, the Corporation redeemed $10.3 million of subordinated debentures and dissolved Center Bancorp, Inc. Statutory Trust I. At December 31, 2009, the $5.2 million of these securities still outstanding are included as a component of Tier 1 Capital for regulatory purposes. The Tier 1 leverage capital ratio was 7.80 percent at December 31, 2009.
During 2002, the Bank established two investment subsidiaries to hold portions of its securities portfolio. At December 2007, under a plan of liquidation adopted by the Bank, one of the investment companies had been liquidated. During 2008, the Corporation formed a new investment company. In January of 2003, the Corporation established an insurance subsidiary for the sale of insurance and annuity products. The Corporation also formed a title insurance partnership during the later part of 2007 that was fully operational in 2008. During the early part of 2008, the Corporation formed a second title partnership that was fully operational during the second half of 2008. Both title insurance partnerships were liquidated during December, 2009 and the Bank no longer provides title insurance.
The Parent Corporation makes its Annual Report on Form 10-K, Quarterly Reports on Form 10-Q and Current Reports on Form 8-K and amendments thereto available on its website atwww.centerbancorp.com without charge as soon as reasonably practicable after filing or furnishing them to the SEC. Also available on the website are the Corporation’s corporate code of ethics that applies to all of the Corporation’s employees, including principal officers and directors, and charters for the Audit Committee, Compensation Committee and Nominating Committee.
The Parent Corporation has filed the certifications of the Chief Executive Officer and Chief Financial Officer required pursuant to Section 302 of the Sarbanes-Oxley Act of 2002 with respect to the Parent Corporation’s Annual Report on Form 10-K as exhibits to this Report. Center Bancorp’s CEO submitted the required annual CEO’s Certification regarding the NASDAQ’s corporate governance listing standards, Section 12(a) CEO Certification, to the NASDAQ within the required time frame after the 2009 annual shareholders’ meeting.
Additionally, the Parent Corporation will provide without charge, a copy of its Annual Report on Form 10-K to any shareholder by mail. Requests should be sent to Center Bancorp, Inc, Attention: Shareholder Relations, 2455 Morris Avenue, Union, New Jersey, 07083.
The Bank offers a broad range of lending, depository and related financial services to commercial, industrial and governmental customers. In 1999, the Bank obtained full trust powers, enabling it to offer a variety of trust services to its customers. In the lending area, the Bank’s services include short and medium term loans, lines of credit, letters of credit, working capital loans, real estate construction loans and mortgage loans. In the depository area, the Bank offers demand deposits, savings accounts and time deposits. In addition, the Bank offers collection services, wire transfers, night depository and lock box services.
The Bank offers a broad range of consumer banking services, including interest bearing and non-interest bearing checking accounts, savings accounts, money market accounts, certificates of deposit, IRA accounts, Automated Teller Machine (“ATM”) accessibility using Star Systems, Inc. service, secured and unsecured loans, mortgage loans, home equity lines of credit, safe deposit boxes, Christmas club accounts, vacation club accounts, money orders and travelers’ checks.
The Bank, through its subsidiary, Center Financial Group LLC, provides financial services, including brokerage services, insurance and annuities, mutual funds and financial planning. In the fourth quarter of 2007, the Corporation formed a title insurance partnership, Center Title LLC, with Progressive Title Company in Parsippany, New Jersey to provide title services in connection with the closing of real estate transactions. In January 2008, the Corporation formed a title insurance partnership, Union Title LLC, with Elite Title Abstract of West Caldwell, New Jersey to provide title services in connection with the closing of real estate loan transactions. Our partnerships with both title companies were liquidated during December, 2009.
The Bank offers various money market services. It deals in U.S. Treasury and U.S. Governmental agency securities, certificates of deposit, commercial paper and repurchase agreements.
The Bank entered into a limited liability company operating agreement with Morris Property Company, LLC, a New Jersey limited liability company, during the fourth quarter of 2008. The purpose of Morris Property Company, LLC is to hold foreclosed assets.
Competitive pressures affect the Corporation’s manner of conducting business. Competition stems not only from other commercial banks but also from other financial institutions such as savings banks, savings and loan associations, mortgage companies, leasing companies and various other financial service and advisory companies. Many of the financial institutions operating in the Corporation’s primary market are substantially larger and offer a wider variety of products and services than the Corporation.
The banking industry is highly regulated. Statutory and regulatory controls increase a bank holding company’s cost of doing business and limit the options of its management to deploy assets and maximize income. The following discussion is not intended to be a complete list of all the activities regulated by the banking laws or of the impact of such laws and regulations on the Corporation or its Bank subsidiary. It is intended only to briefly summarize some material provisions.
Center Bancorp, Inc. is a bank holding company within the meaning of the Bank Holding Company Act of 1956 (the “Holding Company Act”). As a bank holding company, the Parent Corporation is supervised by the Board of Governors of the Federal Reserve System (“FRB”) and is required to file reports with the FRB and provide such additional information as the FRB may require. The Parent Corporation and it subsidiaries are subject to examination by the FRB.
On November 9, 2007, the FRB approved the Parent Corporation’s application to become a Financial Holding Company. A Financial Holding Company may perform the following activities: insurance underwriting, securities dealing and underwriting, financial and investment advisory services, merchant banking and issuing or selling security interests in bank-eligible assets. Financial Holding Companies may also engage in any other activity that the FRB determines to be financial in nature or incidental to financial activities after consultation with the Secretary of the Treasury. A Financial Holding Company may also engage in any non-financial activity that the FRB determines is complementary to a financial activity and does not pose a substantial risk to the safety or soundness of depository institutions or the financial system. As of December 31, 2009, the Corporation officially rescinded its status as a financial services holding company as a result of the discontinuation of the title insurance activities.
The Holding Company Act prohibits the Corporation, with certain exceptions, from acquiring direct or indirect ownership or control of more than five percent of the voting shares of any company which is not a bank and from engaging in any business other than that of banking, managing and controlling banks or furnishing services to subsidiary banks, except that it may, upon application, engage in, and may own shares of companies engaged in, certain businesses found by the FRB to be so closely related to banking “as to be a proper incident thereto.” The Holding Company Act requires prior approval by the FRB of the acquisition by Center Bancorp, Inc. of more than five percent of the voting stock of any other bank. Satisfactory capital ratios and Community Reinvestment Act ratings and anti-money laundering policies are generally prerequisites to obtaining federal regulatory approval to make acquisitions. The policy of the FRB provides that a bank holding company is expected to act as a source of financial strength to its subsidiary bank and to commit resources to support the subsidiary bank in circumstances in which it might not do so absent that policy.
Acquisitions through Union Center National Bank require approval of the Office of the Comptroller of the Currency of the United States (“OCC”). The Holding Company Act does not place territorial restrictions on the activities of non-bank subsidiaries of bank holding companies. The Gramm-Leach-Bliley Act, discussed below, allows the Corporation to expand into insurance, securities, merchant banking activities, and other activities that are financial in nature.
The Riegle-Neal Interstate Banking and Branching Efficiency Act of 1994 (“Interstate Banking and Branching Act”) enables bank holding companies to acquire banks in states other than their home state, regardless of applicable state law. The Interstate Banking and Branching Act also authorizes banks to merge across state lines, thereby creating interstate banks with branches in more than one state. Under the legislation, each state had the opportunity to “opt-out” of this provision. Furthermore, a state may “opt-in” with respect tode novo branching, thereby permitting a bank to open new branches in a state in which the bank does not already have a branch. Withoutde novo branching, an out-of-state commercial bank can enter the state only by acquiring an existing bank or branch. The vast majority of states have allowed interstate banking by merger but have not authorizedde novo branching.
New Jersey enacted legislation to authorize interstate banking and branching and the entry into New Jersey of foreign country banks. New Jersey did not authorizede novo branching into the state. However, under federal law, federal savings banks which meet certain conditions may branchde novo into a state, regardless of state law.
The operations of the Bank are subject to requirements and restrictions under federal law, including requirements to maintain reserves against deposits, restrictions on the types and amounts of loans that may be granted, and limitations on the types of investments that may be made and the types of services which may be offered. Various consumer laws and regulations also affect the operations of the Bank. Approval of the Comptroller of the Currency is required for branching, bank mergers in which the continuing bank is a national bank and in connection with certain fundamental corporate changes affecting the Bank. There are various legal limitations, including Sections 23A and 23B of the Federal Reserve Act, which govern the extent to which a bank subsidiary may finance or otherwise supply funds to its holding company or its holding company’s non-bank subsidiaries. Under federal law, no bank subsidiary may, subject to certain limited exceptions, make loans or extensions of credit to, or investments in the securities of, its parent or the non-bank subsidiaries of its parent (other than direct subsidiaries of such bank which are not financial subsidiaries) or take their securities as collateral for loans to any borrower. Each bank subsidiary is also subject to collateral security requirements for any loans or extensions of credit permitted by such exceptions.
The Bank and the OCC have entered into an informal Memorandum of Understanding, or MOU. A memorandum of understanding is characterized by the regulatory authorities as an informal action that is not published or publicly available and that is used when circumstances warrant a milder form of action than a formal supervisory action. Among other things, under the MOU, the Bank has agreed to develop a three year capital program, which will include specific plans for the maintenance of adequate capital and the strengthening of the Bank’s capital structure to meet the Bank’s current and future needs, a profit plan that includes the identification of the major areas and means by which the Board will seek to improve the Bank’s operating performance, and a dividend policy that permits the declaration of a dividend by the Bank only with the prior approval of the OCC. Management is committed to addressing and resolving the issues raised by the OCC and has substantially completed corrective actions to comply with the MOU. In addition, the OCC has established higher minimum capital ratios for the Bank than the regulatory minimums. See “FDICIA.”
The Federal Reserve Board has issued Regulation W, which codifies prior regulations under Sections 23A and 23B of the Federal Reserve Act and interpretative guidance with respect to affiliate transactions. Regulation W incorporates the exemption from the affiliate transaction rules but expands the exemption to cover the purchase of any type of loan or extension of credit from an affiliate. Affiliates of a bank include, among other entities, the bank’s holding company and companies that are under common control with the bank. The Parent Corporation is considered to be an affiliate of the Bank. In general, subject to certain specified exemptions, a bank or its subsidiaries are limited in their ability to engage in “covered transactions” with affiliates:
In addition, a bank and its subsidiaries may engage in covered transactions and other specified transactions only on terms and under circumstances that are substantially the same, or at least as favorable to the bank or its subsidiary, as those prevailing at the time for comparable transactions with nonaffiliated companies. A “covered transaction” includes:
In addition, under Regulation W:
Regulation W generally excludes all non-bank and non-savings association subsidiaries of banks from treatment as affiliates, except to the extent that the Federal Reserve Board decides to treat these subsidiaries as affiliates.
Under the Financial Institutions Reform, Recovery, and Enforcement Act of 1989 (“FIRREA”), a depository institution insured by the Federal Deposit Insurance Corp (“FDIC”) can be held liable for any loss incurred by, or reasonably expected to be incurred by, the FDIC in connection with (i) the default of a commonly controlled FDIC-insured depository institution or (ii) any assistance provided by the FDIC to a commonly controlled FDIC-insured depository institution in danger of default. These provisions have commonly been referred to as FIRREA’s “cross guarantee” provisions. Further, under FIRREA, the failure to meet capital guidelines could subject a bank to a variety of enforcement remedies available to federal regulatory authorities.
FIRREA also imposes certain independent appraisal requirements upon a bank’s real estate lending activities and further imposes certain loan-to-value restrictions on a bank’s real estate lending activities. The bank regulators have promulgated regulations in these areas.
Pursuant to the Federal Deposit Insurance Corporation Improvement Act of 1991 (“FDICIA”), each federal banking agency has promulgated regulations, specifying the levels at which a financial institution would be considered “well capitalized,” “adequately capitalized,” “undercapitalized,” “significantly undercapitalized,” or “critically undercapitalized,” and to take certain mandatory and discretionary supervisory actions based on the capital level of the institution. To qualify to engage in financial activities under the Gramm-Leach-Bliley Act, all depository institutions must be “well capitalized.” The financial holding company of a national bank will be put under directives to raise its capital levels or divest its activities if the depository institution falls from that level.
The OCC’s regulations implementing these provisions of FDICIA provide that an institution will be classified as “well capitalized” if it (i) has a total risk-based capital ratio of at least 10.0 percent, (ii) has a Tier 1 risk-based capital ratio of at least 6.0 percent, (iii) has a Tier 1 leverage ratio of at least 5.0 percent, and (iv) meets certain other requirements. An institution will be classified as “adequately capitalized” if it (i) has a total risk-based capital ratio of at least 8.0 percent, (ii) has a Tier 1 risk-based capital ratio of at least 4.0 percent, (iii) has a Tier 1 leverage ratio of (a) at least 4.0 percent or (b) at least 3.0 percent if the institution was rated 1 in its most recent examination, and (iv) does not meet the definition of “well capitalized.” An institution will be classified as “undercapitalized” if it (i) has a total risk-based capital ratio of less than 8.0 percent, (ii) has a Tier 1 risk-based capital ratio of less than 4.0 percent, or (iii) has a Tier 1 leverage ratio of (a) less than 4.0 percent or (b) less than 3.0 percent if the institution was rated 1 in its most recent examination. An institution will be classified as “significantly undercapitalized” if it (i) has a total risk-based capital ratio of less than 6.0 percent, (ii) has a Tier 1 risk-based capital ratio of less than 3.0 percent, or (iii) has a Tier 1 leverage ratio of less than 3.0 percent. An institution will be classified as “critically undercapitalized” if it has a tangible equity to total assets ratio that is equal to or less than 2.0 percent. An insured depository institution may be deemed to be in a lower capitalization category if it receives an unsatisfactory examination rating. The OCC has established higher minimum capital ratios for the Bank effective as of December 31, 2009: Tier 1 Risk-Based Capital of 10.0 percent, Total Risk-Based Capital of 12.0 percent and Tier 1 Leverage Capital of 8.0 percent. Similar categories apply to bank holding companies. At December 31, 2009, the Bank’s capital ratios were all above the minimum levels required, other than the Tier 1 Leverage Capital ratio, which was slightly below the 8.0 percent established by the OCC for the Bank.
In addition, significant provisions of FDICIA required federal banking regulators to impose standards in a number of other important areas to assure bank safety and soundness, including internal controls, information systems and internal audit systems, credit underwriting, asset growth, compensation, loan documentation and interest rate exposure. Under the MOU between the Bank and the OCC, the bank has agreed to develop a three year capital program, which will include specific plans for the maintenance of adequate capital and the strengthening of the Bank’s capital structure to meet current and future needs.
On November 21, 2008, the Board of Directors of the FDIC adopted a final rule relating to the Temporary Liquidity Guarantee Program (the “TLG Program”). The TLG Program was announced by the FDIC on October 14, 2008, to strengthen confidence and encourage liquidity in the banking system. Under the original TLG Program the FDIC would guarantee, through the earlier of maturity or June 30, 2012, certain newly issued senior unsecured debt issued by participating institutions on or after October 14, 2008, and before June 30, 2009 (the “Debt Guarantee Program”). The Debt Guarantee Program was extended for senior unsecured debt issued after April 1, 2009 and before October 31, 2009, and maturing on or after December 31, 2012. On October 20, 2009, the FDIC established a limited, six-month emergency guarantee facility upon expiration of the Debt Guarantee Program. Under this emergency guarantee facility, certain participating entities can apply to the FDIC for permission to issue FDIC-guaranteed debt during the period starting October 31, 2009 through April 30, 2010. As of December 31, 2009, the Bank had no senior unsecured debt scheduled to mature on or before April 30, 2010.
The other provision of the TLG Program provided full FDIC deposit insurance coverage for non-interest bearing transaction deposit accounts, NOW accounts paying less than 0.5 percent interest per annum and certain types of interest paying attorney trust accounts held at participating FDIC-insured institutions originally
through December 31, 2009 (the “Transaction Account Guarantee Program”). The Transaction Account Guarantee Program has been extended to June 30, 2010. Entities that wish to continue their participation in the Transaction Account Guarantee Program during the extension need not take any additional action. After December 31, 2009, those institutions that have not opted out of the extension will be charged an annualized rate according to the institutions risk category. The assessments will be paid each quarter and will be based on amounts over $250,000 for the portion of the quarter that the institution is assigned to the risk category. The Bank has elected to continue participation in the Transaction Account Guarantee Program.
Substantially all of the deposits of the Bank are insured up to applicable limits by the Deposit Insurance Fund (“DIF”) of the FDIC and are subject to deposit insurance assessments to maintain the DIF. The FDIC utilizes a risk-based assessment system that imposes insurance premiums based upon a risk matrix that takes into account a bank’s capital level and supervisory rating, known as a “CAMEL rating”. On December 16, 2008, the FDIC adopted a final rule increasing risk-based assessment rates uniformly by 7 basis points (7 cents for every $100 of deposits), on an annual basis, for the first quarter of 2009. Subsequently on April 1, 2009, the FDIC issued rules which attempted to improve the methodology of the assessment system by differentiating risk among insured institutions.
On May 22, 2009, the Board of Directors of the FDIC adopted a final rule imposing a special assessment on the entire banking industry. The special assessment was calculated as 5 basis points times each insured depository institution’s assets minus Tier I capital as reported in the report of condition of June 30, 2009 and would not exceed ten times the institutions assessment base for the second quarter 2009 risk-based assessment. This special assessment, which totaled $1.2 million, was collected on September 30, 2009. Including this special assessment, the Bank paid a total of $2.1 million in FDIC assessments in 2009.
On November 12, 2009, the FDIC adopted the final rule which required insured depository institutions to prepay their quarterly risk-based assessments for the fourth quarter of 2009 through the fourth quarter of 2012. An institution’s prepaid assessment for the fourth quarter of 2009 and all of 2010 will be determined by multiplying the total base assessment rate that the institution would have paid for the third quarter of 2009 times the corresponding prepaid assessment base for each quarter. For each quarter of the prepayment period, an institution’s prepaid assessment base will be calculated by increasing its third quarter 2009 assessment base at an annual rate of 5 percent. An institution’s prepaid assessment for each quarter of 2011 and 2012 will be determined by multiplying its prepaid assessment rate plus .75 basis points times the corresponding prepaid assessment base for each quarter. On December 30, 2009, the Corporation remitted an FDIC prepayment in the amount of $5.7 million.
The enactment of the Emergency Economic Stabilization Act of 2008 (“EESA”) temporarily raised the basic limit on federal deposit insurance coverage from $100,000 to $250,000 per depositor. The temporary increase in deposit insurance coverage became effective on October 3, 2008. On May 20, 2009, the temporary increase to $250,000 per depositor was extended through December 31, 2013. On January 1, 2014, deposit insurance coverage will return to $100,000.
In addition to deposit insurance assessments, the FDIC is required to continue to collect from institutions payments for the servicing of obligations of the Financing Corporation (“FICO”) that were issued in connection with the resolution of savings and loan associations, so long as such obligations remain outstanding. The Corporation paid a FICO premium of $82,000 in 2009.
The Gramm-Leach-Bliley Financial Modernization Act of 1999 became effective in early 2000. The Modernization Act:
The Modernization Act also modified other financial laws, including laws related to financial privacy and community reinvestment.
Under the Community Reinvestment Act (“CRA”), as implemented by OCC regulations, a national bank has a continuing and affirmative obligation consistent with its safe and sound operation to help meet the credit needs of its entire community, including low and moderate income neighborhoods. The CRA does not establish specific lending requirements or programs for financial institutions nor does it limit an institution’s discretion to develop the types of products and services that it believes are best suited to its particular community, consistent with the CRA. The CRA requires the OCC, in connection with its examination of a national bank, to assess the bank’s record of meeting the credit needs of its community and to take such record into account in its evaluation of certain applications by such bank.
In response to the events of September 11, 2001, the Uniting and Strengthening America by Providing Appropriate Tools Required to Intercept and Obstruct Terrorism Act of 2001 (the “USA PATRIOT Act”), was signed into law on October 26, 2001. The USA PATRIOT Act gives the federal government powers to address terrorist threats through domestic security measures, surveillance powers, information sharing, and anti-money laundering requirements. By way of amendments to the Bank Secrecy Act, the USA PATRIOT Act encourages information sharing among bank regulatory agencies and law enforcement bodies. Further, certain provisions of the USA PATRIOT Act impose affirmative obligations on a broad range of financial institutions, including banks, thrifts, brokers, dealers, credit unions, money transfer agents and parties registered under the Commodity Exchange Act.
Among other requirements, the USA PATRIOT Act imposes the following requirements with respect to financial institutions:
The stated goals of the Sarbanes-Oxley Act of 2002 (the “SOA”) are to increase corporate responsibility, to provide for enhanced penalties for accounting and auditing improprieties by publicly traded companies and to protect investors by improving the accuracy and reliability of corporate disclosures pursuant to the securities laws.
The SOA generally applies to all companies, both U.S. and non-U.S., that file or are required to file periodic reports with the Securities and Exchange Commission (the “SEC”) under the Securities Exchange Act of 1934 (the “Exchange Act”).
The SOA includes specific disclosure requirements and corporate governance rules, requires the SEC and securities exchanges to adopt extensive additional disclosure, corporate governance and other related rules and mandates further studies of certain issues by the SEC. The SOA addresses, among other matters:
In response to recent unprecedented market turmoil, EESA was enacted on October 3, 2008. EESA authorizes the U.S. Treasury Department (the “treasury”) to provide up to $700 billion in funding for the financial services industry. Pursuant to the EESA, the Treasury was initially authorized to use $350 billion for the Troubled Asset Relief Program (“TARP”). Of this amount, the Treasury allocated $250 billion to the TARP Capital Purchase Program. On January 15, 2009, the second $350 billion of TARP monies was released to the Treasury. As described elsewhere in this Annual Report on Form 10-K, the Treasury purchased $10,000,000 of the Parent Corporation’s non-convertible preferred stock (the “Preferred Shares”) under the TARP Capital Purchase Program.
Participants in the TARP Capital Purchase Program were required to accept several compensation-related limitations associated with this Program. In January 2009, five executive officers of the Corporation (Messrs. Weagley, Abrahamian, Shapiro and Boylan and Ms. Wunder) agreed in writing to accept the compensation standards in existence at that time under the Capital Purchase Program and thereby cap or eliminate some of their contractual or legal rights. The provisions agreed to were as follows:
During the CPP Covered Period, the Corporation is not permitted to take federal income tax deductions for compensation paid to the senior executive officers in excess of $500,000 per year, subject to certain exceptions.
On February 17, 2009, the American Recovery and Reinvestment Act of 2009 (the “Stimulus Act”) was enacted. The Stimulus Act contains several provisions designed to establish executive compensation and governance standards for financial institutions (such as the Corporation) that received or will receive financial assistance under TARP. In certain instances, the Stimulus Act modified the compensation-related limitations contained in the TARP Capital Purchase Program; in addition, the Stimulus Act created additional compensation-related limitations and directed the Treasury to establish standards for executive compensation applicable to participants in TARP. In their January 2009 agreements, the Corporation’s executives did not waive their rights with respect to the provisions implemented by the Stimulus Act; other employees now covered by these provisions were not asked and did not agree to waive their rights. The compensation-related limitations applicable to the Corporation which have been added or modified by the Stimulus Act are as follows, which provisions are expected to be included in standards established by the Treasury:
From time to time proposals are made in the U.S. Congress and before various bank regulatory authorities, which would alter the policies of and place restrictions on different types of banking operations. It is impossible to predict the impact, if any, of potential legislative trends on the business of the Corporation and the Bank.
The Corporation’s authority to extend credit to its directors and executive officers, as well as to entities controlled by such persons, is currently governed by the requirements of the National Bank Act, the Sarbanes-Oxley Act of 2002 and Regulation O of the Federal Reserve Bank. Among other things, these provisions require that extensions of credit to insiders (i) be made on terms that are substantially the same as, and follow credit underwriting procedures that are not less stringent than, those prevailing for comparable transactions with unaffiliated persons and that do not involve more than the normal risk of repayment or present other
unfavorable features and (ii) not exceed certain limitations on the amount of credit extended to such persons, individually and in the aggregate, which limits are based, in part, on the amount of the Corporation’s capital. In addition, the Corporation’s Board of Directors must approve extensions of credit in excess of certain limits. Under the SOA, the Corporation and its subsidiaries, other than Union Center National Bank, may not extend or arrange for any personal loans to its directors and executive officers.
The Parent Corporation is a legal entity separate and distinct from the Bank. Virtually all of the revenue of the Parent Corporation available for payment of dividends on its capital stock will result from amounts paid to the Parent Corporation by the Bank. All such dividends are subject to various limitations imposed by federal laws and by regulations and policies adopted by federal regulatory agencies. As a national bank, the Bank may not pay a dividend if it would impair the capital of the Bank. Furthermore, prior approval by the Comptroller of the Currency is required if the total of dividends declared in a calendar year exceeds the total of the Bank’s net profits for that year combined with the retained profits for the two preceding years. The Company’s current MOU provides that the Bank cannot declare a dividend without the prior approval of the OCC.
On January 9, 2009, as part of the TARP Capital Purchase Program, the Parent Corporation entered into a Letter Agreement (the “Letter Agreement”) and a Securities Purchase Agreement — Standard Terms attached thereto (the “Securities Purchase Agreement”) with the Treasury, pursuant to which (i) the Parent Corporation issued and sold, and the Treasury purchased, 10,000 shares of the Parent Corporation’s Fixed Rate Cumulative Perpetual Preferred Stock, Series A, having a liquidation preference of $1,000 per share, for an aggregate purchase price of $10,000,000 in cash, and (ii) the Parent Corporation issued to the Treasury a ten-year warrant (the “Warrant”) to purchase up to 173,410 shares of the Corporation’s common stock at an exercise price of $8.65 per share. The Securities Purchase Agreement contains limitations on the payment of dividends on the common stock. Specifically, the Parent Corporation is unable to declare dividend payments on the common stock (and certain preferred stock if the Corporation issues additional series of preferred stock) if the Parent Corporation is in arrears in the payment of dividends on the Preferred Shares. Further, until the third anniversary of the investment or when all of the Preferred Shares have been redeemed or transferred, the Parent Corporation is not permitted to increase the amount of the quarterly cash dividend above $0.09 per share, which was the amount of the last regular dividend declared by the Parent Corporation prior to October 14, 2008.
If, in the opinion of the OCC, a bank under its jurisdiction is engaged in or is about to engage in an unsafe or unsound practice (which could include the payment of dividends), the OCC may require, after notice and hearing, that such bank cease and desist from such practice or, as a result of an unrelated practice, require the bank to limit dividends in the future. The FRB has similar authority with respect to bank holding companies. In addition, the FRB and the OCC have issued policy statements which provide that insured banks and bank holding companies should generally only pay dividends out of current operating earnings. Regulatory pressures to reclassify and charge off loans and to establish additional loan loss reserves can have the effect of reducing current operating earnings and thus impacting an institution’s ability to pay dividends. Further, as described herein, the regulatory authorities have established guidelines with respect to the maintenance of appropriate levels of capital by a bank or bank holding company under their jurisdiction. Compliance with the standards set forth in these policy statements and guidelines could limit the amount of dividends which the Parent Corporation and the Bank may pay. Under FDICIA, banking institutions which are deemed to be “undercapitalized” will, in most instances, be prohibited from paying dividends.
Credit risks are an inherent part of the lending function. The Corporation has set in place specific policies and guidelines to limit credit risks. The following describes the Corporation’s credit management policy and identifies certain risk elements in its earning assets portfolio.
The maintenance of comprehensive and effective credit policies is a paramount objective of the Corporation. Credit procedures are enforced by the department heads of the different lending units and are maintained at the senior administrative level as well as through internal control procedures.
Prior to extending credit, the Corporation’s credit policy generally requires a review of the borrower’s credit history, repayment capacity, collateral and purpose of each loan. Requests for most commercial and consumer loans are to be accompanied by financial statements and other relevant financial data for evaluation. After the granting of a loan or lending commitment, this financial data is typically updated and evaluated by the credit staff on a periodic basis for the purpose of identifying potential problems. Construction financing requires a periodic submission by the borrowers of sales/leasing status reports regarding their projects, as well as, in most cases, inspections of the project sites by independent engineering firms and/or independent consultants. Advances are normally made only upon the satisfactory completion of periodic phases of construction.
Certain lending authorities are granted to loan officers based upon each officer’s position and experience. However, large dollar loans and lending lines are reported to and are subject to the approval of the Bank’s loan committees and/or board of directors. Either the Chairman of the Board or President chairs the loan committees.
The Corporation has established its own internal loan-to-value (“LTV”) limits for real estate loans. In general, except as described below, these internal limits are not permitted to exceed the following supervisory limits:
It may be appropriate in individual cases to originate loans with loan-to-value ratios in excess of the supervisory LTV limits, based on support provided by other credit factors. The President of the Bank must approve such non-conforming loans. The Bank must identify all non-conforming loans and their aggregate amount must be reported at least quarterly to the Directors’ Loan Committee. Non-conforming loans should not exceed 100% of capital, or 30% with respect to non one to four family residential loans. At present, management is unaware of any exceptions to supervisory LTV limits.
Collateral margin guidelines are based on cost, market or other appraised value to maintain a reasonable amount of collateral protection in relation to the inherent risk in the loan. This does not mitigate the fundamental analysis of cash flow from the conversion of assets in the normal course of business or from operations to repay the loan. It is merely designed to provide a cushion to minimize the risk of loss if the ultimate collection of the loan becomes dependent on the liquidation of security pledged.
The Corporation also seeks to minimize lending risk through loan diversification. The composition of the Corporation’s commercial loan portfolio reflects and is highly dependent upon the economy and industrial make-up of the region it serves. Effective loan diversification spreads risk to many different industries, thereby reducing the impact of downturns in any specific industry on overall loan profitability.
Credit quality is monitored through an internal review process, which includes a credit Risk Grading System that facilitates the early detection of problem loans. Under this grading system, all commercial loans and commercial mortgage loans are graded in accordance with the risk characteristics inherent in each loan. Problem loans include non-accrual loans, and loans which conform to the regulatory definitions of criticized and classified loans.
A Problem Asset Report is prepared monthly and is examined by the senior management of the Bank, the Corporation’s Loan and Discount Committee and Board of Directors. This review is designed to enable management to take such actions as are considered necessary to identify and remedy problems on a timely basis.
The Bank’s internal loan review process is complemented by an independent loan review conducted throughout the year, under the mandate and approval of the Corporation’s Board of Directors. In addition, regularly scheduled audits performed by the Bank’s internal audit function are designed to ensure the integrity of the credit and risk monitoring systems currently in place.
The risk elements identified by the Corporation include non-performing loans, loans past due ninety days or more as to interest or principal payments but not placed on a non-accrual status, potential problem loans, other real estate owned, net, and other non-performing interest-earning assets.
| • | we potentially face increased regulation of our industry and compliance with such regulation may increase our costs and limit our ability to pursue business opportunities; | |
| • | customer demand for loans secured by real estate could be reduced due to weaker economic conditions, an increase in unemployment, a decrease in real estate values or an increase in interest rates; |
asset values and by a lack of liquidity. The liquidity issues have been particularly acute for regional and community banks, as many of the larger financial institutions have significantly curtailed their lending to regional and community banks to reduce their exposure to the risks of other banks. In addition, many of the larger correspondent lenders have reduced or even eliminated federal funds lines for their correspondent customers. Furthermore, regional and community banks generally have less access to the capital markets than do the national and super-regional banks because of their smaller size and limited analyst coverage. Any decline in available funding could adversely impact our ability to originate loans, invest in securities, meet our expenses, or fulfill obligations such as repaying our borrowings or meeting deposit withdrawal demands, any of which could have a material adverse impact on our liquidity, business, results of operations and financial condition.
business, could subject us to additional cost and expense or could change the terms of the Preferred Shares to the detriment of our common shareholders. While it may be possible for us to redeem the Preferred Shares in the event that the U.S. Treasury imposes any changes or additional requirements that we believe are detrimental, there can be no assurances that our federal regulator will approve such redemption or that we will have the ability to implement such redemption, especially in light of regulatory requirements imposed upon financial institutions seeking to redeem TARP securities.
None.
The Bank’s operations are located at nine sites in Union County, New Jersey, consisting of five sites in Union Township, one in Springfield Township, one in Berkeley Heights, one in Vauxhall and one in Summit, New Jersey. The Bank also has three sites in Morris County, New Jersey, consisting of one site in Madison, one site in Boonton/Mountain Lakes, and one site in Morristown, New Jersey. The principal office is located at 2455 Morris Avenue, Union, New Jersey. The principal office is a two story building constructed in 1993. On October 9, 2004, the Bank opened a 19,555 square foot office facility on Springfield Road in Union, New Jersey, which serves as the Bank’s Operations and Data Center. On February 27, 2008, the Corporation
signed an agreement to lease premises at 105 North Avenue, Cranford, New Jersey to be used to construct a full service branch facility. Subsequently, the Corporation has notified the landlord that it wanted to terminate the commitment and completed the termination in the first quarter of 2009.
The following table sets forth certain information regarding the Bank’s leased locations.
The Bank operates a Drive In/Walk Up located at 2022 Stowe Street, Union, New Jersey, adjacent to a part of the Center Office facility. The Bank has three off-site ATM locations. Two are located at New Jersey Transit stations and one is located at the Boys and Girls Club of Union, 1050 Jeanette Avenue, Union, New Jersey.
On January 12, 2010, the Bank entered into a sale/purchase agreement for its 1180 Springfield Road facility. Under the terms of the agreement the premises will be leased with an option to buy. The agreement is expected to be fully consummated in the second quarter of 2010.
Union Center has instituted a suit against Highlands State Bank (“Highlands”) in the Superior Court of New Jersey (Docket No. MRS-C-189-09). counterclaim.
Securities Litigation Reform Act of 1995. Actual results could differ materially from this statement as a result of various factors, including the uncertainties arising in proving facts within the judicial process.
The following table sets forth the name and age of each executive officer of the Parent Corporation, the period during which each such person has served as an officer of the Parent Corporation or the Bank and each such person’s business experience (including all positions with the Parent Corporation and the Bank) for the past five years:
The common stock of the Parent Corporation is traded on the NASDAQ Global Select Market. The Corporation’s symbol is CNBC. As of December 31, 2009, the Corporation had 605 stockholders of record. This does not include beneficial owners for whom CEDE & Company or others act as nominees. On December 31, 2009, the closing low market bid and asked price were $8.92 and $9.07, respectively.
The following table sets forth the high and low bid price, and the dividends declared, on a share of the Corporation’s common stock for the years ended December 31, 2009 and 2008. All amounts are adjusted for prior stock splits and stock dividends.
| Common Stock Price | Common Dividends Declared | |||||||||||||||||||||||
| 2009 | 2008 | |||||||||||||||||||||||
| High Bid | Low Bid | High Bid | Low Bid | 2009 | 2008 | |||||||||||||||||||
| Fourth Quarter | $ | 9.20 | $ | 7.36 | $ | 10.15 | $ | 7.45 | $ | 0.0300 | $ | 0.0900 | ||||||||||||
| Third Quarter | 10.16 | 7.53 | 10.96 | 8.44 | 0.0300 | 0.0900 | ||||||||||||||||||
| Second Quarter | 9.15 | 6.88 | 10.38 | 8.45 | 0.0300 | 0.0900 | ||||||||||||||||||
| First Quarter | 8.50 | 6.43 | 11.32 | 9.95 | 0.0900 | 0.0900 | ||||||||||||||||||
| Total | $ | 0.1800 | $ | 0.3600 | ||||||||||||||||||||
Historically, repurchases have been made from time to time as, in the opinion of management, market conditions warranted, in the open market or in privately negotiated transactions. Shares repurchased were used for stock dividends and other issuances. As of December 31, 2009, Center Bancorp had 14.6 million shares of common stock outstanding. As of December 31, 2009, the Parent Corporation had purchased 1,386,863 common shares at an average cost per share of $11.44 under stock buyback programs announced in 2006, 2007 and 2008. No repurchases were made during 2009. The repurchased shares were recorded as Treasury Stock, which resulted in a decrease in stockholders’ equity.
Information concerning the stock repurchases for the three months ended December 31, 2009 is set forth below.
| Period | Total Number of Shares (or Units) Purchased | Average Price Paid per Share (or Unit) | Total Number of Shares (or Units) Purchased as Part of Publicly Announced Plans or Programs | Maximum Number of Shares that May Yet Be Purchased Under the Plans or Programs | ||||||||||||
| October 1, through October 31, 2009 | — | $ | — | 1,386,863 | 652,868 | |||||||||||
| November 1, through November 30, 2009 | — | — | 1,386,863 | 652,868 | ||||||||||||
| December 1, through December 31, 2009 | — | — | 1,386,863 | 652,868 | ||||||||||||
| Total | — | $ | — | 1,386,863 | 652,868 | |||||||||||
As noted elsewhere herein, on January 9, 2009, as part of the U.S. Department of the Treasury’s Troubled Asset Relief Program (“TARP”), the Parent Corporation entered into an agreement with the U.S. Treasury (the “Stock Purchase Agreement”) pursuant to which (i) the Parent Corporation issued and sold, and the U.S. Treasury purchased, 10,000 shares (the “Preferred Shares”) of the Company’s Fixed Rate Cumulative Perpetual Preferred Stock, Series A, having a liquidation preference of $1,000 per share for an aggregate purchase price of $10 million in cash, and (ii) the Parent Corporation issued to the U.S. Treasury a ten-year warrant (the “Warrant”) to purchase up to 173,410 shares of the Parent Corporation’s common stock at an exercise price of $8.65 per share. As a result of the successful completion of the Rights Offering in October 2009, the number of shares underlying the warrant held by the U.S. Treasury was reduced to 86,705 shares or 50 percent of the original 173,410 shares. Until the third anniversary of the issuance of the Preferred Shares, the consent of the U.S. Treasury will be required for any increase in the dividends on the Parent Corporation’s common stock or for any stock repurchases unless the Preferred Shares have been redeemed in their entirety or the U.S. Treasury has transferred the Preferred Shares to third parties. See “Dividends” below for additional restrictions on the payment of dividends.
Federal laws and regulations contain restrictions on the ability of the Parent Corporation and Union Center National Bank to pay dividends. For information regarding restrictions on dividends, see Part I, Item 1, “Business — Dividend Limitations” and Part II, Item 8, “Financial Statements and Supplementary Data — Dividend Restrictions, Note 17 of the Notes to Consolidated Financial Statements.” Pursuant to the MOU between Union Center National Bank and the OCC, the Bank may not declare dividends without the prior approval of the OCC. In addition, under the terms of the trust preferred securities issued by Center Bancorp, Inc. Statutory Trust II, the Parent Corporation can not pay dividends on its common stock if the Corporation defers payments on the junior subordinated debentures which provide the cash flow for the payments on the trust preferred securities. Further, pursuant to the Stock Purchase Agreement, the Parent Corporation is unable to declare dividend payments on the Parent Corporation’s common stock (and certain preferred stock if the Parent Corporation issues additional series of preferred stock) if the Parent Corporation is in arrears in the payment of dividends on the Preferred Shares issued to the U.S. Treasury. Further, until the third anniversary of the U.S. Treasury’s investment or when all of the Preferred Shares have been redeemed or transferred, the Parent Corporation is not permitted to increase the amount of the quarterly cash dividend above $0.09 per share, which was the amount of the last regular dividend declared by the Parent Corporation prior to October 14, 2008.
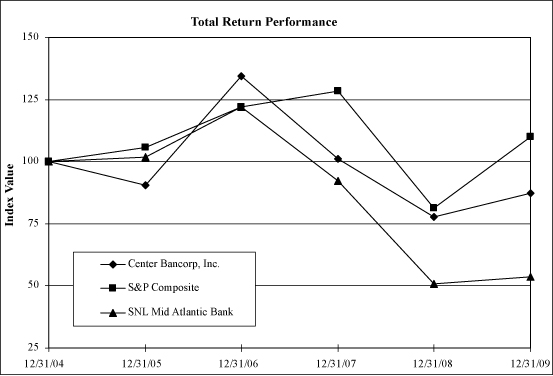
Set forth below is a line graph presentation comparing the cumulative stockholder return on the Parent Corporation’s common stock, on a dividend reinvested basis, against the cumulative total returns of the Standard & Poor’s Composite and the SNL Mid-Atlantic Bank Index for the period from January 1, 2005 through December 31, 2009.
| Fiscal Year Ending | ||||||||||||||||||||||||
| Company/Index/Market | 12/31/2004 | 12/31/2005 | 12/31/2006 | 12/31/2007 | 12/31/2008 | 12/31/2009 | ||||||||||||||||||
| Center Bancorp, Inc. | 100.0 | 90.5 | 134.3 | 101.1 | 77.6 | 87.3 | ||||||||||||||||||
| S&P Composite | 100.0 | 105.7 | 121.9 | 128.5 | 81.3 | 109.8 | ||||||||||||||||||
| SNL Mid-Atlantic Bank Index | 100.0 | 101.8 | 122.1 | 92.4 | 50.9 | 53.6 | ||||||||||||||||||
| Years Ended December 31, | ||||||||||||||||||||
| 2009 | 2008 | 2007 | 2006 | 2005(3) | ||||||||||||||||
| (Dollars in Thousands, Except per Share Data) | ||||||||||||||||||||
| Summary of Income | ||||||||||||||||||||
| Interest income | $ | 51,110 | $ | 49,894 | $ | 52,129 | $ | 53,325 | $ | 50,503 | ||||||||||
| Interest expense | 22,645 | 24,095 | 30,630 | 28,974 | 23,296 | |||||||||||||||
| Net interest income | 28,465 | 25,799 | 21,499 | 24,351 | 27,207 | |||||||||||||||
| Provision for loan losses | 3,261 | 1,561 | 350 | 57 | — | |||||||||||||||
| Net interest income after provision for loan losses | 25,204 | 24,238 | 21,149 | 24,294 | 27,207 | |||||||||||||||
| Other income | 3,906 | 2,644 | 4,372 | 633 | 3,836 | |||||||||||||||
| Other expense | 23,057 | 19,473 | 24,598 | 24,358 | 22,213 | |||||||||||||||
| Income before income tax expense | 6,053 | 7,409 | 923 | 569 | 8,830 | |||||||||||||||
| Income tax expense (benefit) | 1,480 | 1,567 | (2,933 | ) | (3,329 | ) | 1,184 | |||||||||||||
| Net income | $ | 4,573 | $ | 5,842 | $ | 3,856 | $ | 3,898 | $ | 7,646 | ||||||||||
| Net income available to common stockholders | $ | 4,006 | $ | 5,842 | $ | 3,856 | $ | 3,898 | $ | 7,646 | ||||||||||
| Statement of Financial Condition Data | ||||||||||||||||||||
| Investments | $ | 298,124 | $ | 242,714 | $ | 314,194 | $ | 381,733 | $ | 517,730 | ||||||||||
| Total loans | 715,453 | 676,203 | 551,669 | 550,414 | 505,826 | |||||||||||||||
| Goodwill and other intangibles | 17,028 | 17,110 | 17,204 | 17,312 | 17,437 | |||||||||||||||
| Total assets | 1,196,824 | 1,023,293 | 1,017,645 | 1,051,384 | 1,114,829 | |||||||||||||||
| Deposits | 813,705 | 659,537 | 699,070 | 726,771 | 700,601 | |||||||||||||||
| Borrowings | 269,253 | 268,440 | 218,109 | 206,434 | 293,963 | |||||||||||||||
| Stockholders’ equity | 102,551 | 81,713 | 85,278 | 97,613 | 99,489 | |||||||||||||||
| Dividends | ||||||||||||||||||||
| Cash dividends | $ | 2,434 | $ | 4,675 | $ | 4,885 | $ | 4,808 | $ | 4,518 | ||||||||||
| Dividend payout ratio | 60.76 | % | 80.02 | % | 126.69 | % | 123.35 | % | 59.09 | % | ||||||||||
| Cash Dividends Per Share(1) | ||||||||||||||||||||
| Cash dividends | $ | 0.18 | $ | 0.36 | $ | 0.36 | $ | 0.34 | $ | 0.34 | ||||||||||
| Earnings Per Share(1) | ||||||||||||||||||||
| Basic | $ | 0.30 | $ | 0.45 | $ | 0.28 | $ | 0.28 | $ | 0.60 | ||||||||||
| Diluted | $ | 0.30 | $ | 0.45 | $ | 0.28 | $ | 0.28 | $ | 0.60 | ||||||||||
| Weighted Average Common Shares Outstanding(1) | ||||||||||||||||||||
| Basic | 13,382,614 | 13,048,518 | 13,780,504 | 13,959,684 | 12,678,614 | |||||||||||||||
| Diluted | 13,385,416 | 13,061,410 | 13,840,756 | 14,040,338 | 12,725,256 | |||||||||||||||
| Operating Ratios | ||||||||||||||||||||
| Return on average assets | 0.37 | % | 0.58 | % | 0.38 | % | 0.37 | % | 0.69 | % | ||||||||||
| Average stockholders’ equity to average assets | 7.67 | % | 8.28 | % | 9.33 | % | 9.21 | % | 7.79 | % | ||||||||||
| Return on average stockholders’ equity | 4.87 | % | 7.03 | % | 4.09 | % | 4.04 | % | 8.91 | % | ||||||||||
| Return on average tangible stockholders’ equity(2) | 5.96 | % | 8.86 | % | 5.00 | % | 4.93 | % | 10.34 | % | ||||||||||
| Book Value | ||||||||||||||||||||
| Book value per common share(1) | $ | 6.38 | $ | 6.29 | $ | 6.48 | $ | 7.02 | $ | 7.05 | ||||||||||
| Tangible book value per common share(1)(2) | $ | 5.21 | $ | 4.97 | $ | 5.17 | $ | 5.77 | $ | 5.82 | ||||||||||
| Non-Financial Information | ||||||||||||||||||||
| Common stockholders of record | 605 | 640 | 679 | 717 | 767 | |||||||||||||||
| Full-time equivalent staff | 160 | 160 | 172 | 214 | 202 | |||||||||||||||
| Years Ended December 31, | ||||||||||||||||||||
2009 (Restated) | 2008 | 2007 | 2006 | 2005 (3) | ||||||||||||||||
| (Dollars in Thousands, Except per Share Data) | ||||||||||||||||||||
| Summary of Income | ||||||||||||||||||||
| Interest income | $ | 51,110 | $ | 49,894 | $ | 52,129 | $ | 53,325 | $ | 50,503 | ||||||||||
| Interest expense | 22,645 | 24,095 | 30,630 | 28,974 | 23,296 | |||||||||||||||
| Net interest income | 28,465 | 25,799 | 21,499 | 24,351 | 27,207 | |||||||||||||||
| Provision for loan losses | 4,597 | 1,561 | 350 | 57 | — | |||||||||||||||
| Net interest income after provision for loan losses | 23,868 | 24,238 | 21,149 | 24,294 | 27,207 | |||||||||||||||
| Other income | 3,906 | 2,644 | 4,372 | 633 | 3,836 | |||||||||||||||
| Other expense | 23,057 | 19,473 | 24,598 | 24,358 | 22,213 | |||||||||||||||
| Income before income tax expense | 4,717 | 7,409 | 923 | 569 | 8,830 | |||||||||||||||
| Income tax expense (benefit) | 946 | 1,567 | (2,933 | ) | (3,329 | ) | 1,184 | |||||||||||||
| Net income | $ | 3,771 | $ | 5,842 | $ | 3,856 | $ | 3,898 | $ | 7,646 | ||||||||||
| Net income available to common stockholders | $ | 3,204 | $ | 5,842 | $ | 3,856 | $ | 3,898 | $ | 7,646 | ||||||||||
| Statement of Financial Condition Data | ||||||||||||||||||||
| Investments | $ | 298,124 | $ | 242,714 | $ | 314,194 | $ | 381,733 | $ | 517,730 | ||||||||||
| Total loans | 719,606 | 676,203 | 551,669 | 550,414 | 505,826 | |||||||||||||||
| Goodwill and other intangibles | 17,028 | 17,110 | 17,204 | 17,312 | 17,437 | |||||||||||||||
| Total assets | 1,195,488 | 1,023,293 | 1,017,645 | 1,051,384 | 1,114,829 | |||||||||||||||
| Deposits | 813,705 | 659,537 | 699,070 | 726,771 | 700,601 | |||||||||||||||
| Borrowings | 269,253 | 268,440 | 218,109 | 206,434 | 293,963 | |||||||||||||||
| Stockholders’ equity | 101,749 | 81,713 | 85,278 | 97,613 | 99,489 | |||||||||||||||
| Dividends | ||||||||||||||||||||
| Cash dividends | $ | 2,434 | $ | 4,675 | $ | 4,885 | $ | 4,808 | $ | 4,518 | ||||||||||
| Dividend payout ratio | 75.97 | % | 80.02 | % | 126.69 | % | 123.35 | % | 59.09 | % | ||||||||||
Cash Dividends Per Share (1) | ||||||||||||||||||||
| Cash dividends | $ | 0.18 | $ | 0.36 | $ | 0.36 | $ | 0.34 | $ | 0.34 | ||||||||||
Earnings Per Share (1) | ||||||||||||||||||||
| Basic | $ | 0.24 | $ | 0.45 | $ | 0.28 | $ | 0.28 | $ | 0.60 | ||||||||||
| Diluted | $ | 0.24 | $ | 0.45 | $ | 0.28 | $ | 0.28 | $ | 0.60 | ||||||||||
Weighted Average Common Shares Outstanding (1) | ||||||||||||||||||||
| Basic | 13,382,614 | 13,048,518 | 13,780,504 | 13,959,684 | 12,678,614 | |||||||||||||||
| Diluted | 13,385,416 | 13,061,410 | 13,840,756 | 14,040,338 | 12,725,256 | |||||||||||||||
| Operating Ratios | ||||||||||||||||||||
| Return on average assets | 0.31 | % | 0.58 | % | 0.38 | % | 0.37 | % | 0.69 | % | ||||||||||
| Average stockholders’ equity to average assets | 7.66 | % | 8.28 | % | 9.33 | % | 9.21 | % | 7.79 | % | ||||||||||
| Return on average stockholders’ equity | 4.02 | % | 7.03 | % | 4.09 | % | 4.04 | % | 8.91 | % | ||||||||||
Return on average tangible stockholders’ equity (2) | 4.91 | % | 8.86 | % | 5.00 | % | 4.93 | % | 10.34 | % | ||||||||||
| Book Value | ||||||||||||||||||||
Book value per common share (1) | $ | 6.32 | $ | 6.29 | $ | 6.48 | $ | 7.02 | $ | 7.05 | ||||||||||
Tangible book value per common share (1) (2) | $ | 5.15 | $ | 4.97 | $ | 5.17 | $ | 5.77 | $ | 5.82 | ||||||||||
| Non-Financial Information | ||||||||||||||||||||
| Common stockholders of record | 605 | 640 | 679 | 717 | 767 | |||||||||||||||
| Full-time equivalent staff | 160 | 160 | 172 | 214 | 202 | |||||||||||||||
| (1) | All common share and per common share amounts have been adjusted for prior stock splits and stock dividends. |
| (2) | Tangible book value per common share, which is a non-GAAP financial measure, is computed by dividing stockholders’ equity less preferred stock, goodwill and other intangible assets by common shares outstanding. The following table provides certain related reconciliations between Generally Accepted Accounting Principles (“GAAP”)measures (stockholders’ equity and book value per common share) and the related non-GAAP financial measures (tangible stockholders’ equity and tangible book value per common share): |
| 2009 | 2008 | 2007 | 2006 | 2005 | ||||||||||||||||
| (Dollars in Thousands, Except per Share Data) | ||||||||||||||||||||
| Common shares outstanding | 14,572,029 | 12,991,312 | 13,155,784 | 13,910,450 | 14,103,209 | |||||||||||||||
| Stockholders’ equity | $ | 102,551 | $ | 81,713 | $ | 85,278 | $ | 97,613 | $ | 99,489 | ||||||||||
| Less: Preferred Stock | 9,619 | — | — | — | — | |||||||||||||||
| Less: Goodwill and other intangible assets | 17,028 | 17,110 | 17,204 | 17,312 | 17,437 | |||||||||||||||
| Tangible Stockholders’ Equity | $ | 75,904 | $ | 64,603 | $ | 68,074 | $ | 80,301 | $ | 82,052 | ||||||||||
| Book value per common share | $ | 6.38 | $ | 6.29 | $ | 6.48 | $ | 7.02 | $ | 7.05 | ||||||||||
| Less: Goodwill and other intangible assets | 1.17 | 1.32 | 1.31 | 1.25 | 1.23 | |||||||||||||||
| Tangible Book Value per Common Share | $ | 5.21 | $ | 4.97 | $ | 5.17 | $ | 5.77 | $ | 5.82 | ||||||||||
| Years Ended December 31, | ||||||||||||||||||||
2009 (Restated) | 2008 | 2007 | 2006 | 2005 | ||||||||||||||||
| (Dollars in Thousands, Except per Share Data) | ||||||||||||||||||||
| Common shares outstanding | 14,572,029 | 12,991,312 | 13,155,784 | 13,910,450 | 14,103,209 | |||||||||||||||
| Stockholders’ equity | $ | 101,749 | $ | 81,713 | $ | 85,278 | $ | 97,613 | $ | 99,489 | ||||||||||
| Less: Preferred Stock | 9,619 | — | — | — | — | |||||||||||||||
| Less: Goodwill and other intangible assets | 17,028 | 17,110 | 17,204 | 17,312 | 17,437 | |||||||||||||||
| Tangible Stockholders’ Equity | $ | 75,102 | $ | 64,603 | $ | 68,074 | $ | 80,301 | $ | 82,052 | ||||||||||
| Book value per common share | $ | 6.32 | $ | 6.29 | $ | 6.48 | $ | 7.02 | $ | 7.05 | ||||||||||
| Less: Goodwill and other intangible assets | 1.17 | 1.32 | 1.31 | 1.25 | 1.23 | |||||||||||||||
| Tangible Book Value per Common Share | $ | 5.15 | $ | 4.97 | $ | 5.17 | $ | 5.77 | $ | 5.82 | ||||||||||
| 2009 | 2008 | 2007 | 2006 | 2005 | ||||||||||||||||
| (Dollars in Thousands) | ||||||||||||||||||||
| Net income | $ | 4,573 | $ | 5,842 | $ | 3,856 | $ | 3,898 | $ | 7,646 | ||||||||||
| Average stockholders’ equity | $ | 93,853 | $ | 83,123 | $ | 94,345 | $ | 96,505 | $ | 85,772 | ||||||||||
| Less: Average goodwill and other intangible assets | 17,069 | 17,158 | 17,259 | 17,378 | 11,814 | |||||||||||||||
| Average Tangible Stockholders’ Equity | $ | 76,784 | $ | 65,965 | $ | 77,086 | $ | 79,127 | $ | 73,958 | ||||||||||
| Return on average stockholders’ equity | 4.87 | % | 7.03 | % | 4.09 | % | 4.04 | % | 8.91 | % | ||||||||||
| Add: Average goodwill and other intangible assets | 1.09 | 1.83 | 0.91 | 0.89 | 1.43 | |||||||||||||||
| Return on Average Tangible Stockholders’ Equity | 5.96 | % | 8.86 | % | 5.00 | % | 4.93 | % | 10.34 | % | ||||||||||
| Years Ended December, 31 | ||||||||||||||||||||
2009 (Restated) | 2008 | 2007 | 2006 | 2005 | ||||||||||||||||
| (Dollars in Thousands) | ||||||||||||||||||||
| Net income | $ | 3,771 | $ | 5,842 | $ | 3,856 | $ | 3,898 | $ | 7,646 | ||||||||||
| Average stockholders’ equity | $ | 93,850 | $ | 83,123 | $ | 94,345 | $ | 96,505 | $ | 85,772 | ||||||||||
| Less: Average goodwill and other intangible assets | 17,069 | 17,158 | 17,259 | 17,378 | 11,814 | |||||||||||||||
| Average Tangible Stockholders’ Equity | $ | 76,781 | $ | 65,965 | $ | 77,086 | $ | 79,127 | $ | 73,958 | ||||||||||
| Return on average stockholders’ equity | 4.02 | % | 7.03 | % | 4.09 | % | 4.04 | % | 8.91 | % | ||||||||||
| Add: Average goodwill and other intangible assets | 0.89 | 1.83 | 0.91 | 0.89 | 1.43 | |||||||||||||||
| Return on Average Tangible Stockholders’ Equity | 4.91 | % | 8.86 | % | 5.00 | % | 4.93 | % | 10.34 | % | ||||||||||
| (3) | The Corporation completed the acquisition of Red Oak Bank as of the close of business on May 20, 2005. The acquisition was accounted for as a purchase and the excess cost over the fair value of net assets acquired (“goodwill”) in the transaction was $14.7 million. The Corporation also recorded a core deposit intangible of $702,617 in connection with the acquisition. |
| 2009 | 2008 | 2007 | ||||||||||||||||||||||||||||||||||
| Amount | Increase (Decrease) from Prior Year | Percent Change | Amount | Increase (Decrease) from Prior Year | Percent Change | Amount | Increase (Decrease) from Prior Year | Percent Change | ||||||||||||||||||||||||||||
| (Dollars in Thousands) | ||||||||||||||||||||||||||||||||||||
| Interest income: | ||||||||||||||||||||||||||||||||||||
| Investments | $ | 14,226 | $ | (179 | ) | (1.24 | ) | $ | 14,405 | $ | (4,850 | ) | (25.19 | ) | $ | 19,255 | $ | (3,215 | ) | (14.31 | ) | |||||||||||||||
| Loans, including fees | 36,751 | 641 | 1.78 | 36,110 | 2,583 | 7.70 | 33,527 | 1,528 | 4.78 | |||||||||||||||||||||||||||
| Federal funds sold and securities purchased under agreements to resell | 0 | (113 | ) | (100.00 | ) | 113 | (491 | ) | (81.29 | ) | 604 | 57 | 10.42 | |||||||||||||||||||||||
| Restricted investment in bank stocks | 643 | 49 | 8.25 | 594 | 45 | 8.20 | 549 | 42 | 8.28 | |||||||||||||||||||||||||||
| Total interest income | 51,620 | 398 | 0.78 | 51,222 | (2,713 | ) | (5.03 | ) | 53,935 | (1,588 | ) | (2.86 | ) | |||||||||||||||||||||||
| Interest expense: | ||||||||||||||||||||||||||||||||||||
| Deposits | 12,308 | (979 | ) | (7.37 | ) | 13,287 | (7,548 | ) | (36.23 | ) | 20,835 | 2,830 | 15.72 | |||||||||||||||||||||||
| Borrowings | 10,337 | (471 | ) | (4.36 | ) | 10,808 | 1,013 | 10.34 | 9,795 | (1,174 | ) | (10.70 | ) | |||||||||||||||||||||||
| Total interest expense | 22,645 | (1,450 | ) | (6.02 | ) | 24,095 | (6,535 | ) | (21.34 | ) | 30,630 | 1,656 | 5.72 | |||||||||||||||||||||||
| Net interest income on a fully tax-equivalent basis | 28,975 | 1,848 | 6.81 | 27,127 | 3,822 | 16.40 | 23,305 | (3,244 | ) | (12.22 | ) | |||||||||||||||||||||||||
| Tax-equivalent adjustment | (510 | ) | 818 | (61.60 | ) | (1,328 | ) | 478 | (26.47 | ) | (1,806 | ) | 392 | (17.83 | ) | |||||||||||||||||||||
| Net interest income | $ | 28,465 | $ | 2,666 | 10.33 | $ | 25,799 | $ | 4,300 | 20.00 | $ | 21,499 | $ | (2,852 | ) | (11.71 | ) | |||||||||||||||||||
| 2009 | 2008 | 2007 | |||||||||||||||||||||||||||||||||
| Amount | Increase (Decrease) from Prior Year | Percentage Change | Amount | Increase (Decrease) from Prior Year | Percentage Change | Amount | Increase (Decrease) from Prior Year | Percentage Change | |||||||||||||||||||||||||||
| (Dollars in Thousands) | |||||||||||||||||||||||||||||||||||
| Interest income: | |||||||||||||||||||||||||||||||||||
| Investments | $ | 14,226 | $ | (179 | ) | (1.24 | ) | $ | 14,405 | $ | (4,850 | ) | (25.19 | ) | $ | 19,255 | $ | (3,215 | ) | (14.31 | ) | ||||||||||||||
| Loans, including fees | 36,751 | 641 | 1.78 | 36,110 | 2,583 | 7.70 | 33,527 | 1,528 | 4.78 | ||||||||||||||||||||||||||
| Federal funds sold and securities purchased under agreements to resell | 0 | (113 | ) | (100.00 | ) | 113 | (491 | ) | (81.29 | ) | 604 | 57 | 10.42 | ||||||||||||||||||||||
| Restricted investment in bank stocks | 643 | 49 | 8.25 | 594 | 45 | 8.20 | 549 | 42 | 8.28 | ||||||||||||||||||||||||||
| Total interest income | 51,620 | 398 | 0.78 | 51,222 | (2,713 | ) | (5.03 | ) | 53,935 | (1,588 | ) | (2.86 | ) | ||||||||||||||||||||||
| Interest expense: | |||||||||||||||||||||||||||||||||||
| Deposits | 12,308 | (979 | ) | (7.37 | ) | 13,287 | (7,548 | ) | (36.23 | ) | 20,835 | 2,830 | 15.72 | ||||||||||||||||||||||
| Borrowings | 10,337 | (471 | ) | (4.36 | ) | 10,808 | 1,013 | 10.34 | 9,795 | (1,174 | ) | (10.70 | ) | ||||||||||||||||||||||
| Total interest expense | 22,645 | (1,450 | ) | (6.02 | ) | 24,095 | (6,535 | ) | (21.34 | ) | 30,630 | 1,656 | 5.72 | ||||||||||||||||||||||
| Net interest income on a fully tax-equivalent basis | 28,975 | 1,848 | 6.81 | 27,127 | 3,822 | 16.40 | 23,305 | (3,244 | ) | (12.22 | ) | ||||||||||||||||||||||||
| Tax-equivalent adjustment | (510 | ) | 818 | (61.60 | ) | (1,328 | ) | 478 | (26.47 | ) | (1,806 | ) | 392 | (17.83 | ) | ||||||||||||||||||||
| Net interest income | $ | 28,465 | $ | 2,666 | 10.33 | $ | 25,799 | $ | 4,300 | 20.00 | $ | 21,499 | $ | (2,852 | ) | (11.71 | ) | ||||||||||||||||||
2009/2008 Increase (Decrease) Due to Change in: | 2008/2007 Increase (Decrease) Due to Change in: | |||||||||||||||||||||||
Average Volume | Average Rate | Net Change | Average Volume | Average Rate | Net Change | |||||||||||||||||||
| (Dollars in Thousands) | ||||||||||||||||||||||||
| Interest-earning assets: | ||||||||||||||||||||||||
| Investment securities: | ||||||||||||||||||||||||
| Taxable | $ | 3,553 | $ | (1,355 | ) | $ | 2,198 | $ | (2,835 | ) | $ | (364 | ) | $ | (3,199 | ) | ||||||||
| Non-Taxable | (2,463 | ) | 86 | (2,377 | ) | (1,577 | ) | (74 | ) | (1,651 | ) | |||||||||||||
| Loans, net of unearned discount | 3,864 | (3,223 | ) | 641 | 4,807 | (2,224 | ) | 2,583 | ||||||||||||||||
| Federal funds sold and securities purchased under agreements to resell | (56 | ) | (57 | ) | (113 | ) | (294 | ) | (197 | ) | (491 | ) | ||||||||||||
| Restricted investment in bank stocks | 25 | 24 | 49 | 145 | (100 | ) | 45 | |||||||||||||||||
| Total interest-earning assets | 4,923 | (4,525 | ) | 398 | 246 | (2,959 | ) | (2,713 | ) | |||||||||||||||
| Interest-bearing liabilities: | ||||||||||||||||||||||||
| Money market deposits | (545 | ) | (1,298 | ) | (1,843 | ) | 332 | (3,431 | ) | (3,099 | ) | |||||||||||||
| Savings deposits | 1,017 | 483 | 1,500 | (53 | ) | (14 | ) | (67 | ) | |||||||||||||||
| Time deposits | 3,648 | (3,050 | ) | 598 | (410 | ) | (2,170 | ) | (2,580 | ) | ||||||||||||||
| Other interest-bearing deposits | 204 | (1,438 | ) | (1,234 | ) | (1,039 | ) | (763 | ) | (1,802 | ) | |||||||||||||
| Borrowings and subordinated debentures | (463 | ) | (8 | ) | (471 | ) | 2,654 | (1,641 | ) | 1,013 | ||||||||||||||
| Total interest-bearing liabilities | 3,861 | (5,311 | ) | (1,450 | ) | 1,484 | (8,019 | ) | (6,535 | ) | ||||||||||||||
| Change in net interest income | $ | 1,062 | $ | 786 | $ | 1,848 | $ | (1,238 | ) | $ | 5,060 | $ | 3,822 | |||||||||||
| Years Ended December 31, | ||||||||||||||||||||||||||||||||||||
| 2009 | 2008 | 2007 | ||||||||||||||||||||||||||||||||||
| (Tax-Equivalent Basis) | Average Balance | Income/ Expense | Yield/ Rate | Average Balance | Income/ Expense | Yield/ Rate | Average Balance | Income/ Expense | Yield/ Rate | |||||||||||||||||||||||||||
| (Dollars in Thousands) | ||||||||||||||||||||||||||||||||||||
| ASSETS | ||||||||||||||||||||||||||||||||||||
| Interest-earning assets: | ||||||||||||||||||||||||||||||||||||
| Investment securities:(1) | ||||||||||||||||||||||||||||||||||||
| Taxable | $ | 289,414 | $ | 12,727 | 4.40 | % | $ | 211,185 | $ | 10,529 | 4.99 | % | $ | 267,884 | $ | 13,728 | 5.12 | % | ||||||||||||||||||
| Non-taxable | 25,677 | 1,499 | 5.84 | % | 67,890 | 3,876 | 5.71 | % | 95,501 | 5,527 | 5.79 | % | ||||||||||||||||||||||||
| Loans, net of unearned income:(2) | 692,562 | 36,751 | 5.31 | % | 622,533 | 36,110 | 5.80 | % | 541,297 | 33,527 | 6.19 | % | ||||||||||||||||||||||||
| Federal funds sold and securities purchased under agreements to resell | — | — | — | 4,047 | 113 | 2.79 | % | 12,050 | 604 | 5.01 | % | |||||||||||||||||||||||||
| Restricted investment in bank stocks | 10,526 | 643 | 6.11 | % | 10,104 | 594 | 5.88 | % | 7,806 | 549 | 7.03 | % | ||||||||||||||||||||||||
| Total interest-earning assets | 1,018,179 | 51,620 | 5.07 | % | 915,759 | 51,222 | 5.59 | % | 924,538 | 53,935 | 5.83 | % | ||||||||||||||||||||||||
| Non-interest-earning assets: | ||||||||||||||||||||||||||||||||||||
| Cash and due from banks | 128,156 | 16,063 | 18,586 | |||||||||||||||||||||||||||||||||
| Bank owned life insurance | 24,941 | 22,627 | 21,801 | |||||||||||||||||||||||||||||||||
| Intangible assets | 17,069 | 17,158 | 17,259 | |||||||||||||||||||||||||||||||||
| Other assets | 42,980 | 37,602 | 34,547 | |||||||||||||||||||||||||||||||||
| Allowance for loan losses | (6,916 | ) | (5,681 | ) | (5,002 | ) | ||||||||||||||||||||||||||||||
| Total non-interest earning assets | 206,230 | 87,769 | 87,191 | |||||||||||||||||||||||||||||||||
| Total assets | $ | 1,224,409 | $ | 1,003,528 | $ | 1,011,729 | ||||||||||||||||||||||||||||||
| LIABILITIES & STOCKHOLDERS’ EQUITY | ||||||||||||||||||||||||||||||||||||
| Interest-bearing liabilities: | ||||||||||||||||||||||||||||||||||||
| Money market deposits | $ | 123,427 | $ | 1,635 | 1.32 | % | $ | 150,373 | $ | 3,478 | 2.31 | % | $ | 142,805 | $ | 6,577 | 4.61 | % | ||||||||||||||||||
| Savings deposits | 145,536 | 2,050 | 1.41 | % | 63,192 | 550 | 0.87 | % | 69,289 | 617 | 0.89 | % | ||||||||||||||||||||||||
| Time deposits | 319,639 | 6,850 | 2.14 | % | 178,761 | 6,252 | 3.50 | % | 187,860 | 8,832 | 4.70 | % | ||||||||||||||||||||||||
| Other interest-bearing deposits | 140,890 | 1,773 | 1.26 | % | 131,452 | 3,007 | 2.29 | % | 173,123 | 4,809 | 2.78 | % | ||||||||||||||||||||||||
| Short-term and long-term borrowings | 258,607 | 10,146 | 3.92 | % | 270,390 | 10,501 | 3.88 | % | 205,681 | 9,384 | 4.56 | % | ||||||||||||||||||||||||
| Subordinated debentures | 5,155 | 191 | 3.71 | % | 5,155 | 307 | 5.96 | % | 5,155 | 411 | 7.97 | % | ||||||||||||||||||||||||
| Total interest-bearing liabilities | 993,254 | 22,645 | 2.28 | % | 799,323 | 24,095 | 3.01 | % | 783,913 | 30,630 | 3.91 | % | ||||||||||||||||||||||||
| Non-interest-bearing liabilities: | ||||||||||||||||||||||||||||||||||||
| Demand deposits | 124,966 | 114,400 | 127,107 | |||||||||||||||||||||||||||||||||
| Other non-interest-bearing deposits | 333 | 368 | 385 | |||||||||||||||||||||||||||||||||
| Other liabilities | 12,003 | 6,314 | 5,979 | |||||||||||||||||||||||||||||||||
| Total non-interest-bearing liabilities | 137,302 | 121,082 | 133,471 | |||||||||||||||||||||||||||||||||
| Stockholders’ equity | 93,853 | 83,123 | 94,345 | |||||||||||||||||||||||||||||||||
| Total liabilities and stockholders’ equity | $ | 1,224,409 | $ | 1,003,528 | $ | 1,011,729 | ||||||||||||||||||||||||||||||
| Net interest income (tax-equivalent basis) | 28,975 | 27,127 | 23,305 | |||||||||||||||||||||||||||||||||
| Net interest spread | 2.79 | % | 2.58 | % | 1.92 | % | ||||||||||||||||||||||||||||||
| Net interest income as percent of earning assets (margin) | 2.85 | % | 2.96 | % | 2.52 | % | ||||||||||||||||||||||||||||||
| Tax-equivalent adjustment(3) | (510 | ) | (1,328 | ) | (1,806 | ) | ||||||||||||||||||||||||||||||
| Net interest income | $ | 28,465 | $ | 25,799 | $ | 21,499 | ||||||||||||||||||||||||||||||
| Years Ended December 31, | ||||||||||||||||||||||||||||||||||||
| 2009 | 2008 | 2007 | ||||||||||||||||||||||||||||||||||
| (Tax-Equivalent Basis) | Average Balance | Income/ Expense | Yield/ Rate | Average Balance | Income/ Expense | Yield/ Rate | Average Balance | Income/ Expense | Yield/ Rate | |||||||||||||||||||||||||||
| (Dollars in Thousands) | ||||||||||||||||||||||||||||||||||||
| ASSETS | ||||||||||||||||||||||||||||||||||||
| Interest-earning assets: | ||||||||||||||||||||||||||||||||||||
Investment securities: (1) | ||||||||||||||||||||||||||||||||||||
| Taxable | $ | 289,414 | $ | 12,727 | 4.40 | % | $ | 211,185 | $ | 10,529 | 4.99 | % | $ | 267,884 | $ | 13,728 | 5.12 | % | ||||||||||||||||||
| Non-taxable | 25,677 | 1,499 | 5.84 | % | 67,890 | 3,876 | 5.71 | % | 95,501 | 5,527 | 5.79 | % | ||||||||||||||||||||||||
Loans, net of unearned income: (2) | 692,562 | 36,751 | 5.31 | % | 622,533 | 36,110 | 5.80 | % | 541,297 | 33,527 | 6.19 | % | ||||||||||||||||||||||||
| Federal funds sold and securities purchased under agreements to resell | — | — | — | 4,047 | 113 | 2.79 | % | 12,050 | 604 | 5.01 | % | |||||||||||||||||||||||||
| Restricted investment in bank stocks | 10,526 | 643 | 6.11 | % | 10,104 | 594 | 5.88 | % | 7,806 | 549 | 7.03 | % | ||||||||||||||||||||||||
| Total interest-earning assets | 1,018,179 | 51,620 | 5.07 | % | 915,759 | 51,222 | 5.59 | % | 924,538 | 53,935 | 5.83 | % | ||||||||||||||||||||||||
| Non-interest-earning assets: | ||||||||||||||||||||||||||||||||||||
| Cash and due from banks | 128,156 | 16,063 | 18,586 | |||||||||||||||||||||||||||||||||
| Bank owned life insurance | 24,941 | 22,627 | 21,801 | |||||||||||||||||||||||||||||||||
| Intangible assets | 17,069 | 17,158 | 17,259 | |||||||||||||||||||||||||||||||||
| Other assets | 42,980 | 37,602 | 34,547 | |||||||||||||||||||||||||||||||||
| Allowance for loan losses | (6,916 | ) | (5,681 | ) | (5,002 | ) | ||||||||||||||||||||||||||||||
| Total non-interest earning assets | 206,230 | 87,769 | 87,191 | |||||||||||||||||||||||||||||||||
| Total assets | $ | 1,224,409 | $ | 1,003,528 | $ | 1,011,729 | ||||||||||||||||||||||||||||||
| LIABILITIES & STOCKHOLDERS’ EQUITY | ||||||||||||||||||||||||||||||||||||
| Interest-bearing liabilities: | ||||||||||||||||||||||||||||||||||||
| Money market deposits | $ | 123,427 | $ | 1,635 | 1.32 | % | $ | 150,373 | $ | 3,478 | 2.31 | % | $ | 142,805 | $ | 6,577 | 4.61 | % | ||||||||||||||||||
| Savings deposits | 145,536 | 2,050 | 1.41 | % | 63,192 | 550 | 0.87 | % | 69,289 | 617 | 0.89 | % | ||||||||||||||||||||||||
| Time deposits | 319,639 | 6,850 | 2.14 | % | 178,761 | 6,252 | 3.50 | % | 187,860 | 8,832 | 4.70 | % | ||||||||||||||||||||||||
| Other interest-bearing deposits | 140,890 | 1,773 | 1.26 | % | 131,452 | 3,007 | 2.29 | % | 173,123 | 4,809 | 2.78 | % | ||||||||||||||||||||||||
| Short-term and long-term borrowings | 258,607 | 10,146 | 3.92 | % | 270,390 | 10,501 | 3.88 | % | 205,681 | 9,384 | 4.56 | % | ||||||||||||||||||||||||
| Subordinated debentures | 5,155 | 191 | 3.71 | % | 5,155 | 307 | 5.96 | % | 5,155 | 411 | 7.97 | % | ||||||||||||||||||||||||
| Total interest-bearing liabilities | 993,254 | 22,645 | 2.28 | % | 799,323 | 24,095 | 3.01 | % | 783,913 | 30,630 | 3.91 | % | ||||||||||||||||||||||||
| Non-interest-bearing liabilities: | ||||||||||||||||||||||||||||||||||||
| Demand deposits | 124,966 | 114,400 | 127,107 | |||||||||||||||||||||||||||||||||
| Other non-interest-bearing deposits | 333 | 368 | 385 | |||||||||||||||||||||||||||||||||
| Other liabilities | 12,003 | 6,314 | 5,979 | |||||||||||||||||||||||||||||||||
| Total non-interest-bearing liabilities | 137,302 | 121,082 | 133,471 | |||||||||||||||||||||||||||||||||
| Stockholders’ equity | 93,853 | 83,123 | 94,345 | |||||||||||||||||||||||||||||||||
| Total liabilities and stockholders’ equity | $ | 1,224,409 | $ | 1,003,528 | $ | 1,011,729 | ||||||||||||||||||||||||||||||
| Net interest income (tax-equivalent basis) | 28,975 | 27,127 | 23,305 | |||||||||||||||||||||||||||||||||
| Net interest spread | 2.79 | % | 2.58 | % | 1.92 | % | ||||||||||||||||||||||||||||||
| Net interest income as percent of earning assets (margin) | 2.85 | % | 2.96 | % | 2.52 | % | ||||||||||||||||||||||||||||||
Tax-equivalent adjustment (3) | (510 | ) | (1,328 | ) | (1,806 | ) | ||||||||||||||||||||||||||||||
| Net interest income | $ | 28,465 | $ | 25,799 | $ | 21,499 | ||||||||||||||||||||||||||||||
| (1) | Average balances for available-for-sale securities are based on amortized cost. |
| (2) | Average balances for loans include loans on non-accrual status. |
| (3) | The tax-equivalent adjustment was computed based on a statutory Federal income tax rate of 34 percent. |
U.S. Treasury & Agency Securities | Federal Agency Obligations | Obligations of U.S. States & Political Subdivisions | Other Debt and Equity Securities | Total | ||||||||||||||||
| (Dollars in Thousands) | ||||||||||||||||||||
| Due in 1 year or less | ||||||||||||||||||||
| Amortized Cost | $ | 150 | $ | — | $ | 979 | $ | 723 | $ | 1,852 | ||||||||||
| Market Value | 150 | — | 981 | 726 | 1,857 | |||||||||||||||
| Weighted Average Yield | 0.16 | % | — | 2.69 | % | 3.48 | % | 2.79 | % | |||||||||||
| Due after one year through five years | ||||||||||||||||||||
| Amortized Cost | $ | — | $ | — | $ | 4,103 | $ | 3,000 | $ | 7,103 | ||||||||||
| Market Value | — | — | 4,132 | 2,100 | 6,232 | |||||||||||||||
| Weighted Average Yield | — | — | 3.57 | % | 2.80 | % | 3.24 | % | ||||||||||||
| Due after five years through ten years | ||||||||||||||||||||
| Amortized Cost | $ | 1,939 | $ | 23,506 | $ | 4,253 | $ | 22,957 | $ | 52,655 | ||||||||||
| Market Value | 1,939 | 23,226 | 4,255 | 21,930 | 51,350 | |||||||||||||||
| Weighted Average Yield | 3.72 | % | 3.13 | % | 3.89 | % | 4.70 | % | 3.90 | % | ||||||||||
| Due after ten years | ||||||||||||||||||||
| Amortized Cost | $ | — | $ | 193,134 | $ | 10,353 | $ | 46,977 | $ | 250,464 | ||||||||||
| Market Value | — | 191,359 | 9,913 | 37,413 | 238,685 | |||||||||||||||
| Weighted Average Yield | — | 4.06 | % | 4.10 | % | 4.57 | % | 4.16 | % | |||||||||||
| Total | ||||||||||||||||||||
| Amortized Cost | $ | 2,089 | $ | 216,640 | $ | 19,688 | $ | 73,657 | $ | 312,074 | ||||||||||
| Market Value | 2,089 | 214,585 | 19,281 | 62,169 | 298,124 | |||||||||||||||
| Weighted Average Yield | 3.46 | % | 3.96 | % | 3.87 | % | 4.53 | % | 4.08 | % | ||||||||||
| 2009 | 2008 | 2007 | ||||||||||
| (Dollars in Thousands) | ||||||||||||
| Securities Available-for-Sale: | ||||||||||||
| U.S. Treasury & Agency Securities | $ | 2,089 | $ | 100 | $ | 101 | ||||||
| Federal Agency Obligations | 214,585 | 82,797 | 108,991 | |||||||||
| Obligations of U.S. States and political subdivisions | 19,281 | 52,094 | 83,337 | |||||||||
| Trust Preferred Securities | 26,715 | 31,771 | 30,468 | |||||||||
| Other debt securities | 29,921 | 59,362 | 83,478 | |||||||||
| Other equity securities | 5,533 | 16,590 | 7,819 | |||||||||
| Total Investment Securities Available-for-Sale | $ | 298,124 | $ | 242,714 | $ | 314,194 | ||||||
| December 31, | ||||||||||||||||||||
| 2009 | 2008 | 2007 | 2006 | 2005 | ||||||||||||||||
| (Dollars in Thousands) | ||||||||||||||||||||
| Real estate – residential mortgage | $ | 191,199 | $ | 240,885 | $ | 266,251 | $ | 269,486 | $ | 261,028 | ||||||||||
| Real estate – commercial mortgage | 405,903 | 358,394 | 219,356 | 206,044 | 164,841 | |||||||||||||||
| Commercial and industrial | 117,912 | 75,415 | 65,493 | 74,179 | 79,006 | |||||||||||||||
| Installment | 439 | 1,509 | 569 | 705 | 951 | |||||||||||||||
| Total loans | 715,453 | 676,203 | 551,669 | 550,414 | 505,826 | |||||||||||||||
| Less: | ||||||||||||||||||||
| Allowance for loan losses | 8,275 | 6,254 | 5,163 | 4,960 | 4,937 | |||||||||||||||
| Net loans | $ | 707,178 | $ | 669,949 | $ | 546,506 | $ | 545,454 | $ | 500,889 | ||||||||||
| December 31, | ||||||||||||||||||||
2009 (Restated) | 2008 | 2007 | 2006 | 2005 | ||||||||||||||||
| (Dollars in Thousands) | ||||||||||||||||||||
| Real estate – residential mortgage | $ | 191,199 | $ | 240,885 | $ | 266,251 | $ | 269,486 | $ | 261,028 | ||||||||||
| Real estate – commercial mortgage | 410,056 | 358,394 | 219,356 | 206,044 | 164,841 | |||||||||||||||
| Commercial and industrial | 117,912 | 75,415 | 65,493 | 74,179 | 79,006 | |||||||||||||||
| Installment | 439 | 1,509 | 569 | 705 | 951 | |||||||||||||||
| Total loans | 719,606 | 676,203 | 551,669 | 550,414 | 505,826 | |||||||||||||||
| Less: | ||||||||||||||||||||
| Allowance for loan losses | 8,711 | 6,254 | 5,163 | 4,960 | 4,937 | |||||||||||||||
| Net loans | $ | 710,895 | $ | 669,949 | $ | 546,506 | $ | 545,454 | $ | 500,889 | ||||||||||
| At December 31, 2009, Maturing | ||||||||||||||||
| In One Year or Less | After One Year through Five Years | After Five Years | Total | |||||||||||||
| (Dollars in Thousands) | ||||||||||||||||
| Construction loans | $ | 25,918 | $ | 14,028 | $ | 7,000 | $ | 46,946 | ||||||||
| Commercial real estate loans | 47,241 | 168,302 | 143,414 | 358,957 | ||||||||||||
| Commercial loans | 59,927 | 48,644 | 9,341 | 117,912 | ||||||||||||
| All other loans | 42,013 | 24,488 | 125,137 | 191,638 | ||||||||||||
| Total | $ | 175,099 | $ | 255,462 | $ | 284,892 | $ | 715,453 | ||||||||
| Loans with: | ||||||||||||||||
| Fixed rates | $ | 47,258 | $ | 98,739 | $ | 258,834 | $ | 404,831 | ||||||||
| Variable rates | 127,841 | 156,723 | 26,058 | 310,622 | ||||||||||||
| Total | $ | 175,099 | $ | 255,462 | $ | 284,892 | $ | 715,453 | ||||||||
| At December 31, 2009, Maturing | ||||||||||||||||
In One Year or Less | After One Year through Five Years | After Five Years | Total | |||||||||||||
| (Restated, Dollars in Thousands) | ||||||||||||||||
| Construction loans | $ | 30,071 | $ | 14,028 | $ | 7,000 | $ | 51,099 | ||||||||
| Commercial real estate loans | 47,241 | 168,302 | 143,414 | 358,957 | ||||||||||||
| Commercial loans | 59,927 | 48,644 | 9,341 | 117,912 | ||||||||||||
| All other loans | 42,013 | 24,488 | 125,137 | 191,638 | ||||||||||||
| Total loans | $ | 179,252 | $ | 255,462 | $ | 284,892 | $ | 719,606 | ||||||||
| Loans with: | ||||||||||||||||
| Fixed rates | $ | 47,258 | $ | 98,739 | $ | 258,834 | $ | 404,831 | ||||||||
| Variable rates | 131,994 | 156,723 | 26,058 | 314,775 | ||||||||||||
| Total loans | $ | 179,252 | $ | 255,462 | $ | 284,892 | $ | 719,606 | ||||||||
well as operating, regulatory and other conditions beyond the Corporation’s control. The allowance for loan losses as a percentage of total loans amounted to 1.161.21 percent, 0.92 percent and 0.94 percent at December 31, 2009, 2008 and 2007, respectively.
| Years Ended December 31, | ||||||||||||||||||||
| 2009 | 2008 | 2007 | 2006 | 2005 | ||||||||||||||||
| (Dollars in Thousands) | ||||||||||||||||||||
| Average loans outstanding | $ | 692,562 | $ | 622,533 | $ | 541,297 | $ | 522,352 | $ | 454,372 | ||||||||||
| Total loans at end of period | $ | 715,453 | $ | 676,203 | $ | 551,669 | $ | 550,414 | $ | 505,826 | ||||||||||
| Analysis of the Allowance for Loan Losses | ||||||||||||||||||||
| Balance at the beginning of year | $ | 6,254 | $ | 5,163 | $ | 4,960 | $ | 4,937 | $ | 3,781 | ||||||||||
| Charge-offs: | ||||||||||||||||||||
| Commercial | 2,122 | 50 | 45 | — | 49 | |||||||||||||||
| Residential | 4 | 414 | 80 | — | — | |||||||||||||||
| Installment loans | 26 | 35 | 31 | 79 | 33 | |||||||||||||||
| Total charge-offs | 2,152 | 499 | 156 | 79 | 82 | |||||||||||||||
| Recoveries: | ||||||||||||||||||||
| Commercial | 902 | 10 | 2 | 19 | — | |||||||||||||||
| Residential | 4 | — | — | — | — | |||||||||||||||
| Installment loans | 6 | 19 | 7 | 26 | 28 | |||||||||||||||
| Total recoveries | 912 | 29 | 9 | 45 | 28 | |||||||||||||||
| Net charge-offs (recoveries) | 1,240 | 470 | 147 | 34 | 54 | |||||||||||||||
| Addition of Red Oak Bank’s allowance | — | — | — | — | 1,210 | |||||||||||||||
| Provision for loan losses | 3,261 | 1,561 | 350 | 57 | — | |||||||||||||||
| Balance at end of year | $ | 8,275 | $ | 6,254 | $ | 5,163 | $ | 4,960 | $ | 4,937 | ||||||||||
| Ratio of net charge-offs during the year to average loans outstanding during the year | 0.18 | % | 0.08 | % | 0.03 | % | 0.01 | % | 0.01 | % | ||||||||||
| Allowance for loan losses as a percentage of total loans at end of year | 1.16 | % | 0.92 | % | 0.94 | % | 0.90 | % | 0.98 | % | ||||||||||
Years Ended December 31, 2009(Restated) 2008 2007 2006 2005 (Dollars in Thousands) Average loans outstanding $ 692,562 $ 622,533 $ 541,297 $ 522,352 $ 454,372 Total loans at end of period $ 719,606 $ 676,203 $ 551,669 $ 550,414 $ 505,826 Analysis of the Allowance for Loan Losses Balance at the beginning of year $ 6,254 $ 5,163 $ 4,960 $ 4,937 $ 3,781 Charge-offs: Commercial 2,122 50 45 — 49 Residential 4 414 80 — — Installment 26 35 31 79 33 Total charge-offs 2,152 499 156 79 82 Recoveries: Commercial 2 10 2 19 — Residential 4 — — — — Installment 6 19 7 26 28 Total recoveries 12 29 9 45 28 Net charge-offs 2,140 470 147 34 54 Addition of Red Oak Bank’s allowance — — — — 1,210 Provision for loan losses 4,597 1,561 350 57 — Balance at end of year $ 8,711 $ 6,254 $ 5,163 $ 4,960 $ 4,937 Ratio of net charge-offs during the year to average loans outstanding during the year 0.31 % 0.08 % 0.03 % 0.01 % 0.01 % Allowance for loan losses as a percentage of total loans at end of year 1.21 % 0.92 % 0.94 % 0.90 % 0.98 %
| Commercial | Real Estate Residential Mortgage | Installment | Unallocated | |||||||||||||||||||||||||||||||||
| Amount of Allowance | Loans to Total Loans % | Amount of Allowance | Loans to Total Loans % | Amount of Allowance | Loans to Total Loans % | Amount of Allowance | Total | |||||||||||||||||||||||||||||
| (Dollars in Thousands) | ||||||||||||||||||||||||||||||||||||
| 2009 | $ | 6,532 | 73.2 | $ | 1,312 | 26.6 | $ | 56 | 0.2 | $ | 375 | $ | 8,275 | |||||||||||||||||||||||
| 2008 | 5,473 | 64.2 | 651 | 35.6 | 60 | 0.2 | 70 | 6,254 | ||||||||||||||||||||||||||||
| 2007 | 4,167 | 51.6 | 727 | 48.3 | 49 | 0.1 | 220 | 5,163 | ||||||||||||||||||||||||||||
| 2006 | 3,972 | 50.9 | 707 | 49.0 | 45 | 0.1 | 236 | 4,960 | ||||||||||||||||||||||||||||
| 2005 | 3,453 | 48.2 | 594 | 51.6 | 55 | 0.2 | 835 | 4,937 | ||||||||||||||||||||||||||||
| Commercial | Residential Mortgage | Installment | Unallocated | ||||||||||||||||||||||||||
Amount of Allowance | Loans to Total Loans % | Amount of Allowance | Loans to Total Loans % | Amount of Allowance | Loans to Total Loans % | Amount of Allowance | Total | ||||||||||||||||||||||
| (Dollars in Thousands) | |||||||||||||||||||||||||||||
| 2009 (Restated) | $ | 7,314 | 73.3 | $ | 1,242 | 25.6 | $ | 56 | 0.1 | $ | 99 | $ | 8,711 | ||||||||||||||||
| 2008 | 5,473 | 64.2 | 651 | 35.6 | 60 | 0.2 | 70 | 6,254 | |||||||||||||||||||||
| 2007 | 4,167 | 51.6 | 727 | 48.3 | 49 | 0.1 | 220 | 5,163 | |||||||||||||||||||||
| 2006 | 3,972 | 50.9 | 707 | 49.0 | 45 | 0.1 | 236 | 4,960 | |||||||||||||||||||||
| 2005 | 3,453 | 48.2 | 594 | 51.6 | 55 | 0.2 | 835 | 4,937 | |||||||||||||||||||||
| At December 31, | ||||||||||||||||||||
| 2009 | 2008 | 2007 | 2006 | 2005 | ||||||||||||||||
| (Dollars in Thousands) | ||||||||||||||||||||
| Non-accrual loans | $ | 7,092 | $ | 541 | $ | 3,907 | $ | 475 | $ | 387 | ||||||||||
| Accruing loans past due 90 days or more | 39 | 139 | — | 225 | 179 | |||||||||||||||
| Troubled debt restructuring | 966 | 93 | — | — | — | |||||||||||||||
| Total non-performing loans | 8,097 | 773 | 3,907 | 700 | 566 | |||||||||||||||
| OREO | — | 3,949 | 501 | — | — | |||||||||||||||
| Total non-performing assets | $ | 8,097 | $ | 4,722 | $ | 4,408 | $ | 700 | $ | 566 | ||||||||||
(Restated:) | At December 31, | |||||||||||||||||||
2009 | 2008 | 2007 | 2006 | 2005 | ||||||||||||||||
| (Dollars in Thousands) | ||||||||||||||||||||
| Non-accrual loans | $ | 11,245 | $ | 541 | $ | 3,907 | $ | 475 | $ | 387 | ||||||||||
| Accruing loans past due 90 days or more | 39 | 139 | — | 225 | 179 | |||||||||||||||
| Total non-performing loans | 11,284 | 680 | 3,907 | 700 | 566 | |||||||||||||||
| OREO | — | 3,949 | 501 | — | — | |||||||||||||||
| Total non-performing assets | $ | 11,284 | $ | 4,629 | $ | 4,408 | $ | 700 | $ | 566 | ||||||||||
| Troubled debt restructured loans | $ | 966 | $ | 93 | $ | — | $ | — | $ | — | ||||||||||
| (As previously reported:) | At December 31, | |||||||||||||||||
| 2009 | 2008 | 2007 | 2006 | 2005 | ||||||||||||||
| (Dollars in Thousands) | ||||||||||||||||||
| Non-accrual loans | $ | 7,092 | $ | 541 | $ | 3,907 | $ | 475 | $ | 387 | ||||||||
| Accruing loans past due 90 days or more | 39 | 139 | — | 225 | 179 | |||||||||||||
| Troubled debt restructuring | 966 | 93 | — | — | — | |||||||||||||
| Total non-performing loans | 8,097 | 773 | 3,907 | 700 | 566 | |||||||||||||
| OREO | — | 3,949 | 501 | — | — | |||||||||||||
| Total non-performing assets | $ | 8,097 | $ | 4,722 | $ | 4,408 | $ | 700 | $ | 566 | ||||||||
| December 31, | ||||||||||||||||||||
| 2009 | 2008 | 2007 | 2006 | 2005 | ||||||||||||||||
| (Dollars in Thousands) | ||||||||||||||||||||
| Commercial | $ | — | $ | — | $ | — | $ | 225 | $ | 179 | ||||||||||
| Residential | 39 | 139 | — | — | — | |||||||||||||||
| Installment | — | — | — | — | — | |||||||||||||||
| Total accruing loans 90 days or more past due | $ | 39 | $ | 139 | $ | — | $ | 225 | $ | 179 | ||||||||||
At December 31, 2009, other than the loans set forth above, the Corporation is not aware of any loans which present serious doubts as to the ability of its borrowers to comply with present loan repayment terms and which are expected to fall into one of the categories set forth in the tables or description above.
| Years Ended December 31, | ||||||||||||||||||||||||
| 2009 | 2008 | % Change | 2008 | 2007 | % Change | |||||||||||||||||||
| (Dollars in Thousands) | ||||||||||||||||||||||||
| Service charges, commissions and fees | $ | 1,835 | $ | 2,015 | (8.93 | ) | $ | 2,015 | $ | 1,824 | 10.47 | |||||||||||||
| Annuity & insurance commissions | 126 | 112 | 12.50 | 112 | 298 | (62.42 | ) | |||||||||||||||||
| Bank-owned life insurance | 1,156 | 1,203 | (3.91 | ) | 1,203 | 893 | 34.71 | |||||||||||||||||
| Net securities gains (losses) | 491 | (1,106 | ) | 144.39 | (1,106 | ) | 900 | (222.89 | ) | |||||||||||||||
| Other | 298 | 420 | (29.05 | ) | 420 | 457 | (8.10 | ) | ||||||||||||||||
| Total other income | $ | 3,906 | $ | 2,644 | 47.73 | $ | 2,644 | $ | 4,372 | (39.52 | ) | |||||||||||||
| Years Ended December 31, | ||||||||||||||||||||||||
| 2009 | 2008 | Percentage Change | 2008 | 2007 | Percentage Change | |||||||||||||||||||
| (Dollars in Thousands) | ||||||||||||||||||||||||
| Service charges, commissions and fees | $ | 1,835 | $ | 2,015 | (8.93 | )% | $ | 2,015 | $ | 1,824 | 10.47 | % | ||||||||||||
| Annuity & insurance commissions | 126 | 112 | 12.50 | 112 | 298 | (62.42 | ) | |||||||||||||||||
| Bank-owned life insurance | 1,156 | 1,203 | (3.91 | ) | 1,203 | 893 | 34.71 | |||||||||||||||||
| Net securities gains (losses) | 491 | (1,106 | ) | 144.39 | (1,106 | ) | 900 | (222.89 | ) | |||||||||||||||
| Other | 298 | 420 | (29.05 | ) | 420 | 457 | (8.10 | ) | ||||||||||||||||
| Total other income | $ | 3,906 | $ | 2,644 | 47.73 | % | $ | 2,644 | $ | 4,372 | (39.52 | )% | ||||||||||||
and investment portfolios. In 2008 and 2007, the sales of securities were made in the normal course of business and proceeds were primarily reinvested into the loan portfolio.
| Year Ended December 31, | ||||||||||||||||||||||||
| 2009 | 2008 | % Change | 2008 | 2007 | % Change | |||||||||||||||||||
| (Dollars in Thousands) | ||||||||||||||||||||||||
| Salaries and employee benefits | $ | 9,915 | $ | 8,505 | 16.58 | $ | 8,505 | $ | 11,436 | (25.63 | ) | |||||||||||||
| Occupancy, net | 2,536 | 3,279 | (22.66 | ) | 3,279 | 2,843 | 15.34 | |||||||||||||||||
| Premises and equipment | 1,263 | 1,436 | (12.05 | ) | 1,436 | 1,777 | (19.19 | ) | ||||||||||||||||
| FDIC Insurance | 2,055 | 217 | 847.00 | 217 | 86 | 152.33 | ||||||||||||||||||
| Professional and consulting | 811 | 703 | 15.36 | 703 | 2,139 | (67.13 | ) | |||||||||||||||||
| Stationery and printing | 339 | 397 | (14.61 | ) | 397 | 465 | (14.62 | ) | ||||||||||||||||
| Marketing and advertising | 366 | 637 | (42.54 | ) | 637 | 603 | 5.64 | |||||||||||||||||
| Computer expense | 964 | 834 | 15.59 | 834 | 614 | 35.83 | ||||||||||||||||||
| OREO Expense, net | 1,438 | 31 | 4538.71 | 31 | 110 | (71.82 | ) | |||||||||||||||||
| Other | 3,370 | 3,434 | (1.86 | ) | 3,434 | 4,525 | (24.11 | ) | ||||||||||||||||
| Total other expense | $ | 23,057 | $ | 19,473 | 18.40 | $ | 19,473 | $ | 24,598 | (20.84 | ) | |||||||||||||
| Year Ended December 31, | ||||||||||||||||||||||||
| 2009 | 2008 | Percentage Change | 2008 | 2007 | Percentage Change | |||||||||||||||||||
| (Dollars in Thousands) | ||||||||||||||||||||||||
| Salaries and employee benefits | $ | 9,915 | $ | 8,505 | 16.58 | % | $ | 8,505 | $ | 11,436 | (25.63 | )% | ||||||||||||
| Occupancy, net | 2,536 | 3,279 | (22.66 | ) | 3,279 | 2,843 | 15.34 | |||||||||||||||||
| Premises and equipment | 1,263 | 1,436 | (12.05 | ) | 1,436 | 1,777 | (19.19 | ) | ||||||||||||||||
| FDIC Insurance | 2,055 | 217 | 847.00 | 217 | 86 | 152.33 | ||||||||||||||||||
| Professional and consulting | 811 | 703 | 15.36 | 703 | 2,139 | (67.13 | ) | |||||||||||||||||
| Stationery and printing | 339 | 397 | (14.61 | ) | 397 | 465 | (14.62 | ) | ||||||||||||||||
| Marketing and advertising | 366 | 637 | (42.54 | ) | 637 | 603 | 5.64 | |||||||||||||||||
| Computer expense | 964 | 834 | 15.59 | 834 | 614 | 35.83 | ||||||||||||||||||
| OREO Expense, net | 1,438 | 31 | 4538.71 | 31 | 110 | (71.82 | ) | |||||||||||||||||
| Other | 3,370 | 3,434 | (1.86 | ) | 3,434 | 4,525 | (24.11 | ) | ||||||||||||||||
| Total other expense | $ | 23,057 | $ | 19,473 | 18.40 | % | $ | 19,473 | $ | 24,598 | (20.84 | )% | ||||||||||||
part of its ongoing effort to reduce operating expense, it had frozen its defined benefit pension plan and that it redesigned its 401(k) savings plan, effective September 30, 2007. The changes were consistent with cost reduction strategies and a shift in the focus of future savings of retirement benefits toward the more predictable cost structure of a 401(k) plan and away from the legacy costs of a defined benefit pension plan. The changes included stopping the accrual of future benefits in the Corporation’s defined benefit pension plan, and fully preserving all retirement benefits that employees have earned as of September 30, 2007; and redesigning the Corporation’s 401(k) plan by granting current pension plan participants an annual company-funded matching contribution of as much as 6 percent of their pay, which is an increase from the existing 3 percent match. As a result, the Corporation recorded a one-time pre-tax benefit related to these pension plan changes of approximately $1.2 million in the third quarter of 2007, reflecting the curtailment of the defined benefit plan. For the twelve months ended December 31, 2007, the plan changes resulted in retirement-related expense savings of $1.2 million.
was primarily due to reduced spending in media and advertising. These expenses increased $34,000 or 5.6 percent in 2008 compared with 2007.
the effect of all events or transactions that provide additional evidence of conditions that existed at the balance sheet date, including the estimates inherent in the financial preparation process. Entities shall not recognize the impact of events or transactions that provide evidence about conditions that did not exist at the balance sheet date but arose after that date. FASB ASC 855-10-05 also requires entities to disclose the date through which subsequent events have been evaluated. FASB ASC 855-10-05 was effective for interim and annual reporting periods ending after June 15, 2009. The Corporation adopted the provisions of FASB ASC 855-10-05 for the quarter ended June 30, 2009. The adoption of this accounting standard had no material impact on the Corporation’s consolidated financial statements.
a number of specific time frames. The difference between interest sensitive assets and interest sensitive liabilities is referred to as the interest sensitivity gap. At any given point in time, the Corporation may be in an asset-sensitive position, whereby its interest-sensitive assets exceed its interest-sensitive liabilities, or in a liability-sensitive position, whereby its interest-sensitive liabilities exceed its interest-sensitive assets, depending in part on management’s judgment as to projected interest rate trends.
| Expected Maturity/Principal Repayment December 31, | ||||||||||||||||||||||||||||||||||||
| Average Interest Rate | Year End 2010 | Year End 2011 | Year End 2012 | Year End 2013 | Year End 2014 | 2015 and Thereafter | Total Balance | Estimated Fair Value | ||||||||||||||||||||||||||||
| (Dollars in Thousands) | ||||||||||||||||||||||||||||||||||||
| Interest-Earning Assets: | ||||||||||||||||||||||||||||||||||||
| Loans, net | 5.33 | % | $ | 340,977 | $ | 90,254 | $ | 74,772 | $ | 90,302 | $ | 54,959 | $ | 55,914 | $ | 707,178 | $ | 713,474 | ||||||||||||||||||
| Investments | 4.10 | % | 54,407 | 40,772 | 37,460 | 20,014 | 14,566 | 130,905 | 298,124 | 298,124 | ||||||||||||||||||||||||||
| Total interest-earning assets | $ | 395,384 | $ | 131,026 | $ | 112,232 | $ | 110,316 | $ | 69,525 | $ | 186,819 | $ | 1,005,302 | $ | 1,011,598 | ||||||||||||||||||||
| Interest-Bearing Liabilities: | ||||||||||||||||||||||||||||||||||||
| Time certificates of deposit of $100 or greater | 1.38 | % | $ | 141,827 | $ | 2,119 | $ | 753 | $ | 103 | $ | — | $ | — | $ | 144,802 | $ | 145,219 | ||||||||||||||||||
| Time certificates of deposit of less than $100 | 1.75 | % | 69,688 | 6,836 | 3,391 | 258 | — | — | 80,173 | 80,543 | ||||||||||||||||||||||||||
| Other interest-bearing deposits | 0.84 | % | 60,770 | 60,770 | 68,842 | 59,256 | 100,302 | 108,272 | 458,212 | 458,212 | ||||||||||||||||||||||||||
| Subordinated debentures | 3.23 | % | 5,155 | — | — | — | — | — | 5,155 | 5,155 | ||||||||||||||||||||||||||
| Securities sold under agreements to repurchase and Fed Funds Purchased | 3.35 | % | 46,109 | 12,000 | — | — | — | 41,000 | 99,109 | 101,555 | ||||||||||||||||||||||||||
| Term borrowings | 4.09 | % | 40,144 | 10,000 | — | 5,000 | — | 115,000 | 170,144 | 177,664 | ||||||||||||||||||||||||||
| Total interest-bearing liabilities | $ | 363,693 | $ | 91,725 | $ | 72,986 | $ | 64,617 | $ | 100,302 | $ | 264,272 | $ | 957,595 | $ | 968,348 | ||||||||||||||||||||
| Cumulative interest-earning assets | $ | 395,384 | $ | 526,410 | $ | 638,642 | $ | 748,958 | $ | 818,483 | $ | 1,005,302 | $ | 1,005,302 | ||||||||||||||||||||||
| Cumulative interest-bearing liabilities | 363,693 | 455,418 | 528,404 | 593,021 | 693,323 | 957,595 | 957,595 | |||||||||||||||||||||||||||||
| Rate sensitivity gap | 31,691 | 39,301 | 39,246 | 45,699 | (30,777 | ) | (77,453 | ) | 47,707 | |||||||||||||||||||||||||||
| Cumulative rate sensitivity gap | 31,691 | 70,992 | 110,238 | 155,937 | 125,160 | 47,707 | 47,707 | |||||||||||||||||||||||||||||
| Cumulative gap ratio | 1.09 | % | 1.16 | % | 1.21 | % | 1.26 | % | 1.18 | % | 1.05 | % | 1.05 | % | ||||||||||||||||||||||
| Expected Maturity/Principal Repayment at December 31, | ||||||||||||||||||||||||||||||||||||
Average Interest Rate | 2010 | 2011 | 2012 | 2013 | 2014 | 2015 and Thereafter | Total Balance | Estimated Fair Value | ||||||||||||||||||||||||||||
| (Dollars in Thousands) | ||||||||||||||||||||||||||||||||||||
| Interest-Earning Assets: | ||||||||||||||||||||||||||||||||||||
| Loans, net | 5.30 | % | $ | 345,130 | $ | 90,254 | $ | 74,772 | $ | 90,302 | $ | 54,959 | $ | 55,478 | $ | 710,895 | $ | 717,191 | ||||||||||||||||||
| Investments | 4.10 | % | 54,407 | 40,772 | 37,460 | 20,014 | 14,566 | 130,905 | 298,124 | 298,124 | ||||||||||||||||||||||||||
| Total interest-earning assets | $ | 399,537 | $ | 131,026 | $ | 112,232 | $ | 110,316 | $ | 69,525 | $ | 186.383 | $ | 1.009.019 | $ | 1,015,315 | ||||||||||||||||||||
| Interest-Bearing Liabilities: | ||||||||||||||||||||||||||||||||||||
| Time certificates of deposit of $100 or greater | 1.38 | % | $ | 141,827 | $ | 2,119 | $ | 753 | $ | 103 | $ | — | $ | — | $ | 144,802 | $ | 145,219 | ||||||||||||||||||
| Time certificates of deposit of less than $100 | 1.75 | % | 69,688 | 6,836 | 3,391 | 258 | — | — | 80,173 | 80,543 | ||||||||||||||||||||||||||
| Other interest-bearing deposits | 0.84 | % | 60,770 | 60,770 | 68,842 | 59,256 | 100,302 | 108,272 | 458,212 | 458,212 | ||||||||||||||||||||||||||
| Subordinated debentures | 3.23 | % | 5,155 | — | — | — | — | — | 5,155 | 5,155 | ||||||||||||||||||||||||||
| Securities sold under agreements to repurchase and Fed Funds Purchased | 3.35 | % | 46,109 | 12,000 | — | — | — | 41,000 | 99,109 | 101,555 | ||||||||||||||||||||||||||
| Term borrowings | 4.09 | % | 40,144 | 10,000 | — | 5,000 | — | 115,000 | 170,144 | 177,664 | ||||||||||||||||||||||||||
| Total interest-bearing liabilities | $ | 363,693 | $ | 91,725 | $ | 72,986 | $ | 64,617 | $ | 100,302 | $ | 264,272 | $ | 957,595 | $ | 968,348 | ||||||||||||||||||||
| Cumulative interest-earning assets | $ | 399,537 | $ | 530,563 | $ | 642,795 | $ | 753,111 | $ | 822,636 | $ | 1,009,019 | $ | 1,009,019 | ||||||||||||||||||||||
| Cumulative interest-bearing liabilities | 363,693 | 455,418 | 528,404 | 593,021 | 693,323 | 957,595 | 957,595 | |||||||||||||||||||||||||||||
| Rate sensitivity gap | 35,844 | 39,301 | 39,246 | 45,700 | (30,777 | ) | (77,889 | ) | 51,424 | |||||||||||||||||||||||||||
| Cumulative rate sensitivity gap | 35,844 | 75,145 | 114,391 | 160,091 | 129,314 | 51,424 | 51,424 | |||||||||||||||||||||||||||||
| Cumulative gap ratio | 1.10 | % | 1.17 | % | 1.22 | % | 1.27 | % | 1.19 | % | 1.05 | % | 1.05 | % | ||||||||||||||||||||||
| December 31, | Net Change Volume 2009 vs. 2008 | |||||||||||||||||||
| 2009 | 2008 | |||||||||||||||||||
| Amount | Percentage | Amount | Percentage | |||||||||||||||||
| (Dollars in Thousands) | ||||||||||||||||||||
| Demand Deposits | $ | 130,518 | 34.4 | $ | 113,319 | 32.4 | $ | 17,199 | ||||||||||||
| Interest-Bearing Demand | 156,738 | 41.3 | 139,349 | 39.9 | 17,389 | |||||||||||||||
| Regular Savings | 58,240 | 15.4 | 56,431 | 16.2 | 1,809 | |||||||||||||||
| Money Market Deposits under $100 | 33,795 | 8.9 | 40,419 | 11.5 | (6,624 | ) | ||||||||||||||
| Total core deposits | $ | 379,291 | 100.0 | $ | 349,518 | 100.0 | $ | 29,773 | ||||||||||||
| Total deposits | $ | 813,705 | $ | 659,537 | $ | 154,168 | ||||||||||||||
| Core deposits to total deposits | 46.61 | % | 52.99 | % | ||||||||||||||||
| December 31, | ||||||||||||||||||
| 2009 | 2008 | |||||||||||||||||
| Amount | Percentage | Amount | Percentage | Net Change Volume 2009 vs. 2008 | ||||||||||||||
| (Dollars in Thousands) | ||||||||||||||||||
| Demand Deposits | $ | 130,518 | 34.4 | % | $ | 113,319 | 32.4 | % | $ | 17,199 | ||||||||
| Interest-Bearing Demand | 156,738 | 41.3 | 139,349 | 39.9 | 17,389 | |||||||||||||
| Regular Savings | 58,240 | 15.4 | 56,431 | 16.1 | 1,809 | |||||||||||||
| Money Market Deposits under $100 | 33,795 | 8.9 | 40,419 | 11.6 | (6,624 | ) | ||||||||||||
| Total core deposits | $ | 379,291 | 100.0 | % | $ | 349,518 | 100.0 | % | $ | 29,773 | ||||||||
| Total deposits | $ | 813,705 | $ | 659,537 | $ | 154,168 | ||||||||||||
| Core deposits to total deposits | 46.61 | % | 52.99 | % | ||||||||||||||
| December 31, | ||||||||||||
| 2009 | 2008 | 2007 | ||||||||||
| (Dollars in Thousands) | ||||||||||||
| Short-term securities sold under repurchase agreements: | ||||||||||||
| Average interest rate: | ||||||||||||
| At year end | 0.97 | % | 1.98 | % | 3.85 | % | ||||||
| For the year | 1.38 | % | 2.39 | % | 3.60 | % | ||||||
| Average amount outstanding during the year | $ | 35,392 | $ | 43,973 | $ | 33,683 | ||||||
| Maximum amount outstanding at any month end | $ | 58,515 | $ | 52,992 | $ | 48,541 | ||||||
| Amount outstanding at year end | $ | 46,109 | $ | 30,143 | $ | 48,541 | ||||||
| Total | Less Than 1 Year | 1 – 3 Years | 4 – 5 Years | After 5 Years | ||||||||||||||||
| (Dollars in Thousands) | ||||||||||||||||||||
| Contractual Obligations | ||||||||||||||||||||
| Operating lease obligations | $ | 7,714 | $ | 592 | $ | 1,232 | $ | 1,033 | $ | 4,857 | ||||||||||
| Total contracted cost obligations | $ | 7,714 | $ | 592 | $ | 1,232 | $ | 1,033 | $ | 4,857 | ||||||||||
| Other Long-term Liabilities/Long-term Debt | ||||||||||||||||||||
| Time Deposits | $ | 224,974 | $ | 213,400 | $ | 11,213 | $ | 361 | $ | — | ||||||||||
| Federal Home Loan Bank advances and repurchase agreements | 269,253 | 86,253 | 22,000 | 5,000 | 156,000 | |||||||||||||||
| Subordinated debentures | 5,155 | 5,155 | — | — | — | |||||||||||||||
| Total Other Long-term Liabilities/Long-term Debt | $ | 499,382 | $ | 304,808 | $ | 33,213 | $ | 5,361 | $ | 156,000 | ||||||||||
| Other Commercial Commitments – Off Balance Sheet | ||||||||||||||||||||
| Commitments under commercial loans and lines of credit | $ | 70,076 | $ | 70,076 | $ | — | $ | — | $ | — | ||||||||||
| Home equity and other revolving lines of credit | 54,572 | 54,572 | — | — | — | |||||||||||||||
| Outstanding commercial mortgage loan commitments | 33,659 | 20,596 | 13,063 | — | — | |||||||||||||||
| Standby letters of credit | 1,676 | 1,676 | — | — | — | |||||||||||||||
| Performance letters of credit | 11,466 | 11,466 | — | — | — | |||||||||||||||
| Outstanding residential mortgage loan commitments | 4,153 | 4,153 | — | — | — | |||||||||||||||
| Overdraft protection lines | 5,058 | 5,058 | — | — | — | |||||||||||||||
| Other consumer | 11 | 11 | — | — | — | |||||||||||||||
| Total off balance sheet arrangements and contractual obligations | $ | 180,671 | $ | 167,608 | $ | 13,063 | $ | — | $ | — | ||||||||||
| Total contractual obligations and other commitments | $ | 687,767 | $ | 473,008 | $ | 47,508 | $ | 6,394 | $ | 160,857 | ||||||||||
The
interest income and on net portfolio value of an immediate change in interest rates in 100 basis point increments. Net portfolio value is defined as the net present value of assets, liabilities and off-balance sheet contracts.
| /s/ ParenteBeard LLC |
ParenteBeard LLC
| December 31, | ||||||||
| 2009 | 2008 | |||||||
| (In Thousands, Except Share Data) | ||||||||
| ASSETS | ||||||||
| Cash and due from banks | $ | 89,168 | $ | 15,031 | ||||
| Investment securities available-for-sale | 298,124 | 242,714 | ||||||
| Loans | 715,453 | 676,203 | ||||||
| Less: Allowance for loan losses | 8,275 | 6,254 | ||||||
| Net loans | 707,178 | 669,949 | ||||||
| Restricted investment in bank stocks, at cost | 10,672 | 10,230 | ||||||
| Premises and equipment, net | 17,860 | 18,488 | ||||||
| Accrued interest receivable | 4,033 | 4,154 | ||||||
| Bank owned life insurance | 26,304 | 22,938 | ||||||
| Other real estate owned | — | 3,949 | ||||||
| Goodwill and other intangible assets | 17,028 | 17,110 | ||||||
| Prepaid FDIC assessment | 5,374 | — | ||||||
| Other assets | 21,083 | 18,730 | ||||||
| Total assets | $ | 1,196,824 | $ | 1,023,293 | ||||
| LIABILITIES | ||||||||
| Deposits: | ||||||||
| Non-interest-bearing | $ | 130,518 | $ | 113,319 | ||||
| Interest-bearing: | ||||||||
| Time deposits $100 and over | 144,802 | 100,493 | ||||||
| Interest-bearing transaction, savings and time deposits $100 and less | 538,385 | 445,725 | ||||||
| Total deposits | 813,705 | 659,537 | ||||||
| Short-term borrowings | 46,109 | 45,143 | ||||||
| Long-term borrowings | 223,144 | 223,297 | ||||||
| Subordinated debentures | 5,155 | 5,155 | ||||||
| Accounts payable and accrued liabilities | 6,160 | 8,448 | ||||||
| Total liabilities | 1,094,273 | 941,580 | ||||||
| Stockholders’ Equity | ||||||||
| Preferred Stock, $1,000 liquidation value per share: | ||||||||
| Authorized 5,000,000 shares; issued 10,000 shares in 2009 and none in 2008 | 9,619 | — | ||||||
| Common stock, no par value: | ||||||||
| Authorized 20,000,000 shares; issued 16,762,412 shares in 2009 and 15,190,984 in 2008; outstanding 14,572,029 shares in 2009 and 12,991,312 in 2008 | 97,908 | 86,908 | ||||||
| Additional paid-in capital | 5,650 | 5,204 | ||||||
| Retained earnings | 17,870 | 16,309 | ||||||
| Treasury stock, at cost (2,190,383 in 2009 and 2,199,672 shares in 2008) | (17,720 | ) | (17,796 | ) | ||||
| Accumulated other comprehensive loss | (10,776 | ) | (8,912 | ) | ||||
| Total stockholders’ equity | 102,551 | 81,713 | ||||||
| Total liabilities and stockholders’ equity | $ | 1,196,824 | $ | 1,023,293 | ||||
December 31, (In Thousands, Except Share Data) 2009(Restated) 2008 ASSETS Cash and due from banks $ 89,168 $ 15,031 Investment securities available-for-sale 298,124 242,714 Loans 719,606 676,203 Less: Allowance for loan losses 8,711 6,254 Net loans 710,895 669,949 Restricted investment in bank stocks, at cost 10,672 10,230 Premises and equipment, net 17,860 18,488 Accrued interest receivable 4,033 4,154 Bank-owned life insurance 26,304 22,938 Other real estate owned — 3,949 Goodwill and other intangible assets 17,028 17,110 Prepaid FDIC assessment 5,374 — Other assets 16,030 18,730 Total assets $ 1,195,488 $ 1,023,293 LIABILITIES AND STOCKHOLDERS’ EQUITY Deposits: Non interest-bearing $ 130,518 $ 113,319 Interest-bearing: Time deposits $100 and over 144,802 100,493 Interest-bearing transaction, savings and time deposits $100 and less 538,385 445,725 Total deposits 813,705 659,537 Short-term borrowings 46,109 45,143 Long-term borrowings 223,144 223,297 Subordinated debentures 5,155 5,155 Accounts payable and accrued liabilities 5,626 8,448 Total liabilities 1,093,739 941,580 Stockholders’ Equity: Preferred Stock, $1,000 liquidation value per share: Authorized 5,000,000 shares; issued 10,000 shares in 2009 and none in 2008 9,619 — Common stock, no par value: Authorized 20,000,000 shares; issued 16,762,412 shares in 2009 and 15,190,984 in 2008; outstanding 14,572,029 shares in 2009 and 12,991,312 in 2008 97,908 86,908 Additional paid-in capital 5,650 5,204 Retained earnings 17,068 16,309 Treasury stock, at cost (2,190,383 in 2009 and 2,199,672 shares in 2008) (17,720 ) (17,796 ) Accumulated other comprehensive loss (10,776 ) (8,912 ) Total stockholders’ equity 101,749 81,713 Total liabilities and stockholders’ equity $ 1,195,488 $ 1,023,293 See the accompanying notes to the consolidated financial statements. CENTER BANCORP, INC. AND SUBSIDIARIES![]()
![]()
![]()
![]()
Years Ended December 31,200920082007(Dollars in Thousands, Except per Share Data)Interest income:Interest and fees on loans$36,751$36,110$33,527Interest and dividends on investment securities:Taxable interest income12,72710,35313,585Non-taxable interest income9892,5473,171Dividends6437711,242Interest on federal funds sold and securities purchased under agreements to resell—113604Total interest income51,11049,89452,129Interest expense:Interest on certificates of deposit $100 and over3,5512,4113,964Interest on other deposits8,75710,87616,871Interest on short-term borrowings4491,2951,948Interest on long-term borrowings9,8889,5137,847Total interest expense22,64524,09530,630Net interest income28,46525,79921,499Provision for loan losses3,2611,561350Net interest income, after provision for loan losses25,20424,23821,149Other income:Service charges, commissions and fees1,8352,0151,824Annuity and insurance126112298Bank-owned life insurance1,1561,203893Other298420457Total other-than-temporary impairment losses(9,066) (1,761) —Less: Portion of loss recognized in other comprehensive income (before taxes)4,828——Net other-than-temporary impairment losses(4,238) (1,761) —Net gains on sale on investment securities4,729655900Net investment securities gains (losses)491(1,106) 900Total other income3,9062,6444,372Other expense:Salaries and employee benefits9,9158,50511,436Occupancy, net2,5363,2792,843Premises and equipment1,2631,4361,777FDIC Insurance2,05521786Professional and consulting8117032,139Stationery and printing339397465Marketing and advertising366637603Computer expense964834614OREO expense, net1,43831110Other3,3703,4344,525Total other expense23,05719,47324,598Income before income tax expense (benefit)6,0537,409923Income tax expense (benefit)1,4801,567(2,933) Net income4,5735,8423,856Preferred stock dividends and accretion567——Net income available to common stockholders$4,006$5,842$3,856Earnings per common share:Basic$0.30$0.45$0.28Diluted$0.30$0.45$0.28Weighted average common shares outstanding:Basic13,382,61413,048,51813,780,504Diluted13,385,41613,061,41013,840,756
Years Ended December 31, 2009(Restated) 2008 2007 Interest income: Interest and fees on loans $ 36,751 $ 36,110 $ 33,527 Interest and dividends on investment securities: Taxable interest income 12,727 10,353 13,585 Non-taxable interest income 989 2,547 3,171 Dividends 643 771 1,242 Interest on federal funds sold and securities purchased under agreements to resell — 113 604 Total interest income 51,110 49,894 52,129 Interest expense: Interest on certificates of deposit $100 and over 3,551 2,411 3,964 Interest on other deposits 8,757 10,876 16,871 Interest on short-term borrowings 449 1,295 1,948 Interest on long-term borrowings 9,888 9,513 7,847 Total interest expense 22,645 24,095 30,630 Net interest income 28,465 25,799 21,499 Provision for loan losses 4,597 1,561 350 Net interest income, after provision for loan losses 23,868 24,238 21,149 Other income: Service charges, commissions and fees 1,835 2,015 1,824 Annuity and insurance 126 112 298 Bank-owned life insurance 1,156 1,203 893 Other 298 420 457 Total other-than-temporary impairment losses (9,066 ) (1,761 ) — Less: Portion of loss recognized in other comprehensive income (before taxes) 4,828 — — Net other-than-temporary impairment losses (4,238 ) (1,761 ) — Net gains on sale on investment securities 4,729 655 900 Net investment securities gains (losses) 491 (1,106 ) 900 Total other income 3,906 2,644 4,372 Other expense: Salaries and employee benefits 9,915 8,505 11,436 Occupancy, net 2,536 3,279 2,843 Premises and equipment 1,263 1,436 1,777 FDIC Insurance 2,055 217 86 Professional and consulting 811 703 2,139 Stationery and printing 339 397 465 Marketing and advertising 366 637 603 Computer expense 964 834 614 OREO expense, net 1,438 31 110 Other 3,370 3,434 4,525 Total other expense 23,057 19,473 24,598 Income before income tax expense (benefit) 4,717 7,409 923 Income tax expense (benefit) 946 1,567 (2,933 ) Net income 3,771 5,842 3,856 Preferred stock dividends and accretion 567 — — Net income available to common stockholders $ 3,204 $ 5,842 $ 3,856 Earnings per common share: Basic $ 0.24 $ 0.45 $ 0.28 Diluted $ 0.24 $ 0.45 $ 0.28 Weighted average common shares outstanding: Basic 13,382,614 13,048,518 13,780,504 Diluted 13,385,416 13,061,410 13,840,756 See the accompanying notes to the consolidated financial statements. CENTER BANCORP, INC. AND SUBSIDIARIES![]()
![]()
![]()
![]()
![]()
![]()
![]()
![]()
![]()
![]()
![]()
![]()
![]()
![]()
![]()
![]()
Years Ended December 31, 2009, 2008 and 2007 Preferred
Stock Common
Stock Additional
Paid In
Capital Retained
Earnings Treasury
Stock Accumulated
Other
Comprehensive
Loss Total
Stockholders’
Equity (In Thousands, Except Share and per Share Data) Balance, December 31, 2006 $ — $ 77,130 $ 4,535 $ 25,989 $ (6,631 ) $ (3,410 ) $ 97,613 Comprehensive income: Net income 3,856 �� 3,856 Other comprehensive loss, net of taxes (2,414 ) (2,414 ) Total comprehensive income 1,442 Cash dividends declared on common stock ($0.36 per share) (4,885 ) (4,885 ) 5 percent stock dividend 9,778 (9,778 ) — Issuance cost of common stock (21 ) (21 ) Exercise of stock options (95,861 shares) 292 558 850 Stock-based compensation expense 151 151 Tax benefit related to stock-based compensation 155 155 Treasury stock purchased (850,527 shares) (10,027 ) (10,027 ) Balance, December 31, 2007 $ — $ 86,908 $ 5,133 $ 15,161 $ (16,100 ) $ (5,824 ) $ 85,278 Comprehensive income: Net income 5,842 5,842 Other comprehensive loss, net of taxes (3,088 ) (3,088 ) Total comprehensive income 2,754 Cash dividends declared on common stock of ($0.36 per share) (4,675 ) (4,675 ) Issuance cost of common stock (19 ) (19 ) Restricted stock award (3,028 shares) 25 25 Exercise of stock options (25,583 shares) 21 203 224 Stock-based compensation expense 128 128 Taxes related to stock-based compensation (78 ) (78 ) Treasury stock purchased (193,083 shares) (1,924 ) (1,924 ) Balance, December 31, 2008 $ — $ 86,908 $ 5,204 $ 16,309 $ (17,796 ) $ (8,912 ) $ 81,713 Comprehensive income: Net income 4,573 4,573 Other comprehensive loss, net of taxes (1,864 ) (1,864 ) Total comprehensive income 2,709 Issuance of preferred stock (10,000 shares) and warrants (86,705 shares) 9,539 461 10,000 Accretion of discount on preferred stock 80 (80 ) — Dividends on preferred stock (487 ) (487 ) Proceeds from rights offering (1,571,428 shares) 11,000 11,000 Cash dividends declared on common stock ($0.18 per share) (2,434 ) (2,434 ) Issuance cost of common stock (11 ) (11 ) Exercise of stock options (9,289 shares) (19 ) 76 57 Stock-based compensation expense 77 77 Taxes related to stock-based compensation (73 ) (73 ) Balance, December 31, 2009 $ 9,619 $ 97,908 $ 5,650 $ 17,870 $ (17,720 ) $ (10,776 ) $ 102,551
Years Ended December 31, 2009, 2008 and 2007 PreferredStock CommonStock AdditionalPaid InCapital RetainedEarnings TreasuryStock AccumulatedOtherComprehensiveLoss TotalStockholders’Equity (In Thousands, Except Share and per Share Data) Balance, December 31, 2006 $ — $ 77,130 $ 4,535 $ 25,989 $ (6,631 ) $ (3,410 ) $ 97,613 Comprehensive income: Net income 3,856 3,856 Other comprehensive loss, net of taxes (2,414 ) (2,414 ) Total comprehensive income 1,442 Cash dividends declared on common stock ($0.36 per share) (4,885 ) (4,885 ) 5 percent stock dividend 9,778 (9,778 ) — Issuance cost of common stock (21 ) (21 ) Exercise of stock options (95,861 shares) 292 558 850 Stock-based compensation expense 151 151 Tax benefit related to stock-based compensation 155 155 Treasury stock purchased (850,527 shares) (10,027 ) (10,027 ) Balance, December 31, 2007 $ — $ 86,908 $ 5,133 $ 15,161 $ (16,100 ) $ (5,824 ) $ 85,278 Comprehensive income: Net income 5,842 5,842 Other comprehensive loss, net of taxes (3,088 ) (3,088 ) Total comprehensive income 2,754 Cash dividends declared on common stock of ($0.36 per share) (4,675 ) (4,675 ) Issuance cost of common stock (19 ) (19 ) Restricted stock award (3,028 shares) 25 25 Exercise of stock options (25,583 shares) 21 203 224 Stock-based compensation expense 128 128 Taxes related to stock-based compensation (78 ) (78 ) Treasury stock purchased (193,083 shares) (1,924 ) (1,924 ) Balance, December 31, 2008 $ — $ 86,908 $ 5,204 $ 16,309 $ (17,796 ) $ (8,912 ) $ 81,713 Comprehensive income: Net income 3,771 3,771 Other comprehensive loss, net of taxes (1,864 ) (1,864 ) Total comprehensive income 1,907 Issuance of preferred stock (10,000 shares) and warrants (86,705 shares) 9,539 461 10,000 Accretion of discount on preferred stock 80 (80 ) — Dividends on preferred stock (487 ) (487 ) Proceeds from rights offering (1,571,428 shares) 11,000 11,000 Cash dividends declared on common stock ($0.18 per share) (2,434 ) (2,434 ) Issuance cost of common stock (11 ) (11 ) Exercise of stock options (9,289 shares) (19 ) 76 57 Stock-based compensation expense 77 77 Taxes related to stock-based compensation (73 ) (73 ) Balance, December 31, 2009 (Restated) $ 9,619 $ 97,908 $ 5,650 $ 17,068 $ (17,720 ) $ (10,776 ) $ 101,749 See the accompanying notes to the consolidated financial statements. CENTER BANCORP, INC. AND SUBSIDIARIES![]()
![]()
![]()
![]()
Years Ended December 31, 2009 2008 2007 (Dollars in Thousands) Cash flows from operating activities: Net income $ 4,573 $ 5,842 $ 3,856 Adjustments to Reconcile Net Income to Net Cash (Used In) Provided by Operating Activities: Depreciation and amortization 1,451 1,832 1,700 Provision for loan losses 3,261 1,561 350 Provision (benefit) for deferred taxes 1,353 1,221 (4,939 ) Stock-based compensation expense 77 128 151 Proceeds from restricted stock — 25 — Net other-than-temporary impairment losses 4,238 1,761 — Net gains on available-for-sale securities (4,729 ) (655 ) (312 ) Net gains on sale of held-to-maturity securities — — (588 ) Net loss on premises and equipment — 51 — Net loss on OREO 905 26 Life insurance death benefit (136 ) (230 ) — Increase in cash surrender value of bank owned life insurance (1,020 ) (973 ) (893 ) Net amortization of securities 793 90 162 Decrease in accrued interest receivable 121 381 397 Increase in other assets (7,319 ) (7,332 ) (2,055 ) Increase (decrease) in other liabilities 54 (4,432 ) 4,057 Net cash (used in) provided by operating activities 3,622 (704 ) 1,886 Cash flows from investing activities: Proceeds from maturities of investment securities available-for-sale 58,206 52,702 186,371 Proceeds from maturities, calls and paydowns of securities held to maturity — — 9,206 Net purchases of restricted investment in bank stock (442 ) (1,763 ) (662 ) Proceeds from sales of investment securities available-for-sale 665,828 330,808 56,331 Proceeds from sales of investment securities held to maturity — — 10,312 Purchase of securities available-for-sale (785,044 ) (315,899 ) (204,238 ) Purchase of securities held to maturity — — (2,000 ) Net increase in loans (40,490 ) (125,004 ) (1,402 ) Purchases of premises and equipment (742 ) (2,882 ) (182 ) Purchase of bank-owned life insurance (2,475 ) — — Proceeds from life insurance death benefits 266 526 — Capital expenditure addition to OREO (476 ) — — Proceeds from sale of premises and equipment 1 24 — Proceeds from sale of branch facility — 2,414 — Proceeds from sale of OREO 3,520 452 — Net cash (used in) provided by investing activities (101,848 ) (58,622 ) 53,736
Years Ended December 31, 2009 (Restated) 2008 2007 (Dollars in Thousands) Cash flows from operating activities: Net income $ 3,771 $ 5,842 $ 3,856 Adjustments to reconcile net income to net cash (provided by) used in operating activities: Depreciation and amortization 1,451 1,832 1,700 Provision for loan losses 4,597 1,561 350 Provision (benefit) for deferred taxes 819 1,221 (4,939 ) Stock-based compensation expense 77 128 151 Proceeds from restricted stock — 25 — Net other-than-temporary impairment losses 4,238 1,761 — Net gains on available-for-sale securities (4,729 ) (655 ) (312 ) Net gains on sale of held-to-maturity securities — — (588 ) Net loss on premises and equipment — 51 — Net loss on OREO 905 26 Life insurance death benefit (136 ) (230 ) — Increase in cash surrender value of bank-owned life insurance (1,020 ) (973 ) (893 ) Net amortization of securities 793 90 162 Decrease in accrued interest receivable 121 381 397 Increase in other assets (1,732 ) (7,332 ) (2,055 ) (Decrease) increase in other liabilities (480) (4,432 ) 4,057 Net cash provided by (used in) operating activities 8,675 (704 ) 1,886 Cash flows from investing activities: Proceeds from maturities of investment securities available-for-sale 58,206 52,702 186,371 Proceeds from maturities, calls and paydowns of securities held to maturity — — 9,206 Net purchases of restricted investment in bank stock (442 ) (1,763 ) (662 ) Proceeds from sales of investment securities available-for-sale 665,828 330,808 56,331 Proceeds from sales of investment securities held to maturity — — 10,312 Purchase of securities available-for-sale (785,044 ) (315,899 ) (204,238 ) Purchase of securities held to maturity — — (2,000 ) Net increase in loans (45,543 ) (125,004 ) (1,402 ) Purchases of premises and equipment (742 ) (2,882 ) (182 ) Purchase of bank-owned life insurance (2,475 ) — — Proceeds from life insurance death benefits 266 526 — Capital expenditure addition to OREO (476 ) — — Proceeds from sale of premises and equipment 1 24 — Proceeds from sale of branch facility — 2,414 — Proceeds from sale of OREO 3,520 452 — Net cash (used in) provided by investing activities (106,901 ) (58,622 ) 53,736 See the accompanying notes to the consolidated financial statements. CENTER BANCORP, INC. AND SUBSIDIARIESCONSOLIDATED STATEMENTS OF CASH FLOWS – (continued)![]()
![]()
![]()
![]()
Years Ended December 31, 2009 2008 2007 (Dollars in Thousands) Cash flows from financing activities: Net increase (decrease) in deposits 154,168 (39,533 ) (27,701 ) Net increase (decrease) in short-term borrowings 966 (4,521 ) (8,325 ) Proceeds from long-term borrowings — 55,000 55,000 Payments on long-term borrowings (153 ) (148 ) (35,000 ) Cash dividends on common stock (3,166 ) (4,675 ) (4,885 ) Cash dividends on preferred stock (425 ) — — Issuance cost of common stock (11 ) (19 ) (21 ) Proceeds from issuance of preferred stock and warrants 10,000 — — Proceeds from issuance of shares from rights offering 11,000 — — Tax (expense) benefit from stock based compensation (73 ) (78 ) 155 Proceeds from exercise of stock options 57 224 850 Purchase of treasury stock — (1,924 ) (10,027 ) Net cash provided by (used in) financing activities 172,363 4,326 (29,954 ) Net (decrease) increase in cash and cash equivalents 74,137 (55,000 ) 25,668 Cash and cash equivalents at beginning of year 15,031 70,031 44,363 Cash and cash equivalents at end of year $ 89,168 $ 15,031 $ 70,031 Supplemental disclosures of cash flow information: Noncash activities: Trade date accounting settlement for investments $ 1,979 $ 3,514 $ — Transfer of loans to real estate owned — 3,949 — Transfer of loan participation to other receivables 5,054 — — Reclassification of held-to-maturity investment securities to available-for-sale — — 113,413 Reclassification of office building from premises to other assets — — 2,398 Cash paid during year for: Interest paid on deposits and borrowings $ 23,021 $ 23,615 $ 30,726 Income taxes 344 2,370 515
Years Ended December 31, 2009(Restated) 2008 2007 Cash flows from financing activities: Net increase (decrease) in deposits 154,168 (39,533 ) (27,701 ) Net increase (decrease) in short-term borrowings 966 (4,521 ) (8,325 ) Proceeds from long-term borrowings — 55,000 55,000 Payments on long-term borrowings (153 ) (148 ) (35,000 ) Cash dividends on common stock (3,166 ) (4,675 ) (4,885 ) Cash dividends on preferred stock (425 ) — — Issuance cost of common stock (11 ) (19 ) (21 ) Proceeds from issuance of preferred stock and warrants 10,000 — — Proceeds from issuance of shares from rights offering 11,000 — — Tax (expense) benefit from stock based compensation (73 ) (78 ) 155 Proceeds from exercise of stock options 57 224 850 Purchase of treasury stock — (1,924 ) (10,027 ) Net cash provided by (used in) financing activities 172,363 4,326 (29,954 ) Net increase (decrease) in cash and cash equivalents 74,137 (55,000 ) 25,668 Cash and cash equivalents at beginning of year 15,031 70,031 44,363 Cash and cash equivalents at end of year $ 89,168 $ 15,031 $ 70,031 Supplemental disclosures of cash flow information: Noncash activities: Trade date accounting settlement for investments $ 1,979 $ 3,514 $ — Transfer of loans to other real estate owned — 3,949 — Reclassification of held-to-maturity investment securities to available-for-sale — — 113,413 Reclassification of office building from premises to other assets — — 2,398 Cash paid during year for: Interest paid on deposits and borrowings $ 23,021 $ 23,615 $ 30,726 Income taxes 344 2,370 515 See the accompanying notes to the consolidated financial statements. CENTER BANCORP, INC. AND SUBSIDIARIES
Principles of ConsolidationThe consolidated financial statements of Center Bancorp, Inc. (the “Parent Corporation”) are prepared on the accrual basis and include the accounts of the Parent Corporation and its wholly owned subsidiary, Union Center National Bank (the “Bank” and collectively with the Parent Corporation and the Parent Corporation’s other direct and indirect subsidiaries, the “Corporation”). All significant inter-company accounts and transactions have been eliminated from the accompanying consolidated financial statements.BusinessThe Parent Corporation is a bank holding company whose principal activity is the ownership and management of Union Center National Bank as mentioned above. The Bank provides a full range of banking services to individual and corporate customers through branch locations in Union and Morris counties, New Jersey. Additionally, the Bank originates residential mortgage loans and services such loans for others. The Bank is subject to competition from other financial institutions and the regulations of certain federal and state agencies and undergoes periodic examinations by those regulatory authorities.Basis of Financial Statement PresentationThe consolidated financial statements have been prepared in conformity with U.S. generally accepted accounting principles.Use of EstimatesIn preparing the consolidated financial statements, management is required to make estimates and assumptions that affect the reported amounts of assets and liabilities as of the date of the statement of condition and revenues and expenses for the reported periods. Actual results could differ significantly from those estimates. Material estimates that are particularly susceptible to significant change in the near term relate to the determination of the allowance for loan losses, other-than-temporary impairment evaluation of securities, the evaluation of the impairment of goodwill and the valuation of deferred tax assets.Cash and Due From BanksCash and Due From Banks includes cash on hand and balances due from correspondent banks including the Federal Reserve Bank.Investment SecuritiesThe Corporation accounts for its investment securities in accordance with Financial Accounting Standards Board (“FASB”) Accounting Standards Codification (“ASC”) 320-10-05 (previously SFAS No. 115, “Accounting for Certain Investment in Debt and Equity Securities”). Investments are classified into the following categories: (1) held to maturity securities, for which the Corporation has both the positive intent and ability to hold until maturity, which are reported at amortized cost; (2) trading securities, which are purchased and held principally for the purpose of selling in the near term and are reported at fair value with unrealized gains and losses included in earnings; and (3) available-for-sale securities, which do not meet the criteria of the other two categories and which management believes may be sold prior to maturity due to changes in interest rates, prepayment, risk, liquidity or other factors, and are reported at fair value, with unrealized gains and losses, net of applicable income taxes, reported as a component of accumulated other comprehensive income, which is included in stockholders’ equity and excluded from earnings.Investment securities are adjusted for amortization of premiums and accretion of discounts, which are recognized on a level yield method, as adjustments to interest income. Investment securities gains or losses are determined using the specific identification method. CENTER BANCORP, INC. AND SUBSIDIARIESNOTES TO CONSOLIDATED FINANCIAL STATEMENTSNote 1 — Summary of Significant Accounting Policies – (continued)During the fourth quarter of 2007, the Corporation reclassified all of its held-to-maturity investment securities to available-for-sale. The transfer of these securities to available-for-sale allowed the Corporation greater flexibility in managing its investment portfolio. Investment securities with a total of $113.4 million and a fair value of $112.9 million were transferred to available-for-sale during the fourth quarter of 2007. The unrealized loss on these securities was recorded, net of tax, as accumulated other comprehensive income, an adjustment to stockholders’ equity.Securities are evaluated on at least a quarterly basis, and more frequently when market conditions warrant such an evaluation, to determine whether a decline in their value is other-than-temporary. In April 2009, the FASB issued FASB ASC 320-10-65 (previously SFAS No. 115-2 and SFAS No. 124-2, “Recognition and Presentation of Other-Than-Temporary Investments”), which was adopted as of June 30, 2009. The accounting standard clarifies the interaction of the factors that should be considered when determining whether a debt security is other–than-temporarily impaired. For debt securities, management must assess whether (a) it has the intent to sell the security and (b) it is more likely than not that it will be required to sell the security prior to its anticipated recovery. These steps are done before assessing whether the entity will recover the cost basis of the investment. Prior to the June 30, 2009 adoption, this assessment required management to assert it has both the intent and the ability to hold a security for a period of time sufficient to allow for anticipated recovery in fair value to avoid recognizing an other-than-temporary impairment. This change does not affect the need to forecast recovery of the value of the security through either cash flows or market price.In instances when a determination is made that an other-than-temporary impairment exists but the investor does not intend to sell the debt security and it is not more likely than not that it will be required to sell the debt security prior to its anticipated recovery, FASB ASC 320-10-65 changes the presentation and amount of the other-than-temporary impairment recognized in the income statement. The other-than-temporary impairment is separated into (a) the amount of the total other-than-temporary impairment related to a decrease in cash flows expected to be collected from the debt security (the credit loss) and (b) the amount of the total other-than-temporary impairment related to all other factors. The amount of the total other-than-temporary impairment related to the credit loss is recognized through earnings. The amount of the total other-than-temporary impairment related to all other factors is recognized through other comprehensive income. Impairment charges on certain investment securities of approximately $4.2 million and $1.8 million were recognized in earnings during the years ended December 31, 2009 and 2008, respectively. No impairment charges were recognized during the year ended December 31, 2007.Loans Held for SaleMortgage loans originated and intended for sale in the secondary market are carried at the lower of costs or estimated fair value or fair value under the fair value option accounting guidance for financial instruments. For loans carried at the lower of cost or estimated fair value, gains and losses on loan sales (sale proceeds minus carrying value) are recorded in other income and direct loan origination costs and fees are deferred at origination of the loan and are recognized in other income upon sale of the loan. At December 31, 2009 and 2008, the Corporation held no loans for sale.LoansLoans are stated at their principal amounts less net deferred loan origination fees. Interest income is credited as earned except when a loan becomes past due 90 days or more and doubt exists as to the ultimate collection of interest or principal; in those cases the recognition of income is discontinued. Loans that are past due 90 days or more that are both well secured and in the process of collection will remain on an accruing basis. When a loan is placed on non-accrual status, interest accruals cease and uncollected accrued interest is reversed and charged against current income. CENTER BANCORP, INC. AND SUBSIDIARIESNOTES TO CONSOLIDATED FINANCIAL STATEMENTSNote 1 — Summary of Significant Accounting Policies – (continued)Payments received on non-accrual loans are applied against principal. A loan may only be restored to an accruing basis when it again becomes well secured and in the process of collection or all past due amounts have been collected. Loan origination fees and certain direct loan origination costs are deferred and recognized over the life of the loan as an adjustment to the loan’s yield using the level yield method.Allowance for Loan LossesThe allowance for loan losses (“allowance”) is maintained at a level determined adequate to provide for probable loan losses. The allowance is increased by provisions charged to operations and reduced by loan charge-offs, net of recoveries. The allowance is based on management’s evaluation of the loan portfolio considering economic conditions, the volume and nature of the loan portfolio, historical loan loss experience and individual credit situations.Material estimates that are particularly susceptible to significant change in the near-term relate to the determination of the allowance for loan losses. In connection with the determination of the allowance for loan losses, management obtains independent appraisals for significant properties.The ultimate collectability of a substantial portion of the Bank’s loan portfolio is susceptible to changes in the real estate market and economic conditions in the State of New Jersey and the impact of such conditions on the creditworthiness of the borrowers.Management believes that the allowance for loan losses is adequate. While management uses available information to recognize loan losses, future additions to the allowance may be necessary based on changes in economic conditions. In addition, various regulatory agencies, as an integral part of their examination process, periodically review the Bank’s allowance for loan losses. Such agencies may require the Bank to recognize additions to the allowance based on their judgments about information available to them at the time of their examinations.The Corporation accounts for impaired loans in accordance with FASB ASC 310-10-35 (previously SFAS No. 114, “Accounting by Creditors for Impairment of a Loan” as amended by SFAS No. 118, “Accounting by Creditors for Impairment of a Loan — Income Recognition and Disclosures”). The value of impaired loans is based on the present value of expected future cash flows discounted at the loan’s effective interest rate or, as a practical expedient, at the loan’s observable market price or at the fair value of the collateral if the loan is collateral dependent.The Corporation has defined its population of impaired loans to include all non-accrual and troubled debt restructuring loans. As part of the evaluation, the Corporation reviews for impairment all non-homogeneous loans internally classified as substandard or below, in each instance above an established dollar threshold of $200,000, as well as all non-homogeneous loans greater than $1.0 million. Smaller impaired non-homogeneous loans and impaired homogeneous loans are not measured for specific reserves and are covered under the Corporation’s general reserve.Reserve for Unfunded CommitmentsThe reserve for unfunded commitments is maintained at a level believed by management to be sufficient to absorb estimated probable losses related to unfunded credit facilities and is included in other liabilities in the consolidated statements of condition. The determination of the adequacy of the reserve is based upon an evaluation of the unfunded credit facilities, including an assessment of historical commitment utilization experience, and credit risk. Net adjustments to the reserve for unfunded commitments are included in other expense.Premises and EquipmentLand is carried at cost and bank premises and equipment at cost less accumulated depreciation based on estimated useful lives of assets, computed principally on a straight-line basis. Expenditures for maintenance and repairs are charged to operations as incurred; major renewals and betterments are capitalized. Gains and CENTER BANCORP, INC. AND SUBSIDIARIESNOTES TO CONSOLIDATED FINANCIAL STATEMENTSNote 1 — Summary of Significant Accounting Policies – (continued)losses on sales or other dispositions are recorded as a component of other income or other expenses. In September 2007, the Corporation reclassified its Florham Park office building from premises to held for sale,held-for-sale, which was included in other assets, and entered into a contract to sell that property. On February 29, 2008, the Corporation completed the sale of the property for $2.4 million, which approximated the carrying value.Other Real Estate OwnedOther real estate owned (“OREO”), representing property acquired through foreclosure and held for sale, are initially recorded at fair value less cost to sell at the date of foreclosure, establishing a new cost basis. Subsequently, valuations are periodically performed by management and the assets are carried at the lower of carrying amount or fair value less cost to sell. Costs relating to holding the assets are charged to expenses.During the third quarter of 2009, the Corporation sold the residential condominium project in Union County, New Jersey, which was carried as OREO. At December 31, 2009, the Corporation had no OREO. The decrease from December 31, 2008 represented a writedownwrite down of $926,000 of the carrying value and subsequent sale of the project in the third quarter of 2009.Mortgage ServicingThe Corporation performs various servicing functions on loans owned by others. A fee, usually based on a percentage of the outstanding principal balance of the loan, is received for those services. At December 31, 2009 and 2008, the Corporation was servicing approximately $7.6 million and $10.0 million, respectively, of loans for others.The Corporation accounts for its servicing of financial assets in accordance with FASB ASC 860-50. The Corporation originates mortgages under plans to sell those loans and service the loans owned by the investor. The Corporation records mortgage servicing rights and the loans based on relative fair values at the date of sale. The balance of mortgage servicing rights at December 31, 2009 and 2008 are immaterial to the Corporation’s consolidated financial statements.Employee Benefit PlansThe Corporation has a non-contributory pension plan covering all eligible employees up until September 30, 2007, at which time the Corporation froze its defined benefit pension plan. As such, all future benefit accruals in this pension plan were discontinued and all retirement benefits that employees would have earned as of September 30, 2007 were preserved. The Corporation’s policy is to fund at least the minimum contribution required by the Employee Retirement Income Security Act of 1974. The costs associated with the plan are accrued based on actuarial assumptions and included in other expense.The Corporation accounts for its defined benefit pension plan in accordance with FASB ASC 715-30. FASB ASC 715-30 requires that the funded status of defined benefit postretirement plans be recognized on the Corporation’s statement of condition and changes in the funded status be reflected in other comprehensive income. FASB ASC 715-30 also requires companies to measure the funded status of the plan as of the date of its fiscal year-end, effective for fiscal years ended after December 15, 2008. Early adoption was encouraged. The Corporation had early adopted this statement and the adoption did not have a material effect on the Corporation’s consolidated financial statements.Stock-Based CompensationStock compensation accounting guidance (FASB ASC 718, “Compensation-Stock Compensation”) requires that the compensation cost related to share-based payment transactions be recognized in financial statements. That cost will be measured based on the grant date fair value of the equity or liability instruments issued. The stock compensation accounting guidance covers a wide range of share-based compensation arrangements including stock options, restricted share plans, performance-based awards, share appreciation rights and employee share purchase plans. CENTER BANCORP, INC. AND SUBSIDIARIESNOTES TO CONSOLIDATED FINANCIAL STATEMENTSNote 1 — Summary of Significant Accounting Policies – (continued)Stock compensation accounting guidance requires that compensation cost for all stock awards be calculated and recognized over the employees’ service period, generally defined as the vesting period. For awards with graded-vesting, compensation cost is recognized on a straight-line basis over the requisite service period for the entire award. A Black-Scholes model is used to estimate the fair value of stock options while the market price of the Corporation’s common stock at the date of grant is used for restricted stock awards. See Note 16 of the Notes to Consolidated Financial Statements for a further discussion.Earnings per ShareBasic Earnings per Share (“EPS”) is computed by dividing income available to common shareholders by the weighted-average number of common shares outstanding. Diluted EPS includes any additional common shares as if all potentially dilutive common shares were issued (e.g. stock options). The Corporation’s weighted average common shares outstanding for diluted EPS include the effect of stock options outstanding using the Treasury Stock Method, which are not included in the calculation of basic EPS.Earnings per common share have been computed based on the following:![]()
![]()
![]()
![]()
Years Ended December 31, 2009 2008 2007 (In Thousands, Except per Share Amounts) Net income $ 4,573 $ 5,842 $ 3,856 Preferred stock dividends and accretion 567 — — Net income available to common stockholders $ 4,006 $ 5,842 $ 3,856 Average number of common shares outstanding 13,382 13,049 13,781 Effect of dilutive options 3 12 60 Average number of common shares outstanding used to calculate diluted earnings per common share 13,385 13,061 13,841 Earnings per common share: Basic $ 0.30 $ 0.45 $ 0.28 Diluted $ 0.30 $ 0.45 $ 0.28 Years Ended December 31, 2009(Restated) 2008 2007 (In Thousands, Except per Share Amounts) Net income $ 3,771 $ 5,842 $ 3,856 Preferred stock dividends and accretion 567 — — Net income available to common stockholders $ 3,204 $ 5,842 $ 3,856 Average number of common shares outstanding 13,382 13,049 13,781 Effect of dilutive options 3 12 60 Average number of common shares outstanding used to calculate diluted earnings per common share 13,385 13,061 13,841 Earnings per common share: Basic $ 0.24 $ 0.45 $ 0.28 Diluted $ 0.24 $ 0.45 $ 0.28 Treasury StockThe Corporation announced on March 27, 2006 that its Board of Directors approved an increase in its then current share buyback program to 5 percent of outstanding shares, enhancing its then current authorization by 425,825 shares to 684,965 shares. The Corporation announced on October 1, 2007 that its Board of Directors approved an additional increase in its current share buyback program to 5 percent of outstanding shares, enhancing its current authorization by 684,627 shares. On June 26, 2008, the Corporation announced that its Board of Directors approved an additional buyback of 649,712 shares. The total buyback authorization has been increased to 2,039,731 shares. Subject to limitations applicable to the Corporation, purchases may be made from time to time as, in the opinion of management, market conditions warrant, in the open market or in privately negotiated transactions. Shares repurchased will be added to the corporate treasury and will be used for future stock dividends and other issuances. As of December 31, 2009, Center Bancorp had 14.6 million shares of common stock outstanding. As of December 31, 2009, the Corporation had purchased 1,386,863 common shares at an average cost per share of $11.44 under the stock buyback program as amended on October 1, 2007 and June 26, 2008. The repurchased shares were recorded as Treasury Stock, which resulted in a decrease in stockholders’ equity. Treasury stock is recorded using the cost method and accordingly is presented as a reduction of stockholders’ equity. For the year ended December 31, 2009, the Corporation did not purchase any of its shares. CENTER BANCORP, INC. AND SUBSIDIARIESNOTES TO CONSOLIDATED FINANCIAL STATEMENTSNote 1 — Summary of Significant Accounting Policies – (continued)GoodwillThe Corporation adopted the provisions of FASB ASC 350-10 (previously SFAS No. 142, “Goodwill and Other Intangible Assets”), which requires that goodwill to be tested for impairment annually, or more frequently if impairment indicators arise for impairment. No impairment charge was deemed necessary for the years ended December 31, 2009, 2008 and 2007.Comprehensive IncomeTotal comprehensive income includes all changes in equity during a period from transactions and other events and circumstances from non-owner sources. The Corporation’s other comprehensive income is comprised of unrealized holding gains and losses on securities available-for-sale and unrecognized actuarial gains and losses of the Corporation’s defined benefit pension plan, net of taxes.Disclosure of comprehensive income for the years ended December 31, 2009, 2008 and 2007 is presented in the Consolidated Statements of Changes in Stockholders’ Equity and presented in detail in Note 14 of the Notes to Consolidated Financial Statements.Bank-Owned Life InsuranceDuring 2001, the Corporation invested $12.5 million in Bank-Owned Life Insurance (“BOLI”) to help offset the rising cost of employee benefits, and made subsequent investments in 2004 of $2.5 million and in 2006 of $2.0 million. During 2009, the Corporation invested $2.5 million in additional BOLI policies. The change in the cash surrender value of the BOLI was recorded as a component of other income and amounted to $1,020,000, $973,000 and $893,000 in 2009, 2008 and 2007, respectively. During 2009 and 2008, the Corporation recognized $136,000 and $230,000, respectively, in tax-free proceeds in excess of contract value on its BOLI due to the death of insured participants.Income TaxesThe Corporation recognizes deferred tax assets and liabilities for the expected future tax consequences of events that have been included in the financial statements or tax returns. Under this method, deferred tax assets and liabilities are determined based on the difference between financial statement and tax bases of assets and liabilities, using enacted tax rates expected to be applied to taxable income in the years in which the differences are expected to be settled. Income tax-related interest and penalties are classified as a component of income tax expense.Advertising CostsThe Corporation recognizes its marketing and advertising cost as incurred. Advertising costs were $366,000, $637,000 and $603,000 for the years ended December 31, 2009, 2008 and 2007, respectively.ReclassificationsCertain reclassifications have been made in the consolidated financial statements for 2008 and 2007 to conform to the classifications presented in 2009. CENTER BANCORP, INC. AND SUBSIDIARIESNOTES TO CONSOLIDATED FINANCIAL STATEMENTSNote 2 — Recent Accounting PronouncementsOn June 29, 2009, the FASB issued FASB ASC 105-10-65 (previously SFAS No. 168, “Accounting Standards CodificationTMand the Hierarchy of Generally Accepted Accounting Principles — a replacement of FASB Statement No. 162”(“Codification”)). This Codification is the sole source of authoritative accounting principles recognized by the FASB to be applied by nongovernmental entities in the preparation of financial statements in conformity with U.S. GAAP. The Codification is effective for financial statements issued for interim and annual periods ending after September 15, 2009, for most entities. On the effective date, all non-SEC accounting and reporting standards will be superseded. The Corporation adopted the Codification for the quarterly period ended. September 30, 2009, as required, and there was not a material impact on the Corporation’s financial statements taken as a whole. In order to ease the transition to the Codification, the Corporation has provided the Codification cross-reference along side the references to the standards issued and adopted prior to the adoption of the Codification.In April 2009, the FASB issued three amendments to the fair value measurement, disclosure and other-than-temporary impairment standards:FASB ASC 820-10-65 (previously SFAS 157-4, “Determining Fair Value When the Volume and Level of Activity for the Asset or Liability Have Significantly Decreased and Identifying Transactions that are Not Orderly”).FASB ASC 320-10-65 (previously SFAS 115-2 and FAS 124-2, “Recognition and Presentation of Other-Than-Temporary Impairments”).FASB ASC 825-10 (previously SFAS 107 and APB 28-1, “Interim Disclosure about Fair Value of Financial Instruments”).FASB ASC 820-10-05 (previously SFAS No. 157, “Fair Value Measurements”) defines fair value as the price that would be received to sell the asset or transfer the liability in an orderly transaction (that is, not a forced liquidation or distressed sale) between market participants at the measurement date under current market conditions. FASB ASC 820-10-05 provides additional guidance on identifying circumstances when a transaction may not be considered orderly.FASB ASC 820-10-65 provides a list of factors that a reporting entity should evaluate to determine whether there has been a significant decrease in the volume and level of activity for the asset or liability in relation to normal market activity for the asset or liability. When the reporting entity concludes there has been a significant decrease in the volume and level of activity for the asset or liability, further analysis of the information from that market is needed and significant adjustments to the related prices may be necessary to estimate fair value in accordance with FASB ASC 820-10-05.FASB ASC 820-10-65 clarifies that when there has been a significant decrease in the volume and level of activity for the asset or liability, some transactions may not be orderly. In those situations, the entity must evaluate the weight of evidence to determine whether the transaction is orderly. It also provides a list of circumstances that may indicate that a transaction is not orderly. A transaction price that is not associated with an orderly transaction is given little, if any, weight when estimating fair value.FASB ASC 320-10-65 amends other-than-temporary impairment guidance for debt securities and expands disclosure requirements for other-than-temporarily impaired debt and equity securities. FASB ASC 320-10-65 requires companies to record other-than-temporary impairment charges, through earnings, if they have the intent to sell, or will more likely than not be required to sell, an impaired debt security before a recovery of its amortized cost basis. In addition, FASB ASC 320-10-65 requires companies to record other-than-temporary impairment charges through earnings for the amount of credit losses, regardless of the intent or requirement to sell. Credit loss is measured as the difference between the present value of an impaired debt security’s cash flows and its amortized cost basis. Non-credit related write-downs to fair value must be recorded as decreases to accumulated other comprehensive income as long as a company has no intent or requirement to sell an CENTER BANCORP, INC. AND SUBSIDIARIESNOTES TO CONSOLIDATED FINANCIAL STATEMENTSNote 2 — Recent Accounting Pronouncements – (continued)impaired security before a recovery of amortized cost basis. Finally, FASB 320-10-65 requires companies to record all previously recorded non-credit related other-than-temporary impairment charges for debt securities as cumulative effect adjustments to retained earnings as of the beginning of the period of adoption.FASB ASC 825-10-65 (previously SFAS No. 107-1 and APB 28-1) requires disclosures about fair value of financial instruments for interim reporting periods of publicly traded companies as well as in annual financial statements. FASB ASC 825-10 also requires those disclosures in summarized financial information at interim reporting periods.All three FASB ASC’s discussed herein include substantial additional disclosure requirements. The effective date for these new ASC’s is the same: interim and annual reporting periods ended after June 15, 2009. The Corporation adopted these ASC’s at June 30, 2009 and there was not a material impact on its consolidated financial statements.On May 28, 2009, the FASB issued FASB ASC 855-10 (previously SFAS No. 165, “Subsequent Events”). Under FASB ASC 855-10-05, companies are required to evaluate events and transactions that occur after the balance sheet date but before the date the financial statements are issued, or available to be issued in the case of non-public entities. FASB ASC 855-10-05 requires entities to recognize in the financial statements the effect of all events or transactions that provide additional evidence of conditions that existed at the balance sheet date, including the estimates inherent in the financial preparation process. Entities shall not recognize the impact of events or transactions that provide evidence about conditions that did not exist at the balance sheet date but arose after that date. FASB ASC 855-10 also requires entities to disclose the date through which subsequent events have been evaluated. FASB ASC 855-10 was effective for interim and annual reporting periods ending after June 15, 2009. The Corporation adopted the provisions of FASB ASC 855-10-05 for the quarter ended June 30, 2009. The adoption of this accounting standard had no material impact on the Corporation’s consolidated financial statements.On June 12, 2009, the FASB issued SFAS No. 166, “Accounting for Transfers of Financial Assets” (“FAS 166”), which was incorporated into ASC 860 “Transfers and Servicing”, and SFAS No.167, “Amendments to FASB Interpretation No. 46(Revised), which was incorporated into ASC 810 “Consolidation” (“FAS 167”), which change the way entities account for securitizations and special-purpose entities.FAS 166 is a revision to FASB ASC 860-10 (previously SFAS No. 140, “Accounting for Transfers and Servicing of Financial Assets and Extinguishments of Liabilities”) and will require more information about transfers of financial assets, including securitization transactions, and where companies have continuing exposure to the risks related to transferred financial assets. FAS 166 also eliminates the concept of a “qualifying special-purpose entity”, changes the requirements for derecognizing financial assets and requires additional disclosures.FAS 167 changes how a company determines when an entity that is insufficiently capitalized or is not controlled through voting (or similar rights) should be consolidated. The determination of whether a company is required to consolidate an entity is based on, among other things, an entity’s purpose and design and a company’s ability to direct the activities of the entity that most significantly impact the entity’s economic performance.Both FAS 166 and FAS 167 will be effective as of the beginning of each reporting entity’s first annual reporting period that begins after November 15, 2009, for interim periods within that first annual reporting period and for interim and annual reporting periods thereafter. Earlier application is prohibited. The recognition and measurement provisions of FAS 166 shall be applied to transfers that occur on or after the effective date. The Corporation will adopt both FAS 166 and FAS 167 on January 1, 2010, as required. The Corporation is currently assessing the impact this adoption may have on the Corporation’s consolidated financial statements. CENTER BANCORP, INC. AND SUBSIDIARIESNOTES TO CONSOLIDATED FINANCIAL STATEMENTSNote 2 — Recent Accounting Pronouncements – (continued)In November 2008, the SEC released a proposed roadmap regarding the potential use by U.S. issuers of financial statements prepared in accordance with International Financial Reporting Standards (“IFRS”). IFRS is a comprehensive series of accounting standards published by the International Accounting Standards Board. Under the proposed roadmap, the Company may be required to prepare financial statements in accordance with IFRS as early as 2014. The SEC will make a determination in 2011 regarding the mandatory adoption of IFRS. The Company is currently assessing the impact that this potential change would have on its consolidated financial statements, and it will continue to monitor the development of the potential implementation of IFRS.In December 2008, the FASB issued FASB ASC 715-20-65-2 (previously FSP FAS 132(R)-1 “Employers’ Disclosures about Postretirement Benefit Plan Assets”). This ASC amends FASB ASC 715-20-65-2 (previously SFAS 132(R), “Employers’ Disclosures about Pensions and Other Postretirement Benefits”) to provide guidance on an employer’s disclosures about plan assets of a defined benefit pension or other postretirement plan. The disclosures about plan assets required by this ASC shall be provided for fiscal years ending after December 15, 2009. The Corporation has adopted this standard and the adoption had no material impact on the Corporation’s consolidated financial statements.Note 3 — Cash and Due from BanksThe subsidiary bank, Union Center National Bank, maintained cash balances reserved to meet regulatory requirements of the Federal Reserve Board of approximately $4,050,000 and $2,900,000 at December 31, 2009 and 2008, respectively.Note 4 — Investment SecuritiesThe following tables present information related to the Corporation’s portfolio of securities available-for-sale at December 31, 2009 and 2008.![]()
![]()
![]()
![]()
![]()
![]()
December 31, 2009 Amortized
Cost Gross
Unrealized
Gains Gross Unrealized Losses Estimated
Fair Value Non-Credit
OTTI Other (Dollars in Thousands) Securities Available-for-Sale: U.S. Treasury and agency securities $ 2,089 $ — $ — $ — $ 2,089 Federal agency obligations 216,640 592 — (2,647 ) 214,585 Obligations of U.S. states and political subdivisions 19,688 77 — (484 ) 19,281 Trust preferred securities 34,404 113 (2,457 ) (5,345 ) 26,715 Other debt securities 33,317 76 (2,371 ) (1,101 ) 29,921 Equity securities 5,936 42 — (445 ) 5,533 Total $ 312,074 $ 900 $ (4,828 ) $ (10,022 ) $ 298,124 December 31, 2009 Gross Unrealized Losses AmortizedCost GrossUnrealizedGains Non-CreditOTTI Other EstimatedFair Value (Dollars in Thousands) Securities Available-for-Sale: U.S. Treasury and agency securities $ 2,089 $ — $ — $ — $ 2,089 Federal agency obligations 216,640 592 — (2,647 ) 214,585 Obligations of U.S. states and political subdivisions 19,688 77 — (484 ) 19,281 Trust preferred securities 34,404 113 (2,457 ) (5,345 ) 26,715 Other debt securities 33,317 76 (2,371 ) (1,101 ) 29,921 Equity securities 5,936 42 — (445 ) 5,533 Total $ 312,074 $ 900 $ (4,828 ) $ (10,022 ) $ 298,124 CENTER BANCORP, INC. AND SUBSIDIARIESNOTES TO CONSOLIDATED FINANCIAL STATEMENTSNote 4 — Investment Securities – (continued) December 31, 2008 AmortizedCost GrossUnrealizedGains GrossUnrealizedLosses Estimated FairValue (Dollars in Thousands) Securities Available-for-Sale: U.S. Treasury and agency securities $ 100 $ — $ — $ 100 Federal agency obligations 81,919 1,087 (209 ) 82,797 Obligations of U.S. states and political subdivisions 51,926 436 (268 ) 52,094 Trust preferred securities 39,050 — (7,279 ) 31,771 Other debt securities 63,104 82 (3,824 ) 59,362 Equity securities 17,247 — (657 ) 16,590 Total $ 253,346 $ 1,605 $ (12,237 ) $ 242,714
| Available-for-Sale | ||||||||
Amortized Cost | Estimated Fair Value | |||||||
| (Dollars in Thousands) | ||||||||
| Due in one year or less | $ | 1,852 | $ | 1,857 | ||||
| Due after one year through five years | 7,103 | 6,232 | ||||||
| Due after five years through ten years | 52,655 | 51,350 | ||||||
| Due after ten years | 244,528 | 233,153 | ||||||
| Equity securities | 5,936 | 5,532 | ||||||
| Total investment securities | $ | 312,074 | $ | 298,124 | ||||
| Years Ended December 31, | ||||||||
| 2009 | 2008 | |||||||
| (Dollars in Thousands) | ||||||||
| Equity securities | $ | 113 | $ | 461 | ||||
| Debt securities | 4,125 | 1,300 | ||||||
| Total other-than-temporary impairment charges | $ | 4,238 | $ | 1,761 | ||||
| Deal Name | Single Issuer or Pooled | Class/ Tranche | Book Value | Estimated Fair Value | Gross Unrealized Gain (Loss) | Lowest Credit Rating Assigned | Number of Banks Currently Performing | Deferrals and Defaults as % of Original Collateral | Expected Deferral/Defaults as % of Remaining Performing Collateral | ||||||||||||||||||||||||
| (Dollars in Thousands) | |||||||||||||||||||||||||||||||||
| Countrywide Capital IV | Single | — | $ | 1,769 | $ | 1,519 | $ | (250 | ) | BB | 1 | None | None | ||||||||||||||||||||
| Countrywide Capital V | Single | — | 2,747 | 2,366 | (381 | ) | BB | 1 | None | None | |||||||||||||||||||||||
| Countrywide Capital V | Single | — | 250 | 215 | (35 | ) | BB | 1 | None | None | |||||||||||||||||||||||
| NPB Capital Trust II | Single | — | 898 | 754 | (144 | ) | NR | 1 | None | None | |||||||||||||||||||||||
| Citigroup Cap IX | Single | — | 991 | 736 | (255 | ) | B+ | 1 | None | None | |||||||||||||||||||||||
| Citigroup Cap IX | Single | — | 1,901 | 1,420 | (481 | ) | B+ | 1 | None | None | |||||||||||||||||||||||
| Citigroup Cap XI | Single | — | 245 | 184 | (61 | ) | B+ | 1 | None | None | |||||||||||||||||||||||
| IBC Cap Fin II | Single | — | 667 | 333 | (334 | ) | NR | 1 | None | None | |||||||||||||||||||||||
| BFC Capital Trust | Single | — | 1,348 | 1,461 | 113 | NR | 1 | None | None | ||||||||||||||||||||||||
| BAC Capital Trust X | Single | — | 2,496 | 2,004 | (492 | ) | BB | 1 | None | None | |||||||||||||||||||||||
| Nationsbank Cap Trust III | Single | — | 1,568 | 1,095 | (473 | ) | BB | 1 | None | None | |||||||||||||||||||||||
| Bank of Florida Junior Sub Debt | Single | — | 3,000 | 2,100 | (900 | ) | NR | 1 | None | None | |||||||||||||||||||||||
| ALESCO Preferred Funding VI | Pooled | C2 | 665 | 34 | (631 | ) | Ca | 68 | 31.4 | % | 62.4 | % | |||||||||||||||||||||
| ALESCO Preferred Funding VII | Pooled | C1 | 2,041 | 215 | (1,826 | ) | Ca | 69 | 22.9 | % | 53.2 | % | |||||||||||||||||||||
| (Dollars in Thousands) | ||||
| Balance of credit-related OTTI at January 1, 2009 | $ | — | ||
| Addition: | ||||
| Credit losses for which other-than-temporary impairment was not previously recognized | 3,761 | |||
| Reduction: | ||||
| Credit losses for securities sold during the period | (140 | ) | ||
| Balance of credit-related OTTI at December 31, 2009 | $ | 3,621 | ||
| December 31, 2009 | ||||||||||||||||||||||||
| Total | Less Than 12 Months | 12 Months or Longer | ||||||||||||||||||||||
| Fair Value | Unrealized Losses | Fair Value | Unrealized Losses | Fair Value | Unrealized Losses | |||||||||||||||||||
| (Dollars in Thousands) | ||||||||||||||||||||||||
| Available-for-Sale: | ||||||||||||||||||||||||
| Federal Agency Obligations | $ | 120,504 | $ | (2,647 | ) | $ | 120,402 | $ | (2,646 | ) | $ | 102 | $ | (1 | ) | |||||||||
| Obligations of U.S. states and political subdivisions | 7,181 | (484 | ) | 6,297 | (458 | ) | 884 | (26 | ) | |||||||||||||||
| Trust preferred securities | 25,253 | (7,802 | ) | 3,717 | (1,234 | ) | 21,536 | (6,568 | ) | |||||||||||||||
| Other debt securities | 22,815 | (3,472 | ) | 11,864 | (55 | ) | 10,951 | (3,417 | ) | |||||||||||||||
| Equity securities | 1,317 | (445 | ) | — | — | 1,317 | (445 | ) | ||||||||||||||||
| Total temporarily impaired securities | $ | 177,070 | $ | (14,850 | ) | $ | 142,280 | $ | (4,393 | ) | $ | 34,790 | $ | (10,457 | ) | |||||||||
December 31, 2009 Total Less Than 12 Months 12 Months or Longer FairValue UnrealizedLosses FairValue UnrealizedLosses FairValue UnrealizedLosses (Dollars in Thousands) Available-for-Sale: Federal Agency Obligations $ 120,504 $ (2,647 ) $ 120,402 $ (2,646 ) $ 102 $ (1 ) Obligations of U.S. states and political subdivisions 7,181 (484 ) 6,297 (458 ) 884 (26 ) Trust preferred securities 25,253 (7,802 ) 3,717 (1,234 ) 21,536 (6,568 ) Other debt securities 22,815 (3,472 ) 11,864 (55 ) 10,951 (3,417 ) Equity securities 1,317 (445 ) — — 1,317 (445 ) Total temporarily impaired securities $ 177,070 $ (14,850 ) $ 142,280 $ (4,393 ) $ 34,790 $ (10,457 )
| December 31, 2008 | ||||||||||||||||||||||||
| Total | Less than 12 Months | 12 Months or Longer | ||||||||||||||||||||||
Fair Value | Unrealized Losses | Fair Value | Unrealized Losses | Fair Value | Unrealized Losses | |||||||||||||||||||
| (Dollars in Thousands) | ||||||||||||||||||||||||
| Available-for-Sale: | ||||||||||||||||||||||||
| Federal Agency Obligations | $ | 16,118 | $ | (209 | ) | $ | 2,477 | $ | (1 | ) | $ | 13,641 | $ | (208 | ) | |||||||||
| Obligations of U.S. states and political subdivisions | 9,542 | (268 | ) | 8,740 | (155 | ) | 802 | (113 | ) | |||||||||||||||
| Trust preferred securities | 28,103 | (7,279 | ) | 1,485 | (16 | ) | 26,618 | (7,263 | ) | |||||||||||||||
| Other debt securities | 48,208 | (3,824 | ) | 16,358 | (1,540 | ) | 31,850 | (2,284 | ) | |||||||||||||||
| Equity securities | 500 | (657 | ) | — | — | 500 | (657 | ) | ||||||||||||||||
| Total temporarily impaired securities | $ | 102,471 | $ | (12,237 | ) | $ | 29,060 | $ | (1,712 | ) | $ | 73,411 | $ | (10,525 | ) | |||||||||
| 2009 | 2008 | |||||||
| (Dollars in Thousands) | ||||||||
| Real estate – residential mortgage | $ | 191,199 | $ | 240,885 | ||||
| Real estate – commercial | 405,903 | 358,394 | ||||||
| Commercial and industrial | 117,912 | 75,415 | ||||||
| Installment | 439 | 1,509 | ||||||
| Total loans | $ | 715,453 | $ | 676,203 | ||||
2009 (Restated) | 2008 | |||||||
| (Dollars in Thousands) | ||||||||
| Real estate – residential mortgage | $ | 191,199 | $ | 240,885 | ||||
| Real estate – commercial | 410,056 | 358,394 | ||||||
| Commercial and industrial | 117,912 | 75,415 | ||||||
| Installment | 439 | 1,509 | ||||||
| Total loans | $ | 719,606 | $ | 676,203 | ||||
| 2009 | 2008 | 2007 | ||||||||||
| (Dollars in Thousands) | ||||||||||||
| Balance at the beginning of year | $ | 6,254 | $ | 5,163 | $ | 4,960 | ||||||
| Provision for loan losses | 3,261 | 1,561 | 350 | |||||||||
| Loans charged-off | (2,152 | ) | (499 | ) | (156 | ) | ||||||
| Recoveries on loans previously charged-off | 912 | 29 | 9 | |||||||||
| Balance at the end of year | $ | 8,275 | $ | 6,254 | $ | 5,163 | ||||||
2009 (Restated) | 2008 | 2007 | ||||||||||
| (Dollars in Thousands) | ||||||||||||
| Balance at the beginning of year | $ | 6,254 | $ | 5,163 | $ | 4,960 | ||||||
| Provision for loan losses | 4,597 | 1,561 | 350 | |||||||||
| Loans charged-off | (2,152 | ) | (499 | ) | (156 | ) | ||||||
| Recoveries on loans previously charged-off | 12 | 29 | 9 | |||||||||
| Balance at the end of year | $ | 8,711 | $ | 6,254 | $ | 5,163 | ||||||
During the fourth quarter of 2009 the Corporation took steps to terminate a participation agreement with another New Jersey bank, as the participation ended on December 31, 2009. Accordingly the Corporation reclassified the outstanding loan of $5.1 million into other assets on its balance sheet.
| Estimated Useful Life (Years) | 2009 | 2008 | ||||||||||
| (Dollars in Thousands) | ||||||||||||
| Land | $ | 3,447 | $ | 3,447 | ||||||||
| Buildings | 5 – 40 | 16,200 | 16,182 | |||||||||
| Furniture, fixtures and equipment | 2 – 20 | 16,222 | 15,933 | |||||||||
| Leasehold improvements | 5 – 30 | 1,839 | 1,735 | |||||||||
| Subtotal | 37,708 | 37,297 | ||||||||||
| Less: accumulated depreciation and amortization | 19,848 | 18,809 | ||||||||||
| Total premises and equipment, net | $ | 17,860 | $ | 18,488 | ||||||||
EstimatedUseful Life(Years) 2009 2008 (Dollars in Thousands) Land $ 3,447 $ 3,447 Buildings 5 – 40 16,200 16,182 Furniture, fixtures and equipment 2 – 20 16,222 15,933 Leasehold improvements 5 – 30 1,839 1,735 Subtotal 37,708 37,297 Less: accumulated depreciation and amortization 19,848 18,809 Total premises and equipment, net $ 17,860 $ 18,488
Gross Carrying Amount | Accumulated Amortization | Net Carrying Amount | ||||||||||
| (Dollars in Thousands) | ||||||||||||
| As of December 31, 2009: | ||||||||||||
| Core deposits | $ | 703 | $ | (479 | ) | $ | 224 | |||||
| Total intangible assets | 703 | (479 | ) | 224 | ||||||||
| As of December 31, 2008: | ||||||||||||
| Core deposits | $ | 703 | $ | (397 | ) | $ | 306 | |||||
| Total intangible assets | 703 | (397 | ) | 306 | ||||||||
| As of December 31, 2007: | ||||||||||||
| Core deposits | $ | 703 | $ | (303 | ) | $ | 400 | |||||
| Total intangible assets | $ | 703 | $ | (303 | ) | $ | 400 | |||||
| Amount | ||||
| (Dollars in Thousands) | ||||
| Due in one year or less | $ | 141,827 | ||
| Due in 2011 | 2,119 | |||
| Due in 2012 | 753 | |||
| Due in 2013 | 103 | |||
| Total certificates of deposit $100 or more | $ | 144,802 | ||
Amount (Dollars in Thousands) Due in one year or less $ 141,827 Due in 2011 2,119 Due in 2012 753 Due in 2013 103 Total certificates of deposit $100 or more $ 144,802
| 2009 | 2008 | |||||||
| (Dollars in Thousands) | ||||||||
| Securities sold under agreements to repurchase | $ | 46,109 | $ | 30,143 | ||||
| Federal funds purchased and FHLB short-term advances | — | 15,000 | ||||||
| Total short-term borrowings | $ | 46,109 | $ | 45,143 | ||||
| 2009 | 2008 | |||||||
| (Dollars in Thousands) | ||||||||
| FHLB long-term advances | $ | 170,144 | $ | 170,297 | ||||
| Securities sold under agreements to repurchase | 53,000 | 53,000 | ||||||
| Total long-term borrowings | $ | 223,144 | $ | 223,297 | ||||
| 2009 | 2008 | |||||||
| (Dollars in Thousands) | ||||||||
| 2010 | $ | 40,144 | $ | 40,297 | ||||
| 2011 | 10,000 | 10,000 | ||||||
| 2013 | 5,000 | 5,000 | ||||||
| 2016 | 20,000 | 20,000 | ||||||
| 2017 | 55,000 | 55,000 | ||||||
| 2018 | 40,000 | 40,000 | ||||||
| Total | $ | 170,144 | $ | 170,297 | ||||
2009 2008 (Dollars in Thousands) 2010 $ 40,144 $ 40,297 2011 10,000 10,000 2013 5,000 5,000 2016 20,000 20,000 2017 55,000 55,000 2018 40,000 40,000 Total $ 170,144 $ 170,297
| 2009 | 2008 | |||||||
| (Dollars in Thousands) | ||||||||
| 2011 | $ | 12,000 | $ | 12,000 | ||||
| 2015 | 10,000 | 10,000 | ||||||
| 2017 | 15,000 | 15,000 | ||||||
| 2018 | 16,000 | 16,000 | ||||||
| Total | $ | 53,000 | $ | 53,000 | ||||
| Issuance Date | Securities Issued | Liquidation Value | Coupon Rate | Maturity | Redeemable by Issuer Beginning | ||||||||||
| 12/19/03 | $ | 5,000,000 | $ | 1,000 per Capital Security | Floating 3-month LIBOR + 285 Basis Points | 01/23/2034 | 01/23/2009 | ||||||||
| 2009 | 2008 | 2007 | ||||||||||
| (Dollars in Thousands) | ||||||||||||
| Current: | ||||||||||||
| Federal | $ | (19 | ) | $ | 104 | $ | 1,693 | |||||
| State | 146 | 242 | 313 | |||||||||
| Subtotal | 127 | 346 | 2,006 | |||||||||
| Deferred: | ||||||||||||
| Federal | 1,238 | 1,184 | (3,731 | ) | ||||||||
| State | 115 | 37 | (1,208 | ) | ||||||||
| Subtotal | 1,353 | 1,221 | (4,939 | ) | ||||||||
| Income tax expense (benefit) | $ | 1,480 | $ | 1,567 | $ | (2,933 | ) | |||||
2009(Restated) 2008 2007 (Dollars in Thousands) Current: Federal $ (19 ) $ 104 $ 1,693 State 146 242 313 Subtotal 127 346 2,006 Deferred: Federal 824 1,184 (3,731 ) State (5 ) 37 (1,208 ) Subtotal 819 1,221 (4,939 ) Income tax expense (benefit) $ 946 $ 1,567 $ (2,933 )
| 2009 | 2008 | 2007 | ||||||||||
| (Dollars in Thousands) | ||||||||||||
| Income before income tax expense | $ | 6,053 | $ | 7,409 | $ | 923 | ||||||
| Federal statutory rate | 34 | % | 34 | % | 34 | % | ||||||
| Computed “expected” Federal income tax expense | 2,058 | 2,519 | 314 | |||||||||
| State tax, net of Federal tax benefit | 173 | 184 | (591 | ) | ||||||||
| Bank owned life insurance | (393 | ) | (409 | ) | (313 | ) | ||||||
| Tax-exempt interest and dividends | (334 | ) | (798 | ) | (1,080 | ) | ||||||
| Internal entity reorganization of subsidiaries | — | — | (1,285 | ) | ||||||||
| Other, net | (24 | ) | 71 | 22 | ||||||||
| Income tax expense (benefit) | $ | 1,480 | $ | 1,567 | $ | (2,933 | ) | |||||
2009 (Restated) | 2008 | 2007 | ||||||||||
| (Dollars in Thousands) | ||||||||||||
| Income before income tax expense | $ | 4,717 | $ | 7,409 | $ | 923 | ||||||
| Federal statutory rate | 34 | % | 34 | % | 34 | % | ||||||
| Computed “expected” Federal income tax expense | 1,604 | 2,519 | 314 | |||||||||
| State tax, net of Federal tax benefit | 93 | 184 | (591 | ) | ||||||||
| Bank-owned life insurance | (393 | ) | (409 | ) | (313 | ) | ||||||
| Tax-exempt interest and dividends | (334 | ) | (798 | ) | (1,080 | ) | ||||||
| Internal entity reorganization of subsidiaries | — | — | (1,285 | ) | ||||||||
| Other, net | (24) | ) | 71 | 22 | ||||||||
| Income tax expense (benefit) | $ | 946 | $ | 1,567 | $ | (2,933 | ) | |||||
| 2009 | 2008 | |||||||
| (Dollars in Thousands) | ||||||||
| Deferred tax assets: | ||||||||
| Impaired assets | $ | 1,661 | $ | 676 | ||||
| Allowance for loan losses | 3,121 | 2,314 | ||||||
| Employee benefit plans | 54 | 165 | ||||||
| Unrealized loss on securities available-for-sale and tax benefits related to adoption of FASB ASC 715-10 (previously known as FASB No 158) | 7,088 | 5,800 | ||||||
| Other | 507 | 406 | ||||||
| Federal NOL and AMT Credits | 4,471 | 7,426 | ||||||
| NJ NOL and AMA credits | 1,813 | 2,152 | ||||||
| Total deferred tax assets | $ | 18,715 | $ | 18,939 | ||||
| Deferred tax liabilities: | ||||||||
| Depreciation | $ | 243 | $ | 235 | ||||
| Market discount accretion | 61 | 108 | ||||||
| Deferred loan costs, net of fees | 502 | 581 | ||||||
| Purchase accounting | 89 | 130 | ||||||
| Total deferred tax liabilities | 895 | 1,054 | ||||||
| Net deferred tax asset | $ | 17,820 | $ | 17,885 | ||||
2009(Restated) 2008 (Dollars in Thousands) Deferred tax assets: Impaired assets $ 1,661 $ 676 Allowance for loan losses 3,296 2,314 Employee benefit plans 54 165 Unrealized loss on securities available-for-sale and tax benefits related to adoption of FASB ASC 715-10 (previously known as FASB No. 158) 7,088 5,800 Other 507 406 Federal NOL and AMT credits 4,777 7,426 State NOL and AMA credits 1,866 2,152 Total deferred tax assets $ 19,249 $ 18,939 Deferred tax liabilities: Depreciation $ 243 $ 235 Market discount accretion 61 108 Deferred loan costs, net of fees 502 581 Purchase accounting 89 130 Total deferred tax liabilities 895 1,054 Net deferred tax asset $ 18,354 $ 17,885
| 2009 | 2008 | |||||||
| (Dollars in Thousands) | ||||||||
| Commitments under commercial loans and lines of credit | $ | 70,076 | $ | 71,271 | ||||
| Home equity and other revolving lines of credit | 54,572 | 61,886 | ||||||
| Outstanding commercial mortgage loan commitments | 33,659 | 31,831 | ||||||
| Standby letters of credit | 1,676 | 2,357 | ||||||
| Performance letters of credit | 11,466 | 13,745 | ||||||
| Outstanding residential mortgage loan commitments | 4,153 | 1,588 | ||||||
| Overdraft protection lines | 5,058 | 4,480 | ||||||
| Other consumer | 11 | 36 | ||||||
| Total | $ | 180,671 | $ | 187,194 | ||||
| Union Center National Bank Actual | Minimum Capital Adequacy | For Classification Under Corrective Action Plan as Well Capitalized | ||||||||||||||||||||||
| Amount | Ratio | Amount | Ratio | Amount | Ratio | |||||||||||||||||||
| (Dollars in Thousands) | ||||||||||||||||||||||||
| December 31, 2009 Leverage (Tier 1) capital | $ | 97,116 | 7.62 | % | $ | 52,131 | 4.00 | % | $ | 64,313 | 5.00 | % | ||||||||||||
| Risk-Based Capital: | ||||||||||||||||||||||||
| Tier 1 | $ | 97,116 | 11.25 | % | $ | 34,521 | 4.00 | % | $ | 51,781 | 6.00 | % | ||||||||||||
| Total | 105,402 | 12.21 | % | 69,042 | 8.00 | % | 86,302 | 10.00 | % | |||||||||||||||
| December 31, 2008 Leverage (Tier 1) capital | 76,598 | 7.54 | % | 41,655 | 4.00 | % | 51,214 | 5.00 | % | |||||||||||||||
| Risk-Based Capital: | ||||||||||||||||||||||||
| Tier 1 | $ | 76,598 | 9.99 | % | $ | 30,672 | 4.00 | % | $ | 46,008 | 6.00 | % | ||||||||||||
| Total | 82,852 | 10.80 | % | 61,344 | 8.00 | % | 76,680 | 10.00 | % | |||||||||||||||
Union CenterNationalBank Minimum CapitalAdequacy For Classificationas Well Capitalized Amount Ratio Amount Ratio Amount Ratio (Dollars in Thousands) December 31, 2009 Leverage (Tier 1) capital (Restated) $ 96,314 7.56 % $ 52,133 4.00 % $ 64,315 5.00 % Risk-Based Capital: Tier 1 (Restated) $ 96,314 11.17 % $ 34,485 4.00 % $ 51,727 6.00 % Total (Restated) 105,036 12.18 % 68,970 8.00 % 86,212 10.00 % December 31, 2008 Leverage (Tier 1) capital $ 76,598 7.54 % $ 41,655 4.00 % $ 51,214 5.00 % Risk-Based Capital: Tier 1 $ 76,598 9.99 % $ 30,672 4.00 % $ 46,008 6.00 % Total 82,852 10.80 % 61,344 8.00 % 76,680 10.00 %
| Parent Corporation Actual | Minimum Capital Adequacy | For Classification as Well Capitalized | ||||||||||||||||||||||
| Amount | Ratio | Amount | Ratio | Amount | Ratio | |||||||||||||||||||
| (Dollars in Thousands) | ||||||||||||||||||||||||
| December 31, 2009 Leverage (Tier 1) capital | $ | 99,338 | 7.80 | % | $ | 52,141 | 4.00 | % | $ | 64,325 | 5.00 | % | ||||||||||||
| Risk-Based Capital: | ||||||||||||||||||||||||
| Tier 1 | $ | 99,338 | 11.51 | % | $ | 34,534 | 4.00 | % | $ | 51,801 | 6.00 | % | ||||||||||||
| Total | 107,613 | 12.46 | % | 69,067 | 8.00 | % | N/A | N/A | ||||||||||||||||
| December 31, 2008 Leverage (Tier 1) capital | 78,237 | 7.71 | % | 41,619 | 4.00 | % | 51,618 | 5.00 | % | |||||||||||||||
| Risk-Based Capital: | ||||||||||||||||||||||||
| Tier 1 | $ | 78,237 | 10.20 | % | $ | 30,675 | 4.00 | % | $ | 46,013 | 6.00 | % | ||||||||||||
| Total | 84,491 | 11.02 | % | 61,350 | 8.00 | % | N/A | N/A | ||||||||||||||||
| Parent Corporation | Minimum Capital Adequacy | For Classification as Well Capitalized | ||||||||||||||||||||||
| Amount | Ratio | Amount | Ratio | Amount | Ratio | |||||||||||||||||||
| (Dollars in Thousands) | ||||||||||||||||||||||||
| December 31, 2009 Leverage (Tier 1) capital (Restated) | $ | 98,536 | 7.73 | % | $ | 52,143 | 4.00 | % | $ | 64,327 | 5.00 | % | ||||||||||||
| Risk-Based Capital: | ||||||||||||||||||||||||
| Tier 1 (Restated) | $ | 98,536 | 11.43 | % | $ | 34,498 | 4.00 | % | $ | 51,747 | 6.00 | % | ||||||||||||
| Total (Restated) | 107,247 | 12.44 | % | 68,996 | 8.00 | % | N/A | N/A | ||||||||||||||||
| December 31, 2008 Leverage (Tier 1) capital | $ | 78,237 | 7.71 | % | $ | 41,619 | 4.00 | % | $ | 51,618 | 5.00 | % | ||||||||||||
| Risk-Based Capital: | ||||||||||||||||||||||||
| Tier 1 | $ | 78,237 | 10.20 | % | $ | 30,675 | 4.00 | % | $ | 46,013 | 6.00 | % | ||||||||||||
| Total | 84,491 | 11.02 | % | 61,350 | 8.00 | % | N/A | N/A | ||||||||||||||||
| Years Ended December 31, | ||||||||||||
| 2009 | 2008 | 2007 | ||||||||||
| (Dollars in Thousands) | ||||||||||||
| Unrealized losses on debt securities for which a portion of the impairment has been recognized in income | $ | (1,830 | ) | $ | — | $ | — | |||||
| Reclassification adjustments of OTTI losses included in income | (4,238 | ) | — | — | ||||||||
| Unrealized losses on other available for sale securities | (1,979 | ) | (3,328 | ) | (4,079 | ) | ||||||
| Reclassification adjustment for net gain/(loss) arising during this period | 4,729 | 655 | 312 | |||||||||
| Net unrealized losses | (3,318 | ) | (2,673 | ) | (3,767 | ) | ||||||
| Tax effect | 1,354 | 1,584 | 1,163 | |||||||||
| Net of tax amount | (1,964 | ) | (1,089 | ) | (2,604 | ) | ||||||
| Change in minimum pension liability | 25 | — | — | |||||||||
| Tax effect | (10 | ) | — | — | ||||||||
| Net of tax amount | 15 | — | — | |||||||||
| Net actuarial gains (losses) | 142 | (3,332 | ) | (583 | ) | |||||||
| Tax effect | (57 | ) | 1,333 | 233 | ||||||||
| Net of tax amount | 85 | (1,999 | ) | (350 | ) | |||||||
| Change in pension plan – curtailment | — | — | 1,353 | |||||||||
| Tax effect | — | — | (541 | ) | ||||||||
| Net of tax amount | — | — | 812 | |||||||||
| Market value adjustment on securities transferred from held-to-maturity to available-for-sale | — | — | (459 | ) | ||||||||
| Tax effect | — | — | 187 | |||||||||
| Net of tax amount | — | — | (272 | ) | ||||||||
| Other comprehensive loss, net of tax | $ | (1,864 | ) | $ | (3,088 | ) | $ | (2,414 | ) | |||
| 2009 | 2008 | |||||||
| (Dollars in Thousands) | ||||||||
| Investment securities available for sale, net of tax | $ | (8,428 | ) | $ | (6,464 | ) | ||
| Defined benefit pension and post-retirement plans, net of tax | (2,348 | ) | (2,448 | ) | ||||
| Total | $ | (10,776 | ) | $ | (8,912 | ) | ||
| 2009 | 2008 | |||||||
| (Dollars in Thousands) | ||||||||
| Investment securities available-for-sale, net of tax | $ | (8,428 | ) | $ | (6,464 | ) | ||
| Defined benefit pension and post-retirement plans, net of tax | (2,348 | ) | (2,448 | ) | ||||
| Total | $ | (10,776 | ) | $ | (8,912 | ) | ||
| 2009 | 2008 | |||||||
| (Dollars in Thousands) | ||||||||
| Change in Benefit Obligation: | ||||||||
| Projected benefit obligation at beginning of year | $ | 9,923 | $ | 11,497 | ||||
| Service cost | — | — | ||||||
| Interest cost | 606 | 676 | ||||||
| Actuarial loss | 617 | 107 | ||||||
| Benefits paid | (486 | ) | (663 | ) | ||||
| Curtailments | — | (719 | ) | |||||
| Settlement | — | (975 | ) | |||||
| Projected benefit obligation at end of year | $ | 10,660 | $ | 9,923 | ||||
| Change in Plan Assets: | ||||||||
| Fair value of plan assets at beginning year | $ | 5,734 | $ | 9,008 | ||||
| Actual return on plan assets | 930 | (2,728 | ) | |||||
| Employer contributions | 474 | 1,092 | ||||||
| Benefits paid | (486 | ) | (663 | ) | ||||
| Settlement | — | (975 | ) | |||||
| Fair value of plan assets at end of year | $ | 6,652 | $ | 5,734 | ||||
| Funded status | $ | (4,008 | ) | $ | (4,189 | ) | ||
| 2009 | 2008 | 2007 | ||||||||||
| (Dollars in Thousands) | ||||||||||||
| Service cost | $ | — | $ | — | $ | 627 | ||||||
| Interest cost | 606 | 701 | 707 | |||||||||
| Expected return on plan assets | (288 | ) | (658 | ) | (674 | ) | ||||||
| Net amortization and deferral | — | — | 13 | |||||||||
| Recognized curtailment gain | — | — | (1,155 | ) | ||||||||
| Net periodic pension expense (benefit) | $ | 318 | $ | 43 | $ | (482 | ) | |||||
| 2009 | 2008 | 2007 | ||||||||||
| Discount rate | 5.75 | % | 6.25 | % | 5.75 | % | ||||||
| Rate of compensation increase | N/A | N/A | 4.25 | % | ||||||||
| Expected long-term rate of return on plan assets | 5.00 | % | 7.50 | % | 7.50 | % | ||||||
2009 2008 2007 Discount rate 5.75 % 6.25 % 5.75 % Rate of compensation increase N/A N/A 4.25 % Expected long-term rate of return on plan assets 5.00 % 7.50 % 7.50 %
| 2009 | 2008 | 2007 | ||||||||||
| (Dollars in Thousands) | ||||||||||||
| Information for Plans With a Benefit Obligation in Excess of Plan Assets | ||||||||||||
| Projected benefit obligation | $ | 10,660 | $ | 9,923 | $ | 11,497 | ||||||
| Accumulated benefit obligation | 10,660 | 9,923 | 11,497 | |||||||||
| Fair value of plan assets | 6,652 | 5,734 | 9,008 | |||||||||
| Assumptions | ||||||||||||
| Weighted average assumptions used to determine benefit obligation at December 31 | ||||||||||||
| Discount rate | 6.25 | % | 6.25 | % | 6.25 | % | ||||||
| Rate of compensation increase | N/A | N/A | N/A | |||||||||
| Weighted average assumptions used to determine net periodic benefit cost for years ended December 31 | ||||||||||||
| Discount rate | 6.25 | % | 6.25 | % | 5.75 | % | ||||||
| Expected long-term return on plan assets | 5.00 | % | 7.50 | % | 7.50 | % | ||||||
| Rate of compensation increase | N/A | N/A | 4.25 | % | ||||||||
| Asset Category | 2009 | 2008 | 2007 | |||||||||
| Equity securities | 44 | % | 48 | % | 80 | % | ||||||
| Debt and/or fixed income securities | 46 | % | 34 | % | 20 | % | ||||||
| Alternative investments, including commodities, foreign currency and real estate | 5 | % | 9 | % | — | |||||||
| Cash and other alternative investments, including hedge funds, equity structured notes | 5 | % | 9 | % | — | |||||||
| Total | 100 | % | 100 | % | 100 | % | ||||||
Asset Category 2009 2008 2007 Equity securities 44 % 48 % 80 % Debt and/or fixed income securities 46 % 34 % 20 % Alternative investments, including commodities, foreign currency and real estate 5 % 9 % — Cash and other alternative investments, including hedge funds, equity structured notes 5 % 9 % — Total 100 % 100 % 100 %
| Range | Target | |||||||
| Equity securities | 36 – 52 | % | 44 | % | ||||
| Debt and/or fixed income securities | 38 – 54 | % | 46 | % | ||||
| International equity | N/A | N/A | ||||||
| Short term | N/A | N/A | ||||||
| Other | 7 – 14 | % | 10 | % | ||||
| Fair Value Measurements at Reporting Date Using | ||||||||||||||||
December 31, 2009 | Quoted Prices in Active Markets for Identical Assets (Level 1) | Significant Other Observable Inputs (Level 2) | Significant Unobservable Inputs (Level 3) | |||||||||||||
| (Dollars in Thousands) | ||||||||||||||||
| Cash | $ | 1,020 | $ | 1,020 | $ | — | $ | — | ||||||||
| Equity Securities: | ||||||||||||||||
| U.S. companies | 1,327 | 1,327 | — | — | ||||||||||||
| International companies | 1,163 | 1,163 | — | — | ||||||||||||
| U.S. Treasury securities | 2,301 | 2,301 | — | — | ||||||||||||
| Corporate bonds | 340 | 340 | — | — | ||||||||||||
| Commodities | 170 | 170 | — | — | ||||||||||||
| Hedge funds | 331 | — | — | 331 | ||||||||||||
| Total | $ | 6,652 | $ | 6,321 | $ | — | $ | 331 | ||||||||
| 2009 | ||||
| (Dollars in Thousands) | ||||
| Beginning balance, January 1, | $ | 663 | ||
| Actual return on plan assets: | ||||
| Relating to assets still held at the reporting date | 88 | |||
| Relating to assets sold during the period | — | |||
| Purchases, sales and settlements | — | |||
| Transfers out of Level 3 | (420 | ) | ||
| Ending balance, December 31, | $ | 331 | ||
| 2009 | 2008 | 2007 | ||||||||||
| Weighted average fair value of grants | $ | 1.48 | $ | 3.10 | $ | 6.48 | ||||||
| Risk-free interest rate | 1.90 | % | 3.03 | % | 4.92 | % | ||||||
| Dividend yield | 4.69 | % | 2.43 | % | 2.51 | % | ||||||
| Expected volatility | 33.0 | % | 30.2 | % | 47.4 | % | ||||||
| Expected life in months | 69 | 88 | 72 | |||||||||
| Shares | Weighted- Average Exercise Price | Weighted- Average Remaining Contractual Term (In Years) | Aggregate Intrinsic Value | |||||||||||||
| Outstanding at December 31, 2008 | 185,164 | $ | 10.45 | |||||||||||||
| Granted | 38,203 | 7.67 | ||||||||||||||
| Exercised | (9,289 | ) | 6.07 | |||||||||||||
| Forfeited/cancelled/expired | (22,076 | ) | 11.04 | |||||||||||||
| Outstanding at December 31, 2009 | 192,002 | $ | 10.04 | 5.82 | $ | 91,679 | ||||||||||
| Exercisable at December 31, 2009 | 124,271 | $ | 10.05 | 4.36 | $ | 48,267 | ||||||||||
| Stock Option Plan | Shares | Exercise Price Range per Share | ||||||
| Outstanding, December 31, 2006 (262,527 shares exercisable) | 340,850 | $ | 6.07 to $15.12 | |||||
| Granted during 2007 | 38,203 | $ | 15.73 | |||||
| Exercised during 2007 | (95,861 | ) | $ | 6.07 to $10.66 | ||||
| Expired or canceled during 2007 | (18,937 | ) | $ | 10.50 to $15.73 | ||||
| Outstanding, December 31, 2007 (188,273 shares exercisable) | 264,255 | $ | 6.07 to $15.73 | |||||
| Granted during 2008 | 38,203 | $ | 11.15 | |||||
| Exercised during 2008 | (25,583 | ) | $ | 6.07 to $10.66 | ||||
| Expired or canceled during 2008 | (91,711 | ) | $ | 6.07 to $15.73 | ||||
| Outstanding, December 31, 2008 (125,468 shares exercisable) | 185,164 | $ | 6.07 to $15.73 | |||||
| Granted during 2009 | 38,203 | $ | 7.67 | |||||
| Exercised during 2009 | (9,289 | ) | $ | 6.07 | ||||
| Expired or canceled during 2009 | (22,076 | ) | $ | 6.07 to $15.73 | ||||
| Outstanding, December 31, 2009 (124,271 shares exercisable) | 192,002 | $ | 7.67 to $15.73 | |||||
| Stock Option Plan | Shares | Exercise Price Range per Share | ||||||
| Outstanding, December 31, 2006 (262,527 shares exercisable) | 340,850 | $ | 6.07 to $15.12 | |||||
| Granted during 2007 | 38,203 | $ | 15.73 | |||||
| Exercised during 2007 | (95,861 | ) | $ | 6.07 to $10.66 | ||||
| Expired or canceled during 2007 | (18,937 | ) | $ | 10.50 to$15.73 | ||||
| Outstanding, December 31, 2007 (188,273 shares exercisable) | 264,255 | $ | 6.07 to $15.73 | |||||
| Granted during 2008 | 38,203 | $ | 11.15 | |||||
| Exercised during 2008 | (25,583 | ) | $ | 6.07 to $10.66 | ||||
| Expired or canceled during 2008 | (91,711 | ) | $ | 6.07 to $15.73 | ||||
| Outstanding, December 31, 2008 (125,468 shares exercisable) | 185,164 | $ | 6.07 to $15.73 | |||||
| Granted during 2009 | 38,203 | $ | 7.67 | |||||
| Exercised during 2009 | (9,289 | ) | $ | 6.07 | ||||
| Expired or canceled during 2009 | (22,076 | ) | $ | 6.07 to $15.73 | ||||
| Outstanding, December 31, 2009 (124,271 shares exercisable) | 192,002 | $ | 7.67 to $15.73 | |||||
requirements for fair value measurements. The valuation hierarchy is based upon the transparency of inputs to the valuation of an asset or liability as of the measurement date.
of securities with similar characteristics, or discounted cash flows. Examples of instruments, which would generally be classified within Level 2 of the valuation hierarchy, include municipal bonds and certain agency collateralized mortgage obligations. In certain cases where there is limited activity in the market for a particular instrument, assumptions must be made to determine their fair value and are classified as Level 3. Due to the inactive condition of the markets amidst the financial crisis, the Corporation treated certain securities as Level 3 securities in order to provide more appropriate valuations. For assets in an inactive market, the infrequent trades that do occur are not a true indication of fair value. When measuring fair value, the valuation techniques available under the market approach, income approach and/or cost approach are used. The Corporation’s evaluations are based on market data and the Corporation employs combinations of these approaches for its valuation methods depending on the asset class.
| (a) | Quoted prices in active markets for similar TRUPS with insignificant adjustments for differences between the TRUPS that the Corporation holds and similar TRUPS. |
| (b) | Quoted prices in markets that are not active that represent current transactions for the same or similar TRUPS that do not require significant adjustment based on unobservable inputs. |
severity risk. With the exception of the two pooled trust preferred securities, for which $3.4 million of impairment charges were taken to earnings during 2009, the securities continue to make scheduled cash flows and no material cash flow payment defaults have occurred to date.
current levels of interest rate and the committed rates. The fair value of financial standby letters of credit is based on fees currently charged for similar agreements or on the estimated cost to terminate them or otherwise settle the obligations with the counterparties.
| Fair Value Measurements at Reporting Date Using | ||||||||||||||||
| December 31, 2009 | Quoted Prices in Active Markets for Identical Assets (Level 1) | Significant Other Observable Inputs (Level 2) | Significant Unobservable Inputs (Level 3) | |||||||||||||
| (Dollars in Thousands) | ||||||||||||||||
| Financial Instruments Measured at Fair Value on a Recurring Basis: | ||||||||||||||||
| U.S. Treasury & Agency Securities | $ | 2,089 | $ | 2,089 | $ | — | $ | — | ||||||||
| Federal Agency Obligations | 214,585 | 55,470 | 159,115 | — | ||||||||||||
| Obligations of U.S. States and Political Subdivision | 19,281 | — | 19,281 | — | ||||||||||||
| Trust preferred securities | 26,715 | — | 24,366 | 2,349 | ||||||||||||
| Other debt securities | 29,921 | 7,248 | 22,673 | — | ||||||||||||
| Equity securities | 5,533 | 5,533 | — | — | ||||||||||||
| Securities available-for-sale | $ | 298,124 | $ | 70,340 | $ | 225,435 | $ | 2,349 | ||||||||
| Fair Value Measurements at Reporting Date Using | ||||||||||||||||||||
| December 31, 2008 | Quoted Prices in Active Markets for Identical Assets (Level 1) | Significant Other Observable Inputs (Level 2) | Significant Unobservable Inputs (Level 3) | |||||||||||||||||
| (Dollars in Thousands) | ||||||||||||||||||||
| Financial Instruments Measured at Fair Value on a Recurring Basis: | ||||||||||||||||||||
| U.S. Treasury & Agency Securities | $ | 100 | $ | 100 | $ | — | $ | — | ||||||||||||
| Federal Agency Obligations | 82,797 | — | 82,797 | — | ||||||||||||||||
| Obligations of U.S. States and Political Subdivision | 52,094 | 2,190 | 49,904 | — | ||||||||||||||||
| Trust preferred securities | 31,771 | — | 14,713 | 17,058 | ||||||||||||||||
| Other debt securities | 59,362 | 3,816 | 49,050 | 6,496 | ||||||||||||||||
| Equity securities | 16,590 | 16,590 | — | — | ||||||||||||||||
| Securities available-for-sale | $ | 242,714 | $ | 22,696 | $ | 196,464 | $ | 23,554 | ||||||||||||
Fair Value Measurements atReporting Date Using December 31,2009 QuotedPrices inActiveMarkets forIdenticalAssets(Level 1) SignificantOtherObservableInputs(Level 2) SignificantUnobservableInputs(Level 3) (Dollars in Thousands) Financial Instruments Measured at Fair Value on a Recurring Basis: U.S. Treasury & Agency Securities $ 2,089 $ 2,089 $ — $ — Federal Agency Obligations 214,585 55,470 159,115 — Obligations of U.S. States and Political Subdivision 19,281 — 19,281 — Trust preferred securities 26,715 — 24,366 2,349 Other debt securities 29,921 7,248 22,673 — Equity securities 5,533 5,533 — — Securities available-for-sale $ 298,124 $ 70,340 $ 225,435 $ 2,349
Fair Value Measurements at Reporting Date Using | ||||||||||||||||
December 31, 2008 | Quoted Prices in Active Markets for Identical Assets (Level 1) | Significant Other Observable Inputs (Level 2) | Significant Unobservable Inputs (Level 3) | |||||||||||||
| (Dollars in Thousands) | ||||||||||||||||
| Financial Instruments Measured at Fair Value on a Recurring Basis: | ||||||||||||||||
| U.S. Treasury & Agency Securities | $ | 100 | $ | 100 | $ | — | $ | — | ||||||||
| Federal Agency Obligations | 82,797 | — | 82,797 | — | ||||||||||||
| Obligations of U.S. States and Political Subdivision | 52,094 | 2,190 | 49,904 | — | ||||||||||||
| Trust preferred securities | 31,771 | — | 14,713 | 17,058 | ||||||||||||
| Other debt securities | 59,362 | 3,816 | 49,050 | 6,496 | ||||||||||||
| Equity securities | 16,590 | 16,590 | — | — | ||||||||||||
| Securities available-for-sale | $ | 242,714 | $ | 22,696 | $ | 196,464 | $ | 23,554 | ||||||||
| 2009 | ||||
| (Dollars in Thousands) | ||||
| Beginning balance, January 1, | $ | 23,554 | ||
| Transfers out of Level 3 | (19,855 | ) | ||
| Principal interest deferrals | 139 | |||
| Total net losses included in net income | (4,403 | ) | ||
| Total net unrealized gains | 2,914 | |||
| Ending balance, December 31, | $ | 2,349 | ||
| 2008 | ||||
| (Dollars in Thousands) | ||||
| Beginning balance, January 1, | $ | — | ||
| Transfers in (out) of Level 3 | 27,629 | |||
| Principal paydowns | (309 | ) | ||
| Total net unrealized losses | (3,766 | ) | ||
| Ending balance, December 31, | $ | 23,554 | ||
| Fair Value Measurements at Reporting Date Using | ||||||||||||||||
| December 31, 2009 | Quoted Prices in Active Markets for Identical Assets (Level 1) | Significant Other Observable Inputs (Level 2) | Significant Unobservable Inputs (Level 3) | |||||||||||||
| (Dollars in Thousands) | ||||||||||||||||
| Assets Measured at Fair Value on a Non-Recurring Basis: | ||||||||||||||||
| Impaired loans | $ | 8,058 | $ | — | $ | — | $ | 8,058 | ||||||||
Fair Value Measurements at Reporting Date Using | ||||||||||||||||
| (Restated) | December 31, 2009 | Quoted Prices in Active Markets for Identical Assets (Level 1) | Significant Other Observable Inputs (Level 2) | Significant Unobservable Inputs (Level 3) | ||||||||||||
| (Dollars in Thousands) | ||||||||||||||||
| Assets Measured at Fair Value on a Non-Recurring Basis: | ||||||||||||||||
| Impaired loans | $ | 5,455 | $ | — | $ | — | $ | 5,455 | ||||||||
| December 31, | ||||||||||||||||
| 2009 | 2008 | |||||||||||||||
| Carrying Amount | Fair Value | Carrying Amount | Fair Value | |||||||||||||
| (Dollars in Thousands) | ||||||||||||||||
| FINANCIAL ASSETS: | ||||||||||||||||
| Cash and cash equivalents | $ | 89,168 | $ | 89,168 | $ | 15,031 | $ | 15,031 | ||||||||
| Investment securities available-for-sale | 298,124 | 298,124 | 242,714 | 242,714 | ||||||||||||
| Net loans | 707,178 | 713,474 | 669,949 | 673,976 | ||||||||||||
| Restricted investment in bank stocks | 10,672 | 10,672 | 10,230 | 10,230 | ||||||||||||
| Accrued interest receivable | 4,033 | 4,033 | 4,154 | 4,154 | ||||||||||||
| FINANCIAL LIABILITIES: | ||||||||||||||||
| Non-interest-bearing deposits | 130,518 | 130,518 | 113,319 | 113,319 | ||||||||||||
| Interest-bearing deposits | 683,187 | 683,974 | 546,218 | 548,747 | ||||||||||||
| Federal funds purchased, securities sold under agreement to repurchase and FHLB advances | 269,253 | 279,219 | 268,440 | 296,144 | ||||||||||||
| Subordinated debentures | 5,155 | 5,155 | 5,155 | 4,875 | ||||||||||||
| Accrued interest payable | 1,825 | 1,825 | 2,201 | 2,201 | ||||||||||||
| December 31, | ||||||||||||||||
2009 (Restated) | 2008 | |||||||||||||||
| Carrying Amount | Fair Value | Carrying Amount | Fair Value | |||||||||||||
| (Dollars in Thousands) | ||||||||||||||||
| FINANCIAL ASSETS: | ||||||||||||||||
| Cash and cash equivalents | $ | 89,168 | $ | 89,168 | $ | 15,031 | $ | 15,031 | ||||||||
| Investment securities available-for-sale | 298,124 | 298,124 | 242,714 | 242,714 | ||||||||||||
| Net loans | 710,895 | 717,191 | 669,949 | 673,976 | ||||||||||||
| Restricted investment in bank stocks | 10,672 | 10,672 | 10,230 | 10,230 | ||||||||||||
| Accrued interest receivable | 4,033 | 4,033 | 4,154 | 4,154 | ||||||||||||
| FINANCIAL LIABILITIES: | ||||||||||||||||
| Non interest-bearing deposits | 130,518 | 130,518 | 113,319 | 113,319 | ||||||||||||
| Interest-bearing deposits | 683,187 | 683,974 | 546,218 | 548,747 | ||||||||||||
| Federal funds purchased, securities sold under agreement to repurchase and FHLB advances | 269,253 | 279,219 | 268,440 | 296,144 | ||||||||||||
| Subordinated debentures | 5,155 | 5,155 | 5,155 | 4,875 | ||||||||||||
| Accrued interest payable | 1,825 | 1,825 | 2,201 | 2,201 | ||||||||||||
| At December 31, | ||||||||
| 2009 | 2008 | |||||||
| (Dollars in Thousands) | ||||||||
| ASSETS | ||||||||
| Cash and cash equivalents | $ | 2,683 | $ | 922 | ||||
| Investment in subsidiaries | 104,946 | 85,229 | ||||||
| Securities available for sale | 501 | 1,255 | ||||||
| Other assets | 248 | 1,306 | ||||||
| Total assets | $ | 108,378 | $ | 88,712 | ||||
| LIABILITIES AND STOCKHOLDERS’ EQUITY | ||||||||
| Other liabilities | $ | 280 | $ | 1,041 | ||||
| Securities sold under repurchase agreement | 392 | 803 | ||||||
| Subordinated debentures | 5,155 | 5,155 | ||||||
| Stockholders’ equity | 102,551 | 81,713 | ||||||
| Total liabilities and stockholders’ equity | $ | 108,378 | $ | 88,712 | ||||
| At December 31, | ||||||||
2009 (Restated) | 2008 | |||||||
| (Dollars in Thousands) | ||||||||
| ASSETS | ||||||||
| Cash and cash equivalents | $ | 2,683 | $ | 922 | ||||
| Investment in subsidiaries | 104,144 | 85,229 | ||||||
| Securities available for sale | 501 | 1,255 | ||||||
| Other assets | 248 | 1,306 | ||||||
| Total assets | $ | 107,576 | $ | 88,712 | ||||
| LIABILITIES AND STOCKHOLDERS’ EQUITY | ||||||||
| Other liabilities | $ | 280 | $ | 1,041 | ||||
| Securities sold under repurchase agreement | 392 | 803 | ||||||
| Subordinated debentures | 5,155 | 5,155 | ||||||
| Stockholders’ equity | 101,749 | 81,713 | ||||||
| Total liabilities and stockholders’ equity | $ | 107,576 | $ | 88,712 | ||||
| For Years Ended December 31, | ||||||||||||
| 2009 | 2008 | 2007 | ||||||||||
| (Dollars in Thousands) | ||||||||||||
| Income: | ||||||||||||
| Dividend income from subsidiaries | $ | 2,474 | $ | 4,675 | $ | 7,074 | ||||||
| Other income | 3 | 37 | 58 | |||||||||
| Net securities gains (losses) | (325 | ) | (413 | ) | 95 | |||||||
| Management fees | 298 | 275 | 221 | |||||||||
| Total Income | 2,450 | 4,574 | 7,448 | |||||||||
| Expenses | (604 | ) | (623 | ) | (1,718 | ) | ||||||
| Income before equity in undistributed earnings (loss) of subsidiaries | 1,846 | 3,951 | 5,730 | |||||||||
| Equity in undistributed earnings (loss) of subsidiaries | 2,727 | 1,891 | (1,874 | ) | ||||||||
| Net Income | $ | 4,573 | $ | 5,842 | $ | 3,856 | ||||||
For Years Ended December 31, 2009(Restated) 2008 2007 (Dollars in Thousands) Income: Dividend income from subsidiaries $ 2,474 $ 4,675 $ 7,074 Other income 3 37 58 Net securities gains (losses) (325 ) (413 ) 95 Management fees 298 275 221 Total income 2,450 4,574 7,448 Expenses (604 ) (623 ) (1,718 ) Income before equity in undistributed earnings (loss) of subsidiaries 1,846 3,951 5,730 Equity in undistributed earnings (loss) of subsidiaries 1,925 1,891 (1,874 ) Net income $ 3,771 $ 5,842 $ 3,856
| For Years Ended December 31 | ||||||||||||
| 2009 | 2008 | 2007 | ||||||||||
| (Dollars in Thousands) | ||||||||||||
| Cash flows from operating activities: | ||||||||||||
| Net income | $ | 4,573 | $ | 5,842 | $ | 3,856 | ||||||
| Adjustments to reconcile net income to net cash provided by operating activities: | ||||||||||||
| Net securities losses (gains) | 325 | 413 | (95 | ) | ||||||||
| Equity in undistributed loss (earnings) of subsidiary | (2,727 | ) | (1,891 | ) | 1,874 | |||||||
| Change in deferred tax asset | (111 | ) | (1,542 | ) | — | |||||||
| Decrease (increase) in other assets | 1,838 | 41 | 1,516 | |||||||||
| Increase (decrease) in other liabilities | (844 | ) | 1,610 | (1,114 | ) | |||||||
| Stock based compensation | 77 | 128 | 151 | |||||||||
| Net cash provided by operating activities | 3,131 | 4,601 | 6,188 | |||||||||
| Cash flows from investing activities: | ||||||||||||
| Purchases of available-for-sale securities | — | (579 | ) | (5,070 | ) | |||||||
| Maturity of available-for-sale securities | 659 | 938 | 6,887 | |||||||||
| (Investments in subsidiaries) and return of capital from subsidiaries | (19,000 | ) | 3,500 | 3,500 | ||||||||
| Net cash (used in) provided by investing activities | (18,341 | ) | 3,859 | 5,317 | ||||||||
| Cash flows from financing activities: | ||||||||||||
| Net increase (decrease) in borrowings | (411 | ) | (1,197 | ) | 2,000 | |||||||
| Cash dividends paid on common stock | (3,166 | ) | (4,675 | ) | (4,885 | ) | ||||||
| Proceeds from exercise of stock options | 57 | 224 | 850 | |||||||||
| Proceeds from restricted stock | — | 25 | — | |||||||||
| Proceeds from issuance of preferred stock and warrants | 10,000 | — | — | |||||||||
| Cash dividends paid on preferred stock | (425 | ) | — | — | ||||||||
| Proceeds from issuance of shares from rights offering | 11,000 | — | — | |||||||||
| Purchase of treasury stock | — | (1,924 | ) | (10,027 | ) | |||||||
| Issuance cost of common stock | (11 | ) | (19 | ) | (21 | ) | ||||||
| Tax (expense) benefit from stock based compensation | (73 | ) | (78 | ) | 155 | |||||||
| Net cash provided (used in) financing activities | 16,971 | (7,644 | ) | (11,928 | ) | |||||||
| Increase (decrease) in cash and cash equivalents | 1,761 | 816 | (423 | ) | ||||||||
| Cash and cash equivalents at beginning of year | 922 | 106 | 529 | |||||||||
| Cash and cash equivalents at the end of year | $ | 2,683 | $ | 922 | $ | 106 | ||||||
For Years Ended December 31, 2009(Restated) 2008 2007 (Dollars in Thousands) Cash flows from operating activities: Net income $ 3,771 $ 5,842 $ 3,856 Adjustments to reconcile net income to net cash (used in) provided by operating activities: Net securities losses (gains) 325 413 (95 ) Equity in undistributed (earnings) loss of subsidiary (1,925 ) (1,891 ) 1,874 Change in deferred tax asset (111 ) (1,542 ) — Decrease in other assets 1,838 41 1,516 (Decrease) increase in other liabilities (844 ) 1,610 (1,114 ) Stock-based compensation 77 128 151 Net cash provided by operating activities 3,131 4,601 6,188 Cash flows from investing activities: Purchases of available-for-sale securities — (579 ) (5,070 ) Maturity of available-for-sale securities 659 938 6,887 (Investments in subsidiaries) and return of capital from subsidiaries (19,000 ) 3,500 3,500 Net cash (used in) provided by investing activities (18,341 ) 3,859 5,317 Cash flows from financing activities: Net (decrease) increase in borrowings (411 ) (1,197 ) 2,000 Cash dividends paid on common stock (3,166 ) (4,675 ) (4,885 ) Proceeds from exercise of stock options 57 224 850 Proceeds from restricted stock — 25 — Proceeds from issuance of preferred stock and warrants 10,000 — — Cash dividends paid on preferred stock (425 ) — — Proceeds from issuance of shares from rights offering 11,000 — — Purchase of treasury stock — (1,924 ) (10,027 ) Issuance cost of common stock (11 ) (19 ) (21 ) Tax (expense) benefit from stock-based compensation (73 ) (78 ) 155 Net cash provided by (used in) financing activities 16,971 (7,644 ) (11,928 ) Increase (decrease) in cash and cash equivalents 1,761 816 (423 ) Cash and cash equivalents at beginning of year 922 106 529 Cash and cash equivalents at the end of year $ 2,683 $ 922 $ 106
| 2009 | ||||||||||||||||
| 4th Quarter | 3rd Quarter | 2nd Quarter | 1st Quarter | |||||||||||||
| (Dollars in Thousands, Except per Share Data) | ||||||||||||||||
| Total interest income | $ | 12,971 | $ | 13,491 | $ | 12,706 | $ | 11,942 | ||||||||
| Total interest expense | 4,953 | 6,050 | 6,079 | 5,563 | ||||||||||||
| Net interest income | 8,018 | 7,441 | 6,627 | 6,379 | ||||||||||||
| Provision for loan losses | 1,404 | 280 | 156 | 1,421 | ||||||||||||
| Total other income, net of securities gains | 968 | 822 | 841 | 784 | ||||||||||||
| Net securities gains (losses) | (1,308 | ) | (511 | ) | 1,710 | 600 | ||||||||||
| Other expense | 5,238 | 5,186 | 7,314 | 5,319 | ||||||||||||
| Income before income taxes | 1,036 | 2,286 | 1,708 | 1,023 | ||||||||||||
| Provision for income taxes | (2 | ) | 751 | 507 | 224 | |||||||||||
| Net income | $ | 1,038 | $ | 1,535 | $ | 1,201 | $ | 799 | ||||||||
| Net income available to common stockholders | $ | 896 | $ | 1,387 | $ | 1,053 | $ | 670 | ||||||||
| Earnings per share: | ||||||||||||||||
| Basic | $ | 0.06 | $ | 0.11 | $ | 0.08 | $ | 0.05 | ||||||||
| Diluted | $ | 0.06 | $ | 0.11 | $ | 0.08 | $ | 0.05 | ||||||||
| Weighted average common shares outstanding: | ||||||||||||||||
| Basic | 14,531,387 | 13,000,601 | 12,994,429 | 12,991,312 | ||||||||||||
| Diluted | 14,534,255 | 13,005,101 | 12,996,544 | 12,993,185 | ||||||||||||
| 2008 | 2009 | |||||||||||||||||||||||||||||||
| 4th Quarter | 3rd Quarter | 2nd Quarter | 1st Quarter | 4th Quarter (Restated)(1) | 3rd Quarter | 2nd Quarter | 1st Quarter | |||||||||||||||||||||||||
| (Dollars in Thousands, Except per Share Data) | (Dollars in Thousands, Except per Share Data) | |||||||||||||||||||||||||||||||
| Total interest income | $ | 12,615 | $ | 12,689 | $ | 12,230 | $ | 12,360 | $ | 12,971 | $ | 13,491 | $ | 12,706 | $ | 11,942 | ||||||||||||||||
| Total interest expense | 5,792 | 5,829 | 5,801 | 6,673 | 4,953 | 6,050 | 6,079 | 5,563 | ||||||||||||||||||||||||
| Net interest income | 6,823 | 6,860 | 6,429 | 5,687 | 8,018 | 7,441 | 6,627 | 6,379 | ||||||||||||||||||||||||
| Provision for loan losses | 425 | 465 | 521 | 150 | 2,740 | 280 | 156 | 1,421 | ||||||||||||||||||||||||
| Total other income, net of securities gains | 871 | 1,122 | 891 | 866 | 968 | 822 | 841 | 784 | ||||||||||||||||||||||||
| Net securities gains (losses) | (256 | ) | (1,075 | ) | 225 | 0 | (1,308 | ) | (511 | ) | 1,710 | 600 | ||||||||||||||||||||
| Other expense | 4,754 | 4,578 | 5,188 | 4,953 | 5,238 | 5,186 | 7,314 | 5,319 | ||||||||||||||||||||||||
| Income before income taxes | 2,259 | 1,864 | 1,836 | 1,450 | (300 | ) | 2,286 | 1,708 | 1,023 | |||||||||||||||||||||||
| Provision for income taxes | 560 | 346 | 428 | 233 | ||||||||||||||||||||||||||||
| Income tax expense (benefit) | (536 | ) | 751 | 507 | 224 | |||||||||||||||||||||||||||
| Net income | $ | 1,699 | $ | 1,518 | $ | 1,408 | $ | 1,217 | $ | 236 | $ | 1,535 | $ | 1,201 | $ | 799 | ||||||||||||||||
| Net income available to common stockholders | $ | 94 | $ | 1,387 | $ | 1,053 | $ | 670 | ||||||||||||||||||||||||
| Earnings per share: | ||||||||||||||||||||||||||||||||
| Basic | $ | 0.13 | $ | 0.12 | $ | 0.11 | $ | 0.09 | $ | 0.01 | $ | 0.11 | $ | 0.08 | $ | 0.05 | ||||||||||||||||
| Diluted | $ | 0.13 | $ | 0.12 | $ | 0.11 | $ | 0.09 | $ | 0.01 | $ | 0.11 | $ | 0.08 | $ | 0.05 | ||||||||||||||||
| Weighted average common shares outstanding: | ||||||||||||||||||||||||||||||||
| Basic | 12,989,304 | 12,990,441 | 13,070,868 | 13,144,747 | 14,531,387 | 13,000,601 | 12,994,429 | 12,991,312 | ||||||||||||||||||||||||
| Diluted | 12,995,134 | 13,003,954 | 13,083,558 | 13,163,586 | 14,534,255 | 13,005,101 | 12,996,544 | 12,993,185 | ||||||||||||||||||||||||
| (1) See Note 21 to the Consolidated Financial Statements. | (1) See Note 21 to the Consolidated Financial Statements. | |||||||||||||||||||||||||||||||
| 2008 | ||||||||||||||||
| 4th Quarter | 3rd Quarter | 2nd Quarter | 1st Quarter | |||||||||||||
| (Dollars in Thousands, Except per Share Data) | ||||||||||||||||
| Total interest income | $ | 12,615 | $ | 12,689 | $ | 12,230 | $ | 12,360 | ||||||||
| Total interest expense | 5,792 | 5,829 | 5,801 | 6,673 | ||||||||||||
| Net interest income | 6,823 | 6,860 | 6,429 | 5,687 | ||||||||||||
| Provision for loan losses | 425 | 465 | 521 | 150 | ||||||||||||
| Total other income, net of securities gains | 871 | 1,122 | 891 | 866 | ||||||||||||
| Net securities gains (losses) | (256 | ) | (1,075 | ) | 225 | 0 | ||||||||||
| Other expense | 4,754 | 4,578 | 5,188 | 4,953 | ||||||||||||
| Income before income taxes | 2,259 | 1,864 | 1,836 | 1,450 | ||||||||||||
| Income tax expense | 560 | 346 | 428 | 233 | ||||||||||||
| Net income | $ | 1,699 | $ | 1,518 | $ | 1,408 | $ | 1,217 | ||||||||
| Earnings per share: | ||||||||||||||||
| Basic | $ | 0.13 | $ | 0.12 | $ | 0.11 | $ | 0.09 | ||||||||
| Diluted | $ | 0.13 | $ | 0.12 | $ | 0.11 | $ | 0.09 | ||||||||
| Weighted average common shares outstanding: | ||||||||||||||||
| Basic | 12,989,304 | 12,990,441 | 13,070,868 | 13,144,747 | ||||||||||||
| Diluted | 12,995,134 | 13,003,954 | 13,083,558 | 13,163,586 | ||||||||||||
At or For the Year Ended December 31, 2009 As PreviouslyReported Reclassification Adjustment Restated (In Thousands, Except Per Share Data ) Consolidated Statement of Condition Data Loans $ 715,453 $ 5,053 $ (900 ) $ 719,606 Allowance for loan losses 8,275 — 436 8,711 Net loans 707,178 5,053 (1,336 ) 710,895 Other assets 21,083 (5,053 ) — 16,030 Total assets 1,196,824 — (1,336 ) 1,195,488 Accounts payable and accrued liabilities 6,160 — (534 ) 5,626 Total liabilities 1,094,273 — (534 ) 1,093,739 Retained earnings 17,870 — (802 ) 17,068 Total stockholders’ equity 102,551 — (802 ) 101,749 Total liabilities and stockholder’s equity 1,196,824 — (1,336 ) 1,195,488 Consolidated Statement of Income Data Provision for loan losses $ 3,261 $ — $ 1,336 $ 4,597 Net interest income, after provision for loan losses 25,204 — (1,336 ) 23,868 Income before income tax expense 6,053 — (1,336 ) 4,717 Income tax expense 1,480 — (534 ) 946 Net income 4,573 — (802 ) 3,771 Net income available to common stockholders 4,006 — (802 ) 3,204 Earnings per common share: Basic $ 0.30 $ — $ (0.06 ) $ 0.24 Diluted 0.30 — (0.06 ) 0.24 Consolidated Statement of Cash Flows Data Net income $ 4,573 $ — $ (802 ) $ 3,771 Cash flows from operating activities: Provision for loan losses 3,261 — 1,336 4,597 Provision for deferred taxes 1,353 (534) 819 Increase in other assets (7,319 ) — 5,587 (1,732 ) Increase (decrease) in other liabilities 54 — (534 ) (480 ) Net cash provided by operating activities 3,622 — 5,053 8,675 Net increase in loans (40,490 ) (5,053 ) — (45,543 ) Net cash (used in) investing activities (101,848 ) (5,053 ) — (106,901 ) Supplemental disclosures of cash flow information: Transfer of loan participation to other receivables $ 5,054 $ (5,054 ) $ 1 $ —
None.
/s/ ParenteBeard LLC
ParenteBeard LLCReading, PennsylvaniaMarch 16, 2010
| /s/ ParenteBeard LLC |
None.
The Corporation responds to this item by incorporating herein by reference the material responsive to such item in the Corporation’s definitive proxy statement for its 2010 Annual MeetingTable of Stockholders. Certain information on Executive Officers of the registrant is included in Part I, Item 3A of this report, which is also incorporated herein by reference.
The Corporation maintains a code of ethics applicable to the Corporation’s chief executive officer, senior financial professional personnel (including the Corporation’s chief financial officer, principal accounting officer or controller and persons performing similar transactions), all other executive officers and all directors. The Corporation also maintains a code of conduct applicable to all other employees. Copies of both codes were filed as exhibits to the Corporation’s Annual Report on Form 10-K for the year ended December 31, 2003. The Corporation will provide copies of such codes to any person without charge, upon request to Anthony C. Weagley, President and Chief Executive Officer, Center Bancorp, Inc., 2455 Morris Avenue, Union, NJ 07083.
The Corporation responds to this item by incorporating herein by reference the material responsive to such item in the Corporation’s definitive proxy statement for its 2010 Annual Meeting of Stockholders.
The Corporation responds to this item by incorporating herein by reference the material responsive to such item in the Corporation’s definitive proxy statement for its 2010 Annual Meeting of Stockholders.
For information related to stock based compensation, see Note 16 of the Notes to Consolidated Financial Statements. The following table gives information about the Corporation’s common stock that may be issued upon the exercise of options, warrants and rights under the Corporation’s 2009 Equity Incentive Plan, 1999 Incentive Plan, 1993 Employee Stock Option Plan, 1993 Outside Director Stock Option Plan and 2003 Non-Employee Director Stock Option Plan as of December 31, 2009. These plans were the Corporation’s only equity compensation plans in existence as of December 31, 2009.
| Plan Category | Number of Securities to Be Issued Upon Exercise of Outstanding Options, Warrants and Rights (a) | Weighted-Average Exercise Price of Outstanding Options, Warrants and Rights (b) | Number of Securities Remaining Available for Future Issuance Under Equity Compensation Plans (Excluding Securities Reflected in Column (a)) (c) | |||||||||
| Equity Compensation Plans Approved by Shareholders | 192,002 | $ | 7.67 – $15.73 | 1,079,622 | ||||||||
| Equity Compensation Plans Not Approved by Shareholders | — | — | — | |||||||||
| Total | 192,002 | $ | 7.67 – $15.73 | 1,079,622 | ||||||||
The Corporation responds to this item by incorporating herein by reference the material responsive to such item in the Corporation’s definitive proxy statement for its 2010 Annual Meeting of Stockholders.
The Corporation responds to this item by incorporating herein by reference the material responsive to such item in the Corporation’s definitive proxy statement for its 2010 Annual Meeting of Stockholders.
| (a) | (1) Financial Statements and Schedules: |
| (b) | Exhibits (numbered in accordance with Item 601 of Regulation S-K) filed herewith or incorporated by reference as part of this annual report. (Note: only Exhibit Nos. 12.1, 23.1, 31.1 and 31.2 are being filed with this Amendment No. 2.) |
Exhibit No. | Description | |
| 3.1 | The Registrant’s Certificate of Incorporation, including the Registrant’s Certificate of Amendment, dated January 8, 2009, is incorporated by reference to Exhibit 3.1 to the Registrant’s Current Report on Form 8-K dated January 13, 2010. | |
| 3.2 | By-Laws of the Registrant is incorporated by reference to Exhibit 3.2 to the Registrant’s Annual Report on Form 10K for the year ended December 31, 1998. | |
| 4.1 | Warrant to Purchase up to 173,410 shares of Common Stock, dated January 9, 2009, is incorporated by reference to Exhibit 4.1 to the Registrant’s Current Report on Form 8-K dated January 13, 2010. | |
| 10.1 | Letter Agreement, dated January 9, 2010, including the Securities Purchase Agreement — Standard Terms attached thereto, between the Registrant and the United States Department of the Treasury is incorporated by reference to Exhibit 10.1 to the Registrant’s Current Report on Form 8-K dated January 13, 2010. | |
| 10.2 | The Registrant’s 1993 Employee Stock Option Plan is incorporated by reference to Exhibit 10.3 to the Registrant’s Annual Report on Form 10-K for the year ended December 31, 1993. | |
| 10.3 | The Registrant’s 1993 Outside Director Stock Option Plan is incorporated by reference to Exhibit 10.4 to the Registrant’s Annual Report on Form 10-K for the year ended December 31, 1993. | |
| 10.5 | The Registrant’s Annual Incentive Plan is incorporated by reference to Exhibit 10.6 to the Registrant’s Annual Report on Form 10-K for the year ended December 31, 2006. | |
| 10.6 | Amended and restated employment agreement among the Registrant, its bank subsidiary and Anthony C. Weagley, effective as of January 1, 2008 is incorporated by reference to Exhibit 10.1 to the Registrant’s Current Report on Form 8-K filed with the SEC on April 22, 2008. | |
| 10.7 | Amended and restated employment agreement among the Registrant, its bank subsidiary and Lori A. Wunder, effective as of January 1, 2007 is incorporated by reference to Exhibit 10.3 to the Registrant’s Current Report on Form 8-K filed with the SEC on February 26, 2007. See also Exhibit 10.27. | |
| 10.8 | A change in control agreement among the Registrant, its bank subsidiary and A. Richard Abrahamian, effective as of February 19, 2008, is incorporated by reference to Exhibit 10.2 to the Registrant’s Current Report on Form 8-K filed with the SEC on April 22, 2008. | |
| 10.9 | Directors’ Retirement Plan is incorporated by reference to Exhibit 10.10 to the Registrant’s Annual Report on Form 10-K for the year ended December 31, 1998. |
Exhibit No. | Description | |
| 10.10 | Center Bancorp, Inc. 1999 Stock Incentive Plan is incorporated by reference to Exhibit 10.11 to the Registrant’s Annual Report on Form 10-K for the year ended December 31, 1999. | |
| 10.11 | Registrant’s Placement Agreement dated December 12, 2003 with Sandler O’Neill & Partners, L.P. to issue and sell $5 million aggregate liquidation amount of floating rate MMCapS(SM) Securities is incorporated by reference to Exhibit 10.15 of the Registrant’s Annual Report on Form 10-K for the year ended December 31, 2003. | |
| 10.12 | Indenture dated as of December 19, 2003, between the Registrant and Wilmington Trust Company relating to $5.0 million aggregate principal amount of floating rate debentures is incorporated by reference to Exhibit 10.16 of the Registrant’s Annual Report on Form 10-K for the year ended December 31, 2003. | |
| 10.13 | Amended and restated Declaration of Trust of Center Bancorp Statutory Trust II, dated as of December 19, 2003 is incorporated by reference to Exhibit 10.17 of the Registrant’s Annual Report on Form 10-K for the year ended December 31, 2003. | |
| 10.14 | Guarantee Agreement between Registrant and Wilmington Trust Company dated as of December 19, 2003 is incorporated by reference to Exhibit 10.18 of the Registrant’s Annual Report on Form 10-K for the year ended December 31, 2003. | |
| 10.16 | Form of Waiver, executed by each of Lori A. Wunder, A. Richard Abrahamian, Ronald M. Shapiro, William J. Boylan and Anthony C. Weagley is incorporated by reference to Exhibit 10.2 to the Registrant’s Current Report on Form 8-K dated January 13, 2009. | |
| 10.17 | Form of Executive Waiver Agreement, executed by each of Lori A. Wunder, A. Richard Abrahamian, Ronald M. Shapiro, William J. Boylan and Anthony C. Weagley is incorporated by reference to Exhibit 10.3 to the Registrant’s Current Report on Form 8-K dated January 13, | |
| 10.18 | Registration Rights Agreement, dated September 29, 2004, relating to securities issued in a September 2004 private placement of securities, is incorporated by reference to Exhibit 10.2 to the Registrant’s Current Report on Form 8-K dated October 1, 2004. | |
| 10.19 | The Registrant’s Amended and Restated 2003 Non-Employee Director Stock Option Plan, as amended and restated, is incorporated by reference to Exhibit 10.1 to the Registrant’s Current Report on Form 8-K dated March 5, 2008. | |
| 10.20 | Amended and restated employment agreement among the Registrant, its bank subsidiary and Julie D’Aloia, effective as of January 1, 2007, is incorporated by reference to Exhibit 10.20 to the Registrant’s Annual Report on Form 10-K for the year ended December 31, 2006. See also Exhibit 10.25. | |
| 10.21 | Amended and restated Employment Agreement among the Registrant, its bank subsidiary and Mark S. Cardone, effective as of January 1, 2007, is incorporated by reference to Exhibit 10.4 to the Registrant’s Current Report on Form 8-K filed with the SEC on February 26, 2007. See also Exhibit 10.26. | |
| 10.22 | Registration Rights Agreement, dated June 30, 2005, relating to securities issued in a June 2005 private placement of securities, is incorporated by reference to Exhibit 10.2 to the Registrant’s Current Report on Form 8-K dated June 30, 2005. | |
| 10.23 | Open Market Share Purchase Incentive Plan is incorporated by reference to exhibit 10.1 to registrant’s Current Report on Form 8-K dated January 26, 2006. | |
| 10.24 | Deferred Compensation Plan is incorporated by reference to Exhibit 10.26 to the Registrant’s Annual Report on Form 10-K for the year ended December 31, 2006. | |
| 10.25 | Amendment to Employment Agreement among the Registrant, its bank subsidiary and Julie D’Aloia, dated December 3, 2007, is incorporated by reference to Exhibit 10.1 to the Registrant’s Current Report on Form 8-K dated December 20, 2007. |
Exhibit No. | Description | |
| 10.26 | Amendment to Employment Agreement among the Registrant, its bank subsidiary and Mark Cardone, dated December 3, 2007, is incorporated by reference to Exhibit 10.2 to the Registrant’s Current Report on Form 8-K dated December 20, 2007. | |
| 10.27 | Amendment to Employment Agreement among the Registrant, its bank subsidiary and Lori A. Wunder, dated December 3, 2007, is incorporated by reference to Exhibit 10.4 to the Registrant’s Current Report on Form 8-K dated December 20, 2007. | |
| 10.28 | Change in Control Agreement among the Registrant, its bank subsidiary and Ronald M. Shapiro is incorporated by reference to Exhibit 10.28 to the Registrant’s Annual Report on Form 10-K for the year ended December 31, 2008. | |
| 11.1 | Statement regarding computation of per share earnings is omitted because the computation can be clearly determined from the material incorporated by reference in this Report. | |
| 12.1 | Statement of Ratios of Earnings to Fixed Charges. | |
| 14.1 | Code of Ethics is incorporated by reference to Exhibit 14.1 of the Registrant’s Annual Report on Form 10-K for the year ended December 31, 2003. | |
| 21.1 | Subsidiaries of the Registrant. | |
| 23.1 | Consent of Independent Registered Public Accounting Firm. | |
| 31.1 | Personal certification of the chief executive officer pursuant to section 302 of the Sarbanes-Oxley Act of 2002. | |
| 31.2 | Personal certification of the | |
| 32.2 | Personal certification of the acting chief financial officer pursuant to section 906 of the Sarbanes-Oxley Act of 2002. | |
| 99.1 | Certification of Chief Executive Officer and Acting Chief Financial Officer pursuant to Section 111 (b) (4) of the Emergency Economic Stabilization Act of 2008. | |
| 99.3 | Code of Conduct is incorporated by reference to Exhibit 99.1 to the Registrant’s Annual Report on Form 10-K for the year ended December 31, 2003. |
| (c) | Financial Statement Schedules |
| CENTER BANCORP, INC. | ||||
May 3, 2010 | By: | /s/ Anthony C. Weagley | ||
| Anthony C. Weagley | ||||
| President and Chief Executive Officer | ||||
| /s/ Alexander A. Bol* | Chairman of the Board | ||
| Alexander A. Bol | |||
/s/ | Director | ||
John J. DeLaney, Jr. | |||
| /s/ James J. Kennedy* | Director | ||
| James J. Kennedy | |||
| /s/ Howard Kent* | Director | ||
| Howard Kent | |||
| /s/ Phyllis S. Klein * | Director | ||
| Phyllis S. Klein | |||
| /s/ Elliot I. Kramer* | Director | ||
| Elliot I. Kramer | |||
| /s/ Nicolas Minoia* | Director | ||
| Nicholas Minoia | |||
| /s/ Harold Schechter* | Director | ||
| Harold Schechter | |||
| /s/ Lawrence B. Seidman* | Director | ||
| Lawrence B. Seidman | |||
| /s/ William A. Thompson* | Director | ||
| William A. Thompson | |||
| /s/ Raymond Vanaria* | Director | ||
| Raymond Vanaria | |||
/s/ Anthony C. Weagley | President and Chief Executive Officer | ||
| Anthony C. Weagley | |||
| /s/ Stephen J. Mauger | Vice President, Treasurer and |
|
72
| *By: | /s/ Anthony C. Weagley | ||||
| Anthony C. Weagley | |||||
Attorney-in-fact |