UNITED STATES
SECURITIES AND EXCHANGE COMMISSION
Washington, D.C. 20549
FORM 10-K
x | ANNUAL REPORT PURSUANT TO SECTION 13 OR 15(d) OF THE SECURITIES EXCHANGE ACT OF 1934 For the fiscal year ended December 31, 2010 |
For the fiscal year ended December 31, 2009
¨[ ] | TRANSITION REPORT PURSUANT TO SECTION 13 OR 15(d) OF THE SECURITIES EXCHANGE ACT OF 1934 For the transition period from _______________ to _______________ |
For the transition period from _______________ to _______________
Commission file number: 0-29466
National Research Corporation
(Exact name of registrant as specified in its charter)
Wisconsin | | 47-0634000 |
(State or other jurisdiction | | (I.R.S. Employer |
of incorporation or organization) | | 47-0634000 (I.R.S. Employer Identification No.) |
| | |
1245 Q Street | | |
Lincoln, Nebraska | | 68508 |
(Address of principal executive offices) | | 68508 (Zip code) |
Registrant’s telephone number, including area code: (402) 475-2525
Securities registered pursuant to Section 12(b) of the Act:
Title of Class Name of Each Exchange on Which Registered Title of Class | | Name of Each Exchange on Which Registered |
Common Stock, $.001 par value | | Common Stock, $.001 par value The NASDAQ Global Market |
Securities registered pursuant to Section 12(g) of the Act: None
Indicate by check mark if the registrant is a well-known seasoned issuer, as defined in Rule 405 of the Securities Act.
Yes ¨ £No xT
Indicate by check mark if the registrant is not required to file reports pursuant to Section 13 or Section 15(d) of the Act.
Yes ¨ £No xT
Indicate by check mark whether the registrant (1) has filed all reports required to be filed by Section 13 or 15(d) of the Securities Exchange Act of 1934 during the preceding 12 months (or for such shorter period that the registrant was required to file such reports), and (2) has been subject to such filing requirements for the past 90 days. Yes x TNo ¨£
Indicate by check mark whether the registrant has submitted electronically and posted on its corporate Web site, if any, every Interactive Data File required to be submitted and posted pursuant to Rule 405 of Regulation S-T during the preceding 12 months (or for such shorter period that the registrant was required to submit and post such files). [Registrant is not yet required to provide financial disclosure in an Interactive Data File Format.] Yes ¨ £No ¨£
Indicate by check mark if disclosure of delinquent filers pursuant to Item 405 of Regulation S-K is not contained herein, and will not be contained, to the best of registrant’s knowledge, in definitive proxy or information statements incorporated by reference in Part III of this Form 10-K or any amendment to this Form 10-K. ¨£
Indicate by check mark whether the registrant is a large accelerated filer, an accelerated filer, a non-accelerated filer or a smaller reporting company. See the definitions of “large accelerated filer,” “accelerated filer” and “smaller reporting company” in Rule 12b-2 of the Exchange Act.
Large accelerated filer ¨ £Accelerated filer ¨ £Non-accelerated filer xT Smaller reporting company ¨£
Indicate by check mark whether the registrant is a shell company (as defined in Rule 12b-2 of the Act.) Yes ¨£ No xT
Aggregate market value of the voting stock held by nonaffiliates of the registrant at June 30, 2009: $42,810,239.2010: $42,424,896.
Indicate the number of shares outstanding of each of the issuer’s classes of common stock, as of the latest practicable date.
Common Stock, $.001$0.001 par value, outstanding as of March 30, 2010: 6,657,60021, 2011: 6,713,407 shares
DOCUMENTS INCORPORATED BY REFERENCE
Portions of the Proxy Statement for the 20102011 Annual Meeting of Shareholders are incorporated by reference into Part III.
TABLE OF CONTENTS
| | |
| | | Page |
| | PART I | |
| | | |
| Item 1. | Business | 1 |
| Item 1A. | Risk Factors | 65 |
| Item 1B. | Unresolved Staff Comments | 118 |
| Item 2. | Properties | 118 |
| Item 3. | Legal Proceedings | 118 |
| | | |
| | PART II | |
| | | |
| Item 5. | Market for Registrant’s Common Equity, Related Stockholder Matters and Issuer Purchases of Equity Securities | 129 |
| Item 6. | Selected Financial Data | 1411 |
| Item 7. | Management’s Discussion and Analysis of Financial Condition and Results of Operations | 1512 |
| Item 7A. | Quantitative and Qualitative Disclosure About Market Risk | 2221 |
| Item 8. | Financial Statements and Supplementary Data | 2322 |
| Item 9. | Changes in and Disagreements with Accountants on Accounting and Financial Disclosure | 4447 |
| Item 9A. | Controls and Procedures | 4447 |
| Item 9B. | Other Information | 4548 |
| | | |
| | PART III | |
| | | |
| Item 10. | Directors and Executive Officers of the Registrant | 4649 |
| Item 11. | Executive Compensation | 4649 |
| Item 12. | Security Ownership of Certain Beneficial Owners and Management and Related Stockholder Matters | 4649 |
| Item 13. | Certain Relationships and Related Transactions | 4750 |
| Item 14. | Principal Accountant Fees and Services | 4750 |
| | | |
| | PART IV | |
| | | |
| Item 15. | Exhibits and Financial Statement Schedules | 4851 |
| Signatures | 51 | 54 |
PART I
Item 1. Business
Special Note Regarding Forward-Looking Statements
Certain matters discussed below in this Annual Report on Form 10-K are “forward-looking statements” intended to qualify forwithin the safe harbors from liability established bymeaning of Section 21E of the Private Securities Litigation Reform Act of 1995.1934, as amended. These forward-looking statements can generally be identified as such because the context of the statements include phrases such as the Company “believes,” “expects” or other words of similar import. Similarly, statements that describe the Company’s future plans, objectives or goals are also forwarding-looking statements. Such forward-looking statements are subject to certain risks and uncertainties which could cause actual results or outcomes to differ materially from those currently anticipated. Factors that could affect actual results or outcomes include, without limitation, the factors set forth in “Risk Factors.” Shareholders, potential investors, and other readers are urged to consider these and other factors in evaluating the forward-looking statements, and are cautioned not to place undue reliance on such forward-looking statements. The forward-looking statements included are only made as of the date of this Annual Report on Form 10-K and the Company undertakes no obligation to publicly update such forward-looking statements to reflect subsequent events or circumstances.
General
National Research Corporation (“NRC”NRC,” the “Company” “we,” “our,” “us” or the “Company”)similar terms), a Wisconsin corporation, believes it is a leading provider of ongoing survey-based performance measurement and improvement services, healthcare analytics and governance education to the healthcare industry in the United States and Canada. The Company believes it has achieved this leadership position based on 2930 years of industry experience and its relationships with many of the industry’s largest payers and providers.organizations. The CompanyCompany’s portfolio of services addresses the growing needs of healthcare providers and payersorganizations to measure and improve satisfaction, quality and cost outcomes relative to the care outcomes, specifically experience and health status, of their patients, residents or members. NRC develops tools that enable healthcare organizations to obtain performance measurement information necessary to comply with industry and regulatory standards, and to improve their business practices soservices that they can maximize resident and/or patient attraction, experience, retention and profitability.
provide. Since its founding 29 years ago in 1981 as ain Lincoln, Nebraska, corporation (the Company reincorporated in Wisconsin in September 1997), NRC has focused on meeting the information needs of the healthcare industry. The Company’s primary typesservices, which are comprehensive, include data collection, healthcare analytics, best practice identification and effective delivery of value-added business intelligence that enables its clients to improve performance across key business metrics. Through its extensive array of service capabilities and industry relationships, NRC is positioned to provide healthcare information services are renewable performance tracking and improvement services, subscription-based governance information and educational services, andto organizations across a renewable syndicated service.wide continuum of service delivery segments.
While performance data has always been of interest to healthcare providers and payers, such information has become increasingly important to these entities as a result of regulatory, industry and competitive requirements. In recent years, the healthcare industry has been under significant pressure from consumers, employers and the government to reduce costs. However, the same parties that demanded cost reductions are now concerned that healthcare service quality is being compromised under managed care. This concern has created a demand for consistent, objective performance information by which healthcare providers and payers can be measured and compared, and on which physicians’ compensation can, in part, be based.
The NRC Solution
The Company addresses the healthcare organizations’industry’s growing need to track theirmeasure and improve performance atacross the enterprise-wide, departmentalbroad and physician/caregiver levels.rapidly changing continuum of healthcare service delivery. The Company has been developing toolsprovides services designed to enable its clients to collect, in an unobtrusive manner, a substantial amount of comparativeobtain and effectively utilize healthcare analytics and business intelligence to improve performance information in orderagainst key metrics relative to analyzesatisfaction, quality and improve their practices to maximize resident and/or patient attraction, experience, retention and profitability. NRC’s performance assessments offer a tangible measurement of health service quality ofcost outcomes across the type currently demanded by consumers, employers, industry accreditation organizations and lawmakers.
organization. The Company’s solutions are designed to respond to managed care’s redefined relationships among consumers, employers, payers and providers. Insteadthe rapidly changing needs of relying exclusively on static, mass-produced questionnaires,the healthcare industry. NRC utilizes a dynamic data collection, processanalysis and business intelligence delivery processes to create a personalized questionnaire which evaluates service issues specificoptimize its clients ability to each respondent’s healthcare experience.improve performance. The flexibility of the Company’s data collection process allows healthcare organizations to add timely, market-driven questions relevant to matters such as industry performance mandates, employer performance guarantees and internal quality improvement initiatives. In addition, the Company assesses core service factors relevant to all healthcare respondent groups (patients, members, employers, employees, physicians, residents, families, etc.) and to all service points of aacross the healthcare system (inpatient, emergency room, outpatient, home health, rehabilitation, behavioral health, long-term care, hospice, assisted living, dental, etc.).delivery continuum.
The Company’s performance trackingmeasurement and improvement services subscription-based educational services, and a renewable syndicated service. The Company has renewable performance tracking tools,healthcare analytics are delivered throughout the healthcare industry under several brand names, including those produced and delivered under its NRC Picker, trade name and My InnerView Inc. (“MIV”), for gatheringTicker, Outcome Concept Systems (“OCS”), which was acquired on August 3, 2010, and analyzing data from survey respondents on an ongoing basis with comparisons over time. These performance tracking tools may be coupled with the Company’s improvement tools to help clients not only measure performance, but know where to focus with ideas and solutions for making improvements. The Company has the capacity to measure performance beyond the enterprise-wide level. It has the ability and experience to determine key performance indicators at the department and individual physician/caregiver measurement levels, where the Company’s services can best guide the efforts of its clients to improve quality and enhance their market position. The improvement services of NRC Picker provide a way of bridging the gap between measurement and improvement. Additional offerings under the Company’s Payer Solutions division include functional disease-specific and health status measurement tools.Canada.
Through its division known as The Governance Institute (“TGI”), NRC offers subscription-based governance information services and educational conferences designed to improve the effectiveness of hospital and healthcare systems by continually strengthening their boards, medical leadership, and management performance in the United States. TGI conducts timely conferences, produces publications, videos, white papers and research studies, and tracks industry trends showcasing the best practices of healthcare boards across the country.
The syndicated NRC Healthcare Market Guide (“Ticker”), a stand-alone market information and competitive intelligence source, as well as a comparative performance database, allows the Company’s clients to assess their performance relative to the industry, to access best practice examples, and to utilize competitive information for marketing purposes.
Growth Strategy
The Company believes that it can continue to grow through (1) expanding the depth and breadthincreasing sales of existing services to its current clients’ performance tracking services programs, since healthcare organizations are increasingly interested in gathering performance information at deeper levels of their organizations and from more of their constituencies,existing clients, (2) increasing the cross-sellingnumber of its complementary services, including subscription-based governance information, (3) adding new clients through penetratingmarket share growth in existing market segments, (3) expanding the sizeable portionsale of the healthcare industry which is not yet conducting performance assessments beyond the enterprise-wide level or is not yet outsourcing this function,existing services into new market segments, (4) introducing new services to new and (4)existing clients, and (5) pursuing acquisitions of, or investments in, firms providing products, services or technologies which complement those of the Company.
Product Offerings
NRC’s data collection process provides ongoing, renewableThe Company’s performance trackingmeasurement and is the platform of the Company’s online tools. This performance tracking program efficiently coordinates and centralizes an organization’s satisfaction monitoring, thereby establishing a uniform methodology and survey instrument needed to obtain valid performance information and improve quality. Using the industry method of mail, telephone, or internet-based data collection, this assessment process monitors the patient’s or stakeholder’s experience across healthcare respondent groups (patients, members, employers, employees, physicians, resident, family, etc.) and service settings (inpatient, emergency room, outpatient, long-term care etc.). Rather than be limited to only static, mass-produced questionnaires which provide limited flexibility and performance insights, NRC’s proprietary software generates individualized questionnaires, including personalization such as patient name, treating caregiver name, encounter date and, in some cases, theimprovement services received. To enhance the response rates and the relevance of performance data and to be flexible and responsive to healthcare organizations’ changing information needs, NRC creates personalized questionnaires which evaluate service issues specific to each respondent’s healthcare experience and includes questions which address core service factors throughout a healthcare organization.
Unlike some of its competitors, which use multiple questionnaires often sent to the same respondents, the Company gathers data through one questionnaire, the contents of which are selected from the Company’s library of questions after a client’s needs are determined. As a result, the Company’s renewable performance tracking programs and data collection processes (1) realize higher response rates, obtain data more efficiently, and thereby provide healthcare organizations with more feedback, (2) eliminate over-surveying (where one respondent receives multiple surveys), and (3) allow healthcare organizations to adapt questionnaire content to address management objectives and to assess quality improvement programs or other timely marketplace issues.
The Company recognizes that performance programs must do more than just measure the experiences; they must measure and facilitate improvement. The Company offers solutions designed to enable its clients to effectively measurecollect, analyze and utilize meaningful business intelligence to improve the most important aspects of the patient’s or stakeholder’s experience. NRC’sperformance relative to satisfaction, quality, cost, clinical outcomes and other key performance metrics. NRC has developed proprietary web-based electronic delivery systems that provide clients the ability to review results and reports online, independently analyze data, query data sets, customize a number of reports and distribute reports electronically. The Company has also developed online improvement tools, including a one-page reportbusiness intelligence solutions which provides a basis on which improvements can be made, shows healthcare organizations which service factors impact their customer group’s value and which have the greatest impact on satisfaction levels, and how their performance in relationship to theseprovide clients with current key indicators changes over time.
Ticker serves as a stand-alone market information and competitive intelligence source,metric results, as well as a comparative performance database. Ticker is the largest consumer-based assessment of consumers’ perceptions of, and satisfaction with, hospitals and health systems in more than 300 markets across the country, representing the views of more than 267,000 households across nearly every county in the continental United States. Ticker provides comprehensive assessments, including consumer quality perceptions, product-line preferences, service use and visit satisfaction for more than 3,200 hospitals and health systems. More than 200 data items relevant to healthcare payers, providers and purchasers are reported in the Ticker, including hospital quality and image ratings, hospital selection factors, household preventative health behaviors, presence of chronic conditions, and contemporary issues such as healthcare internet utilization. Clients can purchase customized versions specific to their local service areas, with the ability to benchmark performance results to over 300 metro areas, 48 states or nationally. Ticker is delivered to clients via Ticker’s exclusive web-based electronic delivery system, which features easy to use graphs, charts and various report formats for multiple users within the client’s organization. Another feature of the web-based system is a national name search designed to allow a healthcare organization with a national or regional presence to simultaneously compare the performance of all its sites and pinpoint where strengths and weaknesses exist. Clients who have renewed for multiple years of the study may utilize the system’s trending capability which details how the performance of the healthcare organization changes over time. The proprietary Ticker data results are also used to produce reports which are customized to meet the specific information needs of existing clients, as well as new healthcare markets beyond the Company’s traditional client base.best practice benchmarking information.
Through TGI, the Company offers subscription-based membership services. The information and education services are provided for the boards of directors and medical leadership of hospital and healthcare systems. These services are sold and delivered in the form of a twelve-month subscription membership and include accredited leadership conference and educational programs, customized research reports, board advisory services, videos, books, policy guidelines, board self-assessment tools, white papers, newsletters, and fax surveys. The Company’s leadership conferences are available to all prospective members by paying the applicable conference fee. The Company also sells publications, periodicals, reference books, and associated videos through its resource catalog.
The Company’s MIV division is a leading provider of qualityperformance measurement and performance improvement solutionsservices to the senior care profession. MIV offers resident, family and employee satisfaction measurement and improvement products to the long-term care, assisted and independent living markets in the United States. MIV works with over 8,000 senior-care providers throughout the United States, housing what the Company believes is the largest dataset of senior-care satisfaction metrics in the nation.
The OCS division is a leading provider of quality and performance improvement solutions to the home health market. OCS provides performance measurement and improvement services, healthcare analytics and hosted software solutions to a large segment of the leading home healthcare providers in the United States.
Ticker serves as a market information and competitive intelligence source, as well as a comparative performance database. Ticker is the largest consumer-based study of consumers’ perceptions of, and satisfaction with, hospitals and health systems in more than 300 markets across the country, representing the views of approximately 265,000 households in the largest markets in the continental United States. Ticker provides comprehensive assessments, including consumer quality perceptions, product-line preferences, service use and visit satisfaction for more than 4,900 hospitals and health systems. More than 200 data items relevant to healthcare providers and purchasers are reported in Ticker, including hospital quality and image ratings, hospital selection factors, household preventative health behaviors, presence of chronic conditions, and emerging market issues such as social media and retail mini clinics.
Through TGI, the Company offers subscription-based governance education services. These education services are provided for the boards of directors and medical leadership of hospital and healthcare systems. The Company provides information regarding organization governance as well as emerging healthcare issues through online content, publications, periodicals, reference books, and associated videos through its resource catalog. The Company also produces several executive healthcare leadership conferences each year which are exclusively available to clients.
Clients
The Company’s ten largest clients accounted for 14%19%, 24%19%, and 29%24% of the Company’s total revenue in 2010, 2009 2008 and 2007,2008, respectively. Approximately 8%, 8%, and 9% of the Company’s revenue was derived from foreign customers in 2010, 2009, 2008, and 2007, respectively.2008.
Sales and Marketing
The Company generates the majority of its revenue from client renewals, supplemented by its internal marketing effortssales of new products and services to existing clients and the addition of new clients. NRC sales activities are carried out by a direct sales force. Sales associates direct NRC’sorganization staffed with professional, trained sales efforts from Nebraska, Wisconsin and California in the United States, and from Toronto in Canada.associates. As compared to the typical industry practice of compensating sales peopleassociates with relatively high base pay and a relatively small sales commission, NRC compensates its sales associatesstaff with relatively low base pay and a relatively high per-sale commission.commission component. The Company believes this compensation structure provides incentives to its sales associates to surpass sales goals and increases the Company’s ability to attract top-quality sales associates.
Marketing efforts support theIn addition to prospect leads generated by direct sales force’s new business generation and project renewal initiatives. NRC conducts directassociates, the Company’s integrated marketing campaigns and public relations programs.activities facilitate its ongoing receipt of prospect request-for-proposals. NRC uses lead generation mechanisms to add generated leads to its database of current and potential client contacts. Finally, the Company’sThe Company also maintains an active public relations program which includes (1) an ongoing presence in leading industry trade press and in the mainstream press, (2) public speaking at strategic industry conferences, (3) fostering relationships with key industry constituencies, and (4) the annual Consumer Choice Award program recognizing top-ranking hospitals in more than 250 markets.healthcare organizations.
The Company’s integrated marketing activities facilitate its ongoing receipt of project requests-for-proposals, as well as direct sales force initiated prospect contacts. The sales process typically spans a 120-day period encompassing the identification of a healthcare organization’s information needs, the education of prospects on NRC solutions (via proposals and in-person sales presentations), and the closing of the sale. The Company’s sales cycle varies depending on the particular service being marketed and the size of the potential project. The subscription-based services typically have a shorter sales cycle.
Competition
The healthcare information and market research services industry is highly competitive. The Company has traditionally competed with healthcare organizations’ internal marketing, market research and/or quality improvement departments which create their own performance measurement tools, and with relatively small specialty research firms which provide survey-based healthcare market research and/or performance assessment. The Company’s mainprimary competitors among such specialty firms areinclude Press Ganey, which NRC believes has revenue that is significantly largerhigher annual revenue than the Company’s revenue,Company, and three or four other companies whichfirms that NRC believes have less annual revenue smaller than the Company’s revenue.Company. The Company, to a certain degree, currently competes with, and anticipates that in the future it may increasingly compete with, (1) traditional market research firms which are significant providers of survey-based, general market research and (2) firms which provide services or products that complement healthcare performance assessments such as healthcare software or information systems. Although only a few of these competitors have to-date offered survey-based, healthcare market researchspecific services that competescompete directly with the Company’s services, many of these competitors have substantially greater financial, information gathering, and marketing resources than the Company and could decide to increase their resource commitments to the Company’s market. There are relatively few barriers to entry into the Company’s market, and the Company expects increased competition in its market which could adversely affect the Company’s operating results through pricing pressure, increased marketing expenditures, and market share losses, among other factors. There can be no assurance that the Company will continue to compete successfully against existing or new competitors.
The Company believes the primary competitive factors within its market include quality of service, timeliness of delivery, unique service uniqueness,capabilities, credibility of provider, industry experience, and price. NRC believes that its industry leadership position, exclusive focus on the healthcare industry, dynamic questionnaire,survey tools, syndicated products,market research, accredited leadership conferences, educational programs, comparative performancebenchmarking database information, and relationships with leading healthcare payers and providers position the Company to compete in this market.
Intellectual Property and Other Proprietary Rights
The Company’s success depends in part upon its data collection processes, research methods, data analysis techniques and internal systems, and procedures that it has developed specifically to serve clients in the healthcare industry. The Company has no patents. Consequently, it relies on a combination of copyright and trade secret laws and associate nondisclosure agreements to protect its systems, survey instruments and procedures. There can be no assurance that the steps taken by the Company to protect its rights will be adequate to prevent misappropriation of such rights or that third parties will not independently develop functionally equivalent or superior systems or procedures. The Company believes that its systems and procedures and other proprietary rights do not infringe upon the proprietary rights of third parties. There can be no assurance, however, that third parties will not assert infringement claims against the Company in the future or that any such claims will not result in protracted and costly litigation, regardless of the merits of such claims or whether the Company is ultimately successful in defending against such claims.
Associates
As of December 31, 2009,2010, the Company employed a total of 260253 persons on a full-time basis. In addition, as of such date, the Company had 4252 part-time associates primarily in its survey operations, representing approximately 2028 full-time equivalent associates. None of the Company’s associates are represented by a collective bargaining unit. The Company considers its relationship with its associates to be good.
Executive Officers of the Registrant
The following table sets forth certain information as of March 1, 2010,2011, regarding the executive officers of the Company:
| Name | | Age | | Position |
| | | | |
| Michael D. Hays | | 5556 | | President, Chief Executive Officer and Director |
| | | | | |
| Patrick E. Beans | | 5253 | | Vice President, Treasurer, Chief Financial Officer, Secretary and Director |
Michael D. Hays has served as Chief Executive Officer and a director since he founded the Company in 1981. He was appointed to the additional role of President of the Company in July 2008, a position in which he also served from 1981 to 2004. Prior to founding the Company, Mr. Hays served for seven years as a Vice President and a director of SRI Research Center, Inc. (n/k/a the Gallup Organization).
Patrick E. Beans has served as Vice President, Treasurer, Chief Financial Officer, Secretary and a director since 1997. He has served1997, and as the principal financial officer since he joined the Company in August 1994. From June 1993 until joining the Company, Mr. Beans was the finance director for the Central Interstate Low-Level Radioactive Waste Commission, a five-state compact developing a low-level radioactive waste disposal plan. From 1979 to 1988 and from June 1992 to June 1993, he practiced as a certified public accountant.
Executive officers of the Company are elected by and serve at the discretion of the Company’s Board of Directors. There are no family relationships between any directors or executive officers of NRC.
Item 1A. Risk Factors
You should carefully consider each of the risks described below, together with all of the other information contained in this Annual Report on Form 10-K, before making an investment decision with respect to our securities. If any of the following risks develop into actual events, our business, financial condition or results of operations could be materially and adversely affected and you may lose all or part of your investment.
We depend on performance tracking contract renewals for a large share of our revenue and our operating results could be adversely affected.
We expect that a substantial portion of our revenue for the foreseeable future will continue to be derived from renewable performance tracking services.service contracts. Substantially all contracts for such services are renewable annually at the option of our clients, although a client generally has no minimum purchase commitment under a contract and the contracts are generally cancelable on short or no notice without penalty. To the extent that clients fail to renew or defer their renewals, from the quarter we anticipate our quarterly results may be materially adversely affected. Our ability to secure renewals depends on, among other things, our ability to gather and analyze performance data in a consistent, high-quality, and timely fashion. In addition, the performance tracking and market research activitiesservice needs of our clients are affected by accreditation requirements, enrollment in managed care plans, the level of use of satisfaction measures in healthcare organizations’ overall management and compensation programs, the size of operating budgets, clients’ operating performance, industry and economic conditions, and changes in management or ownership. As these factors are beyond our control, we cannot assure youensure that we will be able to maintain our renewal rates. Any material decline in renewal rates from existing levels would have an adverse effect on our revenue and a corresponding effect on our operating and net income.
Our operating results may fluctuate on a quarterly basis and this may cause our stock price to decline.
Our operating results have fluctuated from period to period in the past and will likely fluctuate significantly in the future due to various factors. There has historically been fluctuation in our financial results related to Ticker, a stand-alone market information intelligence source and comparative performance database. In the future, we expect such fluctuations will continue, but to a lesser degree. Until May 2008, Ticker was deliverable on an annual basis, and historically we recognized revenue when it was delivered to the principal customers pursuant to their contracts, typically in the third quarter of the year. Substantially all of the related costs were deferred and subsequently charged to direct expenses contemporaneously with the recognition of the revenue. Starting in May 2008, the Company began providing Ticker subscription-based services to clients on a monthly basis generally over a twelve-month period. Accordingly, we now recognize much of the Ticker revenue ratably over a twelve-month period and, since October of 2008, all of the related costs are expensed in the month they are incurred. We will continue to have some annual sales which could increase fluctuation of operating results in the third quarter. A delay in completing and delivering Ticker, the timing of which is dependent upon our ability to access a third-party’s respondent panel on a timely basis, could delay recognition of such revenue and expenses which could materially affect operating results for the affected periods. We generate additional revenue from incidental customers subsequent to the completion of each monthly edition. Revenue and costs for these subsequent services are recognized as the services are performed and completed.
In addition, our overall operating results may fluctuate as a result of a variety of other factors, including the size and timing of orders from clients, client demand for our services (which, in turn, is affected by factors such as accreditation requirements, enrollment in managed care plans, operating budgets and clients’ operating performance), the hiring and training of additional staff, postal rate changes,expense increases, and industry and general economic conditions. Because a significant portion of our overhead is fixed in the short-term, particularly some costs associated with owning and occupying our building and full-time personnel expenses, is fixed in the short-term, our results of operations may be materially adversely affected in any particular quarterperiod if revenue falls below our expectations. These factors, among others, make it possible that in some future quarterperiod our operating results may be below the expectations of securities analysts and investors which would have a material adverse effect on the market price of our common stock.
We operate in a highly competitive market and could experience increased price pressure and expenses as a result.
The healthcare information and market research services industry is highly competitive. We competehave traditionally competed with healthcare organizations’ internal marketing, market research and/or quality improvement departments that create their own performance measurement tools, and with relatively small specialty research firms that provide survey-based healthcare market research and/or performance assessment. Our mainThe Company’s primary competitors among such specialty firms areinclude Press Ganey, which we believe has significantly higher annual revenue that is significantly larger than our revenue,us, and three or four other companiesfirms that we believe have less annual revenue that is smaller than our revenue. We, tous. To a certain degree, we currently compete with, and we anticipate that in the future we may increasingly compete with, (1) traditional market research firms thatwhich are significant providers of survey-based, general market research, and (2) firms thatwhich provide services or products that complement healthcare performance assessments, such as healthcare software or information systems. Although only a few of these competitors have to-date offered survey-based, healthcare market researchspecific services that competescompete directly with our services, many of these competitors have substantially greater financial, information gathering, and marketing resources than we do,the Company and could decide to increase their resource commitments to our market. There are relatively few barriers to entry into ourthe Company’s market, and we expect increased competition in our market which could adversely affect our operating results through pricing pressure, increased client service and marketing expenditures, and market share losses, among other factors. We cannot assure youThere can be no assurance that wethe Company will continue to compete successfully against existing or new competitors, and our revenue and operating net income could be adversely affected as a result.competitors.
Because our clients are concentrated in the healthcare industry, our revenue and operating results may be adversely affected by changes in regulations, a business downturn or consolidation with respect to the healthcare industry.
Substantially all of our revenue is derived from clients in the healthcare industry. As a result, our business, financial condition and results of operations are influenced by conditions affecting this industry, including changing political, economic, competitive and regulatory influences that may affect the procurement practices and operation of healthcare providers and payers. Recently, Congressional leaders enacted a comprehensive healthcare reform plan, including provisions to control healthcare costs, improve healthcare quality and expand access to affordable health insurance. These programs could result in lower reimbursement rates and otherwise change the environment in which providers and payers operate. In addition, large private purchasers of healthcare services are placing increasing cost pressure on providers. Healthcare providers may react to these cost pressures and other uncertainties by curtailing or deferring purchases, including purchases of our services. Moreover, there has been consolidation of companies in the healthcare industry, a trend which we believe will continue to grow. Consolidation in this industry, including the potential acquisition of certain of our clients, could adversely affect aggregate client budgets for our services or could result in the termination of a client’s relationship with us. The impact of these developments on the healthcare industry is difficult to predict and could have an adverse effect on our revenue and a corresponding effect on our operating and net income.
In March 2010, President Obama signed into law the Patient Protection and Affordable Care Act and the Health Care and Education Reconciliation Act of 2010. The new legislation makes extensive changes to the current system of healthcare insurance and benefits that will include changes in Medicare and Medicaid payment policies and other healthcare delivery reforms that could potentially impact the Company’s business. At this time, it is difficult to estimate the impact of this legislation on the Company.
We rely on a limited number of key clients and a loss of one or more of these key clients will adversely affect our operating results.
We rely on a limited number of key clients for a substantial portion of our revenue. The Company’s ten largest clients accounted for 14%19%, 24%19%, and 29%24% of the Company’s total revenue in 2010, 2009, 2008, and 2007,2008, respectively.
We cannot assure you that we will maintain our existing client base, maintain or increase the level of revenue or profits generated by our existing clients, or be able to attract new clients. Furthermore, the healthcare industry continues to undergo consolidation and we cannot assure you that such consolidation will not cause us to lose clients. The loss of one or more of our large clients or a significant reduction in business from such clients, regardless of the reason, willmay have a negative effect on our revenue and a corresponding effect on our operating and net income. See “Risk Factors - Because our clients are concentrated in the healthcare industry, our revenue and operating results may be adversely affected by changes in regulations, a business downturn or consolidation with respect to the healthcare industry.”
Our future success depends on our ability to manage our growth, including identifying acquisition candidates and effectively integrating acquired companies.
Since our inception, our growth has placed significant demands on our management, administrative, operational and financial resources. In order to manage our growth, we will need to continue to implement and improve our operational, financial and management information systems, and continue to expand, motivate and effectively manage an evolving workforce. If our management is unable to effectively manage under such circumstances, the quality of our services, our ability to retain key personnel, and our results of operations could be materially adversely affected. Furthermore, we cannot assure you that our business will continue to expand. Reductions in clients’ spending on performance tracking and market research, increased competition, pricing pressures, and other general economic and industry trends could adversely affect our growth.
We may achieve a portion of our future revenue growth, if any, through acquisitions of complimentary businesses, products, services or technologies, although we currently have no commitments or agreements with respect to any such acquisitions. We have encountered minor problems with integrating people and processes in connection with past acquisitions. We cannot assure you that the integration of any possible future acquisitions will be managed without incurring higher than expected costs and expenses. In addition, we cannot assure you that, as a result of such unexpected costs and expenses, any possible future acquisition will not negatively affect our operating and net income.
We face several risks relating to our ability to collect the data on which our business relies.
Our ability to provide timely and accurate performance trackingmeasurement and market researchimprovement services to our clients depends on our ability to collect large quantities of high-quality data through surveys and interviews. If receptivity to our survey and interview methods by respondents declines, or for some other reason their willingness to complete and return surveys declines, or if we, for any reason, cannot rely on the integrity of the data we receive, then our revenue could be adversely affected, with a corresponding effect on our operating and net income. In addition, we currently rely primarily on mail and telephone surveys for gathering information. If one or more of our competitors were to develop an online survey process that more effectively and efficiently gathers information, then we would be at a competitive disadvantage and our revenue could be adversely affected, with a corresponding effect on our operating and net income.
We also rely on third-party panels of pre-recruited consumer households to produce Ticker in a timely manner. If we are not able to continue to use these panels, or the time period in which we use these panels is altered and we cannot find alternative panels on a timely, cost-competitive basis, we could face an increase in our costs or an inability to effectively produce Ticker. In either case, our operating and net income wouldcould be negatively affected.
Our principal shareholder effectively controls our company.
Michael D. Hays, our President and Chief Executive Officer, beneficially owned 26.7%66.8% of our outstanding common stock as of March 30, 2010.10, 2011. In addition, Mr. Hays and his wife havehas created certaina grantor retained annuity truststrust and havehas transferred to such truststrust shares representing in the aggregate, approximately 45.1%4.2% of our outstanding common stock as of March 30, 2010,10, 2011, all or a portion of which, will be returned to Mr. Hays or his wife over the next two years.year. As a result, Mr. Hays can or will be able to, control matters requiring shareholder approval, including the election of directors and the approval of significant corporate matters such as change of control transactions. The effects of such influence could be to delay or prevent a change of control of our company unless the terms are approved by Mr. Hays.
Our business and operating results could be adversely affected if we are unable to attract or retain key managers and other personnel.
Our future performance willmay depend, to a significant extent, upon the efforts and ability of our key personnel who have expertise in gathering, interpreting and marketing survey-based performance information for healthcare markets. Although client relationships are managed at many levels within our company, the loss of the services of Michael D. Hays, our President and Chief Executive Officer, or one or more of our other senior managers, could have a material adverse effect, at least in the short to medium term, on most significant aspects of our business, including strategic planning, product development, and sales and customer relations. As of December 31, 2009,2010, we maintained $500,000 of key officer life insurance on Mr. Hays. Our success will also depend on our ability to hire, train and retain skilled personnel in all areas of our business. Currently, we do not have employment agreements with our officers or our other key personnel. Competition for qualified personnel in our industry is intense, and many of the companies that compete with us for qualified personnel have substantially greater financial and other resources than us. Furthermore, we expect competition for qualified personnel to become more intense as competition in our industry increases. We cannot assure you that we will be able to recruit, retain and motivate a sufficient number of qualified personnel to compete successfully.
If intellectual property and other proprietary information technology were copied or independently developed by our competitors, our operating results could be negatively affected.
Our success depends in part upon our data collection process, research methods, data analysis techniques, and internal systems and procedures that we have developed specifically to serve clients in the healthcare industry. We have no patents. Consequently, we rely on a combination of copyright, trade secret laws and associate nondisclosure agreements to protect our systems, survey instruments and procedures. We cannot assure you that the steps we have taken to protect our rights will be adequate to prevent misappropriation of such rights, or that third parties will not independently develop functionally equivalent or superior systems or procedures. We believe that our systems and procedures and other proprietary rights do not infringe upon the proprietary rights of third parties. We cannot assure you, however, that third parties will not assert infringement claims against us in the future, or that any such claims will not result in protracted and costly litigation, regardless of the merits of such claims, or whether we are ultimately successful in defending against such claims.
Errors in, or dissatisfaction with, performance tracking and other surveys could adversely affect our business.
Many healthcare providers, payers and other entities or individuals use our renewable performance tracking and other healthcare surveys in promoting and/or operating their businesses, and as a factor in determining physician or employee compensation. Consequently, any errors in the data received or in the final surveys, as well as the actual results of such surveys, can have a significant impact on such providers’, payers’ or other entities’ businesses, and on any such individual’s compensation. In addition, parties who have not performed well in our surveys may be dissatisfied with the results of the surveys or the manner in which the results may be used by competitors or others. Although any such errors or dissatisfaction with the results of the surveys, or the manner in which the surveys have been used, has not resulted in litigation against us, we cannot assure you that we will not face future litigation, which may be costly, as a result of a healthcare provider’s, payer’s, other entity’s or individual’s allegation of errors in our surveys or dissatisfaction with the results thereof.
Regulatory developments could adversely affect our revenue and results of operations.
In the operation of our business, we have access to, or gather certain confidential information, such as medical histories of our respondents. As a result, we could be subject to potential liability for any inappropriate disclosure or use of such information. Even if we do not improperly disclose confidential information, privacy laws, including the U.S. Health Insurance Portability and Accountability Act of 1996, the U.S. Patriot Act and Canadian legislation relating to personal health information, have had, and could in the future have, the effect of increasing our costs and restricting our ability to gather and disseminate information which could ultimately have a negative effect on our revenue.
Several years ago, the Centers for Medicare and Medicaid Services initiated a nationwide effort to collect and publicly report hospital quality data, including the patient experience of care questionnaire. This questionnaire is called the HCAHPS questionnaire and was developed by the Agency for Healthcare Research and Quality. After several years of development and consensus building, the HCAHPS survey program began in 2006. This survey program may increase competition and pricing pressures, which could adversely affect our operating and net income.
The enactment of the new comprehensive healthcare reform plan will include changes in Medicare and Medicaid payment policies and other healthcare delivery reforms that could potentially impact our business.
Item 1B. | Unresolved Staff Comments |
Item 1B. Unresolved Staff Comments
The Company has no unresolved staff comments to report pursuant to this item.
Item 2. Properties
The Company’s headquarters is located in an owned office building in Lincoln, Nebraska, of which 62,000 square feet are used for the Company’s operations. This facility houses all the capabilities necessary for NRC’s survey programming, printing and distribution, data processing, analysis and report generation, marketing, and corporate administration.
The Company’s Canadian officeCompany is located in a rentedleasing 2,600 square footfeet of office buildingspace in Markham, Ontario. The operationsOntario, 5,100 square feet of TGI are locatedoffice space in San Diego, California where the Company leases 6,100and 8,900 square feet of office space. MIV’s operations are locatedspace in Wausau, Wisconsin, where theSeattle, Washington. The Company leasesalso leased 8,500 square feet of office space.space in Wausau, Wisconsin until February 1, 2011.
Item 3. Legal Proceedings
The Company is not subject to any material pending litigation.
PART II
Item 5. Market for the Registrant’s Common Equity, Related Stockholder Matters and Issuer Purchases of Equity Securities
The Company’s Common Stock, $.001$0.001 par value (“Common Stock”), is traded on the NASDAQ Global Market under the symbol “NRCI.” The following table sets forth the range of high and low sales prices for, and dividends declared on, the Common Stock for the period from January 1, 2008,2009, through December 31, 2009:2010:
| | | High | | | Low | | | Dividends Declared Per Common Share | |
| 2009 Quarter Ended: | | | | | | | | | |
| March 31 | | $29.01 | | | $19.48 | | | $.16 | |
| June 30 | | $28.10 | | | $23.10 | | | $.16 | |
| September 30 | | $26.74 | | | $23.55 | | | $.16 | |
| December 31 | | $25.30 | | | $20.32 | | | $.16 | |
| | | High | | | Low | | | Dividends Declared Per Common Share | | |
| | | | | | | | | | | |
| 2008 Quarter Ended: | | | | | | | | | | |
| 2010 Quarter Ended: | | | | | | | |
| March 31 | | $ | 27.94 | | | $ | 24.75 | | | $ | .14 | | | $25.91 | | | $19.00 | | | $.19 | |
| June 30 | | $ | 32.06 | | | $ | 25.14 | | | $ | .14 | | | $27.50 | | | $21.45 | | | $.19 | |
| September 30 | | $ | 35.58 | | | $ | 23.01 | | | $ | .14 | | | $26.90 | | | $22.07 | | | $.19 | |
| December 31 | | $ | 34.93 | | | $ | 19.00 | | | $ | .14 | | | $35.33 | | | $25.21 | | | $.19 | |
| | | | | | | | | | | | | | |
| 2009 Quarter Ended: | | | | | | | | | | | | | |
| March 31 | | $ | 29.01 | | | $ | 19.48 | | | $ | .16 | | |
| June 30 | | $ | 28.10 | | | $ | 23.10 | | | $ | .16 | | |
| September 30 | | $ | 26.74 | | | $ | 23.55 | | | $ | .16 | | |
| December 31 | | $ | 25.30 | | | $ | 20.32 | | | $ | .16 | | |
On March 30, 2010,10, 2011, there were approximately 1926 shareholders of record and approximately 500400 beneficial owners of the Common Stock.
In March 2005, the Company announced the commencement of a quarterly cash dividend. Cash dividends of $4.3$5.1 million and $3.8$4.3 million in the aggregate were declared and paid during the twelve-month periods ended December 31, 20092010 and 2008,2009, respectively. The payment and amount of future dividends is at the discretion of the Company’s Board of Directors and will depend on the Company’s future earnings, financial condition, general business conditions and other factors.
The table below summarizesIn February 2006, the Company’s repurchasesBoard of itsDirectors of the Company authorized the repurchase of 750,000 shares of common stock duringin the three-monthopen market or in privately negotiated transactions. As of December 31, 2010, the remaining number of shares that could be purchased under this authorization was 268,717. There was no stock repurchased in the three month period ended December 31, 2009.
| Period | | Total Number of Shares Purchased | | | Average Price Paid Per Share | | | Total Number of Shares Purchased as Part of Publicly Announced Plans or Programs(1) | | | Maximum Number of Shares That May Yet Be Purchased Under the Plans or Programs | |
| | | | | | | | | | | | | |
| October 1 - October 31, 2009 | | | — | | | | — | | | | — | | | | 289,275 | |
| | | | | | | | | | | | | | | | | |
| November 1 - November 30, 2009 | | | — | | | | — | | | | — | | | | 289,275 | |
| | | | | | | | | | | | | | | | | |
| December 1 - December 31, 2009 | | | 210 | | | $ | 21.69 | | | | 210 | | | | 289,065 | |
(1) | In February 2006, the Company’s Board of Directors authorized a stock repurchase plan providing for the repurchase of an additional 750,000 shares. The plan has no expiration date. |
2010.
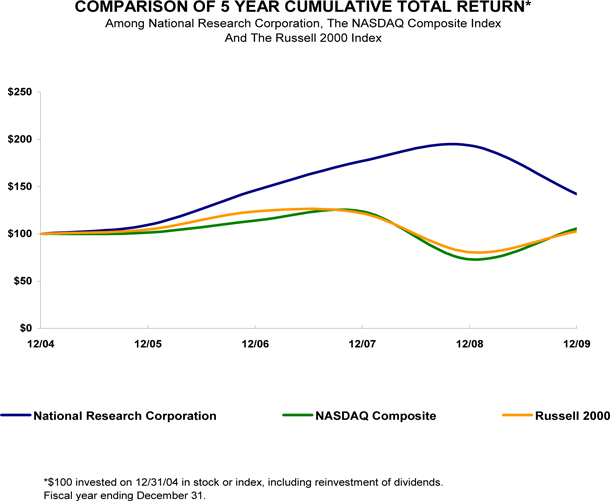
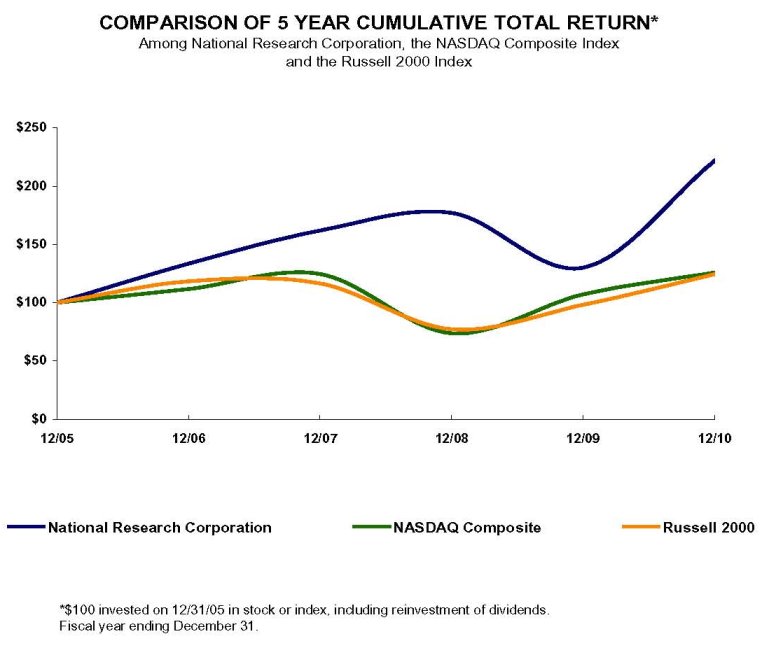
The following graph compares the cumulative 5-year total return provided shareholders on National Research Corporation's common stock relative to the cumulative total returns of the NASDAQ Composite Index and the Russell 2000 Index. An investment of $100 (with reinvestment of all dividends) is assumed to have been made in our common stock and in each of the indexes on December 31, 2004,2005, and its relative performance is tracked through December 31, 2009.2010.
COMPARISON OF FIVE-YEAR CUMULATIVE TOTAL RETURN DATA
| | | |
| | | | 12/04 | | | | 12/05 | | | | 12/06 | | | | 12/07 | | | | 12/08 | | | | 12/09 | | | 12/05 | 12/06 | 12/07 | 12/08 | 12/09 | 12/10 |
| | | | | | | | | | | | | | | | | | | | | | | | | | |
| National Research Corporation | | | 100.00 | | | | 109.35 | | | | 146.03 | | | | 177.05 | | | | 193.68 | | | | 142.27 | | National Research Corporation | 100.00 | 133.54 | 161.91 | 177.12 | 130.11 | 221.81 |
| | | | | | | | | | | | | | | | | | | | | | | | | | |
| NASDAQ Composite | | | 100.00 | | | | 101.33 | | | | 114.01 | | | | 123.71 | | | | 73.11 | | | | 105.61 | | | 100.00 | 111.74 | 124.67 | 73.77 | 107.12 | 125.93 |
| | | | | | | | | | | | | | | | | | | | | | | | | | |
| Russell 2000 | | | 100.00 | | | | 104.55 | | | | 123.76 | | | | 121.82 | | | | 80.66 | | | | 102.58 | | | 100.00 | 118.37 | 116.51 | 77.15 | 98.11 | 124.46 |
The stock price performance included in this graph is not necessarily indicative of future stock price performance.
Item 6. | Selected Financial Data |
Item 6. Selected Financial Data
The selected statement of income data for the years ended December 31, 2010, 2009, 2008, and 2007,2008, and the selected balance sheet data at December 31, 20092010 and 2008,2009, are derived from, and are qualified by reference to, the audited consolidated financial statements of the Company included elsewhere in this Annual Report on Form 10-K. The selected statement of income data for the years ended December 31, 20062007 and 2005,2006, and the balance sheet data at December 31, 2008, 2007, 2006, and 2005,2006, are derived from audited consolidated financial statements not included herein. The Company has made acquisitions and began recognizing share-based compensation expense during the five years covered by the selected statement financial data. See Note 2 and Note 7 to the Company's consolidated financial statements.
| | | Year Ended December 31, | | |
| | | 2009 | | | 2008 | | | 2007 | | | 2006 | | | 2005 | | | Year Ended December 31, | |
| | | (In thousands, except per share data) | | | 2010 | | | 2009 | | | 2008 | | | 2007 | | | 2006 | |
| | | | | | (In thousands, except per share data) | |
| Statement of Income Data: | | | | | | | | | | | | | | | | | | | | | | | | | | | | | | |
| Revenue | | $ | 57,692 | | | $ | 51,013 | | | $ | 48,923 | | | $ | 43,771 | | | $ | 32,437 | | | $ | 63,398 | | | $ | 57,692 | | | $ | 51,013 | | | $ | 48,923 | | | $ | 43,771 | |
| Operating expenses: | | | | | | | | | | | | | | | | | | | | | | | | | | | | | | | | | | | | | | | | |
| Direct expenses | | | 24,574 | | | | 23,611 | | | | 21,801 | | | | 19,445 | | | | 13,642 | | | | 24,635 | | | | 24,148 | | | | 23,611 | | | | 21,801 | | | | 19,445 | |
| Selling, general and administrative | | | 15,590 | | | | 12,728 | | | | 13,173 | | | | 12,158 | | | | 8,617 | | | | 20,202 | | | | 16,016 | | | | 12,728 | | | | 13,173 | | | | 12,158 | |
| Depreciation and amortization | | | 3,831 | | | | 2,685 | | | | 2,583 | | | | 2,260 | | | | 1,762 | | | | 4,704 | | | | 3,831 | | | | 2,685 | | | | 2,583 | | | | 2,260 | |
| Total operating expenses | | | 43,995 | | | | 39,024 | | | | 37,557 | | | | 33,863 | | | | 24,021 | | | | 49,541 | | | | 43,995 | | | | 39,024 | | | | 37,557 | | | | 33,863 | |
| Operating income | | | 13,697 | | | | 11,989 | | | | 11,366 | | | | 9,908 | | | | 8,416 | | | | 13,857 | | | | 13,697 | | | | 11,989 | | | | 11,366 | | | | 9,908 | |
| Other income (expenses) | | | (580 | ) | | | (6 | ) | | | (248 | ) | | | (402 | ) | | | 99 | | |
| Other expense | | | | (542 | ) | | | (580 | ) | | | (6 | ) | | | (248 | ) | | | (402 | ) |
| Income before income taxes | | | 13,117 | | | | 11,983 | | | | 11,118 | | | | 9,506 | | | | 8,515 | | | | 13,315 | | | | 13,117 | | | | 11,983 | | | | 11,118 | | | | 9,506 | |
| Provision for income taxes | | | 4,626 | | | | 4,538 | | | | 4,278 | | | | 3,622 | | | | 3,279 | | | | 4,816 | | | | 4,626 | | | | 4,538 | | | | 4,278 | | | | 3,622 | |
| Net income | | $ | 8,491 | | | $ | 7,445 | | | $ | 6,840 | | | $ | 5,884 | | | $ | 5,236 | | | $ | 8,499 | | | $ | 8,491 | | | $ | 7,445 | | | $ | 6,840 | | | $ | 5,884 | |
| | | | | | | | | | | | | | | | | | | | | | | | | | | | | | | | | | | | | | | | | |
| Net income per share - basic | | $ | 1.28 | | | $ | 1.11 | | | $ | 1.00 | | | $ | 0.86 | | | $ | 0.74 | | | $ | 1.28 | | | $ | 1.28 | | | $ | 1.11 | | | $ | 1.00 | | | $ | 0.86 | |
| Net income per share - diluted | | $ | 1.26 | | | $ | 1.09 | | | $ | 0.98 | | | $ | 0.85 | | | $ | 0.74 | | | $ | 1.26 | | | $ | 1.26 | | | $ | 1.09 | | | $ | 0.98 | | | $ | 0.85 | |
| Dividends per share | | $ | 0.64 | | | $ | 0.56 | | | $ | 0.48 | | | $ | 0.40 | | | $ | 0.32 | | | $ | 0.76 | | | $ | 0.64 | | | $ | 0.56 | | | $ | 0.48 | | | $ | 0.40 | |
| Weighted average shares outstanding – basic | | | 6,637 | | | | 6,685 | | | | 6,850 | | | | 6,836 | | | | 7,038 | | | | 6,637 | | | | 6,637 | | | | 6,685 | | | | 6,850 | | | | 6,836 | |
| Weighted average shares outstanding – diluted | | | 6,723 | | | | 6,831 | | | | 7,011 | | | | 6,954 | | | | 7,118 | | | | 6,735 | | | | 6,723 | | | | 6,831 | | | | 7,011 | | | | 6,954 | |
| | | | | | | | | | | | | | | | | | | | | | | | |
| | | December 31, | | | | |
| | | 2009 | | | 2008 | | | 2007 | | | 2006 | | | 2005 | | | December 31, | |
| | | (In thousands) | | | 2010 | | | 2009 | | | 2008 | | | 2007 | | | 2006 | |
| | | | (In thousands) | |
| Balance Sheet Data: | | | | | | | | | | | | | | | | | | | | | | | | | | | | | | | | | | | | | | | | |
| Working capital (deficit) | | $ | (4,432 | ) | | $ | (10,650 | ) | | $ | (2,384 | ) | | $ | (1,482 | ) | | $ | 8,058 | | |
| Working capital deficiency | | | $ | (8,809 | ) | | $ | (4,432 | ) | | $ | (10,650 | ) | | $ | (2,384 | ) | | $ | (1,482 | ) |
| Total assets | | | 72,499 | | | | 72,145 | | | | 61,869 | | | | 61,532 | | | | 44,675 | | | | 95,770 | | | | 72,499 | | | | 72,145 | | | | 61,869 | | | | 61,532 | |
| Total debt, including current portion | | | 7,719 | | | | 12,954 | | | | 2,993 | | | | 11,093 | | | | 1,471 | | |
Total debt and capital lease obligations, including current portion | | | | 16,599 | | | | 7,719 | | | | 12,954 | | | | 2,993 | | | | 11,093 | |
| Total shareholders’ equity | | $ | 44,171 | | | $ | 38,598 | | | $ | 42,286 | | | $ | 36,751 | | | $ | 32,593 | | | $ | 48,584 | | | $ | 44,171 | | | $ | 38,598 | | | $ | 42,286 | | | $ | 36,751 | |
Item 7. | Management’s Discussion and Analysis of Financial Condition and Results of Operations |
Item 7. Management’s Discussion and Analysis of Financial Condition and Results of Operations
Overview
The Company believes it is a leading provider of ongoing survey-based performance measurement analysis, tracking,and improvement services, healthcare analytics and governance education to the healthcare industry in the United States and Canada. Since 1981,The Company believes it has achieved this leadership position based on 30 years of industry experience and its relationships with many of the Company has provided theseindustry’s largest organizations. The Company’s portfolio of services using traditional market research methodologies such as direct mail, telephone, internet-based surveys, focus groups and in-person interviews. Since 2002, the current primary data collection methodology used is direct mail, but the Company still uses other methodologies for certain types of studies. The Company addresses the growing needneeds of healthcare providers and payers to measure the care outcomes, specifically experience and health status of their patients and/or members, and provides information on governance issues. NRC develops tools that enable healthcare organizations to obtain performance measurementmeasure and improve satisfaction, quality and cost outcomes relative to the services that they provide. Since its founding in 1981 in Lincoln, Nebraska, NRC has focused on meeting the information necessary to comply with industryneeds of the healthcare industry. The Company’s services, which are comprehensive, include data collection, healthcare analytics, best practice identification and regulatory standards, andeffective delivery of value-added business intelligence that enables its clients to improve theirperformance across key business practices so that they can maximize resident and/or patient attraction, experience, retentionmetrics. Through its extensive array of service capabilities and profitability. The Company believes that a driver of its growth and the growth of its industry will be the increase in demand for performance measurement, improvement and educational services as a result of more public reporting programs. The Company’s primary types ofrelationships, NRC is positioned to provide healthcare information services are performance tracking services, subscription-based educational and improvement services, and Ticker.to organizations across a wide continuum of service delivery segments.
Acquisitions
On August 3, 2010, the Company acquired all of the issued and outstanding shares of stock and stock rights of OCS, a provider of clinical, financial and operational benchmarks and analytics to home care and hospice providers. The acquisition provides the Company with an entry in the home health and hospice markets through OCS’s customer relationships with home healthcare and hospice providers and expands the Company's service offerings across the continuum of care. Goodwill related to the acquisition of OCS primarily relates to intangible assets that do not qualify for separate recognition, including the depth and knowledge of management. The all-cash consideration paid at closing was $15.3 million, net of $1.0 million cash received.
On December 19, 2008, the Company acquired My InnerView, Inc. (“MIV”),MIV, a leading provider of quality and performance improvement solutions to the senior care profession. MIV offers resident, family and employee satisfaction measurement and improvement products to the long-term care, assisted and independent living markets in the United States. MIV works with over 8,000 senior care providers throughout the United States housing what the Company believes is the largest dataset of senior care satisfaction metrics in the nation. The consideration paid at closing for MIV included payment of $11,500,000 in cash and $440,000 of direct expenses capitalized as purchase price. The merger agreement under which the Company acquired MIV providedprovides for contingent earn-out payments of which $581,000 of the 2009 earn-outand 2010 earn-outs was included in this amount.
On April 1, 2008, approximately 10 customer contracts were purchased from SQ Strategies for $249,000. The recording of this asset purchase increased customer relatedcustomer-related intangibles by $260,000 and deferred revenue by $11,000.
Critical Accounting Policies and Estimates
The preparation of financial statements requires management to make estimates and assumptions that affect amounts reported therein. The most significant of these areas involving difficult or complex judgments made by management with respect to the preparation of the Company’s consolidated financial statements for fiscal year 20092010 include:
Valuation of goodwill and identifiable intangible assets; and
Income taxes.
| · | Valuation of long-lived assets; |
| · | Valuation of goodwill and identifiable intangible assets; and |
Revenue Recognition
The Company derives a majority of its operating revenue from its annually renewable services, which include performance trackingmeasurement and improvement services, subscription-based educational serviceshealthcare analytics and Ticker.governance education services. The Company provides interim and annual performance trackingthese services to its clients under annual client service contracts, although such contracts are generally cancelable on short or no notice without penalty. The Company provides subscription-based educational services to clients generally under annual service contracts over a twelve-month period and publishes healthcare market information for its clients through its Ticker. Starting in May 2008, the Company began providing Ticker subscription-based services to clients on a monthly basis generally over a twelve-month period, however, some Ticker subscriptions will continue to be sold and delivered on an annual basis. The Company also derives some revenue from its custom and other research projects.
The Company’s performance tracking services are performance tracking and improvement tools for gathering and analyzing data from survey respondents. Such services are provided pursuant to contracts which are generally renewable annually, and that provide for a customer-specific study which is conducted via a series of surveys and delivered via a series of updates or reports, the timing and frequency of which vary by contract (such as monthly or weekly). These contracts are generally cancelable on short or no notice without penalty and, since progress on these contracts can be tracked and regular updates and reports are made, clients are entitled to any work-in-process, but are obligated to pay for all services performed through cancellation. Typically, theseCertain contracts are fixed-fee arrangements with a portion of the project fee billed in advance and the remainder billed periodically over the duration of the project. Revenue and direct expenses for the Company’s performance tracking services provided under these contracts are recognized under the proportional performance method.
Under the proportional performance method, the Company recognizes revenue based on output measures or key milestones such as survey set-up, survey mailings, survey returns and reporting. The Company measures its progress based on the level of completion of these output measures and recognizes revenue accordingly. Management judgments and estimates must be made and used in connection with revenue recognized using the proportional performance method. If management made different judgments and estimates, then the amount and timing of revenue for any period could differ materially from the reported revenue.
Services are also provided under subscription-based service agreements. The Company recognizes subscription-based educational service revenue over the period of time the service is provided. Generally, the subscription periods are for twelve months and revenue is recognized equally over the subscription period.
Ticker was published by NRC solely on an annual basis from 1996 to September 2008. The Company recognizesalso derives revenue on Ticker contracts upon deliveryfrom hosting arrangements where our propriety software is offered as a service to our customers through our data processing facilities. The Company’s revenue also includes software-related revenue for software license revenue, installation services, post-contract support (maintenance) and training. Software-related revenue is recognized in accordance with the provisions of ASC 985-605, Software-Revenue Recognition.
Hosting arrangements to provide customers with access to the principal customers. RevenueCompany’s propriety software are marketed under some annual contracts which dolong-term arrangements, generally over periods of one to three years. Under these arrangements, the customer is not include monthly updates is fully recognized upon delivery, typically inprovided the third quartercontractual right to take possession of the year. Starting in May 2008,licensed software at any time during the Company added subscription-based services,hosting period without significant penalty, and the revenue from whichcustomer is generally recognized on a monthly basis over a twelve-month period. Until September 2008, the Company would defer costs of preparing the survey data for Ticker and expense these at the time the annual contract revenue was recognized. Starting in October 2008, these costs were expensed monthly. The Company generates additional revenue from incidental customers subsequent to the completion of each monthly edition. Revenue and costs for these subsequent services are recognized as the services are performed and completed. Ticker is generallynot provided pursuant to contracts that provide for the receipt of survey results that are customized to meet an individual client’s specific information needs. Typically, these contracts are not cancelable by clients, clients receive no rights in the comprehensive healthcare database which results from this survey, other than the right to userun the customized reports purchased pursuant thereto,software on their own hardware or contract with another party unrelated to us to host the software. Upfront fees for set-up services are typically billed for our hosting arrangements. However, these arrangements do not qualify for separation from the ongoing hosting services due to the absence of standalone value for the set-up services. Therefore, we account for these arrangements as service contracts and amounts duerecognize revenue ratably over the hosting service period when all other conditions to revenue are met. Other conditions that must be met before the commencement of revenue recognition include achieving evidence of an arrangement, determining that the collection of the revenue is probable, and determining that fees are fixed and determinable.
The Company’s software arrangements typically involve the sale of a time-based license bundled with installation services, post-contract support (“PCS”) and training. License terms range from one year to three years and require an annual fee for Tickerbundled elements of the arrangement. PCS is also contractually provided for a period that is co-terminus with the term of the time-based license. The Company’s installation services are billed priornot considered to or at delivery.be essential to the functionality of the software license. The Company does not achieve vendor-specific objective evidence (“VSOE”) of the fair value of the undelivered elements of its software arrangements (primarily PCS) and, therefore, these arrangements are accounted for as a single unit of accounting with revenue recognized ratably over the minimum bundled PCS period.
As a result of the timing of recognition of revenue and costs associated with Ticker, the Company’s margins vary throughout the year.
The Company’s revenue recognition policyarrangements (not involving software elements) may include multiple elements. In assessing the separation of revenue for Tickerelements of such arrangements, we first determine whether each delivered element has standalone value based on whether we or other vendors sell the services separately. We also consider whether there is not sensitive to significant estimates and judgments.
Valuationsufficient evidence of Long-Lived Assets
The Company monitors events and changes in circumstances that may require the Company to review the carrying value of its long-lived assets. The Company assesses whether an impairment of assets held and used may have occurred using undiscounted future operating cash flows. Impairments, if they occur, are measured using the fair value of the assets. The assessment ofelements in allocating the recoverability of long-lived assets may be adversely impacted if estimated future operating cash flows arefees in the arrangement to each element. Revenue allocated to an element is limited to revenue that is not achieved.
The Company assesses the impairment of long-lived assets whenever eventssubject to refund or changes in circumstances indicate that the carrying value of such assets may not be recoverable. Among others, management believes the following circumstances are important indicators of potential impairment of such assets and, as a result, may trigger an impairment review:
| · | Significant underperformance in comparison to historical or projected operating results; |
| · | Significant changes in the manner or use of acquired assets or the Company’s overall strategy; |
| · | Significant negative trends in the Company’s industry or the overall economy; |
| · | A significant decline in the market price for the Company’s common stock for a sustained period; and |
| · | The Company’s market capitalization falling below the book value of the Company’s net assets. |
otherwise represents contingent revenue.
Valuation of Goodwill and Identifiable Intangible Assets
Intangible assets include customer relationships, trade namenames, non-compete agreements and goodwill. Intangible assets with estimable useful lives are amortized over their respective estimated useful lives to their estimated residual values and reviewed for impairment.
Goodwill representsis an asset representing the difference betweenfuture economic benefits arising from other assets acquired in a business combination that are not individually identified and separately recognized. Goodwill is reviewed for impairment at least annually. The goodwill impairment test is a two-step test. Under the purchase price paid in acquisitions using the purchase method of accounting, andfirst step, the fair value of the net assets acquired. Goodwillreporting unit is compared with its carrying value (including goodwill). If the fair value of the reporting unit is less than its carrying value, an indication of goodwill impairment exists for the reporting unit and indefinite-lived intangibles are assessed annuallythe entity must perform step two of the impairment test (measurement). Under step two, an impairment loss is recognized for impairmentany excess of the carrying amount of the reporting unit’s goodwill over the implied fair value of that goodwill. The implied fair value of goodwill is determined by allocating the fair value of the reporting unit in a manner similar to a purchase price allocation and arethe residual fair value after this allocation is the implied fair value of the reporting unit goodwill. Fair value of the reporting unit is determined using a discounted cash flow analysis. If the fair value of the reporting unit exceeds its carrying value, step two does not amortized.need to be performed.
AsAll of December 31, 2009, the Company hadCompany’s goodwill of $39.9 million.is allocated to its reporting units. As of October 1 of each year (or more frequently as changes in circumstances indicate), the Company evaluatestests goodwill for impairment. There are a number of inputs used to calculate the estimated fair value using a discounted cash flow model, including operating results, business plans, projected cash flows and a discount rate. Discount rates, growth rates and cash flow projections are the most sensitive and susceptible to change as they require significant management judgment. Discount rates are determined by using a weighted average cost of capital, which considers market and industry data as well as Company-specific risk factors. Operational management develop growth rates and cash flow projections for each reporting unit considering industry and Company-specific historical and projected information. Terminal value rate determination follows common methodology of capturing the Company’s goodwill.present value of perpetual cash flow estimates beyond the last projected period assuming a constant weighted average cost of capital and low long-term growth rates. On thesethe evaluation dates, to the extent that the carrying value of the net assets of the Company’s reporting units having goodwill is greater than the estimated fair value, impairment charges will be recorded. The Company’s analysis has resulted in fair value substantially exceeding its carrying value in four of the five business units having goodwill. For the newest business unit, MIV,determined and measured based on the estimated fair value did not substantially exceedof goodwill as compared to its carrying value. This was due, in part, to the 2009 MIV revenues and operating margins being below original projections, but management believes that the performance is improvingNo impairments were recorded during the first part of 2010. No impairment loss has been recorded on goodwill inyears ended December 31, 2010, 2009 2008 or 2007. The Company will continue to evaluate for impairment as unforeseen future events may impact the goodwill valuation.2008.
Income Taxes
The Company uses the asset and liability method of accounting for income taxes. Under that method, deferred income tax assets and liabilities are recognized for the future tax consequences attributable to differences between the financial statement carrying amounts of existing assets and liabilities and their respective tax bases using enacted tax rates. The effect on deferred tax assets and liabilities of a change in tax rates is recognized in income in the period that includes the enactment date. Valuation allowances, if any, are established when necessary to reduce deferred tax assets to the amount that is more likely than not to be realized. The Company recognizes the effect of income tax positions only if those positions are more likely than not of being sustained. Recognized income tax positions are measured at the largest amount that is greater than 50% likely of being realized. Changes in recognition or measurement are reflected in the period in which the change in judgment occurs. Management judgment is required to determine the provision for income taxes and to determine whether deferred income taxes will be realized in full or in part. Such judgments include, but are not limited to, the likelihood we would realize the benefits of net operating loss carryforwards, the adequacy of valuation allowances, the election to capitalize or expense costs incurred, and the probability of outcomes of uncertain tax positions. It is possible that the various taxing authorities could challenge those judgments or positions and reach conclusions that would cause us to incur tax liabilities in excess of, or realize benefits less than, those currently recorded. In addition, changes in the geographical mix or estimated amount of annual pretax income could impact our overall effective tax rate.
Results of Operations
The following table sets forth, for the periods indicated, selected financial information derived from the Company’s consolidated financial statements, expressed as a percentage of total revenue and the percentage change in such items versus the prior comparable period. The trends illustrated in the following table may not necessarily be indicative of future results. The discussion that follows the table should be read in conjunction with the Company’s consolidated financial statements.
| | | Percentage of Total Revenue Year Ended December 31, | | | Percentage Increase (Decrease) | |
| | | 2010 | | | 2009 | | | 2008 | | | 2010 over 2009 | | | 2009 over 2008 | |
| | | | | | | | | | | | | | | | |
| Revenue | | | 100.0 | % | | | 100.0 | % | | | 100.0 | % | | | 9.9 | % | | | 13.1 | % |
| Operating expenses: | | | | | | | | | | | | | | | | | | | | |
| Direct expenses | | | 38.8 | | | | 41.9 | | | | 46.3 | | | | 2.0 | | | | 2.3 | |
| Selling, general and administrative | | | 31.9 | | | | 27.8 | | | | 24.9 | | | | 26.1 | | | | 25.8 | |
| Depreciation and amortization | | | 7.4 | | | | 6.6 | | | | 5.3 | | | | 22.8 | | | | 42.7 | |
| Total operating expenses | | | 78.1 | | | | 76.3 | | | | 76.5 | | | | 12.6 | | | | 12.7 | |
| Operating income | | | 21.9 | % | | | 23.7 | % | | | 23.5 | % | | | 1.2 | % | | | 14.2 | % |
Year Ended December 31, 2010, Compared to Year Ended December 31, 2009
Revenue. Revenue increased 9.9% in 2010 to $63.4 million from $57.7 million in 2009. The acquisition of OCS accounted for $3.0 million of the increase with the remainder due to the addition of new clients and expanded sales from existing clients.
Direct expenses. Direct expenses increased 2% to $24.6 million in 2010 from $24.1 million in 2009. The primary reason for the increase in direct expenses was due to the acquisition of OCS, which added approximately $1.4 million, and investment in a new business unit, Illuminate, offset by increased use of more cost-efficient survey methodology, as well as staffing reductions. Direct expenses decreased as a percentage of revenue to 38.8% in 2010, from 41.9% during the same period of 2009.
Selling, general and administrative expenses. Selling, general and administrative expenses increased 26.1% to $20.2 million in 2010 from $16.0 million in 2009. The increase was primarily due to the addition of OCS (adding $1.0 million), $312,000 in acquisition and transition costs associated with the acquisition of OCS, investment in a new product development, expansion of the sales force, and the addition of several executives in various leadership roles. Selling, general and administrative expenses increased as a percentage of revenue to 31.9% in 2010 from 27.8% in 2009, mainly due to sales expansion efforts in 2010 throughout the Company, acquisition and transition costs associated with OCS and investment in a new product development.
| | | Percentage of Total Revenue Year Ended December 31, | | | Percentage Increase (Decrease) | |
| | | 2009 | | | 2008 | | | 2007 | | | 2009 over 2008 | | | 2008 over 2007 | |
| | | | | | | | | | | | | | | | |
| Revenue | | | 100.0 | % | | | 100.0 | % | | | 100.0 | % | | | 13.1 | % | | | 4.3 | % |
| Operating expenses: | | | | | | | | | | | | | | | | | | | | |
| Direct expenses | | | 42.6 | | | | 46.3 | | | | 44.6 | | | | 4.1 | | | | 8.3 | |
| Selling, general and administrative | | | 27.0 | | | | 25.0 | | | | 26.9 | | | | 22.5 | | | | (3.4 | ) |
| Depreciation and amortization | | | 6.6 | | | | 5.3 | | | | 5.3 | | | | 42.7 | | | | 4.0 | |
| Total operating expenses | | | 76.3 | | | | 76.5 | | | | 76.8 | | | | 12.7 | | | | 3.9 | |
| Operating income | | | 23.7 | % | | | 23.5 | % | | | 23.2 | % | | | 14.2 | % | | | 5.5 | % |
Depreciation and amortization. Depreciation and amortization expenses increased 22.8% to $4.7 million in 2010 from $3.8 million in 2009. Depreciation and amortization increased as a percentage of revenue to 7.4% in 2010 from 6.6% in 2009. Approximately $351,000 of the increase was related to the acquisition of OCS, with the remainder primarily due to a large software project that was placed into service at the end of 2009.
Provision for income taxes. The provision for income taxes totaled $4.8 million (36.2% effective tax rate) for 2010 compared to $4.6 million (35.3% effective tax rate) for 2009. The effective tax rate was higher in 2010 due to an adjustment to deferred tax balances based on higher projected federal taxable rates and a decrease in research and development tax credits.
Year Ended December 31, 2009, Compared to Year Ended December 31, 2008
Revenue. Revenue increased 13.1% in 2009 to $57.7 million from $51.0 million in 2008. This was primarily due to the acquisition of MIV in December 2008.
Direct expenses. Direct expenses increased 4.1%2.3% to $24.6$24.1 million in 2009 from $23.6 million in 2008. The change was mainly due to increased costs of servicing the additional revenue from the MIV business, partially offset by the reductions in costs of servicing decreased revenue in other areas of the Company. Direct expenses decreased as a percentage of revenue to 42.6%41.9% in 2009 from 46.3% in 2008, primarily due to MIV’s current business model with direct expenses as a percentage of revenue lower than the other operating business units of the Company and growth in margin in the Ticker division.
Selling, general and administrative expenses. Selling, general and administrative expenses increased 22.5%25.8% to $15.6$16.0 million in 2009 from $12.7 million in 2008. The change was primarily due to increases in expenses related to the MIV acquisition and expansions in the sales force. Selling, general and administrative expenses increased as a percentage of revenue to 27.0%27.8% in 2009 from 25.0%24.9% in 2008, mainly due to sales expansion efforts in the latter portion of 2009 throughout the Company.
Depreciation and amortization. Depreciation and amortization expenses increased 42.7% to $3.8 million in 2009 from $2.7 million in 2008. Depreciation and amortization increased as a percentage of revenue to 6.6% in 2009 from 5.3% in 2008. The increase was primarily due to the depreciation of the fixed assets and amortization of intangible assets associated with the acquisition of MIV.
Provision for income taxes. The provision for income taxes totaled $4.6 million (35.3% effective tax rate) for 2009 compared to $4.5 million (37.9% effective tax rate) for 2008. The effective tax rate was lower in 2009 due to increases in research and development tax credits and state investment and growth act credits, and decreases in Canadian statutory income tax rates.
Year Ended December 31, 2008, Compared to Year Ended December 31, 2007
Revenue. Revenue increased 4.3% in 2008 to $51.0 million from $48.9 million in 2007. This was primarily due to increases in the scope of work from existing clients and the addition of new clients.
Direct expenses. Direct expenses increased 8.3% to $23.6 million in 2008 from $21.8 million in 2007. The change was primarily due to an increase in salaries, benefits and travel of $1.2 million, the result of the change in the business model, and the allocation of responsibilities related to sales and servicing clients. In 2008, the Company divided its sales force into two groups, one focused only on bringing in prospective new clients and the second focused exclusively on servicing current clients. As a result, salaries, benefits and travel attributable to the group focused on current clients are now classified as direct expenses rather than selling, general and administrative expenses. Direct expenses increased as a percentage of revenue to 46.3% in 2008 from 44.6% in 2007.
Selling, general and administrative expenses. Selling, general and administrative expenses decreased 3.4% to $12.7 million in 2008 from $13.2 million in 2007. The change was largely due to the 2008 change in the business model and the allocation of responsibilities related to sales and servicing clients. Selling, general and administrative expenses decreased as a percentage of revenue to 25.0% in 2008 from 26.9% in 2007.
Depreciation and amortization. Depreciation and amortization expenses increased 4.0% to $2.7 million in 2008 from $2.6 million in 2007. Depreciation and amortization as a percentage of revenue remained at 5.3% in 2008 and 2007 respectively.
Provision for income taxes. The provision for income taxes totaled $4.5 million (37.9% effective tax rate) for 2008 compared to $4.3 million (38.5% effective tax rate) for 2007. The effective tax rate was lower in 2008 due to decreases in provincial income tax rates.
Inflation and Changing Prices
Inflation and changing prices have not had a material impact on revenuesrevenue or net income from continuing operations in the last three years.
Liquidity and Capital Resources
The Company believes it has adequate capital resources and operating cash flow to meet its projected capital and debt maturity needs and dividend policy for the foreseeable future. Requirements for working capital, capital expenditures, and debt maturities will continue to be funded by operations and the Company’s borrowing arrangements.
Working Capital
The Company had a working capital deficiency of $4.4$8.8 million on December 31, 2009, as2010, compared to a $10.7$4.4 million working capital deficiency on December 31, 2008.2009. The decreaseincrease in the working capital deficiency was primarily due to paying offa $5.8 million increase in deferred revenue, a $3.3 million increase in accrued expenses, accrued wages and accounts payable combined, and a $1.0 million increase in the linecurrent portion of creditnotes payable, partially offset by a $4.0 million increase in 2009 that hadaccounts receivable and a balance of $3.9$1.0 million as of December 31, 2008.increase in cash and cash equivalents. The working capital deficiency balance is primarily due to a deferred revenue balance of $11.9$17.7 million and $12.9$11.9 million as of December 31, 2010 and 2009, and 2008, respectively.
The deferred revenue balance is primarily due to timing of initial billings on new and renewal contracts. The Company typically invoices clients for performance tracking services and custom research projects before they have been completed. Billed amounts are recorded as billings in excess of revenue earned, or deferred revenue, on the Company’s consolidated financial statements, and are recognized as income when earned. In addition, when work is performed in advance of billing, the Company records this work as revenue earned in excess of billings, or unbilled revenue. Substantially all deferred revenue and all unbilled revenue will be earned and billed respectively, within 12 months of the respective period ends.
Cash Flow Analysis
A summary of operating, investing, and financing activities are shown in the following table:
| | | For the Year Ended December 31, | |
| | | 2010 | | | 2009 | | | 2008 | |
| | | (In thousands) | |
| Provided by operating activities | | $ | 14,603 | | | $ | 13,666 | | | $ | 15,175 | |
| Used in investing activities | | | (16,980 | ) | | | (3,002 | ) | | | (15,264 | ) |
| Provided by (used in) financing activities | | | 3,254 | | | | (9,548 | ) | | | (1,755 | ) |
| Effect of exchange rate change on cash | | | 130 | | | | 287 | | | | (402 | ) |
| Net increase (decrease) in cash and cash equivalents | | | 1,007 | | | | 1,403 | | | | (2,246 | ) |
| Cash and cash equivalents at end of period | | $ | 3,519 | | | $ | 2,512 | | | $ | 1,109 | |
Cash Flows from Operating Activities
Cash flows from operating activities consist of net income adjusted for non-cash items including depreciation and amortization, deferred taxes, and the effect of working capital changes.
Net cash provided by operating activities was $14.6 million for the year ended December 31, 2010, which included net income of $8.5 million, plus non cash charges (benefits) for deferred tax expense, depreciation and amortization and non-cash stock compensation totaling $6.1 million.
Net cash provided by operating activities was $13.7 million for the year ended December 31, 2009, which included net income of $8.5 million, plus non-cash charges (benefits) for deferred tax expense, depreciation and amortization, and non-cash stock compensation totaling $6.2 million. Changes in working capital reduced 2009 cash flows from operating activities by $1.0 million.
Net cash provided by operating activities was $15.2 million for the year ended December 31, 2008, which included net income of $7.4 million, plus non-cash charges (benefits) for deferred tax expense, depreciation and amortization, tax benefit from exercise of stock options and non-cash stock compensation totaling $4.3 million. Changes in working capital increased 2008 cash flows from operating activities by 3.5 million.
Cash Flows from Investing Activities
Net cash of $17.0 million was used for investing activities in the year ended December 31, 2010. Cash of $15.3 million was used for the acquisition of OCS and $172,000 was paid under the earn-out related to the MIV acquisition. Cash of $1.5 million was used for the purchase of property and equipment.
Net cash of $3.0 million was used for investing activities in the year ended December 31, 2009. Earn-out payments related to the MIV acquisition approximated $100,000 and purchases of property and equipment totaled $2.9 million.
Net cash of $15.3 million was used for investing activities in the year ended December 31, 2008. Cash of $12.6 million was used for the acquisition of MIV. Cash of $2.8 million was used for the purchase of property and equipment, which was offset by approximately $100,000 from proceeds from the maturity of available-for-sale securities.
Cash Flows from Financing Activities
Net cash provided by financing activities was $3.3 million in the year ended December 31, 2010. Cash was generated from borrowings under the term note and revolving credit note totaling $11.3 million. Proceeds from the exercise of stock options provided cash of $274,000. Cash was used to pay dividends of $5.1 million, repay borrowings under the term note and revolving credit note totaling $2.8 million, and repurchases of the Company’s common stock for $399,000.
Net cash used in financing activities was $9.5 million in the year ended December 31, 2009. Cash was generated from borrowings under the term note and revolving credit note totaling $4.9 million. Cash was used to pay dividends of $4.3 million and repay borrowings under the term note and revolving credit note totaling $10.1 million.
Net cash used in financing activities was $1.8 million in the year ended December 31, 2008. Cash was generated from borrowings under the term note and revolving credit note totaling $18.6 million. Proceeds from the exercise of stock options and the tax benefit on the exercise of stock options and vested restricted stock favorably impacted cash by $731,000 and $680,000, respectively. Cash was used to repurchase the Company’s common stock for $9.0 million, repay borrowings under the term note and revolving credit note totaling $9.0 million, and pay dividends of $3.8 million.
The effect of changes in foreign exchange rates increased (decreased) cash and cash equivalents by $130,000, $287,000 and ($402,000) in the years ended December 31, 2010, 2009 and 2008, respectively.
Capital Expenditures
Capital expenditures for the year ended December 31, 2009,2010, were $2.9$2.3 million. Cash paid for these expenditures was $1.5 million. These expenditures consisted mainly of computer software, computer hardware, and furniture and other equipment. The Company expects similar capital expenditure purchases in 2010,2011 consisting primarily of computer software and hardware and other equipment, to be funded through cash generated from operations.
Debt and Equity
On May 26, 2006,December 19, 2008, the Company entered into a credit facility pursuant to which it borrowed $9.0 million under a term note and $3.5 million under a revolving credit note in order to partially finance the acquisition of TGI.MIV. In July 2010, the Company refinanced the existing term loan with a $6.9 million term loan. The new term note was refinanced on February 25, 2008,loan is payable in 35 monthly installments of $80,104 with a balloon payment for the remaining principal balance ofand interest due on July 31, 2013. Borrowings under the term note of $1.6 million. The refinanced term note required payments of principal and interest in 17 monthly installments of $93,000, beginning March 31, 2008, and ending August 31, 2009. Borrowings under the refinanced term note borebear interest at an annual rate of 5.14%3.79%. The Company paid offoutstanding balance of the term note at December 31, 2010, was $6.6 million.
On July 31, 2010, the Company borrowed $10.0 million under a term note to partially finance the acquisition of OCS. The term loan is payable in October 2008.35 monthly installments of $121,190 with a balloon payment for the remaining principal balance and interest due on July 31, 2013. Borrowings under the term note bear interest at an annual rate of 3.79%. The outstanding balance of the term note at December 31, 2010, was $9.6 million.
The term notes are secured by certain of the Company’s assets, including the Company’s land, building, accounts receivable and intangible assets. The term notes contain various restrictions and covenants applicable to the Company, including requirements that the Company maintain certain financial ratios at prescribed levels and restrictions on the ability of the Company to consolidate or merge, create liens, incur additional indebtedness or dispose of assets. As of December 31, 2010, the Company was in compliance with these restrictions and covenants.
The Company entered into a revolving credit note in 2006. The maximum aggregate amount available under the revolving credit note, was originally $3.5 million, butfollowing an addendum to the revolving credit note datedin March 26, 2008, changed the revolving credit note amount tois $6.5 million. The revolving credit note was renewed in July 20092010 to extend the term to July 31, 2010.June 30, 2011. The Company may borrow, repay and re-borrow amounts under the revolving credit note from time to time until its maturity on July 31, 2010. The maximum aggregate amount available under the revolving credit note is $6.5 million, subject to a borrowing base equal to 75% of the Company’s eligible accounts receivable. Borrowings under the revolving credit note bear interest at a variable rate equal to (1) prime (as defined in the credit facility) less 0.50% or (2) one-, two-, three-, six- or twelve-month LIBOR.June 30, 2011. The Company expects to extend the term of the revolving credit note for at least one year beyond the maturity date. If, however, the note cannot be extended, the Company believes it has adequate cash flows from operations to meet its debt and capital needs.
The maximum aggregate amount available under the revolving credit note of $6.5 million is subject to a borrowing base equal to 75% of the Company’s eligible accounts receivable. Borrowings under the renewed revolving credit note bear interest at a variable annual rate, with three rate options at the discretion of management as follows: 1) 2.5% plus the daily reset one-month LIBOR rate, or 2) 2.2% plus the one-, two-, three-, six- or twelve-month LIBOR rate, or 3) the bank’s Money Market Loan Rate. As of December 31, 2009,2010, the revolving credit note did not have a balance. According to borrowing base requirements, the Company had the capacity to borrow $4.2$6.5 million as of December 31, 2009.2010.
On December 19, 2008, the Company borrowed $9.0 million under a term note to partially finance the acquisition of MIV. The term note is payable in 35 equal installments of $97,000, with the balance of principal and interest payable in a balloon payment due on December 31, 2011. Borrowings under the term note bear interest at a rate of 5.2% per year. In 2009, the Company made principal payments, in addition to the monthly installments, on the term loan totaling $650,000.
The term note is secured by certain of the Company’s assets, including the Company’s land, building, accounts receivable and intangibles. The term note contains various restrictions and covenants applicable to the Company, including requirements that the Company maintain certain financial ratios at prescribed levels and restrictions on the ability of the Company to consolidate or merge, create liens, incur additional indebtedness or dispose of assets. As of December 31, 2009, the Company was in compliance with these restrictions and covenants.
The merger agreement under which the Company acquired MIV providedprovides for contingent earn-out payments over three years based on growth in revenue and earnings. As of December 31,The 2010 and 2009 a contingent earn-out payment of $795,000 was accrued, which was thenpayments, paid in February 2010. 2011 and 2010 were $1.6 million and $172,000, respectively, net of closing valuation adjustments and were recorded as additions to goodwill. The Company currently projectsestimates that the 2011 earn-out for 2010 and 2011 could be $3.0approximately $2.6 million and $1.0 million, respectfullyexpects to be fundedfund this through cash flow from operations.
Debt assumed through the MIV acquisition included $90,000 in capital leases. The capital leases are for production and mailing equipment meetingthrough 2011. The Company also assumed capital leases of $42,000 in connection with its acquisition of OCS for computer equipment through 2012. The capital leases meet capitalization requirements wherebecause the lease term exceedsterms exceed more than 75% of the related assets’ estimated useful life.lives. Equipment is depreciated over the lease terms. The Company also purchased operational inserting equipment for $389,000 through a capital lease arrangement. The lease began November 1, 2010, for a five year term with a bargain purchase option. The equipment is being depreciated over seven years, the lease termestimated useful life of 4.25 years ending in 2011.the asset.
Contractual Obligations
The Company had contractual obligations to make payments in the following amounts in the future as of December 31, 2009:2010:
| Contractual Obligations | | Total Payments | | | Less than One Year | | | One to Three Years | | | Three to Five Years | | | After Five Years | |
| (In thousands) | | | | | | | | | | | | | | | |
| Operating leases | | $ | 1,600 | | | $ | 524 | | | $ | 1,066 | | | $ | 10 | | | $ | — | |
Capital leases(1) | | | 65 | | | | 37 | | | | 28 | | | | — | | | | — | |
Uncertain tax positions(2) | | | 78 | | | | — | | | | — | | | | — | | | | — | |
Long-term debt(1) | | | 8,376 | | | | 1,162 | | | | 7,214 | | | | — | | | | — | |
| Total | | $ | 10,119 | | | $ | 1,723 | | | $ | 8,386 | | | $ | 10 | | | $ | — | |
(1) Includes interest
(2) It is uncertain when the tax benefits will be settled.| Contractual Obligations | | Total Payments | | | Less than One Year | | | One to Three Years | | | Three to Five Years | | | After Five Years | |
| (In thousands) | | | | | | | | | | | | | | | |
| Operating leases(1) | | $ | 1,709 | | | $ | 560 | | | $ | 870 | | | $ | 279 | | | $ | -- | |
| Capital leases | | | 536 | | | | 150 | | | | 208 | | | | 178 | | | | -- | |
| Uncertain tax positions(2) | | | 269 | | | | -- | | | | -- | | | | -- | | | | -- | |
| Long-term debt | | | 17,534 | | | | 2,416 | | | | 15,118 | | | | -- | | | | -- | |
| Total | | $ | 20,048 | | | $ | 3,126 | | | $ | 16,196 | | | $ | 457 | | | $ | -- | |
| | | | | | | | | | | | | | | | | | | | | �� | |
| (1) | The Company terminated its lease for MIV’s Wausau office space in February 2011 for a lump-sum payment of $267,000. Contractual amounts as of December 31, 2010, included in the table that will not be required as a result of the termination are $130,000 less than one year and $281,000 in one to three years. | |
| (2) | We have $269,000 in liabilities associated with uncertain tax positions. We are unable to reasonably estimate the expected cash settlement dates of these uncertain tax positions with the taxing authorities. | |
The Company generally does not make unconditional, non-cancelable purchase commitments. The Company enters into purchase orders in the normal course of business, but these purchase obligations do not exceed one year.
Shareholders’ equity increased $5.6$4.4 million to $48.6 million in 2010, from $44.2 million in 2009 from $38.6 million in 2008.2009. The increase was primarily due to net income of $8.5 million and non-cash stock compensation expense of $619,000, and change in cumulative translation adjustment of $775,000,$779,000, offset by dividends paid of $4.3$5.1 million.
Stock Repurchase Program
In February 2006, the Board of Directors of the Company authorized the repurchase of an additional 750,000 shares of common stock in the open market or in privately negotiated transactions. As of December 31, 2009,2010, the remaining number of shares that cancould be purchased are 289,065.under this authorization was 268,717.
Off-Balance Sheet Obligations
The Company has no significant off-balance sheet obligations other than the operating lease commitments disclosed in “Liquidity and Capital Resources.”
Adoption of New Accounting Pronouncements
In June 2009, FASB issuedJanuary 2010, the Financial Accounting Standards Codification™Board (“Codification”FASB”) as the sourceamended fair value guidance to require companies to make new disclosures about recurring and/or non-recurring fair value measurements including significant transfers into and out of authoritative U.S. generally accepted accounting principles (“GAAP”) recognized by FASB to be applied by nongovernmental entities. The Codification supersedes all then-existing non-SEC accountingLevel 1 and reporting standards. In accordance with the Codification, references to accounting literature in this report are presented in plain English. The Codification did not change GAAP, but reorganizes the literature. The Codification isLevel 2 measurements. This guidance was effective for financial statements issued forannual or interim and annualreporting periods endingbeginning after SeptemberDecember 15, 2009. The adoption of the Codificationthis pronouncement has not had an impacteffect on the consolidated financial statements.statements as it pertains only to disclosure requirements. In addition, as part of this guidance and effective for annual or interim reporting periods beginning after December 15, 2010, disclosure of purchases, sales, issuances and settlement of assets must be on a gross basis for Level 3 measurements, where currently it is on a net basis. Also, the level of disaggregation will be increased by “class” instead of “major category.” The adoption of this pronouncement has not had an effect on the consolidated financial statements as it pertains to only disclosure requirements.
Recent Accounting Pronouncements
In September 2009, the FASB issued new guidance for revenue recognition with multiple deliverables, which is effective for revenue arrangements entered into or materially modified in fiscal years beginning on or after June 15, 2010, although early adoption is permitted. This guidance eliminates the residual method under the current guidance and replaces it withrequires the use of the “relative selling price” method when allocating revenue in a multiple deliverable arrangement. The selling price for each deliverable shall be determined using vendor-specificvendor specific objective evidence of selling price, if it exists, otherwise third-party evidence of selling price. If neither exists for a deliverable, the vendor shall use its best estimate of the selling price for that deliverable. After adoption, this guidance will also require expanded qualitative and quantitative disclosures. Management continuesThe Company plans to assessadopt this guidance on January 1, 2011, and is assessing the potential impact on its financial position and results of this authoritative guidance.operations.
Item 7A. | Quantitative and Qualitative Disclosure About Market Risk |
Item 7A. Quantitative and Qualitative Disclosure About Market Risk
The Company’s primary market risk exposure is changes in foreign currency exchange rates and interest rates.
The Company’s Canadian subsidiary uses as its functional currency the local currency of the country in which it operates. It translates its assets and liabilities into U.S. dollars at the exchange rate in effect at the balance sheet date. It translates its revenue and expenses at the average exchange rate during the period. The Company includes translation gains and losses in accumulated other comprehensive income (loss), a component of shareholders’ equity. Foreign currency translation gains or (losses) were $339,000, $775,000, and ($937,000), in 2010, 2009, and $568,000 in 2009, 2008, and 2007, respectively. Gains and losses related to transactions denominated in a currency other than the functional currency of the countries in which the Company operates and short-term intercompany accounts are included in other income (expense) in the consolidated statements of income.
The Company’s primaryWe performed a sensitivity analysis assuming a hypothetical 100 basis point movement in interest rate risk is relatedrates applied to interest expense from the Company’s revolving credit note with a variable interest rate. However,average daily borrowings of the revolving line of credit note had no balance asfacility. As of December 31, 2009.2010, the analysis indicated that such a movement would not have a material effect on our consolidated financial position, results of operations or cash flows.
The Company has limited interest rate risk related to interest income from the Company’s investments in United States government notes with maturities of 90 days or less at the purchase date for the security. The Company has classified these as cash equivalents. The discounted notes bear interest at .041% and .091% annually. One of the notes matured on February 3, 2010, and payment was received for the full principal amount.
Item 8. | Financial Statements and Supplementary Data |
Item 8. Financial Statements and Supplementary Data
Quarterly Financial Data (Unaudited)
The following table sets forth selected financial information for each of the eight quarters in the two-year period ended December 31, 2009.2010. This unaudited information has been prepared by the Company on the same basis as the consolidated financial statements and includes all normal recurring adjustments necessary to present fairly this information when read in conjunction with the Company’s audited consolidated financial statements and the notes thereto.
| | | (In thousands, except per share data) | |
| | | Quarter Ended | |
| | | Dec. 31, 2010 | | | Sept 30, 2010 | | | June 30, 2010 | | | Mar. 31, 2010 | | | Dec. 31, 2009 | | | Sept 30, 2009 | | | June 30, 2009 | | | Mar. 31, 2009 | |
| | | | | | | | | | | | | | | | | | | | | | | | | |
| Revenue | | $ | 15,883 | | | $ | 16,006 | | | $ | 14,139 | | | $ | 17,370 | | | $ | 13,841 | | | $ | 13,517 | | | $ | 13,594 | | | $ | 16,740 | |
| Direct expenses | | | 6,264 | | | | 6,038 | | | | 5,877 | | | | 6,456 | | | | 5,384 | | | | 5,522 | | | | 6,114 | | | | 7,128 | |
| Selling, general and administrative | | | 5,938 | | | | 5,250 | | | | 4,545 | | | | 4,469 | | | | 4,204 | | | | 3,796 | | | | 3,887 | | | | 4,129 | |
| Depreciation and amortization | | | 1,322 | | | | 1,225 | | | | 1,059 | | | | 1,098 | | | | 929 | | | | 901 | | | | 891 | | | | 1,110 | |
| Operating income | | | 2,359 | | | | 3,493 | | | | 2,658 | | | | 5,347 | | | | 3,324 | | | | 3,298 | | | | 2,702 | | | | 4,373 | |
| Other expense | | | (200 | ) | | | (160 | ) | | | (42 | ) | | | (140 | ) | | | (134 | ) | | | (166 | ) | | | (183 | ) | | | (97 | ) |
| Provision for income taxes | | | 590 | | | | 1,191 | | | | 956 | | | | 2,079 | | | | 951 | | | | 1,138 | | | | 910 | | | | 1,627 | |
| Net income | | $ | 1,569 | | | $ | 2,142 | | | $ | 1,660 | | | $ | 3,128 | | | $ | 2,239 | | | $ | 1,994 | | | $ | 1,609 | | | $ | 2,649 | |
| Net income per share – basic | | $ | 0.24 | | | $ | 0.32 | | | $ | 0.25 | | | $ | 0.47 | | | $ | 0.34 | | | $ | 0.30 | | | $ | 0.24 | | | $ | 0.40 | |
| Net income per share – diluted | | $ | 0.23 | | | $ | 0.32 | | | $ | 0.25 | | | $ | 0.47 | | | $ | 0.33 | | | $ | 0.30 | | | $ | 0.24 | | | $ | 0.39 | |
| Weighted average shares outstanding – basic | | | 6,644 | | | | 6,632 | | | | 6,634 | | | | 6,640 | | | | 6,639 | | | | 6,637 | | | | 6,637 | | | | 6,633 | |
| Weighted average shares outstanding – diluted | | | 6,780 | | | | 6,727 | | | | 6,732 | | | | 6,711 | | | | 6,725 | | | | 6,735 | | | | 6,734 | | | | 6,713 | |
| | | (In thousands, except per share data) | |
| | | Quarter Ended | |
| | | Dec. 31, 2009 | | | Sept 30, 2009 | | | June 30, 2009 | | | Mar. 31, 2009 | | | Dec. 31, 2008 | | | Sept 30, 2008 | | | June 30, 2008 | | | Mar. 31, 2008 | |
| | | | | | | | | | | | | | | | | | | | | | | | | |
| Revenue | | $ | 13,841 | | | $ | 13,517 | | | $ | 13,594 | | | $ | 16,740 | | | $ | 12,189 | | | $ | 13,469 | | | $ | 11,901 | | | $ | 13,454 | |
| Direct expenses | | | 5,548 | | | | 5,446 | | | | 6,304 | | | | 7,276 | | | | 5,766 | | | | 6,598 | | | | 5,320 | | | | 5,927 | |
| Selling, general and administrative | | | 4,042 | | | | 3,872 | | | | 3,697 | | | | 3,979 | | | | 2,768 | | | | 3,053 | | | | 3,348 | | | | 3,559 | |
| Depreciation and amortization | | | 929 | | | | 901 | | | | 891 | | | | 1,110 | | | | 682 | | | | 661 | | | | 676 | | | | 666 | |
| Operating income | | | 3,322 | | | | 3,298 | | | | 2,702 | | | | 4,375 | | | | 2,973 | | | | 3,157 | | | | 2,557 | | | | 3,302 | |
| Other income (expense) | | | (134 | ) | | | (166 | ) | | | (183 | ) | | | (97 | ) | | | 70 | | | | 14 | | | | (58 | ) | | | (32 | ) |
| Provision for income taxes | | | 951 | | | | 1,138 | | | | 910 | | | | 1,627 | | | | 1,148 | | | | 1,205 | | | | 918 | | | | 1,267 | |
| Net income | | $ | 2,237 | | | $ | 1,994 | | | $ | 1,609 | | | $ | 2,651 | | | $ | 1,895 | | | $ | 1,966 | | | $ | 1,581 | | | $ | 2,003 | |
| Net income per share – basic | | $ | 0.34 | | | $ | 0.30 | | | $ | 0.24 | | | $ | 0.40 | | | $ | 0.29 | | | $ | 0.30 | | | $ | 0.24 | | | $ | 0.29 | |
| Net income per share – diluted | | $ | 0.33 | | | $ | 0.30 | | | $ | 0.24 | | | $ | 0.39 | | | $ | 0.28 | | | $ | 0.29 | | | $ | 0.23 | | | $ | 0.29 | |
| Weighted average shares outstanding – basic | | | 6,639 | | | | 6,637 | | | | 6,637 | | | | 6,633 | | | | 6,642 | | | | 6,644 | | | | 6,637 | | | | 6,818 | |
| Weighted average shares outstanding – diluted | | | 6,725 | | | | 6,735 | | | | 6,734 | | | | 6,713 | | | | 6,782 | | | | 6,803 | | | | 6,793 | | | | 6,970 | |
REPORT OF INDEPENDENT REGISTERED PUBLIC ACCOUNTING FIRM
Report of Independent Registered Public Accounting Firm
To the Shareholders andThe Board of Directors and Shareholders
National Research Corporation:
We have audited the accompanying consolidated balance sheets of National Research Corporation and subsidiary as of December 31, 20092010 and 2008,2009, and the related consolidated statements of income, shareholders’ equity and comprehensive income, and cash flows for each of the years in the three-year period ended December 31, 2009.2010. In connection with our audits of the consolidated financial statements, we also have also audited the financial statement schedule listed in Item 15(a)(2)15(2) of this Form 10-K. These consolidated financial statements and financial statement schedule are the responsibility of the Company’s management. Our responsibility is to express an opinion on these consolidated financial statements and financial statement schedule based on our audits.
We conducted our audits in accordance with the standards of the Public Company Accounting Oversight Board (United States). Those standards require that we plan and perform the audit to obtain reasonable assurance about whether the financial statements are free of material misstatement. An audit includes examining, on a test basis, evidence supporting the amounts and disclosures in the financial statements. An audit also includes assessing the accounting principles used and significant estimates made by management, as well as evaluating the overall financial statement presentation. We believe that our audits provide a reasonable basis for our opinion.
In our opinion, the consolidated financial statements referred to above present fairly, in all material respects, the financial position of National Research Corporation and subsidiary as of December 31, 20092010 and 2008,2009, and the results of their operations and their cash flows for each of the years in the three-year period ended December 31, 2009,2010, in conformity with U.S. generally accepted accounting principles. Also in our opinion, the related financial statement schedule, when considered in relation to the basic consolidated financial statements taken as a whole, presents fairly, in all material respects, the information set forth therein.
Lincoln, Nebraska
March 31, 201025, 2011
NATIONAL RESEARCH CORPORATION AND SUBSIDIARY
CONSOLIDATED BALANCE SHEETS
(In thousands, except share amounts)
| | | 2009 | | | 2008 | | |
| Assets | | | | | | | | 2010 | | | 2009 | |
| Current assets: | | | | | | | | | | | | |
| Cash and cash equivalents | | $ | 2,512 | | | $ | 1,109 | | | $ | 3,519 | | | $ | 2,512 | |
| Trade accounts receivable, less allowance for doubtful accounts of $279 and $241 in 2009 and 2008, respectively | | | 5,214 | | | | 6,531 | | |
Trade accounts receivable, less allowance for doubtful accounts of $337 and $279, respectively | | | | 9,172 | | | | 5,214 | |
| Unbilled revenue | | | 1,173 | | | | 810 | | | | 1,115 | | | | 1,173 | |
| Prepaid expenses and other | | | 1,864 | | | | 1,300 | | | | 1,347 | | | | 1,864 | |
| Recoverable income taxes | | | 803 | | | | 574 | | | | 1,277 | | | | 803 | |
| Deferred income taxes | | | 98 | | | | 115 | | | | 911 | | | | 98 | |
| Total current assets | | | 11,664 | | | | 10,439 | | | | 17,341 | | | | 11,664 | |
| | | | | | | | | | | | | | | | | |
| Net property and equipment | | | 13,975 | | | | 13,747 | | | | 14,482 | | | | 13,975 | |
| Intangible assets, net | | | 6,883 | | | | 8,056 | | | | 8,638 | | | | 6,883 | |
| Goodwill | | | 39,924 | | | | 39,276 | | | | 55,133 | | | | 39,924 | |
| Other | | | 53 | | | | 627 | | | | 176 | | | | 53 | |
| | | | | | | | | | | | | | | | | |
| Total assets | | $ | 72,499 | | | $ | 72,145 | | | $ | 95,770 | | | $ | 72,499 | |
| | | | | | | | | | | | | | | | | |
| Liabilities and Shareholders’ Equity | | | | | | | | | | | | | | | | |
| Current liabilities: | | | | | | | | | | | | | | | | |
| Current portion of note payable | | $ | 816 | | | $ | 4,581 | | |
| Current portion of notes payable | | | $ | 1,827 | | | $ | 783 | |
| Accounts payable | | | 598 | | | | 863 | | | | 956 | | | | 598 | |
| Accrued wages, bonus and profit sharing | | | 1,926 | | | | 1,375 | | | | 4,315 | | | | 1,926 | |
| Accrued expenses | | | 848 | | | | 1,344 | | | | 1,351 | | | | 881 | |
| Deferred revenue | | | 11,907 | | | | 12,926 | | | | 17,701 | | | | 11,907 | |
| Total current liabilities | | | 16,095 | | | | 21,089 | | | | 26,150 | | | | 16,095 | |
| | | | | | | | | | | | | | | | | |
| Note payable, net of current portion | | | 6,903 | | | | 8,374 | | |
| Notes payable, net of current portion | | | | 14,333 | | | | 6,876 | |
| Deferred income taxes | | | 5,126 | | | | 4,084 | | | | 6,193 | | | | 5,126 | |
| Deferred revenue | | | 204 | | | | — | | | | 184 | | | | 204 | |
| Other long term liabilities | | | | 326 | | | | 27 | |
| Total liabilities | | | 28,328 | | | | 33,547 | | | | 47,186 | | | | 28,328 | |
| | | | | | | | | | | | | | | | | |
| Shareholders’ equity: | | | | | | | | | | | | | | | | |
Common stock, $.001 par value; authorized 20,000,000 shares, issued 8,018,044 in 2009 and 8,019,922 in 2008, outstanding 6,662,111 in 2009 and 6,667,517 in 2008 | | | 8 | | | | 8 | | |
Common stock, $0.001 par value; authorized 20,000,000 shares, issued 8,044,855 in 2010 and 8,018,044 in 2009, outstanding 6,668,574 in 2010 and 6,662,111 in 2009 | | | | 8 | | | | 8 | |
| Additional paid-in capital | | | 27,871 | | | | 27,217 | | | | 28,970 | | | | 27,871 | |
| Retained earnings | | | 37,905 | | | | 33,677 | | | | 41,343 | | | | 37,905 | |
| Accumulated other comprehensive income (loss), net of taxes | | | 769 | | | | (6 | ) | |
| Treasury stock, at cost; 1,355,933 shares in 2009 and 1,352,405 shares in 2008 | | | (22,382 | ) | | | (22,298 | ) | |
| Accumulated other comprehensive income, net of taxes | | | | 1,108 | | | | 769 | |
Treasury stock, at cost; 1,376,281 shares in 2010 and 1,355,933 shares in 2009 | | | | (22,845 | ) | | | (22,382 | ) |
| Total shareholders’ equity | | | 44,171 | | | | 38,598 | | | | 48,584 | | | | 44,171 | |
| | | | | | | | | | | | | | | | | |
| Total liabilities and shareholders’ equity | | $ | 72,499 | | | $ | 72,145 | | | $ | 95,770 | | | $ | 72,499 | |
See accompanying notes to consolidated financial statements.
NATIONAL RESEARCH CORPORATION AND SUBSIDIARY
CONSOLIDATED STATEMENTS OF INCOME
(In thousands, except for per share amounts)
| | | 2009 | | | 2008 | | | 2007 | | | 2010 | | | 2009 | | | 2008 | |
| | | | | | | | | | | | | | | | | | | |
| Revenue | | $ | 57,692 | | | $ | 51,013 | | | $ | 48,923 | | | $ | 63,398 | | | $ | 57,692 | | | $ | 51,013 | |
| | | | | | | | | | | | | | | | | | | | | | | | | |
| Operating expenses: | | | | | | | | | | | | | | | | | | | | | | | | |
| Direct expenses | | 24,574 | | | 23,611 | | | 21,801 | | | | 24,635 | | | | 24,148 | | | | 23,611 | |
| Selling, general and administrative | | 15,590 | | | 12,728 | | | 13,174 | | | | 20,202 | | | | 16,016 | | | | 12,728 | |
| Depreciation and amortization | | | 3,831 | | | | 2,685 | | | | 2,583 | | | | 4,704 | | | | 3,831 | | | | 2,685 | |
| Total operating expenses | | | 43,995 | | | | 39,024 | | | | 37,558 | | | | 49,541 | | | | 43,995 | | | | 39,024 | |
| | | | | | | | | | | | | | | | | | | | | | | | | |
| Operating income | | | 13,697 | | | | 11,989 | | | | 11,365 | | | | 13,857 | | | | 13,697 | | | | 11,989 | |
| | | | | | | | | | | | | | | | | | | | | | | | | |
| Other income (expense): | | | | | | | | | | | | | | | | | | | | | | | | |
| Interest income | | 2 | | | 42 | | | 139 | | | | 6 | | | | 2 | | | | 42 | |
| Interest expense | | (405 | ) | | (139 | ) | | (483 | ) | | | (491 | ) | | | (405 | ) | | | (139 | ) |
| Other, net | | | (177 | ) | | | 91 | | | | 96 | | | | (57 | ) | | | (177 | ) | | | 91 | |
| | | | | | | | | | | | | | | | | | | | | | | | | |
| Total other expense | | | (580 | ) | | | (6 | ) | | | (248 | ) | | | (542 | ) | | | (580 | ) | | | (6 | ) |
| | | | | | | | | | | | | | | | | | | | | | | | | |
| Income before income taxes | | 13,117 | | | 11,983 | | | 11,117 | | | | 13,315 | | | | 13,117 | | | | 11,983 | |
| | | | | | | | | | | | | | | | | | | | | | | | | |
| Provision for income taxes | | | 4,626 | | | | 4,538 | | | | 4,278 | | | | 4,816 | | | | 4,626 | | | | 4,538 | |
| | | | | | | | | | | | | | | | | | | | | | | | | |
| Net income | | $ | 8,491 | | | $ | 7,445 | | | $ | 6,839 | | | $ | 8,499 | | | $ | 8,491 | | | $ | 7,445 | |
| | | | | | | | | | | | | | | | | | | | | | | | | |
| Net income per share - basic | | $ | 1.28 | | | $ | 1.11 | | | $ | 1.00 | | | $ | 1.28 | | | $ | 1.28 | | | $ | 1.11 | |
| Net income per share - diluted | | $ | 1.26 | | | $ | 1.09 | | | $ | 0.98 | | | $ | 1.26 | | | $ | 1.26 | | | $ | 1.09 | |
| | | | | | | | | | | | | | | | | | | | | | | | | |
| Weighted average shares and shares equivalent outstanding - basic | | | 6,637 | | | | 6,685 | | | | 6,850 | | | | 6,637 | | | | 6,637 | | | | 6,685 | |
| Weighted average shares and shares equivalent outstanding - diluted | | | 6,723 | | | | 6,831 | | | | 7,011 | | | | 6,736 | | | | 6,723 | | | | 6,831 | |
See accompanying notes to consolidated financial statements.
NATIONAL RESEARCH CORPORATION AND SUBSIDIARY
CONSOLIDATED STATEMENTS OF SHAREHOLDERS’ EQUITY
AND COMPREHENSIVE INCOME
(In thousands except share and per share amounts)
| | | Common Stock | | | Additional Paid-in Capital | | | Retained Earnings | | | Accumulated Other Comprehensive Income | | | Treasury Stock | | | Total | | | Common Stock | | | Additional Paid-in Capital | | | Retained Earnings | | | Accumulated Other Comprehensive Income | | | Treasury Stock | | | Total | |
| | | | | | | | | | | | | | | | | | | | | | | | | | | | | | | | | | | | | | | | | | | |
| Balances at December 31, 2006 | | | 8 | | | | 21,820 | | | | 26,488 | | | | 359 | | | | (11,924 | ) | | | 36,751 | | |
| Purchase of 61,849 shares of treasury stock | | | — | | | | — | | | | — | | | | — | | | | (241 | ) | | | (241 | ) | |
| Issuance of 22,829 common shares for the exercise of stock options | | | — | | | | 338 | | | | — | | | | — | | | | — | | | | 338 | | |
| Tax benefit from the exercise of options and vested restricted stock | | | — | | | | 111 | | | | — | | | | — | | | | — | | | | 111 | | |
| Issuance of 32,115 restricted common shares, net of 9,109 cancelled | | | — | | | | — | | | | — | | | | — | | | | — | | | | — | | |
| Non-cash stock compensation expense | | | — | | | | 1,240 | | | | — | | | | — | | | | — | | | | 1,240 | | |
| Dividends declared of $0.48 per common share | | | — | | | | — | | | | (3,324 | ) | | | — | | | | — | | | | (3,324 | ) | |
| Comprehensive income | | | | | | | | | | | | | | | | | | | | | | | | | |
| Change in unrealized gain/(loss) on marketable securities, net of tax | | | — | | | | — | | | | — | | | | 4 | | | | — | | | | 4 | | |
| Change in cumulative translation adjustment | | | — | | | | — | | | | — | | | | 568 | | | | — | | | | 568 | | |
| Net income | | | — | | | | — | | | | 6,839 | | | | — | | | | — | | | | 6,839 | | |
| Total comprehensive income | | | | | | | | | | | | | | | | | | | | | | | 7,411 | | |
| Balances at December 31, 2007 | | $ | 8 | | | $ | 23,509 | | | $ | 30,003 | | | $ | 931 | | | $ | (12,165 | ) | | $ | 42,286, | | | $ | 8 | | | $ | 23,509 | | | $ | 30,003 | | | $ | 931 | | | $ | (12,165 | ) | | $ | 42,286, | |
| Purchase of 395,558 shares of treasury stock | | | — | | | | — | | | | — | | | | — | | | | (10,133 | ) | | | (10,133 | ) | | | -- | | | | -- | | | | -- | | | | -- | | | | (10,133 | ) | | | (10,133 | ) |
| Issuance of 144,614 common shares for the exercise of stock options | | | — | | | | 1,856 | | | | — | | | | — | | | | — | | | | 1,856 | | | | -- | | | | 1,856 | | | | -- | | | | -- | | | | -- | | | | 1,856 | |
| Tax benefit from the exercise of options and vested restricted stock | | | — | | | | 836 | | | | — | | | | — | | | | — | | | | 836 | | | | -- | | | | 836 | | | | -- | | | | -- | | | | -- | | | | 836 | |
| Cancellation of 7,981 restricted common shares | | | — | | | | — | | | | — | | | | — | | | | — | | | | — | | | | -- | | | | -- | | | | -- | | | | -- | | | | -- | | | | -- | |
| Non-cash stock compensation expense | | | — | | | | 1,016 | | | | — | | | | — | | | | — | | | | 1,016 | | | | -- | | | | 1,016 | | | | -- | | | | -- | | | | -- | | | | 1,016 | |
| Dividends declared of $0.56 per common share | | | — | | | | — | | | | (3,771 | ) | | | — | | | | — | | | | (3,771 | ) | | | -- | | | | -- | | | | (3,771 | ) | | | -- | | | | -- | | | | (3,771 | ) |
| Comprehensive income | | | | | | | | | | | | | | | | | | | | | | | | | |
| Change in cumulative translation adjustment | | | — | | | | — | | | | — | | | | (937 | ) | | | — | | | | (937 | ) | |
Comprehensive income Change in cumulative translation adjustment | | | | -- | | | | -- | | | | -- | | | | (937 | ) | | | -- | | | | (937 | ) |
| Net Income | | | | | | | | | | | 7,445 | | | | | | | | | | | | 7,445 | | | | -- | | | | -- | | | | 7,445 | | | | -- | | | | -- | | | | 7,445 | |
| Total comprehensive income | | | — | | | | — | | | | — | | | | — | | | | — | | | | 6,508 | | | | -- | | | | -- | | | | -- | | | | -- | | | | -- | | | | 6,508 | |
| Balances at December 31, 2008 | | $ | 8 | | | $ | 27,217 | | | $ | 33,677 | | | $ | (6 | ) | | $ | (22,298 | ) | | $ | 38,598 | | | $ | 8 | | | $ | 27,217 | | | $ | 33,677 | | | $ | (6 | ) | | $ | (22,298 | ) | | $ | 38,598 | |
| Purchase of 3,528 shares of treasury stock | | | — | | | | — | | | | — | | | | — | | | | (84 | ) | | | (84 | ) | | | -- | | | | -- | | | | -- | | | | -- | | | | (84 | ) | | | (84 | ) |
| Issuance of 2,023 common shares for the exercise of stock options | | | — | | | | 18 | | | | — | | | | — | | | | — | | | | 18 | | | | -- | | | | 18 | | | | -- | | | | -- | | | | -- | | | | 18 | |
| Tax benefit from the exercise of options and vested restricted stock | | | — | | | | 17 | | | | — | | | | — | | | | — | | | | 17 | | | | -- | | | | 17 | | | | -- | | | | -- | | | | -- | | | | 17 | |
| Cancellation of 3,901 restricted common shares | | | — | | | | — | | | | — | | | | — | | | | — | | | | — | | | | -- | | | | -- | | | | -- | | | | -- | | | | -- | | | | -- | |
| Non-cash stock compensation expense | | | — | | | | 619 | | | | — | | | | — | | | | — | | | | 619 | | | | -- | | | | 619 | | | | -- | | | | -- | | | | -- | | | | 619 | |
| Dividends declared of $0.64 per common share | | | — | | | | — | | | | (4,263 | ) | | | — | | | | — | | | | (4,263 | ) | | | -- | | | | -- | | | | (4,263 | ) | | | -- | | | | -- | | | | (4,263 | ) |
| Comprehensive income | | | | | | | | | | | | | | | | | | | | | | | | | |
| Change in cumulative translation adjustment | | | — | | | | — | | | | — | | | | 775 | | | | — | | | | 775 | | |
Comprehensive income Change in cumulative translation adjustment | | | | -- | | | | -- | | | | -- | | | | 775 | | | | -- | | | | 775 | |
| Net income | | | | | | | | | | | 8,491 | | | | | | | | | | | | 8,491 | | | | -- | | | | -- | | | | 8,491 | | | | -- | | | | -- | | | | 8,491 | |
| Total comprehensive income | | | — | | | | — | | | | — | | | | — | | | | — | | | | 9,266 | | | | -- | | | | -- | | | | -- | | | | -- | | | | -- | | | | 9,266 | |
| Balances at December 31, 2009 | | $ | 8 | | | $ | 27,871 | | | $ | 37,905 | | | $ | 769 | | | $ | (22,382 | ) | | $ | 44,171 | | | $ | 8 | | | $ | 27,871 | | | $ | 37,905 | | | $ | 769 | | | $ | (22,382 | ) | | $ | 44,171 | |
| Purchase of 20,349 shares of treasury stock | | | | -- | | | | -- | | | | -- | | | | -- | | | | (463 | ) | | | (463 | ) |
| Issuance of 17,573 common shares for the exercise of stock options | | | | -- | | | | 274 | | | | -- | | | | -- | | | | -- | | | | 274 | |
| Tax benefit from the exercise of options and vested restricted stock | | | | -- | | | | 46 | | | | -- | | | | -- | | | | -- | | | | 46 | |
| Issuance of 9,238 restricted common shares | | | | -- | | | | -- | | | | -- | | | | -- | | | | -- | | | | -- | |
| Non-cash stock compensation expense | | | | -- | | | | 779 | | | | -- | | | | -- | | | | -- | | | | 779 | |
| Dividends declared of $0.76 per common share | | | | -- | | | | -- | | | | (5,061 | ) | | | -- | | | | -- | | | | (5,061 | ) |
Comprehensive income Change in cumulative translation adjustment | | | | -- | | | | -- | | | | -- | | | | 339 | | | | -- | | | | 339 | |
| Net income | | | | -- | | | | -- | | | | 8,499 | | | | -- | | | | -- | | | | 8,499 | |
| Total comprehensive income | | | | -- | | | | -- | | | | -- | | | | -- | | | | -- | | | | 8,838 | |
| Balances at December 31, 2010 | | | $ | 8 | | | $ | 28,970 | | | $ | 41,343 | | | $ | 1,108 | | | $ | (22,845 | ) | | $ | 48,584 | |
See accompanying notes to consolidated financial statements.
NATIONAL RESEARCH CORPORATION AND SUBSIDIARY
CONSOLIDATED STATEMENTS OF CASH FLOWS
(In thousands)
| | | 2009 | | | 2008 | | | 2007 | | | 2010 | | | 2009 | | | 2008 | |
| Cash flows from operating activities: | | | | | | | | | | | | | | | | | | |
| Net income | | $ | 8,491 | | | $ | 7,445 | | | $ | 6,839 | | | $ | 8,499 | | | $ | 8,491 | | | $ | 7,445 | |
| Adjustments to reconcile net income to net cash provided by operating activities: | | | | | | | | | | | | | | | | | | | | | | | | |
| Depreciation and amortization | | | 3,831 | | | | 2,686 | | | | 2,583 | | | | 4,704 | | | | 3,831 | | | | 2,686 | |
| Deferred income taxes | | | 1,733 | | | | 430 | | | | 117 | | | | 614 | | | | 1,733 | | | | 430 | |
| Loss (gain) on sale of property and equipment | | | 1 | | | | — | | | | (3 | ) | |
| Loss on sale of property and equipment | | | | 1 | | | | 1 | | | | -- | |
| Tax benefit from exercise of stock options | | | — | | | | 156 | | | | 31 | | | | 33 | | | | -- | | | | 156 | |
| Non-cash stock compensation expense | | | 619 | | | | 1,016 | | | | 1,093 | | | | 779 | | | | 619 | | | | 1,016 | |
| Change in assets and liabilities, net of effect of acquisitions: | | | | | | | | | | | | | | | | | | | | | | | | |
| Trade accounts receivable | | | 1,396 | | | | 637 | | | | 616 | | | | (2,489 | ) | | | 1,396 | | | | 637 | |
| Unbilled revenue | | | (315 | ) | | | 603 | | | | 900 | | | | 91 | | | | (315 | ) | | | 603 | |
| Prepaid expenses and other | | | (516 | ) | | | (155 | ) | | | 30 | | | | 1,854 | | | | (516 | ) | | | (155 | ) |
| Accounts payable | | | (278 | ) | | | (408 | ) | | | (73 | ) | | | (1,391 | ) | | | (278 | ) | | | (408 | ) |
| Accrued expenses, wages, bonus and profit sharing | | | (73 | ) | | | 6 | | | | 330 | | | | 113 | | | | (73 | ) | | | 6 | |
| Income taxes payable and recoverable | | | (326 | ) | | | (249 | ) | | | 563 | | | | (442 | ) | | | (326 | ) | | | (249 | ) |
| Deferred revenue | | | (897 | ) | | | 3,008 | | | | 1,540 | | | | 2,237 | | | | (897 | ) | | | 3,008 | |
| Net cash provided by operating activities | | | 13,666 | | | | 15,175 | | | | 14,566 | | | | 14,603 | | | | 13,666 | | | | 15,175 | |
| | | | | | | | | | | | | | | | | | | | | | | | | |
| Cash flows from investing activities: | | | | | | | | | | | | | | | | | | | | | | | | |
| Purchases of property and equipment | | | (2,909 | ) | | | (2,812 | ) | | | (1,956 | ) | | | (1,539 | ) | | | (2,909 | ) | | | (2,812 | ) |
| Acquisition, net of cash acquired and earn-out on acquisition | | | (93 | ) | | | (12,551 | ) | | | — | | |
| Purchases of securities available-for-sale | | | — | | | | — | | | | (2,990 | ) | |
| Acquisitions, net of cash acquired and earn-out on acquisitions | | | | (15,441 | ) | | | (93 | ) | | | (12,551 | ) |
| Proceeds from the maturities of securities available-for-sale | | | — | | | | 99 | | | | 4,007 | | | | -- | | | | -- | | | | 99 | |
| Net cash used in investing activities | | | (3,002 | ) | | | (15,264 | ) | | | (939 | ) | | | (16,980 | ) | | | (3,002 | ) | | | (15,264 | ) |
| | | | | | | | | | | | | | | | | | | | | | | | | |
| Cash flows from financing activities: | | | | | | | | | | | | | | | | | | | | | | | | |
| Proceeds from notes payable | | | 4,916 | | | | 18,564 | | | | 375 | | | | 11,300 | | | | 4,916 | | | | 18,564 | |
| Payments on notes payable | | | (10,152 | ) | | | (8,952 | ) | | | (8,474 | ) | | | (2,799 | ) | | | (10,108 | ) | | | (8,952 | ) |
| Payments on capital lease obligations | | | | (43 | ) | | | (44 | ) | | | -- | |
| Proceeds from exercise of stock options | | | 18 | | | | 731 | | | | 338 | | | | 274 | | | | 18 | | | | 731 | |
| Tax benefit on exercise of stock options and vested restricted stock | | | 17 | | | | 680 | | | | 80 | | | | 46 | | | | 17 | | | | 680 | |
| Purchase of treasury stock | | | (84 | ) | | | (9,007 | ) | | | (241 | ) | | | (399 | ) | | | (84 | ) | | | (9,007 | ) |
| Repurchase of restricted shares for payroll tax withholdings | | | | (64 | ) | | | -- | | | | -- | |
| Payment of dividends on common stock | | | (4,263 | ) | | | (3,771 | ) | | | (3,324 | ) | | | (5,061 | ) | | | (4,263 | ) | | | (3,771 | ) |
| Net cash used in financing activities | | | (9,548 | ) | | | (1,755 | ) | | | (11,246 | ) | |
| Net cash provided by (used in) financing activities | | | | 3,254 | | | | (9,548 | ) | | | (1,755 | ) |
| | | | | | | | | | | | | | | | | | | | | | | | | |
| Effect of exchange rate changes on cash | | | 287 | | | | (402 | ) | | | 98 | | | | 130 | | | | 287 | | | | (402 | ) |
| | | | | | | | | | | | | | | | | | | | | | | | | |
| Net increase (decrease) in cash and cash equivalents | | | 1,403 | | | | (2,246 | ) | | | 2,479 | | | | 1,007 | | | | 1,403 | | | | (2,246 | ) |
| | | | | | | | | | | | | | | | | | | | | | | | | |
| Cash and cash equivalents at beginning of period | | | 1,109 | | | | 3,355 | | | | 876 | | | | 2,512 | | | | 1,109 | | | | 3,355 | |
| | | | | | | | | | | | | | | | | | | | | | | | | |
| Cash and cash equivalents at end of period | | $ | 2,512 | | | $ | 1,109 | | | $ | 3,355 | | | $ | 3,519 | | | $ | 2,512 | | | $ | 1,109 | |
| | | | | | | | | | | | | | | | | | | | | | | | | |
| Supplemental disclosure of cash paid for: | | | | | | | | | | | | | | | | | | | | | | | | |
| Interest expense | | $ | 498 | | | $ | 122 | | | $ | 483 | | |
| Interest expense, net of capitalized amounts | | | $ | 497 | | | $ | 498 | | | $ | 122 | |
| Income taxes | | $ | 2,999 | | | $ | 3,502 | | | $ | 3,457 | | | $ | 4,549 | | | $ | 2,999 | | | $ | 3,502 | |
Supplemental disclosures of non-cash investing activities:
Capital lease obligations for property and equipment originating during the years ended December 31, 2010, 2009 and 2008 was $389,000, $0 and $0, respectively.
In connection with the Company’s Equity Incentive plans, certain optionees tendered to the Company previously owned shares to pay for the option strike price. The total non-cash stock options exercised was $0,$-0-, $-0- and $1.1 million and $0 for the years ended December 31, 2010, 2009, 2008, and 2007,2008, respectively.
See accompanying notes to consolidated financial statements.
NATIONAL RESEARCH CORPORATION AND SUBSIDIARY
NOTES TO CONSOLIDATED FINANCIAL STATEMENTS
(1) | Summary of Significant Accounting Policies |
(1) Summary of Significant Accounting Policies
Description of Business and Basis of Presentation
National Research Corporation (the(“NRC” or the “Company”) believes it is a leading provider of ongoing survey-based performance measurement analysis, tracking,and improvement services, healthcare analytics and governance education to the healthcare industry in the United States and Canada. The Company provides market research services to hospitals and insurance companies on an unsecured credit basis. The Company’s ten largest clients accounted for 14%19%, 24%19%, and 29%24% of the Company’s total revenue in 2010, 2009, 2008, and 2007,2008, respectively.
Principles of Consolidation
The consolidated financial statements include the accounts of the Company and its subsidiary. All significant intercompany transactions and balances have been eliminated in consolidation.
Use of Estimates
The preparation of financial statements in conformity with accounting principles generally accepted in the United States of America requires management to make certain estimates and assumptions that affect the reported amounts of assets and liabilities at the date of the financial statements and the reported amounts of revenue and expenses during the reporting period. Actual results could differ from those estimates.
Translation of Foreign Currencies
The Company’s Canadian subsidiary uses as its functional currency the local currency of the country in which it operates. It translates its assets and liabilities into U.S. dollars at the exchange rate in effect at the balance sheet date. It translates its revenue and expenses at the average exchange rate during the period. The Company includes translation gains and losses in accumulated other comprehensive income (loss), a component of shareholders’ equity. Gains and losses related to transactions denominated in a currency other than the functional currency of the countries in which the Company operates and short-term intercompany accounts are included in other income (expense) in the consolidated statements of income.
Revenue Recognition
The Company derives a majority of its operating revenue from its annually renewable services, which include the performance trackingmeasurement and improvement services, subscription-based educational serviceshealthcare analytics and subscription-based and annual contracts of Ticker.governance education services. The Company provides interim and annual performance trackingthese services to its clients under annual client service contracts, although such contracts are generally cancelable on short or no notice without penalty. The Company provides subscription-based educational services to clients generally under annual service contracts over a twelve-month period and publishes healthcare market information for its clients through its Ticker on an annual or monthly basis. The Company also derives some revenue from its custom and other research projects. Sales taxes collected from customers
Certain contracts are fixed-fee arrangements with a portion of the project fee billed in advance and remitted to governmental authoritiesthe remainder billed periodically over the duration of the project. Revenue and direct expenses for services provided under these contracts are accounted for on a net basis and, therefore, are excluded from revenue inrecognized under the consolidated statements of income.
The Company recognizes revenue from itsproportional performance tracking services and its custom and other research projects usingmethod. Under the proportional performance method, of accounting. These services typically include a series of surveys and deliverable reports in which the timing and frequency vary by contract. Progress on a contract can be tracked reliably, and customers are obligated to pay as services are performed. The Company recognizes revenue based on output measures or key milestones such as survey set up,set-up, survey mailings, survey returns and reporting. The Company measures its progress based on the level of completion of these output measures and recognizes revenue accordingly. Management judgments and estimates must be made and used in connection with revenue recognized using the revenue related to output measures. Losses expected to be incurred, if any, on jobs in progress are charged to income as soon as such losses are known. Revenue earned on contracts in progress in excess of billings is classified as a current asset. Amounts billed in excessproportional performance method. If management made different judgments and estimates, then the amount and timing of revenue earned are classified as a current liability. Client projects are generally completed within a twelve-month period.for any period could differ materially from the reported revenue.
Services are also provided under subscription-based service agreements. The Company recognizes subscription-based educational service revenue over the period of time the service is provided. Generally, the subscription periods are for twelve months and revenue is recognized equally over the subscription period.
The Company recognizesalso derives revenue on Ticker contracts upon deliveryfrom hosting arrangements where our propriety software is offered as a service to our customers through our data processing facilities. The Company’s revenue also includes software-related revenue for software license revenue, installation services, post-contract support (maintenance) and training. Software-related revenue is recognized in accordance with the provisions of ASC 985-605, Software-Revenue Recognition.
Hosting arrangements to provide customers with access to the principal customers. RevenueCompany’s propriety software are marketed under some annual contracts whichlong-term arrangements generally over periods of one to three years. Under these arrangements, the customer is not provided the contractual right to take possession of the licensed software at any time during the hosting period without significant penalty, and the customer is not provided the right to run the software on their own hardware or contract with another party unrelated to us to host the software. Upfront fees for set-up services are typically billed for our hosting arrangements, however, these arrangements do not qualify for separation from the ongoing hosting services due to the absence of standalone value for the set-up services. Therefore, we account for these arrangements as service contracts and recognize revenue ratably over the hosting service period when all other conditions to revenue are met. Other conditions that must be met before the commencement of revenue recognition include monthly updatesachieving evidence of an arrangement, determining that the collection of the revenue is fullyprobable, and determining that fees are fixed and determinable.
The Company’s software arrangements typically involve the sale of a time-based license bundled with installation services, post-contract support (“PCS”) and training. License terms range from one year to three years, and require an annual fee for bundled elements of the arrangement. PCS is also contractually provided for a period that is co-terminus with the term of the time-based license. The Company’s installation services are not considered to be essential to the functionality of the software license. The Company does not achieve vendor-specific objective evidence (“VSOE”) of the fair value of the undelivered elements of its software arrangements (primarily PCS) and, therefore, these arrangements are accounted for as a single unit of accounting with revenue recognized upon delivery, typicallyratably over the minimum bundled PCS period.
The Company’s revenue arrangements (not involving software elements) may include multiple elements. In assessing the separation of revenue for elements of such arrangements, we first determine whether each delivered element has standalone value based on whether we, or other vendors, sell the services separately. We also consider whether there is sufficient evidence of the fair value of the elements in allocating the fees in the third quarter of the year. Starting in May 2008, the Company added subscription-based services, thearrangement to each element. Revenue allocated to an element is limited to revenue from whichthat is generally recognized on a monthly basis over a twelve-month period. Until September 2008, the Company deferred costs of preparing the survey data for Ticker and expensed these at the time the annual contract revenue was recognized. These costs are primarily incremental external direct costs solely relatednot subject to fulfilling the Company’s obligations under Ticker contracts. Beginning in October 2008, these costs are expensed monthly as incurred. The Company generates additional revenue from incidental customers subsequent to the completion of each monthly edition. Revenue and costs for these subsequent services are recognized as the services are performed and completed.refund or otherwise represent contingent revenue.
Trade Accounts Receivable
Trade accounts receivable are recorded at the invoiced amount. The allowance for doubtful accounts is the Company’s best estimate of the amount of probable credit losses in the Company’s existing accounts receivable. The Company determines the allowance based on specific account analysis and on the Company’s historical write-off experience. The Company reviews the allowance for doubtful accounts monthly. Past due balances over 90 days and over a specified amount are reviewed individually for collectability and provisions are made for accounts not specifically reviewed. Account balances are charged off against the allowance after all means of collection have been exhausted and the potential for recovery is considered remote.
Property and Equipment
Property and equipment is stated at cost. Major expenditures to purchase property or to substantially increase useful lives of property are capitalized. Maintenance, repairs and minor renewals are expensed as incurred. When assets are retired or otherwise disposed of, their costs and related accumulated depreciation are removed from the accounts and resulting gains or losses are included in income.
For costs of software developed for internal use, the Company expenses computer software costs as incurred in the preliminary project stage, which involves the conceptual formulation, evaluation and selection of technology alternatives. Costs incurred related to the design, coding, installation and testing of software during the application project stage are capitalized. Costs for training and application maintenance are expensed as incurred. The Company has capitalized approximately $900,000, $450,000 $493,000 and $511,000,$493,000, of internal and external costs incurred for the development of internal useinternal-use software for the years ended December 31, 2010, 2009 2008 and 2007,2008, respectively, with such costs classified as property and equipment.
The Company provides for depreciation and amortization of property and equipment using annual rates which are sufficient to amortize the cost of depreciable assets over their estimated useful lives. The Company uses the straight-line method of depreciation and amortization over estimated useful lives of five to ten years for furniture and equipment, three to five years for computer equipment, three to five years for capitalized software, and ten to forty years for the Company’s office building and related improvements.
Leases are categorized as operating or capital at the inception of the lease. Assets under capital lease obligations are reported at the lower of fair value or the present value of the aggregate future minimum lease payments at the beginning of the lease term. The Company depreciates capital lease assets without transfer-of-ownership or bargain-purchase-options using the straight-line method over the lease terms, excluding any lease renewals, unless the lease renewals are reasonably assured. Capital lease assets with transfer-of-ownership or bargain-purchase-options are depreciated using the straight-line method over the assets’ estimated useful lives.
Impairment of Long-Lived Assets
The Company monitors eventsLong-lived assets, such as property and changes in circumstances that may require the Companyequipment and purchased intangible assets subject to review the carrying value of its long-lived assets. The Company assesses whether anamortization, are reviewed for impairment of assets held and used may have occurred using undiscounted future operating cash flows. Impairments, if they occur, are measured using the fair value of the assets. The assessment of the recoverability of long-lived assets may be adversely impacted if estimated future operating cash flows are not achieved.
The Company assesses the impairment of long-lived assets whenever events or changes in circumstances indicate that the carrying valueamount of such assetsan asset may not be recoverable. If circumstances require a long-lived asset or asset group be tested for possible impairment, the Company first compares undiscounted cash flows expected to be generated by that asset or asset group to its carrying value. If the carrying value of the long-lived asset or asset group is not recoverable on an undiscounted cash flow basis, an impairment is recognized to the extent that the carrying value exceeds its fair value. Fair value is determined through various valuation techniques including discounted cash flow models, quoted market values and third-party independent appraisals, as considered necessary. No impairments were recorded during the years ended December 31, 2010, 2009 or 2008.
Among others, management believes the following circumstances are important indicators of potential impairment of such assets and as a result may trigger an impairment review:
| · | Significant underperformance in comparison to historical or projected operating results; |
30
| · | Significant changes in the manner or use of acquired assets or the Company’s overall strategy; |
Significant negative trends in the Company’s industry or the overall economy;
| · | Significant negative trends in the Company’s industry or the overall economy; |
The Company’s market capitalization falling below the book value of the Company’s net assets. | · | A significant decline in the market price for the Company’s common stock for a sustained period; and |
| · | The Company’s market capitalization falling below the book value of the Company’s net assets. |
Goodwill and Intangible Assets
Intangible assets include customer relationships, trade names, non-compete agreements and goodwill. Customer relationships are being amortized over periods of five to fifteen years. One of the trade names is being amortized over a period of ten years. The other trade name is indefinite lived. Goodwill represents the difference between the purchase price paid in acquisitions, using the purchase method of accounting, and the fair value of the net assets acquired.
Goodwill and intangible assets acquired in a purchase business combination and determined to have an indefinite useful life are not amortized, but instead are tested for impairment at least annually. Intangible assets with estimable useful lives are amortized over their respective estimated useful lives to their estimated residual values and reviewed for impairment.
Goodwill is an asset representing the future economic benefits arising from other assets acquired in a business combination that are not individually identified and separately recognized. Goodwill is reviewed for impairment at least annually. The goodwill impairment test is a two-step test. Under the first step, the fair value of the reporting unit is compared with its carrying value (including goodwill). If the fair value of the reporting unit is less than its carrying value, an indication of goodwill impairment exists for the reporting unit and the entity must perform step two of the impairment test (measurement). Under step two, an impairment loss is recognized for any excess of the carrying amount of the reporting unit’s goodwill over the implied fair value of that goodwill. The implied fair value of goodwill is determined by allocating the fair value of the reporting unit in a manner similar to a purchase price allocation and the residual fair value after this allocation is the implied fair value of the reporting unit goodwill. Fair value of the reporting unit is determined using a discounted cash flow analysis. If the fair value of the reporting unit exceeds its carrying value, step two does not need to be performed.
All of the Company’s goodwill is allocated to five of its six reporting units. As of December 31, 2009, the Company has goodwill of $39.9 million. As of October 1 of each year (or more frequently as changes in circumstances indicate), the Company tests goodwill for impairment using level 3 inputs as defined in the fair value hierarchy. Refer to Note 1, Fair Value Measurements, for the definitionimpairment. There are a number of the levels in the fair value hierarchy. The inputs used to calculate the fair value included theusing a discounted cash flow model, including operating results, business plans, projected cash flows and a discount rate. Discount rates, growth rates and cash flow projections are the most sensitive and susceptible to change as they require significant management judgment. Discount rates are determined by using a weighted average cost of capital, which considers market and industry data as well as Company-specific risk factors. Operational management develops growth rates and cash flow projections for each reporting unit considering industry and Company-specific historical and projected information. Terminal value rate thatdetermination follows common methodology of capturing the Company estimated would be used bypresent value of perpetual cash flow estimates beyond the last projected period assuming a market participant in valuing these assets.constant weighted average cost of capital and low long-term growth rates. On these evaluation dates, to the extent that the carrying value of the net assets of the Company’s reporting units having goodwill is greater than the estimated fair value, impairment charges will be determined and measured based on the estimated fair value of goodwill as compared to its carrying value. No impairments were recorded during the years ended December 31, 2010, 2009 or 2008.
Income Taxes
The Company uses the asset and liability method of accounting for income taxes. Under that method, deferred income tax assets and liabilities are recognized for the future tax consequences attributable to differences between the financial statement carrying amounts of existing assets and liabilities and their respective tax basis using enacted tax rates. The effect on deferred tax assets and liabilities of a change in tax rates is recognized in income in the period that includes the enactment date. Valuation allowances, if any, are established when necessary to reduce deferred tax assets to the amount that is more likely than not to be realized. The Company uses the deferral method of accounting for its investment tax credits related to state tax incentives. During the years ended December 31, 2010, 2009 2008 and 2007,2008, the Company recorded income tax benefits relating to these tax credits of $251,000, $189,000, $0, and $0.
The Company recognizes the effect of income tax positions only if those positions are more likely than not of being sustained. Recognized income tax positions are measured at the largest amount that is greater than 50% likely of being realized. Changes in recognition or measurement are reflected in the period in which the change in judgment occurs.
The Company had an unrecognized tax benefit at December 31, 2010 and 2009 of $269,000 and $541,000, respectively excluding interest of $31,000 and $3,000, respectively and no penalties. Of this amount, $269,000 and $78,000 at December 31, 2010 and 2009, respectively represents the net unrecognized tax benefits that, if recognized, would favorably impact the effective income tax rate. The Company accrues interest and penalties related to uncertain tax position in the statements of income as income tax expense. The Company is not subject to tax examinations for years prior to 20062007 in the U.S. and 20052006 in Canada.
Share-Based Compensation
The Company measures and recognizes compensation expense for all share-based payments. The compensation expense is recognized based on the grant-date fair value of those awards. All of the Company’s existing stock option awards and non-vested stock awards have been determined to be equity-classified awards.
Amounts recognized in the financial statements with respect to these plans:
| | | 2009 | | | 2008 | | | 2007 | | | 2010 | | | 2009 | | | 2008 | |
| | | (In thousands) | | | (In thousands) | |
| Amounts charged against income, before income tax benefit | | $ | 619 | | | $ | 1,016 | | | $ | 1,093 | | | $ | 779 | | | $ | 619 | | | $ | 1,016 | |
| Amount of related income tax benefit | | | 238 | | | | 391 | | | | 421 | | | | 309 | | | | 238 | | | | 391 | |
| Total net income impact | | $ | 381 | | | $ | 625 | | | $ | 672 | | | $ | 470 | | | $ | 381 | | | $ | 625 | |
Cash and Cash Equivalents
For purposes of the statements of cash flows, the Company considers all highly liquid investments with original maturities of three months or less to be cash equivalents. Cash equivalents were $2.8 million as of December 31, 2010, consisting of money market funds, and $2.5 million as of December 31, 2009, consisting of U.S. government notes of $1.6 million and money market funds of $930,000 as of December 31, 2009, and $379,000 of money market funds as of December 31, 2008.$930,000.
Fair Value Measurements
The Company’s valuation techniques are based on maximizing observable and unobservable inputs and minimizing the use of unobservable inputs when measuring fair value. Observable inputs reflect readily obtainable data from independent sources, while unobservable inputs reflect the Company’s market assumptions. The inputs are then classified into the following hierarchy: (1) Level 1 Inputs—quoted prices in active markets for identical assets and liabilities,liabilities; (2) Level 2 Inputs—observable market-based inputs other than Level 1 inputs, such as quoted prices for similar assets or liabilities in active markets;markets, quoted prices for similar or identical assets or liabilities in markets that are not active;active, or other inputs that are observable or can be corroborated by observable market data,data; (3) Level 3 Inputs—unobservable inputs.
As of December 31, 2009, thoseThe following details the Company’s financial assets and liabilities that are measured atwithin the fair value hierarchy at December 31, 2010 and 2009:
| | | Level 1 | | | Level 2 | | | Level 3 | | | Total | |
| | | (In thousands) | |
As of December 31, 2010: Money Market Funds | | $ | 2,790 | | | $ | -- | | | $ | -- | | | $ | 2,790 | |
As of December 31, 2009: Money Market Funds | | $ | 930 | | | $ | -- | | | $ | -- | | | $ | 930 | |
| U.S. Government notes | | | -- | | | | 1,560 | | | | -- | | | | 1,560 | |
| Total | | $ | 930 | | | $ | 1,560 | | | $ | -- | | | $ | 2,490 | |
The Company's long-term debt is recorded at historical cost. The following are the carrying amount and estimated fair values, based primarily on a recurring basis consistedestimated current rates available for debt of the following:same remaining duration and adjusted for nonperformance and credit risk:
| | | December 31, 2010 | | | December 31, 2009 | |
| | | (In thousands) | |
| Total carrying amount of long-term debt | | $ | 16,160 | | | $ | 7,659 | |
| Estimated fair value of long-term debt | | $ | 16,305 | | | $ | 7,642 | |
| | | Level 1 | | | Level 2 | | | Level 3 | |
| | | (In thousands) | |
| Money Market Funds | | $ | 930 | | | $ | — | | | $ | — | |
| U.S. government notes | | | — | | | | 1,560 | | | | — | |
| Total | | $ | 930 | | | $ | 1,560 | | | $ | — | |
The Company believes that the carrying amounts of its other financial instruments, including cash,accounts receivable, accounts payable, and accrued expenses approximate their fair value due to the short-term maturities of these instruments.value. All non-financial assets and liabilities that are not recognized or disclosed at fair value in the financial statements on a recurring basis, which includes goodwill and non-financial long livedlong-lived assets, are measured at fair value in certain circumstances (for example, when there is evidence of impairment). As of December 31, 2010 and 2009 there was no indication of impairment related to our non-financial assetsproperty and liabilities. Refer to Note 1, Goodwillequipment, goodwill and Intangible Assets, for further description of the inputs used to measure fair value of goodwill as part of our annual impairment test.other intangible assets.
Earnings Per Share
Net income per share has been calculated and presented for “basic” and “diluted” per share data. Basic net income per share is computed by dividing net income by the weighted average number of common shares outstanding. Diluted income per share is computed by dividing net income by the weighted average number of common shares adjusted for the dilutive effects of options and restricted stock. At December 31, 2010, 2009 2008 and 2007,2008, the Company had 384,652, 247,603 -0- and 48,000-0- options, respectively, which have been excluded from the diluted net income per share computation because their exercise price exceeds the fair market value.
The weighted average shares outstanding were calculated as follows:
| | | 2009 | | | 2008 | | | 2007 | | | 2010 | | | 2009 | | | 2008 | |
| | | (In thousands) | | | (In thousands) | |
| Common stock | | | 6,637 | | | | 6,685 | | | | 6,850 | | | | 6,637 | | | | 6,637 | | | | 6,685 | |
| Dilutive effect of options | | | 74 | | | | 131 | | | | 131 | | | | 87 | | | | 74 | | | | 131 | |
| Dilutive effect of restricted stock | | | 12 | | | | 15 | | | | 30 | | | | 12 | | | | 12 | | | | 15 | |
| Weighted average shares used for dilutive per share information | | | 6,723 | | | | 6,831 | | | | 7,011 | | | | 6,736 | | | | 6,723 | | | | 6,831 | |
There are no reconciling items between the Company’s reported net income and net income used in the computation of basic and diluted income per share.
Comprehensive Income
Comprehensive income consists of net income and other comprehensive income (loss). Other comprehensive income (loss) refers to revenue, expenses, gains and losses that are not included in net income, but rather are recorded directly in stockholder’s equity. For the years ended December 31, 20092010 and 20082009, accumulated other comprehensive income (loss) was $769,000$1.1 million and ($6,000),$769,000, respectively, consisting solely of changes in the cumulative translation adjustment.
Segment Information
The Company has sixseven operating segments that are aggregated into one reporting segment because they have similar economic characteristics and meet the other aggregation criteria withinfrom the authoritativeFinancial Accounting Standards Board (“FASB”) guidance on disclosure about enterprise segments.segment disclosure. The sixseven operating segments are as follows: NRC Picker U.S. and NRC Picker Canada, which each offer renewable performance tracking and improvement services, custom research, best practice improvementsubscription-based educational services and a renewable syndicated service; Healthcare Market Guide (Ticker)Ticker, which offers stand-alone market information as well as a comparative performance database to allow the Company’s clients to assess their performance relative to the industry, to access best practice examples, and to utilize competitive information for marketing purposes; Payer Solutions, which offers functional disease-specific and health status measurement tools; The Governance Institute (TGI)(“TGI”), which offers subscription-based governance information and educational conferences designed to improve the effectiveness of hospital and healthcare systems by continually strengthening their healthcare boards, medical leadership and management performance in the United States; and My InnerView (MIV)(“MIV”), which provides quality and performance improvement solutions to the senior care profession.industry; and Illuminate, a new patient outreach and discharge program designed to facilitate service and clinical recovery within the critical hours after a patient is discharged from a healthcare setting within the acute care, skilled nursing, physician and home health environments. On August 3, 2010, the Company acquired Outcome Concept Systems, Inc. (“OCS”), a provider of clinical, financial and operational benchmarks and analytics to home care and hospice providers, that has been merged into the MIV operating segment.
Adoption of New Accounting Pronouncements
In June 2009,January 2010, the FASB issued the Accounting Standards Codification™ (“Codification”) as the sourceamended fair value guidance to require companies to make new disclosures about recurring and/or non-recurring fair value measurements including significant transfers into and out of authoritative U.S. generally accepted accounting principles (“GAAP”) recognized by FASB to be applied by nongovernmental entities. The Codification supersedes all then-existing non-SEC accountingLevel 1 and reporting standards. In accordance with the Codification, references to accounting literature in this report are presented in plain English. The Codification did not change GAAP, but reorganizes the literature. The Codification isLevel 2 measurements. This guidance was effective for financial statements issued forannual or interim and annualreporting periods endingbeginning after SeptemberDecember 15, 2009. The adoption of the Codificationthis pronouncement has not had an impacteffect on the consolidated financial statements.statements as it pertains only to disclosure requirements. In addition, as part of this guidance and effective for annual or interim reporting periods beginning after December 15, 2010, disclosure of purchases, sales, issuances and settlement of assets must be on a gross basis for Level 3 measurements, where currently it is on a net basis. Also, the level of disaggregation will be increased by “class” instead of “major category.” The adoption of this pronouncement has not had an effect on the consolidated financial statements as it pertains to only disclosure requirements.
Recent Accounting Pronouncements
In September 2009, the FASB issued new guidance for revenue recognition with multiple deliverables, which is effective for revenue arrangements entered into or materially modified in fiscal years beginning on or after June 15, 2010, although early adoption is permitted. This guidance eliminates the residual method under the current guidance and replaces it withrequires the use of the “relative selling price” method when allocating revenue in a multiple deliverable arrangement. The selling price for each deliverable shall be determined using vendor specific objective evidence of selling price, if it exists, otherwise third-party evidence of selling price. If neither exists for a deliverable, the vendor shall use its best estimate of the selling price for that deliverable. After adoption, this guidance will also require expanded qualitative and quantitative disclosures. AsThe Company plans to adopt this guidance on January 1, 2011, and is assessing the potential impact on its financial position and results of December 31, 2009, management believes that adoption of this new guidance will not have a material effect on the consolidated financial statements.operations.
On August 3, 2010, the Company acquired all of the issued and outstanding shares of stock and stock rights of OCS, a provider of clinical, financial and operational benchmarks and analytics to home care and hospice providers. The acquisition provides the Company with an entry in the home health and hospice markets through OCS’s customer relationships with home healthcare and hospice providers and expands the Company's service offerings across the continuum of care. Goodwill related to the acquisition of OCS primarily relates to intangible assets that do not qualify for separate recognition including the depth and knowledge of management. The all-cash consideration paid at closing was
$15.3 million, net of $1.0 million cash received. Of the purchase price, $1.6 million was deposited into an escrow for indemnification, working capital adjustments and certain other potential claims or expenses following closing. During the fourth quarter of 2010, the Company finalized the valuation and purchase allocation. The following table summarizes the fair value of the assets acquired and liabilities assumed at the acquisition date.
Amount of Identified Assets Acquired and Liabilities Assumed | |
| (In thousands) | |
| Current Assets | | $ | 3,615 | |
| Property and equipment | | | 1,632 | |
| Customer relationships | | | 2,330 | |
| Trade name | | | 330 | |
| Non-compete Agreements | | | 430 | |
| Goodwill | | | 13,502 | |
| Total acquired assets | | | 21,839 | |
| | | | | |
| Current liabilities | | | 6,310 | |
| Long-term liabilities | | | 260 | |
| Total liabilities assumed | | | 6,570 | |
| | | | | |
| Net assets acquired | | $ | 15,269 | |
The identifiable intangible assets are being amortized over their estimated useful lives and have a total weighted average amortization period of 8.5 years. The excess of purchase price over the fair value of net assets acquired resulted in the Company recording $13.5 million of goodwill. The goodwill and identifiable intangible assets are non-deductible for tax purposes. No residual value was estimated for intangible assets.
The consolidated financial statements as of December 31, 2010, and for the year then ended, include amounts acquired from, as well as the results of operations of, OCS from August 3, 2010, forward. Results of operations for the year ended December 31, 2010, include revenue of $3.0 million and operating income of $221,000 attributable to OCS since its acquisition. Acquisition-related costs included in selling, general and administrative expenses for the year ended December 31, 2010, approximated $312,000. The following unaudited pro forma information for the Company has been prepared as if the acquisition of OCS had occurred on January 1, 2009. The information is based on the historical results of the separate companies and may not necessarily be indicative of the results that could have been achieved or of results that may occur in the future. The pro forma adjustments include the impact of depreciation and amortization of property and equipment and intangible assets acquired, interest expense on the acquisition debt and income tax benefits for tax effects of the foregoing adjustments to depreciation, amortization and interest expense.
| | | Year Ended December 31, | |
| | | 2010 | | | 2009 | |
| | | (in thousands) | |
| Revenue | | $ | 67,341 | | | $ | 63,457 | |
| Net income | | $ | 7,664 | | | $ | 7,198 | |
| | | | | | | | | |
| Net income per share - basic | | $ | 1.15 | | | $ | 1.08 | |
| Net income per share - diluted | | $ | 1.14 | | | $ | 1.07 | |
On December 19, 2008, the Company acquired My InnerView, Inc. (“MIV”),MIV, a leading provider of quality and performance improvement solutions to the senior care profession. MIV offers resident, family and employee satisfaction measurement and improvement products to the long term-care,long-term care, assisted and independent living markets in the United States. MIV works with over 8,000 senior care providers throughout the United States, housing what the Company believes is the largest dataset of senior care satisfaction metrics in the nation. The acquisition was completed in order to pursue the Company’s strategy of expanding additional service offerings to the healthcare industry in the United States and Canada. This acquisition gives the Company a foundation upon which to expand in the senior care profession. The consideration paid at closing for MIV included a payment of $11.5 million in cash and $440,000 of direct expenses capitalized as purchase price. The merger agreement under which the Company acquired MIV provided for contingent earn-out payments over three years based on revenue and operating income increases.
In connection with the acquisition the Company recorded the following amounts as its preliminary purchase price allocation, based on the estimated fair value of the assets acquired and liabilities assumed at the date of acquisition:
| | | Fair Value | |
| | | (In thousands) | |
| Current Assets | | $ | 1,290 | |
| Property and equipment | | | 846 | |
| Customer relationships | | | 3,003 | |
| Goodwill | | | 8,833 | |
| Other Long Term Assets | | | 581 | |
| Total acquired assets | | | 14,553 | |
| Less total liabilities | | | 2,613 | |
| Net assets acquired | | $ | 11,940 | |
The excess of purchase price over the fair value of net assets acquired resulted in the Company recording $8.8 million of goodwill. The customer relationships acquired intangible asset is being amortized over a useful life of 10 years. The amortization of customer relationships and goodwill is non-deductible for tax purposes.
During the year ended December 31, 2009, the Company adjusted the initial purchase price allocation resulting in a net increase to goodwill of $240,000, which was due to additional contingent consideration earned of $795,000, deferred tax adjustments of $630,000, and allowance for doubtful accounts of $75,000. During the year ended December 31, 2010, the Company increased goodwill by $1.6 million to record additional earn-out payment requirements which were paid in February 2011.
The following unaudited pro forma information for the Company has been prepared as if the acquisition of MIV had occurred on January 1, 2007.2008. The information is based on the historical results of the separate companies and may not necessarily be indicative of the results that could have been achieved or of results that may occur in the future. The pro forma adjustments include the impact of depreciation and amortization of property and equipment and intangible assets acquired, interest expense on the acquisition debt, and income tax benefits for tax effects of the foregoing adjustments to depreciation, amortization and interest expense.
| | | 2008 | |
| | | (In thousands, except per share amounts) (Unaudited ) | |
| Revenue | | $ | 58,008 | |
| Net income | | $ | 7,457 | |
| Earnings per share - basic | | $ | 1.12 | |
| Earnings per share - diluted | | $ | 1.09 | |
| | | 2008 | | | 2007 | |
| | | (In thousands, except per share amounts) (Unaudited) | |
| Revenue | | $ | 58,008 | | | $ | 54,904 | |
| Net income | | $ | 7,457 | | | $ | 6,586 | |
| Earnings per share - basic | | $ | 1.12 | | | $ | 0.96 | |
| Earnings per share - diluted | | $ | 1.09 | | | $ | 0.94 | |
(3) | Property and Equipment |
(3) Property and Equipment
At December 31, 20092010 and 2008,2009, property and equipment consisted of the following:
| | | 2010 | | | 2009 | |
| | | (In thousands) | |
| Furniture and equipment | | $ | 3,165 | | | $ | 2,639 | |
| Computer equipment and software | | | 15,721 | | | | 16,911 | |
| Building | | | 9,367 | | | | 9,130 | |
| Land | | | 425 | | | | 425 | |
| | | | 28,678 | | | | 29,105 | |
| Less accumulated depreciation and amortization | | | 14,196 | | | | 15,130 | |
| Net property and equipment | | $ | 14,482 | | | $ | 13,975 | |
| | | 2009 | | | 2008 | |
| | | (In thousands) | |
| Furniture and equipment | | $ | 2,639 | | | $ | 2,536 | |
| Computer equipment and software | | | 16,911 | | | | 14,467 | |
| Building | | | 9,130 | | | | 9,108 | |
| Land | | | 425 | | | | 425 | |
| | | | 29,105 | | | | 26,536 | |
| Less accumulated depreciation and amortization | | | 15,130 | | | | 12,789 | |
| Net property and equipment | | $ | 13,975 | | | $ | 13,747 | |
Depreciation and amortization expense related to property and equipment, including assets under capital lease, for the years ended December 31, 2010, 2009, and 2008 was $3.4 million, $2.7 million, and $1.8 million, respectively.
(4) | Goodwill and Intangible Assets |
Property and equipment included the following amounts under capital lease:| | | 2010 | | | 2009 | |
| | | (In thousands) | |
| Furniture and equipment | | $ | 411 | | | $ | 22 | |
| Computer equipment and software | | | 47 | | | | -- | |
| | | | 458 | | | | 22 | |
| Less accumulated amortization | | | 38 | | | | 8 | |
| Net assets under capital lease | | $ | 420 | | | $ | 14 | |
(4) Goodwill and Intangible Assets
Goodwill and intangible assets consisted of the following at December 31, 20092010 and 2008:
| | | 2009 | | | 2008 | |
| | | (In thousands) | |
| Goodwill | | $ | 39,924 | | | $ | 39,276 | |
| Non-amortizing other intangible assets: | | | | | | | | |
| Trade name | | | 1,191 | | | | 1,191 | |
| Amortizing other intangible assets: | | | | | | | | |
| Customer related intangibles | | | 8,174 | | | | 8,150 | |
| Trade name | | | 1,572 | | | | 1,572 | |
| Total other intangible assets, | | | 10,937 | | | | 10,913 | |
| Less accumulated amortization | | | 4,054 | | | | 2,857 | |
| Other intangible assets, net | | $ | 6,883 | | | $ | 8,056 | |
| | | 2010 | | | 2009 | | | Useful Life | |
| | | (In thousands) | | | | |
| Goodwill | | $ | 55,133 | | | $ | 39,924 | | | | -- | |
| Non-amortizing other intangible assets: | | | | | | | | | | | | |
| Trade name | | | 1,191 | | | | 1,191 | | | | -- | |
| Amortizing other intangible assets: | | | | | | | | | | | | |
| Customer related intangibles | | | 10,520 | | | | 8,174 | | | 5 - 15 years | |
Non-competes | | | 430 | | | | -- | | | 3 years | |
Trade names | | | 1,902 | | | | 1,572 | | | 5 - 10 years | |
| Total other intangible assets, | | | 14,043 | | | | 10,937 | | | | | |
| Less accumulated amortization | | | 5,405 | | | | 4,054 | | | | | |
| Other intangible assets, net | | $ | 8,638 | | | $ | 6,883 | | | | | |
The following represents a summary of changes in the Company’s carrying amount of goodwill for the years ended December 31, 2010, 2009, and 2008 and 2007:(in thousands):
| | | (In thousands) | | | | |
| Balance as of December 31, 2006 | | $ | 30,014 | | |
| Smaller World additional payment for contingent consideration | | | 652 | | |
| Foreign currency translation | | | 385 | | |
| Balance as of December 31, 2007 | | $ | 31,051 | | | $ | 31,051 | |
| MIV acquisition | | | 8,833 | | | | 8,833 | |
| Foreign currency translation | | | (608 | ) | | | (608 | ) |
| Balance as of December 31, 2008 | | $ | 39,276 | | | $ | 39,276 | |
| Foreign currency translation | | | 408 | | | | 408 | |
| MIV deferred tax adjustments | | | (630 | ) | | | (630 | ) |
| MIV allowance for doubtful accounts | | | 75 | | | | 75 | |
| MIV contingent consideration earned | | | 795 | | | | 795 | |
| Balance as of December 31, 2009 | | $ | 39,924 | | | $ | 39,924 | |
| MIV contingent consideration earned | | | | 1,565 | |
| OCS acquisition | | | | 13,502 | |
| Foreign currency translation | | | | 142 | |
| Balance as of December 31, 2010 | | | $ | 55,133 | |
The merger agreement under which the Company acquired MIV providedprovides for contingent earn-out payments over three years based on growth in revenue and earnings. As of December 31,The 2010 and 2009 a contingent earn-out payment of $795,000 was accrued, which was thenpayments, paid in February 2010.2011 and 2010, respectively were $1.6 million and $172,000, respectively, net of closing valuation adjustments and were recorded as additions to goodwill.
During 2007, an additional payment was made to Smaller World Communications for contingent consideration in accordance with the purchase agreement. The purchase agreement included two scheduled payments of additional purchase price in 2006 and 2008 of $536,000 and $714,000 respectively, as a result of meeting certain revenue goals.
On April 1, 2008, approximately 10 customer contracts were purchased from SQ Strategies for $249,000. The recording of this purchase increased customer related intangibles by $260,000 and deferred revenuesrevenue by $11,000.
Aggregate amortization expense for customer related intangibles, and trade names and non-competes for the year ended December 31, 2009,2010, was $1.2$1.3 million. Estimated amortization expense for the next five years is: 2010—2011—$1.21.6 million; 2011—2012—$1.11.3 million; 2012—2013—$836,000; 2013—954,000; 2014—$572,000; 2014—842,000; 2015—$543,000;789,000; thereafter $1.5$2.0 million.
(5) Income Taxes
For the years ended December 31, 2010, 2009, 2008, and 2007,2008, income before income taxes consists of the following:
| | | 2009 | | | 2008 | | | 2007 | |
| | | | | | | | | | |
| U.S. Operations | | $ | 11,497 | | | $ | 10,406 | | | $ | 9,664 | |
| Foreign Operations | | | 1,620 | | | | 1,577 | | | | 1,453 | |
| | | $ | 13,117 | | | $ | 11,983 | | | $ | 11,117 | |
| | | 2010 | | | 2009 | | | 2008 | |
| U.S. Operations | | $ | 11,353 | | | $ | 11,497 | | | $ | 10,406 | |
| Foreign Operations | | | 1,962 | | | | 1,620 | | | | 1,577 | |
| | | $ | 13,315 | | | $ | 13,117 | | | $ | 11,983 | |
Income tax expense consisted of the following components:
| | | Current | | | Deferred | | | Total | | | Current | | | Deferred | | | Total | |
2010: | | | | | | | | | | |
| Federal | | | $ | 3,450 | | | $ | 458 | | | $ | 3,908 | |
| Foreign | | | | 477 | | | | 28 | | | | 505 | |
| State | | | | 275 | | | | 128 | | | | 403 | |
| Total | | | $ | 4,202 | | | $ | 614 | | | $ | 4,816 | |
2009: | | | | | | | | | | | | | | | | | | | | | |
| Federal | | $ | 2,433 | | | $ | 1,109 | | | $ | 3,542 | | | $ | 2,433 | | | $ | 1,109 | | | $ | 3,542 | |
| Foreign | | | 532 | | | | 3 | | | | 535 | | | | 532 | | | | 3 | | | | 535 | |
| State | | | (21 | ) | | | 570 | | | | 549 | | | | (21 | ) | | | 570 | | | | 549 | |
| Total | | $ | 2,944 | | | $ | 1,682 | | | $ | 4,626 | | | $ | 2,944 | | | $ | 1,682 | | | $ | 4,626 | |
2008: | | | | | | | | | | | | | | | | | | | | | | | | |
| Federal | | $ | 2,963 | | | $ | 350 | | | $ | 3,313 | | | $ | 2,963 | | | $ | 350 | | | $ | 3,313 | |
| Foreign | | | 549 | | | | (5 | ) | | | 544 | | | | 549 | | | | (5 | ) | | | 544 | |
| State | | | 596 | | | | 85 | | | | 681 | | | | 596 | | | | 85 | | | | 681 | |
| Total | | $ | 4,108 | | | $ | 430 | | | $ | 4,538 | | | $ | 4,108 | | | $ | 430 | | | $ | 4,538 | |
2007: | | | | | | | | | | | | | |
| Federal | | $ | 2,971 | | | $ | 65 | | | $ | 3,036 | | |
| Foreign | | | 588 | | | | (21 | ) | | | 567 | | |
| State | | | 603 | | | | 72 | | | | 675 | | |
| Total | | $ | 4,162 | | | $ | 116 | | | $ | 4,278 | | |
The difference between the Company’s income tax expense as reported in the accompanying consolidated financial statements and the income tax expense that would be calculated applying the U.S. federal income tax rate of 34% on pretax income was as follows:
| | | 2009 | | | 2008 | | | 2007 | | | 2010 | | | 2009 | | | 2008 | |
| | | | | | | | | | | | | | | | | | | |
| Expected federal income taxes | | $ | 4,460 | | | $ | 4,074 | | | $ | 3,780 | | | $ | 4,527 | | | $ | 4,460 | | | $ | 4,074 | |
| Foreign tax rate differential | | | (16 | ) | | | (8 | ) | | | 31 | | | | (59 | ) | | | (16 | ) | | | (8 | ) |
| State income taxes, net of federal benefit and state tax credits | | | 362 | | | | 449 | | | | 446 | | | | 257 | | | | 362 | | | | 449 | |
| Federal tax credits | | | (183 | ) | | | (51 | ) | | | (51 | ) | | | (110 | ) | | | (183 | ) | | | (51 | ) |
| Uncertain tax positions | | | 27 | | | | — | | | | — | | | | 72 | | | | 27 | | | | -- | |
| Deferred tax adjustment due to projected rates | | | | 138 | | | | -- | | | | -- | |
| Valuation allowance | | | 18 | | | | — | | | | — | | | | 2 | | | | 18 | | | | -- | |
| Other | | | (42 | ) | | | 74 | | | | 73 | | | | (11 | ) | | | (42 | ) | | | 74 | |
| Total | | $ | 4,626 | | | $ | 4,538 | | | $ | 4,278 | | | $ | 4,816 | | | $ | 4,626 | | | $ | 4,538 | |
Deferred tax assets and liabilities at December 31, 20092010 and 2008,2009, were comprised of the following:
| | | 2009 | | | 2008 | | | 2010 | | | 2009 | |
| Deferred tax assets: | | | | | | | | | | | | |
| Allowance for doubtful accounts | | $ | 105 | | | $ | 93 | | | $ | 129 | | | $ | 105 | |
| Accrued expenses | | | 248 | | | | 231 | | | | 298 | | | | 248 | |
| Share based compensation | | | 1,034 | | | | 892 | | | | 1,261 | | | | 1,034 | |
| Capital loss carryforward | | | | 1,287 | | | | 47 | |
| Net operating loss | | | | 1,376 | | | | | |
| Other | | | — | | | | 83 | | | | 215 | | | | -- | |
| Gross deferred tax assets | | | 1,387 | | | | 1,299 | | | | 4,566 | | | | 1,434 | |
| Less Valuation Allowance | | | (47 | ) | | | — | | | | (1,287 | ) | | | (47 | ) |
| Deferred tax assets | | | 1,340 | | | | 1,299 | | | | 3,279 | | | | 1,387 | |
| | | | | | | | | | | | | | | | | |
| Deferred tax liabilities: | | | | | | | | | | | | | | | | |
| Prepaid expenses | | | 188 | | | | 243 | | | | 281 | | | | 188 | |
| Property and equipment | | | 1,602 | | | | 1,263 | | | | 2,169 | | | | 1,602 | |
| Intangible assets | | | 4,282 | | | | 3,762 | | | | 6,111 | | | | 4,282 | |
| Other | | | 296 | | | | — | | | | -- | | | | 343 | |
| Deferred tax liabilities | | | 6,368 | | | | 5,268 | | | | 8,561 | | | | 6,415 | |
| Net deferred tax liabilities | | $ | (5,028 | ) | | $ | (3,969 | ) | | $ | (5,282 | ) | | $ | (5,028 | ) |
In assessing the realizablility of deferred tax assets, the Company considers whether it is more likely than not that some portion, or all, of the deferred tax assets will not be realized. The ultimate realization of deferred tax assets is dependent upon the generation of future taxable income during the periods in which those temporary differences become deductible. The Company considers projected future taxable income, carrybackcarry-back opportunities and tax planning strategies in making this assessment. Based upon the level of historical taxable income and projections for future taxable income over the periods which the deferred tax assets are deductible, the Company believes it is more likely than not that it will realize the benefits of these deductible differences, net of the valuation allowance recorded. The net impact on income tax expense related to changes in the valuation allowance for 2010, 2009 and 2008, were $2,000, $18,000 and $0, respectively. The current year change relates to increases to the valuation allowance for capital loss carryforwards.
The Company has capital loss carryforwards of $123,000$3.2 million which will begin to expire in 2010.2011. A total of $76,000$3.2 million of the capital loss carryforwards relate to the pre-acquisition periods of acquired companies. The Company has provided a $47,000$1.3 million valuation allowance against the tax benefit associated with the capital loss carryforwards.
The undistributed foreign earnings of the Company’s foreign subsidiary of approximately $4.1$5.6 million are considered to be indefinitely reinvested. Accordingly, no provision for U.S. federal and state income taxes or foreign withholding taxes havehas been provided for such undistributed earnings. It is impractical to determine the additional income tax liability, if any, associated with the repatriation of undistributed earnings.
Effective January 1, 2007, the Company adopted guidance regarding accounting for uncertainty in income taxes. This accounting standards adoption had no impact on the Company. The unrecognized tax benefit at December 31, 20092010, was $541,000,$269,000, excluding interest of $3,000$31,000 and no penalties. Of this amount $78,000 represents the netThe full unrecognized tax benefits, that, if recognized, would favorably impact the effective income tax rate.
The Company accrues interest and penalties related to uncertain tax position in the statements of income as income tax expense.
The Company believes it is reasonably possible that the total amount of unrecognized tax benefits will not decrease within the next 12 months.
The change in the unrecognized tax benefits for 2010 and 2009 is as follows. There was no change in unrecognized tax benefits during 2008.follows:
| | | (In thousands) | |
| | | | |
| Balance of unrecognized tax benefits at December 31, 2008 | | $ | --- | |
| Increases for tax positions established during prior years | | | 509 | |
| Increases for tax positions established for the current period | | | 32 | |
| Balance of unrecognized tax benefits at December 31, 2009 | | $ | 541 | |
| Increases for tax positions established during prior years | | | 162 | |
| Decreases for tax positions established for the current period | | | (434 | ) |
| Balance of unrecognized tax benefits at December 31, 2010 | | $ | 269 | |
| | | (In thousands) | |
| Balance of unrecognized tax benefits at December 31, 2008 | | $ | — | |
Increases for tax positions established during prior years | | | 509 | |
| Increases for tax positions established for the current period | | | 32 | |
| Balance of unrecognized tax benefits at December 31, 2009 | | $ | 541 | |
The Company files a U.S. federal income tax return, various state jurisdictions and a Canada federal and provincial income tax return. The 20062007 to 20092010 U.S. federal and state returns remain open to examination. The 20052006 to 20092010 Canada federal and provincial income tax returns remain open to examination.
Notes payable consisted of the following:
| | | 2009 | | | 2008 | |
| | | (In thousands) | |
| Note payable to US Bank, interest 5.2% fixed rate, 35 scheduled principal and interest payments of $97,000, final balloon payment of interest and principal due December 31, 2011, secured by land, building, accounts receivable and intangible assets. | | | 7,659 | | | | 9,000 | |
| Revolving credit note with US Bank, subject to borrowing base of 75% of eligible accounts receivable, matures July 31, 2010, maximum available $6.5 million | | | — | | | | 3,850 | |
| Capital leases | | | 60 | | | | 90 | |
| Other debt | | | — | | | | 15 | |
| Total notes payable | | | 7,719 | | | | 12,955 | |
| Less current portion | | | 816 | | | | 4,581 | |
| Note payable, net of current portion | | $ | 6,903 | | | $ | 8,374 | |
| | | 2010 | | | 2009 | |
| | | (In thousands) | |
Revolving credit note with US Bank, subject to borrowing base, matures June 30, 2011, maximum available $6.5 million | | | -- | | | | -- | |
Note payable to US Bank refinanced as of July 2010 for $6.9 million, interest 3.79% fixed rate, 35 monthly scheduled principal and interest payments of $80,104, final balloon payment of interest and principal due July 31, 2013. | | | 6,610 | | | | 7,659 | |
Note payable to US bank for $10 million, interest at a fixed rate of 3.79%, 35 monthly scheduled principal and interest payments of $121,190, final balloon payment of interest and principal due July 31, 2013. | | | 9,550 | | | | -- | |
| Total notes payable | | | 16,160 | | | | 7,659 | |
| Less current portion | | | 1,827 | | | | 783 | |
| Note payable, net of current portion | | $ | 14,333 | | | $ | 6,876 | |
On May 26, 2006, the Company entered into a credit facility pursuant to which it borrowed $9.0 million under a term note and $3.5 million under a revolving credit note in order to partially finance the acquisition of TGI. The term note was refinanced on February 25, 2008, for the remaining balance of the term note of $1.6 million. The refinanced term note required payments of principal and interest in 17 monthly installments of $93,000 beginning March 31, 2008, and ending August 31, 2009. Borrowings under the refinanced term note bore interest at an annual rate of 5.14%. The Company made additional payments and paid off the term note in October 2008.
The maximum aggregate amount available under the revolving credit note was originally $3.5 million, but an addendum to the revolving credit note dated March 26, 2008, changed the revolving credit note amount to $6.5 million. The revolving credit note was renewed in July 2009 to extend the term to July 31, 2010. The Company may borrow, repay and re-borrow amounts under the revolving credit note from time to time until its maturity on July 31, 2010. The maximum aggregate amount available under the revolving credit note is $6.5 million, subject to a borrowing base equal to 75% of the Company’s eligible accounts receivable. Borrowings under the revolving credit note bear interest at a variable rate equal to (1) prime (as defined in the credit facility) less 0.50%, or (2) one-, two-, three-, six- or twelve-month LIBOR. As of December 31, 2009, the revolving credit note did not have a balance. According to borrowing base requirements, the Company had the capacity to borrow $4.2 million as of December 31, 2009.
On December 19, 2008, the Company borrowed $9.0 million under a term note to partially finance the acquisition of MIV. In July 2010, the Company refinanced the existing term loan with a $6.9 million term loan. The new term noteloan is payable in 35 equalmonthly installments of $97,000,$80,104 with the balance of principal and interest payable in a balloon payment of $4.8 million for the remaining principal balance and interest due on DecemberJuly 31, 2011.2013. Borrowings under the term note bear interest at aan annual rate of 5.2% per year. In 2009,3.79%.
On July 31, 2010, the Company made principal payments,borrowed $10.0 million under a term note to partially finance the acquisition of OCS. The term loan is payable in addition to the35 monthly installments of $121,190 with a balloon payment of $6.7 million for the remaining principal balance and interest due on July 31, 2013. Borrowings under the term loan totaling $650,000.note bear interest at an annual rate of 3.79%.
The term note isnotes are secured by certain of the Company’s assets, including the Company’s land, building, accounts receivable and intangible assets. The term note containsnotes contain various restrictions and covenants applicable to the Company, including requirements that the Company maintain certain financial ratios at prescribed levels and restrictions on the ability of the Company to consolidate or merge, create liens, incur additional indebtedness or dispose of assets. As of December 31, 2009,2010, the Company was in compliance with these restrictions and covenants.
The Company entered into a revolving credit note in 2006. The maximum aggregate amount available under the MIV acquisition included $90,000revolving credit note was originally $3.5 million, but an addendum to the note in capital leases.March 2008, changed the amount to $6.5 million. The capital leases are for productionrevolving credit note was renewed in July 2010 to extend the term to June 30, 2011. The Company may borrow, repay and mailing equipment meeting capitalization requirements wherere-borrow amounts under the lease term exceeds more thanrevolving credit note from time to time until its maturity on June 30, 2011.
The maximum aggregate amount available under the revolving credit note of $6.5 million is subject to a borrowing base equal to 75% of the estimated useful life. The equipment is being depreciated overCompany’s eligible accounts receivable. Borrowings under the lease termrenewed revolving credit note bear interest at a variable annual rate, with three rate options at the discretion of 4.25 years ending in 2011.management as follows: 1) 2.5% plus the daily reset one-month LIBOR rate or 2) 2.2% plus the one-, two-, three-, six- or twelve-month LIBOR rate, or 3) the bank’s Money Market Loan Rate. As of December 31, 2010, the revolving credit note did not have a balance. According to borrowing base requirements, the Company had the capacity to borrow $6.5 million as of December 31, 2010.
The aggregate maturities of the note payable for each of the five years subsequent to December 31, 2009, are:2010, are (in thousands):
| | | Total Payments | | | 2011 | | | 2012 | | | 2013 | | | 2014 | | | 2015 | |
| | | | | | | | | | | | | | | | | | | |
| Notes payable | | $ | 16,160 | | | $ | 1,827 | | | $ | 1,897 | | | $ | 12,436 | | | $ | -- | | | $ | -- | |
(7) Share-Based Compensation
| | | Total Payments | | | 2010 | | | 2011 | | | 2012 | | | 2013 | | | 2014 | |
| (In thousands) | | | | | | | | | | | | | | | | | | |
| Notes payable | | $ | 7,659 | | | $ | 783 | | | $ | 6,876 | | | $ | — | | | $ | — | | | $ | — | |
(7) | Share-Based Compensation |
The Company measures and recognizes compensation expense for all share-based payments. The compensation expense is recognized based on the grant-date fair value of those awards. All of the Company’s existing stock option awards and non-vested stock awards have been determined to be equity–classifiedequity-classified awards.
In August 2001, the Board of Directors adopted, and on May 1, 2002, the Company’s shareholders approved, the National Research Corporation 2001 Equity Incentive Plan (“2001 Equity Incentive Plan”). The 2001 Equity Incentive Plan provides for the granting of stock options, stock appreciation rights, restricted stock, performance shares and other share-based awards and benefits up to an aggregate of 600,000 shares of the Company’s common stock. Options granted may be either nonqualified or incentive stock options. Options vest over one to five years following the date of grant and option terms are generally five to ten years following the date of grant. At December 31, 2009,2010, there were 78,4173,770 shares available for issuance pursuant to future grants under the 2001 Equity Incentive Plan. The Company has accounted for grants of 521,583596,230 options under the 2001 Equity Incentive Plan using the date of grant as the measurement date for financial accounting purposes.
The National Research Corporation 2004 Non-Employee Director Stock Plan (the “2004 Director Plan”) is a nonqualified plan that provides for the granting of options with respect to 250,000550,000 shares of the Company’s common stock. The 2004 Director Plan provides for grants of nonqualified options to each director of the Company who is not employed by the Company. On the date of each annual meeting of shareholders of the Company, options to purchase 12,000 shares of the Company’s common stock are granted to directors that are re-elected or retained as a director at such meeting. On May 7, 2009, the Board of Directors amended the plan to increase the number of shares of common stock authorized for issuance under the plan from 250,000 to 550,000 shares, subject to approval ofand the Company’s shareholders approved the increase at the 2010 annual meeting of shareholders. The grants of options to directors on the date of the 2009 annual meeting of shareholders was also made subject to approval of the Company’s shareholders at the 2010 annual meeting of shareholders. Given the ownership by the CEO and grantor retained annuity trusts that he established in February 2010, approval will be perfunctory.May 7, 2010. Options vest one year following the date of grant and option terms are generally ten years following the date of grant, or three years in the case of termination of the outside director’s service. At December 31, 2009, pending shareholder approval of the increased number of shares at the 2010, annual meeting of shareholders, there will be 277,000were 229,000 shares available for issuance pursuant to future grants under the 2004 Director Plan. The Company has accounted for grants of 321,000 options under the 2004 Director Plan using the date of grant as the measurement date for financial accounting purposes.
In February 2006, the Board of Directors adopted, and on May 4, 2006, the Company’s shareholders approved the National Research Corporation 2006 Equity Incentive Plan (the “2006 Equity Incentive Plan”). The 2006 Equity Incentive Plan provides for the granting of options, stock appreciation rights, restricted stock, performance shares and other share-based awards and benefits up to an aggregate of 600,000 shares of the Company’s common stock. Options granted may be either incentive stock options or nonqualified stock options. Vesting terms vary with each grant, and option terms are generally five to ten years. Options vest over one to five years following the date of grant and options terms are generally five to ten years following the date of grant. At December 31, 2009,2010, there were 427,057266,654 shares available for issuance pursuant to future grants under the 2006 Equity Incentive Plan. The Company has accounted for grants of 172,943333,346 options under the 2006 Equity Incentive Plan using the date of grant as the measurement date for financial accounting purposes.
The Company granted options to purchase 273,812, 102,739 118,475 and 131,382118,475 shares of the Company’s common stock during the years ended December 31, 2010, 2009 2008 and 2007,2008, respectively. Options to purchase shares of common stock were granted with exercise prices equal to the fair value of the common stock on the date of grant. The fair value of stock options granted was estimated using a Black-Scholes valuation model with the following assumptions:
| | | 2009 | | 2008 | | 2007 | 2010 | | 2009 | | | 2008 | |
| | | | | | | | | | | | | | |
| Expected dividend yield at date of grant | | 1.93-2.35% | | 1.87-2.11% | | 1.76-1.92% | 2.86 to 3.09% | | 1.93-2.35% | | | 1.87-2.11% | |
| Expected stock price volatility | | 24.2 to 30.2% | | 21.1-24.2% | | 22.7-29.9% | 28.40 to 31.20% | | 24.2 to 30.2% | | | 21.1-24.2% | |
| Risk-free interest rate | | 1.55% to2.15% | | 3.18% | | 4.54-4.59% | 1.55 to 2.56% | | | | | 3.18% | |
| Expected life of options (in years) | | 4.00 to 6.00 | | 4.00 to 6.00 | | 4.00 to 6.00 | 4 to 6 | | 4 to 6 | | | 4 to 6 | |
The risk-free interest rate assumptions were based on the U.S. Treasury yield curve in effect at the time of the grant. The expected volatility was based on historical monthly price changes of the Company’s stock based on the expected life of the options at the date of grant. The expected life of options is the average number of years the Company estimates that options will be outstanding. The Company considers groups of associates that have similar historical exercise behavior separately for valuation purposes.
The following table summarizes stock option activity under the Company’s 2001 and 2006 Equity Incentive Plans and the 2004 Director Plan for the year ended December 31, 2009:2010:
| | | Number of Options | | | Weighted Average Exercise Price | | | Weighted Average Remaining Contractual Terms (Years) | | | Aggregate Intrinsic Value (In thousands) | | | Number of Options | | | Weighted Average Exercise Price | | | Weighted Average Remaining Contractual Terms (Years) | | | Aggregate Intrinsic Value (In thousands) | |
| Outstanding at beginning of period | | | 492,431 | | | $ | 20.77 | | | | — | | | | — | | | 577,822 | | | $22.06 | | | -- | | | -- | |
| Granted | | | 102,739 | | | $ | 27.91 | | | | — | | | | — | | | 273,812 | | | $26.02 | | | -- | | | -- | |
| Exercised | | | (2,023 | ) | | $ | 8.69 | | | | — | | | | — | | | (17,573) | | | $15.59 | | | -- | | | -- | |
| Canceled/expired | | | (15,325 | ) | | $ | 21.73 | | | | — | | | | — | | |
| Outstanding at end of period | | | 577,822 | | | $ | 22.06 | | | | 6.74 | | | $ | 1,221 | | | 834,061 | | | $23.49 | | | 6.98 | | | $19,592 | |
| Exercisable at end of period | | | 265,959 | | | $ | 20.26 | | | | 5.78 | | | $ | 855 | | | 333,746 | | | $20.97 | | | 5.27 | | | $ 6,999 | |
The weighted average grant date fair value of stock options granted during the years ended December 31, 2010, 2009 and 2008, was $4.48, $5.72 and 2007, was $5.72, $5.67, and $6.39, respectively. The total intrinsic value of stock options exercised during the years ended December 31, 2010, 2009 and 2008, and 2007, was $192,000, $28,000 and $2.3 million, and $239,000, respectively. As of December 31, 2009,2010, the total unrecognized compensation cost related to non-vested stock option awards was approximately $810,000,$1.4 million, which was expected to be recognized over a weighted average period of 2.643.45 years.
Cash received from stock options exercised for the years ended December 31, 2010, 2009 and 2008, and 2007, was $274,000, $18,000, and $1.9 million, and $338,000, respectively. The actual tax benefit realized for the tax deduction from stock options exercised was $43,000, $11,000 $743,000 and $92,000,$743,000, for the years ended December 31, 2010, 2009 2008 and 2007,2008, respectively.
During 2010, 2009 2008 and 2007,2008, the Company granted -0-,9,238, -0- and 32,115-0- non-vested shares of common stock under the 2001 Equity Incentive Plan. As of December 31, 2009,2010, the Company had 21,95622,636 non-vested shares of common stock outstanding under the Plan. These shares vest over one to five years following the date of grant and holders thereof are entitled to receive dividends from the date of grant, whether or not vested. The fair value of the awards is calculated as the fair market value of the shares on the date of grant. The Company recognized $108,000, $178,000 $220,000 and $437,000$220,000 of non-cash compensation for the years ended December 31, 2010, 2009 2008 and 2007,2008, respectively, related to this non-vested stock.
The following table summarizes information regarding non-vested stock granted to associates under the 2001 Equity Incentive Plan for the year ended December 31, 2009:2010:
| | | Shares Outstanding | | | Weighted Average Grant Date Fair Value Per Share | | | Shares Outstanding | | Weighted Average Grant Date Fair Value Per Share | |
| Outstanding at beginning of period | | | 36,502 | | | $ | 21.62 | | | 21,956 | | | | $21.68 | |
| Granted | | | — | | | | — | | | 9,238 | | | | $21.65 | |
| Vested | | | (10,645 | ) | | $ | 23.49 | | | (8,558 | ) | | | $23.37 | |
| Forfeited | | | (3,901 | ) | | $ | 16.15 | | |
| Outstanding at end of period | | | 21,956 | | | $ | 21.68 | | | 22,636 | | | | $21.03 | |
As of December 31, 2009,2010, the total unrecognized compensation cost related to non-vested stock awards was approximately $105,000$198,000 and is expected to be recognized over a weighted average period of 1.733.47 years.
(8) Restructuring and Severance Costs The Company records restructuring liabilities that represent charges incurred in connection with consolidations, including operations from acquisitions. These charges consist primarily of severance costs. Severance charges are based on various factors including the employee’s length of service, contract provisions, and salary levels. Expense for one-time termination benefits are accrued over each individual’s service period. The Company records the expense based on its best estimate based upon detailed analysis. Although significant changes are not expected, actual costs may differ from these estimates.
As part of the Company’s ongoing plans to improve the efficiency and effectiveness of its operations, the Company announced plans to centralize MIV/OCS functions in Lincoln and Seattle and eliminate certain costs of the Wausau operation (the “2010 Restructuring Plan”). In connection with the 2010 Restructuring Plan, the Company expects to incur aggregate costs of $143,000 for one-time termination benefits related to 14 employees. The Company recorded $143,000 in the year ended December 31, 2010, which is included in selling, general and administrative expenses. The Company paid $106,000 in 2010 and the remaining $37,000 will be paid in the first quarter of 2011.
In connection with the acquisition of OCS, the Company reduced headcount from acquisition date levels. OCS had pre-existing arrangements for severance with its associates at the date of acquisition. Total severance related to 26 OCS associates approximated $347,000, including $333,000 of severance accruals included in the liabilities assumed at acquisition. The Company recorded additional severance costs of $14,000 in the fourth quarter of 2010. The Company paid $333,000 in 2010 and the remaining $14,000 will be paid in the first quarter of 2011.
The following table reconciles the beginning and ending restructuring costs included in accrued wages, bonus and profit-sharing:
| | | 2010 Restructuring Plan One-time Termination Benefits | | | OCS One-time Termination Benefits | | | Total | |
| | | (In thousands) | |
| Balance, Restructuring liability at December 31, 2009 | | $ | - | | | $ | - | | | $ | - | |
| Severance assumed in OCS acquisition | | | - | | | | 333 | | | | 333 | |
| Accrual for severance and employee related costs | | | 143 | | | | 14 | | | | 157 | |
| Payments | | | (106 | ) | | | (333 | ) | | | (439 | ) |
| Balance, Restructuring liability at December 31, 2010 | | $ | 37 | | | $ | 14 | | | $ 51_ | |
In February 2011, the Company vacated its office in Wausau, Wisconsin, and reached agreements to terminate the operating lease for its office in Wausau and other services. As a result, the Company made lump-sum payments totaling $271,000, which are included in selling, general and administrative expenses in the first quarter of 2011.
(9) Leases
The Company leases printing equipment and services in the United States, and office space in Canada, Wisconsin, California and California.Washington. The Company has recorded rent expense in connection with its operating leases of $691,000, $626,000 and $607,000 in 2010, 2009 and $475,000 in 2009, 2008, respectively. The Company also has capital leases for production, mailing and 2007, respectively. Minimum lease paymentscomputer equipment.
Payments under non-cancelable operating leases and capital leases are:
As of December 31, | | Capital Leases | | | Operating Leases | |
| | | (In thousands) | |
| 2011 | | $ | 150 | | | $ | 560 | |
| 2012 | | | 111 | | | | 562 | |
| 2013 | | | 97 | | | | 308 | |
| 2014 | | | 97 | | | | 143 | |
| 2015 | | | 81 | | | | 136 | |
| Total minimum lease payments | | | 536 | | | $ | 1,709 | |
| Less: amount representing interest | | | 96 | | | | | |
| Present value of minimum lease payments | | | 440 | | | | | |
| Less: current maturities included in accrued expenses | | | 113 | | | | | |
Capital lease obligations, net of current portion included in other long term liabilities | | $ | 327 | | | | | |
| Minimum lease payments | | Total Payments | | | 2010 | | | 2011 | | | 2012 | | | 2013 | | | 2014 | |
| (In thousands) | | | | | | | | | | | | | | | | | | |
| Operating leases | | $ | 1,600 | | | $ | 524 | | | $ | 459 | | | $ | 432 | | | $ | 175 | | | $ | 10 | |
| Capital leases | | | 65 | | | | 37 | | | | 28 | | | | — | | | | — | | | | — | |
| Total | | $ | 1,665 | | | $ | 561 | | | $ | 487 | | | $ | 432 | | | $ | 175 | | | $ | 10 | |
The capital leases are for production and mailing equipment. Total minimum lease payments remaining are $65,000, with $5,000 representing interest as of December 31, 2009. The present value of the future minimum lease payments are $60,000 less current maturities of $33,000. Long-term obligations under capital leases total $27,000 as of December 31, 2009.
A Board member of the Company also serves as a director of the Picker Institute. The Company advanced $300,000 in each of 2004 and 2003 to the Picker Institute to fund designated research projects. The advance was fully used by December 31, 2008. During 2008, $171,000 and $175,000 was expensed on research work during 2008 and 2007, respectively.work.
A Board member of the Company also serves as an officer of Ameritas Life Insurance Corp. In connection with the Company’s regular assessment of its insurance-based associate benefits and the costs associated therewith which is conducted by an independent insurance broker, in 2007 the Company began purchasing dental insurance for certain of its associates from Ameritas Life Insurance Corp. and, in 2009, the Company also began purchasing vision insurance for certain of its associates from Ameritas Life Insurance Corp. The total value of these purchases was $113,000,$146,000, $108,000 and $79,000 in 2010, 2009 and $65,000 in 2009, 2008 and 2007 respectively.
A former owner of OCS, and current associate of the Company, is also co-owner of EPIC Property Management LLC, the entity from which the Company leases office space for OCS. The lease term began on August 3, 2010 and ends January 31, 2011. The total of the rental and utility payments under the lease for the year ended December 31, 2010, was $84,000. (11) Associate Benefits
The Company sponsors a qualified 401(k) plan covering substantially all associates with no eligibility service requirement. Under the 401(k) plan, the Company matches 25% of the first 6% of compensation contributed by each associate. Employer contributions, which are discretionary, vest to participants at a rate of 20% per year. The Company contributed $151,000,$168,000, $151,000 and $127,000$151,000 in 2010, 2009 2008 and 2007,2008, respectively, as a matching percentage of associate 401(k) contributions.
(12) Segment Information
The Company has seven operating segments that are aggregated into one reporting segment because they have similar economic characteristics and meet the other aggregation criteria. Included in the table below is certain entity-wide information regarding the Company’s revenue by geographic areas for the years ended December 31, 2010, 2009, and 2008:
| | | 2010 | | | 2009 | | | 2008 | |
| | | (In thousands) | |
| United States | | $ | 58,598 | | | $ | 52,961 | | | $ | 46,841 | |
| Canada | | | 4,800 | | | | 4,731 | | | | 4,172 | |
| Total | | $ | 63,398 | | | $ | 57,692 | | | $ | 51,013 | |
As of December 31, 2010, long-lived assets, net total $14.5 million, which includes $14.3 million in the United States and $200,000 in Canada. As of December 31, 2009, long-lived assets, net total $14.0 million, which includes $13.8 million in the United States and $200,000 in Canada.
(13) Subsequent Event
As discussed in Notes 8 and 9, in February 2011, the Company negotiated a lease termination for its office space in Wausau, Wisconsin. A lump sum payment termination fee of $267,000 was paid in the first quarter of 2011. Minimum operating lease payment included in Note 9 that will not be required due to the lease termination are $130,000 in 2011, $145,000 in 2012, and $136,000 in 2013.
Item 9. | Changes in and Disagreements with Accountants on Accounting and Financial Disclosure |
Item 9. Changes in and Disagreements with Accountants on Accounting and Financial Disclosure
Not applicable.
Item 9A. | Controls and Procedures |
Item 9A. Controls and Procedures
In accordance with Rule 13a-15(b) of the Securities Exchange Act of 1934 (the “Exchange Act”), the Company’s management evaluated, with the participation of the Company’s Chief Executive Officer and the Company’s Chief Financial Officer, the effectiveness of the design and operation of the Company’s disclosure controls and procedures (as defined in Rule 13a-15(e) and 15d-15(e) under the Exchange Act) as of December 31, 2009.2010. Based upon their evaluation of these disclosure controls and procedures, the Chief Executive Officer and the Chief Financial Officer concluded that the disclosure controls and procedures were effective as of December 31, 2009.2010.
The Company’s management is responsible for establishing and maintaining adequate internal control over financial reporting (as defined in Rule 13a-15(f) of the Exchange Act). The Company’s internal control over financial reporting is designed to provide reasonable assurance regarding the reliability of financial reporting and the preparation of financial statements for external purposes in accordance with generally accepted accounting principles. Because of its inherent limitations, however, internal control over financial reporting may not prevent or detect misstatements. Also, projections of any evaluation of effectiveness to future periods are subject to the risk that controls may become inadequate because of changes in conditions, or that the degree of compliance with the policies of procedures may deteriorate.
The Company’s management, with the participation of the Company’s Chief Executive Officer and Chief Financial Officer, has evaluated the effectiveness of the Company’s internal control over financial reporting using the framework in Internal Control – Integrated Framework issued by the Committee of Sponsoring Organizations of the Treadway Commission. Based on such evaluation, the Company’s management concluded that the Company’s internal control over financial reporting was effective as of December 31, 2009.2010.
There was no change in the Company’s internal control over financial reporting that occurred during the quarter ended December 31, 2009,2010, that has materially affected, or is reasonably likely to materially affect, the Company’s internal control over financial reporting.
This annual report does not include an attestation report of the Company’s registered public accounting firm regarding internal control over financial reporting. Management’s report was not subject to attestation by the Company’s registered public accounting firm pursuant to temporary rules of the Securities and Exchange Commission that permit the Company to provide only management’s report in this annual report.
Item 9B. | Other Information |
Item 9B. Other Information
The Company has no other information to report pursuant to this item.
PART III
Item 10. | Directors, Executive Officers and Corporate Governance |
Item 10. Directors, Executive Officers and Corporate Governance
The information required by this Item with respect to directors and Section 16 compliance is included under the captions “Election of Directors” and “Section 16(a) Beneficial Ownership Reporting Compliance,” respectively, in the Company’s definitive Proxy Statement for its 20102011 Annual Meeting of Shareholders (“Proxy Statement”) and is hereby incorporated herein by reference. Information with respect to the executive officers of the Company appears in Item 1 of this Annual Report on Form 10-K. The information required by this Item with respect to audit committees and audit committee financial experts is included under the caption “Corporate Governance” in the Proxy Statement and is incorporated herein by reference.
The Company has adopted a Code of Business Conduct and Ethics that applies to all of the Company’s associates, including the Company’s Chief Executive Officer, Chief Financial Officer, Controller and other persons performing similar functions. The Company has posted a copy of the Code of Business Conduct and Ethics on its website at www.nationalresearch.com. The Company intends to satisfy the disclosure requirements under Item 5.05 of Form 8-K regarding amendments to, or waivers from, the Code of Business Conduct and Ethics by posting such information on its website at www.nationalresearch.com. The Company is not including the information contained on its website as part of, or incorporating it by reference into, this report.
Item 11. | Executive Compensation |
Item 11. Executive Compensation
The information required by this Item is included under the captions “Compensation Discussion and Analysis,” “2009“2010 Summary Compensation Table,” “Grants of Plan-Based Awards in 2009,2010,” “Outstanding Equity Awards at December 31, 2009,2010,” “2009“2010 Director Compensation” andCompensation,” “Compensation Committee Report” and “Corporate Governance-Transactions with Related Persons” in the Proxy Statement and is hereby incorporated herein by reference.
Item 12. | Security Ownership of Certain Beneficial Owners and Management and Related Shareholder Matters |
Item 12. Security Ownership of Certain Beneficial Owners and Management and Related Shareholder Matters
The information required by this Item with respect to security ownership of certain beneficial owners and management is included under the caption “Principal Shareholders” in the Proxy Statement and is hereby incorporated by reference.
The following table sets forth information with respect to compensation plans under which equity securities of the Company are authorized for issuance as of December 31, 2009.2010.
| Plan Category | | Number of securities to be issued upon the exercise of outstanding options, warrants and rights | | | Weighted-average exercise price of outstanding options, warrants and rights | | | Number of securities remaining available for future issuance under equity compensation plans (excluding securities reflected in the first column) | | | Number of securities to be issued upon the exercise of outstanding options, warrants and rights | | Weighted-average exercise price of outstanding options, warrants and rights | | Number of securities remaining available for future issuance under equity compensation plans (excluding securities reflected in the first column) |
| | | | | | | | | | | | | | |
Equity compensation plans approved by security holders (1) | | | 554,822 | | | $ | 21.80 | | | | 505,474 | (2) | | 834,061 | | | $23.49 | | | 499,424 | (2) |
| | | | | | | | | | | | | | |
| Equity compensation plans not approved by security holders | | | 23,000 | | | | 27.23 | | | | 277,000 | (3) | | -- | | | -- | | | -- | |
| | | | | | | | | | | | | | |
| Total | | | 577,822 | | | $ | 22.06 | | | | 782,474 | | | 834,061 | | | $23.49 | | | 499,424 | |
| (1) | Includes the Company’s 2006 Equity Incentive Plan, 2004 Director Plan, and the 2001 Equity Incentive Plan. |
| (2) | As of December 31, 2009,2010, the Company had authority to award up to 161,854 additional shares of restricted Common Stock to participants under the 2001 Equity Incentive Plan, provided that the total of such shares awarded may not exceed the total number of shares remaining available for issuance under the 2001 Equity Incentive Plan, which totaled 78,4173,770 as of December 31, 2009.2010. Under the 2006 Equity Incentive Plan, the Company had authority to award up to 167,885158,647 additional shares of restricted Common Stock to participants under the 2006 Equity Incentive Plan, provided that the total of such shares awarded may not exceed the total number of shares remaining available for issuance under the 2006 Equity Incentive Plan, which totaled 427,057266,654 as of December 31, 2009.2010. |
(3) | As of December 31, 2009, the Company had authority to award up to 277,000 additional shares of Common Stock to participants under the 2004 Directors Plan, subject to approval by the Company’s shareholders at the 2010 annual meeting of shareholders of the amendment to the plan adopted, on May 7, 2009 by the Board of Directors to increase the number of shares of common stock authorized for issuance under the plan from 250,000 to 550,000 shares. The Board of Directors conditioned the amendment, on the approval of the Company’s shareholders at the 2010 annual meeting of shareholders. The grants of options to directors on the date of the 2009 annual meeting of shareholders were also made subject to approval of the Company’s shareholders at the 2010 annual meeting of shareholders. |
Item 13. | Certain Relationships and Related Transactions, and Director Independence |
Item 13. Certain Relationships and Related Transactions, and Director Independence
The information required by this Item is included under the caption “Corporate Governance—”Governance” in the Proxy Statement and is hereby incorporated by reference.
Item 14. | Principal Accountant Fees and Services |
Item 14. Principal Accountant Fees and Services
The information required by this Item is included under the caption “Miscellaneous—Independent Registered Public Accounting Firm” in the Proxy Statement and is hereby incorporated by reference.
PART IV
Item 15. Exhibits, Financial Statement Schedules
Item 15. | Exhibits, Financial Statement Schedules |
| | |
(a) | 1. | Consolidated financial statements -statements. The consolidated financial statements listed in the accompanying index to the consolidated financial statements and financial statement schedule are filed as part of this Annual Report on Form 10-K. |
| | |
| 2. | Financial statement schedule -schedule. The financial statement schedule listed in the accompanying index to the consolidated financial statements and financial statement schedule is filed as part of this Annual Report on Form 10-K. |
| | |
| 3. | Exhibits -Exhibits. The exhibits listed in the accompanying exhibit index are filed as part of this Annual Report on Form 10-K. |
NATIONAL RESEARCH CORPORATION AND SUBSIDIARY
SCHEDULE II — VALUATION AND QUALIFYING ACCOUNTS
| | | Balance at Beginning of Year | | | MIV Acquisition | | | Bad Debt Expense | | | Write-offs Net of Recoveries | | | Balance at End of Year | | | Balance at Beginning of Year | | | Acquisition | | | Bad Debt Expense | | | Write-offs Net of Recoveries | | | Balance at End of Year | |
| (In thousands) | | | | | | | | | | | | | | | | |
| | | | | | | | | | | | | | | | | |
| Allowance for doubtful accounts: | | | | | | | | | | | | | | | | | | | | | | | | | | | | | | |
| Year Ended December 31, 2007 | | $ | 44 | | | $ | — | | | $ | 29 | | | $ | 3 | | | $ | 70 | | |
| Year Ended December 31, 2008 | | $ | 70 | | | $ | 69 | | | $ | 168 | | | $ | 66 | | | $ | 241 | | | $ | 70 | | | $ | 69 | | | $ | 168 | | | $ | 66 | | | $ | 241 | |
| Year Ended December 31, 2009 | | $ | 241 | | | $ | 75 | | | $ | 138 | | | $ | 175 | | | $ | 279 | | | | 241 | | | | 75 | | | | 138 | | | | 175 | | | | 279 | |
| Year Ended December 31, 2010 | | | | 279 | | | | 42 | | | | 39 | | | | 23 | | | | 337 | |
See accompanying report of independent registered public accounting firm.
INDEX TO CONSOLIDATED FINANCIAL STATEMENTS
AND FINANCIAL STATEMENT SCHEDULE
| | | Page in this |
| | Form 10-K |
| | |
| Report of Independent Registered Public Accounting Firm | | 24 |
| | 23 |
Consolidated Balance Sheets as of December 31, 20092010 and 20082009 | | 25 |
| | 24 |
Consolidated Statements of Income for the Three Years Ended December 31, 20092010 | | 26 |
| | 25 |
Consolidated Statements of Shareholders’ Equity and Comprehensive Income as of and for the Three Years Ended December 31, 20092010 | | 27 |
| | 26 |
Consolidated Statements of Cash Flows for the Three Years Ended December 31, 20092010 | | 28 |
| | 27 |
| Notes to Consolidated Financial Statements | | 29 |
| | 28 |
| Schedule II — Valuation and Qualifying Accounts | | 4952 |
All other financial statement schedules are omitted since the required information is not present or is not present in amounts sufficient to require submission of the schedules, or because the information required is included in the consolidated financial statements and notes thereto.
SIGNATURES
Pursuant to the requirements of Section 13 or 15(d) of the Securities Exchange Act of 1934, the Registrant has duly caused this report to be signed on its behalf by the undersigned, thereunto duly authorized, on this 31st25th day of March 2010.2011.
| NATIONAL RESEARCH CORPORATION | |
| | | | |
By | By: | /s/ Michael D. Hays | |
| | | Michael D. Hays |
| President and Chief Executive Officer | |
Pursuant to the requirements of the Securities Exchange Act of 1934, this report has been signed below by the following persons on behalf of the Registrant and in the capacities and on the dates indicated.
| Signature | | Title | | Date |
| | | | |
| /s/ Michael D. Hays | | President, Chief Executive Officer and Director | | March 31, 201025, 2011 |
| Michael D. Hays | | (PrincipalDirector (Principal Executive Officer) | | |
| | | | | |
| /s/ Patrick E. Beans | | Vice President, Treasurer, Secretary, Chief Financial Officer | | March 31, 201025, 2011 |
| Patrick E. Beans | | Financial Officer and Director (Principal Financial and Accounting Officer) | | |
| | | | | |
| /s/ JoAnn M. Martin | | Director | | March 31, 201025, 2011 |
| JoAnn M. Martin | | | | |
| | | | | |
| /s/ John N. Nunnelly | | Director | | March 31, 201025, 2011 |
| John N. Nunnelly | | | | |
| | | | | |
| /s/ Paul C. Schorr III | | Director | | March 31, 201025, 2011 |
| Paul C. Schorr III | | | | |
| | | | | |
| /s/ Gail L. Warden | | Director | | March 31, 201025, 2011 |
| Gail L. Warden | | | | |
EXHIBIT INDEX
Exhibit Number | | Exhibit Description |
| | |
(3.1) | | Articles of Incorporation of National Research Corporation, as amended to date [Incorporated by reference to Exhibit (3.1) to National Research Corporation’s Registration Statement on Form S-1 (Registration No. 333-33273)] |
| | |
(3.2) | | By-Laws of National Research Corporation, as amended to date [Incorporated by reference to Exhibit (3.2) to National Research Corporation’s Current Report on Form 8-K dated May 8, 2009 (File No. 0-29466)] |
| | |
(4.1) | | Installment or Single Payment Note, dated as of December 19, 2008, from National Research Corporation to U.S. Bank National Association [Incorporated by reference to Exhibit (4.1) to National Research Corporation’s Current Report on Form 8-K dated December 19, 2008 (File No. 0-294660)] |
| | |
(10.1)* | | National Research Corporation 2001 Equity Incentive Plan [Incorporated by reference to National Research Corporation’s Proxy Statement for the 2002 Annual Meeting of Shareholders, filed with the Securities and Exchange Commission on April 3, 2002 (File No. 0-29466)] |
| | |
(10.2)* | | National Research Corporation 2006 Equity Incentive Plan [Incorporated by reference to National Research Corporation’s Proxy Statement for the 2006 Annual Meeting of Shareholders, filed with the Securities and Exchange Commission on April 3, 2006 (File No. 0-29466)] |
| | |
(10.3)* | | National Research Corporation Director Stock Plan, as amended to date [Incorporated by reference to Exhibit (10.2) to National Research Corporation’s Annual Report on Form 10-K for the year ended December 31, 1997 (File No. 0-29466)] |
| | |
(10.4)* | | National Research Corporation 2004 Director Stock Plan [Incorporated by reference to National Research Corporation’s Proxy Statement for the 2005 Annual Meeting of Shareholders, filed with the Securities and Exchange Commission on April 4, 2005 (File No. 0-29466)] |
| | |
(10.5)+ | | Contract, dated January 23, 2002, between National Research Corporation and the Department of Veterans Affairs [Incorporated by reference to Exhibit (10.4) to National Research Corporation’s Annual Report on Form 10-K for the year ended December 31, 2001 (File No. 0-29466)] |
| | |
(10.6)* | | Form of Nonqualified Stock Option Agreement (for new associates) used in connection with the 2001 Equity Incentive Plan [Incorporated by reference to Exhibit 4.4 to National Research Corporation’s Registration Statement on Form S-8 (Registration No. 333-120530)] |
| | |
(10.7)* | | Form of Nonqualified Stock Option Agreement (for officers) used in connection with the 2001 Equity Incentive Plan [Incorporated by reference to Exhibit 4.5 to National Research Corporation’s Registration Statement on Form S-8 (Registration No. 333-120530)] |
| | |
(10.8)* | | Form of Restricted Stock Agreement for executive officers used in connection with the 2001 Equity Incentive Plan [Incorporated by reference to Exhibit 10.2 to National Research Corporation’s Current Report on Form 8-K dated March 19, 2005 (File No. 0-29466)] |
| | |
(10.9)* | | Form of Restricted Stock Agreement (one year vesting) used in connection with the 2001 Equity Incentive Plan [Incorporated by reference to Exhibit 4.6 to National Research Corporation’s Registration Statement on Form S-8 (Registration No. 333-120530)] |
Exhibit
Number
| | Exhibit Description |
| | |
(10.10)* | | Form of Restricted Stock Agreement (five year vesting) used in connection with the 2001 Equity Incentive Plan [Incorporated by reference to Exhibit 4.7 to National Research Corporation’s Registration Statement on Form S-8 (Registration No. 333-120530)] |
| | |
(10.11)* | | Restricted Stock Incentive Plan for Joseph W. Carmichael, as amended and restated, under the 2001 Equity Incentive Plan [Incorporated by reference to Exhibit 10.2 to National Research Corporation’s Current Report on Form 8-K dated March 3, 2006 (File No. 0-29466)] |
| | |
(10.12)* | | Director’s Compensation Summary [Incorporated by reference to Exhibit (10.1) to National Research Corporation’s Annual Report on Form 10-Q for the quarter ended March 31, 2007 (File No. 0-29466)] |
| | |
(10.13)* | | Form of Nonqualified Stock Option Agreement used in connection with the 2006 Equity Incentive Plan [Incorporated by reference to Exhibit (10.14) to National Research Corporation’s Annual Report on Form 10-K for the year ended December 31, 2006 (File No. 0-29466)] |
| | |
(10.14)* | | Form of Restricted Stock Agreement used in connection with the 2006 Equity Incentive Plan [Incorporated by reference to Exhibit (10.15) to National Research Corporation’s Annual Report on Form 10-K for the year ended December 31, 2006 (File No. 0-29466)] |
| | |
(10.15)(2.1)# | | Merger Agreement, dated as of November 26, 2008, by and among National Research Corporation, NRC Acquisition, Inc., My Innerview, Inc., Neil L. Gulsvig and Janice L. Gulsvig [Incorporated by reference to Exhibit (2.1) to National Research Corporation’s Current Report on Form 8-K dated November 26, 2008 (File No. 0-29466)] |
| (2.2)# | | Stock Purchase Agreement, dated as of August 3, 2010, by and among National Research Corporation, Outcome Concept Systems, Inc. and the holders of Outcome Concept Systems’ shares of common stock and warrants to purchase such shares [Incorporated by reference to Exhibit (2.1) to National Research Corporation’s Current Report on Form 8-K dated August 3, 2010 (File No. 0-29466)] |
(23.1)(3.1) | | Articles of Incorporation of National Research Corporation, as amended to date [Incorporated by reference to Exhibit (3.1) to National Research Corporation’s Registration Statement on Form S-1 (Registration No. 333-33273)] |
| (3.2) | | By-Laws of National Research Corporation, as amended to date [Incorporated by reference to Exhibit (3.2) to National Research Corporation’s Current Report on Form 8-K dated May 8, 2009 (File No. 0-29466)] |
| (4.1) | | Installment or Single Payment Note, dated as of December 19, 2008, from National Research Corporation to U.S. Bank National Association [Incorporated by reference to Exhibit (4.1) to National Research Corporation’s Current Report on Form 8-K dated December 19, 2008 (File No. 0-294660)] |
| (4.2) | | Installment or Single Payment Note, dated as of July 30, 2010, from National Research Corporation to U.S. Bank N.A. to refinance the prior December 19, 2008 note of National Research Corporation [Incorporated by reference to Exhibit (4.2) to National Research Corporation’s Current Report on Form 8-K dated August 3, 2010 (File No. 0-29466)] |
| (4.3) | | Installment or Single Payment Note, dated as of July 30, 2010, from National Research Corporation to U.S. Bank N.A. to fund a portion of the acquisition of Outcome Concept Systems, Inc. [Incorporated by reference to Exhibit (4.1) to National Research Corporation’s Current Report on Form 8-K dated August 3, 2010 (File No. 0-29466)] |
| (10.1)* | | National Research Corporation 2001 Equity Incentive Plan [Incorporated by reference to National Research Corporation’s Proxy Statement for the 2002 Annual Meeting of Shareholders, filed with the Securities and Exchange Commission on April 3, 2002 (File No. 0-29466)] |
(10.2)* | | National Research Corporation 2006 Equity Incentive Plan [Incorporated by reference to National Research Corporation’s Proxy Statement for the 2006 Annual Meeting of Shareholders, filed with the Securities and Exchange Commission on April 3, 2006 (File No. 0-29466)] |
| (10.3)* | | National Research Corporation Director Stock Plan, as amended to date [Incorporated by reference to Exhibit (10.2) to National Research Corporation’s Annual Report on Form 10-K for the year ended December 31, 1997 (File No. 0-29466)] |
Exhibit Number | | Exhibit Description |
| (10.4)* | | National Research Corporation 2004 Non-Employee Director Stock Plan [Incorporated by reference to Exhibit (10) to National Research Corporation’s Quarterly Report on Form 10-Q for the quarter ended June 30, 2010 (File No. 0-29466)] |
| (10.5)+ | | Contract, dated January 23, 2002, between National Research Corporation and the Department of Veterans Affairs [Incorporated by reference to Exhibit (10.4) to National Research Corporation’s Annual Report on Form 10-K for the year ended December 31, 2001 (File No. 0-29466)] |
| (10.6)* | | Form of Nonqualified Stock Option Agreement (for new associates) used in connection with the 2001 Equity Incentive Plan [Incorporated by reference to Exhibit 4.4 to National Research Corporation’s Registration Statement on Form S-8 (Registration No. 333-120530)] |
| (10.7)* | | Form of Nonqualified Stock Option Agreement (for officers) used in connection with the 2001 Equity Incentive Plan [Incorporated by reference to Exhibit 4.5 to National Research Corporation’s Registration Statement on Form S-8 (Registration No. 333-120530)] |
| (10.8)* | | Form of Restricted Stock Agreement for executive officers used in connection with the 2001 Equity Incentive Plan [Incorporated by reference to Exhibit 10.2 to National Research Corporation’s Current Report on Form 8-K dated March 19, 2005 (File No. 0-29466)] |
| (10.9)* | | Form of Restricted Stock Agreement (one year vesting) used in connection with the 2001 Equity Incentive Plan [Incorporated by reference to Exhibit 4.6 to National Research Corporation’s Registration Statement on Form S-8 (Registration No. 333-120530)] |
| (10.10)* | | Form of Restricted Stock Agreement (five year vesting) used in connection with the 2001 Equity Incentive Plan [Incorporated by reference to Exhibit 4.7 to National Research Corporation’s Registration Statement on Form S-8 (Registration No. 333-120530)] |
| (10.11)* | | Form of Nonqualified Stock Option Agreement used in connection with the 2006 Equity Incentive Plan [Incorporated by reference to Exhibit (10.14) to National Research Corporation’s Annual Report on Form 10-K for the year ended December 31, 2006 (File No. 0-29466)] |
| (10.12)* | | Form of Restricted Stock Agreement used in connection with the 2006 Equity Incentive Plan [Incorporated by reference to Exhibit (10.15) to National Research Corporation’s Annual Report on Form 10-K for the year ended December 31, 2006 (File No. 0-29466)] |
| (21) | | Subsidiary of National Research Corporation |
| (23) | | Consent of Independent Registered Public Accounting Firm |
| | |
| (31.1) | | Certification of the Chief Executive Officer pursuant to Section 302 of the Sarbanes-Oxley Act of 2002 |
| | |
| (31.2) | | Certification of the Chief Financial Officer pursuant to Section 302 of the Sarbanes-Oxley Act of 2002 |
| | |
(32.1)(32) | | Certification of Periodic Financial Report by the Chief Executive Officer and Chief Financial Officer pursuant to Section 906 of the Sarbanes-Oxley Act of 2002 |
Exhibit Number | | Exhibit Description |
(99.1)(99) | | Proxy Statement for the 20102011 Annual Meeting of Shareholders to be filed within 120 days of December 31, 2009 [To be filed with the Securities and Exchange Commission under Regulation 14A within 120 days after December 31, 2009;2010; except to the extent specifically incorporated by reference, the Proxy Statement for the 20102011 Annual Meeting of Shareholders shall not be deemed to be filed with the Securities and Exchange Commission as part of this Annual Report on Form 10-K] |
____________________
| * | A management contract or compensatory plan or arrangement. |
| # | The schedules to this agreement are not being filed herewith. The registrant agrees to furnish supplementally a copy of any such schedule to the Securities and Exchange Commission upon request. |
| + | Portions of this exhibit have been redacted and are subject to a confidential treatment request filed with the Secretary of the Securities and Exchange Commission pursuant to Rule 24b-2 under the Securities Exchange Act of 1934, as amended. The redacted material was filed separately with the Securities and Exchange Commission. |