the amount of and our ability to estimate our asbestos-related liabilities;
the solvency of our insurers and the likelihood of their payment for asbestos-related costs;
material disruptions at any of our manufacturing facilities;
noncompliance with various laws and regulations associated with our international operations, including anti-bribery laws, export control regulations and United States (“U.S.”) sanctions and embargoes on certain foreign countries;
risks associated with our international operations;
risks associated with the representation of our employees by trade unions and work councils;
our exposure to product liability claims;
potential costs and liabilities associated with environmental laws and regulations;
failure to maintain and protect our intellectual property rights;
the loss of key members of our leadership team;
restrictions in our credit agreement with Deutsche Bank Securities Inc., HSBC Securities (USA) Inc. and certain other lender parties named therein (the “Deutsche Bank Credit Agreement”) that may limit our flexibility in operating our business;
2
impairment in the value of intangible assets;
the funding requirements or obligations of our defined benefit pension plans and other post-retirement benefit plans;
significant movements in foreign currency exchange rates;
availability and cost of raw materials, parts and components used in our products;
new regulations and customer preferences reflecting an increased focus on environmental, social and governance issues, including new regulations related to the use of conflict minerals;
service interruptions, data corruption, cyber-based attacks or network security breaches affecting our information technology infrastructure;
risks arising from changes in technology;
the competitive environment in our industry;
changes in our tax rates or exposure to additional income tax liabilities;
our ability to manage and grow our business and execution of our business and growth strategies;
the level of capital investment and expenditures by our customers in our strategic markets;
our financial performance;
andAny such forward-looking statements are not guarantees of future performance and actual results, developments and business decisions may differ materially from those envisaged by such forward-looking statements. These forward-looking statements speak only as of the date this Annual ReportForm 10-K is filed with the SEC. We do not assume any obligation and do not intend to update any forward-looking statement except as required by law. See Item IA. Risk Factors1A. “Risk Factors” in Part I of this Form 10-K for a further discussion regarding some of the reasonsfactors that may cause actual results may beto differ materially different from those that we anticipate.
PART I
Item 1. Business
General
Colfax Corporation is a diversified global supplier of a broad range of fluid handlingindustrial manufacturing and engineering company that provides gas- and fluid-handling and fabrication technology products including pumps, fluid handling systems and controls,services to commercial and specialty valves. We believe that we are a leading manufacturer of rotary positive displacement pumps, which include screw pumps, gear pumps and progressive cavity pumps. We design and engineer our products to high quality and reliability standards for use in critical fluid handling applications where performance is paramount. We also offer customized fluid handling solutions to meet individual customer needs based on our in-depth technical knowledge ofgovernmental customers around the applications in which our products are used.
Colfax began with a series of acquisitions in the fluid-handling and mechanical power transmission sectors, most notably those of Imo and Allweiler in 1997 and 1998, respectively. In 2004, we divested our mechanical power transmission operations and focused on fluid handling. Through the end of 2011, we made a series of strategic acquisitions in this sector, including: Lubrication Systems Company (“LSC”), PD-Technik Ingenieurbüro GmbH (“PD-Technik”), Baric Group (“Baric”), Rosscor Holding B.V. (“Rosscor”) and COT-Puritech, Inc. (“COT-Puritech”).
On January 13, 2012, we closed the acquisition of Charter International plc (“Charter”) by Colfax (the “Charter Acquisition”), which transformed Colfax from a fluid-handling business into a multi-platform enterprise with a strong global footprint. This acquisition provided an additional growth platform in the fragmented fabrication technology industry, while broadening the scope
3
of our fluid-handling platform to include air- and gas-handling products.
Following the Charter Acquisition, we announced the following additional acquisitions that we expect will grow and strengthen our business:
Gas and Fluid Handling
In September 2012, we acquired Co-Vent Group Inc. (“Co-Vent”), a leading supplier of industrial fans based in Quebec, Canada.
In July 2013, we acquired Clarus Fluid Intelligence, LLC (“Clarus”), a domestic supplier of flushing services for marine applications primarily to U.S. government agencies, with primary operations in Bellingham, Washington.
In September 2013, we acquired certain business units of The New York Blower Company, including TLT-Babcock Inc. (“TLT-Babcock”) and Alphair Ventilating Systems Inc. (“Alphair”), suppliers of heavy duty and industrial fans in Akron, Ohio and Winnepeg, Ontario, respectively.
In November 2013, we acquired ČKD Kompresory a.s. (“ČKDK”), a leading supplier of multi-stage centrifugal compressors to the oil & gas, petrochemical, power and steel industries, based in Prague, Czech Republic.
In November 2013, we acquired the remaining ownership of Sistemas Centrales de Lubrication S.A. de C.V. (“Sicelub”), previously a less than wholly owned subsidiary in which the Company did not have a controlling interest. Sicelub provides flushing services to Central and South American customers primarily in the oil, gas and petrochemical end market.
In November 2013, we acquired the global infrastructure and industry division of Fläkt Woods Group (“GII”), an international supplier of heavy duty industrial and cooling fans.
Fabrication Technology
In May 2012, we acquired the remaining ownership of CJSC Sibes (“Sibes”), a less than wholly owned Russian subsidiary in which the Company did not have a controlling interest.
In October 2012, we acquired approximately 91% of Soldex S.A. (“Soldex”), a leading South American supplier of welding products. In August 2013, we increased our ownership of Soldex to approximately 99%.
We employ a comprehensive set of tools that we refer to as the Colfax Business System, or CBS. CBS, is a disciplined strategic planning and execution methodology designed to achieve excellence and world-class financial performance in all aspects of our business by focusing on the Voice of the Customer and continuously improving quality, delivery and cost. Modeledmodeled on the Danaher Business System, CBS focuses on conducting root-cause analysis, developingis our business management system. It is a repeatable, teachable process improvements and implementing sustainable systems. Our approach addresses the entire business, not just manufacturing operations.
Each year, Colfax associates in every business are asked to optimize material sourcing, transportation and production costs and reduce foreign currency risk.
Reportable Segments
Upon the closing of the Charter Acquisition, we changed the composition of our reportable segments to reflect the changes in our internal organization resulting from the integration of the acquired businesses. We now report our operations through the gas- and fluid handling and fabrication technology segments. For certain financial information, including Net sales and long-lived assets by geographic area, see Note 16, “Segment Information” in the accompanying Notes to Consolidated Financial Statements in this Form 10-K.
4
Gas and Fluid Handling
Our gas- and fluid-handling segment is a global supplier of a broad range of products, including pumps, fluid-handling systems and controls, specialty valves, heavy-duty centrifugal and axial fans, rotary heat exchangers and gas compressors, which serves customers in the power generation, oil, gas and petrochemical, mining, marine (including defense) and general industrial and other end markets.
Our gas-handling products are principally marketed under the Howden brand name, and are manufactured and engineered in facilities located in Asia, Europe, North and South America, Australia and Africa. Our fluid-handling products are marketed principally under the Colfax Fluid Handling brand name, as well as a portfolio of brands, including Allweiler, Imo and Total Lubrication Management. We manufacture and assemble our fluid-handling products at locations in Europe, North America and Asia.
Our gas- and fluid-handling products and services are generally sold directly, though independent representatives and distributors are also used.
Fans
Howden fans primarily consist of heavy-duty axial, centrifugal and industrial cooling fans. Axial fans include non-variable pitch, variable pitch, OEM and mixed flow axial fans. Centrifugal fans consist of custom engineered, pre-engineered and OEM centrifugal fans. Ranging in diameter from 200mm to future acquisitions,over 5m, and with a variety of impeller designs, control systems and layout options, our fans form a comprehensive series of axial and centrifugal fans to satisfy virtually all industrial applications. Howden industrial cooling fans are designed for cooling towers, heat exchangers and steam condensers. They range in size from fans for packaged cooling systems to fans up to 25m diameter for cooling towers. Each of our cooling fan designs has its own unique characteristics in terms of efficiency, noise levels and application. We have developed our cooling fans over the last 50 years, and we believe that we will be able to continue to introduce differentiated productsoffer the most reliable and solutions, improvequietest cooling fans available. We have fans operating marginsin over 90 countries in a wide range of applications and increaseuses that require the asset utilizationmovement of our businesses. As a result, we believe we can create profitable sales growth, generate excess cash flow to fund future acquisitionslarge volumes of air in harsh applications, including the world’s largest power stations and increase shareholder value.
Compressors
Howden process compressors and lubrication applications, strong product brand names and a reputation for reliabilitycomplete compressor packages are used in the power generation industry. Within this market we intend to continue our growth as a provider of turnkey systems by utilizing our expertise in power generation applications to develop innovative solutions. We also plan to continue to leverage our global presence to strengthen our relationships with large original equipment manufacturers of power generation equipment to establish us as a critical supplier.
Rotary Heat Exchangers
Rotary regenerative heat exchangers provide a compact, cost effective and reliable solution for heat recovery in the near term.power plant and flue gas desulfurization systems. With over 80 years experience, Howden supplies highly efficient and reliable air preheaters for power boiler applications, rotary regenerative heat exchangers and replacement element baskets for rotary regenerative heat exchangers.
Pumps
Rotary Positive Displacement Pumps —We - We believe that we are a leading manufacturer of rotary positive displacement pumps with a broad product portfolio and globally recognized brands. Rotary positive displacement pumps consist of a casing containing screws, gears, vanes or similar components that are actuated by the relative rotation of that component to the casing, which results in the physical movement of the liquid from the inlet to the discharge at a constant rate. Positive displacement pumps generally offer precise, quiet and highly efficient transport of viscous fluids. The U.S. Hydraulic Institute accredits 11 basic types of rotary positive displacement pumps, of which we manufacture five (3-screw, 2-screw, progressive cavity, gear and peristaltic).
Specialty Centrifugal Pumps—Pumps - Centrifugal pumps use the kinetic energy imparted by rotating an impeller inside a configured casing to create pressure. While traditionally used to transport large quantities of thin liquids, our centrifugal pumps use specialty designs and materials to offer customers high quality, reliability and customized solutions for a wide range of viscosities, temperatures and applications. We position our specialty centrifugal pumps for applications where customers clearly recognize our brand value or in markets where centrifugal and rotary pumps are complimentary.
5
We manufacture complete fluid handlingfluid-handling systems used primarily in the oil and gas, power generation, commercial marine and global defense markets. We offer turnkey systems and support, including design, manufacture, installation, commission and service. Our systems include:
| lubrication systems, which are used in rotating equipment in oil refineries and other process industries; |
| custom designed packages used in crude oil pipeline applications; |
| lubrication and fuel forwarding systems used in power generation turbines; and |
Specialty Valves
Our specialty valves are used primarily in naval applications. Our valve business has specialized machining, welding and fabrication capabilities that enable itus to serve as a supplier to the U.S. Navy. In addition to designing and manufacturing valves, we also offer repair and retrofit services for products manufactured by other valve suppliers through our aftermarket support centers located in Portland, MaineVirginia Beach, Virginia and San Diego, California.
Our total lubrication management offering provides lubrication system equipment and services to customers in end markets where lubrication system performance is critical, including: petroleum refining, petrochemical production, natural gas transmission, power generation, and military and commercial marine vessels. Our products include LubriMist® oil mist generators, Mistlock™ bearing lubrication cartridges and ThermoJet® oil purifiers. Our services include high velocity oil flushing, leakage oil reclamation and condition monitoring. We sell lubrication equipment globally, and provide lubrication services primarily in North and South America.
Fabrication Technology
We formulate, develop, manufacture and assemblesupply consumable products and equipment for use in the cutting and joining of steels, aluminum and other metals and metal alloys. For the year ended December 31, 2013, welding consumables represented approximately 37% of our total Net sales. Our fabrication technology products at 14are principally marketed under the ESAB brand name, which we believe is a leading international welding company with roots dating back to the invention of the covered welding electrode. ESAB’s comprehensive range of welding consumables includes electrodes, cored and solid wires and fluxes. ESAB’s fabrication technology equipment ranges from portable welding machines to large customized automated welding systems. Products are sold into a wide range of end markets, including oil & gas, power generation, wind power, shipbuilding, pipelines, mobile/off-highway equipment and mining.
Many of ESAB’s manufacturing facilities are located in low cost locations, in particular Central and Eastern Europe, NorthSouth America and Asia. This global manufacturing reach enables usOur fabrication technology products are sold both through independent distributors and direct salespeople, depending on geography and end market.
The following discussions of Industry and Competition, International Operations, Research and Development, Intellectual Property, Raw Materials and Backlog, Seasonality, Working Capital, Associates and Company Information and Access to serve our customers wherever they chooseSEC Reports include information that is common to do business. Eachboth of our manufacturing sites offers machining, fabricationreportable segments, unless indicated otherwise.
Industry and assembly capabilities that gives us the flexibility to source some of our products from multiple facilities. Our manufacturing facilities also benefit from the use of shared technology and collaboration across production lines, enabling us to increase operational efficiencies through the use of common suppliers and the duplication of production processes.
Competition
Our products and services are marketed on a worldwide basis. We believe that the principal elements of competition in our markets are:
worldwide. The markets we serveserved by our gas- and fluid-handling segment are highly fragmented and competitive. Because we compete in selected niches of these markets and due to the fluid handling industry, there is not anydiversity of our products and services, no single company that competes directly with us across all of our markets. AsWe encounter a result,wide variety of competitors that differ by product line, including well-established regional competitors, competitors who are more specialized than we haveare in particular markets, as well as larger companies or divisions of companies that are larger than we are. The markets that our fabrication technology segment competes in are also served by the welding segments of Lincoln Electric and Illinois Tool Works, Inc.
6
Our customer base is broadly diversified across many different competitorssectors of the economy, and we believe customers place a premium on quality, reliability, availability, design and application engineering support. We believe the principal elements of competition in our served markets are the technical ability to meet customer specifications, product quality and reliability, brand names, price, application expertise and engineering capabilities and timely delivery and strong aftermarket support. Our management believes that we are a leading competitor in each of our markets.
Additionally, we utilize CBS to continuously improve our business, which we believe, in addition to our management team’s experience in the application of the CBS methodology, is one of our primary competitive strengths. CBS is our business system designed to encourage a culture of continuous improvement in all aspects of our operations and strategic markets.planning.
International Operations
Our products and services are available worldwide. We believe this geographic diversity allows us to draw on the skills of a worldwide workforce, provides stability to our operations, allows us to drive economies of scale, provides revenue streams that may offset economic trends in individual economies and offers us an opportunity to access new markets for products. Our principal markets outside the United States are in Europe, Asia, the Middle East and South America. In addition, we believe that future growth is dependent in part on our ability to develop products and sales models that target developing countries. For the commercial marine market, we compete primarilyyear ended December 31, 2013, approximately 53% of our Net sales were shipped to locations in developing countries.
Our international operations subject us to certain risks. See Item 1A. “Risk Factors—Risks Related to Our Business—The majority of our sales are derived from international operations. We are subject to specific risks associated with Naniwa Pump Manufacturing Co., Ltd., Shinko Industries, Ltd., Shin Shin Machinery Group Co., Ltd. and Taiko Kikai Industries Co., Ltd. In the oil and gas market, we compete primarily with Joh. Heinr. Bornemann GmbH and Leistritz Pumpen GmbH. In the power generation market, we compete primarily with Buffalo Pumps, a subsidiary of Ampco-Pittsburgh Corporation. In the global defense market, we compete primarily with Buffalo Pumps, Carver Pump Company, Curtiss-Wright Corporation and Tyco International, Inc.international operations.”
Research and Development
Our research and development activities vary by operating segment. We closely integrate research and development with marketing, manufacturing and product engineering in meeting the needs of our customers. Our research and development efforts focus on innovation and developing new product applications, lowering the cost of manufacturing our existing products and redesigning existing product lines to increase efficiency and enhance performance. Our business product engineering teams are continuously enhancing our existing products and developing new product applications for our growing base of customers that require custom solutions. We believe these capabilities provide a significant competitive advantage in the development of high quality fluid handling systems. Our product engineering teams focus on:products.
Intellectual Property
We rely on a combination of intellectual property rights, including patents, trademarks, copyrights, trade secrets and contractual provisions to protect our intellectual property. Although we highlight recent additions to our patent portfolio as part of our marketing efforts, we do not consider any one patent or trademark or any group thereof essential to our business as a whole or to any of our business operations. We also rely on proprietary product knowledge and manufacturing processes in our operations.
Raw Materials and Backlog
We obtain raw materials, component parts and supplies from a variety of sources, generally each from more than one supplier. Our principal raw materials are metals, castings, motors, seals and bearings. Our suppliers and sources of raw materials are based in the United States and other countries.globally based. We believe that our sources of raw materials are adequate for our needs for the foreseeable future and the loss of any one supplier would not have a material adverse effect on our business or results of operations.
Manufacturing turnaround time for our gas- and fluid-handling operating segment is generally sufficiently short to allow us to manufacture to order for most of our products, which helps to limit inventory levels. Backlog generally is a function of requested customer delivery dates and may range from days to several years. Backlog of gas- and fluid-handling orders as of December 31, 20102013 was $313.5 million,$1.6 billion, compared with $290.9 million$1.4 billion as of December 31, 2009. We expect to ship approximately 70%2012. A substantial majority of our the gas- and fluid-handling order backlog as of December 31, 2010 backlog during 2011; however, orders are subject2013 is expected to postponement or cancellation.be filled within the current fiscal year.
7
Seasonality
Working Capital
We maintain an adequate level of working capital to support our business needs. There are no unusual industry practices or requirements related to working capital items.
Associates
The following table presents our worldwide associate base as of the periodsdates indicated:
| Year ended December 31, | ||||||||||||
| 2010 | 2009 | 2008 | ||||||||||
| North America | 638 | 598 | 739 | |||||||||
| Europe | 1,260 | 1,189 | 1,276 | |||||||||
| Asia and Middle East | 262 | 254 | 299 | |||||||||
| Total | 2,160 | 2,041 | 2,314 | |||||||||
| December 31, | ||||||||
| 2013 | 2012 | 2011 | ||||||
| North America | 2,667 | 2,805 | 728 | |||||
| Europe | 6,761 | 6,107 | 1,232 | |||||
| Asia and Middle East | 4,722 | 4,397 | 251 | |||||
| Central and South America | 2,963 | 2,424 | — | |||||
| Other | 646 | 553 | — | |||||
| Total associates | 17,759 | 16,286 | 2,211 | |||||
Approximately 2% of associates are 39 associates in the United States covered by a collective bargaining agreementagreements with the International Union of Electronic, Electrical, Salaried, Machine and Furniture Workers-Communications Workers of America (IUE-CWA). The contract with the union expires December 4, 2011 and provides for wage increases ranging from 3.5% to a maximum of 3.8% per year.U.S. trade unions. In addition, approximately 49%36% of our associates are represented by foreign trade unions by law,and work councils in Germany, SwedenEurope, Asia, Central and the Netherlands,South America, Canada, Africa and Australia, which subjects us to arrangements very similar to collective bargaining agreements. We have not experienced any work stoppages or strikes that have had a material adverse impact on operations. We consider our relations with our associates to be good.
Company Information and Access to SEC Reports
We were organized as a Delaware corporation in 1998. Our principal executive offices are located at 8170 Maple Lawn Boulevard, Suite 180, Fulton, MD 20759, and our main telephone number at that address is (301) 323-9000. Our corporate website address is www.colfaxcorp.com.
We make available, free of charge through our website, our annual report on Form 10-K,and quarterly reports on Form 10-K and Form 10-Q (including related filings in XBRL format), current reports on Form 8-K and any amendments to those reports as soon as practicable after filing or furnishing the material to the SEC. You may also request a copy of these filings, at no cost, by writing or telephoning us at: Investor Relations, Colfax Corporation, 8170 Maple Lawn Boulevard, Suite 180, Fulton, MD 20759, telephone (301) 323-9000. Information contained on our website is not incorporated by reference in this report.
Item 1A. Risk Factors
An investment in our commonCommon stock involves a high degree of risk. You should carefully consider the risks and uncertainties described below, together with the information included elsewhere in this Annual Report on Form 10-K and other documents we file with the SEC. If any of the following risks actually occur, our business, financial condition or operating results could suffer. As a result, the trading price of our common stock could decline and you could lose all or part of your investment in our common stock. The risks and uncertainties described below are those that we have identified as material, but aremay not be the only risks to which Colfax might be exposed. Additional risks and uncertainties, facingwhich are currently unknown to us or that we do not currently consider to be material, may materially affect the business of Colfax and we caution that this listcould have material adverse effects on our business, financial condition and results of risk factors may notoperations. If any of the following risks were to occur, our business, financial condition and results of operations could be exhaustive.materially adversely affected, the value of our Common stock could decline and investors could lose all or part of the value of their investment in Colfax shares. Our business is also subject to general risks and uncertainties that affect many other companies, such as overall U.S. and non-U.S. economic and industry conditions, a global economic slowdown, geopolitical events, changes in laws or accounting rules, fluctuations in interest rates, terrorism, international conflicts, natural disasters or other disruptions of expected economic or business conditions. We operate in a continually changing business
8
environment, and new risk factors emerge from time to time which we cannot predict. Additional risks and uncertainties not currently known to us or that we currently believe are immaterial also may impair our business, including our results of operations, liquidity and financial condition.
Risks Related to Our Business
Changes in the general economy and the cyclical nature of the markets that we serve could negatively impact the demand for our markets couldproducts and services and harm our operations and financial performance.
In addition, our products are sold in many industries, some of which are cyclical and may experience periodic downturns. Cyclical weakness in the industries we serve could lead to reduced demand for our products and affect our profitability and financial performance. In 2010 the effects of the global economic slowdown started to recede in some markets but we still see sluggish demand and less than robust growth in certain areas.
Acquisitions have formed a significant part of our growth strategy in the past and are expected to continue to do so. If we are unable to identify suitable acquisition candidates or successfully integrate the businesses we acquire, or realize the intended benefits, our growth strategy may not succeed. Acquisitions involve numerous risks, including risks related to integration and undisclosed or underestimated liabilities.
Historically, our business strategy has relied on acquisitions. We expect to derive a significant portion of our growth by acquiring businesses and integrating those businesses into our existing operations. We intend to seek acquisition opportunities both to expand into new markets and to enhance our position in our existing markets. However, our ability to do so will depend on a number of steps, including our ability to:
identify suitable acquisition candidates;
integrate the acquired business into our existing operations.
If we fail to achieve any of these steps, our growth strategy may not be successful.
Acquisitions involve numerous risks, including difficulties in the assimilation of the operations, systems, controls, technologies, personnel, services and products of the acquired company, the potential loss of key employees, customers and distributors of the acquired company and the diversion of our management’smanagement's attention from other business concerns. This is the case particularly in the fiscal quarters immediately following the completion of an acquisition because the operations of the acquired business are integrated into the acquiring businesses’business' operations during this period. We cannot be sure that we willmay not accurately anticipate all of the changing demands that any future acquisition may impose on our management, our operational and management information systems and our financial systems. The failure to successfully integrate acquired businesses in a timely manner, or at all, could have an adverse effect on our business, financial condition and results of operations.
9
In addition, the anticipated benefits of an acquisition may not be realized fully or at all, or may take longer to realize than we expect. Actual operating, technological, strategic and sales synergies, if achieved at all, may be less significant than we expect or may take longer to achieve than anticipated. If we are not able to realize the anticipated benefits and synergies expected from our acquisitions within a reasonable time, our business, financial condition and results of operations may be adversely affected.
Acquisitions may result in significant integration costs, and unanticipated integration expense may harm our business, financial condition and results of operations.
Integration efforts associated with our acquisitions may require significant capital and operating expense. Such expenses may include information technology integration fees, facility closure costs and other restructuring expenses. Significant unanticipated expenses associated with integration activities may harm our business, financial condition and results of operations.
Our acquisitions may expose us to significant unanticipated liabilities and could adversely affect our business, financial condition and results of operations.
We may underestimate or fail to discover liabilities relating to a future acquisitionacquisitions during theour due diligence investigationinvestigations, and we, as the successor owner of an acquired company, might be responsible for those liabilities. For example, two of our acquired subsidiaries are each one of many defendants in a large number of lawsuits that claimSuch liabilities could include employment, retirement or severance-related obligations under applicable law or other benefits arrangements, legal claims, tax liabilities, warranty or similar liabilities to customers, product liabilities and personal injury as a result of exposure to asbestos from products manufactured with components that are alleged to have contained asbestos. Although our due diligence investigations in connection with these acquisitions uncovered the existence of potential asbestos-related liabilities, the scope of such liabilities were greater than we had originally estimated. Although we seek to minimize the impact of underestimated or potential undiscovered liabilities by structuring acquisitions to minimizeclaims, environmental liabilities and obtaining indemnitiesclaims by or amounts owed to vendors. The indemnification and warranties from the selling party, these methodswarranty provisions in our acquisition agreements may not fully protect us from the impact of undiscovered liabilities. Indemnities or warranties are often limited in scope, amount or duration, and may not fully cover the liabilities for which they were intended. The liabilities that are not covered by the limited indemnities or warranties could have a material adverse effect on our business, financial condition and financial condition.results of operations.
We may require additional capital to finance our operating needs and to finance our growth. If the terms on which the additional capital is available are unsatisfactory, if the additional capital is not available at all or if we are not able to fully access our existing credit facility,under the Deutsche Bank Credit Agreement, we may not be able to pursue our growth strategy.
Our growth strategy will require additional capital investment to complete acquisitions, integrate the completed acquisitions into our existing operations and to expand into new markets.
We intend to pay for future acquisitions using cash, capital stock, notes, assumption of indebtedness or any combination of the foregoing. To the extent that we do not generate sufficient cash internally to provide the capital we require to fund our growth strategy and future operations, we will require additional debt or equity financing. We cannot be sure that thisThis additional financing willmay not be available or, if available, willmay not be on terms acceptable to us. Further, high volatility in the equitycapital markets and in our stock price may make it difficult for us to access the equitycapital markets for additional capital at attractive prices, if at all. If we are unable to obtain sufficient additional capital in the future, it may limit our ability to implement fully our businessgrowth strategy. Even if future debt financing is available, it may result in (1)(i) increased interest expense, (2)(ii) increased term loan payments, (3)(iii) increased leverage and (4)(iv) decreased income available to fund further acquisitions and expansion. It may also limit our ability to withstand competitive pressures and make us more vulnerable to economic downturns. If future equity financing is available, issuances of our equity securities may dilute our existing stockholders.
In addition, our credit facility agreement includes restrictive covenants which could limit our financial flexibility. If we do not maintain compliance with these covenants,See “—The Deutsche Bank Credit Agreement contains restrictions that may limit our creditors could declare a default. Our ability to comply with the provisions offlexibility in operating our indebtedness may be affected by changes in economic or business conditions beyond our control.
We have implemented, and plan to remedy the situation, which could negatively affect our profitabilitycontinue to implement, restructuring programs designed to facilitate key strategic initiatives and financial condition.maintain long-term sustainable growth. As such, we have incurred and expect to continue to incur increased expense relating to restructuring activities. We maintain property damage insurance which we believe to be adequate to provide for reconstruction of facilities and equipment, as well as business interruption insurance to mitigate losses resulting from any production interruption or shutdown caused by an insured loss. However, any recovery under our insurance policies may not offsetachieve or sustain the lost salesanticipated benefits of these programs. Further, restructuring efforts are inherently risky, and we may not be able to predict the cost and timing of such actions accurately or increased costs thatproperly estimate their impact. We also may not be experienced duringable to realize the disruption of operations, which could adversely affect our financial performance.anticipated savings we expect from restructuring activities.
10
Available insurance coverage, the number of future asbestos-related claims and the average settlement value of current and future asbestos-related claims of two of ourcertain subsidiaries could be different than we have estimated, which could materially and adversely affect our business, financial condition and results of operations and cash flow.operations.
Our decision to use a 15-year period is based on our belief that this is the extent of our ability to forecast liability costs. We also estimate the amount of insurance proceeds available for such claims based on the current financial strength of the various insurers, our estimate of the likelihood of payment and applicable current law. We reevaluate these estimates regularly. Although we believe our current estimates are reasonable, a change in the time period used for forecasting our liability costs, the actual number of future claims brought against us, the cost of resolving these claims, the likelihood of payment by, and the solvency of, insurers and the amount of remaining insurance available could be substantially different than our estimates, and future revaluation of our liabilities and insurance recoverables could result in material adjustments to these estimates, any of which could materially and adversely affect our business, financial condition and results of operations and cash flow.operations. In addition, the company incurswe incur defense costs related to those claims, a portion of which has historically been reimbursed by our insurers. We also incur litigation costs in connection with actions against certain of the subsidiaries’subsidiaries' insurers relating to insurance coverage. While these costs may be significant, we may not be able to predict the amount or duration of such costs. Additionally, we may experience delays in receiving reimbursement from insurers, during which time we may be required to pay cash for settlement or legal defense costs. Any increase in the actual number of future claims brought against us, the defense costs of resolving these claims, the cost of pursuing claims against our insurers, the likelihood and timing of payment by, and the solvency of, insurers and the amount of remaining insurance available, could materially and adversely affect our business, financial condition and results of operations.
A material disruption at any of our manufacturing facilities could adversely affect our ability to generate sales and meet customer demand.
If operations at any of our manufacturing facilities were to be disrupted as a result of a significant equipment failure, natural disaster, power outage, fire, explosion, terrorism, cyber-based attack, adverse weather conditions, labor disputes or other reason, our financial performance could be adversely affected as a result of our inability to meet customer demand for our products. Interruptions in production could increase our costs and cash flow.
reduce our sales. Any interruption in production capability could require us to make substantial capital expenditures to remedy the situation, which could negatively affect our profitability and financial condition. We maintain property damage insurance which we believe to be adequate to provide for reconstruction of facilities and equipment, as well as business interruption insurance to mitigate losses resulting from any production interruption or shutdown caused by an insured loss. However, any recovery under our insurance policies may not offset the lost sales or increased costs that may be experienced during the disruption of operations, which could adversely affect our business, financial condition and results of operations.
Our international operations are subject to the laws and regulations of the United StatesU.S. and many foreign countries. Failure to comply with these laws may affect our ability to conduct business in certain countries and may affect our financial performance.
We are subject to a variety of laws regarding our international operations, including the U.S. Foreign Corrupt Practices Act and the U.K Bribery Act of 2010, and regulations issued by U.S. Customs and Border Protection, the U.S. Bureau of Industry and Security, and the regulationsU.S. Treasury Department’s Office of Foreign Assets Control (“OFAC”) and various foreign governmental agencies. We cannot predict the nature, scope or effect of future regulatory requirements to which our international sales and manufacturing operations might be subject or the manner in which existing laws might be administered or interpreted. Future regulations could limit the countries in which some of our products may be manufactured or sold, or could restrict our access to, and increase the cost of obtaining, products from foreign sources. In addition, actual or alleged violations of these laws could result inlead to enforcement actions and financial penalties that could result in substantial costs. The occurrence of any of the foregoing could have a material adverse effect on our business, financial condition and results of operations.
11
Failure to comply with the U.S. Foreign Corrupt Practices Act, the U.K. Bribery Act or other applicable anti-bribery laws could have an adverse effect on our business.
The U.S. Foreign Corrupt Practices Act, the U.K. Bribery Act and similar anti-bribery laws in other jurisdictions generally prohibit companies and their intermediaries from making improper payments for the purpose of obtaining or retaining business. Recent years have seen a substantial increase in anti-bribery law enforcement activity with more frequent and aggressive investigations and enforcement proceedings by both the Department of Justice and the U.S. Securities and Exchange Commission, increased enforcement activity by non-U.S. regulators and increases in criminal and civil proceedings brought against companies and individuals. Our foreign subsidiariespolicies mandate compliance with all anti-bribery laws. However, we operate in certain countries that are recognized as having governmental and commercial corruption. Our internal control policies and procedures may not always protect us from reckless or criminal acts committed by our employees or third-party intermediaries. Violations of these anti-bribery laws may result in criminal or civil sanctions, which could have a material adverse effect on our business, financial condition and results of operations.
We have done and may continue to do business in countries subject to U.S. sanctions and embargoes, including Iran and Syria, and we may have limited managerial oversight over those activities. Failure to comply with these sanctions and embargoes may result in enforcement or other regulatory actions.
Our efforts to comply with U.S. sanction laws and embargoes willmay not be effective, and as a consequence we may face enforcement or other actions if our compliance efforts are not wholly effective. Actual or alleged violations of these laws could result inlead to substantial fines or other sanctions which could result in substantial costs. In addition, Syria, Iran and Syriacertain other sanctioned countries currently are identified by the U.S. State Department as state sponsors of terrorism, and may behave been subject to increasingly restrictive sanctions. Because certain of our independent foreign subsidiaries have contact with and transact limited business in suchcertain U.S. sanctioned countries, including sales to enterprises controlled by agencies of the governments of such countries, our reputation may suffer due to our association with these countries, which may have a material adverse effect on the price of our common stock. Further,shares and our business, financial condition and results of operations. In addition, certain U.S. states and municipalities have recently enacted legislation regarding investments by pension funds and other retirement systems in companies that have business activities or contacts with countries that have been identified as state sponsors of terrorism and similar legislation may be pending in other states. As a result, pension funds and other retirement systems may be subject to reporting requirements with respect to investments in companies such as oursColfax or may be subject to limits or prohibitions with respect to those investments that may have a material adverse effect on the price of our shares.shares and our business, financial condition and results of operations.
If we fail to comply with export control regulations, we could be subject to substantial fines or other sanctions.
Some of our products manufactured or assembled in the United StatesU.S. are subject to the U.S. Export Administration Regulations, administered by the U.S. Department of Commerce, Bureau of Industry and Security, which require that we obtain an export license is
12
obtained before we can export such products can be exported to specifiedcertain countries. Additionally, some of our products are subject to the International Traffic in Arms Regulations, which restrict the export of certain military or intelligence-related items, technologies and services to non-U.S. persons. Failure to comply with these laws could harm our business by subjecting us to sanctions by the U.S. government, including substantial monetary penalties, denial of export privileges and debarment from U.S. government contracts.
The occurrence of any of the foregoing could have a material and adverse effect on our business, financial condition and results of operations.
In the year ended December 31, 2013, we derived approximately 80% of our sales from operations outside of the U.S. and we have principal manufacturing facilities in 25 non-U.S. countries. Sales from international operations, export sales and the use of manufacturing facilities outside of the U.S. by us are subject to risks inherent in doing business outside the U.S. These risks include:
economic or political instability;
partial or total expropriation of international assets;
limitations on ownership or participation in local enterprises;
trade protection measures, including tariffs or import-export restrictions;
currency exchange rate fluctuations and restrictions on currency repatriation;
labor and employment laws that may be more restrictive than in the U.S.;
significant adverse changes in taxation policies or other laws or regulations;
difficulties in hiring and maintaining qualified staff; and
the disruption of operations from political disturbances, terrorist activities, insurrection or war.
If any of these risks were to materialize, they may have a material adverse effect on our business, financial condition and results of operations.
If our employees are represented by foreign trade unions. Ifunions or works councils engage in a strike, work stoppage or other slowdown or if the representation committees responsible for negotiating with thesesuch trade unions on our behalfor works councils are unsuccessful in negotiating new and acceptable agreements when the existing agreements with our employees covered by the unionscollective bargaining expire,or if the foreign trade unions chose not to support our restructuring programs, we could experience business disruptions or increased costs.
As of December 31, 2010,2013, approximately 38% of our employees were represented by a number of different trade unions and works councils. Further, as of that date, we had 1,524approximately 15,200 employees, representing 86% of our worldwide employee base, in foreign locations. In certainCanada, Australia and various countries laborin Europe, Asia, and employment laws are more restrictive than in the U.S.Central and in many cases, grant significant job protection to employees, including rights on termination of employment. In Germany, Sweden and the Netherlands,South America, by law, somecertain of our employees are represented by a number of different trade unions in these jurisdictions,and works councils, which subjectssubject us to employment arrangements very similar to collective bargaining agreements. Further, the laws of certain foreign countries may place restrictions on our ability to take certain employee-related actions or require that we conduct additional negotiations with trade unions, works councils or other governmental authorities before we can take such actions.
If our employees represented by foreign trade unions or works councils were to engage in a strike, work stoppage or other slowdown in the future, we could experience a significant disruption of our operations. Such disruption could interfere with our business operations and could lead to decreased productivity, increased labor costs and lost revenue.
Our manufacturing business is subject to the possibility of product liability lawsuits, which could harm our business.
13
third-party suppliers may be limited and thus insufficient to cover claims made against us. If our insurance coverage or contractual indemnification is insufficient to satisfy product liability claims made against us, the claims could have an adverse effect on our business and financial condition. Even claims without merit could harm our reputation, reduce demand for our products, cause us to incur substantial legal costs and distract the attention of our management. The occurrence of any of the foregoing could have a material and adverse effect on our business, financial condition and results of operations.
As a manufacturer,manufacturers, we are subject to a variety of environmental and health and safety laws for which compliance, or liabilities that arise as a result of noncompliance, could be costly. In addition, if we fail to comply with such laws, we could incur liability that could result in penalties and costs to correct any non-compliance.
Our business isbusinesses are subject to international, federal, state and local environmental and safety laws and regulations, including laws and regulations governing emissions of: regulated air pollutants; discharges of wastewater and storm water; storage and handling of raw materials; and generation, storage, transportation and disposal of regulated wastes; and laws and regulations governing worker safety. These requirements impose on our businessbusinesses certain responsibilities, including the obligation to obtain and maintain various environmental permits. If we were to fail to comply with these requirements or fail to obtain or maintain a required permit, we could be subject to penalties and be required to undertake corrective action measures to achieve compliance. In addition, if our noncompliance with such regulations were to result in a release of hazardous materials tointo the environment, such as soil or groundwater, we could be required to remediate such contamination, which could be costly. Moreover, noncompliance could subject us to private claims for property damage or personal injury based on exposure to hazardous materials or unsafe working conditions. ChangesIn addition, changes in applicable requirements or stricter interpretation of existing requirements may result in costly compliance requirements or otherwise subject us to future liabilities.
The occurrence of any of the foregoing could have a material adverse effect on our business, financial condition and results of operations.
As the present or former owner or operator of real property, or generator of waste, we could become subject to liability for environmental contamination, regardless of whether we caused such contamination.
Under various federal, state and local laws, regulations and ordinances, and, in some instances, international laws, relating to the protection of the environment, a current or former owner or operator of real property may be liable for the cost to remove or remediate contamination on, under, or released from such property and for any damage to natural resources resulting from such contamination. Similarly, a generator of waste can be held responsible for contamination resulting from the treatment or disposal of such waste at any off-site location (such as a landfill), regardless of whether the generator arranged for the treatment or disposal of the waste in compliance with applicable laws. Costs associated with liability for removal or remediation of contamination or damage to natural resources could be substantial and liability under these laws may attach without regard to whether the responsible party knew of, or was responsible for, the presence of the contaminants. In addition, the liability may be joint and several. Moreover, the presence of contamination or the failure to remediate contamination at our properties, or properties for which we are deemed responsible, may expose us to liability for property damage or personal injury, or materially adversely affect our ability to sell our real property interests or to borrow using the real property as collateral. We cannot be sure that we will notcould be subject to environmental liabilities in the future as a result of historic or current operations that have resulted or will result in contamination. The occurrence of any of the foregoing could have a material adverse effect on our business, financial condition and results of operations.
Failure to maintain and protect our trademarks, trade names and technologyintellectual property rights or challenges to these rights by third parties may affect our operations and financial performance.
The market for many of our products is, in part, dependent upon patent, trademark, copyright and trade secret laws, agreements with employees, customers and other third parties to establish and maintain our intellectual property rights, and the goodwill engendered by our trademarks and trade names. TrademarkThe protection of these intellectual property rights is therefore material to a portion of our business.businesses. The failure to protect our trademarks and trade namesthese rights may have a material adverse effect on our business, financial condition and operating results.results of operations. Litigation may be required to enforce our intellectual property rights, protect our trade secrets or determine the validity and scope of proprietary rights of others. It may be particularly difficult to enforce our intellectual property rights in countries where such rights are not highly developed or protected. Any action we take to protect our intellectual property rights could be costly and could absorb significant management time and attention. As a result of any such litigation, we could lose any proprietary rights we have.
In addition, itthird parties may claim that we or our customers are infringing upon their intellectual property rights. Claims of intellectual property infringement may subject us to costly and time-consuming defense actions and, should defenses not be successful, may result in the payment of damages, redesign of affected products, entry into settlement or license agreements, or a temporary or permanent injunction prohibiting us from manufacturing, marketing or selling certain of our products. It is also possible that others will independently develop technology that will compete with our patented or unpatented technology. The development
14
occurrence of new technologies by competitors that may compete withany of the foregoing could have a material and adverse effect on our technologies could reduce demand for our productsbusiness, financial condition and affect our financial performance.results of operations.
The loss of key leadership could have a material adverse effect on our ability to run our business.
We may be adversely affected if we lose members of our senior leadership. We are highly dependent on our senior leadership team as a result of their expertise. During 2010 we added several new members toexpertise in our senior leadership team, including Clay H. Kiefaber,industry and our President and Chief Executive Officer, and C. Scott Brannan, our Senior Vice President, Finance and Chief Financial Officer.business. The loss of key leadership or the inability to attract, retain and motivate sufficient numbers of qualified management personnel could have a material adverse effect on usour business, financial condition and our business.
The methods, estimatesDeutsche Bank Credit Agreement contains various covenants that limit our ability to engage in specified types of transactions. These covenants limit our ability to, among other things:
incur additional indebtedness;
pay dividends on, repurchase or make distributions in respect of, the capital stock of Colfax and judgmentsits wholly-owned subsidiaries;
make certain investments;
create liens on certain assets to secure debt;
consolidate, merge, sell or otherwise dispose of all or substantially all our assets; and
enter into certain transactions with affiliates.
In addition, under the Deutsche Bank Credit Agreement, we use in applying our accounting policiesare required to satisfy and maintain compliance with a total leverage ratio and an interest coverage ratio. Limitations imposed by the Deutsche Bank Credit Agreement's various covenants could have a significant impactmaterially adverse effect on our results of operations (see “Critical Accounting Policiesbusiness, financial condition and Estimates” in Part II, Item 7 of this Form 10-K). Such methods, estimates and judgments are, by their nature, subject to substantial risks, uncertainties and assumptions, and factors may arise over time that lead us to change our methods, estimates and judgments. Changes in those methods, estimates and judgments could significantly affect our results of operations.
Any impairment in the value of our intangible assets, including goodwill,Goodwill, would negatively affect our operating results and total capitalization.
Our totalTotal assets reflect substantial intangible assets, primarily goodwill.Goodwill. The goodwillGoodwill results from our acquisitions, representing the excess of cost over the fair value of the net assets we have acquired. We assess at least annually whether there has been impairment in the value of our intangible assets. If future operating performance at one or more of our business units were to fall significantly below current levels, if competing or alternative technologies emerge, or if market conditions for businessesan acquired declines,business decline, we could incur, under current applicable accounting rules, a non-cash charge to operating earnings for goodwillGoodwill impairment. Any determination requiring the write-off of a significant portion of unamortized intangible assets would negativelyadversely affect our business, financial condition, results of operations and total capitalization, the effect of which could be material.
Our defined benefit pension plans and post-retirement medical and death benefit plans are or may become subject to financial market risksfunding requirements or obligations that could adversely affect our operating results,business, financial condition and cash flow.results of operations.
Significant movements in foreign currency exchange rates may harm our financial results.
We are exposed to fluctuations in currency exchange rates. During the year ended December 31, 2013, approximately 80% of our sales were derived from operations outside the U.S. A significant portion of our revenues and income are denominated in foreign currencies. Large fluctuations in the rate of exchange between foreign currencies and the U.S. dollar could have a material adverse effect on our business, financial condition and results of operations. Changes in the currency exchange rates may impact
15
the financial results positively or negatively in one period and not another, which may make it difficult to compare our operating results from different periods.
We also face exchange risk from transactions with customers in countries outside the U.S. and from intercompany transactions between affiliates. Although we use the U.S dollar as our functional currency for reporting purposes, we have manufacturing sites throughout the world and a substantial portion of our costs are incurred and sales are generated in foreign currencies. Costs incurred and sales recorded by subsidiaries operating outside of the U.S. are translated into U.S. dollars using exchange rates effective during the respective period. As a result, we are exposed to movements in the exchange rates of various currencies against the U.S. dollar. In particular, the Company has more sales in European currencies than it has expenses in those currencies. Although a significant portion of this difference is hedged, when European currencies strengthen or weaken against the U.S. dollar, operating profits are increased or decreased, respectively.
Venezuela devalued its currency relative to the U.S. dollar numerous times, and may do so again in the future. Because we consider the Venezuelan bolivar fuerte a highly inflationary currency under accounting principles generally accepted in the U.S. (“GAAP”), the financial statements of the Company’s Venezuelan operations have been remeasured into their parent’s reporting currency, the Colombian peso. The devaluation of the bolivar and the change to the Colombian peso as the functional currency resulted in a foreign currency transaction loss of $2.9 million recognized in Selling, general and administrative expense for the three months ended March 29, 2013. Additionally, during the first quarter of 2014, Argentina devalued its currency relative to the U.S. dollar, which has resulted in the Argentine peso to also be considered a highly inflationary currency under GAAP. We expect to be subject to foreign currency translation losses during the first quarter of 2014 as a result of the devaluation of the Argentine peso. We may be subject to additional foreign currency translation losses depending upon whether Venezuela further devalues the bolivar, movements in exchange rates between these highly inflationary currencies and the parents’ reporting currency and the amount of monetary assets and liabilities included in the balance sheets of our operations denominated in currencies considered to be highly inflationary. As of and for the year ended December 31, 2013, the Company’s combined Venezuelan and Argentine operations represented less than 1% and 2% of the Company’s Total assets and Net sales, respectively.
We have generally accepted the exposure to exchange rate movements without using derivative financial instruments to manage this risk. Both positive and negative movements in currency exchange rates against the U.S. dollar will therefore continue to affect the reported amount of sales, profit, assets and liabilities in our Consolidated Financial Statements.
We are dependent on the availability of raw materials, as well as parts and components used in our products.
While we manufacture many of the parts and components used in our products, we purchase a substantial amount of raw materials, parts and components from suppliers. The availability and prices for raw materials, parts and components may be subject to curtailment or change due to, among other things, suppliers' allocations to other purchasers, interruptions in production by suppliers, changes in exchange rates and prevailing price levels. Any significant change in the supply of, or price for, these raw materials, parts or components could materially affect our business, financial condition and results of operations. In addition, delays in delivery of raw materials, parts or components by suppliers could cause delays in our delivery of products to our customers.
We are currently working to streamline our supplier base, which could exacerbate certain of the risks described above. For example, as a result of maintaining relationships with fewer suppliers, we may become more dependent on such suppliers having adequate quantities of raw materials, parts or components that satisfy our requirements at prices that we consider appropriate, and on the timely delivery of such raw materials, parts or components to us. In addition, as a result of maintaining relationships with fewer suppliers, it may be more difficult or impossible to obtain raw materials, parts or components from alternative sources when such components and raw materials are not available from our regular suppliers.
New regulations and customer preferences reflecting an increased focus on environmental, social and governance responsibility may impose additional costs on us and expose us to new risks, including with respect to the sourcing of our products.
Regulators, stockholders and other interested constituencies have focused increasingly on the environmental, social and governance practices of companies, which has resulted in new regulations that may impose costs on us and expose us to new risks. For example, Section 1502 of the Dodd-Frank Wall Street Reform and Consumer Protection Act, and its implementing SEC regulations, impose new supply chain diligence and disclosure requirements for certain manufacturers of products containing “conflict minerals” that originated in the Democratic Republic of the Congo or an adjoining country. Complying with these requirements will impose additional costs on us, including costs to determine the source of any conflict minerals used in our products, and we may face reputational challenges or the loss of customers if we are unable to verify the origins for any conflict minerals used in our products. In addition, these requirements could adversely affect the sourcing, availability and pricing of such minerals.
16
We may be subject to additional regulations in the future arising from the increased focus on environmental, social and governance responsibility. In addition, our customers may require us to implement environmental, social or governance responsibility procedures or standards before they will continue to do business with us.The occurrence of any of the foregoing could have a material adverse effect on the price of our shares and our business, financial condition and results of operations.
Our information technology infrastructure could be subject to service interruptions, data corruption, cyber-based attacks or network security breaches, which could result in the disruption of operations or the loss of data confidentiality.
We rely on information technology networks and systems, including the Internet, to process, transmit and store electronic information, and to manage or support a variety of business processes and activities, including procurement, manufacturing, distribution, invoicing and collection. These technology networks and systems may be susceptible to damage, disruptions or shutdowns due to failures during the process of upgrading or replacing software, databases or components, power outages, hardware failures or computer viruses. In addition, our efforts to avoid or mitigate the impact of cyber-based attacks and security breaches may not be successful in avoiding a material breach, which could result in unauthorized disclosure of confidential information or damage to our information technology networks and systems. If these information technology systems suffer severe damage, disruption or shutdown and business continuity plans do not effectively resolve the issues in a timely manner, our business, financial condition and results of operations could be materially adversely affected.
We may be subject to risks arising from changes in technology.
The supply chains in which we operate are subject to technological changes and changes in customer requirements. We may not successfully develop new or modified types of products or technologies that may be required by our customers in the future. Further, the development of new technologies by competitors that may compete with our technologies could reduce demand for our products and affect our financial performance. Should we not be able to maintain or enhance the competitive values of our products or develop and introduce new products or technologies successfully, or if new products or technologies fail to generate sufficient revenues to offset research and development costs, our business, financial condition and operating results could be materially adversely affected.
The markets we serve are highly competitive and some of our competitors may have superior resources. If we are unable to respond successfully to this competition, this could reduce our sales and operating margins.
We sell most of our products in highly fragmented and competitive markets. We believe that the principal elements of competition in our markets are:
the ability to meet customer specifications;
application expertise and design and engineering capabilities;
product quality and brand name;
timeliness of delivery;
price; and
quality of aftermarket sales and support.
In order to maintain and enhance our competitive position, we intend to continue investing in manufacturing quality, marketing, customer service and support and distribution networks. We may not have sufficient resources to continue to make these investments and we may not be able to maintain our competitive position. Our competitors may develop products that are superior to our products, develop methods of more efficiently and effectively providing products and services, or adapt more quickly than us to new technologies or evolving customer requirements. Some of our competitors may have greater financial, marketing and research and development resources than we have. As a result, those competitors may be better able to withstand the effects of periodic economic downturns. In addition, pricing pressures could cause us to lower the prices of some of our products to stay competitive. We may not be able to compete successfully with our existing competitors or with new competitors. If we fail to compete successfully, the failure may have a material adverse effect on our business, financial condition and results of operations.
Changes in our tax rates or exposure to additional income tax liabilities could adversely affect our financial results.
Our future effective income tax rates could be unfavorably affected by various factors including, among others, changes in the tax rates, rules and regulations in jurisdictions in which we generate income or the repatriation of income held in foreign jurisdictions. Our Cash and cash flow.equivalents as of December 31, 2013 includes $290.2 million held in jurisdictions outside the
17
U.S., which may be subject to tax penalties and other restrictions if repatriated into the U.S. In addition, the U.S. and foreign countries have considered changes to existing tax laws, including allowing existing provisions to expire, that could significantly impact the treatment of income earned outside the U.S. An increase in our effective tax rate could have a material adverse effect on our after-tax results of operations.
In addition, the amount of income taxes we pay is subject to ongoing audits by U.S. federal, state and local tax authorities and by non-U.S. tax authorities. If these audits result in assessments different from amounts recorded, our future financial results may include unfavorable tax adjustments.
Risks and Other Considerations Related to our Common Stock
The issuances of additional Common and Preferred stock or the resale of previously restricted Common stock may adversely affect the market price of Colfax Common stock.
In connection with the Charter Acquisition, we issued a total of 20,182,293 shares of Colfax Common stock to BDT CF Acquisition Vehicle, LLC (the “BDT Investor”), Mitchell P. Rales, Steven M. Rales and Markel Corporation (collectively, the “Investors”) and 13,877,552 shares of Colfax Series A Preferred Stock, which are initially convertible into an additional 12,173,291 shares of Colfax Common stock, to the BDT Investor. Pursuant to registration rights agreements we entered into with the Investors in January 2012, the Investors and their permitted transferees have registration rights for the resale of the shares of Colfax Common stock acquired as a result of the Charter Acquisition and, with respect to the BDT Investor, shares of Colfax Common stock issuable upon conversion of the Series A Preferred Stock. In April 2012, we filed a prospectus supplement under which the Investors may resell these shares. In addition, Mitchell P. Rales and Steven M. Rales have registration rights for the resale of certain shares of Colfax Common stock pursuant to a registration rights agreement entered into in 2003 and amended in 2013. These registration rights would facilitate the resale of such securities into the public market, and any such resale would increase the number of shares of Colfax Common stock available for public trading. For instance, in May 2013 the BDT Investor and certain of its permitted transferees sold 4,000,000 shares of Colfax Common stock to underwriters for public resale. Sales by the BDT Investor, Markel, Mitchell P. Rales or Steven M. Rales or their permitted transferees of a substantial number of shares of Colfax Common stock in the public market, or the perception that such sales might occur, could have a material adverse effect on the price of Colfax Common stock.
In March 2012 and May 2013, we sold 9,000,000 shares and 7,500,000 shares, respectively, of newly issued Common stock to underwriters for public resale pursuant to a shelf registration statement. Under our Amended and Restated Certificate of Incorporation, there are additional authorized shares of Colfax Common stock, which, if subsequently issued, could have a further dilutive effect on outstanding Colfax Common stock.
Our Amended and Restated Certificate of Incorporation contains provisions that grant the BDT Investor certain rights which may limit our flexibility in operating our business and structuring our corporate governance.
Under our Amended and Restated Certificate of Incorporation, so long as the BDT Investor and its permitted transferees beneficially own, in the aggregate, at least 50% of the Series A Preferred Stock issued to the BDT Investor under the securities purchase agreement with the BDT Investor (the “BDT Purchase Agreement”), the BDT Investor's written consent is required in order for us to take certain corporate actions, including:
the incurrence of certain indebtedness (excluding certain permitted indebtedness) if the ratio of such indebtedness to EBITDA (as defined in the Deutsche Bank Credit Agreement) exceeds certain specified ratios, measured by reference to the last twelve-month period for which financial information is reported by Colfax (pro forma for acquisitions during such period);
the issuance of any shares of preferred stock;
any change to our dividend policy or the declaration or payment of any dividend or distribution on any of our stock ranking subordinate or junior to the Series A Preferred Stock with respect to the payment of dividends and distributions (including the Colfax Common stock) under certain circumstances;
any voluntary liquidation, dissolution or winding up of Colfax;
any change in our independent auditor;
the election of anyone other than Mr. Mitchell P. Rales as Chairman of our Board of Directors;
any acquisition of another entity or assets for a purchase price exceeding 30% of our equity market capitalization;
18
any merger, consolidation, reclassification, joint venture or strategic partnership or similar transaction, or any disposition of any assets (excluding sale/leaseback transactions and other financing transactions in the ordinary course of business) of Colfax if the value of the resulting entity, level of investment by Colfax or value of the assets disposed, as applicable, exceeds 30% of our equity market capitalization;
any amendments to our organizational or governing documents, including the Amended and Restated Certificate of Incorporation and the Amended and Restated Bylaws; and
any change in the size of our Board of Directors.
As of February 3, 2014, the BDT Investor owned 100% of the Series A Convertible Preferred Stock issued under the BDT Purchase Agreement.
Our Amended and Restated Certificate of Incorporation also provides that, so long as the BDT Investor and certain permitted transferees beneficially own at least 10% of the Colfax Common stock (on a fully-diluted basis), the BDT Investor's written consent is required to alter, amend or repeal the provisions of our Amended and Restated Certificate of Incorporation which set forth the authorized number of members of our Board and the BDT Investor's nomination rights in respect of members of our Board. As of February 3, 2014, the BDT Investor beneficially owned more than 10% of Colfax Common stock (on a fully diluted basis). The above factors could limit our financial and operational flexibility, and as a result could have a material adverse effect on our business, financial condition and results of operations.
The BDT Investor may exercise significant influence over us, including through its ability to elect up to two members of our Board of Directors.
The shares of Colfax Common stock and Series A Preferred Stock beneficially owned by the BDT Investor represent approximately 14% of the voting rights in respect of the Company's issued share capital as of February 3, 2014. In addition, our Amended and Restated Certificate of Incorporation provides that the BDT Investor's consent is required before we may take certain actions for so long as the BDT Investor and its permitted transferees beneficially own in the aggregate at least 50% of the Series A Preferred Stock issued pursuant to the BDT Purchase Agreement (as discussed above). As a result, the BDT Investor may have the ability to significantly influence the outcome of any matter submitted for the vote of our stockholders. The BDT Investor may have interests that diverge from, or even conflict with, those of Colfax and our other stockholders.
The Amended and Restated Certificate of Incorporation also provides that the BDT Investor will have the right to exclusively nominate (1) two out of eleven directors to our Board of Directors so long as the BDT Investor holds at least 20% of the outstanding Colfax Common stock (calculated on a fully diluted basis, assuming conversion of the Series A Preferred Stock at the then-existing conversion price), with one of its nominees to serve on the Audit Committee of our Board of Directors and one of its nominees to serve on the Compensation Committee of our Board of Directors, and (2) one out of ten directors to our Board of Directors so long as the BDT Investor and its permitted transferees beneficially own in the aggregate less than 20% but more than 10% of the outstanding Colfax Common stock (calculated on a fully diluted basis, assuming conversion of the Series A Preferred Stock at the then-existing conversion price), with such nominee to serve on the Audit Committee and the Compensation Committee of our Board of Directors. Further, so long as the BDT Investor and certain permitted transferees beneficially own at least 10% of the Colfax Common stock (calculated on a fully diluted basis, assuming conversion of the Series A Preferred Stock at the then-existing conversion price), the BDT Investor’s written consent is required to alter, amend or repeal the provisions of the Amended and Restated Certificate of Incorporation which set forth the authorized number of members of our Board and the BDT Investor’s nomination rights in respect of members of our Board.
In addition, the percentage of Colfax Common stock owned by the BDT Investor, Mitchell P. Rales and Steven M. Rales and the governance rights of the BDT Investor could discourage a third party from proposing a change of control or other strategic transaction concerning Colfax.
Provisions in our governing documents and Delaware law may delay or prevent an acquisition of Colfax, which could decrease the value of its shares.
Our Amended and Restated Certificate of Incorporation, Amended and Restated Bylaws, and Delaware law contain provisions that may make it difficult for a third party to acquire us without the consent of our Board of Directors. These include provisions prohibiting stockholders from taking action by written consent, prohibiting special meetings of stockholders called by stockholders and prohibiting stockholder nominations and approvals without complying with specific advance notice requirements. In addition, our Board of Directors has the right to issue Preferred stock without stockholder approval, which our Board of Directors could
19
use to effect a rights plan or “poison pill” that could dilute the stock ownership of a potential hostile acquirer and may have the effect of delaying, discouraging or preventing an acquisition of Colfax. Delaware law also imposes some restrictions on mergers and other business combinations between Colfax and any holder of 15% or more of its outstanding voting stock.
Item 1B. Unresolved Staff Comments
None.
Item 2. Properties
Item 3. Legal Proceedings
Discussion of legal matters is incorporated by reference to Part II, Item 8, Note 18,15, “Commitments and Contingencies,” in the Notes to the Consolidated Financial Statements.
Item 4. Mine Safety Disclosures
None.
EXECUTIVE OFFICERS OF THE REGISTRANT
Set forth below are the names, ages, positions and experience of our executive officers. All of our executive officers hold office at the pleasure of our Board of Directors.
| Name | Age | Position | |||
| President and Chief Executive Officer and Director, | |||||
| C. Scott Brannan | Senior Vice President, Finance, Chief Financial Officer and Treasurer | ||||
| Clay H. Kiefaber | 58 | Executive Vice President, Chief Executive Officer, ESAB Global and Director, Colfax Corporation | |||
| Daniel A. Pryor | |||||
| Ian Brander | 52 | Chief Executive Officer, Howden | |||
| Lynn Clark | 56 | Senior Vice President, Global Human Resources | |||
| A. Lynne Puckett | Senior Vice President, General Counsel and Secretary | ||||
| Stephen J. Wittig | 51 | Senior Vice President, Colfax Business System and Supply Chain Strategy | |||
Steven E. SimmsClay H. Kiefaber became President‚ Chief Executive Officer in January 2010. Mr. Kiefaber has served on the Colfax Board of Directors since the Company's IPO in 2008. Before joining Colfax asbeen President and Chief Executive Officer in 2010‚ he spent nearly 20 years in increasingly senior executive positions at Masco Corporation. Most recently‚ he wassince April 2012. He has served as a Group President‚ where he was responsible forDirector of Colfax since July 2011. Mr. Simms also served as Chairman of the Board of Directors of Apex Tools and is a $2.8 billion group of architectural coatings‚ windows‚ and spa business units. Prior to becoming a Group President at Masco‚ Mr. Kiefaber was Groupformer Executive Vice President of Masco Builder Cabinet Group.Danaher Corporation. Mr. Simms held a variety of leadership roles during his 11-year career at Danaher. He previously spent 14 years in increasingly senior positions in Masco’s Merillat Industries subsidiary. Mr. Kiefaber holds an M.B.A. degree from the University of Colorado and a B.A. degree from Miami University.
20
C. Scott Brannan has been the Senior Vice President, Finance, Chief Financial Officer and Treasurer since October 2010. Mr. Brannan served on the Colfax Board of Directors and was Chairman of the Audit Committee from 2008 to September 2010. Prior to joining Colfax in his current role‚ he was a partner at Aronson & Company‚ a public accounting firm‚ from 2003 to 2010. He was also previously employed at Danaher Corporation for 12 years in roles of increasing responsibility‚ including Chief Accounting Officer‚ Controller and Vice President of Administration. Prior to Danaher‚Danaher Corporation‚ he spent 8 years with Arthur Andersen & Co. He holds bachelors and masters degrees in accounting from Loyola University Maryland and is a certified public accountant.
Clay H. Kiefaber is Executive Vice President‚ Chief Executive Officer ESAB Global and a Director of Colfax Corporation. Mr. Kiefaber has served on the Colfax Board of Directors since the Company’s IPO in 2008 and was previously the President and Chief Executive Officer of Colfax from January 2010 through April 2012. Before joining Colfax‚ he spent nearly 20 years in increasingly senior executive positions at Masco Corporation. Most recently‚ he was a Group President‚ where he was responsible for a $2.8 billion group of architectural coatings‚ windows‚ and spa business units. Prior to becoming a Group President at Masco, Mr. Kiefaber was Group Vice President of Masco Builder Cabinet Group. He previously spent 14 years in increasingly senior positions in Masco’s Merillat Industries subsidiary. Mr. Kiefaber holds an M.B.A. degree from the University of Colorado and a B.A. degree from Miami University.
Daniel A. Pryor has served as our SeniorExecutive Vice President‚ Strategy and Business Development since July 2013. Mr. Pryor was Senior Vice President, Strategy and Business Development from January 2011.2011 through July 2013. Prior to joining Colfax‚ he was a Partner and Managing Director with The Carlyle Group‚ a global alternative asset manager, where he focused on industrial leveraged buyouts and led numerous portfolio company and follow-on acquisitions. While at The Carlyle Group, he served on the boards of portfolio companies Veyance Technologies, Inc., John Maneely Co., and HD Supply Inc. Prior to Carlyle‚The Carlyle Group, he spent 11 years at Danaher Corporation in roles of increasing responsibility‚ most recently as Vice President –- Strategic Development. Mr. Pryor earned his MBAM.B.A. from Harvard Business School and his BAB.A. in Economics from Williams College.
Ian Brander has been the Chief Executive Officer of Howden since August 1, 2011. Prior to becoming Chief Executive Officer of Howden, he served as Operations Director beginning in 2008. His experience includes over 20 years at Howden in various roles in technical, project, commercial and general management positions associated with a wide range of products. He holds a Mechanical Engineering degree from the University of Strathclyde.
Lynn Clark has been the Senior Vice President, Global Human Resources since January 2013. Prior to joining Colfax, she served as senior vice president, global human resources for Mead Johnson Nutrition. Her experience includes extensive work at the board and operating levels, broad human resources leadership capabilities, talent management, organization design and development and M&A. Ms. Clark held roles of increasing responsibility at Bristol-Myers Squibb from 2001 to 2009, and was with Lucent Technologies and Allied Signal Corporation, leading executive development and then serving as human resources leader for headquarters functions between 1993 and 2001. Prior to transferring into human resources, she worked for 15 years in sales and marketing, most recently as a general manager for Drake Beam Morin - a global consulting firm in employee development, retention and transition - in Richmond, Virginia. Ms. Clark started her career as a career counselor at George Washington University in Washington, DC. Ms. Clark has a bachelor of science in education and a master of science in college student personnel from Bowling Green University in Ohio.
A. Lynne Puckett has served as our Senior Vice President, General Counsel and Secretary since September 2010. Prior to joining Colfax‚ she was a Partner with the law firm of Hogan Lovells U.S.US LLP from 1999 to 2010. Her experience includes a broad range of corporate and transactional matters‚ including mergers and acquisitions‚ venture capital financings‚ debt and equity offerings‚ and general corporate and securities law matters. Before entering the practice of law‚ Ms. Puckett worked for the U.S. Central Intelligence Agency and a major U.S. defense contractor. Ms. Puckett holds a J.D. from the University of Maryland School of Law and a B.S. degree from James Madison University.
Stephen J. Wittig has been the Senior Vice President, Colfax Business System and Supply Chain Strategy since August 2011. Prior to joining Colfax, he was the Vice President of Lean Manufacturing and Six Sigma for the Masco Cabinet Group of Masco Corporation. His experience includes over 20 years of experience in engineering, manufacturing, logistics and supply chain management and held a number of operations positions with Lear Corporation, Preferred Technical Group, Sumitomo Electric and United Technologies. He has also been a member of the adjunct faculty in the School of Management with the University of Michigan where he taught a number of operations management courses. Mr. Wittig is a Six Sigma Master Black Belt with a certification from the Juran Institute. He holds his M.S. in Engineering from the University of Michigan and his B.S. in Industrial Engineering from Kettering University (formerly General Motors Institute).
21
PART II
Item 5. Market for the Registrant’s Common Equity, Related Stockholder Matters and Issuer Purchases of Equity Securities
Our commonCommon stock began trading on the New York Stock Exchange under the symbol CFX on May 8, 2008. As of January 31, 2011,February 3, 2014, there were approximately 4,99623,381 holders of record of our commonCommon stock. The high and low sales prices per share of our commonCommon stock, as reported on the New York Stock Exchange, for the fiscal periods presented are as follows:
| 2010 | 2009 | |||||||||||||||
| High | Low | High | Low | |||||||||||||
| First Quarter | $ | 12.46 | $ | 10.44 | $ | 13.22 | $ | 5.33 | ||||||||
| Second Quarter | $ | 13.97 | $ | 10.00 | $ | 9.48 | $ | 6.05 | ||||||||
| Third Quarter | $ | 15.17 | $ | 10.17 | $ | 12.66 | $ | 7.21 | ||||||||
| Fourth Quarter | $ | 19.04 | $ | 14.46 | $ | 13.91 | $ | 10.22 | ||||||||
| Year Ended December 31, | ||||||||||||||||
| 2013 | 2012 | |||||||||||||||
| High | Low | High | Low | |||||||||||||
| First Quarter | $ | 48.82 | $ | 40.29 | $ | 37.64 | $ | 27.61 | ||||||||
| Second Quarter | $ | 53.65 | $ | 42.22 | $ | 35.56 | $ | 26.01 | ||||||||
| Third Quarter | $ | 57.49 | $ | 50.13 | $ | 36.79 | $ | 24.43 | ||||||||
| Fourth Quarter | $ | 64.37 | $ | 54.53 | $ | 40.52 | $ | 33.14 | ||||||||
We have not paid any dividends on our commonCommon stock since inception, and we do not anticipate the declaration or payment of dividends at any time in the foreseeable future. Our credit agreementThe Deutsche Bank Credit Agreement (as defined and further discussed in Item 7. “Management’s Discussion and Analysis of Financial Condition and Results of Operations—Liquidity and Capital Resources”) limits the amount of cash dividends and commonCommon stock repurchases the Company may make to a total of $10$50 million annually.
Performance Graph
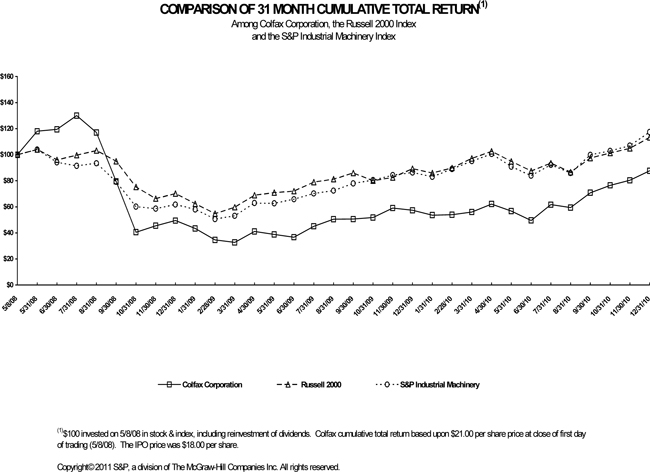

22
Issuer Purchase of Equity Securities
2013, 2012 or 2011.
| Year ended December 31, | ||||||||||||||||||||
| 2010 | 2009 | 2008 | 2007 | 2006 | ||||||||||||||||
| Statement of Operations Data: | ||||||||||||||||||||
| Net sales | $ | 541,987 | $ | 525,024 | $ | 604,854 | $ | 506,305 | $ | 393,604 | ||||||||||
| Cost of sales | 350,579 | 339,237 | 387,667 | 330,714 | 256,806 | |||||||||||||||
| Gross profit | 191,408 | 185,787 | 217,187 | 175,591 | 136,798 | |||||||||||||||
| Selling, general and administrative expenses | 119,426 | 112,503 | 124,105 | 97,426 | 78,964 | |||||||||||||||
| Restructuring and other related charges | 10,323 | 18,175 | - | - | - | |||||||||||||||
| Initial public offering-related costs | - | - | 57,017 | - | - | |||||||||||||||
| Research and development expenses | 6,205 | 5,930 | 5,856 | 4,162 | 3,336 | |||||||||||||||
| Asbestos liability and defense costs (income) | 7,876 | (2,193 | ) | (4,771 | ) | (63,978 | ) | 21,783 | ||||||||||||
| Asbestos coverage litigation expenses | 13,206 | 11,742 | 17,162 | 13,632 | 12,033 | |||||||||||||||
| Operating income | 34,372 | 39,630 | 17,818 | 124,349 | 20,682 | |||||||||||||||
| Interest expense | 6,684 | 7,212 | 11,822 | 19,246 | 14,186 | |||||||||||||||
| Provision for income taxes | 11,473 | 8,621 | 5,465 | 39,457 | 4,298 | |||||||||||||||
| Income from continuing operations | 16,215 | 23,797 | 531 | 65,646 | 2,198 | |||||||||||||||
Net income (1) | $ | 16,215 | $ | 23,797 | $ | 531 | $ | 65,646 | $ | 801 | ||||||||||
| Net income (loss) per share from continuing operations -- basic and diluted | $ | 0.37 | $ | 0.55 | $ | (0.08 | ) | $ | 1.82 | $ | 0.10 | |||||||||
| Year Ended and As of December 31, | ||||||||||||||||||||
2013(1) | 2012(2) | 2011(3) | 2010(4) | 2009(5) | ||||||||||||||||
| (In thousands, except per share data) | ||||||||||||||||||||
| Statement of Operations Data: | ||||||||||||||||||||
| Net sales | $ | 4,207,209 | $ | 3,913,856 | $ | 693,392 | $ | 541,987 | $ | 525,024 | ||||||||||
| Cost of sales | 2,900,987 | 2,761,731 | 453,293 | 350,579 | 339,237 | |||||||||||||||
| Gross profit | 1,306,222 | 1,152,125 | 240,099 | 191,408 | 185,787 | |||||||||||||||
| Selling, general and administrative expense | 860,994 | 895,452 | 162,761 | 133,507 | 116,240 | |||||||||||||||
| Charter acquisition-related expense | — | 43,617 | 31,052 | — | — | |||||||||||||||
| Restructuring and other related charges | 35,502 | 60,060 | 9,680 | 10,323 | 18,175 | |||||||||||||||
| Asbestos coverage litigation expense | 3,334 | 12,987 | 10,700 | 13,206 | 11,742 | |||||||||||||||
| Operating income | 406,392 | 140,009 | 25,906 | 34,372 | 39,630 | |||||||||||||||
| Interest expense | 103,597 | 91,570 | 5,919 | 6,684 | 7,212 | |||||||||||||||
| Provision for income taxes | 93,652 | 90,703 | 15,432 | 11,473 | 8,621 | |||||||||||||||
| Net income (loss) | 209,143 | (42,264 | ) | 4,555 | 16,215 | 23,797 | ||||||||||||||
| Less: income attributable to noncontrolling interest, net of taxes | 30,515 | 22,138 | — | — | — | |||||||||||||||
| Dividends on preferred stock | 20,396 | 18,951 | — | — | — | |||||||||||||||
| Net income (loss) available to Colfax Corporation common shareholders | $ | 158,232 | $ | (83,353 | ) | $ | 4,555 | $ | 16,215 | $ | 23,797 | |||||||||
| Net income (loss) per share—basic | $ | 1.56 | $ | (0.92 | ) | $ | 0.10 | $ | 0.37 | $ | 0.55 | |||||||||
| Net income (loss) per share—diluted | $ | 1.54 | $ | (0.92 | ) | $ | 0.10 | $ | 0.37 | $ | 0.55 | |||||||||
| Balance Sheet Data: | ||||||||||||||||||||
| Cash and cash equivalents | $ | 311,301 | $ | 482,449 | $ | 75,108 | $ | 60,542 | $ | 49,963 | ||||||||||
| Goodwill and Intangible assets, net | 3,217,075 | 2,853,279 | 245,873 | 200,636 | 175,370 | |||||||||||||||
| Total assets | 6,582,853 | 6,129,727 | 1,088,543 | 1,022,077 | 1,006,301 | |||||||||||||||
| Total debt, including current portion | 1,487,091 | 1,728,311 | 111,518 | 82,500 | 91,485 | |||||||||||||||
| December 31, | ||||||||||||||||||||
| 2010 | 2009 | 2008 | 2007 | 2006 | ||||||||||||||||
| Balance Sheet Data: | ||||||||||||||||||||
| Cash and cash equivalents | $ | 60,542 | $ | 49,963 | $ | 28,762 | $ | 48,093 | $ | 7,608 | ||||||||||
| Goodwill and intangibles, net | 200,636 | 175,370 | 175,210 | 181,517 | 150,395 | |||||||||||||||
| Asbestos insurance asset, including current portion | 374,351 | 389,449 | 304,015 | 305,228 | 297,106 | |||||||||||||||
| Total assets | 1,022,077 | 1,006,301 | 907,550 | 899,522 | 792,018 | |||||||||||||||
| Asbestos liability, including current portion | 429,651 | 443,769 | 357,258 | 376,233 | 388,920 | |||||||||||||||
Total debt, including current portion (2) | 82,500 | 91,485 | 97,121 | 206,493 | 188,720 | |||||||||||||||
(1) | During 2013, we completed the acquisitions of |
(2) | During 2012, we completed the |
(3) | During 2011, we completed the acquisitions of Rosscor and COT-Puritech in February and December, respectively. See Part I, Item 1. “Business” and Note 4, “Acquisitions” in the accompanying Notes to Consolidated Financial Statements in this Form 10-K for additional information. |
(4) | In August 2010, we acquired Baric. |
(5) | In August 2009, we acquired PD Technik for $1.3 million, net of cash acquired. |
Item 7. Management’s Discussion and Analysis of Financial Condition and Results of Operations
Management’s Discussion and Analysis of Financial Condition and Results of Operations (MD&A)(“MD&A”) is designed to provide a reader of the Company’sour financial statements with a narrative from the perspective of CompanyCompany’s management. The Company’sThis MD&A is divided into four main sections:
▪Overview
▪Liquidity and Capital Resources
▪Critical Accounting Policies
The following discussion of our financial condition and results of operationsMD&A should be read together with Item 6. “Selected Financial and Data,”Data”, Part I, Item 1A. “Risk Factors” and the financial statementsaccompanying Consolidated Financial Statements and related notesNotes to Consolidated Financial Statements included elsewhere in this Form 10-K. The following discussionMD&A includes forward-looking statements. For a discussion of important factors that could cause actual results to differ materially from the results referred to in thethese forward-looking statements, see “Special Note Regarding Forward-Looking Statements.”
Overview
Gas & Fluid Handling - a global supplier of a broad range of fluid handlinggas- and fluid-handling products, including pumps, fluid handlingfluid-handling systems and controls, specialty valves, heavy-duty centrifugal and specialty valves. We believe that weaxial fans, rotary heat exchangers and gas compressors, which serves customers in the power generation, oil, gas and petrochemical, mining, marine (including defense) and general industrial and other end markets; and
Fabrication Technology -a global supplier of welding equipment and consumables, cutting equipment and consumables and automated welding and cutting systems.
Certain amounts not allocated to the two reportable segments and intersegment eliminations are a leading manufacturer of rotary positive displacement pumps, which include screw pumps, gear pumps and progressive cavity pumps. We design and engineer our products to high quality and reliability standards for use in critical fluid handling applications where performance is paramount. We also offer customized fluid handling solutions to meet individual customer needs based on our in-depth technical knowledge of the applications in which our products are used.
Colfax has a global manufacturinggeographic footprint, with production facilities in Europe, North America, South America, Asia, Australia and Asia, as well as worldwide sales and distribution channels.
consistent basis.
Outlook
We believe that we are well positioned to grow our businessbusinesses organically over the long term by enhancing our product offerings and expanding our customer base in our strategic markets. As a late cyclebase. Our business we beganmix is expected to recover from the global economic downturn midway through 2010. This recovery was evidenced by increases in both salesbe well balanced between long- and orders in the third and fourth quarters of 2010 over the comparable 2009 quarters. Nonetheless, project delivery push-outs as well as order cancellations may continue in 2011. We will continue to monitor general global economic conditions and expect the following market conditions:
We will also continue to target aftermarketface a number of challenges and opportunities, in our strategic markets as we generally are able to generate higher margins on aftermarket partsincluding the successful integration of new acquisitions, application and service than on foremarket opportunities. For the year ended December 31, 2010, aftermarket sales and services represented approximately 24%expansion of our revenues.CBS tools to improve margins and working capital management, rationalization of assets and back office functions, and consolidation of manufacturing facilities.
24
We also expect to continue to grow as a result of strategic acquisitions. We believe that the extensive experience of our leadership team in acquiring and effectively integrating acquisition targets should enable us to capitalize on opportunities in the future.
Results of Operations
The following discussion of our resultsResults of operations that follows focuses on someOperations addresses the comparison of the key financial measures that we use to evaluate our business. We evaluate our business using several measures, including net sales, orders and order backlog. Our sales, orders and backlog are affected by many factors, particularlyperiods presented. The Company’s management evaluates the impact of acquisitions, the impact of fluctuating foreign exchange rates and change from our existing businesses which may be driven by market conditions and other factors. To facilitate the comparison between reporting periods, we describe the impactoperating results of each of these three factors, to the extent they impact the periods presented, on ourits reportable segments based upon Net sales orders and backlog in tabular format under the heading “Salessegment operating income (loss), which represents Operating income before Restructuring and Orders.”other related charges.
Items Affecting the Comparability of Our Reported Results
Our financial performance and growth are driven by many factors, principally our ability to serve increasingly global markets, fluctuations in the relationship of foreign currencies to the U.S. dollar, the general economic conditions, within our five strategic markets, the global economy and capital spending levels, the availability of capital, our estimates concerning the availability of insurance proceeds to cover asbestos litigation expensesexpense and liabilities, the amountsamount of asbestos liabilities and litigation expenses,expense, the impact of restructuring initiatives, our ability to pass through cost increases on through pricing, the impact of sales mix, and our ability to continue to grow through acquisitions. These key factors have impacted our results of operations in the past and are likely to affect them in the future.
Global Operations
Our products and services are available worldwide. The manner in which our products and services are sold differs by region. Most of our sales in non-U.S. markets are made by subsidiaries located outside the United States, though we also sell into non-U.S. markets through various representatives and distributors and directly from the U.S. In countries with low sales volumes, we generally sell through representatives and distributors. For the year ended December 31, 2010,During 2013, approximately 75%82% of our sales were shipped to locations outside of the U.S. Accordingly, we are affected by levels of industrial activity and economic and political factors in countries throughout the world. Our ability to grow and our financial performance will be affected by our ability to address a variety of challenges and opportunities that are a consequence of our global operations, including efficiently utilizing our global sales, manufacturing and distribution capabilities, the expansion of market opportunities in Asia, successfully completing global strategic acquisitions and engineering innovative new product applications for end users in a variety of geographic markets. However, we believe that our geographic, end market and product diversification may limit the impact that any one country or economy could have on our consolidated results.
Foreign Currency Fluctuations
A significant portion of our Net sales, approximately 66%80% for the year ended December 31, 2010, are2013 is derived from operations outside the U.S., with the majority of those sales denominated in currencies other than the U.S. dollar, especially the Euro.dollar. Because much of our manufacturing and employee costs are outside the U.S., a significant portion of our costs are also denominated in currencies other than the U.S. dollar. Changes in foreign exchange rates can impact our results of operations and are quantified when significant to our discussion.
Venezuela devalued its currency related to the U.S. dollar numerous times, and may do so again in our discussionthe future. We consider the Venezuelan bolivar fuerte a highly inflationary currency under GAAP. Additionally, during the first quarter of 2014, Argentina devalued its currency relative to the U.S. dollar, which has resulted in the Argentine peso to also be considered a highly inflationary currency under GAAP. We expect to be subject to foreign currency translation losses during the first quarter of 2014 as a result of the devaluation of the Argentine peso. We may be subject to additional foreign currency translation losses depending upon whether Venezuela further devalues the bolivar, movements in exchange rates between these highly inflationary currencies and the parents’ reporting currency and the amount of monetary assets and liabilities included in the balance sheets of our operations.operations denominated in currencies considered to be highly inflationary.
Economic Conditions
Seasonality
As our gas- and fluid-handling customers seek to fully utilize capital spending budgets before the end of the year, historically our shipments have peaked during the fourth quarter. Also, all of our European operations typically experience a slowdown during the July and August and December holiday season. General economic conditions may, however, impact future seasonal variations.
25
Pricing
We believe our customers place a premium on quality, reliability, availability, design and application engineering support. Our highly engineered fluid handlinggas- and fluid-handling products typically have higher margins than products with commodity-like qualities. However, we are sensitive to price movements in our raw materials supply base. Our largest material purchases are for components and raw materials consisting ofincluding steel, iron, copper and aluminum. Historically, we have been generally successful in passing raw material price increases on to our customers. While we seek to take actions to manage this risk, including commodity hedging where appropriate, such increased costs may adversely impact earnings.
Sales and Cost Mix
Our profit margins vary in relation to the relative mix of many factors, including the type of product, the geographic location in which the product is manufactured, the end market for which the product is designed, and the percentage of total revenue represented by consumables and aftermarket sales and services. AftermarketConsumables are generally sold at lower margins in comparison to our foremarket products and equipment, whereas our aftermarket business, including spare parts and other value added services, is generally a higher margin businessbusiness. Beginning in 2012, our mix of consumables and is a significant component of our profitability.aftermarket products and services was significantly impacted by the Charter Acquisition.
The mix of sales was as follows for the periods presented:
| Year Ended December 31, | |||||||||
| 2013 | 2012 | 2011 | |||||||
| Foremarket and equipment | 47 | % | 45 | % | 78 | % | |||
| Aftermarket and consumables | 53 | % | 55 | % | 22 | % | |||
Strategic Acquisitions
We complement our organic growth with strategic acquisitions. Acquisitions can significantly affect our reported results and can complicate period to period comparisons of results. As a consequence, we report the change in our Net sales between periods both from existing and acquired businesses. We intendOrders and order backlog are presented only for the gas- and fluid-handling segment, where this information is relevant. The change in Net sales due to continueacquisitions represents the change in sales due to pursuethe following acquisitions:
On January 13, 2012, Colfax completed the Charter Acquisition for a total purchase price of approximately $2.6 billion. Charter is a global industrial manufacturing company focused on welding, cutting and automation and air and gas handling. The impact of the additional 12 days of operations is included in the change in Net sales due to acquisitions, of complementary businesses that will broaden our product portfolio, expand our geographic footprint or enhance our position within our strategic markets.in 2013.
Gas and Fluid Handling
On August 19, 2010, weFebruary 14, 2011, Colfax completed the acquisition of Baric Group (“Baric”),Rosscor for $22.3 million, net of cash acquired. Rosscor is a supplier of multiphase pumping technology and certain other highly engineered fluid handlingfluid-handling systems, primarily for lubrication applications, with its primary operations based in Blyth, United Kingdom.Hengelo, The Netherlands.
On August 31, 2009, weMarch 28, 2011, Howden completed the acquisition of PD-Technik Ingenieurbüro GmbHThomassen Compression Systems BV (“PD-Technik”Thomassen”), a providerleading supplier of marine aftermarket related productshigh-powered engineered compressors to the oil, gas and services located in Hamburg, Germany. Thepetrochemical end market, for approximately €100 million.
On December 6, 2011, Colfax completed the acquisition of PD-Technik supports our marine aftermarket growth initiatives, broadening our served market as well as service capabilities.COT-Puritech for a total purchase price, net of cash acquired, of $39.4 million which includes the fair value of estimated additional contingent cash payments of $4.3 million at the acquisition date. The additional contingent cash payments are to be paid over two years from the acquisition date subject to the achievement of certain performance goals. COT-Puritech is a national supplier of oil flushing and remediation services to power generation plants, refinery and petrochemical operations and other manufacturing sites, with its primary operations based in Canton, Ohio.
26
On July 9, 2013, Colfax completed the acquisition of the common stock of Clarus for $13.2 million, which includes the years endedfair value of an estimated additional contingent cash payment of $2.5 million at the acquisition date. The additional contingent payment will be paid during the year ending December 31, 2010 and 2009,2016 subject to the achievement of certain performance goals. Clarus is a domestic supplier of flushing services for marine applications primarily to U.S. government agencies, with primary operations based in Bellingham, Washington.
On September 30, 2013, the Company recorded pre-tax restructuringcompleted the acquisitions of TLT-Babcock and other related costsAlphair for an aggregate purchase price of $10.3$55.7 million. TLT-Babcock and Alphair are suppliers of heavy duty and industrial fans in Akron, Ohio and Winnepeg, Ontario, respectively.
On November 1, 2013, the Company completed the acquisition of ČKDK for $69.4 million, and $18.2 million, respectively. The costs incurred inincluding the year ended December 31, 2010 include $2.2 millionassumption of termination benefits, including $0.6 milliondebt. ČKDK is a leading supplier of non-cash stock-based compensation expense, relatedmulti-stage centrifugal compressors to the departureoil & gas, petrochemical, power and steel industries, based in Prague, Czech Republic.
On November 25, 2013, the Company increased its ownership of the Company’s former President and Chief Executive Officer in January of 2010. Additionally, the costs incurred in the year ended December 31, 2010 include $1.3 million of termination benefits related to the October 2010 departures of the Company’s former Chief Financial Officer and General Counsel. The costs incurred in the year ended December 31, 2009 includeSicelub, previously a $0.6 million non-cash asset impairment charge related to closure of a repair facility.
On November 29, 2013, the Company completed the acquisition of GII for participating associates. We realized savings$246.0 million, including the assumption of debt, subject to certain adjustments. GII has operations around the world and will expand the Company’s product offerings in the heavy duty industrial and cooling fan market.
Fabrication Technology
On March 3, 2011, ESAB completed the acquisition of LLC Sychevsky Electrodny Zavod (“Sychevsky”), a leading Russian electrode manufacturer based in the Smolensk region for $19.2 million.
On July 1, 2011, ESAB acquired 60% of Condor Equipamentos Industriais Ltda (“Condor”), a leading Brazilian manufacturer of gas apparatus used in welding applications, for cash consideration of R$25.2 million.
In May 2012, Colfax acquired the remaining 83.7% of Sibes not already owned by its ESAB business for $8.5 million, including the assumption of debt. Sibes is a leading supplier of welding electrodes to customers in Eastern Russia and strengthens ESAB’s position in the attractive Russian welding consumables market, particularly in the energy and natural resources end markets.
On October 31, 2012, Colfax completed the acquisition of approximately $2591% of the outstanding common and investment shares of Soldex for $187.2 million. Soldex is organized under the laws of Peru and complements our existing fabrication technology segment by supplying welding products from its plants in Colombia and Peru. On August 5, 2013, Colfax completed a $14.9 million tender offer for common and investment shares of Soldex resulting in 2010an increase in our ownership of the subsidiary from the restructuring initiatives implemented in 2009 and 2010, primarily reflecting lower employee costs.approximately 91% to 99%.
27
| Year ended December 31, | ||||||||||||
| (Amounts in millions) | 2010 | 2009 | 2008 | |||||||||
| Asbestos liability and defense costs (income) | $ | 7.9 | $ | (2.2 | ) | $ | (4.8 | ) | ||||
| Net Sales | Orders(1) | Backlog at Period End | ||||||||||||||||||
| $ | % | $ | % | $ | % | |||||||||||||||
| (In millions) | ||||||||||||||||||||
| As of and for the year ended December 31, 2012 | $ | 3,913.9 | $ | 1,996.0 | $ | 1,431.5 | ||||||||||||||
| Components of Change: | ||||||||||||||||||||
Existing businesses(2) | 107.5 | 2.7 | % | (15.3 | ) | (0.8 | )% | (58.6 | ) | (4.1 | )% | |||||||||
Acquisitions(3) | 246.9 | 6.3 | % | 96.4 | 4.8 | % | 231.2 | 16.2 | % | |||||||||||
Foreign currency translation(4) | (61.1 | ) | (1.5 | )% | (15.7 | ) | (0.7 | )% | (26.7 | ) | (1.9 | )% | ||||||||
| 293.3 | 7.5 | % | 65.4 | 3.3 | % | 145.9 | 10.2 | % | ||||||||||||
| As of and for the year ended December 31, 2013 | $ | 4,207.2 | $ | 2,061.4 | $ | 1,577.4 | ||||||||||||||
(1) Represents contracts for products or services, net of cancellations for the year ended December 31, 2010 compared to income of $2.2 millionperiod, for the year ended December 31, 2009. The increase in asbestos liabilityour gas- and defense costs was primarily attributable to a net pre-tax gain of $7.8 million recorded in 2009, comprised of a $19.4 million gain to increase the insurance asset as a result of favorable court rulings in October and December of 2009 concerning allocation methodology, partially offset by an $11.6 million charge to increase asbestos-related liabilities by $111.3 million, offset by an increase to expected insurance recoveries of $99.7 million arising from a revision to our 15-year estimate of asbestos-related liabilities. Additionally, the Company recorded charges totaling $4.0 million in the third and fourth quarters of 2010 as a result of developments in the litigation, which was partially offset by a $0.7 million gain resulting from a settlement received from an insolvent carrier.fluid-handling operating segment.
| Year ended December 31, | ||||||||||||
| (Amounts in millions) | 2010 | 2009 | 2008 | |||||||||
| Asbestos coverage litigation expenses | $ | 13.2 | $ | 11.7 | $ | 17.2 | ||||||
product mix and volume.
(4) Represents the difference between prior year sales and orders valued at the end of a period. The components of orderactual prior year foreign exchange rates and backlog growth (decline) are presented on the same basis as sales growth (decline).
| Backlog at | ||||||||||||||||||||||||
| (Amounts in millions) | Sales | Orders | Period End | |||||||||||||||||||||
| $ | % | $ | % | $ | % | |||||||||||||||||||
| Year ended December 31, 2008 | $ | 604.9 | $ | 682.1 | $ | 349.0 | ||||||||||||||||||
| Components of Change: | ||||||||||||||||||||||||
| Existing Businesses | (48.8 | ) | (8.1 | )% | (198.0 | ) | (29.0 | )% | (66.8 | ) | (19.1 | )% | ||||||||||||
| Acquisitions | 1.0 | 0.2 | % | 1.4 | 0.2 | % | 0.7 | 0.2 | % | |||||||||||||||
| Foreign Currency Translation | (32.1 | ) | (5.3 | )% | (23.1 | ) | (3.4 | )% | 8.0 | 2.3 | % | |||||||||||||
| Total | (79.9 | ) | (13.2 | )% | (219.7 | ) | (32.2 | )% | (58.1 | ) | (16.6 | )% | ||||||||||||
| Year ended December 31, 2009 | $ | 525.0 | $ | 462.4 | $ | 290.9 | ||||||||||||||||||
| Components of Change: | ||||||||||||||||||||||||
| Existing Businesses | 16.1 | 3.1 | % | 71.1 | 15.4 | % | (6.6 | ) | (2.3 | )% | ||||||||||||||
| Acquisitions | 10.0 | 1.9 | % | 6.1 | 1.3 | % | 38.7 | 13.3 | % | |||||||||||||||
| Foreign Currency Translation | (9.1 | ) | (1.7 | )% | (6.8 | ) | (1.5 | )% | (9.5 | ) | (3.3 | )% | ||||||||||||
| Total | 17.0 | 3.2 | % | 70.4 | 15.2 | % | 22.6 | 7.8 | % | |||||||||||||||
| Year ended December 31, 2010 | $ | 542.0 | $ | 532.8 | $ | 313.5 | ||||||||||||||||||
| Year ended December 31, | ||||||||||||
| (Amounts in millions) | 2010 | 2009 | 2008 | |||||||||
| Net Sales by Product: | ||||||||||||
| Pumps, including aftermarket parts and service | $ | 444.9 | $ | 443.1 | $ | 529.3 | ||||||
| Systems, including installation service | 78.6 | 69.3 | 58.2 | |||||||||
| Valves | 14.6 | 10.1 | 10.1 | |||||||||
| Other | 3.9 | 2.5 | 7.3 | |||||||||
| Total net sales | $ | 542.0 | $ | 525.0 | $ | 604.9 | ||||||
our fabrication technology segment. Orders, net of cancellations, from existing businesses for our gas- and fluid-handling segment decreased during 2013 in comparison to 2012 due to decreases in the year ended December 31, 2009 were down 29.0%oil, gas and petrochemical, mining and general industrial and other end markets, offset by increases in the power generation and marine end markets.
For 2012, our consolidated Net sales increased from proforma net sales of $3.8 billion in 2011 to $3.9 billion (which excludes operations acquired in the Charter Acquisition for the first 12 days of each annual period presented). The following tables present components of our proforma consolidated Net sales and, for our gas- and fluid-handling segment, proforma order and backlog growth:
| Net Sales | Orders(1) | Backlog at Period End | |||||||||||||||||||
| $ | % | $ | % | $ | % | ||||||||||||||||
| (In millions) | |||||||||||||||||||||
| Proforma as of and for the year ended December 31, 2011 | $ | 3,839.1 | $ | 1,924.6 | $ | 1,288.3 | |||||||||||||||
| Components of Change: | |||||||||||||||||||||
Existing businesses(2) | 202.2 | 5.3 | % | 54.0 | 2.8 | % | 117.5 | 9.1 | % | ||||||||||||
Acquisitions(3) | 86.5 | 2.2 | % | 100.4 | 5.2 | % | 9.4 | 0.7 | % | ||||||||||||
Foreign currency translation(4) | (213.9 | ) | (5.6 | )% | (83.0 | ) | (4.3 | )% | 16.3 | 1.3 | % | ||||||||||
| 74.8 | 1.9 | % | 71.4 | 3.7 | % | 143.2 | 11.1 | % | |||||||||||||
| As of and for the year ended December 31, 2012 | $ | 3,913.9 | $ | 1,996.0 | $ | 1,431.5 | |||||||||||||||
__________
(1) | Represents contracts for products or services, net of cancellations for the period, for our gas- and fluid-handling operating segment. |
(2) | Excludes the impact of foreign exchange rate fluctuations and acquisitions, thus providing a measure of growth due to factors such as price, product mix and volume. |
(3) | Represents the incremental sales, orders and order backlog as a result of acquisitions. |
(4) | Represents the difference between sales from existing businesses valued at current year foreign exchange rates and sales from existing businesses at prior year foreign exchange rates. |
28
The proforma increase in Net sales from existing businesses in 2012 was attributable to increases of $161.5 million and $40.7 million in our gas- and fluid-handling and fabrication technology segments, respectively. Orders, net of cancellations, from existing businesses for our gas- and fluid-handling segment increased during 2012 in comparison to 2011 primarily due to growth in the power generation and mining end markets.
Business Segments
As discussed further above, the Company reports results in two reportable segments: gas and fluid handling and fabrication technology. The following table summarizes Net sales by reportable segment for each of the following periods:
| Year Ended December 31, | |||||||||||
| 2013 | 2012 | Proforma 2011 | |||||||||
| (In millions) | |||||||||||
| Gas and Fluid Handling | $ | 2,104.0 | $ | 1,901.2 | $ | 1,757.1 | |||||
| Fabrication Technology | 2,103.2 | 2,012.7 | 2,082.0 | ||||||||
| Total Net sales | $ | 4,207.2 | $ | 3,913.9 | $ | 3,839.1 | |||||
The Net sales comparisons discussed above, for 2012 in comparison to 2011, are on a proforma basis (which excludes operations acquired in the Charter Acquisition for the first 12 days of each annual period presented). Further, cost information for Charter, ESAB and Howden is not available for 2011 under the presentation required by the Exchange Act and, as such, proforma discussions for 2012 in comparison to 2011 are limited to sales.
Gas and Fluid Handling
We design, manufacture, install and maintain gas- and fluid-handling products for use in a wide range of markets, including power generation, oil, gas and petrochemical, mining, marine (including defense) and general industrial and other. Our gas-handling products are principally marketed under the Howden brand name. Howden’s primary products are heavy-duty fans, rotary heat exchangers and compressors. The fans and heat exchangers are used in coal-fired and other types of power stations, both in combustion and emissions control applications, underground mines, steel sintering plants and other industrial facilities that require movement of large volumes of air in harsh applications. Howden’s compressors are mainly used in the oil, gas and petrochemical end market. Our fluid-handling products are marketed by Colfax Fluid Handling under a portfolio of brands including Allweiler and Imo. Colfax Fluid Handling is a supplier of a broad range of fluid-handling products, including pumps, fluid-handling systems and controls, and specialty valves.
The following table summarizes selected financial data for our gas- and fluid-handling segment:
| Year Ended December 31, | |||||||||||
| 2013 | 2012 | 2011 | |||||||||
| (Dollars in millions) | |||||||||||
| Net sales | $ | 2,104.0 | $ | 1,901.2 | $ | 693.4 | |||||
| Gross profit | 626.7 | 567.1 | 240.1 | ||||||||
| Gross profit margin | 29.8 | % | 29.8 | % | 34.6 | % | |||||
| Restructuring and other related charges | $ | 10.4 | $ | 8.7 | $ | 8.6 | |||||
| Selling, general and administrative expense | 352.6 | 412.6 | 142.7 | ||||||||
| Selling, general and administrative expense as a percentage of Net sales | 16.8 | % | 21.7 | % | 20.6 | % | |||||
| Asbestos coverage litigation expense | $ | 3.3 | $ | 13.0 | $ | 10.7 | |||||
| Segment operating income | 270.7 | 141.5 | 86.7 | ||||||||
| Segment operating income margin | 12.9 | % | 7.4 | % | 12.5 | % | |||||
The $138.1 million Net sales increase due to existing businesses, as discussed and defined under “Sales, Orders and Backlog” above, during 2013 in comparison to 2012 was primarily due to growth in the power generation, marine and general industrial and other end markets, partially offset by declines in the oil, gas and petrochemical and mining end markets. Additionally, Net sales increased by $83.9 million due to acquisition-related growth, including 12 additional days of activity in Howden, which was partially offset by a decrease of $19.2 million due to changes in foreign exchange rates. Gross profit increased during 2013 reflecting the impact of higher volumes. Gross profit margin remained consistent in 2013 with 2012 due to the positive impact of our strong
29
cost control activities offset by the lower margins on the sales associated with the entities acquired in 2013. Additionally, $4.5 million of acquisition-related amortization expense was reflected in Gross profit for 2012. Selling, general and administrative expense for 2013 decreased compared to 2012 primarily due to a significant declinedecrease of $56.6 million in demandacquisition-related amortization expense. Selling, general and administrative expense for 2013 was reduced by a $13.8 million gain to remeasure the Company’s equity investment in Sicelub to fair value upon increasing the Company’s ownership to 100%.
Year over year fluctuations for 2012 in comparison to 2011 for selected financial data are primarily due to the addition of the Howden operations. The $161.5 million sales growth due to existing businesses, as discussed and defined under “Sales, Orders and Backlog” above, during 2012 in comparison to 2011 was primarily due to growth in all end markets, except marine. Additionally, $56.6 million of acquisition-related amortization expense and $15.1 million increased recurring intangible amortization expense in comparison to 2011 is reflected in Selling, general and administrative expense for 2012.
Fabrication Technology
We formulate, develop, manufacture and supply consumable products and equipment for use in the commercial marine, oilcutting and gas, general industrialjoining of steels, aluminum and power generation end markets. We experienced commercial marine order cancellations of approximately $21.9 million duringother metals and metal alloys. Our fabrication technology products are principally marketed under the year ended December 31, 2009, asESAB brand name, which we believe is a resultleading international welding company with roots dating back to the invention of the economic downturn. Backlog ascovered welding electrode. ESAB’s comprehensive range of December 31, 2009,welding consumables includes electrodes, cored and solid wires and fluxes. ESAB’s fabrication technology equipment ranges from portable units to large custom systems. Products are sold into a wide range of $290.9 million decreased $58.1 million, or 16.6%, reflecting the decline in orders during the year.end markets, including wind power, shipbuilding, pipelines, mobile/off-highway equipment and mining.
The following table presentssummarizes selected financial data for our grossfabrication technology segment:
| Year Ended December 31, | |||||||
| 2013 | 2012 | ||||||
| (Dollars in millions) | |||||||
| Net sales | $ | 2,103.2 | $ | 2,012.7 | |||
| Gross profit | 679.6 | 585.1 | |||||
| Gross profit margin | 32.3 | % | 29.1 | % | |||
| Restructuring and other related charges | $ | 25.1 | $ | 45.2 | |||
| Selling, general and administrative expense | 459.9 | 444.9 | |||||
| Selling, general and administrative expense as a percentage of Net sales | 21.9 | % | 22.1 | % | |||
| Segment operating income | $ | 219.6 | $ | 140.2 | |||
| Segment operating income margin | 10.4 | % | 7.0 | % | |||
The $90.5 million Net sales increase during 2013 compared to 2012 was primarily the result of acquisition-related growth of $163.0 million, including 12 additional days of activity in ESAB. The $30.6 million Net sales decline due to existing businesses, as discussed and defined under “Sales, Orders and Backlog” above, during 2013 in comparison to 2012 was primarily the result of decreases in consumable volumes in Europe, Asia and North America. Net sales was also negatively impacted by $41.9 million due to the change in foreign exchange rates. Gross profit and gross profit margin figures for the periods indicated:
| Year ended December 31, | ||||||||||||
| (Amounts in millions) | 2010 | 2009 | 2008 | |||||||||
| Gross profit | $ | 191.4 | $ | 185.8 | $ | 217.2 | ||||||
| Gross profit margin | 35.3 | % | 35.4 | % | 35.9 | % | ||||||
2012 were impacted by acquisition-related inventory step-up expense of $18.7 million. In 2013, Gross profit and gross profit margin were favorably impacted by the fixed costs eliminated by several manufacturing site closings in late 2012 and the higher gross profit margins at Soldex. Additionally, Selling, general and administrative expense increased $5.6 million for the year ended December 31, 2010 compared to the same period in 2009. Gross profit from existing businesses increased $6.5 million, with an additional increase of $1.8by $29.9 million due to the acquisitionsacquisition of BaricSoldex. This amount includes the impact of the devaluation of the Venezuelan bolivar fuerte during the first quarter of 2013, which resulted in a foreign currency transaction loss of $2.9 million recognized in Selling, general and PD-Technik. Foreign currency translation negativelyadministrative expense for 2013. Selling, general and administrative expense was also impacted grossby the inclusion of an additional 12 days of ESAB operations in 2013 compared to 2012. See Note 2, “Summary of Significant Accounting Policies” in the accompanying Notes to Consolidated Financial Statements included in this Form 10-K for additional discussion regarding the devaluation of the Venezuelan bolivar fuerte.
The $40.7 million sales growth due to existing businesses, as discussed and defined under “Sales, Orders and Backlog” above, during 2012 in comparison to 2011 was primarily due to increased consumable and equipment sales in the Americas, Russia and the Middle East. Year over year comparison of the other selected financial data above is not practical, as further discussed above. Additionally, Gross profit by $2.7 million. Grossand gross profit margin for the year ended December 31, 20102012 were negatively impacted by acquisition-related inventory step-up expense of $18.7 million.
30
Gross Profit - Total Company
| Year Ended December 31, | |||||||||||
| 2013 | 2012 | 2011 | |||||||||
| (Dollars in millions) | |||||||||||
| Gross profit | $ | 1,306.2 | $ | 1,152.1 | $ | 240.1 | |||||
| Gross profit margin | 31.0 | % | 29.4 | % | 34.6 | % | |||||
The $154.1 million increase in Gross profit during 2013 in comparison to 2012 was flat comparedattributable to increases of $59.6 million in our gas- and fluid-handling segment and $94.5 million in our fabrication technology segment. Gross profit increased during 2013 due to the year ended December 31, 2009, asnon-recurrence of $21.6 million of acquisition-related inventory step-up expense incurred in 2012. The improvement in gross profit margin declines driven by lower pricing and an unfavorable product mix shift were partially offset by restructuring program cost savings and higher productivity.
The following table presents$912.0 million increase in Gross profit during 2012 in comparison to 2011 was attributable to increases of $585.1 million in our selling, generalfabrication technology segment and administrative (SG&A) expenses for$326.9 million in our gas- and fluid-handling segment, which were primarily due to the periods indicated:Charter Acquisition.
| Year ended December 31, | ||||||||||||
| (Amounts in millions) | 2010 | 2009 | 2008 | |||||||||
| SG&A expenses | $ | 119.4 | $ | 112.5 | $ | 124.1 | ||||||
| SG&A expenses as a percentage of sales | 22.0 | % | 21.4 | % | 20.5 | % | ||||||
| Year Ended December 31, | |||||||||||
| 2013 | 2012 | 2011 | |||||||||
| (Dollars in millions) | |||||||||||
| Selling, general and administrative expense | $ | 861.0 | $ | 895.5 | $ | 162.8 | |||||
| Selling, general and administrative expense as a percentage of Net sales | 20.5 | % | 22.9 | % | 23.5 | % | |||||
| Charter acquisition-related expense | $ | — | $ | 43.6 | $ | 31.1 | |||||
| Restructuring and other related charges | 35.5 | 60.1 | 9.7 | ||||||||
| Asbestos coverage litigation expense | 3.3 | 13.0 | 10.7 | ||||||||
Selling, general and administrative expenses increased $6.9expense decreased $34.5 million during 2013 in comparison to $119.4 million for the year ended December 31, 2010. Excluding a $2.2 million net increase related to acquisitions and foreign exchange rates, SG&A increased $4.7 million from 2009,2012, primarily due to higher selling and commission costs and higher incentive compensation. There was also a $2.9decrease in acquisition-related amortization expense of $56.6 million, partially offset by the increase in pension costs dueexpenses resulting from the additional 12 days of operations related to the Company’s assumptionentities acquired as part of the pension obligation for a groupCharter Acquisition and the acquisitions of former employeesSoldex, Co-Vent, Clarus, ČKDK, GII, TLT-Babcock, Alphair and Sicelub. During 2012, we incurred $43.6 million of a divested subsidiaryadvisory, legal, valuation and other professional service fees and realized losses on acquisition-related foreign exchange derivatives in connection with the Charter Acquisition. Restructuring and other related charges decreased in 2013 in comparison to 2012 primarily as a result of an agreement reachedthe completion of several substantial cost reduction programs in the fabrication technology segment in 2012. Additionally, Asbestos coverage litigation expense decreased in 2013 as significant costs were incurred in 2012 for the preparation of our appeals submissions related to a case decided by the trial court during 2011 and for depositions and preparation for a trial related to a subsidiary’s coverage which was conducted in the fourth quarter of 2010. However, this was substantially offset by the reversal of an accrual established in prior years for this matter.2012.
Selling, general and administrative expenses decreased $11.6expense increased $732.7 million during 2012 in comparison to $112.5 million for the year ended December 31, 2009. Excluding the $6.1 million favorable impact of foreign exchange rates, SG&A declined $5.5 million from 2008,2011 primarily due to reductionsthe Charter Acquisition. The decrease in sellingSelling, general and commission expensesadministrative expense as a percentage of $2.2 million and restructuring savings of $2.5 million. An additional $2.0 million of professional fees and other costs associated with becoming a public company and $2.6 million of pension and other postretirement benefit costs were incurredNet sales during 2012 in 2009, but were offset by lower legacy legal expenses and favorable changes in the fair value of commodity and foreign currency derivatives.
| Year ended December 31, | ||||||||||||
| (Amounts in millions) | 2010 | 2009 | 2008 | |||||||||
| Operating income | $ | 34.4 | $ | 39.6 | $ | 17.8 | ||||||
| Operating margin | 6.3 | % | 7.5 | % | 2.9 | % | ||||||
31
Interest Expense - Total Company
| Year Ended December 31, | |||||||||||
| 2013 | 2012 | 2011 | |||||||||
| (Dollars in millions) | |||||||||||
| Interest expense | $ | 103.6 | $ | 91.6 | $ | 5.9 | |||||
The increase in Interest expense during 2013 in comparison to 2012 was primarily dueattributable to the absencewrite-off of $57.0$29.4 million of IPO-relatedcertain deferred fees and original issue discount associated with the Second and Third Amendments to the Deutsche Bank Credit Agreement, as defined and further discussed under “—Liquidity and Capital Resources—Borrowing Arrangements” below, and $1.2 million of costs incurred in 2008,connection with the refinancings, partially offset by $18.2 million of restructuring costs incurred in 2009 as well as a $5.5 million negativethe favorable impact of foreign exchange rates. Excluding these impacts, operating income was $11.5 million lower thanborrowing rates associated with the prior year, primarily due to lower sales volume from existing businesses, partially offset by lower asbestos-related expensesSecond and selling, general and administrative expenses.
Provision for Income Taxes - Total Company
During 2012, Loss before income taxes was $48.4 million and the Provision for income taxes was $90.7 million. The 41.4% effectiveProvision for income taxes was impacted by two significant items. Upon completion of the Charter Acquisition, certain deferred tax rate forassets existing at that date were reassessed in light of the year ended December 31, 2010 was higher thanimpact of the 26.6% effectiveacquired businesses on expected future income or loss by country and future tax rate forplanning, including the year ended December 31, 2009 primarily due a $4.2 millionimpact of the post-acquisition capital structure. This assessment resulted in an increase in our valuation allowance to provide full valuation allowances against U.S. deferred tax assets. The increased valuation allowances resulted in 2010.
Liquidity and Capital Resources
Overview
Historically, we have financed our capital and working capital requirements through a combination of cash flows from operating activities, and borrowings under our bank credit facility.facilities and the issuances of equity. We expect that our primary ongoing requirements for cash will be for working capital, funding for potentialof acquisitions, capital expenditures, asbestos-related cash outflows and funding of our pension plan funding.plans. If additional funds are needed for strategic acquisitions or other corporate purposes, we believe we could raise additional funds in the form of debt or equity.
On May 13, 2013, we sold 7,500,000 shares of newly issued Colfax Common stock to underwriters for public resale pursuant to a shelf registration statement for an aggregate purchase price of $331.9 million. In conjunction with this issuance, we recognized $12.0 million in equity issuance costs which were recorded as a reduction to Additional paid-in capital during 2013.
On September 12, 2013, we contributed 88,200 shares of newly issued Colfax Common stock to its U.S. defined benefit pension plan.
In connection with the financing of the Charter Acquisition, on January 24, 2012, we sold to the BDT Investor (i) 14,756,945 shares of newly issued Colfax Common stock and (ii) 13,877,552 shares of newly created Series A perpetual convertible preferred stock, referred to as the Series A Preferred Stock, for an aggregate of $680 million (representing $24.50 per share of Series A Preferred Stock and $23.04 per share of Common stock) pursuant to the BDT Purchase Agreement with the BDT Investor as well as BDT Capital Partners Fund I-A, L.P., and Mitchell P. Rales, Chairman of our Board of Directors, and his brother, Steven M.
32
Rales (for the limited purpose of tag-along sales rights provided to the BDT Investor in the event of a sale or transfer of shares of our Common stock by either or both of Mitchell P. Rales and Steven M. Rales). Pursuant to the BDT Purchase Agreement, under the terms of the Series A Preferred Stock, holders are entitled to receive cumulative cash dividends, payable quarterly, at a per annum rate of 6% of the liquidation preference (defined as $24.50, subject to customary antidilution adjustments), provided that the dividend rate shall be increased to a per annum rate of 8% if Colfax fails to pay the full amount of any dividend required to be paid on such shares until the date that full payment is made.
The Series A Preferred Stock is convertible, in whole or in part, at the option of the holders at any time after the date the shares were issued into shares of Colfax Common stock at a conversion rate determined by dividing the liquidation preference by a number equal to 114% of the liquidation preference, subject to certain adjustments. The Series A Preferred Stock is also convertible, in whole or in part, at our option on or after the third anniversary of the issuance of the shares at the same conversion rate if, among other things: (i) for the preceding thirty trading days, the closing price of Colfax Common stock on the New York Stock Exchange exceeds 133% of the applicable conversion price and (ii) Colfax has declared and paid or set apart for payment all accrued but unpaid dividends on the Series A Preferred Stock.
On May 13, 2008, coincidingJanuary 24, 2012, we sold 2,170,139 shares of newly issued Colfax Common stock to each of Mitchell P. Rales and Steven M. Rales and 1,085,070 shares of newly issued Colfax Common stock to Markel Corporation (“Markel”) at $23.04 per share, for an aggregate of $125 million pursuant to separate securities purchase agreements with Mitchell P. Rales, Chairman of Colfax’s Board of Directors, and his brother Steven M. Rales, each of whom were beneficial owners of 20.9% of Colfax’s Common stock at the time of the sale, and Markel. Thomas S. Gayner, a member of Colfax’s Board of Directors, is President and Chief Investment Officer of Markel.
Consideration paid to Charter shareholders included 0.1241 shares of newly issued Colfax Common stock in exchange for each share of Charter’s ordinary stock, which resulted in the issuance of 20,735,493 shares of Common stock on January 24, 2012.
In conjunction with the issuance of the Common and Preferred stock issued in connection with the financing of the Charter Acquisition, the Company recognized $14.7 million in equity issuance costs which were recorded as a reduction to Additional paid-in capital during 2012.
On March 5, 2012, we sold 8,000,000 shares of newly issued Common stock to underwriters for public resale pursuant to a shelf registration statement for an aggregate purchase price of $272 million. Further, on March 9, 2012, the underwriters of the March 5, 2012 equity offering exercised their over-allotment option and we sold an additional 1,000,000 shares of newly issued Common stock to the underwriters for public resale pursuant to a shelf registration statement for an aggregate purchase price of $34 million. In conjunction with these issuances, we recognized $12.6 million in equity issuance costs which were recorded as a reduction to Additional paid-in capital during 2012.
Borrowing Arrangements
We entered into the Deutsche Bank Credit Agreement on September 12, 2011. In connection with the closing of the IPO,Charter Acquisition, the Deutsche Bank Credit Agreement was amended on January 13, 2012 and we terminated our existing credit facility. There were no material early termination penalties incurredagreement as a resultwell as Charter’s outstanding indebtedness.
On February 22, 2013, we entered into the Second Amendment to the Deutsche Bank Credit Agreement to, among other things, (i) reallocate the borrowing capacities of the termination. Deferred loantranches of loans, (ii) provide for an interest rate margin on the term A-1 facility, the term A-2 facility and the revolving credit subfacilities ranging from 0.75% to 1.50% per annum for base rate loans and 1.75% to 2.50% per annum for Eurocurrency rate loans, in each case, determined by the Company’s leverage ratio, (iii) provide for an interest rate margin on the term A-3 facility and the term A-4 facility ranging from 1.50% to 2.25% per annum for base rate loans and 2.50% to 3.25% per annum for Eurocurrency rate loans, in each case, determined by the Company’s leverage ratio and (iv) provide for an interest rate margin on the term B facility of 1.50% per annum for base rate loans and 2.50% per annum for Eurocurrency rate loans.
On November 7, 2013, we entered into the Third Amendment to the Deutsche Bank Credit Agreement (the “Third Amendment”). Pursuant to the Third Amendment, the Company further amended its credit agreement to, among other things, (i) reallocate borrowing capacities of the tranches of loans as follows: a $408.7 million term A-1 facility, a $380 million term A-2 facility, a €149.7 million term A-3 facility, a €100 million term A-4 facility and two revolving credit subfacilities which total $898 million in commitments, (ii) provide for an interest rate margin on the term A-1 facility, the term A-2 facility and the revolving credit subfacilities ranging from 0.50% and 1.25% per annum for base rate loans and 1.50% to 2.25% per annum for Eurocurrency rate loans, in each case determined by the Company’s leverage ratio, (iii) provide for an interest margin on the term A-3 facility
33
and the term A-4 facility ranging from 0.75% to 1.50% per annum for base rate loans and 1.75% and 2.50% per annum for Eurocurrency loans, in each case, determined by the Company’s leverage ratio and (iv) reset the maturity date for the term A facilities and the two revolving credit subfacilities as well as the amortization schedule for the term A facilities to a five year term commencing on November 7, 2013. In connection with the Third Amendment, the prior term B facility under the credit agreement was repaid in its entirety.
In conjunction with the amendments, we recorded a charge to Interest expense in the Consolidated Statement of Operations for the year ended December 31, 2013 of $29.4 million to write-off certain deferred financing fees and original issue discount and expensed approximately $1.2 million of costs of $4.6 million were written offincurred in connection with this termination. On the same day, we entered into a new credit agreement (the “Credit Agreement”).refinancing. The Company had an original issue discount of $17.7 million and deferred financing fees of $13.5 million included in its Consolidated Balance Sheet as of December 31, 2013, which will be accreted to Interest expense primarily using the effective interest method, over the life of the Deutsche Bank Credit Agreement. As of December 31, 2013, the weighted-average interest rate of borrowings under the amended Deutsche Bank Credit Agreement led by Bancwas 1.99%, excluding accretion of America Securities LLCoriginal issue discount, and administered by Bank of America, is a senior secured structure with a $150.0there was $560.6 million revolver and a Term A Note of $100.0 million.
The Company is also party to additional letter of credit sub-facility and $6.0facilities with total capacity of $688.7 million attributable to a defaulting lender, leaving approximately $129.9. Total letters of credit of $398.2 million available under our revolver.
In connection with the Deutsche Bank Credit Agreement, the Company has been designated as a cash flow hedge, and therefore changes inpledged substantially all of its fair value are recorded as an adjustment to other comprehensive income.
34
| Amount | ||||
| Bank of America | $ | 32.4 | ||
| RBS Citizens | 14.4 | |||
| TD BankNorth | 14.4 | |||
| Wells Fargo | 14.4 | |||
| SunTrust Bank | 14.4 | |||
| Landesbank Baden-Wuerttemberg | 10.5 | |||
| DnB Nor Bank | 10.5 | |||
| HSBC | 10.5 | |||
| KeyBank | 10.5 | |||
| Carolina First Corp | 6.0 | |||
| UBS | 6.0 | |||
Lehman Brothers(1) | 6.0 | |||
| Total | $ | 150.0 | ||
and cash equivalents, a decrease of $171.1 million from $482.4 million as of December 31, 2012. The following table below presents selectedsummarizes the change in Cash and cash flow data forequivalents during the periods indicated:
| Year ended December 31, | ||||||||||||
| (Amounts in millions) | 2010 | 2009 | 2008 | |||||||||
| Net cash provided by (used in) operating activities | $ | 62.0 | $ | 38.7 | $ | (33.0 | ) | |||||
| Purchases of fixed assets | (12.5 | ) | (11.0 | ) | (18.6 | ) | ||||||
| Net cash paid for acquisitions | (28.0 | ) | (1.7 | ) | (0.4 | ) | ||||||
| Other sources, net | 0.1 | 0.2 | (0.1 | ) | ||||||||
| Net cash used in investing activities | $ | (40.4 | ) | $ | (12.5 | ) | $ | (19.1 | ) | |||
| Proceeds and repayments of borrowings, net | (8.8 | ) | (5.0 | ) | (110.3 | ) | ||||||
| Net proceeds from the issuance of common stock | - | - | 193.0 | |||||||||
| Dividends paid to preferred shareholders | - | - | (38.5 | ) | ||||||||
| Repurchases of common stock | - | - | (5.7 | ) | ||||||||
| Payments made for loan costs | - | - | (3.3 | ) | ||||||||
| Other sources (uses), net | 0.8 | (0.4 | ) | (0.4 | ) | |||||||
| Net cash (used in) provided by financing activities | $ | (8.0 | ) | $ | (5.4 | ) | $ | 34.8 | ||||
| Year Ended December 31, | |||||||||||
| 2013 | 2012 | 2011 | |||||||||
| (In millions) | |||||||||||
| Net cash provided by operating activities | $ | 362.2 | $ | 174.0 | $ | 57.2 | |||||
| Purchases of fixed assets, net | (71.5 | ) | (83.2 | ) | (13.6 | ) | |||||
| Acquisitions, net of cash received | (372.5 | ) | (1,859.6 | ) | (56.3 | ) | |||||
| Loans to non-trade creditors | (31.0 | ) | — | — | |||||||
| Other sources, net | — | 1.9 | — | ||||||||
| Net cash used in investing activities | (475.0 | ) | (1,940.9 | ) | (69.9 | ) | |||||
| (Repayments) proceeds from borrowings, net | (309.0 | ) | 1,159.8 | 29.0 | |||||||
| Proceeds from issuance of common stock, net | 324.2 | 756.8 | 3.7 | ||||||||
| Proceeds from issuance of preferred stock, net | — | 333.0 | — | ||||||||
| Acquisition of shares held by noncontrolling interest | (14.9 | ) | (29.3 | ) | — | ||||||
| Other uses | (45.3 | ) | (37.1 | ) | — | ||||||
| Net cash (used in) provided by financing activities | (45.0 | ) | 2,183.2 | 32.7 | |||||||
| Effect of exchange rates on Cash and cash equivalents | (13.3 | ) | (8.9 | ) | (5.4 | ) | |||||
| (Decrease) increase in Cash and cash equivalents | $ | (171.1 | ) | $ | 407.4 | $ | 14.6 | ||||
Cash flows from operating activities can fluctuate significantly from period to period asdue to changes in working capital needs,and the timing of payments for items such as asbestos-related cash flows, pension funding decisions and otherasbestos-related costs. Changes in significant operating cash flow items impact reported cash flows.are discussed below.
Net cash provided by (used in) operating activities was $62.0 million, $38.7 million and $(33.0) millionreceived or paid for the years ended December 31, 2010, 2009 and 2008, respectively. The two most significant items causing the variability in these reported amounts were asbestos-related cash flows (includingcosts, net of insurance proceeds, including the disposition of claims, defense costs insurer reimbursements and settlements and legal expenses related to litigation against our insurers)insurers, creates variability in our operating cash flows. We had net cash outflows of $39.6 million, $24.7 million and IPO-related costs$7.9 million during 2013, 2012 and 2011, respectively.
Funding requirements of our defined benefit plans, including pension plans and other post-retirement benefit plans, can vary significantly from period to period due to changes in 2008.the fair value of plan assets and actuarial assumptions. For 2013, 2012 and 2011 cash contributions for defined benefit plans were $46.9 million, $61.2 million and $9.3 million, respectively. Contributions for 2012 included $18.9 million of supplemental contributions to pension plans in the years ended United Kingdom as a result of the financing of the Charter Acquisition.
During 2013, 2012 and 2011 cash payments of $47.3 million, $45.1 million and $6.8 million, respectively, were made related to our restructuring initiatives. Additionally, during 2012 and 2011 cash payments of approximately $46.1 million and $1.6 million were made for advisory, legal, valuation and other professional service fees related to the Charter Acquisition.
Changes in net working capital also affected the operating cash flows for the periods presented. We define working capital as Trade receivables, net and Inventories, net reduced by Accounts payable. During 2013, net working capital decreased $110.0 million, primarily due to a decrease in inventory and an increase in payables partially offset by an increase in receivables, which increased our cash flows from operating activities. During 2012, net working capital decreased, primarily due to a decrease in inventory and an increase in payable levels, which increased our cash flows from operating activities by $78.3 million, a significant contributor to 2012 cash flows from operating activities. During 2011, net working capital increased, primarily due to an increase in receivables, which reduced our cash flows from operating activities.
During 2013, the acquisitions of GII, Clarus, ČKDK, TLT-Babcock, Alphair and Sicelub resulted in net cash outflows of $399.9 million. There were significant investing activities associated with the Charter Acquisition. The cash cost of the Charter Acquisition, which was completed in 2012, was approximately $1.7 billion, net of cash acquired. During 2011, the acquisitions of Rosscor and COT-Puritech resulted in net cash outflows of $56.3 million. During 2013, the Company also made a loan in connection with an acquisition of $31.0 million, which is expected to be repaid in 2015.
35
Cash flows from financing activities for 2013 were impacted by the amendments to the Deutsche Bank Credit Agreement further discussed above under “—Borrowing Arrangements” and the May 2013 sale of newly issued Common stock further discussed above under “—Equity Capital.” The sale of our Common stock in May 2013 generated $319.9 million cash inflows from financing activities.
Cash flows from financing activities for 2012 were significantly impacted by the Charter Acquisition. As discussed above under “—Equity Capital,” we raised $805.0 million of cash from sales of our equity securities to the BDT Investor, Steven and Mitchell Rales, and Markel. We borrowed approximately $1.8 billion of term loans, $70.3 million of which was repaid in 2012. The additional payment of borrowings under term loans of $455 million primarily represents the repayment of borrowings under our Bank of America Credit Agreement, in conjunction with the financing of the Charter Acquisition. Additionally, financing activities for 2012 included $293 million raised in a primary offering of our Common stock settled in March 2012.
Cash flows from financing activities were also impacted by acquisitions of shares of less than wholly owned subsidiaries. During 2013, cash flows from financing activities included a $14.9 million acquisition of common and investment shares of Soldex resulting in an increase in our ownership of the subsidiary from approximately 91% to 99%. During 2012, cash flows from financing activities included a $29.3 million acquisition of shares in ESAB India Limited, a publicly traded, less than wholly owned subsidiary in which the Company acquired a controlling interest in the Charter Acquisition. This acquisition of shares was pursuant to a statutorily mandated tender offer triggered as a result of the Charter Acquisition.
Cash flows from financing activities during 2011 included net borrowings of $29.0 million, which were primarily related to the acquisitions of Rosscor and COT-Puritech.
Our Cash and cash equivalents as of December 31, 2010, 20092013 includes $290.2 held in jurisdictions outside the U.S., which may be subject to tax penalties if repatriated into the U.S. and 2008, net cash paid for asbestos liabilities, net of insurance settlements received, was $11.4 million, $19.7 million and $21.8 million, respectively. For the year ended December 31, 2008, cash paid for IPO-related costs were $42.4 million. Additionally, in the year ended December 31, 2008, cash paid for legacy legal settlements were $11.7 million. Excluding the effect of asbestos-related cash flows, IPO-related costs, and legacy legal settlements, net cash provided by operating activities would have been $73.4 million, $58.4 million and $42.9 million for the years ended December 31, 2010, 2009 and 2008, respectively.
other restrictions.
Contractual Obligations
The following table is a summary ofsummarizes our future contractual obligations as of December 31, 2010 (in millions):2013.
| Total | Less than One Year | 1-3 Years | 3-5 Years | More Than 5 Years | ||||||||||||||||
Debt & Leases: | ||||||||||||||||||||
| Term Loan A | $ | 82.5 | $ | 10.0 | $ | 72.5 | $ | - | $ | - | ||||||||||
Interest Payments on Long-Term Debt (1) | 6.6 | 3.7 | 2.9 | - | - | |||||||||||||||
| Operating Leases | 12.7 | 3.8 | 5.1 | 3.1 | 0.7 | |||||||||||||||
Purchase Obligations (2) | 50.9 | 47.7 | 3.2 | - | - | |||||||||||||||
| Total | $ | 152.7 | $ | 65.2 | $ | 83.7 | $ | 3.1 | $ | 0.7 | ||||||||||
Less Than One Year | 1-3 Years | 3-5 Years | More Than 5 Years | Total | ||||||||||||||||
| (In millions) | ||||||||||||||||||||
| Debt | $ | 29.4 | $ | 280.2 | $ | 1,195.2 | $ | — | $ | 1,504.8 | ||||||||||
Interest payments on debt(1) | 29.2 | 53.9 | 32.5 | — | 115.6 | |||||||||||||||
| Mandatorily redeemable preferred stock of a subsidiary | — | 31.4 | — | — | 31.4 | |||||||||||||||
| Dividend payment on mandatorily redeemable preferred stock of a subsidiary | — | 3.1 | — | — | 3.1 | |||||||||||||||
| Operating leases | 36.5 | 40.2 | 24.6 | 55.9 | 157.2 | |||||||||||||||
| Capital leases | 4.1 | 1.3 | — | — | 5.4 | |||||||||||||||
Purchase obligations(2) | 418.8 | 13.1 | 1.1 | 0.4 | 433.4 | |||||||||||||||
| Total | $ | 518.0 | $ | 423.2 | $ | 1,253.4 | $ | 56.3 | $ | 2,250.9 | ||||||||||
__________
(1) | Variable interest payments are estimated using a static rate of |
(2) | Excludes open purchase orders for goods or services that are provided on demand, the timing of which is not certain. |
We have cash funding requirements associated with our pension and other post-retirement benefit plans as of December 31, 2013, which are estimated to be approximately $6.7$71.7 million for the year ending December 31, 2011.2014, of which approximately $10 million is expected to be satisfied with a contribution of Colfax Common stock, with the balance in cash. Other long-term liabilities, such as those for asbestos and other legal claims, employee benefit plan obligations, and deferred income taxes and liabilities for unrecognized income tax benefits, are excluded from the above table since they are not contractually fixed as to timing and amount.
36
Off-Balance Sheet Arrangements
We do not have any off-balance sheet arrangements that provide liquidity, capital resources, market or credit risk support that expose us to any liability that is not reflected in our consolidated financial statementsConsolidated Financial Statements at December 31, 2013 other than outstanding letters of credit of $14.1$398.2 million and $16.4$157.2 million of bank guarantees at December 31, 2010 and future operating lease payments of $12.7 million.payments.
The Company and its subsidiaries have in the past divested certain of its businesses and assets. In connection with these divestitures, certain representations, warranties and indemnities were made to purchasers to cover various risks or unknown liabilities. We cannot estimate the potential liability, if any, that may result from such representations, warranties and indemnities because they relate to unknown and unexpected contingencies; however, the Company doeswe do not believe that any such liabilities will have a material adverse effect on our financial condition, results of operations or liquidity.
Critical Accounting Policies
The methods, estimates and judgments we use in applying our critical accounting policies have a significant impact on theour results we report in ourof operations and financial statements.position. We evaluate our estimates and judgments on an ongoing basis. Our estimates are based upon our historical experience, our evaluation of business and macroeconomic trends and information from other outside sources, as appropriate. Our experience and assumptions form the basis for our judgments about the carrying value of assets and liabilities that are not readily apparent from other sources. Actual results may vary from what our management anticipates and different assumptions or estimates about the future could changehave a material impact on our reported results.results of operations and financial position.
We believe the following accounting policies are the most critical in that they are important to the financial statements and they require the most difficult, subjective or complex judgments in the preparation of the financial statements. For a detailed discussion on the application of these and other accounting policies, see Note 2, “Summary of Significant Accounting Policies” in the accompanying Notes to the Consolidated Financial Statements.Statements in this Form 10-K.
Asbestos Liabilities and Insurance Assets
Certain subsidiaries are each one of many defendants in a large number of lawsuits that claim personal injury as a result of exposure to asbestos from products manufactured with components that are alleged to have contained asbestos. Such components were acquired from third-party suppliers, and were not manufactured by any of ourthe Company’s subsidiaries nor were the subsidiaries producers or direct suppliers of asbestos. The manufactured products that are alleged to have contained asbestos generally were provided to meet the specifications of the subsidiaries’ customers, including the U.S. Navy.
| Year ended December 31, | ||||||||||||
| 2010 | 2009 | 2008 | ||||||||||
| Claims unresolved at the beginning of the period | 25,295 | 35,357 | 37,554 | |||||||||
Claims filed (2) | 3,692 | 3,323 | 4,729 | |||||||||
Claims resolved (3) | (4,223 | ) | (13,385 | ) | (6,926 | ) | ||||||
| Claims unresolved at the end of the period | 24,764 | 25,295 | 35,357 | |||||||||
Average cost of resolved claims (4) | $ | 12,037 | $ | 11,106 | $ | 5,378 | ||||||
We have projected each subsidiary’s future asbestos-related liability costs with regard to pending and future unasserted claims based upon the Nicholson methodology. The Nicholson methodology is a standard approach used by experts and has been accepted by numerous courts. This methodology is based upon risk equations, exposed population estimates, mortality rates, and other demographic statistics. In applying the Nicholson methodology for each subsidiary we performed: 1)(1) an analysis of the estimated population likely to have been exposed or claim to have been exposed to products manufactured by the subsidiaries based upon national studies undertaken of the population of workers believed to have been exposed to asbestos; 2) the use(2) a review of epidemiological and demographic studies to estimate the number of potentially exposed people that would be likely to develop asbestos-related diseases in each year; 3)(3) an analysis of the subsidiaries’ recent claims history to estimate likely filing rates for these diseases;diseases and 4)(4) an analysis of the historical asbestos liability costs to develop average values, which vary by disease type, jurisdiction and the nature of claim, to determine an estimate of costs likely to be associated with currently pending and projected asbestos claims. Our projections, based upon the Nicholson methodology, estimate both claims and the estimated cash outflows related to the resolution of such claims for periods up to and including the endpoint of asbestos studies referred to in item 2)(2) above. It is our policy to record a liability for asbestos-related liability costs for the longest period of time that we can reasonably estimate. Accordingly, no accrual has been recorded for any costs which may be paid after the next 15 years.
Projecting future asbestos-related liability costs is subject to numerous variables that are difficult to predict, including, among others, the number of claims that might be received, the type and severity of the disease alleged by each claimant, the latency period associated with asbestos exposure, dismissal rates, costs of medical treatment, the financial resources of other companies that are co-defendants in the claims, funds available in post-bankruptcy trusts, uncertainties surrounding the litigation process from jurisdiction to jurisdiction and from case to case, including fluctuations in the timing of court actions and rulings, and the impact of potential changes in legislative or judicial standards, including potential tort reform. Furthermore, any projections with respect to these variables are subject to even greater uncertainty as the projection period lengthens. These trend factors have both positive and negative effects on the dynamics of asbestos litigation in the tort system and the related best estimate of our asbestos liability, and these effects do not move in linear fashion but rather change over multiple year periods. Accordingly, we monitor these trend
37
factors over time and periodically assessesassess whether an alternative forecast period is appropriate. Taking these factors into account and the inherent uncertainties, we believe that we can reasonably estimate the asbestos-related liability for pending and future claims that will be resolved in the next 15 years and have recorded that liability as our best estimate. While it is reasonably possible that the subsidiaries will incur costs after this period, we do not believe the reasonably possible loss or range of reasonably possible loss is estimable at the current time. Accordingly, no accrual has been recorded for any costs which may be paid after the next 15 years. Defense costs associated with asbestos-related liabilities as well as costs incurred related to litigation against the subsidiaries’ insurers are expensed as incurred.
We assessed the subsidiaries’ existing insurance arrangements and agreements, estimated the applicability of insurance coverage for existing and expected future claims, analyzed publicly available information bearing on the current creditworthiness and solvency of the various insurers, and employed such insurance allocation methodologies as we believed appropriate to ascertain the probable insurance recoveries for asbestos liabilities. The analysis took into account self-insurance retentions, policy exclusions, pending litigation, liability caps and gaps in coverage, existing and potential insolvencies of insurers as well as how legal and defense costs will be covered under the insurance policies.
Each subsidiary has separate insurance coverage acquired prior to Companyour ownership of each independent entity. In itsour evaluation of the insurance asset, the Company usedwe use differing insurance allocation methodologies for each subsidiary based upon the applicable law pertaining to the affected subsidiary.
Management’s analyses are based on currently known facts and a number of assumptions. However, projecting future events, such as new claims to be filed each year, the average cost of resolving each claim, coverage issues among layers of insurers, the method in which losses will be allocated to the various insurance policies, interpretation of the effect on coverage of various policy terms and limits and their interrelationships, the continuing solvency of various insurance companies, the amount of remaining insurance available, as well as the numerous uncertainties inherent in asbestos litigation could cause the actual liabilities and insurance recoveries to be higher or lower than those projected or recorded which could materially affect our financial condition, results of operations or cash flow.
As of December 31, 2013, we had total asbestos liabilities, including current portion, of $409.4 million and total asbestos insurance assets, including current portion, of $395.3 million. See Note 15, “Commitments and Contingencies” in the accompanying Notes to Consolidated Financial Statements for additional information regarding our asbestos liabilities and insurance assets.
Retirement Benefits
Pension obligations and other post-retirement benefits are actuarially determined and are affected by several assumptions, including the discount rate, assumed annual rates of return on plan assets, and per capita cost of covered health care benefits. Changes in discount rate and differences from actual results for each assumption will affect the amounts of pension expense and other post-retirement expense recognized in future periods. These assumptions may also have an effect on the amount and timing of future cash contributions. See Note 1113, “Defined Benefit Plans” in the accompanying Notes to our Consolidated Financial Statements for further information.
Impairment of Goodwill and Indefinite-Lived Intangible Assets
Goodwill represents the costs in excess of the fair value of net assets acquired associated with our acquisitions.
We evaluate the recoverability of goodwillGoodwill and indefinite-lived intangible assets annually or more frequently if an event occurs or circumstances change in the interim that would more likely than not reduce the fair value of the asset below its carrying amount. Goodwill isand indefinite-lived intangible assets are considered to be impaired when the net book value of a reporting unit or asset exceeds its estimated fair value.
In the evaluation of goodwillGoodwill for impairment, we first compareassess qualitative factors to determine whether it is more likely than not that the fair value of thea reporting unit toentity is less than its carrying value. If we determine that it is not more likely than not for a reporting unit’s fair value to be less than its carrying value, a calculation of the fair value is not performed. If we determine that it is more likely than not for a reporting unit’s fair value to be less than its carrying value, a calculation of the reporting entity’s fair value is performed and compared to the carrying value of that entity. If the carrying value of a reporting unit exceeds its fair value, the goodwillGoodwill of that reporting unit is potentially impaired and step two of the impairment analysis is performed. In step two of the analysis, an impairment loss is recorded equal to the excess of the carrying value of the reporting unit’s goodwillGoodwill over its implied fair value should such a circumstance arise.
38
We measure fair value of reporting units based on a present value of future discounted cash flows or a market valuation approach. The discounted cash flows model indicates the fair value of the reporting units based on the present value of the cash flows that the reporting units are expected to generate in the future. Significant estimates in the discounted cash flows model include: the weighted average cost of capital; long-term rate of growth and profitability of our business; and working capital effects. The market valuation approach indicates the fair value of the business based on a comparison of the Company against certain market information. Significant estimates in the market approach model include identifying appropriate market multiples and assessing earnings before interest, income taxes, depreciation and amortization (EBITDA) in estimating the fair value of the reporting units.
In the evaluation of indefinite-lived intangible assets for impairment, we first assess qualitative factors to determine whether it is more likely than not that the fair value of the indefinite-lived intangible asset is less than its carrying value. If we determine that it is not more likely than not for the indefinite-lived intangible asset’s fair value to be less than its carrying value, a calculation of the fair value is not performed. If we determine that it is more likely than not that the indefinite-lived intangible asset’s fair value is less than its carrying value, a calculation is performed and compared to the carrying value of the asset. If the carrying amount of the indefinite-lived intangible asset exceeds its fair value, an impairment loss is recognized in an amount equal to that excess. We measure the fair value of our indefinite-lived intangible assets using the “relief from royalty” method. Significant estimates in this approach include royalty and discount rates for each trade name evaluated.
The analysisanalyses performed as of September 28, 2013, September 29, 2012, and October 2, 2010 and December 31, 2009 and 20081, 2011 indicated no impairment to be present. However, actualpresent, except for $0.2 million of impairment loss related to an indefinite-lived intangible asset included in the gas- and fluid-handling segment for the year ended December 31, 2013. This impairment results from a decline in anticipated revenue related to this asset. The impairment loss is included in Selling, general and administrative expense in the accompanying Consolidated Statements of Operations and was calculated as the difference between the fair value of the asset under the relief from royalty method and its carrying value as of the date of the impairment test. The fair value of that intangible asset of $2.8 million as of December 31, 2013 is not material to our Consolidated Financial Statements. See Note 2, “Summary of Significant Accounting Policies” in the accompanying Notes to Consolidated Financial Statements for further information.
Actual results could differ from our estimates and projections, which would affect the assessment of impairment. As of December 31, 2010,2013, we have goodwillGoodwill of $172.3$2.4 billion and indefinite lived trade names of $412.3 million that isare subject to at least annual review offor impairment. See Note 107, “Goodwill and Intangible Assets” in the accompanying Notes to our Consolidated Financial Statements for further information.
Income Taxes
We account for income taxes under the asset and liability method, which requires that deferred tax assets and liabilities be recognized using enacted tax rates for the effect of temporary differences between the book and tax bases of recorded assets and liabilities. Deferred tax assets are reduced by a valuation allowance if it is more likely than not that some portion of the deferred tax asset will not be realized. In evaluating the need for a valuation allowance, we take into account various factors, including the expected level of future taxable income and available tax planning strategies. If actual results differ from the assumptions made in the evaluation of our valuation allowance, we record a change in valuation allowance through income tax expense in the period such determination is made.
During the year ending December 31, 2010,2013, the valuation allowance increased from $45.1$357.6 million to $52.9 million with $4.2 million$358.4 million.
Accounting Standards Codification 740, “Income Taxes” prescribes a recognition threshold and $3.6 million ofmeasurement attribute for a position taken in a tax return. Under this standard, we must presume the increase recognized in income tax expenseposition will be examined by a relevant tax authority and in other comprehensive income, respectively. The $7.8 million net increase in 2010 was primarily attributable to U.S. deferred tax assets we believe may not be realized. Consideration was given to U.S. tax planning strategies and future U.S. taxable income as to how much of the total U.S. deferred tax asset could be realized on adetermine whether it is more likely than not basis.that the income tax position will be sustained upon examination based on its technical merits. An income tax position that meets the more-likely-than-not recognition threshold is then measured to determine the amount of the benefit to be recognized in the financial statements. Liabilities for unrecognized income tax benefits are reviewed periodically and are adjusted as events occur that effect our estimates, such as the availability of new information, the lapsing of applicable statutes of limitations, the conclusion of tax audits and, if applicable, the conclusion of any court proceedings. To the extent we prevail in matters for which liabilities for unrecognized tax benefits have been established or are required to pay amounts in excess of our liabilities for unrecognized tax benefits, our effective income tax rate in a given period could be materially affected. The Company recognizes interest and penalties related to unrecognized tax benefits in the Provision for income taxes in the Consolidated Statements of Operations. Net liabilities for unrecognized income tax benefits, including accrued interest and penalties were $68.8 million as of December 31, 2013 and are included in Other liabilities in the accompanying Consolidated Balance Sheet.
39
Revenue Recognition
We recognize revenuesrevenue and costs from product sales when title passes to the buyer and all of the following criteria are met: persuasive evidence of an arrangement exists, the price is fixed or determinable, product delivery has occurred or services have been rendered, there are no further obligations to customers, and collectibility is probable. Product delivery occurs when title and risk of loss transfer to the customer. Our shipping terms vary based on the contract. If any significant obligations to the customer with respect to such sale remain to be fulfilled following shipment, typically involving obligations relating to installation and acceptance by the buyer, revenue recognition is deferred until such obligations have been fulfilled. Any customer allowances and discounts are recorded as a reduction in reported revenues at the time of sale because these allowances reflect a reduction in the purchasesales price for the products purchased.sold. These allowances and discounts are estimated based on historical experience and known trends. Revenue related to service agreements is recognized as revenue over the term of the agreement.
We recognize revenue and cost of sales on gas-handling construction projects using the “percentage of completion method” in accordance with U.S. GAAP. Under this method, contract revenues are recognized over the performance period of the contract in direct proportion to the costs incurred as a percentage of total estimated costs for the entirety of the contract. Any recognized revenues that have not been billed to a customer are recorded as a component of Trade receivables and any billings of customers in excess of recognized revenues are recorded as a component of Accounts payable. As of December 31, 2013, there were $231.3 million of revenues in excess of billings and $214.8 million of billings in excess of revenues on construction contracts in the Consolidated Balance Sheet.
We have contracts in various stages of completion. Such contracts require estimates to determine the appropriate cost and revenue recognition. Significant management judgments and estimates, including estimated costs to complete projects, must be made and used in connection with revenue recognized during each period. Current estimates may be revised as additional information becomes available. The revisions are recorded in income in the period in which they are determined using the cumulative catch-up method of accounting.
We maintain allowances for doubtful accounts for estimated losses resulting from the inability of our customers to make required payments. These allowances are based on recent trends of certain customers estimated to be a greater credit risk as well as general trends of the entire pool of customers. The allowance for doubtful accounts was $2.6$31.3 million and $2.8$16.5 million as of December 31, 20102013 and 2009,2012, respectively. If the financial condition of our customers were to deteriorate, resulting in an impairment of their ability to make payments, additional allowances maycould be required.
For purposes of calculating stock-based compensation, the fair value of restricted stock or restricted stock units granted is equal to the market value of a share of common stock on the date of the grant. For grants that were awarded on May 7, 2008 in conjunction with our initial public offering, we used the initial public offering price as the fair value of the restricted stock and restricted stock units granted. For stock options, we estimate the fair value on the date of grant using the Black-Scholes option-pricing model. The determination of fair value using the Black-Scholes model requires a number of complex and subjective variables. One key input into the model is the fair value of our common stock on the date of grant, the initial public offering price in the case of stock optionsdetailed information regarding recently issued on May 7, 2008. Other key variables in the Black-Scholes option-pricing model include the expected volatility of our common stock price, the expected term of the award and the risk-free interest rate. In addition, we are required to estimate forfeitures of unvested awards when recognizing compensation expense. Significant assumptions used to calculate stock-based compensation during the years ended December 31, 2010 and 2009 were a stock price volatility of 52.2% and 32.5%, respectively, an expected option life of 4.5 years, a risk-free interest rate based on the 5-year treasury note yield on the date of grant ranging from 1.1% to 2.6% in 2010 and 1.9% to 2.5% in 2009 and a 0% expected dividend yield.
Item 7A. Quantitative and Qualitative Disclosures About Market Risk
We are exposed to market risk from changes in short-term interest rates, foreign currency exchange rates and commodity prices that could impact our results of operations and financial condition. We address our exposure to these risks through our normal operating and financing activities.
Interest Rate Risk
We are subject to exposure from changes in short-term interest rates basedrelated to interest payments on our financing activities.borrowing arrangements. Under our credit facility,the Deutsche Bank Credit Agreement, all of our borrowings at as of December 31, 20102013 are variable rate facilities based on LIBOR or EURIBOR. In order to mitigate our interest rate risk, we periodically enter into interest rate swap or collar agreements. A hypothetical increase in the interest rate of 1.00% during 2010 on our variable rate debt that is not hedged2013 would have increased our interest costInterest expense by approximately $0.3$16.4 million.
Exchange Rate Risk
We have manufacturing sites throughout the world and sell our products globally. As a result, we are exposed to movements in the exchange rates of various currencies against the U.S. dollar and against the currencies of other countries in which we manufacture and sell products and services. During 2010,2013, approximately 66%80% of our sales were derived from operations outside the U.S., We have significant manufacturing operations in European countries that are not part of the Eurozone. Sales revenues are
40
more highly weighted toward the Euro and U.S. dollar. We also have significant contractual obligations in U.S. dollars that are met with approximately 62% generatedcash flows in other currencies as well as U.S. dollars. To better match revenue and expense as well as cash needs from contractual liabilities, we regularly enter into cross currency swaps and forward contracts.
We also face exchange rate risk from our investments in subsidiaries owned and operated in foreign countries. The Euro denominated borrowings under the Deutsche Bank Credit Agreement, provide a natural hedge to a portion of our European operations.net asset position. The effect of a change in currency exchange rates on our net investment in international subsidiaries, net of the translation effect of the Company’s euro denominated borrowings, is reflected in the Accumulated other comprehensive loss component of Equity. A 10% depreciation in major currencies, relative to the U.S. dollar as of December 31, 2013 (net of the translation effect of our euro denominated borrowings) would result in a reduction in Equity of approximately $150 million.
We also face exchange rate risk from transactions with customers in countries outside the U.S. and from intercompany transactions between affiliates. Although we use the U.S. dollar as our functional currency for reporting purposes, we have manufacturing sites throughout the world, and a substantial portion of our costs are incurred and sales are generated in foreign currencies. Costs incurred and sales recorded by subsidiaries operating outside of the U.S. are translated into U.S. dollars using exchange rates effective during the respective period. As a result, we are exposed to movements in the exchange rates of various currencies against the U.S. dollar. In particular, we havethe Company has more sales in European currencies than we haveit has expenses in those currencies. Therefore,Although a significant portion of this difference is hedged, when European currencies strengthen or weaken against the U.S. dollar, operating profits are increased or decreased, respectively. To assist with
We have generally accepted the matchingexposure to exchange rate movements without using derivative financial instruments to manage this risk. Both positive and negative movements in currency exchange rates against the U.S. dollar will, therefore, continue to affect the reported amount of revenues and expenses andsales, profit, assets and liabilities in foreign currencies, we may periodically enter into derivative instruments such as cross currency swaps or forward contracts. To illustrate the potential impact of changes in foreign currency exchange rates, assuming a 10% increase in average foreign exchange rates compared to the U.S. dollar, 2010 income before income taxes would have increased by $3.7 million.our Consolidated Financial Statements.
Commodity Price Risk
We are exposed to changes in the prices of raw materials used in our production processes. Commodity futures contracts are periodically used to manage such exposure. As of December 31, 2010,2013, we had no open commodity futures contracts.
See Note 14, “Financial Instruments and Fair Value Measurements” in the accompanying Notes to Consolidated Financial Statements included in this Form 10-K for additional information regarding our derivative instruments.
Item 8. Financial Statements and Supplementary Data
INDEX TO THE CONSOLIDATED FINANCIAL STATEMENTS
| Page | ||
| Report of | ||
| Report of | ||
| Consolidated Statements of Operations | ||
| Consolidated Statements of Comprehensive Income (Loss) | ||
| Consolidated Balance Sheets | ||
| Consolidated Statements of | ||
| Consolidated Statements of Cash Flows | ||
| Notes to Consolidated Financial Statements | ||
| Note 1. Organization and Nature of Operations | ||
| Note 2. Summary of Significant Accounting Policies | ||
| Note 3. Recently Issued Accounting Pronouncements | ||
| Note 4. Acquisitions | ||
| Note 5. Net Income (Loss) Per Share | ||
| Note 6. Income Taxes | ||
| Note 7. Goodwill and Intangible Assets | ||
| Note 8. Property, Plant and Equipment, Net | ||
| Note 9. Inventories, Net | ||
| Note 10. Debt | ||
| Note 11. Equity | ||
| Note 12. Accrued Liabilities | ||
| Note 13. Defined Benefit Plans | ||
| Note 14. Financial Instruments and Fair Value Measurements | ||
| Note 15. Commitments and Contingencies | ||
| Note 16. Segment Information | ||
| Note 17. Selected Quarterly Data—(unaudited) | ||
42
Report of Ernst & Young LLP, Independent Registered Public Accounting Firm
The Board of Directors and Shareholders of Colfax Corporation
We have audited Colfax Corporation’s internal control over financial reporting as of December 31, 2010,2013, based on criteria established in Internal Control—Integrated Framework issued by the Committee of Sponsoring Organizations of the Treadway Commission (1992 framework) (the COSO criteria). Colfax Corporation’s management is responsible for maintaining effective internal control over financial reporting, and for its assessment of the effectiveness of internal control over financial reporting included in the accompanying Management’s Annual Report on Internal Control overOver Financial Reporting. Our responsibility is to express an opinion on the company’s internal control over financial reporting based on our audit.
We conducted our audit in accordance with the standards of the Public Company Accounting Oversight Board (United States). Those standards require that we plan and perform the audit to obtain reasonable assurance about whether effective internal control over financial reporting was maintained in all material respects. Our audit included obtaining an understanding of internal control over financial reporting, assessing the risk that a material weakness exists, testing and evaluating the design and operating effectiveness of internal control based on the assessed risk, and performing such other procedures as we considered necessary in the circumstances. We believe that our audit provides a reasonable basis for our opinion.
A company’s internal control over financial reporting is a process designed to provide reasonable assurance regarding the reliability of financial reporting and the preparation of financial statements for external purposes in accordance with generally accepted accounting principles. A company’s internal control over financial reporting includes those policies and procedures that (1) pertain to the maintenance of records that, in reasonable detail, accurately and fairly reflect the transactions and dispositions of the assets of the company; (2) provide reasonable assurance that transactions are recorded as necessary to permit preparation of financial statements in accordance with generally accepted accounting principles, and that receipts and expenditures of the company are being made only in accordance with authorizations of management and directors of the company; and (3) provide reasonable assurance regarding prevention or timely detection of unauthorized acquisition, use, or disposition of the company’s assets that could have a material effect on the financial statements.
Because of its inherent limitations, internal control over financial reporting may not prevent or detect misstatements. Also, projections of any evaluation of effectiveness to future periods are subject to the risk that controls may become inadequate because of changes in conditions, or that the degree of compliance with the policies or procedures may deteriorate.
In our opinion, Colfax Corporation maintained, in all material respects, effective internal control over financial reporting as of December 31, 2010,2013, based on the COSO criteria.criteria.
We also have audited, in accordance with the standards of the Public Company Accounting Oversight Board (United States), the consolidated balance sheets of Colfax Corporation as of December 31, 20102013 and 20092012, and the related consolidated statements of operations, comprehensive income shareholders’(loss), equity, and cash flows for each of the three years in the period ended December 31, 20102013 of Colfax Corporation and our report dated February 25, 201112, 2014 expressed an unqualified opinion thereon.
/s/ Ernst & Young LLP
Baltimore, Maryland
Report of Ernst & Young LLP, Independent Registered Public Accounting Firm
Consolidated Financial Statements
The Board of Directors and Shareholders of Colfax Corporation
We have audited the accompanying consolidated balance sheets of Colfax Corporation as of December 31, 20102013 and 2009,2012, and the related consolidated statements of operations, comprehensive income shareholders'(loss), equity, and cash flows for each of the three years in the period ended December 31, 2010.2013. Our audits also included the financial statement schedule listed in the Index at Item 15(a).15. These financial statements and schedule are the responsibility of the Company's management. Our responsibility is to express an opinion on these consolidated financial statements and schedule based on our audits.
We conducted our audits in accordance with the standards of the Public Company Accounting Oversight Board (United States). Those standards require that we plan and perform the audit to obtain reasonable assurance about whether the financial statements are free of material misstatement. An audit includes examining, on a test basis, evidence supporting the amounts and disclosures in the financial statements. An audit also includes assessing the accounting principles used and significant estimates made by management, as well as evaluating the overall financial statement presentation. We believe that our audits provide a reasonable basis for our opinion.
In our opinion, the financial statements referred to above present fairly, in all material respects, the consolidated financial position of Colfax Corporation at December 31, 20102013 and 2009,2012, and the consolidated results of its operations and its cash flows for each of the three years in the period ended December 31, 2010,2013, in conformity with U.S. generally accepted accounting principles. Also, in our opinion, the related financial statement schedule, when considered in relation to the basic financial statements taken as a whole, presents fairly in all material respects the information set forth therein.
We also have audited, in accordance with the standards of the Public Company Accounting Oversight Board (United States), Colfax Corporation'sCorporation’s internal control over financial reporting as of December 31, 2010,2013, based on criteria established in Internal Control-Integrated Framework issued by the Committee of Sponsoring Organizations of the Treadway Commission (1992 framework) and our report dated February 25, 201112, 2014 expressed an unqualified opinion thereon.
/s/ Ernst & Young LLP
February 25, 201112, 2014
COLFAX CORPORATION
CONSOLIDATED STATEMENTS OF OPERATIONS
Dollars in thousands, except per share amounts
| Year Ended December 31, | |||||||||||
| 2013 | 2012 | 2011 | |||||||||
| Net sales | $ | 4,207,209 | $ | 3,913,856 | $ | 693,392 | |||||
| Cost of sales | 2,900,987 | 2,761,731 | 453,293 | ||||||||
| Gross profit | 1,306,222 | 1,152,125 | 240,099 | ||||||||
| Selling, general and administrative expense | 860,994 | 895,452 | 162,761 | ||||||||
| Charter acquisition-related expense | — | 43,617 | 31,052 | ||||||||
| Restructuring and other related charges | 35,502 | 60,060 | 9,680 | ||||||||
| Asbestos coverage litigation expense | 3,334 | 12,987 | 10,700 | ||||||||
| Operating income | 406,392 | 140,009 | 25,906 | ||||||||
| Interest expense | 103,597 | 91,570 | 5,919 | ||||||||
| Income before income taxes | 302,795 | 48,439 | 19,987 | ||||||||
| Provision for income taxes | 93,652 | 90,703 | 15,432 | ||||||||
| Net income (loss) | 209,143 | (42,264 | ) | 4,555 | |||||||
| Less: income attributable to noncontrolling interest, net of taxes | 30,515 | 22,138 | — | ||||||||
| Net income (loss) attributable to Colfax Corporation | 178,628 | (64,402 | ) | 4,555 | |||||||
| Dividends on preferred stock | 20,396 | 18,951 | — | ||||||||
| Net income (loss) available to Colfax Corporation common shareholders | $ | 158,232 | $ | (83,353 | ) | $ | 4,555 | ||||
| Net income (loss) per share- basic | $ | 1.56 | $ | (0.92 | ) | $ | 0.10 | ||||
| Net income (loss) per share- diluted | $ | 1.54 | $ | (0.92 | ) | $ | 0.10 | ||||
| Year ended December 31, | ||||||||||||
| 2010 | 2009 | 2008 | ||||||||||
| Net sales | $ | 541,987 | $ | 525,024 | $ | 604,854 | ||||||
| Cost of sales | 350,579 | 339,237 | 387,667 | |||||||||
| Gross profit | 191,408 | 185,787 | 217,187 | |||||||||
| Selling, general and administrative expenses | 119,426 | 112,503 | 124,105 | |||||||||
| Research and development expenses | 6,205 | 5,930 | 5,856 | |||||||||
| Restructuring and other related charges | 10,323 | 18,175 | - | |||||||||
| Initial public offering related costs | - | - | 57,017 | |||||||||
| Asbestos liability and defense costs (income) | 7,876 | (2,193 | ) | (4,771 | ) | |||||||
| Asbestos coverage litigation expenses | 13,206 | 11,742 | 17,162 | |||||||||
| Operating income | 34,372 | 39,630 | 17,818 | |||||||||
| Interest expense | 6,684 | 7,212 | 11,822 | |||||||||
| Income before income taxes | 27,688 | 32,418 | 5,996 | |||||||||
| Provision for income taxes | 11,473 | 8,621 | 5,465 | |||||||||
| Net income | 16,215 | 23,797 | 531 | |||||||||
| Dividends on preferred stock | - | - | (3,492 | ) | ||||||||
| Net income (loss) available to common shareholders | $ | 16,215 | $ | 23,797 | $ | (2,961 | ) | |||||
| Net income (loss) per share—basic and diluted | $ | 0.37 | $ | 0.55 | $ | (0.08 | ) | |||||
See accompanying notesNotes to consolidated financial statements.Consolidated Financial Statements.
45
COLFAX CORPORATION
CONSOLIDATED STATEMENTS OF COMPREHENSIVE INCOME (LOSS)
Dollars in thousands
| Year Ended December 31, | |||||||||||
| 2013 | 2012 | 2011 | |||||||||
| Net income (loss) | $ | 209,143 | $ | (42,264 | ) | $ | 4,555 | ||||
| Other comprehensive income (loss): | |||||||||||
| Foreign currency translation, net of tax of $(3,634), $(304) and $(18) | 6,202 | 117,703 | (11,465 | ) | |||||||
| Unrealized loss on hedging activities, net of tax of $404, $632 and $0 | (10,404 | ) | (4,008 | ) | (161 | ) | |||||
| Changes in unrecognized pension and other post-retirement benefits cost, net of tax of $575, $(5,835) and $(654) | 77,071 | (91,495 | ) | (34,291 | ) | ||||||
| Amounts reclassified from Accumulated other comprehensive loss: | |||||||||||
| Realized gain on hedging activities, net of tax of $0, $0 and $0 | — | 471 | 1,479 | ||||||||
| Net pension and other postretirement benefit cost, net of tax of $715, $256 and $114 | 10,022 | 8,557 | 4,160 | ||||||||
| Other comprehensive income (loss) | 82,891 | 31,228 | (40,278 | ) | |||||||
| Comprehensive income (loss) | 292,034 | (11,036 | ) | (35,723 | ) | ||||||
| Less: comprehensive income attributable to noncontrolling interest | 13,039 | 26,523 | — | ||||||||
| Comprehensive income (loss) attributable to Colfax Corporation | $ | 278,995 | $ | (37,559 | ) | $ | (35,723 | ) | |||
See Notes to Consolidated Financial Statements.
46
COLFAX CORPORATION
CONSOLIDATED BALANCE SHEETS
Dollars in thousands, except per share amounts
| December 31, | ||||||||
| 2010 | 2009 | |||||||
| ASSETS | ||||||||
| CURRENT ASSETS: | ||||||||
| Cash and cash equivalents | $ | 60,542 | $ | 49,963 | ||||
| Trade receivables, less allowance for doubtful accounts of $2,562 and $2,837 | 98,070 | 88,493 | ||||||
| Inventories, net | 57,941 | 71,150 | ||||||
| Deferred income taxes, net | 6,108 | 7,114 | ||||||
| Asbestos insurance asset | 34,117 | 31,502 | ||||||
| Asbestos insurance receivable | 46,108 | 35,891 | ||||||
| Prepaid expenses | 11,851 | 11,109 | ||||||
| Other current assets | 6,319 | 2,426 | ||||||
| Total current assets | 321,056 | 297,648 | ||||||
| Deferred income taxes, net | 52,385 | 51,838 | ||||||
| Property, plant and equipment, net | 89,246 | 92,090 | ||||||
| Goodwill | 172,338 | 163,418 | ||||||
| Intangible assets, net | 28,298 | 11,952 | ||||||
| Long-term asbestos insurance asset | 340,234 | 357,947 | ||||||
| Long-term asbestos insurance receivable | 5,736 | 16,876 | ||||||
| Deferred loan costs and other assets | 12,784 | 14,532 | ||||||
| Total assets | $ | 1,022,077 | $ | 1,006,301 | ||||
| LIABILITIES AND SHAREHOLDERS’ EQUITY | ||||||||
| CURRENT LIABILITIES: | ||||||||
| Current portion of long-term debt and capital leases | $ | 10,000 | $ | 8,969 | ||||
| Accounts payable | 50,896 | 36,579 | ||||||
| Accrued asbestos liability | 37,875 | 34,866 | ||||||
| Accrued payroll | 21,211 | 17,756 | ||||||
| Advance payments from customers | 17,250 | 5,896 | ||||||
| Accrued taxes | 6,173 | 2,154 | ||||||
| Accrued termination benefits | 2,180 | 9,473 | ||||||
| Other accrued liabilities | 45,925 | 35,406 | ||||||
| Total current liabilities | 191,510 | 151,099 | ||||||
| Long-term debt, less current portion | 72,500 | 82,516 | ||||||
| Long-term asbestos liability | 391,776 | 408,903 | ||||||
| Pension and accrued post-retirement benefits | 112,257 | 105,230 | ||||||
| Deferred income tax liability | 13,529 | 10,375 | ||||||
| Other liabilities | 24,134 | 31,353 | ||||||
| Total liabilities | 805,706 | 789,476 | ||||||
| Shareholders’ equity: | ||||||||
| Common stock: $0.001 par value; authorized 200,000,000; issued and outstanding 43,413,553 and 43,229,104 | 43 | 43 | ||||||
| Additional paid-in capital | 406,901 | 402,852 | ||||||
| Accumulated deficit | (60,058 | ) | (76,273 | ) | ||||
| Accumulated other comprehensive loss | (130,515 | ) | (109,797 | ) | ||||
| Total shareholders’ equity | 216,371 | 216,825 | ||||||
| Total liabilities and shareholders' equity | $ | 1,022,077 | $ | 1,006,301 | ||||
| December 31, | |||||||
| 2013 | 2012 | ||||||
| ASSETS | |||||||
| CURRENT ASSETS: | |||||||
| Cash and cash equivalents | $ | 311,301 | $ | 482,449 | |||
| Trade receivables, less allowance for doubtful accounts of $31,282 and $16,464 | 1,030,892 | 873,382 | |||||
| Inventories, net | 445,752 | 493,649 | |||||
| Other current assets | 350,401 | 282,266 | |||||
| Total current assets | 2,138,346 | 2,131,746 | |||||
| Property, plant and equipment, net | 757,140 | 688,570 | |||||
| Goodwill | 2,384,522 | 2,098,836 | |||||
| Intangible assets, net | 832,553 | 779,049 | |||||
| Other assets | 470,292 | 450,086 | |||||
| Total assets | $ | 6,582,853 | $ | 6,148,287 | |||
| LIABILITIES AND EQUITY | |||||||
| CURRENT LIABILITIES: | |||||||
| Current portion of long-term debt | $ | 29,449 | $ | 34,799 | |||
| Accounts payable | 860,380 | 699,626 | |||||
| Accrued liabilities | 485,261 | 447,220 | |||||
| Total current liabilities | 1,375,090 | 1,181,645 | |||||
| Long-term debt, less current portion | 1,457,642 | 1,693,512 | |||||
| Other liabilities | 1,009,006 | 1,116,844 | |||||
| Total liabilities | 3,841,738 | 3,992,001 | |||||
| Equity: | |||||||
| Preferred stock, $0.001 par value; 20,000,000 shares authorized; 13,877,552 issued and outstanding | 14 | 14 | |||||
| Common stock, $0.001 par value; 400,000,000 shares authorized; 101,921,613 and 94,067,418 issued and outstanding | 102 | 94 | |||||
| Additional paid-in capital | 2,541,005 | 2,197,694 | |||||
| Retained earnings (accumulated deficit) | 19,376 | (138,856 | ) | ||||
| Accumulated other comprehensive loss | (46,608 | ) | (146,594 | ) | |||
| Total Colfax Corporation equity | 2,513,889 | 1,912,352 | |||||
| Noncontrolling interest | 227,226 | 243,934 | |||||
| Total equity | 2,741,115 | 2,156,286 | |||||
| Total liabilities and equity | $ | 6,582,853 | $ | 6,148,287 | |||
See accompanying notesNotes to consolidated financial statements.Consolidated Financial Statements.
47
COLFAX CORPORATION
CONSOLIDATED STATEMENTS OF SHAREHOLDERS’ EQUITY AND
Dollars in thousands, except share amounts and as noted
Preferred Stock | Common Stock | Additional Paid-In Capital | Accumulated Deficit | Accumulated Other Comprehensive Loss | Total | |||||||||||||||||||
| Balance at December 31, 2007 | $ | 1 | $ | 22 | $ | 201,660 | $ | (97,109 | ) | $ | (38,138 | ) | $ | 66,436 | ||||||||||
| Comprehensive income (loss): | ||||||||||||||||||||||||
| Net income | - | - | - | 531 | - | 531 | ||||||||||||||||||
| Foreign currency translation, net of $-0- tax | - | - | - | - | (10,662 | ) | (10,662 | ) | ||||||||||||||||
| Unrealized losses on hedging activities, net of $-0- tax | - | - | - | - | (5,815 | ) | (5,815 | ) | ||||||||||||||||
| Changes in unrecognized pension and postretirement benefit costs, net of $1,731 tax benefit | - | - | - | - | (67,630 | ) | (67,630 | ) | ||||||||||||||||
| Amounts reclassified to net income: | ||||||||||||||||||||||||
| Losses on hedging activities, net of $-0- tax | - | - | - | - | 766 | 766 | ||||||||||||||||||
| Net pension and other postretirement benefit costs, net of $128 tax expense | - | - | - | - | 2,622 | 2,622 | ||||||||||||||||||
| Total comprehensive loss | - | - | - | 531 | (80,719 | ) | (80,188 | ) | ||||||||||||||||
| Net proceeds from initial public offering and conversion of preferred stock | (1 | ) | 22 | 192,999 | - | - | 193,020 | |||||||||||||||||
| Stock repurchase | - | (1 | ) | (5,730 | ) | - | - | (5,731 | ) | |||||||||||||||
| Stock-based award activity | - | - | 11,330 | - | - | 11,330 | ||||||||||||||||||
| Preferred dividends declared | - | - | - | (3,492 | ) | - | (3,492 | ) | ||||||||||||||||
| Balance at December 31, 2008 | - | 43 | 400,259 | (100,070 | ) | (118,857 | ) | 181,375 | ||||||||||||||||
| Comprehensive income (loss): | ||||||||||||||||||||||||
| Net income | - | - | - | 23,797 | - | 23,797 | ||||||||||||||||||
| Foreign currency translation, net of $7 tax benefit | - | - | - | - | 5,401 | 5,401 | ||||||||||||||||||
| Unrealized losses on hedging activities, net of $-0- tax | - | - | - | - | (866 | ) | (866 | ) | ||||||||||||||||
| Changes in unrecognized pension and postretirement benefit costs, net of $572 tax benefit | - | - | - | - | (910 | ) | (910 | ) | ||||||||||||||||
| Amounts reclassified to net income: | ||||||||||||||||||||||||
| Losses on hedging activities, net of $-0- tax | - | - | - | - | 2,881 | 2,881 | ||||||||||||||||||
| Net pension and other postretirement benefit costs, net of $1,438 tax expense | - | - | - | - | 2,554 | 2,554 | ||||||||||||||||||
| Total comprehensive income | - | - | - | 23,797 | 9,060 | 32,857 | ||||||||||||||||||
| Stock-based award activity | - | - | 2,593 | - | - | 2,593 | ||||||||||||||||||
| Balance at December 31, 2009 | - | 43 | 402,852 | (76,273 | ) | (109,797 | ) | 216,825 | ||||||||||||||||
| Comprehensive income (loss): | ||||||||||||||||||||||||
| Net income | - | - | - | 16,215 | - | 16,215 | ||||||||||||||||||
| Foreign currency translation, net of $1,224 tax benefit | - | - | - | - | (8,260 | ) | (8,260 | ) | ||||||||||||||||
| Unrealized losses on hedging activities, net of $-0- tax | - | - | - | - | (1,201 | ) | (1,201 | ) | ||||||||||||||||
| Changes in unrecognized pension and postretirement benefit costs, net of $1,717 tax benefit | - | - | - | - | (18,690 | ) | (18,690 | ) | ||||||||||||||||
| Amounts reclassified to net income: | ||||||||||||||||||||||||
| Losses on hedging activities, net of $-0- tax | - | - | - | - | 2,447 | 2,447 | ||||||||||||||||||
| Net pension and other postretirement benefit costs, net of $89 tax expense | - | - | - | - | 4,986 | 4,986 | ||||||||||||||||||
| Total comprehensive loss | - | - | - | 16,215 | (20,718 | ) | (4,503 | ) | ||||||||||||||||
| Stock-based award activity | - | - | 4,049 | - | - | 4,049 | ||||||||||||||||||
| Balance at December 31, 2010 | $ | - | $ | 43 | $ | 406,901 | $ | (60,058 | ) | $ | (130,515 | ) | $ | 216,371 | ||||||||||
| Common Stock | Preferred Stock | Additional Paid-In Capital | (Accumulated Deficit) Retained Earnings | Accumulated Other Comprehensive Loss | Noncontrolling Interest | Total | |||||||||||||||||||
| Shares | $ Amount | Shares | $ Amount | ||||||||||||||||||||||
| Balance at January 1, 2011 | 43,413,553 | $ | 43 | — | $ | — | $ | 406,901 | $ | (60,058 | ) | $ | (130,515 | ) | $ | — | $ | 216,371 | |||||||
| Net income | — | — | — | — | — | 4,555 | — | — | 4,555 | ||||||||||||||||
| Other comprehensive loss | — | — | — | — | — | — | (40,278 | ) | — | (40,278 | ) | ||||||||||||||
| Common stock-based award activity | 284,017 | 1 | — | — | 8,626 | — | — | — | 8,627 | ||||||||||||||||
| Balance at December 31, 2011 | 43,697,570 | 44 | — | — | 415,527 | (55,503 | ) | (170,793 | ) | — | 189,275 | ||||||||||||||
| Net (loss) income | — | — | — | — | — | (64,402 | ) | — | 22,138 | (42,264 | ) | ||||||||||||||
| Acquisitions | — | — | — | — | — | — | — | 259,229 | 259,229 | ||||||||||||||||
| Sale of stock of entity previously controlled | — | — | — | — | — | — | — | (4,414 | ) | (4,414 | ) | ||||||||||||||
| Distributions to noncontrolling owners | — | — | — | — | — | — | — | (9,721 | ) | (9,721 | ) | ||||||||||||||
| Acquisition of shares held by noncontrolling interest | — | — | — | — | 1,035 | — | (2,644 | ) | (27,683 | ) | (29,292 | ) | |||||||||||||
| Preferred stock dividend | — | — | — | — | — | (18,951 | ) | — | — | (18,951 | ) | ||||||||||||||
| Other comprehensive income, net of tax of $5.3 million | — | — | — | — | — | — | 26,843 | 4,385 | 31,228 | ||||||||||||||||
| Common stock issuances, net of costs of $20.2 million | 49,917,786 | 50 | — | — | 1,432,921 | — | — | — | 1,432,971 | ||||||||||||||||
| Preferred stock issuances, net of costs of $7.0 million | — | — | 13,877,552 | 14 | 332,958 | — | — | — | 332,972 | ||||||||||||||||
| Common stock-based award activity | 452,062 | — | — | — | 15,253 | — | — | — | 15,253 | ||||||||||||||||
| Balance at December 31, 2012 | 94,067,418 | 94 | 13,877,552 | 14 | 2,197,694 | (138,856 | ) | (146,594 | ) | 243,934 | 2,156,286 | ||||||||||||||
| Net income | — | — | — | — | — | 178,628 | — | 30,515 | 209,143 | ||||||||||||||||
| Distributions to noncontrolling owners | — | — | — | — | — | — | — | (14,260 | ) | (14,260 | ) | ||||||||||||||
| Acquisition of shares held by noncontrolling interest | — | — | — | — | 955 | — | (381 | ) | (15,487 | ) | (14,913 | ) | |||||||||||||
| Preferred stock dividend | — | — | — | — | — | (20,396 | ) | — | — | (20,396 | ) | ||||||||||||||
| Other comprehensive income (loss), net of tax of $1.9 million | — | — | — | — | — | — | 100,367 | (17,476 | ) | 82,891 | |||||||||||||||
| Common stock issuances, net of costs of $12.0 million | 7,500,000 | 8 | — | — | 319,890 | — | — | — | 319,898 | ||||||||||||||||
| Common stock-based award activity | 265,995 | — | — | — | 17,589 | — | — | — | 17,589 | ||||||||||||||||
| Contribution to defined benefit pension plan | 88,200 | — | — | — | 4,877 | — | — | — | 4,877 | ||||||||||||||||
| Balance at December 31, 2013 | 101,921,613 | $ | 102 | 13,877,552 | $ | 14 | $ | 2,541,005 | $ | 19,376 | $ | (46,608 | ) | $ | 227,226 | $ | 2,741,115 | ||||||||
See accompanying notesNotes to consolidated financial statements.Consolidated Financial Statements.
48
COLFAX CORPORATION
CONSOLIDATED STATEMENTS OF CASH FLOWS
Dollars in thousands
| Year ended December 31, | ||||||||||||
| 2010 | 2009 | 2008 | ||||||||||
| Cash flows from operating activities: | ||||||||||||
| Net income | $ | 16,215 | $ | 23,797 | $ | 531 | ||||||
| Adjustments to reconcile net income to cash provided by (used in) operating activities: | ||||||||||||
| Depreciation, amortization and fixed asset impairment charges | 16,130 | 15,074 | 14,788 | |||||||||
| Noncash stock-based compensation | 3,137 | 2,593 | 11,330 | |||||||||
| Write off of deferred loan costs | - | - | 4,614 | |||||||||
| Amortization of deferred loan costs | 677 | 677 | 934 | |||||||||
| Loss (gain) on sale of fixed assets | 90 | (64 | ) | 60 | ||||||||
| Deferred income taxes | (296 | ) | 2,689 | (13,330 | ) | |||||||
| Changes in operating assets and liabilities, net of acquisitions: | ||||||||||||
| Trade receivables | (6,060 | ) | 16,280 | (20,612 | ) | |||||||
| Inventories | 11,598 | 10,763 | (15,556 | ) | ||||||||
| Accounts payable and accrued liabilities, excluding asbestos | ||||||||||||
| related accrued expenses | 21,759 | (20,899 | ) | 7,044 | ||||||||
| Other current assets | (934 | ) | 2,605 | (3,285 | ) | |||||||
| Change in asbestos liability and asbestos-related accrued expenses, net of asbestos insurance asset and receivable | 9,659 | (10,166 | ) | (9,457 | ) | |||||||
| Changes in other operating assets and liabilities | (10,010 | ) | (4,645 | ) | (10,042 | ) | ||||||
| Net cash provided by (used in) operating activities | 61,965 | 38,704 | (32,981 | ) | ||||||||
| Cash flows from investing activities: | ||||||||||||
| Purchases of fixed assets | (12,527 | ) | (11,006 | ) | (18,645 | ) | ||||||
| Acquisitions, net of cash received | (27,960 | ) | (1,678 | ) | (439 | ) | ||||||
| Proceeds from sale of fixed assets | 74 | 219 | 23 | |||||||||
| Net cash used in investing activities | (40,413 | ) | (12,465 | ) | (19,061 | ) | ||||||
| Cash flows from financing activities: | ||||||||||||
| Borrowings under term credit facility | - | - | 100,000 | |||||||||
| Payments under term credit facility | (8,750 | ) | (5,000 | ) | (210,278 | ) | ||||||
| Proceeds from borrowings on revolving credit facilities | 5,500 | - | 28,185 | |||||||||
| Repayments of borrowings on revolving credit facilities | (5,500 | ) | - | (28,158 | ) | |||||||
| Payments on capital leases | (205 | ) | (417 | ) | (309 | ) | ||||||
| Payments for loan costs | - | - | (3,347 | ) | ||||||||
| Net proceeds from stock-based awards | 912 | - | - | |||||||||
| Proceeds from the issuance of common stock, net of offering costs | - | - | 193,020 | |||||||||
| Repurchases of common stock | - | - | (5,731 | ) | ||||||||
| Dividends paid to preferred shareholders | - | - | (38,546 | ) | ||||||||
| Net cash (used in) provided by financing activities | (8,043 | ) | (5,417 | ) | 34,836 | |||||||
| Effect of exchange rates on cash | (2,930 | ) | 379 | (2,125 | ) | |||||||
| Increase (decrease) in cash and cash equivalents | 10,579 | 21,201 | (19,331 | ) | ||||||||
| Cash and cash equivalents, beginning of year | 49,963 | 28,762 | 48,093 | |||||||||
| Cash and cash equivalents, end of year | $ | 60,542 | $ | 49,963 | $ | 28,762 | ||||||
| Cash interest paid | $ | 6,105 | $ | 6,615 | $ | 9,970 | ||||||
| Cash income taxes paid | $ | 5,819 | $ | 16,596 | $ | 18,534 | ||||||
| Year Ended December 31, | |||||||||||
| 2013 | 2012 | 2011 | |||||||||
| Cash flows from operating activities: | |||||||||||
| Net income (loss) | $ | 209,143 | $ | (42,264 | ) | $ | 4,555 | ||||
| Adjustments to reconcile net income (loss) to net cash provided by operating activities: | |||||||||||
| Depreciation, amortization and fixed asset impairment charges | 119,258 | 183,403 | 22,598 | ||||||||
| Stock-based compensation expense | 13,334 | 9,373 | 4,908 | ||||||||
| Non-cash interest expense | 44,377 | 16,997 | 735 | ||||||||
| Gain on revaluation of Sicelub investment | (13,784 | ) | — | — | |||||||
| Unrealized loss on acquisition-related foreign currency derivative | — | — | 21,146 | ||||||||
| Deferred income tax provision (benefit) | 9,946 | 7,222 | (1,722 | ) | |||||||
| Changes in operating assets and liabilities, net of acquisitions: | |||||||||||
| Trade receivables, net | (98,912 | ) | (37,338 | ) | (5,972 | ) | |||||
| Inventories, net | 79,987 | 26,694 | 10,844 | ||||||||
| Accounts payable | 128,889 | 88,927 | (7,298 | ) | |||||||
| Changes in other operating assets and liabilities | (130,069 | ) | (78,994 | ) | 7,359 | ||||||
| Net cash provided by operating activities | 362,169 | 174,020 | 57,153 | ||||||||
| Cash flows from investing activities: | |||||||||||
| Purchases of fixed assets, net | (71,482 | ) | (83,187 | ) | (13,624 | ) | |||||
| Acquisitions, net of cash received | (372,476 | ) | (1,859,645 | ) | (56,346 | ) | |||||
| Loans to non-trade creditors | (31,012 | ) | — | — | |||||||
| Other, net | — | 1,857 | — | ||||||||
| Net cash used in investing activities | (474,970 | ) | (1,940,975 | ) | (69,970 | ) | |||||
| Cash flows from financing activities: | |||||||||||
| Borrowings under term credit facility | 50,861 | 1,731,523 | — | ||||||||
| Payments under term credit facility | (679,755 | ) | (531,415 | ) | (10,000 | ) | |||||
| Proceeds from borrowings on revolving credit facilities | 648,000 | 13,149 | 141,203 | ||||||||
| Repayments of borrowings on revolving credit facilities | (328,133 | ) | (53,414 | ) | (102,180 | ) | |||||
| Proceeds from issuance of common stock, net | 324,153 | 756,762 | 3,719 | ||||||||
| Proceeds from issuance of preferred stock, net | — | 332,969 | — | ||||||||
| Acquisition of shares held by noncontrolling interest | (14,913 | ) | (29,292 | ) | — | ||||||
| Payments of dividend on preferred stock | (20,396 | ) | (17,446 | ) | — | ||||||
| Other | (24,870 | ) | (19,608 | ) | — | ||||||
| Net cash (used in) provided by financing activities | (45,053 | ) | 2,183,228 | 32,742 | |||||||
| Effect of foreign exchange rates on Cash and cash equivalents | (13,294 | ) | (8,932 | ) | (5,359 | ) | |||||
| (Decrease) increase in Cash and cash equivalents | (171,148 | ) | 407,341 | 14,566 | |||||||
| Cash and cash equivalents, beginning of period | 482,449 | 75,108 | 60,542 | ||||||||
| Cash and cash equivalents, end of period | $ | 311,301 | $ | 482,449 | $ | 75,108 | |||||
| Supplemental Disclosure of Cash Flow Information: | |||||||||||
| Interest payments | $ | 58,970 | $ | 79,857 | $ | 5,209 | |||||
| Income tax payments, net | 93,856 | 70,677 | 16,731 | ||||||||
See accompanying notesNotes to consolidated financial statements.Consolidated Financial Statements.
COLFAX CORPORATION
NOTES TO CONSOLIDATED FINANCIAL STATEMENTS
1. Organization and Nature of Operations
Colfax Corporation (the “Company”, or “Colfax”, “we”, “our” or “us”) is a diversified global supplierindustrial manufacturing and engineering company that provides gas- and fluid-handling and fabrication technology products and services to customers around the world under the Howden, ESAB and Colfax Fluid Handling brand names.
During the three months ended March 29, 2013, adjustments were made retrospectively to provisional amounts recorded as of a broad range of fluid handling products, including pumps, fluid handling systems and controls, and specialty valves. We believe that we are a leading manufacturer of rotary positive displacement pumps, which include screw pumps, gear pumps and progressive cavity pumps. We have a global manufacturing footprint, with production facilities in Europe, North America and Asia, as well as worldwide sales and distribution channels. Our products serve a variety of applications in five strategic markets: commercial marine, oil and gas, power generation, defense and general industrial. We design and engineer our productsDecember 31, 2012, due to high quality and reliability standards for use in critical fluid handling applications where performance is paramount. We also offer customized fluid handling solutions to meet individual customer needs based on our in-depth technical knowledgethe finalization of the applications in which our products are used. Our products are marketed principally undervaluation of specific tax items related to the Allweiler, Baric, Fairmount, Houttuin, Imo, LSC, Portland Valve, Tushaco, Warren, and Zenith brand names. We believe that our brands are widely known and have a premium position in our industry. Allweiler, Houttuin, Imo and Warren are among the oldest and most recognized brands in the fluid handling industry, with Allweiler dating back to 1860.acquisition of Charter International plc (“Charter”) by Colfax (the “Charter Acquisition”). See Note 4, “Acquisitions” for additional information regarding these adjustments.
2. Summary of Significant Accounting Policies
Principles of Consolidation
The consolidated financial statementsCompany’s Consolidated Financial Statements include the accounts of the Company and its subsidiaries. Less than wholly owned subsidiaries, including joint ventures, are consolidated when it is determined that the Company has a controlling financial interest, which is generally determined when the Company holds a majority voting interest. When protective rights, substantive rights or other factors exist, further analysis is performed in order to determine whether or not there is a controlling financial interest. The Company owns 44%Consolidated Financial Statements reflect the assets, liabilities, revenues and expenses of consolidated subsidiaries and the common shares of Sistemas Centrales de Lubricación S.A. de C.V., a Mexican company and 28% of the common shares of Allweiler Al-Farid Pumps Company (S.A.E.), an Egyptian Corporation. These investments are recorded in these financial statements using the equity method of accounting. Accordingly, $7.2 million and $6.6 million are recorded in other assets on the consolidated balance sheets at December 31, 2010 and 2009, respectively. The Company records itsnoncontrolling parties’ ownership share of these investments’ net earnings, based on its economic ownership percentage. Accordingly, $1.8 million, $1.5 million and $1.5 million of earnings from equity investments were includedis presented as a reduction of selling, general and administrative expenses on the consolidated statements of operations for each of the three years ended December 31, 2010, 2009 and 2008, respectively.noncontrolling interest. All significant intercompany accounts and transactions have been eliminated.
Equity Method Investments
Investments in joint ventures, where the Company has a significant influence but not a controlling interest, are accounted for using the equity method of accounting. Investments accounted for under the equity method are initially recorded at the amount of the Company’s initial investment and adjusted each period for the Company’s share of the investee’s income or loss and dividends paid. All equity investments are reviewed periodically for indications of other than temporary impairment, including, but not limited to, significant and sustained decreases in quoted market prices or a series of historic and projected operating losses by investees. If the decline in fair value is considered to be other than temporary, an impairment loss is recorded and the investment is written down to a new carrying value. Investments in joint ventures acquired in a business combination are recognized in the opening balance sheet at fair value.
Revenue Recognition
The Company generally recognizes revenues and costs from product sales when title passes to the buyer and all of the following criteria are met: persuasive evidence of an arrangement exists, the price is fixed andor determinable, product delivery has occurred or services have been rendered, there are no further obligations to customers, and collectibilitycollectability is probable.reasonably assured. Product delivery occurs when title and risk of loss transfer to the customer. The Company’s shipping terms vary based on the contract. If any significant obligations to the customer with respect to such sale remain to be fulfilled following shipments, typically involving obligations relating to installation and acceptance by the buyer, revenue recognition is deferred until such obligations have been fulfilled. Any customer allowances and discounts are recorded as a reduction in reported revenues at the time of sale because these allowances reflect a reduction in the sales price for the products sold. These allowances and discounts are estimated based on historical experience and known trends. Revenue related to service agreements is recognized as revenue over the term of the agreement. Progress billings are generally shown as a reduction of Inventories, net unless such billings are in excess of accumulated costs, in which case such balances are included in Accrued liabilities in the Consolidated Balance Sheets.
The Company recognizes revenue and cost of sales on gas-handling construction projects using the “percentage of completion method” in accordance with accounting principles generally accepted in the United States of America (“GAAP”). Under this method, contract revenues are recognized over the performance period of the contract in direct proportion to the costs incurred as a percentage of total estimated costs for the entirety of the contract. Any recognized revenues that have not been billed to a customer are recorded as a component of Trade receivables and any billings of customers in excess of recognized revenues are recorded as a component of Accounts payable. As of December 31, 2013, there were $231.3 million of revenues in excess of billings and $214.8 million of billings in excess of revenues on construction contracts in the Consolidated Balance Sheet. As of December 31, 2012, there were $97.1 million of revenues in excess of billings and $178.3 million of billings in excess of revenues on construction contracts in the Consolidated Balance Sheet.
50
COLFAX CORPORATION
NOTES TO CONSOLIDATED FINANCIAL STATEMENTS — (Continued)
group.
Amounts billed for shipping and handling are recorded as revenue. Shipping and handling expenses are recorded as cost of sales. Progress billings are generally shown as a reduction of inventory unless such billings are in excess of accumulated costs, in which case such balances are included in accrued liabilities. The Company accrues for bad debts, as a component of selling, general, and administrative expenses, based upon estimatesCost of amounts deemed uncollectible and a specific review of significant delinquent accounts factoring in current and expected economic conditions. Product return reserves are accrued at the time of sale based on historical rates, and are recorded as a reduction to net sales.
Taxes Collected from Customers and Remitted to Governmental Authorities
The Company collects various taxes and fees as an agent in connection with the sale of products and remits these amounts to the respective taxing authorities. These taxes and fees have been presented on a net basis in the consolidated statementsConsolidated Statements of operationsOperations and are recorded as a liabilitycomponent of Accrued liabilities in the Consolidated Balance Sheets until remitted to the respective taxing authority.
Research and Development Expense
Research and development costs are expensed as incurred.
Advertising Costs
Advertising costs of $17.0 million, $15.7 million, and $1.2 million for the years ended December 31, 2013, 2012 and 2011, respectively, are expensed as incurred and are included in Selling, general and administrative expense in the Consolidated Statements of Operations.
Cash and Cash Equivalents
Cash and cash equivalents include all financial instruments purchased with an initial maturity of three months or less.
Trade Receivables
Inventories
Inventories, net include the costscost of material, labor and overhead. Inventoriesoverhead and are stated at the lower of cost (determined under various methods, but predominantly first-in, first-out) or market. CostFor gas-handling construction projects, cost is primarily determined using the first-in, first-out method.based upon actual cost. The Company periodically reviews its quantities of inventories on hand and compares these amounts to the expected usage of each particular product. The Company records as a charge to costCost of sales any amounts required to reduce the carrying value of inventories to net realizable value.
Property, Plant and Equipment
Property, plant and equipment, net are stated at historical cost, which includes the fair values of such assets acquired. Depreciation of property, plant and equipment is provided forrecorded on a straight-line basis over estimated useful lives ranging from three to 40 years.lives. Assets recorded under capital leases are amortized over the shorter of their estimated useful lives or the lease terms. The estimated useful lives or lease terms, of assetswhich range from three to 4015 years. RepairsRepair and maintenance expenditures are expensed as incurred unless the repair extends the useful life of the asset.
51
COLFAX CORPORATION
NOTES TO CONSOLIDATED FINANCIAL STATEMENTS — (Continued)
Impairment of Goodwill and Indefinite-Lived Intangible Assets
Goodwill represents the costs in excess of the fair value of net assets acquired associated with acquisitions by the Company. Indefinite-lived intangible assets consist of trade names.
The Company evaluates the recoverability of goodwillGoodwill and indefinite-lived intangible assets annually or more frequently if an event occurs or circumstances change in the interim that would more likely than not reduce the fair value of the asset below its carrying amount. Goodwill is considered to be impaired when the net book value of a reporting unit exceeds its estimated fair value.
In the evaluation of goodwillGoodwill for impairment, the Company first comparesassesses qualitative factors to determine whether it is more likely than not that the fair value of thea reporting unit toentity is less than its carrying value. If the Company determines that it is not more likely than not for a reporting unit’s fair value to be less than its carrying value, a calculation of the fair value is not performed. If the Company determines that it is more likely than not for a reporting unit’s fair value to be less than its carrying value, a calculation of the reporting entity’s fair value is performed and compared to the carrying value of that entity. If the carrying value of a reporting unit exceeds its fair value, the goodwill ofGoodwill attributable to that reporting unit is potentially impaired and step two of the impairment analysis is performed. In step two of the analysis, an impairment loss is recorded equal to the excess of the carrying value of the reporting unit’s goodwillGoodwill over its implied fair value should such a circumstance arise.
The Company measures fair value of reporting units based on a present value of future discounted cash flows or a market valuation approach. The discounted cash flows model indicates the fair value of the reporting units based on the present value of the cash flows that the reporting units are expected to generate in the future. Significant estimates in the discounted cash flows model include: the weighted averageweighted-average cost of capital; long-term rate of growth and profitability of ourthe Company’s business; and working capital effects. The market valuation approach indicates the fair value of the business based on a comparison of the Company against certain market information. Significant estimates in the market approach model include identifying appropriate market multiples and assessing earnings before interest, income taxes, depreciation and amortization (EBITDA) in estimating the fair value of the reporting units.
In the evaluation of indefinite-lived intangible assets for impairment, the Company first assesses qualitative factors to determine whether it is more likely than not that the fair value of the indefinite-lived intangible asset is less than its carrying value. If the Company determines that it is not likely for the indefinite-lived intangible asset’s fair value to be less than its carrying value, a calculation of the fair value is not performed. If the Company determines that it is more likely than not that the indefinite-lived intangible asset’s fair value is less than its carrying value, a calculation is performed and compared to the carrying value of the asset. If the carrying amount of the indefinite-lived intangible asset exceeds its fair value, an impairment loss is recognized in an amount equal to that excess. The Company measures the fair value of its indefinite-lived intangible assets using the “relief from royalty” method. Significant estimates in this approach include royalty and discount rates for each trade name evaluated.
The analysis performed as of October 2, 2010,September 28, 2013, indicated no impairment to be present, except for $0.2 million of impairment loss related to an indefinite-lived intangible asset included in the gas- and fluid-handling segment for the year ended December 31, 20092013. This impairment results from a decline in anticipated revenue related to this asset. The impairment loss is included in Selling, general and 2008administrative expense in the Consolidated Statement of Operations and was calculated as the difference between the fair value of the asset under the relief from royalty method and its carrying value as of the date of the impairment test. The fair value of that intangible asset of $2.8 million as of December 31, 2013 is included in Level Three of the fair value hierarchy and is not material to the Consolidated Financial Statements.
The impairment analyses performed as of September 29, 2012 and October 1, 2011 indicated no impairment to be present.
Impairment of Long-Lived Assets Other than Goodwill and Indefinite-Lived Intangible Assets
Intangibles primarily represent acquired customer relationships, acquired order backlog, acquired technology and software license agreements and patents.agreements. Acquired order backlog is amortized in the same period the corresponding revenue is recognized. A portion of the Company’s acquired customer relationships is being amortized over seven years based on the present value of the future cash flows expected to be generated from the acquired customers. All other intangibles are being amortized on a straight-line basis over their estimated useful lives, generally ranging from threetwo to 1520 years.
The Company assesses its long-lived assets other than goodwillGoodwill and indefinite-lived intangible assets for impairment whenever facts and circumstances indicate that the carrying amounts may not be fully recoverable. To analyze recoverability, the Company projects undiscounted net future cash flows over the remaining lives of such assets. If these projected cash flows are less than the carrying amounts, an impairment loss would be recognized, resulting in a write-down of the assets with a corresponding charge
52
COLFAX CORPORATION
NOTES TO CONSOLIDATED FINANCIAL STATEMENTS — (Continued)
to earnings. The impairment loss is measured based upon the difference between the carrying amounts and the fair values of the assets. Assets to be disposed of are reported at the lower of the carrying amounts or fair value less cost to sell. Management determines fair value using the discounted cash flow method or other accepted valuation techniques. The Company recorded asset impairment losses related to facility closures totaling $0.6$1.9 million and $3.2 million during the years ended December 31, 2013 and 2012, respectively, as a component of Restructuring and other related charges in 2009the Consolidated Statements of Operations and $0.1 million during the year ended December 31, 2011 as a component of Selling, general and administrative expense in connection with the closureConsolidated Statement of two facilities. No such impairments were recorded in 2010 or 2008.Operations.
Derivatives
The Company periodically enters intois subject to foreign currency interest rate swap, and commodity derivative contracts. The Company uses interest rate swaps to manage exposure to interest rate fluctuations. Foreign currency contracts are used to manage exchange rate fluctuations and generally hedge transactions betweenrisk associated with the Euro and the U.S. dollar. Commodity futures contracts are used to manage costs of raw materials used in the Company’s production processes.
Derivative instruments are generally recognized on a gross basis in the Consolidated Balance Sheets in either Other current assets, Other assets, Accrued liabilities or Other liabilities depending upon their respective fair values and maturity dates. The Company designates a portion of its foreign exchange contracts as fair value hedges. For all instruments designated as hedges, including net investment hedges, cash flow hedges for accounting purposes. For all derivatives designated asand fair value hedges, wethe Company formally documentdocuments the relationship between the hedging instrument and the hedged item, as well as the risk management objective and the strategy for using the hedging instrument. We assessThe Company assesses whether the hedging relationship between the derivativehedging instrument and the hedged item is highly effective at offsetting changes in the cash flowsfair value both at inception of the hedging relationship and on an ongoing basis. AnyFor cash flow hedges and net investment hedges, unrealized gains and losses are recognized as a component of Accumulated other comprehensive loss in the Consolidated Balance Sheets to the extent that it is effective at offsetting the change in the fair value of the derivative that is not effective at offsetting changeshedged item and realized gains and losses are recognized in the cash flows or fair valuesConsolidated Statements of Operations consistent with the underlying hedged item is recognized currently in earnings.
The Company does not designated as hedges are recognized currently in earnings.enter into derivative contracts for trading purposes.
See Note 14, “Financial Instruments and Fair Value Measurements” for additional information regarding the Company’s derivative instruments.
Self-Insurance
| December 31, | ||||||||
| 2013 | 2012 | |||||||
| (In thousands) | ||||||||
| Medical insurance | $ | 2,846 | $ | 383 | ||||
| Workers’ compensation | 1,616 | 1,868 | ||||||
| Total self-insurance accruals | $ | 4,462 | $ | 2,251 | ||||
| December 31, | ||||||||
| 2010 | 2009 | |||||||
| Medical insurance | $ | 702 | $ | 697 | ||||
| Workers' compensation | 153 | 189 | ||||||
| Total self-insurance reserves | $ | 855 | $ | 886 | ||||
Warranty Costs
Estimated expenses related to product warranties are accrued atas the timerevenue is recognized on products are sold to customers and recorded as partincluded in Cost of costsales in the Consolidated Statements of sales.Operations. Estimates are established using historical information as to the nature, frequency, and average costs of warranty claims.
53
COLFAX CORPORATION
NOTES TO CONSOLIDATED FINANCIAL STATEMENTS — (Continued)
The activity forin the years ended December 31, 2010Company’s warranty liability, which is included in Accrued liabilities and 2009Other liabilities in the Company’s Consolidated Financial Statements, consisted of the following:
| 2010 | 2009 | |||||||
| Warranty liability at beginning of the year | $ | 2,852 | $ | 3,108 | ||||
| Accrued warranty expense, net of adjustments | 2,079 | 1,651 | ||||||
| Changes in estimates related to pre-existing warranties | (589 | ) | (798 | ) | ||||
| Cost of warranty service work performed | (1,264 | ) | (1,191 | ) | ||||
| Foreign exchange translation effect | (115 | ) | 82 | |||||
| Warranty liability at end of the year | $ | 2,963 | $ | 2,852 | ||||
| Year Ended December 31, | |||||||
| 2013 | 2012 | ||||||
| (In thousands) | |||||||
| Warranty liability, beginning of period | $ | 40,437 | $ | 2,987 | |||
| Accrued warranty expense | 25,013 | 10,468 | |||||
| Changes in estimates related to pre-existing warranties | (638 | ) | 9 | ||||
| Cost of warranty service work performed | (21,082 | ) | (23,457 | ) | |||
| Acquisitions | 18,569 | 51,367 | |||||
| Foreign exchange translation effect | (827 | ) | (937 | ) | |||
| Warranty liability, end of period | $ | 61,472 | $ | 40,437 | |||
Income Taxes
Income taxes for the Company are accounted for under the asset and liability method. Deferred income tax assets and liabilities are recognized for the future tax consequences attributable to differences between the financial statement carrying amounts of existing assets and liabilities in the Consolidated Financial Statements and their respective tax bases.basis. Deferred income tax assets and liabilities are measured using enacted tax rates expected to applybe applied to taxable income in the years in which those temporary differences are expected to be recovered or settled. The effect on deferred income tax assets and liabilities of a change in tax rates is generally recognized in Provision for income taxes in the period that includes the enactment date.
Valuation allowances are recorded if it is more likely than not that some portion of the deferred income tax assetassets will not be realized. In evaluating the need for a valuation allowance, we takethe Company takes into account various factors, including the expected level of future taxable income and available tax planning strategies. If actual results differ fromAny changes in judgment about the assumptions madevaluation allowance are recorded through Provision for income taxes and are based on changes in facts and circumstances regarding realizability of deferred tax assets.
The Company must presume that an income tax position taken in a tax return will be examined by the relevant tax authority and determine whether it is more likely than not that the tax position will be sustained upon examination based upon the technical merits of the position. An income tax position that meets the more-likely-than-not recognition threshold is measured to determine the amount of benefit to recognize in the evaluation of our valuation allowance, we recordfinancial statements. The Company establishes a change in valuation allowance throughliability for unrecognized income tax expense or other comprehensivebenefits for income tax positions for which it is more likely than not that a tax position will not be sustained upon examination by the respective taxing authority to the extent such tax positions reduce the Company’s income tax liability. The Company recognizes interest and penalties related to unrecognized income tax benefits in the period such determination is made.
Provision for income taxes in the Consolidated Statements of Operations.
Foreign Currency Exchange Gains and Losses
The Company’s financial statements are presented in U.S. dollars. The functional currencies of the Company’s operating subsidiaries are generally the local currencies of the countries in which each subsidiary is located. Assets and liabilities denominated in foreign currencies are translated at rates of exchange in effect at the balance sheet date. Revenues and expenses are translated at average rates of exchange in effect during the year. The amounts recorded in each year are net of income taxes to the extent the underlying equity balances in the entities are not deemed to be permanently reinvested.
Transactions in foreign currencies are translated at the exchange rate in effect at the date of each transaction. Differences in exchange rates during the period between the date a transaction denominated in a foreign currency is consummated and the date on which it is either settled or translated for inclusion in the consolidated balance sheetsConsolidated Balance Sheets are recognized in Selling, general and administrative expense or Interest expense in the consolidatedConsolidated Statements of Operations for that period.
During the three months ended March 29, 2013, Venezuela devalued its currency to an official rate of 6.3 bolivar fuerte (“bolivar”) to the U.S. dollar, representing an approximate 32% devaluation of its currency relative to the U.S. dollar. The Company currently considers the bolivar a highly inflationary currency under GAAP. Therefore, financial statements of the Company’s
54
COLFAX CORPORATION
NOTES TO CONSOLIDATED FINANCIAL STATEMENTS — (Continued)
Venezuelan operations are remeasured into their parents’ reporting currency. Exchange gains and losses from the re-measurement of monetary assets and liabilities are reflected in current earnings. Future impacts to earnings of applying highly inflationary accounting for that period.Venezuela on the Company’s Consolidated Financial Statements will be dependent upon movements in the applicable exchange rates between the bolivar and the parents’ reporting currency and the amount of monetary assets and liabilities included in the Company’s Venezuelan operations’ balance sheets. As of and for the year ended December 31, 2013, the Company’s Venezuelan operations represented less than 1% of the Company’s Total assets and Net sales. The bolivar-denominated monetary net asset position, primarily related to Cash and cash equivalents, was $5.5 million in the Consolidated Balance Sheet as of December 31, 2013. The devaluation of the bolivar and the change to the Colombian peso as the functional currency resulted in a foreign currency transaction gain (loss)loss of $2.9 million recognized in income was $(0.4) million, $(1.4)Selling, general and administrative expense for the three months ended March 29, 2013.
During the year ended December 31, 2013, the Company recognized net foreign currency transaction losses of $4.1 million and $0.3$5.2 million in Interest expense and Selling, general and administrative expense in the Consolidated Statement of Operations, respectively, including the $2.9 million loss related to the devaluation of the bolivar discussed above. The net foreign currency transaction (loss) gain recognized in Selling, general and administrative expense in the Consolidated Statements of Operations was $(1.2) million and $0.2 million for the years ended December 31, 2010, 20092012 and 2008,2011, respectively.
Debt Issuance Costs and Debt Discount
Costs directly related to the placement of debt are capitalized and amortized to Interest expense primarily using the straight-line method, which approximates the effective interest method over the term of the related obligation. Amounts written off due to early extinguishment of debt are charged to earnings. Cost and accumulated amortization related to debtDeferred issuance costs amounted to approximately $3.4of $18.2 million and 1.8$21.1 million, respectively, were included in Other assets in the Consolidated Balance Sheets as of December 31, 20102013 and $3.42012 net of $4.7 million and $1.1$4.8 million, respectively, as of accumulated amortization. During the years ended December 31, 2009.2013 and 2012, the Company deferred $7.1 million and $9.9 million, respectively, of debt issuance costs. There were no debt issuance costs deferred during the year ended December 31, 2011. Further, the carrying value of Long-term debt is reduced by an original issue discount, which is accreted to Interest expense using the effective interest method over the term of the related obligation. See Note 10, “Debt” for additional discussion regarding the Company’s borrowing arrangements.
Use of Estimates
The preparation of financial statements in conformity with accounting principles generally accepted in the U.S. requires management to makeCompany makes certain estimates and assumptions thatin preparing its Consolidated Financial Statements in accordance with GAAP. These estimates and assumptions affect the reported amounts of assets and liabilities, andthe disclosure of contingent assets and liabilities at the date of the financial statementsConsolidated Financial Statements and the reported amounts of revenues and expenses for the periodsperiod presented. Actual results couldmay differ from those estimates.
Reclassifications
Certain prior period amounts have been reclassified to conform to current year presentations.
3. RecentRecently Issued Accounting Pronouncements
In October 2009,March 2013, the Financial Accounting Standards Board (the “FASB”) issued Accounting Standards Update (ASU)(“ASU”) No. 2009-13, Multiple-Deliverable Revenue Arrangements—a consensus of the FASB Emerging Issues Task Force2013-05, “Foreign Currency Matters (Topic 830)” (“ASU No. 2013-05”). ASU No. 2009-13 addresses2013-05 is intended to clarify the unit ofparent’s accounting for arrangements involving multiple deliverables and how arrangement considerationthe cumulative translation adjustment upon the sale or transfer of a group of assets within a consolidated foreign entity. When a parent ceases to have a controlling financial interest in a subsidiary or group of assets within a foreign entity, the parent is required to release any related cumulative translation adjustment into Net income. ASU No. 2013-05 further clarifies that the cumulative translation adjustment should be allocatedreleased into Net income only if the sale or transfer results in the complete or substantially complete liquidation of the foreign entity in which the subsidiary or group of assets had resided. ASU No. 2013-05 also clarifies application of this guidance to the separate units of accounting.step acquisitions. ASU No. 2013-05 is effective prospectively for fiscal years beginning after December 15, 2013, with early adoption permitted. The Company has adoptedwill apply the provisions of ASU No. 2009-132013-05 to future sales or transfers of assets of a consolidated foreign entity.
In July 2013, the FASB issued ASU No. 2013-11, “Income Taxes (Topic 740)” (“ASU No. 2013-11”). ASU No. 2013-11 is intended to clarify the presentation of an unrecognized tax benefit when a net operating loss carryforward, a similar tax loss, or a tax credit carryforward exists. An unrecognized tax benefit, or a portion of an unrecognized tax benefit, should be presented in the financial statements as a reduction to a deferred tax asset for a net operating loss carryforward, a similar tax loss, or a tax credit carryforward, except in certain circumstances. To the extent a carryforward is not available at the reporting date or the tax law of the applicable jurisdiction does not require the entity to use, and the entity does not intend to use, the deferred tax asset for such
55
COLFAX CORPORATION
NOTES TO CONSOLIDATED FINANCIAL STATEMENTS - (Continued)
purpose, the unrecognized tax benefit should be presented in the financial statements as a liability. ASU No. 2013-11 is effective prospectively to all unrecognized tax benefits that exist at the effective date for fiscal years beginning January 1, 2011.after December 15, 2013, with early adoption permitted. The Company does not anticipateis currently evaluating the impact of adopting ASU No. 2013-11 on the Company’s Consolidated Balance Sheet.
4. Acquisitions
Charter International plc
On January 13, 2012, Colfax completed the acquisition of Charter for a material impacttotal purchase price of approximately $2.6 billion, comprised of $1.9 billion of cash consideration and $0.7 billion fair value of Colfax Common stock on itsthe date of acquisition. Charter is a global industrial manufacturing company focused on welding, cutting and automation and air and gas handling. The acquisition has:
enhanced the Company’s business profile by providing a meaningful recurring revenue stream and considerable exposure to emerging markets;
enabled Colfax to benefit from strong secular growth drivers, with a balance of short- and long-cycle businesses; and
provided an additional growth platform in the fragmented fabrication technology industry.
The Charter Acquisition was accounted for using the acquisition method of accounting and accordingly, the Consolidated Financial Statements include the financial position and results of operations from adopting the provisionsdate of ASU No. 2009-13.acquisition. The measurement period was completed during the three months ended March 29, 2013. During the measurement period, the Company retrospectively adjusted provisional amounts with respect to the Charter Acquisition that were recognized at the acquisition date to reflect new information obtained about facts and circumstances that existed as of the acquisition date that, if known, would have affected the measurement of the amounts recognized as of that date. The aggregate adjustments for the three months ended March 29, 2013 of $23.5 million increased the Goodwill balance and relate to the Company’s valuation of specific tax items.
The following acquisitions were accounted for using the acquisition method of accounting, except as otherwise noted, and, accordingly, the accompanying financial statementsConsolidated Financial Statements include the financial position and the results of operations from the datesrespective date of acquisition.
acquisition:
Gas and Fluid Handling
On August 19, 2010, weNovember 29, 2013, the Company completed the acquisition of Baricthe global infrastructure and industry division of Fläkt Woods Group (“Baric”GII”) for $27.0approximately $246.0 million net, including the assumption of cash acquired. Duringdebt, subject to certain adjustments. GII has operations around the fourth quarterworld and will expand the Company’s product offerings in the heavy duty industrial and cooling fan market.
On November 25, 2013, the Company converted the common shares of 2010,Sistemas Centrales de Lubrication S.A. de C.V. (“Sicelub”), previously a final working capital settlementless than wholly owned subsidiary in which the Company did not have a controlling interest, that were held by the majority owner into shares of $0.2mandatorily redeemable non-voting preferred stock of Sicelub valued at $31.7 million, was paid pursuantwhich resulted in an increase in the Company’s ownership from 44% to terms100%. On the date of the purchase agreements. Baricacquisition, the Company held a $7.4 million equity investment representing the Company’s 44% investment in Sicelub and recognized a $13.8 million gain as a reduction in Selling, general and administrative expense in the Consolidated Statement of Operations to remeasure the investment to fair value at the acquisition date based upon the total enterprise value, adjusting for a control premium. Changes in fair value of the mandatorily redeemable preferred stock are determined, in part, by the achievement of certain performance goals. The change in the fair value of the mandatorily redeemable preferred stock for each period will be reflected in Interest expense.
On November 1, 2013, the Company completed the acquisition of ČKD Kompresory a.s. (“ČKDK”) for approximately $69.4 million, including the assumption of debt. ČKDK is a leading supplier of highly engineered fluid handling systemsmulti-stage centrifugal compressors to the oil & gas, petrochemical, power and steel industries, based in Prague, Czech Republic.
On September 30, 2013, the Company completed the acquisition of certain business units of The New York Blower Company, including TLT-Babcock Inc. (“TLT-Babcock”) and Alphair Ventilating Systems Inc. (“Alphair”) for an approximate aggregate purchase price of $55.7 million. TLT-Babcock and Alphair are suppliers of heavy duty and industrial fans in Akron, Ohio and Winnepeg, Ontario, respectively.
56
COLFAX CORPORATION
NOTES TO CONSOLIDATED FINANCIAL STATEMENTS - (Continued)
On July 9, 2013, the Company completed the acquisition of the common stock of Clarus Fluid Intelligence, LLC (“Clarus”) for $13.2 million, which includes the fair value of an estimated additional contingent cash payment of $2.5 million at the acquisition date. The additional contingent payment, if any, will be paid during the year ending December 31, 2016 subject to the achievement of certain performance goals. See Note 14, “Financial Instruments and Fair Value Measurements” for discussion regarding the Company’s liability for contingent payments. Clarus is a domestic supplier of flushing services for marine applications primarily to U.S. government agencies, with primary operations based in Bellingham, Washington.
On September 13, 2012, the Company completed the acquisition of the common stock of Co-Vent Group Inc. (“Co-Vent”) for lubrication applications,$34.6 million. Co-Vent specializes in the custom design, manufacture, and testing of industrial fans, with its primary operations based in Blyth, United Kingdom. Quebec, Canada. As a result of this acquisition, the Company has expanded its product offerings in the industrial fan market.
On December 6, 2011, the Company completed the acquisition of COT-Puritech, Inc. (“COT-Puritech”), a domestic supplier of oil flushing and remediation services to power generation plants, refinery and petrochemical operators and other industrial manufacturing sites, with primary operations based in Canton, Ohio, for a total purchase price, net of cash acquired, of $39.4 million which includes the fair value of estimated additional contingent cash payments of $4.3 million at the acquisition date. The additional contingent cash payments will be paid over two years subject to the achievement of certain performance goals. See Note 14, “Financial Instruments and Fair Value Measurements” for discussion regarding the Company’s liability for contingent payment associated with the acquisition of COT-Puritech, which is included in the total purchase price. As a result of this acquisition, the Company has expanded its lubrication services offerings in the oil and gas and power generation end markets to include oil flushing and remediation services.
On February 14, 2011, the Company completed the acquisition of Rosscor Holding B.V. (“Rosscor”) for $22.3 million, net of cash acquired. Rosscor is a supplier of multiphase pumping technology and certain other highly engineered fluid-handling systems, with its primary operations based in Hengelo, The Netherlands. As a result of this acquisition, the Company has expanded its product offerings in the oil and gas end market to include multiphase pump systems that many of its customers already purchase.
Fabrication Technology
On October 31, 2012, the Company completed the acquisition of approximately 91% of the outstanding common and investment shares of Soldex S.A. (“Soldex”) for approximately $187.2 million (the “Soldex Acquisition”). Soldex is organized under the laws of Peru and complements the Company’s existing fabrication technology segment by supplying welding products from its plants in Colombia and Peru. On August 5, 2013, the Company completed a $14.9 million tender offer for additional common and investment shares of Soldex. This resulted in an increase in the Company’s ownership of the subsidiary from approximately 91% to 99% and was accounted for as an equity transaction, as the Company increased its controlling interest.
On April 13, 2012, the Company completed a $29.3 million acquisition of shares in ESAB India Limited, a publicly traded, less than wholly owned subsidiary in which the Company acquired a controlling interest in the Charter Acquisition. This resulted in an increase in the Company’s ownership of the subsidiary from 56% to 74%. This acquisition of shares was pursuant to a statutorily mandated tender offer triggered as a result of the Charter Acquisition and was accounted for as an equity transaction, as the Company increased its controlling interest.
In May 2012, the Company completed an $8.5 million acquisition, including the assumption of debt, of the remaining ownership of CJSC Sibes (“Sibes”), a less than wholly owned subsidiary in which the Company did not have a controlling interest. This resulted in an increase in the Company’s ownership of Sibes from 16% to 100%.
The following table summarizes intangible assets acquired:
| Asset | Weighted Average Amortization Period (years) | |||||||
| Acquired customer relationships | $ | 7,053 | 10.0 | |||||
| Acquired developed technology | 6,492 | 9.6 | ||||||
| Backlog | 3,339 | 2.3 | ||||||
| Other | 395 | 8.6 | ||||||
| Trade names - indefinite life | 2,770 | |||||||
| Goodwill | 12,940 | |||||||
| Total intangible assets acquired | $ | 32,989 | ||||||
57
COLFAX CORPORATION
NOTES TO CONSOLIDATED FINANCIAL STATEMENTS - (Continued)
| 2013 | 2012 | 2011 | |||||||||
| (In thousands) | |||||||||||
| Trade receivables | $ | 80,258 | $ | 714,486 | $ | 12,970 | |||||
| Inventories | 53,551 | 487,835 | 11,668 | ||||||||
| Property, plant and equipment | 94,258 | 595,961 | 3,069 | ||||||||
| Goodwill | 258,901 | 1,793,394 | 35,285 | ||||||||
| Intangible assets | 104,272 | 794,333 | 20,796 | ||||||||
| Accounts payable | (68,308 | ) | (391,131 | ) | (9,852 | ) | |||||
| Debt | (10,942 | ) | (437,564 | ) | — | ||||||
| Other assets and liabilities, net | (87,188 | ) | (746,719 | ) | (12,236 | ) | |||||
| 424,802 | 2,810,595 | 61,700 | |||||||||
| Less: net assets attributable to noncontrolling interest | — | (259,329 | ) | — | |||||||
| Consideration, net of cash acquired | $ | 424,802 | $ | 2,551,266 | $ | 61,700 | |||||
The following table summarizes the estimated fair values of the assets acquired and liabilities assumed at the date of acquisition for the individually significant acquisitions consummated, and all of the others collectively, during the year ended December 31, 2012:
| Charter | Soldex | Other | Total 2012 | ||||||||||||
| (In thousands) | |||||||||||||||
| Trade receivables | $ | 683,976 | $ | 22,848 | $ | 7,662 | $ | 714,486 | |||||||
| Inventories | 449,906 | 32,985 | 4,944 | 487,835 | |||||||||||
| Property, plant and equipment | 562,129 | 28,921 | 4,911 | 595,961 | |||||||||||
| Goodwill | 1,649,159 | 116,696 | 27,539 | 1,793,394 | |||||||||||
| Intangible assets | 715,643 | 65,325 | 13,365 | 794,333 | |||||||||||
| Accounts payable | (378,114 | ) | (6,682 | ) | (6,335 | ) | (391,131 | ) | |||||||
| Debt | (399,466 | ) | (36,734 | ) | (1,364 | ) | (437,564 | ) | |||||||
| Other assets and liabilities, net | (706,052 | ) | (33,654 | ) | (7,013 | ) | (746,719 | ) | |||||||
| 2,577,181 | 189,705 | 43,709 | 2,810,595 | ||||||||||||
| Less: net assets attributable to noncontrolling interest | (241,201 | ) | (18,128 | ) | — | (259,329 | ) | ||||||||
| Consideration, net of cash acquired | $ | 2,335,980 | $ | 171,577 | $ | 43,709 | $ | 2,551,266 | |||||||
In connection with the Charter Acquisition, the Company incurred advisory, legal, valuation and other professional service fees, termination payments to Charter executives and realized losses on acquisition-related foreign exchange derivatives, which comprised Charter Acquisition-related expense in the Consolidated Statements of Operations. See Note 14, “Financial Instruments and Fair Value Measurements” for additional information regarding the Company’s derivative instruments. Excluding Charter Acquisition-related expenses, the Company incurred advisory, legal, valuation and other professional service fees of $4.3 million, $3.1 million and $0.1 million, during the years ended December 31, 2013, 2012 and 2011, respectively, in connection with completed acquisitions which are included in Selling, general and administrative expense in the Consolidated Statements of Operations.
During the year ended December 31, 2013, the Company’s Consolidated Statement of Operations included $59.9 million of Net sales associated with the acquisitions consummated in the current year. Net income available to Colfax common shareholders associated with acquisitions consummated in the current year was not material. During the year ended December 31, 2012, the Company’s Consolidated Statement of Operations included $3.2 billion and $21.6 million of Net sales associated with the acquisitions of Charter and Soldex, respectively. The Net loss attributable to Colfax Corporation common shareholders for Soldex included in the Consolidated Statements of Operations for the year ended December 31, 2012 was $1.7 million. Due to the refinancing of the Company's borrowing arrangements, the restructuring of the Corporate function of both entities into a single corporate office and numerous other shared resources given the scale of the Charter Acquisition, quantification of the earnings included in the consolidated income statement for the year ended December 31, 2012 related to Charter is impracticable.
58
COLFAX CORPORATION
NOTES TO CONSOLIDATED FINANCIAL STATEMENTS - (Continued)
Unaudited Pro Forma Financial Information
| Year Ended December 31, | ||||||||
| 2012 | 2011 | |||||||
| (Unaudited, in thousands) | ||||||||
| Net sales | $ | 4,096,401 | $ | 4,027,796 | ||||
Net income (loss) available to Colfax common shareholders(1) | 88,212 | (116,862 | ) | |||||
__________
(1)Proforma net loss available to Colfax common shareholders for the year ended December 31, 2011 reflects the impact of certain expenses included in the Consolidated Statements of Operations for the year ended December 31, 2012, but excluded from the calculation of proforma net income for that period. These expenses include increased acquisition-related amortization expense of $79.9 million, $43.6 million of Charter acquisition-related expense, and a $50.3 million increase in the valuation allowance related to the Company’s deferred tax assets in the U.S., discussed further in Note 6, “Income Taxes.”
5. Net Income (Loss) Per Share
Net income (loss) per share available to Colfax Corporation common shareholders was computed as follows:
| Year Ended December 31, | |||||||||||
| 2013 | 2012 | 2011 | |||||||||
| (In thousands, except share data) | |||||||||||
| Computation of Net income (loss) per share - basic: | |||||||||||
| Net income (loss) available to Colfax Corporation common shareholders | $ | 158,232 | $ | (83,353 | ) | $ | 4,555 | ||||
Less: net income attributable to participating securities(1) | (3,740 | ) | — | — | |||||||
| $ | 154,492 | $ | (83,353 | ) | $ | 4,555 | |||||
| Weighted-average shares of Common stock outstanding - basic | 99,198,570 | 91,069,640 | 43,634,937 | ||||||||
| Net income (loss) per share - basic | $ | 1.56 | $ | (0.92 | ) | $ | 0.10 | ||||
| Computation of Net income (loss) per share - diluted: | |||||||||||
| Net income (loss) available to Colfax Corporation common shareholders | $ | 158,232 | $ | (83,353 | ) | $ | 4,555 | ||||
Less: net income attributable to participating securities(1)(2) | (3,740 | ) | — | — | |||||||
| $ | 154,492 | $ | (83,353 | ) | $ | 4,555 | |||||
| Weighted-average shares of Common stock outstanding - basic | 99,198,570 | 91,069,640 | 43,634,937 | ||||||||
| Net effect of potentially dilutive securities - stock options and restricted stock units | 1,167,885 | — | 633,173 | ||||||||
| Weighted-average shares of Common stock outstanding - diluted | 100,366,455 | 91,069,640 | 44,268,110 | ||||||||
| Net income (loss) per share - diluted | $ | 1.54 | $ | (0.92 | ) | $ | 0.10 | ||||
(1) Net income (loss) per share was calculated consistent with the two-class method in accordance with GAAP from January 13, 2012 through April 23, 2013, as further discussed below.
(2) For periods subsequent to April 23, 2013, Net income per share - dilutive was calculated in accordance with the if-converted method, as further discussed below. However, for the year ended December 31, 2013, the calculation under this method was anti-dilutive.
On April 23, 2013, the Company and BDT CF Acquisition Vehicle, LLC (the “BDT Investor”) amended the Certificate of Designations of Series A Perpetual Convertible Preferred Stock of Colfax Corporation to eliminate the right of the Series A Convertible Preferred Stock to share proportionately in any dividends or distributions made in respect of the Company’s Common stock. The BDT Investor is the sole holder of all issued and outstanding shares of the Company’s Series A Convertible Preferred Stock. For periods prior to April 23, 2013, Net income available to Colfax Corporation common shareholders was allocated to participating securities, while any losses for those periods were not allocated to the participating securities. Effective April 23, 2013, the Company’s Series A Convertible Preferred Stock is no longer considered a participating security. For periods subsequent to April 23, 2013, the Company’s Net income per share - dilutive is computed using the “if-converted” method. Under the “if-converted” method, Net income per share - dilutive is calculated under the assumption that the shares of Series A Convertible Preferred Stock have been converted into shares of Common stock as of the beginning of the respective period. For the year ended
59
COLFAX CORPORATION
NOTES TO CONSOLIDATED FINANCIAL STATEMENTS - (Continued)
December 31, 2013, the weighted-average computation of the dilutive effect of potentially issuable shares of Common stock excludes 12.2 million shares assuming that the shares of Series A Convertible Preferred Stock have been converted, as inclusion of such shares would be anti-dilutive.
The weighted-average computation of the dilutive effect of potentially issuable shares of Common stock under the treasury stock method for the year ended December 31, 2013, 2012 and 2011 excludes approximately 0.6 million, 2.8 million and 0.5 million outstanding stock-based compensation awards, respectively, as their inclusion would be anti-dilutive.
6. Income Taxes
Income before income taxes and the components of the provisionProvision for income taxes wereconsisted of the following:
| Year Ended December 31, | |||||||||||
| 2013 | 2012 | 2011 | |||||||||
| (In thousands) | |||||||||||
| (Loss) income before income taxes: | |||||||||||
| Domestic operations | $ | (7,899 | ) | $ | (73,467 | ) | $ | (27,645 | ) | ||
| Foreign operations | 310,694 | 121,906 | 47,632 | ||||||||
| $ | 302,795 | $ | 48,439 | $ | 19,987 | ||||||
| (Benefit from) provision for income taxes: | |||||||||||
| Current: | |||||||||||
| Federal | $ | (464 | ) | $ | — | $ | 182 | ||||
| State | 871 | 362 | (94 | ) | |||||||
| Foreign | 83,299 | 83,119 | 17,066 | ||||||||
| 83,706 | 83,481 | 17,154 | |||||||||
| Deferred: | |||||||||||
| Domestic operations | 11,603 | 50,340 | — | ||||||||
| Foreign operations | (1,657 | ) | (43,118 | ) | (1,722 | ) | |||||
| 9,946 | 7,222 | (1,722 | ) | ||||||||
| $ | 93,652 | $ | 90,703 | $ | 15,432 | ||||||
The Company’s Provision for income taxes differs from the amount that would be computed by applying the U.S. federal statutory rate as follows:
| Year ended December 31, | ||||||||||||
| 2010 | 2009 | 2008 | ||||||||||
| Income (loss) before income tax expense: | ||||||||||||
| Domestic | $ | (12,737 | ) | $ | 698 | $ | (54,303 | ) | ||||
| Foreign | 40,425 | 31,720 | 60,299 | |||||||||
| $ | 27,688 | $ | 32,418 | $ | 5,996 | |||||||
| Provision for income taxes: | ||||||||||||
| Current income tax expense (benefit): | ||||||||||||
| Federal | $ | (30 | ) | $ | (1,323 | ) | $ | (1,145 | ) | |||
| State | 261 | 344 | 239 | |||||||||
| Foreign | 11,538 | 6,911 | 19,701 | |||||||||
| 11,769 | 5,932 | 18,795 | ||||||||||
| Deferred income tax expense (benefit): | ||||||||||||
| Domestic | - | 2,241 | (12,607 | ) | ||||||||
| Foreign | (296 | ) | 448 | (723 | ) | |||||||
| (296 | ) | 2,689 | (13,330 | ) | ||||||||
| $ | 11,473 | $ | 8,621 | $ | 5,465 | |||||||
| Year ended December 31, | ||||||||||||
| 2010 | 2009 | 2008 | ||||||||||
| Tax at U.S. federal income tax rate | $ | 9,691 | $ | 11,346 | $ | 2,099 | ||||||
| State taxes | (5 | ) | 34 | (1,500 | ) | |||||||
| Effect of international tax rates | (2,522 | ) | (2,260 | ) | (3,342 | ) | ||||||
| Payment of non-deductible underwriting fee | - | - | 4,483 | |||||||||
| Changes in valuation and tax reserves | 3,827 | (710 | ) | 2,903 | ||||||||
| Other | 482 | 211 | 822 | |||||||||
| Provision for income taxes | $ | 11,473 | $ | 8,621 | $ | 5,465 | ||||||
| Year Ended December 31, | |||||||||||
| 2013 | 2012 | 2011 | |||||||||
| (In thousands) | |||||||||||
| Taxes calculated at the U.S. federal statutory rate | $ | 105,978 | $ | 16,954 | $ | 6,995 | |||||
| State taxes | 871 | 362 | (421 | ) | |||||||
| Effect of international tax rates | (42,972 | ) | (24,070 | ) | (2,988 | ) | |||||
| Change in enacted international tax rates | (5,217 | ) | (12,305 | ) | — | ||||||
| Changes in valuation allowance and tax reserves | 30,554 | 106,802 | 11,177 | ||||||||
| Other | 4,438 | 2,960 | 669 | ||||||||
| Provision for income taxes | $ | 93,652 | $ | 90,703 | $ | 15,432 | |||||
60
COLFAX CORPORATION
NOTES TO CONSOLIDATED FINANCIAL STATEMENTS - (Continued)
Deferred income taxes, net reflect the net tax effects of temporary differences between the carrying amounts of assets and liabilities for financial reporting purposes and the amounts used for income tax purposes. During the three months ended March 29, 2013, adjustments were made retrospectively to provisional amounts recorded as of December 31, 2012, due to the finalization of the valuation of specific tax items related to the Charter Acquisition. The significant components of deferred tax assets and liabilities, in addition to the reconciliation of the beginning and ending amount of gross unrecognized tax benefits below, include the impact of these retrospective adjustments. Significant components of the deferred tax assets and liabilities wereare as follows:
| December 31, | ||||||||||||||||
| 2010 | 2009 | |||||||||||||||
| Current | Long-Term | Current | Long-Term | |||||||||||||
| Deferred tax assets: | ||||||||||||||||
| Post-retirement benefit obligations | $ | 1,076 | $ | 28,688 | $ | 1,003 | $ | 23,262 | ||||||||
| Expenses not currently deductible | 7,401 | 30,042 | 9,552 | 30,200 | ||||||||||||
| Net operating loss carryover | - | 49,789 | - | 42,268 | ||||||||||||
| Tax credit carryover | - | 5,728 | - | 5,560 | ||||||||||||
| Other | 918 | 823 | - | 837 | ||||||||||||
| Total deferred tax assets | 9,395 | 115,070 | 10,555 | 102,127 | ||||||||||||
| Valuation allowance for deferred tax assets | (2,987 | ) | (49,904 | ) | (2,649 | ) | (42,404 | ) | ||||||||
| Net deferred tax assets | 6,408 | 65,166 | 7,906 | 59,723 | ||||||||||||
| Net tax liabilities: | ||||||||||||||||
| Depreciation / amortization | - | 14,901 | - | 10,578 | ||||||||||||
| Other | 503 | 11,410 | 1,074 | 7,680 | ||||||||||||
| Total deferred tax liabilities | 503 | 26,311 | 1,074 | 18,258 | ||||||||||||
| Net deferred tax assets | $ | 5,905 | $ | 38,855 | $ | 6,832 | $ | 41,465 | ||||||||
| December 31, | |||||||
| 2013 | 2012 | ||||||
| (In thousands) | |||||||
| Deferred tax assets: | |||||||
| Post-retirement benefit obligation | $ | 87,305 | $ | 126,106 | |||
| Expenses currently not deductible | 152,539 | 133,078 | |||||
| Net operating loss carryover | 264,893 | 256,076 | |||||
| Tax credit carryover | 15,518 | 15,378 | |||||
| Depreciation and amortization | 4,323 | 17,010 | |||||
| Other | 7,202 | 3,556 | |||||
| Valuation allowance | (358,386 | ) | (357,638 | ) | |||
| Deferred tax assets, net | $ | 173,394 | $ | 193,566 | |||
| Deferred tax liabilities: | |||||||
| Depreciation and amortization | $ | (263,996 | ) | $ | (286,173 | ) | |
| Post-retirement benefit obligation | (17,844 | ) | (4,843 | ) | |||
| Inventory | (12,558 | ) | (12,227 | ) | |||
| Other | (59,205 | ) | (43,456 | ) | |||
| Total deferred tax liabilities | $ | (353,603 | ) | $ | (346,699 | ) | |
| Total deferred tax liabilities, net | $ | (180,209 | ) | $ | (153,133 | ) | |
The Company has U.S. net operating loss carryforwards of approximately $130.5$275.6 million expiring in years 2021 through 2030,2032, and alternative minimum tax credits of approximately $1.9$7.7 million that may be carried forward indefinitely. Tax credit carryforwards include foreign tax credits that have been offset by a valuation allowance. We experienced an “ownership change” within the meaning of Section 382 of the Internal Revenue Code of 1986, as amended, as a result of the IPO. The Company’s ability to use these various carryforwards existing at the time of the ownership change to offset any taxable income generated in future taxable periods after the ownership change may be limited under Section 382 and other federal tax provisions.
For the years ended December 31, 2010, 20092013, 2012 and 2008, the Company intends that2011, all undistributed earnings of itsthe Company’s controlled international subsidiaries willare considered to be permanently reinvested outside the U.S. and no tax expense in the United StatesU.S. has been recognized under the applicable accounting standard, for these reinvested earnings. The amount of unremitted earnings from thesethe Company’s international subsidiaries, subject to local statutory restrictions, as of December 31, 20102013 is approximately $151.5$480.2 million. It is not reasonably determinable as to theThe amount of deferred tax liability that would needhave been recognized had such earnings not been permanently reinvested is not reasonably determinable.
61
COLFAX CORPORATION
NOTES TO CONSOLIDATED FINANCIAL STATEMENTS - (Continued)
The Company records a liability for unrecognized income tax benefits for the amount of benefit included in its previously filed income tax returns and in its financial results expected to be provided if such earnings were not reinvested.
sustained upon examination by the respective taxing authority. A reconciliation of the beginning and ending amount of gross unrecognized tax benefits is as follows:follows (inclusive of associated interest and penalties):
| Balance at December 31, 2008 | $ | 10,101 | ||
| Additions for tax positions in prior periods | 73 | |||
| Additions for tax positions in current period | 308 | |||
| Reductions for tax positions in prior periods | (1,896 | ) | ||
| Foreign exchange impact / other | 160 | |||
| Balance at December 31, 2009 | 8,746 | |||
| Additions for tax positions in prior periods | 590 | |||
| Additions for tax positions in current period | 412 | |||
| Reductions for tax positions in prior periods | (1,076 | ) | ||
| Foreign exchange impact / other | (81 | ) | ||
| Balance at December 31, 2010 | $ | 8,591 |
| (In thousands) | |||
| Balance, December 31, 2011 | $ | 4,077 | |
| Acquisitions | 74,316 | ||
| Addition for tax positions taken in prior periods | 1,391 | ||
| Addition for tax positions taken in the current period | 5,241 | ||
| Reduction for tax positions taken in prior periods | (3,695 | ) | |
| Other, including the impact of foreign currency translation | 4,393 | ||
| Balance, December 31, 2012 | 85,723 | ||
| Acquisitions | — | ||
| Addition for tax positions taken in prior periods | 6,988 | ||
| Addition for tax positions taken in the current period | 7,730 | ||
| Reduction for tax positions taken in prior periods | (31,156 | ) | |
| Other, including the impact of foreign currency translation | (373 | ) | |
| Balance, December 31, 2013 | $ | 68,912 | |
The Company is routinely examined by tax authorities around the world. Tax examinations remain in process in multiple countries, including but not limited to Sweden, Indonesia, France, Germany, Finland, Mexico, Brazil and various states. The Company files numerous group and separate tax returns in U.S. federal and state jurisdictions, as well as many international jurisdictions. In the U.S., tax years dating back to 2006 remain subject to examination, as well as the 2003 tax year due to tax attributes available to be carried forward to open or future tax years. With some exceptions, other major tax jurisdictions generally are not subject to tax examinations for years beginning before 2005.
The Company’s total unrecognized tax benefits were $68.9 million and $85.7 million as of December 31, 20102013 and 2009 totaled $8.92012, respectively, inclusive of $13.2 million and $9.3$16.5 million, inclusiverespectively, of $0.3interest and penalties. These amounts were offset by tax benefits of $0.1 million and $0.5 million as of interest and penalties, respectively. These amounts were offset in part by tax benefits of approximately $0.6 million and $0.7 million for the years ended December 31, 20102013 and 2009,2012, respectively. The net liabilities for uncertain tax positions for the years endedas of December 31, 20102013 and 20092012 were $8.3$68.8 million and $8.6$85.2 million, respectively, and if recognized, would favorably impact the effective tax rate.
The Company records interest and penalties on uncertain tax positions for post-adoption periods as a component of Provision for income tax expense. The interesttaxes, which was $4.0 million, $1.3 million and penalty expense recorded in income tax expense attributed to uncertain tax positions$0.1 million for the years ended December 31, 2010, 20092013, 2012 and 2008 was $0.1 million, $0.2 million and $0.2 million,2011, respectively.
Due to the difficulty in predicting with reasonable certainty when tax audits will be fully resolved and closed, the range of reasonably possible significant increases or decreases in the liability for unrecognized tax benefits that may occur within the next 12 months is difficult to ascertain. Currently, we estimatethe Company estimates that it is reasonably possible that the expiration of various statutes of limitations, and resolution of tax audits and court decisions may reduce ourits tax expense in the next 12 months ranging from zeroup to $5.7$2.3 million.
62
COLFAX CORPORATION
NOTES TO CONSOLIDATED FINANCIAL STATEMENTS - (Continued)
7. Goodwill and Other Related ChargesIntangible Assets
The Company initiated a series of restructuring actions beginningfollowing table summarizes the activity in 2009 in response to then current and expected future economic conditions. As a result, forGoodwill, by segment during the years ended December 31, 20102013 and 2009,2012:
Gas and Fluid Handling | Fabrication Technology | Total | |||||||||
| (In thousands) | |||||||||||
| Balance, January 1, 2012 | $ | 204,844 | $ | — | $ | 204,844 | |||||
| Goodwill attributable to Charter Acquisition | 941,178 | 707,981 | 1,649,159 | ||||||||
| Goodwill attributable to Soldex Acquisition | — | 116,696 | 116,696 | ||||||||
| Goodwill attributable to other acquisitions | 21,840 | 5,699 | 27,539 | ||||||||
| Impact of foreign currency translation and other | 57,632 | 42,966 | 100,598 | ||||||||
| Balance, December 31, 2012 | 1,225,494 | 873,342 | 2,098,836 | ||||||||
| Goodwill attributable to acquisitions | 258,901 | — | 258,901 | ||||||||
| Impact of foreign currency translation and other | 22,629 | 4,156 | 26,785 | ||||||||
| Balance, December 31, 2013 | $ | 1,507,024 | $ | 877,498 | $ | 2,384,522 | |||||
The following table summarizes the Company recorded pre-tax restructuring and other related costs of $10.3 million and $18.2 million, respectively. The costs incurred in the year ended December 31, 2010 include $2.2 million of termination benefits, including $0.6 million of non-cash stock-based compensationIntangible assets, excluding Goodwill:
| December 31, | |||||||||||||||
| 2013 | 2012 | ||||||||||||||
| Gross Carrying Amount | Accumulated Amortization | Gross Carrying Amount | Accumulated Amortization | ||||||||||||
| (In thousands) | |||||||||||||||
| Trade names – indefinite life | $ | 412,341 | $ | — | $ | 401,123 | $ | — | |||||||
| Acquired customer relationships | 353,337 | (51,675 | ) | 300,253 | (24,763 | ) | |||||||||
| Acquired technology | 114,647 | (22,757 | ) | 107,018 | (12,466 | ) | |||||||||
| Acquired backlog | 73,476 | (65,919 | ) | 63,984 | (62,432 | ) | |||||||||
| Other intangible assets | 26,061 | (6,958 | ) | 12,352 | (6,020 | ) | |||||||||
| $ | 979,862 | $ | (147,309 | ) | $ | 884,730 | $ | (105,681 | ) | ||||||
Amortization expense related to the departure of the Company’s former President and Chief Executive Officer (CEO) in January of 2010. Additionally, the costs incurredamortizable intangible assets was included in the year ended December 31, 2010 include $1.3 millionConsolidated Statements of termination benefits related to the October 2010 departures of the Company’s former Chief Financial Officer and General Counsel. The costs incurred in the year ended December 31, 2009 include a $0.6 million non-cash asset impairment charge related to closure of a repair facility.Operations as follows:
| Year Ended December 31, | |||||||||||
| 2013 | 2012 | 2011 | |||||||||
| (In thousands) | |||||||||||
| Selling, general and administrative expense | $ | 41,172 | $ | 85,106 | $ | 7,821 | |||||
As of December 31, 2010, excluding additions from businesses acquired in 20092013, total amortization expense for amortizable intangible assets is expected to be $50.9 million, $49.3 million, $44.5 million, $41.1 million and 2010, we have reduced our company-wide workforce by 237 associates from$38.7 million for the years ending December 31, 2008. Additionally, through the second quarter of 2010, we participated in a German government-sponsored furlough program in which the government paid the wage-related costs for participating associates. Payroll taxes2014, 2015, 2016, 2017 and other employee benefits related to employees’ furlough time are included in restructuring costs.2018, respectively.
| Year Ended December 31, 2010 | ||||||||||||||||||||
| Restructuring | Foreign | Restructuring | ||||||||||||||||||
| Liability at | Currency | Liability at | ||||||||||||||||||
| Dec. 31, 2009 | Provisions | Payments | Translation | Dec. 31, 2010 | ||||||||||||||||
| Restructuring and Other RelatedCharges: | ||||||||||||||||||||
Termination benefits (1) | $ | 9,473 | $ | 7,610 | $ | (14,169 | ) | $ | (734 | ) | $ | 2,180 | ||||||||
Furlough charges (2) | - | 327 | (319 | ) | (8 | ) | - | |||||||||||||
Facility closure charges (3) | - | 909 | (909 | ) | - | - | ||||||||||||||
Consulting costs (4) | - | 903 | (903 | ) | - | - | ||||||||||||||
| $ | 9,473 | 9,749 | $ | (16,300 | ) | $ | (742 | ) | $ | 2,180 | ||||||||||
Non-cash termination benefits (5) | 574 | |||||||||||||||||||
| Total | $ | 10,323 | ||||||||||||||||||
| Year ended December 31, | ||||||||||||
| 2010 | 2009 | 2008 | ||||||||||
| Numerator: | ||||||||||||
| Net income | $ | 16,215 | $ | 23,797 | $ | 531 | ||||||
| Dividends on preferred stock | - | - | (3,492 | ) | ||||||||
| Net income (loss) available to common shareholders | $ | 16,215 | $ | 23,797 | $ | (2,961 | ) | |||||
| Denominator: | ||||||||||||
| Weighted-average shares of common stock outstanding - basic | 43,389,878 | 43,222,616 | 36,240,157 | |||||||||
| Net income (loss) per share - basic | $ | 0.37 | $ | 0.55 | $ | (0.08 | ) | |||||
| Weighted-average shares of common stock outstanding - basic | 43,389,878 | 43,222,616 | 36,240,157 | |||||||||
Net effect of potentally dilutive securities (1) | 277,347 | 103,088 | - | |||||||||
| Weighted-average shares of common stock outstanding - diluted | 43,667,225 | 43,325,704 | 36,240,157 | |||||||||
| Net income (loss) per share - diluted | $ | 0.37 | $ | 0.55 | $ | (0.08 | ) | |||||
8. Inventories
| December 31, | ||||||||
| 2010 | 2009 | |||||||
| Raw materials | $ | 23,758 | $ | 28,445 | ||||
| Work in process | 29,565 | 32,888 | ||||||
| Finished goods | 20,121 | 21,013 | ||||||
| 73,444 | 82,346 | |||||||
| Less-Customer progress billings | (7,726 | ) | (3,171 | ) | ||||
| Less-Allowance for excess, slow-moving and obsolete inventory | (7,777 | ) | (8,025 | ) | ||||
| $ | 57,941 | $ | 71,150 | |||||
| December 31, | |||||||||
| Depreciable Life | 2013 | 2012 | |||||||
| (In years) | (In thousands) | ||||||||
| Land | n/a | $ | 48,353 | $ | 40,319 | ||||
| Buildings and improvements | 5-40 | 372,197 | 314,216 | ||||||
| Machinery and equipment | 3-15 | 504,184 | 440,975 | ||||||
| Software | 3-5 | 88,463 | 70,092 | ||||||
| 1,013,197 | 865,602 | ||||||||
| Accumulated depreciation | (256,057 | ) | (177,032 | ) | |||||
| Property, plant and equipment, net | $ | 757,140 | $ | 688,570 | |||||
| Depreciable | December 31, | |||||||||||
| Lives in Years | 2010 | 2009 | ||||||||||
| Land | - | $ | 15,106 | $ | 16,618 | |||||||
| Buildings and improvements | 3 - 40 | 39,666 | 36,651 | |||||||||
| Machinery and equipment | 3 - 15 | 121,933 | 119,727 | |||||||||
| Software | 3 - 5 | 17,063 | 17,324 | |||||||||
| 193,768 | 190,320 | |||||||||||
| Less-Accumulated depreciation | (104,522 | ) | (98,230 | ) | ||||||||
| $ | 89,246 | $ | 92,090 | |||||||||
Depreciation expense, including the amortization of assets recorded under capital leases, for the years ended December 31, 2010, 20092013, 2012 and 2008,2011, was approximately $12.1$78.1 million, $11.8$71.7 million and $12.1$13.1 million, respectively. These amounts include depreciation expense related to software for the years ended December 31, 2010, 20092013, 2012 and 20082011 of $1.9$11.8 million, $10.5 million and $1.7 million, respectively.
9. Inventories, Net
Inventories, net consisted of the following:
| December 31, | |||||||
| 2013 | 2012 | ||||||
| (In thousands) | |||||||
| Raw materials | $ | 145,689 | $ | 154,771 | |||
| Work in process | 112,722 | 99,459 | |||||
| Finished goods | 224,192 | 263,211 | |||||
| 482,603 | 517,441 | ||||||
| Less: customer progress payments | (4,078 | ) | (14,571 | ) | |||
| Less: allowance for excess, slow-moving and obsolete inventory | (32,773 | ) | (9,221 | ) | |||
| Inventories, net | $ | 445,752 | $ | 493,649 | |||
10. Debt
Long-term debt consisted of the following:
| December 31, | |||||||
| 2013 | 2012 | ||||||
| (In thousands) | |||||||
| Term loans | $ | 1,115,238 | $ | 1,682,177 | |||
| Revolving credit facilities and other | 371,853 | 46,134 | |||||
| Total Debt | 1,487,091 | 1,728,311 | |||||
| Less: current portion | (29,449 | ) | (34,799 | ) | |||
| Long-term debt | $ | 1,457,642 | $ | 1,693,512 | |||
The Company entered into a credit agreement by and $2.0among the Company, Colfax UK Holdings Ltd, the other subsidiaries of the Company party thereto, the lenders party thereto and Deutsche Bank AG New York Branch, as administrative agent (the “Deutsche Bank Credit Agreement”) on September 12, 2011. In connection with the closing of the Charter Acquisition, the Deutsche Bank Credit Agreement was amended on January 13, 2012 and the Company terminated its existing credit agreement as well as Charter’s outstanding indebtedness.
64
COLFAX CORPORATION
NOTES TO CONSOLIDATED FINANCIAL STATEMENTS - (Continued)
On February 22, 2013, the Company entered into the Second Amendment to the Deutsche Bank Credit Agreement to, among other things, (i) reallocate the borrowing capacities of the tranches of loans, (ii) provide for an interest rate margin on the term A-1 facility, the term A-2 facility and the revolving credit subfacilities ranging from 0.75% to 1.50% per annum for base rate loans and 1.75% to 2.50% per annum for Eurocurrency rate loans, in each case, determined by the Company’s leverage ratio, (iii) provide for an interest rate margin on the term A-3 facility and the term A-4 facility ranging from 1.50% to 2.25% per annum for base rate loans and 2.50% to 3.25% per annum for Eurocurrency rate loans, in each case, determined by the Company’s leverage ratio and (iv) provide for an interest rate margin on the term B facility of 1.50% per annum for base rate loans and 2.50% per annum for Eurocurrency rate loans.
On November 7, 2013, the Company entered into the Third Amendment to the Deutsche Bank Credit Agreement (the “Third Amendment”). Pursuant to the Third Amendment, the Company further amended its credit agreement to, among other things, (i) reallocate borrowing capacities of the tranches of loans as follows: a $408.7 million respectively.term A-1 facility, a $380 million term A-2 facility, a €149.7 million term A-3 facility, a €100 million term A-4 facility and two revolving credit subfacilities which total $898 million in commitments, (ii) provide for an interest rate margin on the term A-1 facility, the term A-2 facility and the revolving credit subfacilities ranging from 0.50% and 1.25% per annum for base rate loans and 1.50% to 2.25% per annum for Eurocurrency rate loans, in each case determined by the Company’s leverage ratio, (iii) provide for an interest margin on the term A-3 facility and the term A-4 facility ranging from 0.75% to 1.50% per annum for base rate loans and 1.75% and 2.50% per annum for Eurocurrency loans, in each case, determined by the Company’s leverage ratio and (iv) reset the maturity date for the term A facilities and the two revolving credit subfacilities as well as the amortization schedule for the term A facilities to a five year term commencing on November 7, 2013. In connection with the Third Amendment, the prior term B facility under the credit agreement was repaid in its entirety.
In conjunction with the amendments to the Deutsche Bank Credit Agreement, the Company recorded a charge to Interest expense in the Consolidated Statement of Operations for the year ended December 31, 2013 of $29.4 million to write-off certain deferred financing fees and original issue discount and expensed approximately $1.2 million of costs incurred in connection with the refinancing. The Company had an original issue discount of $17.7 million and deferred financing fees of $13.5 million included in its Consolidated Balance Sheet as of December 31, 2013, which will be accreted to Interest expense primarily using the effective interest method, over the life of the Deutsche Bank Credit Agreement. As of December 31, 2013, the weighted-average interest rate of borrowings under the amended Deutsche Bank Credit Agreement was 1.99%, excluding accretion of original issue discount, and there was $560.6 million available on the revolving credit subfacilities, including $199.9 million available on a letter of credit subfacility.
The Company is also party to additional letter of credit facilities with total capacity of $688.7 million. Total letters of credit of $398.2 million were outstanding as of December 31, 2013.
The contractual maturities of the Company’s debt as of December 31, 2013 are as follows(1):
| (In thousands) | |||
| 2014 | $ | 29,449 | |
| 2015 | 90,551 | ||
| 2016 | 189,638 | ||
| 2017 | 344,119 | ||
| 2018 | 851,006 | ||
| Total contractual maturities | 1,504,763 | ||
| Debt discount | (17,672 | ) | |
| Total debt | $ | 1,487,091 | |
________
(1) Represents scheduled payments required under the Deutsche Bank Credit Agreement through November 7, 2018, as well as the contractual maturities of other debt outstanding as of December 31, 2013.
In connection with the Deutsche Bank Credit Agreement, the Company has pledged substantially all of its domestic subsidiaries’ assets and 65% of the shares of certain first tier international subsidiaries as collateral against borrowings to its U.S. companies. In addition, subsidiaries in certain foreign jurisdictions have guaranteed the Company’s obligations on borrowings of one of its European subsidiaries, as well as pledged substantially all of their assets for such borrowings to this European subsidiary under the Deutsche Bank Credit Agreement. The Deutsche Bank Credit Agreement contains customary covenants limiting the Company’s ability to, among other things, pay dividends, incur debt or liens, redeem or repurchase equity, enter into transactions with affiliates,
65
COLFAX CORPORATION
NOTES TO CONSOLIDATED FINANCIAL STATEMENTS - (Continued)
make investments, merge or consolidate with others or dispose of assets. In addition, the Deutsche Bank Credit Agreement contains financial covenants requiring the Company to maintain a total leverage ratio, as defined therein, of not more than 4.95 to 1.0 and a minimum interest coverage ratio, as defined therein, of 2.25 to 1.0, measured at the end of each quarter, through the year ended December 31, 2013. The minimum interest coverage ratio increases by 25 basis points each year until it reaches 3.0 to 1.0 for the year ending December 31, 2016 and each year thereafter. The maximum total leverage ratio decreases to 4.75 to 1.0 for the year ending December 31, 2014 and decreases by 25 basis points each year until it reaches 4.25 to 1.0 for the year ending December 31, 2016 and each year thereafter. The Deutsche Bank Credit Agreement contains various events of default, including failure to comply with the financial covenants referenced above, and upon an event of default the lenders may, subject to various customary cure rights, require the immediate payment of all amounts outstanding under the term loans and the revolving credit subfacilities and foreclose on the collateral. The Company is in compliance with all such covenants as of December 31, 2013.
11. Equity
Common and Preferred Stock
During the years ended December 31, 2013, 2012 and 2011, 265,995, 452,062 and 248,017 shares of Common stock, respectively, were issued in connection with stock option exercises and employee share-based payment arrangements that vested during the year.
The Series A Preferred Stock is convertible, in whole or in part, at the option of the holders at any time after the date the shares were issued into shares of Colfax Common stock at a conversion rate determined by dividing the liquidation preference by a number equal to 114% of the liquidation preference, subject to certain adjustments. The Series A Preferred Stock is also convertible, in whole or in part, at the option of Colfax on or after the third anniversary of the issuance of the shares at the same conversion rate if, among other things: (i) for the preceding thirty trading days, the closing price of Colfax Common stock on the New York Stock Exchange exceeds 133% of the applicable conversion price and (ii) Colfax has declared and paid or set apart for payment all accrued but unpaid dividends on the Series A Preferred Stock.
On January 24, 2012, Colfax sold 2,170,139 to each of Mitchell P. Rales, Chairman of Colfax’s Board of Directors, and his brother Steven M. Rales and 1,085,070 to Markel Corporation, a Virginia corporation (“Markel”) of newly issued Colfax Common stock at $23.04 per share, for a total aggregate of $125 million, pursuant to separate securities purchase agreements with Mitchell P. Rales and Steven M. Rales, each of whom were beneficial owners of 20.9% of Colfax’s Common stock at the time of the sale, and Markel. Thomas S. Gayner, a member of Colfax’s Board of Directors, is President and Chief Investment Officer of Markel.
Consideration paid to Charter shareholders included 0.1241 shares of newly issued Colfax Common stock in exchange for each share of Charter’s ordinary stock, which resulted in the issuance of 20,735,493 shares of Common stock on January 24, 2012.
In conjunction with the issuance of the Common and Preferred stock discussed above, the Company recognized $14.7 million in equity issuance costs, which were recorded as a reduction to Additional paid-in capital during the year ended December 31, 2012.
66
COLFAX CORPORATION
NOTES TO CONSOLIDATED FINANCIAL STATEMENTS - (Continued)
On March 5, 2012, the Company sold 8,000,000 shares of newly issued Colfax Common stock to underwriters for public resale pursuant to a shelf registration statement for an aggregate purchase price of $272 million. Further, on March 9, 2012, the underwriters of the March 5, 2012 equity offering exercised their over-allotment option and the Company sold an additional 1,000,000 shares of newly issued Colfax Common stock to the underwriters for public resale pursuant to a shelf registration statement for an aggregate purchase price of $34 million. In conjunction with these issuances, the Company recognized $12.6 million in equity issuance costs which were recorded as a reduction to Additional paid-in capital during the year ended December 31, 2012.
On May 13, 2013, the Company sold 7,500,000 shares of newly issued Colfax Common stock to underwriters for public resale pursuant to a shelf registration statement for an aggregate purchase price of $331.9 million. In conjunction with this issuance, the Company recognized $12.0 million in equity issuance costs which were recorded as a reduction to Additional paid-in capital during the year ended December 31, 2013.
On September 12, 2013, the Company contributed 88,200 shares of newly issued Colfax Common stock to its U.S. defined benefit pension plan.
Dividend Restrictions
The Company is subject to dividend restrictions under the Deutsche Bank Credit Agreement, which limit the total amount of cash dividends the Company may pay and Common stock repurchases the Company may make to $50 million annually, in the aggregate.
Accumulated Other Comprehensive Loss
The following table presents the changes in the balances of each component of Accumulated other comprehensive loss including current period reclassifications out of Accumulated other comprehensive loss for the year ended December 31, 2013. All amounts are net of tax and noncontrolling interest.
| Accumulated Other Comprehensive Loss Components | |||||||||||||||
| Net Unrecognized Pension And Other Post-Retirement Benefit Cost | Foreign Currency Translation Adjustment | Unrealized Loss On Hedging Activities | Total | ||||||||||||
| (In thousands) | |||||||||||||||
| Beginning balance | $ | (247,332 | ) | $ | 104,718 | $ | (3,980 | ) | $ | (146,594 | ) | ||||
| Acquisition of shares held by noncontrolling interest | — | (381 | ) | — | (381 | ) | |||||||||
| Other comprehensive income (loss) before reclassifications: | |||||||||||||||
| Net actuarial gain | 77,515 | — | — | 77,515 | |||||||||||
| Foreign currency translation adjustment | — | 21,083 | — | 21,083 | |||||||||||
| Gain on long-term intra-entity foreign currency transactions | — | 2,176 | — | 2,176 | |||||||||||
| Loss on net investment hedges | — | — | (14,261 | ) | (14,261 | ) | |||||||||
| Unrealized gain on cash flow hedges | — | — | 3,832 | 3,832 | |||||||||||
| Other comprehensive income (loss) before reclassifications | 77,515 | 23,259 | (10,429 | ) | 90,345 | ||||||||||
| Amounts reclassified from Accumulated other comprehensive loss | 10,022 | — | — | 10,022 | |||||||||||
| Net current period Other comprehensive income (loss) | 87,537 | 23,259 | (10,429 | ) | 100,367 | ||||||||||
| Ending balance | $ | (159,795 | ) | $ | 127,596 | $ | (14,409 | ) | $ | (46,608 | ) | ||||
67
COLFAX CORPORATION
NOTES TO CONSOLIDATED FINANCIAL STATEMENTS - (Continued)
The effect on Net income of amounts reclassified out of each component of Accumulated other comprehensive loss for the year ended December 31, 2013 is as follows:
| Year Ended December 31, 2013 | |||||||||||
| Amounts Reclassified From Accumulated Other Comprehensive Loss | Tax Benefit | Total | |||||||||
| (In thousands) | |||||||||||
| Pension and other post-retirement benefit cost: | |||||||||||
Amortization of net loss (1) | $ | 10,489 | $ | (715 | ) | $ | 9,774 | ||||
Amortization of prior service cost(1) | 248 | — | 248 | ||||||||
| $ | 10,737 | $ | (715 | ) | $ | 10,022 | |||||
(1) Included in the computation of net periodic benefit cost. See Note 13, “Defined Benefit Plans” for additional details.
During the year ended December 31, 2013, Noncontrolling interest decreased by $17.5 million as a result of Other comprehensive loss, primarily due to currency translation adjustment.
Share-Based Payments
The Company adopted the Colfax Corporation 2008 Omnibus Incentive Plan on April 21, 2008, as amended and restated on April 2, 2012 (the “2008 Plan”). The 2008 Plan provides the Compensation Committee of the Company’s Board of Directors discretion in creating employee equity incentives. Awards under the 2008 Plan may be made in the form of stock options, stock appreciation rights, restricted stock, restricted stock units, dividend equivalent rights, performance shares, performance units, and other stock-based awards.
The Company measures and recognizes compensation expense related to share-based payments based on the fair value of the instruments issued. Stock-based compensation expense is generally recognized as a component of Selling, general and administrative expense in the Consolidated Statements of Operations, as payroll costs of the employees receiving the awards are recorded in the same line item.
The Company’s Consolidated Statements of Operations reflect the following amounts related to stock-based compensation:
| Year Ended December 31, | ||||||||||||
| 2013 | 2012 | 2011 | ||||||||||
| (In thousands) | ||||||||||||
| Stock-based compensation expense | $ | 13,334 | $ | 9,373 | $ | 4,908 | ||||||
| Deferred tax benefit | 434 | 305 | 1,719 | |||||||||
As of December 31, 2013, the Company had $25.5 million of unrecognized compensation expense related to stock-based awards that will be recognized over a weighted-average period of approximately 1.9 years. The intrinsic value of awards exercised or converted was $9.2 million, $9.9 million and $3.8 million during the years ended December 31, 20102013, 2012 and 20092011, respectively.
Stock Options
Under the 2008 Plan, the Company may grant options to purchase Common stock, with a maximum term of 10 years at a purchase price equal to the market value of the Company’s Common stock on the date of grant. In the case of an incentive stock option granted to a holder of 10% of the Company’s outstanding Common stock, the Company may grant options to purchase Common stock with a maximum term of 5 years, at a purchase price equal to 110% of the market value of the Company’s Common stock on the date of grant.
68
COLFAX CORPORATION
NOTES TO CONSOLIDATED FINANCIAL STATEMENTS - (Continued)
Stock-based compensation expense for stock option awards is based upon the grant-date fair value using the Black-Scholes option pricing model. The Company recognizes compensation expense for stock option awards on a straight-line basis over the requisite service period of the entire award. The following table shows the weighted-average assumptions used to calculate the fair value of stock option awards using the Black-Scholes option pricing model, as well as the weighted-average fair value of options granted:
| Year Ended December 31, | ||||||||||||
| 2013 | 2012 | 2011 | ||||||||||
| Expected period that options will be outstanding (in years) | 4.90 | 5.41 | 4.50 | |||||||||
| Interest rate (based on U.S. Treasury yields at the time of grant) | 1.06 | % | 0.99 | % | 2.10 | % | ||||||
| Volatility | 43.22 | % | 42.59 | % | 52.50 | % | ||||||
| Dividend yield | — | — | — | |||||||||
| Weighted-average fair value of options granted | $ | 18.07 | $ | 13.14 | $ | 9.68 | ||||||
Expected volatility is estimated based on the historical volatility of comparable public companies. The Company considers historical data to estimate employee termination within the valuation model. Separate groups of employees that have similar historical exercise behavior are considered separately for valuation purposes. Since the Company has limited option exercise history, it has generally elected to estimate the expected life of an award based upon the Securities and Exchange Commission-approved “simplified method” noted under the provisions of Staff Accounting Bulletin No. 107 with the continued use of this method extended under the provisions of Staff Accounting Bulletin No. 110.
Stock option activity is as follows:
| Goodwill | ||||
| Balance December 31, 2008 | $ | 161,694 | ||
| Contingent purchase price payment for Fairmount acquisition | 418 | |||
| Attributable to 2009 acquisition of PD-Technik | 6 | |||
| Impact of changes in foreign exchange rates | 1,300 | |||
| Balance December 31, 2009 | 163,418 | |||
| Contingent purchase price payment for Fairmount acquisition | 736 | |||
| Attributable to 2010 acquisition of Baric | 12,940 | |||
| Impact of changes in foreign exchange rates | (4,756 | ) | ||
| Balance December 31, 2010 | $ | 172,338 | ||
| Number of Options | Weighted- Average Exercise Price | Weighted- Average Remaining Contractual Term (In years) | Aggregate Intrinsic Value(1)(In thousands) | ||||||||||
| Outstanding at January 1, 2013 | 2,210,116 | $ | 25.35 | ||||||||||
| Granted | 551,480 | 46.99 | |||||||||||
| Exercised | (244,519 | ) | 15.11 | ||||||||||
| Forfeited | (81,446 | ) | 34.66 | ||||||||||
| Expired | (3,841 | ) | 21.15 | ||||||||||
| Outstanding at December 31, 2013 | 2,431,790 | $ | 30.98 | 4.94 | $ | 79,528 | |||||||
| Vested or expected to vest at December 31, 2013 | 2,378,775 | $ | 30.77 | 4.92 | $ | 78,305 | |||||||
| Exercisable at December 31, 2013 | 797,724 | $ | 18.92 | 3.63 | $ | 35,717 | |||||||
__________
(1) | The aggregate intrinsic value is based upon the difference between the Company’s closing stock price at the date of the Consolidated Balance Sheet and the exercise price of the stock option for in-the-money stock options. The intrinsic value of outstanding stock options fluctuates based upon the trading value of the Company’s Common stock. |
Restricted Stock Units
69
COLFAX CORPORATION
NOTES TO CONSOLIDATED FINANCIAL STATEMENTS - (Continued)
The fair value of PRSUs and RSUs is equal to the market value of a share of Common stock on the date of grant and the related compensation expense is recognized ratably over the requisite service period and, for PRSUs, when it is expected that any of the performance criterion will be achieved. The performance criterion was met for PRSUs granted during the year ended December 31, 2011, including PRSUs granted to the Company’s former Chief Executive Officer (“CEO”) as part of his initial employment agreement in January 2010, which were subject to a separate criterion. The performance criterion was met for PRSUs granted during the year ended December 31, 2012, including PRSUs granted to the Company’s CEO as part of his initial employment agreement in April 2012, which were subject to a separate criterion. The performance criterion was met for the PRSUs granted during the year ended December 31, 2013, except for PRSUs granted to one employee that were subject to a separate criterion.
The activity in the Company’s PRSUs and RSUs is as follows:
| PRSUs | RSUs | |||||||||||||
| Number of Units | Weighted- Average Grant Date Fair Value | Number of Units | Weighted- Average Grant Date Fair Value | |||||||||||
| Nonvested at January 1, 2013 | 560,951 | $ | 24.40 | 54,876 | $ | 26.23 | ||||||||
| Granted | 81,549 | 45.20 | 105,778 | 46.78 | ||||||||||
| Vested | (15,507 | ) | 18.13 | (35,761 | ) | 25.85 | ||||||||
| Forfeited | (50,251 | ) | 20.35 | (3,104 | ) | 41.06 | ||||||||
| Nonvested at December 31, 2013 | 576,742 | $ | 27.86 | 121,789 | $ | 43.81 | ||||||||
The fair value of shares vested during the years ended December 31, 2013, 2012 and 2011 was $2.5 million, $1.9 million and $1.1 million, respectively.
12. Accrued Liabilities
Accrued liabilities in the Consolidated Balance Sheets consisted of the following:
| December 31, | ||||||||||||||||
| 2010 | 2009 | |||||||||||||||
Gross Carrying Amount | Accumulated Amortization | Gross Carrying Amount | Accumulated Amortization | |||||||||||||
| Acquired customer relationships | $ | 22,084 | $ | (10,719 | ) | $ | 15,512 | $ | (8,989 | ) | ||||||
| Trade names - indefinite life | 4,819 | - | 2,062 | - | ||||||||||||
| Acquired developed technology | 12,231 | (3,331 | ) | 5,811 | (2,444 | ) | ||||||||||
| Acquired backlog of open orders | 3,311 | (474 | ) | - | - | |||||||||||
| Other intangibles | 591 | (214 | ) | 146 | (146 | ) | ||||||||||
| $ | 43,036 | $ | (14,738 | ) | $ | 23,531 | $ | (11,579 | ) | |||||||
| December 31, 2013 | December 31, 2012 | ||||||
| (In thousands) | |||||||
| Accrued payroll | $ | 136,645 | $ | 99,583 | |||
| Advance payment from customers | 53,280 | 61,431 | |||||
| Accrued taxes and deferred tax liability - current portion | 71,314 | 34,165 | |||||
| Accrued asbestos-related liability | 51,142 | 58,501 | |||||
| Warranty liability - current portion | 54,977 | 35,678 | |||||
| Accrued restructuring liability - current portion | 12,856 | 25,406 | |||||
| Accrued third-party commissions | 13,095 | 12,320 | |||||
| Other | 91,952 | 120,136 | |||||
| Accrued liabilities | $ | 485,261 | $ | 447,220 | |||
Accrued Restructuring Liability
The Company’s restructuring programs include a series of restructuring actions at its fluid-handling operations that began in 2009 and ongoing initiatives as a result of acquisitions, as well as efforts to reduce the structural costs and rationalize the corporate overhead of the combined businesses.
70
COLFAX CORPORATION
NOTES TO CONSOLIDATED FINANCIAL STATEMENTS - (Continued)
| Year Ended December 31, 2013 | |||||||||||||||||||
| Balance at Beginning of Period | Provisions | Payments | Foreign Currency Translation | Balance at End of Period(3) | |||||||||||||||
| (In thousands) | |||||||||||||||||||
| Restructuring and other related charges: | |||||||||||||||||||
| Gas and Fluid Handling: | |||||||||||||||||||
Termination benefits(1) | $ | 3,060 | $ | 9,413 | $ | (8,680 | ) | $ | (155 | ) | $ | 3,638 | |||||||
Facility closure costs(2) | 1,177 | 683 | (1,137 | ) | 33 | 756 | |||||||||||||
| Other related charges | — | 333 | (520 | ) | 187 | — | |||||||||||||
| 4,237 | 10,429 | (10,337 | ) | 65 | 4,394 | ||||||||||||||
| Fabrication Technology: | |||||||||||||||||||
Termination benefits(1) | 14,637 | 22,775 | (30,056 | ) | (323 | ) | 7,033 | ||||||||||||
Facility closure costs(2) | 6,925 | 280 | (5,736 | ) | (40 | ) | 1,429 | ||||||||||||
| Other related charges | 33 | 124 | (432 | ) | 275 | — | |||||||||||||
| 21,595 | 23,179 | (36,224 | ) | (88 | ) | 8,462 | |||||||||||||
| Non-cash impairment | 1,894 | ||||||||||||||||||
| 25,073 | |||||||||||||||||||
| Corporate and Other: | |||||||||||||||||||
Facility closure costs(2) | 1,522 | — | (718 | ) | 455 | 1,259 | |||||||||||||
| 1,522 | — | (718 | ) | 455 | 1,259 | ||||||||||||||
| $ | 27,354 | 33,608 | $ | (47,279 | ) | $ | 432 | $ | 14,115 | ||||||||||
| Non-cash impairment | 1,894 | ||||||||||||||||||
| $ | 35,502 | ||||||||||||||||||
(1) Includes severance and other termination benefits, including outplacement services. The Company recognizes the cost of involuntary
termination benefits at the communication date or ratably over any remaining expected future service period. Voluntary termination benefits
are recognized as a liability and an expense when employees accept the offer and the amount can be reasonably estimated.
(2) Includes the cost of relocating associates, relocating equipment and lease termination expense in connection with the acquisitionclosure of PD-Technikfacilities.
(3) As of December 31, 2013, $12.9 million and $1.2 million of the Company’s restructuring liability was included in 2009, customer relationship intangiblesAccrued liabilities and
Other liabilities, respectively.
71
COLFAX CORPORATION
NOTES TO CONSOLIDATED FINANCIAL STATEMENTS - (Continued)
| Year Ended December 31, 2012 | |||||||||||||||||||||||
| Balance at Beginning of Period | Acquisitions | Provisions | Payments | Foreign Currency Translation | Balance at End of Period(3) | ||||||||||||||||||
| (In thousands) | |||||||||||||||||||||||
| Restructuring and other related charges: | |||||||||||||||||||||||
| Gas and Fluid Handling: | |||||||||||||||||||||||
Termination benefits(1) | $ | 3,868 | $ | — | $ | 7,062 | $ | (8,014 | ) | $ | 144 | $ | 3,060 | ||||||||||
Facility closure costs(2) | 633 | — | 1,301 | (756 | ) | (1 | ) | 1,177 | |||||||||||||||
| Other related charges | 72 | — | 289 | (363 | ) | 2 | — | ||||||||||||||||
| 4,573 | — | 8,652 | (9,133 | ) | 145 | 4,237 | |||||||||||||||||
| Fabrication Technology: | |||||||||||||||||||||||
Termination benefits(1) | — | 6,276 | 30,292 | (22,277 | ) | 346 | 14,637 | ||||||||||||||||
Facility closure costs(2) | — | 3,994 | 10,584 | (7,800 | ) | 147 | 6,925 | ||||||||||||||||
| Other related charges | — | — | 1,205 | (1,174 | ) | 2 | 33 | ||||||||||||||||
| — | 10,270 | 42,081 | (31,251 | ) | 495 | 21,595 | |||||||||||||||||
| Non-cash impairment | 3,155 | ||||||||||||||||||||||
| 45,236 | |||||||||||||||||||||||
| Corporate and Other: | |||||||||||||||||||||||
Termination benefits(1) | — | — | 3,020 | (3,020 | ) | — | — | ||||||||||||||||
Facility closure costs(2) | — | — | 1,899 | (415 | ) | 38 | 1,522 | ||||||||||||||||
| Other related charges | — | — | 1,253 | (1,253 | ) | — | — | ||||||||||||||||
| — | — | 6,172 | (4,688 | ) | 38 | 1,522 | |||||||||||||||||
| $ | 4,573 | $ | 10,270 | 56,905 | $ | (45,072 | ) | $ | 678 | $ | 27,354 | ||||||||||||
| Non-cash impairment | 3,155 | ||||||||||||||||||||||
| $ | 60,060 | ||||||||||||||||||||||
(1) Includes severance and other termination benefits, including outplacement services. The Company recognizes the cost of $0.9involuntary
termination benefits at the communication date or ratably over any remaining expected future service period. Voluntary termination benefits
are recognized as a liability and an expense when employees accept the offer and the amount can be reasonably estimated.
(2) Includes the cost of relocating associates, relocating equipment and lease termination expense in connection with the closure of facilities.
(3) As of December 31, 2012, $25.4 million were acquired and are being amortized over a period$1.9 million of six years.the Company’s restructuring liability was included in Accrued liabilities and
Other liabilities, respectively.
The Company sponsors various defined benefit plans, defined contribution plans and other post-retirement benefits plans, including health and life insurance, for certain eligible employees or former employees. We useThe Company uses December 31st as the measurement date for all of ourits employee benefit plans.
72
NOTES TO CONSOLIDATED FINANCIAL STATEMENTS - (Continued)
The following table summarizes the total changes in ourthe Company’s pension and otheraccrued post-retirement benefit plan obligationsbenefits and plan assets and includes a statement of the plans’ funded status:
| Other | ||||||||||||||||
| Pension Benefits | Post-retirement Benefits | |||||||||||||||
| Year ended December 31, | 2010 | 2009 | 2010 | 2009 | ||||||||||||
| Change in benefit obligation: | ||||||||||||||||
| Projected benefit obligation at beginning of year | $ | 306,571 | $ | 295,165 | $ | 10,859 | $ | 10,370 | ||||||||
| Service cost | 1,168 | 1,381 | - | - | ||||||||||||
| Interest cost | 16,514 | 17,577 | 553 | 525 | ||||||||||||
| Actuarial loss | 20,344 | 10,662 | 3,671 | 772 | ||||||||||||
| Acquisitions | - | 72 | - | - | ||||||||||||
| Plan combinations | 12,639 | - | - | - | ||||||||||||
| Foreign exchange effect | (4,827 | ) | 2,958 | - | - | |||||||||||
| Benefits paid | (21,121 | ) | (21,244 | ) | (1,280 | ) | (808 | ) | ||||||||
| Projected benefit obligation at end of year | $ | 331,288 | $ | 306,571 | $ | 13,803 | $ | 10,859 | ||||||||
| Accumulated benefit obligation at end of year | $ | 327,498 | $ | 303,598 | $ | - | $ | - | ||||||||
| Change in plan assets: | ||||||||||||||||
| Fair value of plan assets at beginning of year | $ | 209,921 | $ | 192,859 | $ | - | $ | - | ||||||||
| Actual return on plan assets | 22,886 | 29,193 | - | - | ||||||||||||
| Employer contribution | 10,797 | 7,517 | 1,280 | 808 | ||||||||||||
| Acquisitions | - | 60 | - | - | ||||||||||||
| Plan combinations | 9,762 | - | ||||||||||||||
| Foreign exchange effect | (1,005 | ) | 1,536 | - | - | |||||||||||
| Benefits paid | (21,121 | ) | (21,244 | ) | (1,280 | ) | (808 | ) | ||||||||
| Fair value of plan assets at end of year | $ | 231,240 | $ | 209,921 | $ | - | $ | - | ||||||||
| Funded status at end of year | $ | (100,048 | ) | $ | (96,650 | ) | $ | (13,803 | ) | $ | (10,859 | ) | ||||
| Amounts recognized in the balance sheet at December 31: | ||||||||||||||||
| Non-current assets | $ | 290 | $ | 244 | $ | - | $ | - | ||||||||
| Current liabilities | (1,050 | ) | (1,114 | ) | (834 | ) | (1,409 | ) | ||||||||
| Non-current liabilities | (99,288 | ) | (95,780 | ) | (12,969 | ) | (9,450 | ) | ||||||||
| Total | $ | (100,048 | ) | $ | (96,650 | ) | $ | (13,803 | ) | $ | (10,859 | ) | ||||
| Pension Benefits | Other Post-Retirement Benefits | |||||||||||||||
| Year Ended December 31, | Year Ended December 31, | |||||||||||||||
| 2013 | 2012 | 2013 | 2012 | |||||||||||||
| (In thousands) | ||||||||||||||||
| Change in benefit obligation: | ||||||||||||||||
| Projected benefit obligation, beginning of year | $ | 1,665,138 | $ | 347,911 | $ | 35,519 | $ | 15,397 | ||||||||
| Acquisitions | 6,356 | 1,148,906 | — | 22,629 | ||||||||||||
| Service cost | 3,985 | 3,381 | 179 | 110 | ||||||||||||
| Interest cost | 63,132 | 67,745 | 1,090 | 1,507 | ||||||||||||
| Actuarial (gain) loss | (28,831 | ) | 135,715 | (6,072 | ) | (1,449 | ) | |||||||||
| Foreign exchange effect | 17,919 | 45,458 | — | — | ||||||||||||
| Benefits paid | (83,060 | ) | (84,333 | ) | (2,018 | ) | (2,675 | ) | ||||||||
| Settlements | (4,189 | ) | — | — | — | |||||||||||
| Other | (32 | ) | 355 | 125 | — | |||||||||||
| Projected benefit obligation, end of year | $ | 1,640,418 | $ | 1,665,138 | $ | 28,823 | $ | 35,519 | ||||||||
| Accumulated benefit obligation, end of year | $ | 1,617,651 | $ | 1,641,252 | $ | 28,823 | $ | 33,405 | ||||||||
| Change in plan assets: | ||||||||||||||||
| Fair value of plan assets, beginning of year | $ | 1,287,844 | $ | 221,004 | $ | — | $ | — | ||||||||
| Acquisitions | 2,787 | 954,919 | — | — | ||||||||||||
| Actual return on plan assets | 100,300 | 100,153 | — | — | ||||||||||||
Employer contribution(1) | 49,772 | 58,494 | 2,018 | 2,675 | ||||||||||||
| Foreign exchange effect | 13,076 | 37,359 | — | — | ||||||||||||
| Benefits paid | (83,060 | ) | (84,333 | ) | (2,018 | ) | (2,675 | ) | ||||||||
| Settlements | (3,565 | ) | ��� | — | — | |||||||||||
| Other | 161 | 248 | — | — | ||||||||||||
| Fair value of plan assets, end of year | $ | 1,367,315 | $ | 1,287,844 | $ | — | $ | — | ||||||||
| Funded status, end of year | $ | (273,103 | ) | $ | (377,294 | ) | $ | (28,823 | ) | $ | (35,519 | ) | ||||
| Amounts recognized on the Consolidated Balance Sheet at December 31: | ||||||||||||||||
| Non-current assets | $ | 38,177 | $ | 31,826 | $ | — | $ | — | ||||||||
| Current liabilities | (6,048 | ) | (5,639 | ) | (2,747 | ) | (3,076 | ) | ||||||||
| Non-current liabilities | (305,232 | ) | (403,481 | ) | (26,076 | ) | (32,443 | ) | ||||||||
| Total | $ | (273,103 | ) | $ | (377,294 | ) | $ | (28,823 | ) | $ | (35,519 | ) | ||||
__________
(1) | Contributions during the year ended December 31, 2013 includes the contribution of 88,200 shares of Colfax Common stock with a value on the contribution date of approximately $4.9 million. Contributions during the year ended December 31, 2012 included $18.9 million of supplemental contributions to pension plans in the United Kingdom as a result of financing the Charter Acquisition. |
The accumulated benefit obligation and fair value of plan assets for the pension plans with accumulated benefit obligations in excess of plan assets were $324.8 million$1.2 billion and $228.1$935.2 million, respectively, as of December 31, 20102013 and $301.2 million$1.3 billion and $207.2$864.6 million, respectively, as of December 31, 2009.2012.
The projected benefit obligation and fair value of plan assets for the pension plans with projected benefit obligations in excess of plan assets were $328.5 million$1.2 billion and $228.1$936.8 million, respectively, as of December 31, 20102013 and $304.1 million$1.3 billion and $207.2$868.2 million, respectively, as of December 31, 2009.2012.
73
NOTES TO CONSOLIDATED FINANCIAL STATEMENTS - (Continued)
The following table summarizes the changes in ourthe Company’s foreign pension plans’ obligationsbenefit obligation, which is determined based upon an employee’s expected date of separation, and plan assets, included in the previous disclosure,table above, and includes a statement of the foreign plans’ funded status:
| Foreign Pension Benefits | ||||||||
| Year ended December 31, | 2010 | 2009 | ||||||
| Change in benefit obligation: | ||||||||
| Projected benefit obligation at beginning of year | $ | 80,960 | $ | 82,253 | ||||
| Service cost | 1,168 | 1,381 | ||||||
| Interest cost | 4,138 | 4,668 | ||||||
| Actuarial loss (gain) | 5,494 | (5,947 | ) | |||||
| Acquisitions | - | 72 | ||||||
| Plan combinations | 12,639 | - | ||||||
| Foreign exchange effect | (4,827 | ) | 2,958 | |||||
| Benefits paid | (4,436 | ) | (4,425 | ) | ||||
| Projected benefit obligation at end of year | $ | 95,136 | $ | 80,960 | ||||
| Accumulated benefit obligation at end of year | $ | 91,346 | $ | 77,988 | ||||
| Change in plan assets | ||||||||
| Fair value of plan assets at beginning of year | $ | 24,841 | $ | 23,219 | ||||
| Actual return on plan assets | 1,638 | 1,390 | ||||||
| Employer contribution | 3,271 | 3,061 | ||||||
| Acquisitions | - | 60 | ||||||
| Plan combinations | 9,762 | - | ||||||
| Foreign exchange effect | (1,005 | ) | 1,536 | |||||
| Benefits paid | (4,436 | ) | (4,425 | ) | ||||
| Fair value of plan assets at end of year | $ | 34,071 | $ | 24,841 | ||||
| Funded status at end of year | $ | (61,065 | ) | $ | (56,119 | ) | ||
| Foreign Pension Benefits | ||||||||
| Year Ended December 31, | ||||||||
| 2013 | 2012 | |||||||
| (In thousands) | ||||||||
| Change in benefit obligation: | ||||||||
| Projected benefit obligation, beginning of year | $ | 1,181,024 | $ | 97,108 | ||||
| Acquisitions | 3,952 | 957,080 | ||||||
| Service cost | 3,985 | 3,381 | ||||||
| Interest cost | 46,775 | 49,291 | ||||||
| Actuarial loss | 11,093 | 85,167 | ||||||
| Foreign exchange effect | 17,919 | 45,458 | ||||||
| Benefits paid | (54,978 | ) | (56,816 | ) | ||||
| Settlements | (4,189 | ) | — | |||||
| Other | (27 | ) | 355 | |||||
| Projected benefit obligation, end of year | $ | 1,205,554 | $ | 1,181,024 | ||||
| Accumulated benefit obligation, end of year | $ | 1,182,786 | $ | 1,157,140 | ||||
| Change in plan assets: | ||||||||
| Fair value of plan assets, beginning of year | $ | 938,167 | $ | 32,339 | ||||
| Acquisitions | 651 | 817,258 | ||||||
| Actual return on plan assets | 62,914 | 58,139 | ||||||
Employer contribution(1) | 42,769 | 49,640 | ||||||
| Foreign exchange effect | 13,076 | 37,359 | ||||||
| Benefits paid | (54,978 | ) | (56,816 | ) | ||||
| Settlements | (3,565 | ) | — | |||||
| Other | 163 | 248 | ||||||
| Fair value of plan assets, end of year | $ | 999,197 | $ | 938,167 | ||||
| Funded status, end of year | $ | (206,357 | ) | $ | (242,857 | ) | ||
(1) | Contributions during the year ended December 31, 2012 included $18.9 million of supplemental contributions to pension plans in the United Kingdom as a result of financing the Charter Acquisition. |
Expected contributions to the Company’s pension and other post-employment benefit plans for 2011the year ending December 31, 2014, related to plans as of December 31, 2013, are $6.7$71.7 million. The following benefit payments are expected to be paid during the years ending December 31:each respective fiscal year:
| Pension Benefits | Other Post-Retirement Benefits | |||||||||||
| All Plans | Foreign Plans | |||||||||||
| (In thousands) | ||||||||||||
| 2014 | $ | 91,567 | $ | 60,457 | $ | 2,747 | ||||||
| 2015 | 88,857 | 57,878 | 2,558 | |||||||||
| 2016 | 89,680 | 58,861 | 2,507 | |||||||||
| 2017 | 92,667 | 62,068 | 2,415 | |||||||||
| 2018 | 92,292 | 62,029 | 2,276 | |||||||||
| Thereafter | 473,061 | 326,741 | 8,278 | |||||||||
| Other | ||||||||||||
| Pension Benefits | Post-retirement | |||||||||||
| All Plans | Foreign Plans | Benefits | ||||||||||
| 2011 | $ | 23,080 | $ | 4,554 | $ | 834 | ||||||
| 2012 | 22,232 | 4,752 | 895 | |||||||||
| 2013 | 22,182 | 4,833 | 922 | |||||||||
| 2014 | 22,228 | 4,923 | 932 | |||||||||
| 2015 | 22,424 | 5,003 | 945 | |||||||||
| Years 2016-2020 | 110,002 | 25,782 | 4,534 | |||||||||
74
NOTES TO CONSOLIDATED FINANCIAL STATEMENTS - (Continued)
The Company’s primary investment objective for its pension plan assets is to provide a source of retirement income for the plans’ participants and beneficiaries. The assets are invested with the goal of preserving principal while providing a reasonable real rate of return over the long term. Diversification of assets is achieved through strategic allocations to various asset classes. Actual allocations to each asset class vary due to periodic investment strategy changes, market value fluctuations, the length of time it takes to fully implement investment allocation positions, and the timing of benefit payments and contributions. The asset allocation is monitored and rebalanced as required, as frequently as on a quarterly basis in some instances. The following are the actual and target allocation percentages for the Company’s pension plan assets:
| Actual Allocation | ||||||||||||||||||||
| December 31, | Target | |||||||||||||||||||
| 2010 | 2009 | Allocation | Actual Asset Allocation December 31, | Target | ||||||||||||||||
| 2013 | 2012 | Allocation | ||||||||||||||||||
| United States Plans: | ||||||||||||||||||||
| U.S. Plans: | ||||||||||||||||||||
| Equity securities: | ||||||||||||||||||||
| U.S. | 34 | % | 39 | % | 32% - 42 | % | 41 | % | 36 | % | 30% - 45% | |||||||||
| International | 16 | 12 | 10% - 16 | % | 16 | % | 15 | % | 10% - 20% | |||||||||||
| Fixed income securities | 32 | 34 | 27% - 43 | % | ||||||||||||||||
| Hedge fund | 18 | 15 | 13% - 20 | % | ||||||||||||||||
| Fixed income | 39 | % | 37 | % | 30% - 50% | |||||||||||||||
| Hedge funds | 3 | % | 11 | % | 0% - 20% | |||||||||||||||
| Cash and cash equivalents | 1 | % | 1 | % | 0% - 5% | |||||||||||||||
| Foreign Plans: | ||||||||||||||||||||
| Large cap equity securities | 11 | 15 | 0% - 20 | % | ||||||||||||||||
| Equity securities | 30 | % | 37 | % | 10% - 50% | |||||||||||||||
| Fixed income securities | 57 | 83 | 80% - 100 | % | 65 | % | 58 | % | 50% - 90% | |||||||||||
| Cash and cash equivalents | 32 | 2 | 0% - 5 | % | 2 | % | 2 | % | 0% - 25% | |||||||||||
| Other | 3 | % | 3 | % | 0% - 5% | |||||||||||||||
| December 31, 2013 | ||||||||||||||||
| Level One | Level Two | Level Three | Total | |||||||||||||
| (In thousands) | ||||||||||||||||
| U.S. Plans: | ||||||||||||||||
| Cash and cash equivalents | $ | 2,854 | $ | — | $ | — | $ | 2,854 | ||||||||
| Equity securities: | ||||||||||||||||
| U.S. large cap | 101,702 | — | — | 101,702 | ||||||||||||
| U.S. small/mid cap | 6,714 | 43,199 | — | 49,913 | ||||||||||||
| International | 16,458 | 41,646 | — | 58,104 | ||||||||||||
| Fixed income mutual funds: | ||||||||||||||||
| U.S. government and corporate | 143,903 | — | — | 143,903 | ||||||||||||
| Multi-strategy hedge funds | — | — | 11,642 | 11,642 | ||||||||||||
| Foreign Plans: | ||||||||||||||||
| Cash and cash equivalents | 22,421 | — | — | 22,421 | ||||||||||||
| Equity securities | 266,021 | 38,485 | — | 304,506 | ||||||||||||
| Non-U.S. government and corporate bonds | 277,565 | 372,191 | — | 649,756 | ||||||||||||
Other(1) | 2,107 | 20,407 | — | 22,514 | ||||||||||||
| $ | 839,745 | $ | 515,928 | $ | 11,642 | $ | 1,367,315 | |||||||||
(1) | Represents diversified portfolio funds and reinsurance contracts maintained for certain foreign plans. |
75
COLFAX CORPORATION
NOTES TO CONSOLIDATED FINANCIAL STATEMENTS - (Continued)
| December 31, 2012 | ||||||||||||||||
| Level One | Level Two | Level Three | Total | |||||||||||||
| (In thousands) | ||||||||||||||||
| U.S. Plans: | ||||||||||||||||
| Cash and cash equivalents | $ | 2,645 | $ | — | $ | — | $ | 2,645 | ||||||||
| Equity securities: | ||||||||||||||||
| U.S. large cap | 89,293 | — | — | 89,293 | ||||||||||||
| U.S. small/mid cap | — | 37,671 | — | 37,671 | ||||||||||||
| International | 15,579 | 37,323 | — | 52,902 | ||||||||||||
| Fixed income mutual funds: | ||||||||||||||||
| U.S. government and corporate | 128,334 | — | — | 128,334 | ||||||||||||
| Multi-strategy hedge funds | — | — | 38,832 | 38,832 | ||||||||||||
| Foreign Plans: | ||||||||||||||||
| Cash and cash equivalents | 19,594 | — | — | 19,594 | ||||||||||||
| Equity securities | 234,228 | 108,598 | — | 342,826 | ||||||||||||
| Non-U.S. government and corporate bonds | 250,891 | 298,160 | — | 549,051 | ||||||||||||
Other(1) | 2,108 | 24,588 | — | 26,696 | ||||||||||||
| $ | 742,672 | $ | 506,340 | $ | 38,832 | $ | 1,287,844 | |||||||||
__________
(1) | Represents diversified portfolio funds and reinsurance contracts maintained for certain foreign plans. |
The Company’s pension assets included in Level Three of the fair value hierarchy asconsist of December 31, 2010multi-strategy hedge funds and 2009. Thethe fair value hierarchy has three levels based onis equal to the reliability of the inputs used to determine fair value. Level 1 refers to fair values determined based on quoted prices in active markets for identical assets. Level 2 refers to fair values estimated using significant observable inputs, and Level 3 includes fair values estimated using significant unobservable inputs.
| December 31, 2010 | ||||||||||||||||
| Total | Level 1 | Level 2 | Level 3 | |||||||||||||
| United States Plans: | ||||||||||||||||
| Cash and cash equivalents | $ | 3 | $ | 3 | $ | - | $ | - | ||||||||
| Equity mutual funds: | ||||||||||||||||
| U.S. large cap | 54,086 | 54,086 | - | - | ||||||||||||
| U.S. small / mid-cap | 12,339 | 12,339 | - | - | ||||||||||||
| International | 32,271 | 32,271 | - | - | ||||||||||||
| Fixed income mutual funds: | ||||||||||||||||
| U.S. government and corporate | 39,923 | 39,923 | - | - | ||||||||||||
| High yield bonds | 16,011 | 16,011 | ||||||||||||||
| Emerging markets debt | 6,194 | 6,194 | - | - | ||||||||||||
| Multi-strategy hedge funds | 36,342 | - | - | 36,342 | ||||||||||||
| Foreign Plans: | ||||||||||||||||
| Cash and cash equivalents | 10,638 | 10,638 | - | - | ||||||||||||
| Large cap equity securities | 3,885 | 3,885 | - | - | ||||||||||||
| Non-U.S. Government bonds | 13,520 | 13,520 | ||||||||||||||
Other (a) | 6,028 | - | 6,028 | - | ||||||||||||
| $ | 231,240 | $ | 175,350 | $ | 19,548 | $ | 36,342 | |||||||||
| December 31, 2009 | ||||||||||||||||
| Total | Level 1 | Level 2 | Level 3 | |||||||||||||
| United States Plans: | ||||||||||||||||
| Cash and cash equivalents | $ | 1,180 | $ | 1,180 | $ | - | $ | - | ||||||||
| Equity mutual funds: | ||||||||||||||||
| U.S. large cap | 56,400 | 56,400 | - | - | ||||||||||||
| U.S. small / mid-cap | 15,992 | 15,992 | - | - | ||||||||||||
| International | 22,548 | 22,548 | - | - | ||||||||||||
| Fixed income mutual funds: | ||||||||||||||||
| U.S. government and corporate | 39,192 | 39,192 | - | - | ||||||||||||
| High yield bonds | 11,613 | 11,613 | ||||||||||||||
| Emerging markets debt | 11,386 | 11,386 | - | - | ||||||||||||
| Multi-strategy hedge funds | 26,769 | - | - | 26,769 | ||||||||||||
| Foreign Plans: | ||||||||||||||||
| Cash and cash equivalents | 568 | 568 | - | - | ||||||||||||
| Large cap equity securities | 3,688 | 3,688 | - | - | ||||||||||||
| Non-U.S. Government bonds | 15,498 | 15,498 | ||||||||||||||
Other (a) | 5,087 | - | 5,087 | - | ||||||||||||
| $ | 209,921 | $ | 162,567 | $ | 20,585 | $ | 26,769 | |||||||||
| Balance at January 1, 2009 | $ | 25,983 | ||
| Unrealized gains | 786 | |||
| Balance at December 31, 2009 | 26,769 | |||
| Net purchases and sales | 9,036 | |||
| Realized losses | (316 | ) | ||
| Unrealized gains | 853 | |||
| Balance at December 31, 2010 | $ | 36,342 |
| (In thousands) | |||
| Balance, January 1, 2011 | $ | 36,342 | |
| Unrealized loss | (21 | ) | |
| Balance, December 31, 2011 | 36,321 | ||
| Realized gain | 152 | ||
| Unrealized gain | 2,359 | ||
| Balance, December 31, 2012 | 38,832 | ||
| Sale proceeds | (28,440 | ) | |
| Realized gain | 338 | ||
| Unrealized gain | 912 | ||
| Balance, December 31, 2013 | $ | 11,642 | |
76
COLFAX CORPORATION
NOTES TO CONSOLIDATED FINANCIAL STATEMENTS - (Continued)
The following table sets forth the components of net periodic benefit cost and Other comprehensive income (loss) of the Company’s defined benefit pension plans and other post-retirement employee benefit plans:
| Pension Benefits | Other Post-Retirement Benefits | |||||||||||||||||||||||
| Year Ended December 31, | Year Ended December 31, | |||||||||||||||||||||||
| 2013 | 2012 | 2011 | 2013 | 2012 | 2011 | |||||||||||||||||||
| (In thousands) | ||||||||||||||||||||||||
| Components of Net Periodic Benefit Cost: | ||||||||||||||||||||||||
| Service cost | $ | 3,985 | $ | 3,381 | $ | 1,383 | $ | 179 | $ | 110 | $ | — | ||||||||||||
| Interest cost | 63,132 | 67,745 | 16,408 | 1,090 | 1,507 | 690 | ||||||||||||||||||
| Amortization | 9,672 | 8,091 | 5,839 | 609 | 801 | 852 | ||||||||||||||||||
| Settlement (gain) loss | (592 | ) | — | 1,499 | — | — | — | |||||||||||||||||
| Other | (154 | ) | 26 | — | 125 | — | — | |||||||||||||||||
| Expected return on plan assets | (58,511 | ) | (61,094 | ) | (18,101 | ) | — | — | — | |||||||||||||||
| Net periodic benefit cost | $ | 17,532 | $ | 18,149 | $ | 7,028 | $ | 2,003 | $ | 2,418 | $ | 1,542 | ||||||||||||
| Change in Plan Assets and Benefit Obligations Recognized in Other Comprehensive Income (Loss): | ||||||||||||||||||||||||
| Current year net actuarial (gain) loss | $ | (69,463 | ) | $ | 98,784 | $ | 37,037 | $ | (6,072 | ) | $ | (1,449 | ) | $ | 1,507 | |||||||||
| Less amounts included in net periodic benefit cost: | ||||||||||||||||||||||||
| Amortization of net loss | (9,672 | ) | (8,012 | ) | (5,839 | ) | (361 | ) | (553 | ) | (604 | ) | ||||||||||||
| Settlement loss | (32 | ) | — | (835 | ) | — | — | — | ||||||||||||||||
| Amortization of prior service cost | — | (79 | ) | — | (248 | ) | (248 | ) | (248 | ) | ||||||||||||||
| Total recognized in Other comprehensive income (loss) | $ | (79,167 | ) | $ | 90,693 | $ | 30,363 | $ | (6,681 | ) | $ | (2,250 | ) | $ | 655 | |||||||||
The following table sets forth the components of net periodic benefit cost and Other comprehensive income (loss) of the foreign defined benefit pension plans, included in the table above:
| Foreign Pension Benefits | ||||||||||||
| Year Ended December 31, | ||||||||||||
| 2013 | 2012 | 2011 | ||||||||||
| (In thousands) | ||||||||||||
| Components of Net Periodic Benefit Cost: | ||||||||||||
| Service cost | $ | 3,985 | $ | 3,381 | $ | 1,383 | ||||||
| Interest cost | 46,775 | 49,291 | 5,132 | |||||||||
| Amortization | 2,305 | 944 | 588 | |||||||||
| Settlement (gain) loss | (592 | ) | — | 1,499 | ||||||||
| Other | (154 | ) | 28 | — | ||||||||
| Expected return on plan assets | (34,541 | ) | (36,535 | ) | (1,400 | ) | ||||||
| Net periodic benefit cost | $ | 17,778 | $ | 17,109 | $ | 7,202 | ||||||
| Change in Plan Assets and Benefit Obligations Recognized in Other Comprehensive Income (Loss): | ||||||||||||
| Current year net actuarial (gain) loss | $ | (16,121 | ) | $ | 65,689 | $ | 4,101 | |||||
| Less amounts included in net periodic benefit cost: | ||||||||||||
| Amortization of net loss | (2,305 | ) | (865 | ) | (588 | ) | ||||||
| Settlement loss | (32 | ) | — | (835 | ) | |||||||
| Amortization of prior service cost | — | (79 | ) | — | ||||||||
| Total recognized in Other comprehensive income (loss) | $ | (18,458 | ) | $ | 64,745 | $ | 2,678 | |||||
77
COLFAX CORPORATION
NOTES TO CONSOLIDATED FINANCIAL STATEMENTS - (Continued)
The components of net unrecognized pension and other post-retirement benefit cost included in Accumulated other comprehensive loss in the Consolidated Balance Sheets that have not been recognized as a component of net periodic benefit cost are as follows:
| Pension Benefits | Other Post-Retirement Benefits | |||||||||||||||
| December 31, | December 31, | |||||||||||||||
| 2013 | 2012 | 2013 | 2012 | |||||||||||||
| (In thousands) | ||||||||||||||||
| Net actuarial loss (gain) | $ | 196,044 | $ | 275,211 | $ | (757 | ) | $ | 5,676 | |||||||
| Prior service cost | — | — | 1,055 | 1,303 | ||||||||||||
| Total | $ | 196,044 | $ | 275,211 | $ | 298 | $ | 6,979 | ||||||||
The components of net periodicunrecognized pension and other post-retirement benefit cost andincluded in Accumulated other comprehensive loss (income) were as follows:
| Pension Benefits | Other Post-retirement Benefits | |||||||||||||||||||||||
| 2010 | 2009 | 2008 | 2010 | 2009 | 2008 | |||||||||||||||||||
| Components of net periodic benefit cost: | ||||||||||||||||||||||||
| Service cost | $ | 1,168 | $ | 1,381 | $ | 1,160 | $ | - | $ | - | $ | - | ||||||||||||
| Interest cost | 16,514 | 17,577 | 17,429 | 553 | 525 | 501 | ||||||||||||||||||
| Amortization | 4,593 | 3,639 | 2,523 | 482 | 353 | 227 | ||||||||||||||||||
| Plan combinations | 2,877 | - | - | - | - | - | ||||||||||||||||||
| Expected return on plan assets | (19,331 | ) | (19,570 | ) | (20,509 | ) | - | - | - | |||||||||||||||
| Net periodic benefit cost | $ | 5,821 | $ | 3,027 | $ | 603 | $ | 1,035 | $ | 878 | $ | 728 | ||||||||||||
| Change in plan assets and benefit obligations recognized in other comprehensive loss (income): | ||||||||||||||||||||||||
| Current year net actuarial loss | 16,736 | 710 | 66,101 | 3,671 | 772 | 901 | ||||||||||||||||||
| Prior service cost | - | - | - | - | - | 2,359 | ||||||||||||||||||
| Less amounts included in net periodic cost: | - | - | ||||||||||||||||||||||
| Amortization of net loss | (4,593 | ) | (3,639 | ) | (2,523 | ) | (234 | ) | (104 | ) | (165 | ) | ||||||||||||
| Amortization of prior service cost | - | - | - | (248 | ) | (249 | ) | (62 | ) | |||||||||||||||
| Total recognized in other comprehensive loss (income) | $ | 12,143 | $ | (2,929 | ) | $ | 63,578 | $ | 3,189 | $ | 419 | $ | 3,033 | |||||||||||
| Foreign Pension Benefits | ||||||||||||
| 2010 | 2009 | 2008 | ||||||||||
| Components of net periodic benefit cost: | ||||||||||||
| Service cost | $ | 1,168 | $ | 1,381 | $ | 1,160 | ||||||
| Interest cost | 4,138 | 4,668 | 4,364 | |||||||||
| Recognized net actuarial loss | 385 | 808 | 348 | |||||||||
| Plan combinations | 2,877 | |||||||||||
| Expected return on plan assets | (1,259 | ) | (1,204 | ) | (1,456 | ) | ||||||
| Net periodic benefit cost | $ | 7,309 | $ | 5,653 | $ | 4,416 | ||||||
| Change in plan assets and benefit obligations recognized in other comprehensive loss (income): | ||||||||||||
| Current year net actuarial loss (gain) | 5,062 | (6,464 | ) | 6,339 | ||||||||
| Less amounts included in net periodic cost: | ||||||||||||
| Amortization of net loss | (385 | ) | (808 | ) | (348 | ) | ||||||
| Total recognized in other comprehensive loss (income) | $ | 4,677 | $ | (7,272 | ) | $ | 5,991 | |||||
| Other | ||||||||||||||||
| Pension Benefits | Post-retirement Benefits | |||||||||||||||
| At December 31, | 2010 | 2009 | 2010 | 2009 | ||||||||||||
| Net actuarial loss | $ | 153,757 | $ | 141,614 | $ | 6,774 | $ | 3,337 | ||||||||
| Prior service cost | - | - | 1,800 | 2,048 | ||||||||||||
| Total | $ | 153,757 | $ | 141,614 | $ | 8,574 | $ | 5,385 | ||||||||
| Other | ||||||||||||||||
| Pension | Post-retirement | |||||||||||||||
| Benefits | Benefits | Pension Benefits | Other Post- Retirement Benefits | |||||||||||||
| (In thousands) | ||||||||||||||||
| Net actuarial loss | $ | 5,854 | $ | 567 | ||||||||||||
| Net actuarial loss (gain) | $ | 6,859 | $ | (9 | ) | |||||||||||
| Prior service cost | - | 248 | — | 248 | ||||||||||||
| Total | $ | 5,854 | $ | 815 | $ | 6,859 | $ | 239 | ||||||||
The key economic assumptions used in the measurement of the Company’s pension and other post-retirement benefit obligations at December 31, 2010 and 2009 are as follows:
| Other | ||||||||||||||||
| Pension Benefits | Post-retirement Benefits | |||||||||||||||
| 2010 | 2009 | 2010 | 2009 | |||||||||||||
| Weighted-average discount rate: | ||||||||||||||||
| For all plans | 5.1 | % | 5.7 | % | 5.2 | % | 5.6 | % | ||||||||
| For all foreign plans | 5.4 | % | 5.6 | % | - | - | ||||||||||
| Weighted-average rate of increase in compensation | ||||||||||||||||
| levels for active foreign plans | 2.6 | % | 2.0 | % | - | - | ||||||||||
| Pension Benefits | Other Post-Retirement Benefits | |||||||||||
| December 31, | December 31, | |||||||||||
| 2013 | 2012 | 2013 | 2012 | |||||||||
| Weighted-average discount rate: | ||||||||||||
| All plans | 4.4 | % | 4.0 | % | 4.4 | % | 3.4 | % | ||||
| Foreign plans | 4.4 | % | 4.2 | % | — | — | ||||||
| Weighted-average rate of increase in compensation levels for active foreign plans | 1.6 | % | 1.5 | % | — | — | ||||||
The key economic assumptions used in the computation of net periodic benefit cost for the years ended December 31, 2010, 2009 and 2008 are as follows:
| Pension Benefits | Other Post-Retirement Benefits | |||||||||||||||||
| Year Ended December 31, | Year Ended December 31, | |||||||||||||||||
| 2013 | 2012 | 2011 | 2013 | 2012 | 2011 | |||||||||||||
| Weighted-average discount rate: | ||||||||||||||||||
| All plans | 4.0 | % | 4.6 | % | 5.0 | % | 3.5 | % | 4.3 | % | 5.2 | % | ||||||
| Foreign plans | 4.2 | % | 4.7 | % | 5.1 | % | — | — | — | |||||||||
| Weighted-average expected return on plan assets: | ||||||||||||||||||
| All plans | 5.1 | % | 5.3 | % | 7.7 | % | — | — | — | |||||||||
| Foreign plans | 4.3 | % | 4.5 | % | 4.7 | % | — | — | — | |||||||||
| Weighted-average rate of increase in compensation levels for active foreign plans | 1.5 | % | 1.3 | % | 2.6 | % | — | — | — | |||||||||
| Pension Benefits | Other Post-retirement Benefits | |||||||||||||||||||||||
| 2010 | 2009 | 2008 | 2010 | 2009 | 2008 | |||||||||||||||||||
| Weighted-average discount rate: | ||||||||||||||||||||||||
| For all plans | 5.7 | % | 6.1 | % | 6.0 | % | 5.6 | % | 6.0 | % | 6.3 | % | ||||||||||||
| For all foreign plans | 5.6 | % | 5.8 | % | 4.7 | % | - | - | - | |||||||||||||||
| Weighted-average expected return on plan assets: | ||||||||||||||||||||||||
| For all plans | 8.3 | % | 8.3 | % | 8.3 | % | - | - | - | |||||||||||||||
| For all foreign plans | 5.4 | % | 5.0 | % | 5.1 | % | - | - | - | |||||||||||||||
Weighted-average rate of increase in compensation levels for active foreign plans | 2.2 | % | 2.1 | % | 2.2 | % | - | - | - | |||||||||||||||
In determining discount rates, the Company utilizes the single discount rate equivalent to discounting the expected future cash flows from each plan using the yields at each duration from a published yield curve as of the measurement date.
78
COLFAX CORPORATION
NOTES TO CONSOLIDATED FINANCIAL STATEMENTS - (Continued)
For measurement purposes, ana weighted-average annual rate of increase in the per capita cost of covered health care benefits of approximately 16.0%11.5% was assumed. The rate was assumed to decrease gradually to 5.0%4.5% by 2027 for four of the Company’s plans and to 5.25% by 2021 for another plan and remain at that levelthose levels thereafter for benefits covered under the plans.
The expected long-term rate of return on plan assets was based on the Company’s investment policy target allocation of the asset portfolio between various asset classes and the expected real returns of each asset class over various periods of time that are consistent with the long-term nature of the underlying obligations of these plans.
Assumed health care cost trend rates have a significant effect on the amounts reported for the health care plan. A one-percentage point change in assumed health care cost trend rates would have the following pre-tax effects:
| 1% Increase | 1% Decrease | |||||||
| (in thousands) | ||||||||
| Effect on total service and interest cost components for the year ended December 31, 2013 | $ | 151 | $ | (118 | ) | |||
| Effect on post-retirement benefit obligation at December 31, 2013 | 2,670 | (2,167 | ) | |||||
1 Percentage Point Increase | 1 Percentage Point Decrease | |||||||
| Effect on total service and interest cost components for 2010 | $ | 52 | $ | (43 | ) | |||
| Effect on post-retirement benefit obligation at December 31, 2010 | 1,667 | (1,358 | ) | |||||
The Company maintains defined contribution plans covering substantially all of their non-union domestic employees, as well as certain union domesticand non-union employees. Under the terms of the plans, eligible employees may generally contribute from 1% to 50% of their compensation on a pre-tax basis. The Company’s contributions are based on 50% of the first 6% of each participant’s pre-tax contribution. Additionally, the Company makes a unilateral contribution of 3% of all employees’ salary (including non-contributing participants) to the defined contribution plans. The Company’s expense for 2010, 2009 and 2008 was $2.4 million, $2.4 million and $2.2 million, respectively, related to these plans.
| December 31, | ||||||||
| 2010 | 2009 | |||||||
| Term A notes (senior bank debt) | $ | 82,500 | $ | 91,250 | ||||
| Capital leases and other | - | 235 | ||||||
| Total debt | 82,500 | 91,485 | ||||||
| Less-current portion Term A | (10,000 | ) | (8,750 | ) | ||||
| Less-current portion capital leases and other | - | (219 | ) | |||||
| $ | 72,500 | $ | 82,516 | |||||
| Term Debt | ||||
| 2011 | $ | 10,000 | ||
| 2012 | 10,000 | |||
| 2013 | 62,500 | |||
| Total | $ | 82,500 | ||
| December 31, | ||||||||
| 2010 | 2009 | |||||||
| Foreign currency translation adjustment | $ | 5,928 | $ | 14,188 | ||||
| Unrealized losses on hedging activities | (1,789 | ) | (3,035 | ) | ||||
| Net unrecognized pension and other post-retirement benefit costs | (134,654 | ) | (120,950 | ) | ||||
| Total accumulated other comprehensive loss | $ | (130,515 | ) | $ | (109,797 | ) | ||
| Years Ended December 31, | ||||||||||||
| 2010 | 2009 | 2008 | ||||||||||
| Weighted-average assumptions used in Black-Scholes model: | ||||||||||||
Expected period that options will be outstanding (in years) | 4.50 | 4.50 | 4.50 | |||||||||
Interest rate (based on U.S. Treasury yields at time of grant) | 2.38 | % | 1.87 | % | 3.08 | % | ||||||
| Volatility | 52.22 | % | 32.50 | % | 32.35 | % | ||||||
| Dividend yield | - | - | - | |||||||||
| Weighted-average fair value of options granted | $ | 5.63 | $ | 2.24 | $ | 5.75 | ||||||
14. Financial Instruments and Fair Value Measurements
The company utilizes fair value measurement guidance prescribed by accounting standards to value its financial instruments. The guidance establishes a fair value hierarchy based on the inputs used to measure fair value. This hierarchy prioritizes the inputs into three broad levels as follows:
| Shares | Weighted- Average Exercise Price | Remaining Contractual Term | Aggregate Intrinsic Value | |||||||||
| (Years) | ||||||||||||
| Outstanding at January 1, 2008 | - | $ | - | |||||||||
| Granted | 531,999 | 17.94 | ||||||||||
| Exercised | - | - | ||||||||||
| Forfeited | (17,008 | ) | 18.00 | |||||||||
| Outstanding at December 31, 2008 | 514,991 | $ | 17.93 | |||||||||
| Granted | 844,165 | 7.44 | ||||||||||
| Exercised | - | - | ||||||||||
| Forfeited | (91,523 | ) | 11.70 | |||||||||
| Outstanding at December 31, 2009 | 1,267,633 | $ | 11.40 | |||||||||
| Granted | 756,471 | 12.48 | ||||||||||
| Exercised | (152,490 | ) | 7.48 | |||||||||
| Forfeited | (295,125 | ) | 10.71 | |||||||||
| Expired | (35,833 | ) | 15.94 | |||||||||
| Outstanding at December 31, 2010 | 1,540,656 | $ | 12.34 | 5.47 | $ | 9,380 | ||||||
| Vested or expected to vest at December 31, 2010 | 1,146,682 | $ | 13.06 | 5.11 | $ | 6,162 | ||||||
| Exercisable at December 31, 2010 | 478,052 | $ | 13.82 | 4.72 | $ | 2,214 | ||||||
Level Three: Inputs to the valuation methodology are unobservable and significant to the fair value measurement.
A financial instrument's level within the fair value hierarchy is based on the difference between the Company’s closing stock price at the balance sheet date and the exercise pricelowest level of the stock option, multiplied by the number of in-the-money options. The amount of intrinsic value will change based onany input that is significant to the fair value of the Company’s stock.
| PRSUs | RSUs | |||||||||||||||
| Nonvested shares | Shares | Weighted- Average Grant Date Fair Value | Shares | Weighted- Average Grant Date Fair Value | ||||||||||||
| Nonvested at January 1, 2008 | - | $ | - | - | $ | - | ||||||||||
| Granted | 125,041 | 17.89 | 73,305 | 18.00 | ||||||||||||
| Vested | - | - | - | - | ||||||||||||
| Forfeited | (694 | ) | 18.00 | (1,116 | ) | 18.00 | ||||||||||
| Nonvested at December 31, 2008 | 124,347 | $ | 17.89 | 72,189 | $ | 18.00 | ||||||||||
| Granted | 337,716 | 7.44 | 69,610 | 8.35 | ||||||||||||
| Vested | - | - | (48,871 | ) | 15.72 | |||||||||||
| Forfeited | (31,566 | ) | 10.69 | - | - | |||||||||||
| Nonvested at December 31, 2009 | 430,497 | $ | 10.22 | 92,928 | $ | 11.97 | ||||||||||
| Granted | 263,454 | 12.10 | 44,693 | 12.88 | ||||||||||||
| Vested | (25,000 | ) | 18.00 | (53,828 | ) | 13.69 | ||||||||||
| Forfeited | (385,456 | ) | 8.72 | - | - | |||||||||||
| Nonvested at December 31, 2010 | 283,495 | $ | 13.33 | 83,793 | $ | 11.35 | ||||||||||
The carrying values of financial instruments, including accounts receivable, accountsTrade receivables, other receivables and Accounts payable, and other accrued liabilities, approximate their fair values due to their short-term maturities. The estimated fair value of the Company’s long-term debt of $81.6 million$1.5 billion and $88.6 million at $1.7 billion as of December 31, 20102013 and 2009,2012, respectively, was based on current interest rates for similar types of borrowings.borrowings and is in Level Two of the fair value hierarchy. The estimated fair values may not represent actual values of the financial instruments that could be realized as of the balance sheet date or that will be realized in the future.
79
COLFAX CORPORATION
NOTES TO CONSOLIDATED FINANCIAL STATEMENTS - (Continued)
A summary of the Company’s assets and liabilities that are measured at fair value on a recurring basis for each fair value hierarchy level for the periods presented is as follows:
| December 31, 2013 | |||||||||||||||
| Level One | Level Two | Level Three | Total | ||||||||||||
| (In thousands) | |||||||||||||||
| Assets: | |||||||||||||||
| Cash equivalents | $ | 22,032 | $ | — | $ | — | $ | 22,032 | |||||||
| Foreign currency contracts related to sales - designated as hedges | — | 11,241 | — | 11,241 | |||||||||||
| Foreign currency contracts related to sales - not designated as hedges | — | 3,642 | — | 3,642 | |||||||||||
| Foreign currency contracts related to purchases - designated as hedges | — | 428 | — | 428 | |||||||||||
| Foreign currency contracts related to purchases - not designated as hedges | — | 2,543 | — | 2,543 | |||||||||||
| Deferred compensation plans | — | 2,414 | — | 2,414 | |||||||||||
| $ | 22,032 | $ | 20,268 | $ | — | $ | 42,300 | ||||||||
| Liabilities: | |||||||||||||||
| Foreign currency contracts related to sales - designated as hedges | $ | — | $ | 1,126 | $ | — | $ | 1,126 | |||||||
| Foreign currency contracts related to sales - not designated as hedges | — | 3,625 | — | 3,625 | |||||||||||
| Foreign currency contracts related to purchases - designated as hedges | — | 742 | — | 742 | |||||||||||
| Foreign currency contracts related to purchases - not designated as hedges | — | 846 | — | 846 | |||||||||||
| Deferred compensation plans | — | 2,414 | — | 2,414 | |||||||||||
| Liability for contingent payments | — | — | 6,176 | 6,176 | |||||||||||
| $ | — | $ | 8,753 | $ | 6,176 | $ | 14,929 | ||||||||
| Total | Level 1 | Level 2 | Level 3 | |||||||||||||
| As of December 31, 2010 | ||||||||||||||||
| Assets: | ||||||||||||||||
| Cash equivalents | $ | 24,925 | $ | 24,925 | $ | - | $ | - | ||||||||
| Liabilities: | ||||||||||||||||
| Interest rate swap | $ | 1,789 | $ | - | $ | 1,789 | $ | - | ||||||||
| Foreign currency contracts | 257 | - | 257 | - | ||||||||||||
| $ | 2,046 | $ | - | $ | 2,046 | $ | - | |||||||||
| As of December 31, 2009 | ||||||||||||||||
| Assets: | ||||||||||||||||
| Cash equivalents | $ | 33,846 | $ | 33,846 | $ | - | $ | - | ||||||||
| Liabilities: | ||||||||||||||||
| Interest rate swap | $ | 3,035 | $ | - | $ | 3,035 | $ | - | ||||||||
| Foreign currency contracts | 121 | - | 121 | - | ||||||||||||
| $ | 3,156 | $ | - | $ | 3,156 | $ | - | |||||||||
| December 31, 2012 | |||||||||||||||
| Level One | Level Two | Level Three | Total | ||||||||||||
| (In thousands) | |||||||||||||||
| Assets: | |||||||||||||||
| Cash equivalents | $ | 133,878 | $ | — | $ | — | $ | 133,878 | |||||||
| Foreign currency contracts related to sales - designated as hedges | — | 6,832 | — | 6,832 | |||||||||||
| Foreign currency contracts related to sales - not designated as hedges | — | 2,249 | — | 2,249 | |||||||||||
| Foreign currency contracts related to purchases - designated as hedges | — | 213 | — | 213 | |||||||||||
| Foreign currency contracts related to purchases - not designated as hedges | — | 1,077 | — | 1,077 | |||||||||||
| Deferred compensation plans | — | 2,542 | — | 2,542 | |||||||||||
| $ | 133,878 | $ | 12,913 | $ | — | $ | 146,791 | ||||||||
| Liabilities: | |||||||||||||||
| Foreign currency contracts related to sales - designated as hedges | $ | — | $ | 1,024 | $ | — | $ | 1,024 | |||||||
| Foreign currency contracts related to sales - not designated as hedges | — | 1,693 | — | 1,693 | |||||||||||
| Foreign currency contracts related to purchases - designated as hedges | — | 896 | — | 896 | |||||||||||
| Foreign currency contracts related to purchases - not designated as hedges | — | 1,062 | — | 1,062 | |||||||||||
| Deferred compensation plans | — | 2,542 | — | 2,542 | |||||||||||
| Liability for contingent payments | — | — | 6,517 | 6,517 | |||||||||||
| $ | — | $ | 7,217 | $ | 6,517 | $ | 13,734 | ||||||||
There were no significant transfers between level 1 and level 2in or out of Level One, Two or Three during 2010 or 2009.the year ended December 31, 2013.
Cash Equivalents
The Company’s cash equivalents consist of investments in interest-bearing deposit accounts and money market mutual funds which are valued based on quoted market prices. The fair value of these investments approximate cost due to their short-term maturities and the high credit quality of the issuers of the underlying securities. Interest rate swaps are valued based on forward curves observable in the market. Foreign currency contracts are measured using broker quotations or observable market transactions in either listed or over-the-counter markets. There were no changes during the periods presented in the Company’s valuation techniques used to measure asset and liability fair values on a recurring basis.
80
COLFAX CORPORATION
NOTES TO CONSOLIDATED FINANCIAL STATEMENTS - (Continued)
Derivatives
The Company periodically enters into foreign currency, interest rate swap, and commodity derivative contracts. The Company uses interest rate swaps to manage exposure to interest rate fluctuations. Foreign currency contracts are used to manage exchange rate fluctuations and generally hedge transactions between the Euro and the U.S. dollar.fluctuations. Commodity futures contracts are used to manage costs of raw materials used in the Company’s production processes.
Foreign Currency Contracts. Foreign currency contracts are measured using broker quotations or observable market transactions in either listed or over-the-counter markets. The Company primarily uses foreign currency contracts to mitigate the risk associated with customer forward sale agreements denominated in currencies other than the applicable local currency, and to match costs and expected revenues where production facilities have a different currency than the selling currency.
As of December 31, 20102013 and 2009,2012, the Company had foreign currency contracts with the following notional values of $13.1 million and $10.5 million, respectively. The fair values of the contracts were liabilities of $0.3 million and $0.1 million at December 31, 2010 and 2009, respectively and are recorded in “Other accrued liabilities” and “Other liabilities” on the consolidated balance sheets. values:
| December 31, | |||||||
| 2013 | 2012 | ||||||
| (In thousands) | |||||||
| Foreign currency contracts sold - not designated as hedges | $ | 244,755 | $ | 301,185 | |||
| Foreign currency contracts sold - designated as hedges | 206,220 | 238,537 | |||||
| Foreign currency contracts purchased - not designated as hedges | 273,714 | 121,741 | |||||
| Foreign currency contracts purchased - designated as hedges | 46,728 | 37,065 | |||||
| Total foreign currency derivatives | $ | 771,417 | $ | 698,528 | |||
81
COLFAX CORPORATION
NOTES TO CONSOLIDATED FINANCIAL STATEMENTS - (Continued)
The Company has not elected hedge accountingrecognized the following in its Consolidated Financial Statements related to its derivative instruments:
| Year Ended December 31, | |||||||||||
| 2013 | 2012 | 2011 | |||||||||
| (In thousands) | |||||||||||
| Contracts Designated as Hedges: | |||||||||||
| Interest Rate Swap: | |||||||||||
| Unrealized loss | $ | — | $ | — | $ | (161 | ) | ||||
| Realized loss | — | (471 | ) | (1,479 | ) | ||||||
| Foreign Currency Contracts - related to customer sales contracts: | |||||||||||
| Unrealized gain | 3,801 | 2,120 | — | ||||||||
| Realized gain | 654 | 2,297 | — | ||||||||
| Foreign Currency Contracts - related to supplier purchase contracts: | |||||||||||
| Unrealized gain (loss) | 397 | (374 | ) | — | |||||||
| Realized loss | (298 | ) | (475 | ) | — | ||||||
| Unrealized loss on net investment hedges | (14,261 | ) | (7,783 | ) | — | ||||||
| Contracts Not Designated in a Hedge Relationship: | |||||||||||
| Foreign Currency Contracts - acquisition-related: | |||||||||||
| Unrealized loss | — | — | (21,013 | ) | |||||||
| Realized loss | — | (7,177 | ) | — | |||||||
| Foreign Currency Contracts - related to customer sales contracts: | |||||||||||
| Unrealized (loss) gain | (762 | ) | 778 | (204 | ) | ||||||
| Realized gain | 1,112 | 712 | 152 | ||||||||
| Foreign Currency Contracts - related to supplier purchases contracts: | |||||||||||
| Unrealized gain (loss) | 1,687 | (560 | ) | 81 | |||||||
| Realized gain (loss) | 1,359 | 868 | (20 | ) | |||||||
Liability for these contracts; therefore, changes in the fair value are recognized as a component of selling, general and administrative expense. For the years ended December 31, 2010, 2009 and 2008, the consolidated statements of operations include $(0.2) million, $(0.7) million and $0.3 million, respectively, of unrealized gains (losses) as a result of changes inContingent Payments
The Company’s liability for contingent payments represents the fair value of these contracts. Realized gains (losses) on these contractsestimated additional cash payments related to its acquisitions of $(1.4) million, $0.9 millionCOT-Puritech in December of 2011 and $(0.3) million wereClarus in July 2013, which are subject to the achievement of certain performance goals, and are included in Other liabilities in the Consolidated Balance Sheets. The fair value of the liability for contingent payments represents the present value of probability weighted expected cash flows based upon the Company’s internal model and projections and is included in Level Three of the fair value hierarchy. Accretion is recognized in the years ended December 31, 2010, 2009, and 2008, respectively.
A summary of activity in the Company’s IPO in May 2008.liability for contingent payments is as follows:
| (In thousands) | |||
| Balance, January 1, 2011 | $ | — | |
| Additions | 4,300 | ||
| Interest accretion | 59 | ||
| Balance, December 31, 2011 | 4,359 | ||
| Interest accretion | 712 | ||
| Unrealized loss | (1,446 | ) | |
| Balance, December 31, 2012 | 6,517 | ||
| Additions for Clarus acquisition | 2,494 | ||
| Interest accretion | 665 | ||
| Cash payment | (3,500 | ) | |
| Balance, December 31, 2013 | $ | 6,176 | |
82
COLFAX CORPORATION
NOTES TO CONSOLIDATED FINANCIAL STATEMENTS - (Continued)
15. Commitments and distribution of fluid handling products. The operations of the Company on a geographic basis are as follows:Contingencies
| Year ended December 31, | ||||||||||||
| 2010 | 2009 | 2008 | ||||||||||
| Net sales by origin: | ||||||||||||
| United States | $ | 183,803 | $ | 177,373 | $ | 189,924 | ||||||
| Foreign locations: | ||||||||||||
| Germany | 196,399 | 180,917 | 239,723 | |||||||||
| Other | 161,785 | 166,734 | 175,207 | |||||||||
| Total foreign locations | 358,184 | 347,651 | 414,930 | |||||||||
| Total net sales | $ | 541,987 | $ | 525,024 | $ | 604,854 | ||||||
| Net sales by product: | ||||||||||||
| Pumps, including aftermarket parts and service | $ | 444,907 | $ | 443,073 | $ | 529,300 | ||||||
| Systems, including installation service | 78,598 | 69,339 | 58,231 | |||||||||
| Valves | 14,568 | 10,081 | 10,094 | |||||||||
| Other | 3,914 | 2,531 | 7,229 | |||||||||
| Total net sales | $ | 541,987 | $ | 525,024 | $ | 604,854 | ||||||
| December 31, | |||||||||
| 2010 | 2009 | ||||||||
| Long-lived assets: | |||||||||
| United States | $ | 27,757 | $ | 24,785 | |||||
| Foreign locations: | |||||||||
| Germany | 42,619 | 48,232 | |||||||
| Other | 18,870 | 19,073 | |||||||
| Total foreign locations | 61,489 | 67,305 | |||||||
| Total long-lived assets | $ | 89,246 | $ | 92,090 | |||||
The subsidiaries settle asbestos claims for amounts managementthe Company considers reasonable given the facts and circumstances of each claim. The annual average settlement payment per asbestos claimant has fluctuated during the past several years. ManagementThe Company expects such fluctuations to continue in the future based upon, among other things, the number and type of claims settled in a particular period and the jurisdictions in which such claims arise. To date, the majority of settled claims have been dismissed for no payment.
Claims activity since December 31 related to asbestos claims is as follows(1):
| Year ended December 31, | ||||||||||||
| 2010 | 2009 | 2008 | ||||||||||
| Claims unresolved at the beginning of the period | 25,295 | 35,357 | 37,554 | |||||||||
Claims filed (2) | 3,692 | 3,323 | 4,729 | |||||||||
Claims resolved (3) | (4,223 | ) | (13,385 | ) | (6,926 | ) | ||||||
| Claims unresolved at the end of the period | 24,764 | 25,295 | 35,357 | |||||||||
Average cost of resolved claims (4) | $ | 12,037 | $ | 11,106 | $ | 5,378 | ||||||
| Year Ended December 31, | |||||||||||
| 2013 | 2012 | 2011 | |||||||||
| (Number of claims) | |||||||||||
| Claims unresolved, beginning of period | 23,523 | 25,269 | 26,442 | ||||||||
Claims filed(2) | 6,299 | 4,347 | 5,317 | ||||||||
Claims resolved(3) | (7,429 | ) | (6,093 | ) | (6,490 | ) | |||||
| Claims unresolved, end of period | 22,393 | 23,523 | 25,269 | ||||||||
| (In dollars) | |||||||||||
Average cost of resolved claims(4) | $ | 5,979 | $ | 6,585 | $ | 13,119 | |||||
(1)Excludes claims filed by one legal firm that have been “administratively dismissed.” |
(4) Excludes claims settled in Mississippi for which the majority of claims have historically been resolved for no payment and insurance recoveries.
The Company has projected each subsidiary’s future asbestos-related liability costs with regard to pending and future unasserted claims based upon the Nicholson methodology. The Nicholson methodology is a standard approach used by experts and has been accepted by numerous courts. It is the Company’s policy to record a liability for asbestos-related liability costs for the longest period of time that it can reasonably estimate.
The Company believes that it can reasonably estimate the asbestos-related liability for pending and future claims that will be resolved in the next 15 years and has recorded that liability as its best estimate. While it is reasonably possible that the subsidiaries will incur costs after this period, the Company does not believe the reasonably possible loss or range of reasonably possible loss is estimable at the current time. Accordingly, no accrual has been recorded for any costs which may be paid after the next 15 years. Defense costs associated with asbestos-related liabilities as well as costs incurred related to litigation against the subsidiaries’ insurers are expensed as incurred.
Each subsidiary has separate insurance coverage acquired prior to Company ownership of each independent entity. In its evaluation of the insurance asset, the Company used differing insurance allocation methodologies for each subsidiary based upon the applicable law pertaining to the affected subsidiary.
83
COLFAX CORPORATION
NOTES TO CONSOLIDATED FINANCIAL STATEMENTS - (Continued)
The subsidiary was notified during the third quarter ofin 2010 by the primary and umbrella carrier who had been fully defending and indemnifying the subsidiary for twenty20 years that the limits of liability of its primary and umbrella layer policies had been exhausted. Since then, the subsidiary has sought coverage from certain excess layer insurers whose terms and conditions follow form to the umbrella carrier. Certain first-layer excess insurers have defended and/or indemnified the subsidiary, and/or agreed to defend and/or indemnify the subsidiary, subject to their reservations of rights and their applicable policy limits. Litigation between this subsidiary and itsA trial concerning the payment obligations of the Company’s excess insurers is continuingconcluded during fourth quarter of 2012, but certain legal rulings and it is anticipated that the trial phase will be completed in 2011.entry of a final judgment are still pending. The subsidiary continues to work with its excess insurers to obtain defense and indemnity payments while the litigation is proceeding. Given the uncertainties of litigation, there areis a variety of possible outcomes, including but not limited to the subsidiary being required to fund all or a portion of the subsidiary’s defense and indemnity payments until such time a final ruling orders payment by the insurers. While not impacting the results of operations, the funding requirement could range up to $10 million per quarter until final resolution. In addition, because a statistically significant increase in mesothelioma claims had occurred and was expected to continue to occur in certain regions, this subsidiary recorded a $1.8 million pre-tax charge, which was comprised of an increase in its asbestos-related liabilities of $18.1 million partially offset by an increase in expected insurance recoveries of $16.3 million, during the fourth quarter of the year ended December 31, 2011. Due to a statistically significant increase in mesothelioma and lung cancer claims and higher settlement values per claim that have occurred and are expected to continue to occur in certain jurisdictions, partially offset by lower claims and lower settlement values per claim in other jurisdictions, the Company recorded a $0.6 million pre-tax charge during year ended December 31, 2013, which was included in Selling, general and administrative expense in the Consolidated Statements of Operations. The pre-tax charge was comprised of an increase in asbestos-related liabilities of $10.8 million partially offset by an increase in expected insurance recoveries of $10.2 million.
In 2003, the otheranother subsidiary filed a lawsuit against a large number of its insurers and its former parent to resolve a variety of disputes concerning insurance for asbestos-related bodily injury claims asserted against it. Although none of these insurance companies contested coverage, they disputed the timing, reasonableness and allocation of payments.
For this subsidiary, it was determined by court ruling in the fourth quarter of 2007 that the allocation methodology mandated by the New Jersey courts will apply. Further court rulings in December of 2009 clarified the allocation calculation related to amounts currently due from insurers as well as amounts the Company expects to be reimbursed for asbestos-related costs incurred in future periods. As a result, in the fourth quarter of 2009, the Company increased its receivable for past costs by $11.9 million and decreased its insurance asset for future costs by $9.8 million and recorded a pretax gain of $2.1 million.
In connection with this litigation, the court engaged a special master to review the appropriate information and recommend an allocation formula in accordance with applicable law and the facts of the case. During the fourth quarter of 2010, the court-appointed special allocation master made its recommendation which has not yet beenrecommendation. In May 2011, the court accepted by the court. Based upon the recommendation with modifications. A final judgment at the Company reducedtrial court level in this litigation was rendered during the current asbestos receivable by $2.3 million, increasedyear ended December 31, 2011, but appeals have been entered. Because of the long-term asbestos asset by $0.4 million andhigher settlement values per mesothelioma claim in 2011 in a specific region, this subsidiary recorded a net$0.7 million pre-tax charge, which was comprised of an increase to asbestos liability and defense costsits asbestos-related liabilities of $1.9$4.7 million partially offset by an increase in the third quarterexpected insurance recoveries of 2010. As a result of the current status of this litigation, we decreased the amount currently due from insurers by $0.5$4.0 million, and decreased the insurance asset for future periods by $1.6 million and recorded a pretax loss of $2.1 million induring the fourth quarter of 2010. We currently anticipate that the trial phase in this litigation will be complete inyear ended December 31, 2011. We cannot predict the outcome of this litigation with certainty, or whether the outcome will be more or less favorable than our best estimate included in the consolidated financial statements. Given the uncertainty inherent in litigation, we would estimate the range of possible results from positive $30 million to negative $30 million relative to our reported insurance assets on our consolidated balance sheets. The timing of any cash inflows or outflows related to these matters cannot be estimated. The subsidiary expects to be responsible for approximately 15%18% of all future asbestos-related costs.
The Company has established reserves of $429.7 million and $443.8 million as of December 31, 2010 and December 31, 2009, respectively,Company’s Consolidated Balance Sheets included the following amounts related to asbestos-related litigation:
| December 31, 2013 | December 31, 2012 | ||||||
| (In thousands) | |||||||
Current asbestos insurance asset(1) | $ | 32,872 | $ | 35,566 | |||
Current asbestos insurance receivable(1) | 41,943 | 36,778 | |||||
Long-term asbestos insurance asset(2) | 299,057 | 315,363 | |||||
Long-term asbestos insurance receivable(2) | 21,411 | 7,063 | |||||
Accrued asbestos liability(3) | 51,142 | 58,501 | |||||
Long-term asbestos liability(4) | 358,288 | 375,493 | |||||
(1) Included in Other current assets in the Consolidated Balance Sheets.
(2) Included in Other assets in the Consolidated Balance Sheets.
(3) Represents current accruals for the probable and reasonably estimable asbestos-related liability cost itthat the Company believes the subsidiaries
will pay through the next 15 years. It has also established recoverables of $374.4 million and $389.4 million as of December 31, 2010 and December 31, 2009, respectively, for the insurance recoveries that are deemed probable during the same time period. Net of these recoverables, the expected cash outlay on a non-discounted basis for asbestos-related bodily injury claims over the next 15 years, was $55.3 million and $54.3 million as of December 31, 2010 and December 31, 2009, respectively. In addition, the Company has recorded a receivable for liability and defense costs previously paid in the amount of $51.8 million and $52.8 million as of December 31, 2010 and December 31, 2009, respectively, for which insurance recovery is deemed probable. The Company has recorded the reserves for the asbestos liabilities as “Accrued asbestos liability” and “Long-term asbestos liability” and the related insurance recoveries as “Asbestos insurance asset” and “Long-term asbestos insurance asset”. The receivable for previously paid liability and defense costs is recorded in “Asbestos insurance receivable” and “Long-term asbestos insurance receivable”. The Company also has reflected in other accrued liabilities $23.3 million and $15.8 million as of December 31, 2010 and December 31, 2009, respectively, for overpayments by certain insurers and unpaid legal costs related to defending itselfthemselves against
asbestos-related liability claims and legal action against the Company’s insurers.insurers, which is included in Accrued liabilities in the Consolidated
Balance Sheets.
Management’s analyses are based on currently known facts and a number of assumptions. However, projecting future events, such as new claims to be filed each year, the average cost of resolving each claim, coverage issues among layers of insurers, the method in which losses will be allocated to the various insurance policies, interpretation of the effect on coverage of various policy terms and limits and their interrelationships, the continuing solvency of various insurance companies, the amount of remaining insurance available, as well as the numerous uncertainties inherent in asbestos litigation could cause the actual liabilities and insurance recoveries to be higher or lower than those projected or recorded which could materially affect ourthe Company’s financial condition, results of operations or cash flow.
General Litigation
The Company is also involved in various other pending legal proceedings arising out of the ordinary course of the Company’s business. None of these legal proceedings are expected to have a material adverse effect on the financial condition, results of operations or cash flow of the Company. With respect to these proceedings and the litigation and claims described in the preceding paragraphs, management of the Company believes that it will either prevail, has adequate insurance coverage or has established appropriate reservesaccruals to cover potential liabilities. Any costs that management estimates may be paid related to these proceedings or claims are accrued when the liability is considered probable and the amount can be reasonably estimated. There can be no assurance, however, as to the ultimate outcome of any of these matters, and if all or substantially all of these legal proceedings were to be determined adverselyadverse to the Company, there could be a material adverse effect on the financial condition, results of operations or cash flow of the Company.
Minimum Lease Obligations
The Company has the followingCompany’s minimum rental obligations under non-cancelable operating leases for certain property, plant and equipment. The remaining lease terms range from 1 to 5 years.are as follows:
| December 31, 2013 | |||
| (In thousands) | |||
| 2014 | $ | 36,465 | |
| 2015 | 23,508 | ||
| 2016 | 16,642 | ||
| 2017 | 12,742 | ||
| 2018 | 11,829 | ||
| Thereafter | 55,945 | ||
| Total | $ | 157,131 | |
| Year ended December 31, | ||||
| 2011 | $ | 3,845 | ||
| 2012 | 2,997 | |||
| 2013 | 2,126 | |||
| 2014 | 1,613 | |||
| 2015 | 1,498 | |||
| Thereafter | 646 | |||
| Total | $ | 12,725 | ||
85
COLFAX CORPORATION
NOTES TO CONSOLIDATED FINANCIAL STATEMENTS - (Continued)
The Company’s operating leases extend for varying periods and, in some cases, contain renewal options that would extend the existing terms. During the years ended December 31, 2013, 2012 and 2011, the Company’s net rental expense underrelated to operating leases was approximately $4.6$35.4 million, $4.8$39.5 million and $5.1$4.9 million, in 2010, 2009 and 2008, respectively.
| First | Second | Third | Fourth | |||||||||||||
| Quarter | Quarter | Quarter | Quarter | |||||||||||||
| (millions, except per share amounts) | ||||||||||||||||
| 2010 | ||||||||||||||||
| Net sales | $ | 119,971 | $ | 122,968 | $ | 132,397 | $ | 166,651 | ||||||||
| Gross profit | 41,756 | 42,981 | 47,097 | 59,574 | ||||||||||||
| Net (loss) income | (374 | ) | 2,088 | 5,851 | 8,650 | |||||||||||
| Net (loss) income per share - basic and diluted | $ | (0.01 | ) | $ | 0.05 | $ | 0.13 | $ | 0.20 | |||||||
| 2009 | ||||||||||||||||
| Net sales | $ | 136,323 | $ | 129,185 | $ | 128,545 | $ | 130,971 | ||||||||
| Gross profit | 48,015 | 44,555 | 46,206 | 47,011 | ||||||||||||
| Net income | 7,065 | 4,476 | 5,530 | 6,726 | ||||||||||||
| Net income per share - basic | $ | 0.16 | $ | 0.10 | $ | 0.13 | $ | 0.16 | ||||||||
| Net income per share - diluted | $ | 0.16 | $ | 0.10 | $ | 0.13 | $ | 0.15 | ||||||||
Off-Balance Sheet Arrangements
As of December 31, 2013, the Company had $433.4 million of unconditional purchase obligations with suppliers, primarily all of which is expected to be paid by December 31, 2014.
16. Segment Information
The Company conducts its operations through three operating segments: gas handling, fluid handling and fabrication technology. The gas-handling and fluid-handling operating segments are aggregated into a single reportable segment. A description of the Company’s reportable segments is as follows:
| ▪ | Gas & Fluid Handling - a global supplier of a broad range of gas- and fluid-handling products, including pumps, fluid-handling systems and controls, specialty valves, heavy-duty centrifugal and axial fans, rotary heat exchangers and gas compressors, which serves customers in the power generation, oil, gas and petrochemical, mining, marine (including defense) and general industrial and other end markets; and |
| ▪ | Fabrication Technology -a global supplier of welding equipment and consumables, cutting equipment and consumables and automated welding and cutting systems. |
Certain amounts not allocated to the two reportable segments and intersegment eliminations are reported under the heading “Corporate and other.” The Company’s management evaluates the operating results of each of its reportable segments based upon Net sales and segment operating income, which represents Operating income before Restructuring and other related charges.
86
COLFAX CORPORATION
NOTES TO CONSOLIDATED FINANCIAL STATEMENTS - (Continued)
The Company’s segment results were as follows:
| Year Ended December 31, | |||||||||||
| 2013 | 2012 | 2011 | |||||||||
| (In thousands) | |||||||||||
| Net sales: | |||||||||||
| Gas and fluid handling | $ | 2,104,048 | $ | 1,901,132 | $ | 693,392 | |||||
| Fabrication technology | 2,103,161 | 2,012,724 | — | ||||||||
| Total Net sales | $ | 4,207,209 | $ | 3,913,856 | $ | 693,392 | |||||
Segment operating income (loss)(1): | |||||||||||
| Gas and fluid handling | $ | 270,708 | $ | 141,524 | $ | 86,664 | |||||
| Fabrication technology | 219,634 | 140,184 | — | ||||||||
| Corporate and other | (48,448 | ) | (81,639 | ) | (51,078 | ) | |||||
| Total segment operating income | $ | 441,894 | $ | 200,069 | $ | 35,586 | |||||
| Depreciation and Amortization: | |||||||||||
| Gas and fluid handling | $ | 62,792 | $ | 112,389 | $ | 22,375 | |||||
| Fabrication technology | 55,339 | 69,708 | — | ||||||||
| Corporate and other | 1,127 | 1,306 | 223 | ||||||||
| Total depreciation and amortization | $ | 119,258 | $ | 183,403 | $ | 22,598 | |||||
| Capital Expenditures: | |||||||||||
| Gas and fluid handling | $ | 37,995 | $ | 42,343 | $ | 14,420 | |||||
| Fabrication technology | 33,437 | 41,146 | — | ||||||||
| Corporate and other | 50 | 97 | 366 | ||||||||
| Total capital expenditures | $ | 71,482 | $ | 83,586 | $ | 14,786 | |||||
_________
(1) The following is a reconciliation of Income before income taxes to segment operating income:
| Year Ended December 31, | |||||||||||
| 2013 | 2012 | 2011 | |||||||||
| Income before income taxes | $ | 302,795 | $ | 48,439 | $ | 19,987 | |||||
| Interest expense | 103,597 | 91,570 | 5,919 | ||||||||
| Restructuring and other related charges | 35,502 | 60,060 | 9,680 | ||||||||
| Segment operating income | $ | 441,894 | $ | 200,069 | $ | 35,586 | |||||
87
COLFAX CORPORATION
NOTES TO CONSOLIDATED FINANCIAL STATEMENTS - (Continued)
| Year Ended December 31, | |||||||
| 2013 | 2012 | ||||||
| (In thousands) | |||||||
| Investments in Equity Method Investees: | |||||||
| Gas and fluid handling | $ | 7,097 | $ | 11,451 | |||
| Fabrication technology | 43,698 | 44,106 | |||||
| $ | 50,795 | $ | 55,557 | ||||
| Total Assets: | |||||||
| Gas and fluid handling | $ | 4,007,806 | $ | 3,333,817 | |||
| Fabrication technology | 2,526,245 | 2,580,273 | |||||
| Corporate and other | 48,802 | 234,197 | |||||
| Total Assets | $ | 6,582,853 | $ | 6,148,287 | |||
The detail of the Company’s operations by product type and geography is as follows:
| Year Ended December 31, | |||||||||||
| 2013 | 2012 | 2011 | |||||||||
| (In thousands) | |||||||||||
| Net Sales by Major Product: | |||||||||||
| Gas handling | $ | 1,440,731 | $ | 1,242,371 | $ | — | |||||
| Fluid handling | 663,317 | 658,761 | 693,392 | ||||||||
| Welding and cutting | 2,103,161 | 2,012,724 | — | ||||||||
| Total Net sales | $ | 4,207,209 | $ | 3,913,856 | $ | 693,392 | |||||
Net Sales by Origin(1): | |||||||||||
| United States | $ | 836,636 | $ | 789,259 | $ | 207,459 | |||||
| Foreign locations | 3,370,573 | 3,124,597 | 485,933 | ||||||||
| Total Net sales | $ | 4,207,209 | $ | 3,913,856 | $ | 693,392 | |||||
_________
(1) The Company attributes revenues from external customers to individual countries based upon the country in which the sale was originated.
| Year Ended December 31, | |||||||
| 2013 | 2012 | ||||||
| (In thousands) | |||||||
Property, Plant and Equipment, Net(1): | |||||||
| United States | $ | 145,972 | $ | 127,719 | |||
| China | 82,771 | 74,855 | |||||
| Czech Republic | 92,796 | 53,201 | |||||
| Other Foreign Locations | 435,601 | 432,795 | |||||
| Property, plant and equipment, net | $ | 757,140 | $ | 688,570 | |||
_________
(1) As the Company does not allocate all long-lived assets, specifically intangible assets, to each individual country, evaluation of long-lived
assets in total is impracticable.
88
COLFAX CORPORATION
NOTES TO CONSOLIDATED FINANCIAL STATEMENTS - (Continued)
17. Selected Quarterly Data—(unaudited)
Provided below is selected unaudited quarterly financial data for the years ended December 31, 2013 and 2012.
| Quarter Ended | ||||||||||||||||
March 29, 2013 | June 28, 2013 | September 27, 2013 | December 31, 2013(2) | |||||||||||||
| (In thousands, except per share data) | ||||||||||||||||
| Net sales | $ | 947,143 | $ | 1,074,118 | $ | 1,014,570 | $ | 1,171,378 | ||||||||
| Gross profit | 290,725 | 337,822 | 320,294 | 357,381 | ||||||||||||
| Net income | 32,275 | 67,200 | 65,475 | 44,193 | ||||||||||||
| Net income attributable to Colfax Corporation common shareholders | 22,553 | 53,306 | 50,389 | 31,984 | ||||||||||||
| Net income per share – basic | $ | 0.21 | $ | 0.53 | $ | 0.49 | $ | 0.31 | ||||||||
| Net income per share – diluted | $ | 0.21 | $ | 0.52 | $ | 0.48 | $ | 0.31 | ||||||||
| Quarter Ended | ||||||||||||||||
March 30, 2012(1) | June 29, 2012(1) | September 28, 2012 | December 31, 2012 | |||||||||||||
| (In thousands, except per share data) | ||||||||||||||||
| Net sales | $ | 886,366 | $ | 1,045,653 | $ | 954,440 | $ | 1,027,397 | ||||||||
| Gross profit | 241,706 | 314,862 | 287,987 | 307,570 | ||||||||||||
| Net (loss) income | (100,461 | ) | 18,632 | 14,499 | 25,066 | |||||||||||
| Net (loss) income attributable to Colfax Corporation common shareholders | (109,332 | ) | 7,293 | 4,022 | 14,664 | |||||||||||
| Net (loss) income per share – basic | $ | (1.33 | ) | $ | 0.07 | $ | 0.04 | $ | 0.14 | |||||||
| Net (loss) income per share – diluted | $ | (1.33 | ) | $ | 0.07 | $ | 0.04 | $ | 0.13 | |||||||
__________
(1) | Net (loss) income and Net (loss) income per share for the three months ended March 30, 2012 and June 29, 2012, include $42.9 million and $0.8 million of pre-tax Charter acquisition-related expense. See Note 4, “Acquisitions” for additional information regarding the Company’s acquisition of Charter. |
(2) | Net income and Net income per share for the three months ended December 31, 2013 includes a $13.8 million gain to remeasure the Company’s equity investment in Sicelub to fair value upon increasing the Company’s ownership to 100%, which was included in Selling, general and administrative expense. See Note 4, “Acquisitions” for additional information regarding the Company’s acquisition of Sicelub. Additionally, during the three months ended December 31, 2013, the Company incurred $26.8 million to write-off certain deferred financing fees and original issue discount associated with the Third Amendment to the Deutsche Bank Credit Agreement. See Note 10, “Debt” for additional information regarding the Third Amendment to the Deutsche Bank Credit Agreement. |
89
Item 9. Changes in and Disagreements with Accountants on Accounting and Financial Disclosure
None.
Item 9A. Controls and Procedures
Evaluation of Disclosure Controls and Procedures
Under the supervision and with the participation of our management, including our Chief Executive Officer and Chief Financial Officer, we have evaluated the effectiveness of our disclosure controls and procedures as defined in Rule 13a-15(e) under the Securities Exchange Act of 1934, as amended (the “Exchange Act”), as of the end of the period covered by this report on Form 10-K.December 31, 2013. Based upon that evaluation, our Chief Executive Officer and Chief Financial Officer concluded that ourthe Company’s disclosure controls and procedures were effective in providing reasonable assurance that the information required to be disclosed in this report on Form 10-K has been recorded, processed, summarized and reported as of the end of the period covered by this report on Form 10-K.
Disclosure controls and procedures include, without limitation, controls and procedures designed to ensure that information required to be disclosed by us in reports we file or submit under the Exchange Act is recorded, processed, summarized and reported within the time periods specified in the SEC’sSecurities and Exchange Commission’s rules and forms, and that such information is accumulated and communicated to our management, including our Chief Executive Officer and Chief Financial Officer, as appropriate, to allow timely decisions regarding required disclosure.
Changes in Internal Control Overover Financial Reporting
Management’s Annual Report on Internal Control Over Financial Reporting
The management of Colfax Corporation is responsible for establishing and maintaining adequate internal control over financial reporting as defined in Rules 13a-15(f) and 15d-15(f) under the Securities Exchange Act of 1934. Our internal control over financial reporting is designed to provide reasonable assurance regarding the reliability of financial reporting and the preparation of financial statements for external purposes in accordance with U.S. GAAP. Internal control over financial reporting includes policies and procedures that:
| (i) | pertain to the maintenance of records that, in reasonable detail, accurately and fairly reflect the transactions and dispositions of the company’s assets; |
| (ii) | provide reasonable assurance that transactions are recorded as necessary to permit preparation of financial statements in accordance with |
| (iii) | provide reasonable assurance regarding prevention or timely detection of unauthorized acquisition, use or disposition of the company’s assets that could have a material effect on the financial statements. |
Because of inherent limitations, internal control over financial reporting may not prevent or detect misstatements. Also, projections of any evaluation of effectiveness to future periods are subject to the risk that controls may become inadequate because of changes in conditions, or that the degree of compliance with existing policies or procedures may deteriorate.
Under the supervision and with the participation of our Chief Executive Officer and Chief Financial Officer, our management conducted an assessment of the effectiveness of internal control over financial reporting as of December 31, 20102013 based on the criteria established in Internal Control –- Integrated Framework, issued by the Committee of Sponsoring Organizations of the Treadway Commission.Commission (1992 framework). Based on this assessment, our management has concluded that our internal control over financial reporting was effective as of December 31, 2010.2013.
90
Our independent registered public accounting firm is engaged to express an opinion on our internal control over financial reporting, as stated in theirits report which is included in Part II, Item 8 of this Form 10-K under the caption “Report of Ernst & Young LLP, Independent Registered Public Accounting Firm, on Firm—Internal Control Over Financial Reporting.”
Item 9B. Other Information
None.
PART III
Item 10. Directors, Executive Officers and Corporate Governance
Information relating to our Executive Officers is set forth in Part I of this Form 10-K under the caption “Executive Officers of the Registrant.” Additional information regarding our directors, audit committeeDirectors, Audit Committee and compliance with Section 16(a) of the Exchange Act is incorporated by reference to such information included in our proxy statement for our 20112014 annual meeting to be filed with the SEC within 120 days after the end of the fiscal year covered by this Form 10-K (the “2011“2014 Proxy Statement”) under the captions “Election of Directors”, “Board of Directors and its Committees –- Audit Committee” and “Section 16(a) Beneficial Ownership Reporting Compliance”.
As part of our system of corporate governance, our boardBoard of directorsDirectors has adopted a code of ethics that applies to all employees, including our principal executive officer, and our principal financial and accounting officer and principal accounting officer.or other persons performing similar functions. A copy of the code of ethics is available on the Corporate Governance page of the Investor Relations section of our website at www.colfaxcorp.com. We intend to satisfy any disclosure requirement under Item 5.05 of Form 8-K regarding an amendment to, or a waiver from, a provision of our code of ethics by posting such information on our website at the address above.
Item 11. Executive Compensation
Information responsive to this item is incorporated by reference to such information included in our 20112014 Proxy Statement under the captions “Executive Compensation”, “Director Compensation”, “Compensation Discussion and Analysis”, “Compensation Committee Report” and “Compensation Committee Interlocks and Insider Participation”Participation.”
Item 12. Security Ownership of Certain Beneficial Owners and Management and Related Stockholder Matters
Information responsive to this item is incorporated by reference to such information included in our 20112014 Proxy Statement under the captions “Beneficial Ownership of Our Common Stock” and “Equity Compensation Plan Information”.
Information.”
Item 13. Certain Relationships and Related Transactions, and Director Independence
Information responsive to this item is incorporated by reference to such information included in our 20112014 Proxy Statement under the captions “Certain Relationships and Related Person Transactions” and “Director Independence”.Independence.”
Item 14. Principal Accountant Fees and Services
Information responsive to this item is incorporated by reference to such information included in our 20112014 Proxy Statement under the captions “Independent Registered Public Accountant Fees and Services” and “Audit Committee’s Pre-Approval Policies and Procedures”.
91
PART IV
Item 15. Exhibits and Financial Statement Schedules
| (A) The following documents are filed as part of this report. |
| (1) Financial Statements. The financial statements are set forth under “Item 8. Financial Statements and Supplementary Data” of this report on Form 10-K. |
| (B) | Exhibits. The exhibits listed in the accompanying Exhibit Index are filed or incorporated by reference as part of this report. |
(C) Not applicable.
Pursuant to the requirements of Section 13 or 15(d) of the Securities Exchange Act of 1934, the Registrant has duly caused this report to be signed on its behalf by the undersigned, thereunto duly authorized on February 25, 2011.12, 2014.
COLFAX CORPORATION
| By: /s/ STEVEN E. SIMMS Steven E. Simms President and Chief Executive Officer | ||
Pursuant to the requirements of Section 13 or 15(d) of the Securities Exchange Act of 1934, this report has been signed below by the following persons on behalf of the Registrant and in the capacities and on the date indicated.
Date: February 12, 2014
| /s/ | STEVEN E. SIMMS |
| Steven E. Simms | |
| President and Chief Executive Officer | |
| (Principal Executive Officer) | |
| /s/ C. SCOTT BRANNAN | |
| C. Scott Brannan | |
| Senior Vice President, Chief Financial Officer and Treasurer | |
| (Principal Financial and Accounting Officer) | |
| /s/ MITCHELL P. RALES | |
| Mitchell P. Rales | |
| Chairman of the Board | |
| /s/ PATRICK W. ALLENDER | |
| Patrick W. Allender | |
| Director | |
| /s/ THOMAS S. GAYNER | |
| Thomas S. Gayner | |
| Director | |
| /s/ RHONDA L. JORDAN | |
| Rhonda L. Jordan | |
| Director | |
| /s/ | |
| Clay H. Kiefaber | |
| Director | |
| San W. Orr, III | |
| Director | |
| /s/ A. CLAYTON PERFALL | |
| A. Clayton Perfall | |
| Director | |
| /s/ RAJIV VINNAKOTA | |
| Rajiv Vinnakota | |
| Director |
COLFAX CORPORATION
INDEX TO FINANCIAL STATEMENTS, SUPPLEMENTARY DATA AND FINANCIAL STATEMENT SCHEDULES
| Schedules: | Page Number in Form 10-K | |||
| Valuation and Qualifying Accounts | ||||
EXHIBIT INDEX
Exhibit | Description | Location* | ||
| 3.1 | Amended and Restated Certificate of Incorporation of Colfax Corporation | Incorporated by reference to Exhibit | ||
| 3.2 | Colfax Corporation Amended and Restated Bylaws | Incorporated by reference to Exhibit 3.2 to Colfax Corporation’s Form 8-K (File No. 001-34045) as filed with the Commission on May 13, 2008 | ||
| 3.3 | Amended and Restated Certificate of Designations of Series A Perpetual Convertible Preferred Stock of Colfax Corporation | Incorporated by reference to Exhibit 3.03 to Colfax Corporation’s Form 10-Q (File No. 001-34045) as filed with the Commission on April 25, 2013 | ||
| 4.1 | Specimen Common Stock Certificate | |||
| 10.1 | Colfax Corporation 2008 Omnibus Incentive Plan** | |||
| Colfax Corporation 2008 Omnibus Incentive Plan, as amended and restated April 2, 2012** | Incorporated by reference to Exhibit 10.07 to Colfax Corporation’s Form 10-Q (File No. 001-34045) as filed with the SEC on August 7, 2012 | |||
| 10.3 | Form of Non-Qualified Stock Option Agreement | |||
| Form of Performance Stock Unit | ||||
| Form of Outside Director Restricted Stock Unit Agreement (Three Year Vesting)** | ||||
| 10.6 | Form of Outside Director Deferred Stock Unit | |||
| Form of Outside Director Deferred Stock Unit Agreement for deferral of grants of restricted stock | ||||
| Form of Outside Director Deferred Stock Unit Agreement for deferral of director fees** | ||||
Form of Outside Director Non-Qualified Stock Option Agreement** | Incorporated by reference to Exhibit 10.08 to Colfax Corporation’s Form 10-Q (File No. 001-34045) filed with the SEC on August 7, 2012 | |||
| Form of | Incorporated by reference to Exhibit 10.09 to Colfax Corporation’s Form 10-Q (File No. 001-34045) filed with the SEC on August 7, 2012 | |||
Form of Outside Director Deferred Stock Unit Agreement for deferral of grants of restricted stock units (One Year Vesting)** | Incorporated by reference to Exhibit 10.10 to Colfax Corporation’s Form 10-Q (File No. 001-34045) filed with the SEC on August 7, 2012 | |||
95
Exhibit No. | Description | Location* | ||
| 10.12 | Form of Outside Director Deferred Stock Unit Agreement for deferral of grants of restricted stock units | |||
| 10.13 | Colfax Corporation Amended and Restated Excess Benefit | Incorporated by reference to Exhibit 10.13 to Colfax Corporation’s Form 10-K (File No. 001-34045) as filed with the Commission on February 19, 2013 | ||
| Incorporated by reference to Exhibit 10.1 to Colfax Corporation’s Form 8-K (File No. 001-34045) as filed with the SEC on April 23, 2012 | ||||
| Employment Agreement between Colfax Corporation and Clay H. Kiefaber** | Incorporated by reference to Exhibit 10.1 to Colfax Corporation’s Form 8-K (File No. 001-34045) as filed with the Commission on | |||
| 10.16 | Amendment No. 1 to the Employment Agreement between Colfax Corporation and Clay H. Kiefaber** | Incorporated by reference to Exhibit 10.2 to Colfax Corporation’s Form 8-K (File No. 001-34045) as filed with the Commission on April 23, 2012 | ||
| 10.17 | Employment Agreement between Colfax Corporation and C. Scott Brannan** | Incorporated by reference to Exhibit 10.1 to Colfax Corporation’s Form 8-K (File No. 001-34045) as filed with the Commission on September 22, 2010 | ||
| Employment Agreement between Colfax Corporation and | Incorporated by reference to Exhibit 10.04 to Colfax Corporation’s Form 10-Q (File No. 001-34045) as filed with the SEC on August 7, 2012 | |||
| Employment Agreement between Colfax Corporation and | ||||
| Incorporated by reference to Exhibit | ||||
| 10.20 | Service Agreement between Howden Group Ltd. and Ian Brander dated December 3, 2010** | Incorporated by reference to Exhibit 10.01 to Colfax Corporation’s Form 10-Q (File No. 001-34045) as filed with the Commission on | ||
| Incorporated by reference to Exhibit | ||||
| 10.22 | Incorporated by reference to Exhibit | |||
| 10.23 | ||||
| Credit Agreement, dated | Incorporated by reference to Exhibit 99.6 to Colfax Corporation’s Form 8-K (File No. 001-34045) as filed with the Commission on September 15, 2011 |
96
Exhibit No. | Description | Location* | ||
| 10.24 | Amendment No. 1 to the Credit Agreement, dated January 13, 2012, by and among the Colfax Corporation, certain subsidiaries of Colfax Corporation identified therein, Deutsche Bank AG New York Branch and the lenders identified therein | Incorporated by reference to Exhibit 10.1 to Colfax Corporation’s Form 8-K (File No. 001-34045) as filed with the Commission on | ||
| 10.25 | Second Amendment to the Credit Agreement, dated February 22, 2013, by and among the Colfax Corporation, certain subsidiaries of Colfax Corporation identified therein, Deutsche Bank AG New York Branch and the lenders identified therein | Incorporated by reference to Exhibit 10.1 to Colfax Corporation’s Form 8-K (File No. 001-34045) as filed with the Commission on February 25, 2013 | ||
| 10.26 | Third Amendment to the Credit Agreement, dated November 7, 2013 by and among the Colfax Corporation, certain subsidiaries of Colfax Corporation identified therein, Deutsche Bank AG New York Branch and the lenders identified therein | Incorporated by reference to Exhibit 10.1 to Colfax Corporation’s Form 8-K (File No. 001-34045) as filed with the Commission on November 14, 2013 | ||
| 10.27 | Share Purchase Agreement, by and among Inversiones Breca S.A. and Colfax Corporation, dated as of May 26, 2012 | Incorporated by reference to Exhibit 2.1 to Colfax Corporation’s Form 8-K (File No. 001-34045) as filed with the Commission on May 31, 2012 | ||
| 10.28 | Amendment No. 1 to the Share Purchase Agreement by and among Inversiones Breca S.A. and Colfax Corporation, dated October 25, 2012 | Incorporated by reference to Exhibit 10.28 to Colfax Corporation’s Form 10-K (File No. 001-34045) as filed with the Commission on February 19, 2013 | ||
| 10.29 | Registration Rights Agreement, dated May 30, 2003, by and among Colfax Corporation, Colfax Capital Corporation, Janalia Corporation, Equity Group Holdings, L.L.C., and Mitchell P. Rales and Steven M. Rales | |||
| 10.30 | Amendment No. 1 to the Registration Rights Agreement, by and among Colfax Corporation and Mitchell P. Rales and Steven M. Rales, dated February 18, 2013 | Incorporated by reference to Exhibit 10.30 to Colfax Corporation’s Form 10-K (File No. 001-34045) as filed with the Commission on February 19, 2013 | ||
| 10.31 | Securities Purchase Agreement, dated September 12, 2011, between BDT CF Acquisition Vehicle, LLC and Colfax Corporation | Incorporated by reference to Exhibit 99.2 to Colfax Corporation’s Form 8-K (File No. 001-34045) as filed with the Commission on September 15, 2011 | ||
| 10.32 | Securities Purchase Agreement, dated September 12, 2011, between Mitchell P. Rales and Colfax Corporation | Incorporated by reference to Exhibit 99.3 to Colfax Corporation’s Form 8-K (File No. 001-34045) as filed with the Commission on September 15, 2011 | ||
| 10.33 | Securities Purchase Agreement, dated September 12, 2011, between Steven M. Rales and Colfax Corporation | Incorporated by reference to Exhibit 99.4 to Colfax Corporation’s Form 8-K (File No. 001-34045) as filed with the Commission on September 15, 2011 | ||
97
Exhibit No. | Description | Location* | ||
| 10.34 | Securities Purchase Agreement, dated September 12, 2011, between Markel Corporation and Colfax Corporation | Incorporated by reference to Exhibit 99.5 to Colfax Corporation’s Form 8-K (File No. 001-34045) as filed with the Commission on September 15, 2011 | ||
| 10.35 | Registration Rights Agreement, dated as of January 24, 2012, between Colfax Corporation and BDT CF Acquisition Vehicle, LLC | Incorporated by reference to Exhibit 10.01 to Colfax Corporation’s Form 8-K (File No. 001-34045) as filed with the Commission on January 30, 2012 | ||
| 10.36 | Registration Rights Agreement, dated as of January 24, 2012, between Colfax Corporation and Mitchell P. Rales | Incorporated by reference to Exhibit 10.02 to Colfax Corporation’s Form 8-K (File No. 001-34045) as filed with the Commission on January 30, 2012 | ||
| 10.37 | Registration Rights Agreement, dated as of January 24, 2012, between Colfax Corporation and Steven M. Rales | Incorporated by reference to Exhibit 10.03 to Colfax Corporation’s Form 8-K (File No. 001-34045) as filed with the Commission on January 30, 2012 | ||
| 10.38 | Registration Rights Agreement, dated as of January 24, 2012, between Colfax Corporation and Markel Corporation | Incorporated by reference to Exhibit 10.04 to Colfax Corporation’s Form 8-K (File No. 001-34045) as filed with the Commission on January 30, 2012 | ||
| 12.1 | Computation of Ratio of Earnings to Fixed Charges | Filed herewith | ||
| 21.1 | Subsidiaries of | Filed herewith | ||
| 23.1 | Consent of | Filed herewith | ||
| 31.1 | Certification of Chief Executive Officer Pursuant to Item 601(b)(31) of Regulation S-K, as adopted pursuant to Section 302 of the Sarbanes-Oxley Act of 2002. | Filed herewith | ||
| 31.2 | Certification of Chief Financial Officer Pursuant to Item 601(b)(31) of Regulation S-K, as adopted pursuant to Section 302 of the Sarbanes-Oxley Act of 2002. | Filed herewith | ||
| 32.1 | Certification of Chief Executive Officer, Pursuant to 18 U.S.C. Section 1350, as adopted pursuant to Section 906 of the Sarbanes-Oxley Act of 2002 | Filed herewith | ||
| 32.2 | Certification of Chief Financial Officer, Pursuant to 18 U.S.C. Section 1350, as adopted pursuant to Section 906 of the Sarbanes-Oxley Act of 2002 | Filed herewith | ||
| 101.INS | XBRL Instance Document | Filed herewith | ||
98
Exhibit No. | Description | Location* | ||
| 101.SCH | XBRL Taxonomy Extension Schema Document | Filed herewith | ||
| 101.CAL | XBRL Extension Calculation Linkbase Document | Filed herewith | ||
| 101.DEF | XBRL Taxonomy Extension Definition Linkbase Document | Filed herewith | ||
| 101.LAB | XBRL Taxonomy Extension Label Linkbase Document | Filed herewith | ||
| 101.PRE | XBRL Taxonomy Extension Presentation Linkbase Document | Filed herewith | ||
* Unless otherwise noted, all exhibits are incorporated by reference to the Company’s Registration Statement on Form S-1 (File No. 001-34045).
** Indicates management contract or compensatory plan, contract or arrangement.
COLFAX CORPORATION AND SUBSIDIARIES
SCHEDULE II—II–VALUATION AND QUALIFYING ACCOUNTS
Balance at Beginning of Period | Charged to Cost and Expenses (a) | Charged to Other Accounts (b) | Write-offs, Write-downs & Deductions | Foreign Currency Translation | Balance at End of Period | ||||||||||||||||||||||||||||||||||||||||||||||
| Year Ended December 31, 2010 | |||||||||||||||||||||||||||||||||||||||||||||||||||
| Balance at Beginning of Period | Charged to Cost and Expense (1) | Charged to Other Accounts (2) | Write-Offs Write-Downs and Deductions | Acquisitions and Other(3) | Foreign Currency Translation | Balance at End of Period | |||||||||||||||||||||||||||||||||||||||||||||
| (In thousands) | |||||||||||||||||||||||||||||||||||||||||||||||||||
| Year Ended December 31, 2013: | |||||||||||||||||||||||||||||||||||||||||||||||||||
| Allowance for doubtful accounts | $ | 2,837 | 218 | - | (405 | ) | (88 | ) | $ | 2,562 | $ | 16,464 | $ | 12,707 | $ | — | $ | — | $ | 2,753 | $ | (642 | ) | $ | 31,282 | ||||||||||||||||||||||||||
| Allowance for excess, slow-moving and obsolete inventory | $ | 8,025 | 1,942 | - | (1,849 | ) | (341 | ) | $ | 7,777 | |||||||||||||||||||||||||||||||||||||||||
| Allowance for excess slow-moving and obsolete inventory | 9,221 | 21,629 | — | (2,026 | ) | 4,207 | (258 | ) | 32,773 | ||||||||||||||||||||||||||||||||||||||||||
| Valuation allowance for deferred tax assets | $ | 45,053 | 4,407 | 3,666 | (180 | ) | (55 | ) | $ | 52,891 | 357,638 | 30,554 | (27,233 | ) | (3,373 | ) | 2,401 | (1,601 | ) | 358,386 | |||||||||||||||||||||||||||||||
| Year Ended December 31, 2009 | |||||||||||||||||||||||||||||||||||||||||||||||||||
| Year Ended December 31, 2012: | |||||||||||||||||||||||||||||||||||||||||||||||||||
| Allowance for doubtful accounts | $ | 2,486 | 405 | - | (178 | ) | 124 | $ | 2,837 | $ | 2,578 | $ | 13,917 | $ | — | $ | (192 | ) | $ | — | $ | 161 | $ | 16,464 | |||||||||||||||||||||||||||
| Allowance for excess, slow-moving and obsolete inventory | $ | 6,923 | 1,368 | - | (413 | ) | 147 | $ | 8,025 | ||||||||||||||||||||||||||||||||||||||||||
| Allowance for excess slow-moving and obsolete inventory | 6,735 | 3,341 | — | (1,001 | ) | — | 146 | 9,221 | |||||||||||||||||||||||||||||||||||||||||||
| Valuation allowance for deferred tax assets | $ | 45,206 | (82 | ) | - | - | (71 | ) | $ | 45,053 | 79,855 | 103,785 | 20,676 | — | 153,322 | — | 357,638 | ||||||||||||||||||||||||||||||||||
| Year Ended December 31, 2008 | |||||||||||||||||||||||||||||||||||||||||||||||||||
| Year Ended December 31, 2011: | |||||||||||||||||||||||||||||||||||||||||||||||||||
| Allowance for doubtful accounts | $ | 1,812 | 828 | - | (33 | ) | (121 | ) | $ | 2,486 | $ | 2,562 | $ | 112 | $ | — | $ | (70 | ) | $ | — | $ | (26 | ) | $ | 2,578 | |||||||||||||||||||||||||
| Allowance for excess, slow-moving and obsolete inventory | $ | 7,589 | (334 | ) | - | (74 | ) | (258 | ) | $ | 6,923 | ||||||||||||||||||||||||||||||||||||||||
| Allowance for excess slow-moving and obsolete inventory | 7,777 | 181 | — | (1,258 | ) | — | 35 | 6,735 | |||||||||||||||||||||||||||||||||||||||||||
| Valuation allowance for deferred tax assets | $ | 17,776 | 2,999 | 24,431 | - | - | $ | 45,206 | 52,891 | 16,621 | 10,346 | — | — | (3 | ) | 79,855 | |||||||||||||||||||||||||||||||||||
____________
(1) Amounts charged to expense are net of recoveries for the respective period.
(2) Represents amount charge to Accumulated other comprehensive loss.
(3) Includes reclassifications related to the Charter Acquisition. The valuation allowance for deferred tax assets during the year ended December 31, 2012 reflects the impact of retrospective adjustments recorded during the year ended December 31, 2013. See Note 4, "Acquisitions" for further discussion.
100