UNITED STATES
SECURITIES AND EXCHANGE COMMISSION
Washington, D.C. 20549


FORM 10-K


(Mark One)
 
(Mark One)
x
ANNUAL REPORT PURSUANT TO SECTION 13 OR 15(d)
OF THE SECURITIES EXCHANGE ACT OF 1934.

For the Fiscal Year Ended December 31, 2010

2013
OR

 
o¨
TRANSITION REPORT PURSUANT TO SECTION 13 OR 15(d)
OF THE SECURITIES EXCHANGE ACT OF 1934.

For the Transition Period from    to 

Commission File Number: 000-11486


CENTER BANCORP, INC.

(Exact Name of Registrant as Specified in Its Charter)

New Jersey
 
52-1273725
New Jersey52-1273725
(State or Other Jurisdiction of
Incorporation or Organization)
 
(IRS Employer
Identification Number)

2455 Morris Avenue, Union, NJ 07083-0007

(Address of Principal Executive Offices, Including Zip Code)

(908) 688-9500

(Registrant’s Telephone Number, Including Area Code)


Securities registered pursuant to Section 12(b) of the Exchange Act:

Common Stock, No Par Value

(Title of Class)

Title of each class
Name of each exchange on which registered
Common Stock, no par valueNASDAQ
Securities registered pursuant to Section 12(g) of the Exchange Act:None


Indicate by checkmark if the registrant is a well-known seasoned issuer, as defined in Rule 405 of the Securities Act. Yeso¨ Nox

Indicate by checkmark if the registrant is not required to file reports pursuant to Section 13 or 15(d) of the Act. Yeso¨ Nox

Indicate by check mark whether the registrant (1) has filed all reports required to be filed by Section 13 or 15 (d) of the Securities Exchange Act of 1934 during the preceding 12 months (or for such shorter period that the registrant was required to file such reports), and (2) has been subject to such filing requirements for the past 90 days. Yesx Noo¨

Indicate by check mark whether the registrant has submitted electronically and posted on its corporate Web site, if any, every Interactive Data File required to be submitted and posted pursuant to Regulation S-T (232,405 of this chapter) during the preceding 12 months (or for such shorter period that the registrant has required to submit and post such files.) Yesox Noo¨ Not applicable

Indicate by check mark if disclosure of delinquent filers pursuant to Item 405 of Regulation S-K is not contained herein, and will not be contained, to the best of Registrant’s knowledge, in definitive proxy or information statements incorporated by reference in Part III of the Form 10-K or any amendment to the Form 10-K.o¨

Indicate by check mark whether the registrant is a large accelerated filer, an accelerated filer, a non-accelerated filer or a smaller reporting company. See definition of “large accelerated filer”, “accelerated filer” and “smaller reporting company” in Rule 12b-2 of the Securities Exchange Act of 1934.

Large Accelerated Filero¨
Accelerated Filerx
Non-Accelerated¨
Non-Accelerated
o
Small Reporting Companyo¨

Indicate by check mark whether the registrant is a shell company (as defined in Rule 12b-2 of the Act) Yeso¨ or Nox

The aggregate market value of the voting and non-voting common equity held by non-affiliates computed by reference to the price at which the common equity was last sold or the average bid and ask price of such common equity, as of the last business day of the registrant’s most recently completed second fiscal quarter — $88.1$149.9 million

Shares Outstanding on March 1, 2011

February 28, 2014
Common Stock, no par value: 16,290,70016,369,012 shares

DOCUMENTS INCORPORATED BY REFERENCE

Definitive proxy statement in connection with the 20112014 Annual Stockholders Meeting to be filed with the Commission pursuant to Regulation 14A will be incorporated by reference in Part III.


CENTER BANCORP, INC.
TABLE OF CONTENTS

CENTER BANCORP, INC.

TABLE OF CONTENTS

Page
PART I

Item 1.

Business

  1
Page

Item 1A.

Risk Factors

17
PART I

Item 1.

Business3
Item 1A.Risk Factors18
Item 1B.

Unresolved Staff Comments

2425

Item 2.

Properties

Properties2425

Item 3.

Legal Proceedings

2526

Item 3A.

Executive Officers of the Registrant

2627

Item 4.

Reserved

Mine Safety Disclosures2728
PART II

Item 5.

Market for Registrant’s Common Equity, Related Stockholder Matters and Issuer Purchases of Equity Securities

2829

Item 6.

Selected Financial Data

30

Item 7.

Management’s Discussion and Analysis of Financial Condition and Results of Operations

33

Item 7A.

Quantitative and Qualitative Disclosures About Market Risk

6765

Item 8.

Financial Statements and Supplementary Data:

F-1
 F-1
ReportReports of Independent Registered Public Accounting FirmFirmsF-2
 F-2
Center Bancorp, Inc. and Subsidiaries:
 
Consolidated Statements of ConditionF-4
 F-3
Consolidated Statements of IncomeF-5
 Consolidated Statements of Comprehensive IncomeF-4F-6
Consolidated Statements of Changes in Stockholders’ EquityF-7
 F-5
Consolidated Statements of Cash FlowsF-8
 F-6
Notes to Consolidated Financial StatementsF-8F-9

Item 9.

Changes in and Disagreements With Accountants on Accounting and Financial Disclosure

6866

Item 9A.

Controls and Procedures

6866

Item 9B.

Other Information

7069
PART III

Item 10.

Directors, Executive Officers and Corporate Governance

7170

Item 11.

Executive Compensation

7170

Item 12.

Security Ownership of Certain Beneficial Owners and Management and Related Stockholder Matters

7170

Item 13.

Certain Relationships and Related Transactions, and Director Independence

70
Item 14.Principal Accounting Fees and Services70
PART IV
  71

Item 14.

Principal Accountant Fees and Services

71
PART IV

Item 15.

Exhibits, and Financial Statements Schedules

71
 Signatures72
Signatures7574

Information included in or incorporated by reference in this Annual Report on Form 10-K, other filings with the Securities and Exchange Commission, t hethe Corporation’s press releases or other public statements, contain or may contain forward looking statements. Please refer to a discussion of the Corporation’s forward looking statements and associated risks in “Item 1 — Business — Historical Development of Business” and “Item 1A — Risk Factors” in this Annual Report on Form 10-K.

i


2

TABLE OF CONTENTS

CENTER BANCORP, INC.
FORM 10-K

PART I

Item 1. Business

Historical Development of Business

This report, in Item 1, Item 7 and elsewhere, includes forward-looking statements within the meaning of Sections 27A of the Securities Act of 1933, as amended, and 21E of the Securities Exchange Act of 1934, as amended, that involve inherent risks and uncertainties. This report contains certain forward-looking statements with respect to the financial condition, results of operations, plans, objectives, future performance and business of Center Bancorp, Inc. and its subsidiaries, including statements preceded by, followed by or that include words or phrases such as “believes,” “expects,” “anticipates,” “plans,” “trend,” “objective,” “continue,” “remain,” “pattern” or similar expressions or future or conditional verbs such as “will,” “would,” “should,” “could,” “might,” “can,” “may” or similar expressions. There are a number of important factors that could cause future results to differ materially from historical performance and these forward-looking statements. Factors that might cause such a difference include, but are not limited to: (1) competitive pressures among depository institutions may increase significantly; (2) changes in the interest rate environment may reduce interest margins; (3) prepayment speeds, loan origination and sale volumes, charge-offs and loan loss provisions may vary substantially from period to period; (4) general economic conditions may be less favorable than expected; (5) political developments, wars or other hostilities may disrupt or increase volatility in securities markets or other economic conditions; (6) legislative or regulatory changes or actions may adversely affect the businesses in which Center Bancorp, Inc. is engaged; (7) changes and trends in the securities markets may adversely impact Center Bancorp, Inc; (8) a delayed or incomplete resolution of regulatory issues could adversely impact our planning; (9) difficulties in integrating any businesses that we may acquire, which may increase our expenses and delay the achievement of any benefits that we may expect from such acquisitions; (10) the impact of reputation risk created by the developments discussed above on such matters as business generation and retention, funding and liquidity could be significant; and (10)(11) the outcome of regulatory and legal investigations and proceedings may not be anticipated. Further information on other factors that could affect the financial results of Center Bancorp, Inc. are included in Item 1A of this Annual Report on Form 10-K and in Center Bancorp’s other filings with the Securities and Exchange Commission. These documents are available free of charge at the Commission’s website athttp://www.sec.gov and/or from Center Bancorp, Inc. Center Bancorp, Inc. assumes no obligation to update forward-looking statements at any time.

Center Bancorp, Inc., a one-bank holding company, was incorporated in the state of New Jersey on November 12, 1982. Upon the acquisition of all outstanding shares of capital stock of Union Center National Bank (the “Bank”), its principal subsidiary, Center Bancorp, Inc., commenced operations on May 1, 1983. The holding company’s sole activity, at this time, is to act as a holding company for the Bank and other subsidiaries. As used herein, the term “Corporation” shall refer to Center Bancorp, Inc. and its direct and indirect subsidiaries and the term “Parent Corporation” shall refer to Center Bancorp, Inc. on an unconsolidated basis. In addition to its principal subsidiary,
Center Bancorp, Inc. owns 100 percent of the voting shares of Center Bancorp, Inc. Statutory Trust II, through which it issued trust preferred securities. Center Bancorp, Inc. Statutory Trust IIThe trust exists for the exclusive purpose of (i) issuing trust securities representing undivided beneficial interests in the assets of the trust; (ii) investing the gross proceeds of the trust securities in $5.2 million of junior subordinated deferrable interest debentures (subordinated debentures) of the Corporation; and (iii) engaging in only those activities necessary or incidental thereto. These subordinated debentures and the related income effects are not eliminated in the consolidated financial statements as the statutory business trust is not a consolidated subsidiary.in accordance with Financial Accounting Standards Board (“FASB”) FASB ASC 810-10 “Consolidation of Variable Interest Entities.” Distributions on the subordinated debentures owned by the subsidiary trust have been classified as interest expense in the Consolidated Statements of Income. See Note 1011 of the Consolidated Financial Statements.

The

3

Except as described above, the Corporation’s wholly-owned subsidiaries are all included in the consolidated financial statements of Center Bancorp, Inc. These subsidiaries include an advertising subsidiary; an insurance subsidiary offering annuity products, property and casualty, life and health insurance, and various investment subsidiaries which hold, maintain and manage investment assets for the Corporation. In the past, theThe Corporation’s subsidiaries have also includedinclude a real estate investment trust subsidiariessubsidiary (the “REIT” subsidiaries) and two title insurance partnerships. The title insurance partnerships were liquidated and ceased operations in December 2009. During the fourth quarter of 2006, the Corporation effected an internal entity reorganization and adopted a plan of liquidation for its one remaining REIT subsidiary,subsidiary) which was completed on November 16, 2007.


TABLE OF CONTENTS

During 2001 and 2003, the Corporation formed statutory business trusts, which exist for the exclusive purpose of (i) issuing trust securities representing undivided beneficial interests in the assets of a trust; (ii) investing the gross proceedsowns some of the trust securities in junior subordinated deferrable interest debentures (subordinated debentures) of the Corporation; and (iii) engaging in only those activities necessaryreal estate loans. All subsidiaries mentioned above are directly or incidental thereto. These subordinated debentures and the related income effects are not eliminated in the consolidated financial statements as the statutory business trusts are not consolidated in accordance with Financial Accounting Standards Board (“FASB”) FASB ASC 810-10 (previously FASB interpretation No. 46(R), “Consolidation of Variable Interest Entities.” Distributions on the subordinated debenturesindirectly wholly owned by the subsidiary trusts have been classified as interest expense in the Consolidated Statements of Income.

The Corporation, issued $10.3 million of subordinated debentures in 2001 and $5.2 million of subordinated debentures in 2003. On December 18, 2006,except that the Corporation redeemed $10.3 millionowns less than 100 percent of subordinated debentures and dissolved Center Bancorp, Inc. Statutory Trust I. At December 31, 2010, the $5.2 millionpreferred stock of these securities still outstanding were includedthe REIT subsidiary. A REIT must have 100 or more shareholders to quality as a componentREIT. The REIT has issued less than 20 percent of Tierits outstanding non-voting preferred stock to individuals, primarily bank personnel and directors.

On August 1, Capital for regulatory purposes. The Tier 1 leverage capital ratio was 9.90 percent at December 31, 2010.

During 2002,2012, the Bank established two investment subsidiariesassumed all of the deposits and certain other liabilities and acquired certain assets of Saddle River Valley Bank, a New Jersey State-chartered bank, pursuant to hold portionsthe terms of its securities portfolio. At December 2007, under a planPurchase and Assumption Agreement, dated as of liquidation adopted byFebruary 1, 2012, among the Bank, oneSaddle River Valley Bank and Saddle River Valley Bancorp. This purchase and assumption was in keeping with the Bank’s strategy to expand its base of operations into Northern New Jersey.

On January 20, 2014, the Parent Corporation entered into an Agreement and Plan of Merger (the “Merger Agreement”) with ConnectOne Bancorp, Inc., a New Jersey corporation (“ConnectOne Bancorp”). The Merger Agreement provides that, upon the terms and subject to the conditions set forth therein, ConnectOne Bancorp will merge with and into the Parent Corporation, with the Parent Corporation continuing as the surviving corporation (the “Merger”), and the Parent Corporation will change its name to ConnectOne Bancorp. The Merger Agreement also provides that immediately following the consummation of the investment companies had been liquidated. During 2008,Merger, the Bank will merge with and into ConnectOne Bank (the “Bank Merger”), a New Jersey-chartered commercial bank (“ConnectOne Bank”) and a wholly-owned subsidiary of ConnectOne Bancorp, with ConnectOne Bank continuing as the surviving bank. Subject to the terms and conditions of the Merger Agreement, upon completion of the Merger (the “Effective Time”), each share of common stock, no par value per share, of ConnectOne Bancorp (“ConnectOne Common Stock”), issued and outstanding immediately prior to the Effective Time will be converted into and become the right to receive 2.6 shares of the Parent’s Corporation’s common stock. The Merger and the Bank Merger are subject to the receipt of all necessary regulatory approvals, the approvals of the shareholders of the Parent Corporation formed a new investment company. In January of 2003,and ConnectOne Bancorp and other conditions. The parties contemplate that the Corporation established an insurance subsidiary for the sale of insurance and annuity products. The Corporation also formed a title insurance partnership during the later part of 2007 that was fully operational in 2008. During the early part of 2008, the Corporation formed a second title partnership that was fully operationalmerger will be consummated during the second halfor third quarters of 2008. Both title insurance partnerships were liquidated during December, 20092014, provided that all conditions are satisfied or, where permitted, waived. 
In connection with the proposed merger, the Parent Corporation will file with the Securities and Exchange Commission (the “SEC”) a Registration Statement on Form S-4 that will include a joint proxy statement of the Parent Corporation and ConnectOne Bancorp and a prospectus of the Parent Corporation, as well as other relevant documents concerning the proposed transaction. The Parent Corporation and ConnectOne Bancorp will each mail the joint proxy statement/prospectus to its stockholders. SHAREHOLDERS OF THE PARENT CORPORATION AND CONNECTONE BANCORP ARE URGED TO READ CAREFULLY THE REGISTRATION STATEMENT AND JOINT PROXY STATEMENT/PROSPECTUS REGARDING THE PROPOSED MERGER IN ITS ENTIRETY WHEN IT BECOMES AVAILABLE AND ANY OTHER RELEVANT DOCUMENTS FILED WITH THE SEC, AS WELL AS ANY AMENDMENTS OR SUPPLEMENTS TO THOSE DOCUMENTS, BECAUSE THEY WILL CONTAIN IMPORTANT INFORMATION. Investors and security holders may obtain a free copy of the joint proxy statement/prospectus (when available) and other filings containing information about the Parent Corporation and ConnectOne Bancorp at the SEC's website at www.sec.gov. The joint proxy statement/prospectus (when available) and the Bank no longer provides title insurance.

other filings may also be obtained free of charge at Center's website at www.centerbancorp.com under the tab "Investor Relations," and then under the heading "SEC Filings" or at ConnectOne Bancorp's website at www.connectonebank.com under the tab "Investor Relations," and then under the heading "SEC Filings." Center, ConnectOne and certain of their respective directors and executive officers, under the SEC's rules, may be deemed to be participants in the solicitation of proxies of the Parent Corporation’s and ConnectOne Bancorp’s shareholders in connection with the proposed merger. Information about the directors and executive officers of the Parent Corporation and their ownership of the Parent Corporation’s common stock is set forth in the proxy statement for the Parent Corporation’s 2013 annual meeting of shareholders, as filed with the SEC on Schedule 14A on April 15, 2013. Information about the directors and executive officers of ConnectOne Bancorp and their ownership of ConnectOne Bancorp common stock is set forth in the proxy statement for ConnectOne Bancorp’s 2013 annual meeting of shareholders, as filed with the SEC on Schedule 14A on April 8, 2013. Additional information regarding the interests of those participants and other persons who may be deemed participants in the transaction may be obtained by reading the joint proxy statement/prospectus regarding the proposed Merger when it becomes available. Free copies of this document may be obtained as described in the preceding paragraph. 

This Annual Report on Form 10-K does not constitute an offer to sell or the solicitation of an offer to buy any securities or a solicitation of any vote or approval, nor shall there be any sale of securities in any jurisdiction in which such offer, solicitation or sale would be unlawful prior to registration or qualification under the securities laws of such jurisdiction.
SEC Reports and Corporate Governance

The Parent Corporation makes its Annual Report on Form 10-K, Quarterly Reports on Form 10-Q and Current Reports on Form 8-K and amendments thereto available on its website atwww.centerbancorp.com without charge as soon as reasonably practicable after filing or furnishing them to the SEC. Also available on the website are the Corporation’s corporate code of ethics that applies to all of the Corporation’s employees, including principal officers and directors, and charters for the Audit Committee, Compensation Committee and Nominating Committee.

The Parent Corporation has filed the certifications of the Chief Executive Officer and Chief Financial Officer required pursuant to Section 302 of the Sarbanes-Oxley Act of 2002 with respect to the Parent Corporation’s Annual Report on Form 10-K as exhibits to this Report. Center Bancorp’s CEO submitted the required annual CEO’s Certification regarding the NASDAQ’s corporate governance listing standards, Section 12(a) CEO Certification, to the NASDAQ within the required time frame after the 20102013 annual shareholders’ meeting.

Additionally, the Parent Corporation will provide without charge, a copy of its Annual Report on Form 10-K to any shareholder by mail. Requests should be sent to Center Bancorp, Inc, Attention: Shareholder Relations, 2455 Morris Avenue, Union, New Jersey, 07083.

Narrative Description of the Business

The Bank offers a broad range of lending, depository and related financial services to commercial, industrial and governmental customers. In 1999, theThe Bank obtainedhas full trust powers, enabling it to offer a variety of trust services to its customers. In the lending area, the Bank’s services include short and medium term loans, lines of credit, letters of credit, working capital loans, real estate construction loans and mortgage loans. In the depository area, the Bank offers demand deposits, savings accounts and time deposits. In addition, the Bank offers collection services, wire transfers, night depository and lock box services.

The Bank offers a broad range of consumer banking services, including interest bearing and non-interest bearing checking accounts, savings accounts, money market accounts, certificates of deposit, IRA accounts, Automated Teller Machine (“ATM”) accessibility using Star Systems, Inc. service, secured and unsecured loans, mortgage loans, home equity lines of credit, safe deposit boxes, Christmas club accounts, vacation club accounts, money orders and travelers’ checks.


TABLE OF CONTENTS

The Bank, through its subsidiary, Center Financial Group LLC, provides financial services, including brokerage services, insurance and annuities, mutual funds and financial planning. In the fourth quarter of 2007, the Corporation formed a title insurance partnership, Center Title LLC, with Progressive Title Company in Parsippany, New Jersey to provide title services in connection with the closing of real estate transactions. In January 2008, the Corporation formed a title insurance partnership, Union Title LLC, with Elite Title Abstract of West Caldwell, New Jersey to provide title services in connection with the closing of real estate loan transactions. Our partnerships with both title companies were liquidated during December, 2009.

The Bank offers various money market services. It deals in U.S. Treasury and U.S. Governmental agency securities, certificates of deposit, commercial paper and repurchase agreements.

The Bank entered into a limited liability company operating agreement with Morris Property Company, LLC, a New Jersey limited liability company, during the fourth quarter ofin 2008. The purpose of Morris Property Company, LLC is to hold foreclosed assets.

4

On August 20, 2010, the Bank formed UCNB 1031 Exchange, LLC, for the purpose of providing customers 1031 exchange services. At December 31, 2010 UCNB 1031 Exchange, LLC was active, however its operations to date have had no material impact onIn August of 2011, the operations of the Corporation.

Bank liquidated this business.

Competitive pressures affect the Corporation’s manner of conducting business. Competition stems not only from other commercial banks but also from other financial institutions such as savings banks, savings and loan associations, mortgage companies, leasing companies and various other financial service and advisory companies. Many of the financial institutions operating in the Corporation’s primary market are substantially larger and offer a wider variety of products and services than the Corporation.

Supervision and Regulation

The banking industry is highly regulated. Statutory and regulatory controls increase a bank holding company’s cost of doing business and limit the options of its management to deploy assets and maximize income. The following discussion is not intended to be a complete list of all the activities regulated by the banking laws or of the impact of such laws and regulations on the Corporation or its Bank subsidiary. It is intended only to briefly summarize some material provisions.

Bank Holding Company Regulation

Center Bancorp, Inc. is a bank holding company within the meaning of the Bank Holding Company Act of 1956 (the “Holding Company Act”). As a bank holding company, the Parent Corporation is supervised by the Board of Governors of the Federal Reserve System (“FRB”) and is required to file reports with the FRB and provide such additional information as the FRB may require. The Parent Corporation and itits subsidiaries are subject to examination by the FRB.

On November 9, 2007, the FRB approved the Parent Corporation’s application to become a Financial Holding Company. A Financial Holding Company may perform the following activities: insurance underwriting, securities dealing and underwriting, financial and investment advisory services, merchant banking and issuing or selling security interests in bank-eligible assets. Financial Holding Companies may also engage in any other activity that the FRB determines to be financial in nature or incidental to financial activities after consultation with the Secretary of the Treasury. A Financial Holding Company may also engage in any non-financial activity that the FRB determines is complementary to a financial activity and does not pose a substantial risk to the safety or soundness of depository institutions or the financial system. As of December 31, 2009 the Parent Corporation officially rescinded its status as a financial services holding company as a result of the discontinuation of its title insurance activities.

The Holding Company Act prohibits the Corporation, with certain exceptions, from acquiring direct or indirect ownership or control of more than five percent of the voting shares of any company which is not a bank and from engaging in any business other than that of banking, managing and controlling banks or furnishing services to subsidiary banks, except that it may, upon application, engage in, and may own shares of companies engaged in, certain businesses found by the FRB to be so closely related to banking “as to be a proper incident thereto.” The Holding Company Act requires prior approval by the FRB of the acquisition by Center Bancorp, Inc. of more than five percent of the voting stock of any other bank. Satisfactory capital


TABLE OF CONTENTS

ratios and Community Reinvestment Act ratings and anti-money laundering policies are generally prerequisites to obtaining federal regulatory approval to make acquisitions. The policy of the FRB provides that a bank holding company is expected to act as a source of financial strength to its subsidiary bank and to commit resources to support the subsidiary bank in circumstances in which it might not do so absent that policy.

Acquisitions through Union Center National Bank require approval of the Office of the Comptroller of the Currency of the United States (“OCC”). The Holding Company Act does not place territorial restrictions on the activities of non-bank subsidiaries of bank holding companies. The Gramm-Leach-Bliley Act, discussed below, allows the Corporation to expand into insurance, securities, merchant banking activities, and other activities that are financial in nature.

The Riegle-Neal Interstate Banking and Branching Efficiency Act of 1994 (“Interstate Banking and Branching Act”) enables bank holding companies to acquire banks in states other than their home state, regardless of applicable state law. The Interstate Banking and Branching Act also authorizes banks to merge across state lines, thereby creating interstate banks with branches in more than one state. Under the legislation, each state had the opportunity to “opt-out” of this provision. Furthermore, a state may “opt-in” with respect tode novo branching, thereby permitting a bank to open new branches in a state in which the bank does not already have a branch. Withoutde novo branching, an out-of-state commercial bank can enter the state only by acquiring an existing bank or branch. The vast majority of states have allowed interstate banking by merger but have not authorizedde novo branching.

New Jersey enacted legislation to authorize interstate banking and branching and the entry into New Jersey of foreign country banks. New Jersey did not authorizede novo branching into the state. However, under federal law, federal savings banks which meet certain conditions may branchde novo into a state, regardless of state law. The Dodd-Frank Wall Street Reform and Consumer Protection Act (the “Dodd-Frank Act”), described in more detail below) removes the restrictions on interstate branching contained in the Interstate Banking and Branching Act, and allows national banks and state banks to establish branches in any state if, under the laws of the state in which the branch is to be located, a state bank chartered by that state would be permitted to establish the branch.

5

Regulation of Bank Subsidiary

The operations of the Bank are subject to requirements and restrictions under federal law, including requirements to maintain reserves against deposits, restrictions on the types and amounts of loans that may be granted, and limitations on the types of investments that may be made and the types of services which may be offered. Various consumer laws and regulations also affect the operations of the Bank. Approval of the Comptroller of the Currency is required for branching, bank mergers in which the continuing bank is a national bank and in connection with certain fundamental corporate changes affecting the Bank. There are various legal limitations, including Sections 23A and 23B of the Federal Reserve Act, which govern the extent to which a bank subsidiary may finance or otherwise supply funds to its holding company or its holding company’s non-bank subsidiaries. Under federal law, no bank subsidiary may, subject to certain limited exceptions, make loans or extensions of credit to, or investments in the securities of, its parent or the non-bank subsidiaries of its parent (other than direct subsidiaries of such bank which are not financial subsidiaries) or take their securities as collateral for loans to any borrower. Each bank subsidiary is also subject to collateral security requirements for any loans or extensions of credit permitted by such exceptions.

The BankDodd-Frank Act
The Dodd-Frank Act, adopted in 2010, will continue to have a broad impact on the financial services industry, as a result of the significant regulatory and the OCC have entered into an informal Memorandum of Understanding, or MOU. A memorandum of understanding is characterizedcompliance changes made by the regulatory authorities as an informal action that is not published or publicly available and that is used when circumstances warrant a milder form of action than a formal supervisory action. AmongDodd-Frank Act, including, among other things, under(i) enhanced resolution authority over troubled and failing banks and their holding companies; (ii) increased capital and liquidity requirements; (iii) increased regulatory examination fees; (iv) changes to assessments to be paid to the MOU, the Bank has agreedFDIC for federal deposit insurance; and (v) numerous other provisions designed to develop a three year capital program, which will include specific plansimprove supervision and oversight of, and strengthening safety and soundness for, the maintenance of adequate capitalfinancial services sector. Additionally, the Dodd-Frank Act establishes a new framework for systemic risk oversight within the financial system to be distributed among new and existing federal regulatory agencies, including the strengthening ofFinancial Stability Oversight Council, the Bank’s capital structure to meet the Bank’s current and future needs, a profit plan that includes the identification of the major areas and means by which the Board will seek to improve the Bank’s operating performance, and a dividend policy that permits the declaration of a dividend by the Bank only with the prior approval of the OCC. Management is committed to addressing and resolving the issues raised byFederal Reserve, the OCC and has substantially completed corrective actionsthe FDIC. A summary of certain provisions of the Dodd-Frank Act is set forth below:
Minimum Capital Requirements.   The Dodd-Frank Act requires new capital rules and the application of the same leverage and risk-based capital requirements that apply to insured depository institutions to most bank holding companies. In addition to making bank holding companies subject to the same capital requirements as their bank subsidiaries, these provisions (often referred to as the Collins Amendment to the Dodd-Frank Act) were also intended to eliminate or significantly reduce the use of hybrid capital instruments, especially trust preferred securities, as regulatory capital. The Dodd-Frank Act also requires banking regulators to seek to make capital standards countercyclical, so that the required levels of capital increase in times of economic expansion and decrease in times of economic contraction. See “New Capital Rules” for a description of new capital requirements adopted by U.S. federal banking regulators in 2013 and the treatment of trust preferred securities under such rules.
Basel III.On July 9, 2013, the Office of the Comptroller of the Currency approved a final rule revising regulatory capital rules applicable to national banks, implementing Basel III. This rule redefines Tier 1 capital as two components (Common Equity Tier 1 and Additional Tier 1), creates a new capital ratio (Common Equity Tier 1 Risk-based Capital Ratio) and implements a capital conservation buffer. It also revises the prompt corrective action thresholds and makes changes to risk weighs for certain assets and off-balance-sheet exposures. Banks are required to transition into the new rule beginning on January 1, 2015, although, based on the Corporation’s capital levels and balance sheet composition at September 30, 2013, the Corporation does not believe implementation of the new rule will have a material impact on the Corporation’s capital needs; however, due to the complexity of the rules, the Corporation will continue to evaluate the impact of these changes to our regulatory capital of Center Bancorp and Union Center National Bank. This statement regarding the impact of the new regulations constitutes a forward-looking statement under the Private Securities Litigation Reform Act of 1995. Actual results could differ materially from this statement as a result of various factors, including modifications to the new regulations that may be adopted prior to the effective dates of the new regulations.
The Consumer Financial Protection Bureau (“Bureau”).   The Dodd-Frank Act created the Bureau within the Federal Reserve. The Bureau is tasked with establishing and implementing rules and regulations under certain federal consumer protection laws with respect to the conduct of providers of certain consumer financial products and services. The Bureau has rulemaking authority over many of the statutes governing products and services offered to bank consumers. In addition, the Dodd-Frank Act permits states to adopt consumer protection laws and regulations that are more stringent than those regulations promulgated by the Bureau and state attorneys general are permitted to enforce consumer protection rules adopted by the Bureau against state-chartered institutions. The Consumer Financial Protection Bureau has examination and
enforcement authority over all banks and savings institutions with more than $10 billion in assets. Institutions with $10 billion or less in assets, such as the Bank, will continue to be examined for compliance with the consumer laws by their primary bank regulators.
6

Deposit Insurance.   The Dodd-Frank Act makes permanent the $250,000 deposit insurance limit for insured deposits. Amendments to the Federal Deposit Insurance Act also revise the assessment base against which an insured depository institution’s deposit insurance premiums paid to the Deposit Insurance Fund (“DIF”) will be calculated. Under the amendments, the assessment base will no longer be the institution’s deposit base, but rather its average consolidated total assets less its average tangible equity during the assessment period. Additionally, the Dodd-Frank Act makes changes to the minimum designated reserve ratio of the DIF, increasing the minimum from 1.15 percent to 1.35 percent of the estimated amount of total insured deposits and eliminating the requirement that the FDIC pay dividends to depository institutions when the reserve ratio exceeds certain thresholds. In December 2010, the FDIC increased the designated reserve ratio to 2.0 percent.
Shareholder Votes .  The Dodd-Frank Act requires publicly traded companies like Center Bancorp to give shareholders a non-binding vote on executive compensation and so-called “golden parachute” payments in certain circumstances. The Dodd-Frank Act also authorizes the SEC to promulgate rules that would allow shareholders to nominate their own candidates using a company’s proxy materials.
Transactions with Affiliates.   The Dodd-Frank Act enhances the requirements for certain transactions with affiliates under Section 23A and 23B of the Federal Reserve Act, including an expansion of the definition of “covered transactions” and increasing the amount of time for which collateral requirements regarding covered transactions must be maintained. These requirements became effective during 2011.
Transactions with Insiders.   Insider transaction limitations are expanded through the strengthening of loan restrictions to insiders and the expansion of the types of transactions subject to the various limits, including derivative transactions, repurchase agreements, reverse repurchase agreements and securities lending or borrowing transactions. Restrictions are also placed on certain asset sales to and from an insider to an institution, including requirements that such sales be on market terms and, in certain circumstances, approved by the institution’s board of directors. These requirements became effective during 2011.
Enhanced Lending Limits.   The Dodd-Frank Act strengthened the previous limits on a depository institution’s credit exposure to one borrower which limited a depository institution’s ability to extend credit to one person (or group of related persons) in an amount exceeding certain thresholds. The Dodd-Frank Act expanded the scope of these restrictions to include credit exposure arising from derivative transactions, repurchase agreements, and securities lending and borrowing transactions.
Compensation Practices.  The Dodd-Frank Act provides that the appropriate federal regulators must establish standards prohibiting as an unsafe and unsound practice any compensation plan of a bank holding company or other “covered financial institution” that provides an insider or other employee with “excessive compensation” or compensation that gives rise to excessive risk or could lead to a material financial loss to such firm. In June 2010, prior to the Dodd-Frank Act, the bank regulatory agencies promulgated theInteragency Guidance on Sound Incentive Compensation Policies , which set forth three key principles concerning incentive compensation arrangements:
such arrangements should provide employees incentives that balance risk and financial results in a manner that does not encourage employees to expose the financial institution to imprudent risk;
such arrangements should be compatible with effective controls and risk management; and
such arrangements should be supported by strong corporate governance with effective and active oversight by the financial institution’s board of directors.
7

Together, the Dodd-Frank Act and the recent guidance on compensation may impact the Corporation’s compensation practices.
Although a significant number of the rules and regulations mandated by the Dodd-Frank Act have been finalized, many of the new requirements called for have yet to be implemented and will likely be subject to implementing regulations over the course of several years. Given the uncertainty associated with the manner in which the provisions of the Dodd-Frank Act will be implemented by the various regulatory agencies, the full extent of the impact such requirements will have on financial institutions’ operations is unclear. The changes resulting from the Dodd-Frank Act may impact the profitability of our business activities, require changes to certain of our business practices, impose upon us more stringent capital, liquidity and leverage ratio requirements (which, in turn, could require the Corporation and the Bank to seek additional capital) or otherwise adversely affect our business. These changes may also require us to invest significant management attention and resources to evaluate and make necessary changes in order to comply with new statutory and regulatory requirements.
Volker Rule
In December 2013, Federal banking regulators issued rules for complying with the MOU. In addition,Volker Rule provision of the OCC has established higher minimum capital ratios forDodd-Frank Act. The Bank does not engage in, or expects to engage in, any transactions that are considered “covered activities” as defined by the Volker Rule. Therefore, the Bank thandoes not have any compliance obligations under the regulatory minimums. See “FDICIA.”

Volker Rule.

Regulation W
 

TABLE OF CONTENTS

Regulation W

The Federal Reserve Board has issued Regulation W, which codifies prior regulations under Sections 23A and 23B of the Federal Reserve Act and interpretative guidance with respect to affiliate transactions. Regulation W incorporates the exemption from the affiliate transaction rules but expands the exemption to cover the purchase of any type of loan or extension of credit from an affiliate. Affiliates of a bank include, among other entities, the bank’s holding company and companies that are under common control with the bank. The Parent Corporation is considered to be an affiliate of the Bank. In general, subject to certain specified exemptions, a bank or its subsidiaries are limited in their ability to engage in “covered transactions” with affiliates:

to an amount equal to 10% of the bank’s capital and surplus, in the case of covered transactions with any one affiliate; and
to an amount equal to 20% of the bank’s capital and surplus, in the case of covered transactions with all affiliates.affiliates

In addition, a bank and its subsidiaries may engage in covered transactions and other specified transactions only on terms and under circumstances that are substantially the same, or at least as favorable to the bank or its subsidiary, as those prevailing at the time for comparable transactions with nonaffiliated companies. A “covered transaction” includes:

a loan or extension of credit to an affiliate;
a purchase of, or an investment in, securities issued by an affiliate;
a purchase of assets from an affiliate, with some exceptions;
the acceptance of securities issued by an affiliate as collateral for a loan or extension of credit to any party; and
the issuance of a guarantee, acceptance or letter of credit on behalf of an affiliate.

In addition,

Further, under Regulationregulation W:

a bank and its subsidiaries may not purchase a low-quality asset from an affiliate;
covered transactions and other specified transactions between a bank or its subsidiaries and an affiliate must be on terms and conditions that are consistent with safe and sound banking practices; and
with some exceptions, each loan or extension of credit by a bank to an affiliate must be secured by certain types of collateral with a market value ranging from 100% to 130%, depending on the type of collateral, of the amount of the loan or extension of credit.credit

Regulation W generally excludes all non-bank and non-savings association subsidiaries of banks from treatment as affiliates, except to the extent that the Federal Reserve Board decides to treat these subsidiaries as affiliates.

8

Capital Adequacy Guidelines

The Federal Reserve Board has adopted risk-based capital guidelines. These guidelines establish minimum levels of capital and require capital adequacy to be measured in part upon the degree of risk associated with certain assets. Under these guidelines all banks and bank holding companies must have a core or Tier 1 capital to risk-weighted assets ratio of at least 4% and a total capital to risk-weighted assets ratio of at least 8%. At December 31, 2010,2013, the Corporation’s Tier 1 capital to risk-weighted assets ratio and total capital to risk-weighted assets ratio were 13.2812.10 percent and 14.2912.91 percent, respectively.

In addition, the Federal Reserve Board and the FDIC have approved leverage ratio guidelines (Tier 1 capital to average quarterly assets, less goodwill) for bank holding companies such as the Parent Corporation. These guidelines provide for a minimum leverage ratio of 3% for bank holding companies that meet certain specified criteria, including that they have the highest regulatory rating. All other holding companies are


TABLE OF CONTENTS

required to maintain a leverage ratio of 3% plus an additional cushion of at least 100 to 200 basis points. The Parent Corporation’s leverage ratio was 9.909.69 percent at December 31, 2010.

2013.

Under FDICIA, federal banking agencies have established certain additional minimum levels of capital. See “FDICIA”. See also “New Capital Rules” for a description of capital which accord with guidelines established under that act. In addition, OCC has established higher minimum capital ratios for the Bank effective as of December 31, 2009. See “FDICIA.”

requirements adopted by federal regulators in July 2013.

FDICIA

Pursuant to the Federal Deposit Insurance Corporation Improvement Act of 1991 (“FDICIA”), each federal banking agency has promulgated regulations, specifying the levels at which a financial institution would be considered “well capitalized,” “adequately capitalized,” “undercapitalized,” “significantly undercapitalized,” or “critically undercapitalized,” and to take certain mandatory and discretionary supervisory actions based on the capital level of the institution. To qualify to engage in financial activities under the Gramm-Leach-Bliley Act, all depository institutions must be “well capitalized.” The financial holding company of a national bank will be put under directives to raise its capital levels or divest its activities if the depository institution falls from that level.

The OCC’s regulations implementing these provisions of FDICIA provide that an institution will be classified as “well capitalized” if it (i) has a total risk-based capital ratio of at least 10.0 percent, (ii) has a Tier 1 risk-based capital ratio of at least 6.0 percent, (iii) has a Tier 1 leverage ratio of at least 5.0 percent, and (iv) meets certain other requirements. An institution will be classified as “adequately capitalized” if it (i) has a total risk-based capital ratio of at least 8.0 percent, (ii) has a Tier 1 risk-based capital ratio of at least 4.0 percent, (iii) has a Tier 1 leverage ratio of (a) at least 4.0 percent or (b) at least 3.0 percent if the institution was rated 1 in its most recent examination, and (iv) does not meet the definition of “well capitalized.” An institution will be classified as “undercapitalized” if it (i) has a total risk-based capital ratio of less than 8.0 percent, (ii) has a Tier 1 risk-based capital ratio of less than 4.0 percent, or (iii) has a Tier 1 leverage ratio of (a) less than 4.0 percent or (b) less than 3.0 percent if the institution was rated 1 in its most recent examination. An institution will be classified as “significantly undercapitalized” if it (i) has a total risk-based capital ratio of less than 6.0 percent, (ii) has a Tier 1 risk-based capital ratio of less than 3.0 percent, or (iii) has a Tier 1 leverage ratio of less than 3.0 percent. An institution will be classified as “critically undercapitalized” if it has a tangible equity to total assets ratio that is equal to or less than 2.0 percent. An insured depository institution may be deemed to be in a lower capitalization category if it receives an unsatisfactory examination rating.

The OCC has established higher minimum capital ratios for the Bank effective as of December 31, 2009: Tier 1 Risk-Based Capital of 10.0 percent, Total Risk-Based Capital of 12.0 percent and Tier 1 Leverage Capital of 8.0 percent. At December 31, 2010, the Bank’s capital ratios were all above the minimum levels required.

In addition, significant provisions of FDICIA required federal banking regulators to impose standards in a number of other important areas to assure bank safety and soundness, including internal controls, information systems and internal audit systems, credit underwriting, asset growth, compensation, loan documentation and interest rate exposure. Under the MOU between the Bank and the OCC, the Bank has agreed to develop a three year capital program, which will include specific plans for the maintenance of adequate capital and the strengthening of the Bank’s capital structure to meet current and future needs.

9

Additional Regulation of Capital

The federal regulatory authorities’ risk-based capital guidelines are based upon the 1988 capital accord (“Basel I”) of the Basel Committee on Banking Supervision (the “Basel Committee”). The Basel Committee is a committee of central banks and bank supervisors/regulators from the major industrialized countries that develops broad policy guidelines for use by each country’s supervisors in determining the supervisory policies and regulations to which they apply. Actions of the Committee have no direct effect on banks in participating countries. In 2004, the Basel Committee published a new capital accord (“Basel II”) to replace Basel I. Basel II provides two approaches for setting capital standards for credit risk — an internal ratings-based approach tailored to individual institutions’ circumstances and a standardized approach that bases risk weightings on external credit assessments to a much greater extent than permitted in existing risk-based capital guidelines.


TABLE OF CONTENTS

Basel II also would set capital requirements for operational risk and refine the existing capital requirements for market risk exposures. The Corporation is not required to comply with the advanced approaches of Basel II.

In 2009, the United States Treasury Department issued a policy statement (the “Treasury Policy Statement”) entitled “Principles for Reforming the U.S. and International Regulatory Capital Framework for Banking Firms,” which contemplates changes to the existing regulatory capital regime involving substantial revisions to major parts of the Basel I and Basel II capital frameworks and affecting all regulated banking organizations. The Treasury Policy Statement calls for, among other things, higher and stronger capital requirements for all banking firms, with changes to the regulatory capital framework to be phased in over a period of several years.

On December 17, 2009, the Basel Committee issued a set of proposals (the “2009 Capital Proposals”) that would significantly revise the definitions of Tier 1 capital and Tier 2 capital. Among other things, the 2009 Capital Proposals would re-emphasize that common equity is the predominant component of Tier 1 capital. Concurrently with the release of the 2009 Capital Proposals, the Basel Committee also released a set of proposals related to liquidity risk exposure (the “2009 Liquidity Proposals”). The 2009 Liquidity Proposals include the implementation of (i) a “liquidity coverage ratio” or LCR, designed to ensure that a bank maintains an adequate level of unencumbered, high-quality assets sufficient to meet the bank’s liquidity needs over a 30-day time horizon under an acute liquidity stress scenario and (ii) a “net stable funding ratio” or NSFR, designed to promote more medium and long-term funding of the assets and activities of banks over a one-year time horizon.

The Dodd-Frank Act includes certain provisions, often referred to as the “Collins Amendment,” concerning the capital requirements of the United States banking regulators. These provisions are intended to subject bank holding companies to the same capital requirements as their bank subsidiaries and to eliminate or significantly reduce the use of hybrid capital instruments, especially trust preferred securities, as regulatory capital. Under the Collins Amendment, trust preferred securities issued by a company, such as Union Center National Bank, with total consolidated assets of less than $15 billion before May 19, 2010 andare treated as regulatory capital, are grandfathered, but any such securities issued later are not eligible as regulatory capital. The banking regulators mustwere required to develop regulations setting minimum risk-based and leverage capital requirements for holding companies and banks on a consolidated basis that are no less stringent than the generally applicable requirements in effect for depository institutions under the prompt corrective action regulations. The banking regulators were also mustrequired to seek to make capital standards countercyclical so that the required levels of capital increase in times of economic expansion and decrease in times of economic contraction. The Dodd-Frank Act requires these new capital regulations to be adopted by the Federal Reserve in final form 18 months after the date of enactment of the Dodd-Frank Act (July 21, 2010).

New Capital Rules
In December 2010 and January 2011, the Basel Committee published the final texts of reforms on capital and liquidity generally referred to as “Basel III.” Although Basel III is intended to be implemented by participating countries for large, internationally active banks, its provisions are likely to be considered by United States banking regulators in developing new regulations applicable to other banks inIn July 2013, the United States, including Union Center National Bank.

For banks inFederal Reserve Board, the United States, amongFDIC and the most significantComptroller of the Currency adopted final rules (the “New Rules”), which implement certain provisions of Basel III concerningand the Dodd-Frank Act. The New Rules replace the general risk-based capital arerules of the following:

various banking agencies with a single, integrated regulatory capital framework. The New Rules require higher capital cushions and more stringent criteria for what qualifies as regulatory capital. 
A
For banks and bank holding companies like the Parent Corporation and the Bank, January 1, 2015 is the start date for compliance with the revised minimum regulatory capital ratios and for determining risk-weighted assets under what the New Rules call a “standardized approach.” As of January 1, 2015, the Parent Corporation and the Bank will be required to maintain the following minimum capital ratios, expressed as a percentage of risk-weighted assets:
·Common Equity Tier 1 Capital Ratio of 4.5% (this is a new concept and requirement, and is referred to as the “CET1”);
·Tier 1 Capital Ratio (CET1 capital plus “Additional Tier 1 capital”) of 6.0%; and
·Total Capital Ratio (Tier 1 capital plus Tier 2 capital) of 8.0%.
In addition, the Parent Corporation and the Bank will be subject to a leverage ratio of common equity to risk-weighted assets reaching 4.5%, plus an additional 2.5%4% (calculated as a capital conservation buffer, by 2019 after a phase-in period.
A minimum ratio of Tier 1 capital to risk-weightedaverage consolidated assets reaching 6.0% byas reported on the consolidated financial statements).
10

The New Rules also require a “capital conservation buffer.” When fully phased in on January 1 2019, afterthe Parent Corporation and the Bank will be required to maintain a phase-in period.
A minimum ratio of total capital to risk-weighted assets, plus the additional 2.5% capital conservation buffer, reachingwhich is composed entirely of CET1, on top of the minimum risk-weighted asset ratios described above, resulting in the following minimum capital ratios:
·CET1 of 7%;
·Tier 1 Capital Ratio of 8.5%; and
·Total Capital Ratio of 10.5%.
The purpose of the capital conservation buffer is to absorb losses during periods of economic stress. Banking institutions with a CET1, Tier 1 Capital Ratio and Total Capital Ratio above the minimum set forth above but below the capital conservation buffer will face constraints on their ability to pay dividends, repurchase equity and pay discretionary bonuses to executive officers, based on the amount of the shortfall. The implementation of the capital conservation buffer will begin on January 1, 2016 at the 0.625% level, and increase by 2019 after0.625% on each subsequent January 1 until it reaches 2.5% on January 1, 2019.
The New Rules also adopted a phase-in period.
An additional countercyclical“countercyclical capital buffer, which is not applicable to be imposed bythe Parent Corporation or the Bank. That buffer is applicable nationalonly to “advanced approaches banking regulators periodicallyorganizations,” which generally are those with consolidated total assets of at their discretion, with advance notice.

least $250 billion.
 

TABLE OF CONTENTS

Restrictions on capital distributionsThe New Rules provide for several deductions from and discretionary bonuses applicable when capital ratios fall within the buffer zone.
Deduction from common equity ofadjustments to CET1, which will be phased in between January 1, 2015 and January 1 2018. For example, mortgage servicing rights, deferred tax assets dependent upon future taxable income and significant investments in common equity issued by nonconsolidated financial entities must be deducted from CET1 to the extent that dependany one of those categories exceeds 10% of CET1 or all such categories in the aggregate exceed 15% of CET1.
Under current capital standards, the effects of accumulated other comprehensive income items included in capital are excluded for the purposes of determining regulatory capital ratios. Under the New Rules, the effects of certain accumulated other comprehensive income items are not excluded; however, banking organizations such as the Parent Corporation and the Bank may make a one-time permanent election to continue to exclude these items effective as of January 1, 2015.
While the New Rules generally require the phase-out of non-qualifying capital instruments such as trust preferred securities and cumulative perpetual preferred stock, holding companies with less than $15 billion in total consolidated assets as of December 31, 2009, such as the Parent Corporation, may permanently include non-qualifying instruments that were issued and included in Tier 1 or Tier 2 capital prior to May 19, 2010 in Additional Tier 1 or Tier 2 capital until they redeem such instruments or until the instruments mature.
The New Rules prescribe a standardized approach for calculating risk-weighted assets that expands the risk-weighting categories from the current four Basel I-derived categories (0%, 20%, 50% and 100%) to a much larger and more risk-sensitive number of categories, depending on future profitabilitythe nature of the assets, generally ranging from 0% for U.S. Government and agency securities, to 600% for certain equity exposures, and resulting in higher risk weights for a variety of asset categories. In addition, the New Rules provide more advantageous risk weights for derivatives and repurchase-style transactions cleared through a qualifying central counterparty and increase the scope of eligible guarantors and eligible collateral for purposes of credit risk mitigation.
Consistent with the Dodd-Frank Act, the New Rules adopt alternatives to credit ratings for calculating the risk-weighting for certain assets.
With respect to the Bank, the New Rules revise the “prompt corrective action” regulations under Section 38 of the Federal Deposit Insurance Act by (i) introducing a CET1 ratio requirement at each capital quality level (other than critically undercapitalized), with the required CET1 ratio being 6.5% for well-capitalized status; (ii) increasing the minimum Tier 1 capital ratio requirement for each category, with the minimum Tier 1 capital ratio for well-capitalized status being 8% (as compared to the current 6%); and (iii) requiring a leverage ratio of 5% to be realized.well-capitalized (as compared to the current required leverage ratio of 3% or 4%). The New Rules do not change the total risk-based capital requirement for any “prompt corrective action” category. When the capital conservation buffer is fully phased in, the capital ratios applicable to depository institutions under the New Rules will exceed the ratios to be considered well-capitalized under the prompt corrective action regulations.
Increased
The Corporation believes that as of December 31, 2013, the Parent Corporation and the Bank would meet all capital requirements for counterparty credit risk relating to OTC derivatives, repos and securities financing activities.under the New Rules on a fully phase-in basis, if such requirements were currently in effect.
For capital instruments issued on or after January 13, 2013 (other than common equity), a loss-absorbency requirement such that the instrument must be written off or converted to common equity if a trigger event occurs, either pursuant to applicable law or at the direction of the banking regulator. A trigger event is an event under which the banking entity would become nonviable without the write-off or conversion, or without an injection of capital from the public sector. The issuer must maintain authorization to issue the requisite shares of common equity if conversion were required.

The Basel III provisions on liquidity include complex criteria establishing the LCR and NSFR. Although Basel III is described as a “final text,” it is subject to the resolution of certain issues and to further guidance and modification, as well as to adoption by United States banking regulators, including decisions as to whether and to what extent it will apply to United States banks that are not large, internationally active banks.

11

Federal Deposit Insurance and Premiums

Substantially all of the deposits of the Bank are insured up to applicable limits by the Deposit Insurance Fund (“DIF”) of the FDIC and are subject to deposit insurance assessments to maintain the DIF. As a result of the Dodd-Frank Act, the basic federal deposit insurance limit was permanently increased from at least $100,000 to at least $250,000. In addition, on November 9, 2010 and January 18, 2011, the FDIC (asAs mandated by Section 343 of the Dodd-Frank Act)Act, the FDIC has adopted rules providing for temporary unlimited deposit insurance for traditional noninterest-bearing transaction accounts and IOLTA accounts beginning December 31, 2010, untilbut these temporary rules expired December 31, 2012. This coverage, which applies to allAs a result, as of January 1, 2013, (i) noninterest-bearing transaction accounts are no longer insured deposit institutions, does not charge any additional FDIC assessment to the institution. Furthermore, this unlimited coverage is separateseparately from and in addition to, the coverage provided to depositors with respect todepositors’ other accounts held at anthe same FDIC. Insured depository institution and such accounts will instead be added to any of a depositor’s other accounts in the applicable ownership category, and the aggregate balance insured institution.

Under current regulations,up to at least the FDIC utilizes a risk-based assessment system that imposesstandard maximum deposit insurance premiums based upon a risk matrix that takes into account a bank’s capital levelamount of $250,000 per depositor at each separately chartered FDIC-insured depository institution, and supervisory rating, known as a “CAMEL rating.” The assessment rate(ii) funds deposited in IOLTAs will no longer be insured under Section 343 of the Dodd-Frank Act, but because IOLTAs are fiduciary accounts, they generally qualify for an individual institution is determined according to a formula basedpass-through coverage on a weighted average of the institution’s individual CAMELS component ratings plus six financial ratios. Well-capitalized institutions (generally those with CAMELS composite ratings of 1 or 2) are grouped in Risk Category I and their initial assessment base rate for deposit insurance is set at an annual rate of between 12 and 16 basis points. The initial base assessment rate for institutions in Risk Categories II, III, and IV is set at annual rates of 22, 31 and 50 basis points, respectively. These base rates are then adjusted to a final assessment rate based on an institution’s brokered deposits, secured liabilities and unsecured debt. In 2010 the Bank recognized a total of $1.8 million in FDIC expense of the $5.7 million assessments prepaid in 2009.

On May 22, 2009, the Board of Directors of the FDIC adopted a final rule imposing a special assessment on the entire banking industry. The special assessment was calculated as five basis points times each insured depository institution’s assets minus Tier 1 capital, as reported in the report of condition as of June 30, 2009 and would not exceed ten times the institution’s assessment base for the second quarter of 2009 risk-based assessment. This special assessment, which totaled $1.2 million, was remitted by the Bank on September 30, 2009.

per-client basis.

On November 12, 2009, the FDIC adopted the finala rule which required insured depository institutions to prepay their quarterly risk-based assessments for the fourth quarter of 2009 through the fourth quarter of 2012. On December 30, 2009, the Bank remitted an FDIC prepayment in the amount of $5.7 million. An institution’s prepaid assessment was based on the total base assessment rate that the institution paid for the third quarter of 2009, adjusted quarterly by an estimated annual growth rate of 5% through the end of 2012, plus, for 2011 and 2012, an increase in the total base assessment rate on September 30, 2009 by an annualized


TABLE OF CONTENTS

three basis points. Any prepaid assessment in excess of the amounts that are subsequently determined to be actually due to the FDIC by June 30, 2013, willwere required to be returned to the institution at that time.

In November 2010, As of December 31, 2013 the Bank recognized a total of $5.4 million in FDIC expense of the $5.7 million assessments prepaid on December 30, 2009, and received a refund of $334,000 in May of 2013.

The FDIC has approved a rule to change the assessment base from adjusted domestic deposits to average consolidated total assets minus average tangible equity, as required by the Dodd-Frank Act. These new assessment rates will beginbegan in the second quarter of 2011 and will be payablewere paid at the end of September 2011. Since the new base is larger than the currentprior base, the FDIC’s rule would lowerlowered total base assessment rates to between 2.5 and 9 basis points for banks in the lowest risk category, and 30 to 45 basis points for banks in the highest risk category.

The Company paid $1.1 million in total FDIC assessments in 2013, as compared to $1.2 million in 2012.

Pursuant to the Dodd-Frank Act, the FDIC has established 2.0% as the designated reserve ratio (DRR), that is, the ratio of the DIF to insured deposits. The FDIC has adopted a plan under which it will meet the statutory minimum DRR of 1.35% by September 30, 2020, the deadline imposed by the Dodd-Frank Act. The Dodd-Frank Act requires the FDIC to offset the effect on institutions with assets less than $10 billion of the increase in the statutory minimum DRR to 1.35% from the former statutory minimum of 1.15%. The FDIC has not yet announced how it will implement this offset.
In addition to deposit insurance assessments, the FDIC is required to continue to collect from institutions payments for the servicing of obligations of the Financing Corporation (“FICO”) that were issued in connection with the resolution of savings and loan associations, so long as such obligations remain outstanding. The Bank paid a FICO premium of $87,000$47,000 in 2010 and expects to pay a similar premium in 2011.

2013.

The Gramm-Leach-Bliley Financial Services Modernization Act of 1999

The Gramm-Leach-Bliley Financial Services Modernization Act of 1999 became effective in early 2000. The Modernization Act:

allows bank holding companies meeting management, capital, and Community Reinvestment Act standards to engage in a substantially broader range of non-banking activities than previously was permissible, including insurance underwriting and making merchant banking investments in commercial and financial companies; if a bank holding company elects to become a financial holding company, it files a certification, effective in 30 days, and thereafter may engage in certain financial activities without further approvals;(the “Modernization Act”):
Allows
·allows bank holding companies meeting management, capital, and Community Reinvestment Act standards to engage in a substantially broader range of non-banking activities than previously was permissible, including insurance underwriting and making merchant banking investments in commercial and financial companies; if a bank holding company elects to become a financial holding company, it files a certification, effective in 30 days, and thereafter may engage in certain financial activities without further approvals;
·allows insurers and other financial services companies to acquire banks;
·removes various restrictions that previously applied to bank holding company ownership of securities firms and mutual fund advisory companies; and
·establishes the overall regulatory structure applicable to bank holding companies that also engage in insurance and securities operations.
removes various restrictions that previously applied to bank holding company ownership of securities firms and mutual fund advisory companies; and
establishes the overall regulatory structure applicable to bank holding companies that also engage in insurance and securities operations.

The Modernization Act also modified other financial laws, including laws related to financial privacy and community reinvestment.

The Gramm-Leach-Bliley Financial Modernization Act of 1999 became effective in early 2000. The Modernization Act:

allows bank holding companies meeting management, capital, and
Community Reinvestment Act standards to engage in a substantially broader range of non-banking activities than previously was permissible, including insurance underwriting and making merchant banking investments in commercial and financial companies; if a bank holding company elects to become a financial holding company, it files a certification, effective in 30 days, and thereafter may engage in certain financial activities without further approvals;
Allows insurers and other financial services companies to acquire banks;
removes various restrictions that previously applied to bank holding company ownership of securities firms and mutual fund advisory companies; and
establishes the overall regulatory structure applicable to bank holding companies that also engage in insurance and securities operations.

The Modernization Act also modified other financial laws, including laws related to financial privacy and community reinvestment.


TABLE OF CONTENTS

Community Reinvestment Act

Under the Community Reinvestment Act (“CRA”), as implemented by OCC regulations, a national bank has a continuing and affirmative obligation consistent with its safe and sound operation to help meet the credit needs of its entire community, including low and moderate income neighborhoods. The CRA does not establish specific lending requirements or programs for financial institutions nor does it limit an institution’s discretion to develop the types of products and services that it believes are best suited to its particular community, consistent with the CRA. The CRA requires the OCC, in connection with its examination of a national bank, to assess the bank’s record of meeting the credit needs of its community and to take such record into account in its evaluation of certain applications by such bank.

12

USA PATRIOT Act

In response to the events of September 11, 2001, the

The Uniting and Strengthening America by Providing Appropriate Tools Required to Intercept and Obstruct Terrorism Act of 2001 (the “USA PATRIOT Act”), was signed into law on October 26, 2001. The USA PATRIOT Act gives the federal government powers to address terrorist threats through domestic security measures, surveillance powers, information sharing, and anti-money laundering requirements. By way of amendments to the Bank Secrecy Act, the USA PATRIOT Act encourages information sharinginformation-sharing among bank regulatory agencies and law enforcement bodies. Further, certain provisions of the USA PATRIOT Act impose affirmative obligations on a broad range of financial institutions, including banks, thrifts,thrift institutions, brokers, dealers, credit unions, money transfer agents and parties registered under the Commodity Exchange Act.

Among other requirements, the USA PATRIOT Act imposes the following requirements with respect to financial institutions:

All financial institutions must establish anti-money laundering programs that include, at a minimum: (i) internal policies, procedures, and controls; (ii) specific designation of an anti-money laundering compliance officer; (iii) ongoing employee training programs; and (iv) an independent audit function to test the anti-money laundering program.
·All financial institutions must establish anti-money laundering programs that include, at a minimum: (i) internal policies, procedures, and controls; (ii) specific designation of an anti-money laundering compliance officer; (iii) ongoing employee training programs; and (iv) an independent audit function to test the anti-money laundering program.
·The Secretary of the Department of Treasury, in conjunction with other bank regulators, is authorized to issue regulations that provide for minimum standards with respect to customer identification at the time new accounts are opened.
·Financial institutions that establish, maintain, administer, or manage private banking accounts or correspondent accounts in the United States for non-United States persons or their representatives (including foreign individuals visiting the United States) are required to establish appropriate, specific and, where necessary, enhanced due diligence policies, procedures, and controls designed to detect and report money laundering.
·Financial institutions are prohibited from establishing, maintaining, administering or managing correspondent accounts for foreign shell banks (foreign banks that do not have a physical presence in any country), and will be subject to certain record keeping obligations with respect to correspondent accounts of foreign banks.
·Bank regulators are directed to consider a holding company’s effectiveness in combating money laundering when ruling on Federal Reserve Act and Bank Merger Act applications.
Financial institutions that establish, maintain, administer, or manage private banking accounts or correspondence accounts in the United States for non-United States persons or their representatives (including foreign individuals visiting the United States) are required to establish appropriate, specific and, where necessary, enhanced due diligence policies, procedures, and controls designed to detect and report money laundering.
Financial institutions are prohibited from establishing, maintaining, administering or managing correspondent accounts for foreign shell banks (foreign banks that do not have a physical presence in any country), and will be subject to certain record keeping obligations with respect to correspondent accounts of foreign banks.
Bank regulators are directed to consider a holding company’s effectiveness in combating money laundering when ruling on Federal Reserve Act and Bank Merger Act applications.

The United States Treasury Department has issued a number of implementing regulations which address various requirements of the USA PATRIOT Act and are applicable to financial institutions such as the Bank. These regulations impose obligations on financial institutions to maintain appropriate policies, procedures and controls to detect, prevent and report money laundering and terrorist financing and to verify the identity of their customers.

Sarbanes-Oxley Act of 2002

The stated goals of the Sarbanes-Oxley Act of 2002 (the “SOA”) arewere to increase corporate responsibility, to provide for enhanced penalties for accounting and auditing improprieties by publicly traded companies and to protect investors by improving the accuracy and reliability of corporate disclosures pursuant to the securities laws.


TABLE OF CONTENTS

The SOA generally applies to all companies, both U.S. and non-U.S., that file or are required to file periodic reports with the Securities and Exchange Commission (the “SEC”) under the Securities Exchange Act of 1934 (the “Exchange Act”).

The SOA includes specific disclosure requirements and corporate governance rules, requires the SEC and securities exchanges to adopt extensive additional disclosure, corporate governance and other related rules and mandates further studies of certain issues by the SEC. The SOA addresses, among other matters:

Audit committees for all reporting companies;
Certification
TARP and SBLF
In January 2009, the Parent Corporation issued $10.0 million of certain publicly filed documents by the chief executive officer and the chief financial officer;
The forfeiture of bonuses or other incentive-based compensation and profits from the sale of an issuer’s securities by directors andits nonvoting non-convertible senior officers in the twelve month period following initial publication of financial statements that later require restatement;
A prohibition on insider trading during pension plan black out periods;
Disclosure of off-balance sheet transactions;
A prohibition on personal loans to directors and officers (subject to certain exceptions, including exceptions which permit under certain circumstances described below, loans by financial institutions to their directors and officers);
Expedited filing requirements for Form 4’s;
Disclosure of a code of ethics and filing a Form 8-K for a change in or waiver of such code;
“Real time” filing of periodic reports;
The formation of a public accounting oversight board;
Auditor independence; and
Various increased criminal penalties for violations of securities laws.

Legislation Implemented in Response to Periods of Economic Turmoil

In response to recent unprecedented market turmoil, EESA was enacted on October 3, 2008. EESA authorizes the U.S. Treasury Departmentpreferred stock (the “treasury”“TARP Preferred Stock”) to provide upthe United States Treasury pursuant to $700 billion in funding for the financial services industry. Pursuant to the EESA, the Treasury was initially authorized to use $350 billion for theCongress’ Troubled Asset Relief Program (“TARP”). Of this amount,

13

On September 15, 2011, the Parent Corporation entered into and consummated the transactions contemplated by a Securities Purchase Agreement (the “Securities Purchase Agreement”) with the Secretary of the Treasury allocated $250(the “Secretary”) under the Small Business Lending Fund program (the “SBLF Program”), a $30 billion fund established under the Small Business Jobs Act of 2010 that is designed to encourage lending to small businesses by providing capital to qualified community banks with assets of less than $10 billion. Under the Securities Purchase Agreement, the Parent Corporation issued to the Secretary a total of 11,250 shares of the Parent Corporation’s Senior Non-Cumulative Perpetual Preferred Stock, Series B (the “SBLF Preferred Stock”), having a liquidation value of $1,000 per share, for a total purchase price of $11,250,000. The SBLF Preferred Stock was issued pursuant to a Certificate of Amendment to the Parent Corporation’s Certificate of Incorporation (the “Certificate of Amendment”) filed on September 13, 2011.
The SBLF Preferred Stock qualifies as Tier 1 capital. Non-cumulative dividends are payable quarterly on January 1, April 1, July 1 and October 1 for the SBLF Preferred Stock, commencing on January 1, 2012. The dividend rate is calculated as a percentage of the aggregate liquidation value of the outstanding SBLF Preferred Stock and is based on changes in the level of “Qualified Small Business Lending” or “QSBL” (as defined in the Certificate of Amendment) by the Bank, compared to the Bank’s baseline QSBL level. Based upon the Bank’s initial level of QSBL compared to the baseline, as calculated under the Securities Purchase Agreement, the dividend rate on the SBLF Preferred Stock was set at five percent for the initial dividend period.
For the second through tenth calendar quarters after the closing of the SBLF Program transaction, the dividend rate will fluctuate between one percent and five percent to reflect the amount of change in the Bank’s level of QSBL compared to the initial baseline. More specifically, if the Bank’s QSBL at the end of a quarter has increased as compared to the baseline, then the dividend rate payable on the SBLF Preferred Stock would change as follows:
Relative Increase in QSBL to Baseline
Dividend Rate
(for each of the 2
nd – 10th Dividend Periods)
0% or less5%
More than 0%, but less than 2.5%5%
2.5% or more, but less than 5%4%
5% or more, but less than 7.5%3%
7.5% or more, but less than 10%2%
10% or more1%
From the eleventh through the eighteenth calendar quarters and that portion of the nineteenth calendar quarter which ends immediately prior to the date that is the four and one half years anniversary of the closing of the SBLF Program transaction, the dividend rate on the SBLF Preferred Stock will be fixed at between one percent and seven percent based on the level of QSBL at that time, as compared to the baseline in accordance with the chart below. If any SBLF Preferred Stock remains outstanding after four and one half years following the closing of the SBLF Program transaction, the dividend rate will increase to nine percent.
0% or less7%
More than 0%, but less than 2.5%5%
2.5% or more, but less than 5%4%
5% or more, but less than 7.5%3%
7.5% or more, but less than 10%2%
10% or more1%
The SBLF Preferred Stock is non-voting, except in limited circumstances that could impact the SBLF investment, such as (i) authorization of senior stock, (ii) charter amendments adversely affecting the SBLF Preferred Stock and (iii) extraordinary transactions such as mergers, asset sales, share exchanges and the like (unless the SBLF Preferred Stock remains outstanding and the rights and preferences thereof are not impaired by such transaction).
14

In the event the Parent Corporation misses five dividend payments, whether or not consecutive, the holder of the SBLF Preferred Stock will have the right, but not the obligation, to appoint a representative as an “observer” on the Parent Corporation’s Board of Directors.
Further, the SBLF Preferred Stock may be redeemed by the Parent Corporation at any time, at a redemption price of 100% of the liquidation amount plus accrued but unpaid dividends for the then current Dividend Period (as defined in the Certificate of Amendment) (plus, the CPP Lending Incentive Fees (as defined in the Certificate of Amendment), if applicable), subject to the approval of the Parent Corporation’s federal banking regulator.
The SBLF Preferred Stock is not subject to any contractual restrictions on transfer and thus the Secretary may sell, transfer, exchange or enter into other transactions with respect to the SBLF Preferred Stock without the Parent Corporation’s consent.
The Parent Corporation used the proceeds from the issuance of the SBLF Preferred to redeem from the Treasury all shares issued by the Parent Corporation pursuant to TARP, for a redemption price of $10,041,667, including accrued but unpaid dividends up to the date of redemption. As a result of the redemption of the TARP Preferred Stock, the Parent Corporation ceased to be subject to the limits on executive compensation and other restrictions stipulated under the TARP Capital Purchase Program. On January 15, 2009, the second $350 billion of TARP monies was released to the Treasury. As described elsewhere in this Annual Report on Form 10-K, the Treasury purchased $10,000,000 ofFor an additional $245,000, the Parent Corporation’s non-convertible preferred stock (the “Preferred Shares”)Corporation also bought back the warrants issued under the TARP Capital Purchase Program.

Participants in the TARP Capital Purchase Program were required to accept several compensation-related limitations associated with this Program. In January 2009, five executive officers of the Corporation agreed in writing to accept the compensation standards in existence at that time under the Capital Purchase Program and thereby cap or eliminate some of their contractual or legal rights. The provisions agreed to were as follows:

No Golden Parachute Payments.  The term “golden parachute payment” under the TARP Capital Purchase Program (as distinguished from the definition under the Stimulus Act referred to below) refers to a severance payment resulting from involuntary termination of employment, or from bankruptcy of the employer, that exceeds three times the terminated employee’s average annual base salary over the five years prior to termination. The Corporation’s senior executive officers have agreed to forego all golden parachute payments for as long as they remain “senior executive officers” (the CEO, the CFO and the next three highest-paid executive officers) of the Corporation and the Treasury continues to hold the equity or debt securities that the Parent Corporation issued to it under the TARP Capital Purchase Program (the period during which the Treasury holds those securities is referred to herein as the “CPP Covered Period.”).
TARP.

Proposed Legislation
 

TABLE OF CONTENTS

Clawback of Bonus and Incentive Compensation if Based on Certain Material Inaccuracies.  Our senior executive officers agreed to a “clawback provision”. Any bonus or incentive compensation paid to them during the CPP Covered Period is subject to recovery or “clawback” by the Corporation if the payments were based on materially inaccurate financial statements or any other materially inaccurate performance metric criteria. The senior executive officers acknowledged that each of the Corporation’s compensation, bonus, incentive and other benefit plans, arrangements and agreements (including golden parachute, severance and employment agreements) (collectively, “Benefit Plans”) with respect to them was deemed amended to the extent necessary to give effect to such clawback and the restriction on golden parachute payments.
No Compensation Arrangements That Encourage Excessive Risks.  The Corporation is required to review its Benefit Plans to ensure that they do not encourage senior executive officers to take unnecessary and excessive risks that threaten the value of the Corporation. To the extent any such review requires revisions to any Benefit Plan with respect to the senior executive officers, they agreed to negotiate such changes promptly and in good faith.

During the CPP Covered Period, the Corporation is not permitted to take federal income tax deductions for compensation paid to the senior executive officers in excess of $500,000 per year, subject to certain exceptions.

On February 17, 2009, the American Recovery and Reinvestment Act of 2009 (the “Stimulus Act”) was enacted. The Stimulus Act contains several provisions designed to establish executive compensation and governance standards for financial institutions (such as the Corporation) that received or will receive financial assistance under TARP. In certain instances, the Stimulus Act modified the compensation-related limitations contained in the TARP Capital Purchase Program; in addition, the Stimulus Act created additional compensation-related limitations and directed the Treasury to establish standards for executive compensation applicable to participants in TARP. In their January 2009 agreements, the Corporation’s executives did not waive their rights with respect to the provisions implemented by the Stimulus Act; other employees now covered by these provisions were not asked and did not agree to waive their rights. The compensation-related limitations applicable to the Corporation which have been added or modified by the Stimulus Act are as follows, which provisions are expected to be included in standards established by the Treasury:

No Severance Payments.  Under the Stimulus Act, the term “golden parachutes” is defined to include any severance payment resulting from involuntary termination of employment, except for payments for services performed or benefits accrued. Under the Stimulus Act, the Corporation is prohibited from making any severance payment to its “senior executive officers” (defined in the Stimulus Act as the five highest paid senior executive officers) and the Corporation’s next five most highly compensated employees during the period that the Preferred Shares are outstanding.
Recovery of Incentive Compensation if Based on Certain Material Inaccuracies.  The Stimulus Act contains the “clawback provision” discussed above but extends its application to any bonus awards and other incentive compensation paid to any of the Corporation’s senior executive officers and the next 20 most highly compensated employees during the period that the Preferred Shares are outstanding that is later found to have been based on materially inaccurate financial statements or other materially inaccurate measurements of performance.
No Compensation Arrangements That Encourage Earnings Manipulation.  Under the Stimulus Act, during the period that the Preferred Shares are outstanding, the Corporation is prohibited from entering into compensation arrangements that encourage manipulation of the reported earnings of the Corporation to enhance the compensation of any of the Corporation’s employees.
Limit on Incentive Compensation.  The Stimulus Act contains a provision that prohibits the payment or accrual of any bonus, retention award or incentive compensation to the Corporation’s highest paid employee while the Preferred Shares are outstanding other than awards of long-term restricted stock that (i) do not fully vest while the Preferred Shares are outstanding, (ii) have a value not greater

TABLE OF CONTENTS

than one-third of the total annual compensation of such employee and (iii) are subject to such other restrictions as will be determined by the Treasury. The prohibition on bonuses does not preclude payments required under written employment contracts entered into on or prior to February 11, 2009.
Compensation Committee Functions.  The Stimulus Act requires that the Parent Corporation’s Compensation Committee be comprised solely of independent directors and that it meet at least semiannually to discuss and evaluate the Corporation’s employee compensation plans in light of an assessment of any risk posed to the Corporation from such compensation plans.
Compliance Certifications.  The Stimulus Act requires an annual written certification by the Parent Corporation’s chief executive officer and chief financial officer with respect to the Corporation’s compliance with the provisions of the Stimulus Act.
Treasury Review of Excessive Bonuses Previously Paid.  The Stimulus Act directs the Treasury to review all compensation paid to the Corporation’s senior executive officers and its next 20 most highly compensated employees to determine whether any such payments were inconsistent with the purposes of the Stimulus Act or were otherwise contrary to the public interest. If the Treasury makes such a finding, the Treasury is directed to negotiate with the Parent Corporation and the applicable employee for appropriate reimbursements to the federal government with respect to the compensation and bonuses.
Say on Pay.  Under the Stimulus Act, the Corporation is required to have an advisory “say on pay vote” by the shareholders on executive compensation at the Corporation’s shareholder meetings during the period that the Preferred Shares are outstanding. This requirement will apply to the Corporation’s 2011 annual meeting of shareholders.

Recent Regulatory Reform-The Dodd-Frank Act

The Dodd-Frank Act, which was signed into law on July 21, 2010, will have a broad impact on the financial services industry, including significant regulatory and compliance changes. Many of the requirements called for in the Dodd-Frank Act will be implemented over time and most will be subject to implementing regulations over the course of several years.

Among other things, the Dodd-Frank Act:

eliminates, effective one year after the date of enactment, the federal prohibitions on paying interest on demand deposits, thus allowing businesses to have interest bearing checking accounts. Depending on competitive responses, this significant change to existing law could have an adverse impact on the Bank’s interest expense.
broadens the base for FDIC insurance assessments. Assessments will now be based on the average consolidated total assets less tangible equity capital of a financial institution.
permanently increases the maximum amount of deposit insurance for banks, savings institutions and credit unions to $250,000 per depositor, retroactive to January 1, 2009, and non-interest bearing transaction accounts have unlimited deposit insurance through December 31, 2013.
requires publicly traded companies like Center Bancorp to give shareholders a non-binding vote on executive compensation and so-called “golden parachute” payments in certain circumstances, even after repayment of the TARP investment.
authorizes the SEC to promulgate rules that would allow stockholders to nominate their own candidates using a company’s proxy materials.
directs the Federal Reserve Board to promulgate rules prohibiting the payment of excessive compensation to bank holding company executives.
creates a new Consumer Financial Protection Bureau with broad powers to supervise and enforce consumer protection laws. The Consumer Financial Protection Bureau has broad rule-making authority for a wide range of consumer protection laws that apply to all banks and savings

TABLE OF CONTENTS

institutions, including the authority to prohibit “unfair, deceptive or abusive” acts and practices. The Consumer Financial Protection Bureau has examination and enforcement authority over all banks and savings institutions with more than $10 billion in assets. Institutions with $10 billion or less in assets, such as the Bank, will continue to be examined for compliance with the consumer laws by their primary bank regulators.
restricts the preemption of state consumer financial protection law by federal law.
requires new capital rules and the application of the same leverage and risk-based capital requirements that apply to insured depository institutions to most bank holding companies. In addition to making bank holding companies subject to the same capital requirements as their bank subsidiaries, these provisions (often referred to as the Collins Amendment to the Dodd-Frank Act) were also intended to eliminate or significantly reduce the use of hybrid capital instruments, especially trust preferred securities, as regulatory capital. Under the Collins Amendment, trust preferred securities issued by a bank holding company such as Center Bancorp (with total consolidated assets between $500 million and $15 billion) before May 19, 2010 and treated as regulatory capital are grandfathered, but any such securities issued later are not eligible as regulatory capital.
requires banking regulators to seek to make capital standards countercyclical, so that the required levels of capital increase in times of economic expansion and decrease in times of economic contraction.
allowsde novo interstate branching by banks.

While it is difficult to predict at this time what specific impact the Dodd-Frank Act and the yet to be written implementing rules and regulations will have on the Corporation, management expects that at a minimum the Corporation’s operating and compliance costs will increase, and our interest expense could increase.

Proposed Legislation

From time to time proposals are made in the U.S. Congress and before various bank regulatory authorities, which would alter the policies of and place restrictions on different types of banking operations. It is impossible to predict the impact, if any, of potential legislative trends on the business of the Parent Corporation and the Bank.

Loans to Related Parties

The Corporation’s authority to extend credit to its directors and executive officers, as well as to entities controlled by such persons, is currently governed by the requirements of the National Bank Act, the Sarbanes-Oxley Act of 2002 and Regulation O of the Federal Reserve Bank. Among other things, these provisions require that extensions of credit to insiders (i) be made on terms that are substantially the same as, and follow credit underwriting procedures that are not less stringent than, those prevailing for comparable transactions with unaffiliated persons and that do not involve more than the normal risk of repayment or present other unfavorable features and (ii) not exceed certain limitations on the amount of credit extended to such persons, individually and in the aggregate, which limits are based, in part, on the amount of the Corporation’s capital. In addition, the Corporation’s Board of Directors must approve extensions of credit in excess of certain limits. Under the SOA, the Corporation and its subsidiaries, other than Union Center National Bank, may not extend or arrange for any personal loans to its directors and executive officers.

Dividend Restrictions

The Parent Corporation is a legal entity separate and distinct from the Bank. Virtually all of the revenue of the Parent Corporation available for payment of dividends on its capital stock will result from amounts paid to the Parent Corporation by the Bank. All such dividends are subject to various limitations imposed by federal laws and by regulations and policies adopted by federal regulatory agencies. As a national bank, the Bank may not pay a dividend if it would impair the capital of the Bank. Furthermore, prior approval by the Comptroller of the Currency is required if the total of dividends declared in a calendar year exceeds the total


TABLE OF CONTENTS

of the Bank’s net profits for that year combined with the retained profits for the two preceding years. The Bank’s current MOU provides that the Bank cannot declare a dividend without the prior approval of the OCC.

On January 9, 2009, as part of the TARP Capital Purchase Program, the Parent Corporation entered into a Letter Agreement (the “Letter Agreement”) and a Securities Purchase Agreement — Standard Terms attached thereto (the “Securities Purchase Agreement”) with the Treasury, pursuant to which (i)September 15, 2011, the Parent Corporation issued and sold, and$11.25 million in nonvoting senior preferred stock to the Treasury purchased, 10,000under the SBLF Program. Under the Securities Purchase Agreement, the Parent Corporation issued to the Treasury a total of 11,250 shares of the Corporation’s Senior Non-Cumulative Perpetual Preferred Stock, Series B, having a liquidation value of $1,000 per share. Simultaneously, using the proceeds from the issuance of the SBLF Preferred Stock, the Parent Corporation’sCorporation redeemed from the Treasury, all 10,000 outstanding shares of its Fixed Rate Cumulative Perpetual Preferred Stock, Series A, having a liquidation preference ofamount $1,000 per share, for an aggregate purchasea redemption price of $10,000,000 in cash, and (ii) the Parent Corporation issued$10,041,667, including accrued but unpaid dividends up to the Treasury a ten-year warrant (the “Warrant”) to purchase up to 173,410 sharesdate of redemption.
15

The terms of the Corporation’s common stock at an exercise price of $8.65 per share. As a result of the successful completion ofSBLF Preferred Stock impose limits on the Parent Corporation’s rights offering in October 2009, the number of shares underlying the Warrant was reducedability to 86,705 shares, or 50% of the original 173,410 shares. The Securities Purchase Agreement contains limitations on the payment ofpay dividends on the common stock. Specifically, the Parent Corporation is unable to declare dividend payments on theand repurchase shares of its common stock (and certain preferred stock if the Corporation issues additional series of preferred stock)and other securities. More specifically, if the Parent Corporation is in arrears in the payment offails to declare and pay dividends on the SBLF Preferred Shares. Further, untilStock in a given quarter, then during such quarter and for the third anniversary of the investment or when all of the Preferred Shares have been redeemed or transferred,next three quarters following such missed dividend payment, the Parent Corporation ismay not permittedpay dividends on, or repurchase, any common stock or any other securities that are junior to increase(or in parity with) the amountSBLF Preferred Stock, except in very limited circumstances.
Also under the terms of the quarterly cash dividend above $0.09 per share, which was the amount of the last regular dividend declared bySBLF Preferred Stock, the Parent Corporation priormay declare and pay dividends on its common stock or any other stock junior to October 14, 2008.

the SBLF Preferred Stock, or repurchase shares of any such stock, only if after payment of such dividends or repurchase of such shares, the Parent Corporation’s Tier 1 Capital would be at least equal to the so-called Tier 1 Dividend Threshold, excluding any subsequent net charge-offs and any redemption of the SBLF Preferred Stock.

If, in the opinion of the OCC, a bank under its jurisdiction is engaged in or is about to engage in an unsafe or unsound practice (which could include the payment of dividends), the OCC may require, after notice and hearing, that such bank cease and desist from such practice or, as a result of an unrelated practice, require the bank to limit dividends in the future. The FRB has similar authority with respect to bank holding companies. In addition, the FRB and the OCC have issued policy statements which provide that insured banks and bank holding companies should generally only pay dividends out of current operating earnings. Regulatory pressures to reclassify and charge off loans and to establish additional loan loss reserves can have the effect of reducing current operating earnings and thus impacting an institution’s ability to pay dividends. Further, as described herein, the regulatory authorities have established guidelines with respect to the maintenance of appropriate levels of capital by a bank or bank holding company under their jurisdiction. Compliance with the standards set forth in these policy statements and guidelines could limit the amount of dividends which the Parent Corporation and the Bank may pay. Under FDICIA, banking institutions which are deemed to be “undercapitalized” will, in most instances, be prohibited from paying dividends.

Lending Guidelines; Real Estate Credit Management

Credit risks are an inherent part of the lending function. The Corporation has set in place specific policies and guidelines to limit credit risks. The following describes the Corporation’s credit management policy and identifies certain risk elements in its earning assets portfolio.

Credit Management

The maintenance of comprehensive and effective credit policies is a paramount objective of the Corporation. Credit procedures are enforced by the department heads of the different lending units and are maintained at the senior administrative level as well as through internal control procedures.

Prior to extending credit, the Corporation’s credit policy generally requires a review of the borrower’s credit history, repayment capacity, collateral and purpose of each loan. Requests for most commercial and consumer loans are to be accompanied by financial statements and other relevant financial data for evaluation. After the granting of a loan or lending commitment, this financial data is typically updated and evaluated by the credit staff on a periodic basis for the purpose of identifying potential problems. Construction financing requires a periodic submission by the borrowers of sales/leasing status reports regarding their projects, as well as, in most cases, inspections of the project sites by independent engineering firms and/or independent consultants. Advances are normally made only upon the satisfactory completion of periodic phases of construction.


TABLE OF CONTENTS

Certain lending authorities are granted to loan officers based upon each officer’s position and experience. However, large dollar loans and lending lines are reported to and are subject to the approval of the Bank’s loan committees and/or board of directors. Either the Chairman of the Board or President chairs the loan committees.

16

The Corporation has established its own internal loan-to-value (“LTV”) limits for real estate loans. In general, except as described below, these internal limits are not permitted to exceed the following supervisory limits:

Loan Category Loan-to-Value

Limit
Raw Land 65%
Land Development 75%
Commercial, Multifamily and Other Non-residential construction 80%
Construction: One to Four Family Residential 85%
Improved Property (excluding One to Four Family Residential) 85%
Owner-Occupied One to Four Family and Home Equity* 90%

*For a permanent mortgage or home equity loan on owner occupied one to four family residential property with ana LTV that exceeds 90 percent at origination, private mortgage insurance or readily marketable collateral is to be obtained. “Readily marketable collateral” means insured deposits, financial instruments and bullion in which the bankBank has a perfected interest. Financial instruments and bullion are to be salable under ordinary circumstances with reasonable promptness at a fair market value.

It may be appropriate in individual cases to originate loans with loan-to-value ratios in excess of the supervisory LTV limits, based on support provided by other credit factors. The President of the Bank must approve such non-conforming loans. The Bank must identify all non-conforming loans and their aggregate amount must be reported at least quarterly to the Directors’ Loan Committee. Non-conforming loans should not exceed 100% of capital, or 30% with respect to non one to four family residential loans. At present, management is unaware of any exceptions to supervisory LTV limits.

Collateral margin guidelines are based on cost, market or other appraised value to maintain a reasonable amount of collateral protection in relation to the inherent risk in the loan. This does not mitigate the fundamental analysis of cash flow from the conversion of assets in the normal course of business or from operations to repay the loan. It is merely designed to provide a cushion to minimize the risk of loss if the ultimate collection of the loan becomes dependent on the liquidation of security pledged.

The Corporation also seeks to minimize lending risk through loan diversification. The composition of the Corporation’s commercial loan portfolio reflects and is highly dependent upon the economy and industrial make-up of the region it serves. Effective loan diversification spreads risk to many different industries, thereby reducing the impact of downturns in any specific industry on overall loan profitability.

Credit quality is monitored through an internal review process, which includes a credit Risk Grading System that facilitates the early detection of problem loans. Under this grading system, all commercial loans and commercial mortgage loans are graded in accordance with the risk characteristics inherent in each loan. Problem loans include non-accrual loans, and loans which conform to the regulatory definitions of criticized and classified loans.

A Problem Asset Report is prepared monthly and is examined by the senior management of the Bank, the Corporation’s Loan and Discount Committee and the Board of Directors. This review is designed to enable management to take such actions as are considered necessary to identify and remedy problems on a timely basis.

The Bank’s internal loan review process is complemented by an independent loan review conducted throughout the year, under the mandate and approval of the Corporation’s Board of Directors. In addition, regularly scheduled audits performed by the Bank’s internal audit function are designed to ensure the integrity of the credit and risk monitoring systems currently in place.


Risk Elements
 

TABLE OF CONTENTS

Risk Elements

The risk elements identified by the Corporation include non-performing loans, loans past due ninety days or more as to interest or principal payments but not placed on a non-accrual status, potential problem loans, other real estate owned, net, and other non-performing interest-earning assets.

Additional information regarding these risk elements is presented in Item 7 of this Annual Report.

17

Item 1A. Risk Factors

An investment in our common stock involves risks. Stockholders should carefully consider the risks described below, together with all other information contained in this Annual Report on Form 10-K, before making any purchase or sale decisions regarding our common stock. If any of the following risks actually occur, our business, financial condition or operating results may be harmed. In that case, the trading price of our common stock may decline, and stockholders may lose part or all of their investment in our common stock.

We are required to take certain actions pursuant to our current MOU with the OCC, and lack of compliance could result in additional regulatory actions.

As described under “Item 1 — Business — Regulation of Bank Subsidiary,” the Bank is subject to a MOU with the OCC, pursuantstringent capital requirements which could require us to which it has agreedseek capital at times when capital may be expensive or unavailable to take various actions to improve the Bank’s capital position and profitability. The OCC has also established higher minimum capital ratios for the Bank than the regulatory minimums. While management is committed to addressing and resolving the issues raised by the OCC and has initiated corrective actions to comply with various requirements of the MOU, no assurances can be given that the OCC will find the Bank’s compliance plan satisfactory, or that the Bank will not be subject to further supervisory action by the OCC. us.

We may at some point needbe required to raise additional capital to assure compliance with mandated capital ratios, including new capital requirements adopted by federal banking regulators in July 2013 and described under “Business-Supervision and Regulation-New Capital Rules,” and to support our continued growth. We will be required to meet new capital requirements beginning on January 1, 2015. In addition, beginning in 2016, banks and bank holding companies will be required to maintain a capital conservation buffer on top of minimum risk-weighted asset ratios. When fully phased in on January 1, 2019, the capital conservation buffer will be 2.5%. Banking institutions which do not maintain capital in excess of the capital conservation buffer will face constraints on the payment of dividends, equity repurchases and compensation based on the amount of the shortfall. Accordingly, if the Bank fails to maintain the applicable minimum capital ratios and the capital conservation buffer, distributions to the Parent Corporation may be prohibited or limited.
Our ability to raise additional capital, if needed, will depend on conditions in the capital markets at that time, which are outside our control, and on our financial performance. Accordingly, we cannot assure you of our ability to raise additional capital, if needed, on terms acceptable to us. If we cannot raise additional capital when needed, our ability to comply with applicable capital requirements and to further expand our operations through internal growth or acquisitions could be materially impaired.

Negative developments in the financial services industry and U.S. and global credit markets in recent years may continue to adversely impact our operations and results.

The general economic downturn experienced duringthat began in 2008 2009 and portions of 2010continued for several years thereafter negatively impacted many financial institutions, including the Company.Corporation. Loan portfolio performances deteriorated at many institutions resulting from, among other factors, a weak economy and a decline in the value of the collateral supporting their loans. The competition for our deposits increased significantly due to liquidity concerns at many of these same institutions. Stock prices of bank holding companies, like ours, were negatively affected by the condition of the financial markets, as was our ability, if needed, to raise capital or borrow in the debt markets compared to recent years.prior periods. While the United States Congress has takentook actions to implement important safeguards, there remains a potential for new federal or state laws and regulations regarding lending and funding practices and liquidity standards, and financial institution regulatory agencies are expected to be very aggressive in responding to concerns and trends identified in examinations, including the issuance of many formal enforcement actions. Negative developments in the financial services industry and the impact of new legislation in response to those developments could negatively impact our operations by restricting our business operations, including our ability to originate or sell loans, and adversely impact our financial performance. A worsening of these conditions would likely exacerbate the adverse effects of these difficult market conditions on us and others in the financial institutions industry. In particular, we may face the following risks in connection with these events:

we potentially face increased regulation of our industry and compliance with such regulation may increase our costs and limit our ability to pursue business opportunities;
customer demand for loans secured by real estate could be reduced due to weaker economic conditions, an increase in unemployment, a decrease in real estate values or an increase in interest rates;

 
·we potentially face increased regulation of our industry and compliance with such regulation may increase our costs and limit our ability to pursue business opportunities;

TABLE OF CONTENTS

·customer demand for loans secured by real estate could be reduced due to weaker economic conditions, an increase in unemployment, a decrease in real estate values or an increase in interest rates;
·the process we use to estimate losses inherent in our credit exposure requires difficult, subjective and complex judgments, including forecasts of economic conditions and how these economic conditions might impair the ability of our borrowers to repay their loans;
·the level of uncertainty concerning economic conditions may adversely affect the accuracy of our estimates which may, in turn, impact the reliability of the process;
·the value of the portfolio of investment securities that we hold may be adversely affected; and
18

In addition, the possibility that certain European Union (“EU”) member states may default on their debt obligations have negatively impacted economic conditions and how theseglobal markets. The continued uncertainty over the outcome of international and the EU’s financial support programs and the possibility that other EU member states may experience similar financial troubles could further disrupt global markets. The negative impact on economic conditions might impair the abilityand global markets could also have a material adverse effect on our liquidity, financial condition and results of our borrowers to repay their loans; the level of uncertainty concerning economic conditions may adversely affect the accuracy of our estimates which may, in turn, impact the reliability of the process;operations.
the value of the portfolio of investment securities that we hold may be adversely affected; and
we may be required to pay significantly higher FDIC premiums because market developments have significantly depleted the insurance fund of the FDIC and reduced the ratio of reserves to insured deposits.

We are subject to interest rate risk and variations in interest rates may negatively impact our financial performance.

We are unable to predict actual fluctuations of market interest rates with complete accuracy. Rate fluctuations are affected by many factors, including:

inflation;
·inflation;
·recession;
·a rise in unemployment;
·tightening money supply; and
·domestic and international disorder and instability in domestic and foreign financial markets, among other things.
a rise in unemployment;
tightening money supply; and
domestic and international disorder and instability in domestic and foreign financial markets.

Changes in the interest rate environment may reduce profits. We expect that we will continue to realize income from the differential or “spread” between the interest we earn on loans, securities and other interest-earning assets, and the interest we pay on deposits, borrowings and other interest-bearing liabilities. Net interest spreads are affected by the difference between the maturities and repricing characteristics of interest-earning assets and interest-bearing liabilities. Changes in levels of market interest rates could materially and adversely affect our net interest spread, asset quality, levels of prepayments and cash flows as well as the market value of our securities portfolio and overall profitability.

The downgrade of the U.S. credit rating could have a material adverse effect on our business, financial condition and liquidity.
Standard & Poor’s lowered its long term sovereign credit rating on the United States of America from AAA to AA+ on August 5, 2011. A further downgrade or a downgrade by other rating agencies could have a material adverse impact on financial markets and economic conditions in the United States and worldwide. Any such adverse impact could have a material adverse effect on our liquidity, financial condition and results of operations. Many of our investment securities are issued by U.S. government agencies and U.S. government sponsored entities.
The Federal Reserve’s repeal of the prohibition against payment of interest on demand deposits may increase competition for such deposits and ultimately increase interest expense.
A major portion of our net income comes from our interest rate spread, which is the difference between the interest rates paid by us on amounts used to fund assets and the interest rates and fees we receive on our interest-earning assets. In July 2011, Regulation Q, which had prohibited the payment of interest on demand deposits by institutions that are member banks of the Federal Reserve System, was repealed. As a result, member banks and thrifts are now permitted to offer interest-bearing demand deposit accounts to commercial customers, which could result in increased competition from other financial institutions for these deposits and could result in an increase in our interest expense.
External factors, many of which we cannot control, may result in liquidity concerns for us.

Liquidity risk is the potential that Union Center Nationalthe Bank may be unable to meet its obligations as they come due, capitalize on growth opportunities as they arise, or pay regular dividends because of an inability to liquidate assets or obtain adequate funding in a timely basis, at a reasonable cost and within acceptable risk tolerances.

19

Liquidity is required to fund various obligations, including credit commitments to borrowers, mortgage and other loan originations, withdrawals by depositors, repayment of borrowings, operating expenses, capital expenditures and dividend payments to shareholders.

Liquidity is derived primarily from deposit growth and retention; principal and interest payments on loans; principal and interest payments on investment securities; sale, maturity and prepayment of investment securities; net cash provided from operations, and access to other funding sources.

Our access to funding sources in amounts adequate to finance our activities could be impaired by factors that affect us specifically or the financial services industry in general. Factors that could detrimentally impact our access to liquidity sources include a decrease in the level of our business activity due to market factors or an adverse regulatory action against us. Our ability to borrow could also be impaired by factors that are not specific to us, such as a severe disruption of the financial markets or negative views and expectations about the prospects for the financial services industry as a whole as the turmoil faced by banking organizations in the domestic and worldwide credit markets continues.whole. Over the last several years, the financial services industry and the credit markets generally have been materially and adversely affected by significant declines in asset values and by a lack of liquidity. The liquidity issues have been particularly acute for regional and community banks, as many of the larger financial institutions have significantly curtailed their lending to


TABLE OF CONTENTS

regional and community banks to reduce their exposure to the risks of other banks. In addition, many of the larger correspondent lenders have reduced or even eliminated federal funds lines for their correspondent customers. Furthermore, regional and community banks generally have less access to the capital markets than do the national and super-regional banks because of their smaller size and limited analyst coverage. Any decline in available funding could adversely impact our ability to originate loans, invest in securities, meet our expenses, or fulfill obligations such as repaying our borrowings or meeting deposit withdrawal demands, any of which could have a material adverse impact on our liquidity, business, results of operations and financial condition.

The extensive regulation and supervision to which we are subject impose substantial restrictions on our business.

Center Bancorp Inc., primarily through its principal subsidiary, Union Center National Bank, and certain non-bank subsidiaries, are subject to extensive regulation and supervision. Banking regulations are primarily intended to protect depositors’ funds, federal deposit insurance funds and the banking system as a whole. Such laws are not designed to protect our shareholders. These regulations affect our lending practices, capital structure, investment practices, dividend policy and growth, among other things. Union Center NationalThe Bank is also subject to a number of federal laws, which, among other things, require it to lend to various sectors of the economy and population, and establish and maintain comprehensive programs relating to anti-money laundering and customer identification. The United States Congress and federal regulatory agencies continually review banking laws, regulations and policies for possible changes, especially for the TARP Capital Purchase Program (in which the Parent Corporation is a participant).changes. Changes to statutes, regulations or regulatory policies, including changes in interpretation or implementation of statutes, regulations or policies, could affect us in substantial and unpredictable ways. Such changes could subject us to additional costs, limit the types of financial services and products we may offer and/or increase the ability of non-banks to offer competing financial services and products, among other things. Failure to comply with laws, regulations or policies could result in sanctions by regulatory agencies, civil money penalties and/or reputational damage, which could have a material adverse effect on our business, financial condition and results of operations.

Because of our participation in the U.S. Treasury’s Capital Purchase Program, we are subject to several restrictions, including restrictions on our ability to declare or pay dividends and repurchase our shares, as well as restrictions on our executive compensation.

As a result of our participation in the U.S. Treasury’s Capital Purchase Program, our ability to declare or pay dividends on any of our capital stock is subject to restrictions. Specifically, we are unable to declare dividend payments on common, junior preferred orpari passu preferred shares if we are in arrears in the payment of dividends on the Preferred Shares. Further, until the third anniversary of the investment or when all of the Preferred Shares have been redeemed or transferred, we are not permitted to increase the cash dividends on our common stock without the U.S. Treasury’s approval. Additionally, our ability to repurchase our shares of outstanding common stock is restricted. The U.S. Treasury’s consent generally is required for us to make any stock repurchase until the third anniversary of the investment by the U.S. Treasury unless all of the Preferred Shares have been redeemed or transferred. Further, common, junior preferred orpari passu preferred shares may not be repurchased if we are in arrears in the payment of dividends on the Preferred Shares. These restrictions, as well as the dilutive effect of the warrants that we issued to the U.S. Treasury as part of the Capital Purchase Program, may have a negative effect on the market price of our common stock.

Pursuant to the terms by which we participated in the U.S. Treasury’s Capital Purchase Agreement and the terms of the American Recovery and Reinvestment Act of 2009, we and several of our senior employees are subject to substantial limitations on executive compensation and are subject to corporate governance standards imposed pursuant to that Act. Such requirements may adversely affect our ability to attract and retain senior officers and employees who are critical to the operation of our business.

The documents that we executed with the U.S. Treasury when it purchased our Preferred Shares allow it to unilaterally change the terms of the Preferred Shares or impose additional requirements on the Corporation if there is a change in law. These changes or additional requirements could restrict our ability to conduct business, could subject us to additional cost and expense or could change the terms of the Preferred Shares to the detriment of our common shareholders. While it may be possible for us to redeem the Preferred Shares in


TABLE OF CONTENTS

the event that the U.S. Treasury imposes any changes or additional requirements that we believe are detrimental, there can be no assurances that our federal regulator will approve such redemption or that we will have the ability to implement such redemption, especially in light of regulatory requirements imposed upon financial institutions seeking to redeem TARP securities.

Current levels of volatility in the capital markets are unprecedented and may adversely impact our operations and results.

The capital markets have been experiencing unprecedented volatility for more than threeseveral years. Such negative developments and disruptions have resulted in uncertainty in the financial markets. Bank and bank holding company stock prices have been negatively affected, as has the ability of banks and bank holding companies to raise capital or borrow in the debt markets. If the capital markets compared to recent years. If current levels of market disruption and volatility continue or worsen,are volatile, there can be no assurance that we will not experience an adverse effect, which may be material, on our business, financial condition and results of operations or our ability to access capital.

20

We must effectively manage our credit risk.

There are risks inherent in making any loan, including risks inherent in dealing with particular borrowers, risks of nonpayment, risks resulting from uncertainties as to the future value of collateral and risks resulting from changes in economic and industry conditions. We attempt to minimize our credit risk through prudent loan application approval procedures, careful monitoring of the concentration of our loans within specific industries, a centralized credit administration department and periodic independent reviews of outstanding loans by our loan review department. However, we cannot assure you that such approval and monitoring procedures will reduce these credit risks.

Our loan portfolio includes commercial real estate loans, which involve risks specific to real estate value.

Commercial real estate and construction loans were $421.7$579.3 million, or approximately 59.5%60.3% of our total loan portfolio, as of December 31, 2010.2013. Many of these loans are extended to small and medium-sized businesses. The market value of real estate can fluctuate significantly in a short period of time as a result of market conditions in the geographic area in which the real estate is located. Although many such loans are secured by real estate as a secondary form of collateral, continued adverse developments affecting real estate values in our market area could increase the credit risk associated with our loan portfolio. Economic events or governmental regulations outside of the control of the borrower or lender could negatively impact the future cash flow and market values of the affected properties. If the loans that are collateralized by real estate become troubled and the value of the real estate has been significantly impaired, then we may not be able to recover the full contractual amount of principal and interest that we anticipated at the time of originating the loan, which could cause us to increase our provision for loan losses and adversely affect our operating results and financial condition.

We may incur impairmentsimpairment to goodwill.

We review our goodwill at least annually. Significant negative industry or economic trends, reduced estimates of future cash flows or disruptions to our business, could indicate that goodwill might be impaired. Our valuation methodology for assessing impairment requires management to make judgments and assumptions based on historical experience and to rely on projections of future operating performance. We operate in a competitive environment and projections of future operating results and cash flows may vary significantly from actual results. Additionally, if our analysis results in an impairment to our goodwill, we would be required to record a non-cash charge to earnings in our financial statements during the period in which such impairment is determined to exist. Any such change could have a material adverse effect on our results of operations and our stock price.


TABLE OF CONTENTS

Union Center National Bank’s ability to pay dividends is subject to regulatory limitations, which, to the extent that our holding company requires such dividends in the future, may affect our holding company’s ability to honor its obligations and pay dividends.

As a bank holding company, Center Bancorp, Inc. is a separate legal entity from Union Center National Bank and its subsidiaries and does not have significant operations. We currently depend on Union Center National Bank’s cash and liquidity to pay our operating expenses and to fund dividends to shareholders. We cannot assure you that in the future Union Center National Bank will have the capacity to pay the necessary dividends and that we will not require dividends from Union Center National Bank to satisfy our obligations. Various statutes and regulations limit the availability of dividends from Union Center National Bank. It is possible, depending upon our and Union Center National Bank’s financial condition and other factors, that bank regulators could assert that payment of dividends or other payments by Union Center National Bank are an unsafe or unsound practice. In the event that Union Center National Bank is unable to pay dividends, we may not be able to service our obligations, as they become due, or pay dividends on our capital stock. Consequently, the inability to receive dividends from Union Center National Bank could adversely affect our financial condition, results of operations, cash flows and prospects. Pursuant
In addition, as described under “Business-Supervision and Regulation-New Capital Rules,” beginning in 2016, banks and bank holding companies will be required to maintain a capital conservation buffer on top of minimum risk-weighted asset ratios. When fully phased in on January 1, 2019, the capital conservation buffer will be 2.5%. Banking institutions which do not maintain capital in excess of the capital conservation buffer will face constraints on the payment of dividends, equity repurchases and compensation based on the amount of the shortfall. Accordingly, if the Bank fails to maintain the applicable minimum capital ratios and the capital conservation buffer, distributions to the MOU between Union Center National Bank and the OCC, the BankParent Corporation may not declare dividends without the prior approval of the OCC.

be prohibited or limited.

21

Union Center National Bank’s allowance for loan losses may not be adequate to cover actual losses.

Like all financial institutions, Union Center National Bank maintains an allowance for loan losses to provide for loan defaults and non-performance. If Union Center National Bank’s allowance for loan losses is not adequate to cover actual loan losses, future provisions for loan losses could materially and adversely affect our operating results. Union Center National Bank’s allowance for loan losses is determined by analyzing historical loan losses, current trends in delinquencies and charge-offs, plans for problem loan resolution, the opinions of its regulators, changes in the size and composition of the loan portfolio and industry information.
Union Center National Bank also considers the impact of economic events, the outcome of which is uncertain. The amount of future losses is susceptible to changes in economic, operating and other conditions, including changes in interest rates that may be beyond our control and these losses may exceed current estimates. Federal regulatory agencies, as an integral part of their examination process, review Union Center National Bank’s loans and allowance for loan losses. While we believe that Union Center National Bank’s allowance for loan losses in relation to its current loan portfolio is adequate to cover current losses, we cannot assure you that Union Center National Bank will not need to increase its allowance for loan losses or that regulators will not require it to increase this allowance. Either of these occurrences could materially and adversely affect our earnings and profitability.

Union Center National Bank is subject to various lending and other economic risks that could adversely impact our results of operations and financial condition.

Changes in economic conditions, particularly a significant worsening of the current economic environment, could hurt Union Center National Bank’s business. Union Center National Bank’s business is directly affected by political and market conditions, broad trends in industry and finance, legislative and regulatory changes, and changes in governmental monetary and fiscal policies, all of which are beyond our control. Deterioration in economic conditions, particularly within New Jersey, could result in the following consequences, any of which could hurt our business materially:

problem assets and foreclosures may increase;
loan delinquencies may increase;
demand for our products and services may decline; and
collateral for loans made by Union Center National Bank may decline in value, in turn reducing Union Center National Bank’s clients’ borrowing power.

 
·loan delinquencies may increase;

TABLE OF CONTENTS

Further deterioration

·problem assets and foreclosures may increase;
·demand for our products and services may decline; and
·collateral for loans made by Union Center National Bank may decline in value, in turn reducing Union Center National Bank’s clients’ borrowing power, among other things.
Deterioration in the real estate market, particularly in New Jersey, could hurt our business. AsIf real estate values in New Jersey decline, our ability to recover on defaulted loans by selling the underlying real estate iswill likely be reduced, which increases the possibility that we may suffer losses on defaulted loans.

Union Center National Bank may suffer losses in its loan portfolio despite its underwriting practices.

Union Center National Bank seeks to mitigate the risks inherent in its loan portfolio by adhering to specific underwriting practices. Although we believe that Union Center National Bank’s underwriting criteria are appropriate for the various kinds of loans that it makes, Union Center National Bank may incur losses on loans that meet its underwriting criteria, and these losses may exceed the amounts set aside as reserves in its allowance for loan losses.

Union Center National Bank faces strong competition from other financial institutions, financial service companies and other organizations offering services similar to the services that Union Center National Bank provides.

Many competitors offer the same types of loans and banking services that Union Center National Bank offers or similar types of such services. These competitors include other national banks, savings associations, regional banks and other community banks. Union Center National Bank also faces competition from many other types of financial institutions, including finance companies, brokerage firms, insurance companies, credit unions, mortgage banks and other financial intermediaries. In this regard, Union Center National Bank’s competitors include other state and national banks and major financial companies whose greater resources may afford them a marketplace advantage by enabling them to maintain numerous banking locations, offer a broader suite of services and mount extensive promotional and advertising campaigns. Our inability to compete effectively may adversely affect our business.

22

If we pursue acquisitions, we may heighten the risks to our operations and financial condition.

To the extent that we undertake acquisitions (including our pending business combination transaction with ConnectOne Bancorp) or new branch openings, we may experience the effects of higher operating expenses relative to operating income from the new operations, which may have a material adverse effect on our levels of reported net income, return on average equity and return on average assets. Other effects of engaging in such growth strategies may include potential diversion of our management’s time and attention and general disruption to our business. To the extent that we grow through acquisitions and branch openings, we cannot assure you that we will be able to adequately and profitably manage this growth. Acquiring other banks and businesses involve similar risks to those commonly associated with branching, but may also involve additional risks, including:

potential exposure to unknown or contingent liabilities of banks and businesses we acquire;
·potential exposure to unknown or contingent liabilities of banks and businesses we acquire;
·exposure to potential asset quality issues of the acquired bank or related business;
·difficulty and expense of integrating the operations and personnel of banks and businesses we acquire; and
·the possible loss of key employees and customers of the banks and businesses we acquire
difficulty and expense of integrating the operations and personnel of banks and businesses we acquire; and
the possible loss of key employees and customers of the banks and businesses we acquire.

Attractive acquisition opportunities may not be available to us in the future.

We expect that other banking and financial service companies, many of which have significantly greater resources than us, will compete with us in acquiring other financial institutions if we pursue such acquisitions.acquisitions beyond the ConnectOne acquisition. This competition could increase prices for potential acquisitions that we believe are attractive. Also, acquisitions are subject to various regulatory approvals. If we fail to receive the appropriate regulatory approvals, we will not be able to consummate an acquisition that we believe is in our best interests. Among other things, our regulators will consider our capital, liquidity, profitability, regulatory compliance and levels of goodwill when considering acquisition and expansion proposals. Any acquisition could be dilutive to our earnings and shareholders’ equity per share of our common stock.


TABLE OF CONTENTS

Further increases in FDIC premiums could have a material adverse effect on our future earnings.

The FDIC insures deposits at FDIC insured financial institutions, including Union Center National Bank. The FDIC charges the insured financial institutions premiums to maintain the Deposit Insurance Fund at an adequate level. In lightperiods of current economic conditions,difficulties, the FDIC has increasedmay increase its assessment rates and imposedimpose special assessments. The FDIC may further increase these rates and impose additional special assessments in the future, which could have a material adverse effect on future earnings.

Declines in value may adversely impact our investment portfolio.

As of December 31, 2010,2013, we had approximately $378.1$323.1 million in available for sale investment securities. We may be required to record impairment charges on our investment securities if they suffer a decline in value that is considered other-than-temporary. Numerous factors, including lack of liquidity for re-sales of certain investment securities, absence of reliable pricing information foror investment securities, adverse changes in business climate, adverse actions by regulators, or unanticipated changes in the competitive environment could have a negative effect on our investment portfolio in future periods. If an impairment charge is significant enough, it could affect the ability of Union Center National Bank to upstream dividends to us,the Parent Corporation, which could have a material adverse effect on our liquidity and our ability to pay dividends to shareholders and could also negatively impact our regulatory capital ratios.

23

Concern of customers over deposit insurance may cause a decrease in deposits.

With recent increased concerns about bank failures, customers increasingly are concerned about the extent to which their deposits are insured by the FDIC. Customers may withdraw deposits in an effort to ensure that the amount they have on deposit with their bank is fully insured. Decreases in deposits may adversely affect our funding costs and net income.

We have a continuing need for technological change and we may not have the resources to effectively implement new technology.

The financial services industry is constantly undergoing rapid technological changes with frequent introductions of new technology-driven products and services. The effective use of technology increases efficiency and enables financial institutions to reduce costs, in addition to providing better service to customers. Our future success will depend in part upon our ability to address the needs of our customers by using technology to provide products and services that will satisfy customer demands for convenience as well as to create additional efficiencies in our operations as we grow. We cannot provideassure you with assurance that we will be able to effectively implement new technology-driven products and services or be successful in marketing such products and services to our customers.

System failure or breaches of our network security could subject us to increased operating costs as well as litigation and other liabilities.

The computer systems and network infrastructure we use could be vulnerable to unforeseen problems. Our operations are dependent upon our ability to protect our computer equipment against damage from physical theft, fire, power loss, telecommunications failure or a similar catastrophic event, as well as from security breaches, denial of service attacks, viruses, worms and other disruptive problems caused by hackers. Any damage or failure that causes an interruption in our operations could have a material adverse effect on our financial condition and results of operations. Computer break-ins, phishing and other disruptions could also jeopardize the security of information stored in and transmitted through our computer systems and network infrastructure, which may result in significant liability to us and may cause existing and potential customers to refrain from doing business with us. A failure of the security measures we use could have a material adverse effect on our financial condition and results of operations.


TABLE OF CONTENTS

Recently enacted legislative reformsThe Dodd-Frank Act and future regulatory reforms required by such legislation could have a significant impact on our business, financial condition and results of operations.

On July 21, 2010, President Obama signed the Dodd-Frank Act into law.

The Dodd-Frank Act will have a broad impact on the financial services industry, including significant regulatory and compliance changes. Many of the requirements called for in the Dodd-Frank Act will be implemented over time and most are and will be subject to implementing regulations over the course of several years. Given the uncertainty associated with the manner in which the provisions of the Dodd-Frank Act will be implemented by the various regulatory agencies, the full extent of the impact such requirements will have on our operations is unclear. Among other things, the Dodd-Frank Act:

eliminates, effective one year after the date of enactment, the federal prohibitions on paying interest on demand deposits, thus allowing businesses to have interest bearing checking accounts. Depending on competitive responses, this significant change to existing law could have an adverse impact on our interest expense.
broadens the base for FDIC insurance assessments. Assessments will now be based on the average consolidated total assets less tangible equity capital of a financial institution.
permanently increases the maximum amount of deposit insurance for banks, savings institutions and credit unions to $250,000 per depositor, retroactive to January 1, 2009, and non-interest bearing transaction accounts have unlimited deposit insurance through December 31, 2013.
directs the Federal Reserve Board to promulgate rules prohibiting excessive compensation paid to bank holding company executives.
creates a new Consumer Financial Protection Bureau with broad powers to supervise and enforce consumer protection laws. The Consumer Financial Protection Bureau has broad rule-making authority for a wide range of consumer protection laws that apply to all banks and savings institutions, including the authority to prohibit “unfair, deceptive or abusive” acts and practices. The Consumer Financial Protection Bureau has examination and enforcement authority over all banks and savings institutions with more than $10 billion in assets. Institutions with $10 billion or less in assets, such as the Bank, will continued to be examined for compliance with the consumer laws by their primary bank regulators.
Weakens the federal preemption rules that have been applicable for national banks and federal savings associations, and gives state attorneys general the ability to enforce federal consumer protection laws.

While it is difficult to predict at this time what specific impact the Dodd-Frank Act newly written implementing rules and regulations and yet to be written implementing rules and regulations will have on us, we expect that at a minimum our operating and compliance costs will increase, and our interest expense could increase.

If the combined company resulting from the Merger (the “combined company”) does not successfully integrate ConnectOne Bank and Union Center National Bank, or if the combined company does not successfully integrate any other banks that the combined company may acquire in the future, the combined company may be adversely affected.
If the Merger of ConnectOne Bancorp into the Parent Corporation, and the merger of Union Center National Bank into ConnectOne Bank, are completed, it will be essential that management integrate the two entities’ cultures, business, operations and systems. If the combined company makes additional acquisitions in the future, the combined company will also need to integrate the acquired entities into its then existing business, operations and systems. The combined company may experience difficulties in accomplishing this integration or in effectively managing the combined company after the Merger, and after any future acquisition. Any actual cost savings or revenue enhancements that the combined company may anticipate from the Merger or from future acquisitions will depend on future expense levels and operating results, the timing of certain events and general industry, regulatory and business conditions. Many of these events will be beyond the combined company’s control, and we cannot assure you that if the Merger is consummated or if the combined company makes any additional acquisitions in the future, it will be successful in integrating those businesses.
Failure to complete the Merger could severely disadvantage Center.
In order to complete the Merger, ConnectOne and Center must each focus on meeting all merger conditions. If for any reason the merger does not occur, that failure could adversely affect Center’s business and could make it difficult for Center to attract other acquisition partners in the future.
24

Item 1B. Unresolved Staff Comments

None.

Item 2. Properties

The Bank’s operations are located at ten sites in Union County, New Jersey, consisting of six sites in Union Township, one in Springfield Township, one in Berkeley Heights, one in Vauxhall and one in Summit, New Jersey. The Bank also has three branch offices in Morris County, New Jersey, consisting of one site in Madison, one site in Boonton/Mountain Lakes, and one site in Morristown, New Jersey. During 2012, the Corporation acquired two bank occupancies from Saddle River Valley Bank and opened an office in Englewood, New Jersey. As a result of its acquisition of assets of Saddle River Valley Bank in 2012, the Bank has three branch offices in Bergen County, New Jersey. In May of 2013 the Corporation opened a branch in Princeton, Mercer County, New Jersey. The Bank’s principal office is located at 2455 Morris Avenue, Union, New Jersey. The principal office is a two story building constructed in 1993. On October 9, 2004, the Bank opened a 19,555 square foot office facility on Springfield Road in Union, New Jersey, which served as the Bank’s Operations and Data Center, until January 12, 2010 when the Bank entered into a sales purchase agreement for this facility. On February 27, 2008 the Corporation signed an agreement to lease premises at 105 North Avenue, Cranford, New Jersey to be used to construct a full service branch facility. Subsequently, the Corporation notified the landlord that it wanted to terminate the commitment and completed the termination in the first quarter of 2009.


TABLE OF CONTENTS

The following table sets forth certain information regarding the Bank’s leased locations.

Branch Location
 
Term
Branch LocationTerm
356 Chestnut Street,
Union,
New Jersey
 Term expires in 2028 with renewal options
Career Center Branch located in
Union High School, Union,
New Jersey
Term expired in October 2008, currently on month to month lease
300 Main Street, Madison,
New Jersey
Term expires June 6, 2015 and is subject to renewal at the Bank’s option
2933 Vauxhall Road, Vauxhall,
Career Center Branch
located in Union High School,
Union,
New Jersey
 Term expires JanuaryAugust 31, 20132015
300 Main Street,
Madison, New Jersey
Term expires May 31, 2016 and is subject to renewal at the Bank’s option
392 Springfield Avenue, Summit,
2933 Vauxhall Road,
Vauxhall,
New Jersey
 Term expired Marchexpires January 31, 20092020 and wasis subject to renewal at the Bank’s option; however, the Bank advised the landlord that it did not intend to renew this lease.option
545 Morris Avenue,
Summit,
New Jersey
 Term expires February 1,January 31, 2024 and is subject to renewal at the Bank’s option
Ely Place, Boonton, New Jersey Term expires August 29, 2021, and is subject to renewal at the Bank’s option
71 E. Allendale Road,
 Saddle River, New Jersey
Term expires May 31, 2032 unless sooner terminated or extended by the Bank
Route 202 and Allerman Road
Oakland, New Jersey
Term expires April 30, 2028 and is subject to renewal at the Bank’s option
12 E. Palisade Avenue,
Englewood, New Jersey
Term expires July 31, 2022 and is subject to renewal at the Bank’s option
344 Nassau Street,
Princeton, New Jersey
Term expires May 31, 2016 and is subject to renewal at the Bank’s option
171 East Saddle River Road
Saddle River, New Jersey
Term expired December 31, 2013, month to month

25

The Bank operates a Drive In/Walk Up located at 2022 Stowe Street, Union, New Jersey, adjacent to a part of the Center Office facility. The
On October 9, 2004, the Bank also operates an Autobanking Center located at Bonnel Court,opened a 19,555 square foot office facility on Springfield Road in Union, New Jersey. The Bank has three off-site ATM locations. Two are located atJersey, which served as the ChathamBank’s operations and Madison New Jersey Transit stations and one is located at the Boys and Girls Club of Union, 1050 Jeanette Avenue, Union, New Jersey.

data center until 2010. During the second quarter of 2010, the Corporation entered into a lease of its former operations facility under a direct financing lease. The lease has a 15 year term with no renewal options. According to the terms of the lease, the lessee has an obligation to purchase the property underlying the lease in either year seven, (7), ten (10) or fifteen (15) at predetermined prices for those years as provided in the lease. The structure of the minimum lease payments and the purchase prices as provided in the lease provide an inducement to the lessee to purchase the property in year seven (7).

seven.

Item 3. Legal Proceedings

In December 2009, the Corporation took steps to terminate a participation agreement with another New Jersey bank at December 31, 2009. Under the terms of the agreement, the participation ended on December 31, 2009, and, in the Corporation’s view, the lead bank is required to repurchase the remaining balance. The lead bank questioned our enforcement of the participation agreement. Therefore, the Corporation filed suit in Superior Court of New Jersey Chancery Division in Morris County, New Jersey, for the return of the outstanding principal.

Union Center has instituted a suit against Highlands State Bank (“Highlands”) in the Superior Court of New Jersey (Docket No. MRS-C-189-09). This litigation relates to a participating interest in a construction loan originated by Highlands. This loan was closed, and the participating interest (85%) was acquired, in 2007. Various causes of action are pleaded in this litigation by both parties, including claims for recovery of damages. The primary claim prosecuted by Union Center seeks a judicial determination that the Participation Agreement executed with Highlands was properly terminated in accordance with its terms on December 31, 2009 and that Highlands is obligated to return the unpaid balance of the loan funds advanced by Union Center during its participation in the loan. The primary claim presented by Highlands is that Union Center’s participation in the loan must continue until it is ultimately retired, which will probably result in a substantial loss that it is claimed must be shared by Union Center. This litigation is in its early stages. The initial pleadings have been filed and the discovery phase will now begin. As of December 31, 2010 no significant progress has been made regarding a decision resulting from the discovery or depositions taken during 2010.


TABLE OF CONTENTS

There are no other significant pending legal proceedings involving the Corporation other than those arising out of routine operations. operations, and those arising in connection with the Merger.

On February 10, 2014, the Parent Corporation was served with a Civil Action Summons and Class Action Complaint that was filed in the Superior Court of New Jersey, Chancery Division, Bergen County. The complaint states that the plaintiff is bringing the class action on behalf of the public stockholders of ConnectOne Bancorp against the Board of Directors of ConnectOne Bancorp for their alleged breach of fiduciary duties arising out of the Agreement and Plan of Merger, dated as of January 21, 2014, by and between the Parent Corporation and ConnectOne Bancorp. The complaint alleges that the Parent Corporation aided and abetted the individual defendants in their alleged breaches of fiduciary duties. The Parent Corporation intends to vigorously defend against these claims.
Management does not anticipate that the ultimate liability, if any, arising out of such litigationproceedings will have a material effect on the financial condition or results of operations of the Corporation on a consolidated basis. Such statement constitutes a forward-looking statement under the Private Securities Litigation Reform Act of 1995. Actual results could differ materially from this statement as a result of various factors, including the uncertainties arising in proving facts within the judicial process.

26

Item 3A. Executive Officers of the Registrant

The following table sets forth the name and age of each executive officer of the Parent Corporation, the period during which each such person has served as an officer of the Parent Corporation or the Bank and each such person’s business experience (including all positions with the Parent Corporation and the Bank) for the past five years:

Name and Age
 
Officer Since
 
Name and AgeOfficer Since
Business Experience
Anthony C.
Weagley

Age – 4952
 1996 the Parent
Corporation

1985 the Bank
 President and Chief Executive Officer of the Parent Corporation (April 2008 – Present);and bank August 23, 2007 - Present; Vice President Chief Executive Officer and Treasurer of the Parent Corporation and Senior Vice President and Cashier of the Bank (prior periods) (Mr. Weagley continued to serve as Chief Financial Officer of the Parent Corporation (August 2007 –until March 2008); President27, 2008 and Chief Executive Officer of the Bank (March 2008 – Present); President, Chief Executive Officer andas Chief Financial Officer of the Bank (August 2007 –until February 2008); Vice President & Treasurer of the Parent Corporation (1996 – August 2007); Senior Vice President & Cashier of the Bank (1996 – August 2007); Vice President & Cashier of the Bank (1991 – 1996)
Mark S.
Cardone
Age – 4851
 2001 the Parent
Corporation

2001 the Bank
 Vice President of the Parent Corporation and Senior Vice President & Branch Administrator of the Bank (2001 – Present)
Joseph D.
Gangemi

Age – 3033
 2008 the Parent
Corporation

2004 the Bank
 Vice President and Assistant Portfolio Manager of the Parent Corporation and the Bank (December 31, 2010 – Present);: Executive Assistant to the Chief Executive Officer, Investor Relations Officer and Corporate Secretary of the Parent Corporation and the Bank (June 2008 –  Present); Executive Assistant to the Chief Executive Officer and Investor Relations Officer of the Bank (January 2008 – June 2008); Executive Assistant to the Chief Executive Officer of the Bank (August 2007 – January 2008); Executive Assistant to the Chief Financial Officer of the Bank (August 2005 – August 2007)
John J. Lukens
Age – 63
 2009 the Parent Corporation
2004
John Bailey
Age – 59
2013 the Bank Vice President and Senior Credit Administrator of the Parent Corporation and Senior Vice President and Senior Credit Administrator of the Bank (December 2009(January 2013 – Present); Managing members of Bailey Financial Consulting, LLC (October 1993 – December 2013); Senior Vice President and Senior Credit Officer of theCrestmont Federal Savings and Loan Association (January 1990 – October 1993); Vice President commercial loans of First Fidelity Bank (September 2004(July 1978December 2009)January 1990)

TABLE OF CONTENTS

  
Name and AgeOfficer SinceBusiness Experience
Francis R. Patryn
James W. Sorge
Age – 61
 2006 the Parent Corporation
2006 the Bank
Vice President, Chief Financial Officer and Comptroller of the Parent Corporation and Vice President and Chief Financial Officer and Comptroller of the Bank (November 2010 – Present); Vice President and Comptroller of the Bank (October 2006 – Present)
James W. Sorge
Age – 58
2010 the Parent
Corporation

2010 the Bank
 Vice President and Compliance Officer of the Parent Corporation and Senior Vice President and Compliance Officer of the Bank (March 2010 – Present); Vice President and Director, PNC Global Investment Servicing (May 2008 – March 2010); Vice President, BSA/AML/OFAC Officer, Yardville National Bank (June 2005 – April 2008)
27

Name and Age
Officer Since
Business Experience
George J.
Theiller

Age – 6063
 2009 the Parent
Corporation

2005 the Bank
 Vice President and Senior Auditor of the Parent Corporation and Senior Vice President and Senior Auditor of the Bank (December 2009 – Present); Vice President and Senior Auditor of the Bank (April 2005 – December 2009)
Arthur M. Wein
Francis R.
Patryn
Age – 6064
2006 the Parent
Corporation
2006 the Bank
Vice President and Chief Financial Officer of the Parent Corporation and Senior Vice President, Chief Financial Officer of the Bank (May 31, 2013 – Present); Vice President, Chief Financial Officer and Comptroller of the Parent Corporation and Vice President and Chief Financial Officer and Comptroller of the Bank (November 2010 – March 28, 2011); Vice President and Comptroller of the Bank (October 2006 – March 28, 2011 and March 28, 2011 to May 31, 2013)
Arthur M.
Wein
Age – 63
 2009 the Parent
Corporation

2009 the Bank
 Vice President and Chief Operating Officer of the Parent Corporation and Senior Vice President and Chief Operating Officer of the Bank (October 2009 – Present); Vice President and Business Development Officer of the Summit Region of the Bank (April 2009 –  October 2009); President and Chief Executive Officer of UTZ Technologies, Inc. (manufacturer of thick film hybrid screens) (December 2003 – March 2009)

Item 4. Reserved


Mine Safety Disclosures
 

TABLE OF CONTENTS

Not applicable.

28

PART II

Item 5. Market for the Registrant’s Common Stock, Related Stockholder Matters and Issuer Purchases of Equity Securities

Security Market Information

The common stock of the Parent Corporation is traded on the NASDAQ Global Select Market. The Corporation’s symbol is CNBC. As of December 31, 2010,2013, the Corporation had 592514 stockholders of record. This does not include beneficial owners for whom CEDE & Company or others act as nominees. On December 31, 2010,2013, the closing low market bid and askedsale price were $8.10 and $8.15, respectively.

was $18.76.

The following table sets forth the high and low bidclosing sales price, and the dividends declared, on a share of the Corporation’s common stock for the years ended December 31, 20102013 and 2009. All amounts are adjusted for prior stock splits and stock dividends.

2012.
      
 Common Stock Price
   2010 2009 Common Dividends Declared  
   High Bid Low Bid High Bid Low Bid 2010 2009
Fourth Quarter $8.11  $7.30  $9.20  $7.36  $0.03  $0.03 
Third Quarter  7.67   7.05   10.16   7.53   0.03   0.03 
Second Quarter  9.07   6.94   9.15   6.88   0.03   0.03 
First Quarter  9.09   8.31   8.50   6.43   0.03   0.09 
Total             $0.12  $0.18 

  Common Stock Price       
  2013 2012 Common Dividends Declared 
  High Low High Low 2013 2012 
Fourth Quarter $19.67 $13.96 $11.93 $10.89 $0.075 $0.055 
Third Quarter  15.24  12.95  11.99  10.82  0.075  0.055 
Second Quarter  13.23  11.50  11.25  9.75  0.075  0.055 
First Quarter  12.82  11.62  10.45  9.50  0.055  0.030 
Total             $0.280 $0.195 
Share Repurchase Program

Historically, repurchases have been made from time to time as, in the opinion of management, market conditions warranted, in the open market or in privately negotiated transactions. Shares repurchased were used for stock dividends and other issuances. No repurchases were made during 2009 and 2010

As noted elsewhere herein, on January 9, 2009, as part of the U.S. Department of the Treasury’s Troubled Asset Relief Program (“TARP”), the Parent Corporation entered into an agreement with the U.S. Treasury (the “Stock Purchase Agreement”) pursuant to which (i) the Parent Corporation issued and sold, and the U.S. Treasury purchased, 10,000 shares (the “Preferred Shares”) of the Company’s Fixed Rate Cumulative Perpetual Preferred Stock, Series A, having a liquidation preference of $1,000 per share for an aggregate purchase price of $10 million in cash, and (ii) the Parent Corporation issued to the U.S. Treasury a ten-year warrant (the “Warrant”) to purchase up to 173,410 shares of the Parent Corporation’s common stock at an exercise price of $8.65 per share. As a result of the successful completion of the Rights Offering in October 2009, the number of shares underlying the warrant held by the U.S. Treasury was reduced to 86,705 sharesduring 2013 or 50 percent of the original 173,410 shares. Until the third anniversary of the issuance of the Preferred Shares, the consent of the U.S. Treasury will be required for any increase in the dividends on the Parent Corporation’s common stock or for any stock repurchases unless the Preferred Shares have been redeemed in their entirety or the U.S. Treasury has transferred the Preferred Shares to third parties. See “Dividends” below for additional restrictions on the payment of dividends.

2012.

Dividends

Federal laws and regulations contain restrictions on the ability of the Parent Corporation and Union Center National Bank to pay dividends. For information regarding restrictions on dividends, see Part I, Item 1, “Business — Dividend Limitations” and Part II, Item 8, “Financial Statements and Supplementary Data —  Dividend and Other Restrictions,”, Note 1718 of the Notes to Consolidated Financial Statements.” Pursuant to the MOU between Union Center National Bank and the OCC, the Bank may not declare dividends without the prior approval of the OCC. In addition, underUnder the terms of the trust preferred securities issued by Center Bancorp, Inc. Statutory Trust II, the Parent Corporation can notcannot pay dividends on its common stock if the Corporation defers payments on the junior subordinated debentures which provide the cash flow for the payments on the trust preferred securities. Further, pursuant to the Stock Purchase Agreement,If the Parent Corporation is unablefails to declare and pay dividends on the SBLF Preferred Stock in a given quarter, then during such quarter and for the next three quarters followings such missed dividend paymentspayment, the Parent Corporation may not pay dividends on, or repurchase, any common stock or any other securities that are junior to (or in parity with) the SBLF Preferred Stock, except in very limited circumstances. Also under the terms of the SBLF Preferred Stock, the Parent Corporation may declare and pay dividends on its common stock or any other stock junior to the SBLF Preferred Stock, or repurchase shares of any such stock, only if after payment of such dividends or repurchase of such shares, the Parent Corporation’s common stock (and certain


Tier 1 Capital would be at least equal to the Tier 1 Dividend Threshold (as defined), excluding any subsequent net charge-offs and any redemption of the SBLF Preferred Stock.
 

TABLE OF CONTENTS

preferred stock ifIn addition, capital guidelines and other regulatory requirements may further limit the Parent Corporation issues additional series of preferred stock) ifCorporation’s and the Parent Corporation is in arrears in the payment of dividendsBank’s ability to pay dividends. See “Item 1 – Business – Supervision and Regulation –New Capital Rules.”

Stockholders Return Comparison
Set forth on the Preferred Shares issued to the U.S. Treasury. Further, until the third anniversary of the U.S. Treasury’s investment or when all of the Preferred Shares have been redeemed or transferred, the Parent Corporation is not permitted to increase the amount of the quarterly cash dividend above $0.09 per share, which was the amount of the last regular dividend declared by the Parent Corporation prior to October 14, 2008.

Stockholders Return Comparison

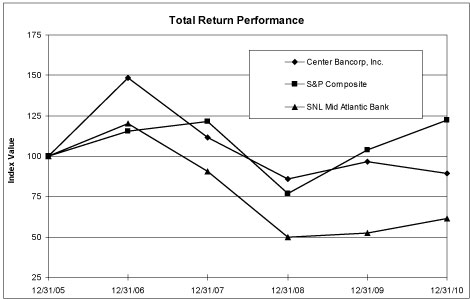
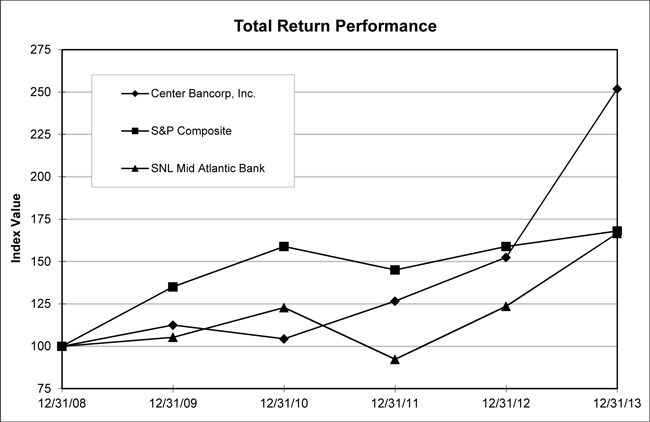
Set forth belowfollowing page is a line graph presentation comparing the cumulative stockholder return on the Parent Corporation’s common stock, on a dividend reinvested basis, against the cumulative total returns of the Standard & Poor’s Composite and the SNL Mid-Atlantic Bank Index for the period from January 1, 20062009 through December 31, 2010.

2013.

29

COMPARE 5-YEAR CUMULATIVE TOTAL RETURN
AMONG CENTER BANCORP INC.,

S&P COMPOSITE AND SNL MID-ATLANTIC BANK INDEX

 
Assumes $100 invested on January 1, 2006
2009
Assumes dividends reinvested

Year ended December 31, 2010

2013

COMPARISON OF CUMULATIVE TOTAL RETURN OF ONE OR MORE

COMPANIES, PEER GROUPS, INDUSTRY INDEXES AND/OR BROAD MARKETS

      
 Fiscal Year Ending
Company/Index/Market 12/31/2005 12/31/2006 12/31/2007 12/31/2008 12/31/2009 12/31/2010
Center Bancorp, Inc.  100.00   148.38   111.68   85.74   96.47   89.46 
S&P Composite  100.00   115.33   121.64   76.97   103.96   122.30 
SNL Mid-Atlantic Bank
Index
  100.00   120.02   90.76   50.00   52.63   61.40 


TABLE OF CONTENTS

  Fiscal Year Ending 
Company/Index/Market 12/31/2008 12/31/2009 12/31/2010 12/31/2011 12/31/2012 12/31/2013 
Center Bancorp, Inc.  100.00  112.51  104.33  126.63  154.44  251.89 
S&P Composite  100.00  135.05  158.89  145.05  158.88  168.03 
SNL Mid-Atlantic Bank
    Index
  100.00  105.27  122.81  92.26  123.59  166.59 

Item 6. Selected Financial Data

The following tables set forth selected consolidated financial data as of the dates and for the periods presented. The selected consolidated statement of financial condition data as of December 31, 20102013 and 20092012 and the selected consolidated summary of income data for the years ended December 31, 2010, 20092013, 2012 and 20082011 have been derived from our audited consolidated financial statements and related notes that we have included elsewhere in this Annual Report. The selected consolidated statement of financial condition data as of December 31, 2008, 20072011, 2010 and 20062009 and the selected consolidated summary of income data for the years ended December 31, 20072010 and 20062009 have been derived from audited consolidated financial statements that are not presented in this Annual Report.

The selected historical consolidated financial data as of any date and for any period are not necessarily indicative of the results that may be achieved as of any future date or for any future period. You should read the following selected statistical and financial data in conjunction with the more detailed information contained in “Management’s Discussion and Analysis of Financial Condition and Results of Operations” and our consolidated financial statements and the related notes that we have presented elsewhere in this Annual Report.


TABLE OF CONTENTS

On August 1, 2012, the Bank assumed all of the deposits and certain other liabilities and acquired certain assets of Saddle River Valley Bank. In this transaction, the Bank assumed $85.2 million in deposits and acquired $89.3 million in loans and securities from Saddle River Valley Bank. See Note 4 of the Notes to the Consolidated Financial Statements. The assumed liabilities and acquired assets are reflected in the table below for the year ended December 31, 2012. The Corporation’s results of operations for 2012 give effect to this acquisition from the date of the acquisition.

30

SUMMARY OF SELECTED STATISTICAL INFORMATION AND FINANCIAL DATA


 Years Ended December 31,
   2010 2009 2008 2007 2006
   (Dollars in Thousands, Except per Share Data)
Summary of Income
                         
Interest income $48,714  $51,110  $49,894  $52,129  $53,325 
Interest expense  14,785   22,645   24,095   30,630   28,974 
Net interest income  33,929   28,465   25,799   21,499   24,351 
Provision for loan losses  5,076   4,597   1,561   350   57 
Net interest income after provision for loan
losses
  28,853   23,868   24,238   21,149   24,294 
Other income  2,472   3,906   2,644   4,372   633 
Other expense  24,099   23,057   19,473   24,598   24,358 
Income before income tax expense  7,226   4,717   7,409   923   569 
Income tax expense (benefit)  222   946   1,567   (2,933  (3,329
Net income $7,004  $3,771  $5,842  $3,856  $3,898 
Net income available to common stockholders $6,423  $3,204  $5,842  $3,856  $3,898 
Statement of Financial Condition Data
                         
Investments $378,080  $298,124  $242,714  $314,194  $381,733 
Total loans  708,444   719,606   676,203   551,669   550,414 
Goodwill and other intangibles  16,959   17,028   17,110   17,204   17,312 
Total assets  1,207,385   1,195,488   1,023,293   1,017,645   1,051,384 
Deposits  860,332   813,705   659,537   699,070   726,771 
Borrowings  212,855   269,253   268,440   218,109   206,434 
Stockholders’ equity  120,957   101,749   81,713   85,278   97,613 
Dividends
                         
Cash dividends $1,852  $2,434  $4,675  $4,885  $4,808 
Dividend payout ratio  28.83  75.97  80.02  126.69  123.35
Cash Dividends Per Share(1)
                         
Cash dividends $0.12  $0.18  $0.36  $0.36  $0.34 
Earnings Per Share(1)
                         
Basic $0.43  $0.24  $0.45  $0.28  $0.28 
Diluted $0.43  $0.24  $0.45  $0.28  $0.28 
Weighted Average Common Shares Outstanding(1)
                         
Basic  15,025,870   13,382,614   13,048,518   13,780,504   13,959,684 
Diluted  15,027,159   13,385,416   13,061,410   13,840,756   14,040,338 
Operating Ratios
                         
Return on average assets  0.59  0.31  0.58  0.38  0.37
Average stockholders’ equity to average assets  9.38  7.66  8.28  9.33  9.21
Return on average stockholders’ equity  6.30  4.02  7.03  4.09  4.04
Return on average tangible stockholders’ equity(2)  7.44  4.91  8.86  5.00  4.93
Book Value
                         
Book value per common share(1) $6.83  $6.32  $6.29  $6.48  $7.02 
Tangible book value per common share(1)(2) $5.79  $5.15  $4.97  $5.17  $5.77 
Non-Financial Information
                         
Common stockholders of record  592   605   640   679   717 
Full-time equivalent staff  159   160   160   172   214 

  Years Ended December 31, 
  2013  2012  2011  2010  2009 
  (Dollars in Thousands, Except per Share Data) 
Summary of Income                    
Interest income $57,268  $55,272  $51,927  $48,714  $51,110 
Interest expense  11,082   11,776   12,177   14,785   22,645 
Net interest income  46,186   43,496   39,750   33,929   28,465 
Provision for loan losses  350   325   2,448   5,076   4,597 
Net interest income after provision for
    loan losses
  45,836   43,171   37,302   28,853   23,868 
Other income  6,851   7,210   7,478   2,472   3,906 
Other expense  25,278   25,197   23,443   24,099   23,057 
Income before income
    tax expense
  27,409   25,184   21,337   7,226   4,717 
Income tax expense  7,484   7,677   7,411   222   946 
Net income $19,925  $17,507  $13,926  $7,004  $3,771 
Net income available to common
    stockholders
 $19,784  $17,226  $13,106  $6,423  $3,204 
Statement of Financial
    Condition Data
                    
Investments available for sale $323,070  $496,815  $414,507  $378,080  $298,124 
Investments held to maturity  215,286   58,064   72,233       
Loans held for sale     1,491   1,018   333    
Total loans  960,943   889,672   754,992   708,111   719,606 
Allowance for loan losses  10,333   10,237   9,602   8,867   8,711 
Goodwill and other intangible
    assets
  16,828   16,858   16,902   16,959   17,028 
Total assets  1,673,082   1,629,765   1,432,738   1,207,385   1,195,488 
Deposits  1,342,005   1,306,922   1,121,415   860,332   813,705 
Borrowings  146,000   146,000   161,000   212,855   269,253 
Stockholders’ equity  168,584   160,691   135,916   120,957   101,749 
Dividends                    
Cash dividends on Common Stock $4,254  $2,778  $1,955  $1,800  $2,434 
Dividend payout ratio  21.50%  16.13%  14.92%  28.02%  75.97%
Cash Dividends Per Share                    
Cash dividends $0.280  $0.195  $0.12  $0.12  $0.18 
Earnings Per Share                    
Basic $1.21  $1.05  $0.80  $0.43  $0.24 
Diluted $1.21  $1.05  $0.80  $0.43  $0.24 
Weighted Average Common Shares
    Outstanding
                    
Basic  16,349,204   16,340,197   16,295,761   15,025,870   13,382,614 
Diluted  16,385,692   16,351,046   16,314,899   15,027,159   13,385,416 
Operating Ratios                    
Return on average assets  1.22%  1.14%  1.05%  0.59%  0.31%
Average stockholders’ equity to
    average assets
  10.10%  9.73%  9.83%  9.38%  7.66%
Return on average stockholders’ equity  12.08%  11.69%  10.73%  6.30%  4.02%
Return on average tangible
    stockholders’ equity(1)
  13.45%  13.18%  12.33%  7.44%  4.91%
Book Value                    
Book value per common share $9.61  $9.14  $7.63  $6.83  $6.32 
Tangible book value per common
    share(1)
 $8.58  $8.11  $6.60  $5.79  $5.15 
Non-Financial Information                    
Common stockholders of record  514   551   563   592   605 
Full-time equivalent staff  166   178   163   159   160 
31

Notes to Selected Financial Data

(1)All common share and per common share amounts have been adjusted for prior stock splits and stock dividends.


TABLE OF CONTENTS

(2)(1)Tangible book value per common share, which is a non-GAAP financial measure, is computed by dividing stockholders’ equity less preferred stock, goodwill and other intangible assets by common shares outstanding. The following table provides certain related reconciliations between Generally Accepted Accounting Principles (“GAAP”)measures (stockholders’ equity and book value per common share) and the related non-GAAP financial measures (tangible stockholders’ equity and tangible book value per common share):

     
 2010 2009 2008 2007 2006
   (Dollars in Thousands, Except per Share Data)
Common shares
outstanding
  16,289,832   14,572,029   12,991,312   13,155,784   13,910,450 
Stockholders’ equity $120,957  $101,749  $81,713  $85,278  $97,613 
Less: Preferred Stock  9,700   9,619   ��      
Less: Goodwill and other intangible assets  16,959   17,028   17,110   17,204   17,312 
Tangible Stockholders’ Equity $94,298  $75,102  $64,603  $68,074  $80,301 
Book value per common share $6.83  $6.32  $6.29  $6.48  $7.02 
Less: Goodwill and other intangible assets  1.04   1.17   1.32   1.31   1.25 
Tangible Book Value per Common Share $5.79  $5.15  $4.97  $5.17  $5.77 

All per common share amounts reflect all prior stock splits and dividends.

  2013 2012 2011 2010 2009 
  (Dollars in Thousands, Except per Share Data) 
Common shares outstanding  16,369,012  16,347,915  16,332,327  16,289,832  14,572,029 
Stockholders’ equity $168,584 $160,691 $135,916 $120,957 $101,749 
Less: Preferred Stock  11,250  11,250  11,250  9,700  9,619 
Less: Goodwill and other intangible assets  16,828  16,858  16,902  16,959  17,028 
Tangible Common Stockholders’ Equity $140,506 $132,583 $107,764 $94,298 $75,102 
Book value per common share $9.61 $9.14 $7.63 $6.83 $6.32 
Less: Goodwill and other intangible assets  1.03  1.03  1.03  1.04  1.17 
Tangible Book Value per Common Share $8.58 $8.11 $6.60 $5.79 $5.15 
Return on average tangible stockholders’ equity, which is a non-GAAP financial measure, is computed by dividing net income by average stockholders’ equity less average goodwill and average other intangible assets. The following table reflects a reconciliation between average stockholders’ equity and average tangible stockholders’ equity and a reconciliation between return on stockholders’ equity and return on average tangible stockholders’ equity.

     
 2010 2009 2008 2007 2006
   (Dollars in Thousands)
Net income $7,004  $3,771  $5,842  $3,856  $3,898 
Average stockholders’ equity $111,136  $93,850  $83,123  $94,345  $96,505 
Less: Average goodwill and other intangible assets  16,993   17,069   17,158   17,259   17,378 
Average Tangible Stockholders’ Equity $94,143  $76,781  $65,965  $77,086  $79,127 
Return on average stockholders’ equity  6.30  4.02  7.03  4.09  4.04
Add: Average goodwill and other intangible assets  1.14   .89   1.83   0.91   0.89 
Return on Average Tangible Stockholders’ Equity  7.44  4.91  8.86  5.00  4.93

  2013  2012  2011  2010  2009 
  (Dollars in Thousands) 
Net income $19,925  $17,507  $13,926  $7,004  $3,771 
Average stockholders’ equity $165,025  $149,714  $129,838  $111,136  $93,850 
Less: Average goodwill and other intangible assets  16,842   16,879   16,930   16,993   17,069 
Average Tangible Stockholders’ Equity $148,183  $132,835  $112,908  $94,143  $76,781 
Return on average stockholders’ equity  12.08%  11.69%  10.73%  6.30%  4.02%
Add: Average goodwill and other intangible assets  1.37   1.49   1.61   1.14   0.89 
Return on Average Tangible Stockholders’ Equity  13.45%  13.18%  12.33%  7.44%  4.91%
The Corporation believes that in comparing financial institutions, investors desire to analyze tangible stockholders’ equity rather than stockholders’ equity, as they discount the significance of goodwill and other intangible assets.


TABLE OF CONTENTS

32

Item 7. Management’s Discussion and Analysis (“MD&A”) of Financial Condition and Results of Operations

The purpose of this analysis is to provide the reader with information relevant to understanding and assessing the Corporation’s results of operations for each of the past three years and financial condition for each of the past two years. In order to fully appreciate this analysis, the reader is encouraged to review the consolidated financial statements and accompanying notes thereto appearing under Item 8 of this report, and statistical data presented in this document.

Cautionary Statement Concerning Forward-Looking Statements

See Item 1 of this Annual Report on Form 10-K for information regarding forward-looking statements.

Critical Accounting Policies and Estimates

The accounting and reporting policies followed by the Corporation conform, in all material respects, to U.S. GAAP. In preparing the consolidated financial statements, management has made estimates, judgments and assumptions that affect the reported amounts of assets and liabilities as of the dates of the consolidated statements of condition and results of operations for the periods indicated. Actual results could differ significantly from those estimates.

The Corporation’s accounting policies are fundamental to understanding this MD&A. The most significant accounting policies followed by the Corporation are presented in Note 1 of the Notes to Consolidated Financial Statements. The Corporation has identified its policies on the allowance for loan losses, other than temporaryother-than-temporary impairment of securities, income tax liabilities and goodwill and other identifiable intangible assets to be critical because management must make subjective and/or complex judgments about matters that are inherently uncertain and could be most subject to revision as new information becomes available. Additional information on these policies can be found in Note 1 of the Notes to Consolidated Financial Statements.

Allowance for Loan Losses and Related Provision

The allowance for loan losses represents management’s estimate of probable loan losses inherent in the loan portfolio. Determining the amount of the allowance for loan losses is considered a critical accounting estimate because it requires significant judgment and the use of estimates related to the amount and timing of expected future cash flows on impaired loans, estimated losses on pools of homogeneous loans based on historical loss experience, and consideration of current economic trends and conditions, all of which may be susceptible to significant change. The loan portfolio also represents the largest asset type on the Corporation’s Consolidated Statements of Condition.

The evaluation of the adequacy of the allowance for loan losses includes, among other factors, an analysis of historical loss rates by loan category applied to current loan totals. However, actual loan losses may be higher or lower than historical trends, which vary. Actual losses on specified problem loans, which also are provided for in the evaluation, may vary from estimated loss percentages, which are established based upon a limited number of potential loss classifications.

The allowance for loan losses is established through a provision for loan losses charged to expense. Management believes that the current allowance for loan losses will be adequate to absorb loan losses on existing loans that may become uncollectible based on the evaluation of known and inherent risks in the loan portfolio. The evaluation takes into consideration such factors as changes in the nature and size of the portfolio, overall portfolio quality, and specific problem loans and current economic conditions which may affect the borrowers’ ability to pay. The evaluation also details historical losses by loan category and the resulting loan loss rates which are projected for current loan total amounts. Loss estimates for specified problem loans are also detailed. All of the factors considered in the analysis of the adequacy of the allowance for loan losses may be subject to change. To the extent actual outcomes differ from management estimates, additional provisions for loan losses may be required that could materially adversely impact earnings in future periods. Additional information can be found in Note 1 of the Notes to Consolidated Financial Statements.


TABLE OF CONTENTS

33

Other-Than-Temporary Impairment of Securities

Securities are evaluated on at least a quarterly basis, and more frequently when market conditions warrant such an evaluation, to determine whether a decline in their value is other-than-temporary. FASB ASC 320-10-65, (previously FAS 115-2 and FAS 124-2, “Recognition and Presentation of Other-Than-Temporary Investments”), clarifies the interaction of the factors that should be considered when determining whether a debt security is other-than-temporarily impaired. For debt securities, management must assess whether (a) it has the intent to sell the security and (b) it is more likely than not that it will be required to sell the security prior to its anticipated recovery. These steps are done before assessing whether the entity will recover the cost basis of the investment. Previously, this assessment required management to assert that it hashad both the intent and the ability to hold a security for a period of time sufficient to allow for anticipated recovery in fair value to avoid recognizing an other-than-temporary impairment. This change does not affect the need to forecast recovery of the value of the security through either cash flows or market price.

In instances when a determination is made that an other-than-temporary impairment exists but the investor does not intend to sell the debt security and it is not more likely than not that it will be required to sell the debt security prior to its anticipated recovery, FASB ASC 320-10-65 changes the presentation and amount of the other-than-temporary impairment recognized in the income statement. The other-than-temporary impairment is separated into (a) the amount of the total other-than-temporary impairment related to a decrease in cash flows expected to be collected from the debt security (the credit loss) and (b) the amount of the total other-than-temporary impairment related to all other factors. The amount of the total other-than-temporary impairment related to the credit loss is recognized inthrough earnings. The amount of the total other-than-temporary impairment related to all other factors is recognized in other comprehensive income. Impairment charges on certain investment securities of approximately $5.6 million$652,000 were recognized in earnings during the year ended December 31, 2010.2013. Of this amount, $1.8 million$628,000 related to charges taken on twoa pooled trust preferred securities owned by the Corporation, $360,000security (or “TRUP”), and $24,000 related to principal losses on a variable rate private label collateralized mortgage obligation (“CMO”), $398,000 in principal losses on a variable rate private label CMO and $3.0 million on a trust preferred security.. The Corporation’s approach to determining whether or not other-than-temporary impairment exists for any of these investments was consistent with the accounting guidance in effect at that time. For the year ended December 31, 2010,2013, the Corporation primarily relied upon the guidance in FASB ASC 320-10-65, (previously FAS 115-2 and 124-2), FASB ASC 820-10-65 (previously FASB FAS 157-4) and FASB ASC 310-10-35 (previously FAS 114).310-10-35. Additional information can be found in Note 45 of the Notes to Consolidated Financial Statements.

Impairment charges on certain investment securities of approximately $4.2 million$870,000 were recognized in earnings during the year ended December 31, 2009.2012. Of this amount, $3.4 million related to charges taken on two pooled trust preferred securities owned by the Corporation, $188,000$68,000 related to a TRUP, $484,000 related to a variable rate private label CMO $140,000and $318,000 related to principal losses on a Lehman holding and $113,000 on an equity holding; additionally, the Corporation recorded a $364,000 charge related to a court order for the liquidation of the Reserve Primary Fund.variable rate private label CMO. The Corporation’s approach to determining whether or not other-than-temporary impairment exists for any of these investments was consistent with the accounting guidance in effect at that time. For the yearyears ended December 31, 2009,2012 and 2011, the Corporation primarily relied upon the guidance in FASB ASC 320-10-35 (previously FSP FAS 115-1 and 124-1),320-10-65, FASB ASC 820-10-35 (previously FASB FAS 157-3)820-10-65 and FASB ASC 325-40 (previously EITF 99-20).

325-10-35.

Income Taxes

The objectives of accounting for income taxes are to recognize the amount of taxes payable or refundable for the current year and deferred tax liabilities and assets for the future tax consequences of events that have been recognized in an entity’s financial statements or tax returns. Judgment is required in assessing the future tax consequences of events that have been recognized in the Corporation’s consolidated financial statements or tax returns.

Fluctuations in the actual outcome of these future tax consequences could impact the Corporation’s consolidated financial condition or results of operations. Notes 1 (under the caption “Use of Estimates”) and 1112 of the Notes to Consolidated Financial Statements include additional discussion on the accounting for income taxes.


Goodwill
 

TABLE OF CONTENTS

Goodwill

The Corporation has adopted the provisions of FASB ASC 350-10-05, (previously SFAS No. 142, “Goodwill and Other Intangible Assets”), which requires that goodwill be reported separate from other intangible assets in the Consolidated Statements of Condition and not be amortized but tested for impairment annually or more frequently if impairment indicators arise for impairment. No impairment charge was deemed necessary for the years ended December 31, 20102013, 2012 and 2009.

2011.

34

Fair Value of Investment Securities

In October 2008, the FASB issued FASB ASC 820-10-35, (previously FASB Staff Position 157-3, “Determining the Fair Value of a Financial Asset When The Market for That Asset Is Not Active”), to clarify the application of the provisions of FASB ASC 820-10-05 in an inactive market and how an entity would determine fair value in an inactive market. FASB ASC 820-10-35 was applied to the Corporation’s December 31, 2008 consolidated financial statements. Changes in the Corporation’s methodology occurred for the quarter ended June 30, 2009 as new accounting guidance was released in April of 2009 with mandatory adoption required in the second quarter. The Corporation relied upon the guidance in FASB ASC 820-10-65 (previously FASB FAS 157-4) when determining fair value for the Corporation’s pooled trust preferred securities and private issue corporate bond. See Note 1819 of the Notes to Consolidated Financial Statements,Fair Value Measurements and Fair Value of Financial Instruments, for further discussion.

Introduction

The following introduction to Management’s Discussion and Analysis highlights the principal factors that contributed to the Corporation’s earnings performance in 2010.

2013.

The year 20102013 was a challenging onenot only for the banking industry andin general but also for the Corporation.Corporation in particular. The current domestic economic issues, ongoing global financial crisisuncertainty and difficult economic climate hascontinued headwinds from new regulatory requirements created challenges to financial institutions both domestically and abroad. Interest rates in 20102013 and 20092012 were reflective of significantly lower short-term interest rates, in an effortas the Federal Reserve maintained its policy stance and continued to expand monetary policy with Quantitative Easing 3, or QE3, to further stimulate the economy. Competition for deposits in the Corporation’s marketplace remained intense while customers’ preference in seeking safety through full FDIC insured productseconomy and more liquidity became paramount in light of the financial crisis. Market conditions remained volatile during 2010 and 2009, related to global instability in the markets in connection with the sub-prime crises. While we continue to see an improvement in balance sheet strength and core earnings performance, we are still concerned with the credit stability of the broader markets.employment. As a result, the Federal Reserve kept overnight borrowing rates at zero to 25 basis points throughout the course of 2010.2013. Short-term interest rates remained lower than longer term rates, resulting in ana somewhat improved steepening of the yield curve. This resultedHistorically, such an improvement in an expansion ofyield curve has benefitted the Corporation’s net interest income, which is the Corporation’s primary source of income.
The Corporation also took actionwas proactive with its balance sheet strategies throughout the year2013 in order to reduce further exposure to interest rates through a reduction in higher cost funding and non-core balances in the deposit mix andcoupled with an improvement in the earning asset mix. The Corporation’s continued progress in growing and improving its balance sheet earning asset mix has helped to expand its spread and margin. We intend to continue to use a portion of the proceeds of maturing investments to help fund new loan growth.

The Corporation’s net income in 20102013 was $7.0$19.9 million or $0.43$1.21 per fully diluted common share, compared with net income of $3.8$17.5 million or $0.24$1.05 per fully diluted common share in 2009. A substantial portion2012. The growth in earnings performance in 2013 (as well as in 2012) was primarily attributable to earnings from core operations. Earnings for 2013 and associated operating performance was characterized by solid revenue growth, strong organic loan generation and a continuation of our earnings in 2010stable and 2009 was from core operations.

favorable asset quality profile. Earnings for 2010 were positively impacted by growth in net interest income, and spread expansion through bothprimarily from an increase in the average balance sheet improvements andof earning assets of $108.8 million, which was partially offset by a decline of 13 basis points in yield. The decline in yield on earning assets was somewhat offset by a decline of 8 basis points from a lower cost of funds as compared to 2009 and reductions in other real estate owned, marketing expenses and occupancy expenses. These improvements were somewhat offset by higher loan loss provisions as well as higher salaries and employee benefits, FDIC insurance, professional and consulting fees and computer expenses. Other expense for2012.

For the twelve-monthsyear ended December 31, 2010 totaled $24.12013, net interest income on a fully taxable equivalent basis amounted to $48.7 million, an increase of $1.0compared to $45.4 million or 4.5for the same period in 2012. For 2013, interest income increased by $2.6 million while interest expense decreased by $694,000 from last year. Compared to 2012, for 2013, as noted above average interest earning assets increased $108.8 million while net interest spread and margin decreased on a tax-equivalent basis by 5 basis points and 2 basis points, respectively. For 2013, the Corporation’s net interest margin decreased to 3.30 percent from the twelve-months ended December 31, 2009 due principallyas compared to the items mentioned above.


3.32 percent for 2012.
 

TABLE OF CONTENTS

The Corporation previously announced a strategic outsourcing agreement with Fiserv to provide core account processing services, which is consistent with the Corporation’s other strategic initiatives to streamline operations, reduce operating overhead and allow the Corporation to focus on core competencies of customer service and product development. This coupled with previously initiated cost reduction plans are intended to improve operating efficiencies, business and technical operations. The core processing transition was consummated duringNet interest margins reflected improvement in the fourth quarter of 2009. Additionally,2012, as prior action on reducing the consolidationcost of the Corporation’s branch office on 392 Springfield Avenue in Summit, New Jerseyfunds coupled with offsetting compression primarily as result of a continued high liquidity pool carried during the first quarter of 2009 into its new office on 545 Morris Avenue in Summit, New Jersey resulted in improved efficiencyperiods took root and increased customer service.

For the twelve months ended December 31, 2010, total salaries and benefits increased by $850,000 or 8.6 percentstarted to $10.8 million primarily attributable to additions to official staff and merit increases for existing staff of approximately $720,000 and increased medical insurance expense of $130,000.

The decreased tax rate resulted in part from the measurement and reassessment of the technical merits which led the Corporation to conclude that its position of the recognition of $2.6 million on a previously unrecognized tax benefit was sustainable. This in turn resulted in recognition of tax benefits previously unrecognized due to changes in the Corporation’s business entity structure during 2007 and into 2008 offset by a higher proportion of taxable income versus tax-exempt income in 2010 versus 2009. The decreased tax rate benefit was offset, in part, due to the surrender of Bank Owned Life Insurance Policies resulting in a $633,000 income tax expense in 2010.

abate further compression..

Total non-interest income decreaseddeclined as a percentage of total revenue, which is the sum of interest income and non-interest income, in 20102013 largely due to $1.3 milliona reduction in net securities lossesgains; $1.7 million in 2013 as compared to $491,000$2.0 million in net securities gains in 2009 as gains from sales of $4.9 million in 2010 were offset by losses of $6.2 million.2012. For the twelve months ended December 31, 2010,2013, total other income decreased $1.4 million$359,000 as compared with the twelve months ended December 31, 2009,2012, from $3.9$7.2 million to $2.5$6.9 million. Excluding net securities gains and losses and the bargain gain on acquisition of $899,000 in the respective periods, the Corporation recorded total other income of $3.8$5.1 million and $4.3 million in the twelve months ended December 31, 2010, compared to $3.4 million in2013 and 2012, respectively.
For the twelve months ended December 31, 2009, representing an increase of $396,0002013, total other expense increased $81,000, or 11.6 percent. This0.03 percent, compared to the year ended December 31, 2012. Excluding a repurchase agreement termination fee and acquisition cost incurred in 2012, the increase was $1.6 million and 6.6 percent. Increases primarily attributable toincluded salaries and employee benefits of $894,000, $531,000 in occupancy and equipment, $118,000 in marketing and advertising and $34,000 in professional and consulting, and $80,000 in all other expense. These increases were partially offset by decreases of $189,000$56,000 in FDIC insurance expense, $16,000 in stationery and $140,000printing expense, and $13,000 in other income and service charges, commissions and fees respectively. Increases in other incomeOREO expense. The Corporation’ s efficiency ratio for the twelve months ended December 31, 2010 were recorded primarily2013 was 46.9 percent as compared to 47.7 percent in loan fees2012.
35

Our continued performance put the Corporation at a competitive advantage while the competition for deposits in the Corporation’s marketplace remained intense. The Corporation expanded its client base and market share, as customers seek safety through high quality organizations to satisfy liquidity and safety and soundness, which became paramount in light of $137,000the protracted financial crisis. With that competitive advantage, the Corporation continues to move forward with momentum in expanding our presence in key markets. With the acquisition of Saddle River Valley Bank in 2012 and bank-owned life insurance incomethe opening of $70,000.

our Englewood office, we are working to solidify and expand the service relationship with our new customers. We remain excited by the potential to create incremental shareholder value from our strategic growth. We believe that this type of sequential earnings performance demonstrates the Corporation’s commitment to achieving meaningful growth in earnings performance, an essential component of providing consistent and favorable long-term returns to our shareholders. However, while we continue to see an improvement in balance sheet strength and core earnings performance, we still remain cautious about the credit stability of the broader markets.

Total assets at December 31, 20102013 were $1.207$1.673 billion, an increase of 1.002.7 percent from assets of $1.195$1.630 billion at December 31, 2009.2012. The increase in assets reflects the growth of $80$71.3 million in our investment securitiesloan portfolio as the Corporation soughtcontinued to adjustexpand its client base and loan production, deploying cash from increased deposit production into a more efficient earning asset mix to improve its return in the face of soft loan demand.mix. The growth in the investment securitiesearning asset portfolio was funded primarilyin part through reductionsdeposit growth of $35.1 million, which also resulted in cash and due from banks of $51.7 million andincreases in loans net of the allowance for loan losses and loans available for sale of $11.3$71.2 million. The Corporation has made a concerted effort to reduce non-core balances and, as mentioned in the preceding sentence, its uninvestedun-invested cash position was reduceddecreased by $51.7$23.4 million in 2010.2013. Additionally, there has been a concerted effort to reduce higher costing retail deposits.

Loan demand slowedcontinued to expand in 2010.2013. Overall, the portfolio declinedincreased year over year by approximately $11.3$71.3 million or 1.598.0 percent from 2009. While the year end balance in the net loan portfolio declined it should be noted that the average balance for the year actually increased by $15.9 million or 2.3 percent in the same period.2012. Demand for both commercial loans and real estate loans prevailed throughout the year in the Corporation’s market in New Jersey, despite the economic climate at both the state and national levels and market turmoil from the sub-prime markets. Thelevels.The Corporation is encouraged by loan demand and positive momentum is expected to returncontinue in growing that segment of earning assets in 2011.2014. However, the Corporation continues to remain concerned with the credit stability of the broader markets due to the weakened economic climate.

climate and continues to maintain a conservative credit culture. At December 31, 2013, the Corporation had $202.3 million in overall undisbursed loan commitments, which includes largely unused commercial lines of credit, home equity lines of credit and available usage from active construction facilities. Included in the overall undisbursed commitments are the Corporation's "Approved, Accepted but Unfunded" pipeline, which includes approximately $35.7 million in commercial and commercial real estate loans and $2.3 million in residential mortgages expected to fund over the next 90 days.

Asset quality continues to remainremains high and credit culture conservative.a primary focus of the Corporation. Even so, the stability of the economy and credit markets remains uncertain and as such, has had an impact on certain credits within our portfolio. The Corporation continuedDespite that, the Corporation’s asset quality continues to make provisionsimprove and our actions in 2013 related to asset quality have placed us near the allowance for loan losses as efforts are made to stabilize credit quality issues. top of all publicly traded banks and thrifts headquartered in the state of New Jersey.At December 31, 2010,2013, non-performing assets totaled $11.9$3.4 million or 0.980.20 percent of total assets, as compared with $13.7a decline from $5.0 million or 1.12 percent, at September 30, 2010 and


TABLE OF CONTENTS

$11.3 million or 0.940.31 percent at December 31, 2009.2012. The increasedecrease in non-performing assets from December 31, 20092012 was primarily attributable toachieved notwithstanding the addition of three largeseveral new residential loans (totaling approximately $0.3 million) and commercial loans (totaling approximately $1.7 million) into non-performing status. This was more than offset by decreases from pay-downs and an increase in troubled debt restructurings.

pay offs of $2.9 million, total charge-offs of $272,000, and the return to performing status of $0.4 million, while $220,000 was moved within the non-performing asset category from non-accrual to OREO.

At December 31, 2010,2013, the total allowance for loan losses amounted to approximately $8.9$10.3 million, or 1.251.08 percent of total loans. The allowance for loan losses as a percent of total non-performing loans amounted to 74.6329.4 percent at December 31, 2010 as compared with 74.7 percent at September 30, 20102013 and 77.2278.9 percent at December 31, 2009.2012. This decreaseincrease in the ratio from December 31, 20092012 to December 31, 20102013 was due to the increasedecrease in the level of non performingnon-performing assets, offset by increasesalong with an increase in the provisionallowance for loan loss of $479,000 in 2010 over 2009.

Deposit growth was strong in 2010, reflective of customers’ desire for safety and liquidity and flight to quality in light of the financial crisis. At December 31, 2010, total deposits for the Corporation were $860.3 million. Non-interest-bearing core deposits, a low cost source of funding, continue to be a key funding source. At December 31, 2010, this source of funding amounted to $144.2from $10.2 million or 13.4 percent of total funding sources and 16.8 percent of total deposits.

Certificates of deposit $100,000 and greater decreased to 13.9 percent of total deposits at December 31, 2010 from 17.82012.

Deposit grew strongly during 2013, with total deposits of $1.342 billion at December 31, 2013, increasing $35.1 million, or 2.7 percent, one year earlier. With the current turmoil in the financial markets, some of the Corporation’s depositors have become sensitive to obtaining full FDIC insurance for their time deposits. To accommodate its customers, the Corporation began offering Certificates of Deposit Account Registry Service (CDARS) in 2008. As a result of that offeringsince December 31, 2012. Total Demand, Savings, Money Market, and the temporary increase in insurance coverage by the FDIC to $250,000, the Corporation reported a decrease of $25.1 million in certificates of deposit greaterless than $100,000 increased $45.5 million or 3.9 percent from December 31, 2012, underscoring the strength of core growth. These increases were attributable to continued core deposit growth in overall segments of the deposit base, as well as in niche areas, such as municipal government, private schools and universities, together with the Saddle River Valley Bank transaction. Time certificates of deposit of $100,000 or more at December 31, 2010 as compared to year-end 2009.

2013, decreased by $11.4 million or 10.3 percent from December 31, 2012.

36

Total stockholders’ equity increased 18.94.9 percent in 20102013 to $121.0$168.6 million, and represented 10.0210.08 percent of total assets at year-end. Book value per common share (total common stockholders’ equity divided by the number of shares outstanding) increased to $6.83$9.61 as compared with $6.32$9.14 a year ago, primarily as a result of the $12.1 million capital raise from the Corporation’s stock offering consummated in September 2010 and earnings of $7.0$19.9 million in 2010.2013. Tangible book value per common share (which excludes goodwill and other intangibles from common stockholders’ equity) increased to $5.79$8.58 from $5.15$8.11 a year ago; see Item 6 of this Annual Report on Form 10-K for a reconciliation of tangible book value (which is a non-GAAP financial measure) to book value. Return on average tangible stockholders’ equity for the year ended December 31, 20102013 was 6.3013.45 percent compared to 4.0213.18 percent for 2009.2012. This increase was attributable to higher earnings in 20102013 compared with 2009 coupled with2012 partially offset by higher average equity due primarily to both the capital raise from the 2010 stock offering and a full year benefit from the capital received under the U.S. Treasury Capital Purchase Program and a rights offering during 2009.SBLF program. The Tier I Leverage capital ratio increased to 9.909.69 percent of total assets at December 31, 2010,2013, as compared with 7.739.02 percent at December 31, 2009.

2012, as an increase in retained earnings was offset only in part by the increased asset base in 2013.

The Corporation’s capital base includes $12.1 and $11.0the $11.25 million inof capital raisedreceived from the U.S. Treasury under the Small Business Lending Fund Program in 2011 and simultaneously, using the proceeds from the issuance of SBLF preferred stock and rights offerings completed in 2010 and 2009 respectively, as well asto redeem the $10 million of capital received from the U.S. Treasury under the Capital Purchase Program.TARP. It also includes $5.2 million in subordinated debentures at December 31, 20102013 and December 31, 2009.2012. This issuance of $5.0 million in floating rate MMCapS(SM)MMCapS(SM) Securities occurred on December 19, 2003. These securities presently are included as a component of Tier I capital for regulatory capital purposes. In accordance with FASB ASC 810, these securities are classified as subordinated debentures on the Corporation’s Consolidated Statements of Condition.

The Corporation’s risk-based capital ratios at December 31, 20102013 were 13.2812.10 percent for Tier I capital and 14.2912.91 percent for total risk-based capital. Total Tier I capital increased to approximately $116.6$159.4 million at December 31, 20102013 from $98.5$143.8 million at December 31, 2009.2012. The increase in Tier I capital primarily reflects the new capital received during 2010.

The Corporation announced an increase in its common stock buyback program on September 28, 2007 and June 26, 2008, under which the Parent Corporation was authorized to purchase up to 2,039,731 shares of Center Bancorp’s outstanding common stock. As ofearnings.

At December 31, 2010,2013, the Corporation's capital ratios continued to exceed the minimum Federal requirements for a bank holding company, and Union Center National Bank's capital ratios continued to exceed each of the minimum levels required for classification as a "well capitalized institution" under the Federal Deposit Insurance Corporation had repurchased


Improvement Act ("FDICIA").
 

TABLE OF CONTENTS

1,386,863 shares under the program at an average cost of $11.44 per share. As repurchases are now restricted pursuant to the Parent Corporation’s participation in TARP there were no repurchases during 2010. See Item 5 of this Annual Report on Form 10K.

The following sections discuss the Corporation’s Results of Operations, Asset and Liability Management, Liquidity and Capital Resources.

Results of Operations

Net income for the year ended December 31, 20102013 was $7,004,000$19,925,000 as compared to $3,771,000$17,507,000 earned in 20092012 and $5,842,000$13,926,000 earned in 2008,2011, an increase of 85.7313.8 percent from 20092012 to 2010.2013. For 2010,2013, the basic and fully diluted earnings per common share was $0.43$1.21 per share as compared with $0.24$1.05 per share in 20092012 and $0.45$0.80 per share in 2008.

2011.

For the year ended December 31, 2010,2013, the Corporation’s return on average stockholders’ equity (“ROE”) was 6.3012.07 percent and its return on average assets (“ROA”) was 0.591.22 percent. The Corporation’s return on average tangible stockholders’ equity (“ROATE”) was 7.4413.45 percent for 2010.2013. The comparable ratios for the year ended December 31, 2009,2012, were ROE of 4.0211.69 percent, ROA of 0.311.14 percent, and ROATE of 4.9113.18 percent. See the discussion and reconciliation of ROATE, which is a non-GAAP financial measure, under Item 6 of this Annual Report on Form 10-K.

Earnings for 2010 were negatively impacted by an2013 benefitted from increases in net interest income and increases to non interest income, primarily service charge and fees on deposit accounts, annuity and insurance fees, loan related fees and bank owned life insurance. The increase in other expense,non-interest expenses was due primarily to a higher provision for loan losses coupled with increases in salaries and benefits, FDIC insurance, professionaloccupancy expenses, marketing and consulting fees, computer expenseadvertising expenses and other expenses, and a reduction in non-interest incomeprimarily due to net securities lossesthe operation of Saddle River Valley Bank branches for a full year in 2010 as compared to gains in 2009.2013, and the opening of the Princeton and Englewood branches. These factorsincreases were partially offset in part, by an improvement in net interest income, due primarily to a lower cost of funds. Earnings in 2010 also benefitted from reductions in occupancy expense, marketingFDIC insurance, OREO expenses, stationery and OREO expense.

printing expenses.

37

Net Interest Income

The following table presents the components of net interest income on a tax-equivalent basis for the past three years


 2010 2009 2008
   Amount Increase
(Decrease)
from
Prior Year
 Percent
Change
 Amount Increase
(Decrease)
from
Prior Year
 Percent
Change
 Amount Increase
(Decrease)
from
Prior Year
 Percent
Change
   (Dollars in Thousands)
Interest income:
                                             
Investments $11,059  $(3,279  (22.9 $14,338  $(67  (0.47 $14,405  $(4,850  (25.19
Loans, including fees  37,200   449   1.22   36,751   641   1.78   36,110   2,583   7.70 
Federal funds sold and securities purchased under agreements to resell  0   0   0.00   0   (113  (100.00  113   (491  (81.29
Restricted investment in bank stocks  568   37   6.97   531   (63  (10.61  594   45   8.20 
Total interest income  48,827   (2,793  (5.41  51,620   398   0.78   51,222   (2,713  (5.03
Interest expense:
                                             
Deposits  6,006   (6,302  (51.20  12,308   (979  (7.37  13,287   (7,548  (36.23
Borrowings  8,779   (1,558  (15.07  10,337   (471  (4.36  10,808   1,013   10.34 
Total interest expense  14,785   (7,860  (34.71  22,645   (1,450  (6.02  24,095   (6,535  (21.34
Net interest income on a fully tax-equivalent basis  34,042   5,067   17.49   28,975   1,848   6.81   27,127   3,822   16.40 
Tax-equivalent adjustment  (113  397   (77.84  (510  818   (61.60  (1,328  478   (26.47
Net interest income $33,929  $5,464   19.20  $28,465  $2,666   10.33  $25,799  $4,300   20.00 

  2013  2012 2011 
  Amount Increase
(Decrease)
from
Prior Year
 Percent Change Amount Increase
(Decrease)
from
Prior Year
 Percent Change Amount Increase
(Decrease)
from
Prior Year
 Percent Change 
  (Dollars in Thousands) 
Interest income:                            
Investment  available-for-sale $13,833 $(1,234)  (8.19) $15,067 $1,018  7.25 $14,049 $2,990  27.04 
Investment held-to-maturity  5,275  2,562  94.43  2,713  743  37.72  1,970  1,970  100.00 
Loans, including fees  40,281  1,360  3.49  38,921  2,601  7.16  36,320  (880)  (2.37) 
Other interest-bearing  deposits  2  (6)  (75.00)  8  8         
Restricted investment in bank stocks  407  (45)  (9.96)  452  (12)  (2.59)  464  (104)  (18.31) 
Total interest income  59,798  2,637  4.61  57,161  4,358  8.25  52,803  3,976  8.14 
Interest expense:                            
Deposits  5,219  (189)  (3.49)  5,408  (112)  (2.03)  5,520  (486)  (8.09) 
Borrowings  5,863  (505)  (7.93)  6,368  (289)  (4.34)  6,657  (2,122)  (24.17) 
Total interest expense  11,082  (694)  (5.89)  11,776  (401)  (3.29)  12,177  (2,608)  (17.64) 
Net interest income on a
    tax-equivalent basis
  48,716  3,331  7.34  45,385  4,759  11.71  40,626  6,584  19.34 
Tax-equivalent adjustment  (2,530)  (641)  33.93  (1,889)  (1,013)  (115.64)  (876)  (763)  675.22 
Net interest income $46,186 $2,690  6.18 $43,496 $3,746  9.42 $39,750 $5,821  17.16 
Note: The tax-equivalent adjustment was computed based on an assumed statutory Federal income tax rate of 35 percent for 2013 and 2012 and 34 percent.percent for 2011. Adjustments were made for interest earned on tax-advantaged instruments.


TABLE OF CONTENTS

Historically, the most significant component of the Corporation’s earnings has been net interest income, which is the difference between the interest earned on the portfolio of earning assets (principally loans and investments) and the interest paid for deposits and borrowings, which support these assets. There were several factors that affected net interest income during 2010,2013, including the volume, pricing, mix and maturity of interest-earning assets and interest-bearing liabilities and interest rate fluctuations.

Net interest income is directly affected by changes in the volume and mix of interest-earning assets and interest-bearing liabilities, which support those assets, as well as changes in the rates earned and paid. Net interest income is presented in this financial review on a tax equivalent basis by adjusting tax-exempt income (primarily interest earned on various obligations of state and political subdivisions) by the amount of income tax which would have been paid had the assets been invested in taxable issues, and then in accordance with the Corporation’s consolidated financial statements. Accordingly, the net interest income data presented in this financial review differ from the Corporation’s net interest income components of the Consolidated Financial Statements presented elsewhere in this report.

38

Net interest income, on a fully tax-equivalent basis, for the year ended December 31, 20102013 increased $5.0$3.3 million, or 17.27.3 percent, to $34.0$48.7 million, from $29.0$45.4 million for 2009.2012. The Corporation’s net interest margin increased 45decreased 2 basis points to 3.30 percent from 2.853.32 percent. From 20082011 to 2009,2012, net interest income on a tax equivalent basis increased by $1.9$4.8 million and the net interest margin decreased by 1121 basis points. During 2010,2013, our net interest margin was positively impacted by increases in the investment portfolio funded by decreases in cash and due from banks and net loans funded by increases in core deposits, a decrease in high yielding time deposits in excess of $100,000 and reductions in borrowings. In 2009 theThese factors were offset, however, by lower rates earned on our loans and investments, resulting in an overall decline in our net interest margin was adversely impacted by the high level of uninvested cash, which accumulated due to the strong deposit growth.

margin.

The change in net interest income from 20092012 to 20102013 was attributable in part to the reduction in short-term interest rates that occurred in 2008 and have remained at historic low levels throughout 20102013 coupled with a sustained steepening of the interest rate yield curve. Steps were taken during 2009 and 2010 to improve the Corporation’s net interest margin by continuing to lower rates in concert with the decline in market benchmark rates. However, inIn light of the financial crisis, the Corporation experienced growth of $13.7$12.3 million in non-interest bearing deposits during 20102013 and, $58.1$34.2 million in savings, money market and time deposits under $100,000 during 20102013 as customers’ desire for safety and liquidity remained paramount in light of their overall investment concerns. During the fourth quarter of 2010,2013, the Corporation made a concerted effort to reduce non-core, single service deposits, and accordingly its uninvestedun-invested cash position, which had an adverse impact on the Corporation’s net interest margin during 2010. However, during2013. During the twelve months ended December 31, 2010,2013, the Corporation’s net interest spread improveddeclined by 345 basis points as a 3313 basis point decrease in the average yield on interest-earning assets was more thannot quite offset by a 678 basis point decrease in the average interest rates paid on interest-bearing liabilities.

For the year ended December 31, 2010,2013, average interest-earning assets increased by $12.3$108.8 million to $1.031$1.478 billion, as compared with the year ended December 31, 2009.2012. The 20102013 change in average interest-earning asset volume was primarily due to increased loan volume which is consistent with the balance sheet strategies of changing and improving the mix of average earning assets.increased investment volume. Increased average loan and investment volume in 20102013 was funded primarily by the reduction of its uninvested cash position.increased deposit growth. Average interest-bearing liabilities decreasedincreased by $72.1$25.9 million, due primarily to a decreasean increase in CDARS Reciprocal deposits.

interest bearing deposits of $36.4 million partially offset by decreases in borrowings of $10.5 million.

For the year ended December 31, 2009,2012, average interest-earning assets increased by $102.4$216.7 million to $1.018$1.4 billion, as compared with the year ended December 31, 2008.2011. The 20092012 change in average interest-earning asset volume was primarily due to increased volumes of investment securities, lower short-term investmentsvolume and increased loan volume.

Increased average investment volume in 2012 was funded primarily by the increased deposit growth. Average interest-bearing liabilities increased by $168.3 million, due primarily to an increase in interest bearing deposits of $201.7 million partially offset by decreases in borrowings of $33.4 million.

The factors underlying the year-to-year changes in net interest income are reflected in the tables presented onpages 38 and 40, each of which have been presented on a tax-equivalent basis (assuming a 35 percent tax rate for 2013 and 2012 and 34 percent tax rate)for 2011). The table on page 42 (Average Statements of Condition with Interest and Average Rates) shows the Corporation’s consolidated average balance of assets, liabilities and stockholders’ equity, the amount of income produced from interest-earning assets and the amount of expense incurred from interest-bearing liabilities, and net interest income as a percentage of average interest-earning assets.


TABLE OF CONTENTS

39

Net Interest Margin

The following table quantifies the impact on net interest income (on a tax-equivalent basis) resulting from changes in average balances and average rates over the past three years. Any change in interest income or expense attributable to both changes in volume and changes in rate has been allocated in proportion to the relationship of the absolute dollar amount of change in each category.

Analysis of Variance in Net Interest Income Due to Volume and Rates

      
 2010/2009
Increase (Decrease)
Due to Change in:
 2009/2008
Increase (Decrease)
Due to Change in:
   Average
Volume
 Average
Rate
 Net
Change
 Average
Volume
 Average
Rate
 Net
Change
   (Dollars in Thousands)
Interest-earning assets:
                              
Investment securities:
                              
Taxable $700  $(2,813 $(2,113 $3,553  $(1,355 $2,198 
Non-Taxable  (1,122  (44  (1,166  (2,463  86   (2,377
Loans, net of unearned discount  1,002   (553  449   3,864   (3,223  641 
Federal funds sold and securities purchased under agreements to resell  (0  (0  (0  (56  (57  (113
Restricted investment in bank stocks  (12  49   37   25   24   49 
Total interest-earning assets  568   (3,361  (2,793  4,923   (4,525  398 
Interest-bearing liabilities:
                              
Money market deposits  54   (749  (695  (545  (1,298  (1,843
Savings deposits  286   (1,110  (824  1,017   483   1,500 
Time deposits  (1,905  (2,262  (4,167  3,648   (3,050  598 
Other interest-bearing deposits  309   (925  (616  204   (1,438  (1,234
Borrowings and subordinated debentures  (709  (849  (1,558  (463  (8  (471
Total interest-bearing liabilities  (1,965  (5,895  (7,860  3,861   (5,311  (1,450
Change in net interest income $2,533  $2,534  $5,067  $1,062  $786  $1,848 

  2013/2012
Increase (Decrease)
Due to Change in:
 2012/2011
Increase (Decrease)
Due to Change in:
 
  Average
Volume
 Average
Rate
 Net
Change
 Average
Volume
 Average
Rate
 Net
Change
 
  (Dollars in Thousands) 
Interest-earning assets:                   
Investment securities:                   
Available for sale                   
Taxable $(742) $287 $(455) $1,294 $(2,368) $(1,074) 
Non-Taxable  (839)  60  (779)  1,770  322  2,092 
Held to maturity                   
Taxable  143  233  376  335  (320)  15 
Non-Taxable  2,662  (476)  2,186  702  26  728 
Loans, net of unearned discount  4,320  (2,960)  1,360  5,296  (2,695)  2,601 
Other interest-bearing deposits  (6)    (6)  8    8 
Restricted investment in bank
    stocks
  (7)  (38)  (45)  (3)  (9)  (12) 
Total interest-earning assets  5,531  (2,894)  2,637  9,402  (5,044)  4,358 
Interest-bearing liabilities:                   
Money market deposits  173  11  184  767  (220)  547 
Savings deposits  (18)  (66)  (84)  54  (292)  (238) 
Time deposits  (160)  (159)  (319)  (347)  (26)  (373) 
Other interest-bearing deposits  76  (46)  30  277  (325)  (48) 
Borrowings and subordinated
    debentures
  (409)  (96)  (505)  (1,236)  947  (289) 
Total interest-bearing liabilities  (338)  (356)  (694)  (485)  84  (401) 
Change in net interest income $5,869 $(2,538) $3,331 $9,887 $(5,128) $4,759 
Interest income on a fully tax-equivalent basis for the year ended December 31, 2010 decreased2013 increased by approximately $2.8$2.6 million or 5.44.6 percent as compared with the year ended December 31, 2009.2012. This decreaseincrease was due primarily to a decreaseincreases in the balances of the Corporation’s tax exemptloan and investment securities portfolios offset in part by an increase in the loan portfolio and a decline in rates due to the actions taken by the Federal Reserve to lowermaintain historically low market interest rates.
The Corporation’s loan portfolio increased on average $15.8$93.3 million to $708.4$908.8 million from $692.6$815.5 million in 2009,2012, primarily driven by growth in commercial loans and commercial real estate.

The loan portfolio represented approximately 68.761.5 percent of the Corporation’s interest-earning assets (on average) during 20102013 and 68.059.6 percent for 2009.2012. Average investment securities decreasedincreased during 20102013 by $3.3$18.1 million compared to 20092012 as the Corporation has continued to reduceincrease its concentration in tax-exempt securities and focused on purchases of lower risk-based mortgage backed securities. The average yield on interest-earning assets decreased from 5.074.18 percent in 20092012 to 4.744.05 percent in 2010. The volume of Federal Funds sold and securities purchased under agreement to resell remained at $0 on average for both 2010 and 2009.

The increase in the volume of loans in 2010 primarily reflected increases in commercial and commercial real estate loans. 2013.

The increase in the average volume on total interest-earning assets created an increase in interest income of $568,000,$5.5 million, as compared with a declinedecrease of $3.4$2.9 million attributable to rate decreases in most interest-earning assets.

40

Interest income (fully tax-equivalent)(tax-equivalent) increased by $398,000$4.4 million from 20082011 to 20092012 primarily due to an increaseincreases in the balances of the Corporation’s loan volume,and investment securities portfolios offset in large part by a decline in yield. The decrease in average yield on total


rates due to the actions taken by the Federal Reserve to maintain historically low market interest rates.
 

TABLE OF CONTENTS

interest-earning assets created a $4.5 million reduction to interest income as compared with a contribution of $4.9 million attributable to volume increases, principally loans.

The Federal Open Market Committee (“FOMC”) kept the Federal Funds target rate at zero to 0.25 percent throughout 2010.2013. This action by the FOMC allowed the Corporation to reduce liability costs throughout 2010.

2013.

Interest expense for the year ended December 31, 20102013 was principally impacted by both volume and rate mix related factors. The rate related changes resulted in decreased expense of $694,000 on most interest-bearing deposits and borrowings in 2010 coupled with a decline in average volume of time deposits and borrowings during 2010.2013. For the year ended December 31, 2010,2012, interest expense decreased $7.9 million$401,000 or 34.73.3 percent as compared with 2009.2011, principally reflecting a reduction in the volume of borrowings. During 2010,2012, the Corporation continued to lowerlowered rates in concert with the decline in market benchmark rates. The result was an improvement in the Corporation’s cost of funds andbut that was not enough to offset a decrease in the rates earned on interest earning assets resulting in a decrease in the net interest spread. Average interest-bearing liabilities decreased $72.1 million, primarilyincreased $168.3 million; the growth was represented in CDARS Reciprocalall deposit categories, except time deposits, and in borrowings.

as the flight to quality continued as depositors sought the safety of FDIC insurance.

For the year ended December 31, 2009,2013, interest expense decreased $1.5 million$694,000 or 6.05.9 percent as compared with 2008. Total interest-bearing liabilities increased on average $193.9 million, primarily in money market deposits and CDARS Reciprocal deposits.2012. The Corporation’s net interest spread on a tax-equivalent basis (i.e., the average yield on average interest-earning assets, calculated on a tax equivalent basis, minus the average rate paid on interest-bearing liabilities) increased 34decreased 5 basis points to 3.133.14 percent in 20102013 from 2.793.19 percent for the year ended December 31, 2009.2012. The increasedecrease in 20102013 reflected an expansiona decline of spreads between yields earned on loans and investments and rates paid for supporting funds. During 2010,2013, spreads improveddeclined due in part to monetary policy maintained by the FOMC keeping the Federal funds rate at zero to 0.25 percent throughout 20102013 coupled with a steepening of the yield curve that occurred during 2010.

2013.

The net interest spread increased 21decreased 20 basis points in 20092012 as compared with 2008,2011, primarily as a result of an expansiona decline of spreads between yields earned on loans and investments and rates paid for supporting funds. During 2009,2012, spreads improveddeclined due in part to monetary policy maintained by the FOMC keeping the Federal funds rate at zero to 0.25 percent throughout 2012 coupled with a steepening of the yield curve that occurred during 2009.

2012.

The cost of total average interest-bearing liabilities decreased to 1.610.91 percent, a decrease of 678 basis points, for the year ended December 31, 2010,2013, from 2.280.99 percent for the year ended December 31, 2009,2012, which followed a decrease of 7320 basis points from 3.011.19 percent for the year ended December 31, 2008.

2011.

The contribution of non-interest-bearing sources (i.e., the differential between the average rate paid on all sources of funds and the average rate paid on interest-bearing sources) decreased to 2110 basis points, a decrease of 54 basis points in 20102013 from 2009.2012. Comparing 20092012 and 2008,2011, there was a decrease of 112 basis points to 2614 basis points on average from 3716 basis points on average during the year ended December 31, 2008.

2012.

41

The following table, “Average Statements of Condition with Interest and Average Rates”, presents for the years ended December 31, 2010, 20092013, 2012 and 2008,2011, the Corporation’s average assets, liabilities and stockholders’ equity. The Corporation’s net interest income, net interest spreads and net interest income as a percentage of interest-earning assets (net interest margin) are also reflected.


TABLE OF CONTENTS

AVERAGE STATEMENTS OF CONDITION WITH INTEREST AND AVERAGE RATES


 Years Ended December 31,
   2010 2009 2008
(Tax-Equivalent Basis) Average
Balance
 Income/
Expense
 Yield/
Rate
 Average
Balance
 Income/
Expense
 Yield/
Rate
 Average
Balance
 Income/
Expense
 Yield/
Rate
   (Dollars in Thousands)
ASSETS
                                             
Interest-earning assets:
                                             
Investment securities:(1)
                                             
Taxable $305,927  $10,726   3.51 $289,414  $12,839   4.44 $211,185  $10,529   4.99
Non-taxable  5,880   333   5.66  25,677   1,499   5.84  67,890   3,876   5.71
Loans, net of unearned income:(2)  708,425   37,200   5.25  692,562   36,751   5.31  622,533   36,110   5.80
Federal funds sold and securities purchased under agreements to resell                   4,047   113   2.79
Restricted investment in bank stocks  10,293   568   5.52  10,526   531   5.04  10,104   594   5.88
Total interest-earning assets  1,030,525   48,827   4.74  1,018,179   51,620   5.07  915,759   51,222   5.59
Non-interest-earning assets:
                                             
Cash and due from banks  81,681             128,156             16,063           
Bank owned life insurance  27,045             24,941             22,627           
Intangible assets  16,993             17,069             17,158           
Other assets  36,817             42,980             37,602           
Allowance for loan losses  (8,579            (6,916            (5,681          
Total non-interest earning assets  153,957         206,230         87,769       
Total assets $1,184,482        $1,224,409        $1,003,528       
LIABILITIES & STOCKHOLDERS’ EQUITY
                                             
Interest-bearing liabilities:
                                             
Money market deposits $127,614  $940   0.74 $123,427  $1,635   1.32 $150,373  $3,478   2.31
Savings deposits  168,591   1,226   0.73  145,536   2,050   1.41  63,192   550   0.87
Time deposits  210,565   2,683   1.27  319,639   6,850   2.14  178,761   6,252   3.50
Other interest-bearing deposits  169,479   1,157   0.68  140,890   1,773   1.26  131,452   3,007   2.29
Short-term and long-term borrowings  239,777   8,568   3.57  258,607   10,146   3.92  270,390   10,501   3.88
Subordinated debentures  5,155   211   4.09  5,155   191   3.71  5,155   307   5.96
Total interest-bearing liabilities  921,181   14,785   1.61  993,254   22,645   2.28  799,323   24,095   3.01
Non-interest-bearing liabilities:
                                             
Demand deposits  142,364             124,966             114,400           
Other non-interest-bearing deposits  0             333             368           
Other liabilities  9,801         12,003         6,314       
Total non-interest-bearing liabilities  152,165         137,302         121,082       
Stockholders’ equity  111,136         93,853         83,123       
Total liabilities and stockholders’ equity $1,184,482        $1,224,409        $1,003,528       
Net interest income (tax-equivalent basis)     34,042         28,975         27,127    
Net interest spread        3.13        2.79        2.58
Net interest income as percent of earning assets (margin)        3.30        2.85        2.96
Tax-equivalent adjustment(3)     (113        (510        (1,328   
Net interest income    $33,929        $28,465        $25,799    

  Years Ended December 31, 
  2013  2012  2011 
(Tax-Equivalent Basis) Average
Balance
 Income/
Expense
  Yield/
Rate
  Average
Balance
 Income/
Expense
  Yield/
Rate
  Average
Balance
 Income/
Expense
  Yield/
Rate
 
  (Dollars in Thousands) 
ASSETS                              
Interest-earning assets:                              
Investment securities: (1)                              
Available for sale                              
Taxable $374,361 $11,027  2.95% $399,739 $11,482  2.87% $359,939 $12,556  3.49%
Non-taxable  59,320  2,806  4.73%  77,069  3,585  4.65%  28,067  1,493  5.32%
Held to maturity                              
Taxable  38,598  1,278  3.31%  33,707  902  2.68%  23,041  887  3.85%
Non-taxable  87,175  3,997  4.59%  30,824  1,811  5.88%  18,869  1,083  5.74%
Loans, net of unearned income: (2)  908,784  40,281  4.43%  815,501  38,921  4.77%  712,895  36,320  5.09%
Other interest-bearing deposits  351  2  0.57%  2,766  8  0.29%      %
Restricted investment in bank stocks  8,983  407  4.53%  9,120  452  4.96%  9,185  464  5.05%
Total interest-earning assets  1,477,572  59,798  4.05%  1,368,726  57,161  4.18%  1,151,996  52,803  4.58%
Non-interest-earning assets:                              
Cash and due from banks  82,447         100,469         99,607       
Bank owned life insurance  35,217         30,668         28,405       
Intangible assets  16,842         16,879         16,930       
Other assets  31,427         31,703         33,984       
Allowance for loan losses  (10,235)         (9,972)         (9,660)       
Total non-interest earning assets  155,698         169,747         169,266       
Total assets $1,633,270        $1,538,473        $1,321,262       
LIABILITIES & STOCKHOLDERS’ EQUITY                              
Interest-bearing liabilities:                              
Money market deposits $411,209 $1,827  0.44% $372,140 $1,643  0.44% $204,664 $1,096  0.54%
Savings deposits  185,793  613  0.33%  190,744  697  0.37%  179,759  935  0.52%
Time deposits  172,444  1,582  0.92%  189,060  1,901  1.01%  223,560  2,274  1.02%
Other interest-bearing deposits  298,530  1,197  0.40%  279,631  1,167  0.42%  221,839  1,215  0.55%
Short-term and long-term borrowings  146,425  5,705  3.90%  156,905  6,200  3.95%  190,343  6,497  3.41%
Subordinated debentures  5,155  158  3.06%  5,155  168  3.26%  5,155  160  3.10%
Total interest-bearing liabilities  1,219,556  11,082  0.91%  1,193,635  11,776  0.99%  1,025,320  12,177  1.19%
Non-interest-bearing liabilities:                              
Demand deposits  233,835         182,642         159,059       
Other liabilities  14,854         12,482         7,045       
Total non-interest-bearing liabilities  248,689         195,124         166,104       
Stockholders’ equity  165,025         149,714         129,838       
Total liabilities and stockholders’ equity $1,633,270        $1,538,473        $1,321,262       
Net interest income (tax-equivalent basis)     48,716         45,385         40,626    
Net interest spread        3.14%        3.19%        3.39%
Net interest income as percent of earning
     assets (margin)
        3.30%        3.32%        3.53%
Tax-equivalent adjustment (3)     (2,530)         (1,889)         (876)    
Net interest income    $46,186        $43,496        $39,750    
(1)Average balances for available-for-sale securities are based on amortized cost.
(2)Average balances for loans include loans on non-accrual status.
(3)The tax-equivalent adjustment was computed based on a statutory Federal income tax rate of 35 percent for 2013 and 2012 and 34 percent.percent for 2011.

42


TABLE OF CONTENTS

Investment Portfolio

For the year ended December 31, 2010,2013, the average volume of investment securities decreasedincreased by $3.3$18.1 million to approximately $311.8$559.4 million or 30.337.9 percent of average earning assets, from $315.1$541.3 million on average, or 30.939.5 percent of average earning assets, in 2009.2012. At December 31, 2010,2013, the total investment portfolio amounted to $378.1$538.4 million, an increasea decrease of $80.0$16.5 million from December 31, 2009.2012. The increase at year-end but decrease in the average volume of investment securities reflects the fact that the Corporation invested in the investment portfolio during the fourth quarter of 2010. Withwith the strong deposit growth experienced during 20102013 and large buildup of liquidity, the Corporation begancontinued to prudently expand the size of its investment portfolio in an effort to deploy excess cash into earning assets. At December 31, 2010,2013, the principal components of the investment portfolio are U.S. Treasury and U.S. Government Agency Obligations, Federal Agency Obligations including mortgage-backed securities, Obligations of U.S. states and political subdivision, corporate bonds and notes, and other debt and equity securities.

In the past, the Corporation’s investment portfolio also consisted of overnight investments that were made in the Reserve Primary Fund (the “Fund”), a money market fund registered with the Securities and Exchange Commission as an investment company under the Investment Company Act of 1940. On September 22, 2008, the Fund announced that redemptions of shares of the Fund were suspended pursuant to an SEC order so that an orderly liquidation could be effected for the protection of the Fund’s investors. Through December 31, 2010, the Corporation received six distributions from the Fund, totaling approximately 99 percent of its outstanding balance.

During the fourth quarter of 2009, the Corporation recorded a $364,000, or approximately 1 percent, other-than-temporary impairment charge to earnings relating to this court ordered liquidation of the Fund. The Corporation’s outstanding carrying balance in the Fund as of December 31, 2010 was zero and recorded to earnings approximately $30,000 as partial recovery of the OTTI charge. Future liquidation distributions received by the Corporation, if any, will be recorded to earnings.

During the twelve month periodyear ended December 31, 2010,2013, volume related factors decreasedincreased investment revenue by $422,000,$1.2 million, while rate related factors decreasedincreased investment revenue by $2.8 million.$104,000. The tax-equivalent yield on investments decreasedincreased by 10014 basis points to 3.553.42 percent from a yield of 4.553.28 percent during the year ended December 31, 2009.2012. The reductionsincrease in the investment portfolio primarilyresulted from the large buildup of liquidity, which caused the Corporation to prudently expand the size of its investment portfolio in the tax-exempt sector, were made during the first three quarters of 2010an effort to reduce exposure to these particular sectors of the portfolio while continuing to providedeploy excess cash flow for loan funding and forecasted liability outflows.into earning assets. The yield on the portfolio declinedincreased compared to 20092012 due primarily to saleshigher rates earned on taxable securities.

During 2013, the Corporation reclassified at fair value approximately $138.3 million in available-for-sale investment securities to the held-to-maturity category. The related after-tax losses of approximately $1.5 million (on a pre-tax basis of $2.6 million) remained in accumulated other comprehensive income and will be amortized over the remaining life of the securities as wellan adjustment of yield, offsetting the related amortization of the premium or accretion of the discount on the transferred securities. No gains or losses were recognized at the time of reclassification. Management considers the held-to-maturity classification of these investment securities to be appropriate as the impact thatCorporation has the lower interest rate environment had on higher yieldingpositive intent and ability to hold these securities that had either matured, were prepaid, or were called. Since loan demand slowed during 2010, the Corporation invested in the investment portfolio to realign the earning asset mix in the fourth quarter of 2010.

Improvement in yield has been limited by reinvesting opportunities. During the first quarter of 2009, the Corporation recorded a $140,000 other-than-temporary impairment charge on its Lehman Brothers bond holding. Through June 30, 2009, other-than-temporary impairment charges taken on this bond amounted to $1,440,000. As part of the Corporation’s tax strategies, management elected to sell the Lehman bond holding during the third quarter of 2009.

maturity.

The Corporation owns twoowned one pooled trust preferred securitiessecurity (“Pooled TRUPS”), which consistsconsisted of securities issued by financial institutions and insurance companies. The Corporation holdsheld the mezzanine tranche of these securities. Senior tranches generally are protected from defaults by over-collateralization and cash flow default protection provided by subordinated tranches, with senior tranches having the greatest protection and mezzanine tranches subordinated to the senior tranches. One of theDuring 2013, Pooled TRUPS,TRUP, ALESCO 6, hasVII, incurred its seventheighteenth interruption of cash flow payments to date. Management reviewed the expected cash flow analysis and credit support to determine if it was probable to that all principal and interest would be repaid, and recorded a $33,000an other-than-temporary impairment charge for the three months ended December 31, 2010 and $500,000of $628,000 for the twelve months ended December 31, 2010, which represents 15.6 percent of the par amount of $3.2 million.2013. The new cost basis for this security hashad been written down to $228,000. The other Pooled TRUP, ALESCO 7 incurred its fifth interruption of cash flow payments to date. Management determined that an other-than-temporary impairment exists on this$260,000. This security as well and recorded a $677,000 charge during the fourth quarter of 2010, and $1.3 million for the twelve months ended


TABLE OF CONTENTS

was sold effective December 31, 2010 which represents 41.9 percent of the par amount of $3.1 million. The new cost basis for this security has been written down to $778,000.

One of the Pooled TRUPS incurred its third interruption of cash flow payments in 2009. Management reviewed the cash flow analysis and credit support to determine if it was probable that all principal and interest would be repaid, and recorded a $1.1 million other-than-temporary impairment charge for the three months ended December 31, 2009 and $2.5 million for the twelve months ended December 31, 2009, which represented 78.7 percent of the par amount of $3.1 million. At December 31, 20092013 at the new cost basis for this security has been written down to $665,000. The other Pooled TRUP incurred its first interruption of cash flow payments in the fourth quarter of 2009. Management determined that an other-than-temporary impairment existed on this security as well and recorded a $1.0 million charge during the fourth quarter of 2009, which represented 32.3 percent of the par amount of $3.0 million. At December 31, 2009 the new cost basis for this security has been written down to $2.0 million.

basis.

43

The Corporation owns aowned one variable rate private label collateralized mortgage obligationsobligation (CMO), which werewas also evaluated for impairment. Management had applied aggressive default rates to identify if any credit impairment exists, as these bonds were downgraded to below investment grade.The bond was sold at $2.1 million with no losses incurred at the sale. The Corporation recorded $398,000$24,000 in principal losses on these bonds in 2010, and expects additional losses in future periods. As such, management determined that an other-than-temporary impairment charge exists and recorded a $360,000 write down to the bonds, which represents 8.0 percent of the par amount of $4.5 million.2013. The new cost basis for these securities has been written down to $3.9 million.

During 2009, the Corporation recorded $113,000 of$318,000 in principal losses and $484,000 other-than-temporary impairment charges relating to one equity holdingcharge on this bond in bank stocks. Due to the deterioration in that bank’s financial condition and that near term prospects in market value recovery appear remote, management determined that the expectation to recover its cost is not temporary. As such, this equity was written down to fair market value at the time of evaluation, which was December 31, 2009.

2012.

Securities available-for-sale are a part of the Corporation’s interest rate risk management strategy and may be sold in response to changes in interest rates, changes in prepayment risk, liquidity management and other factors. The Corporation continues to reposition the investment portfolio as part of an overall corporate-wide strategy to produce reasonable and consistent margins where feasible, while attempting to limit risks inherent in the Corporation’s balance sheet.

At December 31, 2010,2013, the net unrealized lossgain carried as a component of accumulated other comprehensive income and included in stockholders’ equity, net of tax, amounted to a net unrealized lossgain of $5.3$2.4 million as compared with a net unrealized lossgain of $8.4$8.8 million at December 31, 2009,2012, resulting from changes in market conditions and interest rates at period-end December 31, 2010.2013. As a result of the inactive condition of the markets amidst the financial crisis, the Corporation elected to treat certain securities under a permissible alternate valuation approach at December 31, 20102013 and 2009.2012. For additional information regarding the Corporation’s investment portfolio, see Note 45, Note 15 and Note 1819 of the Notes to the Consolidated Financial Statements.

During 2010,2013, securities sold from the Corporation’s available-for-sale portfolio amounted to $644.1$122.2 million, as compared with $665.8$130.1 million in 2009.2012. The gross realized gains on securities sold amounted to approximately $4,872,000$2,451,000 in 20102013 compared to $5,897,000$2,905,000 in 2009,2012, while the gross realized losses, which included impairment charges of $652,000, amounted to approximately $635,000$740,000 in 20102013 compared to $1,168,000$893,000 in 2009.2012. During 2010,2013, the Corporation recorded a $3.0 millionan other-than-temporary charge of $628,000 on its trust preferred securities, $1.8 millionthe Pooled TRUP, ALESCO VII, and $24,000 in principal losses on two pooled trust preferred securities and $360,000the same variable rate private label CMO. During 2012, the Corporation recorded an other-than-temporary charge of $68,000 on the Pooled TRUP, ALESCO VII, a $484,000 other-than-temporary charge on a variable rate private label CMO and $398,000$318,000 in principal losses on thisthe same variable rate private label CMO. During 2009,
The varying amount of sales from the available-for-sale portfolio over the past few years, and the significant volume of such sales in 2012, reflect the significant volatility present in the market. Given the historic low interest rates prevalent in the market, it is necessary for the Corporation recordedto protect itself from interest rate exposure. Securities that once appeared to be sound investments can, after changes in the market, become securities that the Corporation has the flexibility to sell to avoid losses and mismatches of interest-earning assets and interest-bearing liabilities at a $140,000 other-than-temporary impairment charge on its Lehman Brothers corporate bond, $3,433,000 on two pooled trust preferred securities, $188,000 on a variable rate private label CMO, $364,000 on a charge to earnings relating to the court ordered liquidation of the Reserve Primary Fund, and $113,000 of write-downs relating to a single equity holding in bank stocks.


later time.
 

TABLE OF CONTENTS

44

The table below illustrates the maturity distribution and weighted average yield on a tax-equivalent basis for investment securities at December 31, 2010,2013, on a contractual maturity basis.


 US Treas &
Agency
Securities
 Federal
Agency
Obligations
 Mortgage
Backed
Securities
 Obligations
in U.S.
States &
Political
Subdivisions
 Trust
Preferred
 Corp Bonds
& Notes
 Collateralized
Mortgage
Obligations
 Equity
Securities
 Total
Due in 1 year or less
                                             
Amortized Cost $  $  $  $  $  $1,503  $  $  $1,503 
Market Value $  $  $  $  $  $1,500  $  $  $1,500 
Weighted Average Yield            1.35      1.35
Due after one year through five years
                                             
Amortized Cost $  $55  $  $  $  $19,130  $  $  $19,185 
Market Value $  $55  $  $  $  $18,755  $  $  $18,810 
Weighted Average Yield    0.91        2.50      2.50
Due after five years through ten years
                                             
Amortized Cost $7,123  $57  $5,165  $18,002  $  $37,930  $  $  $68,277 
Market Value $6,995  $57  $5,044  $17,577  $  $36,829  $  $  $66,502 
Weighted Average Yield  3.23  1.85  3.41  5.67    4.21      4.43
Due after ten years
                                             
Amortized Cost $  $67,939  $174,872  $20,310  $21,222  $4,484  $3,941  $5,135  $297,903 
Market Value $  $68,369  $172,689  $19,648  $18,731  $4,350  $2,728  $4,753  $291,268 
Weighted Average Yield    2.57  2.37  5.39  6.85  6.00  3.21  0.02  2.97
Total
                                             
Amortized Cost $7,123  $68,051  $180,037  $38,312  $21,222  $63,047  $3,941  $5,135  $386,868 
Market Value $6,995  $68,481  $177,733  $37,225  $18,731  $61,434  $2,728  $4,753  $378,080 
Weighted Average Yield  3.23  2.57  2.40  5.52  6.85  3.75  3.21  0.02  3.19

  Due in 1 year or less  Due after 1 year
through 5 years
  Due after 5 years
through 10 years
  Due after 10 years  Total 
  Amortized
Cost
 Weighted
Average
Yield
  Amortized
Cost
 Weighted
Average
Yield
  Amortized
Cost
 Weighted
Average
Yield
  Amortized
Cost
 Weighted
Average
Yield
  Amortized
Cost
 Weighted
Average
Yield
  Market
Value
 
(Dollars in thousands)                                  
Investment Securities Available-for-Sale                                  
U.S. Treasury and Agency Securities $ % $ % $14,344 2.25% $ % $14,344 2.25% $13,519 
Federal Agency Obligations      2,828 1.75   835 1.72   16,904 2.22   20,567 2.14   19,941 
Residential Mortgage Pass-through Securities      223 2.11   5,021 2.33   43,068 2.62   48,312 2.59   48,874 
Commercial Mortgage Pass-through
    Securities
      4,064 2.11       3,081 2.63   7,145 2.33   6,991 
Obligations of U.S. States and Political
    Subdivisions
          5,758 3.10   25,046 3.58   30,804 3.49   31,460 
Trust Preferred          4,500 5.37   15,263 5.89   19,763 5.77   19,403 
Corporate Bonds and Notes  9,588 1.95   54,027 2.68   90,567 4.40       154,182 3.64   158,630 
Asset-backed Securities      5,148 0.93   7,234 1.07   3,351 1.73   15,733 1.16   15,979 
Certificates of deposit  150 1.38   1,203 1.81   527 2.25   370 2.52   2,250 2.00   2,262 
Equity Securities              376    376    287 
Other Securities      2,500        3,171    5,671    5,724 
Total $9,738 1.94% $69,993 2.37% $128,786 3.84% $110,630 3.12% $319,147 3.21% $323,070 
Investment Securities Held-to-Maturity                                  
U.S. Treasury and Agency Securities $ % $ % $28,056 2.51% $ % $28,056 2.51% $27,037 
Federal Agency Obligations              15,249 2.85   15,249 2.85   14,883 
Residential Mortgage Pass-through Securities              2,246 2.76   2,246 2.76   2,182 
Commercial Mortgage Pass-through
    Securities
      2,960 2.23   1,457 2.28       4,417 2.25   4,396 
Obligations of U.S. States and Political
    Subdivisions
  2,061 0.85   2,480 4.13   9,803 2.51   113,074 3.11   127,418 3.05   125,033 
Corporate Bonds and Notes      10,067 2.83   27,833 3.80       37,900 3.54   37,427 
Total $2,061 0.85% $15,507 2.92% $67,149 3.04% $130,569 3.07% $215,286 3.03% $210,958 
Total Investment Securities $11,799 1.75% $85,500 2.47% $195,935 3.57% $241,199 3.09% $534,433 3.14% $534,028 
45

For information regarding the carrying value of the investment portfolio, see Note 45 and Note 1819 of the Notes to the Consolidated Financial Statements.

The securities listed in the table above are either rated investment grade by Moody’s and/or Standard and Poor’s or have shadow credit ratings from a credit agency supporting investment grade and conform to the Corporation’s investment policy guidelines. There were no municipal securities of any single issuer exceeding 10 percent of stockholders’ equity at December 31, 2010.

2013.

Equity securities included inand other debt and equity securities do not have a contractual maturity and are included in the Due after ten years maturity in the table above.

The following table sets forth the carrying value of the Corporation’s investment securities, as of December 31 for each of the last three years.

   
 2010 2009 2008
   (Dollars in Thousands)
Securities Available-for-Sale:
               
U.S. Treasury & Agency Securities $6,995  $2,089  $100 
Federal Agency Obligations  68,481   128,365   7,239 
Mortgage-backed securities  177,733   86,220   75,558 
Obligations of U.S. States and political subdivisions  37,225   19,281   52,094 
Trust Preferred Securities  18,731   26,715   31,771 
Corporate bonds & notes  61,434   22,655   17,955 
Collateralized mortgage obligations  2,728   7,266   41,407 
Equity securities  4,753   5,533   16,590 
Total Investment Securities Available-for-Sale $378,080  $298,124  $242,714 


TABLE OF CONTENTS

  2013 2012 2011 
   (Dollars in Thousands) 
Investment Securities Available-for-Sale:          
U.S. treasury & agency securities $13,519 $11,909 $ 
Federal agency obligations  19,941  20,535  24,969 
Residential mortgage pass-through securities  48,874  53,784  115,364 
Commercial mortgage pass-through securities  6,991  9,969   
Obligations of U.S. States and political subdivisions  31,460  107,714  69,173 
Trust preferred securities  19,403  21,249  16,187 
Corporate bonds and notes  158,630  237,405  173,117 
Collateralized mortgage obligations    2,120  1,899 
Asset-backed securities  15,979  19,742  7,653 
Certificates of deposit  2,262  2,865   
Equity securities  287  325  262 
Other securities  5,724  9,198  5,883 
Total $323,070 $496,815 $414,507 
Investment Securities Held-to-Maturity:          
U.S. treasury & agency securities $28,056 $ $ 
Federal agency obligations  15,249  4,178  28,262 
Residential mortgage pass-through securities  2,246     
Commercial mortgage-backed securities  4,417  5,501  6,276 
Obligations of U.S. States and political subdivisions  127,418  48,385  37,695 
Corporate bonds and notes  37,900     
Total $215,286 $58,064 $72,233 
Total investment securities $538,356 $554,879 $486,740 

For other information regarding the Corporation’s investment securities portfolio, see Note 45 and Note 1819 of the Notes to the Consolidated Financial Statements.

Loan Portfolio

Lending is one of the Corporation’s primary business activities. The Corporation’s loan portfolio consists of both retail and commercial loans, serving the diverse customer base in its market area. The composition of the Corporation’s loan portfolio continues to change due to the local economy. Factors such as the economic climate, interest rates, real estate values and employment all contribute to these changes. Loan growthWhile the overall economy has been generated throughconstrained by uncertainty, the Corporation’s growth in loans continued during 2013. Enhanced visibility in its markets coupled with the aggressive business development efforts via repeat customeractivities of its sales team has continued to enhance its image and business prospects. However, the Corporation continues to predict economic instability in the near term and new borrower requests.

therefore expects to move cautiously in the growth process into 2014.

At December 31, 2010,2013, total loans amounted to $708.4$960.9 million, a decreasean increase of 1.68.0 percent or $11.2$71.3 million as compared to December 31, 2009. However, the average volume of loans was $708.42012. The $1.4 million during 2010, as compared with $692.6 million during 2009. The $449,000 or 1.23.5 percent increase in interest income on loans for the twelve months ended December 31, 20102013 was the result of the increase in averageincreased volume during 2010as compared with 2012, offset in part by a lower interest rate environment as compared with 2009.environment. Even though the Corporation continues to be challenged by the heightened competition for lending relationships that exists within its market, strong growth in volume has been achieved through successful lending sales efforts to build on continued customer relationships.

46

Total average loan volume increased $15.9$93.3 million or 2.311.4 percent in 2010,2013, while the portfolio yield decreased by 634 basis points compared with 2009.2012. The increased total average loan volume reflected both increased repeat customer activitywas due in part to enhanced visibility in the Corporation’s markets coupled with the aggressive business development activities of its sales team and new lending relationships.the acquisition of the loan portfolio of Saddle River Valley Bank. The volume related factors during the period contributed increased revenue of $1.0$4.3 million, while the rate related changes decreased revenue by $553,000.$3.0 million. Total average loan volume increased to $708.4$908.8 million with a net interest yield of 5.254.43 percent, compared to $692.6$815.5 million with a yield of 5.314.77 percent for the year ended December 31, 2009.2012. The Corporation seeks to create growth in commercial lending by offering sound products and competitive pricing and by capitalizing on new and existing relationships in its market area. Products are offered to meet the financial requirements of the Corporation’s clients. It is the objective of the Corporation’s credit policies to diversify the commercial loan portfolio to limit concentrations in any single industry.

The following table presents information regarding the components of the Corporation’s loan portfolio on the dates indicated.

     
 December 31,
   2010 2009 2008 2007 2006
   (Dollars in Thousands)
Real estate – residential mortgage $165,154  $191,199  $240,885  $266,251  $269,486 
Real estate – commercial mortgage  421,745   410,056   358,394   219,356   206,044 
Commercial and industrial  121,034   117,912   75,415   65,493   74,179 
Installment  511   439   1,509   569   705 
Total loans  708,444   719,606   676,203   551,669   550,414 
Less:
                         
Allowance for loan losses  8,867   8,711   6,254   5,163   4,960 
Net loans $699,577  $710,895  $669,949  $546,506  $545,454 

Included in the loan balances above are net deferred loan costs of $272,000, $391,000 and $572,000 at December 31, 2010, 2009 and 2008, respectively.

  December 31, 
  2013 2012 2011 2010 2009 
  (Dollars in Thousands) 
Commercial and industrial $229,688 $181,682 $146,711 $121,043 $117,841 
Commercial real estate  536,539  497,392  408,164  371,983  358,987 
Construction  42,722  40,277  39,388  49,467  51,139 
Residential mortgage  150,571  169,094  159,753  164,847  190,803 
Installment  1,084  1,104  959  513  445 
Subtotal  960,604  889,549  754,975  707,853  719,215 
Net deferred loan costs  339  123  17  258  391 
Total loans  960,943  889,672  754,992  708,111  719,606 
Less: allowance for loan losses  10,333  10,237  9,602  8,867  8,711 
Net loans $950,610 $879,435 $745,390 $699,244 $710,895 
Over the past five years, demand for the Bank’s commercial and commercial real estate loan products has increased.

The increase in commercial loans in 20102013 was a result of the expansion of the Corporation’s customer base, aggressive business development and marketing programs coupled with its positive market trends for the Corporation. While growthimage in certain sectors of the Banks’ market, such as consumer real estate products, was severely stressed during most of 2008, theits market. The Corporation experienced an increased growth in its commercial lending sales efforts during 20092012 and 20102013 as it continued to benefit from the Corporation’s primary core customer base.


TABLE OF CONTENTS

Average commercial loans, which include commercial real estate and construction, increased to $532.4$763.1 million atfor the year ended December 31, 20102013 compared to $476.1$661.7 million atfor the year ended December 31, 20092012 or by approximately $56.3$101.4 million or 11.815.3 percent in 20102013 compared with 2009. The Corporation seeks to create growth in the commercial lending sector by offering competitive products and pricing and by capitalizing on new relationships in its market area. Over the last several years, the expansion of the Bank’s marketplace has aided in this growth. Products are offered to meet the financial requirements of the Corporation’s clients. It is an objective of the Corporation’s credit policies to diversify the commercial loan portfolio to limit concentrations in any single industry.

2012.

The Corporation’s commercial loan portfolio includes, in addition to real estate development, loans to manufacturing, automobile, professional and retail trade sectors, and to specialized borrowers, such as operators of private educational facilities, for example.facilities. A large proportion of the Corporation’s commercial loans have interest rates that reprice with changes in short-term market interest rates or mature in one year or less.

Average commercial real estate loans, which amounted to $296.6$447.0 million in 2010,2013, increased $27.3$52.9 million or 10.113.4 percent as compared with average commercial real estate loans of $269.3$394.1 million in 20092012 (which reflected a 27.523.3 percent increase over 2008)2011). The Corporation’s long-term mortgage portfolio includes both residential and commercial financing. Growth during the past two years largely reflected brisk activity in new lending activity and mortgage financing. The interest rates on a portion of the Corporation’s commercial mortgages adjust to changes in indices such as the 5 and 10-year Treasury Notes, and the Federal Home Loan Bank of New York 5five and 10-yearten-year advance rate. Interest rate changes usually occur at each five-year anniversary of the loan.

47

The average volume of residential mortgage loans, including home equity loans, declined $40.3decreased $10.7 million or 18.76.9 percent in 20102013 as compared to 2009.2012. During 2010,2013, residential loan growth was affected by the slowdown in the housing market, brisk refinancing activity into fixed rate loans due principally to the current historic low rate environment and competition among lenders. Fixed rate residential and home equity loans have recently become a popular choice among homeowners, either through refinancing or new loans, as consumers wish to lock in historically low fixed rates.

Average construction loans and other temporary mortgage financing increaseddecreased by $4.4$6.4 million to $53.8$49.1 million in 20102013 from $49.4$55.5 million in 2009.2012. The average volume of such loans increaseddecreased by $1.4$10.4 million from 20082011 to 2009. The change in construction and other temporary mortgage lending in 2010 was achieved in the face of a severely distressed market.2012. Interest rates on such mortgages are generally tied to key short-term market interest rates. Funds are typically advanced to the builder or developer during various stages of construction and upon completion of the project. It is contemplated that the loans will be repaid by cash flows derived from sales within the project or, where appropriate, conversion to permanent financing.

Loans to individuals include personal loans, student loans, and home improvement loans, as well as financing for automobiles. Such loans averaged $704,000$1,094,000 in 2010,2013, compared with $773,000$885,000 in 20092012 and $973,000 million$363,000 in 2008.2011. The decreaseincrease in loans to individuals during 20102013 was due in part to decreasesincreases in volumes of new personal loans (single-pay).

Home equity loans, inclusive of home equity lines, as well as traditional secondary mortgage loans, are popular with consumers due to their tax advantages over other forms of consumer borrowing. Home equity loans and secondary mortgages averaged $70.7$48.1 million in 2010,2013, a decrease of $18.5$4.2 million or 20.78.1 percent compared to an average of $89.2$52.3 million in 20092012 and $109.6$58.2 million in 2008.2011. Interest rates on floating rate home equity lines are generally tied to the prime rate while most other loans to individuals, including fixed rate home equity loans, are medium-term (ranging between one-to-ten years) and carry fixed interest rates. The decrease in home equity loans outstanding during 20102013 was due in part to the recent slowdown in the housing market and lower consumer spending. Additionally, floating rate home equity lines and closed-end fixed rate home equity loans became less attractive during 20102013 as consumers took advantage of historically low interest rates or opted to convert these loan balances into fixed rate loan products.


TABLE OF CONTENTS

At December 31, 2010,2013, the Corporation had total loan commitments outstanding of $179.9$202.3 million, of which approximately 61.598.9 percent were for commercial loans, commercial real estate loans and construction loans.

The maturities of loans at December 31, 20102013 are listed below.

    
 At December 31, 2010, Maturing
   In
One Year
or Less
 After
One Year
through
Five Years
 After
Five Years
 Total
   (Dollars in Thousands)
Construction loans $41,952  $500  $7,292  $49,744 
Commercial real estate loans  59,125   184,915   127,961   372,001 
Residential real estate loans  38,854   29,984   96,316   165,154 
Commercial and industrial  74,534   40,739   5,761   121,034 
All other loans  366   100   45   511 
Total $214,831  $256,238  $237,375  $708,444 
Loans with:
                    
Fixed rates $78,468  $102,669  $213,374  $394,511 
Variable rates  136,363   153,569   24,001   313,933 
Total $214,831  $256,238  $237,375  $708,444 

  At December 31, 2013, Maturing 
  In
One Year
or Less
 After
One Year
through
Five Years
 After
Five Years
 Total 
  (Dollars in Thousands) 
Commercial and industrial $121,628 $52,219 $55,841 $229,688 
Commercial real estate  22,910  108,786  404,843  536,539 
Construction  31,994  10,728    42,722 
Residential mortgage  911  9,594  140,066  150,571 
Installment  745  225  114  1,084 
Total $178,188 $181,552 $600,864 $960,604 
Loans with:             
Fixed rates $36,203 $119,477 $133,678 $289,358 
Variable rates  141,985  62,075  467,186  671,246 
Total $178,188 $181,552 $600,864 $960,604 
For additional information regarding loans, see Note 56 of the Notes to the Consolidated Financial Statements.

48

Allowance for Loan Losses and Related Provision

The purpose of the allowance for loan losses (“allowance”) is to absorb the impact of probable losses inherent in the loan portfolio. Additions to the allowance are made through provisions charged against current operations and through recoveries made on loans previously charged-off. The allowance for loan losses is maintained at an amount considered adequate by management to provide for potential credit losses based upon a periodic evaluation of the risk characteristics of the loan portfolio. In establishing an appropriate allowance, an assessment of the individual borrowers, a determination of the value of the underlying collateral, a review of historical loss experience and an analysis of the levels and trends of loan categories, delinquencies and problem loans are considered. Such factors as the level and trend of interest rates, current economic conditions and peer group statistics are also reviewed. At year-end 2010,2013, the level of the allowance was $8,867,000$10,333,000 as compared to a level of $8,711,000$10,237,000 at December 31, 2009.2012. The Corporation made loan loss provisions of $5,076,000$350,000 in 20102013 compared with $4,597,000$325,000 in 20092012 and $1,561,000$2,448,000 in 2008.2011. The level of the allowance during the respective annual periods of 20102013 and 20092012 reflects the change in average volume, credit quality within the loan portfolio, the level of charge-offs, loan volume recorded during the periods and the Corporation’s focus on the changing composition of the commercial and residential real estate loan portfolios.

At December 31, 2010,2013, the allowance for loan losses amounted to 1.251.08 percent of total loans. In management’s view, the level of the allowance at December 31, 20102013 is adequate to cover losses inherent in the loan portfolio. Management’s judgment regarding the adequacy of the allowance constitutes a “Forward Looking Statement” under the Private Securities Litigation Reform Act of 1995. Actual results could differ materially from management’s analysis, based principally upon the factors considered by management in establishing the allowance.

Although management uses the best information available, the level of the allowance for loan losses remains an estimate, which is subject to significant judgment and short-term change. Various regulatory agencies, as an integral part of their examination process, periodically review the Corporation’s allowance for loan losses. Such agencies may require the Corporation to increase the allowance based on their analysis of information available to them at the time of their examination. Furthermore, the majority of the Corporation’s loans are secured by real estate in the State of New Jersey. Future adjustments to the allowance may be necessary due to economic factors impacting New Jersey real estate and further deterioration of the economic


TABLE OF CONTENTS

climate as well as operating, regulatory and other conditions beyond the Corporation’s control. The allowance for loan losses as a percentage of total loans amounted to 1.251.08 percent, 1.211.15 percent and 0.921.27 percent at December 31, 2010, 20092013, 2012 and 2008,2011, respectively.

Net charge-offs were $4,920,000$254,000 in 2010, $2,140,0002013, compared to net recoveries of $310,000 in 20092012 and $470,000net charge-offs of $1,713,000 in 2008.2011. During 2010,2013, the Corporation experienced an increase in charge-offs and a decrease in recoveries compared to 2009 as the Corporation took further write downs of $1.9 million associated with a previously disclosed construction project related to industrial warehouses. In addition, distress2012. Charge-offs were higher in the single family housing market caused the Corporation to recognize write downs of $1.6 million and 2 commercial and industrial loans were the prime contributorsmost of the write downs of $1.1 millionportfolio segments in commercial2013 than in 2012 and industrial loans. In 2009 charge-offs principally related to four commercial and commercial real estate credits taken during the fourth quarter of 2009 totaling $1.1 million, coupled with a $900,000 charge-offrecoveries were lower in connection with a $5.1 million commercial real estate construction project of industrial warehouses, which was placed in non-accrual status during the first quarter of 2009. As previously disclosed, during the fourth quarter of 2009, the Corporation took steps to terminate a participation agreement with another New Jersey bank, as the participation ended on December 31, 2009. The other bank objected to the Corporation’s interpretationmost of the agreement and subsequent actions. Accordingly, the Corporation filed suit for the return of the outstanding principal and reclassified the outstanding loan as a non-performing asset on its balance sheet.

portfolio segments in 2013 than in 2012. Commercial loan charge-offs were $75,000 higher in 2013 compared to 2012.

49

Five-Year Statistical Allowance for Loan Losses

The following table reflects the relationship of loan volume, the provision and allowance for loan losses and net charge-offs (recoveries) for the past five years.

     
 Years Ended December 31,
   2010 2009 2008 2007 2006
   (Dollars in Thousands)
Average loans outstanding $708,425  $692,562  $622,533  $541,297  $522,352 
Total loans at end of period $708,444  $719,606  $676,203  $551,669  $550,414 
Analysis of the Allowance for Loan Losses
                         
Balance at the beginning of year $8,711  $6,254  $5,163  $4,960  $4,937 
Charge-offs:
                         
Commercial  3,348   2,122   444   45    
Residential  1,552   4   20   80   50 
Installment loans  40   26   35   31   29 
Total charge-offs  4,940   2,152   499   156   79 
Recoveries:
                         
Commercial  13   2   10   2   19 
Residential  1   4   13       
Installment loans  6   6   6   7   26 
Total recoveries  20   12   29   9   45 
Net charge-offs (recoveries)  4,920   2,140   470   147   34 
Provision for loan losses  5,076   4,597   1,561   350   57 
Balance at end of year $8,867  $8,711  $6,254  $5,163  $4,960 
Ratio of net charge-offs during the year to average loans outstanding during the year  0.69  0.31  0.08  0.03  0.01
Allowance for loan losses as a percentage of total loans at end of year  1.25  1.21  0.92  0.94  0.90

  Years Ended December 31, 
  2013  2012  2011  2010  2009 
  (Dollars in Thousands) 
Average loans outstanding $960,943  $815,501  $712,895  $708,425  $692,562 
Total loans at end of period $908,784  $889,672  $754,992  $708,111  $719,606 
Analysis of the Allowance for Loan Losses                    
Balance at the beginning of year $10,237  $9,602  $8,867  $8,711  $6,254 
Charge-offs:                    
Commercial and Construction  132   57   1,985   3,348   2,122 
Residential  175   454   23   1,552   4 
Installment loans  22   16   20   40   26 
Total charge-offs  329   527   2,028   4,940   2,152 
Recoveries:                    
Commercial and Construction  69   620   255   13   2 
Residential  0   210   53   1   4 
Installment loans  6   7   7   6   6 
Total recoveries  75   837   315   20   12 
Net charge-offs (recoveries)  254   (310)   1,713   4,920   2,140 
Provision for loan losses  350   325   2,448   5,076   4,597 
Balance at end of year $10,333  $10,237  $9,602  $8,867  $8,711 
Ratio of net charge-offs (recoveries)during
    the year to average loans outstanding
    during the year
  0.03%  (0.04)%  0.24%  0.69%  0.31%
Allowance for loan losses as a percentage
    of total loans at end of year
  1.08%  1.15%  1.27%  1.25%  1.21%
For additional information regarding loans, see Note 56 of the Notes to the Consolidated Financial Statements


TABLE OF CONTENTS

Implicit in the lending function is the fact that loan losses will be experienced and that the risk of loss will vary with the type of loan being made, the creditworthiness of the borrower and prevailing economic conditions. The allowance for loan losses has been allocated in the table below according to the estimated amount deemed to be reasonably necessary to provide for the possibility of losses being incurred within the following categories of loans at December 31, for each of the past five years.

The table below shows, for three types of loans, the amounts of the allowance allocable to such loans and the percentage of such loans to total loans.

        
 Commercial Real Estate
Residential Mortgage
 Installment Unallocated
   Amount of
Allowance
 Loans to
Total Loans
%
 Amount of
Allowance
 Loans to
Total Loans
%
 Amount of
Allowance
 Loans to
Total Loans
%
 Amount of
Allowance
 Total
   (Dollars in Thousands)
2010 $7,538   76.6  $1,038   23.3  $52   0.1  $239  $8,867 
2009  7,314   73.3   1,242   26.6   56   0.1   99   8,711 
2008  5,473   64.2   651   35.6   60   0.2   70   6,254 
2007  4,167   51.6   727   48.3   49   0.1   220   5,163 
2006 $3,972   50.9  $707   49.0  $45   0.1  $236  $4,960 

  Commercial Real Estate
Residential Mortgage
 Installment Unallocated 
   Amount of
Allowance
 Loans to
Total
Loans
%
 Amount of
Allowance
 Loans to
Total
Loans
%
 Amount of
Allowance
 Loans to
Total
Loans
%
 Amount of
Allowance
 Total 
  (Dollars in Thousands) 
2013 $7,806  84.2 $990  15.7 $146  0.1 $1,391 $10,333 
2012  7,944  80.9  1,528  19.0  114  0.1  651  10,237 
2011  8,206  78.7  1,263  21.2  51  0.1  82  9,602 
2010  7,538  76.6  1,038  23.3  52  0.1  239  8,867 
2009  7,314  73.4  1,242  26.5  56  0.1  99  8,711 
50

Asset Quality

The Corporation manages asset quality and credit risk by maintaining diversification in its loan portfolio and through review processes that include analysis of credit requests and ongoing examination of outstanding loans and delinquencies, with particular attention to portfolio dynamics and mix. The Corporation strives to identify loans experiencing difficulty early enough to correct the problems, to record charge-offs promptly based on realistic assessments of current collateral values, and to maintain an adequate allowance for loan losses at all times. These practices have protected the Corporation during economic downturns and periods of uncertainty.

It is generally the Corporation’s policy to discontinue interest accruals once a loan is past due as to interest or principal payments for a period of ninety days. When a loan is placed on non-accrual status, interest accruals cease and uncollected accrued interest is reversed and charged against current income. Payments received on non-accrual loans are applied against principal. A loan may only be restored to an accruing basis when it again becomes well secured and in the process of collection or all past due amounts have been collected and a satisfactory period of ongoing repayment exists. Accruing loans past due 90 days or more are generally well secured and in the process of collection. For additional information regarding loans, see Note 56 of the Notes to the Consolidated Financial Statements

Statements.

Non-Performing and Past Due Loans and OREO

Non-performing loans include non-accrual loans and accruing loans which are contractually past due 90 days or more. Non-accrual loans represent loans on which interest accruals have been suspended. It is the Corporation’s general policy to consider the charge-off of loans when they become contractually past due ninety days or more as to interest or principal payments or when other internal or external factors indicate that collection of principal or interest is doubtful. Troubled debt restructurings represent loans on which a concession was granted to a borrower, such as a reduction in interest rate to a rate lower than the current market rate for new debt with similar risks, and which are currently performing in accordance with the modified terms. The Corporation previously reported performing troubled debt restructured loans as a component of non-performing assets. For additional information regarding loans, see Note 56 of the Notes to the Consolidated Financial Statements


Statements.
 

TABLE OF CONTENTS

The following table sets forth, as of the dates indicated, the amount of the Corporation’s non-accrual loans, accruing loans past due 90 days or more, and other real estate owned (“OREO”) and troubled debt restructurings.

     
 At December 31,
   2010 2009 2008 2007 2006
   (Dollars in Thousands)
Non-accrual loans $11,174  $11,245  $541  $3,907  $475 
Accruing loans past due 90 days or more  714   39   139      225 
Total non-performing loans  11,888   11,284   680   3,907   700 
OREO        3,949   501    
Total non-performing assets $11,888  $11,284  $4,629  $4,408  $700 
Troubled debt restructuring  7,035   966   93       

Total non-accrual loans remained relatively even

  At December 31, 
  2013 2012 2011 2010 2009 
  (Dollars in Thousands) 
Non-accrual loans $3,137 $3,616 $6,871 $11,174 $11,245 
Accruing loans past due 90 days
    or more
    55  1,029  714  39 
Total non-performing loans  3,137  3,671  7,900  11,888  11,284 
OREO  220  1,300  591     
Total non-performing assets $3,357 $4,971 $8,491 $11,888 $11,284 
Troubled debt restructuring —
    performing
 $5,746 $6,813 $7,459 $7,035 $966 
At December 31, 2013, non-performing assets totaled $3.4 million, or 0.20% of total assets, as compared with $5.0 million, or 0.31%, at December 31, 2012. The decrease from December 31, 20092012 was achieved notwithstanding the addition of several new residential loans (totaling approximately $0.3 million) and commercial loans (totaling approximately $1.7 million) into non-performing status. This was more than offset by decreases from pay-downs and payoffs of $2.9 million, total charge-offs of $272,000, the return to performing status of $0.4 million, while $220,000 was moved within the non performing asset category from non-accrual to OREO.
51

Total non-performing assets decreased $3.5 million from December 31, 2011 to December 31, 2010. A $2.2 million single family residential loan previously classified as a non-accrual loan was transferred to OREO during 2010 and subsequently sold in the fourth quarter of 2010. In addition, a $1.9 million net charge off was taken on a loan participation during 2010. On the other hand, a construction participation loan in the amount of $3.6 million went into non-accrual status in the fourth quarter of 2010.

2012. The increase in non-accrual loans atdecrease from December 31, 2009 as compared with one year prior2011 was primarily attributable toachieved notwithstanding the addition of three largeseveral new residential loans (totaling approximately $1.2 million) and commercial credits. In Marchloans (totaling approximately $1.0 million) into non-performing status. This was more than offset by decreases from pay-downs of 2009, one commercial$1.7 million, total charge-offs of $175,000 of existing loans, the transfer of $1.3 million to other real estate construction project of industrial warehouses was downgradedowned and the transfer to non-accrual status. The loan was a participation loan with another New Jersey bank. In December of 2009, the Corporation took steps to terminate this participation agreement, as the participation ended on December 31, 2009. The Corporation filed suit for the return of the outstanding principal and reclassified this $5.1 million outstanding loan intoperforming troubled debt restructured from non-accrual status on the Corporation’s balance sheet.

of $3.9 million.

The components of accruing loans, which are contractually past due 90 days or more as to principal or interest payments, are as follows:

     
 December 31,
   2010 2009 2008 2007 2006
   (Dollars in Thousands)
Commercial $  $  $  $  $225 
Residential  714   39   139       
Installment               
Total accruing loans 90 days or more past due $714  $39  $139  $  $225 

The balance at December 31, 2010 and 2009 comprise one, different for each year, 1 – 4 family residential loan. At December 31, 2010 the loan in question was well secured and in the process of collection either through bringing the loan current as payments had been received during the month of December 2010 or through the sale of the property.

  December 31, 
  2013 2012 2011 2010 2009 
  (Dollars in Thousands) 
Commercial $ $ $1,029 $ $ 
Residential    55    714  39 
Installment           
Total accruing loans 90 days or more past due $ $55 $1,029 $714 $39 
TDR Increase

All Decrease

Troubled Debt Restructured loans (“TDR’s”) at December 31, 20102013 totaled $6.6 million of which $5.7 million were performing pursuant to the terms of their respective modifications. $5,534,000The level of the increase is representedperforming TDR’s decreased during 2013 by 2 loans — $1,354,000 is a 1 – 4 single familyapproximately $1.1 million. Payments and payoffs to performing TDR’s totaled $116,000. Three residential TDRs totaling $951,000 were returned to their original contractual loan and $4,180,000 is a commercial real estate loan. Both loans were restructured with terms to best fit each borrower’s repayment capacity during their respective reduced income levels. All TDR’s outstanding at December 31, 2010 are expected to be fully repaid.

terms.

Other known “potential problem loans” (as defined by SEC regulations) as of December 31, 20102013 have been identified and internally risk rated as assets especially mentioned, substandard or substandard.doubtful. Such loans, which include non-performing assets and TDR’s included in the table above, amounted to $38,382,000, $20,048,000$35,077,000, $47,426,000 and $9,401,000$48,976,000 at December 31, 2010, 20092013, 2012 and 2008,2011, respectively. The increasedecrease at December 31, 2010 and2013 from December 31, 20092012 reflects continued deteriorationimprovement in the quality of certain loans. The risk rating of assets is a dynamic environment wherein through on-going examination certain assets may


TABLE OF CONTENTS

be downgraded or upgraded as circumstances warrant. During the first quarter of 2010,2013, the Corporation reevaluated severalinternally risk rated as assets especially mentioned or substandard a total of $1,041,000 new commercial loans, which resultedand $281,000 in the downgrade of two lending relationships totaling $4.8 million intonew residential loans. This was partially offset by upgrades to an internal pass risk rating categories associated with “potential problem loans” that had not previously been characterized as such by the Corporation. Further, $725,000 was placedof $6,408,000 in commercial loans and $1,327,000 of residential loans. Payoffs of commercial and residential loans totaled $5,438,000. Charge-offs and transfers to other real estate owned accounted for $498,000. A final mitigant came from continued principal reductions on non-accrual status. The Corporation’s construction portfolio experienced a decline inother potential problem loans from December 31, 2008 to December 31, 2009 asloans. With the additionexception of one new relationship of $3.6 million was offset by the removal of another relationship amounting to $4.7 million. The Corporation’s commercial portfolio experienced an increase in potential problemnon-accrual loans, at December 31, 2009 with the addition of six lending relationships while shedding two for a net increase of $10.9 million in this segment. This increase was mitigated somewhat by principal payments made on many of these accounts. All potential problem loans were performing loans as of December 31, 2010.2013. The Corporation has no foreign loans.

At December 31, 2010,2013, other than the loans set forth above, the Corporation is not aware of any loans which present serious doubts as to the ability of its borrowers to comply with present loan repayment terms and which are expected to fall into one of the categories set forth in the tables or description above.

In general, it is At December 31, 2013, the policy of management to consider the charge-off of loans at the point that they become past due in excess of 90 days, with the exception of loans that are secured by cash, marketable securities or real estate loans, which are well secured and in the process of collection.

Corporation had no doubtful loans.

With respect to concentrations of credit within the Corporation’s loan portfolio at December 31, 2010, $22.62013, $77.5 million or 5.2%33.8% of the commercial loan portfolio represented outstanding working capital loans to various real estate developers. All but $8.0$77.5 million of these loans arewere not secured by mortgages on land and on buildings under construction.

52

For additional information regarding risk elements in the Corporation’s loan portfolio, see Note 56 of the Notes to Consolidated Financial Statements.

Other Income

The following table presents the principal categories of non-interest income for each of the years in the three-year period ended December 31, 2010.

2013. 
      
 Years Ended December 31,
   2010 2009 %
Change
 2009 2008 %
Change
   (Dollars in Thousands)
Service charges, commissions and fees $1,975  $1,835   7.63 $1,835  $2,015   (8.93)% 
Annuity & insurance commissions  123   126   (2.38  126   112   12.50 
Bank-owned life insurance  1,226   1,156   6.06   1,156   1,203   (3.91
Net securities gains (losses)  (1,339  491   (372.71  491   (1,106  144.39 
Other  487   298   63.42   298   420   (29.05
Total other income $2,472  $3,906   (36.71)%  $3,906  $2,644   47.73

  Years Ended December 31, 
  2013 2012 % Change  2012 2011 % Change 
  (Dollars in Thousands) 
Service charges, commissions and fees $1,873 $1,775  5.52% $1,775 $1,896  (6.38)%
Annuity & insurance commissions  489  204  139.71   204  110  85.45 
Bank-owned life insurance  1,364  1,018  33.99   1,018  1,038  (1.93) 
Net securities gains  1,711  2,012  (14.96)   2,012  3,634  (44.63) 
Loan related fees  839  510  64.51   510  432  18.06 
Net gains on sales of loans held for sale  294  484  (39.26)   484  251  92.83 
Bargain gain on acquisition    899  (100.00)   899    100.00 
Other  281  308  (8.77)   308  117  163.25 
Total other income $6,851 $7,210  (4.98)% $7,210 $7,478  (3.58)%
For the period ended December 31, 2010,2013, total other income decreased $1.4 million$359,000 compared to 2009,the same period in 2012, primarily as a result of net securities losses in 2010 compared$301,000 related to lower net securities gains and $899,000 relating to a bargain gain on acquisition in 2009.the prior period, offset in part by increased service charges, commissions and fees on deposit accounts, annuity and insurance commissions, bank owned life insurance and loan related fees. Excluding net securities gains and losses, in the respective periods, the Corporation recorded other income of $3.8$5.1 million infor the yeartwelve months ended December 31, 2010,2013 compared to $3.4other income, excluding net securities gains and losses and bargain gain on acquisition, of $4.3 million in 2009,for the twelve months ended December 31, 2012, representing an increase of 11.6$841,000 or 19.6 percent. This increase was attributable in part to a $140,000 increase in service charges, commissions and fees offset by lower other income, resulting primarily from lower letters of credit fee income and title insurance income. Additionally, in 2010 and 2009, the Corporation recognized $0 and $136,000, respectively, in tax-free proceeds in excess of contract value on the Corporation’s bank-owned life insurance due to the death of insured participants.

During 2010,2013, the Corporation recorded net securities lossesgains of $1.3$1.7 million compared to net securities gains of $491,000$2.0 million in 20092012 and net lossessecurities gains of $1.1$3.6 million recorded in 2008.2011. In 2010,2013, total other-than-temporary impairment charges of $5.6 million$652,000 were somewhat offset by net gains on securities sold of $4.3$2.4 million. During 20102013, securities sold from the Corporation’s available-for-sale portfolio amounted to approximately


TABLE OF CONTENTS

$644.1 $122.2 million compared to approximately $665.8$130.1 million in 2009.2012. The gross realized gains on securities sold amounted to approximately $4.9$2.5 million in 20102013 compared to $5.9$2.9 million in 2009,2012, while the gross realized losses amounted to approximately $635,000$88,000 in 20102013 compared to $1.2 million$893,000 in 2009.

2012. The sales of securities were made in the normal course of business and the proceeds were primarily reinvested into the investment portfolio.

During 2010,2013, the Corporation recorded a $3.0 millionan other-than-temporary impairment charge on its trust preferred securities, $1.8 million on two pooled trust preferred securities, $360,000of $628,000 on a variable rate private label CMOPooled TRUP, ALESCO VII, and $398,000$24,000 in principal losses on a variable rate private label CMO. For the year ended December 31, 2009 these2012, the Corporation recorded an other-than-temporary impairment charges consistedcharge of $3.4 million relating to two pooled trust preferred securities, $364,000 relating to$68,000 on a Pooled TRUP, ALESCO VII, and $484,000 on a variable rate private labeled CMO and $318,000 in principal losses on a variable rate private label CMO. For the Corporation’s investment inyear ended December 31, 2011, the Reserve Primary Fund, $188,000 relating toCorporation recorded an other-than-temporary impairment charge of $18,000 on a variable rate private label CMO and $324,000 in principal losses on a $140,000 charge relating to the Corporation’s Lehman Brothers bond and a $113,000 write down relating to one equity holding in bank stocks. In 2008, total other-than-temporary impairment charges of $1.8 million were partially offset by net gains on securities sold of $655,000. During 2008, the Corporation recorded a $1.3 million other-than-temporary impairment charge related to its Lehman Brothers corporate bond and $461,000 of write downs related to three equity holdings in bank stocks. In 2010, the sales of securities were made in the normal course of business and proceeds were primarily reinvested into the loan and investment portfolios. In 2009 and 2008, the proceeds from the sales of securities were made in the normal course of business and were primarily reinvested into the loan portfolio.

variable rate private label CMO.

Other Expense

Total other expense includes salaries and employee benefits, net occupancy expense, premises and equipment expense, professional and consulting expense, stationery and printing expense, marketing and advertising expense, computer expense and other operating expense. Other operating expense includes such expenses as telephone, insurance, audit, bank correspondent fees and the amortization of core deposit intangibles.

53

The following table presents the principal categories of other expense for each of the years in the three-year period ended December 31, 2010.

2013.
      
 Year Ended December 31,
   2010 2009 %
Change
 2009 2008 %
Change
   (Dollars in Thousands)
Salaries and employee benefits $10,765  $9,915   8.57 $9,915  $8,505   16.58
Occupancy, net  2,088   2,536   (17.67  2,536   3,279   (22.66
Premises and equipment  1,093   1,263   (13.46  1,263   1,436   (12.05
FDIC insurance  2,126   2,055   3.45   2,055   217   847.00 
Professional and consulting  1,121   811   38.22   811   703   15.36 
Stationery and printing  316   339   (6.78  339   397   (14.61
Marketing and advertising  268   366   (26.78  366   637   (42.54
Computer expense  1,366   964   41.70   964   834   15.59 
OREO expense, net  284   1,438   (80.25  1,438   31   4538.71 
Loss on fixed assets, net  427      100.00      51   (100.00
Repurchase agreement termination fee  594      100.00          
Other  3,651   3,370   8.34   3,370   3,383   (.38
Total other expense $24,099  $23,057   4.52 $23,057  $19,473   18.40

  Year Ended December 31, 
  2013  2012  % Change  2012  2011  % Change 
  (Dollars in Thousands) 
Salaries and employee benefits $13,465  $12,571   7.11% $12,571  $11,527   9.06%
Occupancy and equipment  3,518   2,987   17.78   2,987   2,947   1.36 
FDIC insurance  1,098   1,154   (4.85)   1,154   1,712   (32.59) 
Professional and consulting  1,111   1,077   3.16   1,077   1,156   (6.83) 
Stationery and printing  333   349   (4.58)   349   368   (5.16) 
Marketing and advertising  304   186   63.44   186   131   41.98 
Computer expense  1,422   1,419   0.21   1,419   1,312   8.16 
OREO expense, net  137   150   (8.67)   150   398   (62.31) 
Repurchase agreement prepayment
    and termination fee
     1,012   (100.00)   1,012      100.00 
Acquisition cost     482   (100.00)   482      100.00 
Other  3,890   3,810   2.10   3,810   3,892   (2.11) 
Total other expense $25,278  $25,197   0.32% $25,197  $23,443   7.48%
Total other expense increased $1.0 million,$81,000, or 4.520.3 percent, in 20102013 from 20092012 as compared with an increase of $3.6$1.8 million, or 18.47.48 percent, from 20082011 to 2009. The level of operating expenses during 20102012. Excluding the repurchase agreement prepayment and termination fee and acquisition cost recognized in 2012, total other expense increased $1.6 million or 6.6 percent. Increases primarily due to increasesincluded $894,000 in salarysalaries and employee benefits, of $850,000,$531,000 in occupancy and equipment, $118,000 in marketing and advertising, $34,000 in professional and consulting feesexpense, and $80,000 in other expense. The increases resulted primarily from operating the Saddle River, Oakland and Englewood branches for the twelve months of $310,000, computer expense2013 and the opening of $402,000 and other expenses of $1.3 million, mainly due to a one-time termination fee of $594,000 in the first quarter of 2010 on a structured securities repurchase agreement and a $437,000 loss on fixed assets which was recordedPrinceton branch in the second quarter of 2010.2013. These increases were partially offset by decreased occupancydecreases recorded in FDIC insurance expense of $448,000, decreased premises$56,000, stationery and equipment chargesprinting of $170,000, decreased marketing expenses of $98,000$16,000, and decreased OREOother real estate expense of $1.2 million. Total other expense


$13,000.
 

TABLE OF CONTENTS

increased in 2009 from 2008 across several expense categories, with the largest increase occurring in salaries and benefit expense, FDIC insurance and OREO expense.

Prudent management of operating expenses has been and will continue to be a key objective of management in an effort to improve earnings performance. The Corporation’s ratio of other expenses to average assets increaseddecreased to 2.031.55 percent in 20102013 compared to 1.881.64 percent in 20092012 and 1.941.77 percent in 2008.

2011.

Salaries and employee benefits increased $850,000$894,000 or 8.577.11 percent in 20102013 compared to 20092012 and increased $1.4 million$1,044,000 or 16.69.06 percent from 20082011 to 2009.2012. The increase in 20102013 was primarily attributable to additions to official staff andincentive based compensation expense, merit increases to existing staff and additions to officer and employee staff. The increase in 2012 was primarily attributable to merit increases to existing staff and additions to office and employee staff of approximately $720,000$467,000 and $273,000, respectively, pension and 401(k) increase of $133,000, and increased medical insurance expense of $130,000. The increase in 2009 was primarily attributable to a $755,000 benefit recognized in 2008 relating to the termination of two benefit plans. During the third quarter of 2008, the Corporation recognized a $272,000 benefit relating to the lump-sum payment and termination of the directors retirement plan. During the fourth quarter of 2008, the Corporation recognized a $483,000 benefit relating to a lump-sum payment and termination of a benefit equalization plan. These benefits represented the difference between the actuarial present value of the lump-sum payment and the accrued liability previously recorded on the Corporation’s statement of condition. Additionally, pension plan expense increased $514,000 in 2009 from 2008 due to both lower asset valuations and a lower expected rate of return on the Corporation’s defined pension plan, which was frozen back in 2007.

$170,000.

Salaries and employee benefits accounted for 44.753.3 percent of total non-interest expense in 2010,2013, as compared to 43.049.9 percent and 43.749.2 percent in 20092012 and 2008,2011, respectively.

In 2009, the Corporation announced a strategic outsourcing agreement with Fiserv to provide core account processing services, which is consistent with the Corporation’s other strategic initiatives to streamline operations, reduce operating overhead and allow the Corporation to focus on core competencies of customer service and product development. The core processing transition was consummated during the fourth quarter of 2009. In 2008, the Corporation announced a series of strategic outsourcing agreements to aid in the realization of its goal to reduce operating overhead and shrink the infrastructure of the Corporation. The cost reduction plans resulted in the reduction of workforce by 12 staff positions, which in turn resulted in a one-time pre-tax charge of $145,000 in the second quarter of 2008 for severance and termination benefits.

54

Occupancy and premises and equipment expense for the year ended December 31, 2010 decreased2013 increased by $448,000$531,000 or 17.717.78 percent, over 2012. Occupancy and $170,000 or13.4equipment expense for 2012 increased by $40,000 or 1.36 percent, respectively from the year ended December 31, 2009. The decreases reflect expense reductions pertainingcompared to the Corporation’s former operations facility that resulted from vacating and eliminating the facility during the first quarter of 2010.2011. For the year ended December 31, 2010,2013, the Corporation recorded reductionsincreases of $273,000$33,000 in depreciationutility expense, $251,000$51,000 in insurance, $169,000 in building and equipment maintenance expense and $98,000$289,000 in real estate taxes, largely associated withrent expense. These increases were partially offset by decreases of $13,000 in depreciation expense. The increases in occupancy expense were primarily due to the Corporation’s former operations facility.operation of Saddle River Valley Bank branches and the new Englewood and Princeton branches. For the year ended December 31, 2009, occupancy and premises2012, the Corporation recorded reductions of $56,000 in depreciation expense, $19,000 in insurance, $34,000 in building and equipment expenses decreased $916,000, or 19.4 percent, from 2008. The decreasemaintenance expense and $10,000 in occupancy and premises and equipment expenseutilities. These decreases were more than offset by increases of $63,000 in 2009 was due primarily to lower operating costs (utilities, rent, real estate taxes general repair and maintenance) of the Corporation’s facilities,$95,000 in rent expense primarily due in part to branch closures and consolidations coupled with a $200,000 charge taken during the fourth quarter of 2008 relating to the terminationacquisition of Saddle River Valley Bank branches and the Corporation’s lease obligation to build anew Englewood branch in Cranford, New Jersey.

facility.

In May 2009,2011 the FDIC adopted a final specialrevised assessment rule that assessed the banking industry 5 basis pointsschedule based on total assets less Tier I capital. The Corporation was required1 Capital and dropped the assessment rate to accrue the charge during the second quarter of 2009, which amounted to approximately $630,000, even though the FDIC collected the fee at the end of the third quarter when the regular quarterly assessmentscompensate for the second were collected. Additionally, in December 2008, the FDIC adopted a final rule increasing the risk-based assessment rates beginning in the first quarter of 2009. As a result of these changes coupled with the one-time assessment credits recognized in 2008, FDIC insurance expense increased $1.8 million for 2009 compared to 2008.new base. FDIC insurance expense in 20102013 was approximately $71,000 more$56,000 less than the 20092012 expense.

For the year ended December 31, 2012, FDIC insurance expense decreased $558,000 compared to 2011.

Professional and consulting expense for 20102013 increased $310,000$34,000 due to higher compliance and legal expenses. Such expenses decreased in 2012 from 2011 primarily due to less compliance and legal loan workout issues during 2010. Such expenses increased in 2009 from 2008 primarily due to higher legal expenses.


issues.
 

TABLE OF CONTENTS

Stationery and printing expenses for 20102013 decreased $23,000$16,000 or 6.784.5 percent, compared to 2009,2012, due primarily to better cost containment measures relating to stationery andreduction of checkbook printing materials.costs. The decrease in such expenses of $58,000$19,000 or 14.65.16 percent in 20092012 from 2008 reflected improved cost containment in the purchasing2011 was due primarily to costs related to marketing of supplies.

new bank products.

Marketing and advertising expenses for the year ended December 31, 2010 decreased $98,000,2013 increased $118,000, or 26.7863.4 percent, from the comparable twelve-month period in 2009,2012, primarily due to lower expense outlays for media.media for the two Saddle River branches acquired and the opening of the new Englewood and Princeton branch offices, promotion of adjustable rate mortgage products and wealth management. These expenses decreased $271,000increased $55,000 or 42.549.98 percent in 20092012 compared with 20082011 primarily due to reduced spending inexpense outlays for media for the two Saddle River branches acquired and advertising.

the opening of the new Englewood branch office.

Computer expense increased $402,000$3,000 during 20102013 compared to 20092012 and increased $130,000$107,000 in 20092012 compared to 2008,2011. The increase in 2013 was due increased cost of core processing systems. The increase in 2012 was due primarily to fees paid in connection with the maintenance of computer systems for Saddle River Valley Bank for the period between closing the acquisition and conversion of Saddle River Valley Bank’s systems to the Corporation’s outsourced information technology service provider. This strategic outsourcing arrangement has significantly improved operating efficiencies and reduced overhead, primarily in salaries and benefits.

systems.

OREO expense for 20102013 decreased by $1.2 million over 2009$13,000 from 2012 due primarily to decline ina decreased level of OREO properties and required maintenance and write-down expenses.

properties.

Other expense increased in 20102013 by approximately $1.3 million$80,000 or 38.642.10 percent compared to 20092012 mainly due to a one-time termination feeincreases in OCC assessment fees of $594,000 in the first quarter$30,000, telephone of 2010$17,000, other insurance of $14,000, donations of $29,000, travel & entertainment of $7,000, and fees on a structured securities repurchase agreement and a $437,000 loss on fixed assets which was recorded in the second quarterour CDAR products of 2010.$30,000. Other expense decreased in 20092012 by $64,000$82,000 or 1.92.11 percent, compared to 2008.2011, mainly due to decreases in other losses and charge-offs of $287,000 which represented an expense in 2011 for tax certificates not duplicated in 2012, OCC assessment fees of $95,000 and miscellaneous expenses of 84,000 which were partially offset by increases in postage of $31,000, telephone of $35,000, other insurance of $20,000, donations of $56,000, travel & entertainment of $57,000, lending and consumer reports of $56,000 and fees on our CDAR products of $60,000. Amortization of core deposit intangibles accounted for $70,000$31,000 and $82,000$47,000 of other expense for the years 20102013 and 2009,2012, respectively.

Provision for Income Taxes

The Corporation recorded income tax expense of $222,000$7.5 million in 20102013 compared to $946,000 in 2009 and $1.6$7.7 million in 2008.2012 and $7.4 million in 2011. The reductiondecrease in 20102013 resulted from an increase in pretax earnings offset in part by higher tax exempt income from investment securities and loans and a reduced rate due to the liquidation of certain other subsidiaries as partestablishment of a business entity restructuring. As previously announced,REIT subsidiary to take advantage of favorable tax treatment. The increase in 2012 resulted from an increase in pretax earnings offset in part by a reduced rate due to the Corporation recordedestablishment of a totalREIT subsidiary to take advantage of $2.6 million unrecognized incomefavorable tax benefit related to an internal entity structure realignment and liquidation of subsidiary companies, commenced in the fourth quarter of 2006.treatment. The effective tax rates for the Corporation for the years ended December 31, 2010, 20092013, 2012 and 20082011 were 3.127.3 percent, 20.130.5 percent and 21.134.7 percent, respectively. The Corporation adjusts its expected annual tax rate on a quarterly basis based on the current projections of non-deductible expenses, tax-exempt interest income, increase in the cash surrender value of bank owned life insurance and pre-tax net earnings. For a more detailed description of income taxes see Note 1112 of the Notes to Consolidated Financial Statements.

55

Tax-exempt interest income on a fully tax equivalent basis decreasedincreased by $1.2$1.4 million, or 77.826.1 percent, from 20092012 to 2010,2013, and decreasedincreased by $2.4$2.82 million, or 61.3109.5 percent, from 20082011 to 2009.2012. The Corporation recorded income related to the cash surrender value of bank-owned life insurance as a component of other income in the amount of $1,226,000, $1,156,000$1,364,000, $1,018,000 and $1,203,000$1,038,000 for 2010, 20092013, 2012 and 2008,2011, respectively.

Recent Accounting Pronouncements

Note 2 of the Notes to Consolidated Financial Statements discusses new accounting policies recently issued or proposed but not yet required to be adopted. To the extent the adoption of new accounting standards materially affects financial condition, results of operations, or liquidity, the impacts are discussed in the applicable sections of the financial review and notes to the consolidated financial statements.

On June 12, 2009, the FASB issued SFAS No. 166, “Accounting for Transfers of Financial Assets” (“FAS 166”), which was incorporated into ASC 860 “Transfers and Servicing”, and SFAS No.167, “Amendments to FASB Interpretation No. 46 (Revised), which was incorporated into ASC 810 “Consolidation” (“FAS 167”), which change the way entities account for securitizations and special-purpose entities.


TABLE OF CONTENTS

FAS 166 is a revision to FASB ASC 860-10 (previously SFAS No. 140, “Accounting for Transfers and Servicing of Financial Assets and Extinguishments of Liabilities”) and will require more information about transfers of financial assets, including securitization transactions, and where companies have continuing exposure to the risks related to transferred financial assets. FAS 166 also eliminates the concept of a “qualifying special-purpose entity”, changes the requirements for derecognizing financial assets and requires additional disclosures.

FAS 167 changes how a company determines when an entity that is insufficiently capitalized or is not controlled through voting (or similar rights) should be consolidated. The determination of whether a company is required to consolidate an entity is based on, among other things, an entity’s purpose and design and a company’s ability to direct the activities of the entity that most significantly impact the entity’s economic performance.

Both FAS 166 and FAS 167 became effective as of the beginning of each reporting entity’s first annual reporting period that begins after November 15, 2009, for interim periods within that first annual reporting period and for interim and annual reporting periods thereafter. Earlier application is prohibited. The recognition and measurement provisions of FAS 166 shall be applied to transfers that occur on or after the effective date. The Corporation adopted both FAS 166 and FAS 167 on January 1, 2010, as required. The Corporation is currently assessing the impact this adoption may have on the Corporation’s consolidated financial statements.

In January 2010,2013, the FASB issued ASU No. 2010-06, 2013-01,ImprovingBalance Sheet (Topic 210): Disclosures About Fair Value Measurementsabout Offsetting Assets and Liabilities,”,” which added disclosure requirementsamended disclosures by requiring improved information about transfers intofinancial instruments and out of Levels 1, 2, and 3, clarified existing fair value disclosure requirements about the appropriate level of disaggregation, and clarifiedderivative instruments that a description of the valuation technique (e.g., market approach, income approach, or cost approach) and inputs used to measure fair value was required for recurring, nonrecurring, and Level 2 and 3 fair value measurements. These provisions of the ASU were effective for the Corporation’s reporting period ending March 31, 2010. The ASU also requires that Level 3 activity about purchases, sales, issuances, and settlements be presented on a gross basis rather than as a net number as currently permitted. This provision of the ASU is effective for the Corporation’s reporting period ending March 31, 2011. As this provision amends only the disclosure requirements related to Level 3 activity, the adoption will have no impactare either offset on the Corporation’s statementsbalance sheet or subject to an enforceable master netting arrangement or similar agreement, irrespective of income and condition.

In December 2010,whether they are offset on the FASB issued ASU No. 2010-28, “When to Perform Step 2 of the Goodwill Impairment Test forbalance sheet. Reporting Units with Zero or Negative Carrying Amounts.” Under GAAP, the evaluation of goodwill impairment is a two-step test. In Step 1, an entity must assess whether the carrying amount of a reporting unit exceeds its fair value. If it does, an entity must perform Step 2 of the goodwill impairment test to determine whether goodwill has been impaired and to calculate the amount of that impairment. The provisions of this ASU modify Step 1 of the goodwill impairment test for reporting units with zero or negative carrying amounts. For those reporting units, an entity isentities are required to perform Step 2provide both net and gross information for these assets and liabilities in order to enhance comparability between those entities that prepare their financial statements on the basis of international financial reporting standards ("IFRS"). Companies were required to apply the goodwill impairment test if it is more likely than not that a goodwill impairment exists.amendments for fiscal years beginning on or after January 1, 2013, and interim periods within those years. The provisions of this ASU are effective for the Corporation’s reporting period ending March 31, 2011. As of December 31, 2010, the Corporation had no reporting units with zero or negative carrying amounts or reporting units where there was a reasonable possibility of failing Step 1 of the goodwill impairment test. As a result, the adoption of this ASU isaccounting standard did not expected to have a material impact on the Corporation’s statementsCorporation's results of income and condition.

operations, financial position, or liquidity.

In January 2011,February 2013, the FASB issued ASU No. 2011-01, “2013-02, "DeferralReporting of Amounts Reclassified Out of Accumulated Other Comprehensive Income," to improve the Effective Datetransparency of Disclosures about Troubled Debt Restructuringsreporting these reclassifications. ASU No. 2013-02 does not amend any existing requirements for reporting net income or other comprehensive income in Updatethe financial statements. ASU No. 2010-20.2013-02 requires an entity to disaggregate the total change of each component of other comprehensive income and separately present reclassification adjustments and current period other comprehensive income. The provisions of ASU No. 2010-20 required the disclosure of more granular information2013-02 also requires that entities present either in a single note or parenthetically on the nature and extentface of troubled debt restructurings and their effect on the Allowance for the period ending March 31, 2011. The amendments in this ASU defer the effective date related to these disclosures, enabling creditors to provide those disclosures after the FASB completes its project clarifying the guidance for determining what constitutes a troubled debt restructuring. Currently, that guidance is expected to be effective for interim and annual periods ending after June 15, 2011. As the provisions of this ASU only defer the effective date of disclosure requirements related to troubled debt restructurings, the adoption of this ASU will have no impact on the Corporation’s statements of income and condition.


TABLE OF CONTENTS

ASU 2010-20

ASU 20100-20,Receivables (Topic 310): Disclosures about the Credit Quality of Financing Receivables and the Allowance for Credit Losses, will help investors assess the credit risk of a company’s receivables portfolio and the adequacy of its allowance for credit losses held against the portfolios by expanding credit risk disclosures.

This ASU requires more information about the credit quality of financing receivables in the disclosures to financial statements, such as aging information and credit quality indicators. Both new and existing disclosures must be disaggregated by portfolio segment or class. The disaggregation of information is based on how a company develops its allowance for credit losses and how it manages its credit exposure.

The amendments in this Update apply to all public and nonpublic entities with financing receivables. Financing receivables include loans and trade accounts receivable. However, short-term trade accounts receivable, receivables measured at fair value or lower of cost or fair value, and debt securities are exempt from these disclosure amendments.

The effective date of ASU 2010-20 differs for public and nonpublic companies. For public companies, the amendments that require disclosures as of the end of a reporting period are effective for periodsending on or after December 15, 2010. The amendments that require disclosures about activity that occurs during a reporting period are effective for periodsbeginning on or after December 15, 2010. For nonpublic companies, the amendments are effective for annual reporting periods ending on or after December 15, 2011.

In April 2009, the FASB issued three amendments to the fair value measurement, disclosure and other-than-temporary impairment standards:

FASB ASC 820-10-65 (previously SFAS 157-4, “Determining Fair Value When the Volume and Level of Activity for the Asset or Liability Have Significantly Decreased and Identifying Transactions that are Not Orderly”).
FASB ASC 320-10-65 (previously SFAS 115-2 and SFAS 124-2, “Recognition and Presentation of Other-Than-Temporary Impairments”).
FASB ASC 825-10-65 (previously SFAS 107 and APB 28-1, “Interim Disclosure about Fair Value of Financial Instruments”).

FASB ASC 820-10-05 (previously SFAS No. 157, “Fair Value Measurements”) defines fair value as the price that would be received to sell the asset or transfer the liability in an orderly transaction (that is, not a forced liquidation or distressed sale) between market participants at the measurement date under current market conditions. FASB ASC 820-10-05 provides additional guidance on identifying circumstances when a transaction may not be considered orderly.

FASB ASC 820-10-65 provides a list of factors that a reporting entity should evaluate to determine whether there has been a significant decrease in the volume and level of activity for the asset or liability in relation to normal market activity for the asset or liability. When the reporting entity concludes there has been a significant decrease in the volume and level of activity for the asset or liability, further analysis of the information from that market is needed and significant adjustments to the related prices may be necessary to estimate fair value in accordance with FASB ASC 820-10-05.

FASB ASC 820-10-65 clarifies that when there has been a significant decrease in the volume and level of activity for the asset or liability, some transactions may not be orderly. In those situations, the entity must evaluate the weight of evidence to determine whether the transaction is orderly. It also provides a list of circumstances that may indicate that a transaction is not orderly. A transaction price that is not associated with an orderly transaction is given little, if any, weight when estimating fair value.

FASB ASC 320-10-65 amends other-than-temporary impairment guidance for debt securities and expands disclosure requirements for other-than-temporarily impaired debt and equity securities. FASB ASC 320-10-65 requires companies to record other-than-temporary impairment charges, through earnings, if they have the intent to sell, or will more likely than not be required to sell, an impaired debt security before a recovery of its amortized cost basis. In addition, FASB ASC 320-10-65 requires companies to record other-than-temporary


TABLE OF CONTENTS

impairment charges through earnings for the amount of credit losses, regardless of the intent or requirement to sell. Credit loss is measured as the difference between the present value of an impaired debt security’s cash flows and its amortized cost basis. Non-credit related write-downs to fair value must be recorded as decreases to accumulated other comprehensive income as long as a company has no intent or requirement to sell an impaired security before a recovery of amortized cost basis. Finally, FASB ASC 320-10-65 requires companies to record all previously recorded non-credit related other-than-temporary impairment charges for debt securities as cumulative effect adjustments to retained earnings as of the beginning of the period of adoption.

FASB ASC 825-10-65 (previously SFAS 107-1 and APB 28-1) requires disclosures about fair value of financial instruments for interim reporting periods of publicly traded companies as well as in annual financial statements. FASB ASC 825-10-65 also requires those disclosures in summarized financial information at interim reporting periods.

All three FASB ASC’s discussed herein include substantial additional disclosure requirements. The effective date for these new ASC’s is the same: interim and annual reporting periods ended after June 15, 2009. The Corporation adopted these ASC’s at June 30, 2009 and there was not a material impact on its consolidated financial statements.

On May 28, 2009, the FASB issued FASB ASC 855-10-05 (previously SFAS No. 165, “Subsequent Events”). Under FASB ASC 855-10-05, companies are required to evaluate events and transactions that occur after the balance sheet date but before the date the financial statements are issued, or available to be issued in the case of non-public entities. FASB ASC 855-10-05 requires entities to recognize in the financial statements, the effect of all events or transactions that provide additional evidencesignificant amounts reclassified from each component of conditions that existed ataccumulated other comprehensive income based on its source and the balance sheet date, includingincome statement line item affected by the estimates inherent in the financial preparation process. Entities shall not recognize the impact of events or transactions that provide evidence about conditions that did not exist at the balance sheet date but arose after that date. FASB ASC 855-10-05 also requires entities to disclose the date through which subsequent events have been evaluated. ASC 855-10-05 was subsequently amended in February of 2010 by ASU 2010-09 “Amendment to Certain recognition and Disclosure Requirements.” FASB ASC 855-10-05 was effective for interim and annual reporting periods ending after June 15, 2009.reclassification. The Corporation adopted the provisions of FASB ASC 855-10-05 forASU No. 2013-02 effective January 1, 2013. As the quarter ended June 30, 2009. TheCorporation provided these required disclosures in the notes to the Consolidated Financial Statements, the adoption of this accounting standardASU No. 2013-02 had no material impact on the Corporation’sCorporation's consolidated financial statements.

On June 12, 2009, the FASB issued SFAS No. 166, “Accounting for Transfersstatements of Financial Assets” (“FAS 166”),income and SFAS No. 167, “Amendments to FASB Interpretation No. 46(R)” (“FAS 167”), which change the way entities account for securitizations and special-purpose entities.

FAS 166 is a revision to FASB ASC 860-10-05 (previously SFAS 140, “Accounting for Transfers and Servicing of Financial Assets and Extinguishments of Liabilities”) and will require more information about transfers of financial assets, including securitization transactions, and where companies have continuing exposure to the risks related to transferred financial assets. FAS 166 also eliminates the concept of a “qualifying special-purpose entity”, changes the requirements for derecognizing financial assets and requires additional disclosures.

FAS 167 changes how a company determines when an entity that is insufficiently capitalized or is not controlled through voting (or similar rights) should be consolidated. The determination of whether a company is required to consolidate an entity is based on, among other things, an entity’s purpose and design and a company’s ability to direct the activities of the entity that most significantly impact the entity’s economic performance.

Both FAS 166 and FAS 167 will be effective as of the beginning of each reporting entity’s first annual reporting period that begins after November 15, 2009, for interim periods within that first annual reporting period and for interim and annual reporting periods thereafter. Earlier application is prohibited. The recognition and measurement provisions of FAS 166 shall be applied to transfers that occur on or after the effective date. The Corporation adopted both FAS 166 and FAS 167 on January 1, 2010, as required. The Corporation is currently assessing the impact this adoption may have on the Corporation’s consolidated financial statements.


condition.
 

TABLE OF CONTENTS

In November 2008, the SEC released a proposed roadmap regarding the potential use by U.S. issuers of financial statements prepared in accordance with International Financial Reporting Standards (“IFRS”). IFRS is a comprehensive series of accounting standards published by the International Accounting Standards Board. Under the proposed roadmap, the Company may be required to prepare financial statements in accordance with IFRS as early as 2014. The SEC will make a determination in 2011 regarding the mandatory adoption of IFRS. The Company is currently assessing the impact that this potential change would have on its consolidated financial statements, and it will continue to monitor the development of the potential implementation of IFRS.

56

Asset and Liability Management

Asset and liability management encompasses an analysis of market risk, the control of interest rate risk (interest sensitivity management) and the ongoing maintenance and planning of liquidity and capital. The composition of the Corporation’s statement of condition is planned and monitored by the Asset and Liability Committee (“ALCO”). In general, management’s objective is to optimize net interest income and minimize market risk and interest rate risk by monitoring these components of the statement of condition.

Short-term interest rate exposure analysis is supplemented with an interest sensitivity gap model. The Corporation utilizes interest sensitivity analysis to measure the responsiveness of net interest income to changes in interest rate levels. Interest rate risk arises when an earning asset matures or when its interest rate changes in a time period different than that of a supporting interest-bearing liability, or when an interest-bearing liability matures or when its interest rate changes in a time period different than that of an earning asset that it supports. While the Corporation matches only a small portion of specific assets and liabilities, total earning assets and interest-bearing liabilities are grouped to determine the overall interest rate risk within a number of specific time frames.

The difference between interest sensitive assets and interest sensitive liabilities is referred to as the interest sensitivity gap. At any given point in time, the Corporation may be in an asset-sensitive position, whereby its interest-sensitive assets exceed its interest-sensitive liabilities, or in a liability-sensitive position, whereby its interest-sensitive liabilities exceed its interest-sensitive assets, depending in part on management’s judgment as to projected interest rate trends.

The Corporation’s rate sensitivity position in each time frame may be expressed as assets less liabilities, as liabilities less assets, or as the ratio between rate sensitive assets (“RSA”) and rate sensitive liabilities (“RSL”). For example, a short funded position (liabilities repricingre-pricing before assets) would be expressed as a net negative position, when period gaps are computed by subtracting repricingre-pricing liabilities from repricingre-pricing assets. When using the ratio method, a RSA/RSL ratio of 1 indicates a balanced position, a ratio greater than 1 indicates an asset sensitive position and a ratio less than 1 indicates a liability sensitive position.

A negative gap and/or a rate sensitivity ratio less than 1, tends to expand net interest margins in a falling rate environment and to reduce net interest margins in a rising rate environment. Conversely, when a positive gap occurs, generally margins expand in a rising rate environment and contract in a falling rate environment. From time to time, the Corporation may elect to deliberately mismatch liabilities and assets in a strategic gap position.

At December 31, 2010,2013, the Corporation reflected a positive interest sensitivity gap (or an interest sensitivity ratio of (1.21 to1.00)(1:31 to 1.00) at the cumulative one-year position. Based on management’s perception that interest rates will continue to be volatile, projected increased levels of prepayments on the earning asset portfolio and the current level of interest rates, emphasis has been, and is expected to continue to be, placed on interest-sensitivity matching with the objective of continuing to stabilize the net interest spread and margin during 2011.2014. However, no assurance can be given that this objective will be met.


TABLE OF CONTENTS

57

The following table depicts the Corporation’s interest rate sensitivity position at December 31, 2010:

2013:
         
         
 Expected Maturity/Principal Repayment December 31,
   Average Interest Rate Year End 2011 Year End 2012 Year End 2013 Year End 2014 Year End 2015 2016 and Thereafter Total Balance Estimated Fair Value
   (Dollars in Thousands)
Interest-Earning Assets:
                                             
Loans, net  5.41 $288,072  $95,302  $118,410  $70,086  $41,415  $86,292  $699,577  $706,309 
Investments  3.07  87,524   53,533   24,911   28,450   28,846   154,816   378,080   378,080 
Total interest-earning assets    $375,596  $148,835  $143,321  $98,536  $70,261  $241,108  $1,077,657  $1,084,389 
Interest-Bearing Liabilities:
                                             
Time certificates of deposit of $100,000 or greater  0.87 $107,115  $9,783  $2,753  $  $  $  $119,651  $120,021 
Time certificates of deposit of less than $100,000  1.46  45,737   12,246   3,554   150   265   10   61,962   62,358 
Other interest-bearing deposits  0.56  99,536   99,536   103,513   48,142   89,412   94,370   534,509   534,593 
Subordinated debentures  3.14  5,155                  5,155   5,157 
Securities sold under agreements to repurchase and Fed Funds Purchased  2.75  41,855            10,000   31,000   82,855   87,602 
Term borrowings  3.61  10,000      5,000         115,000   130,000   133,823 
Total interest-bearing liabilities    $309,398  $121,565  $114,820  $48,292  $99,677  $240,380  $934,132  $943,554 
Cumulative interest-earning assets      $375,596  $524,431  $667,752  $766,288  $836,549  $1,077,657  $1,077,657      
Cumulative interest-bearing liabilities       309,398   430,963   545,783   594,075   693,752   934,132   934,132      
Rate sensitivity gap       66,198   27,270   28,501   50,244   (29,416  728   143,525      
Cumulative rate sensitivity gap       66,198   93,468   121,969   172,213   142,797   143,525   143,525      
Cumulative gap ratio       1.21  1.22  1.22  1.29  1.21  1.15  1.15     

  Expected Maturity/Principal Repayment December 31, 
  Average
Interest
Rate
  Year
End
2014
  Year
End
2015
  Year
End
2016
  Year
End
2017
  Year
End
2018
  2019
and
Thereafter
  Total
Balance
  Estimated
Fair
Value
 
 (Dollars in Thousands) 
Interest-Earning Assets:                                    
Loans, net  4.42% $343,557  $110,140  $85,347  $87,235  $124,630  $199,701  $950,610  $948,606 
Investments  2.99%  69,678   32,086   53,108   29,752   27,951   325,781   538,356   534,028 
Total interest-earning assets     $413,235  $142,226  $138,455  $116,987  $152,581  $525,482  $1,488,966  $1,482,634 
Interest-Bearing Liabilities:                                    
Time certificates of deposit of
    $100,000 or greater
  0.88% $62,473  $16,434  $16,817  $3,720  $  $  $99,444  $100,194 
Time certificates of deposit of
    less than $100,000
  1.36%  39,633   9,238   2,948   656   34      52,509   52,905 
Other interest-bearing deposits  0.41%  207,650   206,551   155,746   106,746   79,313   434,046   1,190,052   1,190,052 
Subordinated debentures  3.06%  5,155                  5,155   5,143 
Securities sold under agreements
    torepurchase and Fed Funds
    Purchased
  5.90%           15,000   16,000      31,000   33,430 
Term borrowings  3.26%           35,000   40,000   40,000   115,000   124,010 
Total interest-bearing liabilities     $314,911  $232,223  $175,511  $161,122  $135,347  $474,046  $1,493,160  $1,505,734 
Cumulative interest-earning
    assets
     $413,235  $555,461  $693,916  $810,903  $963,484  $1,488,966  $1,434,314     
Cumulative interest-bearing
    liabilities
      314,911   547,134   722,645   883,767   1,019,114   1,493,160   1,243,006     
Rate sensitivity gap      98,324   (89,997)   (37,056)   (44,135)   17,234   51,436   191,308     
Cumulative rate sensitivity gap      98,324   8,327   (28,729)   (72,864)   (55,630)   (4,194)   (4,194)     
Cumulative gap ratio      1.31%  1.02%  0.96%  0.92%  0.95%  1.00%  1.00%    
Estimates of Fair Value

The estimation of fair value is significant to a number of the Corporation’s assets, including loans held for sale, and available-for-sale investment securities. These are all recorded at either fair value or the lower of cost or fair value. Fair values are volatile and may be influenced by a number of factors. Circumstances that could cause estimates of the fair value of certain assets and liabilities to change include a change in prepayment speeds, expected cash flows, credit quality, discount rates, or market interest rates. Fair values for most available for sale investment securities are based on quoted market prices. If quoted market prices are not available, fair values are based on judgments regarding future expected loss experience, current economic condition risk characteristics of various financial instruments, and other factors. See Note 1819 of the Notes to Consolidated Financial Statements for additional discussion.

These estimates are subjective in nature, involve uncertainties and matters of significant judgment and therefore cannot be determined with precision. Changes in assumptions could significantly affect the estimates.

Impact of Inflation and Changing Prices

The financial statements and notes thereto presented elsewhere herein have been prepared in accordance with generally accepted accounting principles, which require the measurement of financial position and operating results in terms of historical dollars without considering the change in the relative purchasing power of money over time due to inflation. The impact of inflation is reflected in the increased cost of the operations; unlike most industrial companies, nearly all of the Corporation’s assets.assets and liabilities are monetary. As a result, interest rates have a greater impact on performance than do the effects of general levels of inflation. Interest rates do not necessarily move in the same direction or to the same extent as the prices of goods and services


services.
 

TABLE OF CONTENTS

58

Liquidity

The liquidity position of the Corporation is dependent on successful management of its assets and liabilities so as to meet the needs of both deposit and credit customers. Liquidity needs arise principally to accommodate possible deposit outflows and to meet customers’ requests for loans. Scheduled principal loan repayments, maturing investments, short-term liquid assets and deposit in-flows, can satisfy such needs. The objective of liquidity management is to enable the Corporation to maintain sufficient liquidity to meet its obligations in a timely and cost-effective manner.

Management monitors current and projected cash flows, and adjusts positions as necessary to maintain adequate levels of liquidity. By using a variety of potential funding sources and staggering maturities, the risk of potential funding pressure is reduced. Management also maintains a detailed liquidity contingency plan designed to respond adequately to situations which could lead to liquidity concerns.

Management believes that the Corporation has the funding capacity to meet the liquidity needs arising from potential events. In addition to pledgeable securities available to pledge, the Corporation also maintains borrowing capacity through the Federal Discount Window and the Federal Home Loan Bank of New York secured with loans and marketable securities.

Liquidity is measured and monitored for the Corporation’s bank subsidiary, Union Center National Bank (the “Bank”).Bank. The Corporation reviews its net short-term mismatch. This measures the ability of the Corporation to meet obligations should access to Bank dividends be constrained. At December 31, 2010,2013, the Parent Corporation had $4.6 million$285,000 in cash and short-term investments compared to $3.2 million$629,000 at December 31, 2009.2012. Expenses at the Parent Corporation are moderate and management believes that the Parent Corporation has adequate liquidity to fund its obligations.

Certain provisions of long-term debt agreements, primarily subordinated debt, prevent the Corporation from creating liens on, disposing of or issuing voting stock of subsidiaries. As of December 31, 2010,2013, the Corporation was in compliance with all covenants and provisions of these agreements.

Management monitors current and projected cash flows, and adjusts positions as necessary to maintain adequate levels of liquidity. By using a variety of potential funding sources and staggering maturities, the risk of potential funding pressure is somewhat reduced. Management also maintains a detailed liquidity contingency plan designed to adequately respond to situations which could lead to liquidity concerns.

Based on anticipated cash flows at December 31, 20102013 projected to December 31, 2011,2014, the Corporation believes that the Bank’s liquidity should remain strong, with an approximate projection of $71.4$212.6 million in anticipated net cash flows over the next twelve months. This projection represents a forward-looking statement under the Private Securities Litigation Reform Act of 1995. Actual results could differ materially from this projection depending upon a number of factors, including the liquidity needs of the Bank’s customers, the availability of sources of liquidity and general economic conditions.

On September 30, 2009, the FDIC proposed a rule that required insured institutions to prepay their estimated quarterly assessments through December 31, 2012 to strengthen the cash position of the Deposit Insurance Fund. The cash prepayment was made on December 30, 2009 and amounted to approximately $5.7 million, which included the 2009 fourth quarter assessment. The prepayment did not have a significant impact on the Corporation’s future cash position or operations.

Deposits

Total deposits increased to $860.3 million$1.342 billion at December 31, 20102013 from $813.7 million$1.307 billion at December 31, 2009,2012, an increase of $46.6$35.1 million, or 5.732.7 percent.

Total non-interest-bearing deposits increased to $144.2$227.4 million at December 31, 20102013 from $130.5$215.1 million at December 31, 2009,2012, an increase of $13.7$12.3 million or 10.495.7 percent. Time, savings and interest-bearing transaction accounts increased to $716.1 million$1.015 billion at December 31, 20102013 from $683.2$981.0 million on December 31, 2009,2012, an increase of $32.9$34.2 million or 4.823.5 percent. The increaseThese increases were attributable to continued core deposit growth in deposits was reflective of customers’ desire for safety and liquidity and flight to quality in lightoverall segments of the financial crisis.


deposits base and in niche areas, such as municipal government, private schools and universities.
 

TABLE OF CONTENTS

59

Certificates of deposit $100,000 and over decreased to 13.97.41 percent of total deposits at December 31, 20102013 from 17.88.48 percent one year earlier. With the current turmoil in the financial markets commencing several years ago, some of the Corporation’s depositors have become sensitive to obtaining full FDIC insurance for their time deposits. To accommodate itsthese customers, the Corporation began offering Certificates of Deposit Account Registry Service (CDARS) in 2008. As a result of this offering and the increase in insurance coverage by the FDIC to $250,000, the Corporation reported a decrease of $25.2$11.4 million in certificates of deposit greater than $100,000 at December 31, 20102013 compared to year-end 2009.

2012. See Note 9 of the Notes to the Consolidated Financial Statements for more information.

At December 31, 2010,2013, the Corporation had a total of $83.0$7.8 million with a weighted average rate of 0.770.47 percent in CDARSCDARS/ICS Reciprocal deposits compared to $111.3$14.7 million with a weighted average rate of 1.240.60 percent at December 31, 2009.2012. Based on the Bank’s participation in Promontory Interfinancial Network, LLC., customers who are FDIC insurance sensitive are able to place large dollar deposits with the Corporation and the Corporation uses CDARS to place those funds into certificates of deposit issued by other banks in the Network. This occurs in increments of less than the FDIC insurance limits so that both the principal and interest are eligible for complete FDIC protection. The FDIC currently considers these funds as brokered deposits. All brokered deposits are classified in time deposits. It became apparent during the latter half of 2008 that customers’ preference in seeking safety and more liquidity became paramount in light of the financial crisis, as customers sought full FDIC insured bank products as a safe haven.

The Corporation derives a significant proportion of its liquidity from its core deposit base. For the year ended December 31, 2010,2013, core deposits, comprised of total demand deposits, savings deposits and money market accounts, increased by $89.5$52.3 million or 15.04.6 percent from December 31, 20092012 to $686.2 million$1.195 billion at December 31, 2010.2013. At December 31, 2010,2013, core deposits were 79.889.1 percent of total deposits compared to 73.386.9 percent at year-end 2009.2012. Alternatively, the Corporation uses a more stringent calculation for the management of its liquidity positions internally which consists of total demand and savings accounts (excluding money market accounts greater than $100,000) and excludes time deposits as part of core deposits as a percentage of total deposits. This number increased by $95.8$50.3 million or 25.27.2 percent from December 31, 20092012 to $475.1$750.2 million at December 31, 2013 and represented 55.255.90 percent of total deposits at December 31, 20102013 as compared with 46.653.55 percent at December 31, 2009.2012. The Corporation expects its deposit gathering efforts to remain strong, supported in part by the FDIC’s temporarily raising the deposit insurance limits. The Corporation was a participant in the FDIC’s Transaction Account Guarantee Program. Under this program, all non-interest bearing deposit transaction accounts were fully guaranteed by the FDIC, regardless of dollar amount, through June 30, 2010.

On July 21, 2010, President Obama signed the Dodd-Frank Act into law. One of the provisions of this actAct permanently increases the maximum amount of deposit insurance for banks, savings institutions and credit unions to $250,000 per depositor, retroactive to January 1, 2009, and non-interest bearing transaction accounts have unlimited deposit insurance through December 31, 2013.

2012.

The following table depicts the Corporation’s more stringent core deposit mix at December 31, 20102013 and 2009.

     
 December 31, Net Change
Volume
2010 vs. 2009
   2010 2009
   Amount Percentage Amount Percentage
   (Dollars in Thousands)
Demand Deposits $144,210   30.4 $130,518   34.4 $13,692 
Interest-Bearing Demand  186,509   39.2   156,738   41.3   29,771 
Regular Savings  112,305   23.6   58,240   15.4   54,065 
Money Market Deposits under $100  32,105   6.8   33,795   8.9   (1,690
Total core deposits $475,129   100.0 $379,291   100.0 $95,838 
Total deposits $860,332       $813,705       $46,627 
Core deposits to total deposits  55.23       46.61          

2012.
 

TABLE OF CONTENTS

  December 31,  Net Change
Volume
2013 vs. 2012
 
  2013  2012     
  Amount Percentage  Amount Percentage     
  (Dollars in Thousands) 
Demand Deposits $227,370   30.3% $215,071   30.7% $12,299 
Interest-Bearing Demand  266,613   35.5   217,922   31.2   48,691 
Regular Savings  102,721   13.7   110,896   15.8   (8,175) 
Money Market Deposits under
    $100
  153,502   20.5   156,009   22.3   (2,507) 
Total core deposits $750,206   100.0% $699,898   100.0% $50,308 
Total deposits $1,342,005      $1,306,922      $35,083 
Core deposits to total deposits  55.90%      53.55%        

60

Short-Term Borrowings

Short-term borrowings can be used to satisfy daily funding needs. Balances in those accounts fluctuate on a day-to-day basis. The Corporation’s principal short-term funding sources are Federal Funds purchased and securities sold under agreements to repurchase. Short-term borrowings, including Federal Funds purchased and securities sold under agreements to repurchase, amounted to $41.9 million$0 at year-end 2010, a decrease2013, and 2012. During the third quarter of $4.32011 certain sweep relationships, in the amount of approximately $37 million, or 9.2 percent from year-end 2009.

that were previously classified as short term borrowings were discontinued and were moved to interest bearing checking accounts.

The following table is a summary of short-term securities sold under repurchase agreements, including Federal Funds purchased, for each of the last three years.

   
 December 31,
   2010 2009 2008
   (Dollars in Thousands)
Short-term securities sold under repurchase agreements, including Federal Funds purchased:
               
Average interest rate:
               
At year end  0.27  0.97  1.98
For the year  0.50  1.38  2.39
Average amount outstanding during the year $42,608  $35,392  $43,973 
Maximum amount outstanding at any month end $54,855  $58,515  $52,992 
Amount outstanding at year end $41,855  $46,109  $30,143 

  December 31, 
  2013  2012  2011 
  (Dollars in Thousands) 
Short-term securities sold under repurchase
    agreements,including Federal Funds purchased:
            
Average interest rate:            
At year end  %  %  %
For the year  0.32%  0.48%  0.27%
Average amount outstanding during the year $425  $181  $29,288 
Maximum amount outstanding at any month end $-  $10,050  $71,732 
Amount outstanding at year end $  $  $ 
Long-Term Borrowings

Long-term borrowings consist of Federal Home Loan Bank of New York (“FHLB”) advances and securities sold under agreements to repurchase that have contractual maturities over one year. Long-term borrowings amounted to $171.0$146.0 million at December 31, 2010, a decrease of $52.1 million or 23.4 percent, from year-end 2009 as the Corporation decided to concentrate its efforts on increasing the core deposit base of the Bank and replaced those borrowings.

2013.

Cash Flows

The consolidated statements of cash flows present the changes in cash and cash equivalents from operating, investing and financing activities. During 2010,2013, cash and cash equivalents (which decreased overall by $51.7 million) were provided on a net basis by operating activities and used on a net basis by investing activities and financing activities. With respect to the cash flows from financing activities, a net increase in deposits and proceeds from a stock offering were offset by a reduction in borrowings and the Corporation’s dividend payments

During 2009, cash and cash equivalents (which increased overall by $74.1$23.4 million) were provided on a net basis by operating activities and financing activities, and used on a net basis by investing activities. With respect to the cash flows from financing activities, a $172.3 million increase in cash resulted from a substantial net increaseincreases in deposits as well as fromwere partially offset by the proceeds of our TARP participation and rights offering.

Corporation’s dividend payments.

During 2008,2012, cash and cash equivalents (which decreased overall by $55.0$5.0 million) were usedprovided on a net basis by operating activities and investingfinancing activities, and used on a net basis by investing activities. With respect to the cash flows from financing activities, net increases in deposits were partially offset by payments on long-term borrowings and the Corporation’s dividend payments.
During 2011, cash and cash equivalents (which increased overall by $73.6 million) were provided on a net basis by operating activities and financing activities, and used on a net basis by investing activities. CashWith respect to the cash flows from investingfinancing activities, primarily due to a net decreaseincreases in securities,deposits and SBLF proceeds were partially offset by an increasereductions in financing activities, primarily resulting from an increase in borrowings.


borrowings and the Corporation’s dividend payments.
 

TABLE OF CONTENTS

61

Contractual Obligations and Other Commitments

The following table summarizes contractual obligations at December 31, 20102013 and the effect such obligations are expected to have on liquidity and cash flows in future periods.

TotalLess Than
1 Year
1 – 3 Years4 – 5 YearsAfter
5 Years
(Dollars in Thousands)
Contractual Obligations
Operating lease obligations$7,122$607$1,125$1,071$4,319
Total contracted cost obligations$7,122$607$1,125$1,071$4,319
Other Long-term Liabilities/Long-term Debt
Time Deposits$181,613$152,859$28,329$415$10
Federal Home Loan Bank advances and repurchase agreements199,85538,8555,00010,000146,000
Subordinated debentures5,1555,155
Total Other Long-term Liabilities/Long-term Debt$386,623$196,869$33,329$10,415$146,010
Other Commercial Commitments – 
Off Balance Sheet
Commitments under commercial loans and lines of credit$77,786$77,786$$$
Home equity and other revolving lines of credit50,13150,131
Outstanding commercial mortgage loan commitments32,55428,0544,500
Standby letters of credit2,2252,225
Performance letters of credit12,01911,329690
Outstanding residential mortgage loan commitments250250
Overdraft protection lines4,8984,898
Other consumer
Total off balance sheet arrangements and contractual obligations$179,863$174,673$5,190$$
Total contractual obligations and other commitments$573,608$372,149$39,644$11,486$150,329

  Total Less Than
1 Year
 1 – 3 Years 4 – 5 Years After
5 Years
 
  (Dollars in Thousands) 
Contractual Obligations                
Operating lease obligations $11,543 $920 $1,735 $1,599 $7,289 
Total contracted cost obligations $11,543 $920 $1,735 $1,599 $7,289 
Other Long-term Liabilities/Long-term
    Debt
                
Time Deposits $151,953 $102,106 $45,437 $4,410 $ 
Federal Home Loan Bank advances and
    repurchase agreements
  146,000    50,000  56,000  40,000 
Subordinated debentures  5,155        5,155 
Total Other Long-term
    Liabilities/Long-term Debt
 $303,108 $102,106 $95,437 $60,410 $45,155 
Other Commercial Commitments –
    Off Balance Sheet
                
Commitments under commercial loans
    and lines of credit
 $109,661 $109,661 $ $ $ 
Home equity and other revolving lines
    of credit
  41,836  41,836       
Outstanding commercial mortgage loan
    commitments
  48,129  39,568  8,561     
Standby letters of credit  9,655  9,655       
Performance letters of credit  21,844  21,844       
Outstanding residential mortgage loan
    commitments
  1,858  1,858       
Overdraft protection lines  5,273  5,273       
Total off balance sheet arrangements
    and contractual obligations
 $238,256 $229,695 $8,561 $ $ 
Total contractual obligations and other
    commitments
 $552,907 $332,721 $105,733 $62,009 $52,444 
The Stockholders’ Equity

Stockholders’ equity amounted to $121.0$168.6 million at December 31, 2010,2013, an increase of $19.2$7.9 million or 18.94.9 percent, compared to year-end 2009.2012. At December 31, 2009,2012, stockholders’ equity totaled $101.7$160.7 million, an increase of $20.0$24.8 million or 24.518.2 percent from December 31, 2008.

2011.

On September 15, 2011, the Corporation issued $11.25 million in nonvoting senior preferred stock to the Treasury under the Small Business Lending Fund Program. Under the Securities Purchase Agreement, the Corporation issued to the Treasury a total of 11,250 shares of the Corporation’s Senior Non-Cumulative Perpetual Preferred Stock, Series B, having a liquidation value of $1,000 per share. Simultaneously, using the proceeds from the issuance of the SBLF Preferred Stock, the Corporation redeemed from the Treasury, all 10,000 outstanding shares of its Fixed Rate Cumulative Perpetual Preferred Stock, Series A, liquidation amount $1,000 per share, for a redemption price of $10,041,667, including accrued but unpaid dividends up to the date of redemption. The investment in the SBLF program provided the Corporation with approximately $1.25 million additional Tier 1 capital. The capital received under the program has allowed the Corporation to continue to serve its small business clients through the commercial lending program.
62

On December 7, 2011, the Corporation repurchased the warrants issued on January 12, 2009 to the U.S. Treasury as part of its participation in the U.S. Treasury’s TARP Capital Purchase Program. In the repurchase, the Corporation paid the U.S. Treasury $245,000 for the warrants.
In September 2010, the Corporation sold an aggregate of 1,715,000 shares of its common stock under its previously filed shelf registration statement which was declared effective by the Securities and Exchange Commission on May 5, 2010.statement. The Corporation sold 1,430,000 shares of common stock at a price of $7.00 per share, with underwriting discounts and commissions of $0.39 per share, for gross proceeds from this offering of $10,010,000. The Corporation also sold 285,000 shares of common stock directly to certain of its directors at a price of $7.50 per share, for gross proceeds from this offering of $2,137,500. Net proceeds from both offerings totaled $11,377,800$11,378,000 after underwriting discounts and commissions of $557,700$557,000 and offering expenses of approximately $213,000 (which consisted primarily of legal and accounting fees).


TABLE OF CONTENTS

On January 12, 2009, the Corporation issued $10 million in nonvoting senior preferred stock to the U.S. Department of Treasury under the Capital Purchase Program. As part of the transaction, the Corporation also issued warrants to the U.S. Treasury to purchase 173,410 shares of common stock of the Corporation at an exercise price of $8.65 per share. As previously announced, the Corporation’s voluntary participation in the Capital Purchase Program amounted to approximately 50 percent of what the Corporation had qualified for under the U.S. Treasury program. The funding was used to support the balance sheet. As a result of the successful completion of the Rights Offering in October 2009, the number of shares underlying the warrant held by the U.S. Treasury was reduced to 86,705 shares or 50 percent of the original 173,410 shares.

In July 2009, the Corporation announced that its Board of Directors had authorized a rights offering of up to approximately $11 million of common stock to its existing stockholders. In October, the Corporation successfully raised total gross proceeds of approximately $11 million in its rights offering and a private placement with its standby purchaser.

Book value per share at year-end 20102013 was $6.83$9.61 compared to $6.32$9.14 at year-end 2009.2012. Tangible book value at year-end 20102013 was $5.79$8.58 compared to $5.15$8.11 at year end 2009;2012; see Item 6 for a reconciliation of this non-GAAP financial measure to book value.

During 2010,2013, the Corporation made no purchases of common stock. At December 31, 2010,2013, there were 652,868 shares available for repurchase under the Corporation’s stock buyback program.

Capital

The maintenance of a solid capital foundation continues to be a primary goal for the Corporation. Accordingly, capital plans and dividend policies are monitored on an ongoing basis. The most important objective of the capital planning process is to balance effectively the retention of capital to support future growth and the goal of providing stockholders with an attractive long-term return on their investment.

Risk-Based Capital/Leverage

The Corporation’s Tier I leverage capital at December 31, 2010 (defined as tangible stockholders’ equity for common stock and Trust Preferred Capital Securities) at December 31, 2013 amounted to $116.6$159.4 million or 9.909.69 percent of average total assets. At December 31, 2009,2012, the Corporation’s Tier I leverage capital amounted to $98.5$143.8 million or 7.739.02 percent of average total assets. Tier I capital excludes the effect of FASB ASC 320-10-05, which amounted to $5.3 million$2.4 of net unrealized losses,gains, after tax, on securities available-for-sale (reportedat December 31, 2013 (and would be reported as a component of accumulated other comprehensive income which is included in stockholders’ equity), and is reduced by goodwill and intangible assets, of $17.0which amounted to $16.8 million as of December 31, 2010.2013. For information on goodwill and intangible assets, see Note 1 to the Consolidated Financial Statements.

United States bank regulators have issued guidelines establishing minimum capital standards related to the level of assets and off balance-sheet exposures adjusted for credit risk. Specifically, these guidelines categorize assets and off balance-sheet items into four risk-weightings and require banking institutions to maintain a minimum ratio of capital to risk-weighted assets. At December 31, 2010,2013, the Corporation’s Tier I and total risk-based capital ratios were 13.2812.10 percent and 14.2912.91 percent, respectively. For information on risk-based capital and regulatory guidelines for the Parent Corporation and its bank subsidiary, see Note 1314 to the Consolidated Financial Statements.

The foregoing capital ratios are based in part on specific quantitative measures of assets, liabilities and certain off-balance sheet items as calculated under regulatory accounting practices. Capital amounts and classifications are also subject to qualitative judgments by the bank regulators regarding capital components, risk weightings and other factors. The OCC established higher minimum capital ratios for the Bank effective as of December 31, 2009: Tier 1 Risk-Based Capital of 10 percent, Total Risk-Based Capital of 12 percent and Tier 1 Leverage Capital of 8 percent. As of December 31, 2010, management believes that each of the Bank and the Parent Corporation meet all capital adequacy requirements to which it is subject. Under the MOU between the Bank and the OCC, the Bank has agreed to develop a three year capital program, which will include specific plans for the maintenance of adequate capital and the strengthening of the Bank’s capital structure to meet current and future needs.


TABLE OF CONTENTS

63

Subordinated Debentures

On December 19, 2003, Center Bancorp Statutory Trust II, a statutory business trust and wholly-owned subsidiary of Center Bancorp, Inc., issued $5.0 million of, MMCapS capital securities to investors due on January 23, 2034. The capital securities presently qualify as Tier I capital. The trust loaned the proceeds of this offering to the Corporation and received in exchange $5.2 million of the Parent Corporation’s subordinated debentures. The subordinated debentures are redeemable in whole or in part prior to maturity. The floating interest rate on the subordinate debentures is three-month LIBOR plus 2.85 percent and reprices quarterly. The rate at December 31, 20102013 was 3.143.09 percent.

The additional capital raised with respect to the issuance of the floating rate capital pass-through securities was used to bolster the Corporation’s capital and for general corporate purposes, including capital contributions to Union Center National Bank. Additional information regarding the capital treatment of these securities is contained in Note 1011 of the Notes to the Consolidated Financial Statements.

Looking Forward

One of the Corporation’s primary objectives is to achieve balanced asset and revenue growth, and at the same time expand market presence and diversify its financial products. However, it is recognized that objectives, no matter how focused, are subject to factors beyond the control of the Corporation, which can impede its ability to achieve these goals. The following factors should be considered when evaluating the Corporation’s ability to achieve its objectives:

The financial market place is rapidly changing. Banks are no longer the only place to obtain loans, nor the only place to keep financial assets. The banking industry has lost market share to other financial service providers. The future is predicated on the Corporation’s ability to adapt its products, provide superior customer service and compete in an ever-changing marketplace.

Net interest income, the primary source of earnings, is impacted favorably or unfavorably by changes in interest rates. Although the impact of interest rate fluctuations is mitigated by ALCO strategies, significant changes in interest rates can have a material adverse impact on profitability.

The ability of customers to repay their obligations is often impacted by changes in the regional and local economy. Although the Corporation sets aside loan loss provisions toward the allowance for loan losses when management determines such action to be appropriate, significant unfavorable changes in the economy could impact the assumptions used in the determination of the adequacy of the allowance.

Technological changes will have a material impact on how financial service companies compete for and deliver services. It is recognized that these changes will have a direct impact on how the marketplace is approached and ultimately on profitability. The Corporation has taken steps to improve its traditional delivery channels. However, continued success will likely be measured by the Corporation’s ability to anticipate and react to future technological changes.

This “Looking Forward” description constitutes a forward-looking statement under the Private Securities Litigation Reform Act of 1995. Actual results could differ materially from those projected in the Corporation’s forward-looking statements due to numerous known and unknown risks and uncertainties, including the factors referred to above, in Item 1A of this Annual Report on Form 10K and in other sections of this Annual Report on Form 10K.


TABLE OF CONTENTS

64

Item 7A. Quantitative and Qualitative Disclosures Aboutabout Market Risk

Interest Sensitivity

Market Risk

The Corporation’s profitability is affected by fluctuations in interest rates. A sudden and substantial increase or decrease in interest rates may adversely affect the Corporation’s earnings to the extent that the interest rates borne by assets and liabilities do not similarly adjust. The Corporation’s primary objective in managing interest rate risk is to minimize the adverse impact of changes in interest rates on the Corporation’s net interest income and capital, while structuring the Corporation’s asset-liability structure to obtain the maximum yield-cost spread on that structure. The Corporation relies primarily on its asset-liability structure to control interest rate risk. The Corporation continually evaluates interest rate risk management opportunities, including the use of derivative financial instruments. The management of the Corporation believes that hedging instruments currently available are not cost-effective, and, therefore, has focused its efforts on increasing the Corporation’s yield-cost spread through wholesale and retail growth opportunities.

The Corporation monitors the impact of changes in interest rates on its net interest income using several tools. One measure of the Corporation’s exposure to differential changes in interest rates between assets and liabilities is the Corporation’s analysis of its interest rate sensitivity. This test measures the impact on net interest income onor net portfolio value of an immediate change in interest rates in 100 basis point increments. Net portfolio value is defined as the net present value of assets, liabilities and off-balance sheet contracts.

The primary tool used by management to measure and manage interest rate exposure is a simulation model. Use of the model to perform simulations reflecting changes in interest rates over one and two-year time horizons has enabled management to develop and initiate strategies for managing exposure to interest rate risk. In its simulations, management estimates the impact on net interest income of various changes in interest rates. Projected net interest income sensitivity to movements in interest rates is modeled based on both an immediate rise and fall in interest rates (“rate shock”), as well as gradual changes in interest rates over a twelve-month time period. The model is based on the actual maturity and repricingre-pricing characteristics of interest-rate sensitive assets and liabilities. The model incorporates assumptions regarding earning asset and deposit growth, prepayments, interest rates and other factors.

Management believes that both individually and taken together, these assumptions are reasonable, but the complexity of the simulation modeling process results in a sophisticated estimate, not an absolutely precise calculation of exposure. For example, estimates of future cash flows must be made for instruments without contractual maturity or payment schedules.

Based on the results of the interest simulation model as of December 31, 2010,2013, and assuming that management does not take action to alter the outcome, the Corporation would expect a decrease of 1.091.33 and 1.912.30 percent in net interest income if interest rates increased by 200 and 300 basis points, respectively, and a decrease in net interest income of 0.91 percent if interest rates decreased by 100 basis points, from current rates in a gradual and parallel rate ramp over a twelve month period. As market rates declined to historic lows at December 31, 2010, the Corporation did not feel that modeling a down rate scenario was realistic in the current environment.

The declining rates and steepening of the yield curve during both 20102013 and 20092012 affected net interest margins. Based on management’s perception that interest rates will continue to be volatile, projected increased levels of prepayments on the earning-asset portfolio and the current level of interest rates, emphasis has been, and is expected to continue to be, placed on interest-sensitivity matching with the objective of stabilizing the net interest spread during 2011.2014. However, no assurance can be given that this objective will be met.

Equity Price Risk

The Corporation is also exposed to equity price risk inherent in its portfolio of publicly traded equity securities, which had an estimateda fair value of $300,000$287,000 at December 31, 20102013 and $325,000 at December 31, 2009.2012. The Corporation monitors its equity investments for impairment on a periodic basis. In the event that the carrying value of the equity investment exceeds its fair value, and the Corporation determines the decline in value to be other than temporary, the Corporation reduces the carrying value to its current fair value. During 20102013 and 2009,2012, the Corporation recorded $0 and $113,000, respectively, ofdid not record any other-than-temporary impairment charges relating to equity holdings in bank stocks. These equitiesThe remaining securities in the other equity portfolio were written down to fair value.


mutual funds and money market funds.
 

TABLE OF CONTENTS

65

8. Financial Statements and Supplementary Data

All Financial Statements:

The following financial statements are filed as part of this report under Item 8 — “Financial Statements and Supplementary Data.”

 
Page
Page
ReportReports of Independent Registered Public Accounting FirmFirms F-2
Consolidated Statements of Condition F-3F-4
Consolidated Statements of Income F-4F-5
Consolidated Statements of Comprehensive Income
F-6
Consolidated Statements of Changes in Stockholders’ Equity F-5F-7
Consolidated Statements of Cash Flows F-6F-8
Notes to Consolidated Financial Statements F-8F-9

F-1


TABLE OF CONTENTS

REPORT OF INDEPENDENT REGISTERED PUBLIC ACCOUNTING FIRM

To theBoard of Directors and Stockholders

Center Bancorp, Inc.:

We have audited the accompanying consolidated statementsstatement of condition of Center Bancorp, Inc. and subsidiaries (the “Corporation”) as of December 31, 2010 and 2009,2013, and the related consolidated statements of income, comprehensive income, changes in stockholders’ equity, and cash flows for each of the years in the three-year periodyear ended December 31, 2010.2013. Center Bancorp, Inc.’s management is responsible for these consolidated financial statements. Our responsibility is to express an opinion on these financial statements based on our audits.

audit.

We conducted our auditsaudit in accordance with the standards of the Public Company Accounting Oversight Board (United States). Those standards require that we plan and perform the audit to obtain reasonable assurance about whether the financial statements are free of material misstatement. An audit includes examining, on a test basis, evidence supporting the amounts and disclosures in the financial statements. An audit also includes assessing the accounting principles used and significant estimates made by management, as well as evaluating the overall financial statement presentation. We believe that our audits provideaudit provides a reasonable basis for our opinion.

In our opinion, the consolidated financial statements referred to above present fairly, in all material respects, the consolidated financial position of Center Bancorp, Inc. and subsidiaries as of December 31, 2010 and 2009,2013, and the consolidated results of its operations and its cash flows for each of the years in the three-year periodyear ended December 31, 20102013 in conformity with accounting principles generally accepted in the United States of America.

We also have audited, in accordance with the standards of the Public Company Accounting Oversight Board (United States), Center Bancorp, Inc.’s internal control over financial reporting as of December 31, 2010,2013, based on criteria established inInternal Control — Integrated Framework (1992) issued by the Committee of Sponsoring Organizations of the Treadway Commission (COSO), and our report dated March 16, 20115, 2014 expressed an unqualified opinion.

/s/ ParenteBeard LLC

ParenteBeard LLC
Reading, Pennsylvania
March 16, 2011


TABLE OF CONTENTS

/s/ BDO USA, LLP

BDO USA, LLP
Philadelphia, Pennsylvania
March 5, 2014
F-2

Report of Independent Registered Public Accounting Firm
Board of Directors and Stockholders
Center Bancorp, Inc.
We have audited the accompanying consolidated statements of condition of Center Bancorp, Inc. and subsidiaries (the “Corporation”) as of December 31, 2012, and the related consolidated statements of income, comprehensive income, changes in stockholders' equity, and cash flows for each of the years in the two-year period ended December 31, 2012. These consolidated financial statements are the responsibility of the Corporation's management. Our responsibility is to express an opinion on these consolidated financial statements based on our audits.
We conducted our audits in accordance with the standards of the Public Company Accounting Oversight Board (United States), Those standards require that we plan and perform the audit to obtain reasonable assurance about whether the financial statements are free of material misstatement. An audit includes examining, on a test basis, evidence supporting the amounts and disclosures in the financial statements. An audit also includes assessing the accounting principles used and significant estimates made by management, as well as evaluating the overall financial statement presentation. We believe that our audits provide a reasonable basis for our opinion.

In our opinion, the consolidated financial statements referred to above present fairly, in all material respects, the consolidated financial position of Center Bancorp, Inc. and subsidiaries as of December 31, 2012, and the consolidated results of its operations and its cash flows for each of the years in the two-year period ended December 31, 2012 in conformity with accounting principles generally accepted in the United States of America.
/s/ParenteBeard LLC
ParenteBeard LLC
Clark, New Jersey
March 5, 2014
F-3

CENTER BANCORP, INC. AND SUBSIDIARIES

CONSOLIDATED STATEMENTS OF CONDITION

  
 December 31,
   2010 2009
   (In Thousands,
Except Share Data)
ASSETS
     
Cash and due from banks $37,497  $89,168 
Investment securities available-for-sale  378,080   298,124 
Loans  708,444   719,606 
Less: Allowance for loan losses  8,867   8,711 
Net loans  699,577   710,895 
Restricted investment in bank stocks, at cost  9,596   10,672 
Premises and equipment, net  12,937   17,860 
Accrued interest receivable  4,134   4,033 
Bank owned life insurance  27,905   26,304 
Goodwill and other intangible assets  16,959   17,028 
Prepaid FDIC assessment  3,582   5,374 
Other assets  17,118   16,030 
Total assets $1,207,385  $1,195,488 
LIABILITIES AND STOCKHOLDERS’ EQUITY
     
Deposits:
     
Non-interest-bearing $144,210  $130,518 
Interest-bearing:
     
Time deposits $100,000 and over  119,651   144,802 
Interest-bearing transaction, savings and time deposits less than $100,000  596,471   538,385 
Total deposits  860,332   813,705 
Short-term borrowings  41,855   46,109 
Long-term borrowings  171,000   223,144 
Subordinated debentures  5,155   5,155 
Accounts payable and accrued liabilities  8,086   5,626 
Total liabilities  1,086,428   1,093,739 
Stockholders’ Equity
     
Preferred Stock, $1,000 liquidation value per share:
     
Authorized 5,000,000 shares; issued 10,000 shares in 2010 and 2009  9,700   9,619 
Common stock, no par value:
     
Authorized 25,000,000 shares; issued 18,477,412 shares in 2010 and 16,762,412 in 2009; outstanding 16,289,832 shares in 2010 and 14,572,029 in 2009  110,056   97,908 
Additional paid-in capital  4,941   5,650 
Retained earnings  21,633   17,068 
Treasury stock, at cost (2,187,580 shares in 2010 and 2,190,383 in 2009)  (17,698  (17,720
Accumulated other comprehensive loss  (7,675  (10,776
Total stockholders’ equity  120,957   101,749 
Total liabilities and stockholders’ equity $1,207,385  $1,195,488 


  December 31, 
  2013 2012 
  (In Thousands, Except Share and Per Share Data) 
ASSETS       
Cash and due from banks $82,692 $104,134 
Interest bearing deposits with banks    2,004 
Total cash and cash equivalents  82,692  106,138 
Securities available-for-sale  323,070  496,815 
Securities held-to-maturity (fair value of $210,958 and $62,431)  215,286  58,064 
Loans held for sale    1,491 
Loans  960,943  889,672 
Less: Allowance for loan losses  10,333  10,237 
Net loans  950,610  879,435 
Restricted investment in bank stocks, at cost  8,986  8,964 
Premises and equipment, net  13,681  13,563 
Accrued interest receivable  6,802  6,849 
Bank owned life insurance  35,734  34,961 
Goodwill and other intangible assets  16,828  16,858 
Prepaid FDIC assessment    811 
Other real estate owned  220  1,300 
Due from brokers for investment securities  8,759   
Other assets  10,414  4,516 
Total assets $1,673,082 $1,629,765 
LIABILITIES AND STOCKHOLDERS’ EQUITY       
Deposits:       
Non-interest-bearing $227,370 $215,071 
Interest-bearing:       
Time deposits $100 and over  99,444  110,835 
Interest-bearing transaction, savings and time deposits less than
     $100
  1,015,191  981,016 
Total deposits  1,342,005  1,306,922 
Long-term borrowings  146,000  146,000 
Subordinated debentures  5,155  5,155 
Accounts payable and accrued liabilities  11,338  10,997 
Total liabilities  1,504,498  1,469,074 
Stockholders’ Equity       
Preferred Stock, $1,000 liquidation value per share:       
Authorized 5,000,000 shares; issued and outstanding 11,250 shares
     of Series B preferred stock at December 31, 2013 and 2012 total
     liquidation value of $11,250,000
  11,250  11,250 
Common stock, no par value:       
Authorized 25,000,000 shares; issued 18,477,412 shares at
     December 31, 2013 and 2012; outstanding 16,369,012 shares at
     December 31, 2013 and 16,347,915 at December 31, 2012
  110,056  110,056 
Additional paid-in capital  4,986  4,801 
Retained earnings  61,914  46,753 
Treasury stock, at cost (2,108,400 shares at December 31, 2013 and
     2,129,497 at December 31, 2012)
  (17,078)  (17,232) 
Accumulated other comprehensive income (loss)  (2,544)  5,063 
Total stockholders’ equity  168,584  160,691 
Total liabilities and stockholders’ equity $1,673,082 $1,629,765 
See the accompanying notes to the consolidated financial statements.


TABLE OF CONTENTS

F-4

CENTER BANCORP, INC. AND SUBSIDIARIES

CONSOLIDATED STATEMENTS OF INCOME

   
 Years Ended December 31,
   2010 2009 2008
   (Dollars in Thousands, Except per Share Data)
Interest income:
     
Interest and fees on loans $37,200  $36,751  $36,110 
Interest and dividends on investment securities:
     
Taxable interest income  10,588   12,727   10,353 
Non-taxable interest income  220   989   2,547 
Dividends  706   643   771 
Interest on federal funds sold and securities purchased under agreements to resell        113 
Total interest income  48,714   51,110   49,894 
Interest expense:
     
Interest on certificates of deposit $100,000 & over  1,301   3,551   2,411 
Interest on other deposits  4,705   8,757   10,876 
Interest on short-term borrowings  211   449   1,295 
Interest on long-term borrowings  8,568   9,888   9,513 
Total interest expense  14,785   22,645   24,095 
Net interest income  33,929   28,465   25,799 
Provision for loan losses  5,076   4,597   1,561 
Net interest income, after provision for loan losses  28,853   23,868   24,238 
Other income:
     
Service charges, commissions and fees  1,975   1,835   2,015 
Annuity and insurance  123   126   112 
Bank-owned life insurance  1,226   1,156   1,203 
Other  487   298   420 
Total other-than-temporary impairment losses  (8,953  (9,066  (1,761
Less: Portion of loss recognized in other comprehensive income (before taxes)  3,377   4,828    
Net other-than-temporary impairment losses  (5,576  (4,238  (1,761
Net gains on sale on investment securities  4,237   4,729   655 
Net investment securities gains (losses)  (1,339  491   (1,106
Total other income  2,472   3,906   2,644 
Other expense:
     
Salaries and employee benefits  10,765   9,915   8,505 
Occupancy, net  2,088   2,536   3,279 
Premises and equipment  1,093   1,263   1,436 
FDIC Insurance  2,126   2,055   217 
Professional and consulting  1,121   811   703 
Stationery and printing  316   339   397 
Marketing and advertising  268   366   637 
Computer expense  1,366   964   834 
OREO expense, net  284   1,438   31 
Loss on fixed assets, net  427      51 
Repurchase agreement termination fee  594       
Other  3,651   3,370   3,383 
Total other expense  24,099   23,057   19,473 
Income before income tax expense  7,226   4,717   7,409 
Income tax expense  222   946   1,567 
Net income  7,004   3,771   5,842 
Preferred stock dividends and accretion  581   567    
Net income available to common stockholders $6,423  $3,204  $5,842 
Earnings per common share:
     
Basic $0.43  $0.24  $0.45 
Diluted $0.43  $0.24  $0.45 
Weighted average common shares outstanding:
     
Basic  15,025,870   13,382,614   13,048,518 
Diluted  15,027,159   13,385,416   13,061,410 


  Years Ended December 31, 
  2013 2012 2011 
           
  (Dollars in Thousands, Except per Share Data) 
Interest income:          
Interest and fees on loans $40,132 $38,921 $36,320 
Interest and dividends on investment securities:          
Taxable interest income  12,189  12,269  13,278 
Non-taxable interest income  4,422  3,507  1,700 
Dividends  523  567  629 
Interest on federal funds sold and other short-term investment  2  8   
Total interest income  57,268  55,272  51,927 
Interest expense:          
Interest on certificates of deposit $100 & over  866  839  1,215 
Interest on other deposits  4,353  4,569  4,305 
Interest on short-term borrowings      79 
Interest on long-term borrowings  5,863  6,368  6,578 
Total interest expense  11,082  11,776  12,177 
Net interest income  46,186  43,496  39,750 
Provision for loan losses  350  325  2,448 
Net interest income, after provision for loan losses  45,836  43,171  37,302 
Other income:          
Service charges, commissions and fees  1,873  1,775  1,896 
Annuity and insurance  489  204  110 
Bank-owned life insurance  1,364  1,018  1,038 
Loan related fees  839  510  432 
Net gains on sale of loans held for sale  294  484  251 
Bargain gain on acquisition    899   
Other  281  308  117 
Total other-than-temporary impairment losses  (652)  (870)  (342) 
Net gains on sale on investment securities  2,363  2,882  3,976 
Net investment securities gains  1,711  2,012  3,634 
Total other income  6,851  7,210  7,478 
Other expense:          
Salaries and employee benefits  13,465  12,571  11,527 
Occupancy and equipment  3,518  2,987  2,947 
FDIC Insurance  1,098  1,154  1,712 
Professional and consulting  1,111  1,077  1,156 
Stationery and printing  333  349  368 
Marketing and advertising  304  186  131 
Computer expense  1,422  1,419  1,312 
Other real estate owned expense, net  137  150  398 
Repurchase agreement prepayment and termination fee    1,012   
Acquisition cost    482   
Other  3,890  3,810  3,892 
Total other expense  25,278  25,197  23,443 
Income before income tax expense  27,409  25,184  21,337 
Income tax expense  7,484  7,677  7,411 
Net income  19,925  17,507  13,926 
Preferred stock dividends and accretion  141  281  820 
Net income available to common stockholders $19,784 $17,226 $13,106 
Earnings per common share:          
Basic $1.21 $1.05 $0.80 
Diluted $1.21 $1.05 $0.80 
Weighted average common shares outstanding:          
Basic  16,349,204  16,340,197  16,295,761 
Diluted  16,385,692  16,351,046  16,314,899 
See the accompanying notes to the consolidated financial statements.


TABLE OF CONTENTS

F-5

CENTER BANCORP, INC. AND SUBSIDIARIES

CONSOLIDATED STATEMENTS OF CHANGES IN STOCKHOLDERS’ EQUITY

COMPREHENSIVE INCOME
       
 Years Ended December 31, 2010, 2009 and 2008
   Preferred
Stock
 Common
Stock
 Additional
Paid In
Capital
 Retained
Earnings
 Treasury
Stock
 Accumulated
Other
Comprehensive
Income (Loss)
 Total
Stockholders’
Equity
   (In Thousands, Except Share and per Share Data)
Balance, December 31, 2007 $  $86,908  $5,133  $15,161  $(16,100 $(5,824 $85,278 
Comprehensive income:
     
Net income                 5,842             5,842 
Other comprehensive loss, net of taxes                           (3,088  (3,088
Total comprehensive income                                2,754 
Cash dividends declared on common stock of ($0.36 per share)                 (4,675            (4,675
Issuance cost of common stock                 (19            (19
Restricted stock award (3,028 shares)                      25        25 
Exercise of stock options (25,583 shares)            21        203        224 
Stock-based compensation expense            128                  128 
Taxes related to stock-based compensation            (78                 (78
Treasury stock purchased (193,083 shares)                      (1,924       (1,924
Balance, December 31, 2008 $  $86,908  $5,204  $16,309  $(17,796 $(8,912 $81,713 
Comprehensive income:
                                   
Net income                 3,771             3,771 
Other comprehensive loss, net of taxes                           (1,864  (1,864
Total comprehensive income                                1,907 
Issuance of preferred stock (10,000 shares) and warrants (86,705 shares)  9,539        461                  10,000 
Accretion of discount on preferred stock  80             (80             
Dividends on preferred stock                 (487            (487
Proceeds from rights offering (1,571,428 shares)       11,000                       11,000 
Cash dividends declared on common stock ($0.18 per share)                 (2,434            (2,434
Issuance cost of common stock                 (11            (11
Exercise of stock options (9,289 shares)            (19       76        57 
Stock-based compensation expense            77                  77 
Taxes related to stock-based compensation            (73                 (73
Balance, December 31, 2009 $9,619  $97,908  $5,650  $17,068  $(17,720 $(10,776 $101,749 
Comprehensive income:
     
Net income                 7,004             7,004 
Other comprehensive gains, net of taxes                           3,101   3,101 
Total comprehensive income                                10,105 
Accretion of discount on preferred stock  81             (81             
Dividends on preferred stock                 (500            (500
Proceeds from stock offerings (1,715,000 shares)       12,148   (770                 11,378 
Cash dividends declared on common stock ($0.12 per share)                 (1,852            (1,852
Issuance cost of common stock                 (6            (6
Stock awarded            3        22        25 
Stock-based compensation expense            51                  51 
Option related tax trueup            7                  7 
Balance, December 31, 2010 $9,700  $110,056  $4,941  $21,633  $(17,698 $(7,675 $120,957 


  Years Ended December 31, 
  2013 2012 2011 
  (Dollars in Thousands) 
Net income $19,925 $17,507 $13,926 
Other comprehensive income, net of tax:          
Unrealized gains and losses on securities available-for-sale:          
Reclassification adjustments for OTTI losses included in income  652  870  342 
Tax effect  (178)  (265)  (119) 
Net of tax amount  474  605  223 
Unrealized (losses) gains on available for sale securities  (8,741)  19,819  8,990 
Tax effect  3,578  (7,444)  (3,486) 
Net of tax amount  (5,163)  12,375  5,504 
Reclassification adjustment for realized gains arising during this period  (2,363)  (2,882)  (3,976) 
Tax effect  645  879  1,380 
Net of tax amount  (1,718)  (2,003)  (2,596) 
Unrealized holding (losses) gains on securities transferred from available-for-sale to held-to-maturity securities  (2,612)    291 
Tax effect  1,064    (110) 
Net of tax amount  (1,548)    181 
Amortization of unrealized holding gains on securities transferred from available-for-sale to held-to-maturity securities  (58)  (2)  (46) 
Tax effect  19  1  28 
Net of tax amount  (39)  (1)  (18) 
Pension plan:          
Actuarial gains (losses)  654  (790)  (1,649) 
Tax effect  (267)  323  584 
Net of tax amount  387  (467)  (1,065) 
Total other comprehensive (loss) income  (7,607)  10,509  2,229 
Total comprehensive income $12,318 $28,016 $16,155 
See the accompanying notes to the consolidated financial statements.


TABLE OF CONTENTS

F-6

CENTER BANCORP, INC. AND SUBSIDIARIES

CONSOLIDATED STATEMENTS OF CASH FLOWS

CHANGES IN STOCKHOLDERS’ EQUITY
   
 Years Ended December 31,
   2010 2009 2008
   (Dollars in Thousands)
Cash flows from operating activities:
     
Net income $7,004  $3,771  $5,842 
Adjustments to Reconcile Net Income to Net Cash Provided by (Used In) Operating Activities:
     
Depreciation and amortization  1,165   1,451   1,832 
Provision for loan losses  5,076   4,597   1,561 
Provision for deferred taxes  51   819   1,221 
Stock-based compensation expense  51   77   128 
Net other-than-temporary impairment losses  5,576   4,238   1,761 
Net gains on available-for-sale securities  (4,237  (4,729  (655
Net gain on sale of loans held for sale  (140  (5  (13
Loans originated for resale  (8,347  (3,453  (1,708
Proceeds of loans held for sale  8,154   3,458   1,721 
Net loss on premises and equipment  427      51 
Net loss on OREO  207   905   26 
Life insurance death benefit     (136  (230
Increase in cash surrender value of bank owned life insurance  (1,226  (1,020  (973
Net amortization of securities  2,979   793   90 
(Increase) decrease in accrued interest receivable  (101  121   381 
Decrease in prepaid FDIC insurance assessment  1,792       
(Increase) decrease in other assets  1,642   (1,732  (7,332
Increase (decrease) in other liabilities  (2,426  (480  (4,432
Net cash (used in) provided by operating activities  17,647   8,675   (729
Cash flows from investing activities:
     
Proceeds from maturities of investment securities
available-for-sale
  67,960   58,206   52,702 
Net redemption (purchases) of restricted investment in bank stock  1,076   (442  (1,763
Proceeds from sales of investment securities available-for-sale  644,075   665,828   330,808 
Purchase of securities available-for-sale  (791,156  (785,044  (315,899
Net decrease (increase) in loans  8,357   (45,543  (125,004
Purchases of premises and equipment  (300  (742  (2,882
Purchase of bank-owned life insurance  (6,000  (2,475   
Redemption of bank-owned life insurance  5,610       
Proceeds from life insurance death benefits  15   266   526 
Capital expenditure addition to OREO     (476   
Proceeds from sale of premises and equipment  1   1   24 
Proceeds from sale of branch facility        2,414 
Increase in principal portion of lease  (9      
Proceeds from sale of OREO  1,720   3,520   452 
Net cash used in investing activities  (68,651  (106,901  (58,622


  Years Ended December 31, 2013, 2012 and 2011 
  Preferred
Stock
 Common
Stock
 Additional
Paid In
Capital
 Retained
Earnings
 Treasury
Stock
 Accumulated
Other
Comprehensive
Income (Loss)
 Total
Stockholders’
Equity
 
  (In Thousands, Except Share and per Share Data) 
Balance, January 1, 2011 $9,700 $110,056 $4,941 $21,633 $(17,698) $(7,675) $120,957 
Net income           13,926        13,926 
Other comprehensive income                 2,229  2,229 
Accretion of discount on preferred
    stock
  300        (300)         
Dividends on preferred stock           (520)        (520) 
Redemption of series A preferred stock  (10,000)                 (10,000) 
Proceeds from issuance of series B
    preferred stock
  11,250                 11,250 
Warrant repurchased        (245)           (245) 
Cash dividends declared on common
    stock ($0.12 per share)
           (1,955)        (1,955) 
Issuance cost of common stock           (5)        (5) 
Issuance cost of series B preferred
    stock
           (84)        (84) 
Exercise of stock options (42,495
    shares)
        (16)     344     328 
Stock-based compensation expense        35           35 
Balance, December 31, 2011  11,250  110,056  4,715  32,695  (17,354)  (5,446)  135,916 
Net income           17,507        17,507 
Other comprehensive income                 10,509  10,509 
Dividends on series B preferred stock           (253)        (253) 
Cash dividends declared on common
    stock ($0.195 per share)
           (3,188)        (3,188) 
Issuance cost of common stock           (8)        (8) 
Exercise of stock options (15,588
    shares)
        19     122     141 
Stock-based compensation expense        39           39 
Option related tax trueup        28           28 
Balance, December 31, 2012  11,250  110,056  4,801  46,753  (17,232)  5,063  160,691 
Net income           19,925        19,925 
Other comprehensive loss                 (7,607)  (7,607) 
Dividends on series B preferred stock           (169)        (169) 
Cash dividends declared on common
    stock ($0.260 per share)
           (4,581)        (4,581) 
Dividend on restricted stock declared           (1)        (1) 
Issuance cost of common stock           (13)        (13) 
Issuance of restricted stock award
    (18,829 shares)
        91     152     243 
Exercise of stock options (2,268
    shares)
        19     2     21 
Stock-based compensation expense        59           59 
Option related tax trueup        16           16 
Balance, December 31, 2013 $11,250 $110,056 $4,986 $61,914 $(17,078) $(2,544) $168,584 
See the accompanying notes to the consolidated financial statements.


TABLE OF CONTENTS

F-7

CENTER BANCORP, INC. AND SUBSIDIARIES

CONSOLIDATED STATEMENTS OF CASH FLOWS – (continued)

   
 Years Ended December 31,
   2010 2009 2008
   (Dollars in Thousands)
Cash flows from financing activities:
     
Net increase (decrease) in deposits  46,627   154,168   (39,533
Net increase (decrease) in short-term borrowings  (4,254  966   (4,521
Proceeds from long-term borrowings        55,000 
Payments on long-term borrowings  (52,144  (153  (148
Cash dividends on common stock  (1,800  (3,166  (4,675
Cash dividends on preferred stock  (500  (425   
Issuance cost of common stock  (6  (11  (19
Proceeds from issuance of preferred stock and warrants     10,000    
Proceeds from issuance of shares from stock offering or rights offering  12,148   11,000    
Issuance cost from issue of common stock  (770      
Tax (expense) benefit from stock based compensation  7   (73  (78
Issuance cost of restricted stock award  25      25 
Proceeds from exercise of stock options     57   224 
Purchase of treasury stock        (1,924
Net cash provided by (used in) financing activities  (667  172,363   4,351 
Net (decrease) increase in cash and cash equivalents  (51,671  74,137   (55,000
Cash and cash equivalents at beginning of year  89,168   15,031   70,031 
Cash and cash equivalents at end of year $37,497  $89,168  $15,031 
Supplemental disclosures of cash flow information:
     
Noncash activities:
     
Trade date accounting settlement for investments $8  $1,979  $3,514 
Transfer of loans to real estate owned  1,927      3,949 
Net investment in direct financing lease  3,700       
Cash paid during year for:
     
Interest paid on deposits and borrowings $15,569  $23,021  $23,615 
Income taxes  2,479   344   2,370 


  Years Ended December 31, 
  2013 2012 2011 
  (Dollars in Thousands) 
Cash flows from operating activities:          
Net income $19,925 $17,507 $13,926 
Adjustments to Reconcile Net Income to Net
    Cash Provided by Operating Activities:
          
Depreciation and amortization  886  914  983 
Provision for loan losses  350  325  2,448 
Provision for deferred taxes  1,739  1,912  3,406 
Stock-based compensation expense  59  39  35 
Net other-than-temporary impairment losses  652  870  342 
Net gains on sales of available-for-sale securities  (2,363)  (2,882)  (3,976) 
Net gains on sales of loans held for sale  (294)  (484)  (251) 
Net loans originated for sale  (14,816)  (22,013)  (14,357) 
Proceeds from sales of loans held for sale  16,601  22,024  13,923 
Net gains on disposition of premises and equipment  (2)     
Net loss on sales of other real estate owned  75  9  5 
Life insurance death benefit  (291)     
Increase in cash surrender value of bank owned life insurance  (1,073)  (1,018)  (1,038) 
Net amortization of securities  3,316  4,589  4,012 
Increase in accrued interest receivable  (233)  (241)  (2,085) 
Decrease in prepaid FDIC insurance assessment  811  1,073  1,698 
Increase in other assets  (397)  (2,538)  (402) 
(Decrease) increase in other liabilities  (1,792)  980  (585) 
Net cash provided by operating activities  23,153  21,066  18,084 
Cash flows from investing activities:          
Investment securities available-for-sale:          
Purchases  (155,464)  (207,880)  (400,644) 
Sales  122,165  130,059  254,821 
Maturities, calls and principal repayment  46,378  48,406  48,029 
Investment securities held-to-maturity:          
Purchases  (23,531)  (16,606)  (13,118) 
Maturities and principal repayment  3,830  30,258  7,475 
Net (purchase) redemption of restricted investment in bank stock  (22)  319  363 
Net increase in loans  (71,761)  (83,478)  (49,223) 
Purchases of premises and equipment  (973)  (842)  (316) 
Purchase of bank-owned life insurance    (5,000)   
Proceeds from life insurance death benefits  592     
Proceeds from sale of premises and equipment  2     
Proceeds from sale of other real estate owned  1,230  500  33 
Cash and cash equivalent acquired in acquisition    6,195   
Cash consideration paid in acquisition    (10,251)   
Net cash used in investing activities  (77,554)  (108,320)  (152,580) 
Cash flows from financing activities:          
Net increase in deposits  35,083  100,271  261,083 
Net decrease in short-term borrowings      (41,855) 
Payments on long-term borrowings    (15,000)  (10,000) 
Cash dividends on common stock  (4,254)  (2,778)  (1,955) 
Cash dividends on preferred stock  (141)  (363)  (417) 
Proceeds from issuance of Series B preferred stock      11,250 
Redemption of Series A preferred stock      (10,000) 
Warrant repurchased      (245) 
Issuance cost of common stock  (13)  (8)  (5) 
Issuance cost of Series B preferred stock      (84) 
Tax expense from stock based compensation  16  28   
Issuance of restricted stock award  243     
Proceeds from exercise of stock options  21  141  328 
Net cash provided by financing activities  30,955  82,291  208,100 
Net (decrease) increase in cash and cash equivalents  (23,446)  (4,963)  73,604 
Cash and cash equivalents at beginning of year  106,138  111,101  37,497 
Cash and cash equivalents at end of year $82,692 $106,138 $111,101 
Supplemental disclosures of cash flow information:          
Noncash activities:          
Trade date accounting settlement for investments $8,759 $ $ 
Transfer of loans to other real estate owned  236  1,300  629 
Transfer from investment securities available-for-sale
    to investment securities held-to-maturity
  138,300    66,833 
Cash paid during year for:          
Interest paid on deposits and borrowings $10,993 $11,894 $12,226 
Income taxes  4,727  6,280  4,484 
Business combinations:          
Non-cash assets acquired:          
Investment securities available-for-sale $ $37,143 $ 
Loans    52,192   
Premises and equipment, net    1,262   
Accrued interest receivable    389   
Total non-cash assets acquired $ $90,986 $ 
Liabilities assumed:          
Deposits $ $85,236 $ 
Other liabilities    795   
Total liabilities assumed $ $86,031 $ 
Net non-cash assets acquired $ $4,056 $ 
Bargain gain on acquisition $ $899 $ 
Net cash and cash equivalents acquired $ $6,195 $ 
Cash consideration paid in acquisition $ $10,251 $ 
See the accompanying notes to the consolidated financial statements.


TABLE OF CONTENTS

F-8

CENTER BANCORP, INC. AND SUBSIDIARIES

NOTES TO CONSOLIDATED FINANCIAL STATEMENTS

Note 1 — Summary of Significant Accounting Policies

Principles of Consolidation

The consolidated financial statements of Center Bancorp, Inc. (the “Parent Corporation”) are prepared on the accrual basis and include the accounts of the Parent Corporation and its wholly owned subsidiary, Union Center National Bank (the “Bank”, and collectively with the Parent Corporation and the Parent Corporation’s other direct and indirect subsidiaries, the “Corporation”). All significant inter-company accounts and transactions have been eliminated from the accompanying consolidated financial statements.

Business

The Parent Corporation is a bank holding company whose principal activity is the ownership and management of Union Center National Bank as mentioned above. The Bank provides a full range of banking services to individual and corporate customers through branch locations in Union, Morris, Bergen and, Morriscommencing in May 2013, Mercer counties, New Jersey. Additionally, the Bank originates residential mortgage loans and services such loans for others. The Bank is subject to competition from other financial institutions and the regulations of certain federal and state agencies and undergoes periodic examinations by those regulatory authorities.

Segments
Center Bancorp, Inc. has one reportable segment, “Community Banking.” All of the Corporation’s activities are interrelated, and each activity is dependent and assessed based on how each of the activities of the Corporation supports the others. For example, lending is dependent upon the ability of the Corporation to fund itself with deposits and borrowings while managing the interest rate and credit risk. Accordingly, all significant operating decisions are based upon analysis of the Bank as one segment or unit.
Basis of Financial Statement Presentation

The consolidated financial statements have been prepared in conformity with U.S. generally accepted accounting principles.

Use of Estimates

In preparing the consolidated financial statements, management is required to make estimates and assumptions that affect the reported amounts of assets and liabilities as of the date of the statement of condition and revenues and expenses for the reported periods. Actual results could differ significantly from those estimates. Material estimates that are particularly susceptible to significant change in the near term relate to the determination of the allowance for loan losses, other-than-temporary impairment evaluation of securities, the evaluation of the impairment of goodwill, the income tax provision and the valuation of deferred tax assets.

Cash and Due From Banks

Cash Equivalents

Cash and Due From Bankscash equivalents includes cash on hand and balances due from correspondent banks including the Federal Reserve Bank.

and interest bearing deposits with banks.

Investment Securities

The Corporation accounts for its investment securities in accordance with Financial Accounting Standards Board (“FASB”) Accounting Standards Codification (“ASC”) 320-10-05 (previously SFAS No. 115, “Accounting for Certain Investment in Debt and Equity Securities”).320-10-05. Investments are classified into the following categories: (1) held to maturity securities, for which the Corporation has both the positive intent and ability to hold until maturity, which are reported at amortized cost; (2) trading securities, which are purchased and held principally for the purpose of selling in the near term and are reported at fair value with unrealized gains and losses included in earnings; and (3) available-for-sale securities, which do not meet the criteria of the other two categories and which management believes may be sold prior to maturity due to changes in interest rates, prepayment, risk, liquidity or other factors, and are reported at fair value, with unrealized gains and losses, net of applicable income taxes, reported as a component of accumulated other comprehensive income, which is included in stockholders’ equity and excluded from earnings.

Investment securities are adjusted for amortization of premiums and accretion of discounts, which are recognized on a level yield method, as adjustments to interest income. Investment securities gains or losses are determined using the specific identification method.


F-9

CENTER BANCORP, INC. AND SUBSIDIARIES

NOTES TO CONSOLIDATED FINANCIAL STATEMENTS

Note 1 — Summary of Significant Accounting Policies  – (continued)

Securities are evaluated on at least a quarterly basis, and more frequently when market conditions warrant such an evaluation, to determine whether a decline in their value is other-than-temporary. In April 2009, the FASB issued FASB ASC 320-10-65 (previously SFAS No. 115-2 and SFAS No. 124-2, “Recognition and Presentation of Other-Than-Temporary Investments”), which was adopted as of June 30, 2009. The accounting standard clarifies the interaction of the factors that should be considered when determining whether a debt security is other-than-temporarilyother–than-temporarily impaired. For debt securities, management must assess whether (a) it has the intent to sell the security and (b) it is more likely than not that it will be required to sell the security prior to its anticipated recovery. These steps are done before assessing whether the entity will recover the cost basis of the investment. Prior to the June 30, 2009 adoption, this assessment required management to assert it has both the intent and the ability to hold a security for a period of time sufficient to allow for anticipated recovery in fair value to avoid recognizing an other-than-temporary impairment. This change does not affect the need to forecast recovery of the value of the security through either cash flows or market price.

In instances when a determination is made that an other-than-temporary impairment exists but the investor does not intend to sell the debt security and it is not more likely than not that it will be required to sell the debt security prior to its anticipated recovery, FASB ASC 320-10-65 changeschanged the presentation and amount of the other-than-temporary impairment recognized in the income statement.statement of income. The other-than-temporary impairment is separated into (a) the amount of the total other-than-temporary impairment related to a decrease in cash flows expected to be collected from the debt security (the credit loss) and (b) the amount of the total other-than-temporary impairment related to all other factors. The amount of the total other-than-temporary impairment related to the credit loss is recognized through earnings. The amount of the total other-than-temporary impairment related to all other factors is recognized through other comprehensive income. Impairment charges on certain investment securities of approximately $5.6$0.7 million, $4.2$0.9 million and $1.8$0.3 million were recognized in earnings during the years ended December 31, 2010, 20092013, 2012 and 2008,2011, respectively.

Loans Held for Sale

Mortgage loans originated and intended for sale in the secondary market are carried at the lower of costscost or estimated fair value or fair value under the fair value option accounting guidance for financial instruments.value. For loans carried at the lower of cost or estimated fair value, gains and losses on loan sales (sale proceeds minus carrying value) are recorded in other income and direct loan origination costs and fees are deferred at origination of the loan and are recognized in other income upon sale of the loan. The Corporation had $333,000 and $0 in loans held for sale at December 31, 2010 and 2009.

Loans

Loans are stated at their principal amounts inclusive of net deferred loan origination fees. Interest income is credited as earned except when a loan becomes past due 90 days or more and doubt exists as to the ultimate collection of interest or principal; in those cases the recognition of income is discontinued. Loans that are past due 90 days or more that are both well secured and in the process of collection will remain on an accruing basis. When a loan is placed on non-accrual status, interest accruals cease and uncollected accrued interest is reversed and charged against current income.

In July 2010, the Financial Accounting Standards Board (the “FASB”) issued Accounting Standards Update (“ASU”) No. 2010-20,“Disclosures about the Credit Quality of Financing Receivables and the Allowance for Credit Losses,” which requires that the Corporation provide a greater level of disaggregated information about the credit quality of the Corporation’s loans and leases and the allowance for loan and lease losses (the “Allowance”). This ASU also requires the Corporation to disclose on a prospective basis, additional information related to credit quality indicators, non-accrual loans and leases, and past due information. The Corporation adopted the provisions of this ASU in preparing the Consolidated Financial Statements as of and for the year ended December 31, 2010. As this ASU amends only the disclosure


TABLE OF CONTENTS

F-10

CENTER BANCORP, INC. AND SUBSIDIARIES

NOTES TO CONSOLIDATED FINANCIAL STATEMENTS

Note 1 — Summary of Significant Accounting Policies  – (continued)

requirements for loans and leases and the Allowance, the adoption had no impact on the Corporation’s statements of income and condition. See Note 5 of the Notes to the Consolidated Financial Statements for the required disclosures.

Portfolio segments are defined as the level at which an entity develops and documents a systematic methodology to determine its Allowance. Management has determined that the Corporation has two portfolio segments of loans and leases (commercial and consumer) in determining the Allowance. Both quantitative and qualitative factors are used by management at the portfolio segment level in determining the adequacy of the Allowance for the Corporation. Classes of loans and leases are a disaggregation of a Corporation’s portfolio segments. Classes are defined as a group of loans and leases which share similar initial measurement attributes, risk characteristics, and methods for monitoring and assessing credit risk. Management has determined that the Corporation has five classes of loans and leases (Commercial(commercial and industrial (including lease financing), Commercialcommercial — real estate, Construction, Residentialconstruction, residential mortgage (including home equity) and Installment.

installment).

Generally, all classes of commercial and consumer loans and leases are placed on non-accrual status upon becoming contractually past due 90 days or more as to principal or interest (unless loans and leases are adequately secured by collateral, are in the process of collection, and are reasonably expected to result in repayment), when terms are renegotiated below market levels, or where substantial doubt about full repayment of principal or interest is evident. For certain installment loans, the entire outstanding balance on the loan is charged-off when the loan becomes 60 days past due.

Payments received on non-accrual loans are applied against principal. A loan may only be restored to an accruing basis when it again becomes well secured and in the process of collection or all past due amounts have been collected. Loan origination fees and certain direct loan origination costs are deferred and recognized over the life of the loan as an adjustment to the loan’s yield using the level yield method.

Impaired Loans

The Corporation accounts for impaired loans in accordance with FASB ASC 310-10-35 (previously SFAS No. 114, “Accounting by Creditors for Impairment of a Loan” as amended by SFAS No. 118, “Accounting by Creditors for Impairment of a Loan — Income Recognition and Disclosures”).310-10-35. The value of an impaired loansloan is based on the present value of expected future cash flows discounted at the loan’s effective interest rate or, as a practical expedient, at the loan’s observable market price or at the fair value of the collateral if the loan is collateral dependent.

The Corporation has defined its population of impaired loans to include all non-accrual and troubled debt restructuring loans. As part of the evaluation, the Corporation reviews all non-homogeneous loans for impairment internally classified as substandard or below, in each instance above an established dollar threshold of $200,000.$200,000. Smaller impaired non-homogeneous loans and impaired homogeneous loans are not measured for specific reserves and are covered under the Corporation’s general reserve.

A loan is considered impaired when, based on current information and events, it is probable that the Corporation will not be able to collect all amounts due from the borrower in accordance with the contractual terms of the loan, including scheduled interest payments. Impaired loans include all classes of commercial and consumer non-accruing loans and all loans modified in a troubled debt restructuring (“TDR”).

When a loan has been identified as being impaired, the amount of impairment is measured based on the present value of expected future cash flows discounted at the loan’s effective interest rate, the loan’s observable market price, or the estimated fair value of the collateral, less any selling costs, if the loan is collateral-dependent. If the measurement of the impaired loan is less than the recorded investment in the loan (including accrued interest, net of deferred loan fees or costs and unamortized premiums or discounts), an impairment is recognized by creating or adjusting an existing allocation of the Allowance, or by recording a partial charge-off of the loan to its fair value. Interest payments made on impaired loans are typically applied


TABLE OF CONTENTS

CENTER BANCORP, INC. AND SUBSIDIARIES

NOTES TO CONSOLIDATED FINANCIAL STATEMENTS

Note 1 — Summary of Significant Accounting Policies  – (continued)

to principal unless collectability of the principal amount is reasonably assured, in which case interest income may be accrued or recognized on a cash basis.

F-11

CENTER BANCORP, INC. AND SUBSIDIARIES
NOTES TO CONSOLIDATED FINANCIAL STATEMENTS
Note 1 — Summary of Significant Accounting Policies  – (continued)
Loans Modified in a Troubled Debt Restructuring

Loans are considered to have been modified in a TDR when due to a borrower’s financial difficulties, the Corporation makes certain concessions to the borrower that it would not otherwise consider. Modifications may include interest rate reductions, principal or interest forgiveness, forbearance, and other actions intended to minimize economic loss and to avoid foreclosure or repossession of collateral. Generally, a non-accrual loan that has been modified in a TDR remains on non-accrual status for a period of six months to demonstrate that the borrower is able to meet the terms of the modified loan. However, performance prior to the modification, or significant events that coincide with the modification, are included in assessing whether the borrower can meet the new terms and may result in the loan being returned to accrual status at the time of loan modification or after a shorter performance period. If the borrower’s ability to meet the revised payment schedule is uncertain, the loan remains on non-accrual status.

Reserve for Credit Losses

A consequence of lending activities is that the Corporation may incur losses. The amount of such losses will vary depending upon the risk characteristics of the loan and lease portfolio as affected by economic conditions such as rising interest rates and the financial performance of borrowers. The Corporation’s reserve for credit losses is comprised of two components, the Allowanceallowance for loan losses and the reserve for unfunded commitments (the “Unfunded Commitments”).

The reserve for credit losses provides for credit losses inherent in lending or commitments to lend and is based on loss estimates derived from a comprehensive quarterly evaluation, reflecting analyses of individual borrowers and historical loss experience, supplemented as necessary by credit judgment to address observed changes in trends, conditions, and other relevant environmental and economic factors.

Allowance for Loan Losses

The allowance for loan losses (“allowance”)Allowance is maintained at a level determined adequate to provide for probable loan losses. The allowance is increased by provisions charged to operations and reduced by loan charge-offs, net of recoveries. The allowance is based on management’s evaluation of the loan portfolio considering economic conditions, the volume and nature of the loan portfolio, historical loan loss experience and individual credit situations.

Material estimates that are particularly susceptible to significant change in the near-term relate to the determination of the allowance for loan losses.Allowance. In connection with the determination of the allowance for loan losses,Allowance, management obtains independent appraisals for significant properties.

The ultimate collectability of a substantial portion of the Bank’s loan portfolio is susceptible to changes in the real estate market and economic conditions in the State of New Jersey and the impact of such conditions on the creditworthiness of the borrowers.

Management believes that the allowance for loan losses is adequate. Management uses available information to recognize loan losses; however, future additions to the allowanceAllowance may be necessary based on changes in economic conditions. In addition, various regulatory agencies, as an integral part of their examination process, periodically review the Bank’s allowance for loan losses.Allowance. Such agencies may require the Bank to recognize additions to the allowanceAllowance based on their judgments about information available to them at the time of their examinations.

F-12

CENTER BANCORP, INC. AND SUBSIDIARIES
NOTES TO CONSOLIDATED FINANCIAL STATEMENTS
Note 1 — Summary of Significant Accounting Policies  – (continued)
Reserve for Unfunded Commitments

The reserve for unfunded commitments is maintained at a level believed by management to be sufficient to absorb estimated probable losses related to unfunded credit facilities and is included in other liabilities in the consolidated statements of condition. The determination of the adequacy of the reserve is based upon an evaluation of the unfunded credit facilities, including an assessment of historical commitment utilization experience, and credit risk. Net adjustments to the reserve for unfunded commitments are included in other expense.

The balance of the reserve for unfunded commitments was $210,000 as of December 31, 2013 and 2012.

Premises and Equipment
 

TABLE OF CONTENTS

CENTER BANCORP, INC. AND SUBSIDIARIES

NOTES TO CONSOLIDATED FINANCIAL STATEMENTS

Note 1 — Summary of Significant Accounting Policies  – (continued)

Premises and Equipment

Land is carried at cost and bank premises and equipment at cost less accumulated depreciation based on estimated useful lives of assets, computed principally on a straight-line basis. Expenditures for maintenance and repairs are charged to operations as incurred; major renewals and betterments are capitalized. Gains and losses on sales or other dispositions are recorded as a component of other income or other expenses. In September 2007, the Corporation reclassified its Florham Park office building from premises to held for sale, which was included in other assets, and entered into a contract to sell that property. On February 29, 2008, the Corporation completed the sale of the property for $2.4 million, which approximated the carrying value.

During the second quarter of 2010, the Corporation entered into a lease of its former operations facility under a direct financing lease. The lease has a 15 year term with no renewal options. According to the terms of the lease, the lessee has an obligation to purchase the property underlying the lease in either year seven (7), ten (10) or fifteen (15) at predetermined prices for those years as provided in the lease. The structure of the minimum lease payments and the purchase prices as provided in the lease provide an inducement to the lessee to purchase the property in year seven (7).

Other Real Estate Owned

Other real estate owned (“OREO”), representing property acquired through foreclosure and held for sale, are initially recorded at fair value less cost to sell at the date of foreclosure, establishing a new cost basis. Subsequently, valuations are periodically performed by management and the assets are carried at the lower of carrying amount or fair value less cost to sell. Costs relating to holding the assets are charged to expenses.

During the fourth quarter of 2010, the Corporation sold one residential property in Morris County, New Jersey, and one residential property in Union County, New Jersey which were carried as OREO. At December 31, 2010 and 2009, the Corporation had no OREO.

Mortgage Servicing

The Corporation performs various servicing functions on loans owned by others. A fee, usually based on a percentage of the outstanding principal balance of the loan, is received for those services. At December 31, 20102013 and 2009,2012, the Corporation was servicing approximately $5.3$8.4 million and $7.6$10.2 million, respectively, of loans for others.

The Corporation accounts for its servicing of financial assets in accordance with FASB ASC 860-50. The Corporation originates certain mortgages under plans to sell those loans and service the loans owned by the investor. The Corporation records mortgage servicing rights and the loans based on relative fair values at the date of sale. The balance of mortgage servicing rights at December 31, 20102013 and 20092012 are immaterial to the Corporation’s consolidated financial statements.

Risk Related to Representation and Warranty Provisions
The Corporation sells residential mortgage loans in the secondary market primarily to Fannie Mae. The Corporation sells residential mortgage loans to Fannie Mae that include various representations and warranties regarding the origination and characteristics of the residential mortgage loans. Although the specific representations and warranties vary, they typically cover ownership of the loan, validity of the lien securing the loan, the absence of delinquent taxes or liens against the property securing the loan, compliance with loan criteria set forth in the applicable agreement, compliance with applicable federal, state, and local laws, and other matters.
As of December 31, 2013 and 2012, the unpaid principal balance of the Corporation’s portfolio of residential mortgage loans sold to Fannie Mae was $8.4 million and $10.2 million, respectively. These loans are generally sold on a non-recourse basis. The agreements under which the Corporation sells residential mortgage loans require the Corporation to deliver various documents to the investor or its document custodian. Although these loans are primarily sold on a non-recourse basis, the Corporation may be obligated to repurchase residential mortgage loans where required documents are not delivered or are defective. Investors may require the immediate repurchase of a mortgage loan when an early payment default discovered in an underwriting review reveals significant underwriting deficiencies, even if the mortgage loan has subsequently been brought current. As of December 31, 2013, there were no pending repurchase requests related to representation and warranty provisions.
F-13

CENTER BANCORP, INC. AND SUBSIDIARIES
NOTES TO CONSOLIDATED FINANCIAL STATEMENTS
Note 1 — Summary of Significant Accounting Policies  – (continued)
Employee Benefit Plans

The Corporation has a non-contributory pension plan coveringthat covered all eligible employees up until September 30, 2007, at which time the Corporation froze its defined benefit pension plan. As such, all future benefit accruals in this pension plan were discontinued and all retirement benefits that employees would have earned as of September 30, 2007 were preserved. The Corporation’s policy is to fund at least the minimum contribution required by the Employee Retirement Income Security Act of 1974. The costs associated with the plan are accrued based on actuarial assumptions and included in other expense.


TABLE OF CONTENTS

CENTER BANCORP, INC. AND SUBSIDIARIES

NOTES TO CONSOLIDATED FINANCIAL STATEMENTS

Note 1 — Summary of Significant Accounting Policies  – (continued)

The Corporation accounts for its defined benefit pension plan in accordance with FASB ASC 715-30. FASB ASC 715-30 requires that the funded status of defined benefit postretirement plans be recognized on the Corporation’s statement of condition and changes in the funded status be reflected in other comprehensive income. FASB ASC 715-30 also requires companies to measure the funded status of the plan as of the date of its fiscal year-end, effective for fiscal years ended after December 15, 2008. Early adoption was encouraged. The Corporation had early adopted this statement and the adoption did not have a material effect on the Corporation’s consolidated financial statements.

year-end.

Stock-Based Compensation

Stock compensation accounting guidance (FASB ASC 718, “Compensation-Stock Compensation”) requires that the compensation cost related to share-based payment transactions be recognized in financial statements. That cost will be measured based on the grant date fair value of the equity or liability instruments issued. The stock compensation accounting guidance covers a wide range of share-based compensation arrangements including stock options, restricted share plans, performance-based awards, share appreciation rights and employee share purchase plans.

Stock compensation accounting guidance requires that compensation cost for all stock awards be calculated and recognized over the employees’ service period, generally defined as the vesting period. For awards with graded-vesting, compensation cost is recognized on a straight-line basis over the requisite service period for the entire award. A Black-Scholes model is used to estimate the fair value of stock options while the market price of the Corporation’s common stock at the date of grant is used for restricted stock awards. See Note 1617 of the Notes to Consolidated Financial Statements for a further discussion.

Earnings per Share

Basic Earnings per Share (“EPS”) is computed by dividing income available to common shareholders by the weighted-average number of common shares outstanding. Diluted EPS includes any additional common shares as if all potentially dilutive common shares were issued (e.g. stock options). The Corporation’s weighted average common shares outstanding for diluted EPS include the effect of stock options outstanding using the Treasury Stock Method, which are not included in the calculation of basic EPS.

F-14

CENTER BANCORP, INC. AND SUBSIDIARIES
NOTES TO CONSOLIDATED FINANCIAL STATEMENTS
Note 1 — Summary of Significant Accounting Policies  – (continued)
Earnings per common share have been computed based on the following:

   
 Years Ended December 31,
   2010 2009 2008
   (In Thousands, Except per Share Amounts)
Net income $7,004  $3,771  $5,842 
Preferred stock dividends and accretion  581   567    
Net income available to common stockholders $6,423  $3,204  $5,842 
Average number of common shares outstanding  15,026   13,382   13,049 
Effect of dilutive options  1   3   12 
Average number of common shares outstanding used to calculate diluted earnings per common share  15,027   13,385   13,061 
Earnings per common share:
               
Basic $0.43  $0.24  $0.45 
Diluted $0.43  $0.24  $0.45 


TABLE OF CONTENTS

CENTER BANCORP, INC. AND SUBSIDIARIES

NOTES TO CONSOLIDATED FINANCIAL STATEMENTS

Note 1 — Summary of Significant Accounting Policies  – (continued)

  Years Ended December 31, 
  2013 2012 2011 
  (In Thousands, Except per Share Amounts) 
Net income $19,925 $17,507 $13,926 
Preferred stock dividends and accretion  141  281  820 
Net income available to common stockholders $19,784 $17,226 $13,106 
Average number of common shares outstanding  16,349  16,340  16,296 
Effect of dilutive options  37  11  19 
Average number of common shares outstanding used to
    calculate diluted earnings per common share
  16,386  16,351  16,315 
Anti-dilutive common shares outstanding  14  42  79 
Earnings per common share:          
Basic $1.21 $1.05 $0.80 
Diluted $1.21 $1.05 $0.80 

Treasury Stock

The Parent Corporation, announced on March 27, 2006 that its Board of Directors approved an increase in its then current shareunder a stock buyback program last amended in 2008, is authorized to 5 percentbuy back up to2,039,731 shares of outstanding shares, enhancing its then current authorization by 425,825 shares to 684,965 shares. The Corporation announced on October 1, 2007 that its Board of Directors approved an additional increase in its current share buyback program to 5 percent of outstanding shares, enhancing its current authorization by 684,627 shares. On June 26, 2008, the Corporation announced that its Board of Directors approved an additional buyback of 649,712 shares. The total buyback authorization has been increased to 2,039,731 shares.Parent Corporation’s common stock. Subject to limitations applicable to the Corporation, purchases may be made from time to time as, in the opinion of management, market conditions warrant, in the open market or in privately negotiated transactions. Shares repurchased will be added to the corporate treasury and will be used for future stock dividends and other issuances. As of December 31, 2010,2013, Center Bancorp had 16.316.4 million shares of common stock outstanding. As of December 31, 2010,2013, the Parent Corporation had purchased1,386,863 common shares at an average cost per share of $11.44$11.44 under the stock buyback program as amended on October 1, 2007 and June 26, 2008. The repurchased shares were recorded as treasury stock, which resulted in a decrease in stockholders’ equity. Treasury stock is recorded using the cost method and accordingly is presented as a reduction of stockholders’ equity. ForDuring the yearyears ended December 31, 2010,2013, 2012 and 2011, the Parent Corporation did not purchase any of its shares.

Goodwill

The Corporation adopted the provisions of FASB ASC 350-10 (previously SFAS No. 142, “Goodwill and Other Intangible Assets”), which requires that goodwill to be tested for impairment annually, or more frequently if impairment indicators arise for impairment. No impairment charge was deemed necessary for the years ended December 31, 2010, 20092013, 2012 and 2008.

2011. 

As provided by ASU 2011-08 management has evaluated and assessed the following events and circumstances relevant to determining whether it is more likely than not that the fair value of the reporting unit exceeds its carrying value:
Macroeconomic conditions.
Industry and market conditions.
Overall financial performance.
Comprehensive Income

Total comprehensive income includes all changes in equity during a period from transactions and other events and circumstances from non-owner sources. The Corporation’s other comprehensive income is comprised of unrealized holding gains and losses on securities available-for-sale and unrecognized actuarial gains and losses of the Corporation’s defined benefit pension plan, net of taxes.

Disclosure of comprehensive income for the years ended December 31, 2010, 20092013, 2012 and 20082011 is presented in the Consolidated Statements of Changes in Stockholders’ EquityComprehensive Income and presented in detail in Note 1415 of the Notes to Consolidated Financial Statements.

F-15

CENTER BANCORP, INC. AND SUBSIDIARIES
NOTES TO CONSOLIDATED FINANCIAL STATEMENTS
Note 1 — Summary of Significant Accounting Policies  – (continued)
Bank-Owned Life Insurance

The Corporation invests in Bank-Owned Life Insurance (“BOLI”) to help offset the rising cost of employee benefits. During the 3rd quarter of 2010 the Corporation redeemed BOLI policies for proceeds of $5.6 million and purchased additional BOLI policies of $6.0 million. In conjunction with the redemption, the Corporation recorded a tax expense of $633,000. The change in the cash surrender value of the BOLI wasis recorded as a component of other income and amounted to $1,226,000, $1,020,000 and $973,000 in 2010, 2009 and 2008, respectively. During 2010 and 2009, the Corporation recognized $0 and $136,000, respectively, in tax-free proceeds in excess of contract value on its BOLI due to the death of insured participants.

income.

Income Taxes
 

TABLE OF CONTENTS

CENTER BANCORP, INC. AND SUBSIDIARIES

NOTES TO CONSOLIDATED FINANCIAL STATEMENTS

Note 1 — Summary of Significant Accounting Policies  – (continued)

Income Taxes

The Corporation recognizes deferred tax assets and liabilities for the expected future tax consequences of events that have been included in the financial statements or tax returns. Under this method, deferred tax assets and liabilities are determined based on the difference between financial statement and tax bases of assets and liabilities, using enacted tax rates expected to be applied to taxable income in the years in which the differences are expected to be settled. Income tax-related interest and penalties are classified as a component of income tax expense.

ASC Topic 740,Taxes, provides clarification on accounting for uncertainty in income taxes recognized in an enterprise’s financial statements and prescribes a recognition threshold and measurement attribute for the financial statement recognition and measurement of a tax position taken or expected to be taken in a tax return. The Corporation has not identified any income tax uncertainties.
Advertising Costs

The Corporation recognizes its marketing and advertising cost as incurred. Advertising costs were $268,000, $366,000$304,000, $186,000 and $637,000$131,000 for the years ended December 31, 2010, 20092013, 2012 and 2008,2011, respectively.

Reclassifications

Certain reclassifications have been made in the consolidated financial statementsfootnotes for 20092012 and 20082011 to conform to the classifications presented in 2010.

2013.


Note 2 — Recent Accounting Pronouncements

On June 12, 2009, the FASB issued SFAS No. 166, “Accounting for Transfers of Financial Assets” (“FAS 166”), which was incorporated into ASC 860 “Transfers and Servicing”, and SFAS No.167, “Amendments to FASB Interpretation No. 46 (Revised), which was incorporated into ASC 810 “Consolidation” (“FAS 167”), which change the way entities account for securitizations and special-purpose entities.

FAS 166 is a revision to FASB ASC 860-10 (previously SFAS No. 140, “Accounting for Transfers and Servicing of Financial Assets and Extinguishments of Liabilities”) and will require more information about transfers of financial assets, including securitization transactions, and where companies have continuing exposure to the risks related to transferred financial assets. FAS 166 also eliminates the concept of a “qualifying special-purpose entity”, changes the requirements for derecognizing financial assets and requires additional disclosures.

FAS 167 changes how a company determines when an entity that is insufficiently capitalized or is not controlled through voting (or similar rights) should be consolidated. The determination of whether a company is required to consolidate an entity is based on, among other things, an entity’s purpose and design and a company’s ability to direct the activities of the entity that most significantly impact the entity’s economic performance.

Both FAS 166 and FAS 167 became effective as of the beginning of each reporting entity’s first annual reporting period that begins after November 15, 2009, for interim periods within that first annual reporting period and for interim and annual reporting periods thereafter. Earlier application is prohibited. The recognition and measurement provisions of FAS 166 shall be applied to transfers that occur on or after the effective date. The Corporation adopted both FAS 166 and FAS 167 on January 1, 2010, as required. The adoption had no impact on the Corporation’s statements of income and financial condition.

In January 2010,2013, the FASB issued ASU No. 2010-06, 2013-01,ImprovingBalance Sheet (Topic 210): Disclosures About Fair Value Measurementsabout Offsetting Assets and Liabilities,”,” which added disclosure requirementsamended disclosures by requiring improved information about transfers intofinancial instruments and out of Levels 1, 2, and 3, clarified existing fair value disclosure requirements about the appropriate level of disaggregation, and clarifiedderivative instruments that a description of the valuation technique (e.g., market approach, income approach, or cost approach) and inputs used to measure fair value was required for recurring, nonrecurring, and Level 2 and 3 fair value measurements. These provisions of the ASU were effective for the Corporation’s reporting period ending March 31, 2010. The ASU also requires that Level 3 activity about purchases, sales, issuances, and settlements be presented on a gross basis rather than as a net number as currently permitted. This provision of


TABLE OF CONTENTS

CENTER BANCORP, INC. AND SUBSIDIARIES

NOTES TO CONSOLIDATED FINANCIAL STATEMENTS

Note 2 — Recent Accounting Pronouncements  – (continued)

the ASU is effective for the Corporation’s reporting period ending March 31, 2011. As this provision amends only the disclosure requirements related to Level 3 activity, the adoption will have no impactare either offset on the Corporation’s statementsbalance sheet or subject to an enforceable master netting arrangement or similar agreement, irrespective of income and condition.

In December 2010,whether they are offset on the FASB issued ASU No. 2010-28, “When to Perform Step 2 of the Goodwill Impairment Test forbalance sheet. Reporting Units with Zero or Negative Carrying Amounts.” Under GAAP, the evaluation of goodwill impairment is a two-step test. In Step 1, an entity must assess whether the carrying amount of a reporting unit exceeds its fair value. If it does, an entity must perform Step 2 of the goodwill impairment test to determine whether goodwill has been impaired and to calculate the amount of that impairment. The provisions of this ASU modify Step 1 of the goodwill impairment test for reporting units with zero or negative carrying amounts. For those reporting units, an entity isentities are required to perform Step 2provide both net and gross information for these assets and liabilities in order to enhance comparability between those entities that prepare their financial statements on the basis of international financial reporting standards ("IFRS"). Companies were required to apply the goodwill impairment test if it is more likely than not that a goodwill impairment exists.amendments for fiscal years beginning on or after January 1, 2013, and interim periods within those years. The provisions of this ASU are effective for the Corporation’s reporting period ending March 31, 2011. As of December 31, 2010, the Corporation had no reporting units with zero or negative carrying amounts or reporting units where there was a reasonable possibility of failing Step 1 of the goodwill impairment test. As a result, the adoption of this ASU isaccounting standard did not expected to have a material impact on the Corporation’sCorporation's results of operations, financial position, or liquidity. 

In February 2013, the FASB issued ASU No. 2013-02, "Reporting of Amounts Reclassified Out of Accumulated Other Comprehensive Income," to improve the transparency of reporting these reclassifications. ASU No. 2013-02 does not amend any existing requirements for reporting net income or other comprehensive income in the financial statements. ASU No. 2013-02 requires an entity to disaggregate the total change of each component of other comprehensive income and separately present reclassification adjustments and current period other comprehensive income. The provisions of ASU No. 2013-02 also requires that entities present either in a single note or parenthetically on the face of the financial statements, the effect of significant amounts reclassified from each component of accumulated other comprehensive income based on its source and the income statement line item affected by the reclassification. The Corporation adopted the provisions of ASU No. 2013-02 effective January 1, 2013. As the Corporation provided these required disclosures in the notes to the Consolidated Financial Statements, the adoption of ASU No. 2013-02 had no impact on the Corporation's consolidated statements of income and condition.

In January 2011, the

FASB issued ASU No. 2011-01, “2014-04:DeferralReclassification of Residential Real Estate Collateralized Consumer Mortgage Loans Upon Foreclosure. EITF Issue 13-E sought to define “in substance repossession or foreclosure” because of the Effective Datediversity in practice regarding when entities were reclassifying loans receivable to other real estate owned instead of Disclosures about Troubled Debt Restructuringsas a loan receivable. The timing of loan reclassifications to OREO may be qualitatively significant to regulators and other financial statement users. “In substance repossession or foreclosure” is clarified by the ASU. A creditor is considered to have received physical possession (resulting from an in Update No. 2010-20.substance repossession) of residential real estate property collateralizing a consumer mortgage loan only upon the occurrence of either of the following: a) The provisionscreditor obtains legal title to the residential real estate property upon completion of a foreclosure. A creditor may obtain legal title to the residential real estate property even if the borrower has redemption rights that provide the borrower with a legal right for a period of time after a foreclosure to reclaim the real estate property by paying certain amounts specified by law. b) The borrower conveys all interest in the residential real estate property to the creditor to satisfy the loan through completion of a deed in lieu of foreclosure or through a similar legal agreement. The deed in lieu of foreclosure or similar legal agreement is completed when agreed-upon terms and conditions have been satisfied by both the borrower and the creditor. The ASU No. 2010-20 requiredis effective for fiscal years beginning after December 15, 2014, and interim periods therein. Early adoption is permitted. The Corporation will adopt the disclosure of more granular information on the nature and extent of troubled debt restructurings and their effect on the Allowance for the period ending March 31, 2011. The amendments inmethodologies prescribed by this ASU deferby the effective date related to these disclosures, enabling creditors to provide those disclosures afterrequired, and does not anticipate that the FASB completes its project clarifying the guidance for determining what constitutes a troubled debt restructuring. Currently, that guidance is expected to be effective for interim and annual periods ending after June 15, 2011. As the provisions of this ASU only defer the effective date of disclosure requirements related to troubled debt restructurings, the adoption of this ASU will have no impacta material effect on the Corporation’s statementsits financial position or results of income and condition

ASU 2010-20

ASU 20100-20,Receivables (Topic 310): Disclosures about the Credit Quality of Financing Receivables and the Allowance for Credit Losses, will help investors assess the credit risk of a company’s receivables portfolio and the adequacy of its allowance for credit losses held against the portfolios by expanding credit risk disclosures.

This ASU requires more information about the credit quality of financing receivables in the disclosures to financial statements, such as aging information and credit quality indicators. Both new and existing disclosures must be disaggregated by portfolio segment or class. The disaggregation of information is based on how a company develops its allowance for credit losses and how it manages its credit exposure.

The amendments in this Update apply to all public and nonpublic entities with financing receivables. Financing receivables include loans and trade accounts receivable. However, short-term trade accounts receivable, receivables measured at fair value or lower of cost or fair value, and debt securities are exempt from these disclosure amendments.

The effective date of ASU 2010-20 differs for public and nonpublic companies. For public companies, the amendments that require disclosures as of the end of a reporting period are effective for periodsending on or after December 15, 2010. The amendments that require disclosures about activity that occurs during a reporting period are effective for periodsbeginning on or after December 15, 2010. For nonpublic companies, the amendments are effective for annual reporting periods ending on or after December 15, 2011. The Corporation adopted the ASU as required. The adoption had no impact on the Corporation’s statements of income and financial condition.


operations.
 

TABLE OF CONTENTS

F-16

CENTER BANCORP, INC. AND SUBSIDIARIES

NOTES TO CONSOLIDATED FINANCIAL STATEMENTS

Note 3 — Cash and Due from Banks

The subsidiary bank, Union Center National Bank maintained cash balances reserved to meet regulatory requirements of the Federal Reserve Board of approximately $4,248,000$2,545,000 and $4,050,000$1,337,000 at December 31, 20102013 and 2009,2012, respectively.


Note 44. Business Combinations
On August 1, 2012, the Bank assumed all of the deposits and certain other liabilities and acquired certain assets of Saddle River Valley Bank (“Saddle River”), a New Jersey State-chartered bank, pursuant to the terms of a Purchase and Assumption Agreement, dated as of February 1, 2012, among the Bank, Saddle River Valley Bank and Saddle River Valley Bancorp. This purchase and assumption was in keeping with the Bank’s strategy to expand its base of operations into Northern New Jersey.
The Bank assumed approximately $85.2 million in deposits and acquired approximately $89.3 million in loans and securities from Saddle River. The Bank paid total consideration of $10.3 million in cash. Acquisition costs, totaling $482,000 are reported on the consolidated statements of income.
The following table sets forth assets acquired and liabilities assumed at their estimated fair values, and resulting Bargain gain on acquisition, as of the closing date of the transaction:
  August 1, 2012 
  (Dollars in thousands) 
Assets acquired:    
Cash and cash equivalents $6,195 
Investment securities available-for-sale  37,143 
Loans  52,192 
Premises and equipment, net  1,262 
Accrued interest receivable  389 
Total assets acquired $97,181 
Liabilities assumed:    
Deposits: $85,236 
Other liabilities  795 
Total liabilities assumed $86,031 
Net assets acquired $11,150 
Cash consideration paid in acquisition $10,251 
Bargain gain on acquisition $899 
The fair value estimates are subject to change for up to one year after the closing date of the transaction if additional information relative to closing date fair values becomes available.
Fair Value of Measurement of Assets Acquired and Liabilities Assumed
Described below are the methods used to determine the fair values of the significant assets acquired and liabilities assumed in the acquisition.
Cash and cash equivalents. The estimated fair values of cash and cash equivalents approximate their stated face amounts.
Investment securities available-for-sale.The estimated fair values of the investment securities available for sale were calculated utilizing Level 2 inputs. The prices for these instruments are obtained through an independent pricing service and are derived from market quotations and matrix pricing. The fair value measurements consider observable data that may include dealer quotes, market spreads, cash flows, the U.S. Treasury yield curve, live trading levels, trade execution data, market consensus prepayment speeds, credit information and the bond’s terms and conditions, among other things. Management reviewed the data and assumptions used in pricing the securities by its third party provider to ensure the highest level of significant inputs are derived from market observable data.
F-17

CENTER BANCORP, INC. AND SUBSIDIARIES
NOTES TO CONSOLIDATED FINANCIAL STATEMENTS
Note 4. Business Combinations – (continued)
Loans.A discounted cash flow of each individual loan was calculated. The discounted cash flows, at an account level, were then aggregated together by category type to determine the mark-to-market value of each loan type. The market values of all loan categories were added together to determine the total market value of the loan portfolio. The price of the portfolio is then determined bydividing the market value of the portfolio by the purchased face value of the portfolio. The discountrate utilized for the discounted cash flow of each loan category was based upon Bankrate and asurvey of three local market competitors and the Bank’s offerings.There was no carryover of the allowance for loan losses that had been previously recorded by Saddle River.
Deposits.The discount rate utilized for the discounted cash flow of each time deposit category was calculated based upon the market interest rate for the term nearest to the weighted average remaining maturity for each time deposit category. The time deposit market interest rate was derived from a FinancialMarket Focus Report for New Jersey as of August 1, 2012.
Accrued interest receivable. The carrying amounts of accrued interest approximate fair value.
Other liabilities. The estimated fair values of other liabilities approximate their stated face amounts.
In connection with the Saddle River asset/liability purchase and assumption, the Corporation recorded a net deferred income tax liability of $620,000 related to the tax attributes of the transaction.
The following table presents actual operating results attributable to Saddle River since the August 1, 2012 assumption date through December 31, 2012. This information does not include purchase accounting adjustments or acquisition integration costs.
(Dollars in thousands)    
Net interest income $1,352 
Non-interest income  15 
Non-interest expense and income taxes  (763) 
Net income $604 
The Corporation has not provided pro forma information for the twelve month periods ended December 31, 2012 as if the asset/liability purchase and assumption of Saddle River had occurred as of January 1, 2012. There is no consistent level base for objective comparison as product balances declined on a steady basis from the agreement date to assumption date and the closing date and accordingly such disclosures are considered impractical. The application of those disclosures would require a significant estimate of amounts, and it is impossible to distinguish objective information about those estimates that both provide evidence of circumstances that existed at the reporting dates, and would have been available when the financial statements for the prior periods were issued.
Certain loans, for which specific credit-related deterioration was identified, are recorded at fair value, reflecting the present value of the amounts expected to be collected. Income recognition on these loans is based on a reasonable expectation of the timing and amount of cash flows to be collected. The timing of the sale of loan collateral was estimated for acquired loans deemed impaired and considered collateral dependent. For these collateral dependent impaired loans, the excess of the future expected cash flow over the present value of the future expected cash flow represents the accretable yield, which will be accreted into interest income over the estimated liquidation period using the effective interest method. The aggregate contractual cash flows less the aggregate expected cash flows result in a credit related non-accretable yield amount or difference. The nonaccretable balance at December 31, 2013 and 2012 was approximately $0 and $71,000, respectively.The following table details the loans that are accounted for in accordance with FASB ASC 310-30 as of August 1, 2012:
(Dollars in thousands)    
Contractually required principal and interest at acquisition $2,101 
Contractual cash flows not expected to be collected (nonaccretable difference)  (982) 
Expected cash flows at acquisition  1,119 
Interest component of expected cash flows (accretable discount)  (161) 
Fair value of acquired loans accounted for under FASB ASC 310-30 $958 
The following table presents the changes in accretable discount related to purchased-credit-impaired loans:
  December 31, 
  2013 2012 
  (in thousands) 
Accretable discount balance, beginning of period $130 $ 
Additions resulting from acquisition    161 
Accretion to interest income  (130)  (31) 
Accretable discount, end of period $ $130 
Acquired loans not subject to the requirements of FASB ASC 310-30 are recorded at fair value. The fair value mark on each of these loans will be accreted into interest income over the remaining life of the loan. The following table details loans that are not accounted for in accordance with FASB ASC 310-30 as of August 1, 2012:
(Dollars in thousands)    
Contractually required principal and interest at acquisition $50,917 
Contractual cash flows not expected to be collected (credit mark)  (807) 
Expected cash flows at acquisition  50,110 
Interest rate premium mark  1,313 
Fair value of acquired loans not accounted for under FASB ASC 310-30 $51,423 
F-18

CENTER BANCORP, INC. AND SUBSIDIARIES
NOTES TO CONSOLIDATED FINANCIAL STATEMENTS
Note 5 — Investment Securities

The following tables present information related to the Corporation’s portfolio of securities available-for-sale and held-to-maturity at December 31, 20102013 and 2009.

2012.
    
 Amortized
Cost
 Gross
Unrealized
Gains
 Gross
Unrealized
Losses
 Fair
Value
   December 31, 2010
   (Dollars in Thousands)
Securities Available-for-Sale:
                    
U.S. Treasury and agency securities $7,123  $  $(128 $6,995 
Federal agency obligations  68,051   1,071   (641  68,481 
Mortgage-backed securities  180,037   115   (2,419  177,733 
Obligations of U.S. states and political subdivisions  38,312   1   (1,088  37,225 
Trust preferred securities  21,222   26   (2,517  18,731 
Corporate bonds and notes  63,047      (1,613  61,434 
Collateralized mortgage obligations  3,941      (1,213  2,728 
Equity securities  5,135      (382  4,753 
Total $386,868  $1,213  $(10,001 $378,080 

     Amortized
Cost
 Gross
Unrealized
Gains
 Gross
Unrealized
Losses
 Fair
Value
 
 Amortized
Cost
 Gross
Unrealized
Gains
 Gross
Unrealized
Losses
 Fair
Value
 December 31, 2013 
 December 31, 2009 (Dollars in Thousands) 
 (Dollars in Thousands)
Securities Available-for-Sale:
                    
Investment Securities Available-for-Sale:             
U.S. Treasury and agency securities $2,089  $  $  $2,089  $14,344 $ $(825) $13,519 
Federal agency obligations  129,672   538   (1,845  128,365   20,567  29  (655)  19,941 
Mortgage backed securities  86,968   54   (802  86,220 
Residential mortgage pass-through securities  48,312  791  (229)  48,874 
Commercial mortgage pass-through securities  7,145  3  (157)  6,991 
Obligations of U.S. states and political subdivisions  19,688   77   (484  19,281   30,804  711  (55)  31,460 
Trust preferred securities  34,404   113   (7,802  26,715   19,763  150  (510)  19,403 
Corporate bonds and notes  23,680   76   (1,101  22,655   154,182  4,930  (482)  158,630 
Collateralized mortgage obligations  9,637      (2,371  7,266 
Asset-backed securities  15,733  246    15,979 
Certificates of deposit  2,250  32  (20)  2,262 
Equity securities  5,936   42   (445  5,533   376    (89)  287 
Other securities  5,671  68  (15)  5,724 
Total $312,074  $900  $(14,850 $298,124  $319,147 $6,960 $(3,037) $323,070 
Investment Securities Held-to-Maturity:             
U.S. Treasury and agency securities $28,056 $ $(1,019) $27,037 
Federal agency obligations  15,249  23  (389)  14,883 
Residential mortgage-backed securities  2,246    (64)  2,182 
Commercial mortgage-backed securities  4,417  41  (62)  4,396 
Obligations of U.S. states and political subdivisions  127,418  1,303  (3,688)  125,033 
Corporate bonds and notes  37,900  149  (622)  37,427 
Total $215,286 $1,516 $(5,844) $210,958 
Total investment securities $534,433 $8,476 $(8,881) $534,028 

All of the Corporation’s investment securities are classified as available-for-sale at December 31, 2010 and 2009.

  Amortized
Cost
 Gross
Unrealized
Gains
 Gross
Unrealized
Losses
 Fair
Value
 
  December 31, 2012 
  (Dollars in Thousands) 
Investment Securities Available-for-Sale:             
U.S. Treasury and agency securities $11,870 $62 $(23) $11,909 
Federal agency obligations  20,207  333  (5)  20,535 
Residential mortgage pass-through securities  52,400  1,385  (1)  53,784 
Commercial mortgage pass-through securities  9,725  244    9,969 
Obligations of U.S. states and political subdivisions  103,193  4,653  (132)  107,714 
Trust preferred securities  22,279  144  (1,174)  21,249 
Corporate bonds and notes  228,681  9,095  (371)  237,405 
Collateralized mortgage obligations  2,120      2,120 
Asset-backed securities  19,431  311    19,742 
Certificates of deposit  2,854  21  (10)  2,865 
Equity securities  535    (210)  325 
Other securities  9,145  68  (15)  9,198 
Total $482,440 $16,316 $(1,941) $496,815 
Investment Securities Held-to-Maturity:             
Federal agency obligations $4,178 $79 $ $4,257 
Commercial mortgage-backed securities  5,501  154  (5)  5,650 
Obligations of U.S. states and political subdivisions  48,385  4,139    52,524 
Total $58,064 $4,372 $(5) $62,431 
Total investment securities $540,504 $20,688 $(1,946) $559,246 
The available-for-sale securities are reported at fair value with unrealized gains or losses included in equity, net of taxes. Accordingly, the carrying value of such securities reflects their fair value at the balance sheet date. Fair value is based upon either quoted market prices, or in certain cases where there is limited activity in the market for a particular instrument, assumptions are made to determine their fair value. See Note 1819 of the Notes to Consolidated Financial Statements for a further discussion.


TABLE OF CONTENTS

During 2013, the Corporation transferred from its available-for-sale category to its held-to-maturity category $138.3 million of securities. Transfers of securities from the available-for-sale category to the held-to-maturity category are made at fair value at the date of transfer. The unrealized holding gain or loss at the date of transfer remains in accumulated other comprehensive income and in the carrying value of the held-to-maturity investment security. Premiums or discounts on investment securities are amortized or accreted using the effective interest method over the life of the security as an adjustment of yield. Unrealized holding gains or losses that remain in accumulated other comprehensive income are amortized or accreted over the remaining life of the security as an adjustment of yield, offsetting the related amortization of the premium or accretion of the discount.

F-19

CENTER BANCORP, INC. AND SUBSIDIARIES

NOTES TO CONSOLIDATED FINANCIAL STATEMENTS

Note 45 — Investment Securities  – (continued)

The following table presents information for investments in securities available-for-sale and held-to-maturity at December 31, 2010,2013, based on scheduled maturities. Actual maturities can be expected to differ from scheduled maturities due to prepayment or early call options of the issuer.

  
 Available-for-Sale
   Amortized
Cost
 Fair
Value
   (Dollars in Thousands)
Due in one year or less $1,503  $1,500 
Due after one year through five years  19,185   18,810 
Due after five years through ten years  68,277   66,502 
Due after ten years  112,731   108,782 
Mortgage-backed securities without stated maturities  180,037   177,733 
Equity securities  5,135   4,753 
Total investment securities $386,868  $378,080 

During 2010, securities sold

  December 31, 2013 
  Amortized
Cost
 Fair
Value
 
  (Dollars in Thousands) 
Investment Securities Available-for-Sale:       
Due in one year or less $9,738 $9,780 
Due after one year through five years  63,206  64,802 
Due after five years through ten years  123,765  126,024 
Due after ten years  60,934  60,588 
Residential mortgage pass-through securities  48,312  48,874 
Commercial mortgage pass-through securities  7,145  6,991 
Equity securities  376  287 
Other securities  5,671  5,724 
Total $319,147 $323,070 
Investment Securities Held-to-Maturity:       
Due in one year or less $2,061 $2,065 
Due after one year through five years  12,547  12,699 
Due after five years through ten years  65,692  64,027 
Due after ten years  128,323  125,589 
Residential mortgage-backed securities  2,246  2,182 
Commercial mortgage-backed securities  4,417  4,396 
Total $215,286 $210,958 
Total investment securities $534,433 $534,028 
Gross gains and losses from the Corporation’s available-for-sale portfolio amounted to approximately $644.1 million. The gross realized gains onsales of investment securities sold amounted to approximately $4,872,000, whilefor the gross realized losses amounted to approximately $635,000 in 2010. During 2010, the Corporation recorded a $3.0 million other-than-temporary impairment charge on its trust preferred securities, $1.8 million on two pooled trust preferred securities, $360,000 in a variable rate private label CMOyears ended December 31, 2013, 2012 and $398,000 on principal losses on a variable rate private label CMO. During 2009, securities sold from the Corporation’s available-for-sale portfolio amounted to approximately $665.8 million. The gross realized gains on securities sold amounted to approximately $5,897,000, while the gross realized losses amounted to approximately $1,168,000 in 2009. During 2009, the Corporation recorded a $140,000 other-than-temporary impairment charge on its Lehman Brothers corporate bond, $3,433,000 on two pooled trust preferred securities, $188,000 on a variable rate private label CMO, $364,000 on charge to earnings relating to the court ordered liquidation of the Reserve Primary Fund, and $113,000 of write-downs relating to a single equity holding in bank stocks.

2011 were as follows:

  Years Ended December 31, 
(Dollars in Thousands) 2013 2012 2011 
Gross gains on sales of investment securities $2,451 $2,905 $4,045 
Gross losses on sales of investment securities  88  23  69 
Net gains on sales of investment securities $2,363 $2,882 $3,976 
F-20

CENTER BANCORP, INC. AND SUBSIDIARIES
NOTES TO CONSOLIDATED FINANCIAL STATEMENTS
Note 5 — Investment Securities  – (continued)
Other-than-Temporarily Impaired Investments

Summary of Other-than-Temporary Impairment Charges

   
 Years Ended December 31,
   2010 2009 2008
   (Dollars in Thousands)
Equity securities $  $113  $461 
Debt securities  5,576   4,125   1,300 
Total other-than-temporary impairment charges $5,576  $4,238  $1,761 

 Years Ended December 31, 
 2013 2012 2011 
 (Dollars in Thousands) 
One variable rate private label CMO$ $484 $18 
Pooled trust preferred securities 628  68   
Principal losses on a variable rate CMO 24  318  324 
Total other-than-temporary impairment charges$652 $870 $342 
The Corporation performs regular analysis on the available-for-sale securities portfolio to determine whether a decline in fair value indicates that an investment is other-than-temporarily impaired in accordance with FASB ASC 320-10. FASB ASC 320-10 requires companies to record other-than-temporary impairment (“OTTI”) charges, through earnings, if they have the intent to sell, or more likely than not be required to sell, an impaired debt security before recovery of its amortized cost basis. If the Corporation intends to sell or it is more likely than not it will be required to sell the security before recovery of its amortized cost basis, less any current period credit loss, the OTTI is recognized in earnings equal to the entire difference between the investment’s amortized cost basis and its estimated fair value at the balance sheet date. If the Corporation does not intend to sell the security and it is more likely than not that the entity will be required to sell the security before recovery of its amortized cost basis less any current period loss, and as such, it determines that


TABLE OF CONTENTS

CENTER BANCORP, INC. AND SUBSIDIARIES

NOTES TO CONSOLIDATED FINANCIAL STATEMENTS

Note 4 — Investment Securities  – (continued)

a decline in fair value is other than temporary, the OTTI is separated into the amount representing the credit loss and the amount related to all other factors. The amount of the OTTI related to the credit loss is determined based on the present value of cash flows expected to be collected and is recognized in earnings. The amount of the total OTTI related to other factors is recognized in other comprehensive income, net of applicable taxes. The previous amortized cost basis less the OTTI recognized in earnings becomes the new amortized cost basis of the investment.

The Corporation reviews all securities for potential recognition of other-than-temporary impairment. The Corporation maintains a watch list for the identification and monitoring of securities experiencing problems that require a heightened level of review. This could include credit rating downgrades.

The Corporation’s assessment of whether an investment in the portfolio of assets is other than temporary includes factors such as whether the issuer has defaulted on scheduled payments, announced restructuring and/or filed for bankruptcy, has disclosed severe liquidity problems that cannot be resolved, disclosed deteriorating financial condition or sustained significant losses.

F-21

CENTER BANCORP, INC. AND SUBSIDIARIES
NOTES TO CONSOLIDATED FINANCIAL STATEMENTS
Note 5 — Investment Securities  – (continued)
The following table presents detailed information for each trust preferred security held by the Corporation at December 31, 2013, of which all but one has at least one rating below investment grade at December 31, 2010.

grade.
         
         
Deal Name Single
Issuer
or
Pooled
 Class/
Tranche
 Amortized
Cost
 Fair
Value
 Gross
Unrealized
Gain
(Loss)
 Lowest
Credit
Rating
Assigned
 Number of
Banks
Currently
Performing
 Deferrals
and
Defaults
as % of
Original
Collateral
 Expected
Deferral/Defaults
as % of
Remaining
Performing
Collateral
   (Dollars in Thousands)
Countrywide Capital IV  Single     $1,769  $1,688  $(81  BB+   1   None   None 
Countrywide Capital V  Single      2,747   2,691   (56  BB+   1   None   None 
Countrywide Capital V  Single      250   244   (6  BB+   1   None   None 
NPB Capital Trust II  Single      873   875   2   NR   1   None   None 
Citigroup Cap IX  Single      991   892   (99  BB+   1   None   None 
Citigroup Cap IX  Single      1,903   1,721   (182  BB+   1   None   None 
Citigroup Cap XI  Single      245   242   (3  BB+   1   None   None 
BAC Capital Trust X  Single      2,500   2,205   (295  NR   1   None   None 
Nationsbank Cap Trust III  Single      1,569   1,116   (453  BB+   1   None   None 
Morgan Stanley Cap Trust IV  Single      2,500   2,260   (240  BB+   1   None   None 
Morgan Stanley Cap Trust IV  Single      1,741   1,581   (160  BB+   1   None   None 
Saturns – GS 2004-06  Single      242   229   (13  BBB-   1   None   None 
Saturns – GS 2004-06  Single      312   296   (16  BBB-   1   None   None 
Saturns – GS 2004-04  Single      778   731   (47  BBB-   1   None   None 
Saturns – GS 2004-04  Single      22   20   (2  BBB-   1   None   None 
USB Capital VII  Single      1,213   1,230   17   BBB+   1   None   None 
USB Capital VII  Single      561   568   7   BBB+   1   None   None 
ALESCO Preferred Funding VI  Pooled   C2   227   19   (208  Ca   44 of 67   36.4  41.3
ALESCO Preferred Funding VII  Pooled   C1   779   123   (656  Ca   61 of 79   26.8  42.6

Deal Name Single
Issuer or
Pooled
 Class/
Tranche
 Amortized
Cost
 Fair
Value
 Gross
Unrealized
Gain (Loss)
 Lowest
Credit
Rating
Assigned
 Number of
Banks
Currently
Performing
 Deferrals
and Defaults
as % of
Original
Collateral
 Expected
Deferral/Defaults
as % of
Remaining
Performing
Collateral
 
  (Dollars in Thousands) 
Countrywide
    Capital IV
 Single   $1,771 $1,772 $1 BB+ 1 None None 
Countrywide
    Capital V
 Single    2,747  2,784  37 BB+ 1 None None 
Countrywide
    Capital V
 Single    250  253  3 BB+ 1 None None 
Citigroup Cap IX Single    992  999  7 BB+ 1 None None 
Citigroup Cap IX Single    1,906  1,927  21 BB+ 1 None None 
Citigroup Cap XI Single    246  248  2 BB+ 1 None None 
Nationsbank Cap
    Trust III
 Single    1,574  1,275  (299) BB+ 1 None None 
Morgan Stanley
    Cap Trust IV
 Single    2,500  2,372  (128) BB+ 1 None None 
Morgan Stanley
    Cap Trust IV
 Single    1,742  1,659  (83) BB+ 1 None None 
Saturns — GS
    2004-04
 Single    536  536   BB+ 1 None None 
Goldman Sachs Single    999  1,011  12 BB+ 1 None None 
Stifel Financial Single    4,500  4,567  67 BBB- 1 None None 
Total      $19,763 $19,403 $(360)         
The Corporation owns twoowned one pooled trust preferred securitiessecurity (“Pooled TRUPS”TRUP”), which consists of securities issued by financial institutions and insurancesinsurance companies and the Corporation holdsheld the mezzanine tranche of such securities. Senior tranches generally are protected from defaults by over-collateralization and cash flow default protection provided by subordinated tranches, with senior tranches having the greatest protection and mezzanine tranches subordinated to the senior tranches. OurThe Corporation’s analysis of thesethis Pooled TRUPSTRUP falls within the scope of EITF 99-20, ASC 320-40 and uses a discounted cash flow model to determine the


TABLE OF CONTENTS

CENTER BANCORP, INC. AND SUBSIDIARIES

NOTES TO CONSOLIDATED FINANCIAL STATEMENTS

Note 4 — Investment Securities ��– (continued)

total OTTI loss. The model considers the structure and term and the financial condition of the underlying issuers. Specifically, the model details interest rates, principal balances of note classes and underlying issuers and the allocation of the payments to the note classes according to a priority of payments specified in the offering circular and indenture. The current estimate of expected cash flows is based on the most recent trustee reports and other relevant market information including announcements of interest payment deferrals or defaults of underlying trust preferred securities. Assumptions used in the model include defaultsdefault rates, default rate timing profile and recovery rates. We assumeThe Corporation assumes no prepayments as thesethe Pooled TRUPS wereTRUP was issued at comparatively tight spreads and as such, there is little incentive, if any, to prepay.

One of

F-22

CENTER BANCORP, INC. AND SUBSIDIARIES
NOTES TO CONSOLIDATED FINANCIAL STATEMENTS
Note 5 — Investment Securities  – (continued)
During 2013, the Pooled TRUPS, ALESCO 6, has incurred its seventh interruption of cash flow payments to date. Management reviewed the expected cash flow analysis and credit support to determine if it was probable that all principal and interest would be repaid, and recorded a $33,000 other-than-temporary impairment charge for the three months ended December 31, 2010 and $500,000 for the twelve months ended December 31, 2010, which represents 15.6 percent of the par amount of $3.2 million. The new cost basis for this security has been written down to $228,000. The other Pooled TRUP, ALESCO 7VII, incurred its fiftheighteenth interruption of cash flow payments to date. Management determined that an other-than-temporary impairment existscharge of $628,000 existed on this security as well and recorded a $677,000 charge during the fourth quarter of 2010, and $1.3 million for the twelve months ended December 31, 2010 which represents 41.9 percent of the par amount of $3.1 million. The new cost basis for this security has been written down to $800,000.

2013, and subsequently sold at its book value in January 2014.

Credit Loss Portion of OTTI Recognized in Earning on Debt Securities

  
 Years Ended December 31,
   2010 2009
   (Dollars in Thousands)
Balance of credit-related OTTI at January 1, $3,621  $ 
Addition:
          
Credit losses for which other-than-temporary impairment was not previously recognized  5,576   3,761 
Reduction:
          
Credit losses for securities sold during the period  (3,000  (140
Balance of credit-related OTTI at December 31, $6,197  $3,621 

  Years Ended December 31, 
  2013 2012 2011 
  (Dollars in Thousands) 
Balance of credit-related OTTI at January 1, $4,450 $6,539 $6,197 
Addition:          
Credit losses for which other-than-temporary impairment
    was not previously recognized
  652  870  342 
Reduction:          
Credit losses for securities sold during the period  (5,102)  (2,959)   
Balance of credit-related OTTI at December 31, $ $4,450 $6,539 
The Corporation owns threeheld one variable rate private label collateralized mortgage obligations (CMOs)obligation (CMO), which werewas also evaluated for impairment. The Variable Rate Collateralized Mortgage Obligations wereObligation was originally issued in 2006 and areis 30 year Adjustable Rate Mortgage loansloan secured by a first lien, fully amortizing one-to-four residential mortgage loans. The tranche purchased was a Super Senior with an original credit rating of AAA/AAA. The top five states geographic concentration comprised in the deal were California18.2 percent, Arizona10.5 percent, Virginia6.1 percent, Florida6.5 percent and Nevada6.3 percent. No one state exceeded a 25 percent concentration. These states have been heavily impacted by the financial crises and as such have sustained heavy delinquencies affecting the credit rating of the security. Management had applied aggressive default rates to identify if any credit impairment exists, as these bonds were downgraded to below investment grade. The Corporation recorded $398,000$24,000 in principal losses on these bondsthe bond in 2010,2013, and expects additional lossesthis security was sold at this book value in future periods. As such, management determined that an other-than-temporary impairment charge exists and recorded a $360,000 write down to the bonds, which represents 8.0 percent of the par amount of $4.5 million. The new cost basis for these securities has been written down to $3.9 million.


January 2013.
 

TABLE OF CONTENTS

F-23

CENTER BANCORP, INC. AND SUBSIDIARIES

NOTES TO CONSOLIDATED FINANCIAL STATEMENTS

Note 45 — Investment Securities  – (continued)

At December 31, 2010, excess subordination as a percentage of remaining performing collateral for the ALESCO Preferred Funding VI and VII investments were -36.6 percent and -21.1 percent, respectively. Excess subordination is the amount of performing collateral above the amount of outstanding collateral underlying each class of the security. The Excess Subordination as a Percent of Remaining Performing Collateral reflects the difference between the performing collateral and the collateral underlying each security divided by the performing collateral. A negative number results when the paying collateral is less than the collateral underlying each class of the security. A low or negative number decreases the likelihood of full repayment of principal and interest accordingly to original contractual terms.

During 2010, the Corporation did not record other-than-temporary impairment charges relating to equity holdings in bank stocks.

The Corporation’s investment portfolio also consists of overnight investments that were made into the Reserve Primary Fund (the “Fund”), a money market fund registered with the Securities and Exchange Commission as an investment company under the Investment Company Act of 1940. On September 22, 2008, the Fund announced that redemptions of shares of the Fund were suspended pursuant to an SEC order so that an orderly liquidation could be effected for the protection of the Fund’s investors. Through December 31, 2009, the Corporation has received five distributions from the Fund, totaling approximately 92 percent of its outstanding balance, leaving a remaining outstanding balance in the Fund of $2.943 million. On January 29, 2010, as part of the court order liquidation of the Fund, the Corporation received a sixth distribution or $2.446 million, bringing total distributions to date to approximately 99 percent. During the fourth quarter of 2009, the Corporation recorded a $364,000, or approximately 1 percent, other-than-temporary impairment charge to earnings relating to this court order liquidation of the Fund. The Corporation’s outstanding carrying balance in the Fund as of January 31, 2010 totaled $133,000. The Corporation’s outstanding carrying balance in the Fund as of December 31, 2010 was zero and recording to earnings approximately $30,000 as partial recovery of the OTTI charge. Future liquidation distributions received by the Corporation, if any, will be recorded to earnings.

During 2010, securities sold from the Corporation’s available-for-sale portfolio amounted to approximately $644.1 million. The gross realized gains on securities sold amounted to approximately $4,872,000, while the gross realized losses amounted to approximately $635,000 in 2010. During 2010, the Corporation recorded a $3.0 million other-than-temporary impairment charge on its trust preferred securities, $1.8 million on two pooled trust preferred securities, $360,000 in a variable rate private label CMO and $398,000 on principal losses on a variable rate private label CMO. During 2009, securities sold from the Corporation’s available-for-sale portfolio amounted to approximately $665.8 million. The gross realized gains on securities sold amounted to approximately $5,897,000, while the gross realized losses amounted to approximately $1,168,000 in 2009. During 2009, the Corporation recorded a $140,000 other-than-temporary impairment charge on its Lehman Brothers corporate bond, $3,433,000 on two pooled trust preferred securities, $188,000 on a variable rate private label CMO, $364,000 on charge to earnings relating to the court ordered liquidation of the Reserve Primary Fund, and $113,000 of write-downs relating to a single equity holding in bank stocks.

During the third quarter of 2008, the Corporation recognized a $1.2 million other-than-temporary impairment charge on a Lehman Brothers corporate bond, sold in 2009, as a result of Lehman Brothers’ September bankruptcy filing. The Corporation deemed it prudent to mark the security down to what the Corporation believes it would receive from the bankruptcy proceedings as opposed to an attempted sale into an illiquid market. During the fourth quarter, the Corporation took an additional impairment charge of $100,000 on the same bond. The Corporation filed its claims under the Bankruptcy and received notification that Lehman will be afforded a longer time for liquidation than originally announced in order to maximize value returns on the sold assets. Management will continue to monitor the liquidation process, re-test values during that period and adjust carrying value if necessary.


Temporarily Impaired Investments
 

TABLE OF CONTENTS

CENTER BANCORP, INC. AND SUBSIDIARIES

NOTES TO CONSOLIDATED FINANCIAL STATEMENTS

Note 4 — Investment Securities  – (continued)

During 2008, the Corporation recorded $461,000 of other-than-temporary impairment charges relating to three equity holdings in bank stocks. These equities were written down to fair value.

Temporarily Impaired Investments

For all other securities, the Corporation does not believe that the unrealized losses, which were comprised of 115170 and 49 investment securities as of December 31, 2010,2013 and December 31, 2012, respectively, represent an other-than-temporary impairment. The gross unrealized losses associated with U.S. Treasury and Agency securities and Federal agency obligations, mortgage-backed securities, corporate bonds, asset-backed securities and tax-exempt securities are not considered to be other than temporary because their unrealized losses are related to changes in interest rates and do not affect the expected cash flows of the underlying collateral or issuer.

Factors affecting the market price include credit risk, market risk, interest rates, economic cycles, and liquidity risk. The magnitude of any unrealized loss may be affected by the relative concentration of the Corporation’s investment in any one issuer or industry. The Corporation has established policies to reduce exposure through diversification of concentration of the investment portfolio including limits on concentrations to any one issuer. The Corporation believes the investment portfolio is prudently diversified.

The decline in value is related to a change in interest rates and subsequent change in credit spreads required for these issues affecting market price. All issues are performing and are expected to continue to perform in accordance with their respective contractual terms and conditions. Short to intermediate average durations and in certain cases monthly principal payments should reduce further market value exposure to increases in rates.

The Corporation evaluates all securities with unrealized losses quarterly to determine whether the loss is other than temporary. Unrealized losses in the mortgage-backed securities category consist primarily of U.S. agency and private issue collateralized mortgage obligations. Unrealized losses in the corporate debt securities category consist of single name corporate trust preferred securities, a pooled trust preferred securitiessecurity and corporate debt securities issued by large financial institutions. The decline in fair value is due in large part to the lack of an active trading market for these securities, changes in market credit spreads and rating agency downgrades. For collateralized mortgage obligations, management reviewed expected cash flows and credit support to determine if it was probable that all principal and interest would be repaid. None of the corporate issuers have defaulted on interest payments. Management concluded that these securities other than the previously mentioned two Pooled TRUPS, two private label CMOs, one equity holding and its investment in the Primary Reserve Funds, were not other-than-temporarily impaired at December 31, 2010.2013. Future deterioration in the cash flow on collateralized mortgage obligations or the credit quality of these large financial institution issuers of corporate debt securities could result in impairment charges in the future.

Obligations of U.S. states and political subdivisions are comprised of intermediate to long-term municipal bonds. A review of the coupon rates and maturity dates validates the unrealized losses due to the changes in interest rates. These bonds were purchased at lower ends of the interest rate cycle and were a part of the Corporation’s overall strategy to use tax-free instruments and to barbell the maturity distribution of bonds. The bonds are conservative in nature and the value decline is related to the changes in interest rates that occurred since the time of purchase and subsequent changes in spreads affecting the market prices. All of the issues carry an A or better underlying credit support and were evaluated on the basis on their underlying fundamentals; included but not limited to annual financial reports, geographic location, population and debt ratios. In certain cases options for calls reduce the effective duration and in turn the future market value fluctuations. All issues are performing and are expected to continue to perform in accordance with their respective contractual terms and conditions. There have not been disruptions of any payments, associated with any of these municipal securities.

In determining that the securities giving rise to the previously mentioned unrealized losses were not other than temporary, the Corporation evaluated the factors cited above, which the Corporation considers when assessing whether a security is other-than-temporarily impaired. In making these evaluations the Corporation must exercise considerable judgment. Accordingly, there can be no assurance that the actual results will not differ from the Corporation’s judgments and that such differences may not require the future recognition of other-than-temporary impairment charges that could have a material affect on the Corporation’s financial position and results of operations. In addition, the value of, and the realization of any loss on, an investment security is subject to numerous risks as cited above.


TABLE OF CONTENTS

F-24

CENTER BANCORP, INC. AND SUBSIDIARIES

NOTES TO CONSOLIDATED FINANCIAL STATEMENTS

Note 45 — Investment Securities  – (continued)

The following tables indicate gross unrealized losses not recognized in income and fair value, aggregated by investment category and the length of time individual securities have been in a continuous unrealized loss position at December 31, 20102013 and December 31, 2009:

2012:
      
 December 31, 2010
   Total Less Than 12 Months 12 Months or Longer
   Fair
Value
 Unrealized
Losses
 Fair
Value
 Unrealized
Losses
 Fair
Value
 Unrealized
Losses
   (Dollars in Thousands)
Available-for-Sale:
                              
U.S. Treasury and agency securities $6,995  $(128 $6,995  $(128 $  $ 
Federal agency obligations  35,799   (641  32,113   (622  3,686   (19
Mortgage-backed securities  166,820   (2,419  166,820   (2,419      
Obligations of U.S. states and political subdivisions  19,699   (1,088  19,699   (1,088      
Trust preferred securities  16,058   (2,517        16,058   (2,517
Corporate bonds and notes  61,434   (1,613  52,985   (1,175  8,449   (438
Collateralized mortgage obligations  2,728   (1,213        2,728   (1,213
Equity securities  4,653   (382  3,427   (73  1,226   (309
Total Temporarily Impaired Securities $314,186  $(10,001 $282,039  $(5,505 $32,147  $(4,496

      
 December 31, 2009
   Total Less than 12 Months 12 Months or Longer
   Fair
Value
 Unrealized
Losses
 Fair
Value
 Unrealized
Losses
 Fair
Value
 Unrealized
Losses
   (Dollars in Thousands)
Available-for-Sale:
                              
U.S. Treasury and agency securities                  
Federal agency obligations $72,801  $(1,845 $72,699  $(1,844 $102  $(1
Mortgage backed securities  47,703   (802  47,703   (802      
Obligations of U.S. states and political subdivisions  7,181   (484  6,297   (458  884   (26
Trust preferred securities  25,253   (7,802  3,717   (1,234  21,536   (6,568
Corporate bonds & notes  19,803   (1,101  11,864   (55  (7,939  (1,046
Collateralized mortgage obligations  3,012   (2,371        3,012   (2,371
Equity securities  1,317   (445        1,317   (445
Total temporarily impaired securities $177,070  $(14,850 $142,280  $(4,393 $34,790  $(10,457
  December 31, 2013 
  Total Less than 12 Months 12 Months or Longer 
  Fair
Value
 Unrealized
Losses
 Fair
Value
 Unrealized
Losses
 Fair
Value
 Unrealized
Losses
 
  (Dollars in Thousands) 
Investment Securities
    Available-for-Sale:
                   
U.S. Treasury and
    agency securities
 $13,519 $(825) $13,519 $(825) $ $ 
Federal agency obligation  17,200  (655)  17,200  (655)     
Residential mortgage
    pass-through securities
  18,293  (229)  18,293  (229)     
Commercial mortgage
    pass-through securities
  2,924  (157)  2,924  (157)     
Obligations of U.S. states and
    political subdivisions
  4,199  (55)  4,199  (55)     
Trust preferred securities  5,306  (510)  4,031  (211)  1,275  (299) 
Corporate bonds and notes  32,498  (482)  30,533  (448)  1,965  (34) 
Certificates of deposit  552  (20)  552  (20)     
Equity securities  287  (89)      287  (89) 
Other securities  985  (15)      985  (15) 
Total  95,763  (3,037)  91,251  (2,600)  4,512  (437) 
Investment Securities
    Held-to-Maturity:
                   
U.S. Treasury and agency
    securities
  27,037  (1,019)  27,037  (1,019)     
Federal agency obligation  13,492  (389)  13,197  (388)  295  (1) 
Residential mortgage
    pass-through securities
  2,182  (64)  2,182  (64)     
Commercial mortgage-backed
    securities
  1,395  (62)  1,395  (62)     
Obligations of U.S. states
    and political subdivisions
  66,034  (3,688)  57,072  (2,957)  8,962  (731) 
Corporate bonds and notes  27,210  (622)  27,210  (622)     
Total  137,350  (5,844)  128,093  (5,112)  9,257  (732) 
Total Temporarily Impaired
    Securities
 $233,113 $(8,881) $219,344 $(7,712) $13,769 $(1,169) 

F-25

CENTER BANCORP, INC. AND SUBSIDIARIES
NOTES TO CONSOLIDATED FINANCIAL STATEMENTS
Note 5 — Investment Securities  – (continued)
  December 31, 2012 
  Total Less than 12 Months 12 Months or Longer 
  Fair
Value
 Unrealized
Losses
 Fair
Value
 Unrealized
Losses
 Fair
Value
 Unrealized
Losses
 
  (Dollars in Thousands) 
Investment Securities
    Available-for-Sale:
                   
U.S. Treasury and agency
    securities
 $4,460 $(23) $4,460 $(23) $ $ 
Federal agency obligation  877  (5)  877  (5)     
Residential mortgage
    pass-through securities
  1,669  (1)  1,669  (1)     
Obligations of U.S. states
    and political subdivisions
  18,360  (132)  18,360  (132)     
Trust preferred securities  11,740  (1,174)  10,494  (18)  1,246  (1,156) 
Corporate bonds and notes  26,440  (371)  18,244  (134)  8,196  (237) 
Certificates of deposit  388  (10)  388  (10)     
Equity securities  325  (210)      325  (210) 
Other securities  985  (15)      985  (15) 
Total  65,244  (1,941)  54,492  (323)  10,752  (1,618) 
Investment Securities
    Held-to-Maturity:
                   
Commercial mortgage-backed
    securities
  932  (5)  932  (5)     
Total  932  (5)  932  (5)     
Total Temporarily Impaired
     Securities
 $66,176 $(1,946) $55,424 $(328) $10,752 $(1,618) 
Investment securities having a carrying value of approximately $125.6$109.3 million and $185.9$96.1 million at December 31, 20102013 and 2009,2012, respectively, were pledged to secure public deposits, short-term borrowings, and FHLB advances and for other purposes required or permitted by law.


TABLE OF CONTENTS

CENTER BANCORP, INC. AND SUBSIDIARIES

NOTES TO CONSOLIDATED FINANCIAL STATEMENTS

Note 5Note 6 — Loans and the Allowance for Loan Losses

The following table sets forth the composition of the Corporation’s loan portfolio including net deferred fees and costs, at December 31, 20102013 and 2009,2012, respectively:

  
 2010 2009
   (Dollars in Thousands)
Commercial and industrial $121,034  $117,912 
Commercial real estate  372,001   358,957 
Construction  49,744   51,099 
Residential mortgage  165,154   191,199 
Installment  511   439 
Total loans $708,444  $719,606 

Included in

  2013 2012 
  (Dollars in Thousands) 
Commercial and industrial $229,688 $181,682 
Commercial real estate  536,539  497,392 
Construction  42,722  40,277 
Residential mortgage  150,571  169,094 
Installment  1,084  1,104 
Subtotal  960,604  889,549 
Net deferred loan costs  339  123 
Total loans $960,943 $889,672 
F-26

CENTER BANCORP, INC. AND SUBSIDIARIES
NOTES TO CONSOLIDATED FINANCIAL STATEMENTS
Note 6 — Loans and the loan balances above are net deferred loan costs of $258,000 and $391,000 at December 31, 2010 and 2009, respectively.

Allowance for Loan Losses  – (continued)

At December 31, 20102013 and 2009,2012, loans to officers and directors aggregated approximately $5,456,000$20,365,000 and $9,006,000,$18,977,000, respectively. During the year ended December 31, 2010,2013, the Corporation made new loans to officers and directors in the amount of $197,000;$11,613,000; payments by such persons during 20102013 aggregated $3,748,000.

$10,225,000. During the year ended December 31, 2012, the Corporation made new loans to officers and directors in the amount of $13,952,000; payments by such persons during 2012 aggregated $5,254,000. On March 30, 2012, the Corporation appointed Frederick S. Fish to the Board of Directors. Mr. Fish had a prior lending relationship with the Bank, the total loan to Mr. Fish of approximately $9,910,000 is included in the amount of new loan to officers and directors.

Management is of the opinion that the above loans were made on the same terms and conditions as those prevailing for comparable transactions with non-related borrowers.

At December 31, 20102013 and 20092012, loan balances of approximately $435.9$564.7 million and $217.4$532.8 million were pledged to secure short term borrowings from the Federal Reserve Bank of New York and Federal Home Loan Bank Advances.

During the second quarter of 2010, the Corporation entered into a lease of its former operations facility under a direct financing lease. The lease has a 15 year term with no renewal options. According to the terms of the lease, the lessee has an obligation to purchase the property underlying the lease in either year seven (7), ten (10) or fifteen (15) at predetermined prices for those years as provided in the lease. The structure of the minimum lease payments and the purchase prices as provided in the lease provide an inducement to the lessee to purchase the property in year seven (7).

At December 31, 2010,2013 and 2012, the net investment in direct financing lease consists of a minimum lease receivable of $5,026,000$4,483,000 and $4,699,000, respectively, and unearned interest income of $1,317,000,$733,000 and $928,000, respectively, for a net investment in direct financing lease of $3,709,000.$3,750,000 and $3,771,000, respectively. The net investment in direct financing lease is carried as a component of loans in the Corporation’s consolidated statements of condition.

Minimum future lease receipts of the direct financing lease are as follows:

 
 (Dollars
in thousands)
For years ending December 31,
     
2011 $156 
2012  171 
2013  216 
2014  216 
2015  261 
Thereafter  2,689 
Total minimum future lease receipts $3,709 


TABLE OF CONTENTS

For years ending December 31, (Dollars in Thousands) 
2014 $216 
2015  228 
2016  265 
2017  265 
2018  265 
Thereafter  2,511 
Total minimum future lease receipts $3,750 

The following table presents information about loan receivables on non-accrual status at December 31, 2013 and 2012:
  2013 2012 
  (Dollars in Thousands)
Commercial and industrial $753 $214 
Commercial real estate  744  354 
Construction    319 
Residential mortgage  1,640  2,729 
Total loans receivable on non-accrual status $3,137 $3,616 
F-27

CENTER BANCORP, INC. AND SUBSIDIARIES

NOTES TO CONSOLIDATED FINANCIAL STATEMENTS

Note 56 — Loans and the Allowance for Loan Losses  – (continued)

The following table presents information about loan receivables on non accrual status at December 31, 2010:

Loans Receivable on Non Accrual Status

 
 December 31, 2010
   (Dollars in Thousands)
Commercial and Industrial $456 
Commercial Real Estate  3,563 
Construction  5,865 
Residential Mortgage  1,290 
Total loans receivable on non accrual status $11,174 

The Corporation continuously monitors the credit quality of its loans receivable. In addition to the internal staff, the Corporation utilizes the services of a third party loan review firm to rate the credit quality of its loans receivable. Credit quality is monitored by reviewing certain credit quality indicators. Assets classified “Pass” are deemed to possess average to superior credit quality, requiring no more than normal attention. Assets classified as “Special Mention” have generally acceptable credit quality yet possess higher risk characteristics/circumstances than satisfactory assets. Such conditions include strained liquidity, slow pay, stale financial statements, or other conditions that require more stringent attention from the lending staff. These conditions, if not corrected, may weaken the loan quality or inadequately protect the Corporation’s credit position at some future date. Assets are classified “Substandard” if the asset has a well defined weakness that requires management’s attention to a greater degree than for loans classified special mention. Such weakness, if left uncorrected, could possibly result in the compromised ability of the loan to perform to contractual requirements. An asset is classified as “Doubtful” if it is inadequately protected by the net worth and/or paying capacity of the obligor or of the collateral, if any, that secures the obligation. Assets classified as doubtful include assets for which there is a “distinct possibility” that a degree of loss will occur if the inadequacies are not corrected. All loans past due 90 days or more and all impaired loans are included in the appropriate category below. The following table presents information about the loan credit quality at December 31, 2010:

2013 and 2012:

Credit Quality Indicators

     
 December 31, 2010
   (Dollars in Thousands)
   Pass Special Mention Substandard Doubtful Total
Commercial and industrial $116,741  $1,929  $2,364  $  $121,034 
Commercial real estate  345,096   15,383   11,522      372,001 
Construction  43,879      3,588   2,277   49,744 
Residential mortgage  161,558      3,596      165,154 
Installment  511            511 
Total loans $667,785  $17,312  $21,070  $2,277  $708,444 


TABLE OF CONTENTS

  December 31, 2013 
  (Dollars in Thousands) 
  Pass Special
Mention
 Substandard Doubtful Total 
Commercial and industrial $226,013 $1,719 $1,284 $672 $229,688 
Commercial real estate  509,679  14,544  12,316    536,539 
Construction  41,492    1,230    42,722 
Residential mortgage  147,379  978  2,214    150,571 
Installment  964    120    1,084 
Total loans $925,527 $17,241 $17,164 $672 $960,604 

Credit Quality Indicators
  December 31, 2012 
  (Dollars in Thousands) 
  Pass Special
Mention
 Substandard Doubtful Total 
Commercial and industrial $176,818 $3,281 $1,583 $ $181,682 
Commercial real estate  462,266  18,945  16,181    497,392 
Construction  38,303  810  1,164    40,277 
Residential mortgage  163,769  993  4,332    169,094 
Installment  967    137    1,104 
Total loans $842,123 $24,029 $23,397 $ $889,549 
F-28

CENTER BANCORP, INC. AND SUBSIDIARIES

NOTES TO CONSOLIDATED FINANCIAL STATEMENTS

Note 56 — Loans and the Allowance for Loan Losses  – (continued)

The following table provides an analysis of the impaired loans at December 31, 2010:

Impaired2013 and 2012:

  December 31, 2013 
  (Dollars in Thousands) 
No Related Allowance Recorded Recorded
Investment
 Unpaid
Principal
Balance
 Related
Allowance
 Average
Recorded
Investment
 Interest
Income
Recognized
 
Commercial and industrial $449 $449 $ $494 $25 
Commercial real estate  10,482  10,783    10,658  496 
Residential mortgage  1,858  2,000    1,892  94 
Installment  120  120    128  6 
Total $12,909 $13,352 $ $13,172 $621 
With An Allowance Recorded Recorded
Investment
 Unpaid
Principal
Balance
 Related
Allowance
 Average
Recorded
Investment
 Interest
Income
Recognized
 
Commercial and industrial $672 $672 $300 $687 $43 
Commercial real estate  4,344  4,344  115  4,359  200 
Total $5,016 $5,016 $415 $5,046 $243 
Total                
Commercial and industrial $1,121 $1,121 $300 $1,181 $68 
Commercial real estate  14,826  15,127  115  15,017  696 
Residential mortgage  1,858  2,000    1,892  94 
Installment  120  120    128  6 
Total (including related
    allowance)
 $17,925 $18,368 $415 $18,218 $864 
  December 31, 2012 
  (Dollars in Thousands) 
No Related Allowance Recorded Recorded
Investment
 Unpaid
Principal
Balance
 Related
Allowance
 Average
Recorded
Investment
 Interest
Income
Recognized
 
Commercial and industrial $731 $731 $ $834 $46 
Commercial real estate  5,886  6,187    6,182  349 
Construction  3,600  3,600    3,600  92 
Residential mortgage  422  422    439  22 
Total $10,639 $10,940 $ $11,055 $509 
With An Allowance Recorded Recorded
Investment
 Unpaid
Principal
Balance
 Related
Allowance
 Average
Recorded
Investment
 Interest
Income
Recognized
 
Commercial real estate $4,180 $4,180 $493 $4,179 $138 
Residential mortgage  1,255  1,255  152  1,289  40 
Total $5,435 $5,435 $645 $5,468 $178 
Total                
Commercial and industrial $731 $731 $ $834 $46 
Commercial real estate  10,066  10,367  493  10,361  487 
Construction  3,600  3,600    3,600  92 
Residential mortgage  1,677  1,677  152  1,728  62 
Total (including related
    allowance)
 $16,074 $16,375 $645 $16,523 $687 
F-29

CENTER BANCORP, INC. AND SUBSIDIARIES
NOTES TO CONSOLIDATED FINANCIAL STATEMENTS
Note 6 — Loans

     
 December 31, 2010
   (Dollars in Thousands)
No Related Allowance Recorded Recorded
Investment
 Unpaid
Principal
Balance
 Related
Allowance
 Average
Recorded
Investment
 Interest
Income
Recognized
Commercial and industrial $1,364  $1,908  $  $1,933  $87 
Commercial real estate  3,984   4,625      4,274   78 
Construction  5,865   8,642      6,855   112 
Residential mortgage  1,462   1,765      1,711   27 
Total $12,675  $16,940  $  $14,773  $304 

     
With An Allowance Recorded Recorded
Investment
 Unpaid
Principal
Balance
 Related
Allowance
 Average
Recorded
Investment
 Interest
Income
Recognized
Commercial real estate $4,180  $4,180  $618  $4,181  $204 
Residential mortgage  1,354   1,354   21   1,356   76 
Total $5,534  $5,534  $639  $5,537  $280 

     
Total
     
Commercial and industrial $1,364  $1,908  $  $1,933  $87 
Commercial real estate  8,164   8,805   618   8,455   282 
Construction  5,865   8,642      6,855   112 
Residential mortgage  2,816   3,119   21   3,067   103 
Total (including related allowance) $18,209  $22,474  $639  $20,310  $584 

The Corporation defines an impaired loan as a loan and the Allowance for which it is probable, based on information available at the determination date, that the Corporation will not collect all amounts due under the contractual terms of the loan. At December 31, 2010 impaired loans were primarily collateral dependent, and totaled $18.2 million. Specific allowance for loan loss of $639,000 was assigned to impaired loans of $5.5 million. Loans in the amount of $12.7 million had no specific allowance allocation.

Loan Losses  – (continued)

Loans are considered to have been modified in a troubled debt restructuring when due to a borrower’s financial difficulties, the Corporation makes certain concessions to the borrower that it would not otherwise consider. Modifications may include interest rate reductions, principal or interest forgiveness, forbearance, and other actions intended to minimize economic loss and to avoid foreclosure or repossession of collateral. Generally, a non-accrual loan that has been modified in a troubled debt restructuring remains on non-accrual status for a period of six months to demonstrate that the borrower is able to meet the terms of the modified loan. However, performance prior to the modification, or significant events that coincide with the modification, are included in assessing whether the borrower can meet the new terms and may result in the loan being returned to accrual status at the time of loan modification or after a shorter performance period. If the borrower’s ability to meet the revised payment schedule is uncertain, the loan remains on non-accrual status. Included in impaired loans at December 31, 20102013 are $7.0 million in loans that are deemed troubled debt restructurings. TheseOf these loans, $5.7 million or87.4% at December 31,2013 and $6.2 million or91.0% at December 31,2012, of which are included in the tables above, are performing under the restructured terms and are accruing interest.


TABLE OF CONTENTS

F-30

CENTER BANCORP, INC. AND SUBSIDIARIES

NOTES TO CONSOLIDATED FINANCIAL STATEMENTS

Note 56 — Loans and the Allowance for Loan Losses  – (continued)

The following table provides an analysis of the ageaging of loans, excluding deferred fees and costs, that are past due at December 31, 2010:

2013 and 2012:

Aging Analysis

       
 December 31, 2010
   (Dollars in Thousands)
   30 – 59 Days
Past Due
 60 – 89 Days
Past Due
 Greater
Than
90 Days
 Total
Past Due
 Current Total Loans
Receivable
 Loans
Receivable >
90 Days And
Accruing
Commercial and Industrial $1,509  $476  $456  $2,441  $118,593  $121,034  $ 
Commercial Real Estate  4,290   2,229   3,563   10,082   361,919   372,001    
Construction  170   449   5,865   6,484   43,260   49,744    
Residential Mortgage  1,814   309   2,004   4,127   161,027   165,154   714 
Installment  9         9   502   511    
Total $7,792  $3,463  $11,888  $23,143  $685,301  $708,444  $714 

  December 31, 2013 
  (Dollars in Thousands) 
  30 – 59
Days
Past Due
 60 – 89
Days
Past Due
 Greater
Than
90 Days
 Total
Past Due
 Current Total
Loans
Receivable
 Loans
Receivable
> 90 Days
And
Accruing
 
Commercial and
    Industrial
 $18 $ $753 $771 $228,917 $229,688 $ 
Commercial Real
    Estate
  221    744  965  535,574  536,539   
Construction          42,722  42,722   
Residential
    Mortgage
  990  258  1,640  2,888  147,683  150,571   
Installment  5      5  1,079  1,084   
Total $1,234 $258 $3,137 $4,629 $955,975 $960,604 $ 
Aging Analysis
  December 31, 2012 
  (Dollars in Thousands) 
  30 – 59
Days
Past Due
 60 – 89
Days
Past Due
 Greater
Than
90 Days
 Total
Past Due
 Current Total
Loans
Receivable
 Loans
Receivable
> 90 Days
And
Accruing
 
Commercial and
    Industrial
 $590 $  216  806 $180,876 $181,682 $ 
Commercial Real
    Estate
  1,012  703  354  2,069  495,323  497,392   
Construction      319  319  39,958  40,277   
Residential
    Mortgage
  2,017  628  2,784  5,429  163,665  169,094  55 
Installment  23      23  1,081  1,104   
Total $3,642 $1,331 $3,673 $8,646 $880,903 $889,549 $55 
F-31

CENTER BANCORP, INC. AND SUBSIDIARIES
NOTES TO CONSOLIDATED FINANCIAL STATEMENTS
Note 6 — Loans and the Allowance for Loan Losses  – (continued)
The following table details the amount of loans receivable that are evaluated individually, and collectively, for impairment, and the related portion of the allowance for loan loss that is allocated to each loan portfolio segment:

Allowance for loan and lease losses

       
 December 31, 2010
   (Dollars in Thousands)
   C & I Comm R/E Construction Res Mtge Installment Unallocated Total
Allowance for loan and
lease losses:
                              
Individually evaluated for impairment $  $618  $  $21  $  $  $639 
Collectively evaluated for impairment  1,272   5,097   551   1,017   52   239   8,228 
Total $1,272  $5,715  $551  $1,038  $52  $239  $8,867 
Loans Receivable
                                   
Individually evaluated for impairment $2,748  $11,960  $5,865  $1,354  $  $  $21,927 
Collectively evaluated for impairment  118,286   360,041   43,879   163,800   511      686,517 
Total $121,034  $372,001  $49,744  $165,154  $511  $  $708,444 

  December 31, 2013
(Dollars in Thousands)
 
  C & I Comm R/E Construction Res Mtge Installment Unallocated Total 
Allowance for
    loan and lease
    losses:
                      
Individually
    evaluated for
    impairment
 $300 $115 $ $ $ $ $415 
Collectively
    evaluated for
    impairment
  1,398  5,631  362  990  146  1,391  9,918 
Total $1,698 $5,746 $362 $990 $146 $1,391 $10,333 
Loans Receivable                      
Individually
    evaluated for
    impairment
 $1,121 $14,826 $ $1,858 $120 $ $17,925 
Collectively
    evaluated for
    impairment
  226,450  505,361  41,493  135,031  839    909,174 
Loans acquired
    with discounts
    related to credit
    quality
  2,117  16,352  1,229  13,682  125    33,505 
Total $229,688 $536,539 $42,722 $150,571 $1,084 $ $960,604 
Allowance for loan and lease losses
  December 31, 2012
(Dollars in Thousands)
 
  C & I Comm R/E Construction Res Mtge Installment Unallocated Total 
Allowance for
    loan and lease
    losses:
                      
Individually
    evaluated for
    impairment
 $ $493 $ $152 $ $ $645 
Collectively
    evaluated for
    impairment
  2,419  4,719  313  1,376  114  651  9,592 
Total $2,419 $5,212 $313 $1,528 $114 $651 $10,237 
Loans Receivable                      
Individually
    evaluated for
    impairment
 $731 $10,066 $3,600 $1,677 $ $ $16,074 
Collectively
    evaluated for
    impairment
  176,913  466,411  34,572  146,508  973    825,377 
Loans acquired
    with discounts
    related to credit
    quality
  4,038  20,915  2,105  20,909  131    48,098 
Total $181,682 $497,392 $40,277 $169,094 $1,104 $ $889,549 
The Corporation’s allowance for loan losses is analyzed quarterly and many factors are considered, including growth in the portfolio, delinquencies, nonaccrual loan levels, and other factors inherent in the extension of credit. There have been no material changes to the allowance for loan loss methodology as disclosed in the Corporation’s previous Annual Reports.


TABLE OF CONTENTS

F-32

CENTER BANCORP, INC. AND SUBSIDIARIES

NOTES TO CONSOLIDATED FINANCIAL STATEMENTS

Note 56 — Loans and the Allowance for Loan Losses  – (continued)

A summary of the activity in the allowance for loan losses is as follows:

   
 2010 2009 2008
   (Dollars in Thousands)
Balance at the beginning of year $8,711  $6,254  $5,163 
Provision for loan losses  5,076   4,597   1,561 
Loans charged-off  (4,940  (2,152  (499
Recoveries on loans previously charged-off  20   12   29 
Balance at the end of year $8,867  $8,711  $6,254 

  Year Ended December 31, 2013 
  (Dollars in thousands) 
  C & I Comm R/E Construction Res Mtg Installment Unallocated Total 
Balance at January 1, $2,424 $5,323 $313 $1,532 $113 $532 $10,237 
Loans charged-off  (6)  (126)    (175)  (22)    (329) 
Recoveries  41  28      6    75 
Provision for loan losses  (761)  521  49  (367)  49  859  350 
Balance at December 31, $1,698 $5,746 $362 $990 $146 $1,391 $10,333 
  Year Ended December 31, 2012 
  (Dollars in thousands) 
  C & I Comm R/E Construction Res Mtg Installment Unallocated Total 
Balance at January 1, $1,527 $5,972 $707 $1,263 $51 $82 $9,602 
Loans charged-off    (57)    (454)  (16)    (527) 
Recoveries    80  540  210  7    837 
Provision for loan losses  892  (783)  (934)  509  72  569  325 
Balance at December 31, $2,419 $5,212 $313 $1,528 $114 $651 $10,237 
  For the Year Ended December 31, 
  2013 2012 2011 
  (Dollars in Thousands) 
Balance at the beginning of year $10,237 $9,602 $8,867 
Provision for loan losses  350  325  2,448 
Loans charged-off  (329)  (527)  (2,028) 
Recoveries on loans previously charged-off  75  837  315 
Balance at the end of year $10,333 $10,237 $9,602 
The amount of interest income that would have been recorded on non-accrual loans in 2010, 20092013, 2012 and 20082011 had payments remained in accordance with the original contractual terms was $598,000, $431,000$104,000, $187,000 and $37,000,$378,000, respectively.

At December 31, 2010, total impaired loans were approximately $18,209,000 as compared to $12,211,000 at December 31, 2009. The amount of related valuation allowances was $639,000 at December 31, 2010 and $1,565,000 at December 31, 2009. Impaired loans with a specific reserve of $639,000 amounted to $5,534,000 while $12,675,000 of impaired loans had no specific reserves. At December 31, 2009, the amount of impaired loans with specific reserves was $6,756,000 while $5,455,000 of impaired loans had no specific reserves. The Corporation’s total average impaired loans were $20,310,000 during 2010, $6,253,000 during 2009, and $525,000 during 2008.

At December 31, 2010,2013, there were no commitments to lend additional funds to borrowers whose loans were non-accrual or contractually past due in excess of 90 days and still accruing interest.

interest, or whose terms have been modified in troubled debt restructurings.

The policy of the Corporation is to generally grant commercial, mortgage and installment loans to New Jersey residents and businesses within its market area. The borrowers’ abilities to repay their obligations are dependent upon various factors including the borrowers’ income and net worth, cash flows generated by the borrowers’ underlying collateral, value of the underlying collateral, and priority of the Bank’slender’s lien on the property. Such factors are dependent upon various economic conditions and individual circumstances beyond the control of the Corporation. The Corporation is therefore subject to risk of loss. The Corporation believes its lending policies and procedures adequately minimize the potential exposure to such risks and that adequate provisions for loan losses are provided for all known and inherent risks. Collateral and/or personal guarantees are required for virtually alla large majority of the Corporation’s loans.

F-33

CENTER BANCORP, INC. AND SUBSIDIARIES
NOTES TO CONSOLIDATED FINANCIAL STATEMENTS
Note 6 — Loans and the Allowance for Loan Losses  – (continued)
The following tables present information about the troubled debt restructurings (TDRs) by class transacted during the period indicated:
Year Ended December 31, 2013
Number of
Loans
Pre-restructuring
Outstanding
Recorded
Investment
Post-restructuring
Outstanding
Recorded
Investment
(Dollars in Thousands)
Troubled debt restructurings:
Commercial Real Estate$$
Residential Mortgage
Installment
Total$$
  Year Ended December 31, 2012 
  Number of
Loans
 Pre-restructuring
Outstanding
Recorded
Investment
 Post-restructuring
Outstanding
Recorded
Investment
 
  (Dollars in Thousands) 
Troubled debt restructurings:          
Commercial Real Estate  1 $225 $225 
Residential Mortgage  1  714  675 
Installment  1  1,354  1,354 
Total  3 $2,293 $2,254 
The Corporation had no loans charged off in connection with loan modifications at the time of the modification during the twelve months ended December 31, 2013 and 2012.
The Corporation had no loan modified as a TDR within the previous twelve months that subsequently defaulted during the twelve months ended December 31, 2013. The Corporation had one loan that defaulted during the twelve months ended December 31, 2012 that had previously been modified as a TDR within the previous twelve months.
ASU No. 2011-02 provides guidance to creditors for evaluating whether a modification or restructuring of a receivable is a troubled debt restructuring. In general, a modification or restructuring of a loan constitutes a TDR if the Corporation grants a concession to a borrower experiencing financial difficulty. Loans modified in TDRs are placed on non-accrual status until the Corporation determines that future collection of principal and interest is reasonably assured, which generally requires that the borrower demonstrate performance according to the restructured terms for a period of at least six months. However, performance prior to the modification, or significant events that coincide with the modification, are included in assessing whether the borrower can meet the new terms and may result in the loan being returned to accrual status at the time of loan modification or after a shorter performance period. If the borrower’s ability to meet the revised payment schedule is uncertain, the loan remains on non-accrual status.
Loans modified in a troubled debt restructuring totaled $6.6 million at December 31, 2013 of which $826,000 were on non-accrual status. The remaining loans modified were current at the time of the restructuring and have complied with the terms of their restructure agreement.
In an effort to proactively manage delinquent loans, the Corporation has selectively extended to certain borrowers concessions such as rate reductions, extension of maturity dates, principal or interest forgiveness, adjusted repayment terms, forbearance agreements, or combinations of two or more of these concessions. As of December 31, 2013, loans on which concessions were made with respect to adjusted repayment terms amounted to $1.5 million. Loans on which combinations of two or more concessions were made amounted to $5.1 million. The concessions granted included principal concessions, rate reduction, adjusted repayment, extended maturity and payment deferral.
F-34

CENTER BANCORP, INC. AND SUBSIDIARIES
NOTES TO CONSOLIDATED FINANCIAL STATEMENTS
Note 7 — Premises and Equipment

Premises and equipment are summarized as follows:

   
 Estimated
Useful Life
(Years)
 2010 2009
   (Dollars in Thousands)
Land      $2,403  $3,447 
Buildings  5 – 40   12,656   16,200 
Furniture, fixtures and equipment  2 – 20   15,929   16,222 
Leasehold improvements  5 – 30   1,839   1,839 
Subtotal       32,827   37,708 
Less: accumulated depreciation and amortization     19,890   19,848 
Total premises and equipment, net    $12,937  $17,860 

  Estimated       
  Useful Life       
  (Years) 2013 2012 
  (Dollars in Thousands) 
Land  $2,403 $2,403 
Buildings 5 – 40  13,675  13,434 
Furniture, fixtures and equipment 2 – 20  17,604  17,226 
Leasehold improvements 5 – 30  3,184  2,900 
Subtotal    36,866  35,963 
Less: accumulated depreciation and
     amortization
    23,185  22,400 
Total premises and equipment, net   $13,681 $13,563 
Depreciation and amortization expense of premises and equipment for the three years ended December 31, amounted to $1,096,000$855,000 in 2010, $1,369,0002013, $868,000 in 20092012 and $1,738,000$926,000 in 2008, respectively.

2011.


TABLE OF CONTENTS

CENTER BANCORP, INC. AND SUBSIDIARIES

NOTES TO CONSOLIDATED FINANCIAL STATEMENTS

Note 78 — Goodwill and Other Intangible Assets

A goodwill impairment test is required under ASC 350, Intangibles – Goodwill

and Other, and the FASB issued ASU No. 2011-08, “Testing Goodwill for Impairment,” allowing an initial qualitative assessment of goodwill commonly known as step zero impairment testing. In general, the step zero test allows an entity to first assess qualitative factors to determine whether it is more likely than not (i.e., more than 50%) that the fair value of a reporting unit is less than its carrying value. If a step zero impairment test results in the conclusion that it is more likely than not that the fair value of the reporting unit exceeds its carrying value, then no further testing is required.

While step zero impairment testing is an assessment of qualitative factors that affect the likelihood of impairment. Based upon management’s review, the Corporation’s intangible assets were not impaired and there has been no impairment through December 31, 2013. Management concludes that the ASC 350 goodwill step zero test has been passed, and no further testing is required.
Goodwill
Goodwill allocated to the Corporation as of December 31, 20102013 and 20092012 was $16,804,000.$16,804,000. There were no changes in the carrying amount of goodwill during the fiscal years ended December 31, 20102013 and 2009.

2012.

The table below provides information regarding the carrying amounts and accumulated amortization of amortized intangible assets as of the dates set forth below.

   
 Gross
Carrying
Amount
 Accumulated
Amortization
 Net
Carrying
Amount
   (Dollars in Thousands)
As of December 31, 2010:
               
Core deposits $703  $(548 $155 
Total intangible assets  703   (548  155 
As of December 31, 2009:
               
Core deposits $703  $(479 $224 
Total intangible assets  703   (479  224 

  Gross
Carrying
Amount
 Accumulated
Amortization
 Net
Carrying
Amount
 
  (Dollars in Thousands) 
As of December 31, 2013:          
Core deposits $703 $(679) $24 
Total intangible assets  703  (679)  24 
As of December 31, 2012:          
Core deposits $703 $(649) $54 
Total intangible assets  703  (649)  54 
The current year and estimated future amortization expense for amortized intangible assets was $69,000$30,000 for 20102013 and $56,000, $44,000, $31,000, $18,000$19,000, and $5,000,$5,000, respectively, for the subsequent five-year periods of 2011, 2012, 2013, 2014 and 2015.

F-35

CENTER BANCORP, INC. AND SUBSIDIARIES
NOTES TO CONSOLIDATED FINANCIAL STATEMENTS
Note 89 — Deposits

Time Deposits
As of December 31, 2013 and 2012, the Corporation's total time deposits were $152.0 million and $170.9 million, respectively. As of December 31, 2013, the contractual maturities of these time deposits were as follows:
(dollars in thousands) Amount 
2014 $102,106 
2015  25,672 
2016  19,765 
2017  4,376 
2018  34 
Thereafter   
Total $151,953 
The table below provides information regarding the aggregate amount and maturity of time certificates of depositdeposits with balances of $100,000 or more was $99.4 million and $110.8 million as of December 31, 2010.

2013 and 2012, respectively. As of December 31, 2013, the contractual maturities of these time deposits were as follows:
 
 Amount
   (Dollars in Thousands)
Due in one year or less $107,115 
Due in 2012  9,783 
Due in 2013  2,753 
Due in 2014   
Total certificates of deposit $100,000 or more $119,651 

(dollars in thousands) Amount 
Three Months or Less $15,301 
Over Three Months through Six Months  28,401 
Over Six Months through Twelve Months  18,771 
Over Twelve Months  36,971 
Total $99,444 

Note 910 — Borrowed Funds:

Short-term borrowings at December 31, 2010 and 2009 consisted of the following:

  
 2010 2009
   (Dollars in Thousands)
Securities sold under agreements to repurchase $28,855  $46,109 
Federal funds purchased and FHLB short-term advances  13,000    
Total short-term borrowings $41,855  $46,109 

The weighted average interest rates for short-term borrowings at December 31, 2010 and 2009 were 0.27 percent and 0.97 percent, respectively.


TABLE OF CONTENTS

CENTER BANCORP, INC. AND SUBSIDIARIES

NOTES TO CONSOLIDATED FINANCIAL STATEMENTS

Note 9 — Borrowed Funds:  – (continued)

Long-term borrowings at December 31, 20102013 and 20092012 consisted of the following:

  
 2010 2009
   (Dollars in Thousands)
FHLB long-term advances $130,000  $170,144 
Securities sold under agreements to repurchase  41,000   53,000 
Total long-term borrowings $171,000  $223,144 

  2013 2012 
  (Dollars in Thousands) 
FHLB long-term advances $115,000 $115,000 
Securities sold under agreements to repurchase  31,000  31,000 
Total long-term borrowings $146,000 $146,000 
Securities sold under agreements to repurchase had average balances of $86.1$31.0 million and $87.9$38.2 million for the years ended December 31, 20102013 and 2009,2012, respectively. The maximum amount outstanding at any month end during 20102013 and 20092012 was $95.9$31.0 million and $111.5$41.0 million, respectively. The average interest rate paid on securities sold under agreements to repurchase were 2.975.99 percent,5.54 percent and 3.523.39 percent for the years ended December 31, 20102013, 2012 and 2009,2011, respectively. Overnight federal funds purchased averaged $0.4 million during 2010 as compared to $0.5 million during 2009.

F-36

CENTER BANCORP, INC. AND SUBSIDIARIES
NOTES TO CONSOLIDATED FINANCIAL STATEMENTS
Note 10 — Borrowed Funds:  – (continued)
The weighted average interest rates on long term borrowings at December 31, 20102013 and 20092012 were 4.023.82 percent and 4.363.97 percent, respectively. The maximum amount outstanding at any month-end during 20102013 and 20092012 was $223.1 million and $223.3 million, respectively.$161.0 million. The average interest rates paid on Federal Home Loan Bank advances were 3.953.46 percent and 4.093.51 percent for the years ended December 31, 20102013 and 2009, respectively.

2012, respectively. The maximum borrowing capacity with the Federal Home Loan Bank is limited to25 percent of the Corporation’s total assets.

At December 31, 20102013 and 2009,2012, advances from the Federal Home Loan Bank of New York (“FHLB”) amounted to $130.0 million and $170.1 million, respectively.$115.0 million. The FHLB advances had a weighted average interest rate of 3.613.26 percent and 4.093.44 percent at December 31, 20102013 and 2009,2012, respectively. These advances are secured by pledges of FHLB stock, 1 – 4 family residential mortgages, commercial real estate mortgages and U.S. Government and Federal Agency obligations. The advances are subject to quarterly call provisions at the discretion of the FHLB and at December 31, 20102013 and 2009,2012, are contractually scheduled for repayment as follows:

  
(Dollars in Thousands) 2010 2009
2010 $  $40,144 
2011  10,000   10,000 
2013  5,000   5,000 
2016  20,000   20,000 
2017  55,000   55,000 
2018  40,000   40,000 
Total $130,000   170,144 

  2013 2012 
        
  (Dollars in Thousands) 
2016 $ $20,000 
2017  35,000  55,000 
2018  40,000  40,000 
2020  40,000   
Total $115,000 $115,000 
The securities sold under repurchase agreements to other counterparties included in long-term debt totaled $41.0$31.0 million at December 31, 20102013 and $53.0 million2012. The weighted average rates were5.90 percent at December 31, 2009. The weighted average rate at December 31, 20102013 and 2009 was 5.31 percent and 5.23 percent, respectively.2012. The schedule for contractual repayment is as follows:

  
(Dollars in Thousands) 2010 2009
2011 $  $12,000 
2015  10,000   10,000 
2017  15,000   15,000 
2018  16,000   16,000 
Total $41,000  $53,000 


TABLE OF CONTENTS

CENTER BANCORP, INC. AND SUBSIDIARIES

NOTES TO CONSOLIDATED FINANCIAL STATEMENTS

Note 10
  2013 2012 
  (Dollars in Thousands)
2017 $15,000 $15,000 
2018  16,000  16,000 
Total $31,000 $31,000 


Note 11 — Subordinated Debentures:

During 2003, the Corporation formed a statutory business trust, which exists for the exclusive purpose of (i) issuing Trust Securities representing undivided beneficial interests in the assets of the Trust; (ii) investing the gross proceeds of the Trust securities in junior subordinated deferrable interest debentures (subordinated debentures) of the Corporation; and (iii) engaging in only those activities necessary or incidental thereto. These subordinated debentures and the related income effects are not eliminated in the consolidated financial statements as the statutory business trust is not consolidated in accordance with FASB ASC 810-10 (previously FASB Interpretation No. 46(R) “Consolidation of Variable Interest Entities”).810-10. Distributions on the subordinated debentures owned by the subsidiary trusts belowtrust have been classified as interest expense in the Consolidated Statements of Income.

F-37

CENTER BANCORP, INC. AND SUBSIDIARIES
NOTES TO CONSOLIDATED FINANCIAL STATEMENTS
Note 11 — Subordinated Debentures:  – (continued)
The following table summarizes the mandatory redeemable trust preferred securities of the Corporation’s Statutory Trust II at December 31, 2010.

2013 and 2012.
Issuance DateSecurities IssuedLiquidation ValueCoupon RateMaturityRedeemable by
Issuer Beginning
12/19/03$5,000,000$1,000 per
Capital
Security
Floating
3-month
LIBOR + 285
Basis Points
01/23/203401/23/2009

Issuance Date Securities
Issued
 Liquidation Value Coupon Rate Maturity Redeemable by
Issuer Beginning
 
12/19/2003 $5,000,000 $1,000 per Capital Security Floating 3-month LIBOR + 285 Basis Points 01/23/2034 01/23/2009 

Note 1112 — Income Taxes

The current and deferred amounts of income tax expense for the years ended December 31, 2010, 20092013, 2012 and 2008,2011, respectively, are as follows:

   
 2010 2009 2008
   (Dollars in Thousands)
Current:
               
Federal $(27 $(19 $104 
State  198   146   242 
Subtotal  171   127   346 
Deferred:
               
Federal  (191  824   1,184 
State  242   (5  37 
Subtotal  51   819   1,221 
Income tax expense $222  $946  $1,567 

  2013 2012 2011 
  (Dollars in Thousands) 
Current:          
Federal $5,658 $5,506 $3,818 
State  87  259  187 
Subtotal  5,745  5,765  4,005 
Deferred:          
Federal  1,906  1,085  2,157 
State  (167)  827  1,249 
Subtotal  1,739  1,912  3,406 
Income tax expense $7,484 $7,677 $7,411 
Reconciliation between the amount of reported income tax expense and the amount computed by applying the statutory Federal income tax rate is as follows:

   
 2010 2009 2008
   (Dollars in Thousands)
Income before income tax expense $7,226  $4,717  $7,409 
Federal statutory rate  34  34  34
Computed “expected” Federal income tax expense  2,457   1,604   2,519 
State tax, net of Federal tax benefit  291   93   184 
Bank owned life insurance  (417  (393  (409
Tax-exempt interest and dividends  (75  (334  (798
Tax on Bank Owned Life Insurance policy surrender gain  539       
Reversal of unrealized tax benefit & interest  (2,551      
Other, net  (22  (24  71 
Income tax expense $222  $946  $1,567 


TABLE OF CONTENTS

  2013  2012  2011 
  (Dollars in Thousands) 
Income before income tax expense $27,409  $25,184  $21,337 
Federal statutory rate  35%  35%  35%
Computed “expected” Federal income tax
    expense
  9,593   8,814   7,468 
State tax, net of Federal tax benefit  (53)   706   933 
Bank owned life insurance  (477)   (356)   (363) 
Tax-exempt interest and dividends  (1,645)   (1,228)   (595) 
Bargain gain on Saddle River Valley Bank
    acquisition
     (314)    
Other, net  66   55   (32) 
Income tax $7,484  $7,677  $7,411 

F-38

CENTER BANCORP, INC. AND SUBSIDIARIES

NOTES TO CONSOLIDATED FINANCIAL STATEMENTS

Note 1112 — Income Taxes  – (continued)

The decreased tax rate resulted in part from the measurement and reassessment of the technical merits which led the Corporation to conclude that its position of the recognition of $2.6 million on a previously unrecognized tax benefit was sustainable. This in turn resulted in recognition of tax benefits previously unrecognized due to changes in the Corporation’s business entity structure during 2007 and into 2008 offset by a higher proportion of taxable income versus tax-exempt income in 2010 versus 2009. The decreased tax rate benefit was offset, in part, due to the surrender of Bank Owned Life Insurance Policies resulting in a $633,000 in income tax expense in 2010.

The tax effects of temporary differences that give rise to significant portions of the deferred tax asset and deferred tax liability at December 31, 20102013 and 20092012 are presented onin the next page:

following table:
  
 2010 2009
   (Dollars in Thousands)
Deferred tax assets:
          
Impaired assets $2,621  $1,661 
Allowance for loan losses  3,358   3,296 
Employee benefit plans  59   54 
Unrealized loss on securities available-for-sale and tax benefits related to FASB ASC 715-10  5,028   7,088 
Other  656   507 
Federal NOL and AMT Credits  3,874   4,777 
NJ NOL and AMA credits  1,471   1,866 
Total deferred tax assets $17,067  $19,249 
Deferred tax liabilities:
          
Depreciation $298  $243 
Market discount accretion  29   61 
Deferred loan costs, net of fees  435   502 
Purchase accounting  62   89 
Total deferred tax liabilities  824   895 
Net deferred tax asset $16,243  $18,354 

  2013 2012 
  (Dollars in Thousands) 
Deferred tax assets:       
Impaired assets $1,221 $1,967 
Allowance for loan losses  4,118  4,040 
Employee benefit plans    64 
Pension actuarial losses  2,206  2,473 
Other  466  454 
NJ NOL  399   
NJ AMA credits  137  131 
Total deferred tax assets $8,547 $9,129 
Deferred tax liabilities:       
Employee benefit plans $1,281 $ 
Depreciation  416  294 
Market discount accretion  200  148 
Deferred loan costs, net of fees  385  330 
Purchase accounting  522  608 
Unrealized gains on securities available-for-sale  547  5,675 
Total deferred tax liabilities  3,351  7,055 
Net deferred tax asset $5,196 $2,074 
Based on the Corporation’s historical and current taxable income and the projected future taxable income, management believes it is more likely than not that the Corporation will realize the benefit of the net deductible temporary differences existing at December 31, 20102013 and 2009,2012, respectively.

At December 31, 2010,2013, the Corporation has no federal income tax loss carry forwards, and hasapproximately $6.8 million state income tax loss carry forwards of approximately $21.2 million, which have expirations beginningexpire in the year 2013.

2033.

In assessing the realization of deferred tax assets, management considers whether it is more likely than not that some portion or all of the deferred tax assets will not be realized. The ultimate realization of deferred tax assets is dependantdependent upon the generation of future taxable income during periods in which those temporary differences become deductible. Management considers the scheduled reversal of deferred tax liabilities, the projected future taxable income, and tax planning strategies in making this assessment. During 20102013 and 2009,2012, based on the level of historical taxable income and projections for future taxable income over the periods in which the deferred tax assets are deductible, the Corporation believes the net deferred tax assets are more likely than not to be realized.

The Corporation’s federal income tax returns are open and subject to examination from the 20072010 tax return year and forward. The Corporation’s state income tax returns are generally open from the 20072009 and later tax return years based on individual state statutestatutes of limitations.


TABLE OF CONTENTS

F-39

CENTER BANCORP, INC. AND SUBSIDIARIES

NOTES TO CONSOLIDATED FINANCIAL STATEMENTS

Note 1213 — Commitments, Contingencies and Concentrations of Credit Risk

In the normal course of business, the Corporation has outstanding commitments and contingent liabilities, such as standby and commercial letters of credit, unused portions of lines of credit and commitments to extend various types of credit. Commitments to extend credit and standby letters of credit generally do not exceed one year.

These financial instruments involve, to varying degrees, elements of credit risk in excess of the amounts recognized in the consolidated financial statements. The commitment or contract amount of these financial instruments is an indicator of the Corporation’s level of involvement in each type of instrument as well as the exposure to credit loss in the event of non-performance by the other party to the financial instrument.

The Corporation controls the credit risk of these financial instruments through credit approvals, limits and monitoring procedures. To minimize potential credit risk, the Corporation generally requires collateral and other credit-related terms and conditions from the customer. In the opinion of management, the financial condition of the Corporation will not be materially affected by the final outcome of these commitments and contingent liabilities.

A substantial portion of the Bank’s loans isare secured by real estate located in New Jersey. Accordingly, the collectability of a substantial portion of the loan portfolio of the Bank is susceptible to changes in the New Jersey real estate market.

The following table provides a summary of financial instruments with off-balance sheet risk at December 31, 20102013 and 2009:

2012:
  
 2010 2009
   (Dollars in Thousands)
Commitments under commercial loans and lines of credit $77,786  $70,076 
Home equity and other revolving lines of credit  50,131   54,572 
Outstanding commercial mortgage loan commitments  32,554   33,659 
Standby letters of credit  2,225   1,676 
Performance letters of credit  12,019   11,466 
Outstanding residential mortgage loan commitments  250   4,153 
Overdraft protection lines  4,898   5,058 
Other consumer     11 
Total $179,863  $180,671 

Other expenses include

  2013 2012 
  (Dollars in Thousands) 
Commitments under commercial loans and lines of credit $109,661 $129,797 
Home equity and other revolving lines of credit  41,836  46,795 
Outstanding commercial mortgage loan commitments  48,129  30,955 
Standby letters of credit  9,655  1,700 
Performance letters of credit  21,844  27,743 
Outstanding residential mortgage loan commitments  1,858  2,207 
Overdraft protection lines  5,273  5,666 
Total $238,256 $244,863 
Occupancy and equipment expense includes rentals for premises and equipment of $692,000$1,094,000 in 2010, $704,0002013, $805,000 in 20092012 and $1,092,000$710,000 in 2008.2011. At December 31, 2010,2013, the Corporation was obligated under a number of non-cancelable leases for premises and equipment, many of which provide for increased rentals based upon increases in real estate taxes and the cost of living index. These leases, most of which have renewal provisions, are principally operating leases. Minimum rentals under the terms of these leases for the years 20112014 through 20152018 are $607,000, $625,000, $500,000,$920,000, $932,000, $803,000, $796,000 and $533,000 and 538,000,$803,000, respectively. Minimum rentals due 20162019 and after are $4,319,000.

$7,289,000.

The Corporation is subject to claims and lawsuits that arise in the ordinary course of business. Based upon the information currently available in connection with such claims, it is the opinion of management that the disposition or ultimate determination of such claims will not have a material adverse impact on the consolidated financial position, results of operations, or liquidity of the Corporation.


TABLE OF CONTENTS

CENTER BANCORP, INC. AND SUBSIDIARIES

NOTES TO CONSOLIDATED FINANCIAL STATEMENTS

Note 1314 — Stockholders’ Equity and Regulatory Requirements

On January 12, 2009, the Corporation issued $10$10 million in nonvoting senior preferred stock to the U.S. Department of Treasury under the Capital Purchase Program. As part of the transaction, the Corporation also issued warrants to the U.S. Treasury to purchase173,410 shares of common stock of the Corporation at an exercise price of $8.65$8.65 per share. As previously announced, the Corporation’s voluntary participation in the Capital Purchase Program amounted to approximately 50 percent of what the Corporation had qualified for under the U.S. Treasury program. The Corporation believes that its participation in this program will strengthen its current well-capitalized position. The funding will be used to support future loan growth. As a result of the successful completion of thea rights offering in October 2009, the number of shares underlying the warrants held by the U.S. Treasury was reduced to86,705 shares, or50 percent of the original 173,410 shares as outlined by the provisions of the Capital Purchase Program.

F-40

CENTER BANCORP, INC. AND SUBSIDIARIES
NOTES TO CONSOLIDATED FINANCIAL STATEMENTS
Note 14 — Stockholders’ Equity and Regulatory Requirements  – (continued)
On September 15, 2011, the Corporation issued $11.25 million in nonvoting senior preferred stock to the Treasury under the Small Business Lending Fund Program (“SBLF Program”). Under the Securities Purchase Agreement, the Corporation issued to the Treasury a total of11,250 shares of the Corporation’s Senior Non-Cumulative Perpetual Preferred Stock, Series B, having a liquidation value of $1,000 per share. Simultaneously, using the proceeds from the issuance of the SBLF Preferred Stock, the Corporation redeemed from the Treasury, all10,000 outstanding shares of its Fixed Rate Cumulative Perpetual Preferred Stock, Series A, liquidation amount $1,000 per share, for a redemption price of $10,041,667, including accrued but unpaid dividends up to the date of redemption. The investment in the SBLF program provides the Corporation with approximately $1.25 million additional Tier 1 capital. The capital received under the program will allow the Corporation to continue to serve its small business clients through the commercial lending program.
On December 7, 2011, the Corporation repurchased the warrants issued on January 12, 2009 to the U.S. Treasury as part of its participation in the U.S. Treasury’s TARP Capital Purchase Program. In the repurchase, the Corporation paid the U.S. Treasury $245,000 for the warrants.
Federal Deposit Insurance Corporation (“FDIC”) and the Board of Governors of the Federal Reserve System (“FRB”) regulations require banks to maintain minimum levels of regulatory capital. Under the regulations in effect at December 31, 2010,2013 (but subject to the enhanced requirement described below), the Bank was required to maintain (i) a minimum leverage ratio of Tier I capital to total adjusted assets of4.00 percent, and (ii) minimum ratios of Tier I and total capital to risk-weighted assets of4.00 percent and8.00 percent, respectively.

Under its prompt corrective action regulations, the regulators are required to take certain supervisory actions with respect to an undercapitalized institution. Such actions could have a direct material effect on the institution’s financial statements. The regulations establish a framework for the classification of financial institutions into five categories: well capitalized, adequately capitalized, undercapitalized, significantly undercapitalized and critically undercapitalized. Generally, an institution is considered well capitalized if it has a leverage (Tier I) capital ratio of at least5.00 percent; a Tier I risk-based capital ratio of at least6.00 percent; and a total risk-based capital ratio of at least10.00 percent.

The foregoing capital ratios are based in part on specific quantitative measures of assets, liabilities and certain off-balance sheet items as calculated under regulatory accounting practices. Capital amounts and classifications are also subject to qualitative judgments by the regulators about capital components, risk weightings and other factors. The Comptroller of the Currency (“OCC”) has established higher minimum capital ratios for the Bank effective as of December 31, 2009: Tier 1 Risk-Based Capital of 10.0 percent, Total Risk-Based Capital of 12.0 percent and Tier 1 Leverage Capital of 8.0 percent. Similar categories apply to bank holding companies.
At December 31, 2010, the Bank’s capital ratios were all above the minimum levels required.

At December 31, 2010,2013, management believes that the Bank and the Parent Corporation met all capital adequacy requirements to which they are subject.


TABLE OF CONTENTS

CENTER BANCORP, INC. AND SUBSIDIARIES

NOTES TO CONSOLIDATED FINANCIAL STATEMENTS

Note 13 — Stockholders’ Equity and Regulatory Requirements  – (continued)

The following is a summary of the Bank’s and the Parent Corporation’s actual capital amounts and ratios as of December 31, 20102013 and 2009,2012, compared to the FRB and FDIC minimum capital adequacy requirements and the FRB and FDIC requirements for classification as a well-capitalized institution.

      
 Union Center
National Bank
 Minimum Capital
Adequacy
 For Classification Under
Corrective Action Plan
as Well Capitalized
   Amount Ratio Amount Ratio Amount Ratio
   (Dollars in Thousands)
December 31, 2010 Leverage
(Tier 1) capital
 $112,601   9.56 $48,088   4.00 $59,262   5.00
Risk-Based Capital:
                              
Tier 1 $112,601   12.83 $35,116   4.00 $52,674   6.00
Total  121,468   13.84  70,232   8.00  87,790   10.00
December 31, 2009 Leverage
(Tier 1) capital
 $96,314   7.56 $52,133   4.00 $64,315   5.00
Risk-Based Capital:
                              
Tier 1 $96,314   11.17 $34,485   4.00 $51,727   6.00
Total  105,036   12.18  68,970   8.00  86,212   10.00

      
 Parent Corporation Minimum Capital
Adequacy
 For Classification
as Well Capitalized
   Amount Ratio Amount Ratio Amount Ratio
   (Dollars in Thousands)
December 31, 2010 Leverage
(Tier 1) capital
 $116,600   9.90 $48,098   4.00 $59,275   5.00
Risk-Based Capital:
                              
Tier 1 $116,600   13.28 $35,124   4.00 $52,686   6.00
Total  125,467   14.29  70,248   8.00  N/A   N/A 
December 31, 2009 Leverage
(Tier 1) capital
 $98,536   7.73 $52,143   4.00 $64,327   5.00
Risk-Based Capital:
                              
Tier 1 $98,536   11.43 $34,498   4.00 $51,747   6.00
Total  107,247   12.44  68,996   8.00  N/A   N/A 

F-41

CENTER BANCORP, INC. AND SUBSIDIARIES
NOTES TO CONSOLIDATED FINANCIAL STATEMENTS
Note 14 — Stockholders’ Equity and Regulatory Requirements  – (continued)
  Union Center
National Bank
 Minimum
Capital Adequacy
 For Classification
Under Corrective
Action Plan
as Well Capitalized
 
  Amount Ratio Amount Ratio Amount Ratio 
  (Dollars in Thousands) 
December 31, 2013
     Leverage (Tier 1)
     capital
 $159,431 9.69% $65,813 4.00% $82,266 5.00% 
Risk-Based
     Capital:
                   
Tier 1 $159,431 12.10% $52,704 4.00% $79,057 6.00% 
Total  169,974 12.91%  105,329 8.00%  131,661 10.00% 
December 31, 2012
     Leverage (Tier 1)
     capital
 $143,294 8.99% $63,757 4.00% $79,696 5.00% 
Risk-Based
     Capital:
                   
Tier 1 $143,294 11.35% $50,500 4.00% $75,750 6.00% 
Total  153,776 12.18%  101,002 8.00%  126,253 10.00% 
  Parent Corporation Minimum Capital
Adequacy
 For Classification
as Well Capitalized
 
  Amount Ratio Amount Ratio Amount Ratio 
  (Dollars in Thousands) 
December 31, 2013
     Leverage (Tier 1)
     capital
 $159,316 9.69% $65,765 4.00% $N/A N/A% 
Risk-Based
     Capital:
                   
Tier 1 $159,316 12.10% $52,666 4.00% $N/A N/A% 
Total  169,894 12.90%  105,361 8.00%  N/A N/A  
December 31, 2012
     Leverage (Tier 1)
     capital
 $143,824 9.02% $63,780 4.00% $N/A N/A% 
Risk-Based
     Capital:
                   
Tier 1 $143,824 11.39% $50,509 4.00% $N/A N/A% 
Total  154,271 12.22%  100,996 8.00%  N/A N/A  
The Corporation issued $5.2$5.2 million of subordinated debentures in 2003. These securities are included as a component of Tier 1 Capital for regulatory purposes.

On March 1, 2005, the Federal Reserve adopted a final rule that allows the continued inclusion of outstanding and prospective issuances of trust preferred securities in the Tier I Capital of bank holding companies, subject to stricter quantitative limits and qualitative standards. The new quantitative limits became effective after a five-year transition period ending March 31, 2009. Under the final rules, trust preferred securities and other restricted core capital elements are limited to 25% of all core capital elements. Amounts of restricted core capital elements in excess of these limits may be included in Tier II Capital. Based on a review of the final rule, the Corporation believes that its trust preferred issues qualify as Tier I Capital. However, in the event that the trust preferred issues do not qualify as Tier I Capital, the Corporation would remain well-capitalized.

The Dodd-Frank Act includes certain provisions, often referred to as the “Collins Amendment,” concerning the capital requirements of the United States banking regulators. These provisions are intended to subject bank holding companies to the same capital requirements as their bank subsidiaries and to eliminate or


TABLE OF CONTENTS

F-42

CENTER BANCORP, INC. AND SUBSIDIARIES

NOTES TO CONSOLIDATED FINANCIAL STATEMENTS

Note 13 — Stockholders’ Equity and Regulatory Requirements  – (continued)

significantly reduce the use of hybrid capital instruments, especially trust preferred securities, as regulatory capital. Under the Collins Amendment, trust preferred securities issued by a company, such as Union Center National Bank, with total consolidated assets of less than $15 billion before May 19, 2010 and treated as regulatory capital are grandfathered, but any such securities issued later are not eligible as regulatory capital. The banking regulators must develop regulations setting minimum risk-based and leverage capital requirements for holding companies and banks on a consolidated basis that are no less stringent than the generally applicable requirements in effect for depository institutions under the prompt corrective action regulations. The banking regulators also must seek to make capital standards countercyclical so that the required levels of capital increase in times of economic expansion and decrease in times of economic contraction. The Dodd-Frank Act requires these new capital regulations to be adopted by the Federal Reserve in final form 18 months after the date of enactment of the Dodd-Frank Act (July 21, 2010).

Note 1415 — Comprehensive Income

Total comprehensive income includes all changes in equity during a period from transactions and other events and circumstances from non-owner sources. The Corporation’s other comprehensive income (loss) is comprised of unrealized holding gains and losses on securities available-for-sale, obligations for defined benefit pension plan and an adjustment to reflect the curtailment of the Corporation’s defined benefit pension plan, net of taxes.

Disclosure of comprehensive income for the years ended December 31, 2010, 2009 and 2008 is presented in the Consolidated Statements of Changes in Stockholders’ Equity. The table below provides a reconciliation of the components of

           Affected Line Item in the
Details about Accumulated Other Amounts Reclassified from Accumulated Statement Where Net Income is
Comprehensive Income Components Other Comprehensive Income Presented
  Twelve Months Ended  
  December 31,  
(Dollars in thousands) 2013 2012 2011  
OTTI losses $(652) $(870) $(342) Net investment securities gains
   178  265  119 Tax benefit
   (474)  (605)  (223) Net of tax
Sale of investment securities available-for-sale  2,363  2,882  3,976 Net investment securities gains
   (645)  (879)  (1,380) Tax expense
   1,718  2,003  2,596 Net of tax
Amortization of unrealized holding gains on securities transferred from available-for-sale to held-to-maturity  58  2  46 Interest income
   (19)  (1)  (28) Tax expense
   39  1  18 Net of tax
Pension plan actuarial (gains) losses  (654)  790  1,649 Before tax
   267  (323)  (584) Tax benefit (expense)
   (387)  467  1,065 Net of tax
Total reclassification $896 $1,866 $3,456 Net of tax
Accumulated other comprehensive income to(loss) at December 31, 2013 and 2012 consisted of the disclosure provided in the statement of changes in stockholders’ equity.

The components of other comprehensive income (loss), net of taxes, were as follows for the following fiscal years ended December 31:

   
 Years Ended December 31,
   2010 2009 2008
   (Dollars in Thousands)
Reclassification adjustments of OTTI losses included in income $(5,576 $(4,238 $ 
Unrealized gains (losses) on available for sale securities  6,500   (3,809  (3,328
Reclassification adjustment for net gain/(loss) arising during this period  4,237   4,729   655 
Net unrealized gains (losses)  5,161   (3,318  (2,673
Tax effect  (2,060  1,354   1,584 
Net of tax amount  3,101   (1,964  (1,089
Change in minimum pension liability     25    
Tax effect     (10   
Net of tax amount     15    
Net actuarial gains (losses)     142   (3,332
Tax effect     (57  1,333 
Net of tax amount     85   (1,999
Other comprehensive income (loss), net of tax $3,101  $(1,864 $(3,088

following:
 

TABLE OF CONTENTS

  2013 2012 
  (Dollars in Thousands) 
Investment securities available for sale, net of tax $2,374 $8,781 
Unamortized component of securities transferred from
    available-for-sale to held-to-maturity, net of tax
  (1,425)  162 
Defined benefit pension and post-retirement plans, net of tax  (3,493)  (3,880) 
Total $(2,544) $5,063 

F-43

CENTER BANCORP, INC. AND SUBSIDIARIES

NOTES TO CONSOLIDATED FINANCIAL STATEMENTS

Note 14 — Comprehensive Income  – (continued)

Accumulated other comprehensive loss at December 31, 2010 and 2009 consisted of the following:

  
 2010 2009
   (Dollars in Thousands)
Investment securities available for sale, net of tax $(5,327 $(8,428
Defined benefit pension and post-retirement plans, net of tax  (2,348  (2,348
Total $(7,675 $(10,776

Note 1516 — Pension and Other Benefits

Defined Benefit Plans

The Corporation maintained a non-contributory pension plan for substantially all of its employees until September 30, 2007, at which time the Corporation froze its defined benefit pension plan. The benefits are based on years of service and the employee’s compensation over the prior five-year period. The plan’s benefits are payable in the form of a ten year certain and life annuity. The plan is intended to be a tax-qualified defined benefit plan under Section 401(a) of the Internal Revenue Code. The Pension Plan, which has been in effect since March 15, 1950,pension plan generally covers employees of Union Center National Bank and the Parent Corporation who havehad attained age 21 and completed one year of service.service prior to September 30, 2007. Payments may be made under the Pension Plan once attaining the normal retirement age of 65 and isare generally equal to 44 percent of a participant’s highest average compensation over a 5-year period.

In addition, the Corporation has a non-qualified retirement plan that is designed to supplement the pension plan for key employees. The plan is known as the Union Center National Bank Benefit Equalization Plan, or “BEP”. The BEP is a nonqualified, unfunded supplemental retirement plan, which is designed to replace the benefits that cannot be provided under the terms of the Pension Plan solely due to certain compensation and benefit limits placed on tax-qualified pension plans under the Internal Revenue Code. Benefits under the BEP Plan were paid out in 2009.

In 1999, the Corporation adopted a Directors’ Retirement Plan, which was designed to provide retirement benefits for members of the Board of Directors. There was no recorded expense associated with the plan in 2010, 2009 and 2008. During the third quarter of 2008, the Corporation recognized a $272,000 benefit relating to a lump-sum payment and termination of the Directors Retirement Plan. This benefit represented the difference between the actuarial present value of the lump-sum payments and the accrued liability previously recorded on the Corporation’s balance sheet.


TABLE OF CONTENTS

CENTER BANCORP, INC. AND SUBSIDIARIES

NOTES TO CONSOLIDATED FINANCIAL STATEMENTS

Note 15 — Pension and Other Benefits  – (continued)

The following table sets forth changes in projected benefit obligation, changes in fair value of plan assets, funded status, and amounts recognized in the consolidated statements of condition for the Corporation’s pension plans at December 31, 20102013 and 2009.

2012.
  
 2010 2009
   (Dollars in Thousands)
Change in Benefit Obligation:
          
Projected benefit obligation at beginning of year $10,660  $9,923 
Service cost      
Interest cost  601   606 
Actuarial loss  393   617 
Benefits paid  (622  (486
Projected benefit obligation at end of year $11,032  $10,660 
Change in Plan Assets:
          
Fair value of plan assets at beginning year $6,652  $5,734 
Actual return on plan assets  663   930 
Employer contributions  300   474 
Benefits paid  (622  (486
Fair value of plan assets at end of year $6,993  $6,652 
Funded status $(4,039 $(4,008

  2013 2012 
  (Dollars in Thousands) 
Change in Benefit Obligation:       
Projected benefit obligation at beginning of year $13,533 $12,345 
Interest cost  529  555 
Actuarial loss  255  1,389 
Benefits paid  (748)  (756) 
Projected benefit obligation at end of year $13,569 $13,533 
Change in Plan Assets:       
Fair value of plan assets at beginning year $7,034 $6,762 
Actual return on plan assets  1,040  681 
Employer contributions  3,700  347 
Benefits paid  (748)  (756) 
Fair value of plan assets at end of year $11,026 $7,034 
Funded status $(2,543) $(6,499) 
Amounts related to unrecognized actuarial losses for the plan, on a pre-tax basis, that have been recognized in accumulated other comprehensive loss amounted to $3,914,000$5,699,000 and $6,354,000 at December 31, 20102013 and 20092012, respectively.

F-44

CENTER BANCORP, INC. AND SUBSIDIARIES
NOTES TO CONSOLIDATED FINANCIAL STATEMENTS
Note 16 — Pension and Other Benefits  – (continued)
The net periodic pension cost for 2010, 20092013, 2012 and 20082011 includes the following components:

   
 2010 2009 2008
   (Dollars in Thousands)
Service cost $  $  $ 
Interest cost  601   606   701 
Expected return on plan assets  (413  (288  (658
Net amortization and deferral  130       
Net periodic pension expense $318  $318  $43 

  2013 2012 2011 
  (Dollars in Thousands) 
Interest cost $529 $555 $589 
Expected return on plan assets  (488)  (377)  (381) 
Net amortization  375  294  179 
Net periodic pension expense $416 $472 $387 
The following table presents the assumptions used to calculate the projected benefit obligation in each of the last three years.

   
 2010 2009 2008
Discount rate  5.25  5.75  6.25
Rate of compensation increase  N/A   N/A   N/A 
Expected long-term rate of return on plan assets  6.25  5.00  7.50


TABLE OF CONTENTS

CENTER BANCORP, INC. AND SUBSIDIARIES

NOTES TO CONSOLIDATED FINANCIAL STATEMENTS

Note 15 — Pension and Other Benefits  – (continued)

  2013  2012  2011 
Discount rate  4.84%  4.03%  4.64%
Rate of compensation increase  N/A   N/A   N/A 
Expected long-term rate of return on plan assets  5.50%  5.50%  5.50%

The following information is provided atfor the year ended December 31:

   
 2010 2009 2008
   (Dollars in Thousands)
Information for Plans With a Benefit Obligation in
Excess of Plan Assets
               
Projected benefit obligation $11,032  $10,660  $9,923 
Accumulated benefit obligation  11,032   10,660   9,923 
Fair value of plan assets  6,993   6,652   5,734 
Assumptions
               
Weighted average assumptions used to determine benefit obligation at December 31
               
Discount rate  5.25  5.75  6.25
Rate of compensation increase  N/A   N/A   N/A 
Weighted average assumptions used to determine net periodic benefit cost for years ended December 31
               
Discount rate  5.75  6.25  6.25
Expected long-term return on plan assets  6.25  5.00  7.50
Rate of compensation increase  N/A   N/A   N/A 

 2013 2012 2011 
 (Dollars in Thousands) 
Weighted average assumptions used to determine net
    periodic benefit cost for years ended December 31
         
Discount rate 4.03% 4.64% 5.25%
Expected long-term return on plan assets 5.50% 5.50% 5.50%
Rate of compensation increase N/A  N/A  N/A 
The process of determining the overall expected long-term rate of return on plan assets begins with a review of appropriate investment data, including current yields on fixed income securities, historical investment data, historical plan performance and forecasts of inflation and future total returns for the various asset classes. This data forms the basis for the construction of a best-estimate range of real investment return for each asset class. An average, weighted real-return range is computed reflecting the Plan’splan’s expected asset mix, and that range, when combined with an expected inflation range, produces an overall best-estimate expected return range. Specific factors such as the Plan’splan’s investment policy, reinvestment risk and investment volatility are taken into consideration during the construction of the best estimate real return range, as well as in the selection of the final return assumption from within the range.

Plan Assets

The Union Center National Bank Pension Trust’s weighted-average asset allocation at December 31, 2010, 20092013, 2012 and 2008,2011, by asset category, is as follows:

   
Asset Category 2010 2009 2008
Equity securities  44  44  48
Debt and/or fixed income securities  37  46  34
Alternative investments, including commodities, foreign currency and real estate    5  9
Cash and other alternative investments, including hedge funds, equity structured notes  19  5  9
Total  100  100  100


TABLE OF CONTENTS

Asset Category 2013  2012  2011 
Equity securities (domestic and international)  53%  60%  47%
Debt and/or fixed income securities  39%  39%  41%
Alternative investments, including commodities, foreign currency and real estate  %  1%  4%
Cash and other alternative investments, including hedge funds, equity structured notes  8%  %  8%
Total  100%  100%  100%

F-45

CENTER BANCORP, INC. AND SUBSIDIARIES

NOTES TO CONSOLIDATED FINANCIAL STATEMENTS

Note 1516 — Pension and Other Benefits  – (continued)

The general investment policy of the Pension Trust is for the fund to experience growth in assets that will allow the market value to exceed the value of benefit obligations over time. Appropriate diversification on a total fund basis is achieved by following an allowable range of commitment within asset category, as follows:

 Range Target
Equity securities  354253%48%  4544%%
Debt and/or fixed income securities  303744%43%  4037%%
International equity  N/A12 – 18%  15N/A%
Short term  N/A   N/A 
Other  15 – 23%N/A   19%N/A 

The fair values of the Corporation’s pension plan assets at December 31, 2010,2013 and 2012, by asset category, are as follows:

    
  Fair Value Measurements at Reporting Date Using
   December 31,
2010
 Quoted Prices
in Active
Markets for
Identical Assets
(Level 1)
 Significant
Other
Observable
Inputs
(Level 2)
 Significant
Unobservable
Inputs
(Level 3)
   (Dollars in Thousands)
Cash $1,379  $1,379  $  $ 
Equity Securities:
                    
U.S. companies  1,522   1,522       
International companies  1,534   1,534       
U.S. Treasury securities  2,378   2,378       
Corporate bonds  180   180       
Total $6,993  $6,993  $  $ 

The fair value of the Corporation’s pension plan assets at December 31, 2009, by asset category, are as follows:

    
  Fair Value Measurements at Reporting Date Using
   December 31,
2009
 Quoted Prices
in Active
Markets for
Identical Assets
(Level 1)
 Significant
Other
Observable
Inputs
(Level 2)
 Significant
Unobservable
Inputs
(Level 3)
   (in thousands)
Cash $1,020  $1,020  $  $ 
Equity securities:
                    
U.S. companies  1,327   1,327       
International companies  1,163   1,163       
U.S. Treasury securities  2,301   2,301       
Corporate bonds  340   340       
Commodities  170   170       
Hedge funds  331         331 
Total $6,652  $6,321  $  $331 


TABLE OF CONTENTS

  December 31,
2013
 Fair Value Measurements at Reporting Date Using 
    Quoted Prices
in Active
Markets for
Identical Assets
(Level 1)
 Significant
Other
Observable
Inputs
(Level 2)
 Significant
Unobservable
Inputs
(Level 3)
 
  (Dollars in Thousands) 
Cash $865 $865 $ $ 
Equity securities:             
U.S. companies  4,310  4,310     
International
    companies
  1,495  1,495     
Debt and/or fixed
    income securities
  4,356  4,356     
Total $11,026 $11,026 $ $ 

  December 31,
2012
 Fair Value Measurements at Reporting Date Using 
     Quoted Prices
in Active
Markets for
Identical Assets
(Level 1)
 Significant
Other
Observable
Inputs
(Level 2)
 Significant
Unobservable
Inputs
(Level 3)
 
  (Dollars in Thousands) 
Cash $42 $42 $ $ 
Equity securities:             
U.S. companies  3,154  3,154     
International
    companies
  1,051  1,051     
Debt and/or fixed
    income securities
  2,787  2,787     
Total $7,034 $7,034 $ $ 
F-46

CENTER BANCORP, INC. AND SUBSIDIARIES

NOTES TO CONSOLIDATED FINANCIAL STATEMENTS

Note 1516 — Pension and Other Benefits  – (continued)

The following table presents the changes in pension plan asset with significant unobservable inputs (Level 3) for the year ended December 31:

  
 2010 2009
   (in thousands)   
Beginning balance, January 1, $331  $663 
Actual return on plan assets:
          
Relating to assets still held at the reporting date     88 
Relating to assets sold during the period  8    
Purchases, sales and settlements  (339   
Transfers out of Level 3     (420
Ending balance, December 31, $0  $331 

The investment manager is not authorized to purchase, acquire or otherwise hold certain types of market securities (subordinated bonds, commodities, real estate investment trusts, limited partnerships, naked puts, naked calls, stock index futures, oil, gas or mineral exploration ventures or unregistered securities) or to employ certain types of market techniques (margin purchases or short sales) or to mortgage, pledge, hypothecate, or in any manner transfer as security for indebtedness, any security owned or held by the Plan.

Cash Flows

Contributions

The Bank expects to contribute $467,000$400,000 to its Pension Trust in 2011.

2014.

The Preservation of Access to Care for Medicare Beneficiaries and Pension Relief Act of 2010, signed into law on June 25, 2010, permits single employer and multiple employer defined benefit plan sponsors to elect to extend the plan’s amortization period of a Shortfall Amortization Base over either a nine year period or a fifteen year period, rather than the seven year period required under the Pension Protection Act of 2006.

The relief was available for any two Plan Years 2008 through 2011.

The Bank has elected to apply the Pension Relief Act Fifteen Yearfifteen year amortization of the Shortfall Amortization BaseBases established for itsthe 2009 and 2011 Plan Years.  
The Moving Ahead for Progress in the 21st Century Act which was enacted on July 6, 2012 contained special rules related to funding stabilization for single employer defined benefit plans. Under these provisions, the interest rates used to calculate the plan’s funding percentages and minimum funding requirement.required contribution are adjusted as necessary to fall within a specified range that is determined based on an average of rates for the 25 year period ending on September 30 of the calendar year preceding the first day of the Plan year. For Plan years beginning in 2013, the range is85% -115% of the 25 year average. The application of the adjusted rates produced a 2013 required minimum amountcontribution to be funded is $467,000, as noted above, by December 31, 2011 with the understanding thatPlan to approximately $400,000. However, a decision was made to contribute a total of $3,700,000 for the 2013 plan year in order to make significant progress toward fully funding the plan earlier than this date will lower this amountPlan liabilities and that fundingamount has been contributed for the plan after this date will increase this amount. As noted, this amount is the minimum required funding amount. The Bank does have the option of funding above this amount but has contributed the minimum historically.

2013 Plan Year.

Estimated Future Benefit Payments

The following benefit payments, which reflect expected future service, as appropriate, are expected to be paid in each year 2011, 2012, 2013, 2014, 2015, 2016, 2017, 2018 and years 2016 – 2020,2019-2023, respectively: $636,550, $721,931, $750,704, $785,646, $810,925$761,489, $762,957, $765,263, $747,835, $743,646 and $4,076,442.

$3,882,812.

401(k) Benefit Plan

The Corporation maintains a 401(k) employee savings plan to provide for defined contributions which covers substantially all employees of the Corporation. ThePrior to 2013, the Corporation’s contribution to its 401(k) plan providesprovided a dollar-for-dollar matching contribution up to six percent of salary deferrals.deferrals for the periods presented. Beginning with the 2013 Plan Year, the Plan was amended to provide for a 3% non-elective safe harbor contribution for all participants. For 2010, 20092013, 2012 and 2008,2011, employer contributions amounted to $294,000, $266,000$265,000, $405,000 and $281,000,$358,000, respectively.


TABLE OF CONTENTS

F-47

CENTER BANCORP, INC. AND SUBSIDIARIES

NOTES TO CONSOLIDATED FINANCIAL STATEMENTS

Note 1617 — Stock Based Compensation

Stock Option Plans

At December 31, 2010,2013, the Corporation maintained two stock-based compensation plans from which new grants could be issued. The 2009 Equity Incentive Plan permits the grant of “incentive stock options” as defined under the Internal Revenue Code, non-qualified stock options, restricted stock awards and restricted stock unit awards to employees, including officers, and consultants of the Corporation and its subsidiaries. The 2003 Non-Employee Director Stock Option Plan permits the grant of non-qualified stock options to the Corporation’s non-employee directors. An aggregate of 400,000363,081 shares remain available for grant under the 2009 Equity Incentive Plan and an aggregate of 443,127406,527 shares remain available for grant under the 2003 Non-Employee Director Stock Option Plan. Such shares may be treasury shares, newly issued shares or a combination thereof.

Options have been granted to purchase common stock principally at the fair market value of the stock at the date of grant. Options vest over a three year vesting period starting one year after the date of grant and generally expire ten years from the date of grant.

The total compensation expense related to these plans was $51,000, $77,000$59,000, $39,000 and $128,000$35,000 for the years ended December 31, 2010, 20092013, 2012 and 2008,2011, respectively.

As a result of the compensation expense related to stock options: (i) for the year ended December 31, 2010,2013, the Corporation’s income before income taxes and net income was reduced by $51,000$59,000 and $31,000,$35,000, respectively; (ii) for the year ended December 31, 2009,2012, the Corporation’s income before income taxes and net income was reduced by $77,000$39,000 and $51,000,$23,000, respectively; and (iii) for the year ended December 31, 2008,2011, the Corporation’s income before income taxes and net income was reduced by $128,000$35,000 and $84,000,$21,000, respectively.

Under the principal option plans, the Corporation may grant restricted stock awards to certain employees. Restricted stock awards are non-vested stock awards. Restricted stock awards are independent of option grants and are generally subject to forfeiture if employment terminates prior to the release of the restrictions. Such awards generally vest during a period specified at the date of grant. During that period, ownership of the shares cannot be transferred. Restricted stock has the same cash dividend and voting rights as other common stock and is considered to be currently issued and outstanding. The Corporation expenses the cost of the restricted stock awards, which is determined to be the fair market value of the shares at the date of grant, ratably over the period during which the restrictions lapse. During 2010, 2,8032013,18,829 shares were awarded while in 2009, no2012,2,125 shares were awarded. During 2008, 3,0282011,2,780 shares were awarded. All2013 shares were issued from Treasury shares.treasury stock, while 2012 and 2011 shares were purchased in the open market. The amount of compensation cost related to restricted stock awards included in salary expense was zero$24,000, $25,000 and $25,000 in 20102013, 2012 and 2009 and approximately $25,000 in 2008.2011, respectively. As of December 31, 2010,2013, all shares relating to 2012 and 2011 restricted stock awards were vested. Thus, there
Options covering41,639 shares were no restricted stock awards outstanding at December 31, 2010.

Options covering 38,203, 38,203granted on August 27 and 38,203March 1, 2013, while27,784 and27,784 shares were granted on March 1, 2010, March 1, 20092012 and March 1, 2008,2011, respectively. The fair value of share-based payment awards was estimated using the Black-Scholes option pricing model with the following assumptions and weighted average fair values:

   
 2010 2009 2008
Weighted average fair value of grants $2.16  $1.48  $3.10 
Risk-free interest rate  2.29  1.90  3.03
Dividend yield  1.41  4.69  2.43
Expected volatility  28.60  33.00  30.20
Expected life in months  62   69   88 


TABLE OF CONTENTS

  2013  2012  2011 
Weighted average fair value of grants $2.50 – 5.87  $2.03  $1.89 
Risk-free interest rate  1.86 – 2.29%  2.03%  2.19%
Dividend yield  1.76 – 2.11%  1.24%  1.32%
Expected volatility  23.21 – 33.74%  22.04%  22.25%
Expected life in months  69 – 90   68   65 

F-48

CENTER BANCORP, INC. AND SUBSIDIARIES

NOTES TO CONSOLIDATED FINANCIAL STATEMENTS

Note 1617 — Stock Based Compensation  – (continued)

Option activity under the principal option plans as of December 31, 20102013 and changes during the twelve months ended December 31, 20102013 were as follows:

    
 Shares Weighted-
Average
Exercise
Price
 Weighted-
Average
Remaining
Contractual
Term
(In Years)
 Aggregate
Intrinsic Value
Outstanding at December 31, 2009  192,002  $10.04           
Granted  38,203   8.53           
Exercised  0   0.00           
Forfeited/cancelled/expired  (31,259  10.02           
Outstanding at December 31, 2010  198,946  $9.75   4.82  $29,638 
Exercisable at December 31, 2010  139,898  $10.05   3.31  $20,885 

  Shares Weighted-
Average
Exercise 
Price
 Weighted-
Average
Remaining 
Contractual 
Term
(In Years)
 Aggregate
Intrinsic Value
 
Outstanding at December 31, 2012  183,574 $10.04       
Granted  41,639  12.95       
Exercised  (2,268)  9.14       
Forfeited/cancelled/expired  (34,565)  10.81       
Outstanding at December 31, 2013  188,380 $10.55  5.99 $1,546,129 
Exercisable at December 31, 2013  113,751 $10.14  4.40 $980,102 
The aggregate intrinsic value of options above represents the total pre-tax intrinsic value (the difference between the Corporation’s closing stock price on the last trading day of the twelve-months of fiscal 20102013 and the exercise price, multiplied by the number of in-the-money options) that would have been received by the option holders had all option holders exercised their options on December 31, 2010.2013. This amount changes based on the fair market value of the Parent Corporation’s stock.

As of December 31, 2010, $50,0002013, $266,000 of total unrecognized compensation cost related to stock options is expected to be recognized over a weighted-average period of 1.423.9 years. Changes in options outstanding during the past three years were as follows:

  
Stock Option Plan Shares Exercise Price
Range per Share
Outstanding, December 31, 2007 (188,273 shares exercisable)  264,255   $6.07 to $15.73 
Granted during 2008  38,203   $11.15 
Exercised during 2008  (25,583  $6.07 to $10.66 
Expired or canceled during 2008  (91,711  $6.07 to $15.73 
Outstanding, December 31, 2008 (125,468 shares exercisable)  185,164   $6.07 to $15.73 
Granted during 2009  38,203   $7.67 
Exercised during 2009  (9,289  $6.07 
Expired or canceled during 2009  (22,076  $6.07 to $15.73 
Outstanding, December 31, 2009 (124,271 shares exercisable)  192,002   $7.67 to $15.73 
Granted during 2010  38,203   $8.53 
Exercised during 2010  0   $0.00 
Expired or canceled during 2010  (31,259  $7.67 to $15.73 
Outstanding, December 31, 2010 (138,898) shares exercisable)  198,946   $7.67 to $15.73 

Stock Option Plan Shares Exercise Price
Range per Share
 
Outstanding, December 31, 2010 (138,898 shares exercisable)  198,946  $7.67 to $15.73 
Granted during 2011  27,784 $9.11 
Exercised during 2011  (42,495) $7.71 
Expired or canceled during 2011  (12,857) $10.50 to $15.73 
Outstanding, December 31, 2011 (105,388 shares exercisable)  171,378  $7.67 to $15.73 
Granted during 2012  27,784 $9.64 
Exercised during 2012  (15,588)  $7.67 to $10.50 
Expired or canceled during 2012   $0.00 
Outstanding, December 31, 2012 (117,111 shares exercisable)  183,574  $7.67 to $15.73 
Granted during 2013  41,639 $12.52 to $14.24 
Exercised during 2013  (2,268)  $7.67 to $10.66 
Expired or canceled or forfeited during 2013  (34,565) $7.67 to $15.73 
Outstanding, December 31, 2013 (113,751 shares exercisable)  188,380  $7.67 to $15.73 
Under the Director Stock Option Plan, there were stock options granted with a weighted average fair value of 38,20331,257 and $2.16, 38,203$2.50,27,784 and $1.48$2.03 and 38,20327,784 and $3.10$1.89 during the years ended December 31, 2010, 20092013, 2012 and 2008,2011, respectively. There were no18,829,2,125 and2,780 restricted stock optionsawards granted under the Employee Stock Incentive Plan during the years ended December 31, 2010, 20092013, 2012 and 2008.


2011, respectively. In addition, during 201310,382 stock options with a weighted average fair value of $5.87 were granted under the Employee Stock Incentive Plan.
 

TABLE OF CONTENTS

F-49

CENTER BANCORP, INC. AND SUBSIDIARIES

NOTES TO CONSOLIDATED FINANCIAL STATEMENTS

Note 1718 — Dividends and Other Restrictions

Certain restrictions, including capital requirements, exist on the availability of undistributed net profits of the Bank for the future payment of dividends to the Parent Corporation. A dividend may not be paid if it would impair the capital of the Bank. Furthermore, prior approval by the Comptroller of the CurrencyOCC is required if the total of dividends declared in a calendar year exceeds the total of the Bank’s net profits for that year combined with the retained profits for the two preceding years. Pursuant to a Memorandum of Understanding (“MOU”) between the Bank and the Office of the Comptroller of the Currency (“OCC”), the Bank may not declare dividends without prior approval of the OCC. At December 31, 2010,2013, approximately $11.2$45.1 million was available for payment of dividends based on the preceding guidelines.

Note 18


Note 19 — Fair Value Measurements and Fair Value of Financial Instruments

Management uses its best judgment in estimating the fair value of the Corporation’s financial and non-financial instruments; however, there are inherent weaknesses in any estimation technique. Therefore, for substantially all financial and non-financial instruments, the fair value estimates herein are not necessarily indicative of the amounts the Corporation could have realized in a sale transaction on the dates indicated. The estimated fair value amounts have been measured as of their respective year-ends and have not been re-evaluated or updated for purposes of these financial statements subsequent to those respective dates. As such, the estimated fair values of these financial and non-financial instruments subsequent to the respective reporting dates may be different than the amounts reported at each year-end.

In September 2006, the FASB issued FASB ASC 820-10-05 (previously SFAS No. 157, “Fair Value Measurements”).

FASB ASC 820-10-05 defines fair value, establishes a framework for measuring fair value, establishes a three-level valuation hierarchy for disclosure of fair value measurement and enhances disclosure requirements for fair value measurements. The valuation hierarchy is based upon the transparency of inputs to the valuation of an asset or liability as of the measurement date.

In December 2007, the FASB issued FASB ASC 820-10-15 (previously FASB Statement Position 157-2, “Effective Date of FASB Statement No. 157”). FASB ASC 820-10-15 delays the effective date of FASB ASC 820-10-05 for all non-financial assets and liabilities, except those that are recognized or disclosed at fair value on a recurring basis (at least annually) to fiscal years beginning after November 15, 2008 and interim periods within those fiscal years. As such, the Corporation adopted the provisions of FASB ASC 820-10-05 relating to non-financial assets and liabilities in 2009. In October 2008, the FASB issued FASB ASC 820-10-35 (previously FASB Staff Position 157-3, “Determining the Fair Value of a Financial Asset When the Market for that Asset is Not Active”), to clarify the application of the provisions of FASB ASC 820-10-05 in an inactive market and how an entity would determine fair value in an inactive market. FASB ASC 820-10-35 was applied to the Corporation’s December 31, 2008 consolidated financial statements.

FASB ASC 820-10-65 provides additional guidance for estimating fair value in accordance with FASB ASC 820-10-05 when the volume and level of activity for the asset or liability have significantly decreased. This ASC also includes guidance on identifying circumstances that indicate a transaction is not orderly. This ASC is effective for interim and annual reporting periods ending after June 15, 2009, with early adoption permitted for periods ending after March 15, 2009. FASB ASC 820-10-65 was applied to the Corporation’s consolidated financial statements, effective June 30, 2009.

FASB ASC 820-10-05 establishes a fair value hierarchy that prioritizes the inputs to valuation methods used to measure fair value. The Hierarchyhierarchy gives the highest priority to unadjusted quoted prices in active markets for identical assets or liabilities (Level 1 measurements) and the lowest priority to unobservable inputs (Level 3 measurements). The three levels of the fair value hierarchy under FASB ASC 820-10-05 are as follows:

Level 1:   Unadjusted quoted prices in active markets that are accessible at the measurement date for identical, unrestricted assets or liabilities.


TABLE OF CONTENTS

CENTER BANCORP, INC. AND SUBSIDIARIES

NOTES TO CONSOLIDATED FINANCIAL STATEMENTS

Note 18 — Fair Value Measurements and Fair Value of Financial Instruments  – (continued)

Level 2:   Quoted prices for similar assets and liabilities in active markets, and inputs that are observable for the asset or liability, either directly or indirectly, for substantially the full term of the financial instrument.
Level 3:   Prices or valuation techniques that require inputs that are both significant to the fair value measurement and unobservable (for example, supported with little or no market activity).

An asset’s or liability’s level within the fair value hierarchy is based on the lowest level of input that is significant to the fair value measurement.

F-50

CENTER BANCORP, INC. AND SUBSIDIARIES
NOTES TO CONSOLIDATED FINANCIAL STATEMENTS
Note 19 — Fair Value Measurements and Fair Value of Financial Instruments  – (continued)
The following information should not be interpreted as an estimate of the fair value of the entire Corporation since a fair value calculation is only provided for a limited portion of the Corporation’s assets and liabilities. Due to a wide range of valuation techniques and the degree of subjectivity used in making the estimates, comparisons between the Corporation’s disclosures and those of other companies may not be meaningful. The following methods and assumptions were used to estimate the fair values of the Corporation’s assets measured at fair value on a recurring basis at December 31, 20102013 and December 31, 2009:

2012:

Cash and Cash Equivalents

The carrying amounts for cash and cash equivalents approximate those assets’ fair value.

Securities Available-for-Sale

Where quoted prices are available in an active market, securities are classified with Level 1 of the valuation hierarchy. Level 1 inputs include securities that have quoted prices in active markets for identical assets. If quoted market prices are not available, then fair values are estimated by using pricing models, quoted prices of securities with similar characteristics, or discounted cash flows. Examples of instruments, which would generally be classified within Level 2 of the valuation hierarchy, include municipal bonds and certain agency collateralized mortgage obligations. In certain cases where there is limited activity in the market for a particular instrument, assumptions must be made to determine their fair value and are classified as Level 3. Due to the inactive condition of the markets amidst the financial crisis, the Corporation treated certain securities as Level 3 securities in order to provide more appropriate valuations. For assets in an inactive market, the infrequent trades that do occur are not a true indication of fair value. When measuring fair value, the valuation techniques available under the market approach, income approach and/or cost approach are used. The Corporation’s evaluations are based on market data and the Corporation employs combinations of these approaches for its valuation methods depending on the asset class.

At December 31, 2010,2012, the Corporation’s two pooled trust preferred securitiessecurity, ALESCO 6 and ALESCO 7 and one private label collateralized mortgage obligation wereVII, was classified as Level 3. Market pricing for the Level 3 securities varied widely from one pricing service to another based on the lack of trading. As such, these securities were considered to no longer have readily observable market data that was accurate to support a fair value as prescribed by FASB ASC 820-10-05. The fair value measurement objective remained the same in that the price received by the Corporation would result from an orderly transaction (an exit price notion) and that the observable transactions considered in fair value were not forced liquidations or distressed sales at the measurement date.

In regards to the pooled trust preferred securitiessecurity (“pooled TRUPS”) and the private issue single name trust preferred security (“single name TRUP”), or collectively (“TRUPS”), the Corporation was able to determine fair value of the TRUPS using a market approach validation technique based on Level 2 inputs that did not require significant adjustments. The Level 2 inputs included:

(a)Quoted prices in active markets for similar TRUPS with insignificant adjustments for differences between the TRUPS that the Corporation holds and similar TRUPS.


TABLE OF CONTENTS

CENTER BANCORP, INC. AND SUBSIDIARIES

NOTES TO CONSOLIDATED FINANCIAL STATEMENTS

Note 18 — Fair Value Measurements and Fair Value of Financial Instruments  – (continued)

(b)Quoted prices in markets that are not active that represent current transactions for the same or similar TRUPS that do not require significant adjustment based on unobservable inputs.

Since June 30, 2008, the market for these TRUPS has become increasingly inactive. The inactivity was evidenced first by a significant widening of the bid-ask spread in the brokered markets in which these TRUPS trade and then by a significant decrease in the volume of trades relative to historical levels as well as other relevant factors. At December 31, 2010,2013, the Corporation determined that the market for similar TRUPS had stabilized. That determination was made considering that there are more observable transactions for similar TRUPS, the prices for those transactions that have occurred are current and or represent fair value, and the observable prices for those transactions have stabilized over time, thus increasing the potential relevance of those observations. However, the Corporation’s threeone TRUPS at December 31, 2010 have2012 has been classified within Level 3 because the Corporation determined that significant adjustments using unobservable inputs are required to determine a true fair value at the measurement date.

F-51

CENTER BANCORP, INC. AND SUBSIDIARIES
NOTES TO CONSOLIDATED FINANCIAL STATEMENTS
Note 19 — Fair Value Measurements and Fair Value of Financial Instruments  – (continued)
The Corporation held one variable rate private label collateralized mortgage obligation (CMO), which was also evaluated for impairment. The Variable Rate Collateralized Mortgage Obligation was originally issued in 2006 and is 30 year Adjustable Rate Mortgage loan secured by a first lien, fully amortizing one-to-four residential mortgage loans. The tranche purchased was a Super Senior with an original credit rating of AAA/AA. The top five states geographic concentration comprised in the deal were California18.2 percent, Arizona10.5 percent, Virginia6.1 percent, Florida6.5 percent and Nevada6.3 percent. No one state exceeded a25 percent concentration. These states have been heavily impacted by the financial crises and as such have sustained heavy delinquencies affecting the credit rating of the security. Management applied aggressive default rates to identify if any credit impairment exists, as these bonds were downgraded to below investment grade. The Corporation recorded $24,000 in principal losses on the bond in 2013, and this security was sold at this book value in January 2013.
The Corporation determined that an income approach valuation technique (present value technique) that maximizes the use of relevant observable inputs and minimizes the use of unobservable inputs will be equally or more representative of fair value than the market approach valuation technique used at the prior measurement dates. As a result, the Corporation used the discount rate adjustment technique to determine fair value.

The fair value as of December 31, 20102013 was determined by discounting the expected cash flows over the life of the security. The discount rate was determined by deriving a discount rate when the markets were considered more active for this type of security. To this estimated discount rate, additions were made for more liquid markets and increased credit risk as well as assessing the risks in the security, such as default risk and severity risk. With the exception of the two pooled trust preferred securities, for which $1.8 million of impairment charges were taken to earnings during 2010, theThe securities continue to make scheduled cash flows and no material cash flow payment defaults have occurred to date.

Securities Held-to-Maturity
The fair value of the Corporation’s investment securities held-to-maturity was primarily measured using information from a third-party pricing service. Level 1 investment securities are comprised of debt securities issued by the U.S. Treasury as quoted prices were available, unadjusted, for identical securities in active markets. If quoted prices were not available, fair values were estimated primarily by obtaining quoted prices for similar assets in active markets or through the use of pricing models. In cases where there may be limited or less transparent information provided by the Corporation’s third-party pricing service, fair value may be estimated by the use of secondary pricing services or through the use of non-binding third-party broker quotes.
Loans Held for Sale

Loans held for sale are required to be measured at the lower of cost or fair value. Under FASB ASC 820-10-05, market value is to represent fair value. Management obtains quotes or bids on all or part of these loans directly from the purchasing financial institutions.

Loans Receivable

The fair value of performing loans, except residential mortgages, is calculated by discounting scheduled cash flows through the estimated maturity using estimated market discount rates that reflect the credit and interest rate risks inherent in the loan. The estimate of maturity is based on the historical experience of the Bank with prepayments for each loan classification, modified as required by an estimate of the effect of current economic and lending conditions. For performing residential mortgage loans, fair value is estimated by discounting contractual cash flows adjusted for prepayment estimates using discount rates based on secondary market sources adjusted to reflect differences in servicing and credit costs.

F-52

CENTER BANCORP, INC. AND SUBSIDIARIES
NOTES TO CONSOLIDATED FINANCIAL STATEMENTS
Note 19 — Fair Value Measurements and Fair Value of Financial Instruments  – (continued)
Restricted Stocks

The carrying amount of restricted investmentinvestments in bank stocks, which includes stock of the Federal Home Loan Bank of New York, Federal Reserve Bank of New York and Atlantic Central Bankers Bank, approximates fair value, and considers the limited marketability of such securities.

Accrued Interest Receivable and Payable

The carrying value of accrued interest receivable and accrued interest payable approximates its fair value.


Deposits
 

TABLE OF CONTENTS

CENTER BANCORP, INC. AND SUBSIDIARIES

NOTES TO CONSOLIDATED FINANCIAL STATEMENTS

Note 18 — Fair Value Measurements and Fair Value of Financial Instruments  – (continued)

Deposits

The fair value of deposits with no stated maturity, such as non-interest-bearing demand deposits, savings and interest-bearing checking accounts, and money market and checking accounts, is equal to the amount payable on demand as of December 31, 20102013 and 2009.2012. The fair value of certificates of deposit is based on the discounted value of contractual cash flows. The discount rate is estimated using the rates currently offered for deposits of similar remaining maturities.

Short-Term Borrowings

Short-term borrowings that mature within six months and securities sold under agreements to repurchase have fair values which approximate carrying value.

Long-Term Borrowings

Fair values of FHLB advances are estimated using discounted cash flow analysis, based on quoted prices for new FHLB advances with similar credit risk characteristics, terms and remaining maturity. These prices obtained from this active market represent a market value that is deemed to represent the transfer price if the liability were assumed by a third party.

Subordinated Debt

The fair value of subordinated debentures is estimated by discounting the estimated future cash flows, using market discount rates of financial instruments with similar characteristics, terms and remaining maturity.

Off-Balance Sheet Financial Instruments

The fair value of commitments to extend creditscredit is estimated using the fees currently charged to enter into similar agreements, taking into account the remaining terms of the agreements and the present creditworthiness of the counterparties. For fixed rate loan commitments, fair value also considers the difference between current levels of interest rate and the committed rates.
The fair value of financial standby letters of credit is based on fees currently charged for similar agreements or on the estimated cost to terminate them or otherwise settle the obligations with the counterparties.


TABLE OF CONTENTS

CENTER BANCORP, INC. AND SUBSIDIARIES

NOTES TO CONSOLIDATED FINANCIAL STATEMENTS

Note 18 — Fair Value Measurements and Fair Value of Financial Instruments  – (continued)

Assets and Liabilities Measured at Fair Value on a Recurring Basis

For financial assets and liabilities measured at fair value on a recurring basis, the fair value measurements by level within the fair value hierarchy used at December 31, 20102013 and December 31, 20092012 are as follows:

    
  Fair Value Measurements at
Reporting Date Using
   December 31,
2010
 Quoted
Prices in
Active
Markets for
Identical
Assets
(Level 1)
 Significant
Other
Observable
Inputs
(Level 2)
 Significant
Unobservable
Inputs
(Level 3)
   (Dollars in Thousands)
Financial Instruments Measured at Fair Value on a Recurring Basis:
     
U.S. Treasury & agency securities $6,995  $6,995  $  $ 
Federal agency obligations  68,481      68,481    
Mortgage backed securities  177,733      177,733      
Obligations of U.S. states and political subdivision  37,225   16,936   20,289    
Trust preferred securities  18,731      18,589   142 
Corporate bonds & notes  61,434      61,434    
Collateralized mortgage obligations  2,728         2,728 
Equity securities  4,753   4,753       
Securities available-for-sale $378,080  $28,684  $346,526  $2,870 

    
  Fair Value Measurements at
Reporting Date Using
   December 31,
2009
 Quoted
Prices in
Active
Markets for
Identical
Assets
(Level 1)
 Significant
Other
Observable
Inputs
(Level 2)
 Significant
Unobservable
Inputs
(Level 3)
   (Dollars in Thousands)
Financial Instruments Measured at Fair Value on a Recurring Basis:
     
U.S. Treasury & agency securities $2,089  $2,089  $  $ 
Federal agency obligations  128,365   26,288   102,077    
Mortgage backed securities  86,220   29,182   57,038      
Obligations of U.S. states and political subdivision  19,281      19,281    
Trust preferred securities  26,715      24,366   2,349 
Corporate bonds and notes  22,655   2,994   19,661    
Collateralized mortgages obligations  7,266   4,254   3,012    
Equity securities  5,533   5,533       
Securities available-for-sale $298,124  $70,340  $225,435  $2,349 


TABLE OF CONTENTS

F-53

CENTER BANCORP, INC. AND SUBSIDIARIES

NOTES TO CONSOLIDATED FINANCIAL STATEMENTS

Note 1819 — Fair Value Measurements and Fair Value of Financial Instruments  – (continued)

  December 31,
2013
 Fair Value Measurements at Reporting Date Using 
     Quoted Prices
in Active
Markets for
Identical
Assets
(Level 1)
 Significant
Other
Observable
Inputs
(Level 2)
 Significant
Unobservable
Inputs
(Level 3)
 
              
  (Dollars in Thousands) 
Financial Instruments Measured at Fair Value on a
    Recurring Basis:
             
U.S. treasury and agency securities $13,519 $13,519 $ $ 
Federal agency obligations  19,941    19,941   
Residential mortgage pass-through
    securities
  48,874    48,874   
Commercial mortgage pass-
    through securities
  6,991    6,991   
Obligations of U.S. states and
    political subdivision
  31,460    31,460   
Trust preferred securities  19,403    19,403   
Corporate bonds and notes  158,630    158,630   
Asset-backed securities  15,979    15,979   
Certificates of deposit  2,262    2,262   
Equity securities  287  287     
Other securities  5,724  5,724     
Securities available-for-sale $323,070 $19,530 $303,540 $ 
  December 31,
2012
 Fair Value Measurements at Reporting Date Using 
     Quoted Prices
in Active
Markets for
Identical Assets
(Level 1)
 Significant
Other
Observable
Inputs
(Level 2)
 Significant
Unobservable
Inputs
(Level 3)
 
              
  (Dollars in Thousands) 
Financial Instruments Measured at Fair Value on a
    Recurring Basis:
             
U.S. treasury and agency securities $11,909 $11,909 $ $ 
Federal agency obligations  20,535    20,535   
Residential mortgage pass-
    through securities
  53,784    53,784   
Commercial mortgage pass-
    through securities
  9,969    9,969   
Obligations of U.S. states and
    political subdivision
  107,714  469  107,245   
Trust preferred securities  21,249    21,213  36 
Corporate bonds and notes  237,405    237,405   
Collateralized mortgage
    obligations
  2,120    2,120   
Asset-backed securities  19,742    19,742   
Certificates of deposit  2,865    2,865   
Equity securities  325  325     
Other securities  9,198  9,198     
Securities available-for-sale $496,815 $21,901 $474,878 $36 
F-54

CENTER BANCORP, INC. AND SUBSIDIARIES
NOTES TO CONSOLIDATED FINANCIAL STATEMENTS
Note 19 — Fair Value Measurements and Fair Value of Financial Instruments  – (continued)
The fair values used by the Corporation are obtained from an independent pricing service and represent either quoted market prices for the identical securities (Level 1 inputs) or fair values determined by pricing models using a market approach that considers observable market data, such as interest rate volatilities, LIBOR yield curve, credit spreads and prices from market makers and live trading systems (Level 2). The fair values of the federal agency obligations, obligations of states and political subdivision and corporate bonds and notes measured at fair value using Level 1 inputs at December 31, 2013 and 2012 represented the purchase price of the securities since they were acquired near year-end 2013 and 2012.
The following table presents the changes in securities available-for-sale with significant unobservable inputs (Level 3) for the year ended December 31, 20102013 and December 31, 2009:

2012:
 
 2010
   (Dollars in Thousands)
Beginning balance, January 1, $2,349 
Transfers into Level 3  8,197 
Transfers out of Level 3  (5,174
Principal interest deferrals  118 
Principal paydown  (1,083
Total net losses included in net income  (3,000
Total net unrealized gains  1,463 
Ending balance, December 31, $2,870 

 
 2009 2013 2012 
 (Dollars in Thousands) (Dollars in Thousands) 
Beginning balance, January 1, $23,554  $36 $2,115 
Transfers out of Level 3  (19,855  (260)  (2,120) 
Principal interest deferrals  139   58  116 
Principal paydown    (272) 
Total net losses included in net income  (4,403  (628)  (68) 
Total net unrealized gains  2,914   794  265 
Ending balance, December 31, $2,349  $ $36 

Assets Measured at Fair Value on a Non-Recurring Basis

The Corporation may be required periodically to measure certain assets at fair value on a nonrecurring basis in accordance with GAAP. These adjustments to fair value usually result from the application of lower of cost or fair value accounting or impairment write-downs of individual assets. The Corporation primarily utilizedappraisal value less cost to sell and other unobservable market inputs to determine fair value of assets, and therefore, is classified as a Level 3 measurement. For assets measured at fair value on a non-recurring basis, the fair value measurements at December 31, 20102013 and 2012 are as follows:

    
  Fair Value Measurements at
Reporting Date Using
   December 31, 2010 Quoted Prices in Active Markets for Identical Assets
(Level 1)
 Significant Other Observable Inputs
(Level 2)
 Significant Unobservable Inputs
(Level 3)
   (Dollars in Thousands)
Assets Measured at Fair Value on a
Non-Recurring Basis:
     
Impaired loans $4,895  $  $  $4,895 

At December 31, 2010 and 2009, impaired loans totaled $5,534,000 and $6,756,000, respectively. The amount of related valuation allowances was $639,000
Impaired Loans
Valuation Techniques
Range of Unobservable Inputs
ResidentialAppraisals of collateral valueAdjustment for age of comparable sales, generally a decline of 0-25%
CommercialDiscounted cash flow modelDiscount rate from 0% to 6%
Commercial real estateAppraisals of collateral valueMarket capitalization rates between 8% to 12%. Market rental rates for similar properties
ConstructionAppraisals of collateral valueAdjustment for age comparable sales. Generally a decline of 5% to no change
Other Real Estate Owned
ResidentialAppraisals of collateral valueAdjustment for age of comparable sales, generally a decline of 0-25% and estimated selling costs of 6-8%
CommercialAppraisals of collateral valueAdjustment for age of comparable sales, generally a decline of 15% to no change and estimated selling costs of 6-8%

For assets measured at fair value on a non-recurring basis, the unobservable inputs used to derive fair value measurements at December 31, 20102013 and $1,565,000 at December 31, 2009.

2012 were as follows:

  December 31,
2013
 Fair Value Measurements at Reporting Date Using 
     Quoted Prices
in Active
Markets for
Identical 
Assets
(Level 1)
 Significant
Other
Observable
Inputs
(Level 2)
 Significant
Unobservable
Inputs
(Level 3)
 
              
  (Dollars in Thousands) 
Assets Measured at Fair Value
    on a Non-Recurring Basis:
             
Impaired loans $4,601 $ $ $4,601 
Other real estate owned  220      220 
  December 31,
2012
 Fair Value Measurements at Reporting Date Using 
     Quoted Prices
in Active
Markets for
Identical 
Assets
(Level 1)
 Significant
Other
Observable
Inputs
(Level 2)
 Significant
Unobservable
Inputs
(Level 3)
 
              
  (Dollars in Thousands) 
Assets Measured at Fair Value
    on a Non-Recurring Basis:
             
Impaired loans $4,790 $ $ $4,790 
Other real estate owned  1,300      1,300 
              
F-55

CENTER BANCORP, INC. AND SUBSIDIARIES
NOTES TO CONSOLIDATED FINANCIAL STATEMENTS
Note 19 — Fair Value Measurements and Fair Value of Financial Instruments  – (continued)
The following methods and assumptions were used to estimate the fair values of the Corporation’s assets measured at fair value on a non-recurring basis at December 31, 20102013 and 2009:

2012:

Impaired Loans

Loans.The value of an impaired loan is measured based upon the present value of expected future cash flows discounted at the loan’s effective interest rate, or the fair value of the collateral if the loan is collateral dependent. Smaller balance homogeneous loans that are collectively evaluated for impairment, such as residential mortgage loans and installment loans, are specifically excluded from the impaired loan portfolio.


TABLE OF CONTENTS

CENTER BANCORP, INC. AND SUBSIDIARIES

NOTES TO CONSOLIDATED FINANCIAL STATEMENTS

Note 18 — Fair Value Measurements and Fair Value of Financial Instruments  – (continued)

The Corporation’s impaired loans are primarily collateral dependent. Impaired loans are individually assessed to determine that each loan’s carrying value is not in excess of the fair value of the related collateral or the present value of the expected future cash flows.

At December 31, 2013 and 2012, impaired loanswith related valuation allowance totaled $5,016,000 and $5,435,000, respectively. The amount of related valuation allowances was $415,000 at December 31, 2013 and $645,000 at December 31, 2012.

Other Real Estate Owned

Owned.Certain assets such as other real estate owned (“OREO”)OREO are measured at fair value less cost to sell. The Corporation believes that the fair value component in its valuation follows the provisions of FASB ASC 820-10-05. Fair value of OREO is determined by sales agreements or appraisals by qualified licensed appraisers approved and hired by the Corporation. Costs to sell associated with OREO isare based on estimation per the terms and conditions of the sales agreements or appraisal. At December 31, 2010, the Corporation held no OREO

Fair Value of Financial Instruments
FASB ASC 825-10 requires all entities to disclose the estimated fair value of their financial instrument assets and liabilities. For the Corporation, as for most financial institutions, the majority of its assets and liabilities are considered financial instruments as defined in FASB ASC 825-10. Many of the Corporation’s financial instruments, however, lack an available trading market as characterized by a willing buyer and willing seller engaging in an exchange transaction. It is also the Corporation’s general practice and intent to hold its financial instruments to maturity and not to not engage in trading or sales activities except for loans held-for-sale and available-for-sale securities.investment securities available-for-sale. Therefore, significant estimations and assumptions, as well as present value calculations, were used by the Corporation for the purposes of this disclosure.

Estimated

Investment Securities Held-to-Maturity.The fair value of the Corporation’s investment securities held-to-maturity was primarily measured using information from a third-party pricing service. If quoted prices were not available, fair values have been determinedwere estimated primarily by obtaining quoted prices for similar assets in active markets or through the use of pricing models. In cases where there may be limited or less transparent information provided by the CorporationCorporation’s third-party pricing service, fair value may be estimated by the use of secondary pricing services or through the use of non-binding third-party broker quotes.
Loans.The fair value of the Corporation’s loans was estimated by discounting the expected future cash flows using the best available datacurrent interest rates at which similar loans would be made to borrowers with similar credit ratings and an estimation methodology suitable for each categorythe same remaining maturities. Loans were segregated by types such as commercial, residential and consumer loans. Expected future cash flows were projected based on contractual cash flows, adjusted for estimated prepayments.
Interest-Bearing Deposits. The fair values of financial instruments. For those loans andthe Corporation’s interest-bearing deposits were estimated using discounted cash flow analyses. The discounted rates used were based on rates currently offered for deposits with floatingsimilar remaining maturities. The fair values of the Corporation’s interest-bearing deposits do not take into consideration the value of the Corporation’s long-term relationships with depositors, which may have significant value.
Term Borrowings and Subordinated Debentures. The fair value of the Corporation’s long-term borrowings and subordinated debentures were calculated using a discounted cash flow approach and applying discount rates currently offered based on weighted remaining maturities.
Accrued Interest Receivable/Payable.The carrying amounts of accrued interest approximate fair value resulting in a level 2 or level 3 classification based on the level of the asset or liability with which the accrual is associated.
F-56

CENTER BANCORP, INC. AND SUBSIDIARIES
NOTES TO CONSOLIDATED FINANCIAL STATEMENTS
Note 19 — Fair Value Measurements and Fair Value of Financial Instruments  – (continued)
The following presents the carrying amount, fair value, and placement in the fair value hierarchy of the Corporation’s financial instruments as of December 31, 2013 and December 31, 2012.
        Fair Value Measurements 
  Carrying
Amount
 Fair
Value
 Quoted
Prices in
Active
Markets for
Identical
Assets
(Level 1)
 Significant
Other
Observable
Inputs
 (Level 2)
 Significant
Unobservable
Inputs
(Level 3)
 
  (in thousands) 
December 31, 2013                
Financial assets                
Cash and due from banks $82,692 $82,692 $82,692 $ $ 
Investment securities available-for-sale  323,070  323,070  19,530  303,540   
Investment securities held-to-maturity  215,286  210,958  27,037  164,940  18,981 
Restricted investment in bank stocks  8,986  8,986    8,986   
Net loans  950,610  948,606      948,606 
Accrued interest receivable  6,802  6,802    4,136  2,666 
                 
Financial liabilities                
Non interest-bearing deposits  227,370  227,370    227,370   
Interest-bearing deposits  1,114,635  1,115,781    1,115,781   
Long-term borrowings  146,000  157,440    157,440   
Subordinated debentures  5,155  5,143    5,143   
Accrued interest payable  963  963    963   
                 
December 31, 2012                
Financial assets                
Cash and due from banks $104,134 $104,134 $104,134 $ $ 
Interest bearing deposits with banks  2,004  2,004  2,004     
Investment securities available-for-sale  496,815  496,815  21,901  474,878  36 
Investment securities held-to-maturity  58,064  62,431    53,247  9,184 
Restricted investment in bank stocks  8,964  8,964    8,964   
Loans held for sale  1,491  1,491  1,491     
Net loans  879,435  897,030      897,030 
Accrued interest receivable  6,849  6,849    4,465  2,384 
                 
Financial liabilities                
Non interest-bearing deposits  215,071  215,071    215,071   
Interest-bearing deposits  1,091,851  1,092,822    1,092,822   
Long-term borrowings  146,000  162,992    162,992   
Subordinated debentures  5,155  5,046    5,046   
Accrued interest payable  874  874    874   
F-57

CENTER BANCORP, INC. AND SUBSIDIARIES
NOTES TO CONSOLIDATED FINANCIAL STATEMENTS
Note 19 — Fair Value Measurements and Fair Value of Financial Instruments  – (continued)
The fair value of commitments to originate loans is estimated using the fees currently charged to enter into similar agreements, taking into account the remaining terms of the agreements and the present creditworthiness of the counterparties. For fixed-rate loan commitments, fair value also considers the difference between current levels of interest rates it is presumed that estimatedand the committed rates. The fair values generally approximate the recorded book balances. The estimation methodologies used,of letters of credit and lines of credit are based on fees currently charged for similar agreements or on the estimated fair values, andcost to terminate or otherwise settle the recorded book balancesobligations with the counterparties at December 31, 2010 and 2009, were as follows:

the reporting date.
    
 December 31,
   2010 2009
   Carrying
Amount
 Fair Value Carrying
Amount
 Fair Value
   (Dollars in Thousands)
FINANCIAL ASSETS:
     
Cash and cash equivalents $37,497  $37,497  $89,168  $89,168 
Investment securities available-for-sale  378,080   378,080   298,124   298,124 
Net loans  699,577   706,309   710,895   717,191 
Restricted investment in bank stocks  9,596   9,596   10,672   10,672 
Accrued interest receivable  4,134   4,134   4,033   4,033 
FINANCIAL LIABILITIES:
     
Non-interest-bearing deposits  144,210   144,210   130,518   130,518 
Interest-bearing deposits  716,122   716,887   683,187   683,974 
Federal funds purchased, securities sold under agreement to repurchase and FHLB advances  212,855   221,425   269,253   279,219 
Subordinated debentures  5,155   5,157   5,155   5,155 
Accrued interest payable $1,041  $1,041  $1,825  $1,825 

Changes in assumptions or estimation methodologies may have a material effect on these estimated fair values.

The Corporation’s remaining assets and liabilities, which are not considered financial instruments, have not been valued differently than has been customary with historical cost accounting. No disclosure of the relationship value of the Corporation’s core deposit base is required by FASB ASC 825-10.


TABLE OF CONTENTS

CENTER BANCORP, INC. AND SUBSIDIARIES

NOTES TO CONSOLIDATED FINANCIAL STATEMENTS

Note 18 — Fair Value Measurements and Fair Value of Financial Instruments  – (continued)

Fair value estimates are based on existing balance sheet financial instruments, without attempting to estimate the value of anticipated future business and the value of assets and liabilities that are not considered financial instruments. For example, there are certain significant assets and liabilities that are not considered financial assets or liabilities, such as the brokerage network, deferred taxes, premises and equipment, and goodwill. In addition, the tax ramifications related to the realization of the unrealized gains and losses can have a significant effect on fair value estimates and have not been considered in the estimates.

Management believes that reasonable comparability between financial institutions may not be likely, due to the wide range of permitted valuation techniques and numerous estimates which must be made, given the absence of active secondary markets for many of the financial instruments. This lack of uniform valuation methodologies also introduces a greater degree of subjectivity to these estimated fair values.

Note 19


Note 20 — Parent Corporation Only Financial Statements

The Parent Corporation operates its wholly-owned subsidiary, Union Center National Bank. The earnings of this subsidiary are recognized by the Corporation using the equity method of accounting. Accordingly, earnings are recorded as increases in the Corporation’s investment in the subsidiaries and dividends paid reduce the investment in the subsidiaries. The ability of the Parent Corporation to pay dividends will largely depend upon the dividends paid to it by the Bank. Dividends payable by the Bank to the Corporation are restricted under supervisory regulations (see Note 1718 of the Notes to Consolidated Financial Statements).

F-58

CENTER BANCORP, INC. AND SUBSIDIARIES
NOTES TO CONSOLIDATED FINANCIAL STATEMENTS
Note 20 — Parent Corporation Only Financial Statements  – (continued)
Condensed financial statements of the Parent Corporation only are as follows:

Condensed Statements of Condition

  
 At December 31,
   2010 2009
   (Dollars in Thousands)
ASSETS
     
Cash and cash equivalents $4,299  $2,683 
Investment in subsidiaries  122,129   104,144 
Securities available for sale  432   501 
Other assets  22   248 
Total assets $126,882  $107,576 
LIABILITIES AND STOCKHOLDERS’ EQUITY
     
Other liabilities $460  $280 
Securities sold under repurchase agreement  310   392 
Subordinated debentures  5,155   5,155 
Stockholders’ equity  120,957   101,749 
Total liabilities and stockholders’ equity $126,882  $107,576 


TABLE OF CONTENTS

  At December 31, 
  2013 2012 
  (Dollars in Thousands) 
ASSETS       
Cash and cash equivalents $285 $629 
Investment in subsidiaries  173,658  165,351 
Securities available for sale  442  543 
Other assets  271  41 
Total assets $174,656 $166,564 
LIABILITIES AND STOCKHOLDERS’ EQUITY       
Other liabilities $917 $718 
Subordinated debentures  5,155  5,155 
Stockholders’ equity  168,584  160,691 
Total liabilities and stockholders’ equity $174,656 $166,564 

Condensed Statements of Income
  For Years Ended December 31, 
  2013 2012 2011 
  (Dollars in Thousands) 
Income:          
Dividend income from subsidiaries $4,393 $2,079 $785 
Other income  6  15  7 
Net gains on available for sale securities  22  26   
Management fees  353  409  294 
Total Income  4,774  2,529  1,086 
Expenses  (765)  (731)  (615) 
Income before equity in undistributed earnings
    of subsidiaries
  4,009  1,798  471 
Equity in undistributed earnings of subsidiaries  15,916  15,709  13,455 
Net Income $19,925 $17,507 $13,926 
F-59

CENTER BANCORP, INC. AND SUBSIDIARIES

NOTES TO CONSOLIDATED FINANCIAL STATEMENTS

Note 1920 — Parent Corporation Only Financial Statements  – (continued)

Condensed Statements of Comprehensive Income

   
 For Years Ended December 31,
   2010 2009 2008
   (Dollars in Thousands)
Income:
     
Dividend income from subsidiaries $500  $2,474  $4,675 
Other income  8   3   37 
Net (losses) on available for sale securities  (97  (325  (413
Management fees  290   298   275 
Total Income  701   2,450   4,574 
Expenses  (635  (604  (623
Income before equity in undistributed earnings of subsidiaries  66   1,846   3,951 
Equity in undistributed earnings of subsidiaries  6,938   1,925   1,891 
Net Income $7,004  $3,771  $5,842 


TABLE OF CONTENTS

  Consolidated
Subsidiaries
 Parent Consolidated
Total
 
  (Dollars in Thousands) 
For the year ended 2013:          
Net income $19,925 $ $19,925 
Other comprehensive (loss) income, net of tax:          
Net unrealized loss on investment securities  (8,073)  79  (7,994) 
Actuarial gain  387    387 
Total other comprehensive (loss) income  (7,686)  79  (7,607) 
Total comprehensive income $12,239 $79 $12,318 
           
For the year ended 2012:          
Net income $17,507 $ $17,507 
Other comprehensive income, net of tax:          
Net unrealized gain on investment securities  10,935  41  10,976 
Actuarial loss  (467)    (467) 
Total other comprehensive income  10,468  41  10,509 
Total comprehensive income $27,975 $41 $28,016 
           
For the year ended 2011:          
Net income $13,926 $ $13,926 
Other comprehensive income, net of tax:          
Net unrealized gain (loss) on investment securities  3,301  (7)  3,294 
Actuarial loss  (1,065)    (1,065) 
Total other comprehensive income (loss)  2,236  (7)  2,229 
Total comprehensive income $16,162 $(7) $16,155 

Condensed Statements of Cash Flows
  For Years Ended December 31 
  2013 2012 2011 
  (Dollars in Thousands) 
Cash flows from operating activities:          
Net income $19,925 $17,507 $13,926 
Adjustments to reconcile net income to net cash
    provided by operating activities:
          
Net gains on available for sale securities  (22)  (26)   
Equity in undistributed earnings of subsidiary  (15,916)  (15,709)  (13,455) 
Change in deferred tax asset      3 
(Increase) decrease in other assets  (167)  563  (298) 
(Decrease) increase in other liabilities  (276)  (772)  220 
Stock based compensation  59  39  35 
Net cash provided by operating activities  3,603  1,602  431 
Cash flows from investing activities:          
Proceeds from sales of available-for-sale securities  181  375   
Purchase of available-for-sale securities    (410)   
Investments in subsidiaries      (1,250) 
Net cash provided by (used in) investing activities  181  (35)  (1,250) 
Cash flows from financing activities:          
Net decrease in borrowings      (310) 
Cash dividends on common stock  (4,254)  (2,778)  (1,955) 
Cash dividends on preferred stock  (141)  (363)  (417) 
Proceeds from issuance of Series B preferred stock      11,250 
Redemption of Series A preferred stock      (10,000) 
Warrant repurchased      (245) 
Issuance of restricted stock award  243     
Issuance cost of common stock  (13)  (8)  (5) 
Issuance cost of Series B preferred stock      (84) 
Proceeds from exercise of stock options  21  141  328 
Tax expense from stock based compensation  16  28   
Net cash used in financing activities  (4,128)  (2,980)  (1,438) 
Decrease in cash and cash equivalents  (344)  (1,413)  (2,257) 
Cash and cash equivalents at beginning of year  629  2,042  4,299 
Cash and cash equivalents at the end of year $285 $629 $2,042 
F-60

CENTER BANCORP, INC. AND SUBSIDIARIES

NOTES TO CONSOLIDATED FINANCIAL STATEMENTS

Note 19 — Parent Corporation Only Financial Statements  – (continued)

Condensed Statements of Cash Flows

   
 For Years Ended December 31
   2010 2009 2008
   (Dollars in Thousands)
Cash flows from operating activities:
     
Net income $7,004  $3,771  $5,842 
Adjustments to reconcile net income to net cash provided by operating activities:
     
Net losses on available for sale securities  97   325   413 
Equity in undistributed (earnings) of subsidiary  (6,938  (1,925  (1,891
Change in deferred tax asset  224   (111  (1,542
(Increase) decrease in other assets  (44  1,838   41 
Increase (decrease) in other liabilities  70   (844  1,610 
Stock based compensation  51   77   128 
Net cash provided by operating activities  464   3,131   4,601 
Cash flows from investing activities:
     
Purchases of available-for-sale securities        (579
Maturity of available-for-sale securities  130   659   938 
(Investments in subsidiaries) and return of capital from subsidiaries  (8,000  (19,000  3,500 
Net cash (used in) provided by investing activities  (7,870  (18,341  3,859 
Cash flows from financing activities:
     
Net (decrease) in borrowings  (82  (411  (1,197
Cash dividends paid on common stock  (1,800  (3,166  (4,675
Proceeds from exercise of stock options     57   224 
Proceeds from restricted stock  25      25 
Proceeds from issuance of preferred stock and warrants     10,000    
Cash dividends paid on preferred stock  (500  (425   
Proceeds from issuance of shares from stock offerings  12,148   11,000    
Issuance cost of common stock from common stock offering  (770           
Purchase of treasury stock        (1,924
Issuance cost of common stock  (6  (11  (19
Tax (expense) from stock based compensation  7   (73  (78
Net cash provided by (used in) financing activities  9,022   16,971   (7,644
Increase in cash and cash equivalents  1,616   1,761   816 
Cash and cash equivalents at beginning of year  2,683   922   106 
Cash and cash equivalents at the end of year $4,299  $2,683  $922 

TABLE OF CONTENTS

CENTER BANCORP, INC. AND SUBSIDIARIES

NOTES TO CONSOLIDATED FINANCIAL STATEMENTS

Note 2021 — Quarterly Financial Information of Center Bancorp, Inc. (Unaudited)

    
 2010
   4th Quarter 3rd Quarter 2nd Quarter 1st Quarter
   (Dollars in Thousands, Except per Share Data)
Total interest income $11,519  $12,035  $12,488  $12,672 
Total interest expense  3,138   3,653   3,831   4,163 
Net interest income  8,381   8,382   8,657   8,509 
Provision for loan losses  2,048   1,307   781   940 
Total other income, net of securities gains  989   1,102   825   895 
Net securities gains (losses)  315   1,033   657   (3,344
Other expense  5,997   5,442   6,268   6,392 
Income (loss) before income taxes  1,640   3,768   3,090   (1,272
Provision (Benefit) from income taxes  (930  1,629   1,076   (1,553
Net income $2,570  $2,139  $2,014  $281 
Net income available to common stockholders $2,426  $1,993  $1,868  $136 
Earnings per share:
     
Basic $0.15  $0.14  $0.13  $0.01 
Diluted $0.15  $0.14  $0.13  $0.01 
Weighted average common shares outstanding:
     
Basic  16,289,832   14,649,397   14,574,832   14,574,832 
Diluted  16,290,071   14,649,397   14,576,223   14,579,871 

    
 2009 2013 
 4th Quarter 3rd Quarter 2nd Quarter 1st Quarter 4th Quarter 3rd Quarter 2nd Quarter 1st Quarter 
 (Dollars in Thousands, Except per Share Data) (Dollars in Thousands, Except per Share Data) 
Total interest income $12,971  $13,491  $12,706  $11,942  $14,644 $14,541 $13,979 $14,104 
Total interest expense  4,953   6,050   6,079   5,563   2,778  2,819  2,751  2,734 
Net interest income  8,018   7,441   6,627   6,379   11,866  11,722  11,228  11,370 
Provision for loan losses  2,740   280   156   1,421   350       
Total other income, net of securities gains  968   822   841   784   1,307  1,200  1,107  1,526 
Net securities gains (losses)  (1,308  (511  1,710   600 
Net securities gains  449  343  600  319 
Other expense  5,238   5,186   7,314   5,319   6,459  6,205  6,076  6,538 
Income before income taxes  (300  2,286   1,708   1,023   6,813  7,060  6,859  6,677 
Provision (Benefit)for income taxes  (536  751   507   224 
Provision from income taxes  1,829  1,966  1,936  1,753 
Net income $236  $1,535  $1,201  $799  $4,984 $5,094 $4,923 $4,924 
Net income available to common stockholders $94  $1,387  $1,053  $670  $4,955 $5,066 $4,895 $4,868 
Earnings per share:
                  
Basic $0.01  $0.11  $0.08  $0.05  $0.30 $0.31 $0.30 $0.30 
Diluted $0.01  $0.11  $0.08  $0.05  $0.30 $0.31 $0.30 $0.30 
Weighted average common shares outstanding:
                  
Basic  14,531,387   13,000,601   12,994,429   12,991,312   16,350,183  16,349,480  16,348,915  16,348,215 
Diluted  14,534,255   13,005,101   12,996,544   12,993,185   16,396,931  16,385,155  16,375,774  16,373,588 

  2012 
  4th Quarter 3rd Quarter 2nd Quarter 1st Quarter 
  (Dollars in Thousands, Except per Share Data) 
Total interest income $14,263 $14,118 $13,496 $13,395 
Total interest expense  2,841  2,935  2,950  3,050 
Net interest income  11,422  11,183  10,546  10,345 
Provision for loan losses  100  225  (107)  107 
Total other income, net of securities
    gains
  1,217  1,872  1,091  1,018 
Net securities (losses) gains  (201)  763  513  937 
Other expense  6,193  7,507  5,690  5,807 
Income before income taxes  6,145  6,086  6,567  6,386 
Provision from income taxes  1,676  1,632  2,214  2,155 
Net income $4,469 $4,454 $4,353 $4,231 
Net income available to common
    stockholders
 $4,441 $4,426 $4,269 $4,090 
Earnings per share:             
Basic $0.27 $0.27 $0.26 $0.25 
Diluted $0.27 $0.27 $0.26 $0.25 
Weighted average common shares
    outstanding:
             
Basic  16,347,564  16,347,088  16,333,653  16,332,327 
Diluted  16,363,698  16,362,635  16,341,767  16,338,162 
F-61

Note:  Due to rounding, quarterly earnings per share may not sum to reported annual earnings per share.


Note 22 Subsequent Event
 

TABLE OF CONTENTS

On January 20, 2014, the Parent Corporation entered into an Agreement and Plan of Merger (the “Merger Agreement”) with ConnectOne Bancorp, Inc., a New Jersey corporation (“ConnectOne Bancorp”). The Merger Agreement provides that, upon the terms and subject to the conditions set forth therein, ConnectOne Bancorp will merge with and into the Parent Corporation, with the Parent Corporation continuing as the surviving corporation (the “Merger”), and the Parent Corporation will change its name to ConnectOne Bancorp. The Merger Agreement also provides that immediately following the consummation of the Merger, the Bank will merge with and into ConnectOne Bank (the “Bank Merger”), a New Jersey-chartered commercial bank (“ConnectOne Bank”) and a wholly-owned subsidiary of ConnectOne Bancorp, with ConnectOne Bank continuing as the surviving bank. Subject to the terms and conditions of the Merger Agreement, upon completion of the Merger (the “Effective Time”), each share of common stock, no par value per share, of ConnectOne Bancorp (“ConnectOne Common Stock”), issued and outstanding immediately prior to the Effective Time will be converted into and become the right to receive 2.6 shares of the Parent’s Corporation’s common stock. The Merger and the Bank Merger are subject to the receipt of all necessary regulatory approvals, the approvals of the shareholders of the Parent Corporation and ConnectOne Bancorp and other conditions. The parties contemplate that the merger will be consummated during the second or third quarters of 2014, provided that all conditions are satisfied or, where permitted, waived.

66

Item 9. Changes in and Disagreements Withwith Accountants on Accounting and Financial Disclosures

None.

Item 9A. Controls and Procedures

(a) Evaluation of Disclosure Controls and Procedures

The Corporation maintains disclosure controls and procedures that are designed to ensure that information required to be disclosed in its reports filed or submitted pursuant to the Securities Exchange Act of 1934, as amended (“Exchange Act”), is recorded, processed, summarized and reported within the time periods specified in the Securities and Exchange Commission’s rules and forms, and that information required to be disclosed by the Corporation in its Exchange Act reports is accumulated and communicated to management, including the Corporation’s Chief Executive Officer and Chief Financial Officer, to allow timely decisions regarding required disclosure.

Under the supervision and with the participation of its management, including the Corporation’s Chief Executive Officer and Chief Financial Officer, the Corporation evaluated the effectiveness of the design and operation of the Corporation’s disclosure controls and procedures pursuant to Exchange Act Rule 13a-15(e) and 15d-15(e) as of December 31, 2010.2013. Based upon that evaluation, the Corporation’s Chief Executive Officer and Chief Financial Officer concluded that the Corporation’s disclosure controls and procedures were effective as of such date as described below in Management’s Report on Internal Control Over Financial Reporting (Item 9A(b)).

(b) Management’s Report on Internal Control Overover Financial Reporting

The Corporation’s management is responsible for establishing and maintaining adequate internal control over financial reporting as defined in Rules 13a-15(f) of the Exchange Act. The Corporation’s internal control system is a process designed to provide reasonable assurance to the Corporation’s management, Board of Directors and shareholders regarding the reliability of financial reporting and the preparation and fair presentation of financial statements for external reporting purposes in accordance with U.S. generally accepted accounting principles. Our internal control over financial reporting includes policies and procedures that pertain to the maintenance of records that, in reasonable detail, accurately and fairly reflect transactions and dispositions of assets; provide reasonable assurances that transactions are recorded as necessary to permit preparation of financial statements in accordance with U.S. generally accepted accounting principles and that receipts and expenditures are being made only in accordance with authorizations of management and the directors of the Corporation; and provide reasonable assurance regarding prevention or timely detection of unauthorized acquisition, use or disposition of the Corporation’s assets that could have a material effect on our financial statements.

All internal control systems, no matter how well designed, have inherent limitations. Therefore, even those systems determined to be effective can provide only reasonable assurance with respect to financial statement preparation and presentation. Also, projections of any evaluation of effectiveness to future periods are subject to the risk that controls may become inadequate because of changes in conditions, or that the degree of compliance with the policies or procedures may deteriorate.

As part of the Corporation’s program to comply with Section 404 of the Sarbanes-Oxley Act of 2002, our management assessed the effectiveness of the Corporation’s internal control over financial reporting as of December 31, 20102013 (the “Assessment”). In making this Assessment, management used the control criteria framework of the Committee of Sponsoring Organizations (“COSO”) of the Treadway Commission published in its report entitled Internal Control — Integrated Framework.Framework (1992). Management’s Assessment included an evaluation of the design of the Corporation’s internal control over financial reporting and testing of the operational effectiveness of its internal control over financial reporting. Management reviewed the results of its Assessment with the Audit Committee.

67

Based on this Assessment, management determined that, as of December 31, 2010,2013, the Corporation’s internal control over financial reporting was effective to provide reasonable assurance regarding the reliability of financial reporting and the preparation of financial statements for external purposes in accordance with accounting principles generally accepted in the United States of America.

ParenteBeard LLC,

BDO USA, LLP, the independent registered public accounting firm that audited the Corporation’s consolidated financial statements included in this Annual Report on Form 10-K, has issued an audit report on


TABLE OF CONTENTS

the Corporation’s internal control over financial reporting as of December 31, 2010.2013. The report, which expresses an unqualified opinion on the effectiveness of the Corporation’s internal control over financial reporting as of December 31, 2010,2013, is included in this item under the heading “Report of Independent Registered Public Accounting Firm.”

68

(c) Report of Independent Registered Public Accounting Firm

To the Board of Directors and Stockholders

Center Bancorp, Inc.

We have audited Center Bancorp, Inc.’s and subsidiaries’ (the “Corporation”) internal control over financial reporting as of December 31, 2010,2013, based on criteria established inInternal Control — Integrated Framework (1992) issued by the Committee of Sponsoring Organizations of the Treadway Commission (COSO). Center Bancorp, Inc.’sThe Corporation’s management is responsible for maintaining effective internal control over financial reporting, and for its assessment of the effectiveness of internal control over financial reporting included in the accompanying Management’s Report on Internal Controlinternal control over Financial Reporting.financial reporting. Our responsibility is to express an opinion on the Corporation’s internal control over financial reporting based on our audit.

We conducted our audit in accordance with the standards of the Public Company Accounting Oversight Board (United States). Those standards require that we plan and perform the audit to obtain reasonable assurance about whether effective internal control over financial reporting was maintained in all material respects. Our audit of internal control over financial reporting included obtaining an understanding of internal control over financial reporting, assessing the risk that a material weakness exists, and testing and evaluating the design and operating effectiveness of internal control based on the assessed risk. Our audit also included performing such other procedures as we considered necessary in the circumstances. We believe that our audit provides a reasonable basis for our opinion.

A corporation’s internal control over financial reporting is a process designed to provide reasonable assurance regarding the reliability of financial reporting and the preparation of financial statements for external purposes in accordance with accounting principles generally accepted in the United States of America. A corporation’s internal control over financial reporting includes those policies and procedures that (1) pertain to the maintenance of records that, in reasonable detail, accurately and fairly reflect the transactions and dispositions of the assets of the corporation; (2) provide reasonable assurance that transactions are recorded as necessary to permit preparation of financial statements in accordance with generally accepted accounting principles, and that receipts and expenditures of the corporation are being made only in accordance with authorizations of management and directors of the corporation; and (3) provide reasonable assurance regarding prevention or timely detection of unauthorized acquisition, use, or disposition of the corporation’s assets that could have a material effect on the financial statements.

Because of its inherent limitations, internal control over financial reporting may not prevent or detect misstatements. Also, projections of any evaluation of effectiveness to future periods are subject to the risk that controls may become inadequate because of changes in conditions, or that the degree of compliance with the policies or procedures may deteriorate.

In our opinion, Center Bancorp, Inc. and subsidiaries maintained, in all material respects, effective internal control over financial reporting as of December 31, 2010,2013, based on the criteria established inInternal Control —  Integrated Framework issued by the Committee of Sponsoring Organizations of the Treadway Commission (COSO).

COSO criteria.

We also have audited, in accordance with the standards of the Public Company Accounting Oversight Board (United States), the consolidated statementsstatement of condition of Center Bancorp, Inc. and subsidiaries and the related consolidated statements of income, changes in stockholders’ equity and cash flows for each of the years in the three-year periodyear ended December 31, 20102013 and our report dated March 16, 2011,5, 2014, expressed an unqualified opinion.

/s/ ParenteBeard LLC

ParenteBeard LLC
Reading, Pennsylvania
March 16, 2011


TABLE OF CONTENTS

/s/ BDO USA, LLP

BDO USA, LLP
Philadelphia, Pennsylvania
March 5, 2014 
69

(d) Changes in Internal Controls Over Financial Reporting

There have been no changes in the Company’s internal control over financial reporting identified in the Assessment that occurred during the last fiscal quarter to which this Annual Report on Form 10-K relates that have materially affected, or are reasonably likely to materially affect, the Company’s internal control over financial reporting.

Item 9B. Other Information

None.


TABLE OF CONTENTS

None.

70

PART III

Item 10. Directors and Corporate Governance

The Corporation responds to this item by incorporating herein by reference the material responsive to such item in the Corporation’s definitive proxy statement for its 20112014 Annual Meeting of Stockholders. Certain information on Executive Officers of the registrant is included in Part I, Item 3A of this report, which is also incorporated herein by reference.

The Corporation maintains a code of ethics applicable to the Corporation’s chief executive officer, senior financial professional personnel (including the Corporation’s chief financial officer, principal accounting officer or controller and persons performing similar transactions), all other executive officers and all directors. The Corporation also maintains a code of conduct applicable to all other employees. Copies of both codes were filed as exhibits to the Corporation’s Annual Report on Form 10-K for the year ended December 31, 2003. The Corporation will provide copies of such codes to any person without charge, upon request to Anthony C. Weagley, President and Chief Executive Officer, Center Bancorp, Inc., 2455 Morris Avenue, Union, NJ 07083.

Item 11. Executive Compensation

The Corporation responds to this item by incorporating herein by reference the material responsive to such item in the Corporation’s definitive proxy statement for its 20112014 Annual Meeting of Stockholders.

Item 12. Security Ownership of Certain Beneficial Owners and Management

The Corporation responds to this item by incorporating herein by reference the material responsive to such item in the Corporation’s definitive proxy statement for its 20112014 Annual Meeting of Stockholders.

Stock Compensation Plan Information

For information related to stock based compensation, see Note 16 of the Notes to Consolidated Financial Statements. The following table gives information about the Corporation’s common stock that may be issued upon the exercise of options, warrants and rights under the Corporation’s 2009 Equity Incentive Plan, 1999 Incentive Plan, 1993 Employee Stock Option Plan, 1993 Outside Director Stock Option Plan and 2003 Non-Employee Director Stock Option Plan as of December 31, 2010.2013. These plans were the Corporation’s only equity compensation plans in existence as of December 31, 2010.

2013.
   
Plan Category Number of Securities
to Be Issued Upon
Exercise of Outstanding
Options, Warrants and
Rights
(a)
 Weighted-Average
Exercise Price of
Outstanding Options,
Warrants and
Rights
(b)
 Number of Securities
Remaining Available for
Future Issuance Under
Equity Compensation Plans (Excluding Securities Reflected in Column (a)) (c)
Equity Compensation Plans Approved by Shareholders  198,946  $7.67  – $15.73   843,127 
Equity Compensation Plans Not Approved by Shareholders         
Total  198,946  $7.67  – $15.73   843,127 

Plan Category Number of 
Securities
to Be Issued Upon
Exercise of
Outstanding 
Options,
Warrants and 
Rights
(a)
 Weighted-Average
Exercise Price of
Outstanding Options,
Warrants and Rights
(b)
 Number of Securities
Remaining Available
for Future Issuance
Under Equity
Compensation Plans
(Excluding Securities
Reflected in
Column (a))
(c)
 
Equity Compensation Plans
    Approved by Shareholders
  188,380 $10.55  769,608 
Equity Compensation Plans Not
    Approved by Shareholders
       
Total  188,380 $10.55  769,608 
Item 13. Certain Relationships and Related Transactions

The Corporation responds to this item by incorporating herein by reference the material responsive to such item in the Corporation’s definitive proxy statement for its 20112014 Annual Meeting of Stockholders.

Item 14. Principal AccountantAccounting Fees and Services

The Corporation responds to this item by incorporating herein by reference the material responsive to such item in the Corporation’s definitive proxy statement for its 20112014 Annual Meeting of Stockholders.


TABLE OF CONTENTS

71

PART IV

Item 15. Exhibits, Financial Statement Schedules
(a)(1)  Financial Statements and Schedules:

The following Financial Statements and Supplementary Data are filed as part of this annual report:

Report of Independent Registered Public Accounting Firm

Consolidated Statements of Condition

Consolidated Statements of Income

Consolidated Statements of Changes in Stockholders’ Equity

Consolidated Statements of Cash Flows

Notes to Consolidated Financial Statements

Reports of Independent Registered Public Accounting FirmsF-2
Consolidated Statements of ConditionF-4
Consolidated Statements of IncomeF-5
Consolidated Statements of Comprehensive IncomeF-6
Consolidated Statements of Changes in Stockholders’ EquityF-7
Consolidated Statements of Cash FlowsF-8
Notes to Consolidated Financial StatementsF-9
(b)Exhibits (numbered in accordance with Item 601 of Regulation S-K) filed herewith or incorporated by reference as part of this annual report.

Exhibit
No.
 
Description
Exhibit
No. 2.1
 DescriptionAgreement and Plan of Merger, dated as of January 20, 2014, by and between Center Bancorp, Inc. and ConnectOne Bancorp, Inc. is incorporated by reference to Exhibit 2.1 to the Registrant’s Current Report on Form 8-K filed with the SEC on January 21, 2014.
 3.1 2.2 Bank Purchase and Assumption Agreement, dated February 1, 2012, by and among the Registrant, Saddle River Valley Bancorp and Saddle River Valley Bank is incorporated by reference to Exhibit 2.1 to the Registrant’s Current Report on Form 8-K dated February 2, 2012.
3.1
The Registrant’s Restated Certificate of Incorporation as amended, is incorporated by reference to Exhibit 3.1 to the Registrant’s Current Report on Form 8-K dated June 17, 2010.filed with the SEC on April 15, 2013.
3.2 
The Registrant’s Amended and Restated By-Laws of the Registrant isare incorporated by reference to Exhibit 3.2 to the Registrant’s Annual Report on Form 10-K for the year ended December 31, 1998.
 4.1 Warrant to Purchase up to 173,410 shares of Common Stock, dated January 9, 2009, is incorporated by reference to Exhibit 4.1 to the Registrant’s Current Report on Form 8-K dated January 13, 2009.filed with the SEC on April 15, 2013.
10.1 Letter Agreement, dated January 9, 2009, including theSmall Business Lending Fund — Securities Purchase Agreement — Standard Terms attached thereto dated September 15, 2011, between the Registrant and the United States Department of the Treasury is incorporated by reference to Exhibit 10.1 to the Registrant’s Current Report on Form 8-K dated January 13, 2009.September 21, 2011.
10.2 10.2* The Registrant’s 1993 Employee Stock Option Plan is incorporated by reference to Exhibit 10.3 to the Registrant’s Annual Report on Form 10-K for the year ended December 31, 1993.
10.3 10.3* The Registrant’s 1993 Outside Director Stock Option Plan is incorporated by reference to Exhibit 10.4 to the Registrant’s Annual Report on Form 10-K for the year ended December 31, 1993.
10.5 10.5* The Registrant’s Annual Incentive Plan is incorporated by reference to Exhibit 10.6 to the Registrant’s Annual Report on Form 10-K for the year ended December 31, 2006.
10.6 10.6* AmendedEmployment Agreement, effective April 4, 2012, by and restated employment agreement among the Registrant, its bank subsidiaryUnion Center National Bank and Anthony C. Weagley, effective as of January 1, 2008 is incorporated by reference to Exhibit 10.1 to the Registrant’s Current Report on Form 8-K filed with the SEC on April 22, 2008.6, 2012.
10.7 Non-Competition Agreement, dated as of December 2, 2010, between the Registrant, and Anthony C. Weagley is incorporated by reference to Exhibit 10.1 to the Registrant’s Current Report on Form 8-K dated December 6, 2010.
10.8 Non-Competition Agreement, dated as of December 2, 2010, between the Registrant, and James W. Sorge is incorporated by reference to Exhibit 10.2 to the Registrant’s Current Report on Form 8-K dated December 6, 2010.
10.9 10.9* Center Bancorp, Inc. 2009 Equity Incentive Plan is incorporated by reference to Exhibit 10.1 to the Registrant’s Current Report on Form 8-K dated June 1, 2009.
10.1010.10* Center Bancorp, Inc. 1999 Stock Incentive Plan is incorporated by reference to Exhibit 10.11 to the Registrant’s Annual Report on Form 10-K for the year ended December 31, 1999.


TABLE OF CONTENTS

72

Exhibit
No.
 
Exhibit
No.
Description
10.11 Registrant’s Placement Agreement dated December 12, 2003 with Sandler O’Neill & Partners, L.P. to issue and sell $5 million aggregate liquidation amount of floating rate MMCapS(SM)MMCapS(SM) Securities is incorporated by reference to Exhibit 10.15 of the Registrant’s Annual Report on Form 10-K for the year ended December 31, 2003.
10.12 Indenture dated as of December 19, 2003, between the Registrant and Wilmington Trust Company relating to $5.0 million aggregate principal amount of floating rate debentures is incorporated by reference to Exhibit 10.16 of the Registrant’s Annual Report on Form 10-K for the year ended December 31, 2003.
10.13 Amended and restated Declaration of Trust of Center Bancorp Statutory Trust II, dated as of December 19, 2003 is incorporated by reference to Exhibit 10.17 of the Registrant’s Annual Report on Form 10-K for the year ended December 31, 2003.
10.14 Guarantee Agreement between Registrant and Wilmington Trust Company dated as of December 19, 2003 is incorporated by reference to Exhibit 10.18 of the Registrant’s Annual Report on Form 10-K for the year ended December 31, 2003.
10.15 Form of Waiver, executed by each of Lori A. Wunder, A. Richard Abrahamian, Ronald M. Shapiro, William J. Boylan and Anthony C. Weagley is incorporated by reference to Exhibit 10.2 to the Registrant’s Current Report on Form 8-K dated January 13, 2009.
10.16Form of Executive Waiver Agreement, executed by each of Lori A. Wunder, A. Richard Abrahamian, Ronald M. Shapiro, William J. Boylan and Anthony C. Weagley is incorporated by reference to Exhibit 10.3 to the Registrant’s Current Report on Form 8-K dated January 13, 2009
10.17Registration Rights Agreement, dated September 29, 2004, relating to securities issued in a September 2004 private placement of securities, is incorporated by reference to Exhibit 10.2 to the Registrant’s Current Report on Form 8-K dated October 1, 2004.
10.1810.16* The Registrant’s Amended and Restated 2003 Non-Employee Director Stock Option Plan, as amended and restated, is incorporated by reference to Exhibit 10.1 to the Registrant’s Current Report on Form 8-K dated March 5, 2008.
10.1910.17* Amended and restated Employment Agreement among the Registrant, its bank subsidiary and Mark S. Cardone, effective as of January 1, 2007, is incorporated by reference to Exhibit 10.4 to the Registrant’s Current Report on Form 10-K filed with the SEC on February 26, 2007. See also Exhibit 10.22.
10.2010.18 Registration Rights Agreement, dated June 30, 2005, relating to securities issued in a June 2005 private placement of securities is incorporated by reference to Exhibit 10.2 to the Registrant’s Current Report on Form 8-K dated June 30, 2005.
10.2110.19* Open Market Share Purchase Incentive Plan is incorporated by reference to exhibit 10.1 to the Registrant’s Current Report on Form 8-K dated January 26, 2006.
10.2210.20* Amendment to Employment Agreement among the Registrant, its bank subsidiary and Mark Cardone, dated December 3, 2007, is incorporated by reference to Exhibit 10.2 to the Registrant’s Current Report on Form 10-K dated December 20, 2007.
10.23Repurchase Agreement, dated September 15, 2011, between the Registrant and the United States Department of the Treasury, with respect to the repurchase of Preferred Stock issued pursuant to TARP is incorporated by reference to Exhibit 10.2 to the Registrant’s Current Report on Form 8-K dated September 21, 2011.
10.24Warrant Letter Agreement, dated December 7, 2011, providing for the repurchase of the warrants issued pursuant to TARP is incorporated by reference to Exhibit 10.1 to the Registrant’s Current Report on Form 8-K dated December 12, 2011.
73

Exhibit
No.
Description
10.25*Employment Agreement, dated as of April 12, 2013, between Union Center National Bank and Mark S. Cardone is incorporated by reference to Exhibit 10.1 to the Registrant’s Current Report on Form 8-K filed with the SEC on April 15, 2013.
10.26*Employment Agreement, dated as of April 12, 2013, between Union Center National Bank and Arthur M. Wein is incorporated by reference to Exhibit 10.2 to the Registrant’s Current Report on Form 8-K filed with the SEC on April 15, 2013.
10.27*Employment Agreement, dated as of April 12, 2013, between Union Center National Bank and James W. Sorge is incorporated by reference to Exhibit 10.3 to the Registrant’s Current Report on Form 8-K filed with the SEC on April 15, 2013.
10.28*Employment Agreement, dated as of April 12, 2013, between Union Center National Bank and Joseph D. Gangemi is incorporated by reference to Exhibit 10.4 to the Registrant’s Current Report on Form 8-K filed with the SEC on April 15, 2013.
10.29*Amendment to Employment Agreement, dated February 18, 2014, between Union Center National Bank and Mark S. Cardone is incorporated by reference to Exhibit 10.1 to the Registrant’s Current Report on Form 8-K filed with the SEC on February 24, 2014.
10.30*Amendment to Employment Agreement, dated February 18, 2014, between Union Center National Bank and Arthur M. Wein is incorporated by reference to Exhibit 10.2 to the Registrant’s Current Report on Form 8-K filed with the SEC on February 24, 2014.
10.31*Amendment to Employment Agreement, dated February 18, 2014, between Union Center National Bank and Joseph D. Gangemi is incorporated by reference to Exhibit 10.3 to the Registrant’s Current Report on Form 8-K filed with the SEC on February 24, 2014.
10.32*
Consulting Agreement, dated as of January 20, 2014, between Center Bancorp, Inc. and Lawrence B. Seidman is incorporated by reference to Exhibit 10.5 to the Registrant’s Current Report on Form 8-K filed with the SEC on January 21, 2014.
10.33Registration Rights Agreement, dated as of January 20, 2014, among Center Bancorp, Inc., Lawrence B. Seidman and the other shareholders named therein is incorporated by reference to Exhibit 10.6 to the Registrant’s Current Report on Form 8-K filed with the SEC on January 21, 2014.
10.34*
Agreement, dated January 20, 2014, among Anthony C. Weagley, Center Bancorp, Inc. and Union Center National Bank, is incorporated by reference to Exhibit 10.7 to the Registrant’s Current Report on Form 8-K filed with the SEC on January 21, 2014.
10.35*Amendment to 2003 Amended and Restated Non-Employee Director Stock Option Plan is incorporated by reference to Exhibit 10.8 to the Registrant’s Current Report on Form 8-K filed with the SEC on January 21, 2014.
74

Exhibit
No.
Description
11.1  Statement regarding computation of per share earnings is omitted because the computation can be clearly determined from the material incorporated by reference in this Report.
12.1 Statement of Ratios of Earnings to Fixed Charges.
14.1 Code of Ethics is incorporated by reference to Exhibit 14.1 of the Registrant’s Annual Report on Form 10-K for the year ended December 31, 2003.
21.1 Subsidiaries of the Registrant.
23.1  Consent of Independent Registered Public Accounting Firm.BDO, USA LLP.
23.2Consent of ParenteBeard, LLC.
24.1 Power of attorney
31.1 Personal certification of the chief executive officer pursuant to section 302 of the Sarbanes-Oxley Act of 2002.

TABLE OF CONTENTS

Exhibit
No.
Description
31.2 Personal certification of the chief financial officer pursuant to section 302 of the Sarbanes-Oxley Act of 2002.
32.1 32.1** Personal certification of the chief executive officer pursuant to section 906 of the Sarbanes-Oxley Act of 2002.
32.2 32.2** Personal certification of the chief financial officer pursuant to section 906 of the Sarbanes-Oxley Act of 2002.
99.1 Certification of Chief Executive Officer pursuant to Section 111 (b) (4) of the Emergency Economic Stabilization Act of 2008.
99.2 Certification of Chief Financial Officer pursuant to Section 111 (b) (4) of the Emergency Economic Stabilization Act of 2008.
99.3 Code of Conduct is incorporated by reference to Exhibit 99.1 to the Registrant’s Annual Report on Form 10-K for the year ended December 31, 2003.
101 .INS***
 XBRL instance document
101 .SCH***
XBRL Taxonomy Extension Schema Document
101 .CAL***
XBRL Taxonomy Extension Calculation Linkbase Document
101 .DEF***
XBRL Taxonomy Extension Definition Linkbase Document
101 .LAB***
XBRL Taxonomy Extension Label Linkbase Document
101 .PRE ***
XBRL Taxonomy Extension Presentation Linkbase Document
(c)Financial Statement Schedules

*Management contract on compensatory plan or arrangement.
**Furnished herewith.
***XBRL (Extensible Business Reporting Language) information is furnished and not filed or a part of a registration statement or prospectus for purposes of Sections 11 or 12 of the Securities Act of 1933, as amended, is deemed not filed for purposes of Section 18 of the Securities Exchange Act of 1934, as amended, and otherwise is not subject to liability under these sections.
All financial statement schedules are omitted because they are either inapplicable or not required, or because the required information is included in the Consolidated Financial Statements or notes thereto.


75

SIGNATURES

Pursuant to the requirements of Section 13 or 15(d) of the Securities Exchange Act of 1934, Center Bancorp, Inc. has duly caused this report to be signed on its behalf by the undersigned, thereunto duly authorized.

 
CENTER BANCORP, INC.
March 16, 20115, 2014By:By:
 

By:

/s/ Anthony C. Weagley

Anthony C. Weagley
President and Chief Executive Officer

Pursuant to the requirements of the Securities Exchange Act of 1934, the following persons on behalf of the Registrant, in the capacities described below on March 16, 2011,5, 2014, have signed this report below.

/s/ Alexander A. Bol*
Alexander A. Bol
 Chairman of the Board
   Alexander A. Bol
/s/ James J. Kennedy*
James J. KennedyFrederick S. Fish *
 Director
   Frederick S. Fish
/s/ Howard Kent*
Howard Kent
 Director
   Howard Kent
/s/ Phyllis Klein*
Phyllis KleinNicolas Minoia*
 Director
   Nicholas Minoia
/s/ Nicolas Minoia*
Nicholas MinoiaHarold Schechter*
 Director
/s/ Harold Schechter*
Harold Schechter
 Director
/s/ Lawrence B. Seidman*
Director
Lawrence B. Seidman Director
/s/ Alan H. Straus*
Alan H. Straus
Director
/s/ William A. Thompson*
Director
William A. Thompson Director
/s/ Raymond Vanaria*
Raymond Vanaria
 Director
   Raymond Vanaria
/s/ Anthony C. Weagley
Anthony C. Weagley
 President and Chief Executive Officer
   Anthony C. Weagley
/s/ Francis R. Patryn*
Patryn *
Vice President, Treasurer and Chief Financial Officer
Francis R. Patryn Chief Financial Officer and
Chief Accounting Officer

*By:

/s/ Anthony C. Weagley
Anthony C. Weagley
Attorney-in-fact


75