![]()
file number 000-53149
| ANNUAL REPORT PURSUANT TO SECTION 13 OR 15(d) OF THE SECURITIES EXCHANGE ACT OF 1934 |
| ¨ | |
| TRANSITION REPORT PURSUANT TO SECTION 13 OR 15(d) OF THE SECURITIES EXCHANGE ACT OF 1934 | |
![]()
file number 000-53149

Delaware | 26-0734029 |
(State or Other Jurisdiction of | (I.R.S. Employer |
Incorporation or Organization) | Identification No.) |
850 Shades Creek Parkway | 35209 |
(Address of Principal Executive Offices) | (Zip Code) |
Large accelerated filer¨ | Accelerated filer | ||
| Non-accelerated filer¨ | Smaller reporting company¨ | ||
$257,793,684.
date.
Class | Outstanding as of February 28, 2014 | |
| Common stock, $.001 par value | 7,420,812 |
| · | “Book value,” changing the amount from 26.34 to 26.35 for 2011 |
| · | “Actual shares outstanding,” changing the amount from 7,346,512 to 7,350,012 for 2013 |
| · | “Return on average stockholders’ equity,” changing the amount from 15.55 to 15.54 for 2013 |
| · | “Efficiency ratio,” changing the amount from 59.57 to 59.93 for 2009 |
| · | “Allowance for loan losses to total gross loans,” changing the amount from 1.24 to 1.22 for 2009 |
| · | “Allowance for loan losses to total non-performing loans,” changing the amount from 122.34 to 120.91 for 2009 |
| · | “Net average loans to average earning assets,” changing the amount from 84.65 to 84.80 for 2013, and from 79.82 to 79.89 for 2012 |
| · | “Noninterest-bearing deposits to total deposits,” changing the amount from 16.96 to 19.54 for 2011 |
| · | “Stockholders’ equity to total assets,” changing the amount from 7.97 to 7.98 for 2011 |
| · | “Percentage change in net income,” changing the amount from (16.10) to (16.09) for 2009 |
In Part II, Item 6 (Selected Financial Data), of our Report, we revised the “Net average loans to average assets” line item for the years ended December 31, 2013 and 2012, changing the ratios from 84.65% to 84.80% and 79.82% to 79.89%, respectively.
In Part II, Item 8 (Financial Statements and Supplementary Data), of our Report, with respect to the line items “Dividends on preferred stock” and “Net income available to common stockholders” in our Consolidated Statements of Income for the year ended December 31, 2013, we revised “Dividends on preferred stock,” changing the amount from 400 to 416 (in thousands) and “Net income available to common stockholders” from 41,217 to 41,201 (in thousands).| 2 | ||
| CAUTIONARY NOTE REGARDING FORWARD-LOOKING STATEMENTS | |||
PART | 4 | ||
| ITEM 1. | BUSINESS | 4 | |
| ITEM 1A. | RISK FACTORS | 25 | |
| ITEM 1B. | UNRESOLVED STAFF COMMENTS | 38 | |
| ITEM 2. | PROPERTIES | 38 | |
| ITEM 3. | LEGAL PROCEEDINGS | 39 | |
| ITEM 4. | MINE SAFETY DISCLOSURES | 40 | |
PART II. | 40 | ||
| ITEM | MARKET FOR REGISTRANT’S COMMON EQUITY, RELATED STOCKHOLDER MATTERS AND ISSUER PURCHASES OF EQUITY SECURITIES | ||
| ITEM 6. | SELECTED FINANCIAL DATA | ||
| ITEM 7. | MANAGEMENT’S DISCUSSION AND ANALYSIS OF FINANCIAL CONDITION AND RESULTS OF OPERATIONS | ||
| ITEM 7A. | QUANTITATIVE AND QUALITATIVE DISCLOSURES ABOUT MARKET RISK | ||
| ITEM 8. | FINANCIAL STATEMENTS AND SUPPLEMENTARY DATA | ||
| ITEM 9. | CHANGES IN AND DISAGREEMENTS WITH ACCOUNTANTS ON ACCOUNTING AND FINANCIAL | ||
| ITEM 9A. | CONTROLS AND PROCEDURES | ||
| ITEM 9B. | OTHER INFORMATION | ||
PART | 108 | ||
| ITEM 10. | DIRECTORS, EXECUTIVE OFFICERS AND CORPORATE GOVERNANCE | ||
| ITEM 11. | EXECUTIVE COMPENSATION | ||
| ITEM 12. | SECURITY OWNERSHIP OF CERTAIN BENEFICIAL OWNERS AND MANAGEMENT AND RELATED STOCKHOLDER MATTERS | ||
| ITEM 13. | CERTAIN RELATIONSHIPS AND RELATED TRANSACTIONS, AND DIRECTOR INDEPENDENCE | ||
| ITEM 14. | PRINCIPAL | ||
PART | 109 | ||
| ITEM 15. | EXHIBITS AND FINANCIAL STATEMENT SCHEDULES | ||
| SIGNATURES | |||
| EXHIBIT INDEX | |||
| 3 | ||
Some of our statements contained in this
| · | the effects of the continued slow economic recovery and high unemployment; |
| · | the effects of continued deleveraging of United States citizens and businesses; |
| · | the effects of potential federal spending cuts due to the United States financial budgetary “sequester”; |
| · | the effects of continued depression of residential housing values and the slow market for sales and resales; |
| · | credit risks, including credit risks resulting from the devaluation of collateralized debt obligations (CDOs) and/or structured investment vehicles to which we currently have no direct exposure; |
| · | the effects of governmental monetary and fiscal policies and legislative and regulatory changes; |
| · | the effects of hazardous weather such as the tornados that struck the state of Alabama in April 2011 and January 2012; |
| · | the effects of competition from other commercial banks, thrifts, mortgage banking firms, consumer finance companies, credit unions, securities brokerage firms, insurance companies, money market and other mutual funds and other financial institutions operating in our market area and elsewhere, including institutions operating regionally, nationally and internationally, together with competitors offering banking products and services by mail, telephone and the internet; |
| · | the effect of any merger, acquisition or other transaction to which we or any of our subsidiaries may from time to time be a party, including our ability to successfully integrate any business that we acquire; |
| · | deterioration in the financial condition of borrowers resulting in significant increases in loan losses and provisions for those losses; |
| · | the effect of changes in interest rates on the level and composition of deposits, loan demand and the values of loan collateral, securities and interest sensitive assets and liabilities; |
| · | the effects of terrorism and efforts to combat it; |
| · | the results of regulatory examinations; |
| · | changes in state and federal legislation, regulations or policies applicable to banks and other financial service providers, including regulatory or legislative developments arising out of current unsettled conditions in the economy, including implementation of the Dodd-Frank Wall Street Reform and Consumer Protection Act (the “Dodd-Frank Act”); |
| · | the effect of inaccuracies in our assumptions underlying the establishment of our loan loss reserves; and |
| · | other factors that are discussed in the section titled “Risk Factors” in Item 1A. |
All written or oral forward-looking statements attributable to us are expressly qualified in their entirety by this Cautionary Note. Our actual resultsfactors, may differ significantly from those we discuss in these forward-looking statements. For certain other factors, risks and uncertainties that could cause our actual results to differ materially from estimates and projectionsthose contained in theseany forward-looking statements, please readstatements.
| 4 | ||
PART I
We were organized to facilitate the Bank’s ability to serve its customers’ requirements for financial services. banking industry.
| 5 | ||
Markets
Service Areas
Birmingham is locatedtarget customers, which include privately held businesses with $2 million to $250 million in central Alabama approximately 90 miles northwest of Montgomery, Alabama, 146 miles west of Atlanta, Georgia, and 148 miles southwest of Chattanooga, Tennessee. Birmingham is intersected by U.S. Interstates 20, 59 and 65. Jefferson County includes the major business area of downtown Birmingham. North Shelby County also encompasses a growing business community and affluent residential areas. With two offices in Jefferson County and one in north Shelby County, we believe we are well positioned to access the most affluent areas of the Birmingham-Hoover MSA.
We also operate in the Huntsville, Alabama MSA, the Montgomery, Alabama MSA and the Dothan, Alabama MSA. We believe the Huntsville market offers substantial growth as one of the strongest technology economies in the nation, with over 300 companies performing sophisticated government, commercial and university research. Huntsville has one of the highest concentrations of engineers in the United States, as well as one of the highest concentrations of Ph.D.s. Huntsville is located in North Alabama off U.S. Interstate 65 between Birmingham and Nashville, Tennessee. Montgomery is the capital and one of the largest cities in Alabama and home to the Hyundai Motor Manufacturing plant, which began production in May 2005. Montgomery is located in central Alabama between Birmingham and Mobile, Alabama and is intersected by U.S. Interstates 65 (connecting Birmingham and Mobile) and 85 (connecting Montgomery to Atlanta, Georgia). Dothan is located in the southeastern corner of Alabama near the Georgia and Florida state lines and is 35 miles from U.S. Interstate 10 which runs through the panhandle of Florida and connects Mobile, Alabama to Tallahassee and Jacksonville, Florida. Dothan is also intersected by U.S. Highways 231, 431 and 84, which are common trucking lanes, and has local access to rail transportation and the Chattahoochee River. With two offices in each of Madison, Montgomery and Houston Counties, we believe that we have a base of banking resources to serve such counties.
In April 2011 we opened our first office outside of Alabama in Pensacola, Florida. We hired an experienced team of veteran Pensacola bankers to help us establish this office. Pensacola is located in the Florida panhandle approximately 50 miles east of Mobile, Alabama, and 40 miles west of Fort Walton, Florida, with easy access to U.S. Interstate 10 just minutes away. Pensacola is a regional hub for healthcare and retail, with an important manufacturing sector, military presence, a strong tourism presence and a broadly diversified economy.
We conduct a general consumer and commercial banking business, emphasizing personal banking services to commercial firms,annual sales, professionals and affluent consumers who we believe are underserved by the large regional banks that operate in our markets. We also seek to capitalize on the extensive relationships that our management, directors, advisory directors and stockholders have with the businesses and professionals in our markets. We believe this philosophy has attracted and will continue to attract customers and capture market share historically controlled by other financial institutions operating in our markets.
| 6 | ||
| · | the availability of successful, experienced bankers with strong reputations in the market; and |
| · | the economic attributes of the market necessary to drive quality lending opportunities coupled with deposit-related attributes of the potential market. |
Local Economy of Service Areas
Birmingham. Jefferson and Shelby Counties are the primary counties for the seven-county Birmingham-Hoover MSA, which had a 2011 population of 1,134,536. With a 2011 population of 656,717, Jefferson County includes Alabama’s largest city – Birmingham and is Alabama’s most populated county. Shelby County has a population of 200,582 and is among the fastest growing counties in the U.S. Between 2000 and 2011, Shelby County’s population increased 40%.
Jefferson and Shelby Counties have the highest population density in the Birmingham-Hoover MSA and accounts for 76% of the population in the entire seven-county region. In 2011, the combined population of Jefferson and Shelby Counties was 857,299 with 335,614 households. Between 2000 and 2011, the counties’ combined population increased 51,959. The projected growth rate for the two counties between 2011 and 2016 is 4% or an additional 33,304 residents, which will bring the total population of the two counties to 890,603.
Serving as the core of the Birmingham-Hoover MSA, Jefferson and Shelby Counties have an employment base of 469,025 – more than 88% of the Birmingham-Hoover MSA’s total employment. The counties combined 2011 average household income is $72,705 and experienced a 40% increase since 2000. The counties’ 2000 to 2011 average household income growth rate is considerably higher than the U.S. average household income growth rate of 28%.
The economic composition of the Birmingham-Hoover MSA is a diverse mixture of traditional and emerging employment sectors. Metals manufacturing is an important historical sector; finance and insurance, healthcare services and distribution are the region’s core economic sectors; and biological; and medical technology; entertainment and diverse manufacturing have been identified as the regions emerging economic sectors.
Finance and insurance is a core economic sector and is among the most specialized economic sectors in the Birmingham-Hoover MSA. Several banks and insurance companies have corporate or regional headquarters in the region, including: Regions Financial Corporation, BBVA Compass, Protective Life, Infinity Insurance and State Farm.
Other major corporations headquartered or with a major presence in the Birmingham-Hoover MSA include: HealthSouth Corporation, Vulcan Materials and AT&T. Moreover, Birmingham serves as the headquarters to six of the country’s top-performing private companies on the elite Forbes 500 list, including O’Neal Steel and Drummond Company.
Healthcare services are also a core economic sector of Metropolitan Birmingham and are highly regarded. The University of Alabama at Birmingham (UAB) is Alabama’s largest employer with more than 19,000 employees and is among the elite healthcare centers in the U.S. UAB’s annual economic impact is estimated at more than $4.6 billion; in 2009, UAB received $489 million in outside research funding. Additionally, Birmingham is home to the largest nonprofit independent research laboratory in the Southeast – Southern Research Institute. These two institutions provide the basis of the region’s growing biotechnology sector.
Diverse manufacturing is an emerging economic sector and is spearheaded by the presence of two major automotive manufacturing facilities – Mercedes Benz U.S. International and Honda Manufacturing of Alabama. These automotive manufacturing facilities together employ more than 7,000 and serve as the basis for the region’s growth in transportation equipment manufacturing.
Unless otherwise stated, the foregoing and other pertinent data can be found on the websites of the Birmingham Regional Chamber of Commerce and the Federal Deposit Insurance Corporation (the “FDIC”).
Huntsville.Huntsville, Madison County, is the life-center for North Alabama and has seen steady growth since the 1960’s. Today there are nearly one million people within a 50-mile radius of Huntsville. The metropolitan population is diverse and rich in culture, with many residents moving into the area as a technology destination from all 50 states and numerous countries, including Japan, Switzerland, Korea, Germany and the U.K. In 2010, the Huntsville, Alabama MSA (which includes Madison and Limestone Counties) was the second largest metropolitan area in the state with a population of 417,593 people, up 21.5% from the 2000 U.S. Census. Madison County’s population was 334,811, up 20.5% from the 2000 Census. The Huntsville MSA population grew at over twice the rate of the rest of Alabama and the U.S. as a whole. According to a 2009 estimate, the average household income was $73,316 for the Huntsville MSA, $75,911 for Madison County, $71,775 for the City of Huntsville, and $96,219 for the City of Madison.
Huntsville offers substantial growth as one of the strongest technology economies in the nation with one of the highest concentrations of engineers and Ph.D’s in the United States. Huntsville has a number of major government programs, including NASA programs such as the Space Station and Space Shuttle Propulsion and U.S. Army programs such as the National Space and Missile Defense Command, Army Aviation and Foreign Military Sales. Cummings Research Park in Huntsville is now the second largest research park in the United States and the fourth largest research park in the world. Huntsville was ranked number one in the state for announced new and expanding jobs from 2004 to 2008 as well as for 2010, according to the Alabama Development Office. Huntsville was named asForbes magazine’s “Best Place to Live to Weather the Economy” in November 2008. Further,Forbes named Huntsville one of its “Leading Cities for Business” six years in a row, including 2008, as well as one of the “10 Smartest Cities in the World” in 2009.Fortune Small Business Magazine named Huntsville as the country’s “Top Mid-sized City to Launch and Grow a Business” andKiplinger Magazine named Huntsville as the nation’s “Best City” in 2009. Huntsville has one of the highest concentrations ofInc.5000 Companies in the United States and also has a number of offices of Fortune 500 companies. Major employers in Huntsville include the U.S. Army/Redstone Arsenal, the Boeing Company, NASA/Marshall Space Flight Center, Intergraph Corporation, ADTRAN, Inc., Northrop Grumman, Cinram, SAIC, DirecTV, Lockheed Martin, and Toyota Motor Manufacturing of Alabama. Job growth in the Huntsville metro area has been strong, with 23,300 net new jobs since 2000 compared to a net loss of jobs during that same period of time for Alabama and the United States. Professional and business service employment in the Huntsville metro area grew by 45.9% from 2000-2010, adding a total of 15,300 workers primarily in professional, scientific and technical fields. This accounts for approximately 70% of the total U.S. professional & business service growth this decade.
In total, new and expanding industry in Huntsville/Madison County in 2010 amounted to 61 projects, 2,901 jobs, and almost $153 million in capital investment. Major projects include new government contracts in missile defense with Lockheed Martin’s Integrated Test Center, Raytheon’s Standard Missile Production facility and new growth at APT Research and Northrop Grumman. Dynetics broke ground on the company’s new prototype engineering center in Cummings Research Park, in which it has invested $52 million and created 350 new jobs. Integration Innovation Inc. also expanded in the park. New government operations included the continued implementation of BRAC as well as the arrival of the U.S. Army Contracting Command and the Defense Acquisition University. Additionally, leaders with Redstone Arsenal and the city of Huntsville presented the designs for Redstone Gateway, a 468-acre development that will help with growth on Redstone Arsenal and from new contractors coming because of BRAC 2005. The office park will be located just outside of gate 9 at Redstone Arsenal, and will ultimately contain hotels, restaurants and 4.4 million square feet of office space.
The foregoing and other pertinent data are available on the Huntsville/Madison County Chamber of Commerce’s and the FDIC’s websites.
Montgomery. Montgomery is Alabama’s second largest city and is the capital of Alabama. We have identified Montgomery as a high-growth market for us, second in the state of Alabama only to Huntsville in the growth of new jobs from 2000-2007. A recent competitive assessment conducted by Market Street Services on behalf of the Montgomery Area Chamber of Commerce shows Montgomery outpacing the State of Alabama as a whole, as well as the benchmark cities of Richmond, Virginia, Little Rock, Arkansas, and Shreveport, Louisiana, with an 11.1% increase in net new jobs during the same period. It is also noteworthy that, according to Market Street, Montgomery had more jobs in March 2010 than it did in March 2000, unlike Richmond, the State of Alabama, and the United States.
The Montgomery MSA comprises 367,475 residents, and is the fourth most populous MSA in Alabama. Over the past 15 years 16,500 jobs have been created in the metro area, an increase of 11%. The area’s wealth has more than doubled since 1990, with a total personal income of $13.2 billion for the Montgomery MSA in 2008. The average median family income grew 25% from 1990 to 2008, from $45,182 to $56,400. The area’s per capita income grew from $18,500 in 1990 to $35,973 in 2009, an increase of 94%.
Recent developments in Montgomery include the more than $1 billion that has been spent on the revitalization of downtown Montgomery and the Riverfront District, including over $200 million on a downtown four-star hotel, performing arts theatre, and convention center complex. Downtown Montgomery also opened a new minor league baseball stadium in 2004, and the Montgomery Regional Airport completed a $40 million renovation and expansion project in 2006.
As its capital city, the State of Alabama employs approximately 9,500 persons in Montgomery, as well as numerous service providers. Montgomery is also home to Maxwell Gunter Air Force Base, which employs more than 12,000 persons, including Air University, the worldwide center for U.S. Air Force leadership and education, in addition to global information technology support systems. In 2010 a new Network Operations Squadron for Air Force Cyber Command and worldwide Air Force Enterprise Call Center created 370 new high-paying civilian and military jobs while strengthening the overall mission of Maxwell/Gunter.
In May of 2005, Hyundai Motor Manufacturing Alabama (HMMA) opened its Montgomery manufacturing plant, which was built with a capital investment of over $1.4 billion. That plant, which now employs over 3,500 people and produces two Hyundai models, has been further expanded with the addition of a new engine plant. That engine plant will also serve the new Kia manufacturing facility in West Point, Georgia. The area has also benefited from the nearly 30 top-tier Hyundai suppliers who have invested over $550 million in new plant facilities, producing almost 8,000 additional jobs. In 2010, HMMA announced an additional $50 million capital investment in order to prepare for the addition of the 2011 Elantra production line.
In 2010, Montgomery led the state in announced new and expanding industries. Hyundai Power Transformers USA will create 1,000 new jobs and invest more than $125 million in Montgomery, the largest project in the State of Alabama for 2010 and the company’s first American manufacturing facility. In addition, approximately 400 new jobs and more than $150 million in capital investment were announced in 2010 as a result of existing industry expansions. Two additional corporate headquarters announced their locations in Montgomery in 2010, Hausted Patient Handling Services and Community Newspaper Holdings Inc.
The foregoing and other pertinent data can be found on the Montgomery Area Chamber of Commerce’s and the FDIC’s websites and recent publications of the Montgomery Area Chamber of Commerce, particularly theMontgomery Business Journal(complete archived editions available at montgomerychamber.com).
Dothan, Dothan, in Houston County, is located in the southeastern corner of Alabama and is conveniently placed near the Florida panhandle and Georgia state line. We believe that this market continues to have great potential due to its central hub, its accessibility to large distribution centers, its home to several major corporations, and its current low level of personalized banking services. According to the FDIC, Dothan’s deposit base has grown 28% during the past five years. Furthermore, Dothan’s two largest deposit holders are Regions Bank and Wells Fargo Bank (formerly SouthTrust Bank and more recently Wachovia Bank), each of which has undergone substantial changes in recent years. These changes continue to provide an opportunity for service oriented banks such as ServisFirst. We believe the citizens of Dothan demand the personal service provided by the Bank, making it a more viable option for the current residents than local branches of larger regional competitors. The Bank’s two offices are strategically located in the southeastern and western areas of Dothan, which are growing areas of business activity and development.
In 2009, the Dothan, Alabama MSA had a population of 142,000 people, a 9.8% increase from 2000. Houston County had a population of 99,000, an 11.5% increase from 2000, while the city of Dothan has experienced a 16.8% increase in population since 2000.
We believe Dothan to be a growing market with increased banking needs considering the wide array of industries being serviced. The Dothan area, while being known as the peanut capital, is also home to facilities of several major corporations, including Michelin, Pemco World Aviation, International Paper, Globe Motors, AAA Cooper-Headquarters, and many more. Also, the strong presence of trucking and its strategic positioning in the Southeast market attracts distribution-related projects to the Dothan MSA. For example, the development of the Houston County Distribution Park has allowed companies to take advantage of the 352-acre tract to serve consumers in the Southeast region of the United States. Being only minutes from the Florida state line, the large lots can serve distribution-related projects up to 1.2 million square feet in size.
Dothan is a hub of healthcare for southeast Alabama, southwest Georgia and northwest Florida areas, with two regional hospitals, Southeast Alabama Medical Center employing over 2,000 medical professionals and support staff, and Flowers Hospital employing 1,400 medical professionals and support staff. In January 2012, construction began on the Alabama College of Osteopathic Medicine, a four-year medical college partnering with and located near; the Southeast Alabama Medical Center. The initial construction budget is $60 million, employment will be 80-100 and the first class will begin in the fall of 2013.
The area also has a strong history in the expansion of aviation jobs in Alabama through Enterprise-Ozark Community College (avionics and aviation mechanic training) and Fort Rucker, the Army Aviation Center of the United States. The highly specialized Dothan Airport Industrial Park offers the land and infrastructure to house aviation related projects with runway access to facilities.
Lastly, the agriculture and agribusiness industries are thriving, and the area is home to many of the successful farmers and related businesses. In addition, the agricultural communities in northwestPensacola-Ferry Pass-Brent, Florida, and southwest Georgia are nearbyNashville, Tennessee. We draw most of our deposits from, and conduct most of our lending transactions in, many cases, use Dothan as their hub.
The existence of these industries and the continuing growth in the area allows an opportunity for the Bank to increase its presence and penetration in this market.
The foregoing and other pertinent data can be found on the Dothan Chamber of Commerce’s and the FDIC’s websites.
Pensacola. The Pensacola-Ferry Pass-Brent MSA (Escambia and Santa Rosa Counties) has a population of more than 450,000, up from 412,000 in 2000. Population in the Pensacola city limits totals 53,752, down from 56,255 in 2000. Pensacola is served by the Pensacola Gulf Coast Regional Airport, which transports over 1.5 million passengers per year, representing more traffic than the airports in Mobile and Fort Walton combined.
The Pensacola and Northwest Florida economies are driven by tourism, military, health services, and medical technologies industries. Five major military bases are located in northwest Florida: Eglin Air Force Base, Hurlburt Field, Pensacola Whiting Field, Pensacola Naval Air Station and Corry Station. Pensacola, the cradle of naval aviation, is home to the U.S. Navy’s precision flight team, the Blue Angels, and has trained naval aviators for decades. Defense spending by these bases totals nearly $5 billion annually. Other major employers in the area include Sacred Heart Health System, Baptist Healthcare, West Florida Regional Hospital, Gulf Power Company (Southern Company), the University of West Florida, International Paper, Ascend Performance Materials (Solutia), GE Wind Energy, Armstrong World Industries, and Wayne Dalton Corporation. The Pensacola Bay area is also home to the Andrews Institute for Orthopaedics and Sports Medicine, a world-leading surgical and research center for human performance enhancement. A vibrant small business sector operates in all areas of the economy.
According to the FDIC, Pensacola MSA Market deposits as of June 30, 2011 totaled approximately $5.1 billion (not including credit union deposits) among 24 banks. Currently, only large regional or national banks dominate Pensacola’s market share. Top market share performers include Regions Bank (22.2%), Wells Fargo Bank (15.2%), Synovus Bank (11.8%), Whitney/Hancock Bank (9.3%), Bank of America (8.4%) and Suntrust Bank (6.4%). We believe this creates the opportunity for a service-oriented community bank such as ServisFirst to not only establish itself but to flourish.
The foregoing and other pertinent data can be found on the Pensacola Chamber of Commerce’s and the FDIC’s websites.
markets.Deposit Growth in Our Markets
| 2011 | 2001 | Compound Annual Growth Rate | ||||||||||
| (Dollars in Billions) | ||||||||||||
| Jefferson/Shelby County, Alabama | $ | 26.5 | $ | 14.5 | 6.22 | % | ||||||
| Madison County, Alabama | 5.9 | 3.2 | 6.31 | % | ||||||||
| Montgomery County, Alabama | 5.9 | 2.9 | 7.36 | % | ||||||||
| Houston County, Alabama | 2.1 | 1.3 | 4.91 | % | ||||||||
| Escambia County, Florida | 3.8 | 2.6 | 3.87 | % | ||||||||
Competition
| Compound | |||||||||
| Annual | |||||||||
| 2013 | 2003 | Growth Rate | |||||||
| (Dollars in Billions) | |||||||||
| Jefferson/Shelby County, Alabama | $ | 24.8 | $ | 16.3 | 4.29 | % | |||
| Madison County, Alabama | 6.1 | 3.7 | 5.13 | % | |||||
| Montgomery County, Alabama | 6.5 | 3.6 | 6.09 | % | |||||
| Houston County, Alabama | 2.2 | 1.3 | 5.40 | % | |||||
| Mobile County, Alabama | 6.0 | 4.7 | 2.47 | % | |||||
| Escambia County, Florida | 3.5 | 3.1 | 1.22 | % | |||||
| 7 | ||
| Market | Number of Branches | Our Market Deposits | Total Market Deposits | Ranking | Market Share Percentage | |||||||||||||||
| (Dollars in Millions) | ||||||||||||||||||||
| Alabama: | ||||||||||||||||||||
| Birmingham-Hoover MSA | 3 | $ | 860.0 | $ | 29,285.0 | 6 | 2.94 | % | ||||||||||||
| Huntsville MSA | 2 | 429.5 | 6,638.7 | 7 | 6.47 | % | ||||||||||||||
| Montgomery MSA | 2 | 284.9 | 7,214.7 | 9 | 3.95 | % | ||||||||||||||
| Dothan MSA | 2 | 208.6 | 2,791.4 | 3 | 7.47 | % | ||||||||||||||
| Florida: | ||||||||||||||||||||
| Pensacola-Ferry Pass-Brent MSA | 1 | 24.9 | 5,076.6 | 20 | 0.49 | % | ||||||||||||||
| Market | |||||||||||||
| Number of | Our Market | Total Market | Share | ||||||||||
| Market | Branches | Deposits | Deposits | Ranking | Percentage | ||||||||
| (Dollars in Millions) | |||||||||||||
| Alabama: | |||||||||||||
| Birmingham-Hoover MSA | 3 | $ | 1,217.3 | $ | 30,175.1 | 5 | 4.03 | % | |||||
| Huntsville MSA | 2 | 540.8 | 6,805.7 | 5 | 7.95 | % | |||||||
| Montgomery MSA | 2 | 374.2 | 7,810.1 | 7 | 4.79 | % | |||||||
| Dothan MSA | 2 | 327.1 | 2,883.9 | 3 | 11.34 | % | |||||||
| Mobile MSA | 1 | 15.2 | 6,041.6 | 18 | 0.25 | % | |||||||
| Florida: | |||||||||||||
| Pensacola-Ferry Pass-Brent MSA | 2 | 202.9 | 4,638.0 | 8 | 4.38 | % | |||||||
2013. Deposits for all institutions in Escambia County represent approximately 0.79% of all the deposits in the state of Florida at June 30, 2013.
Business Strategy
Our philosophy is to operate as an urban community bank emphasizing prompt, personalized customer service to the individuals and businesses located in our primary service areas. We believe this philosophy has attracted and will continue to attract customers and capture market share historically controlled by other financial institutions operating in our market. Our management and employees focus on recognizing customers’ needs and delivering products and services to meet those needs. We aggressively market to businesses, professionals and affluent consumers that may be underserved by the large regional banks that operate in their service areas. We believe that local ownership and control allows us to serve customers more efficiently and effectively and will aid in our growth and success.
Operating Strategy
In order for us to achieve the level of prompt, responsive service necessary to attract customers and to develop our image as an urban bank with a community focus, we have employed the following operating strategies:
Growth Strategy
Because we believe that growth and expansion of our operations are significant factors in our success, we have implemented the following growth strategies:
Lending Services
| 8 | ||
| 9 | ||
2013, but the overall quality of the construction loan portfolio has improved with $9.2 million rated as substandard at December 31, 2013 compared to $14.4 million at December 31, 2012.
| 10 | ||
| · | the asset quality of individual loans; |
| · | changes in the national and local economy and business conditions/development, including underwriting standards, collections, and charge-off and recovery practices; |
| · | changes in the nature and volume of the loan portfolio; |
| · | changes in the experience, ability and depth of our lending staff and management; |
| · | changes in the trend of the volume and severity of past-due loans and classified loans, and trends in the volume of non-accrual loans, troubled debt restructurings and other modifications, as has occurred in the residential mortgage markets and particularly for residential construction and development loans; |
| · | possible deterioration in collateral segments or other portfolio concentrations; |
| · | historical loss experience (when available) used for pools of loans (i.e. collateral types, borrowers, purposes, etc.); |
| · | changes in the quality of our loan review system and the degree of oversight by our board of directors; and |
| · | the effect of external factors such as competition and the legal and regulatory requirement on the level of estimated credit losses in our current loan |
| 11 | ||
2013.
| 12 | ||
However, the description below is not intended to summarize all laws and regulations applicable to us.
| · | acquiring direct or indirect ownership or control of any voting shares of any bank if, after the acquisition, the bank holding company will, directly or indirectly, own or control more than 5% of the bank’s voting shares; |
| · | acquiring all or substantially all of the assets of any bank; or |
| · | merging or consolidating with any other bank holding company. |
| 13 | ||
| · | banking or managing or controlling banks; and |
| · | any activity that the Federal Reserve determines to be so closely related to banking as to be a proper incident to the business of banking. |
| · | factoring accounts receivable; |
| · | making, acquiring, brokering or servicing loans and usual related activities; |
| · | leasing personal or real property; |
| · | operating a non-bank depository institution, such as a savings association; |
| · | trust company functions; |
| · | financial and investment advisory activities; |
| · | discount securities brokerage activities; |
| · | underwriting and dealing in government obligations and money market instruments; |
| · | providing specified management consulting and counseling activities; |
| · | performing selected data processing services and support services; |
| · | acting as an agent or broker in selling credit life insurance and other types of insurance in connection with credit transactions; and |
| · | performing selected insurance underwriting activities. |
| · | lending, trust and other banking activities; |
| · | insuring, guaranteeing, or indemnifying against loss or harm, or providing and issuing annuities, and acting as principal, agent, or broker for these purposes, in any state; |
| · | providing financial, investment, or advisory services; |
| · | issuing or selling instruments representing interests in pools of assets permissible for a bank to hold directly; |
| 14 | ||
| · | underwriting, dealing in or making a market in securities; |
| · | other activities that the Federal Reserve may determine to be so closely related to banking or managing or controlling banks as to be a proper incident to managing or controlling banks; |
| · | foreign activities permitted outside of the United States if the Federal Reserve has determined them to be usual in connection with banking operations abroad; |
| · | merchant banking through securities or insurance affiliates; and |
| · | insurance company portfolio investments. |
Under
this approval requirement for well-capitalized bank holding companies that meet certain conditions.
Bank Regulation and Supervision
| 15 | ||
| · | Assessment Base. An institution’s assessment base equals the institution’s average consolidated total assets during a particular assessment period, minus the institution’s average tangible equity capital (i.e., Tier 1 capital) during such period. |
| · | Assessment Rate. An institution’s assessment rate is assigned by the FDIC on a quarterly basis. To assign an assessment rate, the FDIC designates an institution as falling into one of four risk categories, or as being a large and highly complex financial institution. The FDIC determines an institution’s risk category based on the level of the institution’s capitalization and on supervisory evaluations provided to the FDIC by the institution’s primary federal regulator. Each risk category designation contains upward and downward adjustment factors based on long-term unsecured debt and brokered deposits. Assessment rates currently range from 0.025% per annum for an institution in the lowest risk category with the maximum downward adjustment, to 0.45% per annum for an institution in the highest risk category with the maximum upward adjustment. For the fourth quarter of 2013, the Bank’s assessment rate was set at $0.0133, or $0.0532 annually, per $100 of assessment base. |
| 16 | ||
| · | the Federal Truth-In-Lending Act, governing disclosures of credit terms to consumer borrowers; |
| · | the Home Mortgage Disclosure Act, requiring financial institutions to provide information to enable the public and public officials to determine whether a financial institution is fulfilling its obligation to help meet the housing needs of the community it serves; |
| · | the Equal Credit Opportunity Act, prohibiting discrimination on the basis ofrace, color, religion, national origin, sex, marital status or certain other prohibited factors in all aspects of credit transactions; |
| · | the Fair Credit Reporting Act, governing the use and provision of information to credit reporting agencies; |
| · | the Fair Debt Collection Act, governing the manner in which consumer debts may be collected by debt collectors; |
| · | the Servicemembers’ Civil Relief Act, governing the repayment terms of, and property rights underlying, secured obligations of persons in military service; |
| · | Rules and regulations of the various federal agencies charged with the responsibility of implementing these federal laws. |
| · | the Right to Financial Privacy Act, which imposes a duty to maintain confidentiality of consumer financial records and prescribes procedures for complying with administrative subpoenas of financial records; and |
| · | the Electronic Funds Transfer Act and Regulation E issued by the Consumer Financial Protection Bureau to implement that act, which govern automatic deposits to and withdrawals from deposit accounts and customers’ rights and liabilities arising from the use of automated teller machines and other electronic banking services. |
| 17 | ||
| 18 | ||
| · | A new common equity tier 1 capital to risk-weighted assets ratio of at least 7.0%, inclusive of a 4.5% minimum common equity tier 1 capital ratio, net of regulatory deductions, and a new 2.5% “capital conservation buffer” of common equity to risk-weighted assets; | |
| · | A tier 1 capital ratio of at least 8.5%, inclusive of the 2.5% capital conservation buffer; and | |
| · | A total capital ratio of at least 10.5%, inclusive of the 2.5% capital conservation buffer. |
| · | 4.5% based upon CET1; |
| · | 6.0% based upon tier 1 capital; and |
| · | 8.0% based upon total regulatory capital. |
| 19 | ||
FDIC Insurance Assessments
The FDIC has adopted a risk-based assessment system for insured depository institutions that takes into account the risks attributable to different categories and concentrations of assets and liabilities. The system assigns an institution to one of three capital categories: (1) well capitalized; (2) adequately capitalized; and (3) undercapitalized. These three categories are substantially similar to the prompt corrective action categories described above, with the “undercapitalized” category including institutions that are undercapitalized, significantly undercapitalized, and critically undercapitalized for prompt corrective action purposes. The FDIC also assigns an institution to one of three supervisory subgroups based on a supervisory evaluation that the institution’s primary federal regulator provides to the FDIC and information that the FDIC determines to be relevant to the institution’s financial condition and the risk posed to the deposit insurance funds. In February 2011 the FDIC adopted its final rule relating to the deposit insurance assessment base, assessment rate adjustments, deposit insurance assessment rates, and dividends. Many of the changes to the rules were made as a result of provisions contained in the Dodd-Frank Act and went into effect April 1, 2011. Under the new rules, the base for deposit insurance assessment purposes is defined as average consolidated assets during the assessment period less average tangible equity capital during the assessment period. Insured depository
The FDIC also imposes Financing Corporation (“FICO”) assessments to help pay the $780 million in annual interest payments on the $8 billion of bonds issuedeconomic downturn that began in the late 1980s as part2000s negatively affected the liquidity of many financial institutions. Various bank regulatory publications, including FDIC Financial Institution Letter FIL-13-2010 (Funding and Liquidity Risk Management) and FDIC Financial Institution Letter FIL-84-2008 (Liquidity Risk Management), address the government rescueidentification, measurement, monitoring and control of funding and liquidity risk by financial institutions.
The FDIC may terminate its insurance of deposits ofrequire a bank if it finds that the bank has engaged in unsafe or unsound practices, is in an unsafe or unsound condition to continue operations, or has violated any applicable law, regulation, rule, order or condition imposed by the FDIC.Under the Federal Deposit Insurance Act, an FDIC-insured depository institution can be held liable for any loss incurred by, or reasonably expected, to be incurred by, the FDIC in connection with (1) the default of a commonly controlled FDIC-insured depository institution or (2) any assistance provided by the FDIC to any commonly controlled FDIC-insured depository institution “in danger of default.” “Default” is defined generally as the appointment of a conservator or receiver, and “in danger of default” is defined generally as the existence of certain conditions indicating that a default is likely to occur in the absence of regulatory assistance. The FDIC’s claim for damage is superior to claims of stockholders of the insured depository institution but is subordinate to claims of depositors, secured creditors, and holders of subordinated debt (other than affiliates) of the commonly controlled insured depository institution.
Community Reinvestment Act
The Community Reinvestment Act (“CRA”) requires that, in connection with examinations of financial institutions within their respective jurisdictions, the Federal Reserve or the FDIC will evaluate the record of each financial institution in meetingto maintain sufficient high quality liquid resources to survive an acute stress scenario that lasts for one month. The second metric is the credit needs of“Net Stable Funding Ratio”, and its local community, including low and moderate-income neighborhoods. These factors are also considered in evaluating mergers, acquisitions, and applicationsobjective is to open an office or facility. Failure to adequately meet these criteria could impose additional requirements and limitations on the Bank. Additionally, we must publicly disclose the terms of various CRA-related agreements.
Other Regulations
Interest and other charges collected or contracted for by the Bank are subject to state usury laws and federal laws concerning interest rates.
Federal Laws Applicable to Credit Transactions
The Bank’s loan operations are subject to federal laws applicable to credit transactions, including:
Federal Laws Applicable to Deposit Transactions
The deposit operations of the Bank are subject to:
Capital Adequacy
We and the Bank are required to comply with the capital adequacy standards established by the Federal Reserve (in the case of the holding company) and the FDIC (in the case of the Bank). The Federal Reserve has established a risk-based and a leverage measure of capital adequacy for bank holding companies. The Bank is also subject to risk-based and leverage capital requirements adopted by the FDIC, which are substantially similar to those adopted by the Federal Reserve for bank holding companies.
The risk-based capital standards are designed to make regulatory capital requirements more sensitive to differences in risk profiles among banks and bank holding companies, to account for off-balance-sheet exposure, and to minimize disincentives for holding liquid assets. Assets and off-balance-sheet items, such as letters of credit and unfunded loan commitments, are assigned to broad risk categories, each with appropriate risk weights. The resulting capital ratios represent capital as a percentage of total risk-weighted assets and off-balance-sheet items.
The minimum guideline for the ratio of total capital to risk-weighted assets is 8%. Total capital consists of two components, Tier 1 Capital and Tier 2 Capital. Tier 1 Capital generally consists of common stock, minority interests in the equity accounts of consolidated subsidiaries, noncumulative perpetual preferred stock, and a limited amount of qualifying cumulative perpetual preferred stock, less goodwill and other specified intangible assets. Tier 1 Capital must equal at least 4% of risk-weighted assets. Tier 2 Capital generally consists of subordinated debt, other preferred stock, and a limited amount of loan loss reserves. The total amount of Tier 2 Capital is limited to 100% of Tier 1 Capital. At December 31, 2011, our consolidated ratio of total capital to risk-weighted assets was 12.79%, and our ratio of Tier 1 Capital to risk-weighted assets was 11.39%.
In addition, the Federal Reserve has established minimum leverage ratio guidelines for bank holding companies. These guidelines provide for a minimum ratio of Tier 1 Capital to average assets, less goodwill and other specified intangible assets, of 3% for bank holding companies that meet specified criteria, including having the highest regulatory rating and implementing the Federal Reserve’s risk-based capital measure for market risk. All other bank holding companies generally are required to maintain a leverage ratio of at least 4%. At December 31, 2011, our leverage ratio was 9.17%. The guidelines also provide that bank holding companies experiencing internal growth or making acquisitions will be expected to maintain strong capital positions substantially above the minimum supervisory levels without reliance on intangible assets. The Federal Reserve considers the leverage ratio and other indicators of capital strength in evaluating proposals for expansion or new activities.
Failure to meet capital guidelines could subject a bank or bank holding company to a variety of enforcement remedies, including issuance of a capital directive, the termination of deposit insurance by the FDIC, a prohibition on accepting brokered deposits, and certain other restrictions on its business. As described above, significant additional restrictions can be imposed on FDIC-insured depository institutions that fail to meet applicable capital requirements.
As of December 31, 2011, the Bank’s most recent notification from the FDIC categorized the Bank as well-capitalized under the regulatory framework for prompt corrective action. To remain categorized as well-capitalized, the Bank must maintain minimum total risk-based, Tier 1 risk-based, and Tier 1 leverage ratios as disclosed in the table below. Our management believes that the Bank is well-capitalized under the prompt corrective action provisions as of December 31, 2011.
| To Be Well Capitalized | ||||||||||||||||||||||||
| For Capital Adequacy | Under Prompt Corrective | |||||||||||||||||||||||
| Actual | Purposes | Action Provisions | ||||||||||||||||||||||
| Amount | Ratio | Amount | Ratio | Amount | Ratio | |||||||||||||||||||
| As of December 31, 2011: | ||||||||||||||||||||||||
| Total Capital to Risk Weighted Assets: | ||||||||||||||||||||||||
| Consolidated | $ | 246,334 | 12.79 | % | $ | 154,094 | 8.00 | % | N/A | N/A | ||||||||||||||
| ServisFirst Bank | 243,279 | 12.63 | % | 154,070 | 8.00 | % | $ | 192,588 | 10.00 | % | ||||||||||||||
| Tier I Capital to Risk Weighted Assets: | ||||||||||||||||||||||||
| Consolidated | 219,350 | 11.39 | % | 77,047 | 4.00 | % | N/A | N/A | ||||||||||||||||
| ServisFirst Bank | 216,295 | 11.23 | % | 77,035 | 4.00 | % | 115,553 | 6.00 | % | |||||||||||||||
| Tier I Capital to Average Assets: | ||||||||||||||||||||||||
| Consolidated | 219,350 | 9.17 | % | 95,642 | 4.00 | % | N/A | N/A | ||||||||||||||||
| ServisFirst Bank | 216,295 | 9.06 | % | 95,481 | 4.00 | % | 119,352 | 5.00 | % | |||||||||||||||
Potential Changes in Capital Adequacy Requirements
On December 15, 2010, the Basel Committee on Banking Supervision, a group representing the central banking authorities of 27 nations that formulates recommendations on banking supervisory policy, released its final framework for strengthening international capital and liquidity regulation, known as “Basel III”. Although the Basel III framework is not directly binding on the U.S. bank regulatory agencies, it has been predicted that the regulatory agencies will likely implement changes to the capital adequacy standards applicable to the insured depository institutions and their holding companies in light of Basel III. When fully phased in on January 1, 2019, Basel III will require banks to maintain the following new standards and introduces a new capital measure “Common Equity Tier 1”, or “CET1”. Basel III increases the CET1 to risk-weighted assets to 4.5%, and introduces a capital conservation buffer of an additional 2.5% of common equity to risk-weighted assets, raising the target CET1 to risk-weighted assets ratio to 7%. It requires banks to maintain a minimum ratioamount of Tier 1 capitalstable sources relative to risk weightedthe liquidity profiles of the institution’s assets, of at least 6.0%, plusas well as the capital conservation buffer effectively resulting in Tier 1 capital ratio of 8.5%. Basel III increases the minimum total capital ratio to 8.0% plus the capital conservation buffer, increasing the minimum total capital ratio to 10.5%. Basel III also introduces a non-risk adjusted tier 1 leverage ratio of 3%, based on a measure of total exposure rather than total assets, and newpotential for contingent liquidity standards. The Basel III capital and liquidity standards will be phased inneeds arising from off-balance sheet commitments, over a multi-year period, but the implementation of the new framework will commence January 1, 2013. On that date, to the extentone-year horizon.
therefore at lower yields—than it otherwise might invest. Such lower-yield investments likely would reduce the bank’s revenue stream, and in turn its earnings potential.
| 20 | ||
The Bank’s
We have never paid any dividends and we do not plan to pay dividends in the near future. We anticipate that our earnings, if any, will be held for purposes of enhancing our capital.
| · | a bank’s loans or extensions of credit to affiliates; |
| · | a bank’s investment in affiliates; |
| · | assets a bank may purchase from affiliates, except for real and personal property exempted by the Federal Reserve; |
| · | loans or extensions of credit made by a bank to third parties collateralized by the securities or obligations of affiliates; |
| · | a bank’s guarantee, acceptance or letter of credit issued on behalf of an affiliate; |
| · | a bank’s transactions with an affiliate involving the borrowing or lending of securities to the extent they create credit exposure to the affiliate; and |
| · | a bank’s derivative transactions with an affiliate to the extent they create credit exposure to the affiliate. |
| 21 | ||
On December 4, 2003, President Bush signed the Fair and Accurate Credit Transactions Act, which amended the federal
The FCRA Amendments include, imposes, among other things:
| · | requirements for financial institutions to develop policies and procedures to identify potential identity theft and, upon the request of a consumer, place a fraud alert in the consumer’s credit file stating that the consumer may be the victim of identity theft or other fraud; |
| · | requirements for entities that furnish information to consumer reporting agencies (which would include |
| · | requirements for mortgage lenders to disclose credit scores to |
The FCRA Amendments also prohibit a business that receives consumer information from an affiliate from using that information for marketing purposes unless the consumer is first provided a notice and an opportunity to direct the business not to use the information for such marketing purposes (the “opt-out”), subject to certain exceptions. We do not share consumer information between us and the Bank for marketing purposes, except as allowed under exceptions to the notice and opt-out requirements. Because we do not share consumer information between us and the Bank, the limitations on sharing of information for marketing purposes do not have a significant impact on us.
| · | limitations on the ability of a business that receives consumer information from an affiliate to use that information for marketing purposes. |
The Bank
Proposed Legislation and Regulatory Action
New regulations and statutes are regularly proposed that contain wide-ranging proposals for altering the structures, regulations and competitive relationships of financial institutions operating or doing business in the United States. We cannot predict whether or in what form any proposed regulation or statute will be adopted or the extent to which our business may be affected by any new regulation or statute.
requirements.
| 22 | ||
The Bank’s
The Dodd-Frank Act eliminated
| 23 | ||
The Dodd-Frank Act also broadens the base for FDIC insurance assessments. Assessments will now be based on the average consolidated total assets less tangible equity capital of a financial institution. The Dodd-Frank Act permanently increases the maximum amount of deposit insurance for banks, savings institutions and credit unions to $250,000 per depositor. Noninterest-bearing transaction accounts and certain attorney’s trust accounts have unlimited deposit insurance through December 31, 2012.
The Dodd-Frank Act requires publicly traded companies to give stockholders a non-binding vote on executive compensation and golden parachute payments. In addition, the Dodd-Frank Act authorizesare described or otherwise accounted for in various parts of thisSupervision and Regulationsection. The following items provide a brief description of certain other provisions of the Securities and Exchange Commission to promulgate rules that would allow stockholders to nominate their own candidates using a company’s proxy materials and directs the federal banking regulators to issue rules prohibiting incentive compensation that encourages inappropriate risks.
The Dodd-Frank Act created a new Bureau of Consumer Financial Protection with broad powersthat may be relevant to superviseus and enforce consumer protection laws. The Bureau now has broad rule-making authority for a wide range of consumer protection laws that apply to all banks, including the authority to prohibit “unfair, deceptive or abusive” acts and practices. The Bureau has examination and enforcement authority over all banks with more than $10 billion in assets. Savings institutions with less than $10 billion in assets will continue to be examined for compliance with consumer laws by their primary bank regulator.
bank.
| · | The Dodd-Frank Act created a new Consumer Financial Protection Bureau with broad powers to supervise and enforce consumer protection laws. The Bureau now has broad rule-making authority for a wide range of consumer protection laws that apply to all banks, including the authority to prohibit “unfair, deceptive or abusive” acts and practices. The Bureau has examination and enforcement authority over all banks with more than $10 billion in assets. Institutions with less than $10 billion in assets will continue to be examined for compliance with consumer laws by their primary bank regulator. |
| · | The Dodd-Frank Act imposed new requirements regarding the origination and servicing of residential mortgage loans. The law created a variety of new consumer protections, including limitations on the manner by which loan originators may be compensated and an obligation on the part of lenders to verify a borrower’s “ability to repay” a residential mortgage loan. Final rules implementing these latter statutory requirements are effective in 2014. |
| · | The Dodd-Frank Act eliminated the federal prohibitions on paying interest on demand deposits effective one year after the date of its enactment, thus allowing businesses to have interest-bearing checking accounts. Depending on competitive responses, this significant change to existing law could have an adverse impact on our interest expense. |
| · | The Dodd-Frank Act addresses many aspects of investor protection, corporate governance and executive compensation that will affect most U.S. publicly traded companies. The Dodd-Frank Act (i) requires publicly traded companies to give stockholders a non-binding vote on executive compensation and golden parachute payments; (ii) enhances independence requirements for compensation committee members; (iii) requires companies listed on national securities exchanges to adopt incentive-based compensation claw-back policies for executive officers; (iv) authorizes the Securities and Exchange Commission (the “SEC”) to promulgate rules that would allow stockholders to nominate their own candidates using a company’s proxy materials; and (v) directs the federal banking regulators to issue rules prohibiting incentive compensation that encourages inappropriate risks. |
| · | While insured depository institutions have long been subject to the FDIC’s resolution process, the Dodd-Frank Act creates a new mechanism for the FDIC to conduct the orderly liquidation of certain “covered financial companies,” including bank holding companies and systemically significant non-bank financial companies. Upon certain findings being made, the FDIC may be appointed receiver for a covered financial company, and would conduct an orderly liquidation of the entity. The FDIC liquidation process is modeled on the existing Federal Deposit Insurance Act bank resolution process, and generally gives the FDIC more discretion than in the traditional bankruptcy context. The FDIC has issued final rules implementing the orderly liquidation authority. |
| 24 | ||
| 25 | ||
Recently enacted financial reform legislation will, amongbusiness is also significantly affected by monetary and related policies of the U.S. federal government and its agencies. Changes in any of these policies are influenced by macroeconomic conditions and other things, tighten capital standards, create a new Consumer Financial Protection Bureau and result in new regulationsfactors that are likelybeyond our control. Adverse economic conditions and government policy responses to increase our costs of operations.
On July 21, 2010, the Dodd-Frank Wall Street Reform and Consumer Protection Act (the “Dodd-Frank Act”) was signed into law. As rules and regulations implementing the Dodd-Frank Act are adopted, this new law is significantly changing the current bank regulatory structure and affecting the lending, deposit, investment, trading and operating activities of financial institutions and their holding companies. The Dodd-Frank Act requires various federal agencies to adopt a broad range of new implementing rules and regulations and to prepare numerous studies and reports for Congress. The federal agencies are given significant discretion in drafting the implementing rules and regulations, and consequently, many of the details and much of the impact of the Dodd-Frank Act may not be known for many months or years.
The Dodd-Frank Act eliminated the federal prohibitions on paying interest on demand deposits effective one year after the date of its enactment, thus allowing businesses to have interest-bearing checking accounts. Depending on competitive responses, this significant change to existing law could have an adverse impact on our interest expense.
The Dodd-Frank Act also broadens the base for FDIC insurance assessments. Assessments are now based on the average consolidated total assets less tangible equity capital of a financial institution. The Dodd-Frank Act permanently increases the maximum amount of deposit insurance for banks, savings institutions and credit unions to $250,000 per depositor. Noninterest-bearing transaction accounts and certain attorney’s trust accounts have unlimited deposit insurance through December 31, 2012.
The Dodd-Frank Act requires publicly traded companies to give stockholders a non-binding vote on executive compensation and golden parachute payments. In addition, the Dodd-Frank Act authorizes the Securities and Exchange Commission to promulgate rules that would allow stockholders to nominate their own candidates using a company’s proxy materials and directs the federal banking regulators to issue rules prohibiting incentive compensation that encourages inappropriate risks.
The Dodd-Frank Act created a new Bureau of Consumer Financial Protection with broad powers to supervise and enforce consumer protection laws. The Bureau now has broad rule-making authority for a wide range of consumer protection laws that apply to all banks, including the authority to prohibit “unfair, deceptive or abusive” acts and practices. The Bureau has examination and enforcement authority over all banks with more than $10 billion in assets. Savings institutions with less than $10 billion in assets will continue to be examined for compliance with consumer laws by their primary bank regulator.
As noted above, many aspects of the Dodd-Frank Act are subject to rulemaking and will take effect over several years, making it difficult to anticipate the overall financial impact on us. However, compliance with this new law and its implementing regulations clearly will result in additional operating and compliance costs thatsuch conditions could have a material adverse effect on our business, financial condition, and results of operations.
operations and prospects.
| 26 | ||
Recent government efforts to strengthen the U.S. financial system, including the implementationservices of the American Recoveryour management team and Reinvestment Act (“ARRA”), the Emergency Economic Stabilization Act (“EESA”), the Dodd-Frank Act, and special assessments imposed by the FDIC, subject us, to the extent applicable, to additional regulatory fees, corporate governance requirements, restrictions on executive compensation, restrictions on declaring or paying dividends, restrictions on stock repurchases, limits on tax deductions for executive compensation and prohibitions against golden parachute payments. These fees, requirements and restrictions, as well as any others that may be imposed in the future, may have a material and adverse effect on our business, financial condition, and resultsboard of operations.
Current market conditions have adversely affected, and may continue to adversely affect, us, our customers and our industry.
Because our business is focused exclusively in the southeastern United States, we are particularly exposed to downturns in the U.S. economy in general and in the southeastern economy in particular. Dramatic declines in the housing market over the past three years, with falling home prices and increasing foreclosures, unemployment and under-employment, have negatively impacted the credit performance of mortgage loans and resulted in significant write-downs of asset values by financial institutions, including government-sponsored entities as well as major commercial and investment banks. These write-downs, initially of mortgage-backed securities but spreading to credit default swaps and other derivative and cash securities, in turn, have caused many financial institutions to seek additional capital, to merge with larger and stronger institutions and, in some cases, to fail. Reflecting concern about the stability of the financial markets generallydirectors, and the strengthunexpected loss of counterparties, many lenders and institutional investors have reducedkey officers or ceased providing funding to borrowers, including to other financial institutions. This market turmoil and tightening of credit has led to an increased level of commercial and consumer delinquencies, lack of consumer confidence, increased market volatility and widespread reduction of business activity generally. The resulting economic pressure on consumers and businesses and lack of confidence in the financial markets may adversely affect our customers and thus our business, financial condition, and results of operations. A worsening of these conditions would likely exacerbate any adverse effects of these difficult market conditions on us and others in the financial institutions industry.
Current market volatility and industry developmentsdirectors may adversely affect our business and financial results.operations.
The volatility
Further, if other, particularly larger, financial institutions continue to fail to be adequately capitalized or funded, it may negatively impact our business and financial results. We routinely interact with numerous financial institutionsthe life of Mr. Broughton in the ordinary courseamount of business$5 million. Also, we have hired key officers to run our banking offices in each of the Huntsville, Montgomery, Mobile and are therefore exposed to operational and credit risk to those institutions. Failures of such institutions may significantly adversely impact our operations.
Our profitability is vulnerable to interest rate fluctuations.
As a financial institution, our earnings can be significantly affected by changes in interest rates, particularly our net interest income, the rate of loan prepayments, the volume and type of loans originated or produced, the sales of loans on the secondary marketDothan, Alabama markets and the valuePensacola, Florida market, who are extremely important to our success in such markets. If any of them leaves for any reason, our results of operations could suffer in such markets. With the exception of the key officers in charge of our mortgage servicing rights. Our profitability is dependent to a large extent on our net interest income, which is the difference between our income on interest-earning assetsHuntsville, Montgomery and our expense on interest-bearing liabilities. We are affected by changes in general interest rate levels and by other economic factors beyond our control.
Changes in interest rates also affect the average life of loans and mortgage-backed securities. The relatively lower interest rates in recent periodsDothan banking offices, we do not have resulted in increased prepayments of loans and mortgage-backed securities as borrowers have refinanced their mortgages to reduce their borrowing costs. Under these circumstances, we are subject to reinvestment risk to the extent that we are not able to reinvest such prepayments at rates which are comparable to the rates on the prepaid loansemployment agreements or securities.
We are subject to extensive regulation that could limit or restrict our activities and impose financial requirements or limitations on the conductnon-competition agreements with any of our executive officers, including Messrs. Broughton, Pouncey and Foshee. In the absence of these types of agreements, our executive officers are free to resign their employment at any time and accept an offer of employment from another company, including a competitor. Additionally, our directors’ and advisory board members’ community involvement and diverse and extensive local business which limitationsrelationships are important to our success. Any material change in the composition of our board of directors or restrictionsthe respective advisory boards of the bank could have a material adverse effect on our profitability.
We operate in a highly regulated industry and are subject to examination, supervision and comprehensive regulation by various federal and state agencies including the Federal Reserve, the FDIC and the Alabama Banking Department. Regulatory compliance is costly and restricts certain of our activities, including payment of dividends, mergers and acquisitions, investments, loans and interest rates charged, and interest rates paid on deposits. We are also subject to capitalization guidelines established by our regulators, which require us to maintain adequate capital to support our growth. Violations of various laws, even if unintentional, may result in significant fines or other penalties, including restrictions on branching or bank acquisitions. Recently, banks generally have faced increased regulatory sanctions and scrutiny particularly with respect to the USA Patriot Act and other statutes relating to anti-money laundering compliance and customer privacy. The current recession has had major adverse effects on the banking andbusiness, financial industry, many of which have lost well over 50% of their market capitalization during the past three years due to material and substantial losses in their loan portfolios and substantial write downs of their asset values. As described above, recent legislation has substantially changed, and increased, federal regulation of financial institutions, and there may be significant future legislation (and regulations under existing legislation) that could have a further material effect on banks and bank holding companies like us.
The laws and regulations applicable to the banking industry could change at any time, and we cannot predict the effects of these changes on our business and profitability. Because government regulation greatly affects the business and financialcondition, results of all commercial banksoperations and bank holding companies, our cost of compliance could adversely affect our ability to operate profitably. We are subject to the reporting requirements of the Securities Exchange Act of 1934, the Sarbanes-Oxley Act of 2002 (“Sarbanes-Oxley Act”), and the related rules and regulations promulgated by the Securities and Exchange Commission. These laws and regulations increase the scope, complexity and cost of corporate governance, reporting and disclosure practices over those of non-public companies. Despite our conducting business in a highly regulated environment, these laws and regulations have different requirements for compliance than we experienced prior to becoming a public company. Our expenses related to services rendered by our accountants, legal counsel and consultants will increase in order to ensure compliance with these laws and regulations that we will be subject to as a public company and may increase further as we grow in size.
prospects.
Like all regulated financial institutions, we are affected by monetary policies implemented by the Federal Reserve and other federal instrumentalities. A primary instrument of monetary policy employed by the Federal Reserve is the restriction or expansion of the money supply through open market operations. This instrument of monetary policy frequently causes volatile fluctuations in interest rates, and it can have a direct, material adverse effect on the operating results of financial institutions including our business. Borrowings by the United States government to finance government debt may also cause fluctuations in interest rates and have similar effects on the operating results of such institutions.
Risks Related To Our Business
Our construction and land development loan portfolio and commercial and industrial loan portfolio are both subject to unique risks that could have a material adverse effect on our business, financial condition, and results of operations.operations and prospects.
operations and prospects.
| 27 | ||
Our internal controls
We believe that a control system, no matter how well designed and operated, can provide only reasonable, not absolute, assurance that the objectives of the control system are met. Because of the inherent limitations in all control systems, no evaluation of controls can provide absolute assurance that all control issues and instances of fraud, if any, within a companycredit deterioration or default until they have been detected. We cannot guaranteeoutstanding for some period of time, a process referred to as “seasoning.” As a result, a portfolio of older loans will usually behave more predictably than a newer portfolio. Because a large portion of our portfolio is relatively new, the current level of delinquencies and defaults may not represent the level that may prevail as the portfolio becomes more seasoned. If delinquencies and defaults increase, we will identify significant deficiencies and/or material weaknesses inmay be required to increase our internal controls in the future, and our failure to maintain effective internal controls over financial reporting in accordance with Section 404 of the Sarbanes-Oxley Actprovision for loan losses, which could have a material adverse effect on our business, financial condition, and results of operations.
operations and prospects.
loans.
| 28 | ||
| · | maintaining loan quality; |
| · | maintaining adequate management personnel and information systems to oversee such growth; |
| · | maintaining adequate control and compliance functions; and |
| · | securing capital and liquidity needed to support anticipated growth. |
Failure to manage our growth effectively could adversely affect our ability to successfully implement our business strategy, which could have a material adverse effect on our business, financial condition, results of operations and prospects.
| · | the sale of |
| (or “Series A Preferred Stock”) to the |
| · | the sale of an aggregate of 340,000 shares of our common stock at $30 per share, or $10,200,000, in a private placement completed on June 30, |
| · | the sale of $20,000,000 in 5.5% subordinated notes due November 9, 2022 to accredited investor purchasers, the proceeds of which were used to pay off $15,000,000 in our 8.5% subordinated debentures; and |
| · | the sale of an aggregate of 250,000 shares of our common stock at $41.50 per share, or $10,375,000, in a private placement completed on December 2, 2013. |
| 29 | ||
and prospects.
Additionally, we face competition in our service areas fromde novo community banks, including those with senior management who were previously affiliated with other local or regional banks or those controlled by investor groups with strong local business and community ties. These new, smaller competitors are likely to cater to the same small and medium-size business clientele and with similar relationship-based approaches as we do. Moreover, with their initial capital base to deploy, they could seek to rapidly gain market share by under-pricing the current market rates for loans and paying higher rates for deposits. Thesede novo community banks may offer higher deposit rates or lower cost loans in an effort to attract our customers, and may attempt to hire our management and employees.
| · | our ability to build and maintain long-term customer relationships while ensuring high ethical standards and safe and sound banking practices; |
| · | the scope, relevance and pricing of products and services that we offer; |
| · | customer satisfaction with our products and services; |
| · | industry and general economic trends; and |
| · | our ability to keep pace with technological advances and to invest in new technology. |
Accordingly, any regional or local economic downturn, or natural or man-made disaster, that affects Alabama, the panhandle of Florida or the Nashville, Tennessee MSA, or existing or prospective property or borrowers in such areas, may affect us and our profitability more significantly and more adversely than our more geographically diverse competitors, which could have a material adverse effect on our business, financial condition, results of operations and prospects.
| 30 | ||
results of operations.
Duringoperate effectively, damage our early yearsreputation, result in a loss of operation,customer business, and likelysubject us to additional regulatory scrutiny and possible financial liability, any of which could have a material adverse effect on our business, financial condition, results of operations and prospects.
condition and prospects.
| 31 | ||
We are dependent on Our failure to sustain our historical rate of growth or adequately manage the services of our management team and board of directors, and the unexpected loss of key officers or directors may adversely affect our operations.
If any of our or the Bank’s executive officers, other key personnel, or directors leaves us or the Bank, our operations may be adversely affected. In particular, we believefactors that Thomas A. Broughton III is extremely importanthave contributed to our success and the Bank. Mr. Broughton has extensive executive-level banking experience and is the President and Chief Executive Officer of us and the Bank. If he leaves his position for any reason,growth could have a material adverse effect on our business, financial condition, and results of operations may suffer. The Bank is the beneficiary of a key man life insurance policy on the life of Mr. Broughton in the amount of $5 million. Also, we have hired key officers to run our banking offices in each of the Huntsville, Montgomery and Dothan, Alabama markets and the Pensacola, Florida market, who are extremely important to our success in such markets. If any of them leaves for any reason, our results of operations could suffer in such markets. With the exception of the key officers in charge of our Huntsville, Montgomery and Dothan banking offices, we do not have employment agreements or non-competition agreements with any of our executive officers, including Mr. Broughton. In the absence of these types of agreements, our executive officers are free to resign their employment at any time and accept an offer of employment from another company, including a competitor. Additionally, our directors’ and advisory board members’ community involvement and diverse and extensive local business relationships are important to our success. If the composition of our board of directors changes materially, our business may also suffer. Similarly, if the composition of the respective advisory boards of the Bank change materially, our business may suffer in such markets.
prospects.
| · | general or local economic conditions; |
| · | environmental cleanup liability; |
| · | neighborhood assessments; |
| · | interest rates; |
| · | real estate tax rates; |
| · | operating expenses of the mortgaged properties; |
| · | supply of and demand for rental units or properties; |
| · | ability to obtain and maintain adequate occupancy of the properties; |
| · | zoning laws; |
| · | governmental and regulatory rules; |
| · | fiscal policies; and |
| · | natural disasters. |
| 32 | ||
| 33 | ||
A significant portion
| 34 | ||
| 35 | ||
| 36 | ||
| 37 | ||
funding or capital, if needed.
| 38 | ||
We have never declared or paid cash dividends on our common stock. We have no current intentions to pay dividends. In addition,us and our ability to pay dividends is subject to regulatory limitations.
Under Alabama law, a state bank may not pay a dividend in excess of 90% of its net earnings until the bank’s surplus is equal to at least 20% of its capital.our stockholders. As of December 31, 2011, the Bank’s surplus was equal2013, our bank could pay approximately $110.9 million of dividends to 57.0% of the Bank’s capital. The Bank is also required by Alabama law to obtain theus without prior approval of the Alabama Superintendent of Banks of the Alabama Banking Department (the “Superintendent”) for its. However, the payment of dividends is also subject to declaration by our board of directors, which takes into account our financial condition, earnings, general economic conditions and other factors, including statutory and regulatory restrictions. There can be no assurance that dividends will in fact be paid on our common stock in future periods or that, if paid, such dividends will not be reduced or eliminated.
limited, even if such sale would represent a greater value for stockholders than our continued independent operation.
Alabama and Delaware law limit the ability of others to acquire the Bank, which may restrict your ability to fully realize the value of your common stock.
In many cases, stockholders receive a premium for their shares when one company purchases another. Alabama and Delaware law makes it difficult for anyone to purchase the Bank or us without approval of our board of directors. Thus, your ability to realize the potential benefits of any sale by us may be limited, even if such sale would represent a greater value for stockholders than our continued independent operation.
stockholders.
| 39 | ||
| · | provide that special meetings of stockholders may be called at any time by the Chairman of our board of directors, by the President or by order of the board of directors; |
| · | enable our board of directors to issue preferred stock up to the authorized amount, with such preferences, limitations and relative rights, including voting rights, as may be determined from time to time by the board; |
| · | enable our board of directors to increase the number of persons serving as directors and to fill the vacancies created as a result of the increase by a majority vote of the directors present at the meeting; |
| · | enable our board of directors to amend our bylaws without stockholder approval; and |
| · | do not provide for cumulative voting rights (therefore allowing the holders of a majority of the shares of common stock entitled to vote in any election of directors to elect all of the directors standing for election, if they should so choose). |
| State | ||||||||||||||||
| MSA | Owned | |||||||||||||||
| or | ||||||||||||||||
| Office Address | City | Zip Code | Leased | Date Opened | ||||||||||||
| Alabama: | ||||||||||||||||
| Birmingham-Hoover: | ||||||||||||||||
| 850 Shades Creek Parkway, Suite 200 (1) | Birmingham | 35209 | Leased | |||||||||||||
| 324 Richard Arrington Jr. Boulevard North | Birmingham | 35203 | Leased | 12/19/2005 | ||||||||||||
| 5403 Highway 280, Suite 401 | Birmingham | 35242 | Leased | |||||||||||||
| Total | 3 Offices | |||||||||||||||
| Huntsville: | ||||||||||||||||
| 401 Meridian Street, Suite 100 | Huntsville | 35801 | Leased | 11/21/2006 | ||||||||||||
| 1267 Enterprise Way, Suite A (1) | Huntsville | 35806 | Leased | |||||||||||||
| Total | 2 Offices | |||||||||||||||
| Montgomery: | ||||||||||||||||
| 1 Commerce Street, Suite 200 | Montgomery | 36104 | Leased | |||||||||||||
| 8117 Vaughn Road, Unit 20 | Montgomery | 36116 | Leased | |||||||||||||
| Total | 2 Offices | |||||||||||||||
| Dothan: | ||||||||||||||||
| 4801 West Main Street (1) | Dothan | 36305 | Leased | 10/17/2008 | ||||||||||||
| 1640 Ross Clark Circle | Dothan | 36301 | Leased | 2/1/2011 | ||||||||||||
| Total | 2 Offices | |||||||||||||||
| 64 North Royal Street | Mobile | 36602 | Leased | 7/9/2012 | ||||||||||||
| 1 Office | ||||||||||||||||
| Total Offices in Alabama | 10 Offices | |||||||||||||||
| Florida: | ||||||||||||||||
| Pensacola-Ferry | Pass-Brent: | |||||||||||||||
| 316 South Balen Street | Pensacola | 32502 | Leased | 4/1/2011 | ||||||||||||
| 4980 North 12th Avenue | Pensacola | 32504 | Owned | 8/27/2012 | ||||||||||||
| Total | ||||||||||||||||
| Tennessee: | ||||||||||||||||
| Nashville: | ||||||||||||||||
| 611 Commerce Street (2) | Nashville | 37203 | Leased | 6/4/2013 | ||||||||||||
| 1 Office | ||||||||||||||||
| Total offices | 13 Offices | |||||||||||||||
None.
Dividends
We have never declared or paid dividends on our common stock,and we do not expect to pay dividends to common stockholders in the near future.We anticipate that our earnings, if any,share will be held for purposespayable on April 14, 2014 to stockholders of enhancing our capital. Our paymentrecord as of April 7, 2014. Future declarations of quarterly cash dividends to common stockholders iswill be subject to the discretionapproval of ourthe Board of Directors and the Bank’s ability to pay dividends.may be adjusted as business needs or market conditions change. The principal source of our cash flow, including cash flow to pay dividends, comes from dividends that the Bank pays to us as its sole shareholder.stockholder. Statutory and regulatory limitations apply to the Bank’s payment of dividends to us, as well as our payment of dividends to our stockholders. For a more complete discussion on the restrictions on dividends, see “Supervision and Regulation - Payment of Dividends” in Item 1. We doalso pay quarterly dividends on our 40,000 shares of outstanding Non-cumulative Perpetual Preferred Stock pursuant to itits Certificate of Designation.
| 41 | ||
2013.
| Plan Category | Number of securities issued/to be issued upon exercise of outstanding options, warrants and rights | Weighted-average exercise price of outstanding options, warrants and rights | Number of securities remaining available for future issuance under equity compensation plans | |||||||||
| Equity compensation awards plans approved by security holders | 1,048,800 | 18.59 | 401,200 | |||||||||
| Equity compensation awards plans not approved by security holders | 55,000 | 17.27 | - | |||||||||
| Total | 1,103,800 | 18.52 | 401,200 | |||||||||
| Plan Category | Number of Securities Issued/To Be Issued Upon Exercise of Outstanding Awards | Weighted-average Exercise Price of Outstanding Awards | Number of Securities Remaining Available For Future Issuance Under Equity Compensation Plans | |||||
| Equity Compensation Award-Plans Approved by Security Holders | 806,500 | $ | 24.15 | 217,670 | ||||
| Equity Compensation Awards-Plans Not Approved by Security Holders | 48,300 | 17.59 | - | |||||
| Total | 854,800 | $ | 23.77 | 217,670 |
Uponrestricted stock under the formation2009 Stock Incentive Plan. These shares generally vest between three and five years from the date of grant, subject to earlier vesting in the event of a merger, consolidation, sale or transfer of the Bank in May 2005, we issued to eachCompany or substantially all of our directorsits assets and business.
On September 2, 2008, we granted warrants to purchase up to 75,000 shares of our common stock for a purchasewith an exercise price of $25.00 per share in relation to the issuancesecond quarter of our Subordinated Deferrable Interest Debentures.
On June 23, 2009, we granted2009. These warrants to purchase up to 15,000 shareswere issued in connection with the sale of our common stock for a purchase price$5,000,000 subordinated note of $25.00 per share in relation to the issuance of our Subordinated Note dueBank, which was paid off on June 1, 2016 as more fully described in Note 11 to the Consolidated Financial Statements.
2012.
On October 26, 2009, we made a restricted stock award under the 2009 Stock Incentive Plan of 20,000 shares of common stock to Thomas A. Broughton III, President and Chief Executive Officer. These shares vest in five equal installments commencing on the first anniversary of the grant date, subject to earlier vesting in the event of a merger, consolidation, sale or transfer as described in the first paragraph under the table above.
On February 9, 2010, we made restricted stock awards under the 2009 Stock Incentive Plan of 2,000 shares of common stock to each of five employees, for a total of 10,000 shares. These shares vest five years from the date of grant, subject to earlier vesting in the event of a merger, consolidation, sale or transfer as described in the first paragraph under the table above.
On November 28, 2011, we granted 10,000 non-qualified stock options to each Company director, or a total of 60,000 options, to purchase shares at a price of $30. The options vest 100% at the end of five years.
| 42 | ||
![]()
| Date | ||||||||||||||||||||||||
| Index: | 12/31/2006 | 12/31/2007 | 12/31/2008 | 12/31/2009 | 12/31/2010 | 12/31/2011 | ||||||||||||||||||
| ServisFirst Bancshares, Inc. | 100.00 | 133.00 | 167.00 | 167.00 | 167.00 | 200.00 | ||||||||||||||||||
| NASDAQ Composite | 100.00 | 109.81 | 65.29 | 93.95 | 109.84 | 107.86 | ||||||||||||||||||
| NASDAQ Bank | 100.00 | 77.93 | 59.29 | 48.32 | 54.06 | 47.34 | ||||||||||||||||||
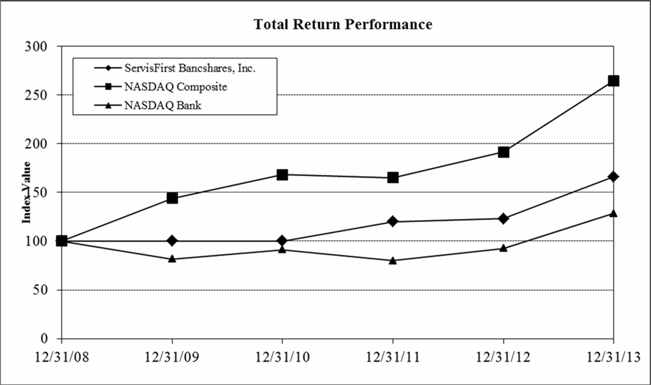
| Date | |||||||||||||
| Index: | 12/31/2008 | 12/31/2009 | 12/31/2010 | 12/31/2011 | 12/31/2012 | 12/31/2013 | |||||||
| ServisFirst Bancshares, Inc. | 100.00 | 100.00 | 100.00 | 120.00 | 123.00 | 166.00 | |||||||
| NASDAQ Composite | 100.00 | 143.89 | 168.22 | 165.19 | 191.47 | 264.84 | |||||||
| NASDAQ Bank | 100.00 | 81.50 | 91.18 | 79.85 | 92.46 | 128.43 | |||||||
| As of and for the years ended December 31, | ||||||||||||||||||||
| 2011 | 2010 | 2009 | 2008 | 2007 | ||||||||||||||||
| (Dollars in thousands except for share and per share data) | ||||||||||||||||||||
| Selected Balance Sheet Data: | ||||||||||||||||||||
| Total assets | $ | 2,460,785 | $ | 1,935,166 | $ | 1,573,497 | $ | 1,162,272 | $ | 838,250 | ||||||||||
| Total loans | 1,830,742 | 1,394,818 | 1,207,084 | 968,233 | 675,281 | |||||||||||||||
| Loans, net | 1,808,712 | 1,376,741 | 1,192,173 | 957,631 | 667,549 | |||||||||||||||
| Securities available for sale | 293,809 | 276,959 | 255,453 | 102,339 | 87,233 | |||||||||||||||
| Securities held to maturity | 15,209 | 5,234 | 645 | - | - | |||||||||||||||
| Cash and due from banks | 43,018 | 27,454 | 26,982 | 22,844 | 15,756 | |||||||||||||||
| Interest-bearing balances with banks | 99,350 | 204,278 | 48,544 | 30,774 | 34,068 | |||||||||||||||
| Fed funds sold | 100,565 | 346 | 680 | 19,300 | 16,598 | |||||||||||||||
| Mortgage loans held for sale | 17,859 | 7,875 | 6,202 | 3,320 | 2,463 | |||||||||||||||
| Restricted equity securities | 3,501 | 3,510 | 3,241 | 2,659 | 1,202 | |||||||||||||||
| Bank owned life insurance contracts | 40,390 | - | - | - | - | |||||||||||||||
| Premises and equipment, net | 4,591 | 4,450 | 5,088 | 3,884 | 4,176 | |||||||||||||||
| Deposits | 2,143,887 | 1,758,716 | 1,432,355 | 1,037,319 | 762,683 | |||||||||||||||
| Other borrowings | 84,219 | 24,937 | 24,922 | 20,000 | 73 | |||||||||||||||
| Trust preferred securities | 30,514 | 30,420 | 15,228 | 15,087 | - | |||||||||||||||
| Other liabilities | 5,873 | 3,993 | 3,370 | 3,082 | 2,465 | |||||||||||||||
| Stockholders' equity | 196,292 | 117,100 | 97,622 | 86,784 | 72,247 | |||||||||||||||
| Selected income Statement Data: | ||||||||||||||||||||
| Interest Income | $ | 91,411 | $ | 78,146 | $ | 62,197 | $ | 55,450 | $ | 51,417 | ||||||||||
| Interest expense | 16,080 | 15,260 | 18,337 | 20,474 | 25,872 | |||||||||||||||
| Net interest income | 75,331 | 62,886 | 43,860 | 34,976 | 25,545 | |||||||||||||||
| Provision for loan losses | 8,972 | 10,350 | 10,685 | 6,274 | 3,541 | |||||||||||||||
| Net interest income after provision | ||||||||||||||||||||
| for loan losses | 66,359 | 52,536 | 33,175 | 28,702 | 22,004 | |||||||||||||||
| Noninterest income | 6,926 | 5,169 | 4,413 | 2,704 | 1,441 | |||||||||||||||
| Noninterest expense | 37,458 | 30,969 | 28,930 | 20,576 | 14,796 | |||||||||||||||
| Income before income taxes | 35,827 | 26,736 | 8,658 | 10,830 | 8,649 | |||||||||||||||
| Income taxes expenses | 12,389 | 9,358 | 2,780 | 3,825 | 3,152 | |||||||||||||||
| Net income | 23,438 | 17,378 | 5,878 | 7,005 | 5,497 | |||||||||||||||
| Per common Share Data: | ||||||||||||||||||||
| Net Income, basic | $ | 4.03 | $ | 3.15 | $ | 1.07 | $ | 1.37 | $ | 1.19 | ||||||||||
| Net income, diluted | 3.53 | 2.84 | 1.02 | 1.31 | 1.16 | |||||||||||||||
| Book value | 26.35 | 21.19 | 17.71 | 16.15 | 14.13 | |||||||||||||||
| Weighted average shares outstanding: | ||||||||||||||||||||
| Basic | 5,759,524 | 5,519,151 | 5,485,972 | 5,114,194 | 4,631,047 | |||||||||||||||
| Diluted | 6,749,163 | 6,294,604 | 5,787,643 | 5,338,883 | 4,721,864 | |||||||||||||||
| Actual shares outstanding | 5,932,182 | 5,527,482 | 5,513,482 | 5,374,022 | 5,113,482 | |||||||||||||||
| As of and for the years ended December 31, | ||||||||||||||||||||
| 2011 | 2010 | 2009 | 2008 | 2007 | ||||||||||||||||
| Selected Performance Ratios: | ||||||||||||||||||||
| Return on average assets | 1.08 | % | 1.04 | % | 0.43 | % | 0.71 | % | 0.78 | % | ||||||||||
| Return on average stockholders' equity | 14.73 | % | 15.86 | % | 6.33 | % | 9.28 | % | 9.40 | % | ||||||||||
| Net interest margin (1) | 3.79 | % | 3.94 | % | 3.31 | % | 3.70 | % | 3.78 | % | ||||||||||
| Efficiency ratio (2) | 45.54 | % | 45.51 | % | 59.57 | % | 54.61 | % | 54.83 | % | ||||||||||
| Asset quality Ratios: | ||||||||||||||||||||
| Net charge-offs to average loans outstanding | 0.32 | % | 0.55 | % | 0.60 | % | 0.41 | % | 0.23 | % | ||||||||||
| Non-performing loans to totals loans | 0.75 | % | 1.03 | % | 1.01 | % | 1.02 | % | 0.66 | % | ||||||||||
| Non-performing assets to total assets | 1.06 | % | 1.10 | % | 1.57 | % | 1.74 | % | 0.73 | % | ||||||||||
| Allowance for loan losses to total gross loans | 1.20 | % | 1.30 | % | 1.24 | % | 1.09 | % | 1.15 | % | ||||||||||
| Allowance for loan losses to total non-performing loans | 159.96 | % | 126.00 | % | 122.34 | % | 108.17 | % | 173.94 | % | ||||||||||
| Liquidity Ratios: | ||||||||||||||||||||
| Net loans to total deposits | 84.37 | % | 78.28 | % | 83.23 | % | 92.32 | % | 87.53 | % | ||||||||||
| Net average loans to average earning assets | 76.71 | % | 78.04 | % | 80.06 | % | 85.84 | % | 77.19 | % | ||||||||||
| Noninterest-bearing deposits to | ||||||||||||||||||||
| total deposits | 16.96 | % | 14.24 | % | 14.75 | % | 11.71 | % | 11.15 | % | ||||||||||
| Capital Adequacy Ratios: | ||||||||||||||||||||
| Stockholders' equity to total assets | 7.97 | % | 6.05 | % | 6.20 | % | 7.47 | % | 8.62 | % | ||||||||||
| Total risked-based capital (3) | 12.79 | % | 11.82 | % | 10.48 | % | 11.25 | % | 11.22 | % | ||||||||||
| Tier I capital (4) | 11.39 | % | 10.22 | % | 8.89 | % | 10.18 | % | 10.12 | % | ||||||||||
| Leverage ratio (5) | 9.17 | % | 7.77 | % | 6.97 | % | 9.01 | % | 8.40 | % | ||||||||||
| Growth Ratios: | ||||||||||||||||||||
| Percentage change in net income | 34.87 | % | 195.64 | % | -16.10 | % | 27.43 | % | 35.00 | % | ||||||||||
| Percentage change in diluted net income per share | 24.30 | % | 178.43 | % | -22.50 | % | 12.93 | % | 13.21 | % | ||||||||||
| Percentage change in assets | 27.16 | % | 22.99 | % | 35.38 | % | 38.65 | % | 58.59 | % | ||||||||||
| Percentage change in net loans | 31.38 | % | 15.46 | % | 24.49 | % | 45.45 | % | 53.43 | % | ||||||||||
| Percentage change in deposits | 21.90 | % | 22.78 | % | 38.08 | % | 36.00 | % | 61.13 | % | ||||||||||
| Percentage change in equity | 67.63 | % | 19.95 | % | 12.49 | % | 20.12 | % | 38.18 | % | ||||||||||
| 43 | ||
| As of and for the years ended December 31, | ||||||||||||||||||||
| 2013 | 2012 | 2011 | 2010 | 2009 | ||||||||||||||||
| (Dollars in thousands except for share and per share data) | ||||||||||||||||||||
| Selected Balance Sheet Data: | ||||||||||||||||||||
| Total Assets | $ | 3,520,699 | $ | 2,906,314 | $ | 2,460,785 | $ | 1,935,166 | $ | 1,573,497 | ||||||||||
| Total Loans | 2,858,868 | 2,363,182 | 1,830,742 | 1,394,818 | 1,207,084 | |||||||||||||||
| Loans, net | 2,828,205 | 2,336,924 | 1,808,712 | 1,376,741 | 1,192,173 | |||||||||||||||
| Securities available for sale | 266,220 | 233,877 | 293,809 | 276,959 | 255,453 | |||||||||||||||
| Securities held to maturity | 32,274 | 25,967 | 15,209 | 5,234 | 645 | |||||||||||||||
| Cash and due from banks | 61,370 | 58,031 | 43,018 | 27,454 | 26,982 | |||||||||||||||
| Interest-bearing balances with banks | 188,411 | 119,423 | 99,350 | 204,278 | 48,544 | |||||||||||||||
| Fed funds sold | 8,634 | 3,291 | 100,565 | 346 | 680 | |||||||||||||||
| Mortgage loans held for sale | 8,134 | 25,826 | 17,859 | 7,875 | 6,202 | |||||||||||||||
| Restricted equity securities | 3,738 | 3,941 | 3,501 | 3,510 | 3,241 | |||||||||||||||
| Premises and equipment, net | 8,351 | 8,847 | 4,591 | 4,450 | 5,088 | |||||||||||||||
| Deposits | 3,019,642 | 2,511,572 | 2,143,887 | 1,758,716 | 1,432,355 | |||||||||||||||
| Other borrowings | 194,320 | 136,982 | 84,219 | 24,937 | 24,922 | |||||||||||||||
| Subordinated debentures | - | 15,050 | 30,514 | 30,420 | 15,228 | |||||||||||||||
| Other liabilities | 9,545 | 9,453 | 5,873 | 3,993 | 3,370 | |||||||||||||||
| Stockholders' Equity | 297,192 | 233,257 | 196,292 | 117,100 | 97,622 | |||||||||||||||
| Selected income Statement Data: | ||||||||||||||||||||
| Interest income | $ | 126,081 | $ | 109,023 | $ | 91,411 | $ | 78,146 | $ | 62,197 | ||||||||||
| Interest expense | 13,619 | 14,901 | 16,080 | 15,260 | 18,337 | |||||||||||||||
| Net interest income | 112,462 | 94,122 | 75,331 | 62,886 | 43,860 | |||||||||||||||
| Provision for loan losses | 13,008 | 9,100 | 8,972 | 10,350 | 10,685 | |||||||||||||||
| Net interest income after provision for loan losses | 99,454 | 85,022 | 66,359 | 52,536 | 33,175 | |||||||||||||||
| Noninterest income | 10,010 | 9,643 | 6,926 | 5,169 | 4,413 | |||||||||||||||
| Noninterest expense | 47,489 | 43,100 | 37,458 | 30,969 | 28,930 | |||||||||||||||
| Income before income taxes | 61,975 | 51,565 | 35,827 | 26,736 | 8,658 | |||||||||||||||
| Income taxes expenses | 20,358 | 17,120 | 12,389 | 9,358 | 2,780 | |||||||||||||||
| Net income | 41,617 | 34,445 | 23,438 | 17,378 | 5,878 | |||||||||||||||
| Net income available to common stockholders | 41,201 | 34,045 | 23,238 | 17,378 | 5,878 | |||||||||||||||
| Per common Share Data: | ||||||||||||||||||||
| Net income, basic | $ | 6.00 | $ | 5.68 | $ | 4.03 | $ | 3.15 | $ | 1.07 | ||||||||||
| Net income, diluted | 5.69 | 4.99 | $ | 3.53 | $ | 2.84 | $ | 1.02 | ||||||||||||
| Book value | 35.00 | 30.84 | $ | 26.35 | $ | 21.19 | $ | 17.71 | ||||||||||||
| Weighted average shares outstanding: | ||||||||||||||||||||
| Basic | 6,869,071 | 5,996,437 | 5,759,524 | 5,519,151 | 5,485,972 | |||||||||||||||
| Diluted | 7,268,675 | 6,941,752 | 6,749,163 | 6,294,604 | 5,787,643 | |||||||||||||||
| Actual shares outstanding | 7,350,012 | 6,268,812 | 5,932,182 | 5,527,482 | 5,513,482 | |||||||||||||||
| Selected Performance Ratios: | ||||||||||||||||||||
| Return on average assets | 1.31 | % | 1.30 | % | 1.11 | % | 1.04 | % | 0.43 | % | ||||||||||
| Return on average stockholders' equity | 15.54 | % | 15.81 | % | 14.73 | % | 15.86 | % | 6.33 | % | ||||||||||
| Dividend payout ratio | 8.79 | % | 10.02 | % | - | % | - | % | - | % | ||||||||||
| Net interest margin (1) | 3.80 | % | 3.80 | % | 3.79 | % | 3.94 | % | 3.31 | % | ||||||||||
| Efficiency ratio (2) | 38.78 | % | 41.54 | % | 45.54 | % | 45.51 | % | 59.93 | % | ||||||||||
| Asset quality Ratios: | ||||||||||||||||||||
| Net charge-offs to average loans outstanding | 0.33 | % | 0.24 | % | 0.32 | % | 0.55 | % | 0.60 | % | ||||||||||
| Non-performing loans to totals loans | 0.34 | % | 0.44 | % | 0.75 | % | 1.03 | % | 1.01 | % | ||||||||||
| Non-performing assets to total assets | 0.64 | % | 0.69 | % | 1.06 | % | 1.10 | % | 1.57 | % | ||||||||||
| Allowance for loan losses to total gross loans | 1.07 | % | 1.11 | % | 1.20 | % | 1.30 | % | 1.22 | % | ||||||||||
| Allowance for loan losses to total non-performing loans | 314.94 | % | 253.50 | % | 159.96 | % | 126.00 | % | 120.91 | % | ||||||||||
| Liquidity Ratios: | ||||||||||||||||||||
| Net loans to total deposits | 93.66 | % | 93.05 | % | 84.37 | % | 78.28 | % | 83.23 | % | ||||||||||
| Net average loans to average earning assets | 84.80 | % | 79.89 | % | 76.71 | % | 78.04 | % | 80.06 | % | ||||||||||
| Noninterest-bearing deposits to total deposits | 21.54 | % | 21.71 | % | 19.54 | % | 14.24 | % | 14.75 | % | ||||||||||
| Capital Adequacy Ratios: | ||||||||||||||||||||
| Stockholders' Equity to total assets | 8.44 | % | 8.03 | % | 7.98 | % | 6.05 | % | 6.20 | % | ||||||||||
| Total risked-based capital (3) | 11.73 | % | 11.78 | % | 12.79 | % | 11.82 | % | 10.48 | % | ||||||||||
| Tier 1 capital (4) | 10.00 | % | 9.89 | % | 11.39 | % | 10.22 | % | 8.89 | % | ||||||||||
| Leverage ratio (5) | 8.48 | % | 8.43 | % | 9.17 | % | 7.77 | % | 6.97 | % | ||||||||||
| Growth Ratios: | ||||||||||||||||||||
| Percentage change in net income | 20.82 | % | 46.96 | % | 34.87 | % | 195.64 | % | (16.09) | % | ||||||||||
| Percentage change in diluted net income per share | 14.03 | % | 41.36 | % | 24.30 | % | 178.43 | % | (22.14) | % | ||||||||||
| Percentage change in assets | 21.14 | % | 18.11 | % | 27.16 | % | 22.99 | % | 35.38 | % | ||||||||||
| Percentage change in net loans | 21.02 | % | 29.20 | % | 31.38 | % | 15.48 | % | 24.49 | % | ||||||||||
| Percentage change in deposits | 20.23 | % | 17.15 | % | 21.90 | % | 22.78 | % | 38.08 | % | ||||||||||
| Percentage change in equity | 27.41 | % | 18.83 | % | 67.63 | % | 19.95 | % | 12.49 | % | ||||||||||
interest-earning assets and interest rate paid on interest-bearing liabilities, divided by average earning assets.
income
| 44 | ||
OPERATIONS 2011, respectively. 2011. Net Interest Margin AnalysisITEM 7.MANAGEMENT’S DISCUSSION AND ANALYSIS OF FINANCIAL CONDITION AND RESULTS OF OPERATIONS.The following is a narrative discussion and analysis of significant changes in our results of operations and financial condition.The purpose of this discussion is to focus on information about our financial condition and results of operations that is not otherwise apparent from the audited financial statements. Analysis of the results presented should be made in the context of our relatively short history.This discussion should be read in conjunction with the financial statements and selected financial data included elsewhere in this document.Forward-Looking StatementsWe may from time to time make written or oral forward-looking statements, including statements contained in our filings with the Securities and Exchange Commission and reports to stockholders. Statements made in this annual report, other than those concerning historical information, should be considered forward-looking and subject to various risks and uncertainties. Such forward-looking statements are made based upon our management’s belief as well as assumptions made by, and information currently available to, our management. Our actual results may differ materially from the results anticipated in forward-looking statements due to a variety of factors, including governmental monetary and fiscal policies, deposit levels, loan demand, loan collateral values, securities portfolio values, interest rate risk management, the effects of competition in the banking business from other commercial banks, thrifts, mortgage banking firms, consumer finance companies, credit unions, securities brokerage firms, insurance companies, money market funds and other financial institutions operating in our market area and elsewhere, including institutions operating through the Internet, changes in governmental regulation relating to the banking industry, including regulations relating to branching and acquisitions, failure of assumptions underlying the establishment of reserves for loan losses, including the value of collateral underlying delinquent loans, and other factors. We caution that such factors are not exclusive. We do not undertake to update any forward-looking statement that may be made from time to time by, or on behalf of, us. See also “Cautionary Note Regarding Forward Looking Statements” on page 1.OverviewWe are a bank holding company within the meaning of the Bank Holding Company Act of 1956 headquartered in Birmingham, Alabama. Through our wholly-owned subsidiary bank, we operate ten12 full service banking offices located in Jefferson, Shelby, Madison, Montgomery, Mobile and Houston Counties in Alabama, and in Escambia County in Florida. These offices operate in the Birmingham-Hoover, Huntsville, Montgomery, Mobile and Dothan, Alabama MSAs, and in the Pensacola-Ferry Pass-Brent, Florida MSA. Additionally, we opened a loan production office in Nashville, Tennessee in June 2013.Our principal business is to accept deposits from the public and to make loans and other investments. Our principal source of funds for loans and investments are demand, time, savings, and other deposits and the amortization and prepayment of loans and borrowings. Our principal sources of income are interest and fees collected on loans, interest and dividends collected on other investments and service charges. Our principal expenses are interest paid on savings and other deposits, interest paid on our other borrowings, employee compensation, office expenses and other overhead expenses.Critical Accounting PoliciesOur consolidated financial statements are prepared based on the application of certain accounting policies, the most significant of which are described in the Notes to the Consolidated Financial Statements. Certain of these policies require numerous estimates and strategic or economic assumptions that may prove inaccurate or subject to variation and may significantly affect our reported results and financial position for the current period or in future periods. The use of estimates, assumptions, and judgments are necessary when financial assets and liabilities are required to be recorded at, or adjusted to reflect, fair value. Assets carried at fair value inherently result in more financial statement volatility. Fair values and information used to record valuation adjustments for certain assets and liabilities are based on either quoted market prices or are provided by other independent third-party sources, when available. When such information is not available, management estimates valuation adjustments. Changes in underlying factors, assumptions or estimates in any of these areas could have a material impact on our future financial condition and results of operations.45 Allowance for Loan LossesThe allowance for loan losses, sometimes referred to as the “ALLL”, is established through periodic charges to income. Loan losses are charged against the ALLL when management believes that the future collection of principal is unlikely. Subsequent recoveries, if any, are credited to the ALLL. If the ALLL is considered inadequate to absorb future loan losses on existing loans for any reason, including but not limited to, increases in the size of the loan portfolio, increases in charge-offs or changes in the risk characteristics of the loan portfolio, then the provision for loan losses is increased.Loans are considered impaired when, based on current information and events, it is probable that the Bank will be unable to collect all amounts due according to the original terms of the loan agreement. The collection of all amounts due according to contractual terms means that both the contractual interest and principal payments of a loan will be collected as scheduled in the loan agreement. Impaired loans are measured based on the present value of expected future cash flows discounted at the loan’s effective interest rate, or, as a practical expedient, at the loan’s observable market price, or the fair value of the underlying collateral. The fair value of collateral, reduced by costs to sell on a discounted basis, is used if a loan is collateral-dependent.Investment Securities ImpairmentPeriodically, we may need to assess whether there have been any events or economic circumstances to indicate that a security on which there is an unrealized loss is impaired on an other-than-temporary basis. In any such instance, we would consider many factors, including the severity and duration of the impairment, our intent and ability to hold the security for a period of time sufficient for a recovery in value, recent events specific to the issuer or industry, and for debt securities, external credit ratings and recent downgrades. Securities on which there is an unrealized loss that is deemed to be other-than-temporary are written down to fair value, with the write-down recorded as a realized loss in securities gains (losses).Other Real Estate OwnedOther real estate owned (“OREO”), consisting of assets that have been acquired through foreclosure, is recorded at the lower of cost or estimated fair value less the estimated cost of disposition. Fair value is based on independent appraisals and other relevant factors. Other real estate owned is revalued on an annual basis or more often if market conditions necessitate. Valuation adjustments required at foreclosure are charged to the allowance for loan losses. Subsequent to foreclosure, losses on the periodic revaluation of the property are charged to net income as OREO expense. Significant judgments and complex estimates are required in estimating the fair value of other real estate, and the period of time within which such estimates can be considered current is significantly shortened during periods of market volatility, as experienced in recent years. As a result, the net proceeds realized from sales transactions could differ significantly from appraisals, comparable sales, and other estimates used to determine the fair value of other real estate.Results of OperationsNet IncomeNet income for the year ended December 31, 2011available to common stockholders was $23.4 million, compared to net income of $17.4$41.2 million for the year ended December 31, 2010.2013, compared to $34.0 million for the year ended December 31, 2012. This increase in net income is primarily attributable to a significantan increase in net interest income, which increased $12.4$18.4 million, or 19.8%19.6%, to $75.3$112.5 million in 20112013 from $62.9$94.1 million in 2010.2012. Noninterest income increased $1.8$0.4 million, or 34.0%4.2%, to $6.9$10.0 million in 20112013 from $5.2$9.6 million in 2010.2012. Noninterest expense increased by $6.5$4.4 million, or 21.0%10.2%, to $37.5$47.5 million in 20112013 from $31.0$43.1 million in 2010.2012. Basic and diluted net income per common share were $6.00 and $5.69, respectively, for the year ended December 31, 2013, compared to $5.68 and $4.99, respectively, for the year ended December 31, 2012. Return on average assets was 1.31% in 2013, compared to 1.30% in 2012, and return on average stockholders’ equity was 15.54% in 2013, compared to 15.81% in 2012.Net income for the year ended December 31, 2012 was $34.0 million, compared to net income of $23.2 million for the year ended December 31, 2011. This increase in net income is primarily attributable to an increase in net interest income, which increased $18.8 million, or 25.0%, to $94.1 million in 2012 from $75.3 million in 2011. Noninterest income increased $2.7 million, or 39.1%, to $9.6 million in 2012 from $6.9 million in 2011. Noninterest expense increased by $5.6 million, or 14.9%, to $43.1 million in 2012 from $37.5 million in 2011. Basic and diluted net income per common share were $5.68 and $4.99, respectively, for the year ended December 31, 2012, compared to $4.03 and $3.53, respectively, for the year ended December 31, 2011, compared to $3.15 and $2.84, respectively, for the year ended December 31, 2010.2011. Return on average assets was 1.08%1.30% in 2011,2012, compared to 1.04%1.11% in 2010,2011, and return on average stockholders’ equity was 15.81% in 2012, compared to 14.73% in 2011, compared to 15.86% in 2010.Net income2011.46 The following table presents some ratios of our results of operations for the yearyears ended December 31, 2010 was $17.4 million, compared to net2013, 2012 and 2011. For the years ended December 31, 2013 2012 2011 Return on average assets 1.31 % 1.30 % 1.11 % Return on average stockholders' equity 15.54 % 15.81 % 14.73 % Dividend payout ratio 8.79 % 10.02 % - % Average stockholders' equity to
average total assets 8.43 % 8.19 % 7.56 % The following tables present a summary of our statements of income, of $5.9 millionincluding the percent change in each category, for the yearyears ended December 31, 2009. This increase in net income is primarily attributable2013 compared to a significant increase in net interest income, which increased $19.0 million, or 43.4%, to $62.9 million in 2010 from $43.9 million in 2009. Noninterest income increased $756,000, or 17.1%, to $5.2 million in 2010 from $4.4 million in 2009. Noninterest expense increased by $2.0 million, or 7.1%, to $31.0 million in 2010 from $28.9 million in 2009. Basic2012, and diluted net income per common share were $3.15 and $2.84, respectively, for the yearyears ended December 31, 2010,2012 compared to $1.07 and $1.02, respectively, for the year ended December 31, 2009. Return on average assets was 1.04% in 2010, compared to 0.43% in 2009, and return on average stockholders’ equity was 15.86% in 2010, compared to 6.33% in 2009. Year Ended December 31, 2011 2010 Change from
the Prior
Year (Dollars in Thousands) Interest income $ 91,411 $ 78,146 16.97 % Interest expense 16,080 15,260 5.37 % Net interest income 75,331 62,886 19.79 % Provision for loan losses 8,972 10,350 -13.31 % Net interest income after provision for loan losses 66,359 52,536 26.31 % Noninterest income 6,926 5,169 33.99 % Noninterest expense 37,458 30,969 20.95 % Net income before taxes 35,827 26,736 34.00 % Taxes 12,389 9,358 32.39 % Net income 23,438 17,378 34.87 % Dividends on preferred stock 200 - NM Net income available to common stockholders $ 23,238 $ 17,378 33.72 % Year Ended December 31, 2010 2009 Change from
the Prior
Year (Dollars in Thousands) Interest income $ 78,146 $ 62,197 25.64 % Interest expense 15,260 18,337 -16.78 % Net interest income 62,886 43,860 43.38 % Provision for loan losses 10,350 10,685 -3.14 % Net interest income after provision for loan losses 52,536 33,175 58.36 % Noninterest income 5,169 4,413 17.13 % Noninterest expense 30,969 28,930 7.05 % Net income before taxes 26,736 8,658 208.80 % Taxes 9,358 2,780 236.62 % Net income 17,378 5,878 195.64 % Dividends on preferred stock - - NM Net income available to common stockholders $ 17,378 $ 5,878 195.64 % Year Ended December 31, 2013 2012 Change from
the Prior Year (Dollars in Thousands) Interest income $ 126,081 $ 109,023 15.65 % Interest expense 13,619 14,901 -8.60 % Net interest income 112,462 94,122 19.49 % Provision for loan losses 13,008 9,100 42.95 % Net interest income after
provision for loan losses 99,454 85,022 16.97 % Noninterest income 10,010 9,643 3.81 % Noninterest expense 47,489 43,100 10.18 % Net income before taxes 61,975 51,565 20.19 % Taxes 20,358 17,120 18.91 % Net income 41,617 34,445 20.82 % Dividends on preferred stock 416 400 4.00 % Net income available to
common stockholders $ 41,201 $ 34,045 21.02 % Year Ended December 31, 2012 2011 Change from
the Prior Year (Dollars in Thousands) Interest income $ 109,023 $ 91,411 19.27 % Interest expense 14,901 16,080 -7.33 % Net interest income 94,122 75,331 24.94 % Provision for loan losses 9,100 8,972 1.43 % Net interest income after
provision for loan losses 85,022 66,359 28.12 % Noninterest income 9,643 6,926 39.23 % Noninterest expense 43,100 37,458 15.06 % Net income before taxes 51,565 35,827 43.93 % Taxes 17,120 12,389 38.19 % Net income 34,445 23,438 46.96 % Dividends on preferred stock 400 200 100.00 % Net income available to
common stockholders $ 34,045 $ 23,238 46.51 % 47 Net Interest IncomeNet interest income is the difference between the income earned on interest-earning assets and interest paid on interest-bearing liabilities used to support such assets. The major factors which affect net interest income are changes in volumes, the yield on interest-earning assets and the cost of interest-bearing liabilities. Our management’s ability to respond to changes in interest rates by effective asset-liability management techniques is critical to maintaining the stability of the net interest margin and the momentum of our primary source of earnings.Beginning in mid-2004, the Federal Reserve Open Market Committee, or FOMC, increased interest rates 400 basis points through mid-2006, where interest rates remained constant until September 2007. In September 2007, the FOMC started lowering interest rates in an effort to stabilize a declining real estate market and to ease recessionary pressures. Over the next five quarters, the FOMC would drop rates a total of 500 basis points. Rates have remained extremely low since bottoming out in December 2008. During this time of falling market interest rates, our management maintained a moderately liability-sensitive balance sheet position, meaning that more liabilities are scheduled to reprice within the next year than assets, thereby taking advantage of the decreasing rates.Net interest income increased $12.4$18.4 million, or 19.8%19.5%, to $75.3$112.5 million for the year ended December 31, 20112013 from $62.9$94.1 million for the year ended December 31, 2010.2012. This was due to an increase in total interest income of $13.3$17.1 million, or 17.0%15.6%, and a decrease in total interest expense of $1.3 million, or a 8.6% reduction. The increase in total interest income was primarily attributable to a 26.50% increase in average loans outstanding from 2012 to 2013, which was the result of growth in all of our markets, including in Mobile, Alabama and Nashville, Tennessee, our two newest markets.Net interest income increased $18.8 million, or 24.9%, to $94.1 million for the year ended December 31, 2012 from $75.3 million for the year ended December 31, 2011. This was due to an increase in total interest income of $17.6 million, or 19.3%, and a decrease in total interest expense of $820,000,$1.2 million, or 5.4%-7.3%. The increase in total interest income was primarily attributable to a 22.6%29.30% increase in average loans outstanding from 20102011 to 2011,2012, which was the result of growth in all of our markets, including in Pensacola, Florida, our newest market.Net interest income increased $19.0 million, or 43.4%, to $62.9 million for the year ended December 31, 2010 from $43.9 million for the year ended December 31, 2009. This was due to an increasemarket entrance in total interest income of $15.9 million, or 25.6%, and a decrease in total interest expense of $3.1 million, or 16.8%. The increase in total interest income was primarily attributable to a 17.9% increase in average loans outstanding from 2009 to 2010, which was the result of growth in all four of our Alabama markets, but primarily market share expansion in our younger markets of Montgomery and Dothan.InvestmentsWe view the investment portfolio as a source of income and liquidity. Our investment strategy is to accept a lower immediate yield in the investment portfolio by targeting shorter term investments. Our investment policy provides that no more than 40% of our total investment portfolio should be composed of municipal securities.The investment portfolio at December 31, 2011 was $309.0 million, compared to $282.2 million at December 31, 2010. The interest earned on investments decreased slightly, from $8.8 million in 2010 to $8.7 million in 2011. The lower income was a result of lower yields on new securities purchased during 2011. The average taxable-equivalent yield on the investment portfolio decreased from 4.08% in 2010 to 3.70% in 2011, or 38 basis points.The investment portfolio at December 31, 2010 was $282.2 million, compared to $256.1 million at December 31, 2009. The interest earned on investments rose to $8.8 million in 2010 from $6.0 million in 2009. That was a result of higher average portfolio balances due to our growth. The average taxable-equivalent yield on the investment portfolio decreased from 5.06% in 2009 to 4.08% in 2010, or 98 basis points.The net interest margin is impacted by the average volumes of interest-sensitive assets and interest-sensitive liabilities and by the difference between the yield on interest-sensitive assets and the cost of interest-sensitive liabilities (spread). Loan fees collected at origination represent an additional adjustment to the yield on loans. Our spread can be affected by economic conditions, the competitive environment, loan demand, and deposit flows. The net yield on earning assets is an indicator of effectiveness of our ability to manage the net interest margin by managing the overall yield on assets and cost of funding those assets.The following table shows, for the twelve months ended December 31, 2011, 20102013, 2012 and 2009,2011, the average balances of each principal category of our assets, liabilities and stockholders’ equity, and an analysis of net interest revenue, and the change in interest income and interest expense segregated into amounts attributable to changes in volume and changes in rates. This table is presented on a taxable equivalent basis, if applicable.48 Average Balance Sheets and Net Interest AnalysisOn a Fully Taxable-Equivalent BasisFor the Year Ended December 31,(Dollats in Thousands) 2011 2010 2009 Average
Balance Interest
Earned /
Paid Average
Yield /
Rate Average
Balance Interest
Earned /
Paid Average
Yield /
Rate Average
Balance Interest
Earned /
Paid Average
Yield /
Rate Assets: Interest-earning assets: Loans, net of unearned income (1) $ 1,573,500 $ 82,083 5.22 % $ 1,283,204 $ 68,889 5.37 % $ 1,088,437 $ 55,625 5.11 % Mortgage loans held for sale 7,556 211 2.79 6,275 226 3.60 6,195 265 4.28 Securities: Taxable 188,315 5,721 3.04 180,045 6,482 3.60 92,903 4,517 4.86 Tax-exempt(2) 82,239 4,275 5.20 59,812 3,314 5.72 38,834 2,151 5.54 Total securities (3) 270,554 10,006 3.70 239,857 9,796 4.08 131,737 6,668 5.06 Federal funds sold 85,825 176 0.21 47,581 104 0.22 88,651 257 0.29 Restricted equity securities 4,259 74 1.50 3,448 56 1.62 3,101 10 0.32 Interest-bearing balances with banks 83,152 203 0.24 42,675 115 0.27 24,987 24 0.10 Total interest-earning assets 2,024,846 92,743 4.58 % 1,623,040 79,186 4.88 % 1,343,108 62,849 4.68 % Non-interest-earning assets: Cash and due from banks 28,304 24,837 18,337 Net premises and equipment 4,813 4,914 4,503 Allowance for loan losses, accrued interest and other assets 29,094 23,087 10,534 Total assets 2,087,057 1,675,878 1,376,482 Interest-bearing liabilities: Interest-bearing deposits: Checking $ 303,165 $ 1,134 0.37 % $ 264,591 $ 1,253 0.47 % $ 178,232 $ 1,599 0.90 % Savings 10,088 47 0.47 2,978 15 0.50 972 5 0.51 Money market 902,290 6,675 0.74 775,544 5,994 0.77 704,112 8,859 1.26 Time deposits 330,221 5,192 1.57 255,326 4,679 1.83 218,087 5,624 2.58 Federal funds purchased 19,335 49 0.25 4,901 31 0.63 - - - Other borrowings 41,866 2,983 7.13 52,186 3,288 6.30 37,705 2,250 5.97 Total interest-bearing liabilities 1,606,965 16,080 1.00 % 1,355,526 15,260 1.13 % 1,139,108 18,337 1.61 % Non-interest-bearing liabilities: Non-interest-bearing checking 315,781 207,399 140,660 Other liabilites 6,580 3,412 3,785 Stockholders' equity 157,731 109,541 92,929 Total liabilities and stockholders' equity 2,087,057 1,675,878 1,376,482 Net interest spread 3.58 % 3.75 % 3.07 % Net interest margin 3.79 % 3.94 % 3.31 % 2013 2012 2011 Average
Balance Interest
Earned /
Paid Average
Yield /
Rate Average
Balance Interest
Earned /
Paid Average
Yield /
Rate Average
Balance Interest
Earned /
Paid Average
Yield /
Rate Assets: Interest-earning assets: Loans, net of unearned income Taxable (1) $ 2,573,621 $ 118,032 4.59 % $ 2,034,478 $ 100,143 4.92 % $ 1,573,500 $ 82,083 5.22 % Tax-exempt (2) 3,274 170 5.19 1,631 95 5.82 - - - Mortgage loans held for sale 12,953 306 2.36 17,905 349 1.95 7,556 211 2.79 Securities: Taxable 149,996 3,906 2.60 184,174 4,815 2.61 188,315 5,721 3.04 Tax-exempt (2) 115,829 4,884 4.22 100,926 4,683 4.64 82,239 4,275 5.20 Total securities (3) 265,825 8,790 3.31 285,100 9,498 3.33 270,554 9,996 3.69 Federal funds sold 44,106 110 0.25 94,425 196 0.21 85,825 176 0.21 Restricted equity securities 4,299 93 2.16 4,434 104 2.35 4,259 74 1.74 Interest-bearing balances with banks 100,417 280 0.28 80,170 200 0.25 83,152 203 0.24 Total interest-earning assets $ 3,004,495 $ 127,781 4.25 % $ 2,518,143 $ 110,585 4.39 % $ 2,024,846 $ 92,743 4.58 % Non-interest-earning assets: Cash and due from banks 45,528 38,467 28,304 Net premises and equipment 9,148 6,074 4,813 Allowance for loan losses, accrued interest and other assets 84,297 65,504 29,094 Total assets $ 3,143,468 $ 2,628,188 $ 2,087,057 Interest-bearing liabilities: Interest-bearing deposits: Checking $ 433,931 $ 1,201 0.28 % $ 351,975 $ 1,074 0.31 % $ 303,165 $ 1,133 0.37 % Savings 21,793 61 0.28 17,081 48 0.28 10,088 47 0.47 Money market 1,244,957 5,810 0.47 1,042,870 5,820 0.56 902,290 6,675 0.74 Time deposits 404,927 4,758 1.18 398,552 5,307 1.33 330,221 5,192 1.57 Federal funds purchased 167,063 462 0.28 88,732 222 0.25 19,335 49 0.25 Other borrowings 21,780 1,327 6.09 33,126 2,430 7.34 41,866 2,984 7.13 Total interest-bearing liabilities $ 2,294,451 $ 13,619 0.59 % $ 1,932,336 $ 14,901 0.77 % $ 1,606,965 $ 16,080 1.00 % Non-interest-bearing liabilities: Non-interest-bearing
checking 576,072 474,284 315,781 Other liabilities 7,835 6,200 6,580 Stockholders' equity 259,631 207,656 145,050 Unrealized gains on securities
and derivatives 5,479 7,712 12,681 Total liabilities and
stockholders' equity $ 3,143,468 $ 2,628,188 $ 2,087,057 Net interest spread 3.66 % 3.62 % 3.58 % Net interest margin 3.80 % 3.80 % 3.79 % (1) Non-accrual loans are included in average loan balances in all periods. Loan fees of $538,000 , $750,000$551,000, $372,000 and $730,000$538,000 are included in interest income in 2011, 20102013, 2012 and 2009,2011, respectively.(2) Interest income and yields are presented on a fully taxable equivalent basis using a tax rate of 35% in 2011,35% in 2010, and 34% in 2009..(3) Unrealized gains of $7,624,000, $6,717,000$8,408,000, $11,998,000 and $1,197,000$7,624,000 are excluded from the yield calculation in 2011, 20102013, 2012 and 2009,2011, respectively.
| 49 | ||
| For the Year Ended December 31, | ||||||||||||||||||||||||
| 2011 Compared to 2010 Increase (Decrease) in Interest Income and Expense Due to Changes in: | 2010 Compared to 2009 Increase (Decrease) in Interest Income and Expense Due to Changes in: | |||||||||||||||||||||||
| Volume | Rate | Total | Volume | Rate | Total | |||||||||||||||||||
| Interest-earning assets: | ||||||||||||||||||||||||
| Loans, net of unearned income | 15,193 | (1,999 | ) | 13,194 | 10,346 | 2,918 | 13,264 | |||||||||||||||||
| Mortgages held for sale | 41 | (56 | ) | (15 | ) | 4 | (43 | ) | (39 | ) | ||||||||||||||
| Securities: | ||||||||||||||||||||||||
| Taxable | 287 | (1,048 | ) | (761 | ) | 3,374 | (1,409 | ) | 1,965 | |||||||||||||||
| Tax-exempt | 1,177 | (216 | ) | 961 | 1,162 | 1 | 1,163 | |||||||||||||||||
| Federal funds sold | 78 | (6 | ) | 72 | (100 | ) | (53 | ) | (153 | ) | ||||||||||||||
| Restricted equity securities | 14 | 4 | 18 | 1 | 45 | 46 | ||||||||||||||||||
| Interest-bearing balances with banks | 100 | (12 | ) | 88 | 26 | 65 | 91 | |||||||||||||||||
| Total interest-earning assets | 16,890 | (3,333 | ) | 13,557 | 14,813 | 1,524 | 16,337 | |||||||||||||||||
| Interest-bearing liabilities: | ||||||||||||||||||||||||
| Checking | 166 | (285 | ) | (119 | ) | 590 | (936 | ) | (346 | ) | ||||||||||||||
| Savings | 33 | (1 | ) | 32 | 10 | - | 10 | |||||||||||||||||
| Money market | 947 | (266 | ) | 681 | 827 | (3,692 | ) | (2,865 | ) | |||||||||||||||
| Time deposits | 1,242 | (729 | ) | 513 | 857 | (1,802 | ) | (945 | ) | |||||||||||||||
| Federal funds purchased | 47 | (29 | ) | 18 | 31 | - | 31 | |||||||||||||||||
| Other borrowed funds | (701 | ) | 396 | (305 | ) | 906 | 132 | 1,038 | ||||||||||||||||
| Total interest-bearing liabilities | 1,734 | (914 | ) | 820 | 3,221 | (6,298 | ) | (3,077 | ) | |||||||||||||||
| Increase in net interest income | 15,156 | (2,419 | ) | 12,737 | 11,592 | 7,822 | 19,414 | |||||||||||||||||
| For the Year Ended December 31, | |||||||||||||||||||
| 2013 Compared to 2012 Increase (Decrease) in Interest Income and Expense Due to Changes in: | 2012 Compared to 2011 Increase (Decrease) in Interest Income and Expense Due to Changes in: | ||||||||||||||||||
| Volume | Rate | Total | Volume | Rate | Total | ||||||||||||||
| Interest-earning assets: | |||||||||||||||||||
| Loans, net of unearned income | |||||||||||||||||||
| Taxable | $ | 25,097 | $ | (7,208) | $ | 17,889 | $ | 22,910 | $ | (4,850) | $ | 18,060 | |||||||
| Tax-exempt | 86 | (11) | 75 | 95 | - | 95 | |||||||||||||
| Mortgages held for sale | (108) | 65 | (43) | 218 | (80) | 138 | |||||||||||||
| Taxable | (890) | (19) | (909) | (124) | (782) | (906) | |||||||||||||
| Tax-exempt | 652 | (451) | 201 | 900 | (492) | 408 | |||||||||||||
| Federal funds sold | (119) | 33 | (86) | 18 | 2 | 20 | |||||||||||||
| Restricted equity securities | (3) | (8) | (11) | 3 | 27 | 30 | |||||||||||||
| Interest-bearing balances with banks | 54 | 26 | 80 | (7) | 4 | (3) | |||||||||||||
| Total interest-earning assets | 24,769 | (7,573) | 17,196 | 24,013 | (6,171) | 17,842 | |||||||||||||
| Interest-bearing liabilities: | |||||||||||||||||||
| Interest-bearing demand deposits | 234 | (107) | 127 | 167 | (226) | (59) | |||||||||||||
| Savings | 13 | - | 13 | 25 | (24) | 1 | |||||||||||||
| Money market | 1,028 | (1,038) | (10) | 941 | (1,796) | (855) | |||||||||||||
| Time deposits | 84 | (633) | (549) | 980 | (865) | 115 | |||||||||||||
| Federal funds purchased | 215 | 25 | 240 | 174 | (1) | 173 | |||||||||||||
| Other borrowed funds | (738) | (365) | (1,103) | (641) | 87 | (554) | |||||||||||||
| Total interest-bearing liabilities | 836 | (2,118) | (1,282) | 1,646 | (2,825) | (1,179) | |||||||||||||
| Increase in net interest income | $ | 23,933 | $ | (5,455) | $ | 18,478 | $ | 22,367 | $ | (3,346) | $ | 19,021 | |||||||
| 50 | ||
Our net interest spread and net interest margin were 3.75% and 3.94%, respectively, for the year ended December 31, 2010, compared to 3.07% and 3.31%, respectively, for the year ended December 31, 2009. Our average interest-earning assets for the year ended December 31, 2010 increased $279.9 million, or 20.8%, to $1.623 billion from $1.343 billion for the year ended December 31, 2009. This increase in our average interest-earning assets was due to continued core growth in all of our markets, increased loan production and increased investment securities. Our average interest-bearing liabilities increased $217.0 million, or 19.0%, to $1.356 billion for the year ended December 31, 2010 from $1.139 billion for the year ended December 31, 2009. This increase in our average interest-bearing liabilities was primarily due to an increase in interest-bearing deposits in all our markets. The ratio of our average interest-earning assets to average interest-bearing liabilities was 119.7% and 117.9% for the years ended December 31, 2010 and 2009, respectively.
Our average interest-earning assets produced a taxable equivalent yield of 4.88% for the year ended December 31, 2010, compared to 4.68% for the year ended December 31, 2009. The average rate paid on interest-bearing liabilities was 1.13% for the year ended December 31, 2010, compared to 1.61% for the year ended December 31, 2009.
2011.
The provision expense for loan losses was $10.4 million for the year ended December 31, 2010, a decrease of $300,000 from $10.7 million in 2009.Also, nonperforming loans increased to $14.3 million, or 1.03% of total loans at December 31, 2010, from $12.2 million, or 1.01% of total loans at December 31, 2009. During 2010, we had net charged-off loans totaling $7.0 million, compared to net charged-off loans of $6.6 million for 2009. The ratio of net charged-off loans to average loans was 0.55% for 2010 compared to 0.60% for 2009. The allowance for loan losses totaled $18.1 million, or 1.30% of loans, net of unearned income, at December 31, 2010, compared to $14.9 million, or 1.24% of loans, net of unearned income, at December 31, 2009.
2011.
| 51 | ||
Income from mortgage banking operations continued to be bolstered by refinancing activity in 2011 as the result of low interest rates. For the year ended December 31, 2011, mortgage banking income increased $0.2$4.4 million, or 9.1%10.2%, to $2.4 million from $2.2$47.5 million for the year ended December 31, 2010. Income2013 from mortgage banking operations for the year ended December 31, 2010 was unchanged at $2.2 million from the year ended December 31, 2009. Income from service charges on deposit accounts for the year ended December 31, 2011 remained relatively flat at $2.3 million when compared to the year ended December 31, 2010. Despite the fact that average balances in transaction accounts increased by approximately $280.8 million, or 22.5%, there was minimal growth in the balances in accounts that are tied to analysis fees. Income from service charges on deposit accounts for the year ended December 31, 2010 increased $685,000, or 42.0%, to $2.3 million from $1.6$43.1 million for the year ended December 31, 2009. Our management2012. This increase is currently pursuing new accountslargely attributable to increased salary and customers through direct marketingemployee benefits expense, which is a result of staff additions related to our expansion, increased incentive pay, and other promotional effortsgeneral merit increases. We had 262 full-time equivalent employees at December 31, 2013 compared to increase this source of revenue.
Noninterest Expense
Noninterest234 at December 31, 2012. Equipment and occupancy expense increased $6.5$1.2 million, or 21.0%30.0%, to $5.2 million in 2013 compared to $4.0 million in 2012. Much of this increase is the result of operating an airplane we purchased in the fourth quarter of 2012. Additionally, we opened a new loan production office in Nashville, Tennessee and expanded our space in our Mobile, Alabama office. FDIC assessments were up $0.2 million, or 12.5%, to $1.8 million in 2013 from $1.6 million in 2012, mostly a result of increases in total assets, which is the major component of our assessment base. OREO expense decreased $1.3 million, or 48.1%, to $1.4 million in 2013 from $2.7 million in 2012. This large decrease was the result of fewer write-downs in residential development properties during 2013 compared to 2012. Other noninterest expenses increased $0.2 million, or 1.9 %, to $10.9 million compared to $10.7 million in 2012.
Noninterestexpenses.
Income Tax Expense
Income tax expense was$17.1 million in 2012 and $12.4 million for the year ended December 31, 2011 compared to $9.4 million in 2010 and $2.8 million in 2009.2011. Our effective tax rates for 2013, 2012 and 2011 2010were 32.85%, 33.20% and 2009 were 34.59%, 35.00% and 32.11%34.58%, respectively. Our primary permanent differences are related to tax exempt income on securities and, Alabama income tax benefits on real estate investment trust dividends and incentive stock option expensesexpenses.
| 52 | ||
| Amortized Cost | Gross Unrealized Gain | Gross Unrealized Loss | Market Value | |||||||||||||
| (In Thousands) | ||||||||||||||||
| December 31, 2011: | ||||||||||||||||
| Securities Available for Sale | ||||||||||||||||
| U.S. Treasury and government agencies | $ | 98,169 | $ | 1,512 | $ | (59 | ) | $ | 99,622 | |||||||
| Mortgage-backed securities | 88,118 | 4,462 | - | 92,580 | ||||||||||||
| State and municipal securities | 95,331 | 5,230 | (35 | ) | 100,526 | |||||||||||
| Corporate debt | 1,029 | 52 | - | 1,081 | ||||||||||||
| Total | $ | 282,647 | $ | 11,256 | $ | (94 | ) | $ | 293,809 | |||||||
| Securities Held to Maturity | ||||||||||||||||
| Mortgage-backed securities | $ | 9,676 | $ | 410 | $ | - | $ | 10,086 | ||||||||
| State and municipal securities | 5,533 | 380 | - | 5,913 | ||||||||||||
| Total | $ | 15,209 | $ | 790 | $ | - | $ | 15,999 | ||||||||
| December 31, 2010: | ||||||||||||||||
| Securities Available for Sale | ||||||||||||||||
| U.S. Treasury and government agencies | $ | 90,631 | $ | 1,887 | $ | (224 | ) | $ | 92,294 | |||||||
| Mortgage-backed securities | 101,709 | 2,783 | (268 | ) | 104,224 | |||||||||||
| State and municipal securities | 78,241 | 1,076 | (1,051 | ) | 78,266 | |||||||||||
| Corporate debt | 2,013 | 162 | - | 2,175 | ||||||||||||
| Total | $ | 272,594 | $ | 5,908 | $ | (1,543 | ) | $ | 276,959 | |||||||
| Securities Held to Maturity | ||||||||||||||||
| State and municipal securities | $ | 5,234 | $ | - | $ | (271 | ) | 4,963 | ||||||||
| Total | $ | 5,234 | $ | - | $ | (271 | ) | $ | 4,963 | |||||||
| December 31, 2009: | ||||||||||||||||
| Securities Available for Sale | ||||||||||||||||
| U.S. Treasury and government agencies | $ | 92,368 | $ | 412 | $ | (453 | ) | $ | 92,327 | |||||||
| Mortgage-backed securities | 99,608 | 2,717 | (625 | ) | 101,700 | |||||||||||
| State and municipal securities | 58,090 | 876 | (567 | ) | 58,399 | |||||||||||
| Corporate debt | 3,004 | 36 | (13 | ) | 3,027 | |||||||||||
| Total | $ | 253,070 | $ | 4,041 | $ | (1,658 | ) | $ | 255,453 | |||||||
| Securities Held to Maturity | ||||||||||||||||
| State and municipal securities | $ | 645 | $ | 1 | $ | (3 | ) | $ | 643 | |||||||
| Total | $ | 645 | $ | 1 | $ | (3 | ) | $ | 643 | |||||||
| December 31, | ||||||||||
| 2013 | 2012 | 2011 | ||||||||
| Securities Available for Sale | ||||||||||
| U.S. Treasury and government agencies | $ | 31,641 | $ | 27,360 | $ | 98,169 | ||||
| Mortgage-backed securities | 85,764 | 69,298 | 88,118 | |||||||
| State and municipal securities | 127,083 | 112,319 | 95,331 | |||||||
| Corporate debt | 15,738 | 13,677 | 1,030 | |||||||
| Total | $ | 260,226 | $ | 222,654 | $ | 282,648 | ||||
| Securities Held to Maturity | ||||||||||
| Mortgage-backed securities | $ | 26,730 | $ | 20,429 | $ | 9,676 | ||||
| State and municipal securities | 5,544 | 5,538 | 5,533 | |||||||
| Total | $ | 32,274 | $ | 25,967 | $ | 15,209 | ||||
| 53 | ||
| Maturity of Debt Securities - Amortized Cost | ||||||||||||||||||||
| Less Than One Year | One Year through Five Years | Six Years through Ten Years | More Than Ten Years | Total | ||||||||||||||||
| (In Thousands) | ||||||||||||||||||||
| At December 31, 2013: | ||||||||||||||||||||
| Securities Available for Sale: | ||||||||||||||||||||
| U.S. Treasury and government agencies | $ | 59 | $ | 22,676 | $ | 8,906 | $ | - | $ | 31,641 | ||||||||||
| Mortgage-backed securities | 195 | 83,929 | 1,147 | 493 | 85,764 | |||||||||||||||
| State and municipal securities | 5,600 | 70,106 | 50,283 | 1,094 | 127,083 | |||||||||||||||
| Corporate debt | - | 9,753 | 5,985 | - | 15,738 | |||||||||||||||
| Total | $ | 5,854 | $ | 186,464 | $ | 66,321 | $ | 1,587 | $ | 260,226 | ||||||||||
| Tax-equivalent Yield | ||||||||||||||||||||
| U.S. Treasury and government agencies | 5.02 | % | 2.17 | % | 2.31 | % | - | % | 2.21 | % | ||||||||||
| Mortgage-backed securities | 8.47 | 2.99 | 3.51 | 3.46 | 3.01 | |||||||||||||||
| State and municipal securities | 4.95 | 3.54 | 4.53 | 6.17 | 4.02 | |||||||||||||||
| Corporate debt | - | 1.33 | 1.17 | - | 1.27 | |||||||||||||||
| Weighted average yield | 5.07 | % | 3.01 | % | 3.91 | % | 5.33 | % | 3.30 | % | ||||||||||
| Securities Held to Maturity: | ||||||||||||||||||||
| Mortgage-backed securities | $ | - | $ | 2,382 | $ | 24,348 | $ | - | $ | 26,730 | ||||||||||
| State and municipal securities | - | - | - | 5,544 | 5,544 | |||||||||||||||
| Total | $ | - | $ | 2,382 | $ | 24,348 | $ | 5,544 | $ | 32,274 | ||||||||||
| Tax-equivalent Yield | ||||||||||||||||||||
| Mortgage-backed securities | - | % | 3.94 | % | 2.69 | % | - | % | 2.80 | % | ||||||||||
| State and municipal securities | - | - | - | 6.27 | 6.27 | |||||||||||||||
| Weighted average yield | - | % | 3.94 | % | 2.69 | % | 6.27 | % | 3.40 | % | ||||||||||
Maturitypresented on a fully-taxable equivalent basis using a tax rate of Investment Securities - Amortized Cost
| Less Than One Year | One Year through Five Years | Six Years through Ten Years | More Than Ten Years | Total | ||||||||||||||||
| (Dollars in Thousands) | ||||||||||||||||||||
| Securities Available for Sale: | ||||||||||||||||||||
| U.S. Treasury and government agencies | $ | 10,014 | $ | 83,251 | $ | 4,257 | $ | 647 | $ | 98,169 | ||||||||||
| Mortgage-backed securities | 735 | 868 | 30,111 | 56,404 | 88,118 | |||||||||||||||
| State and municipal securities | 650 | 29,236 | 60,222 | 5,223 | 95,331 | |||||||||||||||
| Corporate debt | - | - | 1,029 | - | 1,029 | |||||||||||||||
| Total | $ | 11,399 | $ | 113,355 | $ | 95,619 | $ | 62,274 | $ | 282,647 | ||||||||||
| Tax-equivalent Yield | ||||||||||||||||||||
| U.S. Treasury and government agencies | 1.52 | % | 1.57 | % | 3.77 | % | 5.09 | % | 1.68 | % | ||||||||||
| Mortgage-backed securities | 4.96 | 5.26 | 3.39 | 3.99 | 3.81 | |||||||||||||||
| State and municipal securities | 5.16 | 3.83 | 5.45 | 6.20 | 4.99 | |||||||||||||||
| Corporate debt | - | - | 7.08 | - | 7.08 | |||||||||||||||
| Weighted average yield | 1.95 | % | 2.18 | % | 4.74 | % | 4.19 | % | 3.48 | % | ||||||||||
| Securities Held to Maturity: | ||||||||||||||||||||
| Mortgage-backed securities | $ | - | $ | - | $ | - | $ | 9,676 | $ | 9,676 | ||||||||||
| State and municipal securities | - | - | - | 5,533 | 5,533 | |||||||||||||||
| Total | $ | - | $ | - | $ | - | $ | 15,209 | $ | 15,209 | ||||||||||
| Tax-equivalent Yield | ||||||||||||||||||||
| Mortgage-backed securities | - | % | - | % | - | % | 3.51 | % | 3.51 | % | ||||||||||
| State and municipal securities | - | - | - | 6.39 | 6.39 | |||||||||||||||
| Weighted average yield | - | % | - | % | - | % | 4.56 | % | 4.56 | % | ||||||||||
35%.
2012. At the end of each of the two years, we shifted balances held at correspondent banks to our reserve account at the Federal Reserve Bank of Atlanta to gain favorable capital treatment. At year-end 2013, there were no holdings of securities of any issuer, other than US government and its agencies, in an amount greater than 10% of stockholders’ equity.
| Percentage of Total Loans in MSA | ||||
| Birmingham-Hoover, AL MSA | % | |||
| Huntsville, AL MSA | % | |||
| Montgomery, AL MSA | % | |||
| Dothan, AL MSA | 13 | |||
| Mobile, AL MSA | 3 | % | ||
| Total Alabama MSAs | % | |||
| Pensacola, FL MSA | 8 | |||
| Nashville, TN MSA | 1 | % |
| 54 | ||
| 2011 | 2010 | 2009 | ||||||||||
| (Dollars in Thousands) | ||||||||||||
| Commercial, financial and | ||||||||||||
| agricultural | $ | 799,464 | $ | 536,620 | $ | 461,088 | ||||||
| Real estate - construction | 151,218 | 172,055 | 224,178 | |||||||||
| Real estate - mortgage: | ||||||||||||
| Owner-occupied commercial | 398,601 | 270,767 | 203,983 | |||||||||
| 1-4 family mortgage | 205,182 | 199,236 | 165,512 | |||||||||
| Other mortgage | 235,251 | 178,793 | 119,749 | |||||||||
| Total real estate - mortgage | 839,034 | 648,796 | 489,244 | |||||||||
| Consumer | 41,026 | 37,347 | 32,574 | |||||||||
| Total loans | 1,830,742 | 1,394,818 | 1,207,084 | |||||||||
| Less: Allowance for loan losses | (22,030 | ) | (18,077 | ) | (14,737 | ) | ||||||
| Net loans | $ | 1,808,712 | $ | 1,376,741 | $ | 1,192,347 | ||||||
| 2013 | 2012 | 2011 | 2010 | 2009 | ||||||||||||
| (Dollars in Thousands) | ||||||||||||||||
| Commercial, financial and agricultural | $ | 1,278,649 | $ | 1,030,990 | $ | 799,464 | $ | 536,620 | $ | 461,088 | ||||||
| Real estate - construction | 151,868 | 158,361 | 151,218 | 172,055 | 224,178 | |||||||||||
| Real estate - mortgage: | ||||||||||||||||
| Owner-occupied commercial | 710,372 | 568,041 | 398,601 | 270,767 | 203,983 | |||||||||||
| 1-4 family mortgage | 278,621 | 235,909 | 205,182 | 199,236 | 165,512 | |||||||||||
| Other mortgage | 391,396 | 323,599 | 235,251 | 178,793 | 119,749 | |||||||||||
| Total real estate - mortgage | 1,380,389 | 1,127,549 | 839,034 | 648,796 | 489,244 | |||||||||||
| Consumer | 47,962 | 46,282 | 41,026 | 37,347 | 32,574 | |||||||||||
| Total Loans | 2,858,868 | 2,363,182 | 1,830,742 | 1,394,818 | 1,207,084 | |||||||||||
| Less: Allowance for loan losses | (30,663) | (26,258) | (22,030) | (18,077) | (14,737) | |||||||||||
| Net Loans | $ | 2,828,205 | $ | 2,336,924 | $ | 1,808,712 | $ | 1,376,741 | $ | 1,192,347 | ||||||
| 2011 | 2010 | 2009 | ||||||||||
| Commercial, financial and agricultural | 43.67 | % | 38.47 | % | 38.20 | % | ||||||
| Real estate - construction | 8.26 | % | 12.34 | % | 18.57 | % | ||||||
| Real estate - mortgage: | ||||||||||||
| Owner-occupied commercial | 21.77 | % | 19.41 | % | 16.90 | % | ||||||
| 1-4 family mortgage | 11.21 | % | 14.28 | % | 13.71 | % | ||||||
| Other mortgage | 12.85 | % | 12.82 | % | 9.92 | % | ||||||
| Total real estate - mortgage | 45.83 | % | 46.51 | % | 40.53 | % | ||||||
| Consumer | 2.24 | % | 2.68 | % | 2.70 | % | ||||||
| Total loans | 100.00 | % | 100.00 | % | 100.00 | % | ||||||
| 2013 | 2012 | 2011 | 2010 | 2009 | |||||||
| Commercial, financial and agricultural | 44.73 | % | 43.63 | % | 43.67 | % | 38.47 | % | 38.20 | % | |
| Real estate - construction | 5.31 | 6.70 | 8.26 | 12.34 | 18.57 | ||||||
| Real estate - mortgage: | |||||||||||
| Owner-occupied commercial | 24.85 | 24.04 | 21.77 | 19.41 | 16.90 | ||||||
| 1-4 family mortgage | 9.74 | 9.98 | 11.21 | 14.28 | 13.71 | ||||||
| Other mortgage | 13.69 | 13.69 | 12.85 | 12.82 | 9.92 | ||||||
| Total real estate - mortgage | 48.28 | 47.71 | 45.83 | 46.51 | 40.53 | ||||||
| Consumer | 1.68 | 1.96 | 2.24 | 2.68 | 2.70 | ||||||
| Total Loans | 100.00 | % | 100.00 | % | 100.00 | % | 100.00 | % | 100.00 | % |
| Type of Loan(1) | Due in 1 year or less | Due in 1 to 5 years | Due after 5 years | Total | ||||||||||||
| (Dollars in Thousands) | ||||||||||||||||
| Commercial, financial and agricultural | $ | 477,605 | $ | 297,816 | $ | 24,043 | $ | 799,464 | ||||||||
| Real estate - construction | 97,117 | 53,951 | 150 | 151,218 | ||||||||||||
| Real estate - mortgage: | ||||||||||||||||
| Owner-occupied commercial | 58,928 | 275,821 | 63,852 | 398,601 | ||||||||||||
| 1-4 family mortgage | 33,340 | 120,124 | 51,718 | 205,182 | ||||||||||||
| Other mortgage | 87,560 | 125,618 | 22,073 | 235,251 | ||||||||||||
| Total real estate - mortgage | 179,828 | 521,563 | 137,643 | 839,034 | ||||||||||||
| Consumer | 26,662 | 14,306 | 58 | 41,026 | ||||||||||||
| Total loans | $ | 781,212 | $ | 887,636 | $ | 161,894 | $ | 1,830,742 | ||||||||
| Less: allowance for loan losses | (22,030 | ) | ||||||||||||||
| Net loans | $ | 1,808,712 | ||||||||||||||
| Interest rate sensitivity: | ||||||||||||||||
| Fixed interest rates | $ | 158,198 | $ | 536,447 | $ | 56,868 | $ | 751,513 | ||||||||
| Floating or adjustable rates | 623,014 | 351,189 | 105,026 | 1,079,229 | ||||||||||||
| Total | $ | 781,212 | $ | 887,636 | $ | 161,894 | $ | 1,830,742 | ||||||||
| (1) includes nonaccrual loans | ||||||||||||||||
2013:
| Due in 1 | Due in 1 to 5 | Due after 5 | |||||||||||
| year or less | years | years | Total | ||||||||||
| (in Thousands) | |||||||||||||
| Commercial, financial and agricultural | $ | 717,845 | $ | 482,849 | $ | 77,955 | $ | 1,278,649 | |||||
| Real estate - construction | 81,886 | 56,776 | 13,206 | 151,868 | |||||||||
| Real estate - mortgage: | |||||||||||||
| Owner-occupied commercial | 71,785 | 405,715 | 232,872 | 710,372 | |||||||||
| 1-4 family mortgage | 42,147 | 204,955 | 31,519 | 278,621 | |||||||||
| Other mortgage | 75,648 | 261,341 | 54,407 | 391,396 | |||||||||
| Total Real estate - mortgage | 189,580 | 872,011 | 318,798 | 1,380,389 | |||||||||
| Consumer | 33,369 | 13,996 | 597 | 47,962 | |||||||||
| Total Loans | $ | 1,022,680 | $ | 1,425,632 | $ | 410,556 | $ | 2,858,868 | |||||
| Less: Allowance for loan losses | (30,663) | ||||||||||||
| Net Loans | $ | 2,828,205 | |||||||||||
| Interest rate sensitivity: | |||||||||||||
| Fixed interest rates | $ | 197,627 | $ | 933,986 | $ | 263,538 | $ | 1,395,151 | |||||
| Floating or adjustable rates | 825,053 | 491,646 | 147,018 | 1,463,717 | |||||||||
| Total | $ | 1,022,680 | $ | 1,425,632 | $ | 410,556 | $ | 2,858,868 | |||||
| 55 | ||
| For the Years Ended December 31, | ||||||||||||
| 2011 | 2010 | 2009 | ||||||||||
| (Dollars in Thousands) | ||||||||||||
| Allowance for loan losses: | ||||||||||||
| Beginning of year | $ | 18,077 | $ | 14,737 | $ | 10,602 | ||||||
| Charge-offs: | ||||||||||||
| Commercial, financial and agricultural | (1,096 | ) | (1,667 | ) | (2,616 | ) | ||||||
| Real estate - construction | (2,594 | ) | (3,488 | ) | (3,322 | ) | ||||||
| Real estate - mortgage: | ||||||||||||
| Owner occupied commercial | - | (548 | ) | - | ||||||||
| 1-4 family mortgage | (1,096 | ) | (1,227 | ) | (522 | ) | ||||||
| Other mortgage | - | - | (9 | ) | ||||||||
| Total real estate mortgage | (1,096 | ) | (1,775 | ) | (531 | ) | ||||||
| Consumer | (867 | ) | (278 | ) | (207 | ) | ||||||
| Total charge-offs | (5,653 | ) | (7,208 | ) | (6,676 | ) | ||||||
| Recoveries: | ||||||||||||
| Commercial, financial and agricultural | 361 | 97 | - | |||||||||
| Real estate - construction | 180 | 53 | 108 | |||||||||
| Real estate - mortgage: | ||||||||||||
| Owner occupied commercial | 12 | 12 | - | |||||||||
| 1-4 family mortgage | - | 20 | 3 | |||||||||
| Other mortgage | - | - | - | |||||||||
| Total real estate mortgage | 12 | 32 | 3 | |||||||||
| Consumer | 81 | 16 | 15 | |||||||||
| Total recoveries | 634 | 198 | 126 | |||||||||
| Net charge-offs | (5,019 | ) | (7,010 | ) | (6,550 | ) | ||||||
| Provision for loan losses charged to expense | 8,972 | 10,350 | 10,685 | |||||||||
| Allowance for loan losses at end of period | $ | 22,030 | $ | 18,077 | $ | 14,737 | ||||||
| As a percent of year to date average loans: | ||||||||||||
| Net charge-offs | 0.32 | % | 0.55 | % | 0.60 | % | ||||||
| Provision for loan losses | 0.57 | % | 0.81 | % | 1.00 | % | ||||||
| Allowance for loan losses as a percentage of: | ||||||||||||
| Year-end loans | 1.20 | % | 1.30 | % | 1.24 | % | ||||||
| Nonperforming assets | 84.48 | % | 84.82 | % | 60.34 | % | ||||||
| Analysis of the Allowance for Loan Losses | ||||||||||||||||||||
| 2013 | 2012 | 2011 | 2010 | 2009 | ||||||||||||||||
| (Dollars in Thousands) | ||||||||||||||||||||
| Allowance for loan losses: | ||||||||||||||||||||
| Beginning of year | $ | 26,258 | $ | 22,030 | $ | 18,077 | $ | 14,737 | $ | 10,602 | ||||||||||
| Charge-offs: | ||||||||||||||||||||
| Commercial, financial and agricultural | (1,932) | (1,106) | (1,096) | (1,667) | (2,616) | |||||||||||||||
| Real estate - construction | (4,829) | (3,088) | (2,594) | (3,488) | (3,322) | |||||||||||||||
| Real estate - mortgage: | ||||||||||||||||||||
| Owner occupied commercial | (1,100) | (250) | - | (548) | - | |||||||||||||||
| 1-4 family mortgage | (941) | (311) | (1,096) | (1,227) | (522) | |||||||||||||||
| Other mortgage | - | (99) | - | - | (9) | |||||||||||||||
| Total real estate mortgage | (2,041) | (660) | (1,096) | (1,775) | (531) | |||||||||||||||
| Consumer | (210) | (901) | (867) | (278) | (207) | |||||||||||||||
| Total charge-offs | (9,012) | (5,755) | (5,653) | (7,208) | (6,676) | |||||||||||||||
| Recoveries: | ||||||||||||||||||||
| Commercial, financial and agricultural | 66 | 125 | 361 | 97 | - | |||||||||||||||
| Real estate - construction | 296 | 58 | 180 | 53 | 108 | |||||||||||||||
| Real estate - mortgage: | ||||||||||||||||||||
| Owner occupied commercial | 32 | - | 12 | 12 | - | |||||||||||||||
| 1-4 family mortgage | 4 | 692 | - | 20 | 3 | |||||||||||||||
| Other mortgage | - | - | - | - | - | |||||||||||||||
| Total real estate mortgage | 36 | 692 | 12 | 32 | 3 | |||||||||||||||
| Consumer | 11 | 8 | 81 | 16 | 15 | |||||||||||||||
| Total recoveries | 409 | 883 | 634 | 198 | 126 | |||||||||||||||
| Net charge-offs | (8,603) | (4,872) | (5,019) | (7,010) | (6,550) | |||||||||||||||
| Provision for loan losses charged to expense | 13,008 | 9,100 | 8,972 | 10,350 | 10,685 | |||||||||||||||
| Allowance for loan losses at end of period | $ | 30,663 | $ | 26,258 | $ | 22,030 | $ | 18,077 | $ | 14,737 | ||||||||||
| As a percent of year to date average loans: | ||||||||||||||||||||
| Net charge-offs | 0.33 | % | 0.24 | % | 0.32 | % | 0.55 | % | 0.60 | % | ||||||||||
| Provision for loan losses | 0.50 | % | 0.45 | % | 0.57 | % | 0.81 | % | 1.00 | % | ||||||||||
| Allowance for loan losses as a percentage of: | ||||||||||||||||||||
| Year-end loans | 1.07 | % | 1.11 | % | 1.20 | % | 1.30 | % | 1.24 | % | ||||||||||
| Nonperforming assets | 135.70 | % | 130.77 | % | 84.48 | % | 84.82 | % | 60.34 | % | ||||||||||
2013.
| 56 | ||
| For the Years Ended December 31, | ||||||||||||||||||||||||
| 2011 | 2010 | 2009 | ||||||||||||||||||||||
| Amount | Percentage of loans in each category to total loans | Amount | Percentage of loans in each category to total loans | Amount | Percentage of loans in each category to total loans | |||||||||||||||||||
| (Dollars in Thousands) | ||||||||||||||||||||||||
| Commercial, financial and | ||||||||||||||||||||||||
| agricultural | $ | 6,627 | 43.67 | % | $ | 5,348 | 38.47 | % | $ | 3,135 | 38.20 | % | ||||||||||||
| Real estate - construction | 6,542 | 8.26 | % | 6,373 | 12.34 | % | 6,295 | 18.57 | % | |||||||||||||||
| Real estate - mortgage | 3,295 | 45.83 | % | 2,443 | 46.51 | % | 2,102 | 40.53 | % | |||||||||||||||
| Consumer | 531 | 2.24 | % | 749 | 2.68 | % | 115 | 2.70 | % | |||||||||||||||
| Unallocated | 5,035 | 0.00 | % | 3,164 | 0.00 | % | 3,090 | 0.00 | % | |||||||||||||||
| Total | $ | 22,030 | 100.00 | % | $ | 18,077 | 100.00 | % | $ | 14,737 | 100.00 | % | ||||||||||||
| For the Years Ended December 31, | ||||||||||||||||||||||||||||||
| 2013 | 2012 | 2011 | 2010 | 2009 | ||||||||||||||||||||||||||
| Percentage | Percentage | Percentage | Percentage | Percentage | ||||||||||||||||||||||||||
| of loans in | of loans in | of loans in | of loans in | of loans in | ||||||||||||||||||||||||||
| each | each | each | each | each | ||||||||||||||||||||||||||
| category to | category to | category to | category to | category to | ||||||||||||||||||||||||||
| Amount | total loans | Amount | total loans | Amount | total loans | Amount | total loans | Amount | total loans | |||||||||||||||||||||
| (Dollars in Thousands) | ||||||||||||||||||||||||||||||
| Commercial, financial and agricultural | $ | 11,170 | 44.73 | % | $ | 8,233 | 43.63 | % | $ | 6,627 | 43.67 | % | $ | 5,348 | 38.47 | % | $ | 3,135 | 38.20 | % | ||||||||||
| Real estate - | ||||||||||||||||||||||||||||||
| construction | 5,809 | 5.31 | 6,511 | 6.70 | 6,542 | 8.26 | 6,373 | 12.34 | 6,295 | 18.57 | ||||||||||||||||||||
| Real estate - mortgage | 7,495 | 48.28 | 4,912 | 47.71 | 3,295 | 45.83 | 2,443 | 46.51 | 2,102 | 40.53 | ||||||||||||||||||||
| Consumer | 855 | 1.68 | 199 | 1.96 | 531 | 2.24 | 749 | 2.68 | 115 | 2.70 | ||||||||||||||||||||
| Qualitative factors | 5,334 | - | 6,403 | - | 5,035 | - | 3,164 | - | 3,090 | - | ||||||||||||||||||||
| Total | $ | 30,663 | 100.00 | % | $ | 26,258 | 100.00 | % | $ | 22,030 | 100.00 | % | $ | 18,077 | 100.00 | % | $ | 14,737 | 100.00 | % | ||||||||||
| 57 | ||
| · | We closely monitor the past due and overdraft reports on a weekly basis to identify deterioration as early as possible and the placement of identified loans on the watch list. |
| · | We perform extensive monthly credit review for all watch list/classified loans, including formulation of aggressive workout or action plans. When a workout is not achievable, we move to collection/foreclosure proceedings to obtain control of the underlying collateral as rapidly as possible to minimize the deterioration of collateral and/or the loss of its value. |
| · | We require updated financial information, global inventory aging and interest carry analysis for existing builders to help identify potential future loan payment problems. |
| · | We generally limit loans for new construction to established builders and developers that have an established record of turning their inventories, and we restrict our funding of undeveloped lots and land. |
Nonaccrual loans totaled $13.8 million, $14.3 million and $11.9 million as of December 31, 2011, 2010 and 2009, respectively.
| For the Years Ended December 31, | ||||||||||||||||||||||||
| 2011 | 2010 | 2009 | ||||||||||||||||||||||
| (Dollars in Thousands) | ||||||||||||||||||||||||
| Balance | Number of Loans | Balance | Number of Loans | Balance | Number of Loans | |||||||||||||||||||
| Nonaccrual loans: | ||||||||||||||||||||||||
| Commercial, financial and agricultural | $ | 1,179 | 7 | $ | 2,164 | 8 | $ | 2,032 | 2 | |||||||||||||||
| Real estate - construction | 10,063 | 21 | 10,722 | 24 | 8,100 | 13 | ||||||||||||||||||
| Real estate - mortgage: | ||||||||||||||||||||||||
| Owner-occupied commercial | 792 | 2 | 635 | 1 | 909 | 2 | ||||||||||||||||||
| 1-4 family mortgage | 670 | 4 | 202 | 1 | 265 | 2 | ||||||||||||||||||
| Other mortgage | 693 | 1 | - | - | 615 | 1 | ||||||||||||||||||
| Total real estate - mortgage | 2,155 | 7 | 837 | 2 | 1,789 | 5 | ||||||||||||||||||
| Consumer | 375 | 1 | 624 | 1 | - | - | ||||||||||||||||||
| Total nonaccrual loans: | $ | 13,772 | 36 | $ | 14,347 | 35 | $ | 11,921 | 20 | |||||||||||||||
| 90+ days past due and accruing: | ||||||||||||||||||||||||
| Commercial, financial and agricultural | $ | - | - | $ | - | - | $ | 14 | 1 | |||||||||||||||
| Real estate - construction | - | - | - | - | - | - | ||||||||||||||||||
| Real estate - mortgage: | ||||||||||||||||||||||||
| Owner-occupied commercial | - | - | - | - | - | - | ||||||||||||||||||
| 1-4 family mortgage | - | - | - | - | 253 | 1 | ||||||||||||||||||
| Other mortgage | - | - | - | - | - | - | ||||||||||||||||||
| Total real estate - mortgage | - | - | - | - | 253 | 1 | ||||||||||||||||||
| Consumer | - | - | - | - | - | - | ||||||||||||||||||
| Total 90+ days past due and accruing: | $ | - | - | $ | - | - | $ | 267 | 2 | |||||||||||||||
| Total nonperforming loans: | $ | 13,772 | 36 | $ | 14,347 | 35 | $ | 12,188 | 22 | |||||||||||||||
| Plus: Other real estate owned and repossessions | 12,305 | 39 | 6,966 | 39 | 12,525 | 51 | ||||||||||||||||||
| Total nonperforming assets | $ | 26,077 | 75 | $ | 21,313 | 74 | $ | 24,713 | 73 | |||||||||||||||
| Restructured accruing loans: | ||||||||||||||||||||||||
| Commercial, financial and agricultural | $ | 1,369 | 2 | $ | 2,398 | 9 | $ | - | - | |||||||||||||||
| Real estate - construction | - | - | - | - | - | - | ||||||||||||||||||
| Real estate - mortgage: | ||||||||||||||||||||||||
| Owner-occupied commercial | 2,785 | 3 | - | - | 845 | 1 | ||||||||||||||||||
| 1-4 family mortgage | - | - | - | - | - | - | ||||||||||||||||||
| Other mortgage | 331 | 1 | - | - | - | - | ||||||||||||||||||
| Total real estate - mortgage | 3,116 | 4 | - | - | 845 | 1 | ||||||||||||||||||
| Consumer | - | - | - | - | - | - | ||||||||||||||||||
| Total restructured accruing loans: | $ | 4,485 | 6 | $ | 2,398 | 9 | $ | 845 | 1 | |||||||||||||||
| Total nonperforming assets and | ||||||||||||||||||||||||
| restructured accruing loans | $ | 30,562 | 81 | $ | 23,711 | 83 | $ | 25,558 | 74 | |||||||||||||||
| Gross interest income foregone on nonaccrual | ||||||||||||||||||||||||
| loans throughout year | $ | 1,371 | $ | 510 | $ | 647 | ||||||||||||||||||
| Interest income recognized on nonaccrual loans | ||||||||||||||||||||||||
| throughout year | $ | 263 | $ | 418 | $ | 310 | ||||||||||||||||||
| Ratios: | ||||||||||||||||||||||||
| Nonperforming loans to total loans | 0.75 | % | 1.03 | % | 1.01 | % | ||||||||||||||||||
| Nonperforming assets to total loans plus | ||||||||||||||||||||||||
| other real estate owned and repossessions | 1.41 | % | 1.52 | % | 2.02 | % | ||||||||||||||||||
| Nonperforming loans plus restructured accruing | ||||||||||||||||||||||||
| loans to total loans plus other real estate | ||||||||||||||||||||||||
| owned and repossessions | 0.99 | % | 1.19 | % | 1.06 | % | ||||||||||||||||||
| 2013 | 2012 | 2011 | 2010 | 2009 | |||||||||||||||||||||||||||
| Number | Number | Number | Number | Number | |||||||||||||||||||||||||||
| Balance | of Loans | Balance | of Loans | Balance | of Loans | Balance | of Loans | Balance | of Loans | ||||||||||||||||||||||
| (Dollars in Thousands) | |||||||||||||||||||||||||||||||
| Nonaccrual loans: | |||||||||||||||||||||||||||||||
| Commercial, financial | |||||||||||||||||||||||||||||||
| and agricultural | $ | 1,714 | 9 | $ | 276 | 2 | $ | 1,179 | 7 | $ | 2,164 | 8 | $ | 2,032 | 2 | ||||||||||||||||
| Real estate - | |||||||||||||||||||||||||||||||
| construction | 3,749 | 14 | 6,460 | 19 | 10,063 | 21 | 10,722 | 24 | 8,100 | 13 | |||||||||||||||||||||
| Real estate - mortgage: | |||||||||||||||||||||||||||||||
| Owner-occupied | |||||||||||||||||||||||||||||||
| commercial | 1,435 | 3 | 2,786 | 3 | 792 | 2 | 635 | 1 | 909 | 2 | |||||||||||||||||||||
| 1-4 family mortgage | 1,878 | 3 | 453 | 2 | 670 | 4 | 202 | 1 | 265 | 2 | |||||||||||||||||||||
| Other mortgage | 243 | 1 | 240 | 1 | 693 | 1 | - | - | 615 | 1 | |||||||||||||||||||||
| Total real estate - | |||||||||||||||||||||||||||||||
| mortgage | 3,556 | 7 | 3,479 | 6 | 2,155 | 7 | 837 | 2 | 1,789 | 5 | |||||||||||||||||||||
| Consumer | 602 | 4 | 135 | 2 | 375 | 1 | 624 | 1 | - | - | |||||||||||||||||||||
| Total nonaccrual loans | $ | 9,621 | 34 | $ | 10,350 | 29 | $ | 13,772 | 36 | $ | 14,347 | 35 | $ | 11,921 | 20 | ||||||||||||||||
| 90+ days past due | |||||||||||||||||||||||||||||||
| and accruing: | |||||||||||||||||||||||||||||||
| Commercial, financial | |||||||||||||||||||||||||||||||
| and agricultural | $ | - | - | $ | - | - | $ | - | - | $ | - | - | $ | 14 | 1 | ||||||||||||||||
| Real estate - | |||||||||||||||||||||||||||||||
| construction | - | - | - | - | - | - | - | - | - | - | |||||||||||||||||||||
| Real estate - mortgage: | |||||||||||||||||||||||||||||||
| Owner-occupied | |||||||||||||||||||||||||||||||
| commercial | - | - | - | - | - | - | - | - | - | - | |||||||||||||||||||||
| 1-4 family mortgage | 19 | 1 | - | - | - | - | - | - | 253 | 1 | |||||||||||||||||||||
| Other mortgage | - | - | - | - | - | - | - | - | - | - | |||||||||||||||||||||
| Total real estate | |||||||||||||||||||||||||||||||
| mortgage | 19 | 1 | - | - | - | - | - | - | 253 | 1 | |||||||||||||||||||||
| Consumer | 96 | 1 | 8 | 4 | - | - | - | - | - | - | |||||||||||||||||||||
| Total 90+ days past due | |||||||||||||||||||||||||||||||
| and accruing | $ | 115 | 2 | $ | 8 | 4 | $ | - | - | $ | - | - | $ | 267 | 2 | ||||||||||||||||
| Total nonperforming | |||||||||||||||||||||||||||||||
| loans | $ | 9,736 | 36 | $ | 10,358 | 33 | $ | 13,772 | 36 | $ | 14,347 | 35 | $ | 12,188 | 22 | ||||||||||||||||
| Plus: Other real estate | |||||||||||||||||||||||||||||||
| owned and repossessions | 12,861 | 51 | 9,721 | 38 | 12,305 | 39 | 6,966 | 39 | 12,525 | 51 | |||||||||||||||||||||
| Total nonperforming | |||||||||||||||||||||||||||||||
| assets | $ | 22,597 | 87 | $ | 20,079 | 71 | $ | 26,077 | 75 | $ | 21,313 | 74 | $ | 24,713 | 73 | ||||||||||||||||
| Restructured accruing loans: | |||||||||||||||||||||||||||||||
| Commercial, financial | |||||||||||||||||||||||||||||||
| and agricultural | $ | 962 | 2 | $ | 1,168 | 2 | $ | 1,369 | 2 | $ | 2,398 | 9 | $ | - | - | ||||||||||||||||
| Real estate - | |||||||||||||||||||||||||||||||
| construction | 217 | 1 | 3,213 | 15 | - | - | - | - | - | - | |||||||||||||||||||||
| Real estate - mortgage: | |||||||||||||||||||||||||||||||
| Owner-occupied | |||||||||||||||||||||||||||||||
| commercial | - | - | 3,121 | 3 | 2,785 | 3 | - | - | 845 | 1 | |||||||||||||||||||||
| 1-4 family mortgage | 8,225 | 2 | 1,709 | 5 | - | - | - | - | - | - | |||||||||||||||||||||
| Other mortgage | 285 | 1 | 302 | 1 | 331 | 1 | - | - | - | - | |||||||||||||||||||||
| Total real estate - | |||||||||||||||||||||||||||||||
| mortgage | 8,510 | 3 | 5,132 | 9 | 3,116 | 4 | - | - | 845 | 1 | |||||||||||||||||||||
| Consumer | - | - | - | - | - | - | - | - | - | - | |||||||||||||||||||||
| Total restructured | |||||||||||||||||||||||||||||||
| accruing loans | $ | 9,689 | 6 | $ | 9,513 | 26 | $ | 4,485 | 6 | $ | 2,398 | 9 | $ | 845 | 1 | ||||||||||||||||
| Total nonperforming | |||||||||||||||||||||||||||||||
| assets and restructured | |||||||||||||||||||||||||||||||
| accruing loans | $ | 32,286 | 93 | $ | 29,592 | 97 | $ | 30,562 | 81 | $ | 23,711 | 83 | $ | 25,558 | 74 | ||||||||||||||||
| Gross interest income | |||||||||||||||||||||||||||||||
| foregone on nonaccrual | |||||||||||||||||||||||||||||||
| loans througout year | $ | 972 | $ | 850 | $ | 1,371 | $ | 510 | $ | 647 | |||||||||||||||||||||
| Interest income | |||||||||||||||||||||||||||||||
| recognized on nonaccrual | |||||||||||||||||||||||||||||||
| loans througout year | $ | 433 | $ | 155 | $ | 263 | $ | 418 | $ | 310 | |||||||||||||||||||||
| Ratios: | |||||||||||||||||||||||||||||||
| Nonperforming loans | |||||||||||||||||||||||||||||||
| to total loans | 0.34 | % | 0.44 | % | 0.75 | % | 1.03 | % | 1.01 | % | |||||||||||||||||||||
| Nonperforming assets to | |||||||||||||||||||||||||||||||
| total loans plus other | |||||||||||||||||||||||||||||||
| real estate owned | 0.79 | % | 0.85 | % | 1.41 | % | 1.52 | % | 2.02 | % | |||||||||||||||||||||
| Nonperforming loans plus | |||||||||||||||||||||||||||||||
| restructured accruing | |||||||||||||||||||||||||||||||
| loans to total loans | |||||||||||||||||||||||||||||||
| plus other real estate | |||||||||||||||||||||||||||||||
| owned and repossessions | 0.68 | % | 0.84 | % | 0.99 | % | 1.19 | % | 1.06 | % | |||||||||||||||||||||
There are not any loans, outside of those included in the table above, that cause management to have serious doubts as to the ability of borrowers to comply with present repayment terms.
| 58 | ||
| Average Deposits | ||||||||||||||||||||||||
| Average for Years Ended December 31, | ||||||||||||||||||||||||
| 2011 | 2010 | 2009 | ||||||||||||||||||||||
| Average Balance | Average Rate Paid | Average Balance | Average Rate Paid | Average Balance | Average Rate Paid | |||||||||||||||||||
| Types of Deposits: | (Dollars in Thousands) | |||||||||||||||||||||||
| Non-interest-bearing checking | $ | 315,781 | - | % | $ | 207,399 | - | % | $ | 140,660 | - | % | ||||||||||||
| Interest-bearing checking | 303,165 | 0.37 | % | 264,591 | 0.47 | % | 178,232 | 0.90 | % | |||||||||||||||
| Money market | 902,290 | 0.74 | % | 775,544 | 0.77 | % | 704,112 | 1.26 | % | |||||||||||||||
| Savings | 10,088 | 0.47 | % | 2,978 | 0.50 | % | 972 | 0.51 | % | |||||||||||||||
| Time deposits | 65,484 | 1.44 | % | 47,026 | 1.76 | % | 35,804 | 2.63 | % | |||||||||||||||
| Time deposits, $100,000 and over | 264,737 | 1.60 | % | 208,300 | 1.85 | % | 182,283 | 2.57 | % | |||||||||||||||
| Total deposits | $ | 1,861,545 | $ | 1,505,838 | $ | 1,242,063 | ||||||||||||||||||
2011:
| Average Deposits | ||||||||||||||||||
| Average for Years Ended December 31, | ||||||||||||||||||
| 2013 | 2012 | 2011 | ||||||||||||||||
| Average Balance | Average Rate Paid | Average Balance | Average Rate Paid | Average Balance | Average Rate Paid | |||||||||||||
| Types of Deposits: | (Dollars in Thousands) | |||||||||||||||||
| Non-interest-bearing demand deposits | $ | 576,072 | - | % | $ | 474,284 | - | % | $ | 315,781 | - | % | ||||||
| Interest-bearing demand deposits | 433,931 | 0.28 | % | 351,975 | 0.31 | % | 303,165 | 0.37 | % | |||||||||
| Money market accounts | 1,244,957 | 0.47 | % | 1,042,870 | 0.56 | % | 902,290 | 0.74 | % | |||||||||
| Savings accounts | 21,793 | 0.28 | % | 17,081 | 0.28 | % | 10,088 | 0.47 | % | |||||||||
| Time deposits | 69,247 | 1.01 | % | 69,906 | 1.24 | % | 65,484 | 1.44 | % | |||||||||
| Time deposits, $100,000 and over | 335,680 | 1.13 | % | 328,646 | 1.35 | % | 264,737 | 1.60 | % | |||||||||
| Total deposits | $ | 2,681,680 | $ | 2,284,762 | $ | 1,861,545 | ||||||||||||
| $100,000 or more | Less than $100,000 | Total | ||||||||||
| Maturity | (In Thousands) | |||||||||||
| Three months or less | $ | 42,952 | $ | 14,508 | $ | 57,460 | ||||||
| Over three through six months | 49,965 | 12,821 | 62,786 | |||||||||
| Over six months through one year | 89,340 | 20,552 | 109,892 | |||||||||
| Over one year | 130,363 | 23,487 | 153,850 | |||||||||
| Total | $ | 312,620 | $ | 71,368 | $ | 383,988 | ||||||
2013 and 2012.
| At December 31, 2013 | $100,000 or more | Less than $100,000 | Total | |||||||
| Maturity | (In Thousands) | |||||||||
| Three months or less | $ | 56,566 | $ | 15,105 | $ | 71,671 | ||||
| Over three through six months | 62,916 | 12,863 | 75,779 | |||||||
| Over six months through one year | 90,609 | 22,429 | 113,038 | |||||||
| Over one year | 134,214 | 19,918 | 154,132 | |||||||
| Total | $ | 344,305 | $ | 70,315 | $ | 414,620 | ||||
| At December 31, 2012 | $100,000 or more | Less than $100,000 | Total | |||||||
| Maturity | (In Thousands) | |||||||||
| Three months or less | $ | 81,299 | $ | 20,910 | $ | 102,209 | ||||
| Over three through six months | 33,712 | 9,351 | 43,063 | |||||||
| Over six months through one year | 89,215 | 17,236 | 106,451 | |||||||
| Over one year | 122,275 | 21,682 | 143,957 | |||||||
| Total | $ | 326,501 | $ | 69,179 | $ | 395,680 | ||||
2013.
2012.
deposits.
| 59 | ||
which were redeemed on November 8, 2012.
which was paid off on June 1, 2012.
On October 26, 2009, we made a 50,000 of these options were exercised in December 2012.
On February 9, 2010, we made restricted stock awards under the 2009 Stock Incentive Plan of 2,000 shares of common stock to each of five employees, for a total of 10,000 shares. These shares vest five years from the date of grant, subject to earlier vesting in the event of a merger, consolidation, sale or transfer as described in the first paragraph under the table above.
| 60 | ||
| 2011 | 2010 | 2009 | ||||||||||
| (In Thousands) | ||||||||||||
| Commitments to extend credit | $ | 697,939 | $ | 538,719 | $ | 409,760 | ||||||
| Credit card arrangements | 19,686 | 17,601 | 19,059 | |||||||||
| Standby letters of credit and | ||||||||||||
| financial guarantees | 42,937 | 47,103 | 39,205 | |||||||||
| Total | $ | 760,562 | $ | 603,423 | $ | 468,024 | ||||||
2011:
| 2013 | 2012 | 2011 | ||||||||
| (In Thousands) | ||||||||||
| Commitments to extend credit | $ | 1,052,902 | $ | 860,421 | $ | 697,939 | ||||
| Credit card arrangements | 38,122 | 25,699 | 19,686 | |||||||
| Standby letters of credit and financial guarantees | 40,371 | 36,374 | 42,937 | |||||||
| Total | $ | 1,131,395 | $ | 922,494 | $ | 760,562 | ||||
Prior to 2008, we entered into an interest rate floor with a notional amount of $50 million in order to fix the minimum interest rate on a corresponding amount of our floating-rate loans. The interest rate floor was sold in January 2008 and the related gain of $817,000 was deferred and amortized to income over the remaining term of the original agreement, which terminated on June 22, 2009. A gain of $272,000 was recognized in interest income for the year ended December 31, 2009.
During 2008, the Bank entered into interest rate swaps (“swaps”) to facilitate customer transactions and meet their financing needs. Upon entering into these swaps, the Bank entered into offsetting positions with a regional correspondent bank in order to minimize the risk to the Bank. As of December 31, 2011 and 2010, the Bank was party to two swaps with notional amounts totaling approximately $11.8 million with customers, and two swaps with notional amounts totaling approximately $11.8 million with a regional correspondent bank. These swaps qualify as derivatives, but are not designated as hedging instruments.
During 2010, the Bank entered into an interest rate cap with a notional value of $100 million. The cap has a strike rate of 2.00% and is indexed to the three month London Interbank Offered Rate (“LIBOR”). The cap does not qualify for hedge accounting treatment, and is marked to market, with changes in market value reflected in the income statement. For the year ended December 31, 2010, the Company recognized $45,000 in expense related to marking the cap to market.
| 61 | ||
| Payments due by Period | ||||||||||||||||||||
| Total | 1 year or less | Over 1 - 3 years | Over 3 - 5 years | Over 5 years | ||||||||||||||||
| Contractual Obligations (1): | (In Thousands) | |||||||||||||||||||
| Deposits without a stated maturity | $ | 1,759,899 | $ | - | $ | - | $ | - | $ | - | ||||||||||
| Certificates of deposit (2) | 383,988 | 230,138 | 121,065 | 32,785 | - | |||||||||||||||
| Subordinated debentures | 30,514 | - | - | - | 30,514 | |||||||||||||||
| Subordinated note payable | 4,914 | - | - | 4,914 | - | |||||||||||||||
| Operating lease commitments | 17,078 | 2,068 | 3,900 | 3,909 | 7,201 | |||||||||||||||
| Total | $ | 2,196,393 | $ | 232,206 | $ | 124,965 | $ | 41,608 | $ | 37,715 | ||||||||||
| Payments due by Period | ||||||||||||||||
| Over 1 - 3 | Over 3 - 5 | |||||||||||||||
| Total | 1 year or less | years | years | Over 5 years | ||||||||||||
| (In Thousands) | ||||||||||||||||
| Contractual Obligations (1) | ||||||||||||||||
| Deposits without a stated maturity | $ | 2,605,022 | $ | - | $ | - | $ | - | $ | - | ||||||
| Certificates of deposit (2) | 414,620 | 260,489 | 106,796 | 47,335 | - | |||||||||||
| Federal funds purchased | 174,380 | 174,380 | - | - | - | |||||||||||
| Other borrowings | 19,940 | - | - | - | 19,940 | |||||||||||
| Operating lease commitments | 16,064 | 2,453 | 4,891 | 4,098 | 4,622 | |||||||||||
| Total | $ | 3,230,026 | $ | 437,322 | $ | 111,687 | $ | 51,433 | $ | 24,562 | ||||||
| 62 | ||
| Well-Capitalized | Actual at December 31, 2011 | |||||||
| Total risk-based capital | 10.00 | % | 12.79 | % | ||||
| Tier 1 capital | 6.00 | % | 11.39 | % | ||||
| Leverage ratio | 5.00 | % | 9.17 | % | ||||
2013.
| Well- Capitalized | Actual at December 31, 2013 | ||||
| Total risk-based capital | 10.00 | % | 11.73 | % | |
| Tier 1 capital | 6.00 | % | 10.00 | % | |
| Leverage ratio | 5.00 | % | 8.48 | % |
.
| 63 | ||
Rate Sensitivity Gap Analysis
| 1-3 Months | 4-12 Months | 2-5 Years | Over 5 Years | Total | ||||||||||||||||
| (Dollars in Thousands) | ||||||||||||||||||||
| Interest-earning assets: | ||||||||||||||||||||
| Loans, including mortgages | ||||||||||||||||||||
| held for sale | $ | 1,176,579 | $ | 174,359 | $ | 432,587 | $ | 65,076 | $ | 1,848,601 | ||||||||||
| Securities | 21,845 | 82,791 | 127,916 | 79,967 | 312,519 | |||||||||||||||
| Federal funds sold | 100,565 | - | - | - | 100,565 | |||||||||||||||
| Interest bearing balances | ||||||||||||||||||||
| with banks | 97,145 | - | 2,205 | - | 99,350 | |||||||||||||||
| Total interest-earning assets | $ | 1,396,134 | $ | 257,150 | $ | 562,708 | $ | 145,043 | $ | 2,361,035 | ||||||||||
| Interest-bearing liabilities: | ||||||||||||||||||||
| Deposits: | ||||||||||||||||||||
| Interest-bearing checking | $ | 354,112 | $ | - | $ | - | $ | - | $ | 354,112 | ||||||||||
| Money market and savings | 986,975 | - | - | - | 986,975 | |||||||||||||||
| Time deposits | 57,339 | 172,801 | 153,850 | - | 383,990 | |||||||||||||||
| Federal funds purchased | 79,265 | 79,265 | ||||||||||||||||||
| Other borrowings | - | - | 4,954 | - | 4,954 | |||||||||||||||
| Trust preferred securities | - | - | 15,050 | 15,464 | 30,514 | |||||||||||||||
| Total interest-bearing liabilities | $ | 1,477,691 | $ | 172,801 | $ | 173,854 | $ | 15,464 | $ | 1,839,810 | ||||||||||
| Interest sensitivity gap | $ | (81,557 | ) | $ | 84,349 | $ | 388,854 | $ | 129,579 | $ | 521,225 | |||||||||
| Cumulative sensitivity gap | $ | (81,557 | ) | $ | 2,792 | $ | 391,646 | $ | 521,225 | |||||||||||
| Percent of cumulative sensitivity Gap | ||||||||||||||||||||
| to total interest-earning assets | (5.8 | )% | 0.2 | % | 17.7 | % | 22.1 | % | ||||||||||||
| Rate Sensitive Gap Analysis | ||||||||||||||||||||
| 1-3 Months | 4-12 Months | 1-5 Years | Over 5 Years | Total | ||||||||||||||||
| (Dollars in Thousands) | ||||||||||||||||||||
| Interest-earning assets: | ||||||||||||||||||||
| Loans, including mortgages | ||||||||||||||||||||
| held for sale | $ | 1,589,067 | $ | 318,304 | $ | 849,949 | $ | 109,682 | $ | 2,867,002 | ||||||||||
| Securities | 28,893 | 23,324 | 174,084 | 75,931 | 302,232 | |||||||||||||||
| Federal funds sold | 8,634 | - | - | - | 8,634 | |||||||||||||||
| Interest bearing balances | ||||||||||||||||||||
| with banks | 186,206 | 1,715 | 490 | - | 188,411 | |||||||||||||||
| Total interest-earning assets | $ | 1,812,800 | $ | 343,343 | $ | 1,024,523 | $ | 185,613 | $ | 3,366,279 | ||||||||||
| Interest-bearing liabilities: | ||||||||||||||||||||
| Deposits: | ||||||||||||||||||||
| Interest-bearing checking | $ | 500,128 | $ | - | $ | - | $ | - | $ | 500,128 | ||||||||||
| Money market and savings | 1,454,438 | - | - | - | 1,454,438 | |||||||||||||||
| Time deposits | 71,671 | 188,817 | 154,140 | (8) | 414,620 | |||||||||||||||
| Federal funds purchased | 174,380 | - | - | - | 174,380 | |||||||||||||||
| Other borrowings | - | - | - | 19,940 | 19,940 | |||||||||||||||
| Total interest-bearing liabilities | 2,200,617 | 188,817 | 154,140 | 19,932 | 2,563,506 | |||||||||||||||
| Interest sensitivity gap | $ | (387,817) | $ | 154,526 | $ | 870,383 | $ | 165,681 | $ | 802,773 | ||||||||||
| Cumulative sensitivity gap | $ | (387,817) | $ | (233,291) | $ | 637,092 | $ | 802,773 | $ | - | ||||||||||
| Percent of cumulative sensitivity Gap | ||||||||||||||||||||
| to total interest-earning assets | (11.5) | % | (6.9) | % | 18.9 | % | 23.8 | % | ||||||||||||
| 64 | ||
| Economic Value of Equity Under Rate Shock | ||||||||||||
| At December 31, 2011 | ||||||||||||
| 0 bps | +100 bps | +200 bps | ||||||||||
| (Dollars in Thousands) | ||||||||||||
| Economic value of equity | $ | 196,292 | $ | 200,022 | $ | 204,693 | ||||||
| Actual dollar change | $ | 3,730 | $ | 8,401 | ||||||||
| Percent change | 1.90 | % | 4.28 | % | ||||||||
| 0 bps | +100 bps | +200 bps | |||||||||
| (Dollars in Thousands) | |||||||||||
| Economic value of equity | $ | 297,192 | $ | 297,341 | $ | 298,054 | |||||
| Actual dollar change | $ | 149 | $ | 862 | |||||||
| Percent change | 0.05 | % | 0.29 | % | |||||||
| 65 | ||
DATA Report of Independent Registered Public Accounting Firm on Consolidated Financial Statements Report of Independent Registered Public Accounting Firm on Internal Control over Financial Reporting Consolidated Statements of Income for the Years Ended December 31, Consolidated Statements of Comprehensive Income for the Years Ended December 31, Consolidated Statements of December 31, Consolidated Statements of Cash Flows for the Years Ended December 31, ITEM 8. FINANCIAL STATEMENTS AND SUPPLEMENTARY DATA.The financial statements and supplementary data required by Regulations S-X and by Item 302 of Regulation S-K are set forth in the pages listed below.Page62Report of Independent Registered Public Accounting Firm onConsolidated Financial Statements6366Report of Management on Internal Control over Financial Reporting 646765Consolidated Balance Sheets at December 31, 20112013 and 2010201266692011, 2010 2013, 2012 and 2009672011, 20102013, 2012 and 200968Stockholders’Stockholders' Equity for the Years Ended2011, 20102013, 2012 and 2009692011, 20102013, 2012 and 200970Notes to Consolidated Financial Statements 717466 REPORT OF INDEPENDENT REGISTERED PUBLIC ACCOUNTING FIRMThe Board of Directors and ShareholdersServisFirst Bancshares, Inc.:We have audited the accompanying consolidated balance sheetsheets of ServisFirst Bancshares, Inc. and subsidiaries as of December 31, 2011,2013 and 2012, and the related consolidated statements of income, comprehensive income, changes in stockholders’ equity, and cash flows for each of the year then ended.years in the three-year period ended December 31, 2013. These consolidated financial statements are the responsibility of the Company’s management. Our responsibility is to express an opinion on these consolidated financial statements based on our audit.We conducted our auditaudits in accordance with the standards of the Public Company Accounting Oversight Board (United States). Those standards require that we plan and perform the audit to obtain reasonable assurance about whether the financial statements are free of material misstatement. An audit includes examining, on a test basis, evidence supporting the amounts and disclosures in the financial statements. An audit also includes assessing the accounting principles used and significant estimates made by management, as well as evaluating the overall financial statement presentation. We believe that our auditaudits provide a reasonable basis for our opinion.In our opinion, the consolidated financial statements referred to above present fairly, in all material respects, the financial position of ServisFirst Bancshares, Inc. and subsidiaries as of December 31, 2011,2013 and 2012, and the results of their operations and their cash flows for each of the year thenyears in the three-year period ended December 31, 2013, in conformity with U.S. generally accepted accounting principles.We also have audited, in accordance with the standards of the Public Company Accounting Oversight Board (United States), ServisFirst Banchsares, Inc.’s internal control over financial reporting as of December 31, 2011,2013, based on criteria established inInternal Control — Integrated Framework (1992)issued by the Committee of Sponsoring Organizations of the Treadway Commission (COSO), and our report dated March 7, 20122014, expressed an unqualified opinion on the effectiveness of the Company’s internal control over financial reporting./s/ KPMG LLPBirmingham, AlabamaMarch 7, 2012REPORT OF INDEPENDENT REGISTERED PUBLIC ACCOUNTING FIRMTo the Board of DirectorsServisFirst Bancshares, Inc.Birmingham, AlabamaWe have audited the accompanying consolidated balance sheet of ServisFirst Bancshares, Inc., as of December 31, 2010, and the related consolidated statements of income, comprehensive income, stockholders’ equity and cash flows for each of the two years in the period then ended December 31, 2010. These consolidated financial statements are the responsibility of the Company’s management. Our responsibility is to express an opinion on these consolidated financial statements based on our audits.We conducted our audits in accordance with the standards of the Public Company Accounting Oversight Board (United States). Those standards require that we plan and perform the audit to obtain reasonable assurance about whether the financial statements are free of material misstatement. An audit includes examining, on a test basis, evidence supporting the amounts and disclosures in the consolidated financial statements. An audit also includes assessing the accounting principles used and significant estimates made by management, as well as evaluating the overall financial statement presentation. We believe that our audits provide a reasonable basis for our opinion.In our opinion, the consolidated financial statements referred to above present fairly, in all material respects, the financial position of ServisFirst Bancshares, Inc. as of December 31, 2010, and the results of their operations and their cash flows for each of the two years in the period then ended December 31, 2010, in conformity with accounting principles generally accepted in the United States of America.
Birmingham, AlabamaMarch 8, 201163/s/ KPMG LLP
| Birmingham, Alabama | |
| March 7, 2014 |
| 67 | ||
SERVISFIRST BANCSHARES, | |||
| by | /s/THOMAS A. BROUGHTON, III | ||
| THOMAS A. BROUGHTON, III | |||
| President and Chief Executive Officer | |||
| by | /s/WILLIAM M. FOSHEE | ||
| WILLIAM M. FOSHEE | |||
| Chief Financial Officer |
| 68 | ||
REPORT OF INDEPENDENT REGISTERED PUBLIC ACCOUNTING FIRM
/s/ KPMG LLP
Birmingham, Alabama
March 7, 2012
SERVISFIRST BANCSHARES, INC.
CONSOLIDATED BALANCE SHEETS DECEMBER 31, 2011 AND 2010
(In thousands, except share and per share amounts)
| 2011 | 2010 | |||||||
| Cash and due from banks | $ | 43,018 | $ | 27,454 | ||||
| Interest-bearing balances due from depository institutions | 99,350 | 204,178 | ||||||
| Federal funds sold | 100,565 | 346 | ||||||
| Cash and cash equivalents | 242,933 | 231,978 | ||||||
| Available for sale debt securities, at fair value | 293,809 | 276,959 | ||||||
| Held to maturity debt securities (fair value of $15,999 and $4,963 at | ||||||||
| December 31, 2011 and 2010, respectively) | 15,209 | 5,234 | ||||||
| Restricted equity securities | 3,501 | 3,510 | ||||||
| Mortgage loans held for sale | 17,859 | 7,875 | ||||||
| Loans | 1,830,742 | 1,394,818 | ||||||
| Less allowance for loan losses | (22,030 | ) | (18,077 | ) | ||||
| Loans, net | 1,808,712 | 1,376,741 | ||||||
| Premises and equipment, net | 4,591 | 4,450 | ||||||
| Accrued interest and dividends receivable | 8,192 | 6,990 | ||||||
| Deferred tax assets | 4,914 | 6,366 | ||||||
| Other real estate owned | 12,275 | 6,966 | ||||||
| Bank owned life insurance contracts | 40,390 | - | ||||||
| Other assets | 8,400 | 8,097 | ||||||
| Total assets | $ | 2,460,785 | $ | 1,935,166 | ||||
| LIABILITIES AND STOCKHOLDERS' EQUITY | ||||||||
| Liabilities: | ||||||||
| Deposits: | ||||||||
| Noninterest-bearing | $ | 418,810 | $ | 250,490 | ||||
| Interest-bearing | 1,725,077 | 1,508,226 | ||||||
| Total deposits | 2,143,887 | 1,758,716 | ||||||
| Federal funds purchased | 79,265 | - | ||||||
| Other borrowings | 4,954 | 24,937 | ||||||
| Subordinated debentures | 30,514 | 30,420 | ||||||
| Accrued interest payable | 945 | 898 | ||||||
| Other liabilities | 4,928 | 3,095 | ||||||
| Total liabilities | 2,264,493 | 1,818,066 | ||||||
| Stockholders' equity: | ||||||||
| Preferred stock, Series A Senior Non-Cumulative Perpetual, par value $.001 (liquidation preference $1,000), net of discount; 40,000 shares authorized, 40,000 shares issued and outstanding at December 31, 2011 and no sharesauthorized, issued and outstanding at December 31, 2010 | 39,958 | - | ||||||
| Preferred stock, undesignated, par value $.001 per share; 1,000,000 | ||||||||
| shares authorized; no shares outstanding | - | - | ||||||
| Common stock, par value $.001 per share; 15,000,000 shares authorized; | ||||||||
| 5,932,182 shares issued and outstanding at December 31, 2011 and | ||||||||
| 5,527,482 shares issued and outstanding at December 31, 2010 | 6 | 6 | ||||||
| Additional paid-in capital | 87,805 | 75,914 | ||||||
| Retained earnings | 61,581 | 38,343 | ||||||
| Accumulated other comprehensive income | 6,942 | 2,837 | ||||||
| Total stockholders' equity | 196,292 | 117,100 | ||||||
| Total liabilities and shareholders' equity | $ | 2,460,785 | $ | 1,935,166 | ||||
| /s/ KPMG LLP | |
| Birmingham, Alabama | |
| March 7, 2014 |
| 69 | ||
| SERVISFIRST BANCSHARES, INC. AND SUBSIDIARIES | |||||||
| CONSOLIDATED BALANCE SHEETS | |||||||
| (In thousands, except share and per share amounts) | |||||||
| December 31, 2013 | December 31, 2012 | ||||||
| ASSETS | |||||||
| Cash and due from banks | $ | 61,370 | $ | 58,031 | |||
| Interest-bearing balances due from depository institutions | 188,411 | 119,423 | |||||
| Federal funds sold | 8,634 | 3,291 | |||||
| Cash and cash equivalents | 258,415 | 180,745 | |||||
| Available for sale debt securities, at fair value | 266,220 | 233,877 | |||||
| Held to maturity debt securities (fair value of $31,315 and $27,350 at | |||||||
| December 31, 2013 and 2012, respectively) | 32,274 | 25,967 | |||||
| Restricted equity securities | 3,738 | 3,941 | |||||
| Mortgage loans held for sale | 8,134 | 25,826 | |||||
| Loans | 2,858,868 | 2,363,182 | |||||
| Less allowance for loan losses | (30,663) | (26,258) | |||||
| Loans, net | 2,828,205 | 2,336,924 | |||||
| Premises and equipment, net | 8,351 | 8,847 | |||||
| Accrued interest and dividends receivable | 10,262 | 9,158 | |||||
| Deferred tax asset, net | 11,018 | 7,386 | |||||
| Other real estate owned | 12,861 | 9,685 | |||||
| Bank owned life insurance contracts | 69,008 | 57,014 | |||||
| Other assets | 12,213 | 6,944 | |||||
| Total assets | $ | 3,520,699 | $ | 2,906,314 | |||
| LIABILITIES AND STOCKHOLDERS' EQUITY | |||||||
| Liabilities: | |||||||
| Deposits: | |||||||
| Noninterest-bearing | $ | 650,456 | $ | 545,174 | |||
| Interest-bearing | 2,369,186 | 1,966,398 | |||||
| Total deposits | 3,019,642 | 2,511,572 | |||||
| Federal funds purchased | 174,380 | 117,065 | |||||
| Other borrowings | 19,940 | 19,917 | |||||
| Subordinated debentures | - | 15,050 | |||||
| Accrued interest payable | 769 | 942 | |||||
| Other liabilities | 8,776 | 8,511 | |||||
| Total liabilities | 3,223,507 | 2,673,057 | |||||
| Stockholders' equity: | |||||||
| Preferred stock, Series A Senior Non-Cumulative Perpetual, par value $0.001 | |||||||
| (liquidation preference $1,000), net of discount; 40,000 shares authorized, | |||||||
| 40,000 shares issued and outstanding at December 31, 2013 and at | |||||||
| December 31, 2012 | 39,958 | 39,958 | |||||
| Preferred stock, par value $0.001 per share; 1,000,000 authorized and | |||||||
| 960,000 currently undesignated | - | - | |||||
| Common stock, par value $0.001 per share; 50,000,000 shares authorized; | |||||||
| 7,350,012 shares issued and outstanding at December 31, 2013 and | |||||||
| 6,268,812 shares issued and outstanding at December 31, 2012 | 7 | 6 | |||||
| Additional paid-in capital | 123,325 | 93,505 | |||||
| Retained earnings | 130,011 | 92,492 | |||||
| Accumulated other comprehensive income | 3,891 | 7,296 | |||||
| Total stockholders' equity | 297,192 | 233,257 | |||||
| Total liabilities and stockholders' equity | $ | 3,520,699 | $ | 2,906,314 | |||
SERVISFIRST BANCSHARES, INC.
CONSOLIDATED STATEMENTS OF INCOME
(In thousands, except per share amounts)
| Year Ended December 31, | ||||||||||||
| 2011 | 2010 | 2009 | ||||||||||
| Interest income: | ||||||||||||
| Interest and fees on loans | $ | 82,294 | $ | 69,115 | $ | 55,890 | ||||||
| Taxable securities | 5,721 | 6,482 | 4,516 | |||||||||
| Nontaxable securities | 2,943 | 2,274 | 1,500 | |||||||||
| Federal funds sold | 176 | 104 | 257 | |||||||||
| Other interest and dividends | 277 | 171 | 34 | |||||||||
| Total interest income | 91,411 | 78,146 | 62,197 | |||||||||
| Interest expense: | ||||||||||||
| Deposits | 13,047 | 11,941 | 16,087 | |||||||||
| Borrowed funds | 3,033 | 3,319 | 2,250 | |||||||||
| Total interest expense | 16,080 | 15,260 | 18,337 | |||||||||
| Net interest income | 75,331 | 62,886 | 43,860 | |||||||||
| Provision for loan losses | 8,972 | 10,350 | 10,685 | |||||||||
| Net interest income after provision for loan losses | 66,359 | 52,536 | 33,175 | |||||||||
| Noninterest income: | ||||||||||||
| Service charges on deposit accounts | 2,290 | 2,316 | 1,631 | |||||||||
| Mortgage banking | 2,373 | 2,174 | 2,222 | |||||||||
| Securities gains | 666 | 108 | 193 | |||||||||
| Other operating income | 1,597 | 571 | 367 | |||||||||
| Total noninterest income | 6,926 | 5,169 | 4,413 | |||||||||
| Noninterest expenses: | ||||||||||||
| Salaries and employee benefits | 19,518 | 14,669 | 13,581 | |||||||||
| Equipment and occupancy expense | 3,697 | 3,184 | 2,749 | |||||||||
| Professional services | 1,213 | 925 | 848 | |||||||||
| FDIC and other regulatory assessments | 1,796 | 2,944 | 2,815 | |||||||||
| Other real estate owned expense | 820 | 1,964 | 2,745 | |||||||||
| Other operating expenses | 10,414 | 7,283 | 6,192 | |||||||||
| Total noninterest expenses | 37,458 | 30,969 | 28,930 | |||||||||
| Income before income taxes | 35,827 | 26,736 | 8,658 | |||||||||
| Provision for income taxes | 12,389 | 9,358 | 2,780 | |||||||||
| Net income | 23,438 | 17,378 | 5,878 | |||||||||
| Dividends on preferred stock | 200 | - | - | |||||||||
| Net income available to common stockholders | $ | 23,238 | $ | 17,378 | $ | 5,878 | ||||||
| Basic earnings per common share | $ | 4.03 | $ | 3.15 | $ | 1.07 | ||||||
| Diluted earnings per common share | $ | 3.53 | $ | 2.84 | $ | 1.02 | ||||||
| 70 | ||
| SERVISFIRST BANCSHARES, INC. AND SUBSIDIARIES | |||||||||
| CONSOLIDATED STATEMENTS OF INCOME | |||||||||
| (In thousands, except per share amounts) | |||||||||
| Year Ended December 31, | |||||||||
| 2013 | 2012 | 2011 | |||||||
| Interest income: | |||||||||
| Interest and fees on loans | $ | 118,285 | $ | 100,462 | $ | 82,294 | |||
| Taxable securities | 3,888 | 4,814 | 5,721 | ||||||
| Nontaxable securities | 3,407 | 3,246 | 2,943 | ||||||
| Federal funds sold | 128 | 196 | 176 | ||||||
| Other interest and dividends | 373 | 305 | 277 | ||||||
| Total interest income | 126,081 | 109,023 | 91,411 | ||||||
| Interest expense: | |||||||||
| Deposits | 11,830 | 12,249 | 13,047 | ||||||
| Borrowed funds | 1,789 | 2,652 | 3,033 | ||||||
| Total interest expense | 13,619 | 14,901 | 16,080 | ||||||
| Net interest income | 112,462 | 94,122 | 75,331 | ||||||
| Provision for loan losses | 13,008 | 9,100 | 8,972 | ||||||
| Net interest income after provision for loan losses | 99,454 | 85,022 | 66,359 | ||||||
| Noninterest income: | |||||||||
| Service charges on deposit accounts | 3,228 | 2,756 | 2,290 | ||||||
| Mortgage banking | 2,513 | 3,560 | 2,373 | ||||||
| Securities gains | 131 | - | 666 | ||||||
| Increase in cash surrender value life insurance | 1,994 | 1,624 | 390 | ||||||
| Other operating income | 2,144 | 1,703 | 1,207 | ||||||
| Total noninterest income | 10,010 | 9,643 | 6,926 | ||||||
| Noninterest expenses: | |||||||||
| Salaries and employee benefits | 26,324 | 22,587 | 19,518 | ||||||
| Equipment and occupancy expense | 5,202 | 4,014 | 3,697 | ||||||
| Professional services | 1,809 | 1,455 | 1,213 | ||||||
| FDIC and other regulatory assessments | 1,799 | 1,595 | 1,796 | ||||||
| Other real estate owned expense | 1,426 | 2,727 | 820 | ||||||
| Other operating expenses | 10,929 | 10,722 | 10,414 | ||||||
| Total noninterest expenses | 47,489 | 43,100 | 37,458 | ||||||
| Income before income taxes | 61,975 | 51,565 | 35,827 | ||||||
| Provision for income taxes | 20,358 | 17,120 | 12,389 | ||||||
| Net income | 41,617 | 34,445 | 23,438 | ||||||
| Dividends on preferred stock | 416 | 400 | 200 | ||||||
| Net income available to common stockholders | $ | 41,201 | $ | 34,045 | $ | 23,238 | |||
| Basic earnings per common share | $ | 6.00 | $ | 5.68 | $ | 4.03 | |||
| Diluted earnings per common share | $ | 5.69 | $ | 4.99 | $ | 3.53 | |||
| 71 | ||
| SERVISFIRST BANCSHARES, INC. AND SUBSIDIARIES | ||||||||||
| CONSOLIDATED STATEMENTS OF COMPREHENSIVE INCOME | ||||||||||
| YEARS ENDED DECEMBER 31, 2013, 2012 AND 2011 | ||||||||||
| (In thousands) | ||||||||||
| 2013 | 2012 | 2011 | ||||||||
| Net income | $ | 41,617 | $ | 34,445 | $ | 23,438 | ||||
| Other comprehensive (loss) income, net of tax: | ||||||||||
| Unrealized holding (losses) gains arising during period from | ||||||||||
| securities available for sale, net of tax (benefit) of $(1,781), | ||||||||||
| $191 and $2,944 for 2013, 2012 and 2011, respectively | (3,319) | 354 | 4,519 | |||||||
| Reclassification adjustment for net gains on sale of securities in | ||||||||||
| net income, net of tax of $45 and $252 for 2013 | ||||||||||
| and 2011, respectively | (86) | - | (414) | |||||||
| Other comprehensive (loss) income, net of tax | (3,405) | 354 | 4,105 | |||||||
| Comprehensive income | $ | 38,212 | $ | 34,799 | $ | 27,543 | ||||
| See Notes to Consolidated Financial Statements | ||||||||||
| 72 | ||
| SERVISFIRST BANCSHARES, INC. AND SUBSIDIARIES | |||||||||||||||||||
| CONSOLIDATED STATEMENT OF STOCKHOLDERS' EQUITY | |||||||||||||||||||
| YEARS ENDED DECEMBER 31, 2013, 2012 AND 2011 | |||||||||||||||||||
| (In thousands, except share amounts) | |||||||||||||||||||
| Preferred Stock | Common Stock | Additional Paid-in Capital | Retained Earnings | Accumulated Other Comprehensive Income | Total Stockholders' Equity | ||||||||||||||
| Balance, December 31, 2010 | $ | - | $ | 6 | $ | 75,914 | $ | 38,343 | $ | 2,837 | $ | 117,100 | |||||||
| Sale of 340,000 shares of common stock | - | - | 10,159 | - | - | 10,159 | |||||||||||||
| Sale of 40,000 shares of preferred stock, net | 39,958 | - | - | - | - | 39,958 | |||||||||||||
| Preferred dividends paid | - | - | - | (200) | - | (200) | |||||||||||||
| Exercise 64,700 stock options, including tax benefit | - | - | 757 | - | - | 757 | |||||||||||||
| Stock-based compensation expense | - | - | 975 | - | - | 975 | |||||||||||||
| Other comprehensive income | - | - | - | - | 4,105 | 4,105 | |||||||||||||
| Net income | - | - | - | 23,438 | - | 23,438 | |||||||||||||
| Balance, December 31, 2011 | 39,958 | 6 | 87,805 | 61,581 | 6,942 | 196,292 | |||||||||||||
| Dividends paid | - | - | - | (3,134) | - | (3,134) | |||||||||||||
| Preferred dividends paid | - | - | - | (400) | - | (400) | |||||||||||||
| Exercise 332,630 stock options and warrants, including tax benefit | - | - | 4,651 | - | - | 4,651 | |||||||||||||
| Stock-based compensation expense | - | - | 1,049 | - | - | 1,049 | |||||||||||||
| Other comprehensive income | - | - | - | - | 354 | 354 | |||||||||||||
| Net income | - | - | - | 34,445 | - | 34,445 | |||||||||||||
| Balance, December 31, 2012 | 39,958 | 6 | 93,505 | 92,492 | 7,296 | 233,257 | |||||||||||||
| Sale of 250,000 shares of common stock | - | - | 10,337 | - | - | 10,337 | |||||||||||||
| Dividends paid | - | - | - | (3,682) | - | (3,682) | |||||||||||||
| Preferred dividends paid | - | - | - | (416) | - | (416) | |||||||||||||
| Exercise 164,700 stock options and warrants, including tax benefit | - | - | 3,279 | - | - | 3,279 | |||||||||||||
| Issuance of 600,000 shares upon mandatory conversion of subordinated mandatorily convertible debentures | - | 1 | 14,999 | - | - | 15,000 | |||||||||||||
| Stock-based compensation expense | - | - | 1,205 | - | - | 1,205 | |||||||||||||
| Other comprehensive loss | - | - | - | - | (3,405) | (3,405) | |||||||||||||
| Net income | - | - | - | 41,617 | - | 41,617 | |||||||||||||
| Balance, December 31, 2013 | $ | 39,958 | $ | 7 | $ | 123,325 | $ | 130,011 | $ | 3,891 | $ | 297,192 | |||||||
See Notes to Consolidated Financial Statements |
| 73 | ||
| 2011 | 2010 | 2009 | ||||||||||
| Net income | $ | 23,438 | $ | 17,378 | $ | 5,878 | ||||||
| Other comprehensive income (loss), net of tax (benefit): | ||||||||||||
| Unrealized holding gains arising during period from securities available for sale, | ||||||||||||
| net of tax of $2,944, $755 and $472 for 2011, 2010 and 2009, respectively | 4,519 | 1,334 | 918 | |||||||||
| Reclassification adjustment for net gains on sale of securities in net income, net | ||||||||||||
| of tax (benefit) of $(252), $(39) and $(65) for 2011, 2010 and 2009, respectively | (414 | ) | (70 | ) | (128 | ) | ||||||
| Reclassification adjustment for net gains realized on derivatives in net income, | ||||||||||||
| net of tax benefit of $93 for 2009 | - | - | (179 | ) | ||||||||
| Other comprehensive income, net of tax | 4,105 | 1,264 | 611 | |||||||||
| Comprehensive income | $ | 27,543 | $ | 18,642 | $ | 6,489 | ||||||
| See Notes to Consolidated Financial Statements | ||||||||||||
| SERVISFIRST BANCSHARES, INC. AND SUBSIDIARIES | ||||||||||
| CONSOLIDATED STATEMENTS OF CASH FLOWS | ||||||||||
| YEARS ENDED DECEMBER 31, 2013, 2012 AND 2011 | ||||||||||
| (In thousands) | ||||||||||
| 2013 | 2012 | 2011 | ||||||||
| OPERATING ACTIVITIES | ||||||||||
| Net income | $ | 41,617 | $ | 34,445 | $ | 23,438 | ||||
| Adjustments to reconcile net income to net cash provided by | ||||||||||
| Deferred tax benefit | (1,805) | (2,181) | (1,240) | |||||||
| Provision for loan losses | 13,008 | 9,100 | 8,972 | |||||||
| Depreciation and amortization | 1,841 | 1,218 | 1,173 | |||||||
| Net amortization of investments | 1,122 | 1,079 | 958 | |||||||
| Market value adjustment of interest rate cap | - | 9 | 106 | |||||||
| Increase in accrued interest and dividends receivable | (1,104) | (966) | (1,202) | |||||||
| Stock-based compensation expense | 1,205 | 1,049 | 975 | |||||||
| (Decrease) increase in accrued interest payable | (173) | (3) | 47 | |||||||
| Proceeds from sale of mortgage loans held for sale | 192,576 | 239,292 | 169,172 | |||||||
| Originations of mortgage loans held for sale | (172,371) | (243,699) | (177,200) | |||||||
| Gain on sale of securities available for sale | (131) | - | (666) | |||||||
| Gain on sale of mortgage loans held for sale | (2,513) | (3,560) | (2,373) | |||||||
| Net loss (gain) on sale of other real estate owned | 159 | 105 | (76) | |||||||
| Write down of other real estate owned | 433 | 2,189 | 326 | |||||||
| Decrease in special prepaid FDIC insurance assessments | 2,498 | 1,322 | 1,492 | |||||||
| Increase in cash surrender value of life insurance contracts | (1,994) | (1,624) | (390) | |||||||
| Loss on prepayment of other borrowings | - | - | 738 | |||||||
| Excess tax benefits from the exercise of warrants | (262) | (381) | (127) | |||||||
| Net change in other assets, liabilities, and other | ||||||||||
| operating activities | 92 | 3,790 | 200 | |||||||
| Net cash provided by operating activities | 74,198 | 41,184 | 24,323 | |||||||
| INVESTMENT ACTIVITIES | ||||||||||
| Purchase of securities available for sale | (83,455) | (47,867) | (102,190) | |||||||
| Proceeds from maturities, calls and paydowns of securities | ||||||||||
| available for sale | 40,959 | 106,783 | 28,575 | |||||||
| Purchase of securities held to maturity | (10,668) | (11,701) | (15,441) | |||||||
| Proceeds from maturities, calls and paydowns of securities | ||||||||||
| held to maturity | 4,361 | 943 | 5,466 | |||||||
| Increase in loans | (515,644) | (540,019) | (449,449) | |||||||
| Purchase of premises and equipment | (1,346) | (5,474) | (1,314) | |||||||
| Purchase of restricted equity securities | - | (787) | (543) | |||||||
| Purchase of bank-owned life insurance contracts | (10,000) | (15,000) | (40,000) | |||||||
| Proceeds from sale of securities available for sale | 4,140 | - | 63,270 | |||||||
| Proceeds from sale of restricted equity securities | 203 | 347 | 552 | |||||||
| Proceeds from sale of other real estate owned and repossessed assets | 7,664 | 2,967 | 3,334 | |||||||
| Investment in tax credit partnerships | (7,907) | - | - | |||||||
| Net cash used in investing activities | (571,693) | (509,808) | (507,740) | |||||||
| FINANCING ACTIVITIES | ||||||||||
| Net increase in noninterest-bearing deposits | 105,282 | 126,364 | 168,320 | |||||||
| Net increase in interest-bearing deposits | 402,788 | 241,321 | 216,851 | |||||||
| Net increase in federal funds purchased | 57,315 | 37,800 | 79,265 | |||||||
| Proceeds from other borrowings | - | 19,917 | - | |||||||
| Redemption of subordinated debentures | - | (15,464) | - | |||||||
| Proceeds from sale of common stock, net | 10,337 | - | 10,032 | |||||||
| Proceeds from sale of preferred stock, net | - | - | 39,958 | |||||||
| Proceeds from exercise of stock options and warrants | 3,279 | 4,651 | 757 | |||||||
| Excess tax benefits from exercise of stock options and warrants | 262 | 381 | 127 | |||||||
| Repayment of other borrowings | - | (5,000) | (20,738) | |||||||
| Dividends on common stock | (3,682) | (3,134) | - | |||||||
| Dividends on preferred stock | (416) | (400) | (200) | |||||||
| Net cash provided by financing activities | 575,165 | 406,436 | 494,372 | |||||||
| Net increase (decrease) in cash and cash equivalents | 77,670 | (62,188) | 10,955 | |||||||
| Cash and cash equivalents at beginning of year | 180,745 | 242,933 | 231,978 | |||||||
| Cash and cash equivalents at end of year | $ | 258,415 | $ | 180,745 | $ | 242,933 | ||||
| SUPPLEMENTAL DISCLOSURE | ||||||||||
| Cash paid for: | ||||||||||
| Interest | $ | 13,792 | $ | 14,904 | $ | 16,033 | ||||
| Income taxes | 20,878 | 13,134 | 15,837 | |||||||
| NONCASH TRANSACTIONS | ||||||||||
| Conversion of mandatorily convertible subordinated debentures | $ | (15,000) | $ | - | $ | - | ||||
| Transfers of loans from held for sale to held for investment | - | - | 417 | |||||||
| Other real estate acquired in settlement of loans | 11,355 | 2,695 | 9,029 | |||||||
| Internally financed sales of other real estate owned | - | 24 | 136 | |||||||
See Notes to Consolidated Financial Statements. |
| 74 | ||
CONSOLIDATED STATEMENT OF STOCKHOLDERS' EQUITY
YEARS ENDED DECEMBER 31, 2011, 2010 AND 2009
(In thousands, except share amounts)
| Preferred Stock | Common Stock | Additional Paid-in Capital | Retained Earnings | Accumulated Other Comprehensive Income | Total Stockholders' Equity | |||||||||||||||||||
| Balance, December 31, 2008 | - | 5 | 70,729 | 15,087 | 962 | 86,783 | ||||||||||||||||||
| Sale of 139,460 shares | - | 1 | 3,478 | - | - | 3,479 | ||||||||||||||||||
| Other comprehensive income | - | - | - | - | 611 | 611 | ||||||||||||||||||
| Stock based compensation expense | - | - | 785 | - | - | 785 | ||||||||||||||||||
| Issuance of warrants related to | ||||||||||||||||||||||||
| subordinated notes payable | - | - | 86 | - | - | 86 | ||||||||||||||||||
| Net income | - | - | - | 5,878 | - | 5,878 | ||||||||||||||||||
| Balance, December 31, 2009 | - | 6 | 75,078 | 20,965 | 1,573 | 97,622 | ||||||||||||||||||
| Other comprehensive income | - | - | - | - | 1,264 | 1,264 | ||||||||||||||||||
| Exercise of stock options, including tax benefit | - | - | 123 | - | - | 123 | ||||||||||||||||||
| Stock-based compensation expense | - | - | 713 | - | - | 713 | ||||||||||||||||||
| Net income | - | - | - | 17,378 | - | 17,378 | ||||||||||||||||||
| Balance, December 31, 2010 | - | 6 | 75,914 | 38,343 | 2,837 | 117,100 | ||||||||||||||||||
| Sale of 340,000 shares of common | ||||||||||||||||||||||||
| stock, net | - | - | 10,159 | - | - | 10,159 | ||||||||||||||||||
| Sale of 40,000 shares of preferred | ||||||||||||||||||||||||
| stock, net | 39,958 | - | - | - | - | 39,958 | ||||||||||||||||||
| Preferred dividends paid | - | - | - | (200 | ) | - | (200 | ) | ||||||||||||||||
| Exercise 64,700 stock options, including tax benefit | - | - | 757 | - | - | 757 | ||||||||||||||||||
| Other comprehensive income | - | - | - | - | 4,105 | 4,105 | ||||||||||||||||||
| Stock-based compensation expense | - | - | 975 | - | - | 975 | ||||||||||||||||||
| Net income | - | - | - | 23,438 | - | 23,438 | ||||||||||||||||||
| Balance, December 31, 2011 | $ | 39,958 | $ | 6 | $ | 87,805 | $ | 61,581 | $ | 6,942 | $ | 196,292 |
See Notes to Consolidated Financial Statements
SERVISFIRST BANCSHARES, INC.
CONSOLIDATED STATEMENTS OF CASH FLOWS
YEARS ENDED DECEMBER 31, 2011, 2010 AND 2009
(In thousands)
| 2011 | 2010 | 2009 | ||||||||||
| OPERATING ACTIVITIES | ||||||||||||
| Net income | $ | 23,438 | $ | 17,378 | $ | 5,878 | ||||||
| Adjustments to reconcile net income to net cash provided by | ||||||||||||
| operating activities: | ||||||||||||
| Deferred tax benefit | (1,240 | ) | (2,212 | ) | (1,601 | ) | ||||||
| Provision for loan losses | 8,972 | 10,350 | 10,685 | |||||||||
| Depreciation and amortization | 1,173 | 1,066 | 1,087 | |||||||||
| Net amortization (accretion) of investments | 958 | 823 | (318 | ) | ||||||||
| Amortized gain on derivative | - | - | (272 | ) | ||||||||
| Market value adjustment of interest rate cap | 106 | 45 | - | |||||||||
| Increase in accrued interest and dividends receivable | (1,202 | ) | (790 | ) | (2,174 | ) | ||||||
| Stock-based compensation expense | 975 | 713 | 785 | |||||||||
| Increase (decrease) in accrued interest payable | 47 | (128 | ) | (254 | ) | |||||||
| Proceeds from sale of mortgage loans held for sale | 169,172 | 174,760 | 198,622 | |||||||||
| Originations of mortgage loans held for sale | (177,200 | ) | (175,046 | ) | (201,143 | ) | ||||||
| Gain on sale of securities available for sale | (666 | ) | (108 | ) | (193 | ) | ||||||
| Gain on sale of mortgage loans held for sale | (2,373 | ) | (2,174 | ) | (2,222 | ) | ||||||
| Net (gain) loss on sale of other real estate owned | (76 | ) | 203 | 441 | ||||||||
| Write down of other real estate owned | 326 | 1,051 | 1,802 | |||||||||
| Decrease in special prepaid FDIC insurance assessments | 1,492 | 2,538 | (7,850 | ) | ||||||||
| Loss on prepayment of other borrowings | 738 | - | - | |||||||||
| Increase in cash surrender value of life insurance contracts | (390 | ) | - | - | ||||||||
| Excess tax benefits from the exercise of warrants | (127 | ) | - | - | ||||||||
| Net change in other assets, liabilities, and other operating activities | 200 | 1,106 | (810 | ) | ||||||||
| Net cash provided by operating activities | 24,323 | 29,575 | 2,463 | |||||||||
| INVESTMENT ACTIVITIES | ||||||||||||
| Purchase of securities available for sale | (102,190 | ) | (84,425 | ) | (200,558 | ) | ||||||
| Proceeds from maturities, calls and paydowns of securities available for sale | 28,575 | 31,889 | 16,585 | |||||||||
| Purchase of securities held to maturity | (15,441 | ) | (4,589 | ) | (645 | ) | ||||||
| Proceeds from maturities, calls and paydowns of securities held to maturity | 5,466 | - | - | |||||||||
| Increase in loans | (449,449 | ) | (197,572 | ) | (253,172 | ) | ||||||
| Purchase of premises and equipment | (1,314 | ) | (428 | ) | (2,294 | ) | ||||||
| Purchase of restricted equity securities | (543 | ) | (269 | ) | (582 | ) | ||||||
| Purchase of interest rate cap | - | (160 | ) | - | ||||||||
| Purchase of bank-owned life insurance contracts | (40,000 | ) | - | - | ||||||||
| Proceeds from sale of securities available for sale | 63,270 | 32,297 | 32,567 | |||||||||
| Proceeds from sale of restricted equity securities | 552 | - | - | |||||||||
| Proceeds from sale of other real estate owned and repossessions | 3,334 | 7,995 | 6,314 | |||||||||
| Additions to other real estate owned | - | (75 | ) | (905 | ) | |||||||
| Net cash used in investing activities | (507,740 | ) | (215,337 | ) | (402,690 | ) | ||||||
| FINANCING ACTIVITIES | ||||||||||||
| Net increase in noninterest-bearing deposits | 168,320 | 39,183 | 89,848 | |||||||||
| Net increase in interest-bearing deposits | 216,851 | 287,178 | 305,188 | |||||||||
| Net increase in federal funds purchased | 79,265 | - | - | |||||||||
| Proceeds from issuance of trust preferred securities | - | 15,050 | - | |||||||||
| Proceeds from other borrowings | - | - | 5,000 | |||||||||
| Proceeds from sale of common stock, net | 10,159 | - | 3,479 | |||||||||
| Proceeds from sale of preferred stock, net | 39,958 | - | - | |||||||||
| Proceeds from exercise of stock options | 757 | 123 | - | |||||||||
| Excess tax benefits from the exercise of warrants | 127 | - | - | |||||||||
| Repayment of other borrowings | (20,738 | ) | - | - | ||||||||
| Dividends on preferred stock | (200 | ) | - | - | ||||||||
| Net cash provided by financing activities | 494,499 | 341,534 | 403,515 | |||||||||
| Net increase in cash and cash equivalents | 10,955 | 155,772 | 3,288 | |||||||||
| Cash and cash equivalents at beginning of year | 231,978 | 76,206 | 72,918 | |||||||||
| Cash and cash equivalents at end of year | $ | 242,933 | $ | 231,978 | $ | 76,206 | ||||||
| SUPPLEMENTAL DISCLOSURE | ||||||||||||
| Cash paid for: | ||||||||||||
| Interest | $ | 16,033 | $ | 15,388 | $ | 18,591 | ||||||
| Income taxes | 15,837 | 6,958 | 4,317 | |||||||||
| NONCASH TRANSACTIONS | ||||||||||||
| Transfers of loans from held for sale to held for investment | $ | 417 | $ | 787 | $ | 1,861 | ||||||
| Other real estate acquired in settlement of loans | 9,029 | 5,372 | 10,198 | |||||||||
| Internally financed sales of other real estate owned | 136 | 1,757 | 566 | |||||||||
| See Notes to Consolidated Financial Statements | ||||||||||||
SERVISFIRST BANCSHARES, INC.
SUBSIDIARIES
markets. The Bank has a subsidiary, SF Holding 1, Inc., which has a subsidiary, SF Realty 1, Inc., which operates as a real estate investment trust. More details about SF Holding 1, Inc. and SF Realty 1, Inc. are included in Note 10.
Investment2012.
NOTES TO CONSOLIDATED FINANCIAL STATEMENTS
| 75 | ||
Loans |
Loans are reported at unpaid principal balances, less unearned fees and the allowance for loan losses.Interest on all loans is recognized as income based upon the applicable rate applied to the daily outstanding principal balance of the loans. Interest income on nonaccrual loans is recognized on a cash basis or cost recovery basis until the loan is returned to accrual status. A loan may be returned to accrual status if the Company is reasonably assured of repayment of principal and interest and the borrower has demonstrated sustained performance for a period of at least six months.Loan fees, net of direct costs, are reflected as an adjustment to the yield of the related loan over the term of the loan.The Company does not have a concentration of loans to any one industry or geographic market. |
NOTES TO CONSOLIDATED FINANCIAL STATEMENTS
Allowance for Loan Losses |
The allowance for loan losses is maintained at a level which, in management’s judgment, is adequate to absorb credit losses inherent in the loan portfolio.The amount of the allowance is based on management’s evaluation of the collectability of the loan portfolio, including the nature of the portfolio, credit concentrations, trends in historical loss experience, specific impaired loans, economic conditions, and other risks inherent in the portfolio.Allowances for impaired loans are generally determined based on collateral values or the present value of the estimated cash flows.The allowance is increased by a provision for loan losses, which is charged to expense, and reduced by charge-offs, net of recoveries.In addition, various regulatory agencies, as an integral part of their examination process, periodically review the allowance for losses on loans.Such agencies may require the Company to recognize adjustments to the allowance based on their judgments about information available to them at the time of their |
| 76 | ||
NOTES TO CONSOLIDATED FINANCIAL STATEMENTS
As part of its overall interest rate risk management, the Company uses derivative instruments, which can include interest rate swaps, caps, and floors.Financial Accounting Standards Board (“FASB”) ASC 815-10, Derivatives and Hedging, requires all derivative instruments to be carried at fair value on the balance sheet.This accounting standard provides special accounting provisions for derivative instruments that qualify for hedge accounting.To be eligible, the Company must specifically identify a derivative as a hedging instrument and identify the risk being hedged.The derivative instrument must be shown to meet specific requirements under this accounting standard. |
The Company designates the derivative on the date the derivative contract is entered into as (1) a hedge of the fair value of a recognized asset or liability or of an unrecognized firm commitment (a “fair-value” hedge) or (2) a hedge of a forecasted transaction of the variability of cash flows to be received or paid related to a recognized asset or liability (a “cash-flow” hedge).Changes in the fair value of a derivative that is highly effective as a fair-value hedge, and that is designated and qualifies as a fair-value hedge, along with the loss or gain on the hedged asset or liability that is attributable to the hedged risk (including losses or gains on firm commitments), are recorded in current-period earnings.The effective portion of the changes in the fair value of a derivative that is highly effective and that is designated and qualifies as a cash-flow hedge is recorded in other comprehensive income, until earnings are affected by the variability of cash flows (e.g., when periodic settlements on a variable-rate asset or liability are recorded in earnings).The remaining gain or loss on the derivative, if any, in excess of the cumulative change in the present value of future cash flows of the hedged item is recognized in earnings. |
| The Company formally documents all relationships between hedging instruments and hedged items, as well as its risk-management objective and strategy for undertaking various hedge transactions. This process includes linking all derivatives that are designated as fair-value or cash-flow hedges to specific assets and liabilities on the balance sheet or to specific firm commitments or forecasted transactions. The Company also formally assessed, both at the hedge’s inception and on an ongoing basis (if the hedges do not qualify for short-cut accounting), whether the derivatives that are used in hedging transactions are highly effective in offsetting changes in fair values or cash flows of hedged items. When it is determined that a derivative is not highly effective as a hedge or that it has ceased to be a highly effective hedge, the Company discontinues hedge accounting prospectively, as discussed below. The Company discontinues hedge accounting prospectively when: (1) it is determined that the derivative is no longer effective in offsetting changes in the fair value or cash flows of a hedged item (including firm commitments or forecasted transactions); (2) the derivative expires or is sold, terminated, or exercised; (3) the derivative is re-designated as a hedge instrument, because it is unlikely that a forecasted transaction will occur; (4) a hedged firm commitment no longer meets the definition of a firm commitment; or (5) management determines that designation of the derivative as a hedge instrument is no longer appropriate. |
NOTES TO CONSOLIDATED FINANCIAL STATEMENTS
During 2008 the Company entered into interest rate swaps (“swaps”) to facilitate customer transactions and meet their financing needs. Upon entering into these swaps, the Company entered into offsetting positions with a regional correspondent bank in order to minimize the risk to the Company. As of December 31, 2011, the Company was party to two swaps with notional amounts totaling approximately $11.5 million with customers, and two swaps with notional amounts totaling approximately $11.5 million with a regional correspondent bank. These swaps qualify as derivatives, but are not designated as hedging instruments.
During 2010 the Company entered into an interest rate cap with a notional value of $100 million. The cap has a strike rate of 2.00% and is indexed to the three month London Interbank Offered Rate (“LIBOR”). The cap does not qualify for hedge accounting treatment, and is marked to market.
| 77 | ||
Income Taxes |
Income tax expense is the total of the current year income tax due or refundable and the change in deferred tax assets and liabilities.Deferred tax assets and liabilities are the expected future tax amounts for the temporary differences between carrying amounts and tax bases of assets and liabilities, computed using enacted tax rates.A valuation allowance, if needed, reduces deferred tax assets to the amount expected to be realized. |
Stock-Based Compensation
At December 31, |
Earnings per Common Share |
Basic earnings per common share are computed by dividing net income by the weighted average number of common shares outstanding during the period.Diluted earnings per common share include the dilutive effect of additional potential common shares issuable under stock options and warrants. |
Loan Commitments and Related Financial Instruments |
NOTES TO CONSOLIDATED FINANCIAL STATEMENTS
Fair Value of Financial Instruments |
Fair values of financial instruments are estimated using relevant market information and other assumptions, as more fully disclosed in Note |
Comprehensive Income |
Comprehensive income consists of net income and other comprehensive |
Advertising |
Advertising costs are expensed as incurred.Advertising expense for the years ended December 31, 2013, 2012 and 2011 |
| 78 | ||
Recent
In May 2011, the FASB issued ASU No. 2011-04,Fair Value Measurement (Topic 820): Amendments to Achieve Common Fair Value Measurement and Disclosure Requirements in U.S. GAAP and IFRS, which outlines the collaborative effort of the FASB and the InternationalFinancial Accounting Standards Board (“IASB”FASB”) to consistently define fair value and to come up with a set of consistent disclosures for fair value. The amendments in this update explain how to measure fair value. They do not require additional fair value measurements and are not intended to establish valuation standards or affect valuation practices outside of financial reporting. The amendments in this update are to be applied prospectively. For public entities, the amendments are effective for interim and annual periods beginning after December 31, 2011. Early application is not permitted. The Company will adopt these amendments when required, and does not believe the application will have a material effect on its financial position or results of operations.
NOTES TO CONSOLIDATED FINANCIAL STATEMENTS
Recent Accounting Pronouncements (Continued)
In June 2011, the FASB issued ASU No. 2011-05,Comprehensive Income (Topic 220): Presentation of Comprehensive Income, which amends existing standards to allow an entity the option to present the total of comprehensive income, the components of net income, and the components of other comprehensive income either in a single continuous statement of comprehensive income or in two separate but consecutive statements. Under both options, an entity is required to present each component of net income along with total net income, each component of other comprehensive income along with a total for other comprehensive income, and a total amount for comprehensive income. Any changes pursuant to the options allowed in the amendments should be applied retrospectively. For public entities, the amendments are effective for fiscal years, and interim periods within those years, beginning after December 15, 2011. Early adoption is permitted. The Company has evaluated the impact of this update on its financial statements and determined that there will be no change.
In December 2011, the FASB issued ASU No. 2011-12,Comprehensive Income (Topic 220): Deferral of the Effective Date for Amendments to the Presentation of Reclassifications of Items Out of Accumulated Other Comprehensive Income in ASU No. 2011-05,which defers the effective date pertaining to reclassification adjustments out of other accumulated comprehensive income in ASU 2011-05, until the FASB is able to reconsider those requirements. All other requirements of ASU 2011-05 are not affected by this update, including the requirement to report comprehensive income either in a single continuous financial statement or in two separate but consecutive financial statements. Public entities should apply these requirements for fiscal years, and interim periods within those years, beginning after December 15, 2011, which coincide with the effective dates of the requirements in ASU 2011-05 amended by this Update. The Company has evaluated the impact of this Update on its financial statements and determined that there will be no change.
In December 2011, the FASB issued ASU No. 2011-11,Balance Sheet (Topic 210): Disclosures about Offsetting Assets and Liabilities, which amendsamended disclosures by requiring improved information about financial instruments and derivative instruments that are either offset on the balance sheet or subject to an enforceable master netting arrangement or similar agreement, irrespective of whether they are offset on the balance sheet. Reporting entities are required to provide both net and gross information for these assets and liabilities in order to enhance comparability between those entities that prepare their financial statements on the basis of U.S. GAAP and those entities that prepare their financial statements on the basis of international financial reporting standards (“IFRS”). Companies arewere required to apply the amendmentsthis amendment for fiscal years beginning on or after January 1, 2013, and interim periods within those years. Retrospective disclosures are required. The Company does not believehas adopted this update, will have a materialbut such adoption had no impact on its financial position or results of operations.
NOTES TO CONSOLIDATED FINANCIAL STATEMENTS
| Amortized Cost | Gross Unrealized Gain | Gross Unrealized Loss | Fair Value | |||||||||||||
| (In Thousands) | ||||||||||||||||
| December 31, 2011: | ||||||||||||||||
| Securities Available for Sale | ||||||||||||||||
| U.S. Treasury and government agencies | $ | 98,169 | $ | 1,512 | $ | (59 | ) | $ | 99,622 | |||||||
| Mortgage-backed securities | 88,118 | 4,462 | - | 92,580 | ||||||||||||
| State and municipal securities | 95,331 | 5,230 | (35 | ) | 100,526 | |||||||||||
| Corporate debt | 1,029 | 52 | - | 1,081 | ||||||||||||
| Total | $ | 282,647 | $ | 11,256 | $ | (94 | ) | $ | 293,809 | |||||||
| Securities Held to Maturity | ||||||||||||||||
| Mortgage-backed securities | $ | 9,676 | $ | 410 | $ | - | $ | 10,086 | ||||||||
| State and municipal securities | 5,533 | 380 | - | 5,913 | ||||||||||||
| Total | $ | 15,209 | $ | 790 | $ | - | $ | 15,999 | ||||||||
| December 31, 2010: | ||||||||||||||||
| Securities Available for Sale | ||||||||||||||||
| U.S. Treasury and government agencies | $ | 90,631 | $ | 1,887 | $ | (224 | ) | $ | 92,294 | |||||||
| Mortgage-backed securities | 101,709 | 2,783 | (268 | ) | 104,224 | |||||||||||
| State and municipal securities | 78,241 | 1,076 | (1,051 | ) | 78,266 | |||||||||||
| Corporate debt | 2,013 | 162 | - | 2,175 | ||||||||||||
| Total | $ | 272,594 | $ | 5,908 | $ | (1,543 | ) | $ | 276,959 | |||||||
| Securities Held to Maturity | ||||||||||||||||
| State and municipal securities | $ | 5,234 | $ | - | $ | (271 | ) | $ | 4,963 | |||||||
| Total | $ | 5,234 | $ | - | $ | (271 | ) | $ | 4,963 | |||||||
| Gross | Gross | �� | |||||||||||
| Amortized | Unrealized | Unrealized | Market | ||||||||||
| Cost | Gain | Loss | Value | ||||||||||
| (In Thousands) | |||||||||||||
| December 31, 2013 | |||||||||||||
| Securities Available for Sale | |||||||||||||
| U.S. Treasury and government sponsored agencies | $ | 31,641 | $ | 674 | $ | (41) | $ | 32,274 | |||||
| Mortgage-backed securities | 85,764 | 2,574 | (98) | 88,240 | |||||||||
| State and municipal securities | 127,083 | 3,430 | (682) | 129,831 | |||||||||
| Corporate debt | 15,738 | 163 | (26) | 15,875 | |||||||||
| Total | 260,226 | 6,841 | (847) | 266,220 | |||||||||
| Securities Held to Maturity | |||||||||||||
| Mortgage-backed securities | 26,730 | 266 | (1,422) | 25,574 | |||||||||
| State and municipal securities | 5,544 | 197 | - | 5,741 | |||||||||
| Total | $ | 32,274 | $ | 463 | $ | (1,422) | $ | 31,315 | |||||
| December 31, 2012 | |||||||||||||
| Securities Available for Sale | |||||||||||||
| U.S. Treasury and government sponsored agencies | $ | 27,360 | $ | 1,026 | $ | - | $ | 28,386 | |||||
| Mortgage-backed securities | 69,298 | 4,168 | - | 73,466 | |||||||||
| State and municipal securities | 112,319 | 5,941 | (83) | 118,177 | |||||||||
| Corporate debt | 13,677 | 210 | (39) | 13,848 | |||||||||
| Total | 222,654 | 11,345 | (122) | 233,877 | |||||||||
| Securities Held to Maturity | |||||||||||||
| Mortgage-backed securities | 20,429 | 768 | (40) | 21,157 | |||||||||
| State and municipal securities | 5,538 | 655 | - | 6,193 | |||||||||
| Total | $ | 25,967 | $ | 1,423 | $ | (40) | $ | 27,350 | |||||
| 80 | ||
NOTES TO CONSOLIDATED FINANCIAL STATEMENTS
| Amortized Cost | Fair Value | |||||||
| (In Thousands) | ||||||||
| Securities available for sale | ||||||||
| Due within one year | $ | 10,664 | $ | 10,762 | ||||
| Due from one to five years | 112,488 | 114,227 | ||||||
| Due from five to ten years | 65,509 | 69,864 | ||||||
| Due after ten years | 5,868 | 6,376 | ||||||
| Mortgage-backed securities | 88,118 | 92,580 | ||||||
| $ | 282,647 | $ | 293,809 | |||||
| Securities held to maturity | ||||||||
| Due after ten years | $ | 5,533 | $ | 5,913 | ||||
| Mortgage-backed securities | 9,676 | 10,086 | ||||||
| $ | 15,209 | $ | 15,999 | |||||
| December 31, 2013 | December 31, 2012 | ||||||||||||
| Amortized Cost | Market Value | Amortized Cost | Market Value | ||||||||||
| (In Thousands) | |||||||||||||
| Securities available for sale | |||||||||||||
| Due within one year | $ | 5,659 | $ | 5,717 | $ | 11,971 | $ | 12,052 | |||||
| Due from one to five years | 102,535 | 104,887 | 79,192 | 81,940 | |||||||||
| Due from five to ten years | 65,174 | 66,229 | 59,825 | 63,801 | |||||||||
| Due after ten years | 1,094 | 1,147 | 2,368 | 2,618 | |||||||||
| Mortgage-backed securities | 85,764 | 88,240 | 69,298 | 73,466 | |||||||||
| $ | 260,226 | $ | 266,220 | $ | 222,654 | $ | 233,877 | ||||||
| Securities held to maturity | |||||||||||||
| Due after ten years | $ | 5,544 | $ | 5,741 | $ | 5,538 | $ | 6,193 | |||||
| Mortgage-backed securities | 26,730 | 25,574 | 20,429 | 21,157 | |||||||||
| $ | 32,274 | $ | 31,315 | $ | 25,967 | $ | 27,350 | ||||||
NOTES TO CONSOLIDATED FINANCIAL STATEMENTS
| Less Than Twelve Months | Twelve Months or More | Total | |||||||||||||||||
| Gross | Gross | Gross | |||||||||||||||||
| Unrealized | Unrealized | Unrealized | |||||||||||||||||
| Losses | Fair Value | Losses | Fair Value | Losses | Fair Value | ||||||||||||||
| (In Thousands) | |||||||||||||||||||
| December 31, 2013 | |||||||||||||||||||
| U.S. Treasury and government | |||||||||||||||||||
| sponsored agencies | $ | (41) | $ | 5,854 | $ | - | $ | - | $ | (41) | $ | 5,854 | |||||||
| Mortgage-backed securities | (852) | 21,365 | (668) | 6,691 | (1,520) | 28,056 | |||||||||||||
| State and municipal securities | (607) | 30,666 | (75) | 3,443 | (682) | 34,109 | |||||||||||||
| Corporate debt | (26) | 5,958 | - | - | (26) | 5,958 | |||||||||||||
| Total | $ | (1,526) | $ | 63,843 | $ | (743) | $ | 10,134 | $ | (2,269) | $ | 73,977 | |||||||
| December 31, 2012 | |||||||||||||||||||
| U.S. Treasury and government sponsored agencies | |||||||||||||||||||
| Mortgage-backed securities | (40) | 4,439 | - | - | (40) | 4,439 | |||||||||||||
| State and municipal securities | (83) | 8,801 | - | 166 | (83) | 8,967 | |||||||||||||
| Corporate debt | (39) | 4,882 | - | - | (39) | 4,882 | |||||||||||||
| Total | $ | (162) | $ | 18,122 | $ | - | $ | 166 | $ | (162) | $ | 18,288 | |||||||
| Less Than Twelve Months | Twelve Months or More | |||||||||||||||
| Gross Unrealized Losses | Fair Value | Gross Unrealized Losses | Fair Value | |||||||||||||
| (In Thousands) | ||||||||||||||||
| December 31, 2011: | ||||||||||||||||
| U.S. Treasury and government agencies | $ | (59 | ) | $ | 15,074 | $ | - | $ | - | |||||||
| Mortgage-backed securities | - | - | - | - | ||||||||||||
| State and municipal securities | (35 | ) | 4,559 | - | - | |||||||||||
| Corporate debt | - | - | - | - | ||||||||||||
| $ | (94 | ) | $ | 19,633 | $ | - | $ | - | ||||||||
| December 31, 2010: | ||||||||||||||||
| U.S. Treasury and government agencies | $ | (224 | ) | $ | 24,217 | $ | - | $ | - | |||||||
| Mortgage-backed securities | (268 | ) | 16,417 | - | - | |||||||||||
| State and municipal securities | (1,034 | ) | 33,282 | (288 | ) | 3,674 | ||||||||||
| Corporate debt | - | - | - | - | ||||||||||||
| $ | (1,526 | ) | $ | 73,916 | $ | (288 | ) | $ | 3,674 | |||||||
$992,000.
NOTES TO CONSOLIDATED FINANCIAL STATEMENTS
| December 31, | ||||||||
| 2011 | 2010 | |||||||
| (In Thousands) | ||||||||
| Commercial, financial and agricultural | $ | 799,464 | $ | 536,620 | ||||
| Real estate - construction | 151,218 | 172,055 | ||||||
| Real estate - mortgage: | ||||||||
| Owner occupied commercial | 398,601 | 270,767 | ||||||
| 1-4 family mortgage | 205,182 | 199,236 | ||||||
| Other mortgage | 235,251 | 178,793 | ||||||
| Subtotal: Real estate mortgage | 839,034 | 648,796 | ||||||
| Consumer | 41,026 | 37,347 | ||||||
| Total Loans | 1,830,742 | 1,394,818 | ||||||
| Less: Allowance for loan losses | (22,030 | ) | (18,077 | ) | ||||
| Net Loans | $ | 1,808,712 | $ | 1,376,741 | ||||
NOTES TO CONSOLIDATED FINANCIAL STATEMENTS
NOTE 3. LOANS (Continued)
| December 31, | |||||||
| 2013 | 2012 | ||||||
| (In Thousands) | |||||||
| Commercial, financial and agricultural | $ | 1,278,649 | $ | 1,030,990 | |||
| Real estate - construction | 151,868 | 158,361 | |||||
| Real estate - mortgage: | |||||||
| Owner-occupied commercial | 710,372 | 568,041 | |||||
| 1-4 family mortgage | 278,621 | 235,909 | |||||
| Other mortgage | 391,396 | 323,599 | |||||
| Total real estate - mortgage | 1,380,389 | 1,127,549 | |||||
| Consumer | 47,962 | 46,282 | |||||
| Total Loans | 2,858,868 | 2,363,182 | |||||
| Less: Allowance for loan losses | (30,663) | (26,258) | |||||
| Net Loans | $ | 2,828,205 | $ | 2,336,924 | |||
| Years Ended December 31, | ||||||||||||
| 2011 | 2010 | 2009 | ||||||||||
| (In Thousands) | ||||||||||||
| Balance, beginning of year | $ | 18,077 | $ | 14,737 | $ | 10,602 | ||||||
| Loans charged off | (5,653 | ) | (7,208 | ) | (6,676 | ) | ||||||
| Recoveries | 634 | 198 | 126 | |||||||||
| Provision for loan losses | 8,972 | 10,350 | 10,685 | |||||||||
| Balance, end of year | $ | 22,030 | $ | 18,077 | $ | 14,737 | ||||||
| Years Ended December 31, | ||||||||||
| 2013 | 2012 | 2011 | ||||||||
| (In Thousands) | ||||||||||
| Balance, beginning of year | $ | 26,258 | $ | 22,030 | $ | 18,077 | ||||
| Loans charged off | (9,012) | (5,755) | (5,653) | |||||||
| Recoveries | 409 | 883 | 634 | |||||||
| Provision for loan losses | 13,008 | 9,100 | 8,972 | |||||||
| Balance, end of year | $ | 30,663 | $ | 26,258 | $ | 22,030 | ||||
| 82 | ||
NOTES TO CONSOLIDATED FINANCIAL STATEMENTS
NOTE 3. LOANS (Continued)
| Commercial, financial and agricultural | Real estate - construction | Real estate - mortgage | Consumer | Unallocated | Total | |||||||||||||||||||
| Year Ended December 31, 2011 | ||||||||||||||||||||||||
| Allowance for loan losses: | ||||||||||||||||||||||||
| Balance at December 31, 2010 | $ | 5,348 | $ | 6,373 | $ | 2,443 | $ | 749 | $ | 3,164 | $ | 18,077 | ||||||||||||
| Chargeoffs | (1,096 | ) | (2,594 | ) | (1,096 | ) | (867 | ) | - | (5,653 | ) | |||||||||||||
| Recoveries | 361 | 180 | 12 | 81 | - | 634 | ||||||||||||||||||
| Provision | 2,014 | 2,583 | 1,936 | 568 | 1,871 | 8,972 | ||||||||||||||||||
| Balance at December 31, 2011 | 6,627 | 6,542 | 3,295 | 531 | 5,035 | 22,030 | ||||||||||||||||||
| December 31, 2011 | ||||||||||||||||||||||||
| Individually Evaluated for Impairment | $ | 1,382 | $ | 1,533 | $ | 941 | $ | 325 | $ | - | $ | 4,181 | ||||||||||||
| Collectively Evaluated for Impairment | 5,245 | 5,009 | 2,354 | 206 | 5,035 | 17,849 | ||||||||||||||||||
| Loans: | ||||||||||||||||||||||||
| Ending Balance | $ | 799,464 | $ | 151,218 | $ | 839,034 | $ | 41,026 | $ | - | $ | 1,830,742 | ||||||||||||
| Individually Tested for Impairment | 5,578 | 16,262 | 14,866 | 547 | - | 37,253 | ||||||||||||||||||
| Collectively Evaluated for Impairment | 793,886 | 134,956 | 824,168 | 40,479 | - | 1,793,489 | ||||||||||||||||||
| Year Ended December 31, 2010 | ||||||||||||||||||||||||
| Allowance for loan losses: | ||||||||||||||||||||||||
| Balance at December 31, 2009 | $ | 3,135 | $ | 6,295 | $ | 2,102 | $ | 115 | $ | 3,090 | $ | 14,737 | ||||||||||||
| Chargeoffs | (1,667 | ) | (3,488 | ) | (1,775 | ) | (278 | ) | - | (7,208 | ) | |||||||||||||
| Recoveries | 97 | 53 | 32 | 16 | - | 198 | ||||||||||||||||||
| Provision | 3,783 | 3,513 | 2,084 | 896 | 74 | 10,350 | ||||||||||||||||||
| Balance at December 31, 2010 | 5,348 | 6,373 | 2,443 | 749 | 3,164 | 18,077 | ||||||||||||||||||
| December 31, 2010 | ||||||||||||||||||||||||
| Individually Evaluated for Impairment | $ | 1,602 | $ | 1,855 | $ | 415 | $ | 554 | $ | - | $ | 4,426 | ||||||||||||
| Collectively Evaluated for Impairment | 3,746 | 4,518 | 2,028 | 195 | 3,164 | 13,651 | ||||||||||||||||||
| Loans: | ||||||||||||||||||||||||
| Ending Balance | $ | 536,620 | $ | 172,055 | $ | 648,796 | $ | 37,347 | $ | 1,394,818 | ||||||||||||||
| Individually Evaluated for Impairment | 11,535 | 28,710 | 10,310 | 993 | - | 51,548 | ||||||||||||||||||
| Collectively Evaluated for Impairment | 525,085 | 143,345 | 638,486 | 36,354 | - | 1,343,270 | ||||||||||||||||||
NOTES TO CONSOLIDATED FINANCIAL STATEMENTS
NOTE 3. LOANS (Continued)
Loans by credit quality indicator as of December 31, 2011 and 2010 are as follows:
| December 31, 2011 | Pass | Special Mention | Substandard | Doubtful | Total | |||||||||||||||
| Commercial, financial and agricultural | $ | 780,270 | $ | 11,775 | $ | 7,419 | $ | - | $ | 799,464 | ||||||||||
| Real estate - construction | 117,244 | 14,472 | 19,502 | - | 151,218 | |||||||||||||||
| Real estate - mortgage: | ||||||||||||||||||||
| Owner occupied commercial | 385,084 | 7,333 | 6,184 | - | 398,601 | |||||||||||||||
| 1-4 family mortgage | 194,447 | 4,835 | 5,900 | - | 205,182 | |||||||||||||||
| Other mortgage | 224,807 | 7,034 | 3,410 | - | 235,251 | |||||||||||||||
| Total real estate mortgage | 804,338 | 19,202 | 15,494 | - | 839,034 | |||||||||||||||
| Consumer | 40,353 | 96 | 577 | - | 41,026 | |||||||||||||||
| Total | $ | 1,742,205 | $ | 45,545 | $ | 42,992 | $ | - | $ | 1,830,742 | ||||||||||
| December 31, 2010 | Pass | Special Mention | Substandard | Doubtful | Total | |||||||||||||||
| Commercial, financial and agricultural | $ | 508,376 | $ | 14,209 | $ | 14,035 | $ | - | $ | 536,620 | ||||||||||
| Real estate - construction | 126,200 | 17,145 | 28,710 | - | 172,055 | |||||||||||||||
| Real estate - mortgage: | ||||||||||||||||||||
| Owner occupied commercial | 256,638 | 6,251 | 7,878 | - | 270,767 | |||||||||||||||
| 1-4 family mortgage | 193,365 | 1,072 | 4,799 | - | 199,236 | |||||||||||||||
| Other mortgage | 175,815 | 562 | 2,416 | - | 178,793 | |||||||||||||||
| Total real estate mortgage | 625,818 | 7,885 | 15,093 | - | 648,796 | |||||||||||||||
| Consumer | 36,090 | - | 1,257 | - | 37,347 | |||||||||||||||
| Total | $ | 1,296,484 | $ | 39,239 | $ | 59,095 | $ | - | $ | 1,394,818 | ||||||||||
| 83 | ||
| Commercial, | |||||||||||||||||||
| financial and | Real estate - | Real estate - | Qualitative | ||||||||||||||||
| agricultural | construction | mortgage | Consumer | Factors | Total | ||||||||||||||
| (In Thousands) | |||||||||||||||||||
| Year Ended December 31, 2013 | |||||||||||||||||||
| Allowance for loan losses: | |||||||||||||||||||
| Balance at December 31, 2012 | $ | 8,233 | $ | 6,511 | $ | 4,912 | $ | 199 | $ | 6,403 | $ | 26,258 | |||||||
| Chargeoffs | (1,932) | (4,829) | (2,041) | (210) | - | (9,012) | |||||||||||||
| Recoveries | 66 | 296 | 36 | 11 | - | 409 | |||||||||||||
| Provision | 4,803 | 3,831 | 4,588 | 855 | (1,069) | 13,008 | |||||||||||||
| Balance at December 31, 2013 | $ | 11,170 | $ | 5,809 | $ | 7,495 | $ | 855 | $ | 5,334 | $ | 30,663 | |||||||
| December 31, 2013 | |||||||||||||||||||
| Individually Evaluated for Impairment | $ | 1,992 | $ | 1,597 | $ | 1,982 | $ | 699 | $ | - | $ | 6,270 | |||||||
| Collectively Evaluated for Impairment | 9,178 | 4,212 | 5,513 | 156 | 5,334 | 24,393 | |||||||||||||
| Loans: | |||||||||||||||||||
| Ending Balance | $ | 1,278,649 | $ | 151,868 | $ | 1,380,389 | $ | 47,962 | $ | - | $ | 2,858,868 | |||||||
| Individually Evaluated for Impairment | 3,827 | 9,238 | 18,202 | 699 | - | 31,966 | |||||||||||||
| Collectively Evaluated for Impairment | 1,274,822 | 142,630 | 1,362,187 | 47,263 | - | 2,826,902 | |||||||||||||
| Year Ended December 31, 2012 | |||||||||||||||||||
| Allowance for loan losses: | |||||||||||||||||||
| Balance at December 31, 2011 | $ | 6,627 | $ | 6,542 | $ | 3,295 | $ | 531 | $ | 5,035 | $ | 22,030 | |||||||
| Chargeoffs | (1,106) | (3,088) | (660) | (901) | - | (5,755) | |||||||||||||
| Recoveries | 125 | 58 | 692 | 8 | - | 883 | |||||||||||||
| Provision | 2,587 | 2,999 | 1,585 | 561 | 1,368 | 9,100 | |||||||||||||
| Balance at December 31, 2012 | $ | 8,233 | $ | 6,511 | $ | 4,912 | $ | 199 | $ | 6,403 | $ | 26,258 | |||||||
| December 31, 2012 | |||||||||||||||||||
| Individually Evaluated for Impairment | $ | 577 | $ | 1,013 | $ | 1,921 | $ | - | $ | - | $ | 3,511 | |||||||
| Collectively Evaluated for Impairment | 7,656 | 5,498 | 2,991 | 199 | 6,403 | 22,747 | |||||||||||||
| Loans: | |||||||||||||||||||
| Ending Balance | $ | 1,030,990 | $ | 158,361 | $ | 1,127,549 | $ | 46,282 | $ | - | $ | 2,363,182 | |||||||
| Individually Evaluated for Impairment | 3,910 | 14,422 | 18,927 | 135 | - | 37,394 | |||||||||||||
| Collectively Evaluated for Impairment | 1,027,080 | 143,939 | 1,108,622 | 46,147 | - | 2,325,788 | |||||||||||||
| · | Pass – loans which are well protected by the current net worth and paying capacity of the obligor (or obligors, if any) or by the fair value, less cost to acquire and sell, of any underlying collateral. |
| · | Special Mention – loans with potential weakness that may, if not reversed or corrected, weaken the credit or inadequately protect the Company’s position at some future date. These loans are not adversely classified and do not expose an institution to sufficient risk to warrant an adverse classification. |
| · | Substandard – loans that exhibit well-defined weakness or weaknesses that presently jeopardize debt repayment. These loans are characterized by the distinct possibility that the institution will sustain some loss if the |
| · | Doubtful – loans that have all the weaknesses inherent in loans classified substandard, plus the added characteristic that the weaknesses make collection or liquidation in full on the basis of currently existing facts, conditions, and values highly questionable and improbable. |
| 84 | ||
| Special | ||||||||||||||||
| December 31, 2013 | Pass | Mention | Substandard | Doubtful | Total | |||||||||||
| (In Thousands) | ||||||||||||||||
| Commercial, financial | ||||||||||||||||
| and agricultural | $ | 1,238,109 | $ | 34,883 | $ | 5,657 | $ | - | $ | 1,278,649 | ||||||
| Real estate - construction | 139,239 | 3,392 | 9,237 | - | 151,868 | |||||||||||
| Real estate - mortgage: | ||||||||||||||||
| Owner-occupied | ||||||||||||||||
| commercial | 696,687 | 11,545 | 2,140 | - | 710,372 | |||||||||||
| 1-4 family mortgage | 265,019 | 1,253 | 12,349 | - | 278,621 | |||||||||||
| Other mortgage | 379,419 | 8,179 | 3,798 | - | 391,396 | |||||||||||
| Total real estate mortgage | 1,341,125 | 20,977 | 18,287 | - | 1,380,389 | |||||||||||
| Consumer | 47,243 | 3 | 716 | - | 47,962 | |||||||||||
| Total | $ | 2,765,716 | $ | 59,255 | $ | 33,897 | $ | - | $ | 2,858,868 | ||||||
| Special | ||||||||||||||||
| December 31, 2012 | Pass | Mention | Substandard | Doubtful | Total | |||||||||||
| (In Thousands) | ||||||||||||||||
| Commercial, financial | ||||||||||||||||
| and agricultural | $ | 1,004,043 | $ | 19,172 | $ | 7,775 | $ | - | $ | 1,030,990 | ||||||
| Real estate - construction | 121,168 | 22,771 | 14,422 | - | 158,361 | |||||||||||
| Real estate - mortgage: | ||||||||||||||||
| Owner-occupied | ||||||||||||||||
| commercial | 555,536 | 4,142 | 8,363 | - | 568,041 | |||||||||||
| 1-4 family mortgage | 223,152 | 6,379 | 6,378 | - | 235,909 | |||||||||||
| Other mortgage | 312,473 | 6,674 | 4,452 | - | 323,599 | |||||||||||
| Total real estate mortgage | 1,091,161 | 17,195 | 19,193 | - | 1,127,549 | |||||||||||
| Consumer | 46,076 | 71 | 135 | - | 46,282 | |||||||||||
| Total | $ | 2,262,448 | $ | 59,209 | $ | 41,525 | $ | - | $ | 2,363,182 | ||||||
| 85 | ||
NOTES TO CONSOLIDATED FINANCIAL STATEMENTS
NOTE 3. LOANS (Continued)
| December 31, 2011 | Performing | Nonperforming | Total | |||||||||
| Commercial, financial and agricultural | $ | 798,285 | $ | 1,179 | $ | 799,464 | ||||||
| Real estate - construction | 141,155 | 10,063 | 151,218 | |||||||||
| Real estate - mortgage: | ||||||||||||
| Owner occupied commercial | 397,809 | 792 | 398,601 | |||||||||
| 1-4 family mortgage | 204,512 | 670 | 205,182 | |||||||||
| Other mortgage | 234,558 | 693 | 235,251 | |||||||||
| Total real estate mortgage | 836,879 | 2,155 | 839,034 | |||||||||
| Consumer | 40,651 | 375 | 41,026 | |||||||||
| Total | $ | 1,816,970 | $ | 13,772 | $ | 1,830,742 | ||||||
| December 31, 2010 | Performing | Nonperforming | Total | |||||||||
| Commercial, financial and agricultural | $ | 534,456 | $ | 2,164 | $ | 536,620 | ||||||
| Real estate - construction | 161,333 | 10,722 | 172,055 | |||||||||
| Real estate - mortgage: | ||||||||||||
| Owner occupied commercial | 270,131 | 635 | 270,766 | |||||||||
| 1-4 family mortgage | 199,035 | 202 | 199,237 | |||||||||
| Other mortgage | 178,793 | - | 178,793 | |||||||||
| Total real estate mortgage | 647,959 | 837 | 648,796 | |||||||||
| Consumer | 36,723 | 624 | 37,347 | |||||||||
| Total | $ | 1,380,471 | $ | 14,347 | $ | 1,394,818 | ||||||
NOTES TO CONSOLIDATED FINANCIAL STATEMENTS
NOTE 3. LOANS (Continued)
| December 31, 2013 | Performing | Nonperforming | Total | |||||||
| (In Thousands) | ||||||||||
| Commercial, financial | ||||||||||
| and agricultural | $ | 1,276,935 | $ | 1,714 | $ | 1,278,649 | ||||
| Real estate - construction | 148,118 | 3,750 | 151,868 | |||||||
| Real estate - mortgage: | ||||||||||
| Owner-occupied | ||||||||||
| commercial | 708,937 | 1,435 | 710,372 | |||||||
| 1-4 family mortgage | 276,725 | 1,896 | 278,621 | |||||||
| Other mortgage | 391,153 | 243 | 391,396 | |||||||
| Total real estate mortgage | 1,376,815 | 3,574 | 1,380,389 | |||||||
| Consumer | 47,264 | 698 | 47,962 | |||||||
| Total | $ | 2,849,132 | $ | 9,736 | $ | 2,858,868 | ||||
| December 31, 2012 | Performing | Nonperforming | Total | |||||||
| (In Thousands) | ||||||||||
| Commercial, financial | ||||||||||
| and agricultural | $ | 1,030,714 | $ | 276 | $ | 1,030,990 | ||||
| Real estate - construction | 151,901 | 6,460 | 158,361 | |||||||
| Real estate - mortgage: | ||||||||||
| Owner-occupied | ||||||||||
| commercial | 565,255 | 2,786 | 568,041 | |||||||
| 1-4 family mortgage | 235,456 | 453 | 235,909 | |||||||
| Other mortgage | 323,359 | 240 | 323,599 | |||||||
| Total real estate mortgage | 1,124,070 | 3,479 | 1,127,549 | |||||||
| Consumer | 46,139 | 143 | 46,282 | |||||||
| Total | $ | 2,352,824 | $ | 10,358 | $ | 2,363,182 | ||||
| 86 | ||
| December 31, 2011 | Past Due Status (Accruing Loans) | |||||||||||||||||||||||||||
| 30-59 Days | 60-89 Days | 90+ Days | Total Past Due | Non- Accrual | Current | Total Loans | ||||||||||||||||||||||
| Commercial, financial and agricultural | $ | - | $ | - | $ | - | $ | - | $ | 1,179 | $ | 797,300 | $ | 799,464 | ||||||||||||||
| Real estate - construction | 2,234 | - | - | 2,234 | 10,063 | 138,262 | 151,218 | |||||||||||||||||||||
| Real estate - mortgage: | ||||||||||||||||||||||||||||
| Owner-occupied commercial | - | - | - | - | 792 | 397,966 | 398,601 | |||||||||||||||||||||
| 1-4 family mortgage | 2,107 | - | - | 2,107 | 670 | 202,873 | 205,182 | |||||||||||||||||||||
| Other mortgage | - | - | - | - | 693 | 235,251 | 235,251 | |||||||||||||||||||||
| Total real estate -mortgage | 2,107 | - | - | 2,107 | 2,155 | 836,090 | 839,034 | |||||||||||||||||||||
| Consumer | - | 84 | - | 84 | 375 | 40,318 | 41,026 | |||||||||||||||||||||
| Total | $ | 4,341 | $ | 84 | $ | - | $ | 4,425 | $ | 13,772 | $ | 1,811,970 | $ | 1,830,742 | ||||||||||||||
| December 31, 2010 | Past Due Status (Accruing Loans) | |||||||||||||||||||||||||||
| 30-59 Days | 60-89 Days | 90+ Days | Total Past Due | Non- Accrual | Current | Total Loans | ||||||||||||||||||||||
| Commercial, financial and agricultural | $ | 205 | $ | 575 | $ | - | $ | 780 | $ | 2,164 | $ | 533,676 | $ | 536,620 | ||||||||||||||
| Real estate - construction | - | - | - | - | 10,722 | 161,333 | 172,055 | |||||||||||||||||||||
| Real estate - mortgage: | ||||||||||||||||||||||||||||
| Owner-occupied commercial | 134 | - | - | 134 | 635 | 269,998 | 270,767 | |||||||||||||||||||||
| 1-4 family mortgage | 125 | - | - | 125 | 202 | 198,909 | 199,236 | |||||||||||||||||||||
| Other mortgage | - | - | - | - | - | 178,793 | 178,793 | |||||||||||||||||||||
| Total real estate -mortgage | 259 | - | - | 259 | 837 | 647,700 | 648,796 | |||||||||||||||||||||
| Consumer | 13 | - | - | 13 | 624 | 36,710 | 37,347 | |||||||||||||||||||||
| Total | $ | 477 | $ | 575 | $ | - | $ | 1,052 | $ | 14,347 | $ | 1,379,419 | $ | 1,394,818 | ||||||||||||||
| December 31, 2013 | Past Due Status (Accruing Loans) | |||||||||||||||||||||
| Total Past | ||||||||||||||||||||||
| 30-59 Days | 60-89 Days | 90+ Days | Due | Non-Accrual | Current | Total Loans | ||||||||||||||||
| (In Thousands) | ||||||||||||||||||||||
| Commercial, financial | ||||||||||||||||||||||
| and agricultural | $ | 73 | $ | - | $ | - | $ | 73 | $ | 1,714 | $ | 1,276,862 | $ | 1,278,649 | ||||||||
| Real estate - construction | - | - | - | - | 3,750 | 148,118 | 151,868 | |||||||||||||||
| Real estate - mortgage: | ||||||||||||||||||||||
| Owner-occupied | ||||||||||||||||||||||
| commercial | - | - | - | - | 1,435 | 708,937 | 710,372 | |||||||||||||||
| 1-4 family mortgage | 177 | - | 19 | 196 | 1,877 | 276,548 | 278,621 | |||||||||||||||
| Other mortgage | - | - | - | - | 243 | 391,153 | 391,396 | |||||||||||||||
| Total real estate - | ||||||||||||||||||||||
| mortgage | 177 | - | 19 | 196 | 3,555 | 1,376,638 | 1,380,389 | |||||||||||||||
| Consumer | 89 | 97 | 96 | 282 | 602 | 47,078 | 47,962 | |||||||||||||||
| Total | $ | 339 | $ | 97 | $ | 115 | $ | 551 | $ | 9,621 | $ | 2,848,696 | $ | 2,858,868 | ||||||||
| December 31, 2012 | Past Due Status (Accruing Loans) | |||||||||||||||||||||
| Total Past | ||||||||||||||||||||||
| 30-59 Days | 60-89 Days | 90+ Days | Due | Non-Accrual | Current | Total Loans | ||||||||||||||||
| (In Thousands) | ||||||||||||||||||||||
| Commercial, financial | ||||||||||||||||||||||
| and agricultural | $ | 1,699 | $ | 385 | $ | - | $ | 2,084 | $ | 276 | $ | 1,028,630 | $ | 1,030,990 | ||||||||
| Real estate - construction | - | - | - | - | 6,460 | 151,901 | 158,361 | |||||||||||||||
| Real estate - mortgage: | ||||||||||||||||||||||
| Owner-occupied | ||||||||||||||||||||||
| commercial | 1,480 | 10 | - | 1,490 | 2,786 | 563,765 | 568,041 | |||||||||||||||
| 1-4 family mortgage | 420 | 16 | - | 436 | 453 | 235,020 | 235,909 | |||||||||||||||
| Other mortgage | 516 | - | - | 516 | 240 | 322,843 | 323,599 | |||||||||||||||
| Total real estate - | ||||||||||||||||||||||
| mortgage | 2,416 | 26 | - | 2,442 | 3,479 | 1,121,628 | 1,127,549 | |||||||||||||||
| Consumer | 108 | - | 8 | 116 | 135 | 46,031 | 46,282 | |||||||||||||||
| Total | $ | 4,223 | $ | 411 | $ | 8 | $ | 4,642 | $ | 10,350 | $ | 2,348,190 | $ | 2,363,182 | ||||||||
| 87 | ||
NOTES TO CONSOLIDATED FINANCIAL STATEMENTS
NOTE 3. LOANS (Continued)
December 31, 2011
| Recorded Investment | Unpaid Principal Balance | Related Allowance | Average Recorded Investment | Interest Income Recognized in Period | ||||||||||||||||
| (In Thousands) | ||||||||||||||||||||
| With no allowance recorded: | ||||||||||||||||||||
| Commercial, financial and agricultural | $ | 1,264 | $ | 1,264 | $ | - | $ | 1,501 | $ | 74 | ||||||||||
| Real estate - construction | 11,583 | 12,573 | - | 10,406 | 226 | |||||||||||||||
| Real estate - mortgage: | ||||||||||||||||||||
| Owner-occupied commercial | 2,493 | 2,493 | - | 2,523 | 153 | |||||||||||||||
| 1-4 family mortgage | 1,293 | 1,293 | - | 1,241 | 44 | |||||||||||||||
| Other mortgage | 2,837 | 2,837 | - | 2,746 | 162 | |||||||||||||||
| Total real estate - mortgage | 6,623 | 6,623 | - | 6,510 | 359 | |||||||||||||||
| Consumer | 173 | 173 | - | 173 | 6 | |||||||||||||||
| Total with no allowance recorded | 19,643 | 20,633 | - | 18,590 | 665 | |||||||||||||||
| With an allowance recorded: | ||||||||||||||||||||
| Commercial, financial and agricultural | 4,314 | 4,314 | 1,382 | 4,156 | 226 | |||||||||||||||
| Real estate - construction | 4,679 | 4,679 | 1,482 | 3,987 | 94 | |||||||||||||||
| Real estate - mortgage: | ||||||||||||||||||||
| Owner-occupied commercial | 3,515 | 3,515 | 88 | 3,504 | 365 | |||||||||||||||
| 1-4 family mortgage | 4,397 | 4,397 | 904 | 4,484 | 198 | |||||||||||||||
| Other mortgage | 331 | 331 | - | 337 | 22 | |||||||||||||||
| Total real estate - mortgage | 8,243 | 8,243 | 992 | 8,325 | 585 | |||||||||||||||
| Consumer | 374 | 624 | 325 | 425 | - | |||||||||||||||
| Total with allowance recorded | 17,610 | 17,860 | 4,181 | 16,893 | 905 | |||||||||||||||
| Total Impaired Loans: | ||||||||||||||||||||
| Commercial, financial and agricultural | 5,578 | 5,578 | 1,382 | 5,657 | 300 | |||||||||||||||
| Real estate - construction | 16,262 | 17,252 | 1,482 | 14,393 | 320 | |||||||||||||||
| Real estate - mortgage: | ||||||||||||||||||||
| Owner-occupied commercial | 6,008 | 6,008 | 88 | 6,027 | 518 | |||||||||||||||
| 1-4 family mortgage | 5,690 | 5,690 | 904 | 5,725 | 242 | |||||||||||||||
| Other mortgage | 3,168 | 3,168 | - | 3,083 | 184 | |||||||||||||||
| Total real estate - mortgage | 14,866 | 14,866 | 992 | 14,835 | 944 | |||||||||||||||
| Consumer | 547 | 797 | 325 | 598 | 6 | |||||||||||||||
| Total impaired loans | $ | 37,253 | $ | 38,493 | $ | 4,181 | $ | 35,483 | $ | 1,570 | ||||||||||
| December 31, 2013 | ||||||||||||||||
| Unpaid | Average | Interest Income | ||||||||||||||
| Recorded | Principal | Related | Recorded | Recognized | ||||||||||||
| Investment | Balance | Allowance | Investment | in Period | ||||||||||||
| (In Thousands) | ||||||||||||||||
| With no allowance recorded: | ||||||||||||||||
| Commercial, financial | ||||||||||||||||
| and agricultural | $ | 1,210 | $ | 1,210 | $ | - | $ | 1,196 | $ | 63 | ||||||
| Real estate - construction | 1,967 | 2,405 | - | 1,363 | 32 | |||||||||||
| Real estate - mortgage: | ||||||||||||||||
| Owner-occupied commercial | 577 | 577 | - | 603 | 32 | |||||||||||
| 1-4 family mortgage | 1,198 | 1,198 | - | 1,200 | 55 | |||||||||||
| Other mortgage | 2,311 | 2,311 | - | 1,901 | 123 | |||||||||||
| Total real estate - mortgage | 4,086 | 4,086 | - | 3,704 | 210 | |||||||||||
| Consumer | - | - | - | - | - | |||||||||||
| Total with no allowance recorded | 7,263 | 7,701 | - | 6,263 | 305 | |||||||||||
| With an allowance recorded: | ||||||||||||||||
| Commercial, financial | ||||||||||||||||
| and agricultural | 2,618 | 2,958 | 1,992 | 2,844 | 98 | |||||||||||
| Real estate - construction | 7,270 | 7,750 | 1,597 | 6,564 | 200 | |||||||||||
| Real estate - mortgage: | ||||||||||||||||
| Owner-occupied commercial | 1,509 | 1,509 | 620 | 1,573 | 38 | |||||||||||
| 1-4 family mortgage | 11,120 | 11,120 | 1,210 | 10,743 | 342 | |||||||||||
| Other mortgage | 1,487 | 1,586 | 152 | 1,873 | 96 | |||||||||||
| Total real estate - mortgage | 14,116 | 14,215 | 1,982 | 14,189 | 476 | |||||||||||
| Consumer | 699 | 699 | 699 | 790 | 28 | |||||||||||
| Total with allowance recorded | 24,703 | 25,622 | 6,270 | 24,387 | 802 | |||||||||||
| Total Impaired Loans: | ||||||||||||||||
| Commercial, financial | ||||||||||||||||
| and agricultural | 3,828 | 4,168 | 1,992 | 4,040 | 161 | |||||||||||
| Real estate - construction | 9,237 | 10,155 | 1,597 | 7,927 | 232 | |||||||||||
| Real estate - mortgage: | ||||||||||||||||
| Owner-occupied commercial | 2,086 | 2,086 | 620 | 2,176 | 70 | |||||||||||
| 1-4 family mortgage | 12,318 | 12,318 | 1,210 | 11,943 | 397 | |||||||||||
| Other mortgage | 3,798 | 3,897 | 152 | 3,774 | 219 | |||||||||||
| Total real estate - mortgage | 18,202 | 18,301 | 1,982 | 17,893 | 686 | |||||||||||
| Consumer | 699 | 699 | 699 | 790 | 28 | |||||||||||
| Total impaired loans | $ | 31,966 | $ | 33,323 | $ | 6,270 | $ | 30,650 | $ | 1,107 | ||||||
| 88 | ||
NOTES TO CONSOLIDATED FINANCIAL STATEMENTS
NOTE 3. LOANS (Continued)
| December 31, 2010 | ||||||||||||
| Recorded Investment | Unpaid Principal Balance | Related Allowance | ||||||||||
| (In Thousands) | ||||||||||||
| With no allowance recorded: | ||||||||||||
| Commercial, financial and agricultural | $ | 2,345 | $ | 2,930 | $ | - | ||||||
| Real estate - construction | 10,532 | 12,705 | - | |||||||||
| Real estate - mortgage: | ||||||||||||
| Owner-occupied commercial | 1,614 | 1,801 | - | |||||||||
| 1-4 family mortgage | 511 | 511 | - | |||||||||
| Other mortgage | 1,817 | 1,817 | - | |||||||||
| Total real estate - mortgage | 3,942 | 4,129 | - | |||||||||
| Consumer | 289 | 289 | - | |||||||||
| Total with no allowance recorded | 17,108 | 20,053 | - | |||||||||
| �� | ||||||||||||
| With an allowance recorded: | ||||||||||||
| Commercial, financial and agricultural | 9,190 | 9,190 | 1,602 | |||||||||
| Real estate - construction | 18,178 | 18,428 | 1,855 | |||||||||
| Real estate - mortgage: | ||||||||||||
| Owner-occupied commercial | 3,373 | 3,373 | 55 | |||||||||
| 1-4 family mortgage | 2,995 | 2,995 | 360 | |||||||||
| Other mortgage | - | - | - | |||||||||
| Total real estate - mortgage | 6,368 | 6,368 | 415 | |||||||||
| Consumer | 704 | 704 | 554 | |||||||||
| Total with allowance recorded | 34,440 | 34,690 | 4,426 | |||||||||
| Total Impaired Loans: | ||||||||||||
| Commercial, financial and agricultural | 11,535 | 12,120 | 1,602 | |||||||||
| Real estate - construction | 28,710 | 31,133 | 1,855 | |||||||||
| Real estate - mortgage: | ||||||||||||
| Owner-occupied commercial | 4,988 | 5,174 | 55 | |||||||||
| 1-4 family mortgage | 3,506 | 3,506 | 360 | |||||||||
| Other mortgage | 1,817 | 1,817 | - | |||||||||
| Total real estate - mortgage | 10,311 | 10,497 | 415 | |||||||||
| Consumer | 993 | 993 | 554 | |||||||||
| Total impaired loans | $ | 51,549 | $ | 54,743 | $ | 4,426 | ||||||
The average amount of impaired loans was $52.1 million during 2010 and $21.8 million during 2009. Interest income recognized on impaired loans was $2.2 million and $584,000 for 2010 and 2009, respectively.
NOTES TO CONSOLIDATED FINANCIAL STATEMENTS
NOTE 3. LOANS (Continued)
2012. follows (in thousands): 2013. other operating expenses. INC. AND SF REALTY 1, INC. Company. option activity: $705,000. restricted stock’s vesting period. 2013. Note.All of these warrants were outstanding as of December 31, 2013. expenses above 2013. Commitments to extend credit, credit card arrangements, commercial letters of credit and standby letters of credit all include exposure to some credit loss in the event of nonperformance of the customer. The Company uses the same credit policies in making commitments and conditional obligations as it does for on-balance sheet financial instruments. Because these instruments have fixed maturity dates, and because many of them expire without being drawn upon, they do not generally present any significant liquidity risk to the Company. . Other real estate owned December 31, 2012: follows:: states and political subdivisions, and certain corporate, asset-backed and other securities. In cases where Level 1 or Level 2 inputs are not available, securities are classified in Level 3 of thefair value hierarchy. loans) is estimated using discounted cash flow analysis, based on interest rates currently being offered for loans with similar terms to borrowers of similar credit quality. Loan fair value estimates include judgments regarding future expected loss experience and risk characteristics. The method of estimating fair value does not incorporate the exit-price concept of fair value as prescribed by classified within Level 3 of the fair value hierarchy. party is evaluated for reasonableness given market changes. These measurements are classified within Level 2 of the fair value hierarchy. These measurements are classified as Level 2 in the fair value hierarchy. These measurements are classified as Level 2 in the fair value hierarchy. . 2013. Bank. Stockholders. Information regarding the Company’s executive officers is provided in Part I, Item 1 of the Form 10-K. 17, 2014During the third quarter of 2011, the Company adopted the provisions of the FASB ASU No. 2011-02,Receivables (Topic 310): A Creditor’s Determination of Whether a Restructuring Is a December 31, 2012 Unpaid Average Interest Income Recorded Principal Related Recorded Recognized in Investment Balance Allowance Investment Period (In Thousands) With no allowance recorded: Commercial, financial and agricultural $ 2,602 $ 2,856 $ - $ 2,313 $ 105 Real estate - construction 6,872 7,894 - 7,631 188 Owner-occupied commercial 5,111 5,361 - 5,411 145 1-4 family mortgage 2,166 2,388 - 2,177 108 Other mortgage 4,151 4,249 - 4,206 275 Total real estate - mortgage 11,428 11,998 - 11,794 528 Consumer 135 344 - 296 6 Total with no allowance recorded 21,037 23,092 - 22,034 827 With an allowance recorded: Commercial, financial and agricultural 1,308 1,308 577 1,325 90 Real estate - construction 7,550 8,137 1,013 6,961 154 Real estate - mortgage: Owner-occupied commercial 3,195 3,195 779 3,277 77 1-4 family mortgage 4,002 4,002 1,007 4,001 139 Other mortgage 302 302 135 307 20 Total real estate - mortgage 7,499 7,499 1,921 7,585 236 Total with allowance recorded 16,357 16,944 3,511 15,871 480 Total Impaired Loans: Commercial, financial and agricultural 3,910 4,164 577 3,638 195 Real estate - construction 14,422 16,031 1,013 14,592 342 Real estate - mortgage: Owner-occupied commercial 8,306 8,556 779 8,688 222 1-4 family mortgage 6,168 6,390 1,007 6,178 247 Other mortgage 4,453 4,551 135 4,513 295 Total real estate - mortgage 18,927 19,497 1,921 19,379 764 Consumer 135 344 - 296 6 Total impaired loans $ 37,394 $ 40,036 $ 3,511 $ 37,905 $ 1,307 Troubled Debt RestructuringRestructurings (“TDR”).Management applied the guidance on determining whether any restructurings that occurred from January 1, 2011 or later met the definition of a TDR. TDRs at December 31, 20112013 and 20102012 totaled $4.5$14.2 million and $3.1$12.3 million, respectively. The increase primarily consists of one relationship that was added in the fourth quarter totaling $8.0 million offset by pay-offs of $4.9 million and charge-offs of0.9 million during 2013. The Company’s TDRs have resulted primarily from allowing the borrower to pay interest-only for an extended period of time, or through interest rate reductions rather than from debt forgiveness.At December 31, 2011,2013, the Company had a related allowance for loan losses of $439,000$2,411,000 allocated to these TDRs, compared to $487,000$1,442,000 at December 31, 2010.2012. The Company had eleven TDR loans to one borrower in the amount of $4.8 million enter into payment default status during the fourth quarter of 2013. All other loans classified as TDRs as of December 31, 20112013 are performing as agreed under the terms of their restructured plans. For the years ended December 31, 2011 and 2010, there were no loans modified as a TDR for which there was a payment default during the year. The following table presents an analysis of TDRs as of December 31, 20112013 and December 31, 2010. December 31, 2011 December 31, 2010 Number of
Contracts Pre-
Modification
Outstanding
Recorded
Investment Post-
Modification
Outstanding
Recorded
Investment Number of
Contracts Pre-
Modification
Outstanding
Recorded
Investment Post-
Modification
Outstanding
Recorded
Investment Troubled Debt Restructurings Commercial, financial and agricultural 2 $ 1,369 $ 1,369 9 $ 2,398 $ 2,398 Real estate - construction - - - - - - Real estate - mortgage: Owner-occupied commercial 3 2,785 2,785 1 660 660 1-4 family mortgage - - - - - - Other mortgage 1 331 331 - - - Total real estate mortgage 4 3,116 3,116 1 660 660 Consumer - - - - - - 6 $ 4,485 $ 4,485 10 $ 3,058 $ 3,058 89 December 31, 2013 December 31, 2012 Pre- Post- Pre- Post- Modification Modification Modification Modification Outstanding Outstanding Outstanding Outstanding Number of Recorded Recorded Number of Recorded Recorded Contracts Investment Investment Contracts Investment Investment (In Thousands) Troubled Debt Restructurings Commercial, financial and agricultural 5 $ 2,029 $ 2,029 2 $ 1,168 $ 1,168 Real estate - construction 7 1,781 1,781 15 3,213 3,213 Real estate - mortgage: Owner-occupied commercial - - - 6 5,907 5,907 1-4 family mortgage 4 10,073 10,073 5 1,709 1,709 Other mortgage 1 285 285 1 302 302 Total real estate mortgage 5 10,358 10,358 12 7,918 7,918 Consumer - - - - - - 17 $ 14,168 $ 14,168 29 $ 12,299 $ 12,299 Number of Recorded Number of Recorded Contracts Investment Contracts Investment Troubled Debt Restructurings That Subsequently Defaulted Commercial, financial and agricultural 3 $ 1,067 - $ - Real estate - construction 6 1,564 - - Real estate - mortgage: Owner-occupied commercial - - 3 2,786 1-4 family mortgage 2 1,848 - - Other mortgage - - - - Total real estate - mortgage 2 1,848 3 2,786 Consumer - - - - 11 $ 4,479 3 $ 2,786 In the ordinary course of business, the Company has granted loans to certain related parties, including directors, executive officers, and their affiliates. The interest rates on these loans were substantially the same as rates prevailing at the time of the transaction and repayment terms are customary for the type of loan. Changes in related party loans for the yearyears ended December 31, 20112013 and 20102012 are as follows: Years Ended December 31, 2011 2010 (In Thousands) Balance, beginning of year $ 6,825 $ 8,469 Advances 7,926 9,471 Repayments (4,204 ) (11,115 ) Participation sold (1,500 ) - Balance, end of year $ 9,047 $ 6,825 89NOTES TO CONSOLIDATED FINANCIAL STATEMENTS Years Ended December 31, 2013 2012 (In Thousands) Balance, beginning of year $ 12,400 $ 9,047 Advances 4,975 7,630 Repayments (4,258) (8,096) Participations - 3,819 Balance, end of year $ 13,117 $ 12,400 NOTE 4. FORECLOSED PROPERTIESOther real estate and certain other assets acquired in foreclosure are carried at the lower of the recorded investment in the loan or fair value less estimated costs to sell the property.90 An analysis of foreclosed properties (in thousands) for the years ended December 31, 2013, 2012 and 2011 2010 and 2009 follows: 2011 2010 2009 Balance at beginning of year $ 6,966 $ 12,525 $ 10,473 Transfers from loans and capitalized expenses 9,029 5,447 11,103 Foreclosed properties sold (3,334 ) (7,995 ) (6,314 ) Writedowns and partial liquidations (386 ) (3,011 ) (2,737 ) Balance at end of year $ 12,275 $ 6,966 $ 12,525 2013 2012 2011 Balance at beginning of year $ 9,685 $ 12,275 $ 6,966 Transfers from loans and capitalized expenses 11,244 2,695 9,029 Foreclosed properties sold (7,664) (2,967) (3,334) Writedowns and partial liquidations (593) (2,318) (386) Balance at end of year $ 12,672 $ 9,685 $ 12,275 NOTE 5. PREMISES AND EQUIPMENTPremises and equipment are summarized as follows: December 31, 2011 2010 (In Thousands) Furniture and equipment $ 5,224 $ 4,441 Leasehold improvements 4,436 3,920 9,660 8,361 Accumulated depreciation (5,069 ) (3,911 ) $ 4,591 $ 4,450 December 31, 2013 2012 Land and building $ 1,724 $ 1,724 Furniture and equipment 9,579 8,642 Leasehold improvements 5,131 4,742 16,434 15,108 Accumulated depreciation (8,083) (6,261) $ 8,351 $ 8,847 The provisions for depreciation charged to occupancy and equipment expense for the years ended December 31, 2013, 2012 and 2011 2010were$1,841,000, $1,218,000 and 2009 were $1,173,000, $1,066,000 and $1,087,000,$1,173,000, respectively.The Company leases land and building space under non-cancellable operating leases. Future minimum lease payments under non-cancellable operating leases at December 31, 2013 are summarized as follows: (In Thousands) 2012 $ 2,068 2013 1,955 2014 1,945 2015 1,974 2016 1,934 Thereafter 7,201 $ 17,077 (In Thousands) 2014 $ 2,453 2015 2,462 2016 2,429 2017 2,164 2018 1,934 Thereafter 4,622 $ 16,064 For the years ended December 31, 2011, 20102013, 2012 and 2009,2011, annual rental expense on operating leases was $2,060,000, $1,734,000$2,488,000, $2,195,000 and $1,447,000,$2,060,000, respectively.90NOTES TO CONSOLIDATED FINANCIAL STATEMENTSNOTE 6. VARIABLE INTEREST ENTITIES (VIEs)The Company utilizes special purpose entities (SPEs) that constitute investments in limited partnerships that undertake certain development projects to achieve federal and state tax credits. These SPEs are typically structured as VIEs and are thus subject to consolidation by the reporting enterprise that absorbs the majority of the economic risks and rewards of the VIE. To determine whether it must consolidate a VIE, the Company analyzes the design of the VIE to identify the sources of variability within the VIE, including an assessment of the nature of risks created by the assets and other contractual obligations of the VIE, and determines whether it will absorb a majority of that variability.The Company has invested in a limited partnership for which it determined it is not the primary beneficiary, and which thus areis not subject to consolidation by the company.Company. The Company reports its investment in this partnership at its net realizable value, estimated to be the discounted value of the remaining amount of tax credits to be received. The amount recorded as investment in this partnership at December 31, 20112013 and 2012 was $504,000,$313,000, and is included in other assets.On December 31, 2009, the91 The Company entered into ahas invested in limited partnershippartnerships as funding investor. The partnership is apartnerships are single purpose entityentities that is lendinglend money to a real estate investorinvestors for the purpose of acquiring and operating a multi-tenant office building.commercial property. The investment qualifiesinvestments qualify for New Market Tax Credits under Internal Revenue Code Section 45D, as amended. The Company has determined that it is the primary beneficiary of the economic risks and rewards of the VIE,VIEs, and thus has consolidated the partnership’sthese partnership assets and liabilities into its consolidated financial statements. The amount of recorded as an investment in this partnership atthese partnerships as of December 31, 20112013 and 2012 was $3,403,000,$26,005,000 and $3,192,000, respectively, of which $2,270,000$17,386,000 and $2,270,000 in 2013 and 2012,respectively, is included in loans of the Company. The remaining amount isamounts are included in other assets.NOTE 7.DEPOSITSDeposits at December 31, 20112013 and 20102012 were as follows: December 31, 2011 2010 (In Thousands) Noninterest-bearing demand $ 418,810 $ 250,490 Interest-bearing checking 1,325,451 1,224,244 Savings 15,638 5,493 Time 71,368 55,583 Time, $100,000 and over 312,620 222,906 $ 2,143,887 $ 1,758,716 December 31, 2013 2012 (In Thousands) Noninterest-bearing demand $ 650,456 $ 545,174 Interest-bearing checking 1,930,676 1,551,158 Savings 23,890 19,560 Time 70,316 69,179 Time, $100,000 and over 344,304 326,501 $ 3,019,642 $ 2,511,572 The scheduled maturities of time deposits at December 31, 20112013 were as follows: (In Thousands) 2012 $ 230,138 2013 66,036 2014 55,029 2015 6,515 2016 26,270 $ 383,988 (In Thousands) 2014 $ 260,487 2015 52,887 2016 53,911 2017 16,828 2018 30,507 $ 414,620 At December 31, 20112013 and 2010,2012, overdraft deposits reclassified to loans were $876,000$1,602,000 and $1,111,000, $3,860,000, respectively.NOTES TO CONSOLIDATED FINANCIAL STATEMENTSNOTE 8. FEDERAL FUNDS PURCHASEDAt December 31, 2011, The2013, the Company had $79.3$174.4 million in federal funds purchased from its respondent banks that are clients of its correspondent banking unit.unit, compared to $117.1 million at December 31, 2012. The Company was paying an interest rate of 0.25%0.25% on these balances at December 31, 2011.At December 31, 2011,2013, the Company had available lines of credit totaling approximately $140$130 million with various financial institutions for borrowing on a short-term basis, with no amount outstanding. Available lines with these same banks totaled approximately $130 million at December 31, 2012. These lines are subject to annual renewals with varying interest rates.NOTE 9. OTHER BORROWINGSThe Company prepaid both of its advances from Federal Home Loan Bank (“FHLB”) during 2011, one in March and the other in June. Prepayment penalties of $738,000 were paid to the FHLB as part of these prepayments, and is included in other operating expenses.At December 31, 2011 and 2010, the composition of otherOther borrowings is as follows: 2011 2010 Amount Weighted Average Rate Amount Weighted Average Rate FHLB Advances: Fixed rate, due 2012 and 2013 $ - 0.00 % $ 20,000 3.13 % Subordinated notes payable 4,954 8.25 4,937 8.25 Total other borrowings $ 4,954 8.25 % $ 24,937 4.14 % NOTE 10. JUNIOR SUBORDINATED MANDATORY CONVERTIBLE DEFERRABLE INTEREST DEBENTURES DUE MARCH 15, 2040On February 9, 2010 the Company established a Delaware statutory trust subsidiary, ServisFirst Capital Trust II (the “2010 Trust”), which issued 15,000 shares of its 6.0% Mandatory Convertible Trust Preferred Securities (the “Preferred Securities”) for $15,000,000, or $1,000 per Preferred Security, on March 15, 2010. The 2010 Trust simultaneously issued 50,000 shares of its common securities to the Company for a purchase price of $50,000, or $1.00 per share, which together with the Preferred Securities constitute all$19.9 million are comprised of the issued and outstanding securities of the 2010 Trust (collectively, the “Trust Securities”). The 2010 Trust invested all of the proceeds from the sale of the Trust Securities in the Company’s 6.0% Junior5.5% Subordinated Mandatory Convertible Deferrable Interest DebenturesNotes due March 15, 2040 in the principal amount of $15,050,000 (the “Subordinated Debentures”). The Preferred SecuritiesNovember 9, 2022, which were offered and sold to accredited investorsissued in a private placement.Holders of the Preferred Securities are entitled to receive distributions accruing from March 15, 2010, and payable quarterlyplacement in arrears on March 15,November 2012. The notes pay interest semi-annually.On June 15, September 15 and December 15 of each year, commencing June 15, 2010 unless1, 2012, the Company defers interest payments on the Subordinated Debentures. Distributions accrue at an annual rate equal to 6.0% of the liquidation amount of $1,000 per Preferred Security. The rate and the distribution dates for the Preferred Securities correspond to the interest rate and payment dates on the Subordinated Debentures, which constitute substantially all the assets of the 2010 Trust. As a result, if principal or interest is not paid on the Subordinated Debentures, no corresponding amounts will be paid on the Preferred Securities. The 2010 Trust also pays a distribution on the common securities at an annual rate of 6.0% of the purchase price of the common securities.NOTES TO CONSOLIDATED FINANCIAL STATEMENTSNOTE 10. JUNIOR SUBORDINATED MANDATORY CONVERTIBLE DEFERRABLE INTEREST DEBENTURES DUE MARCH 15, 2040 (Continued)The Subordinated Debentures are subordinate and junior in right of payment to all of the Company’s senior debt, as defined in the Indenture governing the Subordinated Debentures; provided, however, that, while any of the Preferred Securities remain outstanding, the Company shall not incur any additional senior debt in excess of 0.5% of the Company’s average assets for the fiscal year immediately preceding, unless approved by the holders of a majority of the outstanding Preferred Securities. The Company has the right to defer payments of interest on the Subordinated Debentures from time to time, for up to 20 consecutive quarterly periods for each deferral period. During any deferral period, the Company may not (i) pay dividends on or redeem any ofoff its capital stock, (ii) pay principal of or interest on any debt securities rankingpari passuwith or subordinate to the Subordinated Debentures or (iii) make any guaranty payments with respect to any guaranty of the debt securities of any of the Company’s subsidiaries if such guaranty rankspari passuwith or junior in right of payment to the Subordinated Debentures.If not previously redeemed or converted into common stock of the Company, the Preferred Securities will automatically and mandatorily convert into common stock of the Company on March 15, 2013 at a conversion price of $25 per share of common stock. In addition to such mandatory conversion, the Preferred Securities may be converted into common stock of the Company at the option of the holder at any time prior to the earliest to occur of maturity, redemption or mandatory conversion at the same conversion price.The Preferred Securities are subject to mandatory redemption upon repayment of the Subordinated Debentures at their stated maturity (as defined in the Indenture), or upon earlier redemption of the Subordinated Debentures. The Subordinated Debentures are redeemable by the Company at any time in whole, but not in part, upon the occurrence of a special event, as defined in the Indenture.The Company has the right at any time to terminate the 2010 Trust and cause the Subordinated Debentures to be distributed to the holders of the Preferred Securities in liquidation of the 2010 Trust. This right is optional and wholly within the Company’s discretion.The Company is required by the Federal Reserve Board to maintain certain levels of capital for bank regulatory purposes. The Federal Reserve Board has determined that certain cumulative preferred securities having the characteristics of trust preferred securities qualify as minority interests, which is included in Tier 1 capital for bank and financial holding companies. In calculating the amount of Tier 1 qualifying capital, the trust preferred securities can only be included up to the amount constituting 25% of total Tier 1 capital elements (including trust preferred securities). Such Tier 1 capital treatment provides the Company with a more cost-effective means of obtaining capital for bank regulatory purposes than if the Company were to issue preferred stock.NOTE 11. SUBORDINATED NOTE DUE JUNE 1, 2016On June 23, 2009, the Company issued its 8.25%8.25% Subordinated Note due June 1, 2016 in the aggregate principal amount of $5,000,000$5 million. This note was payable to anone accredited investor at 100%and was issued on June 23, 2009.On November 8, 2012, the Company redeemed all of par. The note is subordinate and junior in right of payment upon any liquidationits outstanding8.5% Junior Subordinated Deferrable Interest Debentures due 2038, which were held by ServisFirst Capital Trust I. As a result, all of the Company as tooutstanding8.5% Trust Preferred Securities and8.5% Common Securities of the Trust were redeemed. The redemption price for the Trust Preferred Securities was $1,000 per security, for a total principal interest and premium to obligationsamount of $15 million, plus accrued distributions up to the Company’s depositorsredemption date. The Junior Subordinated Debentures were originally issued on September 2, 2008, and other obligationsin accordance with their terms, were subject to its general and secured creditors. Interest payments are due and payableoption redemption by the Company on eachor after September 1, December 1, March 12011. Pursuant to the terms of its Amended and June 1, commencing on September 1, 2009. Interest accrues at an annual rate of 8.25%. TheRestated Trust Agreement, ServisFirst Capital Trust I is required to use the proceeds it receives from the note payable areredemption of the Junior Subordinated Debentures to redeem its Trust Preferred Securities and 8.5% Common Securities on the same day.92 The Company prepaid both of its advances from Federal Home Loan Bank (“FHLB”) during 2011, one in March and the other in June. Prepayment penaltiesin the amount of $738,000 were paid to the FHLB,which were included in Tier 2 capital of the Bank and the Company.NOTES TO CONSOLIDATED FINANCIAL STATEMENTSNOTE 11. SUBORDINATED NOTE DUE JUNE10. SF HOLDING 1, 2016 (Continued)In addition,January 2012, the Company issued to the investor a total of 15,000 warrants, each representing the right to purchase one share of the Company’s common stock for a purchase price of $25.00. Each warrant is exercisable for a period beginning uponformed SF Holding 1, Inc., an Alabama corporation, and its date of issuance and ending on Junesubsidiary, SF Realty 1, 2016. The Company estimated the fair value of each warrantInc., an Alabama corporation. SF Realty 1 elected to be $5.41 using a Black-Scholes-Merton valuation model. This total value of $86,000 was recordedtreated as a discountreal estate investment trust (“REIT”) for U.S. income tax purposes. SF Realty 1 holds and reducedmanages participations in residential mortgages and commercial real estate loans originated by ServisFirst Bank. SF Holding 1, Inc. and SF Realty 1, Inc. are both consolidated into the net book value of the note to $4,914,000 with an offsetting increase to the Company’s additional paid-in capital. The discount will be amortized over a five-year period.NOTE 12. PARTICIPATION IN THE SMALL BUSINESS LENDING FUND OF THE U.S. TREASURY DEPARTMENTNOTE 11.PARTICIPATION IN THE SMALL BUSINESS LENDING FUND OF THE U.S. TREASURY DEPARTMENTOn June 21, 2011, the Company entered into a Securities Purchase Agreement with the Secretary of the Treasury, pursuant to which the Company issued and sold to the Treasury40,000 shares of its Senior Non-Cumulative Perpetual Preferred Stock, Series A, having a liquidation preference of $1,000$1,000 per share (the “Series A Preferred Stock”), for aggregate proceeds of $40,000,000.$40,000,000. The issuance was pursuant to the Treasury’s Small Business Lending Fund program, a $30$30 billion fund established under the Small Business Jobs Act of 2010, which encourages lending to small businesses by providing capital to qualified community banks with assets of less than $10$10 billion. The Series A Preferred Stock is entitled to receive non-cumulative dividends payable quarterly on each January 1, April 1, July 1 and October 1, commencing October 1, 2011. The dividend rate, which is calculated on the aggregate Liquidation Amount, has been initially set at 1%1% per annum based upon the current level of “Qualified Small Business Lending” (“QSBL”) by the Bank. The dividend rate for future dividend periods will be set based upon the percentage change in qualified lending between each dividend period and the baseline QSBL level established at the time the Agreement was entered into. Such dividend rate may vary from 1%1% per annum to 5%5% per annum for the second through tenth dividend periods, and from 1%1% per annum to 7%7% per annum for the eleventh through the first half of the nineteenth dividend periods. If the Series A Preferred Stock remains outstanding for more than four-and-one-half years, the dividend rate will be fixed at 9%9%. Prior to that time, in general, the dividend rate decreases as the level of the Bank’s QSBL increases. Such dividends are not cumulative, but the Company may only declare and pay dividends on its common stock (or any other equity securities junior to the Series A Preferred Stock) if it has declared and paid dividends for the current dividend period on the Series A Preferred Stock, and will be subject to other restrictions on its ability to repurchase or redeem other securities. In addition, if (i) the Company has not timely declared and paid dividends on the Series A Preferred Stock for six dividend periods or more, whether or not consecutive, and (ii) shares of Series A Preferred Stock with an aggregate liquidation preference of at least $25,000,000$25,000,000 are still outstanding, the Treasury (or any successor holder of Series A Preferred Stock) may designate two additional directors to be elected to the Company’s Board of Directors.As is more completely described in the Certificate of Designation, holders of the Series A Preferred Stock have the right to vote as a separate class on certain matters relating to the rights of holders of Series A Preferred Stock and on certain corporate transactions. Except with respect to such matters and, if applicable, the election of the additional directors described above, the Series A Preferred Stock does not have voting rights.NOTES TO CONSOLIDATED FINANCIAL STATEMENTSNOTE 12. PARTICIPATION IN THE SMALL BUSINESS LENDING FUND OF THE U.S. TREASURY DEPARTMENT (Continued)The Company may redeem the shares of Series A Preferred Stock, in whole or in part, at any time at a redemption price equal to the sum of the Liquidation Amount per share and the per-share amount of any unpaid dividends for the then-current period, subject to any required prior approval by the Company’s primary federal banking regulator.NOTE 13.12. DERIVATIVESPriorThe Company has entered into agreements with secondary market investors to 2008,deliver loans on a “best efforts delivery” basis. When a rate is committed to a borrower, it is based on the best price that day and locked with the investor for the customer for a 30-day period. In the event the loan is not delivered to the investor, the Company entered into an interest rate floorhas no risk or exposure with a notional amount of $50 million in order to fix the minimum interest rate on a corresponding amount of its floating-rate loans.investor. The interest rate floor was sold in January 2008 and the related gain of $817,000 was deferred and amortized to income over the remaining term of the original agreement which would have terminated on June 22, 2009. Gains of $272,000 and $544,000 were recognized for the years ended December 31, 2009 and 2008, respectively.During 2010, the Company entered into an interest rate cap with a notional value of $100 million. The cap has a strike rate of 2.00% and is indexed to the three month London Interbank Offered Rate (“LIBOR”). The cap does not qualify for hedge accounting treatment, and is marked to market, with changes in market value reflected in the income statement.The Company uses derivatives to hedge interest rate exposures associated with mortgage loans held for sale and mortgage loans in process. The Company regularly enters into derivative financial instruments in the form of forward contracts, as part of its normal asset/liability management strategies. The Company’s obligations under forward contracts consist of “best effort” commitments to deliver mortgage loans originated in the secondary market at a future date. Interest rate lock commitments related to loans that are originated for later sale are classified as derivatives. In the normal course of business, the Company regularly extends these rate lock commitments to customers during the loan origination process. The fair values of the Company’s forward contractagreements with investors and rate lock commitments to customers as of December 31, 20112013 and 2010December 31, 2012 were not material and have not been recorded.93 NOTE 14.13. EMPLOYEE AND DIRECTOR BENEFITSAt December 31, 2011,2013, the Company has two share-basedstock-based compensation plans, which are described below. The compensation cost that has been charged against income for the plans was approximately $975,000, $713,000$1,205,000, $1,049,000 and $785,000$975,000 for the years ended December 31, 2013, 2012 and 2011, 2010 and 2009, respectively.Stock Incentive PlansThe Company’s 2005 Stock Incentive Plan (the “2005 Plan”), originally permitted the grant of stock options to its officers, employees, directors and organizers of the Company for up to525,000 shares of common stock. However, upon shareholderstockholder approval during 2006, the 2005 Plan was amended in order to allow the Company to grant stock options for up to1,025,000 shares of common stock. Both incentive stock options and non-qualified stock options may be granted under the 2005 Plan. Option awards are generally granted with an exercise price equal to the estimated fair market value of the Company’s stock at the date of grant; those option awards vest in varying amounts from 2007 through 20152018 and are based on continuous service during that vesting period and have a ten-year contractual term. Dividends are not paid on unexercised options and dividends are not subject to vesting. The 2005 Plan provides for accelerated vesting if there is a change in control (as defined in the 2005 Plan).NOTES TO CONSOLIDATED FINANCIAL STATEMENTSNOTE 14. EMPLOYEE AND DIRECTOR BENEFITS (Continued)On March 23, 2009, the Company’s board of directors adopted the 2009 Stock Incentive Plan (the “2009 Plan”), which was effective upon approval by the stockholders at the 2009 Annual Meeting of Stockholders. The 2009 Plan authorizes the grant of Stock Appreciation Rights, Restricted Stock, Options, Non-stock Share Equivalents, Performance Sharesstock appreciation rights, restricted stock, stock options, non-stock share equivalents, performance shares or Performance Unitsperformance units and other equity-based awards.Both incentive stock options and non-qualified stock options may be granted under the 2009 Plan. Option awards are generally granted with an exercise price equal to the estimated fair market value of the Company’s stock at the date of grant. Up to425,000 shares of common stock of the Company are available for awards under the 2009 Plan.As of December 31, 2011,2013, there are a total of 401,200166,000 shares available to be granted under both of these plans.On September 21, 2006, we granted non-plan stock options to persons representing certain key business relationships to purchase up to an aggregate of30,000 shares of our common stock for a purchase price of $15.00$15.00 per share. On November 2, 2007, we granted non-plan stock options to persons representing certain key business relationships to purchase up to an aggregate of25,000 shares of our common stock for a purchase price of $20.00$20.00 per share. These stock options are non-qualified and are not part of either of our stock incentive plans. They vest 100%vested100% in a lump sum five years after their date of grant and expire10 years after their date of grant.The fair value of each stock option award is estimated on the date of grant using a Black-Scholes-Merton valuation model that uses the assumptions noted in the following table. Expected volatilities are based on an index of approximately 8479 publicly traded banks in the southeast United States. The expected term of options granted is based on the short-cut method and represents the period of time that options granted are expected to be outstanding. The risk-free rate for periods within the contractual life of the option is based on the U.S. Treasury yield curve in effect at the time of grant. 2011 2010 2009 Expected volatility 26.50 % 26.00 % 20.00 % Expected dividends 0.37 % 0.00 % 0.50 % Expected term (in years) 6.5 7 7 Risk-free rate 2.21 % 2.10 % 1.70 % 2013 2012 2011 Expected volatility 18.65 % 19.80 % 26.50 % Expected dividends - % - % 0.37 % Expected term (in years) 7 6 7 Risk-free rate 1.72 % 1.05 % 2.21 % The weighted-averageweighted average grant-date fair value of options granted during the years ended December 31, 2013, December 31, 2012 and December 31, 2011 2010was $9.11, $6.59 and 2009 was $7.82, $7.91 and $5.87,$7.82, respectively.NOTES TO CONSOLIDATED FINANCIAL STATEMENTSNOTE 14. EMPLOYEE AND DIRECTOR BENEFITS (Continued)94 The following tables summarize the status of stock options granted. Shares Weighted
Average
Exercise
Price Weighted
Average
Remaining
Contractual
Term (years) Aggregate
Intrinsic
Value (In Thousands) Year Ended December 31, 2011: Outstanding at beginning of year 881,000 $ 15.65 6.9 $ 8,238 Granted 233,500 27.16 9.3 - Exercised (40,700 ) 10.53 3.8 792 Forfeited - 15.00 - - Outstanding at end of year 1,073,800 $ 18.33 6.0 $ 12,508 Exercisable at December 31, 2011 442,940 $ 13.19 4.4 $ 7,447 Year Ended December 31, 2010: Outstanding at beginning of year 863,500 $ 15.17 6.8 $ 8,483 Granted 37,500 25.00 9.4 - Exercised (10,000 ) 10.00 - 150 Forfeited (10,000 ) 15.00 - - Outstanding at end of year 881,000 $ 15.65 6.9 $ 8,238 Exercisable at December 31, 2010 272,627 $ 11.96 5.1 $ 3,555 Year Ended December 31, 2009: Outstanding at beginning of year 826,000 $ 14.70 7.7 $ 8,513 Granted 40,000 25.00 9.4 - Exercised - - - - Forfeited (2,500 ) 15.00 - - Outstanding at end of year 863,500 $ 15.17 6.8 $ 8,483 Exercisable at December 31, 2009 143,530 $ 11.99 6.1 $ 1,867 NOTES TO CONSOLIDATED FINANCIAL STATEMENTSNOTE 14. EMPLOYEE AND DIRECTOR BENEFITS (Continued) Shares Weighted
Average
Exercise
Price Weighted
Average
Remaining
Contractual
Term (years) Aggregate
Intrinsic Value (In Thousands) Year Ended December 31, 2013: Outstanding at beginning of year 816,500 $ 20.87 5.8 $ 9,905 Granted 60,000 37.96 9.7 213 Exercised (94,200) 13.44 2.8 2,532 Forfeited (6,000) 22.50 5.6 - Outstanding at end of year 776,300 $ 23.08 5.5 $ 14,300 Exercisable at December 31, 2013: 387,244 $ 16.20 3.2 $ 9,797 Year Ended December 31, 2012: Outstanding at beginning of year 1,073,800 $ 18.33 6.0 $ 12,508 Granted 45,500 30.00 9.3 130 Exercised (288,130) 12.71 2.4 5,846 Forfeited (14,670) 24.54 - - Outstanding at end of year 816,500 $ 20.87 5.8 $ 9,905 Exercisable at December 31, 2012 412,825 $ 14.03 3.6 $ 7,831 Year Ended December 31, 2011: Outstanding at beginning of year 881,000 $ 15.65 6.9 $ 8,238 Granted 233,500 27.16 9.3 - Exercised (40,700) 10.53 3.8 792 Forfeited - 15.00 - - Outstanding at end of year 1,073,800 $ 18.33 6.0 $ 12,508 Exercisable at December 31, 2011 442,940 $ 13.19 4.4 $ 7,447 Exercisable options at December 31, 20112013 were as follows:Range of Exercise Price Shares Weighted
Average
Exercise
Price Weighted
Average
Remaining
Contractual
Term
(years) Aggregate
Intrinsic Value (In Thousands) $ 10.00 146,500 $ 10.00 3.4 $ 2,930 11.00 118,300 11.00 4.3 2,247 15.00 125,394 15.00 4.9 1,881 20.00 24,996 20.00 5.7 250 25.00 27,750 25.00 6.7 139 442,940 $ 13.19 4.4 $ 7,447 Range of
Exercise Price Shares Weighted
Average
Exercise Price Weighted
Average
Remaining
Contractual
Term (years) Aggregate
Intrinsic Value (In Thousands) $ 10.00 33,000 $ 10.00 1.4 $ 1,040 11.00 108,000 11.00 2.3 3,294 15.00 113,500 15.00 3.0 3,008 20.00 52,994 20.00 4.1 1,139 25.00 79,750 25.00 4.7 1,316 387,244 $ 16.20 3.2 $ 9,797 As of December 31, 2011,2013, there was $2,269,000$1,636,000 of total unrecognized compensation cost related to non-vested share-based compensation arrangements granted under the Plans.stock options. The cost is expected to be recognized on the straight-line method over a weighted-average period of 2.3the next2.2 years. The total fair value of shares vested during the year ended December 31, 20112013 was $588,000.Restricted StockThe Company granted 20,000has awarded78,500 shares of restricted stock awards to a key executive in October 2009, and granted 2,000 restricted stock awards to eachcertain officers, of five employees in February 2010, for a total of 30,000 shares.which16,000 shares are vested. The value of these awardsrestricted stock is determined to be the current value of the Company’s stock whenat the awards are made,grant date, and this total value iswill be recognized as compensation expense over the vesting period, which is five years from the date of grant. 8,000 shares of restricted stock awarded to the key executive have vested as of December 31, 2011.period. As of December 31, 2011,2013, there was $437,000$1,453,000 of total unrecognized compensation cost related to non-vested restricted stock. The cost is expected to be recognized evenly over a weighted-average period of 2.9 years.Stock WarrantsIn recognitionthe remaining2.1 years of the efforts and financial risks undertaken by the Bank’s organizers, it granted organizers an opportunity to purchase a total 60,000 shares of common stock at a price of $10, which was the fair market value of the Bank’s common stock at the time. The warrants fully vested on May 2, 2008, the third anniversary of the Bank’s incorporation, and will terminate on the tenth anniversary of the incorporation date. The total number of warrants outstanding at December 31, 2011 and 2010 was 40,000 and 60,000.95 Stock WarrantsThe Company issuedgranted warrants for 75,000 shares of common stock at awith an exercise price of $25 per share in the third quarter of 2008. These warrants were issued in connection with the trust preferred securities that are discussedsecurities. 4,500 of these warrants were exercised in detail2012, and the remaining 70,500 warrants were exercised in Note 10.The Company issuedgranted warrants for15,000 shares of common stock at awith an exercise price of $25$25 per share in the second quarter of 2009. These warrants were issued in connection with the saleissuance of the Company’s 8.25% Subordinated Note that is discussed in detail in Note 11.As of December 31, 2011,2013, all warrants were fully vested.NOTES TO CONSOLIDATED FINANCIAL STATEMENTSNOTE 14. EMPLOYEE AND DIRECTOR BENEFITS (Continued)The following tables summarize the status of stock warrants granted under the Company’s stock-based compensation plans. Shares Weighted
Average
Exercise Price Weighted
Average
Remaining
Contractual
Term (years) Aggregate
Intrinsic
Value (In Thousands) Year Ended December 31, 2011: Outstanding at beginning of year 60,000 $ 10.00 4.3 $ 900 Granted - - - - Exercised (20,000 ) 10.00 3.4 400 Forfeited - - - - Outstanding at end of year 40,000 10.00 3.4 $ 800 Exercisable at December 31, 2011 40,000 $ 10.00 3.4 $ 800 Year Ended December 31, 2010: Outstanding at beginning of year 60,000 $ 10.00 5.3 $ 900 Granted - - - - Exercised - - - - Forfeited - - - - Outstanding at end of year 60,000 10.00 4.3 $ 900 Exercisable at December 31, 2010 60,000 $ 10.00 4.3 $ 900 Year Ended December 31, 2009: Outstanding at beginning of year 60,000 $ 10.00 6.3 $ 900 Granted - - - - Exercised - - - - Forfeited - - - - Outstanding at end of year 60,000 10.00 5.3 $ 900 Exercisable at December 31, 2009 60,000 $ 10.00 5.3 $ 900 Retirement PlansThe Company has a retirement savings 401(k) and profit-sharing plan in which all employees age 21 and older may participate after completion of one year of service. For employees in service with the Bank at June 15, 2005, the length of service and age requirements were waived. The Company matches employees’ contributions based on a percentage of salary contributed by participants and may make additional discretionary profit sharing contributions. The Company’s expense for the plan was $946,000, $377,000$878,000, $1,167,000 and $341,000$946,000 for 2011, 20102013, 2012 and 2009,2011, respectively. The Company’s board of directors approved an additional 3% matchdiscretionary matches for 2013, 2012 and 2011 based on the profits of the Company during 2011.those years. The expense for this additional match was $432,000,matches were1%,4% and is3%, respectively, and amounted to $200,000, $576,000 and $432,000, respectively, and are included in the 2011 expense above.NOTE 15.14. COMMON STOCKDuring 2011,2013, the Company completed private placements of 340,000250,000 shares of common stock. The shares were issued and sold at $30$41.50 per share to 105110 accredited investors of which approximately 33,900 shares were purchased by directors, officers and their families, and 2014 non-accredited investors. This sale of stock resulted in net proceeds of $10,159,000.$10,337,000. This includes stock offering expenses of $33,000.NOTES TO CONSOLIDATED FINANCIAL STATEMENTSNOTE 16.15. REGULATORY MATTERSThe Bank is subject to dividend restrictions set forth in the Alabama Banking Code and by the Alabama State Banking Department. Under such restrictions, the Bank may not, without the prior approval of the Alabama State Banking Department, declare dividends in excess of the sum of the current year’s earnings plus the retained earnings from the prior two years. Based on this,these restrictions, the Bank would be limited to paying $61.0$110.9 million in dividends as of December 31, 2011.The Bank is subject to various regulatory capital requirements administered by the state and federal banking agencies. Failure to meet minimum capital requirements can initiate certain mandatory and possible additional discretionary actions by regulators that if undertaken, could have a direct material effect on the Bank and the financial statements. Under regulatory capital adequacy guidelines and the regulatory framework for prompt corrective action, the Bank must meet specific capital guidelines involving quantitative measures of the Bank’s assets, liabilities, and certain off-balance-sheet items as calculated under regulatory accounting practices. The Bank’s capital amounts and classification under the prompt corrective guidelines are also subject to qualitative judgments by the regulators about components, risk weightings, and other factors.Quantitative measures established by regulation to ensure capital adequacy require the Bank to maintain minimum amounts and ratios (set forth in the table below) of total risk-based capital and Tier 1 capital to risk-weighted assets (as defined in the regulations), and Tier 1 capital to adjusted total assets (as defined). Management believes, as of December 31, 2011,2013, that the Bank meets all capital adequacy requirements to which it is subject.As of December 31, 2011,2013, the most recent notification from the Federal Deposit Insurance Corporation categorized ServisFirst Bank as well capitalized under the regulatory framework for prompt corrective.corrective action. To remain categorized as well capitalized;capitalized, the Bank will have to maintain minimum total risk-based, Tier 1 risk-based, and Tier 1 leverage ratios as disclosed in the table below. Management believes that it is well capitalized under the prompt corrective action provisions as of December 31, 2011.2013.10096 NOTES TO CONSOLIDATED FINANCIAL STATEMENTSNOTE 16. REGULATORY MATTERS (Continued)The Company’s and Bank’s actual capital amounts and ratios are presented in the following table: Actual For Capital Adequacy
Purposes To Be Well Capitalized
Under Prompt
Corrective Action
Provisions Amount Ratio Amount Ratio Amount Ratio As of December 31, 2011: Total Capital to Risk Weighted Assets: Consolidated $ 246,334 12.79 % $ 154,094 8.00 % N/A N/A ServisFirst Bank 243,279 12.63 % 154,070 8.00 % $ 192,588 10.00 % Tier I Capital to Risk Weighted Assets: Consolidated 219,350 11.39 % 77,047 4.00 % N/A N/A ServisFirst Bank 216,295 11.23 % 77,035 4.00 % 115,553 6.00 % Tier I Capital to Average Assets: Consolidated 219,350 9.17 % 95,642 4.00 % N/A N/A ServisFirst Bank 216,295 9.06 % 95,481 4.00 % 119,352 5.00 % As of December 31, 2010: Total Capital to Risk Weighted Assets: Consolidated $ 166,850 11.82 % $ 112,927 8.00 % N/A N/A ServisFirst Bank 166,721 11.81 % 112,978 8.00 % $ 141,222 10.00 % Tier I Capital to Risk Weighted Assets: Consolidated 144,263 10.22 % 56,464 4.00 % N/A N/A ServisFirst Bank 144,117 10.20 % 56,489 4.00 % 84,733 6.00 % Tier I Capital to Average Assets: Consolidated 144,263 7.77 % 74,266 4.00 % N/A N/A ServisFirst Bank 144,117 7.77 % 74,236 4.00 % 92,795 5.00 % 101NOTES TO CONSOLIDATED FINANCIAL STATEMENTS Actual For Capital Adequacy
Purposes To Be Well Capitalized Under
Prompt Corrective Action
Provisions Amount Ratio Amount Ratio Amount Ratio As of December 31, 2013: Total Capital to Risk
Weighted Assets: Consolidated $ 343,904 11.73 % $ 234,617 8.00 % N/A N/A ServisFirst Bank 341,256 11.64 % 234,601 8.00 % $ 293,252 10.00 % Tier I Capital to Risk
Weighted Assets: Consolidated 293,301 10.00 % 117,308 4.00 % N/A N/A ServisFirst Bank 310,593 10.59 % 117,301 4.00 % 175,951 6.00 % Tier I Capital to Average
Assets: Consolidated 293,301 8.48 % 138,373 4.00 % N/A N/A ServisFirst Bank 310,593 8.98 % 138,331 4.00 % 172,913 5.00 % As of December 31, 2012: Total Capital to Risk
Weighted Assets: Consolidated $ 287,136 11.78 % $ 194,943 8.00 % N/A N/A ServisFirst Bank 284,141 11.66 % 194,942 8.00 % $ 243,678 10.00 % Tier I Capital to Risk
Weighted Assets: Consolidated 240,961 9.89 % 97,472 4.00 % N/A N/A ServisFirst Bank 257,883 10.58 % 97,471 4.00 % 146,207 6.00 % Tier I Capital to Average
Assets: Consolidated 240,961 8.43 % 114,323 4.00 % N/A N/A ServisFirst Bank 257,883 9.03 % 114,227 4.00 % 142,784 5.00 % NOTE 17.16. OTHER OPERATING INCOME AND EXPENSESThe major components of other operating income and expense included in noninterest income and noninterest expense are as follows: Years Ended December 31, 2011 2010 2009 (In Thousands) Other Operating Income Gain (loss) on sale of other real estate owned 76 (203 ) (441 ) Credit card income 481 30 22 Increase in cash surrender value of life insurance contracts 390 - - Other 650 744 786 $ 1,597 $ 571 $ 367 Other Operating Expenses Postage $ 194 $ 173 $ 142 Telephone 409 358 318 Data processing 2,023 1,983 1,844 Recording fees and other loan expenses 2,406 1,027 537 Supplies 356 263 319 Customer and public relations 689 477 462 Marketing 406 313 276 Sales and use tax 208 141 211 Donations and contributions 437 261 214 Directors fees 235 216 180 Prepayment penalties FHLB advances 738 - - Other 2,313 2,071 1,689 $ 10,414 $ 7,283 $ 6,192 Years Ended December 31, 2013 2012 2011 (In Thousands) Other Operating Income (Loss) gain on sale of other real estate owned $ (159) $ (105) $ 76 Credit card income 1,425 1,064 481 Other 878 744 650 $ 2,144 $ 1,703 $ 1,207 Other Operating Expenses Postage $ 195 $ 159 $ 194 Telephone 465 385 409 Data processing 2,535 2,202 2,023 Other loan expenses 1,882 2,836 2,406 Supplies 380 320 356 Customer and public relations 838 791 689 Marketing 532 454 406 Sales and use tax 309 198 208 Donations and contributions 370 482 437 Directors fees 341 286 235 Prepayment penalties FHLB advances - - 738 Other 3,082 2,609 2,313 $ 10,929 $ 10,722 $ 10,414 97 NOTE 18.17. INCOME TAXESThe components of income tax expense are as follows: Years Ended December 31, 2011 2010 2009 (In Thousands) Current $ 13,629 $ 11,570 $ 4,381 Deferred (1,240 ) (2,212 ) (1,601 ) Income tax expense $ 12,389 $ 9,358 $ 2,780 Year Ended December 31, 2013 2012 2011 (In Thousands) Current tax expense: Federal $ 21,264 $ 17,993 $ 12,045 State 899 1,308 1,584 Total current tax expense 22,163 19,301 13,629 Deferred tax expense (benefit): Federal (1,616) (1,999) (1,100) State (189) (182) (140) Total deferred tax expense (1,805) (2,181) (1,240) Total income tax expense $ 20,358 $ 17,120 $ 12,389 The Company’s total income tax expense differs from the amounts computed by applying the Federal income tax statutory rates to income before income taxes. A reconciliation of the differences is as follows:102 Year Ended December 31, 2013 Amount % of Pre-tax
Earnings (In Thousands) Income tax at statutory federal rate $ 21,691 35.00 % Effect on rate of: State income tax, net of federal tax effect 558 0.90 % Tax-exempt income, net of expenses (1,200) (1.94) % Bank owned life insurance contracts (698) (1.13) % Incentive stock option expense 66 0.11 % Other (59) (0.09) % Effective income tax and rate $ 20,358 32.85 % Year Ended December 31, 2012 Amount % of Pre-tax
Earnings (In Thousands) Income tax at statutory federal rate $ 18,047 35.00 % Effect on rate of: State income tax, net of federal tax effect 709 1.37 % Tax-exempt income, net of expenses (1,007) (1.95) % Bank owned life insurance contracts (568) (1.10) % Incentive stock option expense 121 0.23 % Other (182) (0.35) % Effective income tax and rate $ 17,120 33.20 % Year Ended December 31, 2011 Amount % of Pre-tax
Earnings (In Thousands) Income tax at statutory federal rate $ 12,540 35.00 % Effect on rate of: State income tax, net of federal tax effect 967 2.70 % Tax-exempt income, net of expenses (875) (2.44) % Bank owned life insurance contracts (137) (0.38) % Incentive stock option expense 128 0.36 % Other (234) (0.65) % Effective income tax and rate $ 12,389 34.59 % 98 NOTES TO CONSOLIDATED FINANCIAL STATEMENTSNOTE 18. INCOME TAXES (Continued) Year Ended December 31, 2011 Amount % of Pre-tax
Earnings (In Thousands) Income tax at statutory federal rate $ 12,540 35.00 % Effect on rate of: State income tax, net of federal tax effect 967 2.70 % Tax-exempt income, net of expenses (875 ) -2.44 % Bank owned life insurance contracts (137 ) -0.38 % Incentive stock option expense 128 0.36 % Other (234 ) -0.65 % Effective income tax and rate $ 12,389 34.59 % Year Ended December 31, 2010 Amount % of Pre-tax
Earnings (In Thousands) Income tax at statutory federal rate $ 9,355 35.00 % Effect on rate of: State income tax, net of federal tax effect 715 2.68 % Tax-exempt income, net of expenses (773 ) -2.89 % Incentive stock option expense 144 0.54 % Other (83 ) -0.32 % Effective income tax and rate $ 9,358 35.01 % Year Ended December 31, 2009 Amount % of Pre-tax
Earnings (In Thousands) Income tax at statutory federal rate $ 2,944 34.00 % Effect on rate of: State income tax, net of federal tax effect 214 2.47 % Tax-exempt income, net of expenses (477 ) -5.51 % Incentive stock option expense 224 2.59 % Other (125 ) -1.44 % Effective income tax and rate $ 2,780 32.11 % NOTES TO CONSOLIDATED FINANCIAL STATEMENTSNOTE 18. INCOME TAXES (Continued)The components of net deferred tax asset are as follows: December 31, 2011 2010 2009 (In Thousands) Other real estate $ 452 $ 646 $ 411 Start-up costs 115 127 141 Net unrealized (gains) losses on securities available for sale and cash flow hedge (4,220 ) (1,528 ) (810 ) Depreciation (489 ) (206 ) (304 ) Deferred loan fees (176 ) (72 ) 106 Allowance for loan losses 8,509 6,974 5,419 Nonqualified equity awards 436 194 27 Other 287 231 (118 ) Net deferred income tax assets $ 4,914 $ 6,366 $ 4,872 December 31, 2013 2012 (In Thousands) Deferred tax assets: Allowance for loan losses $ 11,844 $ 10,142 Other real estate owned 1,222 1,064 Nonqualified equity awards 773 583 Nonaccrual interest 374 491 Other deferred tax assets 141 114 Total deferred tax assets 14,354 12,394 Deferred tax liabilities: Net unrealized gain on securities available for sale 2,102 3,929 Depreciation 514 510 Prepaid expenses 161 140 Deferred loan fees 83 237 Investments 229 93 Other deferred tax liabilities 247 99 Total deferred tax liabilities 3,336 5,008 Net deferred income tax assets $ 11,018 $ 7,386 The Company believes its net deferred tax asset is recoverable as of December 31, 20112013 based on the expectation of future taxable income and other relevant considerations.ASC 740 defines the threshold for recognizing the benefits of tax return positions in the financial statements as “more-likely-than-not” to be sustained by the taxing authority. This section also provides guidance on derecognition, measurement and classification of income tax uncertainties in interim periods. As of December 31, 2011, the Company had no unrecognized tax benefits related to federal or state income tax matters. The Company does not anticipate any material increase or decrease in unrecognized tax benefits during 2012 related to any tax positions taken prior to December 31, 2011. As of December 31, 2011, the Company has accrued no interest or penalties related to uncertain tax positions. It is the Company’s policy to recognize interest and penalties, if any, related to income tax matters in income tax expense.The Company and its subsidiaries file a consolidated U.S. federal, State of AlabamaFederal income tax return and State of Floridavarious consolidated and separate company state income tax returns. The Company is currently open to audit under the statute of limitations by the Internal Revenue Service for the years ended December 31, 20092010 through 2011.2013. The Company is also currently open to audit by the Stateseveral state departments of Alabamarevenue for the years ended December 31, 20092010 through 2011, and open to2013. The audit periods differ depending on the date the Company began business activities in each state. Currently, there are no years for which the Company filed a federal or state income tax return that are under examination by the IRS or any state department of Florida forrevenue. Accrued interest and penalties on unrecognized income tax benefits totaled $0 and $6,000 as of January 1, 2013 and December 31, 2013, respectively. Unrecognized income tax benefits as of January 1, 2013 and December 31, 2013, that, if recognized, would impact the year ended 31,effective income tax rate totaled $161,000 and $437,000 (net of the federal benefit on state income tax issues), respectively, which includes interest and penalties of $6,000 and $0, respectively. The Company does not expect any of the uncertain tax positions to be settled or resolved during the next twelve months. The following table presents a summary of the changes during 2013, 2012 and 2011 as we opened our first office in the Stateamount of Floridaunrecognized tax benefits that are included in 2011.the consolidated balance sheets. 2013 2012 2011 (In Thousands) Balance, beginning of year $ 161 $ - $ - Increases related to prior year tax positions 276 - - Decreases related to prior year tax positions - - - Increases related to current year tax positions - 161 - Settlements - - - Lapse of statute - - - Balance, end of year $ 437 $ 161 $ - 99 NOTE 19.18. COMMITMENTS AND CONTINGENCIESLoan CommitmentsThe Company is a party to financial instruments with off-balance-sheet risk in the normal course of business to meet the financing needs of its customers. These financial instruments include commitments to extend credit, credit card arrangements, and standby letters of credit. Such commitments involve, to varying degrees, elements of credit and interest rate risk in excess of the amount recognized in the balance sheets. A summary of the Company’s approximate commitments and contingent liabilities is approximately as follows:NOTES TO CONSOLIDATED FINANCIAL STATEMENTS 2013 2012 2011 (In Thousands) Commitments to extend credit $ 1,052,902 $ 860,421 $ 697,939 Credit card arrangements 38,122 25,699 19,686 Standby letters of credit and financial guarantees 40,371 36,374 42,937 Total $ 1,131,395 $ 922,494 $ 760,562 NOTE 19.COMMITMENTS AND CONTINGENCIES (Continued) 2011 2010 2009 (In Thousands) Commitments to extend credit $ 697,939 $ 538,719 $ 409,760 Credit card arrangements 19,686 17,601 19,059 Standby letters of credit and financial guarantees 42,937 47,103 39,205 Total $ 760,562 $ 603,423 $ 468,024 NOTE 20.19. CONCENTRATIONS OF CREDITThe Company originates primarily commercial, residential, and consumer loans to customers in the Company’s market area. The ability of the majority of the Company’s customers to honor their contractual loan obligations is dependent on the economy in thisthe market area.The Company’s loan portfolio is concentrated primarily concentrated in loans secured by real estate, of which 54%54% is secured by real estate in the Company’s primary market areas. In addition, a substantial portion of the other real estate owned is located in that same market. Accordingly, the ultimate collectability of the loan portfolio and the recovery of the carrying amount of other real estate owned are susceptible to changes in market conditions in the Company’s primary market area.105NOTES TO CONSOLIDATED FINANCIAL STATEMENTSNOTE 21.20. EARNINGS PER COMMON SHAREA reconciliation of the numerators and denominators of theBasic earnings per common share andare computed by dividing net income available to common stockholders by the weighted average number of common shares outstanding during the period. Diluted earnings per common share assuming dilution computations are presented below. Years Ended December 31, 2011 2010 2009 (Dollar Amounts In Thousands Except Per
Share Amounts) Earnings Per Share Weighted average common shares outstanding 5,759,524 5,519,151 5,485,972 Net income available to common stockholders $ 23,238 $ 17,378 $ 5,878 Basic earnings per common share $ 4.03 $ 3.15 $ 1.07 Weighted average common shares outstanding 5,759,524 5,519,151 5,485,972 Dilutive effects of assumed conversions and exercise of stock options and warrants 989,639 775,453 301,671 Weighted average common and dilutive potential common shares outstanding 6,749,163 6,294,604 5,787,643 Net income available to common stockholders $ 23,238 $ 17,378 $ 5,878 Effect of interest expense on convertible debt, net of tax and discretionary expenditures related to conversion $ 568 $ 473 $ - Net income availabe to common stockholders, adjusted for effect of debt conversion $ 23,806 $ 17,851 $ 5,878 Diluted earnings per common share $ 3.53 $ 2.84 $ 1.02 100 Years Ended December 31, 2013 2012 2011 (Dollar Amounts In Thousands Except Per Share Amounts) Earnings Per Share Weighted average common shares outstanding 6,869,071 5,996,437 5,759,524 Net income available to common stockholders $ 41,201 $ 34,045 $ 23,238 Basic earnings per common share $ 6.00 $ 5.68 4.03 Weighted average common shares outstanding 6,869,071 5,996,437 5,759,524 Dilutive effects of assumed conversions and exercise of stock options and warrants 399,604 945,315 989,639 Weighted average common and dilutive potential common shares outstanding 7,268,675 6,941,752 6,749,163 Net income available to common stockholders $ 41,201 $ 34,045 $ 23,238 Effect of interest expense on convertible debt, net of tax and discretionary expenditures related to conversion $ 115 $ 569 $ 568 Net income available to common stockholders, adjusted for effect of debt conversion $ 41,316 $ 34,614 $ 23,806 Diluted earnings per common share $ 5.69 $ 4.99 $ 3.53 NOTE 22.21. RELATED PARTY TRANSACTIONSLoansAs more fully described in Note 3, the Company had outstanding loan balances to related parties as of December 31, 20112013 and 20102012 in the amount of $9,047,000$13.1 million and $6,825,000,$12.4 million, respectively.NOTES TO CONSOLIDATED FINANCIAL STATEMENTSNOTE 23. FAIR VALUE MEASUREMENTFair value is based on the price that would be received to sell an asset or paid to transfer a liability in an orderly transaction between market participants at the measurement date. In order to increase consistency and comparability inNOTE 22.FAIR VALUE MEASUREMENTMeasurement of fair value measurements, the standardunder U.S. GAAP establishes a fair value hierarchy that prioritizes observable and unobservable inputs used to measure fair value, as of the measurement date, into three broad levels, which are described below:Level 1: Quoted prices (unadjusted) in active markets that are accessible at the measurement date for assets or liabilities. The fair value hierarchy gives the highest priority to Level 1 inputs.Level 2: Observable prices that are based on inputs not quoted on active markets, but corroborated by market data.Level 3: Unobservable inputs are used when little or no market data is available. The fair value hierarchy gives the lowest priority to Level 3 inputs.In determining fair value, the Company utilizes valuation techniques that maximize the use of observable inputs and minimize the use of unobservable inputs to the extent possible as well asand also considers counterparty credit risk in its assessment of fair value.Debt Securities – where. Where quoted prices are available in an active market, securities are classified within levelLevel 1 of the hierarchy. Level 1 securities include highly liquid government securities such as U.S. Treasuriestreasuries and exchange-traded equity securities. For securities traded in secondary markets for which quoted market prices are not available, the Company generally relies on pricing services provided byprices obtained from independent vendors. Such independent pricing services are to advise the Company on the carrying value of the securities available for sale portfolio. As part of the Company’s procedures, the price provided from the service is evaluated for reasonableness given market changes. When a questionable price exists, the Company investigates further to determine if the price is valid. If needed, other market participants may be utilized to determine the correct fair value. The Company has also reviewed and confirmed its determinations in discussions with the pricing sourceservice regarding their methods of price discovery. Securities measured with these techniques are classified within Level 2 of the hierarchy and often involve using quoted market prices for similar securities, pricing models or discounted cash flow calculations using inputs observable in the market where available. Examples include U.S. government agency securities, mortgage-backed securities, obligations of states and political subdivisions, and certain corporate, asset-backed and other securities. In certain cases where Level 1 or Level 2 inputs are not available, securities are classified in Level 3 of the hierarchy.101 Interest Rate Swap Agreements –. The fair value is estimated by a third party using inputs that are observable or that can be corroborated by observable market data and, therefore, are classified within Level 2 of the hierarchy. These fair value estimations include primarily market observable inputs such as yield curves and option volatilities, and include the value associated with counterparty credit risk.Interest Rate CapImpaired Loans – The. Impaired loans are measured and reported at fair value is estimated by a third party using inputs that are observable or that can be corroborated by observable market data and, therefore, are classified within Level 2 of the hierarchy. These fair value estimations include primarily market observable inputs such as yield curves and option volatilities.107NOTES TO CONSOLIDATED FINANCIAL STATEMENTSNOTE 23. FAIR VALUE MEASUREMENT (Continued)Impaired Loans-Loans are considered impaired under FASB ASC 310-10-35, Subsequent Measurement of Impaired Loans,when full payment under the loan terms is not expected. Impairednotprobable. Specific allowances for impaired loans are carried atbased on comparisons of the recorded carrying values of the loans to the present value of the estimated future cash flows using theof these loans at each loan’s existingoriginal effective interest rate, or the fair value of the collateral or the observable market prices of the loans. Fair value is generally determined based on appraisals performed by certified and licensed appraisers using inputs such as absorption rates, capitalization rates and market comparables, adjusted for estimated costs to sell.loan is collateral-dependent.market or other factors, such as changes in absorption rates or market conditions from the time of valuation, and anticipated sales values considering management’s plans for disposition. Such modifications to the appraised values could result in lower valuations of such collateral. Estimated costs to sell are based on current amounts of disposal costs for similar assets. These measurements are classified as Level 3 within the valuation hierarchy. Impaired loans are subject to nonrecurring fair value adjustment.adjustment upon initial recognition or subsequent impairment. A portion of the allowance for loan losses is allocated to impaired loans if the value of such loans is deemed to be less than the unpaid balance. Impaired loans are reviewed and evaluated on at least a quarterly basis for additional impairment and adjusted accordingly based on the same factors identified above. The amount recognized as an impairment charge related to impaired loans that are measured at fair value on a nonrecurring basis was $5,419,000$9,589,000 and $7,878,000$4,586,000 during the years ended December 31, 20112013 and 2010,2012, respectively. Impaired loans measured at fair value on a nonrecurring basis are classified within Level 3 of the hierarchy.Other Real Estate Owned – Other real estate assets (“OREO”) acquired through, or in lieu of, foreclosure are held for sale and are initially recorded at the lower of cost or fair value, less selling costs. Any write-downs to fair value at the time of transfer to OREO are charged to the allowance for loan losses subsequent to foreclosure. Values are derived from appraisals of underlying collateral and discounted cash flow analysis. The amount charged to earningsA net loss on the sale and write-downs of OREO of $868,000 and $2,166,000 was $266,000recognized during the years ended December 31, 2013 and $1,252,000 for 2011 and 2010, respectively.2012. These charges were for write-downs in the value of OREO subsequent to foreclosure and losses on the disposal of OREO. OREO is classified within Level 3 of the hierarchy.NOTES TO CONSOLIDATED FINANCIAL STATEMENTSNOTE 23. FAIR VALUE MEASUREMENT (Continued)102 The following table presents the Company’s financial assets and financial liabilities carried at fair value on a recurring basis as of December 31, 20112013 and 2010: Fair Value Measurements at December 31, 2011 Using Quoted Prices in
Active Markets
for Identical
Assets (Level 1) Significant Other
Observable Inputs
(Level 2) Significant
Unobservable
Inputs (Level 3) Total Assets Measured on a Recurring Basis: (In Thousands) Available-for-sale securities: U.S Treasury and government agencies $ - $ 99,622 $ - $ 99,622 Mortgage-backed securities - 92,580 - 92,580 State and municipal securities - 100,526 - 100,526 Corporate debt - 1,081 - 1,081 Interest rate swap agreements - 617 - 617 Interest rate cap - 9 - 9 Total assets at fair value $ - $ 294,435 $ - $ 294,435 Liabilities Measured on a Recurring Basis: Interest rate swap agreements $ - $ 617 $ - $ 617 Fair Value Measurements at December 31, 2010 Using Quoted Prices in
Active Markets for
Identical Assets
(Level 1) Significant Other
Observable Inputs
(Level 2) Significant
Unobservable
Inputs (Level 3) Total Assets Measured on a Recurring Basis: (In Thousands) Available-for-sale securities: U.S Treasury and government agencies $ - $ 92,294 $ - $ 92,294 Mortgage-backed securities - 104,224 - 104,224 State and municipal securities - 78,266 - 78,266 Corporate debt - 2,175 - 2,175 Interest rate swap agreements - 803 - 803 Interest rate cap - 115 - 115 Total assets at fair value $ - $ 277,877 $ - $ 277,877 Liabilities Measured on a Recurring Basis: Interest rate swap agreements $ - $ 803 $ - $ 803 NOTES TO CONSOLIDATED FINANCIAL STATEMENTSNOTE 23. FAIR VALUE MEASUREMENT (Continued) Fair Value Measurements at December 31, 2013 Using Quoted Prices in Active Markets Significant Other Significant for Identical Observable Inputs Unobservable Assets (Level 1) (Level 2) Inputs (Level 3) Total (In Thousands) Assets Measured on a Recurring Basis: Available-for-sale securities: U.S. Treasury and government sponsored
agencies $ - $ 32,274 $ - $ 32,274 Mortgage-backed securities - 88,240 - 88,240 State and municipal securities - 129,831 - 129,831 Corporate debt - 15,875 - 15,875 Total assets at fair value $ - $ 266,220 $ - $ 266,220 Fair Value Measurements at December 31, 2012 Using Quoted Prices in Active Markets Significant Other Significant for Identical Observable Inputs Unobservable Assets (Level 1) (Level 2) Inputs (Level 3) Total (In Thousands) Assets Measured on a Recurring Basis: Available-for-sale securities U.S. Treasury and government sponsored
agencies $ - $ 28,386 $ - $ 28,386 Mortgage-backed securities - 73,466 - 73,466 State and municipal securities - 118,177 - 118,177 Corporate debt - 13,848 - 13,848 Interest rate swap agreements - 389 - 389 Total assets at fair value $ - $ 234,266 $ - $ 234,266 Liabilities Measured on a Recurring Basis: Interest rate swap agreements $ - $ 389 $ - $ 389 103 The following table presentscarrying amount and estimated fair value of the Company’s financial assets and financial liabilities carried at fair value on a nonrecurring basisinstruments were as of December 31, 2011 and 2010: Fair Value Measurements at December 31, 2011 Using Quoted Prices in
Active Markets
for Identical
Assets (Level 1) Significant Other
Observable Inputs
(Level 2) Significant
Unobservable
Inputs (Level 3) Total Assets Measured on a Nonrecurring Basis: (In Thousands) Impaired loans $ - $ - $ 33,072 $ 33,072 Other real estate owned - - 12,275 12,275 Total assets at fair value $ - $ - $ 45,347 $ 45,347 Fair Value Measurements at December 31, 2010 Using Quoted Prices in
Active Markets
for Identical
Assets (Level 1) Significant Other
Observable Inputs
(Level 2) Significant
Unobservable
Inputs (Level 3) Total Assets Measured on a Nonrecurring Basis: (In Thousands) Impaired loans $ - $ - $ 35,183 $ 35,183 Other real estate owned - - 6,966 6,966 Total assets at fair value $ - $ - $ 42,149 $ 42,149 Fair Value Measurements at December 31, 2013 Using Quoted Prices in Active Markets Significant Other Significant for Identical Observable Unobservable Assets (Level 1) Inputs (Level 2) Inputs (Level 3) Total (In Thousands) Assets Measured on a Nonrecurring Basis: Impaired loans $ - - $ 25,696 $ 25,696 Other real estate owned and repossessed assets - - 12,861 12,861 Total assets at fair value - - $ 38,557 $ 38,557 Fair Value Measurements at December 31, 2012 Using Quoted Prices in Active Markets Significant Other Significant for Identical Observable Unobservable Assets (Level 1) Inputs (Level 2) Inputs (Level 3) Total (In Thousands) Assets Measured on a Nonrecurring Basis: Impaired loans $ - $ - $ 33,883 $ 33,883 Other real estate owned - - 9,721 9,721 Total assets at fair value $ - $ - $ 43,604 $ 43,604 The fair value of a financial instrument is the current amount that would be exchanged in a sale between willing parties, other than in a forced liquidation. Fair value is best determined based upon quoted market prices. However, in many instances, there are no quoted market prices for the Company’s various financial instruments. In cases where quoted market prices are not available, fair values are based on estimates using present value or other valuation techniques. Those techniques are significantly affected by the assumptions used, including the discount rate and estimates of future cash flows. Accordingly, the fair value estimates may not be realized in an immediate settlement of the instrument. Current U.S. GAAP excludes certain financial instruments and all nonfinancial instruments from its fair value disclosure requirements. Accordingly, the aggregate fair value amounts presented may not necessarily represent the underlying fair value of the Company.The following methods and assumptions were used by the Company in estimating its fair value disclosures for financial instruments.Cash and cash equivalents:The carrying amounts reported in the statements of financial condition for cash and cash equivalents approximate those assets’ fair values.InvestmentDebt securities: Fair values for investment Where quoted prices are available in an active market, securities are based onclassified within Level 1 of the hierarchy. Level 1 securities include highly liquid government securities such as U.S. treasuries and exchange-traded equity securities. For securities traded in secondary markets for which quoted market prices where available. Ifare not available, the Company generally relies on prices obtained from independent vendors. Such independent pricing services are to advise the Company on the carrying value of the securities available for sale portfolio. As part of the Company’s procedures, the price provided from the service is evaluated for reasonableness given market changes. When a quoted marketquestionable price exists, the Company investigates further to determine if the price is not available,valid. If needed, other market participants may be utilized to determine the correct fair value is based onvalue. The Company has also reviewed and confirmed its determinations in discussions with the pricing service regarding their methods of price discovery. Securities measured with these techniques are classified within Level 2 of the hierarchy and often involve using quoted market prices for similar securities, pricing models or discounted cash flow calculations using inputs observable in the market where available. Examples include U.S. government agency securities, mortgage-backed securities, obligations of comparable instruments.Restricted equity securities:Fair values for other investments are considered to be their cost as they are redeemed at par value.NOTES TO CONSOLIDATED FINANCIAL STATEMENTS104 NOTE 23. FAIR VALUE MEASUREMENT (Continued)Loans, net:Loans: For variable-rate loans that re-price frequently and with no significant change in credit risk, fair value is based on carrying amounts. The fair value of other loans (for example, fixed-rate commercial real estate loans, mortgage loans, and industrialFASB Accounting Standards Codification (ASC)ASC 820 and generally produces a higher value than an exit-price approach. FairThe measurement of the fair value for impairedof loans is estimated using discounted cash flow analysis, or underlying collateral values, where applicable.Mortgage loans held for sale: Loans are committed to be delivered to investors on a “best efforts delivery” basis within 30 days of origination. Due to this short turn-around time, the carrying amounts of the Company’s agreements approximate their fair values.Derivatives:The fair value of the derivative agreements are based on quoted pricesestimated by a third party using inputs that are observable or can be corroborated by observable market data. As part of the Company’s procedures, the price provided from an outsidethe third party.Accrued interest and dividends receivable:The carrying amountamounts in the statements of accrued interest and dividends receivable approximates itscondition approximate these assets’fair value.Bank owned life insurance contracts:The carrying amounts in the statements of condition approximate these assets’ fairvalue.Deposits: The fair valuevalues disclosed for demand deposits is,are, by definition, equal to the amount payable on demand at the reporting date (that is, their carrying amounts). The carrying amounts of variable-rate, fixed-term money market accounts and certificates of deposit approximate their fair values. Fair values for fixed-rate certificates of deposit are estimated using a discounted cash flow calculation that appliesusing interest rates currently offered on certificates to a schedule of aggregated expected monthly maturities on time deposits.Other borrowings:for deposits with similar remaining maturities. The fair value of otherthe Company’s time deposits do not take into consideration the value of the Company’s long-term relationships with depositors, which may have significant value. Measurements of the fair value of certificates of deposit are classified within Level 2 of the fair value hierarchy.Other borrowings: The fair values of borrowings are estimated using discounted cash flow analysis, based on interest rates currently being offered by the Federal Home Loan Bank for borrowings of similar terms as those being valued.Trust preferred securities:Subordinated debentures: The fair valuevalues of trust preferred securitiessubordinated debentures are estimated using a discounted cash flow analysis, based on interest rates currently being offered on the best alternative debt available at the measurement date.Accrued interest payable:The carrying amountamounts in the statements of accrued interest payable approximates itscondition approximate these assets’ fair value.Loan commitments: The fair values of the Company’s off-balance sheetoff-balance-sheet financial instruments are based on fees currently charged to enter into similar agreements. Since the majority of the Company’s other off-balance-sheetfinancialinstruments consistconsists of non-fee-producing, variable-rate commitments, the Company has determined they do not have a distinguishable fair value.NOTES TO CONSOLIDATED FINANCIAL STATEMENTSNOTE 23. FAIR VALUE MEASUREMENT (Continued)The carrying amount, and estimated fair value and placement in the fair value hierarchy of the Company’s financial instruments as of December 31, 2013 and December 31, 2012 are presented in the following table. This table includes those financial assets and liabilities that are not measured and reported at fair value on a recurring basis or nonrecurring basis.105 The Company’s financial assets and financial liabilities which are carried at fair value were as follows: December 31, 2011 2010 Carrying
Amount Fair Value Carrying
Amount Fair Value (In Thousands) Financial Assets: Cash and cash equivalents $ 242,933 $ 242,933 $ 231,978 $ 231,978 Investment securities available for sale 293,809 293,809 276,959 276,959 Investment securities held to maturity 15,209 15,999 5,234 4,963 Restricted equity securities 3,501 3,501 3,510 3,510 Mortgage loans held for sale 17,859 17,859 7,875 7,875 Loans, net 1,808,712 1,811,612 1,376,741 1,388,154 Accrued interest and dividends receivable 8,192 8,192 6,990 6,990 Bank owned life insurance contracts 40,390 40,390 - - Derivative 626 626 918 918 Financial Liabilities: Deposits $ 2,143,887 $ 2,150,308 $ 1,758,716 $ 1,761,906 Borrowings 4,954 5,377 24,937 25,717 Trust preferred securities 30,514 27,402 30,420 27,989 Accrued interest payable 945 945 898 898 Derivative 617 617 803 803 NOTE 24. PARENT COMPANY FINANCIAL INFORMATION December 31, 2013 2012 Carrying
Amount Fair Value Carrying Amount Fair Value (In Thousands) Financial Assets: Level 2 Inputs: Debt securities available for sale $ 266,220 $ 266,220 $ 233,877 $ 233,877 Debt securities held to maturity 32,274 31,315 25,967 27,350 Restricted equity securities 3,738 3,738 3,941 3,941 Federal funds sold 8,634 8,634 3,291 3,291 Mortgage loans held for sale 8,134 8,134 25,826 25,826 Bank owned life insurance contracts 69,008 69,008 57,014 57,014 Derivatives - - 389 389 Level 3 Inputs: Loans, net $ 2,828,205 $ 2,825,924 $ 2,336,924 $ 2,327,780 Financial Liabilities: Level 2 Inputs: Deposits $ 3,019,642 $ 3,021,847 $ 2,511,572 $ 2,516,320 Federal funds purchased 174,380 174,380 117,065 117,065 Other borrowings 19,940 19,940 19,917 19,917 Subordinated debentures - - 15,050 15,050 Derivatives - - 389 389 NOTE 23.PARENT COMPANY FINANCIAL INFORMATIONThe following information presents the condensed balance sheetsheets of ServisFirst Bancshares, Inc.the Parent Company as of December 31, 20112013 and 20102012 and the condensed statements of income and cash flows for the years ended December 31, 2011, 20102013, 2012 and 2009.2011. 112CONDENSED BALANCE SHEETS DECEMBER 31, 2013 AND 2012 (In Thousands) 2013 2012 ASSETS Cash and due from banks $ 2,562 $ 3,264 Investment in subsidiary 314,489 265,229 Other assets 194 18 Total assets $ 317,245 $ 268,511 LIABILITIES AND STOCKHOLDERS' EQUITY Liabilities: Other borrowings $ 19,940 $ 19,917 Subordinated debentures - 15,050 Other liabilities 113 287 Total liabilities 20,053 35,254 Stockholders' equity: Preferred stock, Series A Senior Non-Cumulative Perpetual, par value $.001 (liquidation preference $1,000), net of discount; 40,000 shares authorized, 40,000 shares issued and outstanding at December 31, 2013 and 2012 39,958 39,958 Common stock, par value $.001 per share; 50,000,000 shares authorized; 7,350,012 shares issued and outstanding at December 31, 2013 and 6,268,812 shares issued and outstanding at December 31, 2012 7 6 Additional paid-in capital 123,325 93,505 Retained earnings 130,011 92,492 Accumulated other comprehensive income 3,891 7,296 Total stockholders' equity 297,192 233,257 Total liabilities and stockholders' equity $ 317,245 $ 268,511 106 NOTES TO CONSOLIDATED FINANCIAL STATEMENTSNOTE 24. PARENT COMPANY FINANCIAL INFORMATION (Continued)BALANCE SHEETS DECEMBER 31, 2011 AND 2010(In Thousands) 2011 2010 ASSETS Cash & due from banks $ 2,908 $ 51 Investment in subsidiary 223,753 146,954 Other assets 293 660 Total assets $ 226,954 $ 147,665 LIABILITIES AND STOCKHOLDERS' EQUITY Liabilities: Borrowings $ 30,514 $ 30,420 Other liabilities 148 145 Total liabilities 30,662 30,565 Stockholders' equity: Preferred stock, Series A Senior Non-Cumulative Perpetual, par value $.001 (liquidation preference $1,000), net of discount; 40,000 shares authorized, 40,000 shares issued and outstanding at December 31, 2011 and no shares authorized, issued and outstanding at December 31, 2010 39,958 - Common stock, par value $.001 per share; 15,000,000 shares authorized; 5,932,182 shares issued and outstanding at December 31, 2011 and 5,527,482 shares issued and outstanding at December 31, 2010 6 6 Paid in capital 87,805 75,914 Retained earnings 61,581 38,343 Accumulated other comprehensive income 6,942 2,837 Total stockholders' equity 196,292 117,100 Total liabilites and stockholders' equity $ 226,954 $ 147,665 STATEMENTS OF INCOME(In Thousands) 2011 2010 2009 Income: Dividends received from subsidiary $ 800 $ 1,230 $ 325 Other income 43 42 40 Total income 843 1,272 365 Expense: Interest on borrowings 2,345 2,236 1,401 Other operating expenses 291 295 304 Total expenses 2,636 2,531 1,705 Loss before income tax benefit & equity in undistributed earnings of subsidiary (1,793 ) (1,259 ) (1,340 ) Income tax benefit (976 ) (924 ) (614 ) Loss before equity in undistributed earnings earnings of subsidiary (817 ) (335 ) (726 ) Equity in undistributed earnings of subsidiary 24,255 17,713 6,604 Net income 23,438 17,378 5,878 Dividends on preferred stock 200 - - Net income available to common stockholders $ 23,238 $ 17,378 $ 5,878 113CONDENSED STATEMENTS OF INCOME FOR THE YEARS ENDED DECEMBER 31, (In Thousands) 2013 2012 2011 Income: Dividends received from subsidiary $ 4,750 $ - $ 800 Other income 1 41 43 Total income 4,751 41 843 Expense: Other expenses 1,147 1,594 1,660 Total expenses 1,147 1,594 1,660 Equity in undistributed earnings of subsidiary 38,013 35,998 24,255 Net income 41,617 34,445 23,438 Dividends on preferred stock 400 400 200 Net income available to common stockholders 41,217 34,045 23,238 STATEMENT OF CASH FLOWS FOR THE YEARS ENDED DECEMBER 31, (In Thousands) 2013 2012 2011 Operating activities Net income $ 41,617 $ 34,445 $ 23,438 Adjustments to reconcile net income to net cash used
in operating activities: Other (224) 878 (50) Equity in undistributed earnings of subsidiary (38,013) (35,998) (24,255) Net cash (used in) provided by operating activities 3,380 (675) (867) Investing activities Investment in subsidiary (10,499) - (46,200) Net cash used in investing activities (10,499) - (46,200) Financing activities Proceeds from other borrowings - 19,917 - Repayment of subordinated debentures - (15,464) - Proceeds from issuance of preferred stock - - 39,958 Proceeds from issuance of common stock 10,499 112 10,166 Dividends on preferred stock (400) (400) (200) Dividends on common stock (3,682) (3,134) - Net cash provided by financing activities 6,417 1,031 49,924 (Decrease) increase in cash and cash equivalents $ (702) $ 356 $ 2,857 Cash and cash equivalents at beginning of year 3,264 2,908 51 Cash and cash equivalents at end of year $ 2,562 $ 3,264 $ 2,908 107 NOTES TO CONSOLIDATED FINANCIAL STATEMENTSNOTE 24. PARENT COMPANY FINANCIAL INFORMATION (Continued)STATEMENT OF CASH FLOWSYEARS ENDED DECEMBER 31, 2011, 2010 AND 2009(In Thousands) 2011 2010 2009 OPERATING ACTIVITIES Net income $ 23,438 $ 17,378 $ 5,878 Adjustments to reconcile net income to net cash used in operating activities: Other (50 ) 241 260 Equity in undistributed earnings of subsidiary (24,255 ) (17,713 ) (6,604 ) Net used in operating activities (867 ) (94 ) (466 ) INVESTMENT ACTIVITIES Investment in subsidiary (46,200 ) (15,000 ) (3,479 ) Net cash used in investment activities (46,200 ) (15,000 ) (3,479 ) FINANCING ACTIVITIES Proceeds from other borrowings - - - Repayment of borrowings - - - Proceeds from issuance of trust preferred securities - 15,050 - Proceeds from issuance of preferred stock 39,958 - - Proceeds from issuance of common stock 10,166 - 3,479 Dividends on preferred stock (200 ) - - Net cash provided by financing activities 49,924 15,050 3,479 Increase (decrease) in cash & cash equivalents 2,857 (44 ) $ (466 ) Cash & cash equivalents at beginning of year 51 95 561 Cash & cash equivalents at end of year $ 2,908 $ 51 $ 95 QUARTERLY FINANCIAL DATA (UNAUDITED)The following table sets forth certain unaudited quarterly financial data derived from our consolidated financial statements. Such data is only a summary and should be read in conjunction with our historical consolidated financial statements and related notes continued in this annual report on Form 10-K. 2011 Quarter Ended (Dollars in thousands, except per share data) March 31 June 30 September 30 December 31 Interest income $ 20,961 $ 22,080 $ 23,312 $ 25,058 Interest expense 3,985 4,032 4,093 3,970 Net interest income 16,976 18,048 19,219 21,088 Provision for loan losses 2,231 1,494 2,740 2,507 Net income available to common stockholders 4,871 5,845 6,035 6,487 Net income per common share, basic $ 0.88 $ 1.02 $ 1.03 $ 1.10 Net income per common share, diluted $ 0.77 $ 0.89 $ 0.90 $ 0.97 2010 Quarter Ended (Dollars in thousands, except per share data) March 31 June 30 September 30 December 31 Interest income $ 18,502 $ 18,996 $ 19,959 $ 20,689 Interest expense 3,596 3,688 3,972 4,004 Net interest income 14,906 15,308 15,987 16,685 Provision for loan losses 2,538 2,537 2,537 2,738 Net income available to common stockholders 4,013 4,021 4,799 4,545 Net income per common share, basic $ 0.73 $ 0.73 $ 0.87 $ 0.82 Net income per common share, diluted $ 0.69 $ 0.65 $ 0.77 $ 0.73 2013 Quarter Ended (Dollars in thousands, except per share data) March 31 June 30 September 30 December 31 Interest income $ 29,165 $ 30,692 $ 32,499 $ 33,725 Interest expense 3,264 3,211 3,534 3,610 Net interest income 25,901 27,481 28,965 30,115 Provision for loan losses 4,284 3,334 3,034 2,356 Net income available to common
stockholders 9,151 9,586 10,712 11,752 Net income per common share, basic $ 1.44 $ 1.39 $ 1.53 $ 1.64 Net income per common share, diluted $ 1.31 $ 1.34 $ 1.46 $ 1.58 2012 Quarter Ended (Dollars in thousands, except per share data) March 31 June 30 September 30 December 31 Interest income $ 25,571 $ 26,654 $ 27,743 $ 29,055 Interest expense 3,833 3,749 3,695 3,624 Net interest income 21,738 22,905 24,048 25,431 Provision for loan losses 2,383 3,083 1,185 2,449 Net income available to common
stockholders 8,155 8,231 9,202 8,457 Net income per common share, basic $ 1.37 $ 1.38 $ 1.53 $ 1.40 Net income per common share, diluted $ 1.20 $ 1.21 $ 1.35 $ 1.23 ITEM 9. CHANGES IN AND DISAGREEMENTS WITH ACCOUNTANTS ON ACCOUNTING AND FINANCIAL DISCLOSURE.ITEM 9. CHANGES IN AND DISAGREEMENTS WITH ACCOUNTANTS ON ACCOUNTING AND FINANCIAL DISCLOSURE. There were no changes in or disagreements with accountants regarding accounting and financial disclosure matters during the year ended December 31, 2011.2013.ITEM 9A. CONTROLS AND PROCEDURESITEM 9A. CONTROLS AND PROCEDURES Evaluation of Disclosure Controls and ProceduresOur management, under supervision and with the participation of the Chief Executive Officer and the Chief Financial Officer, evaluated the effectiveness of our disclosure controls and procedures, as defined under Exchange Act Rule 13a-15(e). Based upon that evaluation of these disclosure controls and procedures, the Chief Executive Officer and Chief Financial Officer concluded that our disclosure controls and procedures were effective as of December 31, 2011.Changes in Internal Control over Financial ReportingThe Chief Executive Officer and Chief Financial Officer have concluded that there were no changes in our internal control over financial reporting identified in the evaluation of the effectiveness of our disclosure controls and procedures that occurred during the fiscal quarter ended December 31, 2011,2013, that have materially affected, or are reasonably likely to materially affect, our internal control over financial reporting.Management’s Report on Internal Control over Financial ReportingOur management is responsible for establishing and maintaining adequate internal control over financial reporting, as defined under Exchange Act Rules 13a-15(f) and 14d-14(f). Our internal control over financial reporting is designed to provide reasonable assurance regarding the reliability of financial reporting and the preparation of financial statements for external purposes in accordance with generally accepted accounting principles.As of December 31, 2011,2013, management assessed the effectiveness of our internal control over financial reporting based on criteria for effective internal control over financial reporting established in “Internal Control – Integrated Framework,” issued by the Committee of Sponsoring Organizations (COSO) of the Treadway Commission. Based on the assessment, management determined that the Company maintained effective internal control over financial reporting as of December 31, 2011,2013, based on those criteria.108 The effectiveness of the Company’s internal control over financial reporting as of December 31, 2011,2013, has been audited by KPMG LLP, an independent registered public accounting firm, as stated in their report herein — “Report of Independent Registered Public Accounting Firm.”ITEM 9B. OTHER INFORMATION.AtITEM 9B. OTHER INFORMATION. The Company, the 2011 Annual MeetingBank and William M. Foshee entered into an amended and restated change in control agreement on March 5, 2014. This agreement amends and restates in its entirety that certain change in control agreement between the Bank and Mr. Foshee, dated May 20, 2005. The purposes of Stockholders,the amended and restated change in control agreement with Mr. Foshee are to clarify that a “Change in Control”, as defined in the agreement, includes a change in control of the Company in addition to a change in control of the Bank, and to add that a change in control of the board of directors recommended, and 98%composition of the shares represented atCompany, in certain instances as set forth therein, constitutes a change in control.The Company, the meeting votedBank and Clarence C. Pouncey, III entered into an amended and restated change in favorcontrol agreement on March 5, 2014. This agreement amends and restates in its entirety that certain change in control agreement between the Bank and Mr. Pouncey, dated June 20, 2006.The sole purpose of advisory say-on-pay votes at each annual meetingthe amended and restated change in control agreement with Mr. Pouncey is to clarify that a “Change in Control,” as defined in the agreement, includes a change in control of stockholders. The boardthe Company in addition to a change in control of directors has determined that it will hold the say-on-pay advisory vote at each annual meeting of stockholders.PART IIIITEM 10. DIRECTORS, EXECUTIVE OFFICERS AND CORPORATE GOVERNANCE.ITEM 10. DIRECTORS, EXECUTIVE OFFICERS AND CORPORATE GOVERNANCE. We respond to this Item by incorporating by reference the material responsive to this Item in our definitive proxy statement to be filed with the Securities and Exchange Commission in connection with our 20122014 Annual Meeting of Shareholders.Code of EthicsOur Board of Directors has adopted a Code of Ethics that applies to all of our employees, officers and directors. The Code of Ethics covers compliance with law; fair and honest dealings with us, with competitors and with others; fair and honest disclosure to the public; and procedures for compliance with the Code of Ethics. A copy of the Code of Ethics is included as Exhibit 14 to this Form 10-K.Executive Officers of the RegistrantThe business experience of our executive officers who are not also directors is set forth below.William Foshee – Mr. Foshee has served as our Executive Vice President, Chief Financial Officer, Treasurer and Secretary since 2007 and as Executive Vice President, Chief Financial Officer, Treasurer and Secretary of the Bank since 2005. Mr. Foshee served as the Chief Financial Officer of Heritage Financial Holding Corporation from 2002 until it was acquired in 2005. Mr. Foshee is a Certified Public Accountant.Clarence C. Pouncey, III – Mr. Pouncey has served as our Executive Vice President and Chief Operating Officer since 2007 and Executive Vice President and Chief Operating Officer of the Bank since November 2006 and also served as Chief Risk Officer of the Bank from March 2006 until November 2006. Prior to joining the Company, Mr. Pouncey was employed by SouthTrust Bank (now Wells Fargo Bank) in various capacities from 1978 to 2006, most recently as the Senior Vice President and Regional Manager of Real Estate Financial Services.Andrew N. Kattos – Mr. Kattos has served as Executive Vice President and Huntsville President and Chief Executive Officer of the Bank since April 2006. Prior to joining the Company, Mr. Kattos was employed by First Commercial Bank for 14 years, most recently as an Executive Vice President and Senior Lender in the Commercial Lending Department. Mr. Kattos also serves on the advisory council of the University of Alabama in Huntsville School of Business.G. Carlton Barker – Mr. Barker has served as Executive Vice President and Montgomery President and Chief Executive Officer of the Bank since February 1, 2007. Prior to joining the Company, Mr. Barker was employed by Regions Bank for 19 years in various capacities, most recently as the Regional President for the Southeast Alabama Region. Mr. Barker serves on the Huntingdon College Board of Trustee.Ronald A. DeVane –Mr. DeVane has served as Executive Vice President and Dothan President and Chief Executive Officer of the Bank since August 2008. Prior to joining the Company, Mr. DeVane held various positions with Wachovia Bank and SouthTrust Bank until his retirement in 2006, including CEO for the Wachovia Midsouth Region, which encompassed Alabama, Tennessee, Mississippi and the Florida panhandle, from September 2004 until 2006, CEO of the Community Bank Division of SouthTrust from January 2004 until September 2004, and CEO for SouthTrust Bank of Atlanta and North Georgia from July 2002 until December 2003. Mr. DeVane is a Trustee at Samford University, a member of the Troy University Foundation Board, a Trustee of the Southeast Alabama Medical Center Foundation Board, and a Board Member of the National Peanut Festival Association.Rex D. McKinney –Mr. McKinney has served as Executive Vice President and Pensacola President and Chief Executive Officer of the Bank since January 2011. Prior to joining the Company, Mr. McKinney held several leadership positions at First American Bank/Coastal Bank and Trust (owned by Synovus Financial Corporation) starting in 1997. Mr. McKinney is on the Membership Committee and a Past Board Member of the Rotary Club of Pensacola. He is Past President of the Pensacola Sports Association, Board Member and Finance Committee Member for the United Way of Escambia County, Finance Committee Member for Christ Episcopal Church, Finance Committee Member for the Pensacola Country Club, Member of the Irish Politicians Club, and Board Member of the Order of Tristan.ITEM 11. EXECUTIVE COMPENSATION.ITEM 11. EXECUTIVE COMPENSATION. We respond to this Item by incorporating by reference the material responsive to this Item in our definitive proxy statement to be filed with the Securities and Exchange Commission in connection with our 20122014 Annual Meeting of Stockholders.ITEM 12. SECURITY OWNERSHIP OF CERTAIN BENEFICIAL OWNERS AND MANAGEMENT AND RELATED STOCKHOLDER MATTERS.ITEM 12. SECURITY OWNERSHIP OF CERTAIN BENEFICIAL OWNERS AND MANAGEMENT AND RELATED STOCKHOLDER MATTERS. We respond to this Item by incorporating by reference the material responsive to this Item in our definitive proxy statement to be filed with the Securities and Exchange Commission in connection with our 20122014 Annual Meeting of Stockholders. The information called for by this item relating to “Securities Authorized for Issuance Under Equity Compensation Plans” is provided in Part II, Item 5 of this Form 10-K.ITEM 13. CERTAIN RELATIONSHIPS AND RELATED TRANSACTIONS, AND DIRECTOR INDEPENDENCE.ITEM 13. CERTAIN RELATIONSHIPS AND RELATED TRANSACTIONS, AND DIRECTOR INDEPENDENCE. We respond to this Item by incorporating by reference the material responsive to this Item in our definitive proxy statement to be filed with the Securities and Exchange Commission in connection with our 20122014 Annual Meeting of Stockholders.ITEM 14. PRINCIPAL ACCOUNTING FEES AND SERVICES.ITEM 14. PRINCIPAL ACCOUNTANT FEES AND SERVICES. We respond to this Item by incorporating by reference the material responsive to this Item in our definitive proxy statement to be filed with the Securities and Exchange Commission in connection with our 20122014 Annual Meeting of Stockholders.109 PART IVITEM 15. EXHIBITS AND FINANCIAL STATEMENT SCHEDULES.ITEM 15. FINANCIAL STATEMENT SCHEDULES AND EXHIBITS (a) The following financial statements are filed as a part of this registration statement:Annual Report on Form 10-K PageReport of Independent Registered Public Accounting Firm on Consolidated Financial Statements 62Report of Independent Registered Public Accounting Firm onConsolidated Financial Statements6366Report of Management on Internal Control over Financial Reporting 6467Report of Independent Registered Public Accounting Firm on Internal Control over Financial Reporting 6568Consolidated Balance Sheets at December 31, 20112013 and 201020126669Consolidated Statements of Income for the Years Ended December 31, 2011, 20102013, 2012 and 200920116770Consolidated Statements of Comprehensive Income for the Years Ended December 31, 2011, 20102013, 2012 and 200920116871Consolidated Statements of Stockholders’Stockholders' Equity for the Years Ended December 31, 2011, 20102013, 2012 and 200920116972Consolidated Statements of Cash Flows for the Years Ended December 31, 2011, 20102013, 2012 and 200920117073Notes to Consolidated Financial Statements 7274(b) The following exhibits are furnished with this Annual Report on Form 10-K(b)The following exhibits are furnished with this registration statement.EXHIBIT NO.NAME OF EXHIBIT 2.1 Plan of Reorganization and Agreement of Merger dated August 29, 2007 (1) 3.1 Certificate of Incorporation, (1)as amended (Restated for SEC filing purposes only) (2) 3.2 Certificate of Amendment to Certificate of Incorporation (1)3.3Bylaws (Restated for SEC filing purposes only) (1) 4.1 Form of Common Stock Certificate (1) 4.2 Certain provisions from theRevised Form of Common Stock Certificate of Incorporation (1)(3) 4.3 Revised Form of Common Stock Certificate (2)4.4Amended and Restated Trust Agreement of ServisFirst Capital Trust I dated September 2, 2008 (3)4.5Indenture dated September 2, 2008 (3)4.6Guarantee Agreement dated September 2, 2008 (3)4.7 Form of Common Stock Purchase Warrant dated September 2, 2008 (3)4.8ServisFirst Bank 8.5% Subordinated Note due June 1, 2016 (6)(4) 4.94.4 Warrant to Purchase SharesShare of Common Stock dated June 23, 2009 (6)4.10Amended and Restated Trust Agreement of ServisFirst Capital Trust II, dated March 15, 2010 (7) 4.11Indenture, dated March 15, 2010, by and between ServisFirst Bancshares, Inc. and Wilmington Trust Company (7)4.12Preferred Securities Guaranty Agreement, dated March 15, 2010, by and between ServisFirst Bancshares, Inc. and Wilmington Trust Company (7)4.134.5 Small Business Fund –- Securities Purchase Agreement dated June 21, 2011 between the Secretaryof the Treasury and ServisFirst Bancshares, Inc. (8)(9) 4.144.6 Certificate of Designation of Senior Non-cumulative Perpetual Preferred Stock, Series A of ServisFirst Bancshares, Inc. (8)(9)4.7 Note Purchase Agreement, dated November 9, 2012, between ServisFirst Bancshares, Inc. and certain accredited investors (9) 4.8 Form of 5.50% Subordinated Note due November 9, 2022 (9) 10.1 2005 Amended and Restated Stock Incentive Plan (1)* 10.2 Amended and Restated Change in Control Agreement with William M. Foshee dated May 20, 2005 (1)March 5, 2014 (10)*110 10.3 Amended and Restated Change in Control Agreement with Clarence C. Pouncey III dated June 6, 2006 (1)March 5, 2014 (10)* 10.4 Employment Agreement of Andrew N. Kattos dated April 27, 2006 (1)* 10.5 Employment Agreement of G. Carlton Barker dated February 1, 2007 (1)* 10.6 2009 Stock Incentive Plan (4)(5)* 11 Statement Regarding Computation of Earnings Per Share is included herein at Note 2120 to theConsolidated Financial Statements in Item 8. 14 Code of Ethics for Principal Financial Officers (5)(6) 21 List of Subsidiaries 23.123 Consent of KPMG LLP 23.2Consent of Mauldin & Jenkins 24 Power of Attorney 31.1 Certification of Chief Executive Officer pursuant to Rule 13a-14(a) 31.2 Certification of Chief Financial Officer pursuant to Rule 13a-14(a) 32.1 Certification of Chief Executive Officer pursuant to 18 U.S.C. Section 1350 32.2 Certification of Chief Financial Officer pursuant to 18 U.S.C. Section 1350 119 101.INS XBRL Instance Document 101.SCH XBRL Schema Documents 101.CAL XBRL Calculation Linkbase Document 101.LAB XBRL Label Linkbase Document 101.PRE XBRL Presentation Linkbase Document 101.DEF XBRL Definition Linkbase Document (1) Previously filed as an exhibit to ServisFirst Bancshares, Inc.’s's Registration Statement on Form 10, as filed with the Securities and Exchange Commission onMarch 28, 2008,, and incorporated herein by reference.(2) Previously filed as an exhibit toExhibit 3.01 of ServisFirst Bancshares, Inc.’s Current's Quarterly Report on Form 8-K dated10-Q for the quarter ended September 15, 2008,30, 2012, and incorporated herein by reference.(3) Previously filed as an exhibit to ServisFirst Bancshares, Inc.’s's Current Report on Form 8-K dated September 15, 2008, and incorporated herein by reference.(4) Previously filed as an exhibit to ServisFirst Bancshares, Inc.'s Current Report on Form 8-K dated September 2, 2008, and incorporated herein by reference.(4)(5) Previously filed as Appendix Aan exhibit to ServisFirst Bancshares, Inc.’s definitive's Definitive Proxy Statement on Schedule 14A relating to the 2009 Annual Meeting of Stockholders and incorporated herein by reference.(5)(6) Previously filed as an exhibit to ServisFirst Bancshares, Inc.’s's Annual Report on Form 10-K for the fiscal year ended December 31, 2008, and incorporated herein by reference.(6)(7) Previously filed as an exhibit to ServisFirst Bancshares, Inc.’s's Annual Report on Form 10-K for the fiscal year ended December 31, 2009, and incorporated herein by reference.(7) Previously filed as an exhibit to ServisFirst Bancshares, Inc.’s Current Report on Form 8-K datedMarch 15, 2010, and incorporated herein by reference.(8) Previously filed as an exhibit to ServisFirst Bancshares, Inc.’s current report's Current Report on Form 8-K dated June 21, 2011, and incorporated herein by reference.(9) Previously filed as an exhibit to ServisFirst Bancshares, Inc.'s Current Report on Form 8-K dated November 8, 2012, and incorporated herein by reference.111 (10) Filed herewith* Management contract or compensatory plan arrangements.SIGNATURESPursuant to the requirements of Section 13 or 15(d) of the Securities Exchange Act of 1934, the Registrant has duly caused this report to be signed on its behalf by the undersigned, thereunto duly authorized.SERVISFIRST BANCSHARES, INC. By: /s/Thomas A. Broughton, III Thomas A. Broughton, III President and Chief Executive Officer Dated: March 7, 2012Pursuant to the requirements of the Securities Exchange Act of 1934, this report has been signed below by the following persons on behalf of the Registrant and in the capacities and on the date indicated.SignatureTitleDate /s/Thomas A. Broughton, III President, Chief Executive March 7, 201217, 2014Thomas A. Broughton, III Officer and Director (Principal Executive Officer) /s/ William M. Foshee Executive Vice President March 7, 201217, 2014William M. Foshee and Chief Financial Officer (Principal Financial Officer and Principal Accounting Officer) * Chairman of the Board March 7, 201217, 2014Stanley M. Brock * Director March 7, 201217, 2014Michael D. Fuller * Director March 7, 201217, 2014James J. Filler * Director March 7, 201217, 2014Joseph R. Cashio * Director March 7, 201217, 2014Hatton C. V. Smith *The undersigned, acting pursuant to a Power of Attorney, has signed this Amendment No. 1 to Annual Report on Form 10-K for and on behalf of the persons indicated above as such persons’ true and lawful attorney-in-fact and in their names, places and stated, in the capacities indicated above adand on the date indicated below./s/ William M. Foshee William M. Foshee Attorney-in-Fact 121March 17, 2014EXHIBIT INDEX(b) The following exhibits are furnished with this Annual Report on Form 10-KEXHIBIT INDEXEXHIBIT NO.NAME OF EXHIBIT 2.1Plan of Reorganization and Agreement of Merger dated August 29, 2007 (1)3.1Certificate of Incorporation (1)3.2Certificate of Amendment to Certificate of Incorporation (1)3.3Bylaws (1)4.1Form of Common Stock Certificate (1)4.2Certain provisions from the Certificate of Incorporation (1)4.3Revised Form of Common Stock Certificate (2)4.4Amended and Restated Trust Agreement of ServisFirst Capital Trust I dated September 2, 2008 (3)4.5Indenture dated September 2, 2008 (3)4.6Guarantee Agreement dated September 2, 2008 (3)4.7Form of Common Stock Purchase Warrant dated September 2, 2008 (3)4.8ServisFirst Bank 8.5% Subordinated Note due June 1, 2016 (6)4.9Warrant to Purchase Shares of Common Stock dated June 23, 2009 (6)4.10Amended and Restated Trust Agreement of ServisFirst Capital Trust II, dated March 15, 2010 (7)4.11Indenture, dated March 15, 2010, by and between ServisFirst Bancshares, Inc. and Wilmington Trust Company (7)4.12Preferred Securities Guaranty Agreement, dated March 15, 2010, by and between ServisFirst Bancshares, Inc. and Wilmington Trust Company (7)4.13Small Business Fund – Securities Purchase Agreement dated June 21, 2011 between the Secretary of the Treasury and ServisFirst Bancshares, Inc. (8)4.14Certificate of Designation of Senior Non-cumulative Perpetual Preferred Stock, Series A of ServisFirst Bancshares, Inc. (8)10.12005 Amended and Restated Stock Incentive Plan (1)*10.2Change in Control Agreement with William M. Foshee dated May 20, 2005 (1)*10.3Change in Control Agreement with Clarence C. Pouncey III dated June 6, 2006 (1)*10.4Employment Agreement of Andrew N. Kattos dated April 27, 2006 (1)*10.5Employment Agreement of G. Carlton Barker dated February 1, 2007 (1)*10.62009 Stock Incentive Plan (4)*11Statement Regarding Computation of Earnings Per Share is included herein at Note 21 to the Financial Statements in Item 8.14Code of Ethics for Principal Financial Officers (5) 21 List of Subsidiaries 23.123 Consent of KPMG LLP 23.2Consent of Mauldin & Jenkins 24 Power of Attorney 31.1 Certification of Chief Executive Officer pursuant to Rule 13a-14(a) 31.2 Certification of Chief Financial Officer pursuant to Rule 13a-14(a) 32.1 Certification of Chief Executive Officer pursuant to 18 U.S.C. Section 1350 32.2 Certification of Chief Financial Officer pursuant to 18 U.S.C. Section 1350 (1) Previously filed as an exhibit to ServisFirst Bancshares, Inc.’s Registration Statement on Form 10, as filed with the Securities and Exchange Commission onMarch 28, 2008, and incorporated herein by reference.(2) Previously filed as an exhibit to ServisFirst Bancshares, Inc.’s Current Report on Form 8-K datedSeptember 15, 2008, and incorporated herein by reference.(3) Previously filed as an exhibit to ServisFirst Bancshares, Inc.’s Current Report on Form 8-K dated September 2, 2008, and incorporated herein by reference.(4) Previously filed as Appendix A to ServisFirst Bancshares, Inc.’s definitive Proxy Statement on Schedule 14A relating to the 2009 Annual Meeting of Stockholders and incorporated herein by reference.(5) Previously filed as an exhibit to ServisFirst Bancshares, Inc.’s Annual Report on Form 10-K for the fiscal year ended December 31, 2008, and incorporated herein by reference.(6) Previously filed as an exhibit to ServisFirst Bancshares, Inc.’s Annual Report on Form 10-K for the fiscal year ended December 31, 2009, and incorporated herein by reference.(7) Previously filed as an exhibit to ServisFirst Bancshares, Inc.’s Current Report on Form 8-K dated March 15, 2010, and incorporated herein by reference.(8) Previously filed as an exhibit to ServisFirst Bancshares, Inc.’s current report on Form 8-K dated June 21, 2011, and incorporated herein by reference.* Management contract or compensatory plan arrangements.123101.INS XBRL Instance Document 101.SCH XBRL Schema Documents 101.CAL XBRL Calculation Linkbase Document 101.LAB XBRL Label Linkbase Document 101.PRE XBRL Presentation Linkbase Document 101.DEF XBRL Definition Linkbase Document