UNITED STATES
SECURITIES AND EXCHANGE COMMISSION
Washington, D.C. 20549

FORM 10-K
Amendment No. 1
(Mark One)
| ANNUAL REPORT PURSUANT TO SECTION 13 OR 15(d) OF THE SECURITIES EXCHANGE ACT OF 1934. |
For the Fiscal Year Ended December 31, 2011
2013
OR
| TRANSITION REPORT PURSUANT TO SECTION 13 OR 15(d) OF THE SECURITIES EXCHANGE ACT OF 1934. |
For the Transition Period from
___________
Commission File Number: 000-11486
CENTER BANCORP, INC.
(Exact Name of Registrant as Specified in Its Charter)
(State or Other Jurisdiction of Incorporation or Organization) | (IRS Employer Identification Number) |
2455 Morris Avenue, Union, NJ 07083-0007
(Address of Principal Executive Offices, Including Zip Code)
(908) 688-9500
(Registrant’s Telephone Number, Including Area Code)
Securities registered pursuant to Section 12(b) of the Exchange Act:
Common Stock, No Par Value
(Title of Class)
| Title of each class | Name of each exchange on which registered | |
| Common Stock, no par value | NASDAQ |
Securities registered pursuant to Section 12(g) of the Exchange Act:None
Indicate by checkmark if the registrant is a well-known seasoned issuer, as defined in Rule 405 of the Securities Act.YesAct. Yeso£ NoxS
Indicate by checkmark if the registrant is not required to file reports pursuant to Section 13 or 15(d) of the Act. Yeso£ NoxS
Indicate by check mark whether the registrant (1) has filed all reports required to be filed by Section 13 or 15 (d) of the Securities Exchange Act of 1934 during the preceding 12 months (or for such shorter period that the registrant was required to file such reports), and (2) has been subject to such filing requirements for the past 90 days. YesxS Noo£
Indicate by check mark whether the registrant has submitted electronically and posted on its corporate Web site, if any, every Interactive Data File required to be submitted and posted pursuant to Regulation S-T (232,405 of this chapter) during the preceding 12 months (or for such shorter period that the registrant has required to submit and post such files.) YesxS Noo£
Indicate by check mark if disclosure of delinquent filers pursuant to Item 405 of Regulation S-K is not contained herein, and will not be contained, to the best of Registrant’s knowledge, in definitive proxy or information statements incorporated by reference in Part III of the Form 10-K or any amendment to the Form 10-K.o£
Indicate by check mark whether the registrant is a large accelerated filer, an accelerated filer, a non-accelerated filer or a smaller reporting company. See definition of “large accelerated filer”, “accelerated filer” and “smaller reporting company” in Rule 12b-2 of the Securities Exchange Act of 1934.
| Large Accelerated Filer | Accelerated Filer | Non-Accelerated | Small Reporting Company |
Indicate by check mark whether the registrant is a shell company (as defined in Rule 12b-2 of the Act) Yeso£ or NoxS
The aggregate market value of the voting and non-voting common equity held by non-affiliates computed by reference to the price at which the common equity was last sold or the average bid and ask price of such common equity, as of the last business day of the registrant’s most recently completed second fiscal quarter, — $126.4 millionwas $149.9 million.
Shares Outstanding on March 1, 2012February 28, 2014
Common Stock, no par value: 16,332,32716,369,012 shares
DOCUMENTS INCORPORATED BY REFERENCE
Definitive proxy statement in connection with the 20122014 Annual Stockholders Meeting to be filed with the Commission pursuant to Regulation 14A will beis incorporated by reference in Part III.
| -2- |
CENTER BANCORP, INC.
TABLE OF CONTENTS
| |||||
| |||||
| |||||
| |||||
| |||||
| |||||
| |||||
| |||||
| |||||
| |||||
| |||||
| |||||
| |||||
| |||||
| |||||
| |||||
| |||||
| |||||
| |||||
| |||||
| |||||
Information included in or incorporated by reference in this Annual Report on Form 10-K, other filings with the Securities and Exchange Commission, the Corporation’s press releases or other public statements, contain or may contain forward looking statements. Please refer to a discussion of the Corporation’s forward looking statements and associated risks in “Item 1 — Business — Historical Development of Business” and “Item 1A — Risk Factors” in this Annual Report on Form 10-K.
i
CENTER BANCORP, INC.
FORM 10-K
PART I
Item 1. Business
Historical Development of Business
This report, in Item 1, Item 7 and elsewhere, includes forward-looking statements within the meaning of Sections 27A of the Securities Act of 1933, as amended, and 21E of the Securities Exchange Act of 1934, as amended, that involve inherent risks and uncertainties. This report contains certain forward-looking statements with respect to the financial condition, results of operations, plans, objectives, future performance and business of Center Bancorp, Inc. and its subsidiaries, including statements preceded by, followed by or that include words or phrases such as “believes,” “expects,” “anticipates,” “plans,” “trend,” “objective,” “continue,” “remain,” “pattern” or similar expressions or future or conditional verbs such as “will,” “would,” “should,” “could,” “might,” “can,” “may” or similar expressions. There are a number of important factors that could cause future results to differ materially from historical performance and these forward-looking statements. Factors that might cause such a difference include, but are not limited to: (1) competitive pressures among depository institutions may increase significantly; (2) changes in the interest rate environment may reduce interest margins; (3) prepayment speeds, loan origination and sale volumes, charge-offs and loan loss provisions may vary substantially from period to period; (4) general economic conditions may be less favorable than expected; (5) political developments, wars or other hostilities may disrupt or increase volatility in securities markets or other economic conditions; (6) legislative or regulatory changes or actions may adversely affect the businesses in which Center Bancorp, Inc. is engaged; (7) changes and trends in the securities markets may adversely impact Center Bancorp, Inc; (8) a delayed or incomplete resolution of regulatory issues could adversely impact our planning; (9) difficulties in integrating any businesses that we may acquire, which may increase our expenses and delay the achievement of any benefits that we may expect from such acquisitions; (10) the impact of reputation risk created by the developments discussed above on such matters as business generation and retention, funding and liquidity could be significant; and (11) the outcome of regulatory and legal investigations and proceedings may not be anticipated. Further information on other factors that could affect the financial results of Center Bancorp, Inc. are included in Item 1A of this Annual Report on Form 10-K and in Center Bancorp’s other filings with the Securities and Exchange Commission. These documents are available free of charge at the Commission’s website athttp://www.sec.gov and/or from Center Bancorp, Inc. Center Bancorp, Inc. assumes no obligation to update forward-looking statements at any time.EXPLANATORY NOTE
Center Bancorp, Inc., a one-bank holding company, was incorporated in the state of New Jersey on November 12, 1982. Upon the acquisition of all outstanding shares of capital stock of Union Center National Bank (the “Bank”), its principal subsidiary, Center Bancorp, Inc. commenced operations on May 1, 1983. The holding company’s sole activity, at this time, is to act as a holding company for the Bank and other subsidiaries. As used herein, the term “Corporation” shall refer to Center Bancorp, Inc. and its direct and indirect subsidiaries and the term “Parent Corporation” shall refer to Center Bancorp, Inc. on an unconsolidated basis.
Center Bancorp, Inc. owns 100 percent of the voting shares of Center Bancorp, Inc. Statutory Trust II, through which it issued trust preferred securities. The trust exists for the exclusive purpose of (i) issuing trust securities representing undivided beneficial interests in the assets of the trust; (ii) investing the gross proceeds of the trust securities in $5.2 million of junior subordinated deferrable interest debentures (subordinated debentures) of the Corporation; and (iii) engaging in only those activities necessary or incidental thereto. These subordinated debentures and the related income effects are not eliminated in the consolidated financial statements as the statutory business trust(the “Company”) is not consolidated in accordance with Financial Accounting Standards Board (“FASB”filing this Amendment No. 1 (the “Amendment”) FASB ASC 810-10 (previously FASB interpretation No. 46(R), “Consolidation of Variable Interest Entities.” Distributions on the subordinated debentures owned by the subsidiary trust have been classified as interest expense in the Consolidated Statements of Income. See Note 10 of the Consolidated Financial Statements.
Except as described above, the Corporation’s wholly-owned subsidiaries are all included in the consolidated financial statements of Center Bancorp, Inc. These subsidiaries include an advertising subsidiary; an insurance subsidiary offering annuity products, property and casualty, life and health insurance, and various investment subsidiaries which hold, maintain and manage investment assets for the Corporation.
On February 1, 2012, the Bank entered into a Bank Purchase and Assumption Agreement (the “Agreement”) with Saddle River Valley Bancorp and Saddle River Valley Bank (“SRVB”). Under the Agreement, at closing, the Bank will purchase SRVB’s branches, located in Saddle River, New Jersey and Oakland, New Jersey, as well as substantially all of SRVB’s assets and SRVB’s deposit base, for an all-cash purchase price equal to 90% of SRVB’s adjusted stockholders’ equity at closing. The purchase price is expected to be between $10 million and $11 million. The Agreement provides for standard representations and warranties, indemnities and covenants. Closing is subject to customary conditions, including receipt of regulatory approval and approval of the transaction by the stockholders of Saddle River Valley Bancorp. It is anticipated that the transaction will close during the second quarter of 2012. Center Bancorp expects the transaction to be immediately accretive to earnings, excluding restructuring expenses.
SEC Reports and Corporate Governance
The Parent Corporation makes its Annual Report on Form 10-K Quarterly Reports on Form 10-Q and Current Reports on Form 8-K and amendments thereto available on its website atwww.centerbancorp.com without charge as soon as reasonably practicable after filing or furnishing them to the SEC. Also available on the website are the Corporation’s corporate code of ethics that applies to all of the Corporation’s employees, including principal officers and directors, and charters for the Audit Committee, Compensation Committee and Nominating Committee.
The Parent Corporation has filed the certifications of the Chief Executive Officer and Chief Financial Officer required pursuant to Section 302 of the Sarbanes-Oxley Act of 2002 with respect to the Parent Corporation’s Annual Report on Form 10-K as exhibits to this Report. Center Bancorp’s CEO submitted the required annual CEO’s Certification regarding the NASDAQ’s corporate governance listing standards, Section 12(a) CEO Certification, to the NASDAQ within the required time frame after the 2011 annual shareholders’ meeting.
Additionally, the Parent Corporation will provide without charge, a copy of its Annual Report on Form 10-K to any shareholder by mail. Requests should be sent to Center Bancorp, Inc, Attention: Shareholder Relations, 2455 Morris Avenue, Union, New Jersey, 07083.
Narrative Description of the Business
The Bank offers a broad range of lending, depository and related financial services to commercial, industrial and governmental customers. The Bank has full trust powers, enabling it to offer a variety of trust services to its customers. In the lending area, the Bank’s services include short and medium term loans, lines of credit, letters of credit, working capital loans, real estate construction loans and mortgage loans. In the depository area, the Bank offers demand deposits, savings accounts and time deposits. In addition, the Bank offers collection services, wire transfers, night depository and lock box services.
The Bank offers a broad range of consumer banking services, including interest bearing and non-interest bearing checking accounts, savings accounts, money market accounts, certificates of deposit, IRA accounts, Automated Teller Machine (“ATM”) accessibility using Star Systems, Inc. service, secured and unsecured loans, mortgage loans, home equity lines of credit, safe deposit boxes, Christmas club accounts, vacation club accounts, money orders and travelers’ checks.
The Bank, through its subsidiary, Center Financial Group LLC, provides financial services, including brokerage services, insurance and annuities, mutual funds and financial planning.
The Bank offers various money market services. It deals in U.S. Treasury and U.S. Governmental agency securities, certificates of deposit, commercial paper and repurchase agreements.
The Bank entered into a limited liability company operating agreement with Morris Property Company, LLC, a New Jersey limited liability company, during the fourth quarter of 2008. The purpose of Morris Property Company, LLC is to hold foreclosed assets.
On August 20, 2010, the Bank formed UCNB 1031 Exchange, LLC, for the purpose of providing customers 1031 exchange services. In August of 2011, the Bank liquidated this business.
Competitive pressures affect the Corporation’s manner of conducting business. Competition stems not only from other commercial banks but also from other financial institutions such as savings banks, savings and loan associations, mortgage companies, leasing companies and various other financial service and advisory companies. Many of the financial institutions operating in the Corporation’s primary market are substantially larger and offer a wider variety of products and services than the Corporation.
Supervision and Regulation
The banking industry is highly regulated. Statutory and regulatory controls increase a bank holding company’s cost of doing business and limit the options of its management to deploy assets and maximize income. The following discussion is not intended to be a complete list of all the activities regulated by the banking laws or of the impact of such laws and regulations on the Corporation or its Bank subsidiary. It is intended only to briefly summarize some material provisions.
Bank Holding Company Regulation
Center Bancorp, Inc. is a bank holding company within the meaning of the Bank Holding Company Act of 1956 (the “Holding Company Act”). As a bank holding company, the Parent Corporation is supervised by the Board of Governors of the Federal Reserve System (“FRB”) and is required to file reports with the FRB and provide such additional information as the FRB may require. The Parent Corporation and it subsidiaries are subject to examination by the FRB.
The Holding Company Act prohibits the Corporation, with certain exceptions, from acquiring direct or indirect ownership or control of more than five percent of the voting shares of any company which is not a bank and from engaging in any business other than that of banking, managing and controlling banks or furnishing services to subsidiary banks, except that it may, upon application, engage in, and may own shares of companies engaged in, certain businesses found by the FRB to be so closely related to banking “as to be a proper incident thereto.” The Holding Company Act requires prior approval by the FRB of the acquisition by Center Bancorp, Inc. of more than five percent of the voting stock of any other bank. Satisfactory capital ratios and Community Reinvestment Act ratings and anti-money laundering policies are generally prerequisites to obtaining federal regulatory approval to make acquisitions. The policy of the FRB provides that a bank holding company is expected to act as a source of financial strength to its subsidiary bank and to commit resources to support the subsidiary bank in circumstances in which it might not do so absent that policy.
Acquisitions through Union Center National Bank require approval of the Office of the Comptroller of the Currency of the United States (“OCC”). The Holding Company Act does not place territorial restrictions on the activities of non-bank subsidiaries of bank holding companies. The Gramm-Leach-Bliley Act, discussed below, allows the Corporation to expand into insurance, securities, merchant banking activities, and other activities that are financial in nature.
The Riegle-Neal Interstate Banking and Branching Efficiency Act of 1994 (“Interstate Banking and Branching Act”) enables bank holding companies to acquire banks in states other than their home state, regardless of applicable state law. The Interstate Banking and Branching Act also authorizes banks to merge across state lines, thereby creating interstate banks with branches in more than one state. Under the legislation, each state had the opportunity to “opt-out” of this provision. Furthermore, a state may “opt-in” with respect tode novo branching, thereby permitting a bank to open new branches in a state in which the bank does not already have a branch. Withoutde novo branching, an out-of-state commercial bank can enter the state only by acquiring an existing bank or branch. The vast majority of states have allowed interstate banking by merger but have not authorizedde novo branching.
New Jersey enacted legislation to authorize interstate banking and branching and the entry into New Jersey of foreign country banks. New Jersey did not authorizede novo branching into the state. However, under federal law, federal savings banks which meet certain conditions may branchde novo into a state, regardless of state law. The Dodd-Frank Wall Street Reform and Consumer Protection Act (the “Dodd-Frank Act”, described in more detail below) removes the restrictions on interstate branching contained in the Interstate Banking and Branching Act, and allows national banks and state banks to establish branches
in any state if, under the laws of the state in which the branch is to be located, a state bank chartered by that state would be permitted to establish the branch.
Regulation of Bank Subsidiary
The operations of the Bank are subject to requirements and restrictions under federal law, including requirements to maintain reserves against deposits, restrictions on the types and amounts of loans that may be granted, and limitations on the types of investments that may be made and the types of services which may be offered. Various consumer laws and regulations also affect the operations of the Bank. Approval of the Comptroller of the Currency is required for branching, bank mergers in which the continuing bank is a national bank and in connection with certain fundamental corporate changes affecting the Bank. There are various legal limitations, including Sections 23A and 23B of the Federal Reserve Act, which govern the extent to which a bank subsidiary may finance or otherwise supply funds to its holding company or its holding company’s non-bank subsidiaries. Under federal law, no bank subsidiary may, subject to certain limited exceptions, make loans or extensions of credit to, or investments in the securities of, its parent or the non-bank subsidiaries of its parent (other than direct subsidiaries of such bank which are not financial subsidiaries) or take their securities as collateral for loans to any borrower. Each bank subsidiary is also subject to collateral security requirements for any loans or extensions of credit permitted by such exceptions.
The Dodd-Frank Act
The Dodd-Frank Act, adopted in 2010, is expected to have a broad impact on the financial services industry, as a result of the significant regulatory and compliance changes made by the Dodd-Frank Act, including, among other things, (i) enhanced resolution authority over troubled and failing banks and their holding companies; (ii) increased capital and liquidity requirements; (iii) increased regulatory examination fees; (iv) changes to assessments to be paid to the FDIC for federal deposit insurance; and (v) numerous other provisions designed to improve supervision and oversight of, and strengthening safety and soundness for, the financial services sector. Additionally, the Dodd-Frank Act establishes a new framework for systemic risk oversight within the financial system to be distributed among new and existing federal regulatory agencies, including the Financial Stability Oversight Council, the Federal Reserve, the OCC and the FDIC. A summary of certain provisions of the Dodd-Frank Act is set forth below:
Together, the Dodd-Frank Act and the recent guidance on compensation may impact the Corporation’s compensation practices.
Although a significant number of the rules and regulations mandated by the Dodd-Frank Act have been finalized, many of the new requirements called for have yet to be implemented and will likely be subject to implementing regulations over the course of several years. Given the uncertainty associated with the manner in which the provisions of the Dodd-Frank Act will be implemented by the various regulatory agencies, the full extent of the impact such requirements will have on financial institutions’ operations is unclear. The changes resulting from the Dodd-Frank Act may impact the profitability of our business activities, require changes to certain of our business practices, impose upon us more stringent capital, liquidity and leverage ratio requirements or otherwise adversely affect our business. These changes may also require us to invest significant management attention and resources to evaluate and make necessary changes in order to comply with new statutory and regulatory requirements.
Regulation W
Regulation W codifies prior regulations under Sections 23A and 23B of the Federal Reserve Act and interpretative guidance with respect to affiliate transactions. Regulation W incorporates the exemption from the affiliate transaction rules but expands the exemption to cover the purchase of any type of loan or extension of credit from an affiliate. Affiliates of a bank include, among other entities, the bank’s holding company and companies that are under common control with the bank. The Parent Corporation is considered to be an affiliate of the Bank. In general, subject to certain specified exemptions, a bank or its subsidiaries are limited in their ability to engage in “covered transactions” with affiliates:
In addition, a bank and its subsidiaries may engage in covered transactions and other specified transactions only on terms and under circumstances that are substantially the same, or at least as favorable to the bank or its subsidiary, as those prevailing at the time for comparable transactions with nonaffiliated companies. A “covered transaction” includes:
Further, under regulation W:
Regulation W generally excludes all non-bank and non-savings association subsidiaries of banks from treatment as affiliates, except to the extent that the Federal Reserve Board decides to treat these subsidiaries as affiliates.
Capital Adequacy Guidelines
The Federal Reserve Board has adopted risk-based capital guidelines. These guidelines establish minimum levels of capital and require capital adequacy to be measured in part upon the degree of risk associated with certain assets. Under these guidelines all banks and bank holding companies must have a core or Tier 1 capital to risk-weighted assets ratio of at least 4% and a total capital to risk-weighted assets ratio of at least 8%. Atfiscal year end December 31, 2011, the Corporation’s Tier 1 capital to risk-weighted assets ratio and total capital to risk-weighted assets ratio were 12.00 percent and 12.89 percent, respectively.
In addition, the Federal Reserve Board and the FDIC have approved leverage ratio guidelines (Tier 1 capital to average quarterly assets, less goodwill) for bank holding companies such2013, as the Parent Corporation. These guidelines provide for a minimum leverage ratio of 3% for bank holding companies that meet certain specified criteria, including that they have the highest regulatory rating. All other holding companies are required to maintain a leverage ratio of 3% plus an additional cushion of at least 100 to 200 basis points. The Parent Corporation’s leverage ratio was 9.29 percent at December 31, 2011.
The OCC has established higher minimum capital ratios for the Bank effective as of December 31, 2009. See “FDICIA”.
Under FDICIA, federal banking agencies have established certain additional minimum levels of capital. See “FDICIA”.
FDICIA
Pursuant to the Federal Deposit Insurance Corporation Improvement Act of 1991 (“FDICIA”), each federal banking agency has promulgated regulations, specifying the levels at which a financial institution would be considered “well capitalized,” “adequately capitalized,” “undercapitalized,” “significantly undercapitalized,” or “critically undercapitalized,” and to take certain mandatory and discretionary supervisory actions based on the capital level of the institution. To qualify to engage in financial activities under the Gramm-Leach-Bliley Act, all depository institutions must be “well capitalized.”
The OCC’s regulations implementing these provisions of FDICIA provide that an institution will be classified as “well capitalized” if it (i) has a total risk-based capital ratio of at least 10.0 percent, (ii) has a Tier 1 risk-based capital ratio of at least 6.0 percent, (iii) has a Tier 1 leverage ratio of at least 5.0 percent, and (iv) meets certain other requirements. An institution will be classified as “adequately capitalized” if it (i) has a total risk-based capital ratio of at least 8.0 percent, (ii) has a Tier 1 risk-based capital ratio of at least 4.0 percent, (iii) has a Tier 1 leverage ratio of (a) at least 4.0 percent or (b) at least 3.0 percent if the institution was rated 1 in its most recent examination, and (iv) does not meet the definition of “well capitalized.” An institution will be classified as “undercapitalized” if it (i) has a total risk-based capital ratio of less than 8.0 percent, (ii) has a 1 risk-based capital ratio of less than 4.0 percent, or (iii) has a Tier 1 leverage ratio of (a) less than 4.0 percent or (b) less than 3.0 percent if the institution was rated 1 in its most recent examination. An institution will be classified as “significantly undercapitalized” if it (i) has a total risk-based capital ratio of less than 6.0 percent, (ii) has a Tier 1 risk-based capital ratio of less than 3.0 percent, or (iii) has a Tier 1 leverage ratio of less than 3.0 percent. An institution will be classified as “critically undercapitalized” if it has a tangible equity to total assets ratio that is equal to or less than 2.0 percent. An insured depository institution may be deemed to be in a lower capitalization category if it receives an unsatisfactory examination rating.
The OCC has established higher minimum capital ratios for the Bank effective as of December 31, 2009: Tier 1 Risk-Based Capital of 10.0 percent, Total Risk-Based Capital of 12.0 percent and Tier 1 Leverage Capital of 8.0 percent. At December 31, 2011, the Bank’s capital ratios were all above the minimum levels required.
In addition, significant provisions of FDICIA required federal banking regulators to impose standards in a number of other important areas to assure bank safety and soundness, including internal controls, information systems and internal audit systems, credit underwriting, asset growth, compensation, loan documentation and interest rate exposure.
Additional Regulation of Capital
The federal regulatory authorities’ risk-based capital guidelines are based upon the 1988 capital accord (“Basel I”) of the Basel Committee on Banking Supervision (the “Basel Committee”). The Basel Committee is a committee of central banks and bank supervisors/regulators from the major industrialized countries that develops broad policy guidelines for use by each country’s supervisors in determining the supervisory policies and regulations to which they apply. Actions of the Committee have no direct effect on banks in participating countries. In 2004, the Basel Committee published a new capital accord (“Basel II”) to replace Basel I. Basel II provides two approaches for setting capital standards for credit risk — an internal ratings-based approach tailored to individual institutions’ circumstances and a standardized approach that bases risk weightings on external credit assessments to a much greater extent than permitted in existing risk-based capital guidelines. Basel II also would set capital requirements for operational risk and refine the existing capital requirements for market risk exposures. The Corporation is not required to comply with the advanced approaches of Basel II.
In 2009, the United States Treasury Department issued a policy statement (the “Treasury Policy Statement”) entitled “Principles for Reforming the U.S. and International Regulatory Capital Framework for Banking Firms,” which contemplates changes to the existing regulatory capital regime involving substantial revisions to major parts of the Basel I and Basel II capital frameworks and affecting all regulated banking organizations. The Treasury Policy Statement calls for, among other things, higher and stronger capital requirements for all banking firms, with changes to the regulatory capital framework to be phased in over a period of several years.
On December 17, 2009, the Basel Committee issued a set of proposals (the “2009 Capital Proposals”) that would significantly revise the definitions of Tier 1 capital and Tier 2 capital. Among other things, the 2009 Capital Proposals would re-emphasize that common equity is the predominant component of Tier 1 capital. Concurrently with the release of the 2009 Capital Proposals, the Basel Committee also released a set of proposals related to liquidity risk exposure (the “2009 Liquidity Proposals”). The 2009 Liquidity Proposals include the implementation of (i) a “liquidity coverage ratio” or LCR, designed to ensure that a bank maintains an adequate level of unencumbered, high-quality assets sufficient to meet the bank’s liquidity needs over a 30-day time horizon under an acute liquidity stress scenario and (ii) a “net stable funding ratio” or NSFR, designed to promote more medium and long-term funding of the assets and activities of banks over a one-year time horizon.
The Dodd-Frank Act includes certain provisions, often referred to as the “Collins Amendment,” concerning the capital requirements of the United States banking regulators. These provisions are intended to subject bank holding companies to the same capital requirements as their bank subsidiaries and to eliminate or significantly reduce the use of hybrid capital instruments, especially trust preferred securities, as regulatory capital. Under the Collins Amendment, trust preferred securities issued by a company, such as Union Center National Bank, with total consolidated assets of less than $15 billion before May 19, 2010 are treated as regulatory capital, but any such securities issued later are not eligible as regulatory capital. The banking regulators must develop regulations setting minimum risk-based and leverage capital requirements for holding companies and banks on a consolidated basis that are no less stringent than the generally applicable requirements in effect for depository institutions under the prompt corrective action regulations. The banking regulators also must seek to make capital standards countercyclical so that the required levels of capital increase in times of economic expansion and decrease in times of economic contraction.
On December 20, 2011, the Federal Reserve issued a proposed rule designed to implement provisions of the Dodd-Frank Act to establish stricter prudential standards for all bank holding companies with total consolidated assets of $50 billion or more for certain nonbank financial firms. The proposed rule requires firms to develop annual capital plans, conduct stress tests, and maintain adequate capital, including a tier one common risk-based capital ratio greater than 5 percent, under both expected and stressed conditions.
In December 2010 and January 2011, the Basel Committee published the final texts of reforms on capital and liquidity generally referred to as “Basel III.” Although Basel III is intended to be implemented by participating countries for large, internationally active banks, its provisions are likely to be considered by
United States banking regulators in developing new regulations applicable to other banks in the United States, including Union Center National Bank.
For banks in the United States, among the most significant provisions of Basel III concerning capital are the following:
Federal Deposit Insurance and Premiums
Substantially all of the deposits of the Bank are insured up to applicable limits by the Deposit Insurance Fund (“DIF”) of the FDIC and are subject to deposit insurance assessments to maintain the DIF. As a result of the Dodd-Frank Act, the basic federal deposit insurance limit was permanently increased from at least $100,000 to at least $250,000. In addition, on November 9, 2010 and January 18, 2011, the FDIC (as mandated by Section 343 of the Dodd-Frank Act) adopted rules providing for unlimited deposit insurance for traditional noninterest-bearing transaction accounts and IOLTA accounts beginning December 31, 2010 until December 31, 2012. This coverage, which applies to all insured deposit institutions, does not charge any additional FDIC assessment to the institution. Furthermore, this unlimited coverage is separate from, and in addition to, the coverage provided to depositors with respect to other accounts held at an insured institution.
On May 22, 2009, the Board of Directors of the FDIC adopted a final rule imposing a special assessment on the entire banking industry. The special assessment was calculated as five basis points times each insured depository institution’s assets minus Tier I capital, as reported in the report of condition as of June 30, 2009 and would not exceed ten times the institution’s assessment base for the second quarter of 2009 risk- based assessment. This special assessment, which totaled $1.2 million, was remitted by the Bank on September 30, 2009.
On November 12, 2009, the FDIC adopted the final rule which required insured depository institutions to prepay their quarterly risk-based assessments for the fourth quarter of 2009 through the fourth quarter of 2012. On December 30, 2009, the Bank remitted an FDIC prepayment in the amount of $5.7 million. An institution’s prepaid assessment was based on the total base assessment rate that the institution paid for the third quarter of 2009, adjusted quarterly by an estimated annual growth rate of 5% through the end of 2012, plus, for 2011 and 2012, an increase in the total base assessment rate on September 30, 2009 by an annualized three basis points. Any prepaid assessment in excess of the amounts that are subsequently determined to be
actually due to the FDIC by June 30, 2013, will be returned to the institution at that time. As of December 31, 2011 the Bank recognized a total of $3.8 million in FDIC expense of the $5.7 million assessments prepaid on December 30, 2009.
On February 7, 2011, the FDIC approved a rule to change the assessment base from adjusted domestic deposits to average consolidated total assets minus average tangible equity, as required by the Dodd-Frank Act. These new assessment rates began in the second quarter of 2011 and were paid at the end of September 2011. Since the new base is larger than the current base, the FDIC’s rule lowers total base assessment rates to between 5 and 9 basis points for banks in the lowest risk category, and 35 basis points for banks in the highest risk category. The Company paid $1.7 million in 2011, as compared to $2.1 million in 2010.
Pursuant to the Dodd-Frank Act, the FDIC has established 2.0% as the designated reserve ratio (DRR), that is, the ratio of the DIF to insured deposits. The FDIC has adopted a plan under which it will meet the statutory minimum DRR of 1.35% by September 30, 2020, the deadline imposed by the Dodd-Frank Act. The Dodd-Frank requires the FDIC to offset the effect on institutions with assets less than $10 billion of the increase in the statutory minimum DRR to 1.35% from the former statutory minimum of 1.15%. The FDIC has not yet announced how it will implement this offset.
In addition to deposit insurance assessments, the FDIC is required to continue to collect from institutions payments for the servicing of obligations of the Financing Corporation (“FICO”) that were issued in connection with the resolution of savings and loan associations, so long as such obligations remain outstanding. The Bank paid a FICO premium of $84,000 in 2011 and expects to pay a similar premium in 2012.
The Gramm-Leach-Bliley Financial Modernization Act of 1999
The Gramm-Leach-Bliley Financial Modernization Act of 1999:
The Modernization Act also modified other financial laws, including laws related to financial privacy and community reinvestment.
Community Reinvestment Act
Under the Community Reinvestment Act (“CRA”), as implemented by OCC regulations, a national bank has a continuing and affirmative obligation consistent with its safe and sound operation to help meet the credit needs of its entire community, including low and moderate income neighborhoods. The CRA does not establish specific lending requirements or programs for financial institutions nor does it limit an institution’s discretion to develop the types of products and services that it believes are best suited to its particular community, consistent with the CRA. The CRA requires the OCC, in connection with its examination of a national bank, to assess the bank’s record of meeting the credit needs of its community and to take such record into account in its evaluation of certain applications by such bank.
USA PATRIOT Act
The Uniting and Strengthening America by Providing Appropriate Tools Required to Intercept and Obstruct Terrorism Act of 2001 (the “USA PATRIOT Act”) gives the federal government powers to address terrorist threats through domestic security measures, surveillance powers, information sharing, and anti-money laundering requirements. By way of amendments to the Bank Secrecy Act, the USA PATRIOT Act encourages information-sharing among bank regulatory agencies and law enforcement bodies. Further, certain provisions of the USA PATRIOT Act impose affirmative obligations on a broad range of financial institutions, including banks, thrift institutions, brokers, dealers, credit unions, money transfer agents and parties registered under the Commodity Exchange Act.
Among other requirements, the USA PATRIOT Act imposes the following requirements with respect to financial institutions:
The United States Treasury Department has issued a number of implementing regulations which address various requirements of the USA PATRIOT Act and are applicable to financial institutions such as the Bank. These regulations impose obligations on financial institutions to maintain appropriate policies, procedures and controls to detect, prevent and report money laundering and terrorist financing and to verify the identity of their customers.
Sarbanes-Oxley Act of 2002
The stated goals of the Sarbanes-Oxley Act of 2002 (the “SOA”) were to increase corporate responsibility, to provide for enhanced penalties for accounting and auditing improprieties by publicly traded companies and to protect investors by improving the accuracy and reliability of corporate disclosures pursuant to the securities laws. The SOA generally applies to all companies, both U.S. and non-U.S., that file or are required to file periodic reportsfiled with the Securities and Exchange Commission (the “SEC”) underon March 5, 2014 (the “Original Filing”), for the Securities Exchange Actsole purpose of 1934re-filing the Report of Independent Registered Public Accounting Firm of ParenteBeard LLC (the “Exchange Act”). The SOA includes specific disclosure requirements and corporate governance rules, requires the SEC and securities exchanges to adopt extensive additional disclosure, corporate governance and other related rules and mandates further studies of certain issues by the SEC
TARP and SBLF
In January 2009, the Parent Corporation issued $10.0 million of its nonvoting non-convertible senior preferred stock (the “TARP Preferred Stock”) to the United States Treasury pursuant to Congress’ Troubled Asset Relief Program (“TARP”).
On September 15, 2011, the Parent Corporation entered into and consummated the transactions contemplated by a Securities Purchase Agreement (the “Securities Purchase Agreement”“Report”) with the Secretarycorrect date on such Report. The Report was inadvertently dated March 5, 2014 in the Original Filing, and it should have been dated March 13, 2013.
No amendments are being made to the Original Filing except as set forth above. This Amendment does not reflect events occurring after the filing of the Treasury (the “Secretary”) underOriginal Filing or modify or update the Small Business Lending Fund program (the “SBLF Program”), a $30 billion fund established under the Small Business Jobs Act of 2010 that is designed to encourage lending to small businesses by providing capital to qualified community banks with assets of less than $10 billion. Under the Securities Purchase Agreement, the Parent Corporation issued to the Secretary a total of 11,250 shares of the Parent Corporation’s Senior Non-Cumulative Perpetual Preferred Stock, Series B (the “SBLF Preferred Stock”), having a liquidation value of $1,000 per share, for a total purchase price of $11,250,000. The SBLF Preferred Stock was issued pursuant to a Certificate of Amendment to the Parent Corporation’s Certificate of Incorporation (the “Certificate of Amendment”) filed on September 13, 2011.
The SBLF Preferred Stock qualifies as Tier 1 capital. Non-cumulative dividends are payable quarterly on January 1, April 1, July 1 and October 1 for the SBLF Preferred Stock, commencing on January 1, 2012. The dividend rate is calculated as a percentage of the aggregate liquidation value of the outstanding SBLF Preferred Stock and is based on changesdisclosures contained in the level of “Qualified Small Business Lending” or “QSBL” (as definedOriginal Filing in the Certificate of Amendment) by the Bank, compared to the Bank’s baseline QSBL level. Based upon the Bank’s initial level of QSBL compared to the baseline, as calculated under the Securities Purchase Agreement, the dividend rate on the SBLF Preferred Stock was set at five percent for the initial dividend period.
For the second through tenth calendar quarters after the closing of the SBLF Program transaction, the dividend rate will fluctuate between one percent and five percent to reflect the amount of change in the Bank’s level of QSBL compared to the initial baseline. More specifically, if the Bank’s QSBL at the end of a quarter has increased as compared to the baseline, then the dividend rate payable on the SBLF Preferred Stock would change as follows:
From the eleventh through the eighteenth calendar quarters and that portion of the nineteenth calendar quarter which ends immediately prior to the date that is the four and one half years anniversary of the closing of the SBLF Program transaction, the dividend rate on the SBLF Preferred Stock will be fixed at between one percent and seven percent based on the level of QSBL at that time, as compared to the baseline in accordance with the chart below. If any SBLF Preferred Stock remains outstanding after four and one half years following the closing of the SBLF Program transaction, the dividend rate will increase to nine percent.
The SBLF Preferred Stock is non-voting, except in limited circumstances that could impact the SBLF investment, such as (i) authorization of senior stock, (ii) charter amendments adversely affecting the SBLF Preferred Stock and (iii) extraordinary transactions such as mergers, asset sales, share exchanges and the like (unless the SBLF Preferred Stock remains outstanding and the rights and preferences thereof are not impaired by such transaction).
In the event the Company misses five dividend payments, whether or not consecutive, the holder of the SBLF Preferred Stock will have the right, but not the obligation, to appoint a representative as an “observer” on the Company’s Board of Directors.
Further, the SBLF Preferred Stock may be redeemed by the Company at any time, at a redemption price of 100% of the liquidation amount plus accrued but unpaid dividends for the then current Dividend Period (as defined in the Certificate of Amendment) (plus, the CPP Lending Incentive Fees (as defined in the Certificate of Amendment), if applicable), subject to the approval of the Company’s federal banking regulator.
The SBLF Preferred Stock is not subject to any contractual restrictions on transfer and thus the Secretary may sell, transfer, exchange or enter into other transactions with respect to the SBLF Preferred Stock without the Company’s consent.
The Parent Corporation used the proceeds from the issuance of the SBLF Preferred to redeem from the Treasury all shares issued by the Parent Corporation pursuant to TARP, for a redemption price of $10,041,667, including accrued but unpaid dividends up to the date of redemption. As a result of the redemption of the TARP Preferred Stock, the Company is no longer subject to the limits on executive compensation and other restrictions stipulated under the TARP Capital Purchase Program. For an additional $245,000, the Parent Corporation also bought back the warrants issued under TARP
Proposed Legislation
From time to time proposals are made in the U.S. Congress and before various bank regulatory authorities, which would alter the policies of and place restrictions on different types of banking operations. It is impossible to predict the impact, if any, of potential legislative trends on the business of the Parent Corporation and the Bank.
Loans to Related Parties
The Corporation’s authority to extend credit to its directors and executive officers, as well as to entities controlled by such persons, is currently governed by the requirements of the National Bank Act, the Sarbanes-Oxley Act of 2002 and Regulation O of the Federal Reserve Bank. Among other things, these provisions require that extensions of credit to insiders (i) be made on terms that are substantially the same as, and follow credit underwriting procedures that are not less stringent than, those prevailing for comparable transactions with unaffiliated persons and that do not involve more than the normal risk of repayment or present other unfavorable features and (ii) not exceed certain limitations on the amount of credit extended to such persons, individually and in the aggregate, which limits are based, in part, on the amount of the Corporation’s capital. In addition, the Corporation’s Board of Directors must approve extensions of credit in excess of certain limits. Under the SOA, the Corporation and its subsidiaries,way other than Union Center National Bank, may not extend or arrange for any personal loans to its directors and executive officers.
Dividend Restrictions
The Parent Corporation is a legal entity separate and distinct from the Bank. Virtually all of the revenue of the Parent Corporation available for payment of dividends on its capital stock will result from amounts paid to the Parent Corporation by the Bank. All such dividends are subject to various limitations imposed by federal laws and by regulations and policies adopted by federal regulatory agencies. As a national bank, the Bank may not pay a dividend if it would impair the capital of the Bank. Furthermore, prior approval by the Comptroller of the Currency is required if the total of dividends declared in a calendar year exceeds the total of the Bank’s net profits for that year combined with the retained profits for the two preceding years.
On September 15, 2011, the Parent Corporation issued $11.25 million in nonvoting senior preferred stock to the Treasury under the SBLF Program. Under the Securities Purchase Agreement, the Parent Corporation issued to the Treasury a total of 11,250 shares of the Corporation’s Senior Non-Cumulative Perpetual Preferred Stock, Series B, having a liquidation value of $1,000 per share. Simultaneously, using the proceeds from the issuance of the SBLF Preferred Stock, the Parent Corporation redeemed from the Treasury, all 10,000 outstanding shares of its Fixed Rate Cumulative Perpetual Preferred Stock, Series A, liquidation amount $1,000 per share, for a redemption price of $10,041,667, including accrued but unpaid dividends up to the date of redemption.
The terms of the SBLF Preferred Stock impose limits on the Parent Corporation’s ability to pay dividends on and repurchase shares of its common stock and other securities. More specifically, if the Parent Corporation fails to declare and pay dividends on the SBLF Preferred Stock in a given quarter, then during such quarter and for the next three quarters following such missed dividend payment, the Parent Corporation may not pay dividends on, or repurchase, any common stock or any other securities that are junior to (or in parity with) the SBLF Preferred Stock, except in very limited circumstances.
Also under the terms of the SBLF Preferred Stock, the Parent Corporation may declare and pay dividends on its common stock or any other stock junior to the SBLF Preferred Stock, or repurchase shares of any such stock, only if after payment of such dividends or repurchase of such shares, the Parent Corporation’s Tier 1 Capital would be at least equal to the so-called Tier 1 Dividend Threshold, excluding any subsequent net charge-offs and any redemption of the SBLF Preferred Stock.
If, in the opinion of the OCC, a bank under its jurisdiction is engaged in or is about to engage in an unsafe or unsound practice (which could include the payment of dividends), the OCC may require, after notice and hearing, that such bank cease and desist from such practice or, as a result of an unrelated practice, require the bank to limit dividends in the future. The FRB has similar authority with respect to bank holding companies. In addition, the FRB and the OCC have issued policy statements which provide that insured banks and bank holding companies should generally only pay dividends out of current operating earnings. Regulatory pressures to reclassify and charge off loans and to establish additional loan loss reserves can have the effect of reducing current operating earnings and thus impacting an institution’s ability to pay dividends. Further, as described herein, the regulatory authorities have established guidelines with respect to the maintenance of appropriate levels of capital by a bank or bank holding company under their jurisdiction. Compliance with the standards set forth in these policy statements and guidelines could limit the amount of dividends which the Parent Corporation and the Bank may pay. Under FDICIA, banking institutions which are deemed to be “undercapitalized” will, in most instances, be prohibited from paying dividends.
Lending Guidelines; Real Estate Credit Management
Credit risks are an inherent part of the lending function. The Corporation has set in place specific policies and guidelines to limit credit risks. The following describes the Corporation’s credit management policy and identifies certain risk elements in its earning assets portfolio.
Credit Management
The maintenance of comprehensive and effective credit policies is a paramount objective of the Corporation. Credit procedures are enforced by the department heads of the different lending units and are maintained at the senior administrative level as well as through internal control procedures.
Prior to extending credit, the Corporation’s credit policy generally requires a review of the borrower’s credit history, repayment capacity, collateral and purpose of each loan. Requests for most commercial and consumer loans are to be accompanied by financial statements and other relevant financial data for evaluation. After the granting of a loan or lending commitment, this financial data is typically updated and evaluated by the credit staff on a periodic basis for the purpose of identifying potential problems. Construction financing requires a periodic submission by the borrowers of sales/leasing status reports regarding their projects, as well as, in most cases, inspections of the project sites by independent engineering firms and/or independent consultants. Advances are normally made only upon the satisfactory completion of periodic phases of construction.
Certain lending authorities are granted to loan officers based upon each officer’s position and experience. However, large dollar loans and lending lines are reported to and are subject to the approval of the Bank’s loan committees and/or board of directors. Either the Chairman of the Board or President chairs the loan committees.
The Corporation has established its own internal loan-to-value (“LTV”) limits for real estate loans. In general, except as described below, these internal limits are not permitted to exceed the following supervisory limits:
It may be appropriate in individual cases to originate loans with loan-to-value ratios in excess of the supervisory LTV limits, based on support provided by other credit factors. The President of the Bank must approve such non-conforming loans. The Bank must identify all non-conforming loans and their aggregate amount must be reported at least quarterly to the Directors’ Loan Committee. Non-conforming loans should not exceed 100% of capital, or 30% with respect to non one to four family residential loans. At present, management is unaware of any exceptions to supervisory LTV limits.
Collateral margin guidelines are based on cost, market or other appraised value to maintain a reasonable amount of collateral protection in relation to the inherent risk in the loan. This does not mitigate the fundamental analysis of cash flow from the conversion of assets in the normal course of business or from operations to repay the loan. It is merely designed to provide a cushion to minimize the risk of loss if the ultimate collection of the loan becomes dependent on the liquidation of security pledged.
The Corporation also seeks to minimize lending risk through loan diversification. The composition of the Corporation’s commercial loan portfolio reflects and is highly dependent upon the economy and industrial make-up of the region it serves. Effective loan diversification spreads risk to many different industries, thereby reducing the impact of downturns in any specific industry on overall loan profitability.
Credit quality is monitored through an internal review process, which includes a credit Risk Grading System that facilitates the early detection of problem loans. Under this grading system, all commercial loans and commercial mortgage loans are graded in accordance with the risk characteristics inherent in each loan. Problem loans include non-accrual loans, and loans which conform to the regulatory definitions of criticized and classified loans.
A Problem Asset Report is prepared monthly and is examined by the senior management of the Bank, the Corporation’s Loan and Discount Committee and the Board of Directors. This review is designed to enable management to take such actions as are considered necessary to identify and remedy problems on a timely basis.
The Bank’s internal loan review process is complemented by an independent loan review conducted throughout the year, under the mandate and approval of the Corporation’s Board of Directors. In addition, regularly scheduled audits performed by the Bank’s internal audit function are designed to ensure the integrity of the credit and risk monitoring systems currently in place.
Risk Elements
The risk elements identified by the Corporation include non-performing loans, loans past due ninety days or more as to interest or principal payments but not placed on a non-accrual status, potential problem loans, other real estate owned, net, and other non-performing interest-earning assets. Additional information regarding these risk elements is presented in Item 7 of this Annual Report.
Item 1A. Risk Factors
An investment in our common stock involves risks. Stockholders should carefully consider the risks described below, together with all other information contained in this Annual Report on Form 10-K, before making any purchase or sale decisions regarding our common stock. If any of the following risks actually occur, our business, financial condition or operating results may be harmed. In that case, the trading price of our common stock may decline, and stockholders may lose part or all of their investment in our common stock.
We are subject to stringent capital requirements which could require us to seek capital at times when capital may be expensive or unavailable to us.
We may at some point be required to raise additional capital to assure compliance with mandated capital ratios and to support our continued growth. Our ability to raise additional capital, if needed, will depend on conditions in the capital markets at that time, which are outside our control, and on our financial performance. Accordingly, we cannot assure you of our ability to raise additional capital, if needed, on terms acceptable to us. If we cannot raise additional capital when needed, our ability to comply with applicable capital requirements and to further expand our operations through internal growth or acquisitions could be materially impaired.
Negative developments in the financial services industry and U.S. and global credit markets in recent years may continue to adversely impact our operations and results.
The general economic downturn experienced since 2008 negatively impacted many financial institutions, including the Corporation. Loan portfolio performances deteriorated at many institutions resulting from, among other factors, a weak economy and a decline in the value of the collateral supporting their loans. The competition for our deposits increased significantly due to liquidity concerns at many of these same institutions. Stock prices of bank holding companies, like ours, were negatively affected by the condition of the financial markets, as was our ability, if needed, to raise capital or borrow in the debt markets compared to recent years. While the United States Congress has taken actions to implement important safeguards, there remains a potential for new federal or state laws and regulations regarding lending and funding practices and liquidity standards, and financial institution regulatory agencies are expected to be very aggressive in responding to concerns and trends identified in examinations, including the issuance of many formal enforcement actions. Negative developments in the financial services industry and the impact of new legislation in response to those developments could negatively impact our operations by restricting our business operations, including our ability to originate or sell loans, and adversely impact our financial performance. A worsening of these conditions would likely exacerbate the adverse effects of these difficult market conditions on us and others in the financial institutions industry. In particular, we may face the following risks in connection with these events:
In addition, the possibility that certain European Union (“EU”) member states may default on their debt obligations have negatively impacted economic conditions and global markets. The continued uncertainty over the outcome of international and the EU’s financial support programs and the possibility that other EU member states may experience similar financial troubles could further disrupt global markets. The negative impact on economic conditions and global markets could also have a material adverse effect on our liquidity, financial condition and results of operations.
We are subject to interest rate risk and variations in interest rates may negatively impact our financial performance.
We are unable to predict actual fluctuations of market interest rates with complete accuracy. Rate fluctuations are affected by many factors, including:
Changes in the interest rate environment may reduce profits. We expect that we will continue to realize income from the differential or “spread” between the interest we earn on loans, securities and other interest-earning assets, and the interest we pay on deposits, borrowings and other interest-bearing liabilities. Net interest spreads are affected by the difference between the maturities and repricing characteristics of interest-earning assets and interest-bearing liabilities. Changes in levels of market interest rates could materially and adversely affect our net interest spread, asset quality, levels of prepayments and cash flows as well as the market value of our securities portfolio and overall profitability.
The downgrade of the U.S. credit rating could have a material adverse effect on our business, financial condition and liquidity.
Standard & Poor’s lowered its long term sovereign credit rating on the United States of America from AAA to AA+ on August 5, 2011. A further downgrade or a downgrade by other rating agencies could have a material adverse impact on financial markets and economic conditions in the United States and worldwide. Any such adverse impact could have a material adverse effect on our liquidity, financial condition and results of operations. Many of our investment securities are issued by U.S. government agencies and U.S. government sponsored entities.
The Federal Reserve’s repeal of the prohibition against payment of interest on demand deposits may increase competition for such deposits and ultimately increase interest expense.
A major portion of our net income comes from our interest rate spread, which is the difference between the interest rates paid by us on amounts used to fund assets and the interest rates and fees we receive on our interest-earning assets. On July 14, 2011, the Federal Reserve issued final rules to repeal Regulation Q, which had prohibited the payment of interest on demand deposits by institutions that are member banks of the Federal Reserve System. As a result, banks and thrifts are now permitted to offer interest-bearing demand deposit accounts to commercial customers, which were previously forbidden under Regulation Q. The repeal of Regulation Q may cause increased competition from other financial institutions for these deposits and could result in an increase in our interest expense.
External factors, many of which we cannot control, may result in liquidity concerns for us.
Liquidity risk is the potential that the Bank may be unable to meet its obligations as they come due, capitalize on growth opportunities as they arise, or pay regular dividends because of an inability to liquidate assets or obtain adequate funding in a timely basis, at a reasonable cost and within acceptable risk tolerances.
Liquidity is required to fund various obligations, including credit commitments to borrowers, mortgage and other loan originations, withdrawals by depositors, repayment of borrowings, operating expenses, capital expenditures and dividend payments to shareholders.
Liquidity is derived primarily from deposit growth and retention; principal and interest payments on loans; principal and interest payments on investment securities; sale, maturity and prepayment of investment securities; net cash provided from operations, and access to other funding sources.
Our access to funding sources in amounts adequate to finance our activities could be impaired by factors that affect us specifically or the financial services industry in general. Factors that could detrimentally impact our access to liquidity sources include a decrease in the level of our business activity due to market factors or an adverse regulatory action against us. Our ability to borrow could also be impaired by factors that are not specific to us, such as a severe disruption of the financial markets or negative views and expectations about the prospects for the financial services industry as a whole. Over the last several years, the financial services industry and the credit markets generally have been materially and adversely affected by significant declines in asset values and by a lack of liquidity. The liquidity issues have been particularly acute for regional and community banks, as many of the larger financial institutions have significantly curtailed their lending to regional and community banks to reduce their exposure to the risks of other banks. In addition, many of the larger correspondent lenders have reduced or even eliminated federal funds lines for their correspondent customers. Furthermore, regional and community banks generally have less access to the capital markets than do the national and super-regional banks because of their smaller size and limited analyst coverage. Any decline in available funding could adversely impact our ability to originate loans, invest in securities, meet our expenses, or fulfill obligations such as meeting deposit withdrawal demands, any of which could have a material adverse impact on our liquidity, business, results of operations and financial condition.
The extensive regulation and supervision to which we are subject impose substantial restrictions on our business.
Center Bancorp Inc., primarily through its principal subsidiary, Union Center National Bank, and certain non-bank subsidiaries, are subject to extensive regulation and supervision. Banking regulations are primarily intended to protect depositors’ funds, federal deposit insurance funds and the banking system as a whole. Such laws are not designed to protect our shareholders. These regulations affect our lending practices, capital structure, investment practices, dividend policy and growth, among other things. The Bank is also subject to a number of federal laws, which, among other things, require it to lend to various sectors of the economy and population, and establish and maintain comprehensive programs relating to anti-money laundering and customer identification. The United States Congress and federal regulatory agencies continually review banking laws, regulations and policies for possible changes. Changes to statutes, regulations or regulatory policies, including changes in interpretation or implementation of statutes, regulations or policies, could affect us in substantial and unpredictable ways. Such changes could subject us to additional costs, limit the types of financial services and products we may offer and/or increase the ability of non-banks to offer competing financial services and products, among other things. Failure to comply with laws, regulations or policies could result in sanctions by regulatory agencies, civil money penalties and/or reputational damage, which could have a material adverse effect on our business, financial condition and results of operations.
Current levels of volatility in the capital markets are unprecedented and may adversely impact our operations and results.
The capital markets have been experiencing unprecedented volatility for several years. Such negative developments and disruptions have resulted in uncertainty in the financial markets. Bank and bank holding company stock prices have been negatively affected, as has the ability of banks and bank holding companies to raise capital or borrow in the debt markets. If the capital markets are volatile, there can be no assurance that we will not experience an adverse effect, which may be material, on our business, financial condition and results of operations or our ability to access capital.
We must effectively manage our credit risk.
There are risks inherent in making any loan, including risks inherent in dealing with particular borrowers, risks of nonpayment, risks resulting from uncertainties as to the future value of collateral and risks resulting from changes in economic and industry conditions. We attempt to minimize our credit risk through prudent loan application approval procedures, careful monitoring of the concentration of our loans within specific industries, a centralized credit administration department and periodic independent reviews of outstanding loans by our loan review department. However, we cannot assure you that such approval and monitoring procedures will reduce these credit risks.
Our loan portfolio includes commercial real estate loans, which involve risks specific to real estate value.
Commercial real estate and construction loans were $447.4 million, or approximately 59.2% of our total loan portfolio, as of December 31, 2011. Many of these loans are extended to small and medium-sized businesses. The market value of real estate can fluctuate significantly in a short period of time as a result of market conditions in the geographic area in which the real estate is located. Although many such loans are secured by real estate as a secondary form of collateral, continued adverse developments affecting real estate values in our market area could increase the credit risk associated with our loan portfolio. Economic events or governmental regulations outside of the control of the borrower or lender could negatively impact the future cash flow and market values of the affected properties. If the loans that are collateralized by real estate become troubled and the value of the real estate has been significantly impaired, then we may not be able to recover the full contractual amount of principal and interest that we anticipated at the time of originating the loan, which could cause us to increase our provision for loan losses and adversely affect our operating results and financial condition.
We may incur impairments to goodwill.
We review our goodwill at least annually. Significant negative industry or economic trends, reduced estimates of future cash flows or disruptions to our business, could indicate that goodwill might be impaired. Our valuation methodology for assessing impairment requires management to make judgments and assumptions based on historical experience and to rely on projections of future operating performance. We operate in a competitive environment and projections of future operating results and cash flows may vary significantly from actual results. Additionally, if our analysis results in an impairment to our goodwill, we would be required to record a non-cash charge to earnings in our financial statements during the period in which such impairment is determined to exist. Any such change could have a material adverse effect on our results of operations and our stock price.
Union Center National Bank’s ability to pay dividends is subject to regulatory limitations, which, to the extent that our holding company requires such dividends in the future, may affect our holding company’s ability to honor its obligations and pay dividends.
As a bank holding company, Center Bancorp, Inc. is a separate legal entity from Union Center National Bank and its subsidiaries and does not have significant operations. We currently depend on Union Center National Bank’s cash and liquidity to pay our operating expenses and to fund dividends to shareholders. We cannot assure you that in the future Union Center National Bank will have the capacity to pay the necessary dividends and that we will not require dividends from Union Center National Bank to satisfy our obligations. Various statutes and regulations limit the availability of dividends from Union Center National Bank. It is possible, depending upon our and Union Center National Bank’s financial condition and other factors, that bank regulators could assert that payment of dividends or other payments by Union Center National Bank are an unsafe or unsound practice. In the event that Union Center National Bank is unable to pay dividends, we may not be able to service our obligations, as they become due, or pay dividends on our capital stock. Consequently, the inability to receive dividends from Union Center National Bank could adversely affect our financial condition, results of operations, cash flows and prospects.
Union Center National Bank’s allowance for loan losses may not be adequate to cover actual losses.
Like all financial institutions, Union Center National Bank maintains an allowance for loan losses to provide for loan defaults and non-performance. If Union Center National Bank’s allowance for loan losses is not adequate to cover actual loan losses, future provisions for loan losses could materially and adversely affect our operating results. Union Center National Bank’s allowance for loan losses is determined by analyzing historical loan losses, current trends in delinquencies and charge-offs, plans for problem loan resolution, the opinions of its regulators, changes in the size and composition of the loan portfolio and industry information.
Union Center National Bank also considers the impact of economic events, the outcome of which is uncertain. The amount of future losses is susceptible to changes in economic, operating and other conditions, including changes in interest rates that may be beyond our control and these losses may exceed current estimates. Federal regulatory agencies, as an integral part of their examination process, review Union Center National Bank’s loans and allowance for loan losses. While we believe that Union Center National Bank’s allowance for loan losses in relation to its current loan portfolio is adequate to cover current losses, we cannot assure you that Union Center National Bank will not need to increase its allowance for loan losses or that regulators will not require it to increase this allowance. Either of these occurrences could materially and adversely affect our earnings and profitability.
Union Center National Bank is subject to various lending and other economic risks that could adversely impact our results of operations and financial condition.
Changes in economic conditions, particularly a significant worsening of the current economic environment, could hurt Union Center National Bank’s business. Union Center National Bank’s business is directly affected by political and market conditions, broad trends in industry and finance, legislative and regulatory changes, changes in governmental monetary and fiscal policies, all of which are beyond our control. Deterioration in economic conditions, particularly within New Jersey, could result in the following consequences, any of which could hurt our business materially:
Further deterioration in the real estate market, particularly in New Jersey, could hurt our business. As real estate values in New Jersey decline, our ability to recover on defaulted loans by selling the underlying real estate is reduced, which increases the possibility that we may suffer losses on defaulted loans.
Union Center National Bank may suffer losses in its loan portfolio despite its underwriting practices.
Union Center National Bank seeks to mitigate the risks inherent in its loan portfolio by adhering to specific underwriting practices. Although we believe that Union Center National Bank’s underwriting criteria are appropriate for the various kinds of loans that it makes, Union Center National Bank may incur losses on loans that meet its underwriting criteria, and these losses may exceed the amounts set aside as reserves in its allowance for loan losses.
Union Center National Bank faces strong competition from other financial institutions, financial service companies and other organizations offering services similar to the services that Union Center National Bank provides.
Many competitors offer the same types of loans and banking services that Union Center National Bank offers or similar types of such services. These competitors include other national banks, savings associations, regional banks and other community banks. Union Center National Bank also faces competition from many other types of financial institutions, including finance companies, brokerage firms, insurance companies, credit unions, mortgage banks and other financial intermediaries. In this regard, Union Center National Bank’s competitors include other state and national banks and major financial companies whose greater resources may
afford them a marketplace advantage by enabling them to maintain numerous banking locations, offer a broader suite of services and mount extensive promotional and advertising campaigns. Our inability to compete effectively may adversely affect our business.
If we pursue acquisitions, we may heighten the risks to our operations and financial condition.
To the extent that we undertake acquisitions (such as our pending agreement to acquire assets and assume liabilities of Saddle River Valley Bank) or new branch openings, we may experience the effects of higher operating expenses relative to operating income from the new operations, which may have a material adverse effect on our levels of reported net income, return on average equity and return on average assets. Other effects of engaging in such growth strategies may include potential diversion of our management’s time and attention and general disruption to our business. To the extent that we grow through acquisitions and branch openings, we cannot assure you that we will be able to adequately and profitably manage this growth. Acquiring other banks and businesses involve similar risks to those commonly associated with branching, but may also involve additional risks, including:
Attractive acquisition opportunities may not be available to us in the future.
We expect that other banking and financial service companies, many of which have significantly greater resources than us, will compete with us in acquiring other financial institutions if we pursue such acquisitions. This competition could increase prices for potential acquisitions that we believe are attractive. Also, acquisitions are subject to various regulatory approvals. If we fail to receive the appropriate regulatory approvals, we will not be able to consummate an acquisition that we believe is in our best interests. Among other things, our regulators will consider our capital, liquidity, profitability, regulatory compliance and levels of goodwill when considering acquisition and expansion proposals. Any acquisition could be dilutive to our earnings and shareholders’ equity per share of our common stock.
Further increases in FDIC premiums could have a material adverse effect on our future earnings.
The FDIC insures deposits at FDIC insured financial institutions, including Union Center National Bank. The FDIC charges the insured financial institutions premiums to maintain the Deposit Insurance Fund at an adequate level. In periods of economic difficulties, the FDIC may increase its assessment rates and impose special assessments. The FDIC may further increase these rates and impose additional special assessments in the future, which could have a material adverse effect on future earnings.
Declines in value may adversely impact our investment portfolio.
As of December 31, 2011, we had approximately $414.5 million in available for sale investment securities. We may be required to record impairment charges on our investment securities if they suffer a decline in value that is considered other-than-temporary. Numerous factors, including lack of liquidity for re-sales of certain investment securities, absence of reliable pricing information or investment securities, adverse changes in business climate, adverse actions by regulators, or unanticipated changes in the competitive environment could have a negative effect on our investment portfolio in future periods. If an impairment charge is significant enough, it could affect the ability of Union Center National Bank to upstream dividends to the Parent Corporation, which could have a material adverse effect on our liquidity and our ability to pay dividends to shareholders and could also negatively impact our regulatory capital ratios.
Concern of customers over deposit insurance may cause a decrease in deposits.
With recent increased concerns about bank failures, customers increasingly are concerned about the extent to which their deposits are insured by the FDIC. Customers may withdraw deposits in an effort to ensure that the amount they have on deposit with their bank is fully insured. Decreases in deposits may adversely affect our funding costs and net income.
We have a continuing need for technological change and we may not have the resources to effectively implement new technology.
The financial services industry is constantly undergoing rapid technological changes with frequent introductions of new technology-driven products and services. The effective use of technology increases efficiency and enables financial institutions to reduce costs, in addition to providing better service to customers. Our future success will depend in part upon our ability to address the needs of our customers by using technology to provide products and services that will satisfy customer demands for convenience as well as to create additional efficiencies in our operations as we grow. We cannot assure you that we will be able to effectively implement new technology-driven products and services or be successful in marketing such products and services to our customers.
System failure or breaches of our network security could subject us to increased operating costs as well as litigation and other liabilities.
The computer systems and network infrastructure we use could be vulnerable to unforeseen problems. Our operations are dependent upon our ability to protect our computer equipment against damage from physical theft, fire, power loss, telecommunications failure or a similar catastrophic event, as well as from security breaches, denial of service attacks, viruses, worms and other disruptive problems caused by hackers. Any damage or failure that causes an interruption in our operations could have a material adverse effect on our financial condition and results of operations. Computer break-ins, phishing and other disruptions could also jeopardize the security of information stored in and transmitted through our computer systems and network infrastructure, which may result in significant liability to us and may cause existing and potential customers to refrain from doing business with us. A failure of the security measures we use could have a material adverse effect on our financial condition and results of operations.
The Dodd-Frank Act and future regulatory reforms required by such legislation could have a significant impact on our business, financial condition and results of operations.
The Dodd-Frank Act will have a broad impact on the financial services industry, including significant regulatory and compliance changes. Many of the requirements called for in the Dodd-Frank Act will be implemented over time and most are and will be subject to implementing regulations over the course of several years. Given the uncertainty associated with the manner in which the provisions of the Dodd-Frank Act will be implemented by the various regulatory agencies, the full extent of the impact such requirements will have on our operations is unclear. Among other things, the Dodd-Frank Act:
While it is difficult to predict at this time what specific impact the Dodd-Frank Act, newly written implementing rules and regulations and yet to be written implementing rules and regulations will have on us, we expect that at a minimum our operating and compliance costs will increase, and our interest expense could increase.
Item 1B. Unresolved Staff Comments
None.
Item 2. Properties
The Bank’s operations are located at ten sites in Union County, New Jersey, consisting of six sites in Union Township, one in Springfield Township, one in Berkeley Heights, one in Vauxhall and one in Summit, New Jersey. The Bank also has three branch offices in Morris County, New Jersey, consisting of one site in Madison, one site in Boonton/Mountain Lakes, and one site in Morristown, New Jersey. The principal office is located at 2455 Morris Avenue, Union, New Jersey. The principal office is a two story building constructed in 1993. On October 9, 2004, the Bank opened a 19,555 square foot office facility on Springfield Road in Union, New Jersey, which served as the Bank’s Operations and Data Center until January 12, 2010 when the Bank entered into a sales purchase agreement for this facility.
The following table sets forth certain information regarding the Bank’s leased locations.
Upon consummation of our Saddle River Valley Bank acquisition, the Bank will assume leases pursuant to which the Bank will lease two branch locations in Bergen County, New Jersey.
The Bank operates a Drive In/Walk Up located at 2022 Stowe Street, Union, New Jersey, adjacent to a part of the Center Office facility. The Bank also operates an Auto banking Center located at Bonnel Court, Union, New Jersey. The Bank has three off-site ATM locations. Two are located at the Chatham and Madison New Jersey Transit stations and one is located at the Boys and Girls Club of Union, 1050 Jeanette Avenue, Union, New Jersey.
During the second quarter of 2010, the Corporation entered into a lease of its former operations facility under a direct financing lease. The lease has a 15 year term with no renewal options. According to the terms of the lease, the lessee has an obligation to purchase the property underlying the lease in either year seven, ten or fifteen at predetermined prices for those years as provided in the lease. The structure of the minimum lease payments and the purchase prices as provided in the lease provide an inducement to the lessee to purchase the property in year seven.
Item 3. Legal Proceedings
In December 2009, the Corporation took steps to terminate a participation agreement with another New Jersey bank at December 31, 2009. Under the terms of the agreement, the participation ended on December 31, 2009, and, in the Corporation’s view, the lead bank is required to repurchase the remaining balance. The lead bank questioned our enforcement of the participation agreement. Therefore, Union Center instituted a suit against Highlands State Bank (“Highlands”) in the Superior Court of New Jersey. Various causes of action are pleaded in this litigation by both parties, including claims for recovery of damages. The primary claim prosecuted by the Bank seeks a judicial determination that the participation agreement executed with Highlands was properly terminated in accordance with its terms on December 31, 2009 and that Highlands is obligated to return the unpaid balance of the loan funds advanced by the Bank during its participation in the loan. The primary claim presented by Highlands is that the Bank’s participation in the loan must continue until it is ultimately retired, which will probably result in a substantial loss that it is claimed must be shared by the Bank.
During the fourth quarter of 2011, the Corporation entered into a Settlement Agreement with Highlands State Bank. The Settlement Agreement called for Highlands State Bank, as the lead bank in this participation loan, to repurchase the Corporation’s participating interest in the underlying loan. Both banks executed a stipulation dismissing the lawsuit as well as general releases to each other regarding this matter. The Corporation incurred a $287,000 charge to operating expense during the fourth quarter of 2011 as a result.
There are no other significant pending legal proceedings involving the Corporation other than those arising out of routine operations. Management does not anticipate that the ultimate liability, if any, arising out of such other proceedings will have a material effect on the financial condition or results of operations of the Corporation on a consolidated basis. Such statement constitutes a forward-looking statement under the Private Securities Litigation Reform Act of 1995. Actual results could differ materially from this statement as a result of various factors, including the uncertainties arising in proving facts within the judicial process.
Item 3A. Executive Officers of the Registrant
The following table sets forth the name and age of each executive officer of the Parent Corporation, the period during which each such person has served as an officer of the Parent Corporation or the Bank and each such person’s business experience (including all positions with the Parent Corporation and the Bank) for the past five years:
Item 4. Mine Safety Disclosures
Not applicable.
PART II
Item 5. Market for the Registrant’s Common Stock, Related Stockholder Matters and Issuer Purchases of Equity Securities
Security Market Information
The common stock of the Parent Corporation is traded on the NASDAQ Global Select Market. The Corporation’s symbol is CNBC. As of December 31, 2011, the Corporation had 563 stockholders of record. This does not include beneficial owners for whom CEDE & Company or others act as nominees. On December 31, 2011, the closing low market bid and asked price were $9.74 and $9.77, respectively.
The following table sets forth the high and low bid price, and the dividends declared, on a share of the Corporation’s common stock for the years ended December 31, 2011 and 2010. All amounts are adjusted for prior stock splits and stock dividends.
| Common Stock Price | ||||||||||||||||||||||||||||||||
| 2011 | 2010 | Common Dividends Declared | ||||||||||||||||||||||||||||||
| High Bid | Low Bid | High Bid | Low Bid | 2011 | 2010 | |||||||||||||||||||||||||||
| Fourth Quarter | $ | 9.96 | $ | 8.90 | $ | 8.11 | $ | 7.30 | $ | 0.03 | $ | 0.03 | ||||||||||||||||||||
| Third Quarter | 10.90 | 8.51 | 7.67 | 7.05 | 0.03 | 0.03 | ||||||||||||||||||||||||||
| Second Quarter | 10.44 | 9.49 | 9.07 | 6.94 | 0.03 | 0.03 | ||||||||||||||||||||||||||
| First Quarter | 9.53 | 7.79 | 9.09 | 8.31 | 0.03 | 0.03 | ||||||||||||||||||||||||||
| Total | $ | 0.12 | $ | 0.12 | ||||||||||||||||||||||||||||
Share Repurchase Program
Historically, repurchases have been made from time to time as, in the opinion of management, market conditions warranted, in the open market or in privately negotiated transactions. Shares repurchased were used for stock dividends and other issuances. No repurchases were made during 2011 and 2010.
On January 9, 2009, as part of the U.S. Department of the Treasury’s Troubled Asset Relief Program (“TARP”), the Parent Corporation entered into an agreement with the U.S. Treasury (the “Stock Purchase Agreement”) pursuant to which (i) the Parent Corporation issued and sold, and the U.S. Treasury purchased, 10,000 shares (the “Preferred Shares”) of the Company’s Fixed Rate Cumulative Perpetual Preferred Stock, Series A, having a liquidation preference of $1,000 per share for an aggregate purchase price of $10 million in cash, and (ii) the Parent Corporation issued to the U.S. Treasury a ten-year warrant (the “Warrant”) to purchase up to 173,410 shares of the Parent Corporation’s common stock at an exercise price of $8.65 per share. As a result of the successful completion of a rights offering in October 2009, the number of shares underlying the warrant held by the U.S. Treasury was reduced to 86,705 shares or 50 percent of the original 173,410 shares. On September 15, 2011, the Corporation issued $11.25 million in nonvoting senior preferred stock to the Treasury under the Small Business Lending Fund Program. Simultaneously, the Corporation redeemed from the Treasury, all 10,000 outstanding shares of its Fixed Rate Cumulative Perpetual Preferred Stock, Series A, liquidation amount $1,000 per share, for a redemption price of $10,041,667, including accrued but unpaid dividends up to the date of redemption. On December 7, 2011, the Corporation repurchased the warrants issued on January 12, 2009 to the U.S. Treasury as part of its participation in the U.S. Treasury’s TARP Capital Purchase Program. The Corporation received $10.0 million under the program and, using funds received under the U.S. Government’s Small Business Lending Fund program, repaid the debt in full in September of this year. In the repurchase, the Corporation paid the U.S. Treasury $245,000 for the warrants.
Dividends
Federal laws and regulations contain restrictions on the ability of the Parent Corporation and Union Center National Bank to pay dividends. For information regarding restrictions on dividends, see Part I, Item 1, “Business — Dividend Limitations” and Part II, Item 8, “Financial Statements and Supplementary Data — Dividend and Other Restrictions, Note 17 of the Notes to Consolidated Financial Statements.” Under the terms of the trust preferred securities issued by Center Bancorp, Inc. Statutory Trust II, the Parent Corporation
can not pay dividends on its common stock if the Corporation defers payments on the junior subordinated debentures which provide the cash flow for the payments on the trust preferred securities. If the Parent Corporation fails to declare and pay dividends on the SBLF Preferred Stock in a given quarter, then during such quarter and for the next three quarters followings such missed dividend payment, the Parent Corporation may not pay dividends on, or repurchase, any common stock or any other securities that are Junior to (or in parity with) the SBLF Preferred Stock, except in very limited circumstances. Also under the terms of the SBLF Preferred Stock, the Parent Corporation may declare and pay dividends on its common stock or any other stock junior to the SBLF Preferred Stock, or repurchase shares of any such stock, only if after payment of such dividends or repurchase of such shares, the Parent Corporation’s Tier 1 Capital would be at least equal to the Tier 1 Dividend Threshold, excluding any subsequent net charge-offs and any redemption of the SBLF Preferred Stock.
During 2011, the Office of the Comptroller of the Currency (the “OCC”) determined that the Memorandum of Understanding (the “MOU”) that had previously been entered into by the Bank was no longer required and, accordingly, the OCC terminated the MOU.
Stockholders Return Comparison
Set forth below is a line graph presentation comparing the cumulative stockholder return on the Parent Corporation’s common stock, on a dividend reinvested basis, against the cumulative total returns of the Standard & Poor’s Composite and the SNL Mid-Atlantic Bank Index for the period from January 1, 2007 through December 31, 2011.
COMPARE 5-YEAR CUMULATIVE TOTAL RETURN
AMONG CENTER BANCORP INC.,
S&P COMPOSITE AND SNL MID-ATLANTIC BANK INDEX
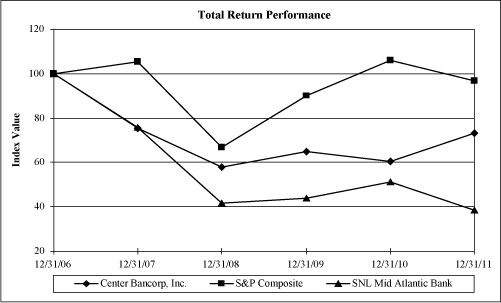
Assumes $100 invested on January 1, 2007
Assumes dividends reinvested
Year ended December 31, 2011
COMPARISON OF CUMULATIVE TOTAL RETURN OF ONE OR MORE
COMPANIES, PEER GROUPS, INDUSTRY INDEXES AND/OR BROAD MARKETS
| Fiscal Year Ending | ||||||||||||||||||||||||
| Company/Index/Market | 12/31/2006 | 12/31/2007 | 12/31/2008 | 12/31/2009 | 12/31/2010 | 12/31/2011 | ||||||||||||||||||
| Center Bancorp, Inc. | 100.00 | 75.27 | 57.79 | 65.02 | 60.29 | 73.18 | ||||||||||||||||||
| S&P Composite | 100.00 | 105.47 | 66.74 | 90.14 | 106.05 | 96.81 | ||||||||||||||||||
| SNL Mid-Atlantic Bank Index | 100.00 | 75.62 | 41.66 | 43.85 | 51.16 | 38.43 | ||||||||||||||||||
Item 6. Selected Financial Data
The following tables set forth selected consolidated financial data as of the dates and for the periods presented. The selected consolidated statement of financial condition data as of December 31, 2011 and 2010 and the selected consolidated summary of income data for the years ended December 31, 2011, 2010 and 2009 have been derived from our audited consolidated financial statements and related notes that we have included elsewhere in this Annual Report. The selected consolidated statement of financial condition data as of December 31, 2009, 2008 and 2007 and the selected consolidated summary of income data for the years ended December 31, 2008 and 2007 have been derived from audited consolidated financial statements that are not presented in this Annual Report.
The selected historical consolidated financial data as of any date and for any period are not necessarily indicative of the results that may be achieved as of any future date or for any future period. You should read the following selected statistical and financial data in conjunction with the more detailed information contained in “Management’s Discussion and Analysis of Financial Condition and Results of Operations” and our consolidated financial statements and the related notes that we have presented elsewhere in this Annual Report.
SUMMARY OF SELECTED STATISTICAL INFORMATION AND FINANCIAL DATA
| Years Ended December 31, | ||||||||||||||||||||
| 2011 | 2010 | 2009 | 2008 | 2007 | ||||||||||||||||
| (Dollars in Thousands, Except per Share Data) | ||||||||||||||||||||
| Summary of Income | ||||||||||||||||||||
| Interest income | $ | 51,927 | $ | 48,714 | $ | 51,110 | $ | 49,894 | $ | 52,129 | ||||||||||
| Interest expense | 12,177 | 14,785 | 22,645 | 24,095 | 30,630 | |||||||||||||||
| Net interest income | 39,750 | 33,929 | 28,465 | 25,799 | 21,499 | |||||||||||||||
| Provision for loan losses | 2,448 | 5,076 | 4,597 | 1,561 | 350 | |||||||||||||||
| Net interest income after provision for loan losses | 37,302 | 28,853 | 23,868 | 24,238 | 21,149 | |||||||||||||||
| Other income | 7,478 | 2,472 | 3,906 | 2,644 | 4,372 | |||||||||||||||
| Other expense | 23,443 | 24,099 | 23,057 | 19,473 | 24,598 | |||||||||||||||
| Income before income tax expense (benefit) | 21,337 | 7,226 | 4,717 | 7,409 | 923 | |||||||||||||||
| Income tax expense (benefit) | 7,411 | 222 | 946 | 1,567 | (2,933 | ) | ||||||||||||||
| Net income | $ | 13,926 | $ | 7,004 | $ | 3,771 | $ | 5,842 | $ | 3,856 | ||||||||||
| Net income available to common stockholders | $ | 13,106 | $ | 6,423 | $ | 3,204 | $ | 5,842 | $ | 3,856 | ||||||||||
| Statement of Financial Condition Data | ||||||||||||||||||||
| Investments available for sale | $ | 414,507 | $ | 378,080 | $ | 298,124 | $ | 242,714 | $ | 314,194 | ||||||||||
| Investments held to maturity | 72,233 | — | — | — | — | |||||||||||||||
| Total loans | 756,010 | 708,444 | 719,606 | 676,203 | 551,669 | |||||||||||||||
| Allowance for loan losses | 9,602 | 8,867 | 8,711 | 6,254 | 5,163 | |||||||||||||||
| Goodwill and other intangible assets | 16,902 | 16,959 | 17,028 | 17,110 | 17,204 | |||||||||||||||
| Total assets | 1,432,738 | 1,207,385 | 1,195,488 | 1,023,293 | 1,017,645 | |||||||||||||||
| Deposits | 1,121,415 | 860,332 | 813,705 | 659,537 | 699,070 | |||||||||||||||
| Borrowings | 161,000 | 212,855 | 269,253 | 268,440 | 218,109 | |||||||||||||||
| Stockholders’ equity | 135,916 | 120,957 | 101,749 | 81,713 | 85,278 | |||||||||||||||
| Dividends | ||||||||||||||||||||
| Cash dividends on Common Stock | $ | 1,955 | $ | 1,852 | $ | 2,434 | $ | 4,675 | $ | 4,885 | ||||||||||
| Dividend payout ratio | 14.92 | % | 28.83 | % | 75.97 | % | 80.02 | % | 126.69 | % | ||||||||||
| Cash Dividends Per Share(1) | ||||||||||||||||||||
| Cash dividends | $ | 0.12 | $ | 0.12 | $ | 0.18 | $ | 0.36 | $ | 0.36 | ||||||||||
| Earnings Per Share(1) | ||||||||||||||||||||
| Basic | $ | 0.80 | $ | 0.43 | $ | 0.24 | $ | 0.45 | $ | 0.28 | ||||||||||
| Diluted | $ | 0.80 | $ | 0.43 | $ | 0.24 | $ | 0.45 | $ | 0.28 | ||||||||||
| Weighted Average Common Shares Outstanding(1) | ||||||||||||||||||||
| Basic | 16,295,761 | 15,025,870 | 13,382,614 | 13,048,518 | 13,780,504 | |||||||||||||||
| Diluted | 16,314,899 | 15,027,159 | 13,385,416 | 13,061,410 | 13,840,756 | |||||||||||||||
| Operating Ratios | ||||||||||||||||||||
| Return on average assets | 1.05 | % | 0.59 | % | 0.31 | % | 0.58 | % | 0.38 | % | ||||||||||
| Average stockholders’ equity to average assets | 9.83 | % | 9.38 | % | 7.66 | % | 8.28 | % | 9.33 | % | ||||||||||
| Return on average stockholders’ equity | 10.73 | % | 6.30 | % | 4.02 | % | 7.03 | % | 4.09 | % | ||||||||||
| Return on average tangible stockholders’ equity(2) | 12.33 | % | 7.44 | % | 4.91 | % | 8.86 | % | 5.00 | % | ||||||||||
| Book Value | ||||||||||||||||||||
| Book value per common share(1) | $ | 7.63 | $ | 6.83 | $ | 6.32 | $ | 6.29 | $ | 6.48 | ||||||||||
| Tangible book value per common share(1)(2) | $ | 6.60 | $ | 5.79 | $ | 5.15 | $ | 4.97 | $ | 5.17 | ||||||||||
| Non-Financial Information | ||||||||||||||||||||
| Common stockholders of record | 563 | 592 | 605 | 640 | 679 | |||||||||||||||
| Full-time equivalent staff | 163 | 159 | 160 | 160 | 172 | |||||||||||||||
Notes to Selected Financial Data
| 2011 | 2010 | 2009 | 2008 | 2007 | ||||||||||||||||
| (Dollars in Thousands, Except per Share Data) | ||||||||||||||||||||
| Common shares outstanding | 16,332,327 | 16,289,832 | 14,572,029 | 12,991,312 | 13,155,784 | |||||||||||||||
| Stockholders’ equity | $ | 135,916 | $ | 120,957 | $ | 101,749 | $ | 81,713 | $ | 85,278 | ||||||||||
| Less: Preferred Stock | 11,250 | 9,700 | 9,619 | — | — | |||||||||||||||
| Less: Goodwill and other intangible assets | 16,902 | 16,959 | 17,028 | 17,110 | 17,204 | |||||||||||||||
| Tangible Stockholders’ Equity | $ | 107,764 | $ | 94,298 | $ | 75,102 | $ | 64,603 | $ | 68,074 | ||||||||||
| Book value per common share | $ | 7.63 | $ | 6.83 | $ | 6.32 | $ | 6.29 | $ | 6.48 | ||||||||||
| Less: Goodwill and other intangible assets | 1.03 | 1.04 | 1.17 | 1.32 | 1.31 | |||||||||||||||
| Tangible Book Value per Common Share | $ | 6.60 | $ | 5.79 | $ | 5.15 | $ | 4.97 | $ | 5.17 | ||||||||||
All per common share amounts reflect all prior stock splits and dividends.
Return on average tangible stockholders’ equity, which is a non-GAAP financial measure, is computed by dividing net income by average stockholders’ equity less average goodwill and average other intangible assets. The following table reflects a reconciliation between average stockholders’ equity and average tangible stockholders’ equity and a reconciliation between return on stockholders’ equity and return on average tangible stockholders’ equity.
| 2011 | 2010 | 2009 | 2008 | 2007 | ||||||||||||||||
| (Dollars in Thousands) | ||||||||||||||||||||
| Net income | $ | 13,926 | $ | 7,004 | $ | 3,771 | $ | 5,842 | $ | 3,856 | ||||||||||
| Average stockholders’ equity | $ | 129,838 | $ | 111,136 | $ | 93,850 | $ | 83,123 | $ | 94,345 | ||||||||||
| Less: Average goodwill and other intangible assets | 16,930 | 16,993 | 17,069 | 17,158 | 17,259 | |||||||||||||||
| Average Tangible Stockholders’ Equity | $ | 112,908 | $ | 94,143 | $ | 76,781 | $ | 65,965 | $ | 77,086 | ||||||||||
| Return on average stockholders’ equity | 10.73 | % | 6.30 | % | 4.02 | % | 7.03 | % | 4.09 | % | ||||||||||
| Add: Average goodwill and other intangible assets | 1.61 | 1.14 | .89 | 1.83 | 0.91 | |||||||||||||||
| Return on Average Tangible Stockholders’ Equity | 12.33 | % | 7.44 | % | 4.91 | % | 8.86 | % | 5.00 | % | ||||||||||
The Corporation believes that in comparing financial institutions, investors desire to analyze tangible stockholders’ equity rather than stockholders’ equity, as they discount the significance of goodwill and other intangible assets.
Item 7. Management’s Discussion and Analysis (“MD&A”) of Financial Condition and Results of Operations
The purpose of this analysis is to provide the reader with information relevant to understanding and assessing the Corporation’s results of operations for each of the past three years and financial condition for each of the past two years. In order to fully appreciate this analysis, the reader is encouraged to review the consolidated financial statements and accompanying notes thereto appearing under Item 8 of this report, and statistical data presented in this document.
Cautionary Statement Concerning Forward-Looking Statements
See Item 1 of this Annual Report on Form 10-K for information regarding forward-looking statements.
Critical Accounting Policies and Estimates
The accounting and reporting policies followed by the Corporation conform, in all material respects, to U.S. GAAP. In preparing the consolidated financial statements, management has made estimates, judgments and assumptions that affect the reported amounts of assets and liabilities as of the dates of the consolidated statements of condition and results of operations for the periods indicated. Actual results could differ significantly from those estimates.
The Corporation’s accounting policies are fundamental to understanding this MD&A. The most significant accounting policies followed by the Corporation are presented in Note 1 of the Notes to Consolidated Financial Statements. The Corporation has identified its policies on the allowance for loan losses, other-than-temporary impairment of securities, income tax liabilities and goodwill and other identifiable intangible assets to be critical because management must make subjective and/or complex judgments about matters that are inherently uncertain and could be most subject to revision as new information becomes available. Additional information on these policies can be found in Note 1 of the Notes to Consolidated Financial Statements.
Allowance for Loan Losses and Related Provision
The allowance for loan losses represents management’s estimate of probable loan losses inherent in the loan portfolio. Determining the amount of the allowance for loan losses is considered a critical accounting estimate because it requires significant judgment and the use of estimates related to the amount and timing of expected future cash flows on impaired loans, estimated losses on pools of homogeneous loans based on historical loss experience, and consideration of current economic trends and conditions, all of which may be susceptible to significant change. The loan portfolio also represents the largest asset type on the Corporation’s Consolidated Statements of Condition.
The evaluation of the adequacy of the allowance for loan losses includes, among other factors, an analysis of historical loss rates by loan category applied to current loan totals. However, actual loan losses may be higher or lower than historical trends, which vary. Actual losses on specified problem loans, which also are provided for in the evaluation, may vary from estimated loss percentages, which are established based upon a limited number of potential loss classifications.
The allowance for loan losses is established through a provision for loan losses charged to expense. Management believes that the current allowance for loan losses will be adequate to absorb loan losses on existing loans that may become uncollectible based on the evaluation of known and inherent risks in the loan portfolio. The evaluation takes into consideration such factors as changes in the nature and size of the portfolio, overall portfolio quality, and specific problem loans and current economic conditions which may affect the borrowers’ ability to pay. The evaluation also details historical losses by loan category and the resulting loan loss rates which are projected for current loan total amounts. Loss estimates for specified problem loans are also detailed. All of the factors considered in the analysis of the adequacy of the allowance for loan losses may be subject to change. To the extent actual outcomes differ from management estimates, additional provisions for loan losses may be required that could materially adversely impact earnings in future periods. Additional information can be found in Note 1 of the Notes to Consolidated Financial Statements.
Other-Than-Temporary Impairment of Securities
Securities are evaluated on at least a quarterly basis, and more frequently when market conditions warrant such an evaluation, to determine whether a decline in their value is other-than-temporary. FASB ASC 320-10-65, clarifies the interaction of the factors that should be considered when determining whether a debt security is other-than-temporarily impaired. For debt securities, management must assess whether (a) it has the intent to sell the security and (b) it is more likely than not that it will be required to sell the security prior to its anticipated recovery. These steps are done before assessing whether the entity will recover the cost basis of the investment. Previously, this assessment required management to assert it has both the intent and the ability to hold a security for a period of time sufficient to allow for anticipated recovery in fair value to avoid recognizing an other-than-temporary impairment. This change does not affect the need to forecast recovery of the value of the security through either cash flows or market price.
In instances when a determination is made that an other-than-temporary impairment exists but the investor does not intend to sell the debt security and it is not more likely than not that it will be required to sell the debt security prior to its anticipated recovery, FASB ASC 320-10-65 changes the presentation and amount of the other-than-temporary impairment recognized in the income statement. The other-than-temporary impairment is separated into (a) the amount of the total other-than-temporary impairment related to a decrease in cash flows expected to be collected from the debt security (the credit loss) and (b) the amount of the total other-than-temporary impairment related to all other factors. The amount of the total other-than-temporary impairment related to the credit loss is recognized through earnings. The amount of the total other-than-temporary impairment related to all other factors is recognized in other comprehensive income. Impairment charges on certain investment securities of approximately $342,000 were recognized in earnings during the year ended December 31, 2011. Of this amount, $18,000 related to a variable rate private label collateralized mortgage obligation (“CMO”) and $324,000 related to principal losses on a variable rate private label CMO. The Corporation’s approach to determining whether or not other-than-temporary impairment exists for any of these investments was consistent with the accounting guidance in effect at that time. For the year ended December 31, 2011, the Corporation primarily relied upon the guidance in FASB ASC 320-10-65, FASB ASC 820-10-65 and FASB ASC 310-10-35. Additional information can be found in Note 4 of the Notes to Consolidated Financial Statements.
Impairment charges on certain investment securities of approximately $5.6 million were recognized during the year ended December 31, 2010. Of this amount, $1.8 million related to charges taken on two pooled trust preferred securities owned by the Corporation, $360,000 on a variable rate private label collateralized mortgage obligation (“CMO”), $398,000 in principal losses on a variable rate private label CMO and $3.0 million on a trust preferred security. The Corporation’s approach to determining whether or not other-than-temporary impairment exists for any of these investments was consistent with the accounting guidance in effect at that time. For the year ended December 31, 2010, the Corporation primarily relied upon the guidance in FASB ASC 320-10-65, FASB ASC 820-10-65 and FASB ASC 325-10-35.
Income Taxes
The objectives of accounting for income taxes are to recognize the amount of taxes payable or refundable for the current year and deferred tax liabilities and assets for the future tax consequences of events that have been recognized in an entity’s financial statements or tax returns. Judgment is required in assessing the future tax consequences of events that have been recognized in the Corporation’s consolidated financial statements or tax returns.
Fluctuations in the actual outcome of these future tax consequences could impact the Corporation’s consolidated financial condition or results of operations. Notes 1 (under the caption “Use of Estimates”) and 11 of the Notes to Consolidated Financial Statements include additional discussion on the accounting for income taxes.
Goodwill
The Corporation adopted the provisions of FASB ASC 350-10-05, which requires that goodwill be reported separate from other intangible assets in the Consolidated Statements of Condition and not be amortized but tested for impairment annually or more frequently if impairment indicators arise for impairment. No impairment charge was deemed necessary for the years ended December 31, 2011 and 2010.
Fair Value of Investment Securities
In October 2008, the FASB issued FASB ASC 820-10-35, to clarify the application of the provisions of FASB ASC 820-10-05 in an inactive market and how an entity would determine fair value in an inactive market. Changes in the Corporation’s methodology occurred for the quarter ended June 30, 2009 as new accounting guidance was released in April of 2009 with mandatory adoption required in the second quarter. The Corporation relied upon the guidance in FASB ASC 820-10-65 when determining fair value for the Corporation’s pooled trust preferred securities and private issue corporate bond. See Note 18 of the Notes to Consolidated Financial Statements,Fair Value Measurements and Fair Value of Financial Instruments, for further discussion.
Introduction
The following introduction to Management’s Discussion and Analysis highlights the principal factors that contributed to the Corporation’s earnings performance in 2011.
The year 2011 was a challenging one for the banking industry and for the Corporation. The current global financial crisis and difficult economic climate has created challenges to financial institutions both domestically and abroad. Interest rates in 2011 and 2010 were reflective of significantly lower short-term interest rates in an effort to stimulate the economy. Competition for deposits in the Corporation’s marketplace remained intense while customers’ preference in seeking safety through full FDIC insured products and more liquidity became paramount in light of the financial crisis. Market conditions remained volatile during 2011 and 2010, related to global instability in the markets following the sub-prime crises. While we continue to see an improvement in balance sheet strength and core earnings performance, we are still concerned with the credit stability of the broader markets. As a result, the Federal Reserve kept overnight borrowing rates at zero to 25 basis points throughout the course of 2011. Short-term interest rates remained lower than longer term rates resulting in an improved steepening of the yield curve. This resulted in an expansion of the Corporation’s net interest income, which is the Corporation’s primary source of income. The Corporation also took action throughout the year to reduce further exposure to interest rates through a reduction in higher cost funding and non-core balances in the deposit mix and improvement in the earning asset mix. The Corporation’s continued progress in growing and improving its balance sheet earning asset mix has helped to expand its spread and margin. We intend to continue to use a portion of the proceeds of maturing investments to help fund new loan growth.
The Corporation’s net income in 2011 was $13.9 million or $0.80 per fully diluted common share, compared with net income of $7.0 million or $0.43 per fully diluted common share in 2010. A substantial portion of our earnings in 2011 and 2010 was from core operations.
Earnings for 2011 were positively impacted by net interest income and spread expansion through both balance sheet improvements and a lower cost of funds as compared to 2010 and reductions in loan loss provisions, marketing expenses, FDIC insurance, computer and occupancy expenses. These improvements were somewhat offset by higher salaries and employee benefits, professional and consulting fees expenses. Other expense for the twelve-months ended December 31, 2011 totaled $23.4 million, a decrease of $656,000, or 2.7 percent, from the twelve-months ended December 31, 2010 due principally to the items mentioned above.
The Corporation previously announced a strategic outsourcing agreement with Fiserv to provide core account processing services, which is consistent with the Corporation’s other strategic initiatives to streamline operations, reduce operating overhead and allow the Corporation to focus on core competencies of customer service and product development. This coupled with previously initiated cost reduction plans are intended to improve operating efficiencies, business and technical operations. The core processing transition was consummated during 2009. Additionally, the consolidation of the Corporation’s branch office on 392 Springfield Avenue in Summit, New Jersey during 2009 into its new office on 545 Morris Avenue in Summit, New Jersey resulted in improved efficiency and increased customer service.
For the twelve months ended December 31, 2011, total salaries and benefits increased by $762,000 or 7.1 percent to $11.5 million primarily attributable to additions to office staff and merit increases for existing staff of approximately $515,000 and increased medical insurance expense of $40,000.
Total non-interest income increased as a percentage of total revenue, which is the sum of interest income and non-interest income, in 2011 largely due to $3.6 million in net securities gains as compared to $1.3 million in net securities losses in 2010 as gains from sales of $4.0 million in 2011 were offset by impairment losses of $411,000. For the twelve months ended December 31, 2011, total other income increased $5.0 million as compared with the twelve months ended December 31, 2010, from $2.5 million to $7.5 million. Excluding net securities gains and losses in the respective periods, the Corporation recorded total other income of $3.8 million in both the twelve months ended December 31, 2011 and the twelve months ended December 31, 2010. Increases of $313,000 in other income were partially offset by decreases in service charges of $79,000 and bank-owned life insurance income of $188,000 caused by a one time premium benefit awarded in 2010 and not repeated in 2011.
Total assets at December 31, 2011 were $1.433 billion, an increase of 18.7 percent from assets of $1.207 billion at December 31, 2010. The increase in assets reflects the growth of $108.7 million in our investment securities portfolio as the Corporation sought to deploy cash from increased deposit production into a more efficient earning asset mix. The growth in the investment securities portfolio was funded primarily through deposit growth of $261.1 million, which also resulted in increases in cash and due from banks of $73.6 million and loans net of the allowance for loan losses of $46.8 million. The Corporation has made a concerted effort to reduce non-core balances and, as mentioned in the preceding sentence, its uninvested cash position was increased by $73.6 million in 2011. Additionally, there has been a concerted effort to reduce higher costing retail deposits.
Loan demand improved in 2011. Overall, the portfolio increased year over year by approximately $46.8 million or 6.7 percent from 2010. Demand for commercial real estate loans prevailed throughout the year in the Corporation’s market in New Jersey, despite the economic climate at both the state and national levels and market turmoil following the crisis in the sub-prime markets. The Corporation is encouraged by loan demand and positive momentum is expected to continue in growing that segment of earning assets in 2012. However, the Corporation continues to remain concerned with the credit stability of the broader markets due to the weakened economic climate.
Asset quality continues to remain high and credit culture conservative. Even so, the stability of the economy and credit markets remains uncertain and as such, has had an impact on certain credits within our portfolio. The Corporation continued to make provisions to the allowance for loan losses as efforts are made to stabilize credit quality issues. At December 31, 2011, non-performing assets totaled $8.5 million or 0.59 percent of total assets, and $11.9 million or 0.98 percent at December 31, 2010. The decrease in non-performing assets from December 31, 2010 was achieved notwithstanding the addition of several new residential loans (totaling approximately $2.6 million) and commercial loans (totaling approximately $1.4 million) into non-performing status. This was more than offset by decreases from pay-downs of $5.0 million, total charge-offs of $0.7 million of existing loans, and the transfer to performing troubled debt restructured from non-accrual status of $1.7 million.
At December 31, 2011, the total allowance for loan losses amounted to approximately $9.6 million, or 1.27 percent of total loans. The allowance for loan losses as a percent of total non-performing loans amounted to 121.5 percent at December 31, 2011 and 74.6 percent at December 31, 2010. This increase in the ratio from December 31, 2010 to December 31, 2011 was due to the decrease in the level of non-performing assets, along with an increase in the allowance for loan loss from $8.9 million at December 31, 2010.
Deposits totaled $1.1 billion at December 31, 2011, increasing $261.1 million, or 30.3%, since December 31, 2010. Total Demand, Savings, Money Market, and certificates of deposit less than $100,000 increased $242.7 million or 32.8% from December 31, 2010. Time certificates of deposit of $100,000 or more increased by $18.3 million or 15.3% from December 31, 2010. These increases were attributable to continued core deposit growth in overall segments of the deposit base and in niche areas, such as municipal government, private schools and universities.
Certificates of deposit $100,000 and greater decreased to 12.3 percent of total deposits at December 31, 2011 from 13.9 percent one year earlier. Some of the Corporation’s depositors have become sensitive to obtaining full FDIC insurance for their time deposits. To accommodate its customers, the Corporation began offering Certificates of Deposit Account Registry Service (CDARS) in 2008.
Total stockholders’ equity increased 12.4 percent in 2011 to $135.9 million, and represented 9.49 percent of total assets at year-end. Book value per common share (total common stockholders’ equity divided by the number of shares outstanding) increased to $7.63 as compared with $6.83 a year ago, primarily as a result of earnings of $13.9 million in 2011. Tangible book value per common share (which excludes goodwill and other intangibles from common stockholders’ equity) increased to $6.60 from $5.79 a year ago; see Item 6 of this Annual Report on Form 10-K for a reconciliation of tangible book value (which is a non-GAAP financial measure) to book value. Return on average stockholders’ equity for the year ended December 31, 2011 was 10.72 percent compared to 6.30 percent for 2010. This increase was attributable to higher earnings in 2011 compared with 2010 partially offset by higher average equity due primarily to both the capital raise from the 2010 stock offering and benefit from the capital received under the SBLF program. The Tier I Leverage capital ratio decreased to 9.29 percent of total assets at December 31, 2011, as compared with 9.90 percent at December 31, 2010.
The Corporation’s capital base includes $11.4 million in capital raised from the stock and rights offerings completed in 2010, as well as the $11.25 million of capital received from the U.S. Treasury under the Small Business Lending Fund Program in 2011 and simultaneously, using the proceed from issuance of SBLF preferred stock to redeem the $10 million of capital received from the U.S. Treasury under the Capital Purchase Program. It also includes $5.2 million in subordinated debentures at December 31, 2011 and December 31, 2010. This issuance of $5.0 million in floating rate MMCapS(SM) Securities occurred on December 19, 2003. These securities presently are included as a component of Tier I capital for regulatory capital purposes. In accordance with FASB ASC 810, these securities are classified as subordinated debentures on the Corporation’s Consolidated Statements of Condition.
The Corporation’s risk-based capital ratios at December 31, 2011 were 12.00 percent for Tier I capital and 12.89 percent for total risk-based capital. Total Tier I capital increased to approximately $129.4 million at December 31, 2011 from $116.6 million at December 31, 2010. The increase in Tier I capital primarily reflects earnings and the new capital received during 2011.
The Corporation announced an increase in its common stock buyback program on September 28, 2007 and June 26, 2008, under which the Parent Corporation was authorized to purchase up to 2,039,731 shares of Center Bancorp’s outstanding common stock. As of December 31, 2011, the Parent Corporation had repurchased 1,386,863 shares under the program at an average cost of $11.44 per share. As repurchases were restricted pursuant to the Parent Corporation’s participation in TARP, there were no repurchases during 2011. On September 15, 2011, the Parent Corporation issued $11.25 million in nonvoting senior preferred stock to the Treasury under the Small Business Lending Fund Program. Under the Securities Purchase Agreement, the Parent Corporation issued to the Treasury a total of 11,250 shares of the Parent Corporation’s Senior Non-Cumulative Perpetual Preferred Stock, Series B, having a liquidation value of $1,000 per share. See Item 5 of this Annual Report on Form 10K.
The following sections discuss the Corporation’s Results of Operations, Asset and Liability Management, Liquidity and Capital Resources.
Results of Operations
Net income for the year ended December 31, 2011 was 13,926,000 as compared to $7,004,000 earned in 2010 and $3,771,000 earned in 2009, an increase of 98.8 percent from 2010 to 2011. For 2011, the basic and fully diluted earnings per common share was $0.80 per share as compared with $0.43 per share in 2010 and $0.24 per share in 2009.
For the year ended December 31, 2011, the Corporation’s return on average stockholders’ equity (“ROE”) was 10.73 percent and its return on average assets (“ROA”) was 1.05 percent. The Corporation’s return on average tangible stockholders’ equity (“ROATE”) was 12.33 percent for 2011. The comparable ratios for the year ended December 31, 2010, were ROE of 6.30 percent, ROA of 0.59 percent, and ROATE of 7.44 percent. See the discussion and reconciliation of ROATE, which is a non-GAAP financial measure, under Item 6 of this Annual Report on Form 10-K.
Earnings for 2011 benefitted from increases in net interest income and non interest income and from decreases in the provision for loan loss and non interest expense as increases in salaries and benefits and
OREO expenses were offset by reductions in FDIC insurance, marketing and advertising expense, costs related to the one time charges connected with a one-time termination fee in the first quarter of 2010 of $594,000 on a structured securities repurchase agreement that did not recur in 2011and a $437,000 loss on fixed assets which was recorded in 2010 and did not recur in 2011.
Net Interest Income
The following table presents the components of net interest income on a tax-equivalent basis for the past three years
| 2011 | 2010 | 2009 | ||||||||||||||||||||||||||||||||||
| Amount | Increase (Decrease) from Prior Year | Percent Change | Amount | Increase (Decrease) from Prior Year | Percent Change | Amount | Increase (Decrease) from Prior Year | Percent Change | ||||||||||||||||||||||||||||
| (Dollars in Thousands) | ||||||||||||||||||||||||||||||||||||
| Interest income: | ||||||||||||||||||||||||||||||||||||
| Investment available-for-sale | $ | 14,049 | $ | 2,990 | 27.04 | $ | 11,059 | $ | (3,279 | ) | (2.29 | ) | $ | 14,338 | $ | (67 | ) | (1.24 | ) | |||||||||||||||||
| Investment held-to-maturity | 1,970 | 1,970 | 100.00 | — | — | — | — | — | — | |||||||||||||||||||||||||||
| Loans, including fees | 36,320 | (880 | ) | (2.37 | ) | 37,200 | 449 | 1.22 | 36,751 | 641 | 1.78 | |||||||||||||||||||||||||
| Federal funds sold and securities purchased under agreements to resell | — | — | — | — | — | — | — | (113 | ) | (100.00 | ) | |||||||||||||||||||||||||
| Restricted investment in bank stocks | 464 | (104 | ) | (18.31 | ) | 568 | 37 | 6.97 | 531 | (63 | ) | 8.25 | ||||||||||||||||||||||||
| Total interest income | 52,803 | 3,976 | 8.14 | 48,827 | (2,793 | ) | (5.41 | ) | 51,620 | 398 | 0.78 | |||||||||||||||||||||||||
| Interest expense: | ||||||||||||||||||||||||||||||||||||
| Deposits | 5,520 | (486 | ) | (8.09 | ) | 6,006 | (6,302 | ) | (51.20 | ) | 12,308 | (979 | ) | (7.37 | ) | |||||||||||||||||||||
| Borrowings | 6,657 | (2,122 | ) | (24.17 | ) | 8,779 | (1,558 | ) | (15.07 | ) | 10,337 | (471 | ) | (4.36 | ) | |||||||||||||||||||||
| Total interest expense | 12,177 | (2,608 | ) | (17.64 | ) | 14,785 | (7,860 | ) | (34.71 | ) | 22,645 | (1,450 | ) | (6.02 | ) | |||||||||||||||||||||
| Net interest income on a fully tax-equivalent basis | 40,626 | 6,584 | 19.34 | 34,042 | 5,067 | 17.49 | 28,975 | 1,848 | 6.81 | |||||||||||||||||||||||||||
| Tax-equivalent adjustment | (876 | ) | (763 | ) | 675.22 | (113 | ) | 397 | (77.84 | ) | (510 | ) | 818 | (61.60 | ) | |||||||||||||||||||||
| Net interest income | $ | 39,750 | $ | 5,821 | 17.16 | $ | 33,929 | $ | 5,464 | 19.20 | $ | 28,465 | $ | 2,666 | 10.33 | |||||||||||||||||||||
Note: The tax-equivalent adjustment was computed based on an assumed statutory Federal income tax rate of 34 percent. Adjustments were made for interest earned on tax-advantaged instruments.
Historically, the most significant component of the Corporation’s earnings has been net interest income, which is the difference between the interest earned on the portfolio of earning assets (principally loans and investments) and the interest paid for deposits and borrowings, which support these assets. There were several factors that affected net interest income during 2011, including the volume, pricing, mix and maturity of interest-earning assets and interest-bearing liabilities and interest rate fluctuations.
Net interest income is directly affected by changes in the volume and mix of interest-earning assets and interest-bearing liabilities, which support those assets, as well as changes in the rates earned and paid. Net interest income is presented in this financial review on a tax equivalent basis by adjusting tax-exempt income (primarily interest earned on various obligations of state and political subdivisions) by the amount of income tax which would have been paid had the assets been invested in taxable issues, and then in accordance with the Corporation’s consolidated financial statements. Accordingly, the net interest income data presented in this financial review differ from the Corporation’s net interest income components of the Consolidated Financial Statements presented elsewhere in this report.
Net interest income, on a fully tax-equivalent basis, for the year ended December 31, 2011 increased $6.6 million, or 19.3 percent, to $40.6 million, from $34.0 million for 2010. The Corporation’s net interest margin increased 23 basis points to 3.53 percent from 3.30 percent. From 2009 to 2010, net interest income on a tax equivalent basis increased by $5.0 million and the net interest margin increased by 45 basis points. During 2011, our net interest margin was positively impacted by increases in the investment portfolio and net loans funded by increases in core deposits, a decrease in high yielding time deposits in excess of $100,000 and reductions in borrowings.
The change in net interest income from 2010 to 2011 was attributable in part to the reduction in short-term interest rates that occurred in 2008 and have remained at historic low levels throughout 2011 coupled with a sustained steepening of the interest rate yield curve. Steps were taken during 2010 and 2011 to improve the Corporation’s net interest margin by continuing to lower rates in concert with the decline in market benchmark rates. However, in light of the financial crisis, the Corporation experienced growth of $23.0 million in non-interest bearing deposits during 2011 and, $219.8 million in savings, money market and time deposits under $100,000 during 2011 as customers’ desire for safety and liquidity remained paramount in light of their overall investment concerns. During 2011, the Corporation made a concerted effort to reduce non-core, single service deposits, and accordingly its uninvested cash position, which had an adverse impact on the Corporation’s net interest margin during 2011. However, during the twelve months ended December 31, 2011, the Corporation’s net interest spread improved by 26 basis points as a 16 basis point decrease in the average yield on interest-earning assets was more than offset by a 42 basis point decrease in the average interest rates paid on interest-bearing liabilities.
For the year ended December 31, 2011, average interest-earning assets increased by $121.5 million to $1.15 billion, as compared with the year ended December 31, 2010. The 2011 change in average interest-earning asset volume was primarily due to increased investment volume and to a lesser degree increased loan volume. Increased average investment volume in 2011 was funded primarily by the increased deposit growth. Average interest-bearing liabilities increased by $104.1 million, due primarily to increase in interest bearing deposits of $153.6 million partially offset by decreases in borrowings of $49.5 million. During the third quarter of 2011 certain sweep relationships, in the amount of approximately $37 million, that were previously classified as short term borrowings were discontinued and were moved to interest bearing checking accounts.
For the year ended December 31, 2010, average interest-earning assets increased by $12.3 million to $1.031 billion, as compared with the year ended December 31, 2009. The 2010 change in average interest-earning asset volume was primarily due to increased loan volume. Increased average loan volume in 2010 was funded primarily by the reduction of the uninvested cash position.
The factors underlying the year-to-year changes in net interest income are reflected in the tables presented on pages 39 and 41, each of which have been presented on a tax-equivalent basis (assuming a 34 percent tax rate). The table on page 41 (Average Statements of Condition with Interest and Average Rates) shows the Corporation’s consolidated average balance of assets, liabilities and stockholders’ equity, the amount of income produced from interest-earning assets and the amount of expense incurred from interest-bearing liabilities, and net interest income as a percentage of average interest-earning assets.
Net Interest Margin
The following table quantifies the impact on net interest income (on a tax-equivalent basis) resulting from changes in average balances and average rates over the past three years. Any change in interest income or expense attributable to both changes in volume and changes in rate has been allocated in proportion to the relationship of the absolute dollar amount of change in each category.
Analysis of Variance in Net Interest Income Due to Volume and Rates
| 2011/2010 Increase (Decrease) Due to Change in: | 2010/2009 Increase (Decrease) Due to Change in: | |||||||||||||||||||||||
| Average Volume | Average Rate | Net Change | Average Volume | Average Rate | Net Change | |||||||||||||||||||
| (Dollars in Thousands) | ||||||||||||||||||||||||
| Interest-earning assets: | ||||||||||||||||||||||||
| Investment securities: | ||||||||||||||||||||||||
| Available for sale | ||||||||||||||||||||||||
| Taxable | $ | 1,885 | $ | (55 | ) | $ | 1,830 | $ | 700 | $ | (2,813 | ) | $ | (2,113 | ) | |||||||||
| Non-Taxable | 1,181 | (21 | ) | 1,160 | (1,122 | ) | (44 | ) | (1,166 | ) | ||||||||||||||
| Held to maturity | ||||||||||||||||||||||||
| Taxable | 887 | — | 887 | — | — | — | ||||||||||||||||||
| Non-Taxable | 1,083 | — | 1,083 | — | — | — | ||||||||||||||||||
| Loans, net of unearned discount | 510 | (1,390 | ) | (880 | ) | 1,002 | (553 | ) | 449 | |||||||||||||||
| Restricted investment in bank stocks | (59 | ) | (45 | ) | (104 | ) | (12 | ) | 49 | 37 | ||||||||||||||
| Total interest-earning assets | 5,487 | (1,511 | ) | 3,976 | 568 | (3,361 | ) | (2,793 | ) | |||||||||||||||
| Interest-bearing liabilities: | ||||||||||||||||||||||||
| Money market deposits | 461 | (305 | ) | 156 | 54 | (749 | ) | (695 | ) | |||||||||||||||
| Savings deposits | 77 | (368 | ) | (291 | ) | 286 | (1,110 | ) | (824 | ) | ||||||||||||||
| Time deposits | 158 | (567 | ) | (409 | ) | (1,905 | ) | (2,262 | ) | (4,167 | ) | |||||||||||||
| Other interest-bearing deposits | 314 | (256 | ) | 58 | 309 | (925 | ) | (616 | ) | |||||||||||||||
| Borrowings and subordinated debentures | (1,701 | ) | (421 | ) | (2,122 | ) | (709 | ) | (849 | ) | (1,558 | ) | ||||||||||||
| Total interest-bearing liabilities | (691 | ) | (1,917 | ) | (2,608 | ) | (1,965 | ) | (5,895 | ) | (7,860 | ) | ||||||||||||
| Change in net interest income | $ | 6,178 | $ | 406 | $ | 6,584 | $ | 2,533 | $ | 2,534 | $ | 5,067 | ||||||||||||
Interest income on a fully tax-equivalent basis for the year ended December 31, 2011 increased by approximately $4.0 million or 8.1 percent as compared with the year ended December 31, 2010. This increase was due primarily to an increase in balances of the Corporation’s investment securities portfolios offset in part by a decline in rates due to the actions taken by the Federal Reserve to lower market interest rates. The Corporation’s loan portfolio increased on average $4.5 million to $712.9 million from $708.4 million in 2010, primarily driven by growth in commercial loans and commercial real estate.
The loan portfolio represented approximately 61.9 percent of the Corporation’s interest-earning assets (on average) during 2011 and 68.7 percent for 2010. Average investment securities increased during 2011 by $118.1 million compared to 2010 as the Corporation has continued to increase its concentration in tax-exempt securities and focused on purchases of lower risk-based mortgage backed securities. The average yield on interest-earning assets decreased from 4.74 percent in 2010 to 4.58 percent in 2011.
The increase in the volume of loans in 2011 primarily reflected increases in commercial and commercial real estate loans. The increase in the average volume on total interest-earning assets created an increase in interest income of $5.5 million, as compared with a decline of $1.5 million attributable to rate decreases in most interest-earning assets.
Interest income (fully tax-equivalent) decreased by $2.8 million from 2009 to 2010 primarily due to a decrease in balances of the Corporation’s investment securities portfolios offset in part by an increase in the loan portfolio and a decline in rates due to the actions taken by the Federal Reserve to lower market interest rates.
The Federal Open Market Committee (“FOMC”) kept the Federal Funds target rate at zero to 0.25 percent throughout 2011. This action by the FOMC allowed the Corporation to reduce liability costs throughout 2011.
Interest expense for the year ended December 31, 2011 was principally impacted by rate related factors. The rate related changes resulted in decreased expense on most interest-bearing deposits and borrowings in 2011. For the year ended December 31, 2011, interest expense decreased $2.6 million or 17.6 percent as compared with 2010. During 2011, the Corporation continued to lower rates in concert with the decline in market benchmark rates. The result was an improvement in the Corporation’s cost of funds and net interest spread. Average interest-bearing liabilities increased $104.1 million; the growth was represented in all deposit categories as the flight to quality continued as depositors sought the safety of FDIC insurance.
For the year ended December 31, 2010, interest expense decreased $7.9 million or 34.7 percent as compared with 2009. Total interest-bearing liabilities decreased on average $72.1 million, primarily in CDARS Reciprocal deposits and in borrowings. The Corporation’s net interest spread on a tax-equivalent basis (i.e., the average yield on average interest-earning assets, calculated on a tax equivalent basis, minus the average rate paid on interest-bearing liabilities) increased 26 basis points to 3.39 percent in 2011 from 3.13 percent for the year ended December 31, 2010. The increase in 2011 reflected an expansion of spreads between yields earned on loans and investments and rates paid for supporting funds. During 2011, spreads improved due in part to monetary policy maintained by the FOMC keeping the Federal funds rate at zero to 0.25 percent throughout 2011 coupled with a steepening of the yield curve that occurred during 2011.
The net interest spread increased 34 basis points in 2010 as compared with 2009, primarily as a result of an expansion of spreads between yields earned on loans and investments and rates paid for supporting funds. During 2010, spreads improved due in part to monetary policy maintained by the FOMC keeping the Federal funds rate at zero to 0.25 percent throughout 2010 coupled with a steepening of the yield curve that occurred during 2010.
The cost of total average interest-bearing liabilities decreased to 1.19 percent, a decrease of 42 basis points, for the year ended December 31, 2011, from 1.61 percent for the year ended December 31, 2010, which followed a decrease of 67 basis points from 2.28 percent for the year ended December 31, 2009.
The contribution of non-interest-bearing sources (i.e., the differential between the average rate paid on all sources of funds and the average rate paid on interest-bearing sources) decreased to16 basis points, a decrease of 5 basis points in 2011 from 2010. Comparing 2010 and 2009, there was a decrease of 5 basis points to 21 basis points on average from 26 basis points on average during the year ended December 31, 2009.
The following table, “Average Statements of Condition with Interest and Average Rates”, presents for the years ended December 31, 2011, 2010 and 2009, the Corporation’s average assets, liabilities and stockholders’ equity. The Corporation’s net interest income, net interest spreads and net interest income as a percentage of interest-earning assets (net interest margin) are also reflected.
AVERAGE STATEMENTS OF CONDITION WITH INTEREST AND AVERAGE RATES
| Years Ended December 31, | ||||||||||||||||||||||||||||||||||||
| 2011 | 2010 | 2009 | ||||||||||||||||||||||||||||||||||
| (Tax-Equivalent Basis) | Average Balance | Income/ Expense | Yield/ Rate | Average Balance | Income/ Expense | Yield/ Rate | Average Balance | Income/ Expense | Yield/ Rate | |||||||||||||||||||||||||||
| (Dollars in Thousands) | ||||||||||||||||||||||||||||||||||||
| ASSETS | ||||||||||||||||||||||||||||||||||||
| Interest-earning assets: | ||||||||||||||||||||||||||||||||||||
| Investment securities:(1) | ||||||||||||||||||||||||||||||||||||
| Available for sale | ||||||||||||||||||||||||||||||||||||
| Taxable | $ | 359,939 | $ | 12,556 | 3.49 | % | $ | 305,927 | $ | 10,726 | 3.51 | % | $ | 289,414 | $ | 12,839 | 4.44 | % | ||||||||||||||||||
| Non-taxable | 28,067 | 1,493 | 5.32 | % | 5,880 | 333 | 5.66 | % | 25,677 | 1,499 | 5.84 | % | ||||||||||||||||||||||||
| Held to maturity | ||||||||||||||||||||||||||||||||||||
| Taxable | 23,041 | 887 | 3.85 | % | — | — | — | % | — | — | — | % | ||||||||||||||||||||||||
| Non-taxable | 18,869 | 1,083 | 5.74 | % | — | — | — | % | — | — | — | % | ||||||||||||||||||||||||
| Loans, net of unearned income:(2) | 712,895 | 36,320 | 5.09 | % | 708,425 | 37,200 | 5.25 | % | 692,562 | 36,751 | 5.31 | % | ||||||||||||||||||||||||
| Restricted investment in bank stocks | 9,185 | 464 | 5.05 | % | 10,293 | 568 | 5.52 | % | 10,526 | 531 | 5.04 | % | ||||||||||||||||||||||||
| Total interest-earning assets | 1,151,996 | 52,803 | 4.58 | % | 1,030,525 | 48,827 | 4.74 | % | 1,018,179 | 51,620 | 5.07 | % | ||||||||||||||||||||||||
| Non-interest-earning assets: | ||||||||||||||||||||||||||||||||||||
| Cash and due from banks | 99,607 | 81,681 | 128,156 | |||||||||||||||||||||||||||||||||
| Bank owned life insurance | 28,405 | 27,045 | 24,941 | |||||||||||||||||||||||||||||||||
| Intangible assets | 16,930 | 16,993 | 17,069 | |||||||||||||||||||||||||||||||||
| Other assets | 33,984 | 36,817 | 42,980 | |||||||||||||||||||||||||||||||||
| Allowance for loan losses | (9,660 | ) | (8,579 | ) | (6,916 | ) | ||||||||||||||||||||||||||||||
| Total non-interest earning assets | 169,266 | 153,957 | 206,230 | |||||||||||||||||||||||||||||||||
| Total assets | $ | 1,321,262 | $ | 1,184,482 | $ | 1,224,409 | ||||||||||||||||||||||||||||||
| LIABILITIES & STOCKHOLDERS’ EQUITY | ||||||||||||||||||||||||||||||||||||
| Interest-bearing liabilities: | ||||||||||||||||||||||||||||||||||||
| Money market deposits | $ | 204,664 | $ | 1,096 | 0.54 | % | $ | 127,614 | $ | 940 | 0.74 | % | $ | 123,427 | $ | 1,635 | 1.32 | % | ||||||||||||||||||
| Savings deposits | 179,759 | 935 | 0.52 | % | 168,591 | 1,226 | 0.73 | % | 145,536 | 2,050 | 1.41 | % | ||||||||||||||||||||||||
| Time deposits | 223,560 | 2,274 | 1.02 | % | 210,565 | 2,683 | 1.27 | % | 319,639 | 6,850 | 2.14 | % | ||||||||||||||||||||||||
| Other interest-bearing deposits | 221,839 | 1,215 | 0.55 | % | 169,479 | 1,157 | 0.68 | % | 140,890 | 1,773 | 1.26 | % | ||||||||||||||||||||||||
| Short-term and long-term borrowings | 190,343 | 6,497 | 3.41 | % | 239,777 | 8,568 | 3.57 | % | 258,607 | 10,146 | 3.92 | % | ||||||||||||||||||||||||
| Subordinated debentures | 5,155 | 160 | 3.10 | % | 5,155 | 211 | 4.09 | % | 5,155 | 191 | 3.71 | % | ||||||||||||||||||||||||
| Total interest-bearing liabilities | 1,025,320 | 12,177 | 1.19 | % | 921,181 | 14,785 | 1.61 | % | 993,254 | 22,645 | 2.28 | % | ||||||||||||||||||||||||
| Non-interest-bearing liabilities: | ||||||||||||||||||||||||||||||||||||
| Demand deposits | 159,059 | 142,364 | 124,966 | |||||||||||||||||||||||||||||||||
| Other non-interest-bearing deposits | — | — | 333 | |||||||||||||||||||||||||||||||||
| Other liabilities | 7,045 | 9,801 | 12,003 | |||||||||||||||||||||||||||||||||
| Total non-interest-bearing liabilities | 166,104 | 152,165 | 137,302 | |||||||||||||||||||||||||||||||||
| Stockholders’ equity | 129,838 | 111,136 | 93,853 | |||||||||||||||||||||||||||||||||
| Total liabilities and stockholders’ equity | $ | 1,321,262 | $ | 1,184,482 | $ | 1,224,409 | ||||||||||||||||||||||||||||||
| Net interest income (tax-equivalent basis) | 40,626 | 34,042 | 28,975 | |||||||||||||||||||||||||||||||||
| Net interest spread | 3.39 | % | 3.13 | % | 2.79 | % | ||||||||||||||||||||||||||||||
| Net interest income as percent of earning assets (margin) | 3.53 | % | 3.30 | % | 2.85 | % | ||||||||||||||||||||||||||||||
| Tax-equivalent adjustment(3) | (876 | ) | (113 | ) | (510 | ) | ||||||||||||||||||||||||||||||
| Net interest income | $ | 39,750 | $ | 33,929 | $ | 28,465 | ||||||||||||||||||||||||||||||
Investment Portfolio
For the year ended December 31, 2011, the average volume of investment securities increased by $118.1 million to approximately $429.9 million or 37.3 percent of average earning assets, from $311.8 million on average, or 30.3 percent of average earning assets, in 2010. At December 31, 2011, the total investment portfolio amounted to $486.7 million, an increase of $108.7 million from December 31, 2010. The increase at year-end and average volume of investment securities reflects the fact that with the strong deposit growth experienced during 2011 and large buildup of liquidity, the Corporation began to prudently expand the size of its investment portfolio in an effort to deploy excess cash into earning assets. At December 31, 2011, the principal components of the investment portfolio are U.S. Government Agency Obligations, Federal Agency Obligations including mortgage-backed securities, Obligations of U.S. states and political subdivision, corporate bonds and notes, and other debt and equity securities.
In the past, the Corporation’s investment portfolio also consisted of overnight investments that were made in the Reserve Primary Fund (the “Fund”), a money market fund registered with the Securities and Exchange Commission as an investment company under the Investment Company Act of 1940. On September 22, 2008, the Fund announced that redemptions of shares of the Fund were suspended pursuant to an SEC order so that an orderly liquidation could be effected for the protection of the Fund’s investors. Through December 31, 2011, the Corporation received six distributions from the Fund, totaling approximately 99 percent of its outstanding balance. During the fourth quarter of 2009, the Corporation recorded a $364,000, or approximately 1 percent, other-than-temporary impairment charge to earnings relating to this court ordered liquidation of the Fund. The Corporation’s outstanding carrying balance in the Fund as of December 31, 2011 was zero. Future liquidation distributions received by the Corporation, if any, will be recorded to earnings.
During the year ended December 31, 2011, volume related factors increased investment revenue by $5.0 million, while rate related factors decreased investment revenue by $76,000. The tax-equivalent yield on investments increased by 18 basis points to 3.73 percent from a yield of 3.55 percent during the year ended December 31, 2010. The increase in the investment portfolio resulted from the large buildup of liquidity, which caused the Corporation to prudently expand the size of its investment portfolio in an effort to deploy excess cash into earning assets. The yield on the portfolio increased compared to 2010 due primarily to tax exempt securities which, due to higher tax equivalent yields, improved the overall yield.
During 2011, the Corporation reclassified at fair value approximately $66.8 million in available-for-sale investment securities to the held-to-maturity category. The related after-tax gains of approximately $159,000 (on a pre-tax basis of $245,000) remained in accumulated other comprehensive income and will be amortized over the remaining life of the securities as an adjustment of yield, offsetting the related amortization of the premium or accretion of the discount on the transferred securities. No gains or losses were recognized at the time of reclassification. Management considers the held-to-maturity classification of these investment securities to be appropriate as the Corporation has the positive intent and ability to hold these securities to maturity.
The Corporation owns two pooled trust preferred securities (“Pooled TRUPS”), which consists of securities issued by financial institutions and insurance companies. The Corporation holds the mezzanine tranche of these securities. Senior tranches generally are protected from defaults by over-collateralization and cash flow default protection provided by subordinated tranches, with senior tranches having the greatest protection and mezzanine tranches subordinated to the senior tranches. One of the Pooled TRUPS, ALESCO VI, has incurred its eleventh interruption of cash flow payments to date. Management reviewed the expected cash flow analysis and credit support to determine if it was probable that all principal and interest would be repaid, and no other-than-temporary impairment charges were recorded for the twelve months ended December 31, 2011. The new cost basis for this security had been written down to $290,000. The other Pooled TRUP, ALESCO VII, incurred its ninth interruption of cash flow payments to date. Management determined that no other-than-temporary impairment charge exists on this security as well for the twelve months ended December 31, 2011. The new cost basis for this security had been written down to $834,000.
One of the Pooled TRUPS, ALESCO VI, incurred its seventh interruption of cash flow payments in 2010. Management reviewed the cash flow analysis and credit support to determine if it was probable that all principal and interest would be repaid, and recorded a $33,000 other-than-temporary impairment charge for the three months ended December 31, 2010 and $500,000 for the twelve months ended December 31, 2010,
which represented 15.6 percent of the par amount of $3.2 million. At December 31, 2010 the new cost basis for this security had been written down to $227,000. The other Pooled TRUP incurred, ALESCO VII, its fifth interruption of cash flow payments to date. Management determined that an other-than-temporary impairment existed on this security as well and recorded a $677,000 charge during the fourth quarter of 2010, and $1.3 million for the twelve months ended December 31, 2010, which represented 41.9 percent of the par amount of $3.1 million. At December 31, 2010 the new cost basis for this security had been written down to $779,000.
The Corporation owns 3 variable rate private label collateralized mortgage obligations (CMO), which were also evaluated for impairment. Management had applied aggressive default rates to identify if any credit impairment exists, as these bonds were downgraded to below investment grade. The Corporation recorded $324,000 in principal losses and an $18,000 other-than-temporary impairment charge on these bonds in 2011, and expects additional losses in future periods. The new cost basis for these securities had been written down to $3.2 million. The Corporation recorded $398,000 in principal losses on these bonds and $360,000 other-than-temporary charge in 2010.
Securities available-for-sale are a part of the Corporation’s interest rate risk management strategy and may be sold in response to changes in interest rates, changes in prepayment risk, liquidity management and other factors. The Corporation continues to reposition the investment portfolio as part of an overall corporate-wide strategy to produce reasonable and consistent margins where feasible, while attempting to limit risks inherent in the Corporation’s balance sheet.
At December 31, 2011, the net unrealized loss carried as a component of accumulated other comprehensive income and included in stockholders’ equity, net of tax, amounted to a net unrealized loss of $2.2 million as compared with a net unrealized loss of $5.3 million at December 31, 2010, resulting from changes in market conditions and interest rates at December 31, 2011. As a result of the inactive condition of the markets amidst the financial crisis, the Corporation elected to treat certain securities under a permissible alternate valuation approach at December 31, 2011 and 2010. For additional information regarding the Corporation’s investment portfolio, see Note 4 and Note 18 of the Notes to the Consolidated Financial Statements.
During 2011, securities sold from the Corporation’s available-for-sale portfolio amounted to $254.8 million, as compared with $644.1 million in 2010. The gross realized gains on securities sold amounted to approximately $4,045,000 in 2011 compared to $4,872,000 in 2010, while the gross realized losses, which included impairment charges of $342,000, amounted to approximately $411,000 in 2011 compared to $635,000 in 2010. During 2011, the Corporation recorded an $18,000 loss on Other Than Temporary Impairment charges on a variable rate private label CMO and $324,000 in principal losses on the same variable rate private label CMO. During 2010, the Corporation recorded a $3.0 million other-than-temporary charge on its trust preferred securities, $1.8 million on two pooled trust preferred securities and $360,000 on a variable rate private label CMO and $398,000 in principal losses on this variable rate private label CMO.
The table below illustrates the maturity distribution and weighted average yield on a tax-equivalent basis for investment securities at December 31, 2011, on a contractual maturity basis.
| Federal Agency Obligations | Residential Mortgage Pass-through Securities | Commercial Mortgage Pass-through Securities | Obligations in U.S. States & Political Subdivisions | Trust Preferred | Corporate Bonds & Notes | Collateralized Mortgage Obligations | Asset-backed Securities | Equity Securities | Total | |||||||||||||||||||||||||||||||
| (Dollars in thousands) | ||||||||||||||||||||||||||||||||||||||||
| Investment Securities Available-for-Sale | ||||||||||||||||||||||||||||||||||||||||
| Due in 1 year or less | ||||||||||||||||||||||||||||||||||||||||
| Amortized Cost | $ | — | $ | — | $ | — | $ | — | $ | — | $ | 4,143 | $ | — | $ | — | $ | — | $ | 4,143 | ||||||||||||||||||||
| Market Value | $ | — | $ | — | $ | — | $ | — | $ | — | $ | 4,118 | $ | — | $ | — | $ | — | $ | 4,118 | ||||||||||||||||||||
| Weighted Average Yield | — | % | — | % | — | % | — | % | — | % | 1.91 | % | — | % | — | % | — | % | 1.91 | % | ||||||||||||||||||||
| Due after one year through five years | ||||||||||||||||||||||||||||||||||||||||
| Amortized Cost | $ | 43 | $ | — | $ | — | $ | 2,055 | $ | — | $ | 79,700 | $ | — | $ | — | $ | — | $ | 81,798 | ||||||||||||||||||||
| Market Value | $ | 43 | $ | — | $ | — | $ | 2,049 | $ | — | $ | 79,046 | $ | — | $ | — | $ | — | $ | 81,138 | ||||||||||||||||||||
| Weighted Average Yield | 0.90 | % | — | % | — | % | 1.53 | % | — | % | 2.55 | % | — | % | — | % | — | % | 2.52 | % | ||||||||||||||||||||
| Due after five years through ten years | ||||||||||||||||||||||||||||||||||||||||
| Amortized Cost | $ | 44 | $ | 5,507 | $ | — | $ | 16,113 | $ | — | $ | 88,521 | $ | — | $ | 3,716 | $ | — | $ | 113,901 | ||||||||||||||||||||
| Market Value | $ | 45 | $ | 5,577 | $ | — | $ | 16,821 | $ | — | $ | 86,520 | $ | — | $ | 3,769 | $ | — | $ | 112,732 | ||||||||||||||||||||
| Weighted Average Yield | 2.00 | % | 2.04 | % | — | % | 2.67 | % | — | % | 4.25 | % | — | % | 1.43 | % | — | % | 3.83 | % | ||||||||||||||||||||
| Due after ten years | ||||||||||||||||||||||||||||||||||||||||
| Amortized Cost | $ | 24,694 | $ | 107,706 | $ | — | $ | 48,141 | $ | 20,567 | $ | 3,448 | $ | 3,226 | $ | 3,898 | $ | 6,417 | $ | 218,097 | ||||||||||||||||||||
| Market Value | $ | 24,881 | $ | 109,787 | $ | — | $ | 50,303 | $ | 16,187 | $ | 3,433 | $ | 1,899 | $ | 3,884 | $ | 6,145 | $ | 216,519 | ||||||||||||||||||||
| Weighted Average Yield | 2.18 | % | 3.18 | % | — | % | 3.58 | % | 5.93 | % | 5.52 | % | 2.91 | % | 3.78 | % | — | % | 3.36 | % | ||||||||||||||||||||
| Total Investment Securities AFS | ||||||||||||||||||||||||||||||||||||||||
| Amortized Cost | $ | 24,781 | $ | 113,213 | $ | — | $ | 66,309 | $ | 20,567 | $ | 175,812 | $ | 3,226 | $ | 7,614 | $ | 6,417 | $ | 417,939 | ||||||||||||||||||||
| Market Value | $ | 24,969 | $ | 115,364 | $ | — | $ | 69,173 | $ | 16,187 | $ | 173,117 | $ | 1,899 | $ | 7,653 | $ | 6,145 | $ | 414,507 | ||||||||||||||||||||
| Weighted Average Yield | 2.18 | % | 3.12 | % | — | % | 3.30 | % | 5.93 | % | 3.45 | % | 2.91 | % | 2.63 | % | — | % | 3.31 | % | ||||||||||||||||||||
| Investment Securities Held-to-Maturity | ||||||||||||||||||||||||||||||||||||||||
| Due after five years through ten years | ||||||||||||||||||||||||||||||||||||||||
| Amortized Cost | $ | — | $ | — | $ | 3,133 | $ | 1,326 | $ | — | $ | — | $ | — | $ | — | $ | — | $ | 4,459 | ||||||||||||||||||||
| Market Value | $ | — | $ | — | $ | 3,071 | $ | 1,435 | $ | — | $ | — | $ | — | $ | — | $ | — | $ | 4,506 | ||||||||||||||||||||
| Weighted Average Yield | — | % | — | % | 2.20 | % | 2.92 | % | — | % | — | % | — | % | — | % | — | % | 2.41 | % | ||||||||||||||||||||
| Due after ten years | ||||||||||||||||||||||||||||||||||||||||
| Amortized Cost | $ | 28,262 | $ | — | $ | 3,143 | $ | 36,369 | $ | — | $ | — | $ | — | $ | — | $ | — | $ | 67,774 | ||||||||||||||||||||
| Market Value | $ | 28,405 | $ | — | $ | 3,136 | $ | 38,875 | $ | — | $ | — | $ | — | $ | — | $ | — | $ | 70,416 | ||||||||||||||||||||
| Weighted Average Yield | 3.23 | % | — | % | 2.39 | % | 4.14 | % | — | % | — | % | — | % | — | % | — | % | 3.94 | % | ||||||||||||||||||||
| Total Investment Securities HTM | ||||||||||||||||||||||||||||||||||||||||
| Amortized Cost | $ | 28,262 | $ | — | $ | 6,276 | $ | 37,695 | $ | — | $ | — | $ | — | $ | — | $ | — | $ | 72,233 | ||||||||||||||||||||
| Market Value | $ | 28,405 | $ | — | $ | 6,207 | $ | 40,310 | $ | — | $ | — | $ | — | $ | — | $ | — | $ | 74,922 | ||||||||||||||||||||
| Weighted Average Yield | 3.23 | % | — | % | 2.30 | % | 4.10 | % | — | % | — | % | — | % | — | % | — | % | 3.85 | % | ||||||||||||||||||||
| Total Investment Securities | ||||||||||||||||||||||||||||||||||||||||
| Amortized Cost | $ | 53,043 | $ | 113,213 | $ | 6,276 | $ | 104,004 | $ | 20,567 | $ | 175,812 | $ | 3,226 | $ | 7,614 | $ | 6,417 | $ | 490,172 | ||||||||||||||||||||
| Market Value | $ | 53,374 | $ | 115,364 | $ | 6,207 | $ | 109,483 | $ | 16,187 | $ | 173,117 | $ | 1,899 | $ | 7,653 | $ | 6,145 | $ | 489,429 | ||||||||||||||||||||
| Weighted Average Yield | 3.07 | % | 3.12 | % | 2.30 | % | 3.59 | % | 5.93 | % | 3.45 | % | 2.91 | % | 2.63 | % | — | % | 3.39 | % | ||||||||||||||||||||
For information regarding the carrying value of the investment portfolio, see Note 4 and Note 18 of the Notes to the Consolidated Financial Statements.
The securities listed in the table above are either rated investment grade by Moody’s and/or Standard and Poor’s or have shadow credit ratings from a credit agency supporting investment grade and conform to the Corporation’s investment policy guidelines. There were no municipal securities of any single issuer exceeding 10 percent of stockholders’ equity at December 31, 2011.
Equity securities included in other debt and equity securities do not have a contractual maturity and are included in the Due after ten years maturity in the table above.
The following table sets forth the carrying value of the Corporation’s investment securities, as of December 31 for each of the last three years.
| 2011 | 2010 | 2009 | ||||||||||
| (Dollars in Thousands) | ||||||||||||
| Investment Securities Available-for-Sale: | ||||||||||||
| U.S. treasury & agency Securities | $ | — | $ | 6,995 | $ | 2,089 | ||||||
| Federal agency obligations | 24,969 | 68,481 | 128,365 | |||||||||
| Residential mortgage pass-through securities | 115,364 | 177,733 | 86,220 | |||||||||
| Obligations of U.S. States and political subdivisions | 69,173 | 37,225 | 19,281 | |||||||||
| Trust preferred securities | 16,187 | 18,731 | 26,715 | |||||||||
| Corporate bonds and notes | 173,117 | 61,434 | 22,655 | |||||||||
| Collateralized mortgage obligations | 1,899 | 2,728 | 7,266 | |||||||||
| Asset-backed securities | 7,653 | — | — | |||||||||
| Equity securities | 6,145 | 4,753 | 5,533 | |||||||||
| Total | $ | 414,507 | $ | 378,080 | $ | 298,124 | ||||||
| Investment Securities Held-to-Maturity: | ||||||||||||
| Federal Agency Obligations | 28,262 | — | — | |||||||||
| Commercial mortgage-backed securities | 6,276 | — | — | |||||||||
| Obligations of U.S. States and political subdivisions | 37,695 | — | — | |||||||||
| Total | $ | 72,233 | $ | — | $ | — | ||||||
| Total investment securities | $ | 486,740 | $ | 378,080 | $ | 298,124 | ||||||
For other information regarding the Corporation’s investment securities portfolio, see Note 4 and Note 18 of the Notes to the Consolidated Financial Statements.
Loan Portfolio
Lending is one of the Corporation’s primary business activities. The Corporation’s loan portfolio consists of both retail and commercial loans, serving the diverse customer base in its market area. The composition of the Corporation’s loan portfolio continues to change due to the local economy. Factors such as the economic climate, interest rates, real estate values and employment all contribute to these changes. While the overall economy has been restrictive and somewhat constrained by the uncertain economic environment, the Corporation’s growth in loans continued during 2011. Enhanced visibility in its markets coupled with the aggressive business development activities of its sales team has continued to enhance its image and business prospects. The Corporation continues to see economic instability in the near term and therefore expects to move cautiously in the growth process into 2012.
At December 31, 2011, total loans amounted to $756.0 million, an increase of 6.7 percent or $47.6 million as compared to December 31, 2010. The $880,000 or 2.4 percent decrease in interest income on loans for the twelve months ended December 31, 2011 was the result of a lower interest rate environment as compared with 2010, offset in part by increased volume. Even though the Corporation continues to be challenged by the competition for lending relationships that exists within its market, growth in volume has been achieved through successful lending sales efforts to build on continued customer relationships.
Total average loan volume increased $4.5 million or 0.63 percent in 2011, while the portfolio yield decreased by 16 basis points compared with 2010. The increased total average loan volume was due in part to enhanced visibility in the Corporation’s markets coupled with the aggressive business development activities of its sales team. The volume related factors during the period contributed increased revenue of $510,000, while the rate related changes decreased revenue by $1.4 million. Total average loan volume increased to $712.9 million with a net interest yield of 5.09 percent, compared to $708.4 million with a yield of 5.25 percent for the year ended December 31, 2010. The Corporation seeks to create growth in commercial lending by offering sound products and competitive pricing and by capitalizing on new and existing relationships in its market area. Products are offered to meet the financial requirements of the Corporation’s clients. It is the objective of the Corporation’s credit policies to diversify the commercial loan portfolio to limit concentrations in any single industry.
The following table presents information regarding the components of the Corporation’s loan portfolio on the dates indicated.
| December 31, | ||||||||||||||||||||
| 2011 | 2010 | 2009 | 2008 | 2007 | ||||||||||||||||
| (Dollars in Thousands) | ||||||||||||||||||||
| Commercial and industrial | $ | 146,662 | $ | 121,034 | $ | 117,912 | $ | 75,415 | $ | 65,493 | ||||||||||
| Commercial real estate | 408,010 | 372,001 | 358,957 | 316,509 | 167,978 | |||||||||||||||
| Construction | 39,382 | 49,744 | 51,099 | 41,885 | 51,378 | |||||||||||||||
| Residential mortgage | 160,999 | 165,154 | 191,199 | 240,885 | 266,251 | |||||||||||||||
| Installment | 957 | 511 | 439 | 1,509 | 569 | |||||||||||||||
| Total loans | 756,010 | 708,444 | 719,606 | 676,203 | 551,669 | |||||||||||||||
| Less: | ||||||||||||||||||||
| Allowance for loan losses | 9,602 | 8,867 | 8,711 | 6,254 | 5,163 | |||||||||||||||
| Net loans | $ | 746,408 | $ | 699,577 | $ | 710,895 | $ | 669,949 | $ | 546,506 | ||||||||||
Included in the loan balances above are net deferred loan costs of $17,000, $258,000, $391,000, $572,000 and $579,000 at December 31, 2011, 2010, 2009, 2008 and 2007, respectively.
Over the past five years, demand for the Bank’s commercial and commercial real estate loan products has increased. The increase in commercial loans in 2011 was a result of the expansion of the Corporation’s customer base, aggressive business development and marketing programs coupled with its positive image in its market. While growth in certain sectors of the Banks’ market, such as consumer real estate products, was severely stressed during most of 2008, the Corporation experienced an increased growth in its commercial lending sales efforts during 2010 and 2011 as it continued to benefit from the Corporation’s primary core customer base.
Average commercial loans, which include commercial real estate and construction, increased to $559.7 million for the year ended December 31, 2011 compared to $532.4 million for the year ended December 31, 2010 or by approximately $27.3 million or 5.2 percent in 2011 compared with 2010.
The Corporation’s commercial loan portfolio includes, in addition to real estate development, loans to manufacturing, automobile, professional and retail trade sectors, and to specialized borrowers, such as operators of private educational facilities, for example. A large proportion of the Corporation’s commercial loans have interest rates that reprice with changes in short-term market interest rates or mature in one year or less.
Average commercial real estate loans, which amounted to $319.7 million in 2011, increased $23.1 million or 7.8 percent as compared with average commercial real estate loans of $296.6 million in 2010 (which reflected a 27.3 percent increase over 2009). The Corporation’s long-term mortgage portfolio includes both residential and commercial financing. Growth during the past two years largely reflected brisk activity in new lending activity and mortgage financing. The interest rates on a portion of the Corporation’s commercial
mortgages adjust to changes in indices such as the 5 and 10-year Treasury Notes, and the Federal Home Loan Bank of New York 5 and 10-year advance rate. Interest rate changes usually occur at each five-year anniversary of the loan.
The average volume of residential mortgage loans, including home equity loans, declined $22.8 million or 13.0 percent in 2011 as compared to 2010. During 2011, residential loan growth was affected by the slowdown in the housing market, brisk refinancing activity into fixed rate loans due principally to the current historic low rate environment and competition among lenders. Fixed rate residential and home equity loans have recently become a popular choice among homeowners, either through refinancing or new loans, as consumers wish to lock in historically low fixed rates.
Average construction loans and other temporary mortgage financing decreased by $8.7 million to $45.1 million in 2011 from $53.8 million in 2010. The average volume of such loans increased by $4.4 million from 2009 to 2010. Interest rates on such mortgages are generally tied to key short-term market interest rates. Funds are typically advanced to the builder or developer during various stages of construction and upon completion of the project. It is contemplated that the loans will be repaid by cash flows derived from sales within the project or, where appropriate, conversion to permanent financing.
Loans to individuals include personal loans, student loans, and home improvement loans, as well as financing for automobiles. Such loans averaged $363,000 in 2011, compared with $704,000 in 2010 and $773,000 in 2009. The decrease in loans to individuals during 2011 was due in part to decreases in volumes of new personal loans (single-pay).
Home equity loans, inclusive of home equity lines, as well as traditional secondary mortgage loans, are popular with consumers due to their tax advantages over other forms of consumer borrowing. Home equity loans and secondary mortgages averaged $58.2 million in 2011, a decrease of $12.5 million or 17.7 percent compared to an average of $70.7 million in 2010 and $89.2 million in 2009. Interest rates on floating rate home equity lines are generally tied to the prime rate while most other loans to individuals, including fixed rate home equity loans, are medium-term (ranging between one-to-ten years) and carry fixed interest rates. The decrease in home equity loans outstanding during 2011 was due in part to the recent slowdown in the housing market and lower consumer spending. Additionally, floating rate home equity lines became less attractive during 2011 as consumers took advantage of historically low interest rates or opted to convert these loan balances into fixed rate loan products.
At December 31, 2011, the Corporation had total loan commitments outstanding of $178.9 million, of which approximately 68.4 percent were for commercial loans, commercial real estate loans and construction loans.
The maturities of loans at December 31, 2011 are listed below.
| At December 31, 2011, Maturing | ||||||||||||||||
| In One Year or Less | After One Year through Five Years | After Five Years | Total | |||||||||||||
| (Dollars in Thousands) | ||||||||||||||||
| Construction loans | $ | 29,472 | $ | 7,720 | $ | 2,190 | $ | 39,382 | ||||||||
| Commercial real estate loans | 67,167 | 156,577 | 184,266 | 408,010 | ||||||||||||
| Residential real estate loans | 37,451 | 30,432 | 93,116 | 160,999 | ||||||||||||
| Commercial and industrial | 87,453 | 53,578 | 5,631 | 146,662 | ||||||||||||
| All other loans | 838 | 64 | 55 | 957 | ||||||||||||
| Total | $ | 222,381 | $ | 248,371 | $ | 285,258 | $ | 756,010 | ||||||||
| Loans with: | ||||||||||||||||
| Fixed rates | $ | 102,524 | $ | 113,818 | $ | 258,322 | $ | 474,664 | ||||||||
| Variable rates | 119,857 | 134,553 | 26,936 | 281,346 | ||||||||||||
| Total | $ | 222,381 | $ | 248,371 | $ | 285,258 | $ | 756,010 | ||||||||
For additional information regarding loans, see Note 5 of the Notes to the Consolidated Financial Statements.
Allowance for Loan Losses and Related Provision
The purpose of the allowance for loan losses (“allowance”) is to absorb the impact of probable losses inherent in the loan portfolio. Additions to the allowance are made through provisions charged against current operations and through recoveries made on loans previously charged-off. The allowance for loan losses is maintained at an amount considered adequate by management to provide for potential credit losses based upon a periodic evaluation of the risk characteristics of the loan portfolio. In establishing an appropriate allowance, an assessment of the individual borrowers, a determination of the value of the underlying collateral, a review of historical loss experience and an analysis of the levels and trends of loan categories, delinquencies and problem loans are considered. Such factors as the level and trend of interest rates, current economic conditions and peer group statistics are also reviewed. At year-end 2011, the level of the allowance was $9,602,000 as compared to a level of $8,867,000 at December 31, 2010. The Corporation made loan loss provisions of $2,448,000 in 2011 compared with $5,076,000 in 2010 and $4,597,000 in 2009. The level of the allowance during the respective annual periods of 2011 and 2010 reflects the change in average volume, credit quality within the loan portfolio, the level of charge-offs, loan volume recorded during the periods and the Corporation’s focus on the changing composition of the commercial and residential real estate loan portfolios.
At December 31, 2011, the allowance for loan losses amounted to 1.27 percent of total loans. In management’s view, the level of the allowance at December 31, 2011 is adequate to cover losses inherent in the loan portfolio. Management’s judgment regarding the adequacy of the allowance constitutes a “Forward Looking Statement” under the Private Securities Litigation Reform Act of 1995. Actual results could differ materially from management’s analysis, based principally upon the factors considered by management in establishing the allowance.
Although management uses the best information available, the level of the allowance for loan losses remains an estimate, which is subject to significant judgment and short-term change. Various regulatory agencies, as an integral part of their examination process, periodically review the Corporation’s allowance for loan losses. Such agencies may require the Corporation to increase the allowance based on their analysis of information available to them at the time of their examination. Furthermore, the majority of the Corporation’s loans are secured by real estate in the State of New Jersey. Future adjustments to the allowance may be necessary due to economic factors impacting New Jersey real estate and further deterioration of the economic climate as well as operating, regulatory and other conditions beyond the Corporation’s control. The allowance for loan losses as a percentage of total loans amounted to 1.27 percent, 1.25 percent and 1.21 percent at December 31, 2011, 2010 and 2009, respectively.
Net charge-offs were $1,713,000 in 2011, $4,920,000 in 2010 and $2,140,000 in 2009. During 2011, the Corporation experienced a decrease in charge-offs and an increase in recoveries compared to 2010. Charge-offs were lower in all loan portfolio segments in 2011 than in 2010 and recoveries were higher in all loan portfolio segments in 2011 than in 2010. The most noticeable change is the dramatic reduction in charge-offs in the Residential portfolio as the need for further write downs, due to distress in the single family housing market, subsided in 2011. Commercial Loan charge-offs were 40.7% lower in 2011 compared to 2010. Over half of the Commercial Loan charge-offs related to a single non-accrual participation loan that was subsequently placed into OREO during the fourth quarter of 2011 followed by the Corporation’s disposal of its ownership interest prior to December 31, 2011. Under $100 thousand in Commercial charge-offs in 2011 were associated with previously disclosed industrial warehouse construction loan project participated with and led by another New Jersey bank. The Corporation’s entire interest in that project was repurchased by the lead bank during the fourth quarter of 2011. During 2010, the Corporation took further write downs of $1.9 million associated with a previously disclosed construction project related to industrial warehouses. In addition, distress in the single family housing market caused the Corporation to recognize write downs of $1.6 million and two commercial and industrial loans were the prime contributors of the write downs of $1.1 million in commercial and industrial loans.
Five-Year Statistical Allowance for Loan Losses
The following table reflects the relationship of loan volume, the provision and allowance for loan losses and net charge-offs for the past five years.
| Years Ended December 31, | ||||||||||||||||||||
| 2011 | 2010 | 2009 | 2008 | 2007 | ||||||||||||||||
| (Dollars in Thousands) | ||||||||||||||||||||
| Average loans outstanding | $ | 712,895 | $ | 708,425 | $ | 692,562 | $ | 622,533 | $ | 541,297 | ||||||||||
| Total loans at end of period | $ | 756,010 | $ | 708,444 | $ | 719,606 | $ | 676,203 | $ | 551,669 | ||||||||||
| Analysis of the Allowance for Loan Losses | ||||||||||||||||||||
| Balance at the beginning of year | $ | 8,867 | $ | 8,711 | $ | 6,254 | $ | 5,163 | $ | 4,960 | ||||||||||
| Charge-offs: | ||||||||||||||||||||
| Commercial and Construction | 1,985 | 3,348 | 2,122 | 444 | 45 | |||||||||||||||
| Residential | 23 | 1,552 | 4 | 20 | 80 | |||||||||||||||
| Installment loans | 20 | 40 | 26 | 35 | 31 | |||||||||||||||
| Total charge-offs | 2,028 | 4,940 | 2,152 | 499 | 156 | |||||||||||||||
| Recoveries: | ||||||||||||||||||||
| Commercial and Construction | 255 | 13 | 2 | 10 | 2 | |||||||||||||||
| Residential | 53 | 1 | 4 | 13 | — | |||||||||||||||
| Installment loans | 7 | 6 | 6 | 6 | 7 | |||||||||||||||
| Total recoveries | 315 | 20 | 12 | 29 | 9 | |||||||||||||||
| Net charge-offs | 1,713 | 4,920 | 2,140 | 470 | 147 | |||||||||||||||
| Provision for loan losses | 2,448 | 5,076 | 4,597 | 1,561 | 350 | |||||||||||||||
| Balance at end of year | $ | 9,602 | $ | 8,867 | $ | 8,711 | $ | 6,254 | $ | 5,163 | ||||||||||
| Ratio of net charge-offs during the year to average loans outstanding during the year | 0.24 | % | 0.69 | % | 0.31 | % | 0.08 | % | 0.03 | % | ||||||||||
| Allowance for loan losses as a percentage of total loans at end of year | 1.27 | % | 1.25 | % | 1.21 | % | 0.92 | % | 0.94 | % | ||||||||||
For additional information regarding loans, see Note 5 of the Notes to the Consolidated Financial Statements
Implicit in the lending function is the fact that loan losses will be experienced and that the risk of loss will vary with the type of loan being made, the creditworthiness of the borrower and prevailing economic conditions. The allowance for loan losses has been allocated in the table below according to the estimated amount deemed to be reasonably necessary to provide for the possibility of losses being incurred within the following categories of loans at December 31, for each of the past five years.
The table below shows, for three types of loans, the amounts of the allowance allocable to such loans and the percentage of such loans to total loans.
| Commercial | Real Estate Residential Mortgage | Installment | Unallocated | |||||||||||||||||||||||||||||
| Amount of Allowance | Loans to Total Loans % | Amount of Allowance | Loans to Total Loans % | Amount of Allowance | Loans to Total Loans % | Amount of Allowance | Total | |||||||||||||||||||||||||
| (Dollars in Thousands) | ||||||||||||||||||||||||||||||||
| 2011 | $ | 8,206 | 78.6 | $ | 1,263 | 21.3 | $ | 51 | 0.1 | $ | 82 | $ | 9,602 | |||||||||||||||||||
| 2010 | 7,538 | 76.6 | 1,038 | 23.3 | 52 | 0.1 | 239 | 8,867 | ||||||||||||||||||||||||
| 2009 | 7,314 | 73.3 | 1,242 | 26.6 | 56 | 0.1 | 99 | 8,711 | ||||||||||||||||||||||||
| 2008 | 5,473 | 64.2 | 651 | 35.6 | 60 | 0.2 | 70 | 6,254 | ||||||||||||||||||||||||
| 2007 | 4,167 | 51.6 | 727 | 48.3 | 49 | 0.1 | 220 | 5,163 | ||||||||||||||||||||||||
Asset Quality
The Corporation manages asset quality and credit risk by maintaining diversification in its loan portfolio and through review processes that include analysis of credit requests and ongoing examination of outstanding loans and delinquencies, with particular attention to portfolio dynamics and mix. The Corporation strives to identify loans experiencing difficulty early enough to correct the problems, to record charge-offs promptly based on realistic assessments of current collateral values, and to maintain an adequate allowance for loan losses at all times. These practices have protected the Corporation during economic downturns and periods of uncertainty.
It is generally the Corporation’s policy to discontinue interest accruals once a loan is past due as to interest or principal payments for a period of ninety days. When a loan is placed on non-accrual status, interest accruals cease and uncollected accrued interest is reversed and charged against current income. Payments received on non-accrual loans are applied against principal. A loan may only be restored to an accruing basis when it again becomes well secured and in the process of collection or all past due amounts have been collected and a satisfactory period of ongoing repayment exists. Accruing loans past due 90 days or more are generally well secured and in the process of collection. For additional information regarding loans, see Note 5 of the Notes to the Consolidated Financial Statements.
Non-Performing and Past Due Loans and OREO
Non-performing loans include non-accrual loans and accruing loans which are contractually past due 90 days or more. Non-accrual loans represent loans on which interest accruals have been suspended. It is the Corporation’s general policy to consider the charge-off of loans when they become contractually past due ninety days or more as to interest or principal payments or when other internal or external factors indicate that collection of principal or interest is doubtful. Troubled debt restructurings represent loans on which a concession was granted to a borrower, such as a reduction in interest rate to a rate lower than the current market rate for new debt with similar risks, and which are currently performing in accordance with the modified terms. The Corporation previously reported performing troubled debt restructured loans as a component of non-performing assets. For additional information regarding loans, see Note 5 of the Notes to the Consolidated Financial Statements.
The following table sets forth, as of the dates indicated, the amount of the Corporation’s non-accrual loans, accruing loans past due 90 days or more, other real estate owned (“OREO”) and troubled debt restructurings.
| At December 31, | ||||||||||||||||||||
| 2011 | 2010 | 2009 | 2008 | 2007 | ||||||||||||||||
| (Dollars in Thousands) | ||||||||||||||||||||
| Non-accrual loans | $ | 6,871 | $ | 11,174 | $ | 11,245 | $ | 541 | $ | 3,907 | ||||||||||
| Accruing loans past due 90 days or more | 1,029 | 714 | 39 | 139 | — | |||||||||||||||
| Total non-performing loans | 7,900 | 11,888 | 11,284 | 680 | 3,907 | |||||||||||||||
| OREO | 591 | — | — | 3,949 | 501 | |||||||||||||||
| Total non-performing assets | $ | 8,491 | $ | 11,888 | $ | 11,284 | $ | 4,629 | $ | 4,408 | ||||||||||
| Troubled debt restructuring — performing | $ | 7,459 | $ | 7,035 | $ | 966 | $ | 93 | $ | — | ||||||||||
At December 31, 2011, non-performing assets totaled $8.5 million, or 0.59% of total assets, as compared with $11.9 million, or 0.98%, at December 31, 2010. The decrease from December 31, 2010 was achieved notwithstanding the addition of several new residential loans (totaling approximately $2.6 million) and commercial loans (totaling approximately $1.4 million) into non-performing status. This was more than offset by decreases from pay-downs of $5.0 million, total charge-offs of $0.7 million of existing loans, and the transfer to performing troubled debt restructured from non-accrual status of $1.7 million.
Total non-accrual loans remained relatively even from December 31, 2009 to December 31, 2010. A $2.2 million single family residential loan previously classified as a non-accrual loan was transferred to OREO during 2010 and subsequently sold in the fourth quarter of 2010. In addition, a $1.9 million net charge off was taken on a loan participation during 2010. On the other hand, a construction participation loan in the amount of $3.6 million went into non-accrual status in the fourth quarter of 2010.
The components of accruing loans, which are contractually past due 90 days or more as to principal or interest payments, are as follows:
| December 31, | ||||||||||||||||||||
| 2011 | 2010 | 2009 | 2008 | 2007 | ||||||||||||||||
| (Dollars in Thousands) | ||||||||||||||||||||
| Commercial | $ | 1,029 | $ | — | $ | — | $ | — | $ | — | ||||||||||
| Residential | — | 714 | 39 | 139 | — | |||||||||||||||
| Installment | — | — | — | — | — | |||||||||||||||
| Total accruing loans 90 days or more past due | $ | 1,029 | $ | 714 | $ | 39 | $ | 139 | $ | — | ||||||||||
The balance at December 31, 2011 is comprised of two commercial loan relationships totaling $1,029,000. At December 31, 2011, both loans in question were well secured and in the process of collection. In both relationships, the Corporation is receiving rental payments directly from the respective tenants that are being used to defray real estate tax expense as well as making loan payments. Because neither relationship has brought their loans current, the Corporation is continuing the foreclosure process.
TDR Increase
Troubled Debt Restructured loans (“TDR’s”) at December 31, 2011 totaled $11.1 million of which $7.5 million were performing pursuant to the terms of their respective modifications. The level of performing TDR’s increased during 2011 by the addition of five residential loans totalling $1,575,000 and one commercial loan totalling $1,318,000. This was offset by payments and payoffs to existing TDR’s totalling $1,002,000. All but $1,000 of these payments were for commercial loan TDR’s. Another two residential TDR’s totalling $1,502,000 was returned to their original contractual loan terms. The net increase for 2011 in performing TDR’s totaled $424,000.
Other known “potential problem loans” (as defined by SEC regulations) as of December 31, 2011 have been identified and internally risk rated as assets especially mentioned or substandard. Such loans, which include non-performing assets and troubled debt restructuring included in the table above, amounted to $48,976,000, $38,382,000 and $20,048,000 at December 31, 2011, 2010 and 2009, respectively. The increase at December 31, 2011 and December 31, 2010 reflects continued deterioration in the quality of certain loans. The risk rating of assets is a dynamic environment wherein through on-going examination certain assets may be downgraded or upgraded as circumstances warrant. During 2011, the Corporation internally risk rated as assets especially mentioned or substandard a total of $21,455,000 new commercial loans and $3,912,000 new residential loans. This was partially offset by upgrades to an internal pass risk rating of $3,943,000 in commercial loans and $1,502,000 of residential loans. Payoffs of commercial and residential loans totaled $6,258,000. Charge-offs and transfers to Other Real Estate Owned accounted for $1,176,000. A final mitigant came from continued principal reductions on other potential problem loans. With the exception of non-accrual loans and loans past due 90 days or more and accruing, potential problem loans were performing as of December 31, 2011. The Corporation has no foreign loans.
At December 31, 2011, other than the loans set forth above, the Corporation is not aware of any loans which present serious doubts as to the ability of its borrowers to comply with present loan repayment terms and which are expected to fall into one of the categories set forth in the tables or description above. At December 31, 2010, the Corporation’s doubtful loans amounted to $2,277,000.
With respect to concentrations of credit within the Corporation’s loan portfolio at December 31, 2011, $12.7 million or 2.1% of the commercial loan portfolio represented outstanding working capital loans to various real estate developers. $4.3 million of these loans are secured by mortgages on land and on buildings under construction.
For additional information regarding risk elements in the Corporation’s loan portfolio, see Note 5 of the Notes to Consolidated Financial Statements.
Other Income
The following table presents the principal categories of non-interest income for each of the years in the three-year period ended December 31, 2011.
| Years Ended December 31, | ||||||||||||||||||||||||
| 2011 | 2010 | % Change | 2010 | 2009 | % Change | |||||||||||||||||||
| (Dollars in Thousands) | ||||||||||||||||||||||||
| Service charges, commissions and fees | $ | 1,896 | $ | 1,975 | (4.00 | )% | $ | 1,975 | $ | 1,835 | 7.63 | % | ||||||||||||
| Annuity & insurance commissions | 110 | 123 | (10.57 | ) | 123 | 126 | (2.38 | ) | ||||||||||||||||
| Bank-owned life insurance | 1,038 | 1,226 | (15.33 | ) | 1,226 | 1,156 | 6.06 | |||||||||||||||||
| Net securities gains (losses) | 3,634 | (1,339 | ) | 371.40 | (1,339 | ) | 491 | (372.71 | ) | |||||||||||||||
| Other | 800 | 487 | 64.27 | 487 | 298 | 63.42 | ||||||||||||||||||
| Total other income | $ | 7,478 | $ | 2,472 | 202.51 | % | $ | 2,472 | $ | 3,906 | (36.71 | )% | ||||||||||||
For the period ended December 31, 2011, total other income increased $5.0 million compared to 2010, primarily as a result of net securities gains in 2011 compared to net securities losses in 2010. Excluding net securities gains and losses in the respective periods, the Corporation recorded other income of $3.8 million in the year ended December 31, 2011 and in the year ended December 31, 2010.
During 2011, the Corporation recorded net securities gains of $3.6 million compared to net securities losses of $1.3 million in 2010 and net gains of $491,000 recorded in 2009. In 2011, total other-than-temporary impairment charges of $342,000 were offset by net gains on securities sold of $4.0 million. During 2011, securities sold from the Corporation’s available-for-sale portfolio amounted to approximately $254.8 million compared to approximately $644.1 million in 2010. The gross realized gains on securities sold amounted to approximately $4.0 million in 2011 compared to $4.9 million in 2010, while the gross realized losses amounted to approximately $411,000 in 2011 compared to $635,000 in 2010. The proceeds from the sales of securities were made in the normal course of business and were primarily reinvested into the loan portfolio.
During 2011, the Corporation recorded an other-than-temporary impairment charge of $18,000 on a variable rate private label CMO and $324,000 in principal losses on a variable rate private label CMO. For the year ended December 31, 2010, these impairment charges consisted of a $3.0 million other-than-temporary impairment charge on its trust preferred securities, $1.8 million on two pooled trust preferred securities, $360,000 on a variable rate private label CMO and $398,000 in principal losses on a variable rate private label CMO. For the year ended December 31, 2009 these impairment charges consisted of $3.4 million relating to two pooled trust preferred securities, $364,000 relating to the Corporation’s investment in the Reserve Primary Fund, $188,000 relating to a variable rate private label CMO, a $140,000 charge relating to a Lehman Brothers bond and a $113,000 write down relating to one equity holding in bank stocks.
Other Expense
Total other expense includes salaries and employee benefits, net occupancy expense, premises and equipment expense, professional and consulting expense, stationery and printing expense, marketing and advertising expense, computer expense and other operating expense. Other operating expense includes such expenses as telephone, insurance, audit, bank correspondent fees and the amortization of core deposit intangibles.
The following table presents the principal categories of other expense for each of the years in the three-year period ended December 31, 2011.
| Year Ended December 31, | ||||||||||||||||||||||||
| 2011 | 2010 | % Change | 2010 | 2009 | % Change | |||||||||||||||||||
| (Dollars in Thousands) | ||||||||||||||||||||||||
| Salaries and employee benefits | $ | 11,527 | $ | 10,765 | 7.08 | % | $ | 10,765 | $ | 9,915 | 8.57 | % | ||||||||||||
| Occupancy, net | 2,021 | 2,088 | (3.21 | ) | 2,088 | 2,536 | (17.67 | ) | ||||||||||||||||
| Premises and equipment | 926 | 1,093 | (15.28 | ) | 1,093 | 1,263 | (13.46 | ) | ||||||||||||||||
| FDIC insurance | 1,712 | 2,126 | (19.47 | ) | 2,126 | 2,055 | 3.45 | |||||||||||||||||
| Professional and consulting | 1,156 | 1,121 | 3.12 | 1,121 | 811 | 38.22 | ||||||||||||||||||
| Stationery and printing | 368 | 316 | 16.46 | 316 | 339 | (6.78 | ) | |||||||||||||||||
| Marketing and advertising | 131 | 268 | (51.12 | ) | 268 | 366 | (26.78 | ) | ||||||||||||||||
| Computer expense | 1,312 | 1,366 | (3.95 | ) | 1,366 | 964 | 41.70 | |||||||||||||||||
| OREO expense, net | 398 | 284 | 40.14 | 284 | 1,438 | (80.25 | ) | |||||||||||||||||
| Loss on fixed assets, net | — | 427 | (100.00 | ) | 427 | — | 100.00 | |||||||||||||||||
| Repurchase agreement termination fee | — | 594 | (100.00 | ) | 594 | — | 100.00 | |||||||||||||||||
| Other | 3,892 | 3,651 | 6.60 | 3,651 | 3,370 | 8.34 | ||||||||||||||||||
| Total other expense | $ | 23,443 | $ | 24,099 | (2.72 | )% | $ | 24,099 | $ | 23,057 | 4.52 | % | ||||||||||||
Total other expense decreased $656,000, or 2.72 percent, in 2011 from 2010 as compared with an increase of $1.0 million, or 4.52 percent, from 2009 to 2010. The level of operating expenses during 2011 decreased primarily as a result of decreased occupancy expense of $67,000, decreased premises and equipment charges of $167,000, decreased computer expense of $54,000, decreased marketing expenses of $137,000, decreased FDIC Insurance of $414,000, $427,000 in charges incurred in 2010 with the lease/sale of the Corporation’s former operations facility and $594,000 incurred in 2010 from the early termination of a structure repurchase agreement in 2010. These items were offset in part by increases in salary and benefits of $762,000, professional and consulting fees of $35,000, stationery & printing expenses of $52,000, OREO expense of $114,000 and other expenses of $241,000. Total other expense increased in 2010 from 2009 across several expense categories, with the largest increases occurring in salaries and benefit expense, professional and consulting fees, computer expense, termination fee on a structured securities repurchase agreement and loss on fixed assets.
Prudent management of operating expenses has been and will continue to be a key objective of management in an effort to improve earnings performance. The Corporation’s ratio of other expenses to average assets decreased to 1.77 percent in 2011 compared to 2.03 percent in 2010 and 1.88 percent in 2009.
Salaries and employee benefits increased $762,000 or 7.08 percent in 2011 compared to 2010 and increased $850,000 or 8.57 percent from 2009 to 2010. The increase in 2011 was primarily attributable to merit increases to existing staff and additions to office and employee staff of $439,000 and $125,000, respectively, pension and 401(k) increase of $129,000, and increased medical insurance expense of $40,000. The increase in 2010 was primarily attributable to additions to office staff and merit increases to existing staff of approximately $720,000 and increased medical insurance expense of $130,000.
Salaries and employee benefits accounted for 49.2 percent of total non-interest expense in 2011, as compared to 44.7 percent and 43.0 percent in 2010 and 2009, respectively.
In 2009, the Corporation announced a strategic outsourcing agreement with Fiserv to provide core account processing services, which is consistent with the Corporation’s other strategic initiatives to streamline operations, reduce operating overhead and allow the Corporation to focus on core competencies of customer service and product development.
Occupancy and premises and equipment expense for the year ended December 31, 2011 decreased by $67,000 or 3.2 percent and $167,000 or 15.3 percent, respectively, from the year ended December 31, 2010. For the year ended December 31, 2011, the Corporation recorded reductions of $170,000 in depreciation
expense, and $62,000 in real estate taxes, largely associated with the Corporation’s former operations facility somewhat offset by an increase of $42,000 in building and equipment maintenance expense. For the year ended December 31, 2010, the Corporation recorded reductions of $273,000 in depreciation expense, $251,000 in building and equipment maintenance expense and $98,000 in real estate taxes, largely associated with the Corporation’s former operations facility. The decreases reflect the full year impact of expense reductions pertaining to the Corporation’s former operations facility that resulted from vacating and eliminating the facility during the first quarter of 2010.
In 2011 the FDIC adopted a revised assessment schedule based on Total Assets less Tier 1 Capital and dropped the assessment rate to compensate for increasing the new base. FDIC insurance expense in 2011 was approximately $414,000 less than the 2010 expense. In May 2009, the FDIC adopted a final special assessment rule that assessed the banking industry 5 basis points on total assets less Tier I capital. The Corporation was required to accrue the charge during the second quarter of 2009, which amounted to approximately $630,000, even though the FDIC collected the fee at the end of the third quarter when the regular quarterly assessments for the second were collected. Additionally, in December 2008, the FDIC adopted a final rule increasing the risk-based assessment rates beginning in the first quarter of 2009. As a result of these actions, FDIC insurance expense increased $71,000 for 2010 compared to 2009.
Professional and consulting expense for 2011 increased $35,000 due to compliance and legal loan workout issues. Such expenses increased in 2010 from 2009 primarily due to compliance and legal loan workout issues.
Stationery and printing expenses for 2011 increased $53,000 or 16.5 percent, compared to 2010, due primarily to costs related to marketing of new bank products. The decrease in such expenses of $23,000 or 6.78 percent in 2010 from 2009 reflected better cost containment measures relating to stationery and printing materials
Marketing and advertising expenses for the year ended December 31, 2011 decreased $137,000, or 51.1 percent, from the comparable twelve-month period in 2010, primarily due to lower expense outlays for media. These expenses decreased $98,000 or 26.78 percent in 2010 compared with 2009 primarily due to lower expense outlays for media.
Computer expense decreased $54,000 during 2011 compared to 2010 and increased $402,000 in 2010 compared to 2009, due primarily to fees paid to the Corporation’s outsourced information technology service provider. This strategic outsourcing arrangement has significantly improved operating efficiencies and reduced overhead, primarily in salaries and benefits.
OREO expense for 2011 increased by $114,000 over 2010 due primarily to an increased level of OREO properties.
Other expense increased in 2011 by approximately $241,000 or 6.6 percent compared to 2010 mainly due to a $287,000 loss related to tax certificates acquired to protect the bank’s interest in property subsequently assigned to Highlands State Bank. Other expense increased in 2010 by $1.3 million or 38.64 percent, compared to 2009, mainly due to a one-time termination fee of $594,000 in the first quarter of 2010 on a structured securities repurchase agreement and a $437,000 loss on fixed assets which was recorded in the second quarter of 2010. Amortization of core deposit intangibles accounted for $57,000 and $70,000 of other expense for the years 2011 and 2010, respectively.
Provision for Income Taxes
The Corporation recorded income tax expense of $7.4 million in 2011 compared to $222,000 in 2010 and $946,000 in 2009. The reduction in 2010 resulted from the liquidation of certain subsidiaries as part of a business entity restructuring. The effective tax rates for the Corporation for the years ended December 31, 2011, 2010 and 2009 were 34.7 percent, 3.1 percent and 20.1 percent, respectively. The Corporation adjusts its expected annual tax rate on a quarterly basis based on the current projections of non-deductible expenses, tax-exempt interest income, increase in the cash surrender value of bank owned life insurance and pre-tax net earnings. For a more detailed description of income taxes see Note 11 of the Notes to Consolidated Financial Statements.
Tax-exempt interest income on a fully tax equivalent basis increased by $2.24 million, or 673.6 percent, from 2010 to 2011, and decreased by $1.2 million, or 77.8 percent, from 2009 to 2010. The Corporation recorded income related to the cash surrender value of bank-owned life insurance as a component of other income in the amount of $1,038,000, $1,226,000 and $1,156,000 for 2011, 2010 and 2009, respectively.
Recent Accounting Pronouncements
Note 2 of the Notes to Consolidated Financial Statements discusses new accounting policies recently issued or proposed but not yet required to be adopted. To the extent the adoption of new accounting standards materially affects financial condition, results of operations, or liquidity, the impacts are discussed in the applicable sections of the financial review and notes to the consolidated financial statements.
In April 2011, the FASB issued ASU No. 2011-03,“Reconsideration of Effective Control for Repurchase Agreements.” ASU No. 2011-03 modifies the criteria for determining when repurchase agreements would be accounted for as a secured borrowing rather than as a sale. Currently, an entity that maintains effective control over transferred financial assets must account for the transfer as a secured borrowing rather than as a sale. The provisions of ASU No. 2011-03 removes from the assessment of effective control the criterion requiring the transferor to have the ability to repurchase or redeem the financial assets on substantially the agreed terms, even in the event of default by the transferee. The FASB believes that contractual rights and obligations determine effective control and that there does not need to be a requirement to assess the ability to exercise those rights. ASU No. 2011-03 does not change the other existing criteria used in the assessment of effective control. The provisions of ASU No. 2011-03 are effective prospectively for transactions, or modifications of existing transactions, that occur on or after January 1, 2012. As the Corporation accounts forrules, all of its repurchase agreements as collateralized financing arrangements, the adoption of this ASU is not expected to have a material impact on the Corporation’s statements of income and condition.
In May 2011, the FASB issued ASU No. 2011-04,“Amendments to Achieve Common Fair Value Measurement and Disclosure Requirements in U.S. GAAP and IFRSs.” ASU No. 2011-04 results in a consistent definition of fair value and common requirements for measurement of and disclosure about fair value between U.S. GAAP and International Financial Reporting Standards (“IFRS”). The changes to U.S. GAAP as a result of ASU No. 2011-04 are as follows: (1) The concepts of highest and best use and valuation premise are only relevant when measuring the fair value of nonfinancial assets (that is, it does not apply to financial assets or any liabilities); (2) U.S. GAAP currently prohibits application of a blockage factor in valuing financial instruments with quoted prices in active markets; ASU No. 2011-04 extends that prohibition to all fair value measurements; (3) An exception is provided to the basic fair value measurement principles for an entity that holds a group of financial assets and financial liabilities with offsetting positions in market risks or counterparty credit risk that are managed on the basis of the entity’s net exposure to either of those risks; this exception allows the entity, if certain criteria are met, to measure the fair value of the net asset or liability position in a manner consistent with how market participants would price the net risk position; (4) Aligns the fair value measurement of instruments classified within an entity’s shareholders’ equity with the guidance for liabilities; and (5) Disclosure requirements have been enhanced for recurring Level 3 fair value measurements to disclose quantitative information about unobservable inputs and assumptions used, to describe the valuation processes used by the entity, and to describe the sensitivity of fair value measurements to changes in unobservable inputs and interrelationships between those inputs. In addition, entities must report the level in the fair value hierarchy of items that are not measured at fair value in the statement of condition but whose fair value must be disclosed. The provisions of ASU No. 2011-04 are effective for the Corporation’s interim reporting period beginning on or after December 15, 2011. The adoption of ASU No. 2011-04 is not expected to have a material impact on the Corporation’s statements of income or statements of condition.
In June 2011, the FASB issued ASU No. 2011-05, “Presentation of Comprehensive Income.”The provisions of ASU No. 2011-05 allow an entity the option to present the total of comprehensive income, the components of net income, and the components of other comprehensive income either in a single continuous statement of comprehensive income or in two separate but consecutive statements. In both choices, an entity is required to present each component of net income along with total net income, each component of other comprehensive income along with a total for other comprehensive income, and a total amount for comprehensive income. The statement(s) are required to be presented with equal prominence as the other
primary financial statements. ASU No. 2011-05 eliminates the option to present the components of other comprehensive income as part of the statement of changes in shareholders’ equity but does not change the items that must be reported in other comprehensive income or when an item of other comprehensive income must be reclassified to net income. The provisions of ASU No. 2011-05 are effective for the Corporation’s interim reporting period beginning on or after December 15, 2011, with retrospective application required. The adoption of ASU No. 2011-05 is expected to result in presentation changes to the Corporation’s statements of income and the addition of a statement of comprehensive income. The adoption of ASU No. 2011-05 will have no impact on the Corporation’s statements of condition.
In September 2011, the FASB issued ASU No. 2011-08, “Intangibles — Goodwill and Other (Topic 350): Testing Goodwill for Impairment”, which permits an entity to first perform a qualitative assessment to determine whether it is more likely than not that the fair value of a reporting unit is less than its carrying amount. If an entity believes, as a result of its qualitative assessment, that it is more likely than not that the fair value of a reporting unit is less than its carrying amount, the quantitative impairment test is required. Otherwise, no further impairment testing is required. The provisions of ASU No. 2011-08 are effective for the Corporation’s interim goodwill impairment tests performed for fiscal years beginning after December 15, 2011. Early adoption is permitted, provided that the entity has not yet performed its annual impairment test for goodwill. The Corporation performs its annual impairment test for goodwill in the fourth quarter of each year. The adoption of ASU No. 2011-08 is not expected to have a material impact on the Corporation’s statements of income and statements of condition.
In December 2011, the FASB issued ASU No. 2011-12, “Comprehensive Income (Topic 220):Deferral of the Effective Date for Amendments to the Presentation of Reclassifications of Items Out of Accumulated Other Comprehensive Income in Accounting Standards Update No. 2011-05. The Update defers the specific requirement to present items that are reclassified from accumulated other comprehensive income to net income separately with their respective components of net income and other comprehensive income. The deferral comes after stakeholders recently raised concerns that the new presentation requirements about the reclassification of items out of accumulated other comprehensive income would be costly for preparers and add unnecessary complexity to financial statements. As a result of the concerns, the FASB decided to reconsider whether it is necessary to require companies to present reclassification adjustments, by component, in both the statement where net income is presented and the statement where other comprehensive income is presented for both interim and annual financial statements. The FASB did not defer the requirement to report comprehensive income either in a single continuous statement or in two separate, but consecutive, financial statements.
In November 2008, the SEC released a proposed roadmap regarding the potential use by U.S. issuers of financial statements prepared in accordance with International Financial Reporting Standards (“IFRS”). IFRS is a comprehensive series of accounting standards published by the International Accounting Standards Board. Under the proposed roadmap, the Company may be required to prepare financial statements in accordance with IFRS as early as 2014. The Company is currently assessing the impact that this potential change would have on its consolidated financial statements, and it will continue to monitor the development of the potential implementation of IFRS.
Asset and Liability Management
Asset and liability management encompasses an analysis of market risk, the control of interest rate risk (interest sensitivity management) and the ongoing maintenance and planning of liquidity and capital. The composition of the Corporation’s statement of condition is planned and monitored by the Asset and Liability Committee (“ALCO”). In general, management’s objective is to optimize net interest income and minimize market risk and interest rate risk by monitoring these components of the statement of condition.
Short-term interest rate exposure analysis is supplemented with an interest sensitivity gap model. The Corporation utilizes interest sensitivity analysis to measure the responsiveness of net interest income to changes in interest rate levels. Interest rate risk arises when an earning asset matures or when its interest rate changes in a time period different than that of a supporting interest-bearing liability, or when an interest-bearing liability matures or when its interest rate changes in a time period different than that of an
earning asset that it supports. While the Corporation matches only a small portion of specific assets and liabilities, total earning assets and interest-bearing liabilities are grouped to determine the overall interest rate risk within a number of specific time frames.
The difference between interest sensitive assets and interest sensitive liabilities is referred to as the interest sensitivity gap. At any given point in time, the Corporation may be in an asset-sensitive position, whereby its interest-sensitive assets exceed its interest-sensitive liabilities, or in a liability-sensitive position, whereby its interest-sensitive liabilities exceed its interest-sensitive assets, depending in part on management’s judgment as to projected interest rate trends
The Corporation’s rate sensitivity position in each time frame may be expressed as assets less liabilities, as liabilities less assets, or as the ratio between rate sensitive assets (“RSA”) and rate sensitive liabilities (“RSL”). For example, a short funded position (liabilities repricing before assets) would be expressed as a net negative position, when period gaps are computed by subtracting repricing liabilities from repricing assets. When using the ratio method, a RSA/RSL ratio of 1 indicates a balanced position, a ratio greater than 1 indicates an asset sensitive position and a ratio less than 1 indicates a liability sensitive position.
A negative gap and/or a rate sensitivity ratio less than 1, tends to expand net interest margins in a falling rate environment and to reduce net interest margins in a rising rate environment. Conversely, when a positive gap occurs, generally margins expand in a rising rate environment and contract in a falling rate environment. From time to time, the Corporation may elect to deliberately mismatch liabilities and assets in a strategic gap position.
At December 31, 2011, the Corporation reflected a positive interest sensitivity gap (or an interest sensitivity ratio of (1:34 to 1.00) at the cumulative one-year position. Based on management’s perception that interest rates will continue to be volatile, projected increased levels of prepayments on the earning asset portfolio and the current level of interest rates, emphasis has been, and is expected to continue to be, placed on interest-sensitivity matching with the objective of continuing to stabilize the net interest spread and margin during 2012. However, no assurance can be given that this objective will be met.
The following table depicts the Corporation’s interest rate sensitivity position at December 31, 2011:
| Expected Maturity/Principal Repayment December 31, | ||||||||||||||||||||||||||||||||||||
| Average Interest Rate | Year End 2012 | Year End 2013 | Year End 2014 | Year End 2015 | Year End 2016 | 2017 and Thereafter | Total Balance | Estimated Fair Value | ||||||||||||||||||||||||||||
| (Dollars in Thousands) | ||||||||||||||||||||||||||||||||||||
| Interest-Earning Assets: | ||||||||||||||||||||||||||||||||||||
| Loans, net | 5.09 | % | $ | 306,816 | $ | 144,767 | $ | 90,972 | $ | 53,551 | $ | 57,210 | $ | 93,092 | $ | 746,408 | $ | 752,252 | ||||||||||||||||||
| Investments | 3.39 | % | 106,160 | 43,114 | 26,052 | 38,041 | 57,161 | 216,212 | 486,740 | 489,429 | ||||||||||||||||||||||||||
| Total interest-earning assets | $ | 412,976 | $ | 187,881 | $ | 117,024 | $ | 91,592 | $ | 114,371 | $ | 309,304 | $ | 1,233,148 | $ | 1,241,681 | ||||||||||||||||||||
| Interest-Bearing Liabilities: | ||||||||||||||||||||||||||||||||||||
| Time certificates of deposit of $100,000 or greater | 0.79 | % | $ | 109,121 | $ | 15,366 | $ | 3,861 | $ | 1,643 | $ | 8,007 | $ | — | $ | 137,998 | $ | 119,932 | ||||||||||||||||||
| Time certificates of deposit of less than $100,000 | 1.74 | % | 46,126 | 6,623 | 3,379 | 456 | 1 | — | 56,585 | 49,177 | ||||||||||||||||||||||||||
| Other interest-bearing deposits | 0.50 | % | 148,110 | 148,110 | 129,258 | 110,405 | 68,382 | 155,403 | 759,668 | 759,668 | ||||||||||||||||||||||||||
| Subordinated debentures | 3.10 | % | 5,155 | — | — | — | — | — | 5,155 | 5,159 | ||||||||||||||||||||||||||
| Securities sold under agreements to repurchase and Fed Funds Purchased | 5.31 | % | — | — | — | 10,000 | — | 31,000 | 41,000 | 44,803 | ||||||||||||||||||||||||||
| Term borrowings | 3.46 | % | — | 5,000 | — | — | 20,000 | 95,000 | 120,000 | 131,130 | ||||||||||||||||||||||||||
| Total interest-bearing liabilities | $ | 308,512 | $ | 175,099 | $ | 136,498 | $ | 122,504 | $ | 96,390 | $ | 281,403 | $ | 1,120,406 | $ | 1,109,869 | ||||||||||||||||||||
| Cumulative interest-earning assets | $ | 412,976 | $ | 600,857 | $ | 717,881 | $ | 809,473 | $ | 923,844 | $ | 1,233,148 | $ | 1,233,148 | ||||||||||||||||||||||
| Cumulative interest-bearing liabilities | 308,512 | 483,611 | 620,109 | 742,613 | 839,003 | 1,120,406 | 1,120,406 | |||||||||||||||||||||||||||||
| Rate sensitivity gap | 104,464 | 12,782 | (19,474 | ) | (30,912 | ) | 17,981 | 27,901 | 112,742 | |||||||||||||||||||||||||||
| Cumulative rate sensitivity gap | 104,464 | 117,246 | 97,772 | 66,860 | 84,841 | 112,742 | 112,742 | |||||||||||||||||||||||||||||
| Cumulative gap ratio | 1.34 | % | 1.24 | % | 1.16 | % | 1.09 | % | 1.10 | % | 1.10 | % | 1.10 | % | ||||||||||||||||||||||
Estimates of Fair Value
The estimation of fair value is significant to a number of the Corporation’s assets, including loans held for sale, and available-for-sale investment securities. These are all recorded at either fair value or the lower of cost or fair value. Fair values are volatile and may be influenced by a number of factors. Circumstances that could cause estimates of the fair value of certain assets and liabilities to change include a change in prepayment speeds, expected cash flows, credit quality, discount rates, or market interest rates. Fair values for most available for sale investment securities are based on quoted market prices. If quoted market prices are not available, fair values are based on judgments regarding future expected loss experience, current economic condition risk characteristics of various financial instruments, and other factors. See Note 18 of the Notes to Consolidated Financial Statements for additional discussion.
These estimates are subjective in nature, involve uncertainties and matters of significant judgment and therefore cannot be determined with precision. Changes in assumptions could significantly affect the estimates.
Impact of Inflation and Changing Prices
The financial statements and notes thereto presented elsewhere herein have been prepared in accordance with generally accepted accounting principles, which require the measurement of financial position and operating results in terms of historical dollars without considering the change in the relative purchasing power of money over time due to inflation. The impact of inflation is reflected in the increased cost of the operations; unlike most industrial companies, nearly all of the Corporation’s assets and liabilities are monetary. As a result, interest rates have a greater impact on performance than do the effects of general levels of inflation. Interest rates do not necessarily move in the same direction or to the same extent as the prices of goods and services.
Liquidity
The liquidity position of the Corporation is dependent on successful management of its assets and liabilities so as to meet the needs of both deposit and credit customers. Liquidity needs arise principally to accommodate possible deposit outflows and to meet customers’ requests for loans. Scheduled principal loan repayments, maturing investments, short-term liquid assets and deposit in-flows, can satisfy such needs. The objective of liquidity management is to enable the Corporation to maintain sufficient liquidity to meet its obligations in a timely and cost-effective manner.
Management monitors current and projected cash flows, and adjusts positions as necessary to maintain adequate levels of liquidity. By using a variety of potential funding sources and staggering maturities, the risk of potential funding pressure is reduced. Management also maintains a detailed liquidity contingency plan designed to respond adequately to situations which could lead to liquidity concerns.
Management believes that the Corporation has the funding capacity to meet the liquidity needs arising from potential events. In addition to pledgeable securities, the Corporation also maintains borrowing capacity through the Federal Discount Window and the Federal Home Loan Bank of New York secured with loans and marketable securities.
Liquidity is measured and monitored for the Bank. The Corporation reviews its net short-term mismatch. This measures the ability of the Corporation to meet obligations should access to Bank dividends be constrained. At December 31, 2011, the Parent Corporation had $2.0 million in cash and short-term investments compared to $4.6 million at December 31, 2010. Expenses at the Parent Corporation are moderate and management believes that the Parent Corporation has adequate liquidity to fund its obligations.
Certain provisions of long-term debt agreements, primarily subordinated debt, prevent the Corporation from creating liens on, disposing of or issuing voting stock of subsidiaries. As of December 31, 2011, the Corporation was in compliance with all covenants and provisions of these agreements.
Management monitors current and projected cash flows, and adjusts positions as necessary to maintain adequate levels of liquidity. By using a variety of potential funding sources and staggering maturities, the risk of potential funding pressure is somewhat reduced. Management also maintains a detailed liquidity contingency plan designed to adequately respond to situations which could lead to liquidity concerns.
Based on anticipated cash flows at December 31, 2011 projected to December 31, 2012, the Corporation believes that the Bank’s liquidity should remain strong, with an approximate projection of $149.4 million in anticipated net cash flows over the next twelve months. This projection represents a forward-looking statement under the Private Securities Litigation Reform Act of 1995. Actual results could differ materially from this projection depending upon a number of factors, including the liquidity needs of the Bank’s customers, the availability of sources of liquidity and general economic conditions.
On September 30, 2009, the FDIC proposed a rule that required insured institutions to prepay their estimated quarterly assessments through December 31, 2012 to strengthen the cash position of the Deposit Insurance Fund. The cash prepayment was made on December 30, 2009 and amounted to approximately $5.7 million, which included the 2009 fourth quarter assessment. The prepayment did not have a significant impact on the Corporation’s future cash position or operations.
Deposits
Total deposits increased to $1.121 billion at December 31, 2011 from $860.3 million at December 31, 2010, an increase of $261.1 million, or 30.3 percent.
Total non-interest-bearing deposits increased to $167.2 million at December 31, 2011 from $144.2 million at December 31, 2010, an increase of $23.0 million or 15.9 percent. Time, savings and interest-bearing transaction accounts increased to $954.3 million at December 31, 2011 from $716.1 million on December 31, 2010, an increase of $238.1 million or 33.3 percent. These increases were attributable to continued core deposit growth in overall segments of the deposits base and in niche areas, such as municipal government, private schools and universities.
Certificates of deposit $100,000 and over decreased to 12.3 percent of total deposits at December 31, 2011 from 13.9 percent one year earlier. With the current turmoil in the financial markets, some of the Corporation’s depositors have become sensitive to obtaining full FDIC insurance for their time deposits. To accommodate its customers, the Corporation began offering Certificates of Deposit Account Registry Service (CDARS) in 2008. As a result of this offering and the increase in insurance coverage by the FDIC to $250,000, the Corporation reported an increase of $18.3 million in certificates of deposit greater than $100,000 at December 31, 2011 compared to year-end 2010. See Note 8 of the Notes to the Consolidated Financial Statements for more information.
At December 31, 2011, the Corporation had a total of $58.9 million with a weighted average rate of 0.70 percent in CDARS Reciprocal deposits compared to $83.0 million with a weighted average rate of 0.77 percent at December 31, 2010. Based on the Bank’s participation in Promontory Interfinancial Network, LLC., customers who are FDIC insurance sensitive are able to place large dollar deposits with the Corporation and the Corporation uses CDARS to place those funds into certificates of deposit issued by other banks in the Network. This occurs in increments of less than the FDIC insurance limits so that both the principal and interest are eligible for complete FDIC protection. The FDIC currently considers these funds as brokered deposits. All brokered deposits are classified in time deposits. It became apparent during the latter half of 2008 that customers’ preference in seeking safety and more liquidity became paramount in light of the financial crisis, as customers sought full FDIC insured bank products as a safe haven.
The Corporation derives a significant proportion of its liquidity from its core deposit base. For the year ended December 31, 2011, core deposits, comprised of total demand deposits, savings deposits and money market accounts, increased by $248.6 million or 36.2 percent from December 31, 2010 to $934.9 million at December 31, 2011. At December 31, 2011, core deposits were 83.4 percent of total deposits compared to 79.8 percent at year-end 2010. Alternatively, the Corporation uses a more stringent calculation for the management of its liquidity positions internally which consists of total demand and savings accounts (excluding money market accounts greater than $100,000) and excludes time deposits as part of core deposits as a percentage of total deposits. This number increased by $193.0 million or 40.6 percent from December 31, 2010 to $668.1 million and represented 59.6 percent of total deposits at December 31, 2011 as compared with 55.2 percent at December 31, 2010. The Corporation expects its deposit gathering efforts to remain strong, supported in part by the FDIC’s temporarily raising the deposit insurance limits. The Corporation was a participant in the FDIC’s Transaction Account Guarantee Program. Under this program, all non-interest bearing deposit transaction accounts were fully guaranteed by the FDIC, regardless of dollar amount, through June 30, 2010.
On July 21, 2010, President Obama signed the Dodd-Frank Act into law. One of the provisions of this act permanently increases the maximum amount of deposit insurance for banks, savings institutions and credit unions to $250,000 per depositor, retroactive to January 1, 2009, and non-interest bearing transaction accounts have unlimited deposit insurance through December 31, 2013.
The following table depicts the Corporation’s more stringent core deposit mix at December 31, 2011 and 2010.
| December 31, | Net Change Volume 2011 vs. 2010 | |||||||||||||||||||
| 2011 | 2010 | |||||||||||||||||||
| Amount | Percentage | Amount | Percentage | |||||||||||||||||
| (Dollars in Thousands) | ||||||||||||||||||||
| Demand Deposits | $ | 167,164 | 25.0 | % | $ | 144,210 | 30.4 | % | $ | 22,954 | ||||||||||
| Interest-Bearing Demand | 215,523 | 32.3 | 186,509 | 39.2 | 29,014 | |||||||||||||||
| Regular Savings | 135,703 | 20.3 | 112,305 | 23.6 | 23,398 | |||||||||||||||
| Money Market Deposits under $100 | 149,760 | 22.4 | 32,105 | 6.8 | 117,655 | |||||||||||||||
| Total core deposits | $ | 668,150 | 100.0 | % | $ | 475,129 | 100.0 | % | $ | 193,021 | ||||||||||
| Total deposits | $ | 1,121,415 | $ | 860,332 | $ | 261,083 | ||||||||||||||
| Core deposits to total deposits | 59.58 | % | 55.23 | % | ||||||||||||||||
Short-Term Borrowings
Short-term borrowings can be used to satisfy daily funding needs. Balances in those accounts fluctuate on a day-to-day basis. The Corporation’s principal short-term funding sources are Federal Funds purchased and securities sold under agreements to repurchase. Short-term borrowings, including Federal Funds purchased and securities sold under agreements to repurchase, amounted to $0 at year-end 2011, a decrease of $41.9 million or 100 percent from year-end 2010. During the third quarter of 2011 certain sweep relationships, in the amount of approximately $37 million, that were previously classified as short term borrowings were discontinued and were moved to interest bearing checking accounts.
The following table is a summary of short-term securities sold under repurchase agreements, including Federal Funds purchased, for each of the last three years.
| December 31, | ||||||||||||
| 2011 | 2010 | 2009 | ||||||||||
| (Dollars in Thousands) | ||||||||||||
| Short-term securities sold under repurchase agreements, including Federal Funds purchased: | ||||||||||||
| Average interest rate: | ||||||||||||
| At year end | — | % | 0.27 | % | 0.97 | % | ||||||
| For the year | 0.27 | % | 0.50 | % | 1.38 | % | ||||||
| Average amount outstanding during the year | $ | 29,288 | $ | 42,608 | $ | 35,392 | ||||||
| Maximum amount outstanding at any month end | $ | 71,732 | $ | 54,855 | $ | 58,515 | ||||||
| Amount outstanding at year end | $ | — | $ | 41,855 | $ | 46,109 | ||||||
Long-Term Borrowings
Long-term borrowings consist of Federal Home Loan Bank of New York (“FHLB”) advances and securities sold under agreements to repurchase that have contractual maturities over one year. Long-term borrowings amounted to $161.0 million at December 31, 2011, a decrease of $10.0 million or 5.85 percent, from year-end 2010 as the Corporation decided to concentrate its efforts on increasing the core deposit base of the Bank rather than replacing those borrowings.
Cash Flows
The consolidated statements of cash flows present the changes in cash and cash equivalents from operating, investing and financing activities. During 2011, cash and cash equivalents (which increased overall by $73.6 million) were provided on a net basis by operating activities and financing activities, and used on a net basis by investing activities. With respect to the cash flows from financing activities, net increases in deposits and SBLF proceeds were offset by reductions in borrowings and the Corporation’s dividend payments.
During 2010, cash and cash equivalents (which decreased overall by $51.7 million) were provided on a net basis by operating activities and used on a net basis by investing activities and financing activities. With respect to the cash flows from financing activities, a net increase in deposits and proceeds from a stock offering were partially offset by a reduction in borrowings and the Corporation’s dividend payments.
During 2009, cash and cash equivalents (which increased overall by $74.1 million) were provided on a net basis by operating activities and financing activities and used on a net basis by investing activities. With respect to cash flows from financing activities, a $172.3 million increase in cash resulted from a substantial net increase in deposits as well as from the proceeds of our TARP participation and rights offering.
Contractual Obligations and Other Commitments
The following table summarizes contractual obligations at December 31, 2011 and the effect such obligations are expected to have on liquidity and cash flows in future periods.
The Stockholders’ Equity
Stockholders’ equity amounted to $135.9 million at December 31, 2011, an increase of $14.9 million or 12.4 percent, compared to year-end 2010. At December 31, 2010, stockholders’ equity totaled $121.0 million, an increase of $19.2 million or 18.9 percent from December 31, 2009.
On September 15, 2011, the Corporation issued $11.25 million in nonvoting senior preferred stock to the Treasury under the Small Business Lending Fund Program. Under the Securities Purchase Agreement, the Corporation issued to the Treasury a total of 11,250 shares of the Corporation’s Senior Non-Cumulative Perpetual Preferred Stock, Series B, having a liquidation value of $1,000 per share. Simultaneously, using the proceeds from the issuance of the SBLF Preferred Stock, the Corporation redeemed from the Treasury, all 10,000 outstanding shares of its Fixed Rate Cumulative Perpetual Preferred Stock, Series A, liquidation amount $1,000 per share, for a redemption price of $10,041,667, including accrued but unpaid dividends up to the date of redemption. The investment in the SBLF program provided the Corporation with approximately $1.25 million additional Tier 1 capital. The capital received under the program will allow the Corporation to continue to serve its small business clients through the commercial lending program.
On December 7, 2011, the Corporation repurchased the warrants issued on January 12, 2009 to the U.S. Treasury as part of its participation in the U.S. Treasury’s TARP Capital Purchase Program. In the repurchase, the Corporation paid the U.S. Treasury $245,000 for the warrants.
In September 2010, the Corporation sold an aggregate of 1,715,000 shares of its common stock under its previously filed shelf registration statement. The Corporation sold 1,430,000 shares of common stock at a price of $7.00 per share, with underwriting discounts and commissions of $0.39 per share, for gross proceeds from this offering of $10,010,000. The Corporation also sold 285,000 shares of common stock directly to certain of its directors at a price of $7.50 per share, for gross proceeds from this offering of $2,137,500. Net proceeds from both offerings totaled $11,378,000 after underwriting discounts and commissions of $557,000 and offering expenses of approximately $213,000 (which consisted primarily of legal and accounting fees).
Book value per share at year-end 2011 was $7.63 compared to $6.83 at year-end 2010. Tangible book value at year-end 2011 was $6.60 compared to $5.79 at year end 2010; see Item 6 for a reconciliation of this non-GAAP financial measure to book value.
During 2011, the Corporation made no purchases of common stock. At December 31, 2011, there were 652,868 shares available for repurchase under the Corporation’s stock buyback program.
Capital
The maintenance of a solid capital foundation continues to be a primary goal for the Corporation. Accordingly, capital plans and dividend policies are monitored on an ongoing basis. The most important objective of the capital planning process is to balance effectively the retention of capital to support future growth and the goal of providing stockholders with an attractive long-term return on their investment.
Risk-Based Capital/Leverage
The Tier I leverage capital (defined as tangible stockholders’ equity for common stock and Trust Preferred Capital Securities) at December 31, 2011 amounted to $129.4 million or 9.29 percent of average total assets. At December 31, 2010, the Corporation’s Tier I leverage capital amounted to $116.6 million or 9.90 percent of average total assets. Tier I capital excludes the effect of FASB ASC 320-10-05, which amounted to $2.0 million of net unrealized losses, after tax, on securities available-for-sale (reported as a component of accumulated other comprehensive income which is included in stockholders’ equity), and is reduced by goodwill and intangible assets of $16.9 million as of December 31, 2011. For information on goodwill and intangible assets, see Note 1 to the Consolidated Financial Statements.
United States bank regulators have issued guidelines establishing minimum capital standards related to the level of assets and off balance-sheet exposures adjusted for credit risk. Specifically, these guidelines categorize assets and off balance-sheet items into four risk-weightings and require banking institutions to maintain a minimum ratio of capital to risk-weighted assets. At December 31, 2011, the Corporation’s Tier I and total risk-based capital ratios were 12.00 percent and 12.89 percent, respectively. For information on risk-based capital and regulatory guidelines for the Parent Corporation and its bank subsidiary, see Note 13 to the Consolidated Financial Statements.
The foregoing capital ratios are based in part on specific quantitative measures of assets, liabilities and certain off-balance sheet items as calculated under regulatory accounting practices. Capital amounts and classifications are also subject to qualitative judgments by the bank regulators regarding capital components, risk weightings and other factors. The OCC established higher minimum capital ratios for the Bank effective as of December 31, 2009: Tier 1 Risk-Based Capital of 10 percent, Total Risk-Based Capital of 12 percent and Tier 1 Leverage Capital of 8 percent. As of December 31, 2011, management believes that each of the Bank and the Parent Corporation meet all capital adequacy requirements to which it is subject. Under a Memorandum of Understanding that was terminated by the OCC during 2011, the Bank agreed to develop a three year capital program, which will include specific plans for the maintenance of adequate capital and the strengthening of the Bank’s capital structure to meet current and future needs.
Subordinated Debentures
On December 19, 2003, Center Bancorp Statutory Trust II, a statutory business trust and wholly-owned subsidiary of Center Bancorp, Inc., issued $5.0 million of, MMCapS capital securities to investors due on January 23, 2034. The capital securities presently qualify as Tier I capital. The trust loaned the proceeds of this offering to the Corporation and received in exchange $5.2 million of the Parent Corporation’s subordinated debentures. The subordinated debentures are redeemable in whole or in part prior to maturity. The floating interest rate on the subordinate debentures is three-month LIBOR plus 2.85 percent and reprices quarterly. The rate at December 31, 2011 was 3.43 percent.
The additional capital raised with respect to the issuance of the floating rate capital pass-through securities was used to bolster the Corporation’s capital and for general corporate purposes, including capital contributions to Union Center National Bank. Additional information regarding the capital treatment of these securities is contained in Note 10 of the Notes to the Consolidated Financial Statements.
Looking Forward
One of the Corporation’s primary objectives is to achieve balanced asset and revenue growth, and at the same time expand market presence and diversify its financial products. However, it is recognized that objectives, no matter how focused, are subject to factors beyond the control of the Corporation, which can impede its ability to achieve these goals. The following factors should be considered when evaluating the Corporation’s ability to achieve its objectives:
The financial market place is rapidly changing. Banks are no longer the only place to obtain loans, nor the only place to keep financial assets. The banking industry has lost market share to other financial service providers. The future is predicated on the Corporation’s ability to adapt its products, provide superior customer service and compete in an ever-changing marketplace. Net interest income, the primary source of earnings, is impacted favorably or unfavorably by changes in interest rates. Although the impact of interest rate fluctuations is mitigated by ALCO strategies, significant changes in interest rates can have a material adverse impact on profitability.
The ability of customers to repay their obligations is often impacted by changes in the regional and local economy. Although the Corporation sets aside loan loss provisions toward the allowance for loan losses when management determines such action to be appropriate, significant unfavorable changes in the economy could impact the assumptions used in the determination of the adequacy of the allowance.
Technological changes will have a material impact on how financial service companies compete for and deliver services. It is recognized that these changes will have a direct impact on how the marketplace is approached and ultimately on profitability. The Corporation has taken steps to improve its traditional delivery channels. However, continued success will likely be measured by the ability to anticipate and react to future technological changes.
This “Looking Forward” description constitutes a forward-looking statement under the Private Securities Litigation Reform Act of 1995. Actual results could differ materially from those projected in the Corporation’s forward-looking statements due to numerous known and unknown risks and uncertainties, including the factors referred to above, in Item 1A of this Annual Report on Form 10K and in other sections of this Annual Report on Form 10K.
Item 7A. Quantitative and Qualitative Disclosures about Market Risk
Interest Sensitivity
Market Risk
The Corporation’s profitability is affected by fluctuations in interest rates. A sudden and substantial increase or decrease in interest rates may adversely affect the Corporation’s earnings to the extent that the interest rates borne by assets and liabilities do not similarly adjust. The Corporation’s primary objective in managing interest rate risk is to minimize the adverse impact of changes in interest rates on the Corporation’s net interest income and capital, while structuring the Corporation’s asset-liability structure to obtain the maximum yield-cost spread on that structure. The Corporation relies primarily on its asset-liability structure to control interest rate risk. The Corporation continually evaluates interest rate risk management opportunities, including the use of derivative financial instruments. The management of the Corporation believes that hedging instruments currently available are not cost-effective, and, therefore, has focused its efforts on increasing the Corporation’s yield-cost spread through wholesale and retail growth opportunities.
The Corporation monitors the impact of changes in interest rates on its net interest income using several tools. One measure of the Corporation’s exposure to differential changes in interest rates between assets and liabilities is the Corporation’s analysis of its interest rate sensitivity. This test measures the impact on net interest income or net portfolio value of an immediate change in interest rates in 100 basis point increments. Net portfolio value is defined as the net present value of assets, liabilities and off-balance sheet contracts.
The primary tool used by management to measure and manage interest rate exposure is a simulation model. Use of the model to perform simulations reflecting changes in interest rates over one and two-year time horizons has enabled management to develop and initiate strategies for managing exposure to interest rate risk. In its simulations, management estimates the impact on net interest income of various changes in interest rates. Projected net interest income sensitivity to movements in interest rates is modeled based on both an immediate rise and fall in interest rates (“rate shock”), as well as gradual changes in interest rates over a twelve-month time period. The model is based on the actual maturity and repricing characteristics of interest-rate sensitive assets and liabilities. The model incorporates assumptions regarding earning asset and deposit growth, prepayments, interest rates and other factors.
Management believes that both individually and taken together, these assumptions are reasonable, but the complexity of the simulation modeling process results in a sophisticated estimate, not an absolutely precise calculation of exposure. For example, estimates of future cash flows must be made for instruments without contractual maturity or payment schedules.
Based on the results of the interest simulation model as of December 31, 2011, and assuming that management does not take action to alter the outcome, the Corporation would expect an increase of 1.71 and 1.89 percent in net interest income if interest rates increased by 200 and 300 basis points, respectively, from current rates in a gradual and parallel rate ramp over a twelve month period. As market rates declined to historic lows at December 31, 2011, the Corporation did not feel that modeling a down rate scenario was realistic in the current environment.
The declining rates and steepening of the yield curve during both 2011 and 2010 affected net interest margins. Based on management’s perception that interest rates will continue to be volatile, projected increased levels of prepayments on the earning-asset portfolio and the current level of interest rates, emphasis has been, and is expected to continue to be, placed on interest-sensitivity matching with the objective of stabilizing the net interest spread during 2012. However, no assurance can be given that this objective will be met.
Equity Price Risk
The Corporation is also exposed to equity price risk inherent in its portfolio of publicly traded equity securities, which had a fair value of $262,000 at December 31, 2011 and $300,000 at December 31, 2010. The Corporation monitors its equity investments for impairment on a periodic basis. In the event that the carrying value of the equity investment exceeds its fair value, and the Corporation determines the decline in value to be other than temporary, the Corporation reduces the carrying value to its current fair value. During 2011 and 2010, the Corporation did not record any of other-than-temporary impairment charges relating to equity holdings in bank stocks. The remaining securities in the equity portfolio were mutual funds and money market funds.
8. Financial Statements and Supplementary Data
is set forth herein.
| -3- |
Page | ||||
| F-2 | ||||
| Consolidated Statements of Condition | F-4 | |||
| Consolidated Statements of Income | F-5 | |||
| Consolidated Statements of Comprehensive Income | F-6 | |||
| Consolidated Statements of Changes in Stockholders’ Equity | F-7 | |||
| Consolidated Statements of Cash Flows | F-8 | |||
| Notes to Consolidated Financial Statements | F-9 | |||
| F-1 | ||
Center Bancorp, Inc.
audit.
Philadelphia, Pennsylvania
March 5, 2014
| F-2 | ||
2013
| F-3 | ||
| December 31, | ||||||||
| 2011 | 2010 | |||||||
| (In Thousands, Except Share Data) | ||||||||
| ASSETS | ||||||||
| Cash and due from banks | $ | 111,101 | $ | 37,497 | ||||
| Securities available-for-sale | 414,507 | 378,080 | ||||||
| Securities held-to-maturity (fair value of $74,922 and $0) | 72,233 | — | ||||||
| Loans | 756,010 | 708,444 | ||||||
| Less: Allowance for loan losses | 9,602 | 8,867 | ||||||
| Net loans | 746,408 | 699,577 | ||||||
| Restricted investment in bank stocks, at cost | 9,233 | 9,596 | ||||||
| Premises and equipment, net | 12,327 | 12,937 | ||||||
| Accrued interest receivable | 6,219 | 4,134 | ||||||
| Bank owned life insurance | 28,943 | 27,905 | ||||||
| Goodwill and other intangible assets | 16,902 | 16,959 | ||||||
| Prepaid FDIC assessment | 1,884 | 3,582 | ||||||
| Other real estate owned | 591 | — | ||||||
| Other assets | 12,390 | 17,118 | ||||||
| Total assets | $ | 1,432,738 | $ | 1,207,385 | ||||
| LIABILITIES AND STOCKHOLDERS’ EQUITY | ||||||||
| Deposits: | ||||||||
| Non-interest-bearing | $ | 167,164 | $ | 144,210 | ||||
| Interest-bearing: | ||||||||
| Time deposits $100 and over | 137,998 | 119,651 | ||||||
| Interest-bearing transaction, savings and time deposits less than $100 | 816,253 | 596,471 | ||||||
| Total deposits | 1,121,415 | 860,332 | ||||||
| Short-term borrowings | — | 41,855 | ||||||
| Long-term borrowings | 161,000 | 171,000 | ||||||
| Subordinated debentures | 5,155 | 5,155 | ||||||
| Accounts payable and accrued liabilities | 9,252 | 8,086 | ||||||
| Total liabilities | 1,296,822 | 1,086,428 | ||||||
| Stockholders’ Equity | ||||||||
| Preferred Stock, $1,000 liquidation value per share: | ||||||||
| Authorized 5,000,000 shares; issued and outstanding 11,250 shares of Series B preferred stock at December 31, 2011 and 10,000 shares of Series A preferred stock at December 31, 2010 | 11,250 | 9,700 | ||||||
| Common stock, no par value: | ||||||||
| Authorized 25,000,000 shares; issued 18,477,412 shares at December 31, 2011 and 2010; outstanding 16,332,327 shares at December 31, 2011 and 16,289,832 at December 31, 2010 | 110,056 | 110,056 | ||||||
| Additional paid-in capital | 4,715 | 4,941 | ||||||
| Retained earnings | 32,695 | 21,633 | ||||||
| Treasury stock, at cost (2,145,085 shares at December 31, 2011 and 2,187,580 at December 31, 2010) | (17,354 | ) | (17,698 | ) | ||||
| Accumulated other comprehensive loss | (5,446 | ) | (7,675 | ) | ||||
| Total stockholders’ equity | 135,916 | 120,957 | ||||||
| Total liabilities and stockholders’ equity | $ | 1,432,738 | $ | 1,207,385 | ||||
| December 31, | |||||||
| 2013 | 2012 | ||||||
| (In Thousands, Except Share and Per Share Data) | |||||||
| ASSETS | |||||||
| Cash and due from banks | $ | 82,692 | $ | 104,134 | |||
| Interest bearing deposits with banks | — | 2,004 | |||||
| Total cash and cash equivalents | 82,692 | 106,138 | |||||
| Securities available-for-sale | 323,070 | 496,815 | |||||
| Securities held-to-maturity (fair value of $210,958 and $62,431) | 215,286 | 58,064 | |||||
| Loans held for sale | — | 1,491 | |||||
| Loans | 960,943 | 889,672 | |||||
| Less: Allowance for loan losses | 10,333 | 10,237 | |||||
| Net loans | 950,610 | 879,435 | |||||
| Restricted investment in bank stocks, at cost | 8,986 | 8,964 | |||||
| Premises and equipment, net | 13,681 | 13,563 | |||||
| Accrued interest receivable | 6,802 | 6,849 | |||||
| Bank owned life insurance | 35,734 | 34,961 | |||||
| Goodwill and other intangible assets | 16,828 | 16,858 | |||||
| Prepaid FDIC assessment | — | 811 | |||||
| Other real estate owned | 220 | 1,300 | |||||
| Due from brokers for investment securities | 8,759 | — | |||||
| Other assets | 10,414 | 4,516 | |||||
| Total assets | $ | 1,673,082 | $ | 1,629,765 | |||
| LIABILITIES AND STOCKHOLDERS’ EQUITY | |||||||
| Deposits: | |||||||
| Non-interest-bearing | $ | 227,370 | $ | 215,071 | |||
| Interest-bearing: | |||||||
| Time deposits $100 and over | 99,444 | 110,835 | |||||
| Interest-bearing transaction, savings and time deposits less than $100 | 1,015,191 | 981,016 | |||||
| Total deposits | 1,342,005 | 1,306,922 | |||||
| Long-term borrowings | 146,000 | 146,000 | |||||
| Subordinated debentures | 5,155 | 5,155 | |||||
| Accounts payable and accrued liabilities | 11,338 | 10,997 | |||||
| Total liabilities | 1,504,498 | 1,469,074 | |||||
| Stockholders’ Equity | |||||||
| Preferred Stock, $1,000 liquidation value per share: | |||||||
| Authorized 5,000,000 shares; issued and outstanding 11,250 shares of Series B preferred stock at December 31, 2013 and 2012 total liquidation value of $11,250,000 | 11,250 | 11,250 | |||||
| Common stock, no par value: | |||||||
| Authorized 25,000,000 shares; issued 18,477,412 shares at December 31, 2013 and 2012; outstanding 16,369,012 shares at December 31, 2013 and 16,347,915 at December 31, 2012 | 110,056 | 110,056 | |||||
| Additional paid-in capital | 4,986 | 4,801 | |||||
| Retained earnings | 61,914 | 46,753 | |||||
| Treasury stock, at cost (2,108,400 shares at December 31, 2013 and 2,129,497 at December 31, 2012) | (17,078) | (17,232) | |||||
| Accumulated other comprehensive income (loss) | (2,544) | 5,063 | |||||
| Total stockholders’ equity | 168,584 | 160,691 | |||||
| Total liabilities and stockholders’ equity | $ | 1,673,082 | $ | 1,629,765 | |||
| F-4 | ||
| Years Ended December 31, | ||||||||||||
| 2011 | 2010 | 2009 | ||||||||||
| (Dollars in Thousands, Except per Share Data) | ||||||||||||
| Interest income: | ||||||||||||
| Interest and fees on loans | $ | 36,320 | $ | 37,200 | $ | 36,751 | ||||||
| Interest and dividends on investment securities: | ||||||||||||
| Taxable interest income | 13,278 | 10,588 | 12,727 | |||||||||
| Non-taxable interest income | 1,700 | 220 | 989 | |||||||||
| Dividends | 629 | 706 | 643 | |||||||||
| Total interest income | 51,927 | 48,714 | 51,110 | |||||||||
| Interest expense: | ||||||||||||
| Interest on certificates of deposit $100 & over | 1,215 | 1,301 | 3,551 | |||||||||
| Interest on other deposits | 4,305 | 4,705 | 8,757 | |||||||||
| Interest on short-term borrowings | 79 | 211 | 449 | |||||||||
| Interest on long-term borrowings | 6,578 | 8,568 | 9,888 | |||||||||
| Total interest expense | 12,177 | 14,785 | 22,645 | |||||||||
| Net interest income | 39,750 | 33,929 | 28,465 | |||||||||
| Provision for loan losses | 2,448 | 5,076 | 4,597 | |||||||||
| Net interest income, after provision for loan losses | 37,302 | 28,853 | 23,868 | |||||||||
| Other income: | ||||||||||||
| Service charges, commissions and fees | 1,896 | 1,975 | 1,835 | |||||||||
| Annuity and insurance | 110 | 123 | 126 | |||||||||
| Bank-owned life insurance | 1,038 | 1,226 | 1,156 | |||||||||
| Other | 800 | 487 | 298 | |||||||||
| Total other-than-temporary impairment losses | (342 | ) | (8,953 | ) | (9,066 | ) | ||||||
| Less: Portion of loss recognized in other comprehensive income (before taxes) | — | 3,377 | 4,828 | |||||||||
| Net other-than-temporary impairment losses | (342 | ) | (5,576 | ) | (4,238 | ) | ||||||
| Net gains on sale on investment securities | 3,976 | 4,237 | 4,729 | |||||||||
| Net investment securities gains (losses) | 3,634 | (1,339 | ) | 491 | ||||||||
| Total other income | 7,478 | 2,472 | 3,906 | |||||||||
| Other expense: | ||||||||||||
| Salaries and employee benefits | 11,527 | 10,765 | 9,915 | |||||||||
| Occupancy, net | 2,021 | 2,088 | 2,536 | |||||||||
| Premises and equipment | 926 | 1,093 | 1,263 | |||||||||
| FDIC Insurance | 1,712 | 2,126 | 2,055 | |||||||||
| Professional and consulting | 1,156 | 1,121 | 811 | |||||||||
| Stationery and printing | 368 | 316 | 339 | |||||||||
| Marketing and advertising | 131 | 268 | 366 | |||||||||
| Computer expense | 1,312 | 1,366 | 964 | |||||||||
| Other real estate owned expense, net | 398 | 284 | 1,438 | |||||||||
| Loss on fixed assets, net | — | 427 | — | |||||||||
| Repurchase agreement termination fee | — | 594 | — | |||||||||
| Other | 3,892 | 3,651 | 3,370 | |||||||||
| Total other expense | 23,443 | 24,099 | 23,057 | |||||||||
| Income before income tax expense | 21,337 | 7,226 | 4,717 | |||||||||
| Income tax expense | 7,411 | 222 | 946 | |||||||||
| Net income | 13,926 | 7,004 | 3,771 | |||||||||
| Preferred stock dividends and accretion | 820 | 581 | 567 | |||||||||
| Net income available to common stockholders | $ | 13,106 | $ | 6,423 | $ | 3,204 | ||||||
| Earnings per common share: | ||||||||||||
| Basic | $ | 0.80 | $ | 0.43 | $ | 0.24 | ||||||
| Diluted | $ | 0.80 | $ | 0.43 | $ | 0.24 | ||||||
| Weighted average common shares outstanding: | ||||||||||||
| Basic | 16,295,761 | 15,025,870 | 13,382,614 | |||||||||
| Diluted | 16,314,899 | 15,027,159 | 13,385,416 | |||||||||
| Years Ended December 31, | ||||||||||
| 2013 | 2012 | 2011 | ||||||||
| (Dollars in Thousands, Except per Share Data) | ||||||||||
| Interest income: | ||||||||||
| Interest and fees on loans | $ | 40,132 | $ | 38,921 | $ | 36,320 | ||||
| Interest and dividends on investment securities: | ||||||||||
| Taxable interest income | 12,189 | 12,269 | 13,278 | |||||||
| Non-taxable interest income | 4,422 | 3,507 | 1,700 | |||||||
| Dividends | 523 | 567 | 629 | |||||||
| Interest on federal funds sold and other short-term investment | 2 | 8 | — | |||||||
| Total interest income | 57,268 | 55,272 | 51,927 | |||||||
| Interest expense: | ||||||||||
| Interest on certificates of deposit $100 & over | 866 | 839 | 1,215 | |||||||
| Interest on other deposits | 4,353 | 4,569 | 4,305 | |||||||
| Interest on short-term borrowings | — | — | 79 | |||||||
| Interest on long-term borrowings | 5,863 | 6,368 | 6,578 | |||||||
| Total interest expense | 11,082 | 11,776 | 12,177 | |||||||
| Net interest income | 46,186 | 43,496 | 39,750 | |||||||
| Provision for loan losses | 350 | 325 | 2,448 | |||||||
| Net interest income, after provision for loan losses | 45,836 | 43,171 | 37,302 | |||||||
| Other income: | ||||||||||
| Service charges, commissions and fees | 1,873 | 1,775 | 1,896 | |||||||
| Annuity and insurance | 489 | 204 | 110 | |||||||
| Bank-owned life insurance | 1,364 | 1,018 | 1,038 | |||||||
| Loan related fees | 839 | 510 | 432 | |||||||
| Net gains on sale of loans held for sale | 294 | 484 | 251 | |||||||
| Bargain gain on acquisition | — | 899 | — | |||||||
| Other | 281 | 308 | 117 | |||||||
| Total other-than-temporary impairment losses | (652) | (870) | (342) | |||||||
| Net gains on sale on investment securities | 2,363 | 2,882 | 3,976 | |||||||
| Net investment securities gains | 1,711 | 2,012 | 3,634 | |||||||
| Total other income | 6,851 | 7,210 | 7,478 | |||||||
| Other expense: | ||||||||||
| Salaries and employee benefits | 13,465 | 12,571 | 11,527 | |||||||
| Occupancy and equipment | 3,518 | 2,987 | 2,947 | |||||||
| FDIC Insurance | 1,098 | 1,154 | 1,712 | |||||||
| Professional and consulting | 1,111 | 1,077 | 1,156 | |||||||
| Stationery and printing | 333 | 349 | 368 | |||||||
| Marketing and advertising | 304 | 186 | 131 | |||||||
| Computer expense | 1,422 | 1,419 | 1,312 | |||||||
| Other real estate owned expense, net | 137 | 150 | 398 | |||||||
| Repurchase agreement prepayment and termination fee | — | 1,012 | — | |||||||
| Acquisition cost | — | 482 | — | |||||||
| Other | 3,890 | 3,810 | 3,892 | |||||||
| Total other expense | 25,278 | 25,197 | 23,443 | |||||||
| Income before income tax expense | 27,409 | 25,184 | 21,337 | |||||||
| Income tax expense | 7,484 | 7,677 | 7,411 | |||||||
| Net income | 19,925 | 17,507 | 13,926 | |||||||
| Preferred stock dividends and accretion | 141 | 281 | 820 | |||||||
| Net income available to common stockholders | $ | 19,784 | $ | 17,226 | $ | 13,106 | ||||
| Earnings per common share: | ||||||||||
| Basic | $ | 1.21 | $ | 1.05 | $ | 0.80 | ||||
| Diluted | $ | 1.21 | $ | 1.05 | $ | 0.80 | ||||
| Weighted average common shares outstanding: | ||||||||||
| Basic | 16,349,204 | 16,340,197 | 16,295,761 | |||||||
| Diluted | 16,385,692 | 16,351,046 | 16,314,899 | |||||||
| F-5 | ||
| Years Ended December 31, 2011, 2010 and 2009 | ||||||||||||||||||||||||||||
| Preferred Stock | Common Stock | Additional Paid In Capital | Retained Earnings | Treasury Stock | Accumulated Other Comprehensive Income (Loss) | Total Stockholders’ Equity | ||||||||||||||||||||||
| (In Thousands, Except Share and per Share Data) | ||||||||||||||||||||||||||||
| Balance, December 31, 2008 | $ | — | $ | 86,908 | $ | 5,204 | $ | 16,309 | $ | (17,796 | ) | $ | (8,912 | ) | $ | 81,713 | ||||||||||||
| Comprehensive income: | ||||||||||||||||||||||||||||
| Net income | 3,771 | 3,771 | ||||||||||||||||||||||||||
| Other comprehensive loss, net of taxes | (1,864 | ) | (1,864 | ) | ||||||||||||||||||||||||
| Total comprehensive income | 1,907 | |||||||||||||||||||||||||||
| Issuance of preferred stock (10,000 shares) and warrants (86,705 shares) | 9,539 | 461 | 10,000 | |||||||||||||||||||||||||
| Accretion of discount on preferred stock | 80 | (80 | ) | — | ||||||||||||||||||||||||
| Dividends on preferred stock | (487 | ) | (487 | ) | ||||||||||||||||||||||||
| Proceeds from rights offering (1,571,428 shares) | 11,000 | 11,000 | ||||||||||||||||||||||||||
| Cash dividends declared on common stock ($0.18 per share) | (2,434 | ) | (2,434 | ) | ||||||||||||||||||||||||
| Issuance cost of common stock | (11 | ) | (11 | ) | ||||||||||||||||||||||||
| Exercise of stock options (9,289 shares) | (19 | ) | 76 | 57 | ||||||||||||||||||||||||
| Stock-based compensation expense | 77 | 77 | ||||||||||||||||||||||||||
| Taxes related to stock-based compensation | (73 | ) | (73 | ) | ||||||||||||||||||||||||
| Balance, December 31, 2009 | 9,619 | 97,908 | 5,650 | 17,068 | (17,720 | ) | (10,776 | ) | 101,749 | |||||||||||||||||||
| Comprehensive income: | ||||||||||||||||||||||||||||
| Net income | 7,004 | 7,004 | ||||||||||||||||||||||||||
| Other comprehensive income, net of taxes | 3,101 | 3,101 | ||||||||||||||||||||||||||
| Total comprehensive income | 10,105 | |||||||||||||||||||||||||||
| Accretion of discount on preferred stock | 81 | (81 | ) | — | ||||||||||||||||||||||||
| Dividends on preferred stock | (500 | ) | (500 | ) | ||||||||||||||||||||||||
| Proceeds from stock offerings (1,715,000 shares) | 12,148 | (770 | ) | 11,378 | ||||||||||||||||||||||||
| Cash dividends declared on common stock ($0.12 per share) | (1,852 | ) | (1,852 | ) | ||||||||||||||||||||||||
| Issuance cost of common stock | (6 | ) | (6 | ) | ||||||||||||||||||||||||
| Stock awarded | 3 | 22 | 25 | |||||||||||||||||||||||||
| Stock-based compensation expense | 51 | 51 | ||||||||||||||||||||||||||
| Option related tax trueup | 7 | 7 | ||||||||||||||||||||||||||
| Balance, December 31, 2010 | 9,700 | 110,056 | 4,941 | 21,633 | (17,698 | ) | (7,675 | ) | 120,957 | |||||||||||||||||||
| Comprehensive income: | ||||||||||||||||||||||||||||
| Net income | 13,926 | 13,926 | ||||||||||||||||||||||||||
| Other comprehensive income, net of taxes | 2,229 | 2,229 | ||||||||||||||||||||||||||
| Total comprehensive income | 16,155 | |||||||||||||||||||||||||||
| Accretion of discount on preferred stock | 300 | (300 | ) | — | ||||||||||||||||||||||||
| Dividends on preferred stock | (520 | ) | (520 | ) | ||||||||||||||||||||||||
| Redemption of series A preferred stock | (10,000 | ) | (10,000 | ) | ||||||||||||||||||||||||
| Proceeds from issuance of series B preferred stock | 11,250 | 11,250 | ||||||||||||||||||||||||||
| Warrant repurchased | (245 | ) | (245 | ) | ||||||||||||||||||||||||
| Cash dividends declared on common stock ($0.12 per share) | (1,955 | ) | (1,955 | ) | ||||||||||||||||||||||||
| Issuance cost of common stock | (5 | ) | (5 | ) | ||||||||||||||||||||||||
| Issuance cost of series B preferred stock | (84 | ) | (84 | ) | ||||||||||||||||||||||||
| Exercise of stock options (42,495 shares) | (16 | ) | 344 | 328 | ||||||||||||||||||||||||
| Stock-based compensation expense | 35 | 35 | ||||||||||||||||||||||||||
| Balance, December 31, 2011 | $ | 11,250 | $ | 110,056 | $ | 4,715 | $ | 32,695 | $ | (17,354 | ) | $ | (5,446 | ) | $ | 135,916 | ||||||||||||
| Years Ended December 31, | ||||||||||
| 2013 | 2012 | 2011 | ||||||||
| (Dollars in Thousands) | ||||||||||
| Net income | $ | 19,925 | $ | 17,507 | $ | 13,926 | ||||
| Other comprehensive income, net of tax: | ||||||||||
| Unrealized gains and losses on securities available-for-sale: | ||||||||||
| Reclassification adjustments for OTTI losses included in income | 652 | 870 | 342 | |||||||
| Tax effect | (178) | (265) | (119) | |||||||
| Net of tax amount | 474 | 605 | 223 | |||||||
| Unrealized (losses) gains on available for sale securities | (8,741) | 19,819 | 8,990 | |||||||
| Tax effect | 3,578 | (7,444) | (3,486) | |||||||
| Net of tax amount | (5,163) | 12,375 | 5,504 | |||||||
| Reclassification adjustment for realized gains arising during this period | (2,363) | (2,882) | (3,976) | |||||||
| Tax effect | 645 | 879 | 1,380 | |||||||
| Net of tax amount | (1,718) | (2,003) | (2,596) | |||||||
| Unrealized holding (losses) gains on securities transferred from available-for-sale to held-to-maturity securities | (2,612) | — | 291 | |||||||
| Tax effect | 1,064 | — | (110) | |||||||
| Net of tax amount | (1,548) | — | 181 | |||||||
| Amortization of unrealized holding gains on securities transferred from available-for-sale to held-to-maturity securities | (58) | (2) | (46) | |||||||
| Tax effect | 19 | 1 | 28 | |||||||
| Net of tax amount | (39) | (1) | (18) | |||||||
| Pension plan: | ||||||||||
| Actuarial gains (losses) | 654 | (790) | (1,649) | |||||||
| Tax effect | (267) | 323 | 584 | |||||||
| Net of tax amount | 387 | (467) | (1,065) | |||||||
| Total other comprehensive (loss) income | (7,607) | 10,509 | 2,229 | |||||||
| Total comprehensive income | $ | 12,318 | $ | 28,016 | $ | 16,155 | ||||
| F-6 | ||
| Years Ended December 31, | ||||||||||||
| 2011 | 2010 | 2009 | ||||||||||
| (Dollars in Thousands) | ||||||||||||
| Cash flows from operating activities: | ||||||||||||
| Net income | $ | 13,926 | $ | 7,004 | $ | 3,771 | ||||||
| Adjustments to Reconcile Net Income to Net Cash Provided by Operating Activities: | ||||||||||||
| Depreciation and amortization | 983 | 1,165 | 1,451 | |||||||||
| Provision for loan losses | 2,448 | 5,076 | 4,597 | |||||||||
| Provision for deferred taxes | 3,406 | 51 | 819 | |||||||||
| Stock-based compensation expense | 35 | 51 | 77 | |||||||||
| Net other-than-temporary impairment losses | 342 | 5,576 | 4,238 | |||||||||
| Net gains on sales of available-for-sale securities | (3,976 | ) | (4,237 | ) | (4,729 | ) | ||||||
| Net gains on sales of loans held for sale | (251 | ) | (140 | ) | (5 | ) | ||||||
| Net loans originated for sale | (14,357 | ) | (8,347 | ) | (3,453 | ) | ||||||
| Proceeds from sales of loans held for sale | 13,923 | 8,154 | 3,458 | |||||||||
| Net loss on disposition of premises and equipment | — | 427 | — | |||||||||
| Net loss on sales of other real estate owned | 5 | 207 | 905 | |||||||||
| Life insurance death benefit | — | — | (136 | ) | ||||||||
| Increase in cash surrender value of bank owned life insurance | (1,038 | ) | (1,226 | ) | (1,020 | ) | ||||||
| Net amortization of securities | 4,012 | 2,979 | 793 | |||||||||
| (Increase) decrease in accrued interest receivable | (2,085 | ) | (101 | ) | 121 | |||||||
| Decrease in prepaid FDIC insurance assessment | 1,698 | 1,792 | — | |||||||||
| (Increase) decrease in other assets | (402 | ) | 1,642 | (1,732 | ) | |||||||
| Decrease in other liabilities | (585 | ) | (2,426 | ) | (480 | ) | ||||||
| Net cash provided by operating activities | 18,084 | 17,647 | 8,675 | |||||||||
| Cash flows from investing activities: | ||||||||||||
| Investment securities available-for-sale: | ||||||||||||
| Purchases | (400,644 | ) | (791,156 | ) | (785,044 | ) | ||||||
| Sales | 254,821 | 644,075 | 665,828 | |||||||||
| Maturities, calls and principal repayment | 48,029 | 67,960 | 58,206 | |||||||||
| Investment securities held-to-maturity: | ||||||||||||
| Purchases | (13,118 | ) | — | — | ||||||||
| Maturities and principal repayment | 7,475 | — | — | |||||||||
| Net redemption (purchases) of restricted investment in bank stock | 363 | 1,076 | (442 | ) | ||||||||
| Net (increase) decrease in loans | (49,223 | ) | 8,348 | (45,543 | ) | |||||||
| Purchases of premises and equipment | (316 | ) | (300 | ) | (742 | ) | ||||||
| Purchase of bank-owned life insurance | — | (6,000 | ) | (2,475 | ) | |||||||
| Redemption of bank-owned life insurance | — | 5,610 | — | |||||||||
| Proceeds from life insurance death benefits | — | 15 | 266 | |||||||||
| Capital expenditure addition to other real estate owned | — | — | (476 | ) | ||||||||
| Proceeds from sale of premises and equipment | — | 1 | 1 | |||||||||
| Proceeds from sale of other real estate owned | 33 | 1,720 | 3,520 | |||||||||
| Net cash used in investing activities | (152,580 | ) | (68,651 | ) | (106,901 | ) | ||||||
| Years Ended December 31, 2013, 2012 and 2011 | ||||||||||||||||||||||
| Preferred Stock | Common Stock | Additional Paid In Capital | Retained Earnings | Treasury Stock | Accumulated Other Comprehensive Income (Loss) | Total Stockholders’ Equity | ||||||||||||||||
| (In Thousands, Except Share and per Share Data) | ||||||||||||||||||||||
| Balance, January 1, 2011 | $ | 9,700 | $ | 110,056 | $ | 4,941 | $ | 21,633 | $ | (17,698) | $ | (7,675) | $ | 120,957 | ||||||||
| Net income | 13,926 | 13,926 | ||||||||||||||||||||
| Other comprehensive income | 2,229 | 2,229 | ||||||||||||||||||||
| Accretion of discount on preferred stock | 300 | (300) | — | |||||||||||||||||||
| Dividends on preferred stock | (520) | (520) | ||||||||||||||||||||
| Redemption of series A preferred stock | (10,000) | (10,000) | ||||||||||||||||||||
| Proceeds from issuance of series B preferred stock | 11,250 | 11,250 | ||||||||||||||||||||
| Warrant repurchased | (245) | (245) | ||||||||||||||||||||
| Cash dividends declared on common stock ($0.12 per share) | (1,955) | (1,955) | ||||||||||||||||||||
| Issuance cost of common stock | (5) | (5) | ||||||||||||||||||||
| Issuance cost of series B preferred stock | (84) | (84) | ||||||||||||||||||||
| Exercise of stock options (42,495 shares) | (16) | 344 | 328 | |||||||||||||||||||
| Stock-based compensation expense | 35 | 35 | ||||||||||||||||||||
| Balance, December 31, 2011 | 11,250 | 110,056 | 4,715 | 32,695 | (17,354) | (5,446) | 135,916 | |||||||||||||||
| Net income | 17,507 | 17,507 | ||||||||||||||||||||
| Other comprehensive income | 10,509 | 10,509 | ||||||||||||||||||||
| Dividends on series B preferred stock | (253) | (253) | ||||||||||||||||||||
| Cash dividends declared on common stock ($0.195 per share) | (3,188) | (3,188) | ||||||||||||||||||||
| Issuance cost of common stock | (8) | (8) | ||||||||||||||||||||
| Exercise of stock options (15,588 shares) | 19 | 122 | 141 | |||||||||||||||||||
| Stock-based compensation expense | 39 | 39 | ||||||||||||||||||||
| Option related tax trueup | 28 | 28 | ||||||||||||||||||||
| Balance, December 31, 2012 | 11,250 | 110,056 | 4,801 | 46,753 | (17,232) | 5,063 | 160,691 | |||||||||||||||
| Net income | 19,925 | 19,925 | ||||||||||||||||||||
| Other comprehensive loss | (7,607) | (7,607) | ||||||||||||||||||||
| Dividends on series B preferred stock | (169) | (169) | ||||||||||||||||||||
| Cash dividends declared on common stock ($0.260 per share) | (4,581) | (4,581) | ||||||||||||||||||||
| Dividend on restricted stock declared | (1) | (1) | ||||||||||||||||||||
| Issuance cost of common stock | (13) | (13) | ||||||||||||||||||||
| Issuance of restricted stock award (18,829 shares) | 91 | 152 | 243 | |||||||||||||||||||
| Exercise of stock options (2,268 shares) | 19 | 2 | 21 | |||||||||||||||||||
| Stock-based compensation expense | 59 | 59 | ||||||||||||||||||||
| Option related tax trueup | 16 | 16 | ||||||||||||||||||||
| Balance, December 31, 2013 | $ | 11,250 | $ | 110,056 | $ | 4,986 | $ | 61,914 | $ | (17,078) | $ | (2,544) | $ | 168,584 | ||||||||
| F-7 | ||
| Years Ended December 31, | ||||||||||||
| 2011 | 2010 | 2009 | ||||||||||
| (Dollars in Thousands) | ||||||||||||
| Cash flows from financing activities: | ||||||||||||
| Net increase in deposits | 261,083 | 46,627 | 154,168 | |||||||||
| Net (decrease) increase in short-term borrowings | (41,855 | ) | (4,254 | ) | 966 | |||||||
| Payments on long-term borrowings | (10,000 | ) | (52,144 | ) | (153 | ) | ||||||
| Cash dividends on common stock | (1,955 | ) | (1,800 | ) | (3,166 | ) | ||||||
| Cash dividends on preferred stock | (417 | ) | (500 | ) | (425 | ) | ||||||
| Proceeds from issuance of Series B preferred stock | 11,250 | — | — | |||||||||
| Redemption of Series A preferred stock | (10,000 | ) | — | — | ||||||||
| Warrant repurchased | (245 | ) | — | — | ||||||||
| Issuance cost of common stock | (5 | ) | (6 | ) | (11 | ) | ||||||
| Issuance cost of Series B preferred stock | (84 | ) | — | — | ||||||||
| Proceeds from issuance of Series A preferred stock and warrants | — | — | 10,000 | |||||||||
| Proceeds from issuance of shares from stock offering or rights offering | — | 12,148 | 11,000 | |||||||||
| Issuance cost of common stock | — | (770 | ) | — | ||||||||
| Tax expense (benefit) from stock based compensation | — | 7 | (73 | ) | ||||||||
| Issuance cost of restricted stock award | — | 25 | — | |||||||||
| Proceeds from exercise of stock options | 328 | — | 57 | |||||||||
| Net cash provided by (used in) financing activities | 208,100 | (667 | ) | 172,363 | ||||||||
| Net increase (decrease) in cash and cash equivalents | 73,604 | (51,671 | ) | 74,137 | ||||||||
| Cash and cash equivalents at beginning of year | 37,497 | 89,168 | 15,031 | |||||||||
| Cash and cash equivalents at end of year | $ | 111,101 | $ | 37,497 | $ | 89,168 | ||||||
| Supplemental disclosures of cash flow information: | ||||||||||||
| Noncash activities: | ||||||||||||
| Trade date accounting settlement for investments | $ | — | $ | 8 | $ | 1,979 | ||||||
| Transfer of loans to other real estate owned | 629 | 1,927 | — | |||||||||
| Net investment in direct financing lease | — | 3,700 | — | |||||||||
| Transfer from investment securities available-for-sale to investment securities held-to-maturity | 66,833 | — | — | |||||||||
| Cash paid during year for: | ||||||||||||
| Interest paid on deposits and borrowings | $ | 12,226 | $ | 15,569 | $ | 23,021 | ||||||
| Income taxes | 4,484 | 2,479 | 344 | |||||||||
| Years Ended December 31, | ||||||||||
| 2013 | 2012 | 2011 | ||||||||
| (Dollars in Thousands) | ||||||||||
| Cash flows from operating activities: | ||||||||||
| Net income | $ | 19,925 | $ | 17,507 | $ | 13,926 | ||||
| Adjustments to Reconcile Net Income to Net Cash Provided by Operating Activities: | ||||||||||
| Depreciation and amortization | 886 | 914 | 983 | |||||||
| Provision for loan losses | 350 | 325 | 2,448 | |||||||
| Provision for deferred taxes | 1,739 | 1,912 | 3,406 | |||||||
| Stock-based compensation expense | 59 | 39 | 35 | |||||||
| Net other-than-temporary impairment losses | 652 | 870 | 342 | |||||||
| Net gains on sales of available-for-sale securities | (2,363) | (2,882) | (3,976) | |||||||
| Net gains on sales of loans held for sale | (294) | (484) | (251) | |||||||
| Net loans originated for sale | (14,816) | (22,013) | (14,357) | |||||||
| Proceeds from sales of loans held for sale | 16,601 | 22,024 | 13,923 | |||||||
| Net gains on disposition of premises and equipment | (2) | — | — | |||||||
| Net loss on sales of other real estate owned | 75 | 9 | 5 | |||||||
| Life insurance death benefit | (291) | — | — | |||||||
| Increase in cash surrender value of bank owned life insurance | (1,073) | (1,018) | (1,038) | |||||||
| Net amortization of securities | 3,316 | 4,589 | 4,012 | |||||||
| Increase in accrued interest receivable | (233) | (241) | (2,085) | |||||||
| Decrease in prepaid FDIC insurance assessment | 811 | 1,073 | 1,698 | |||||||
| Increase in other assets | (397) | (2,538) | (402) | |||||||
| (Decrease) increase in other liabilities | (1,792) | 980 | (585) | |||||||
| Net cash provided by operating activities | 23,153 | 21,066 | 18,084 | |||||||
| Cash flows from investing activities: | ||||||||||
| Investment securities available-for-sale: | ||||||||||
| Purchases | (155,464) | (207,880) | (400,644) | |||||||
| Sales | 122,165 | 130,059 | 254,821 | |||||||
| Maturities, calls and principal repayment | 46,378 | 48,406 | 48,029 | |||||||
| Investment securities held-to-maturity: | ||||||||||
| Purchases | (23,531) | (16,606) | (13,118) | |||||||
| Maturities and principal repayment | 3,830 | 30,258 | 7,475 | |||||||
| Net (purchase) redemption of restricted investment in bank stock | (22) | 319 | 363 | |||||||
| Net increase in loans | (71,761) | (83,478) | (49,223) | |||||||
| Purchases of premises and equipment | (973) | (842) | (316) | |||||||
| Purchase of bank-owned life insurance | — | (5,000) | — | |||||||
| Proceeds from life insurance death benefits | 592 | — | — | |||||||
| Proceeds from sale of premises and equipment | 2 | — | — | |||||||
| Proceeds from sale of other real estate owned | 1,230 | 500 | 33 | |||||||
| Cash and cash equivalent acquired in acquisition | — | 6,195 | — | |||||||
| Cash consideration paid in acquisition | — | (10,251) | — | |||||||
| Net cash used in investing activities | (77,554) | (108,320) | (152,580) | |||||||
| Cash flows from financing activities: | ||||||||||
| Net increase in deposits | 35,083 | 100,271 | 261,083 | |||||||
| Net decrease in short-term borrowings | — | — | (41,855) | |||||||
| Payments on long-term borrowings | — | (15,000) | (10,000) | |||||||
| Cash dividends on common stock | (4,254) | (2,778) | (1,955) | |||||||
| Cash dividends on preferred stock | (141) | (363) | (417) | |||||||
| Proceeds from issuance of Series B preferred stock | — | — | 11,250 | |||||||
| Redemption of Series A preferred stock | — | — | (10,000) | |||||||
| Warrant repurchased | — | — | (245) | |||||||
| Issuance cost of common stock | (13) | (8) | (5) | |||||||
| Issuance cost of Series B preferred stock | — | — | (84) | |||||||
| Tax expense from stock based compensation | 16 | 28 | — | |||||||
| Issuance of restricted stock award | 243 | — | — | |||||||
| Proceeds from exercise of stock options | 21 | 141 | 328 | |||||||
| Net cash provided by financing activities | 30,955 | 82,291 | 208,100 | |||||||
| Net (decrease) increase in cash and cash equivalents | (23,446) | (4,963) | 73,604 | |||||||
| Cash and cash equivalents at beginning of year | 106,138 | 111,101 | 37,497 | |||||||
| Cash and cash equivalents at end of year | $ | 82,692 | $ | 106,138 | $ | 111,101 | ||||
| Supplemental disclosures of cash flow information: | ||||||||||
| Noncash activities: | ||||||||||
| Trade date accounting settlement for investments | $ | 8,759 | $ | — | $ | — | ||||
| Transfer of loans to other real estate owned | 236 | 1,300 | 629 | |||||||
| Transfer from investment securities available-for-sale to investment securities held-to-maturity | 138,300 | — | 66,833 | |||||||
| Cash paid during year for: | ||||||||||
| Interest paid on deposits and borrowings | $ | 10,993 | $ | 11,894 | $ | 12,226 | ||||
| Income taxes | 4,727 | 6,280 | 4,484 | |||||||
| Business combinations: | ||||||||||
| Non-cash assets acquired: | ||||||||||
| Investment securities available-for-sale | $ | — | $ | 37,143 | $ | — | ||||
| Loans | — | 52,192 | — | |||||||
| Premises and equipment, net | — | 1,262 | — | |||||||
| Accrued interest receivable | — | 389 | — | |||||||
| Total non-cash assets acquired | $ | — | $ | 90,986 | $ | — | ||||
| Liabilities assumed: | ||||||||||
| Deposits | $ | — | $ | 85,236 | $ | — | ||||
| Other liabilities | — | 795 | — | |||||||
| Total liabilities assumed | $ | — | $ | 86,031 | $ | — | ||||
| Net non-cash assets acquired | $ | — | $ | 4,056 | $ | — | ||||
| Bargain gain on acquisition | $ | — | $ | 899 | $ | — | ||||
| Net cash and cash equivalents acquired | $ | — | $ | 6,195 | $ | — | ||||
| Cash consideration paid in acquisition | $ | — | $ | 10,251 | $ | — | ||||
| F-8 | ||
Cash Equivalents
and interest bearing deposits with banks.
| F-9 | ||
In instances when a determination is made that an other-than-temporary impairment exists but the investor does not intend to sell the debt security and it is not more likely than not that it will be required to sell the debt security prior to its anticipated recovery, FASB ASC 320-10-65 changeschanged the presentation and amount of the other-than-temporary impairment recognized in the income statement.statement of income. The other-than-temporary impairment is separated into (a) the amount of the total other-than-temporary impairment related to a decrease in cash flows expected to be collected from the debt security (the credit loss) and (b) the amount of the total other-than-temporary impairment related to all other factors. The amount of the total other-than-temporary impairment related to the credit loss is recognized through earnings. The amount of the total other-than-temporary impairment related to all other factors is recognized through other comprehensive income. Impairment charges on certain investment securities of approximately $0.3$0.7 million, $5.6$0.9 million and $4.2$0.3 million were recognized in earnings during the years ended December 31, 2013, 2012 and 2011, 2010 and 2009, respectively.
In July 2010, the FASB issued Accounting Standards Update (“ASU”) No. 2010-20 (FASB ASC 310),“Disclosures about the Credit Quality of Financing Receivables and the Allowance for Credit Losses,” which requires that the Corporation provide a greater level of disaggregated information about the credit quality of the Corporation’s loans and leases and the allowance for loan and lease losses (the “Allowance”). This ASU also requires the Corporation to disclose on a prospective basis, additional information related to credit quality indicators, non-accrual loans and leases, and past due information. The Corporation adopted the provisions of this ASU in preparing the Consolidated Financial Statements as of and for the year ended December 31, 2010. As this ASU amends only the disclosure requirements for loans and leases and the Allowance, the adoption had no impact on the Corporation’s statements of income and condition. See Note 5 of the Notes to the Consolidated Financial Statements for the required disclosures.
| F-10 | ||
| F-11 | ||
| F-12 | ||
The balance of the reserve for unfunded commitments was $210,000 as of December 31, 2013 and 2012.
During the second quarter of 2010, the Corporation entered into a lease of its former operations facility under a direct financing lease. The lease has a 15 year term with no renewal options. According to the terms of the lease, the lessee has an obligation to purchase the property underlying the lease in either year seven (7), ten (10) or fifteen (15) at predetermined prices for those years as provided in the lease. The structure of the minimum lease payments and the purchase prices as provided in the lease provide an inducement to the lessee to purchase the property in year seven (7).
During the fourth quarter of 2011, the Corporation sold one commercial property and one residential property in Union County, New Jersey which were carried as OREO. During the fourth quarter of 2010, the Corporation sold one residential property in Morris County, New Jersey, and one residential property in Union County, New Jersey which were carried as OREO. At December 31, 2011 and 2010, the Corporation had $591,000 and $0, in OREO, respectively.
The Corporation sells residential mortgage loans in the secondary market primarily to Fannie Mae. The Corporation sells residential mortgage loans to Fannie Mae that include various representations and warranties regarding the origination and characteristics of the residential mortgage loans. Although the specific representations and warranties vary, they typically cover ownership of the loan, validity of the lien securing the loan, the absence of delinquent taxes or liens against the property securing the loan, compliance with loan criteria set forth in the applicable agreement, compliance with applicable federal, state, and local laws, and other matters.
| F-13 | ||
| F-14 | ||
| Years Ended December 31, | ||||||||||||
| 2011 | 2010 | 2009 | ||||||||||
| (In Thousands, Except per Share Amounts) | ||||||||||||
| Net income | $ | 13,926 | $ | 7,004 | $ | 3,771 | ||||||
| Preferred stock dividends and accretion | 820 | 581 | 567 | |||||||||
| Net income available to common stockholders | $ | 13,106 | $ | 6,423 | $ | 3,204 | ||||||
| Average number of common shares outstanding | 16,296 | 15,026 | 13,383 | |||||||||
| Effect of dilutive options | 19 | 1 | 2 | |||||||||
| Average number of common shares outstanding used to calculate diluted earnings per common share | 16,315 | 15,027 | 13,385 | |||||||||
| Earnings per common share: | ||||||||||||
| Basic | $ | 0.80 | $ | 0.43 | $ | 0.24 | ||||||
| Diluted | $ | 0.80 | $ | 0.43 | $ | 0.24 | ||||||
Years Ended December 31, 2013 2012 2011 (In Thousands, Except per Share Amounts) Net income $ 19,925 $ 17,507 $ 13,926 Preferred stock dividends and accretion 141 281 820 Net income available to common stockholders $ 19,784 $ 17,226 $ 13,106 Average number of common shares outstanding 16,349 16,340 16,296 Effect of dilutive options 37 11 19 Average number of common shares outstanding used to
calculate diluted earnings per common share 16,386 16,351 16,315 Anti-dilutive common shares outstanding 14 42 79 Earnings per common share: Basic $ 1.21 $ 1.05 $ 0.80 Diluted $ 1.21 $ 1.05 $ 0.80
Treasury StockThe Parent Corporation, under a stock buyback program last amended on June 26,in 2008, is authorized to buy back up to2,039,731 shares of the Parent Corporation’s common stock. Subject to limitations applicable to the Corporation, purchases may be made from time to time as, in the opinion of management, market conditions warrant, in the open market or in privately negotiated transactions. Shares repurchased will be added to the corporate treasury and will be used for future stock dividends and other issuances. As of December 31, 2011,2013, Center Bancorp had 16.316.4 million shares of common stock outstanding. As of December 31, 2011,2013, the Parent Corporation had purchased1,386,863 common shares at an average cost per share of $11.44$11.44 under the stock buyback program as amended on October 1, 2007 and June 26, 2008. The repurchased shares were recorded as treasury stock, which resulted in a decrease in stockholders’ equity. Treasury stock is recorded using the cost method and accordingly is presented as a reduction of stockholders’ equity. During the years ended December 31, 2011, 20102013, 2012 and 2009,2011, the Parent Corporation did not purchase any of its shares.GoodwillThe Corporation adopted the provisions of FASB ASC 350-10 (previously SFAS No. 142, “Goodwill and Other Intangible Assets”), which requires that goodwill be tested for impairment annually, or more frequently if impairment indicators arise for impairment. No impairment charge was deemed necessary for the years ended December 31, 2011, 20102013, 2012 and 2009.2011.
As provided by ASU 2011-08 management has evaluated and assessed the following events and circumstances relevant to determining whether it is more likely than not that the fair value of the reporting unit exceeds its carrying value:
| Years Ended December 31, | ||||||||||
| 2013 | 2012 | 2011 | ||||||||
| (In Thousands, Except per Share Amounts) | ||||||||||
| Net income | $ | 19,925 | $ | 17,507 | $ | 13,926 | ||||
| Preferred stock dividends and accretion | 141 | 281 | 820 | |||||||
| Net income available to common stockholders | $ | 19,784 | $ | 17,226 | $ | 13,106 | ||||
| Average number of common shares outstanding | 16,349 | 16,340 | 16,296 | |||||||
| Effect of dilutive options | 37 | 11 | 19 | |||||||
| Average number of common shares outstanding used to calculate diluted earnings per common share | 16,386 | 16,351 | 16,315 | |||||||
| Anti-dilutive common shares outstanding | 14 | 42 | 79 | |||||||
| Earnings per common share: | ||||||||||
| Basic | $ | 1.21 | $ | 1.05 | $ | 0.80 | ||||
| Diluted | $ | 1.21 | $ | 1.05 | $ | 0.80 | ||||
2011.
| ⋅ | Macroeconomic conditions. |
| ⋅ | Industry and market conditions. |
| ⋅ | Overall financial performance. |
| F-15 | ||
2013.
operations, financial position, or liquidity.
CENTER BANCORP, INC. AND SUBSIDIARIES
NOTES TO CONSOLIDATED FINANCIAL STATEMENTS
Note 2 — Recent Accounting Pronouncements – (continued)
In May 2011,February 2013, the FASB issued ASU No. 2011-04,2013-02, "“AmendmentsReporting of Amounts Reclassified Out of Accumulated Other Comprehensive Income," to Achieve Common Fair Value Measurement and Disclosure Requirements in U.S. GAAP and IFRSs.”improve the transparency of reporting these reclassifications. ASU No. 2011-04 results in a consistent definition of fair value and common2013-02 does not amend any existing requirements for measurement of and disclosure about fair value between U.S. GAAP and International Financial Reporting Standards (“IFRS”). The changes to U.S. GAAP as a result of ASU No. 2011-04 are as follows: (1) The concepts of highest and best use and valuation premise are only relevant when measuring the fair value of nonfinancial assets (that is, it does not apply to financial assets or any liabilities); (2) U.S. GAAP currently prohibits application of a blockage factor in valuing financial instruments with quoted prices in active markets; ASU No. 2011-04 extends that prohibition to all fair value measurements; (3) An exception is provided to the basic fair value measurement principles for an entity that holds a group of financial assets and financial liabilities with offsetting positions in market risks or counterparty credit risk that are managed on the basis of the entity’sreporting net exposure to either of those risks; this exception allows the entity, if certain criteria are met, to measure the fair value of the net asset or liability position in a manner consistent with how market participants would price the net risk position; (4) Aligns the fair value measurement of instruments classified within an entity’s shareholders’ equity with the guidance for liabilities; and (5) Disclosure requirements have been enhanced for recurring Level 3 fair value measurements to disclose quantitative information about unobservable inputs and assumptions used, to describe the valuation processes used by the entity, and to describe the sensitivity of fair value measurements to changes in unobservable inputs and interrelationships between those inputs. In addition, entities must report the level in the fair value hierarchy of items that are not measured at fair value in the statement of condition but whose fair value must be disclosed. The provisions of ASU No. 2011-04 are effective for the Corporation’s interim reporting period beginning on or after December 15, 2011. The adoption of ASU No. 2011-04 is not expected to have a material impact on the Corporation’s statements of income or statements of condition.
In June 2011, the FASB issued ASU No. 2011-05, “Presentation of Comprehensive Income.”The provisions of ASU No. 2011-05 allow an entity the option to present the total of comprehensive income, the components of net income, and the components of other comprehensive income either in a single continuous statement of comprehensive income or in two separate but consecutivethe financial statements. In both choices,ASU No. 2013-02 requires an entity is required to present each componentdisaggregate the total change of net income along with total net income, each component of other comprehensive income along with a total forand separately present reclassification adjustments and current period other comprehensive income, and a total amount for comprehensive income. The statement(s) are required to be presented with equal prominence as the other primary financial statements. ASU No. 2011-05 eliminates the option to present the components of other comprehensive income as part of the statement of changes in shareholders’ equity but does not change the items that must be reported in other comprehensive income or when an item of other comprehensive income must be reclassified to net income. The provisions of ASU No. 2011-05 are2013-02 also requires that entities present either in a single note or parenthetically on the face of the financial statements, the effect of significant amounts reclassified from each component of accumulated other comprehensive income based on its source and the income statement line item affected by the reclassification. The Corporation adopted the provisions of ASU No. 2013-02 effective forJanuary 1, 2013. As the Corporation’s interim reporting period beginning on or after December 15, 2011, with retrospective application required. TheCorporation provided these required disclosures in the notes to the Consolidated Financial Statements, the adoption of ASU No. 2011-05 is expected to result in presentation changes to2013-02 had no impact on the Corporation’sCorporation's consolidated statements of income and condition.
In September 2011,residential real estate property to the FASB issued ASU No. 2011-08, “Intangibles — Goodwill and Other (Topic 350): Testing Goodwill for Impairment”, which permits an entitycreditor to first perform a qualitative assessment to determine whether it is more likely than not thatsatisfy the fair valueloan through completion of a reporting unitdeed in lieu of foreclosure or through a similar legal agreement. The deed in lieu of foreclosure or similar legal agreement is less than its carrying amount. If an entity believes, as a result of its qualitative assessment, that itcompleted when agreed-upon terms and conditions have been satisfied by both the borrower and the creditor. The ASU is more likely than not that the fair value of a reporting unit is less than its carrying amount, the quantitative impairment test is required. Otherwise, no further impairment testing is required. The provisions of ASU No. 2011-08 are effective for the Corporation’s interim goodwill impairment tests performed for fiscal years beginning after December 15, 2011.2014, and interim periods therein. Early adoption is permitted, providedpermitted. The Corporation will adopt the methodologies prescribed by this ASU by the date required, and does not anticipate that the entity has not yet performed its annual impairment test for goodwill. The Corporation performs its annual impairment test for goodwill in the fourth quarter of each year. The adoption of ASU No. 2011-08 is not expected towill have a material impacteffect on the Corporation’s statementsits financial position or results of income and statements of condition.
operations.
| F-16 | ||
Note 2 — Recent Accounting Pronouncements – (continued)
In December 2011, the FASB issued ASU No. 2011-12, “Comprehensive Income (Topic 220):Deferral of the Effective Date for Amendments to the Presentation of Reclassifications of Items Out of Accumulated Other Comprehensive Income in Accounting Standards Update No. 2011-05.” The Update defers the specific requirement to present items that are reclassified from accumulated other comprehensive income to net income separately with their respective components of net income and other comprehensive income. The deferral comes after stakeholders raised concerns that the new presentation requirements about the reclassification of items out of accumulated other comprehensive income would be costly for preparers and add unnecessary complexity to financial statements. As a result of the concerns, the FASB decided to reconsider whether it is necessary to require companies to present reclassification adjustments, by component, in both the statement where net income is presented and the statement where other comprehensive income is presented for both interim and annual financial statements. The FASB did not defer the requirement to report comprehensive income either in a single continuous statement or in two separate, but consecutive, financial statements.
In November 2008, the SEC released a proposed roadmap regarding the potential use by U.S. issuers of financial statements prepared in accordance with International Financial Reporting Standards (“IFRS”). IFRS is a comprehensive series of accounting standards published by the International Accounting Standards Board. Under the proposed roadmap, the Company may be required to prepare financial statements in accordance with IFRS as early as 2014. The Company is currently assessing the impact that this potential change would have on its consolidated financial statements, and it will continue to monitor the development of the potential implementation of IFRS.
On August 1, 2012, the Bank assumed all of the deposits and certain other liabilities and acquired certain assets of Saddle River Valley Bank (“Saddle River”), a New Jersey State-chartered bank, pursuant to the terms of a Purchase and Assumption Agreement, dated as of February 1, 2012, among the Bank, Saddle River Valley Bank and Saddle River Valley Bancorp. This purchase and assumption was in keeping with the Bank’s strategy to expand its base of operations into Northern New Jersey.
| August 1, 2012 | ||||
| (Dollars in thousands) | ||||
| Assets acquired: | ||||
| Cash and cash equivalents | $ | 6,195 | ||
| Investment securities available-for-sale | 37,143 | |||
| Loans | 52,192 | |||
| Premises and equipment, net | 1,262 | |||
| Accrued interest receivable | 389 | |||
| Total assets acquired | $ | 97,181 | ||
| Liabilities assumed: | ||||
| Deposits: | $ | 85,236 | ||
| Other liabilities | 795 | |||
| Total liabilities assumed | $ | 86,031 | ||
| Net assets acquired | $ | 11,150 | ||
| Cash consideration paid in acquisition | $ | 10,251 | ||
| Bargain gain on acquisition | $ | 899 | ||
| F-17 | ||
| (Dollars in thousands) | ||||
| Net interest income | $ | 1,352 | ||
| Non-interest income | 15 | |||
| Non-interest expense and income taxes | (763) | |||
| Net income | $ | 604 |
| (Dollars in thousands) | ||||
| Contractually required principal and interest at acquisition | $ | 2,101 | ||
| Contractual cash flows not expected to be collected (nonaccretable difference) | (982) | |||
| Expected cash flows at acquisition | 1,119 | |||
| Interest component of expected cash flows (accretable discount) | (161) | |||
| Fair value of acquired loans accounted for under FASB ASC 310-30 | $ | 958 |
| December 31, | |||||||
| 2013 | 2012 | ||||||
| (in thousands) | |||||||
| Accretable discount balance, beginning of period | $ | 130 | $ | — | |||
| Additions resulting from acquisition | — | 161 | |||||
| Accretion to interest income | (130) | (31) | |||||
| Accretable discount, end of period | $ | — | $ | 130 | |||
| (Dollars in thousands) | ||||
| Contractually required principal and interest at acquisition | $ | 50,917 | ||
| Contractual cash flows not expected to be collected (credit mark) | (807) | |||
| Expected cash flows at acquisition | 50,110 | |||
| Interest rate premium mark | 1,313 | |||
| Fair value of acquired loans not accounted for under FASB ASC 310-30 | $ | 51,423 |
| F-18 | ||
| Amortized Cost | Gross Unrealized Gains | Gross Unrealized Losses | Fair Value | |||||||||||||
| December 31, 2011 | ||||||||||||||||
| (Dollars in Thousands) | ||||||||||||||||
| Investment Securities Available-for-Sale: | ||||||||||||||||
| Federal agency obligations | $ | 24,781 | $ | 188 | $ | — | $ | 24,969 | ||||||||
| Residential mortgage pass-through securities | 113,213 | 2,157 | (6 | ) | 115,364 | |||||||||||
| Obligations of U.S. states and political subdivisions | 66,309 | 2,900 | (36 | ) | 69,173 | |||||||||||
| Trust preferred securities | 20,567 | 14 | (4,394 | ) | 16,187 | |||||||||||
| Corporate bonds and notes | 175,812 | 1,382 | (4,077 | ) | 173,117 | |||||||||||
| Collateralized mortgage obligations | 3,226 | — | (1,327 | ) | 1,899 | |||||||||||
| Asset-backed securities | 7,614 | 52 | (13 | ) | 7,653 | |||||||||||
| Equity securities | 6,417 | 21 | (293 | ) | 6,145 | |||||||||||
| Total | $ | 417,939 | $ | 6,714 | $ | (10,146 | ) | $ | 414,507 | |||||||
| Investment Securities Held-to-Maturity: | ||||||||||||||||
| Federal agency obligations | $ | 28,262 | $ | 177 | $ | (34 | ) | $ | 28,405 | |||||||
| Commercial mortgage-backed securities | 6,276 | — | (69 | ) | 6,207 | |||||||||||
| Obligations of U.S. states and political subdivisions | 37,695 | 2,615 | — | 40,310 | ||||||||||||
| Total | $ | 72,233 | $ | 2,792 | $ | (103 | ) | $ | 74,922 | |||||||
| Total investment securities | $ | 490,172 | $ | 9,506 | $ | (10,249 | ) | $ | 489,429 | |||||||
| Amortized Cost | Gross Unrealized Gains | Gross Unrealized Losses | Fair Value | Amortized Cost | Gross Unrealized Gains | Gross Unrealized Losses | Fair Value | ||||||||||||||||||||||
| December 31, 2010 | December 31, 2013 | ||||||||||||||||||||||||||||
| (Dollars in Thousands) | (Dollars in Thousands) | ||||||||||||||||||||||||||||
| Investment Securities Available-for-Sale: | |||||||||||||||||||||||||||||
| U.S. Treasury and agency securities | $ | 7,123 | $ | — | $ | (128 | ) | $ | 6,995 | $ | 14,344 | $ | — | $ | (825) | $ | 13,519 | ||||||||||||
| Federal agency obligations | 68,051 | 1,071 | (641 | ) | 68,481 | 20,567 | 29 | (655) | 19,941 | ||||||||||||||||||||
| Residential mortgage pass-through securities | 180,037 | 115 | (2,419 | ) | 177,733 | 48,312 | 791 | (229) | 48,874 | ||||||||||||||||||||
| Commercial mortgage pass-through securities | 7,145 | 3 | (157) | 6,991 | |||||||||||||||||||||||||
| Obligations of U.S. states and political subdivisions | 38,312 | 1 | (1,088 | ) | 37,225 | 30,804 | 711 | (55) | 31,460 | ||||||||||||||||||||
| Trust preferred securities | 21,222 | 26 | (2,517 | ) | 18,731 | 19,763 | 150 | (510) | 19,403 | ||||||||||||||||||||
| Corporate bonds and notes | 63,047 | — | (1,613 | ) | 61,434 | 154,182 | 4,930 | (482) | 158,630 | ||||||||||||||||||||
| Collateralized mortgage obligations | 3,941 | — | (1,213 | ) | 2,728 | ||||||||||||||||||||||||
| Asset-backed securities | 15,733 | 246 | — | 15,979 | |||||||||||||||||||||||||
| Certificates of deposit | 2,250 | 32 | (20) | 2,262 | |||||||||||||||||||||||||
| Equity securities | 5,135 | — | (382 | ) | 4,753 | 376 | — | (89) | 287 | ||||||||||||||||||||
| Other securities | 5,671 | 68 | (15) | 5,724 | |||||||||||||||||||||||||
| Total | $ | 319,147 | $ | 6,960 | $ | (3,037) | $ | 323,070 | |||||||||||||||||||||
| Investment Securities Held-to-Maturity: | |||||||||||||||||||||||||||||
| U.S. Treasury and agency securities | $ | 28,056 | $ | — | $ | (1,019) | $ | 27,037 | |||||||||||||||||||||
| Federal agency obligations | 15,249 | 23 | (389) | 14,883 | |||||||||||||||||||||||||
| Residential mortgage-backed securities | 2,246 | — | (64) | 2,182 | |||||||||||||||||||||||||
| Commercial mortgage-backed securities | 4,417 | 41 | (62) | 4,396 | |||||||||||||||||||||||||
| Obligations of U.S. states and political subdivisions | 127,418 | 1,303 | (3,688) | 125,033 | |||||||||||||||||||||||||
| Corporate bonds and notes | 37,900 | 149 | (622) | 37,427 | |||||||||||||||||||||||||
| Total | $ | 215,286 | $ | 1,516 | $ | (5,844) | $ | 210,958 | |||||||||||||||||||||
| Total investment securities | $ | 386,868 | $ | 1,213 | $ | (10,001 | ) | $ | 378,080 | $ | 534,433 | $ | 8,476 | $ | (8,881) | $ | 534,028 | ||||||||||||
The Corporation’s investment securities are classified as available-for-sale and held-to-maturity at December 31, 2011 and available-for-sale at December 31, 2010.
| Amortized Cost | Gross Unrealized Gains | Gross Unrealized Losses | Fair Value | ||||||||||
| December 31, 2012 | |||||||||||||
| (Dollars in Thousands) | |||||||||||||
| Investment Securities Available-for-Sale: | |||||||||||||
| U.S. Treasury and agency securities | $ | 11,870 | $ | 62 | $ | (23) | $ | 11,909 | |||||
| Federal agency obligations | 20,207 | 333 | (5) | 20,535 | |||||||||
| Residential mortgage pass-through securities | 52,400 | 1,385 | (1) | 53,784 | |||||||||
| Commercial mortgage pass-through securities | 9,725 | 244 | — | 9,969 | |||||||||
| Obligations of U.S. states and political subdivisions | 103,193 | 4,653 | (132) | 107,714 | |||||||||
| Trust preferred securities | 22,279 | 144 | (1,174) | 21,249 | |||||||||
| Corporate bonds and notes | 228,681 | 9,095 | (371) | 237,405 | |||||||||
| Collateralized mortgage obligations | 2,120 | — | — | 2,120 | |||||||||
| Asset-backed securities | 19,431 | 311 | — | 19,742 | |||||||||
| Certificates of deposit | 2,854 | 21 | (10) | 2,865 | |||||||||
| Equity securities | 535 | — | (210) | 325 | |||||||||
| Other securities | 9,145 | 68 | (15) | 9,198 | |||||||||
| Total | $ | 482,440 | $ | 16,316 | $ | (1,941) | $ | 496,815 | |||||
| Investment Securities Held-to-Maturity: | |||||||||||||
| Federal agency obligations | $ | 4,178 | $ | 79 | $ | — | $ | 4,257 | |||||
| Commercial mortgage-backed securities | 5,501 | 154 | (5) | 5,650 | |||||||||
| Obligations of U.S. states and political subdivisions | 48,385 | 4,139 | — | 52,524 | |||||||||
| Total | $ | 58,064 | $ | 4,372 | $ | (5) | $ | 62,431 | |||||
| Total investment securities | $ | 540,504 | $ | 20,688 | $ | (1,946) | $ | 559,246 | |||||
CENTER BANCORP, INC. AND SUBSIDIARIES
NOTES TO CONSOLIDATED FINANCIAL STATEMENTS
Note 4 — Investment Securities – (continued)
security. Premiums or discounts on investment securities are amortized or accreted using the effective interest method over the life of the security as an adjustment of yield. Unrealized holding gains or losses that remain in accumulated other comprehensive income are amortized or accreted over the remaining life of the security as an adjustment of yield, offsetting the related amortization of the premium or accretion of the discount.
| F-19 | ||
| December 31, 2011 | ||||||||
| Amortized Cost | Fair Value | |||||||
| (Dollars in Thousands) | ||||||||
| Investment Securities Available-for-Sale: | ||||||||
| Due in one year or less | $ | 4,143 | $ | 4,118 | ||||
| Due after one year through five years | 81,798 | 81,138 | ||||||
| Due after five years through ten years | 108,395 | 107,155 | ||||||
| Due after ten years | 103,973 | 100,587 | ||||||
| Residential mortgage pass-through securities | 113,213 | 115,364 | ||||||
| Equity securities | 6,417 | 6,145 | ||||||
| Total | 417,939 | 414,507 | ||||||
| Investment Securities Held-to-Maturity: | ||||||||
| Due after five years through ten years | $ | 4,459 | $ | 4,506 | ||||
| Due after ten years | 67,774 | 70,416 | ||||||
| Total | $ | 72,233 | $ | 74,922 | ||||
| Total investment securities | $ | 490,172 | $ | 489,429 | ||||
During 2011, securities sold
| December 31, 2013 | |||||||
| Amortized Cost | Fair Value | ||||||
| (Dollars in Thousands) | |||||||
| Investment Securities Available-for-Sale: | |||||||
| Due in one year or less | $ | 9,738 | $ | 9,780 | |||
| Due after one year through five years | 63,206 | 64,802 | |||||
| Due after five years through ten years | 123,765 | 126,024 | |||||
| Due after ten years | 60,934 | 60,588 | |||||
| Residential mortgage pass-through securities | 48,312 | 48,874 | |||||
| Commercial mortgage pass-through securities | 7,145 | 6,991 | |||||
| Equity securities | 376 | 287 | |||||
| Other securities | 5,671 | 5,724 | |||||
| Total | $ | 319,147 | $ | 323,070 | |||
| Investment Securities Held-to-Maturity: | |||||||
| Due in one year or less | $ | 2,061 | $ | 2,065 | |||
| Due after one year through five years | 12,547 | 12,699 | |||||
| Due after five years through ten years | 65,692 | 64,027 | |||||
| Due after ten years | 128,323 | 125,589 | |||||
| Residential mortgage-backed securities | 2,246 | 2,182 | |||||
| Commercial mortgage-backed securities | 4,417 | 4,396 | |||||
| Total | $ | 215,286 | $ | 210,958 | |||
| Total investment securities | $ | 534,433 | $ | 534,028 | |||
years ended December 31, 2013, 2012 and 2011 were as follows:
Years Ended December 31, (Dollars in Thousands) 2013 2012 2011 Gross gains on sales of investment securities $ 2,451 $ 2,905 $ 4,045 Gross losses on sales of investment securities 88 23 69 Net gains on sales of investment securities $ 2,363 $ 2,882 $ 3,976
| F-20 | ||
| Years Ended December 31, | ||||||||||||
| 2011 | 2010 | 2009 | ||||||||||
| (Dollars in Thousands) | ||||||||||||
| One variable rate private label CMO | $ | 18 | $ | 360 | $ | 188 | ||||||
| One trust preferred security | — | 3,000 | — | |||||||||
| Two pooled trust preferred securities | — | 1,818 | 3,433 | |||||||||
| Principal losses on a variable rate CMO | 324 | 398 | — | |||||||||
| One corporate bond | — | — | 140 | |||||||||
| One equity security | — | — | 113 | |||||||||
| Reserve primary fund | — | — | 364 | |||||||||
| Total other-than-temporary impairment charges | $ | 342 | $ | 5,576 | $ | 4,238 | ||||||
| Years Ended December 31, | |||||||||
| 2013 | 2012 | 2011 | |||||||
| (Dollars in Thousands) | |||||||||
| One variable rate private label CMO | $ | — | $ | 484 | $ | 18 | |||
| Pooled trust preferred securities | 628 | 68 | — | ||||||
| Principal losses on a variable rate CMO | 24 | 318 | 324 | ||||||
| Total other-than-temporary impairment charges | $ | 652 | $ | 870 | $ | 342 | |||
| F-21 | ||
| Deal Name | Single Issuer or Pooled | Class/ Tranche | Amortized Cost | Fair Value | Gross Unrealized Gain (Loss) | Lowest Credit Rating Assigned | Number of Banks Currently Performing | Deferrals and Defaults as % of Original Collateral | Expected Deferral/Defaults as % of Remaining Performing Collateral | |||||||||||||||||||||||||||
| (Dollars in Thousands) | ||||||||||||||||||||||||||||||||||||
| Countrywide Capital IV | Single | — | $ | 1,770 | $ | 1,403 | $ | (367 | ) | BB+ | 1 | None | None | |||||||||||||||||||||||
| Countrywide Capital V | Single | — | 2,747 | 2,230 | (517 | ) | BB+ | 1 | None | None | ||||||||||||||||||||||||||
| Countrywide Capital V | Single | — | 250 | 203 | (47 | ) | BB+ | 1 | None | None | ||||||||||||||||||||||||||
| NPB Capital Trust II | Single | — | 868 | 882 | 14 | NR | 1 | None | None | |||||||||||||||||||||||||||
| Citigroup Cap IX | Single | — | 991 | 857 | (134 | ) | BB | 1 | None | None | ||||||||||||||||||||||||||
| Citigroup Cap IX | Single | — | 1,903 | 1,652 | (251 | ) | BB | 1 | None | None | ||||||||||||||||||||||||||
| Citigroup Cap XI | Single | — | 246 | 214 | (32 | ) | BB | 1 | None | None | ||||||||||||||||||||||||||
| BAC Capital Trust X | Single | — | 2,500 | 1,862 | (638 | ) | BB+ | 1 | None | None | ||||||||||||||||||||||||||
| Nationsbank Cap Trust III | Single | — | 1,571 | 1,094 | (477 | ) | BB+ | 1 | None | None | ||||||||||||||||||||||||||
| Morgan Stanley Cap Trust IV | Single | — | 2,500 | 2,074 | (426 | ) | BB+ | 1 | None | None | ||||||||||||||||||||||||||
| Morgan Stanley Cap Trust IV | Single | — | 1,741 | 1,451 | (290 | ) | BB+ | 1 | None | None | ||||||||||||||||||||||||||
| Saturns — GS 2004-06 | Single | — | 242 | 214 | (28 | ) | BB+ | 1 | None | None | ||||||||||||||||||||||||||
| Saturns — GS 2004-06 | Single | — | 312 | 275 | (37 | ) | BB+ | 1 | None | None | ||||||||||||||||||||||||||
| Saturns — GS 2004-04 | Single | — | 780 | 686 | (94 | ) | BB+ | 1 | None | None | ||||||||||||||||||||||||||
| Saturns — GS 2004-04 | Single | — | 22 | 19 | (3 | ) | BB+ | 1 | None | None | ||||||||||||||||||||||||||
| Goldman Sachs | Single | — | 1,000 | 855 | (145 | ) | BB+ | 1 | None | None | ||||||||||||||||||||||||||
| ALESCO Preferred Funding VI | Pooled | C2 | 290 | 143 | (147 | ) | Ca | 37 of 56 | 32.9 | % | 40.9 | % | ||||||||||||||||||||||||
| ALESCO Preferred Funding VII | Pooled | C1 | 834 | 73 | (761 | ) | Ca | 49 of 62 | 34.3 | % | 40.4 | % | ||||||||||||||||||||||||
| Total | $ | 20,567 | $ | 16,187 | $ | (4,380 | ) | |||||||||||||||||||||||||||||
| Deal Name | Single Issuer or Pooled | Class/ Tranche | Amortized Cost | Fair Value | Gross Unrealized Gain (Loss) | Lowest Credit Rating Assigned | Number of Banks Currently Performing | Deferrals and Defaults as % of Original Collateral | Expected Deferral/Defaults as % of Remaining Performing Collateral | ||||||||||||||
| (Dollars in Thousands) | |||||||||||||||||||||||
| Countrywide Capital IV | Single | — | $ | 1,771 | $ | 1,772 | $ | 1 | BB+ | 1 | None | None | |||||||||||
| Countrywide Capital V | Single | — | 2,747 | 2,784 | 37 | BB+ | 1 | None | None | ||||||||||||||
| Countrywide Capital V | Single | — | 250 | 253 | 3 | BB+ | 1 | None | None | ||||||||||||||
| Citigroup Cap IX | Single | — | 992 | 999 | 7 | BB+ | 1 | None | None | ||||||||||||||
| Citigroup Cap IX | Single | — | 1,906 | 1,927 | 21 | BB+ | 1 | None | None | ||||||||||||||
| Citigroup Cap XI | Single | — | 246 | 248 | 2 | BB+ | 1 | None | None | ||||||||||||||
| Nationsbank Cap Trust III | Single | — | 1,574 | 1,275 | (299) | BB+ | 1 | None | None | ||||||||||||||
| Morgan Stanley Cap Trust IV | Single | — | 2,500 | 2,372 | (128) | BB+ | 1 | None | None | ||||||||||||||
| Morgan Stanley Cap Trust IV | Single | — | 1,742 | 1,659 | (83) | BB+ | 1 | None | None | ||||||||||||||
| Saturns — GS 2004-04 | Single | — | 536 | 536 | — | BB+ | 1 | None | None | ||||||||||||||
| Goldman Sachs | Single | — | 999 | 1,011 | 12 | BB+ | 1 | None | None | ||||||||||||||
| Stifel Financial | Single | — | 4,500 | 4,567 | 67 | BBB- | 1 | None | None | ||||||||||||||
| Total | $ | 19,763 | $ | 19,403 | $ | (360) | |||||||||||||||||
| F-22 | ||
One of
At December 31, 2011, excess subordination as a percentage of remaining performing collateral for the ALESCO Preferred Funding VI2013, and VII investments were -40.4 percent and -45.0 percent, respectively. Excess subordination is the amount of performing collateral above the amount of outstanding collateral underlying each class of the security. The excess subordination as a percent of remaining performing collateral reflects the difference between the performing collateral and the collateral underlying each security divided by the performing collateral. A negative number results when the paying collateral is less than the collateral underlying each class of the security. A low or negative number decreases the likelihood of full repayment of principal and interest according to original contractual terms.
subsequently sold at its book value in January 2014.
| Years Ended December 31, | ||||||||||||
| 2011 | 2010 | 2009 | ||||||||||
| (Dollars in Thousands) | ||||||||||||
| Balance of credit-related OTTI at January 1, | $ | 6,197 | $ | 3,621 | $ | — | ||||||
| Addition: | ||||||||||||
| Credit losses for which other-than-temporary impairment was not previously recognized | 342 | 5,576 | 3,761 | |||||||||
| Reduction: | ||||||||||||
| Credit losses for securities sold during the period | — | (3,000 | ) | (140 | ) | |||||||
| Balance of credit-related OTTI at December 31, | $ | 6,539 | $ | 6,197 | $ | 3,621 | ||||||
| Years Ended December 31, | ||||||||||
| 2013 | 2012 | 2011 | ||||||||
| (Dollars in Thousands) | ||||||||||
| Balance of credit-related OTTI at January 1, | $ | 4,450 | $ | 6,539 | $ | 6,197 | ||||
| Addition: | ||||||||||
| Credit losses for which other-than-temporary impairment was not previously recognized | 652 | 870 | 342 | |||||||
| Reduction: | ||||||||||
| Credit losses for securities sold during the period | (5,102) | (2,959) | — | |||||||
| Balance of credit-related OTTI at December 31, | $ | — | $ | 4,450 | $ | 6,539 | ||||
The Corporation’s investment portfolio also consists of overnight investments that were made into the Reserve Primary Fund (the “Fund”), a money market fund registered with the Securities and Exchange Commission as an investment company under the Investment Company Act of 1940. On September 22, 2008, the Fund announced that redemptions of shares of the Fund were suspended pursuant to an SEC order so that an orderly liquidation could be effected for the protection of the Fund’s investors. Through December 31, 2009, the Corporation has received five distributions from the Fund, totaling approximately 92 percent of its outstanding balance, leaving a remaining outstanding balance in the Fund of $2.943 million. On January 29, 2010, as part of the court order liquidation of the Fund, the Corporation received a sixth distribution or
2013.
| F-23 | ||
$2.446 million, bringing total distributions to date to approximately 99 percent. During the fourth quarter of 2009, the Corporation recorded a $364,000, or approximately 1 percent, other-than-temporary impairment charge to earnings relating to this court order liquidation of the Fund. The Corporation’s outstanding carrying balance in the Fund as of January 31, 2010 totaled $133,000. In 2010, the Corporation recorded approximately $30,000 to earnings as partial recovery of the OTTI charge. The Corporation’s outstanding carrying balance in the Fund as of December 31, 2011 was zero. Future liquidation distributions received by the Corporation, if any, will be recorded to earnings.
Obligations of U.S. states and political subdivisions are comprised of intermediate to long-term municipal bonds. A review of the coupon rates and maturity dates validates the unrealized losses due to the changes in interest rates. These bonds were purchased at lower ends of the interest rate cycle and were a part of the Corporation’s overall strategy to use tax-free instruments and to barbell the maturity distribution of bonds. The bonds are conservative in nature and the value decline is related to the changes in interest rates that occurred since the time of purchase and subsequent changes in spreads affecting the market prices. All of the issues carry an A or better underlying credit support and were evaluated on the basis on their underlying fundamentals; included but not limited to annual financial reports, geographic location, population and debt ratios. In certain cases options for calls reduce the effective duration and in turn the future market value fluctuations. All issues are performing and are expected to continue to perform in accordance with their respective contractual terms and conditions. There have not been disruptions of any payments, associated with any of these municipal securities.
| F-24 | ||
| December 31, 2011 | ||||||||||||||||||||||||
| Total | Less than 12 Months | 12 Months or Longer | ||||||||||||||||||||||
| Fair Value | Unrealized Losses | Fair Value | Unrealized Losses | Fair Value | Unrealized Losses | |||||||||||||||||||
| (Dollars in Thousands) | ||||||||||||||||||||||||
| Investment Securities Available-for-Sale: | ||||||||||||||||||||||||
| Residential mortgage pass-through securities | $ | 2,013 | $ | (6 | ) | $ | 2,013 | $ | (6 | ) | $ | — | $ | — | ||||||||||
| Obligations of U.S. states and political subdivisions | 4,352 | (36 | ) | 4,352 | (36 | ) | — | — | ||||||||||||||||
| Trust preferred securities | 15,272 | (4,394 | ) | 4,325 | (996 | ) | 10,947 | (3,398 | ) | |||||||||||||||
| Corporate bonds and notes | 97,043 | (4,077 | ) | 89,534 | (3,663 | ) | 7,509 | (414 | ) | |||||||||||||||
| Collateralized mortgage obligations | 1,899 | (1,327 | ) | — | — | 1,899 | (1,327 | ) | ||||||||||||||||
| Asset-backed securities | 3,884 | (13 | ) | 3,884 | (13 | ) | — | — | ||||||||||||||||
| Equity securities | 1,242 | (293 | ) | — | — | 1,242 | (293 | ) | ||||||||||||||||
| Total | 125,705 | (10,146 | ) | 104,108 | (4,714 | ) | 21,597 | (5,432 | ) | |||||||||||||||
| Investment Securities Held-to-Maturity: | ||||||||||||||||||||||||
| Federal agency obligations | 11,980 | (34 | ) | 11,980 | (34 | ) | — | — | ||||||||||||||||
| Collateralized mortgage obligations | 6,207 | (69 | ) | 6,207 | (69 | ) | — | — | ||||||||||||||||
| Total | 18,187 | (103 | ) | 18,187 | (103 | ) | — | — | ||||||||||||||||
| Total Temporarily Impaired Securities | $ | 143,892 | $ | (10,249 | ) | $ | 122,295 | $ | (4,817 | ) | $ | 21,597 | $ | (5,432 | ) | |||||||||
2012:
December 31, 2013 Total Less than 12 Months 12 Months or Longer Fair
Value Unrealized
Losses Fair
Value Unrealized
Losses Fair
Value Unrealized
Losses (Dollars in Thousands) Investment Securities
Available-for-Sale: U.S. Treasury and
agency securities $ 13,519 $ (825) $ 13,519 $ (825) $ — $ — Federal agency obligation 17,200 (655) 17,200 (655) — — Residential mortgage
pass-through securities 18,293 (229) 18,293 (229) — — Commercial mortgage
pass-through securities 2,924 (157) 2,924 (157) — — Obligations of U.S. states and
political subdivisions 4,199 (55) 4,199 (55) — — Trust preferred securities 5,306 (510) 4,031 (211) 1,275 (299) Corporate bonds and notes 32,498 (482) 30,533 (448) 1,965 (34) Certificates of deposit 552 (20) 552 (20) — — Equity securities 287 (89) — — 287 (89) Other securities 985 (15) — — 985 (15) Total 95,763 (3,037) 91,251 (2,600) 4,512 (437) Investment Securities
Held-to-Maturity: U.S. Treasury and agency
securities 27,037 (1,019) 27,037 (1,019) — — Federal agency obligation 13,492 (389) 13,197 (388) 295 (1) Residential mortgage
pass-through securities 2,182 (64) 2,182 (64) — — Commercial mortgage-backed
securities 1,395 (62) 1,395 (62) — — Obligations of U.S. states
and political subdivisions 66,034 (3,688) 57,072 (2,957) 8,962 (731) Corporate bonds and notes 27,210 (622) 27,210 (622) — — Total 137,350 (5,844) 128,093 (5,112) 9,257 (732) Total Temporarily Impaired
Securities $ 233,113 $ (8,881) $ 219,344 $ (7,712) $ 13,769 $ (1,169)
Value
Losses
Value
Losses
Value
Losses
Available-for-Sale:
agency securities
pass-through securities
pass-through securities
political subdivisions
Held-to-Maturity:
securities
pass-through securities
securities
and political subdivisions
Securities
| F-25 | ||
| December 31, 2010 | ||||||||||||||||||||||||
| Total | Less than 12 Months | 12 Months or Longer | ||||||||||||||||||||||
| Fair Value | Unrealized Losses | Fair Value | Unrealized Losses | Fair Value | Unrealized Losses | |||||||||||||||||||
| (Dollars in Thousands) | ||||||||||||||||||||||||
| Investment Securities Available-for-Sale: | ||||||||||||||||||||||||
| U.S. Treasury and agency securities | $ | 6,995 | $ | (128 | ) | $ | 6,995 | $ | (128 | ) | $ | — | $ | — | ||||||||||
| Federal agency obligations | 35,799 | (641 | ) | 32,113 | (622 | ) | 3,686 | (19 | ) | |||||||||||||||
| Residential mortgage pass-through securities | 166,820 | (2,419 | ) | 166,820 | (2,419 | ) | — | — | ||||||||||||||||
| Obligations of U.S. states and political subdivisions | 19,699 | (1,088 | ) | 19,699 | (1,088 | ) | — | — | ||||||||||||||||
| Trust preferred securities | 16,058 | (2,517 | ) | — | — | 16,058 | (2,517 | ) | ||||||||||||||||
| Corporate bonds and notes | 61,434 | (1,613 | ) | 52,985 | (1,175 | ) | 8,449 | (438 | ) | |||||||||||||||
| Collateralized mortgage obligations | 2,728 | (1,213 | ) | — | — | 2,728 | (1,213 | ) | ||||||||||||||||
| Equity securities | 4,653 | (382 | ) | 3,427 | (73 | ) | 1,226 | (309 | ) | |||||||||||||||
| Total Temporarily Impaired Securities | $ | 314,186 | $ | (10,001 | ) | $ | 282,039 | $ | (5,505 | ) | $ | 32,147 | $ | (4,496 | ) | |||||||||
| December 31, 2012 | |||||||||||||||||||
| Total | Less than 12 Months | 12 Months or Longer | |||||||||||||||||
| Fair Value | Unrealized Losses | Fair Value | Unrealized Losses | Fair Value | Unrealized Losses | ||||||||||||||
| (Dollars in Thousands) | |||||||||||||||||||
| Investment Securities Available-for-Sale: | |||||||||||||||||||
| U.S. Treasury and agency securities | $ | 4,460 | $ | (23) | $ | 4,460 | $ | (23) | $ | — | $ | — | |||||||
| Federal agency obligation | 877 | (5) | 877 | (5) | — | — | |||||||||||||
| Residential mortgage pass-through securities | 1,669 | (1) | 1,669 | (1) | — | — | |||||||||||||
| Obligations of U.S. states and political subdivisions | 18,360 | (132) | 18,360 | (132) | — | — | |||||||||||||
| Trust preferred securities | 11,740 | (1,174) | 10,494 | (18) | 1,246 | (1,156) | |||||||||||||
| Corporate bonds and notes | 26,440 | (371) | 18,244 | (134) | 8,196 | (237) | |||||||||||||
| Certificates of deposit | 388 | (10) | 388 | (10) | — | — | |||||||||||||
| Equity securities | 325 | (210) | — | — | 325 | (210) | |||||||||||||
| Other securities | 985 | (15) | — | — | 985 | (15) | |||||||||||||
| Total | 65,244 | (1,941) | 54,492 | (323) | 10,752 | (1,618) | |||||||||||||
| Investment Securities Held-to-Maturity: | |||||||||||||||||||
| Commercial mortgage-backed securities | 932 | (5) | 932 | (5) | — | — | |||||||||||||
| Total | 932 | (5) | 932 | (5) | — | — | |||||||||||||
| Total Temporarily Impaired Securities | $ | 66,176 | $ | (1,946) | $ | 55,424 | $ | (328) | $ | 10,752 | $ | (1,618) | |||||||
Note 5
| 2011 | 2010 | |||||||
| (Dollars in Thousands) | ||||||||
| Commercial and industrial | $ | 146,662 | $ | 121,034 | ||||
| Commercial real estate | 408,010 | 372,001 | ||||||
| Construction | 39,382 | 49,744 | ||||||
| Residential mortgage | 160,999 | 165,154 | ||||||
| Installment | 957 | 511 | ||||||
| Total loans | $ | 756,010 | $ | 708,444 | ||||
Included in
| 2013 | 2012 | ||||||
| (Dollars in Thousands) | |||||||
| Commercial and industrial | $ | 229,688 | $ | 181,682 | |||
| Commercial real estate | 536,539 | 497,392 | |||||
| Construction | 42,722 | 40,277 | |||||
| Residential mortgage | 150,571 | 169,094 | |||||
| Installment | 1,084 | 1,104 | |||||
| Subtotal | 960,604 | 889,549 | |||||
| Net deferred loan costs | 339 | 123 | |||||
| Total loans | $ | 960,943 | $ | 889,672 | |||
| F-26 | ||
Allowance for Loan Losses – (continued)
$10,225,000. During the year ended December 31, 2012, the Corporation made new loans to officers and directors in the amount of $13,952,000; payments by such persons during 2012 aggregated $5,254,000. On March 30, 2012, the Corporation appointed Frederick S. Fish to the Board of Directors. Mr. Fish had a prior lending relationship with the Bank, the total loan to Mr. Fish of approximately $9,910,000 is included in the amount of new loan to officers and directors.
CENTER BANCORP, INC. AND SUBSIDIARIES
NOTES TO CONSOLIDATED FINANCIAL STATEMENTS
Note 5 — Loans and the Allowance for Loan Losses – (continued)
At December 31, 20112013 and 20102012, loan balances of approximately $469.5$564.7 million and $435.9$532.8 million were pledged to secure short term borrowings from the Federal Reserve Bank of New York and Federal Home Loan Bank Advances.
During the second quarter of 2010, the Corporation entered into a lease of its former operations facility under a direct financing lease. The lease has a 15 year term with no renewal options. According to the terms of the lease, the lessee has an obligation to purchase the property underlying the lease in either year seven (7), ten (10) or fifteen (15) at predetermined prices for those years as provided in the lease. The structure of the minimum lease payments and the purchase prices as provided in the lease provide an inducement to the lessee to purchase the property in year seven (7).
| For years ending December 31, | (Dollars in Thousands) | |||
| 2012 | $ | 171 | ||
| 2013 | 216 | |||
| 2014 | 216 | |||
| 2015 | 228 | |||
| 2016 | 265 | |||
| Thereafter | 2,651 | |||
| Total minimum future lease receipts | $ | 3,747 | ||
| For years ending December 31, | (Dollars in Thousands) | |||
| 2014 | $ | 216 | ||
| 2015 | 228 | |||
| 2016 | 265 | |||
| 2017 | 265 | |||
| 2018 | 265 | |||
| Thereafter | 2,511 | |||
| Total minimum future lease receipts | $ | 3,750 | ||
| 2011 | 2010 | |||||||
| (Dollars in Thousands) | ||||||||
| Commercial and industrial | $ | 125 | $ | 456 | ||||
| Commercial real estate | 225 | 3,563 | ||||||
| Construction | 3,044 | 5,865 | ||||||
| Residential mortgage | 3,477 | 1,290 | ||||||
| Total loans receivable on non-accrual status | $ | 6,871 | $ | 11,174 | ||||
2012:
2013 2012 (Dollars in Thousands) Commercial and industrial $ 753 $ 214 Commercial real estate 744 354 Construction — 319 Residential mortgage 1,640 2,729 Total loans receivable on non-accrual status $ 3,137 $ 3,616
| F-27 | ||
2012:
| December 31, 2011 | ||||||||||||||||||||
| (Dollars in Thousands) | ||||||||||||||||||||
| Pass | Special Mention | Substandard | Doubtful | Total | ||||||||||||||||
| Commercial and industrial | $ | 143,048 | $ | 2,022 | $ | 1,592 | $ | — | $ | 146,662 | ||||||||||
| Commercial real estate | 371,365 | 24,282 | 12,363 | — | 408,010 | |||||||||||||||
| Construction | 36,338 | — | 3,044 | — | 39,382 | |||||||||||||||
| Residential mortgage | 155,326 | — | 5,673 | — | 160,999 | |||||||||||||||
| Installment | 957 | — | — | — | 957 | |||||||||||||||
| Total loans | $ | 707,034 | $ | 26,304 | $ | 22,672 | $ | — | $ | 756,010 | ||||||||||
December 31, 2013 (Dollars in Thousands) Pass Special
Mention Substandard Doubtful Total Commercial and industrial $ 226,013 $ 1,719 $ 1,284 $ 672 $ 229,688 Commercial real estate 509,679 14,544 12,316 — 536,539 Construction 41,492 — 1,230 — 42,722 Residential mortgage 147,379 978 2,214 — 150,571 Installment 964 — 120 — 1,084 Total loans $ 925,527 $ 17,241 $ 17,164 $ 672 $ 960,604
Credit Quality Indicators
December 31, 2010 (Dollars in Thousands) Pass Special
Mention Substandard Doubtful Total Commercial and industrial $ 116,741 $ 1,929 $ 2,364 $ — $ 121,034 Commercial real estate 345,096 15,383 11,522 — 372,001 Construction 43,879 — 3,588 2,277 49,744 Residential mortgage 161,558 — 3,596 — 165,154 Installment 511 — — — 511 Total loans $ 667,785 $ 17,312 $ 21,070 $ 2,277 $ 708,444
December 31, 2012 (Dollars in Thousands) Pass Special
Mention Substandard Doubtful Total Commercial and industrial $ 176,818 $ 3,281 $ 1,583 $ — $ 181,682 Commercial real estate 462,266 18,945 16,181 — 497,392 Construction 38,303 810 1,164 — 40,277 Residential mortgage 163,769 993 4,332 — 169,094 Installment 967 — 137 — 1,104 Total loans $ 842,123 $ 24,029 $ 23,397 $ — $ 889,549
F-28
CENTER BANCORP, INC. AND SUBSIDIARIES
NOTES TO CONSOLIDATED FINANCIAL STATEMENTSNote 56 — Loans and the Allowance for Loan Losses – (continued)The following table provides an analysis of the impaired loans at December 31, 20112013 and 2010:Impaired Loans
December 31, 2011 (Dollars in Thousands) No Related Allowance Recorded Recorded
Investment Unpaid
Principal
Balance Related
Allowance Average
Recorded
Investment Interest
Income
Recognized Commercial and industrial $ — $ — $ — $ 292 $ 11 Commercial real estate 2,121 2,570 — 3,390 149 Construction — — — 3,156 — Total $ 2,121 $ 2,570 $ — $ 6,838 $ 160
With An Allowance Recorded Recorded
Investment Unpaid Principal
Balance
Related
Allowance
Average
Recorded
Investment Interest
Income
Recognized Commercial real estate $ 4,180 $ 4,180 $ 567 $ 4,583 $ 258 Construction 3,044 3,584 200 3,048 18 Residential mortgage 4,601 4,601 318 4,572 102 Total $ 11,825 $ 12,365 $ 1,085 $ 12,203 $ 378 Total
Commercial and industrial $ — $ — $ — $ 292 $ 11 Commercial real estate 6,301 6,750 567 7,973 407 Construction 3,044 3,584 200 6,204 18 Residential mortgage 4,601 4,601 318 4,572 102 Total (including related allowance) $ 13,946 $ 14,935 $ 1,085 $ 19,041 $ 538
Impaired Loans
December 31, 2010 (Dollars in Thousands) No Related Allowance Recorded Recorded
Investment Unpaid
Principal
Balance Related
Allowance Average
Recorded
Investment Interest
Income
Recognized Commercial and industrial $ 1,364 $ 1,908 $ — $ 1,933 $ 87 Commercial real estate 3,984 4,625 — 4,274 78 Construction 5,865 8,642 — 6,855 112 Residential mortgage 1,462 1,765 — 1,711 27 Total $ 12,675 $ 16,940 $ — $ 14,773 $ 304
2012: December 31, 2013 (Dollars in Thousands) No Related Allowance Recorded Recorded
Investment Unpaid
Principal
Balance Related
Allowance Average
Recorded
Investment Interest
Income
Recognized Commercial and industrial $ 449 $ 449 $ — $ 494 $ 25 Commercial real estate 10,482 10,783 — 10,658 496 Residential mortgage 1,858 2,000 — 1,892 94 Installment 120 120 — 128 6 Total $ 12,909 $ 13,352 $ — $ 13,172 $ 621
With An Allowance Recorded Recorded
Investment Unpaid
Principal
Balance Related
Allowance Average
Recorded
Investment Interest
Income
Recognized Commercial and industrial $ 672 $ 672 $ 300 $ 687 $ 43 Commercial real estate 4,344 4,344 115 4,359 200 Total $ 5,016 $ 5,016 $ 415 $ 5,046 $ 243 Total Commercial and industrial $ 1,121 $ 1,121 $ 300 $ 1,181 $ 68 Commercial real estate 14,826 15,127 115 15,017 696 Residential mortgage 1,858 2,000 — 1,892 94 Installment 120 120 — 128 6 Total (including related
allowance) $ 17,925 $ 18,368 $ 415 $ 18,218 $ 864
December 31, 2012 (Dollars in Thousands) No Related Allowance Recorded Recorded
Investment Unpaid
Principal
Balance Related
Allowance Average
Recorded
Investment Interest
Income
Recognized Commercial and industrial $ 731 $ 731 $ — $ 834 $ 46 Commercial real estate 5,886 6,187 — 6,182 349 Construction 3,600 3,600 — 3,600 92 Residential mortgage 422 422 — 439 22 Total $ 10,639 $ 10,940 $ — $ 11,055 $ 509
With An Allowance Recorded Recorded
Investment Unpaid
Principal
Balance Related
Allowance Average
Recorded
Investment Interest
Income
Recognized Commercial real estate $ 4,180 $ 4,180 $ 493 $ 4,179 $ 138 Residential mortgage 1,255 1,255 152 1,289 40 Total $ 5,435 $ 5,435 $ 645 $ 5,468 $ 178 Total Commercial and industrial $ 731 $ 731 $ — $ 834 $ 46 Commercial real estate 10,066 10,367 493 10,361 487 Construction 3,600 3,600 — 3,600 92 Residential mortgage 1,677 1,677 152 1,728 62 Total (including related
allowance) $ 16,074 $ 16,375 $ 645 $ 16,523 $ 687
F-29
CENTER BANCORP, INC. AND SUBSIDIARIES
NOTES TO CONSOLIDATED FINANCIAL STATEMENTSNote 56 — Loans and the Allowance for Loan Losses – (continued) With An Allowance Recorded Recorded Investment Unpaid Principal Balance Related Allowance Average Recorded Investment Interest Income Recognized Commercial real estate $ 4,180 $ 4,180 $ 618 $ 4,181 $ 204 Residential mortgage 1,354 1,354 21 1,356 76 Total $ 5,534 $ 5,534 $ 639 $ 5,537 $ 280 Total
Commercial and industrial $ 1,364 $ 1,908 $ — $ 1,933 $ 87 Commercial real estate 8,164 8,805 618 8,455 282 Construction 5,865 8,642 — 6,855 112 Residential mortgage 2,816 3,119 21 3,067 103 Total (including related allowance) $ 18,209 $ 22,474 $ 639 $ 20,310 $ 584
| December 31, 2013 | ||||||||||||||||
| (Dollars in Thousands) | ||||||||||||||||
| Pass | Special Mention | Substandard | Doubtful | Total | ||||||||||||
| Commercial and industrial | $ | 226,013 | $ | 1,719 | $ | 1,284 | $ | 672 | $ | 229,688 | ||||||
| Commercial real estate | 509,679 | 14,544 | 12,316 | — | 536,539 | |||||||||||
| Construction | 41,492 | — | 1,230 | — | 42,722 | |||||||||||
| Residential mortgage | 147,379 | 978 | 2,214 | — | 150,571 | |||||||||||
| Installment | 964 | — | 120 | — | 1,084 | |||||||||||
| Total loans | $ | 925,527 | $ | 17,241 | $ | 17,164 | $ | 672 | $ | 960,604 | ||||||
| December 31, 2010 | ||||||||||||||||||||
| (Dollars in Thousands) | ||||||||||||||||||||
| Pass | Special Mention | Substandard | Doubtful | Total | ||||||||||||||||
| Commercial and industrial | $ | 116,741 | $ | 1,929 | $ | 2,364 | $ | — | $ | 121,034 | ||||||||||
| Commercial real estate | 345,096 | 15,383 | 11,522 | — | 372,001 | |||||||||||||||
| Construction | 43,879 | — | 3,588 | 2,277 | 49,744 | |||||||||||||||
| Residential mortgage | 161,558 | — | 3,596 | — | 165,154 | |||||||||||||||
| Installment | 511 | — | — | — | 511 | |||||||||||||||
| Total loans | $ | 667,785 | $ | 17,312 | $ | 21,070 | $ | 2,277 | $ | 708,444 | ||||||||||
December 31, 2012 (Dollars in Thousands) Pass Special
Mention Substandard Doubtful Total Commercial and industrial $ 176,818 $ 3,281 $ 1,583 $ — $ 181,682 Commercial real estate 462,266 18,945 16,181 — 497,392 Construction 38,303 810 1,164 — 40,277 Residential mortgage 163,769 993 4,332 — 169,094 Installment 967 — 137 — 1,104 Total loans $ 842,123 $ 24,029 $ 23,397 $ — $ 889,549
Mention
| F-28 | ||
Impaired Loans
| December 31, 2011 | ||||||||||||||||||||
| (Dollars in Thousands) | ||||||||||||||||||||
| No Related Allowance Recorded | Recorded Investment | Unpaid Principal Balance | Related Allowance | Average Recorded Investment | Interest Income Recognized | |||||||||||||||
| Commercial and industrial | $ | — | $ | — | $ | — | $ | 292 | $ | 11 | ||||||||||
| Commercial real estate | 2,121 | 2,570 | — | 3,390 | 149 | |||||||||||||||
| Construction | — | — | — | 3,156 | — | |||||||||||||||
| Total | $ | 2,121 | $ | 2,570 | $ | — | $ | 6,838 | $ | 160 | ||||||||||
| With An Allowance Recorded | Recorded Investment | Unpaid Principal Balance | Related Allowance | Average Recorded Investment | Interest Income Recognized | |||||||||||||||
| Commercial real estate | $ | 4,180 | $ | 4,180 | $ | 567 | $ | 4,583 | $ | 258 | ||||||||||
| Construction | 3,044 | 3,584 | 200 | 3,048 | 18 | |||||||||||||||
| Residential mortgage | 4,601 | 4,601 | 318 | 4,572 | 102 | |||||||||||||||
| Total | $ | 11,825 | $ | 12,365 | $ | 1,085 | $ | 12,203 | $ | 378 | ||||||||||
| Total | ||||||||||||||||||||
| Commercial and industrial | $ | — | $ | — | $ | — | $ | 292 | $ | 11 | ||||||||||
| Commercial real estate | 6,301 | 6,750 | 567 | 7,973 | 407 | |||||||||||||||
| Construction | 3,044 | 3,584 | 200 | 6,204 | 18 | |||||||||||||||
| Residential mortgage | 4,601 | 4,601 | 318 | 4,572 | 102 | |||||||||||||||
| Total (including related allowance) | $ | 13,946 | $ | 14,935 | $ | 1,085 | $ | 19,041 | $ | 538 | ||||||||||
Impaired Loans
| December 31, 2010 | ||||||||||||||||||||
| (Dollars in Thousands) | ||||||||||||||||||||
| No Related Allowance Recorded | Recorded Investment | Unpaid Principal Balance | Related Allowance | Average Recorded Investment | Interest Income Recognized | |||||||||||||||
| Commercial and industrial | $ | 1,364 | $ | 1,908 | $ | — | $ | 1,933 | $ | 87 | ||||||||||
| Commercial real estate | 3,984 | 4,625 | — | 4,274 | 78 | |||||||||||||||
| Construction | 5,865 | 8,642 | — | 6,855 | 112 | |||||||||||||||
| Residential mortgage | 1,462 | 1,765 | — | 1,711 | 27 | |||||||||||||||
| Total | $ | 12,675 | $ | 16,940 | $ | — | $ | 14,773 | $ | 304 | ||||||||||
2012:
December 31, 2013 (Dollars in Thousands) No Related Allowance Recorded Recorded
Investment Unpaid
Principal
Balance Related
Allowance Average
Recorded
Investment Interest
Income
Recognized Commercial and industrial $ 449 $ 449 $ — $ 494 $ 25 Commercial real estate 10,482 10,783 — 10,658 496 Residential mortgage 1,858 2,000 — 1,892 94 Installment 120 120 — 128 6 Total $ 12,909 $ 13,352 $ — $ 13,172 $ 621
Investment
Principal
Balance
Allowance
Recorded
Investment
Income
Recognized
| With An Allowance Recorded | Recorded Investment | Unpaid Principal Balance | Related Allowance | Average Recorded Investment | Interest Income Recognized | |||||||||||
| Commercial and industrial | $ | 672 | $ | 672 | $ | 300 | $ | 687 | $ | 43 | ||||||
| Commercial real estate | 4,344 | 4,344 | 115 | 4,359 | 200 | |||||||||||
| Total | $ | 5,016 | $ | 5,016 | $ | 415 | $ | 5,046 | $ | 243 | ||||||
| Total | ||||||||||||||||
| Commercial and industrial | $ | 1,121 | $ | 1,121 | $ | 300 | $ | 1,181 | $ | 68 | ||||||
| Commercial real estate | 14,826 | 15,127 | 115 | 15,017 | 696 | |||||||||||
| Residential mortgage | 1,858 | 2,000 | — | 1,892 | 94 | |||||||||||
| Installment | 120 | 120 | — | 128 | 6 | |||||||||||
| Total (including related allowance) | $ | 17,925 | $ | 18,368 | $ | 415 | $ | 18,218 | $ | 864 | ||||||
| December 31, 2012 | ||||||||||||||||
| (Dollars in Thousands) | ||||||||||||||||
| No Related Allowance Recorded | Recorded Investment | Unpaid Principal Balance | Related Allowance | Average Recorded Investment | Interest Income Recognized | |||||||||||
| Commercial and industrial | $ | 731 | $ | 731 | $ | — | $ | 834 | $ | 46 | ||||||
| Commercial real estate | 5,886 | 6,187 | — | 6,182 | 349 | |||||||||||
| Construction | 3,600 | 3,600 | — | 3,600 | 92 | |||||||||||
| Residential mortgage | 422 | 422 | — | 439 | 22 | |||||||||||
| Total | $ | 10,639 | $ | 10,940 | $ | — | $ | 11,055 | $ | 509 | ||||||
| With An Allowance Recorded | Recorded Investment | Unpaid Principal Balance | Related Allowance | Average Recorded Investment | Interest Income Recognized | |||||||||||
| Commercial real estate | $ | 4,180 | $ | 4,180 | $ | 493 | $ | 4,179 | $ | 138 | ||||||
| Residential mortgage | 1,255 | 1,255 | 152 | 1,289 | 40 | |||||||||||
| Total | $ | 5,435 | $ | 5,435 | $ | 645 | $ | 5,468 | $ | 178 | ||||||
| Total | ||||||||||||||||
| Commercial and industrial | $ | 731 | $ | 731 | $ | — | $ | 834 | $ | 46 | ||||||
| Commercial real estate | 10,066 | 10,367 | 493 | 10,361 | 487 | |||||||||||
| Construction | 3,600 | 3,600 | — | 3,600 | 92 | |||||||||||
| Residential mortgage | 1,677 | 1,677 | 152 | 1,728 | 62 | |||||||||||
| Total (including related allowance) | $ | 16,074 | $ | 16,375 | $ | 645 | $ | 16,523 | $ | 687 | ||||||
| F-29 | ||
| With An Allowance Recorded | Recorded Investment | Unpaid Principal Balance | Related Allowance | Average Recorded Investment | Interest Income Recognized | |||||||||||||||
| Commercial real estate | $ | 4,180 | $ | 4,180 | $ | 618 | $ | 4,181 | $ | 204 | ||||||||||
| Residential mortgage | 1,354 | 1,354 | 21 | 1,356 | 76 | |||||||||||||||
| Total | $ | 5,534 | $ | 5,534 | $ | 639 | $ | 5,537 | $ | 280 | ||||||||||
| Total | ||||||||||||||||||||
| Commercial and industrial | $ | 1,364 | $ | 1,908 | $ | — | $ | 1,933 | $ | 87 | ||||||||||
| Commercial real estate | 8,164 | 8,805 | 618 | 8,455 | 282 | |||||||||||||||
| Construction | 5,865 | 8,642 | — | 6,855 | 112 | |||||||||||||||
| Residential mortgage | 2,816 | 3,119 | 21 | 3,067 | 103 | |||||||||||||||
| Total (including related allowance) | $ | 18,209 | $ | 22,474 | $ | 639 | $ | 20,310 | $ | 584 | ||||||||||
The Corporation defines an impaired loan as a loan for which it is probable, based on information available at the determination date, that the Corporation will not collect all amounts due under the contractual terms of the loan. At December 31, 2011, impaired loans were primarily collateral dependent, and totaled $13.9 million. Specific reserves of $1.1 million were assigned to impaired loans of $11.8 million. Other impaired loans in the amount of $2.1 million had no specific reserve. At December 31, 2009 average impaired loans were $6.9 million and related interest income recognized was $267,000.
| F-30 | ||
2012:
| December 31, 2011 | ||||||||||||||||||||||||||||
| (Dollars in Thousands) | ||||||||||||||||||||||||||||
| 30 – 59 Days Past Due | 60 – 89 Days Past Due | Greater Than 90 Days | Total Past Due | Current | Total Loans Receivable | Loans Receivable > 90 Days And Accruing | ||||||||||||||||||||||
| Commercial and Industrial | $ | 137 | $ | 1,544 | $ | 125 | $ | 1,806 | $ | 144,856 | $ | 146,662 | $ | — | ||||||||||||||
| Commercial Real Estate | 1,331 | 5,335 | 1,254 | 7,920 | 400,090 | 408,010 | 1,029 | |||||||||||||||||||||
| Construction | — | — | 3,044 | 3,044 | 36,338 | 39,382 | — | |||||||||||||||||||||
| Residential Mortgage | 2,174 | 99 | 3,477 | 5,750 | 155,249 | 160,999 | — | |||||||||||||||||||||
| Installment | 16 | — | — | 16 | 941 | 957 | — | |||||||||||||||||||||
| Total | $ | 3,658 | $ | 6,978 | $ | 7,900 | $ | 18,536 | $ | 737,474 | $ | 756,010 | $ | 1,029 | ||||||||||||||
Aging Analysis
| December 31, 2010 | ||||||||||||||||||||||||||||
| (Dollars in Thousands) | ||||||||||||||||||||||||||||
| 30 – 59 Days Past Due | 60 – 89 Days Past Due | Greater Than 90 Days | Total Past Due | Current | Total Loans Receivable | Loans Receivable > 90 Days And Accruing | ||||||||||||||||||||||
| Commercial and Industrial | $ | 1,509 | $ | 476 | $ | 456 | $ | 2,441 | $ | 118,593 | $ | 121,034 | $ | — | ||||||||||||||
| Commercial Real Estate | 4,290 | 2,229 | 3,563 | 10,082 | 361,919 | 372,001 | — | |||||||||||||||||||||
| Construction | 170 | 449 | 5,865 | 6,484 | 43,260 | 49,744 | — | |||||||||||||||||||||
| Residential Mortgage | 1,814 | 309 | 2,004 | 4,127 | 161,027 | 165,154 | 714 | |||||||||||||||||||||
| Installment | 9 | — | — | 9 | 502 | 511 | — | |||||||||||||||||||||
| Total | $ | 7,792 | $ | 3,463 | $ | 11,888 | $ | 23,143 | $ | 685,301 | $ | 708,444 | $ | 714 | ||||||||||||||
December 31, 2013 (Dollars in Thousands) 30 – 59
Days
Past Due 60 – 89
Days
Past Due Greater
Than
90 Days Total
Past Due Current Total
Loans
Receivable Loans
Receivable
> 90 Days
And
Accruing Commercial and
Industrial $ 18 $ — $ 753 $ 771 $ 228,917 $ 229,688 $ — Commercial Real
Estate 221 — 744 965 535,574 536,539 — Construction — — — — 42,722 42,722 — Residential
Mortgage 990 258 1,640 2,888 147,683 150,571 — Installment 5 — — 5 1,079 1,084 — Total $ 1,234 $ 258 $ 3,137 $ 4,629 $ 955,975 $ 960,604 $ —
Days
Past Due
Days
Past Due
Than
90 Days
Past Due
Loans
Receivable
Receivable
> 90 Days
And
Accruing
Industrial
Estate
Mortgage
| December 31, 2012 | ||||||||||||||||||||||
| (Dollars in Thousands) | ||||||||||||||||||||||
| 30 – 59 Days Past Due | 60 – 89 Days Past Due | Greater Than 90 Days | Total Past Due | Current | Total Loans Receivable | Loans Receivable > 90 Days And Accruing | ||||||||||||||||
| Commercial and Industrial | $ | 590 | $ | — | 216 | 806 | $ | 180,876 | $ | 181,682 | $ | — | ||||||||||
| Commercial Real Estate | 1,012 | 703 | 354 | 2,069 | 495,323 | 497,392 | — | |||||||||||||||
| Construction | — | — | 319 | 319 | 39,958 | 40,277 | — | |||||||||||||||
| Residential Mortgage | 2,017 | 628 | 2,784 | 5,429 | 163,665 | 169,094 | 55 | |||||||||||||||
| Installment | 23 | — | — | 23 | 1,081 | 1,104 | — | |||||||||||||||
| Total | $ | 3,642 | $ | 1,331 | $ | 3,673 | $ | 8,646 | $ | 880,903 | $ | 889,549 | $ | 55 | ||||||||
| F-31 | ||
| December 31, 2011 (Dollars in Thousands) | ||||||||||||||||||||||||||||
| C & I | Comm R/E | Construction | Res Mtge | Installment | Unallocated | Total | ||||||||||||||||||||||
| Allowance for loan and lease losses: | ||||||||||||||||||||||||||||
| Individually evaluated for impairment | $ | — | $ | 567 | $ | 200 | $ | 318 | $ | — | $ | — | $ | 1,085 | ||||||||||||||
| Collectively evaluated for impairment | 1,527 | 5,405 | 507 | 945 | 51 | 82 | 8,517 | |||||||||||||||||||||
| Total | $ | 1,527 | $ | 5,972 | $ | 707 | $ | 1,263 | $ | 51 | $ | 82 | $ | 9,602 | ||||||||||||||
| Loans Receivable | ||||||||||||||||||||||||||||
| Individually evaluated for impairment | $ | 953 | $ | 12,769 | $ | 3,044 | $ | 5,050 | $ | — | $ | — | $ | 21,816 | ||||||||||||||
| Collectively evaluated for impairment | 145,709 | 395,241 | 36,338 | 155,949 | 957 | — | 734,194 | |||||||||||||||||||||
| Total | $ | 146,662 | $ | 408,010 | $ | 39,382 | $ | 160,999 | $ | 957 | $ | — | $ | 756,010 | ||||||||||||||
December 31, 2013
(Dollars in Thousands) C & I Comm R/E Construction Res Mtge Installment Unallocated Total Allowance for
loan and lease
losses: Individually
evaluated for
impairment $ 300 $ 115 $ — $ — $ — $ — $ 415 Collectively
evaluated for
impairment 1,398 5,631 362 990 146 1,391 9,918 Total $ 1,698 $ 5,746 $ 362 $ 990 $ 146 $ 1,391 $ 10,333 Loans Receivable Individually
evaluated for
impairment $ 1,121 $ 14,826 $ — $ 1,858 $ 120 $ — $ 17,925 Collectively
evaluated for
impairment 226,450 505,361 41,493 135,031 839 — 909,174 Loans acquired
with discounts
related to credit
quality 2,117 16,352 1,229 13,682 125 — 33,505 Total $ 229,688 $ 536,539 $ 42,722 $ 150,571 $ 1,084 $ — $ 960,604
Allowance for loan and lease losses December 31, 2010 (Dollars in Thousands) C & I Comm R/E Construction Res Mtge Installment Unallocated Total Allowance for loan and lease losses:
Individually evaluated for impairment $ — $ 618 $ — $ 21 $ — $ — $ 639 Collectively evaluated for impairment 1,272 5,097 551 1,017 52 239 8,228 Total $ 1,272 $ 5,715 $ 551 $ 1,038 $ 52 $ 239 $ 8,867 Loans Receivable
Individually evaluated for impairment $ 2,748 $ 11,960 $ 5,865 $ 1,354 $ — $ — $ 21,927 Collectively evaluated for impairment 118,286 360,041 43,879 163,800 511 — 686,517 Total $ 121,034 $ 372,001 $ 49,744 $ 165,154 $ 511 $ — $ 708,444
| December 31, 2013 (Dollars in Thousands) | ||||||||||||||||||||||
| C & I | Comm R/E | Construction | Res Mtge | Installment | Unallocated | Total | ||||||||||||||||
| Allowance for loan and lease losses: | ||||||||||||||||||||||
| Individually evaluated for impairment | $ | 300 | $ | 115 | $ | — | $ | — | $ | — | $ | — | $ | 415 | ||||||||
| Collectively evaluated for impairment | 1,398 | 5,631 | 362 | 990 | 146 | 1,391 | 9,918 | |||||||||||||||
| Total | $ | 1,698 | $ | 5,746 | $ | 362 | $ | 990 | $ | 146 | $ | 1,391 | $ | 10,333 | ||||||||
| Loans Receivable | ||||||||||||||||||||||
| Individually evaluated for impairment | $ | 1,121 | $ | 14,826 | $ | — | $ | 1,858 | $ | 120 | $ | — | $ | 17,925 | ||||||||
| Collectively evaluated for impairment | 226,450 | 505,361 | 41,493 | 135,031 | 839 | — | 909,174 | |||||||||||||||
| Loans acquired with discounts related to credit quality | 2,117 | 16,352 | 1,229 | 13,682 | 125 | — | 33,505 | |||||||||||||||
| Total | $ | 229,688 | $ | 536,539 | $ | 42,722 | $ | 150,571 | $ | 1,084 | $ | — | $ | 960,604 | ||||||||
| December 31, 2010 | ||||||||||||||||||||||||||||
| (Dollars in Thousands) | ||||||||||||||||||||||||||||
| C & I | Comm R/E | Construction | Res Mtge | Installment | Unallocated | Total | ||||||||||||||||||||||
| Allowance for loan and lease losses: | ||||||||||||||||||||||||||||
| Individually evaluated for impairment | $ | — | $ | 618 | $ | — | $ | 21 | $ | — | $ | — | $ | 639 | ||||||||||||||
| Collectively evaluated for impairment | 1,272 | 5,097 | 551 | 1,017 | 52 | 239 | 8,228 | |||||||||||||||||||||
| Total | $ | 1,272 | $ | 5,715 | $ | 551 | $ | 1,038 | $ | 52 | $ | 239 | $ | 8,867 | ||||||||||||||
| Loans Receivable | ||||||||||||||||||||||||||||
| Individually evaluated for impairment | $ | 2,748 | $ | 11,960 | $ | 5,865 | $ | 1,354 | $ | — | $ | — | $ | 21,927 | ||||||||||||||
| Collectively evaluated for impairment | 118,286 | 360,041 | 43,879 | 163,800 | 511 | — | 686,517 | |||||||||||||||||||||
| Total | $ | 121,034 | $ | 372,001 | $ | 49,744 | $ | 165,154 | $ | 511 | $ | — | $ | 708,444 | ||||||||||||||
| December 31, 2012 (Dollars in Thousands) | ||||||||||||||||||||||
| C & I | Comm R/E | Construction | Res Mtge | Installment | Unallocated | Total | ||||||||||||||||
| Allowance for loan and lease losses: | ||||||||||||||||||||||
| Individually evaluated for impairment | $ | — | $ | 493 | $ | — | $ | 152 | $ | — | $ | — | $ | 645 | ||||||||
| Collectively evaluated for impairment | 2,419 | 4,719 | 313 | 1,376 | 114 | 651 | 9,592 | |||||||||||||||
| Total | $ | 2,419 | $ | 5,212 | $ | 313 | $ | 1,528 | $ | 114 | $ | 651 | $ | 10,237 | ||||||||
| Loans Receivable | ||||||||||||||||||||||
| Individually evaluated for impairment | $ | 731 | $ | 10,066 | $ | 3,600 | $ | 1,677 | $ | — | $ | — | $ | 16,074 | ||||||||
| Collectively evaluated for impairment | 176,913 | 466,411 | 34,572 | 146,508 | 973 | — | 825,377 | |||||||||||||||
| Loans acquired with discounts related to credit quality | 4,038 | 20,915 | 2,105 | 20,909 | 131 | — | 48,098 | |||||||||||||||
| Total | $ | 181,682 | $ | 497,392 | $ | 40,277 | $ | 169,094 | $ | 1,104 | $ | — | $ | 889,549 | ||||||||
| F-32 | ||
| Year Ended December 31, 2011 | ||||||||||||||||||||||||||||
| (Dollars in thousands) | ||||||||||||||||||||||||||||
| C & I | Comm R/E | Construction | Res Mtg | Installment | Unallocated | Total | ||||||||||||||||||||||
| Balance at January 1, | $ | 1,272 | $ | 5,715 | $ | 551 | $ | 1,038 | $ | 52 | $ | 239 | $ | 8,867 | ||||||||||||||
| Loans charged-off | (186 | ) | (1,168 | ) | (631 | ) | (23 | ) | (20 | ) | — | (2,028 | ) | |||||||||||||||
| Recoveries | 240 | 15 | — | 53 | 7 | — | 315 | |||||||||||||||||||||
| Provision for loan losses | 201 | 1,410 | 787 | 195 | 12 | (157 | ) | 2,448 | ||||||||||||||||||||
| Balance at December 31, | $ | 1,527 | $ | 5,972 | $ | 707 | $ | 1,263 | $ | 51 | $ | 82 | $ | 9,602 | ||||||||||||||
| For the Year Ended December 31, | ||||||||||||
| 2011 | 2010 | 2009 | ||||||||||
| (Dollars in Thousands) | ||||||||||||
| Balance at the beginning of year | $ | 8,867 | $ | 8,711 | $ | 6,254 | ||||||
| Provision for loan losses | 2,448 | 5,076 | 4,597 | |||||||||
| Loans charged-off | (2,028 | ) | (4,940 | ) | (2,152 | ) | ||||||
| Recoveries on loans previously charged-off | 315 | 20 | 12 | |||||||||
| Balance at the end of year | $ | 9,602 | $ | 8,867 | $ | 8,711 | ||||||
| Year Ended December 31, 2013 | ||||||||||||||||||||||
| (Dollars in thousands) | ||||||||||||||||||||||
| C & I | Comm R/E | Construction | Res Mtg | Installment | Unallocated | Total | ||||||||||||||||
| Balance at January 1, | $ | 2,424 | $ | 5,323 | $ | 313 | $ | 1,532 | $ | 113 | $ | 532 | $ | 10,237 | ||||||||
| Loans charged-off | (6) | (126) | — | (175) | (22) | — | (329) | |||||||||||||||
| Recoveries | 41 | 28 | — | — | 6 | — | 75 | |||||||||||||||
| Provision for loan losses | (761) | 521 | 49 | (367) | 49 | 859 | 350 | |||||||||||||||
| Balance at December 31, | $ | 1,698 | $ | 5,746 | $ | 362 | $ | 990 | $ | 146 | $ | 1,391 | $ | 10,333 | ||||||||
| Year Ended December 31, 2012 | ||||||||||||||||||||||
| (Dollars in thousands) | ||||||||||||||||||||||
| C & I | Comm R/E | Construction | Res Mtg | Installment | Unallocated | Total | ||||||||||||||||
| Balance at January 1, | $ | 1,527 | $ | 5,972 | $ | 707 | $ | 1,263 | $ | 51 | $ | 82 | $ | 9,602 | ||||||||
| Loans charged-off | — | (57) | — | (454) | (16) | — | (527) | |||||||||||||||
| Recoveries | — | 80 | 540 | 210 | 7 | — | 837 | |||||||||||||||
| Provision for loan losses | 892 | (783) | (934) | 509 | 72 | 569 | 325 | |||||||||||||||
| Balance at December 31, | $ | 2,419 | $ | 5,212 | $ | 313 | $ | 1,528 | $ | 114 | $ | 651 | $ | 10,237 | ||||||||
| For the Year Ended December 31, | ||||||||||
| 2013 | 2012 | 2011 | ||||||||
| (Dollars in Thousands) | ||||||||||
| Balance at the beginning of year | $ | 10,237 | $ | 9,602 | $ | 8,867 | ||||
| Provision for loan losses | 350 | 325 | 2,448 | |||||||
| Loans charged-off | (329) | (527) | (2,028) | |||||||
| Recoveries on loans previously charged-off | 75 | 837 | 315 | |||||||
| Balance at the end of year | $ | 10,333 | $ | 10,237 | $ | 9,602 | ||||
interest, or whose terms have been modified in troubled debt restructurings.
| F-33 | ||
| Year Ended December 31, 2011 | ||||||||||||
| Number of Loans | Pre-restructuring Outstanding Recorded Investment | Post-restructuring Outstanding Recorded Investment | ||||||||||
| (Dollars in Thousands) | ||||||||||||
| Troubled debt restructurings: | ||||||||||||
| Commercial Real Estate | 1 | $ | 1,719 | $ | 1,318 | |||||||
| Residential Mortgage | 5 | 1,624 | 1,575 | |||||||||
| Total | 6 | $ | 3,343 | $ | 2,893 | |||||||
| Year Ended December 31, 2013 | ||||||||||
| Number of Loans | Pre-restructuring Outstanding Recorded Investment | Post-restructuring Outstanding Recorded Investment | ||||||||
| (Dollars in Thousands) | ||||||||||
| Troubled debt restructurings: | ||||||||||
| Commercial Real Estate | — | $ | — | $ | — | |||||
| Residential Mortgage | — | — | — | |||||||
| Installment | — | — | — | |||||||
| Total | — | $ | — | $ | — | |||||
| Year Ended December 31, 2012 | ||||||||||
| Number of Loans | Pre-restructuring Outstanding Recorded Investment | Post-restructuring Outstanding Recorded Investment | ||||||||
| (Dollars in Thousands) | ||||||||||
| Troubled debt restructurings: | ||||||||||
| Commercial Real Estate | 1 | $ | 225 | $ | 225 | |||||
| Residential Mortgage | 1 | 714 | 675 | |||||||
| Installment | 1 | 1,354 | 1,354 | |||||||
| Total | 3 | $ | 2,293 | $ | 2,254 | |||||
2013 and 2012.
2013. The Corporation adopted had one loan that defaulted during the twelve months ended December 31, 2012 that had previously been modified as a TDR within the previous twelve months.
| F-34 | ||
| Estimated Useful Life (Years) | 2011 | 2010 | ||||||||||
| (Dollars in Thousands) | ||||||||||||
| Land | $ | 2,403 | $ | 2,403 | ||||||||
| Buildings | 5 – 40 | 12,711 | 12,656 | |||||||||
| Furniture, fixtures and equipment | 2 – 20 | 16,191 | 15,929 | |||||||||
| Leasehold improvements | 5 – 30 | 1,839 | 1,839 | |||||||||
| Subtotal | 33,144 | 32,827 | ||||||||||
| Less: accumulated depreciation and amortization | 20,817 | 19,890 | ||||||||||
| Total premises and equipment, net | $ | 12,327 | $ | 12,937 | ||||||||
| Estimated | |||||||||
| Useful Life | |||||||||
| (Years) | 2013 | 2012 | |||||||
| (Dollars in Thousands) | |||||||||
| Land | — | $ | 2,403 | $ | 2,403 | ||||
| Buildings | 5 – 40 | 13,675 | 13,434 | ||||||
| Furniture, fixtures and equipment | 2 – 20 | 17,604 | 17,226 | ||||||
| Leasehold improvements | 5 – 30 | 3,184 | 2,900 | ||||||
| Subtotal | 36,866 | 35,963 | |||||||
| Less: accumulated depreciation and amortization | 23,185 | 22,400 | |||||||
| Total premises and equipment, net | $ | 13,681 | $ | 13,563 | |||||
2011.
and Other, and the FASB issued ASU No. 2011-08, “Testing Goodwill for Impairment,” allowing an initial qualitative assessment of goodwill commonly known as step zero impairment testing. In general, the step zero test allows an entity to first assess qualitative factors to determine whether it is more likely than not (i.e., more than 50%) that the fair value of a reporting unit is less than its carrying value. If a step zero impairment test results in the conclusion that it is more likely than not that the fair value of the reporting unit exceeds its carrying value, then no further testing is required.
2012.
| Gross Carrying Amount | Accumulated Amortization | Net Carrying Amount | ||||||||||
| (Dollars in Thousands) | ||||||||||||
| As of December 31, 2011: | ||||||||||||
| Core deposits | $ | 703 | $ | (605 | ) | $ | 98 | |||||
| Total intangible assets | 703 | (605 | ) | 98 | ||||||||
| As of December 31, 2010: | ||||||||||||
| Core deposits | $ | 703 | $ | (548 | ) | $ | 155 | |||||
| Total intangible assets | 703 | (548 | ) | 155 | ||||||||
| Gross Carrying Amount | Accumulated Amortization | Net Carrying Amount | ||||||||
| (Dollars in Thousands) | ||||||||||
| As of December 31, 2013: | ||||||||||
| Core deposits | $ | 703 | $ | (679) | $ | 24 | ||||
| Total intangible assets | 703 | (679) | 24 | |||||||
| As of December 31, 2012: | ||||||||||
| Core deposits | $ | 703 | $ | (649) | $ | 54 | ||||
| Total intangible assets | 703 | (649) | 54 | |||||||
2015.
| F-35 | ||
| (dollars in thousands) | Amount | |||
| 2012 | $ | 155,247 | ||
| 2013 | 21,989 | |||
| 2014 | 7,240 | |||
| 2015 | 2,099 | |||
| 2016 | 8,008 | |||
| Thereafter | — | |||
| Total | $ | 194,583 | ||
| (dollars in thousands) | Amount | |||
| 2014 | $ | 102,106 | ||
| 2015 | 25,672 | |||
| 2016 | 19,765 | |||
| 2017 | 4,376 | |||
| 2018 | 34 | |||
| Thereafter | — | |||
| Total | $ | 151,953 | ||
| (dollars in thousands) | Amount | |||
| Three Months or Less | $ | 55,959 | ||
| Over Three Months through Six Months | 36,460 | |||
| Over Six Months through Twelve Months | 16,702 | |||
| Over Twelve Months | 28,877 | |||
| Total | $ | 137,998 | ||
(dollars in thousands) Amount Three Months or Less $ 15,301 Over Three Months through Six Months 28,401 Over Six Months through Twelve Months 18,771 Over Twelve Months 36,971 Total $ 99,444
Note 910 — Borrowed Funds:Short-term borrowings at December 31, 2011 and 2010 consisted of the following:
2011 2010 (Dollars in Thousands) Securities sold under agreements to repurchase $ — $ 28,855 Federal funds purchased and FHLB short-term advances — 13,000 Total short-term borrowings $ — $ 41,855
| (dollars in thousands) | Amount | |||
| Three Months or Less | $ | 15,301 | ||
| Over Three Months through Six Months | 28,401 | |||
| Over Six Months through Twelve Months | 18,771 | |||
| Over Twelve Months | 36,971 | |||
| Total | $ | 99,444 | ||
Short-term borrowings at December 31, 2011 and 2010 consisted of the following:
| 2011 | 2010 | |||||||
| (Dollars in Thousands) | ||||||||
| Securities sold under agreements to repurchase | $ | — | $ | 28,855 | ||||
| Federal funds purchased and FHLB short-term advances | — | 13,000 | ||||||
| Total short-term borrowings | $ | — | $ | 41,855 | ||||
The weighted average interest rates for short-term borrowings at December 31, 2011 and 2010 were zero percent and 0.27 percent, respectively.
| 2011 | 2010 | |||||||
| (Dollars in Thousands) | ||||||||
| FHLB long-term advances | $ | 120,000 | $ | 130,000 | ||||
| Securities sold under agreements to repurchase | 41,000 | 41,000 | ||||||
| Total long-term borrowings | $ | 161,000 | $ | 171,000 | ||||
| 2013 | 2012 | ||||||
| (Dollars in Thousands) | |||||||
| FHLB long-term advances | $ | 115,000 | $ | 115,000 | |||
| Securities sold under agreements to repurchase | 31,000 | 31,000 | |||||
| Total long-term borrowings | $ | 146,000 | $ | 146,000 | |||
December 31, 2013, 2012 and 2011, respectively.
| F-36 | ||
December 31, 2011 and 2010, respectively. Overnight federal funds purchased averaged $2.9 million during 2011 as compared to $0.4 million during 2010.
2012, respectively. The maximum borrowing capacity with the Federal Home Loan Bank is limited to25 percent of the Corporation’s total assets.
| 2011 | 2010 | |||||||
| (Dollars in Thousands) | ||||||||
| 2011 | $ | — | $ | 10,000 | ||||
| 2013 | 5,000 | 5,000 | ||||||
| 2016 | 20,000 | 20,000 | ||||||
| 2017 | 55,000 | 55,000 | ||||||
| 2018 | 40,000 | 40,000 | ||||||
| Total | $ | 120,000 | $ | 130,000 | ||||
| 2013 | 2012 | ||||||
| (Dollars in Thousands) | |||||||
| 2016 | $ | — | $ | 20,000 | |||
| 2017 | 35,000 | 55,000 | |||||
| 2018 | 40,000 | 40,000 | |||||
| 2020 | 40,000 | — | |||||
| Total | $ | 115,000 | $ | 115,000 | |||
| 2011 | 2010 | |||||||
| (Dollars in Thousands) | ||||||||
| 2011 | $ | — | $ | — | ||||
| 2015 | 10,000 | 10,000 | ||||||
| 2017 | 15,000 | 15,000 | ||||||
| 2018 | 16,000 | 16,000 | ||||||
| Total | $ | 41,000 | $ | 41,000 | ||||
Note 10 2013 2012 (Dollars in Thousands) 2017 $ 15,000 $ 15,000 2018 16,000 16,000 Total $ 31,000 $ 31,000
Note 11 — Subordinated Debentures:During 2003, the Corporation formed a statutory business trust, which exists for the exclusive purpose of (i) issuing Trust Securities representing undivided beneficial interests in the assets of the Trust; (ii) investing the gross proceeds of the Trust securities in junior subordinated deferrable interest debentures (subordinated debentures) of the Corporation; and (iii) engaging in only those activities necessary or incidental thereto. These subordinated debentures and the related income effects are not eliminated in the consolidated financial statements as the statutory business trust is not consolidated in accordance with FASB ASC 810-10. Distributions on the subordinated debentures owned by the subsidiary trust have been classified as interest expense in the Consolidated Statements of Income.
| 2013 | 2012 | ||||||
| (Dollars in Thousands) | |||||||
| 2017 | $ | 15,000 | $ | 15,000 | |||
| 2018 | 16,000 | 16,000 | |||||
| Total | $ | 31,000 | $ | 31,000 | |||
| F-37 | ||
Issuance Date Securities
Issued Liquidation Value Coupon Rate Maturity Redeemable by
Issuer Beginning 12/19/2003 $ 5,000,000 $1,000 per Capital Security Floating 3-month LIBOR + 285 Basis Points 01/23/2034 01/23/2009
Note 1112 — Income TaxesThe current and deferred amounts of income tax expense for the years ended December 31, 2011, 20102013, 2012 and 2009,2011, respectively, are as follows: 2011 2010 2009 (Dollars in Thousands) Current:
Federal $ 3,818 $ (27 ) $ (19 ) State 187 198 146 Subtotal 4,005 171 127 Deferred:
Federal 2,157 (191 ) 824 State 1,249 242 (5 ) Subtotal 3,406 51 819 Income tax expense $ 7,411 $ 222 $ 946
| Issuance Date | Securities Issued | Liquidation Value | Coupon Rate | Maturity | Redeemable by Issuer Beginning | |||||||
| 12/19/2003 | $ | 5,000,000 | $1,000 per Capital Security | Floating 3-month LIBOR + 285 Basis Points | 01/23/2034 | 01/23/2009 | ||||||
| 2011 | 2010 | 2009 | ||||||||||
| (Dollars in Thousands) | ||||||||||||
| Current: | ||||||||||||
| Federal | $ | 3,818 | $ | (27 | ) | $ | (19 | ) | ||||
| State | 187 | 198 | 146 | |||||||||
| Subtotal | 4,005 | 171 | 127 | |||||||||
| Deferred: | ||||||||||||
| Federal | 2,157 | (191 | ) | 824 | ||||||||
| State | 1,249 | 242 | (5 | ) | ||||||||
| Subtotal | 3,406 | 51 | 819 | |||||||||
| Income tax expense | $ | 7,411 | $ | 222 | $ | 946 | ||||||
| 2013 | 2012 | 2011 | ||||||||
| (Dollars in Thousands) | ||||||||||
| Current: | ||||||||||
| Federal | $ | 5,658 | $ | 5,506 | $ | 3,818 | ||||
| State | 87 | 259 | 187 | |||||||
| Subtotal | 5,745 | 5,765 | 4,005 | |||||||
| Deferred: | ||||||||||
| Federal | 1,906 | 1,085 | 2,157 | |||||||
| State | (167) | 827 | 1,249 | |||||||
| Subtotal | 1,739 | 1,912 | 3,406 | |||||||
| Income tax expense | $ | 7,484 | $ | 7,677 | $ | 7,411 | ||||
| 2011 | 2010 | 2009 | ||||||||||
| (Dollars in Thousands) | ||||||||||||
| Income before income tax expense | $ | 21,337 | $ | 7,226 | $ | 4,717 | ||||||
| Federal statutory rate | 35 | % | 34 | % | 34 | % | ||||||
| Computed “expected” Federal income tax expense | 7,468 | 2,457 | 1,604 | |||||||||
| State tax, net of Federal tax benefit | 933 | 291 | 93 | |||||||||
| Bank owned life insurance | (363 | ) | (417 | ) | (393 | ) | ||||||
| Tax-exempt interest and dividends | (595 | ) | (75 | ) | (334 | ) | ||||||
| Tax on Bank Owned Life Insurance policy surrender gain | — | 539 | — | |||||||||
| Reversal of unrealized tax benefit & interest | — | (2,551 | ) | — | ||||||||
| Other, net | (32 | ) | (22 | ) | (24 | ) | ||||||
| Income tax | $ | 7,411 | $ | 222 | $ | 946 | ||||||
2013 2012 2011 (Dollars in Thousands) Income before income tax expense $ 27,409 $ 25,184 $ 21,337 Federal statutory rate 35 % 35 % 35 % Computed “expected” Federal income tax
expense 9,593 8,814 7,468 State tax, net of Federal tax benefit (53) 706 933 Bank owned life insurance (477) (356) (363) Tax-exempt interest and dividends (1,645) (1,228) (595) Bargain gain on Saddle River Valley Bank
acquisition — (314) — Other, net 66 55 (32) Income tax $ 7,484 $ 7,677 $ 7,411
expense
acquisition
| F-38 | ||
| 2011 | 2010 | |||||||
| (Dollars in Thousands) | ||||||||
| Deferred tax assets: | ||||||||
| Impaired assets | $ | 2,820 | $ | 2,621 | ||||
| Allowance for loan losses | 3,810 | 3,358 | ||||||
| Employee benefit plans | 13 | 59 | ||||||
| Unrealized losses on securities available-for-sale | 1,154 | 3,462 | ||||||
| Pension actuarial losses | 2,150 | 1,566 | ||||||
| Other | 512 | 656 | ||||||
| Federal AMT Credits | 854 | 3,874 | ||||||
| NJ NOL | 373 | 1,258 | ||||||
| NJ AMA credits | 210 | 213 | ||||||
| Total deferred tax assets | $ | 11,896 | $ | 17,067 | ||||
| Deferred tax liabilities: | ||||||||
| Depreciation | $ | 303 | $ | 298 | ||||
| Market discount accretion | 43 | 29 | ||||||
| Deferred loan costs, net of fees | 397 | 435 | ||||||
| Purchase accounting | 40 | 62 | ||||||
| Total deferred tax liabilities | 783 | 824 | ||||||
| Net deferred tax asset | $ | 11,113 | $ | 16,243 | ||||
| 2013 | 2012 | ||||||
| (Dollars in Thousands) | |||||||
| Deferred tax assets: | |||||||
| Impaired assets | $ | 1,221 | $ | 1,967 | |||
| Allowance for loan losses | 4,118 | 4,040 | |||||
| Employee benefit plans | — | 64 | |||||
| Pension actuarial losses | 2,206 | 2,473 | |||||
| Other | 466 | 454 | |||||
| NJ NOL | 399 | — | |||||
| NJ AMA credits | 137 | 131 | |||||
| Total deferred tax assets | $ | 8,547 | $ | 9,129 | |||
| Deferred tax liabilities: | |||||||
| Employee benefit plans | $ | 1,281 | $ | — | |||
| Depreciation | 416 | 294 | |||||
| Market discount accretion | 200 | 148 | |||||
| Deferred loan costs, net of fees | 385 | 330 | |||||
| Purchase accounting | 522 | 608 | |||||
| Unrealized gains on securities available-for-sale | 547 | 5,675 | |||||
| Total deferred tax liabilities | 3,351 | 7,055 | |||||
| Net deferred tax asset | $ | 5,196 | $ | 2,074 | |||
2033
.| F-39 | ||
| 2011 | 2010 | |||||||
| (Dollars in Thousands) | ||||||||
| Commitments under commercial loans and lines of credit | $ | 90,866 | $ | 77,786 | ||||
| Home equity and other revolving lines of credit | 49,203 | 50,131 | ||||||
| Outstanding commercial mortgage loan commitments | 32,938 | 32,554 | ||||||
| Standby letters of credit | 1,800 | 2,225 | ||||||
| Performance letters of credit | 20,482 | 12,019 | ||||||
| Outstanding residential mortgage loan commitments | — | 250 | ||||||
| Overdraft protection lines | 5,850 | 4,898 | ||||||
| Other consumer | — | — | ||||||
| Total | $ | 201,139 | $ | 179,863 | ||||
Other expenses include
| 2013 | 2012 | ||||||
| (Dollars in Thousands) | |||||||
| Commitments under commercial loans and lines of credit | $ | 109,661 | $ | 129,797 | |||
| Home equity and other revolving lines of credit | 41,836 | 46,795 | |||||
| Outstanding commercial mortgage loan commitments | 48,129 | 30,955 | |||||
| Standby letters of credit | 9,655 | 1,700 | |||||
| Performance letters of credit | 21,844 | 27,743 | |||||
| Outstanding residential mortgage loan commitments | 1,858 | 2,207 | |||||
| Overdraft protection lines | 5,273 | 5,666 | |||||
| Total | $ | 238,256 | $ | 244,863 | |||
$7,289,000.
CENTER BANCORP, INC. AND SUBSIDIARIES
NOTES TO CONSOLIDATED FINANCIAL STATEMENTS
Note 13 — Stockholders’ Equity and Regulatory Requirements – (continued)
Capital Purchase Program amounted to approximately 50 percent of what the Corporation had qualified for under the U.S. Treasury program. The Corporation believed that its participation in this program would strengthen its current well-capitalized position. The funding was used to support future loan growth. As a result of the successful completion of thea rights offering in October 2009, the number of shares underlying the warrants held by the U.S. Treasury was reduced to86,705 shares, or50 percent of the original 173,410 shares as outlined by the provisions of the Capital Purchase Program.
| F-40 | ||
At December 31, 2011,2013, management believes that the Bank and the Parent Corporation met all capital adequacy requirements to which they are subject.
| F-41 | ||
| Union Center National Bank | Minimum Capital Adequacy | For Classification Under Corrective Action Plan as Well Capitalized | ||||||||||||||||||||||
| Amount | Ratio | Amount | Ratio | Amount | Ratio | |||||||||||||||||||
| (Dollars in Thousands) | ||||||||||||||||||||||||
| December 31, 2011 Leverage (Tier 1) capital | $ | 127,473 | 9.15 | % | $ | 55,726 | 4.00 | % | $ | 69,657 | 5.00 | % | ||||||||||||
| Risk-Based Capital: | ||||||||||||||||||||||||
| Tier 1 | $ | 127,473 | 11.81 | % | $ | 43,175 | 4.00 | % | $ | 64,762 | 6.00 | % | ||||||||||||
| Total | 137,075 | 12.70 | % | 86,346 | 8.00 | % | 107,933 | 10.00 | % | |||||||||||||||
| December 31, 2010 Leverage (Tier 1) capital | $ | 112,601 | 9.56 | % | $ | 48,088 | 4.00 | % | $ | 59,262 | 5.00 | % | ||||||||||||
| Risk-Based Capital: | ||||||||||||||||||||||||
| Tier 1 | $ | 112,601 | 12.83 | % | $ | 35,116 | 4.00 | % | $ | 52,674 | 6.00 | % | ||||||||||||
| Total | 121,468 | 13.84 | % | 70,232 | 8.00 | % | 87,790 | 10.00 | % | |||||||||||||||
| Union Center National Bank | Minimum Capital Adequacy | For Classification Under Corrective Action Plan as Well Capitalized | |||||||||||||||||||||||||||||||||||||||||
| Parent Corporation | Minimum Capital Adequacy | For Classification as Well Capitalized | Amount | Ratio | Amount | Ratio | Amount | Ratio | |||||||||||||||||||||||||||||||||||
| Amount | Ratio | Amount | Ratio | Amount | Ratio | (Dollars in Thousands) | |||||||||||||||||||||||||||||||||||||
| (Dollars in Thousands) | |||||||||||||||||||||||||||||||||||||||||||
| December 31, 2011 Leverage (Tier 1) capital | $ | 129,437 | 9.29 | % | $ | 55,732 | 4.00 | % | $ | 69,665 | 5.00 | % | |||||||||||||||||||||||||||||||
| December 31, 2013 Leverage (Tier 1) capital | $ | 159,431 | 9.69 | % | $ | 65,813 | 4.00 | % | $ | 82,266 | 5.00 | % | |||||||||||||||||||||||||||||||
| Risk-Based Capital: | |||||||||||||||||||||||||||||||||||||||||||
| Tier 1 | $ | 129,437 | 12.00 | % | $ | 43,146 | 4.00 | % | $ | 64,719 | 6.00 | % | $ | 159,431 | 12.10 | % | $ | 52,704 | 4.00 | % | $ | 79,057 | 6.00 | % | |||||||||||||||||||
| Total | 139,039 | 12.89 | % | 86,293 | 8.00 | % | N/A | N/A | 169,974 | 12.91 | % | 105,329 | 8.00 | % | 131,661 | 10.00 | % | ||||||||||||||||||||||||||
| December 31, 2010 Leverage (Tier 1) capital | $ | 116,600 | 9.90 | % | $ | 48,098 | 4.00 | % | $ | 59,275 | 5.00 | % | |||||||||||||||||||||||||||||||
| December 31, 2012 Leverage (Tier 1) capital | $ | 143,294 | 8.99 | % | $ | 63,757 | 4.00 | % | $ | 79,696 | 5.00 | % | |||||||||||||||||||||||||||||||
| Risk-Based Capital: | |||||||||||||||||||||||||||||||||||||||||||
| Tier 1 | $ | 116,600 | 13.28 | % | $ | 35,124 | 4.00 | % | $ | 52,686 | 6.00 | % | $ | 143,294 | 11.35 | % | $ | 50,500 | 4.00 | % | $ | 75,750 | 6.00 | % | |||||||||||||||||||
| Total | 125,467 | 14.29 | % | 70,248 | 8.00 | % | N/A | N/A | 153,776 | 12.18 | % | 101,002 | 8.00 | % | 126,253 | 10.00 | % | ||||||||||||||||||||||||||
| Parent Corporation | Minimum Capital Adequacy | For Classification as Well Capitalized | |||||||||||||||||
| Amount | Ratio | Amount | Ratio | Amount | Ratio | ||||||||||||||
| (Dollars in Thousands) | |||||||||||||||||||
| December 31, 2013 Leverage (Tier 1) capital | $ | 159,316 | 9.69 | % | $ | 65,765 | 4.00 | % | $ | N/A | N/A | % | |||||||
| Risk-Based Capital: | |||||||||||||||||||
| Tier 1 | $ | 159,316 | 12.10 | % | $ | 52,666 | 4.00 | % | $ | N/A | N/A | % | |||||||
| Total | 169,894 | 12.90 | % | 105,361 | 8.00 | % | N/A | N/A | |||||||||||
| December 31, 2012 Leverage (Tier 1) capital | $ | 143,824 | 9.02 | % | $ | 63,780 | 4.00 | % | $ | N/A | N/A | % | |||||||
| Risk-Based Capital: | |||||||||||||||||||
| Tier 1 | $ | 143,824 | 11.39 | % | $ | 50,509 | 4.00 | % | $ | N/A | N/A | % | |||||||
| Total | 154,271 | 12.22 | % | 100,996 | 8.00 | % | N/A | N/A | |||||||||||
On March 1, 2005, the Federal Reserve adopted a final rule that allows the continued inclusion of outstanding and prospective issuances of trust preferred securities in the Tier I Capital of bank holding companies, subject to stricter quantitative limits and qualitative standards. The new quantitative limits became effective after a five-year transition period ended March 31, 2009. Under the final rules, trust preferred securities and other restricted core capital elements are limited to 25% of all core capital elements. Amounts of restricted core capital elements in excess of these limits may be included in Tier II Capital. Based on a review of the final rule, the Corporation believes that its trust preferred issues qualify as Tier I Capital. However, in the event that the trust preferred issues do not qualify as Tier I Capital, the Corporation would remain well-capitalized.
The Dodd-Frank Act includes certain provisions, often referred to as the “Collins Amendment,” concerning the capital requirements of the United States banking regulators. These provisions are intended to subject bank holding companies to the same capital requirements as their bank subsidiaries and to eliminate or significantly reduce the use of hybrid capital instruments, especially trust preferred securities, as regulatory
| F-42 | ||
capital. Under the Collins Amendment, trust preferred securities issued by a company, such as Union Center National Bank, with total consolidated assets of less than $15 billion before May 19, 2010 and treated as regulatory capital are grandfathered, but any such securities issued later are not eligible as regulatory capital. The banking regulators must develop regulations setting minimum risk-based and leverage capital requirements for holding companies and banks on a consolidated basis that are no less stringent than the generally applicable requirements in effect for depository institutions under the prompt corrective action regulations. The banking regulators also must seek to make capital standards countercyclical so that the required levels of capital increase in times of economic expansion and decrease in times of economic contraction. The Dodd-Frank Act requires these new capital regulations to be adopted by the Federal Reserve in final form 18 months after the date of enactment of the Dodd-Frank Act (July 21, 2010).
Note 1415 — Comprehensive Income
Disclosure of comprehensive income for the years ended December 31, 2011, 2010 and 2009 is presented in the Consolidated Statements of Changes in Stockholders’ Equity. The table below provides a reconciliation of the components of
| Affected Line Item in the | |||||||||||
| Details about Accumulated Other | Amounts Reclassified from Accumulated | Statement Where Net Income is | |||||||||
| Comprehensive Income Components | Other Comprehensive Income | Presented | |||||||||
| Twelve Months Ended | |||||||||||
| December 31, | |||||||||||
| (Dollars in thousands) | 2013 | 2012 | 2011 | ||||||||
| OTTI losses | $ | (652) | $ | (870) | $ | (342) | Net investment securities gains | ||||
| 178 | 265 | 119 | Tax benefit | ||||||||
| (474) | (605) | (223) | Net of tax | ||||||||
| Sale of investment securities available-for-sale | 2,363 | 2,882 | 3,976 | Net investment securities gains | |||||||
| (645) | (879) | (1,380) | Tax expense | ||||||||
| 1,718 | 2,003 | 2,596 | Net of tax | ||||||||
| Amortization of unrealized holding gains on securities transferred from available-for-sale to held-to-maturity | 58 | 2 | 46 | Interest income | |||||||
| (19) | (1) | (28) | Tax expense | ||||||||
| 39 | 1 | 18 | Net of tax | ||||||||
| Pension plan actuarial (gains) losses | (654) | 790 | 1,649 | Before tax | |||||||
| 267 | (323) | (584) | Tax benefit (expense) | ||||||||
| (387) | 467 | 1,065 | Net of tax | ||||||||
| Total reclassification | $ | 896 | $ | 1,866 | $ | 3,456 | Net of tax | ||||
The components of other comprehensive income (loss), net of taxes, were as follows for the following fiscal years ended December 31:
| Years Ended December 31, | ||||||||||||
| 2011 | 2010 | 2009 | ||||||||||
| (Dollars in Thousands) | ||||||||||||
| Reclassification adjustments for OTTI losses included in income | $ | 342 | $ | 5,576 | $ | 4,238 | ||||||
| Unrealized gains (losses) on available for sale securities | 8,990 | 3,822 | (2,827 | ) | ||||||||
| Reclassification adjustment for realized gains arising during this period | (3,976 | ) | (4,237 | ) | (4,729 | ) | ||||||
| Net unrealized gains (losses) on available-for-sale securities | 5,356 | 5,161 | (3,318 | ) | ||||||||
| Unrealized holding gains on securities transferred from available-for-sale to held-to-maturity securities | 245 | — | — | |||||||||
| Net unrealized gains (losses) | 5,601 | 5,161 | (3,318 | ) | ||||||||
| Tax effect | (2,307 | ) | (2,060 | ) | 1,354 | |||||||
| Net of tax amount | 3,294 | 3,101 | (1,964 | ) | ||||||||
| Actuarial (loss) gain | (1,649 | ) | — | 25 | ||||||||
| Tax effect | 584 | — | (10 | ) | ||||||||
| Net of tax amount | (1,065 | ) | — | 15 | ||||||||
| Net actuarial gains | — | — | 142 | |||||||||
| Tax effect | — | — | (57 | ) | ||||||||
| Net of tax amount | — | — | 85 | |||||||||
| Other comprehensive income (loss), net of tax | $ | 2,229 | $ | 3,101 | $ | (1,864 | ) | |||||
following:
2013 2012 (Dollars in Thousands) Investment securities available for sale, net of tax $ 2,374 $ 8,781 Unamortized component of securities transferred from
available-for-sale to held-to-maturity, net of tax (1,425) 162 Defined benefit pension and post-retirement plans, net of tax (3,493) (3,880) Total $ (2,544) $ 5,063
available-for-sale to held-to-maturity, net of tax
| F-43 | ||
Accumulated other comprehensive loss at December 31, 2011 and 2010 consisted of the following:
| 2011 | 2010 | |||||||||||
| (Dollars in Thousands) | ||||||||||||
| Investment securities available for sale, net of tax | $ | (2,196 | ) | $ | (5,327 | ) | ||||||
| Unamortized component of securities transferred from available-for-sale to held-to-maturity, net of tax | 163 | — | ||||||||||
| Defined benefit pension and post-retirement plans, net of tax | (3,413 | ) | (2,348 | ) | ||||||||
| Total | $ | (5,446 | ) | $ | (7,675 | ) | ||||||
Note 1516 — Pension and Other Benefits
| 2011 | 2010 | |||||||
| (Dollars in Thousands) | ||||||||
| Change in Benefit Obligation: | ||||||||
| Projected benefit obligation at beginning of year | $ | 11,032 | $ | 10,660 | ||||
| Service cost | — | — | ||||||
| Interest cost | 589 | 601 | ||||||
| Actuarial loss | 1,335 | 393 | ||||||
| Benefits paid | (611 | ) | (622 | ) | ||||
| Projected benefit obligation at end of year | $ | 12,345 | $ | 11,032 | ||||
| Change in Plan Assets: | ||||||||
| Fair value of plan assets at beginning year | $ | 6,993 | $ | 6,652 | ||||
| Actual return on plan assets | (111 | ) | 663 | |||||
| Employer contributions | 491 | 300 | ||||||
| Benefits paid | (611 | ) | (622 | ) | ||||
| Fair value of plan assets at end of year | $ | 6,762 | $ | 6,993 | ||||
| Funded status | $ | (5,583 | ) | $ | (4,039 | ) | ||
| 2013 | 2012 | ||||||
| (Dollars in Thousands) | |||||||
| Change in Benefit Obligation: | |||||||
| Projected benefit obligation at beginning of year | $ | 13,533 | $ | 12,345 | |||
| Interest cost | 529 | 555 | |||||
| Actuarial loss | 255 | 1,389 | |||||
| Benefits paid | (748) | (756) | |||||
| Projected benefit obligation at end of year | $ | 13,569 | $ | 13,533 | |||
| Change in Plan Assets: | |||||||
| Fair value of plan assets at beginning year | $ | 7,034 | $ | 6,762 | |||
| Actual return on plan assets | 1,040 | 681 | |||||
| Employer contributions | 3,700 | 347 | |||||
| Benefits paid | (748) | (756) | |||||
| Fair value of plan assets at end of year | $ | 11,026 | $ | 7,034 | |||
| Funded status | $ | (2,543) | $ | (6,499) | |||
| F-44 | ||
| 2011 | 2010 | 2009 | ||||||||||
| (Dollars in Thousands) | ||||||||||||
| Service cost | $ | — | $ | — | $ | — | ||||||
| Interest cost | 589 | 601 | 606 | |||||||||
| Expected return on plan assets | (381 | ) | (413 | ) | (288 | ) | ||||||
| Net amortization and deferral | 179 | 130 | — | |||||||||
| Net periodic pension expense | $ | 387 | $ | 318 | $ | 318 | ||||||
| 2013 | 2012 | 2011 | ||||||||
| (Dollars in Thousands) | ||||||||||
| Interest cost | $ | 529 | $ | 555 | $ | 589 | ||||
| Expected return on plan assets | (488) | (377) | (381) | |||||||
| Net amortization | 375 | 294 | 179 | |||||||
| Net periodic pension expense | $ | 416 | $ | 472 | $ | 387 | ||||
| 2011 | 2010 | 2009 | ||||||||||
| Discount rate | 4.64 | % | 5.25 | % | 5.75 | % | ||||||
| Rate of compensation increase | N/A | N/A | N/A | |||||||||
| Expected long-term rate of return on plan assets | 5.50 | % | 6.25 | % | 5.00 | % | ||||||
| 2013 | 2012 | 2011 | ||||||||||
| Discount rate | 4.84 | % | 4.03 | % | 4.64 | % | ||||||
| Rate of compensation increase | N/A | N/A | N/A | |||||||||
| Expected long-term rate of return on plan assets | 5.50 | % | 5.50 | % | 5.50 | % | ||||||
| 2011 | 2010 | 2009 | ||||||||||
| (Dollars in Thousands) | ||||||||||||
| Information for Plans With a Benefit Obligation in Excess of Plan Assets | ||||||||||||
| Weighted average assumptions used to determine net periodic benefit cost for years ended December 31 | ||||||||||||
| Discount rate | 5.25 | % | 5.75 | % | 6.25 | % | ||||||
| Expected long-term return on plan assets | 5.50 | % | 6.25 | % | 5.00 | % | ||||||
| Rate of compensation increase | N/A | N/A | N/A | |||||||||
| 2013 | 2012 | 2011 | |||||||
| (Dollars in Thousands) | |||||||||
| Weighted average assumptions used to determine net periodic benefit cost for years ended December 31 | |||||||||
| Discount rate | 4.03 | % | 4.64 | % | 5.25 | % | |||
| Expected long-term return on plan assets | 5.50 | % | 5.50 | % | 5.50 | % | |||
| Rate of compensation increase | N/A | N/A | N/A | ||||||
| Asset Category | 2011 | 2010 | 2009 | |||||||||
| Equity securities | 47 | % | 44 | % | 44 | % | ||||||
| Debt and/or fixed income securities | 41 | % | 37 | % | 46 | % | ||||||
| Alternative investments, including commodities, foreign currency and real estate | 4 | % | — | % | 5 | % | ||||||
| Cash and other alternative investments, including hedge funds, equity structured notes | 8 | % | 19 | % | 5 | % | ||||||
| Total | 100 | % | 100 | % | 100 | % | ||||||
Asset Category 2013 2012 2011 Equity securities (domestic and international) 53 % 60 % 47 % Debt and/or fixed income securities 39 % 39 % 41 % Alternative investments, including commodities, foreign currency and real estate — % 1 % 4 % Cash and other alternative investments, including hedge funds, equity structured notes 8 % — % 8 % Total 100 % 100 % 100 %
| F-45 | ||
| Range | Target | ||||||||
| Equity securities | % | % | |||||||
| Debt and/or fixed income securities | % | % | |||||||
| International equity | % | % | |||||||
| Short term | N/A | N/A | |||||||
| Other | |||||||||
| December 31, 2011 | Fair Value Measurements at Reporting Date Using | |||||||||||||||
| Quoted Prices in Active Markets for Identical Assets (Level 1) | Significant Other Observable Inputs (Level 2) | Significant Unobservable Inputs (Level 3) | ||||||||||||||
| (Dollars in Thousands) | ||||||||||||||||
| Cash | $ | 512 | $ | 512 | $ | — | $ | — | ||||||||
| Equity securities: | ||||||||||||||||
| U.S. companies | 1,788 | 1,788 | — | — | ||||||||||||
| International companies | 1,405 | 1,405 | — | — | ||||||||||||
| U.S. Treasury securities | 2,798 | 2,798 | — | — | ||||||||||||
| Commodities | 259 | 259 | — | — | ||||||||||||
| Total | $ | 6,762 | $ | 6,762 | $ | — | $ | — | ||||||||
| December 31, 2010 | Fair Value Measurements at Reporting Date Using | |||||||||||||||
| Quoted Prices in Active Markets for Identical Assets (Level 1) | Significant Other Observable Inputs (Level 2) | Significant Unobservable Inputs (Level 3) | ||||||||||||||
| (Dollars in Thousands) | ||||||||||||||||
| Cash | $ | 1,379 | $ | 1,379 | $ | — | $ | — | ||||||||
| Equity Securities: | ||||||||||||||||
| U.S. companies | 1,522 | 1,522 | — | — | ||||||||||||
| International companies | 1,534 | 1,534 | — | — | ||||||||||||
| U.S. Treasury securities | 2,378 | 2,378 | — | — | ||||||||||||
| Corporate bonds | 180 | 180 | — | — | ||||||||||||
| Total | $ | 6,993 | $ | 6,993 | $ | — | $ | — | ||||||||
December 31,
2013 Fair Value Measurements at Reporting Date Using Quoted Prices
in Active
Markets for
Identical Assets
(Level 1) Significant
Other
Observable
Inputs
(Level 2) Significant
Unobservable
Inputs
(Level 3) (Dollars in Thousands) Cash $ 865 $ 865 $ — $ — Equity securities: U.S. companies 4,310 4,310 — — International
companies 1,495 1,495 — — Debt and/or fixed
income securities 4,356 4,356 — — Total $ 11,026 $ 11,026 $ — $ —
2013
in Active
Markets for
Identical Assets
(Level 1)
Other
Observable
Inputs
(Level 2)
Unobservable
Inputs
(Level 3)
companies
income securities
| December 31, 2012 | Fair Value Measurements at Reporting Date Using | ||||||||||||
| Quoted Prices in Active Markets for Identical Assets (Level 1) | Significant Other Observable Inputs (Level 2) | Significant Unobservable Inputs (Level 3) | |||||||||||
| (Dollars in Thousands) | |||||||||||||
| Cash | $ | 42 | $ | 42 | $ | — | $ | — | |||||
| Equity securities: | |||||||||||||
| U.S. companies | 3,154 | 3,154 | — | — | |||||||||
| International companies | 1,051 | 1,051 | — | — | |||||||||
| Debt and/or fixed income securities | 2,787 | 2,787 | — | — | |||||||||
| Total | $ | 7,034 | $ | 7,034 | $ | — | $ | — | |||||
| F-46 | ||
The following table presents the changes in pension plan asset with significant unobservable inputs (Level 3) for the year ended December 31:
| 2011 | 2010 | |||||||
| (Dollars in Thousands) | ||||||||
| Beginning balance, January 1, | $ | — | $ | 331 | ||||
| Actual return on plan assets: | ||||||||
| Relating to assets still held at the reporting date | — | — | ||||||
| Relating to assets sold during the period | — | 8 | ||||||
| Purchases, sales and settlements | — | (339 | ) | |||||
| Transfers out of Level 3 | — | — | ||||||
| Ending balance, December 31, | $ | — | $ | — | ||||
2014.
The relief was available for any two Plan Years 2008 through 2011.
2013 Plan Year.
$3,882,812.
| F-47 | ||
CENTER BANCORP, INC. AND SUBSIDIARIES
NOTES TO CONSOLIDATED FINANCIAL STATEMENTS
Note 16 — Stock Based Compensation – (continued)
defined under the Internal Revenue Code, non-qualified stock options, restricted stock awards and restricted stock unit awards to employees, including officers, and consultants of the Corporation and its subsidiaries. The 2003 Non-Employee Director Stock Option Plan permits the grant of non-qualified stock options to the Corporation’s non-employee directors. An aggregate of 394,417363,081 shares remain available for grant under the 2009 Equity Incentive Plan and an aggregate of 431,003406,527 shares remain available for grant under the 2003 Non-Employee Director Stock Option Plan. Such shares may be treasury shares, newly issued shares or a combination thereof.
Options covering 27,784, 38,203granted on August 27 and 38,203March 1, 2013, while27,784 and27,784 shares were granted on March 1, 2011, March 1, 20102012 and March 1, 2009,2011, respectively. The fair value of share-based payment awards was estimated using the Black-Scholes option pricing model with the following assumptions and weighted average fair values:
| 2011 | 2010 | 2009 | ||||||||||
| Weighted average fair value of grants | $ | 1.89 | $ | 2.16 | $ | 1.48 | ||||||
| Risk-free interest rate | 2.19 | % | 2.29 | % | 1.90 | % | ||||||
| Dividend yield | 1.32 | % | 1.41 | % | 4.69 | % | ||||||
| Expected volatility | 22.25 | % | 28.60 | % | 33.00 | % | ||||||
| Expected life in months | 65 | 62 | 69 | |||||||||
2013 2012 2011 Weighted average fair value of grants $ 2.50 – 5.87 $ 2.03 $ 1.89 Risk-free interest rate 1.86 – 2.29 % 2.03 % 2.19 % Dividend yield 1.76 – 2.11 % 1.24 % 1.32 % Expected volatility 23.21 – 33.74 % 22.04 % 22.25 % Expected life in months 69 – 90 68 65
| F-48 | ||
| Shares | Weighted- Average Exercise Price | Weighted- Average Remaining Contractual Term (In Years) | Aggregate Intrinsic Value | |||||||||||||
| Outstanding at December 31, 2010 | 198,946 | $ | 9.75 | |||||||||||||
| Granted | 27,784 | 9.11 | ||||||||||||||
| Exercised | (42,495 | ) | 7.23 | |||||||||||||
| Forfeited/cancelled/expired | (12,857 | ) | 11.75 | |||||||||||||
| Outstanding at December 31, 2011 | 171,378 | $ | 10.01 | 5.93 | $ | 111,309 | ||||||||||
| Exercisable at December 31, 2011 | 105,388 | $ | 10.75 | 4.48 | $ | 41,611 | ||||||||||
| Shares | Weighted- Average Exercise Price | Weighted- Average Remaining Contractual Term (In Years) | Aggregate Intrinsic Value | ||||||||||
| Outstanding at December 31, 2012 | 183,574 | $ | 10.04 | ||||||||||
| Granted | 41,639 | 12.95 | |||||||||||
| Exercised | (2,268) | 9.14 | |||||||||||
| Forfeited/cancelled/expired | (34,565) | 10.81 | |||||||||||
| Outstanding at December 31, 2013 | 188,380 | $ | 10.55 | 5.99 | $ | 1,546,129 | |||||||
| Exercisable at December 31, 2013 | 113,751 | $ | 10.14 | 4.40 | $ | 980,102 | |||||||
| Stock Option Plan | Shares | Exercise Price Range per Share | ||||||
| Outstanding, December 31, 2008 (125,468 shares exercisable) | 185,164 | $6.07 to $15.73 | ||||||
| Granted during 2009 | 38,203 | $ | 7.67 | |||||
| Exercised during 2009 | (9,289 | ) | $ | 6.07 | ||||
| Expired or canceled during 2009 | (22,076 | ) | $6.07 to $15.73 | |||||
| Outstanding, December 31, 2009 (124,271 shares exercisable) | 192,002 | $7.67 to $15.73 | ||||||
| Granted during 2010 | 38,203 | $ | 8.53 | |||||
| Exercised during 2010 | 0 | $ | 0.00 | |||||
| Expired or canceled during 2010 | (31,259 | ) | $7.67 to $15.73 | |||||
| Outstanding, December 31, 2010 (138,898) shares exercisable) | 198,946 | $7.67 to $15.73 | ||||||
| Granted during 2011 | 27,784 | $ | 9.11 | |||||
| Exercised during 2011 | (42,495 | ) | $ | 7.71 | ||||
| Expired or canceled during 2011 | (12,857 | ) | $ | 10.50 to $15.73 | ||||
| Outstanding, December 31, 2011 (105,388) shares exercisable) | 171,378 | $7.67 to $15.73 | ||||||
| Stock Option Plan | Shares | Exercise Price Range per Share | |||||
| Outstanding, December 31, 2010 (138,898 shares exercisable) | 198,946 | $7.67 to $15.73 | |||||
| Granted during 2011 | 27,784 | $ | 9.11 | ||||
| Exercised during 2011 | (42,495) | $ | 7.71 | ||||
| Expired or canceled during 2011 | (12,857) | $ | 10.50 to $15.73 | ||||
| Outstanding, December 31, 2011 (105,388 shares exercisable) | 171,378 | $7.67 to $15.73 | |||||
| Granted during 2012 | 27,784 | $ | 9.64 | ||||
| Exercised during 2012 | (15,588) | $7.67 to $10.50 | |||||
| Expired or canceled during 2012 | — | $ | 0.00 | ||||
| Outstanding, December 31, 2012 (117,111 shares exercisable) | 183,574 | $7.67 to $15.73 | |||||
| Granted during 2013 | 41,639 | $ | 12.52 to $14.24 | ||||
| Exercised during 2013 | (2,268) | $7.67 to $10.66 | |||||
| Expired or canceled or forfeited during 2013 | (34,565) | $ | 7.67 to $15.73 | ||||
| Outstanding, December 31, 2013 (113,751 shares exercisable) | 188,380 | $7.67 to $15.73 | |||||
In addition, during 201310,382 stock options with a weighted average fair value of $5.87 were granted under the Employee Stock Incentive Plan.
| F-49 | ||
CENTER BANCORP, INC. AND SUBSIDIARIES
NOTES TO CONSOLIDATED FINANCIAL STATEMENTS
Note 17 — Dividends and Other Restrictions – (continued)
required if the total of dividends declared in a calendar year exceeds the total of the Bank’s net profits for that year combined with the retained profits for the two preceding years. The Office of the Comptroller of the Currency (the “OCC”) has determined that the Memorandum of Understanding (the “MOU”) that had previously been entered into by the Bank is no longer required and, accordingly, the OCC has terminated the MOU. Therefore, the Bank may declare dividends without prior approval of the OCC. At December 31, 2011,2013, approximately $22.3$45.1 million was available for payment of dividends based on the preceding guidelines.
Note 18
Level 1: Unadjusted quoted prices in active markets that are accessible at the measurement date for identical, unrestricted assets or liabilities. |
Level 2: Quoted prices for similar assets and liabilities in active markets, and inputs that are observable for the asset or liability, either directly or indirectly, for substantially the full term of the financial instrument. |
Level 3: Prices or valuation techniques that require inputs that are both significant to the fair value measurement and unobservable (for example, supported with little or no market activity). |
| F-50 | ||
2012:
| (a) | Quoted prices in active markets for similar TRUPS with insignificant adjustments for differences between the TRUPS that the Corporation holds and similar TRUPS. |
| (b) | Quoted prices in markets that are not active that represent current transactions for the same or similar TRUPS that do not require significant adjustment based on unobservable inputs. |
CENTER BANCORP, INC. AND SUBSIDIARIES
NOTES TO CONSOLIDATED FINANCIAL STATEMENTS
Note 18 — Fair Value Measurements and Fair Value of Financial Instruments – (continued)
observable prices for those transactions have stabilized over time, thus increasing the potential relevance of those observations. However, the Corporation’s threeone TRUPS at December 31, 2011 have2012 has been classified within Level 3 because the Corporation determined that significant adjustments using unobservable inputs are required to determine a true fair value at the measurement date.
| F-51 | ||
January 2013.
Level 1 investment securities are comprised of debt securities issued by the U.S. Treasury as quoted prices were available, unadjusted, for identical securities in active markets. If quoted prices were not available, fair values were estimated primarily by obtaining quoted prices for similar assets in active markets or through the use of pricing models. In cases where there may be limited or less transparent information provided by the Corporation’s third-party pricing service, fair value may be estimated by the use of secondary pricing services or through the use of non-binding third-party broker quotes.
| F-52 | ||
| F-53 | ||
| December 31, 2011 | Fair Value Measurements at Reporting Date Using | |||||||||||||||
| Quoted Prices in Active Markets for Identical Assets (Level 1) | Significant Other Observable Inputs (Level 2) | Significant Unobservable Inputs (Level 3) | ||||||||||||||
| (Dollars in Thousands) | ||||||||||||||||
| Financial Instruments Measured at Fair Value on a Recurring Basis: | ||||||||||||||||
| Federal agency obligations | $ | 24,969 | $ | 2,004 | $ | 22,965 | $ | — | ||||||||
| Residential mortgage pass-through securities | 115,364 | — | 115,364 | — | ||||||||||||
| Obligations of U.S. states and political subdivision | 69,173 | 397 | 68,776 | |||||||||||||
| Trust preferred securities | 16,187 | — | 15,971 | 216 | ||||||||||||
| Corporate bonds and notes | 173,117 | 2,000 | 171,117 | — | ||||||||||||
| Collateralized mortgage obligations | 1,899 | — | — | 1,899 | ||||||||||||
| Asset-backed securities | 7,653 | — | 7,653 | — | ||||||||||||
| Equity securities | 6,145 | 6,145 | — | — | ||||||||||||
| Securities available-for-sale | $ | 414,507 | $ | 10,546 | $ | 401,846 | $ | 2,115 | ||||||||
| December 31, 2010 | Fair Value Measurements at Reporting Date Using | |||||||||||||||
| Quoted Prices in Active Markets for Identical Assets (Level 1) | Significant Other Observable Inputs (Level 2) | Significant Unobservable Inputs (Level 3) | ||||||||||||||
| (Dollars in Thousands) | ||||||||||||||||
| Financial Instruments Measured at Fair Value on a Recurring Basis: | ||||||||||||||||
| U.S. Treasury and agency securities | $ | 6,995 | $ | 6,995 | $ | — | $ | — | ||||||||
| Federal agency obligations | 68,481 | — | 68,481 | — | ||||||||||||
| Mortgage backed securities | 177,733 | — | 177,733 | |||||||||||||
| Obligations of U.S. states and political subdivision | 37,225 | 16,936 | 20,289 | — | ||||||||||||
| Trust preferred securities | 18,731 | — | 18,589 | 142 | ||||||||||||
| Corporate bonds and notes | 61,434 | — | 61,434 | — | ||||||||||||
| Collateralized mortgage obligations | 2,728 | — | — | 2,728 | ||||||||||||
| Equity securities | 4,753 | 4,753 | — | — | ||||||||||||
| Securities available-for-sale | $ | 378,080 | $ | 28,684 | $ | 346,526 | $ | 2,870 | ||||||||
| December 31, 2013 | Fair Value Measurements at Reporting Date Using | ||||||||||||
| Quoted Prices in Active Markets for Identical Assets (Level 1) | Significant Other Observable Inputs (Level 2) | Significant Unobservable Inputs (Level 3) | |||||||||||
| (Dollars in Thousands) | |||||||||||||
| Financial Instruments Measured at Fair Value on a Recurring Basis: | |||||||||||||
| U.S. treasury and agency securities | $ | 13,519 | $ | 13,519 | $ | — | $ | — | |||||
| Federal agency obligations | 19,941 | — | 19,941 | — | |||||||||
| Residential mortgage pass-through securities | 48,874 | — | 48,874 | — | |||||||||
| Commercial mortgage pass- through securities | 6,991 | — | 6,991 | — | |||||||||
| Obligations of U.S. states and political subdivision | 31,460 | — | 31,460 | — | |||||||||
| Trust preferred securities | 19,403 | — | 19,403 | — | |||||||||
| Corporate bonds and notes | 158,630 | — | 158,630 | — | |||||||||
| Asset-backed securities | 15,979 | — | 15,979 | — | |||||||||
| Certificates of deposit | 2,262 | — | 2,262 | — | |||||||||
| Equity securities | 287 | 287 | — | — | |||||||||
| Other securities | 5,724 | 5,724 | — | — | |||||||||
| Securities available-for-sale | $ | 323,070 | $ | 19,530 | $ | 303,540 | $ | — | |||||
December 31,
2012 Fair Value Measurements at Reporting Date Using Quoted Prices
in Active
Markets for
Identical Assets
(Level 1) Significant
Other
Observable
Inputs
(Level 2) Significant
Unobservable
Inputs
(Level 3) (Dollars in Thousands) Financial Instruments Measured at Fair Value on a
Recurring Basis: U.S. treasury and agency securities $ 11,909 $ 11,909 $ — $ — Federal agency obligations 20,535 — 20,535 — Residential mortgage pass-
through securities 53,784 — 53,784 — Commercial mortgage pass-
through securities 9,969 — 9,969 — Obligations of U.S. states and
political subdivision 107,714 469 107,245 — Trust preferred securities 21,249 — 21,213 36 Corporate bonds and notes 237,405 — 237,405 — Collateralized mortgage
obligations 2,120 — 2,120 — Asset-backed securities 19,742 — 19,742 — Certificates of deposit 2,865 — 2,865 — Equity securities 325 325 — — Other securities 9,198 9,198 — — Securities available-for-sale $ 496,815 $ 21,901 $ 474,878 $ 36
2012
in Active
Markets for
Identical Assets
(Level 1)
Other
Observable
Inputs
(Level 2)
Unobservable
Inputs
(Level 3)
Recurring Basis:
through securities
through securities
political subdivision
obligations
| F-54 | ||
2012.
| 2011 | 2010 | |||||||
| (Dollars in Thousands) | ||||||||
| Beginning balance, January 1, | $ | 2,870 | $ | 2,349 | ||||
| Transfers into Level 3 | — | 8,197 | ||||||
| Transfers out of Level 3 | — | (5,174 | ) | |||||
| Principal interest deferrals | 118 | 118 | ||||||
| Principal paydown | (697 | ) | (1,083 | ) | ||||
| Total net losses included in net income | — | (3,000 | ) | |||||
| Total net unrealized (losses) gains | (176 | ) | 1,463 | |||||
| Ending balance, December 31, | $ | 2,115 | $ | 2,870 | ||||
2013 2012 (Dollars in Thousands) Beginning balance, January 1, $ 36 $ 2,115 Transfers out of Level 3 (260) (2,120) Principal interest deferrals 58 116 Principal paydown — (272) Total net losses included in net income (628) (68) Total net unrealized gains 794 265 Ending balance, December 31, $ — $ 36
Assets Measured at Fair Value on a Non-Recurring BasisThe Corporation may be required periodically to measure certain assets at fair value on a nonrecurring basis in accordance with GAAP. These adjustments to fair value usually result from the application of lower of cost or fair value accounting or impairment write-downs of individual assets. The Corporation primarily utilizedappraisal value less cost to sell and other unobservable market inputs to determine fair value of assets, and therefore, is classified as a Level 3 measurement. For assets measured at fair value on a non-recurring basis, the fair value measurements at December 31, 20112013 and 2012 are as follows: December 31,
2011 Fair Value Measurements at Reporting Date Using Quoted Prices
in Active
Markets for
Identical Assets
(Level 1) Significant
Other
Observable
Inputs
(Level 2) Significant
Unobservable
Inputs
(Level 3) (Dollars in Thousands) Assets Measured at Fair Value on a Non-Recurring Basis:
Impaired loans $ 10,740 $ — $ — $ 10,740
| 2013 | 2012 | ||||||
| (Dollars in Thousands) | |||||||
| Beginning balance, January 1, | $ | 36 | $ | 2,115 | |||
| Transfers out of Level 3 | (260) | (2,120) | |||||
| Principal interest deferrals | 58 | 116 | |||||
| Principal paydown | — | (272) | |||||
| Total net losses included in net income | (628) | (68) | |||||
| Total net unrealized gains | 794 | 265 | |||||
| Ending balance, December 31, | $ | — | $ | 36 | |||
| December 31, 2011 | Fair Value Measurements at Reporting Date Using | |||||||||||||||
| Quoted Prices in Active Markets for Identical Assets (Level 1) | Significant Other Observable Inputs (Level 2) | Significant Unobservable Inputs (Level 3) | ||||||||||||||
| (Dollars in Thousands) | ||||||||||||||||
| Assets Measured at Fair Value on a Non-Recurring Basis: | ||||||||||||||||
| Impaired loans | $ | 10,740 | $ | — | $ | — | $ | 10,740 | ||||||||
Impaired Loans | Valuation Techniques | Range of Unobservable Inputs | ||
| Residential | Appraisals of collateral value | Adjustment for age of comparable sales, generally a decline of 0-25% | ||
| Commercial | Discounted cash flow model | Discount rate from 0% to 6% | ||
| Commercial real estate | Appraisals of collateral value | Market capitalization rates between 8% to 12%. Market rental rates for similar properties | ||
| Construction | Appraisals of collateral value | Adjustment for age comparable sales. Generally a decline of 5% to no change | ||
Other Real Estate Owned | ||||
| Residential | Appraisals of collateral value | Adjustment for age of comparable sales, generally a decline of 0-25% and estimated selling costs of 6-8% | ||
| Commercial | Appraisals of collateral value | Adjustment for age of comparable sales, generally a decline of 15% to no change and estimated selling costs of 6-8% |
| December 31, 2010 | Fair Value Measurements at Reporting Date Using | |||||||||||||||||||
| Quoted Prices in Active Markets for Identical Assets (Level 1) | Significant Other Observable Inputs (Level 2) | Significant Unobservable Inputs (Level 3) | ||||||||||||||||||
| (Dollars in Thousands) | ||||||||||||||||||||
| Assets Measured at Fair Value on a Non-Recurring Basis: | ||||||||||||||||||||
| Impaired loans | $ | 4,895 | $ | — | $ | — | $ | 4,895 | ||||||||||||
At December 31, 2011 and 2010, impaired loans totaled $11,825,000 and $5,534,000, respectively. The amount of related valuation allowances was $1,085,000
| December 31, 2013 | Fair Value Measurements at Reporting Date Using | ||||||||||||
| Quoted Prices in Active Markets for Identical Assets (Level 1) | Significant Other Observable Inputs (Level 2) | Significant Unobservable Inputs (Level 3) | |||||||||||
| (Dollars in Thousands) | |||||||||||||
| Assets Measured at Fair Value on a Non-Recurring Basis: | |||||||||||||
| Impaired loans | $ | 4,601 | $ | — | $ | — | $ | 4,601 | |||||
| Other real estate owned | 220 | — | — | 220 | |||||||||
December 31,
2012 Fair Value Measurements at Reporting Date Using Quoted Prices
in Active
Markets for
Identical
Assets
(Level 1) Significant
Other
Observable
Inputs
(Level 2) Significant
Unobservable
Inputs
(Level 3) (Dollars in Thousands) Assets Measured at Fair Value
on a Non-Recurring Basis: Impaired loans $ 4,790 $ — $ — $ 4,790 Other real estate owned 1,300 — — 1,300
2012
in Active
Markets for
Identical
Assets
(Level 1)
Other
Observable
Inputs
(Level 2)
Unobservable
Inputs
(Level 3)
on a Non-Recurring Basis:
| F-55 | ||
2012:
Loans.
The value of an impaired loan is measured based upon the present value of expected future cash flows discounted at the loan’s effective interest rate, or the fair value of the collateral if the loan is collateral dependent. Smaller balance homogeneous loans that are collectively evaluated for impairment, such as residential mortgage loans and installment loans, are specifically excluded from the impaired loan portfolio. The Corporation’s impaired loans are primarily collateral dependent. Impaired loans are individually assessed to determine that each loan’s carrying value is not in excess of the fair value of the related collateral or the present value of the expected future cash flows.At December 31, 2013 and 2012, impaired loanswith related valuation allowance totaled $5,016,000 and $5,435,000, respectively. The amount of related valuation allowances was $415,000 at December 31, 2013 and $645,000 at December 31, 2012.
Owned.
Certain assets such asCENTER BANCORP, INC. AND SUBSIDIARIES
NOTES TO CONSOLIDATED FINANCIAL STATEMENTS
Note 18 — Fair Value Measurements and Fair Value of Financial Instruments – (continued)
Estimated fair values have been determined by the Corporation using the best available data and an estimation methodology suitable for each category of financial instruments. For those loans and deposits with floating interest rates, it is presumed that estimated fair values generally approximate the recorded book balances. The estimation methodologies used, the estimated fair values, and the recorded book balances at December 31, 2011 and 2010, were as follows:
| December 31, | ||||||||||||||||
| 2011 | 2010 | |||||||||||||||
| Carrying Amount | Fair Value | Carrying Amount | Fair Value | |||||||||||||
| (Dollars in Thousands) | ||||||||||||||||
| FINANCIAL ASSETS: | ||||||||||||||||
| Cash and cash equivalents | $ | 111,101 | $ | 111,101 | $ | 37,497 | $ | 37,497 | ||||||||
| Investment securities available-for-sale | 414,507 | 414,507 | 378,080 | 378,080 | ||||||||||||
| Investment securities held-to-maturity | 72,233 | 74,922 | — | — | ||||||||||||
| Net loans (including loans held for sale) | 746,408 | 752,252 | 699,577 | 706,309 | ||||||||||||
| Restricted investment in bank stocks | 9,233 | 9,233 | 9,596 | 9,596 | ||||||||||||
| Accrued interest receivable | 6,219 | 6,219 | 4,134 | 4,134 | ||||||||||||
| FINANCIAL LIABILITIES: | ||||||||||||||||
| Non-interest-bearing deposits | 167,164 | 167,164 | 144,210 | 144,210 | ||||||||||||
| Interest-bearing deposits | 954,251 | 928,777 | 716,122 | 716,887 | ||||||||||||
| Federal funds purchased, securities sold under agreement to repurchase and FHLB advances | 161,000 | 175,933 | 212,855 | 221,425 | ||||||||||||
| Subordinated debentures | 5,155 | 5,159 | 5,155 | 5,157 | ||||||||||||
| Accrued interest payable | 992 | 992 | 1,041 | 1,041 | ||||||||||||
Financial instruments actively traded in a secondary market have been valued using quoted available market prices. Cash and due from banks, interest-bearing time deposits in other banks, federal funds sold, and interest receivable are valued at book value, which approximates fair value. Financial liability instruments with stated maturities have been valued using a present value discounted cash flow analysis with a discount rate approximating current market for similar liabilities. Interest payable is valued at book value, which approximates fair value. Financial liability instruments with no stated maturities have an estimated fair value equal to both the amount payable on demand and the recorded book balance.
Investment Securities Held-to-Maturity.The fair value of the Corporation’s investment securities held-to-maturity was primarily measured using information from a third-party pricing service. Quoted prices in active markets were used whenever available. If quoted prices were not available, fair values were measured usingestimated primarily by obtaining quoted prices for similar assets in active markets or through the use of pricing modelsmodels. In cases where there may be limited or other valuation techniques such asless transparent information provided by the presentCorporation’s third-party pricing service, fair value may be estimated by the use of secondary pricing services or through the use of non-binding third-party broker quotes.
Loans held for sale are required to be measured at the lower of cost or fair value. Under FASB ASC 820-10-05, market value is to represent fair value. Management obtains quotes or bids on all or part of these loans directly from the purchasing financial institutions. There was $1,018,000 in loans held for sale at December 31, 2011 and $333,000 at December 31, 2010.
The net loan portfolio has been valued using a present value discounted cash flow. The discount rate used in these calculations is the current rateinterest rates at which similar loans would be made to borrowers with similar credit ratings and for the same remaining maturities,maturities. Loans were segregated by types such as commercial, residential and assumed prepayment risk.
| F-56 | ||
| Fair Value Measurements | ||||||||||||||||
| Carrying Amount | Fair Value | Quoted Prices in Active Markets for Identical Assets (Level 1) | Significant Other Observable Inputs (Level 2) | Significant Unobservable Inputs (Level 3) | ||||||||||||
| (in thousands) | ||||||||||||||||
| December 31, 2013 | ||||||||||||||||
| Financial assets | ||||||||||||||||
| Cash and due from banks | $ | 82,692 | $ | 82,692 | $ | 82,692 | $ | — | $ | — | ||||||
| Investment securities available-for-sale | 323,070 | 323,070 | 19,530 | 303,540 | — | |||||||||||
| Investment securities held-to-maturity | 215,286 | 210,958 | 27,037 | 164,940 | 18,981 | |||||||||||
| Restricted investment in bank stocks | 8,986 | 8,986 | — | 8,986 | — | |||||||||||
| Net loans | 950,610 | 948,606 | — | — | 948,606 | |||||||||||
| Accrued interest receivable | 6,802 | 6,802 | — | 4,136 | 2,666 | |||||||||||
| Financial liabilities | ||||||||||||||||
| Non interest-bearing deposits | 227,370 | 227,370 | — | 227,370 | — | |||||||||||
| Interest-bearing deposits | 1,114,635 | 1,115,781 | — | 1,115,781 | — | |||||||||||
| Long-term borrowings | 146,000 | 157,440 | — | 157,440 | — | |||||||||||
| Subordinated debentures | 5,155 | 5,143 | — | 5,143 | — | |||||||||||
| Accrued interest payable | 963 | 963 | — | 963 | — | |||||||||||
| December 31, 2012 | ||||||||||||||||
| Financial assets | ||||||||||||||||
| Cash and due from banks | $ | 104,134 | $ | 104,134 | $ | 104,134 | $ | — | $ | — | ||||||
| Interest bearing deposits with banks | 2,004 | 2,004 | 2,004 | — | — | |||||||||||
| Investment securities available-for-sale | 496,815 | 496,815 | 21,901 | 474,878 | 36 | |||||||||||
| Investment securities held-to-maturity | 58,064 | 62,431 | — | 53,247 | 9,184 | |||||||||||
| Restricted investment in bank stocks | 8,964 | 8,964 | — | 8,964 | — | |||||||||||
| Loans held for sale | 1,491 | 1,491 | 1,491 | — | — | |||||||||||
| Net loans | 879,435 | 897,030 | — | — | 897,030 | |||||||||||
| Accrued interest receivable | 6,849 | 6,849 | — | 4,465 | 2,384 | |||||||||||
| Financial liabilities | ||||||||||||||||
| Non interest-bearing deposits | 215,071 | 215,071 | — | 215,071 | — | |||||||||||
| Interest-bearing deposits | 1,091,851 | 1,092,822 | — | 1,092,822 | — | |||||||||||
| Long-term borrowings | 146,000 | 162,992 | — | 162,992 | — | |||||||||||
| Subordinated debentures | 5,155 | 5,046 | — | 5,046 | — | |||||||||||
| Accrued interest payable | 874 | 874 | — | 874 | — | |||||||||||
| F-57 | ||
Note 19
| F-58 | ||
| At December 31, | ||||||||
| 2011 | 2010 | |||||||
| (Dollars in Thousands) | ||||||||
| ASSETS | ||||||||
| Cash and cash equivalents | $ | 2,042 | $ | 4,299 | ||||
| Investment in subsidiaries | 139,107 | 122,129 | ||||||
| Securities available for sale | 419 | 432 | ||||||
| Other assets | 191 | 22 | ||||||
| Total assets | $ | 141,759 | $ | 126,882 | ||||
| LIABILITIES AND STOCKHOLDERS’ EQUITY | ||||||||
| Other liabilities | $ | 688 | $ | 460 | ||||
| Securities sold under repurchase agreement | — | 310 | ||||||
| Subordinated debentures | 5,155 | 5,155 | ||||||
| Stockholders’ equity | 135,916 | 120,957 | ||||||
| Total liabilities and stockholders’ equity | $ | 141,759 | $ | 126,882 | ||||
At December 31, 2013 2012 (Dollars in Thousands) ASSETS Cash and cash equivalents $ 285 $ 629 Investment in subsidiaries 173,658 165,351 Securities available for sale 442 543 Other assets 271 41 Total assets $ 174,656 $ 166,564 LIABILITIES AND STOCKHOLDERS’ EQUITY Other liabilities $ 917 $ 718 Subordinated debentures 5,155 5,155 Stockholders’ equity 168,584 160,691 Total liabilities and stockholders’ equity $ 174,656 $ 166,564
Condensed Statements of IncomeFor Years Ended December 31,201120102009(Dollars in Thousands)Income:
Dividend income from subsidiaries$785$500$2,474Other income783Net losses on available for sale securities—(97) (325) Management fees294290298Total Income1,0867012,450Expenses(615) (635) (604) Income before equity in undistributed earnings of subsidiaries471661,846Equity in undistributed earnings of subsidiaries13,4556,9381,925Net Income$13,926$7,004$3,771
For Years Ended December 31, 2013 2012 2011 (Dollars in Thousands) Income: Dividend income from subsidiaries $ 4,393 $ 2,079 $ 785 Other income 6 15 7 Net gains on available for sale securities 22 �� 26 — Management fees 353 409 294 Total Income 4,774 2,529 1,086 Expenses (765) (731) (615) Income before equity in undistributed earnings
of subsidiaries 4,009 1,798 471 Equity in undistributed earnings of subsidiaries 15,916 15,709 13,455 Net Income $ 19,925 $ 17,507 $ 13,926
| At December 31, | |||||||
| 2013 | 2012 | ||||||
| (Dollars in Thousands) | |||||||
| ASSETS | |||||||
| Cash and cash equivalents | $ | 285 | $ | 629 | |||
| Investment in subsidiaries | 173,658 | 165,351 | |||||
| Securities available for sale | 442 | 543 | |||||
| Other assets | 271 | 41 | |||||
| Total assets | $ | 174,656 | $ | 166,564 | |||
| LIABILITIES AND STOCKHOLDERS’ EQUITY | |||||||
| Other liabilities | $ | 917 | $ | 718 | |||
| Subordinated debentures | 5,155 | 5,155 | |||||
| Stockholders’ equity | 168,584 | 160,691 | |||||
| Total liabilities and stockholders’ equity | $ | 174,656 | $ | 166,564 | |||
For Years Ended December 31, 2013 2012 2011 (Dollars in Thousands) Income: Dividend income from subsidiaries $ 4,393 $ 2,079 $ 785 Other income 6 15 7 Net gains on available for sale securities 22 �� 26 — Management fees 353 409 294 Total Income 4,774 2,529 1,086 Expenses (765) (731) (615) Income before equity in undistributed earnings
of subsidiaries 4,009 1,798 471 Equity in undistributed earnings of subsidiaries 15,916 15,709 13,455 Net Income $ 19,925 $ 17,507 $ 13,926
of subsidiaries
| F-59 | ||
| Consolidated Subsidiaries | Parent | Consolidated Total | ||||||||
| (Dollars in Thousands) | ||||||||||
| For the year ended 2013: | ||||||||||
| Net income | $ | 19,925 | $ | — | $ | 19,925 | ||||
| Other comprehensive (loss) income, net of tax: | ||||||||||
| Net unrealized loss on investment securities | (8,073) | 79 | (7,994) | |||||||
| Actuarial gain | 387 | — | 387 | |||||||
| Total other comprehensive (loss) income | (7,686) | 79 | (7,607) | |||||||
| Total comprehensive income | $ | 12,239 | $ | 79 | $ | 12,318 | ||||
| For the year ended 2012: | ||||||||||
| Net income | $ | 17,507 | $ | — | $ | 17,507 | ||||
| Other comprehensive income, net of tax: | ||||||||||
| Net unrealized gain on investment securities | 10,935 | 41 | 10,976 | |||||||
| Actuarial loss | (467) | — | (467) | |||||||
| Total other comprehensive income | 10,468 | 41 | 10,509 | |||||||
| Total comprehensive income | $ | 27,975 | $ | 41 | $ | 28,016 | ||||
| For the year ended 2011: | ||||||||||
| Net income | $ | 13,926 | $ | — | $ | 13,926 | ||||
| Other comprehensive income, net of tax: | ||||||||||
| Net unrealized gain (loss) on investment securities | 3,301 | (7) | 3,294 | |||||||
| Actuarial loss | (1,065) | — | (1,065) | |||||||
| Total other comprehensive income (loss) | 2,236 | (7) | 2,229 | |||||||
| Total comprehensive income | $ | 16,162 | $ | (7) | $ | 16,155 | ||||
| For Years Ended December 31 | ||||||||||||
| 2011 | 2010 | 2009 | ||||||||||
| (Dollars in Thousands) | ||||||||||||
| Cash flows from operating activities: | ||||||||||||
| Net income | $ | 13,926 | $ | 7,004 | $ | 3,771 | ||||||
| Adjustments to reconcile net income to net cash provided by operating activities: | ||||||||||||
| Net losses on available for sale securities | — | 97 | 325 | |||||||||
| Equity in undistributed earnings of subsidiary | (13,455 | ) | (6,938 | ) | (1,925 | ) | ||||||
| Change in deferred tax asset | 3 | 224 | (111 | ) | ||||||||
| (Increase) decrease in other assets | (298 | ) | (44 | ) | 1,838 | |||||||
| Increase (decrease) in other liabilities | 220 | 70 | (844 | ) | ||||||||
| Stock based compensation | 35 | 51 | 77 | |||||||||
| Net cash provided by operating activities | 431 | 464 | 3,131 | |||||||||
| Cash flows from investing activities: | ||||||||||||
| Maturity of available-for-sale securities | — | 130 | 659 | |||||||||
| Investments in subsidiaries | (1,250 | ) | (8,000 | ) | (19,000 | ) | ||||||
| Net cash used in investing activities | (1,250 | ) | (7,870 | ) | (18,341 | ) | ||||||
| Cash flows from financing activities: | ||||||||||||
| Net decrease in borrowings | (310 | ) | (82 | ) | (411 | ) | ||||||
| Cash dividends on common stock | (1,955 | ) | (1,800 | ) | (3,166 | ) | ||||||
| Cash dividends on preferred stock | (417 | ) | (500 | ) | (425 | ) | ||||||
| Proceeds from issuance of Series B preferred stock | 11,250 | — | — | |||||||||
| Redemption of Series A preferred stock | (10,000 | ) | — | — | ||||||||
| Warrant repurchased | (245 | ) | — | — | ||||||||
| Issuance cost of common stock | (5 | ) | (6 | ) | (11 | ) | ||||||
| Issuance cost of Series B preferred stock | (84 | ) | — | — | ||||||||
| Proceeds from exercise of stock options | 328 | — | 57 | |||||||||
| Proceeds from restricted stock | — | 25 | — | |||||||||
| Proceeds from issuance of preferred stock and warrants | — | — | 10,000 | |||||||||
| Proceeds from issuance of shares from stock offerings | — | 12,148 | 11,000 | |||||||||
| Issuance cost of common stock from common stock offering | — | (770 | ) | |||||||||
| Tax (expense) from stock based compensation | — | 7 | (73 | ) | ||||||||
| Net cash (used in) provided by financing activities | (1,438 | ) | 9,022 | 16,971 | ||||||||
| Increase (decrease) in cash and cash equivalents | (2,257 | ) | 1,616 | 1,761 | ||||||||
| Cash and cash equivalents at beginning of year | 4,299 | 2,683 | 922 | |||||||||
| Cash and cash equivalents at the end of year | $ | 2,042 | $ | 4,299 | $ | 2,683 | ||||||
For Years Ended December 31 2013 2012 2011 (Dollars in Thousands) Cash flows from operating activities: Net income $ 19,925 $ 17,507 $ 13,926 Adjustments to reconcile net income to net cash
provided by operating activities: Net gains on available for sale securities (22) (26) — Equity in undistributed earnings of subsidiary (15,916) (15,709) (13,455) Change in deferred tax asset — — 3 (Increase) decrease in other assets (167) 563 (298) (Decrease) increase in other liabilities (276) (772) 220 Stock based compensation 59 39 35 Net cash provided by operating activities 3,603 1,602 431 Cash flows from investing activities: Proceeds from sales of available-for-sale securities 181 375 — Purchase of available-for-sale securities — (410) — Investments in subsidiaries — — (1,250) Net cash provided by (used in) investing activities 181 (35) (1,250) Cash flows from financing activities: Net decrease in borrowings — — (310) Cash dividends on common stock (4,254) (2,778) (1,955) Cash dividends on preferred stock (141) (363) (417) Proceeds from issuance of Series B preferred stock — — 11,250 Redemption of Series A preferred stock — — (10,000) Warrant repurchased — — (245) Issuance of restricted stock award 243 — — Issuance cost of common stock (13) (8) (5) Issuance cost of Series B preferred stock — — (84) Proceeds from exercise of stock options 21 141 328 Tax expense from stock based compensation 16 28 — Net cash used in financing activities (4,128) (2,980) (1,438) Decrease in cash and cash equivalents (344) (1,413) (2,257) Cash and cash equivalents at beginning of year 629 2,042 4,299 Cash and cash equivalents at the end of year $ 285 $ 629 $ 2,042
provided by operating activities:
| F-60 | ||
| 2011 | ||||||||||||||||
| 4th Quarter | 3rd Quarter | 2nd Quarter | 1st Quarter | |||||||||||||
| (Dollars in Thousands, Except per Share Data) | ||||||||||||||||
| Total interest income | $ | 13,263 | $ | 12,919 | $ | 12,878 | $ | 12,867 | ||||||||
| Total interest expense | 3,101 | 3,069 | 3,085 | 2,922 | ||||||||||||
| Net interest income | 10,162 | 9,850 | 9,793 | 9,945 | ||||||||||||
| Provision for loan losses | 300 | 1,020 | 250 | 878 | ||||||||||||
| Total other income, net of securities gains | 1,049 | 1,033 | 931 | 831 | ||||||||||||
| Net securities gains | 817 | 1,250 | 801 | 766 | ||||||||||||
| Other expense | 6,222 | 5,529 | 5,757 | 5,935 | ||||||||||||
| Income before income taxes | 5,506 | 5,584 | 5,518 | 4,729 | ||||||||||||
| Provision from income taxes | 1,884 | 1,882 | 1,934 | 1,711 | ||||||||||||
| Net income | $ | 3,622 | $ | 3,702 | $ | 3,584 | $ | 3,018 | ||||||||
| Net income available to common stockholders | $ | 3,238 | $ | 3,557 | $ | 3,439 | $ | 2,872 | ||||||||
| Earnings per share: | ||||||||||||||||
| Basic | $ | 0.20 | $ | 0.22 | $ | 0.21 | $ | 0.18 | ||||||||
| Diluted | $ | 0.20 | $ | 0.22 | $ | 0.21 | $ | 0.18 | ||||||||
| Weighted average common shares outstanding: | ||||||||||||||||
| Basic | 16,311,193 | 16,290,700 | 16,290,700 | 16,290,391 | ||||||||||||
| Diluted | 16,327,990 | 16,313,366 | 16,315,667 | 16,300,604 | ||||||||||||
| 2010 | 2013 | ||||||||||||||||||||||||||||
| 4th Quarter | 3rd Quarter | 2nd Quarter | 1st Quarter | 4th Quarter | 3rd Quarter | 2nd Quarter | 1st Quarter | ||||||||||||||||||||||
| (Dollars in Thousands, Except per Share Data) | (Dollars in Thousands, Except per Share Data) | ||||||||||||||||||||||||||||
| Total interest income | $ | 11,519 | $ | 12,035 | $ | 12,488 | $ | 12,672 | $ | 14,644 | $ | 14,541 | $ | 13,979 | $ | 14,104 | |||||||||||||
| Total interest expense | 3,138 | 3,653 | 3,831 | 4,163 | 2,778 | 2,819 | 2,751 | 2,734 | |||||||||||||||||||||
| Net interest income | 8,381 | 8,382 | 8,657 | 8,509 | 11,866 | 11,722 | 11,228 | 11,370 | |||||||||||||||||||||
| Provision for loan losses | 2,048 | 1,307 | 781 | 940 | 350 | — | — | — | |||||||||||||||||||||
| Total other income, net of securities gains | 989 | 1,102 | 825 | 895 | 1,307 | 1,200 | 1,107 | 1,526 | |||||||||||||||||||||
| Net securities gains (losses) | 315 | 1,033 | 657 | (3,344 | ) | ||||||||||||||||||||||||
| Net securities gains | 449 | 343 | 600 | 319 | |||||||||||||||||||||||||
| Other expense | 5,997 | 5,442 | 6,268 | 6,392 | 6,459 | 6,205 | 6,076 | 6,538 | |||||||||||||||||||||
| Income (loss) before income taxes | 1,640 | 3,768 | 3,090 | (1,272 | ) | ||||||||||||||||||||||||
| Provision (Benefit) from income taxes | (930 | ) | 1,629 | 1,076 | (1,553 | ) | |||||||||||||||||||||||
| Income before income taxes | 6,813 | 7,060 | 6,859 | 6,677 | |||||||||||||||||||||||||
| Provision from income taxes | 1,829 | 1,966 | 1,936 | 1,753 | |||||||||||||||||||||||||
| Net income | $ | 2,570 | $ | 2,139 | $ | 2,014 | $ | 281 | $ | 4,984 | $ | 5,094 | $ | 4,923 | $ | 4,924 | |||||||||||||
| Net income available to common stockholders | $ | 2,426 | $ | 1,993 | $ | 1,868 | $ | 136 | $ | 4,955 | $ | 5,066 | $ | 4,895 | $ | 4,868 | |||||||||||||
| Earnings per share: | |||||||||||||||||||||||||||||
| Basic | $ | 0.15 | $ | 0.14 | $ | 0.13 | $ | 0.01 | $ | 0.30 | $ | 0.31 | $ | 0.30 | $ | 0.30 | |||||||||||||
| Diluted | $ | 0.15 | $ | 0.14 | $ | 0.13 | $ | 0.01 | $ | 0.30 | $ | 0.31 | $ | 0.30 | $ | 0.30 | |||||||||||||
| Weighted average common shares outstanding: | |||||||||||||||||||||||||||||
| Basic | 16,289,832 | 14,649,397 | 14,574,832 | 14,574,832 | 16,350,183 | 16,349,480 | 16,348,915 | 16,348,215 | |||||||||||||||||||||
| Diluted | 16,290,071 | 14,649,397 | 14,576,223 | 14,579,871 | 16,396,931 | 16,385,155 | 16,375,774 | 16,373,588 | |||||||||||||||||||||