| Item | Description | Page | ||
| Special Note Regarding Forward-Looking Statements | 2 | |||
| PART I | ||||
| 1 | Business | 4 | ||
| 1A | Risk Factors | 9 | ||
| 1B | Unresolved Staff Comments | 21 | ||
| 2 | Properties | 21 | ||
| 3 | Legal Proceedings | 21 | ||
| 4 | Mine Safety Disclosures | 21 | ||
| Executive Officers of the Registrant | 21 | |||
| PART II | ||||
| 5 | Market for the Registrant’s Common Equity, Related Stockholder Matters and Issuer Purchases of Equity Securities | 23 | ||
| 6 | Selected Financial Data | 25 | ||
| 7 | Management’s Discussion and Analysis of Financial Condition and Results of Operations | 26 | ||
| 7A | Quantitative and Qualitative Disclosures About Market Risk | 41 | ||
| 8 | Financial Statements and Supplementary Data | �� | 43 | |
| 9 | Changes in and Disagreements with Accountants on Accounting and Financial Disclosure | 89 | ||
| 9A | Controls and Procedures | 89 | ||
| 9B | Other Information | 90 | ||
| PART III | ||||
| 10 | Directors, Executive Officers and Corporate Governance | 90 | ||
| 11 | Executive Compensation | 91 | ||
| 12 | Security Ownership of Certain Beneficial Owners and Management and Related Stockholder Matters | 91 | ||
| 13 | Certain Relationships and Related Transactions, and Director Independence | 91 | ||
| 14 | Principal Accounting Fees and Services | 91 | ||
| PART IV | ||||
| 15 | Exhibits and Financial Statement Schedules | 91 | ||
| Signatures | 92 | |||
| Exhibit Index | 94 |
| Item | Description | Page |
| Special Note Regarding Forward-Looking Statements | ||
| Part I | ||
| 1 | Business | |
| 1A | Risk Factors | |
| 1B | Unresolved Staff Comments | |
| 2 | Properties | |
| 3 | Legal Proceedings | |
| 4 | Mine Safety Disclosures | |
| Executive Officers of the Registrant | ||
| Part II | ||
| 5 | Market for the Registrant’s Common Equity, Related Stockholder Matters and Issuer Purchases of Equity Securities | |
| 6 | Selected Financial Data | |
| 7 | Management’s Discussion and Analysis of Financial Condition and Results of Operations | |
| 7A | Quantitative and Qualitative Disclosures About Market Risk | |
| 8 | Financial Statements and Supplementary Data | |
| 9 | Changes in and Disagreements with Accountants on Accounting and Financial Disclosure | |
| 9A | Controls and Procedures | |
| 9B | Other Information | |
| Part III | ||
| 10 | Directors, Executive Officers and Corporate Governance | |
| 11 | Executive Compensation | |
| 12 | Security Ownership of Certain Beneficial Owners and Management and Related Stockholder Matters | |
| 13 | Certain Relationships and Related Transactions, and Director Independence | |
| 14 | Principal Accountant Fees and Services | |
| Part IV | ||
| 15 | Exhibits and Financial Statement Schedules | |
| Signatures | ||
| Exhibit Index | ||
Upon the closing of the Charter Acquisition, we changed the composition of our reportable segments to reflect the changes in our internal organization resulting from the integration of the acquired businesses.
Total Lubrication Management
We sell lubrication equipment globally, and provide reliability services primarily in North and South America.
2015
is expected to be filled within the current fiscal year.| December 31, | ||||||||||||
| 2012 | 2011 | 2010 | ||||||||||
| North America | 2,805 | 728 | 638 | |||||||||
| Europe | 6,107 | 1,232 | 1,260 | |||||||||
| Asia and Middle East | 4,397 | 251 | 262 | |||||||||
| Central and South America | 2,424 | — | — | |||||||||
| Other | 553 | — | — | |||||||||
| Total associates | 16,286 | 2,211 | 2,160 | |||||||||
| December 31, | ||||||||
| 2015 | 2014 | 2013 | ||||||
| North America | 3,451 | 3,340 | 2,667 | |||||
| Europe | 5,969 | 6,415 | 6,761 | |||||
| Asia and Middle East | 4,131 | 4,696 | 4,722 | |||||
| Central and South America | 2,991 | 3,255 | 2,963 | |||||
| Other | 545 | 645 | 646 | |||||
| Total associates | 17,087 | 18,351 | 17,759 | |||||
Government Contracts
Sales to U.S. government defense agencies and government contractors constituted approximately 1% of our revenue in 2012. We are subject to business and cost accounting regulations associated with our U.S. government defense contracts. Violations can result in civil, criminal or administrative proceedings involving fines, compensatory and treble damages, restitution, forfeitures, and suspension or debarment from U.S. government defense contracts.
Colfax's
In particular, a decline in our stock price has and may continue to make debt or equity financing more challenging to obtain. This may inhibit our ability to acquire new businesses in the future.
Our international operations are subject to the laws and regulations of the U.S. and many foreign countries. Failure to comply with these laws may affect our ability to conduct business in certain countries and may affect our financial performance.
We are subject to a variety of laws regarding our international operations, including the U.S. Foreign Corrupt Practices Act and the U.K Bribery Act of 2010, and regulations issued by U.S. Customs and Border Protection, the U.S. Bureau of Industry and Security, the U.S. Treasury Department’s Office of Foreign Assets Control (“OFAC”) and various foreign governmental agencies. We cannot predict the nature, scope or effect of future regulatory requirements to which our international sales and manufacturing operations might be subject or the manner in which existing laws might be administered or interpreted. Future regulations could limit the countries in which some of our products may be manufactured or sold, or could restrict our access to, and increase the cost of obtaining, products from foreign sources. In addition, actual or alleged violations of these laws could result in enforcement actions and financial penalties that could result in substantial costs. The occurrence of any of the foregoing could have a material adverse effect on our business, financial condition and results of operations.
these sanctionsvarious sanction and embargoesembargo laws may result in enforcement or other regulatory actions.these sanctionsvarious sanction and embargoesembargo laws to which we and our operations may be subject may result in enforcement or other regulatory actions. Specifically, from time to time, certain of our independent foreign subsidiaries sell products to companies and entities located in, or controlled by the governments of, certain countries that are or have previously been subject to sanctions and embargoes imposed by the U.S. government, and/United Nations or the United Nations. In March 2010, our Board of Directors affirmatively prohibited any new sales to Iran by us and all of our foreign subsidiaries.other countries where we maintain operations. With the exception of the U.S. sanctions against Cuba, and Iran, the applicable sanctions and embargoes generally do not prohibit our foreign subsidiaries from selling non-U.S.-origin products and services to countries that are or have previously been subject to sanctions and embargoes. However, our U.S. personnel, each of our domestic subsidiaries, as well as our employees of foreign subsidiaries who are U.S. citizens, are prohibited from participating in, approving or otherwise facilitating any aspect of the business activities in those countries, including Syria. These constraints impose compliance cost and risk on our operations and may negatively affect the financial or operating performance of such business activities.laws and embargoesembargo laws may not be effective, and as a consequence we may face enforcement or other actions if our compliance efforts are not or are perceived as not being wholly effective. Actual or alleged violations of these laws could result inlead to substantial fines or other sanctions which could result in substantial costs. In addition, Syria, Iran and certain other sanctioned countries currently are identified by the U.S. State Department as state sponsors of terrorism, and recently have been subject to increasingly restrictive sanctions. Because certain of our independent foreign subsidiaries have contact with and transact limited business in certain U.S. sanctioned countries, including sales to enterprises controlled by agencies of the governments of such countries, our reputation may suffer due to our association with these countries, which may have a material adverse effect on the price of our shares.shares and our business, financial condition and results of operations. In addition, certain U.S. states and municipalities have enacted legislation regarding investments by pension funds and other retirement systems in companies that have business activities or contacts with countries that have been identified as state sponsors of terrorism and similar legislationshares.Oneshares and our business, financial condition and results of our foreign subsidiaries made a small number of sales from 2003 through 2007 totaling approximately $60,000 inoperations.aggregate to two customers in Cuba which may have been made in violation of regulations of OFAC. Cuba is also identified by the U.S. State Department as a state sponsor of terrorism. We have submitted a disclosure report to OFAC regarding these transactions. As a result of these sales, we may be subject to fines or other sanctions. Further, during the2012 fiscal year a few of our independently-operated foreign subsidiaries which we acquired in 2012 made the final shipments necessary to wind down four sales agreements involving parties identified in section 560.304 of title 31 of the Code of Federal Regulations, which transactions were conducted in accordance with applicable U.S. and E.U. economic sanctions, statutes and regulations in effect at that time. See Item 7. “Management’s Discussion and Analysis of Financial Condition and Results of Operations—Disclosure under Section 13(r)(1)(D)(iii) of the Exchange Act.”United StatesU.S. are subject to the U.S. Export Administration Regulations, administered by the U.S. Department of Commerce, Bureau of Industry and Security, which require that an export license is obtained before such products can be exported to certain countries. Additionally, some of our products are subject to the International Traffic in Arms Regulations, which restrict the export of certain military or intelligence-related items, technologies and services to non-U.S. persons. Failure to comply with these laws could harm our business by subjecting us to sanctions by the U.S. government, including substantial monetary penalties, denial of export privileges and debarment from U.S. government contracts. The occurrence of any of the foregoing could have a material and adverse effect on our business, financial condition and results of operations.2012,2015, we derived approximately 80%72% of our sales from operations outside of the U.S. and we have principal manufacturing facilities in 2029 non-U.S. countries. Sales from international operations, export sales and the use of manufacturing facilities outside of the U.S. by us are subject to risks inherent in doing business outside the U.S. These risks include:
In addition, under the 2015 Deutsche Bank Credit Agreement, we are required to satisfy and maintain compliance with a total leverage ratio and an interest coverage ratio. considered to be highly inflationary. Provisions in our governing documents and Delaware law, and the percentage of Common stock owned by our largest stockholders, may delay or prevent an acquisition of Colfax that may be beneficial to our stockholders. control or other strategic transaction concerning Colfax. Position Williams College. St. Louis University. 2013. However, we are currently in the midst of a sustained decline in commodity prices, including oil, which has had a negative impact on the levels of capital invested and maintenance expenditures by certain of our customers which in turn has reduced the demand for our products and services. Fluid Handling Bellingham, Washington. market. portfolio. challenging ventilation conditions. our fabrication technology segment and expanded our product portfolio into new applications. as a result of our acquisitions. international macroeconomic conditions. decrease in Net sales from existing businesses gas- and fluid-handling segments, respectively. Orders, net of cancellations, from existing businesses and general industrial and other end markets. 2013 primarily as a result of a $66.3 million increase due to acquisitions and the specific 2014 charges discussed previously. Year Ended December 31. 2012 The increase in Selling, general and administrative expense during 2014 was primarily due to an acquisition-related increase of $95.5 million and the foreign currency loss at our Venezuelan fabrication technology business discussed previously. lower gross profit margin at fabrication technology. Changes in foreign exchange rates during 2015 had a $169.0 million negative impact on Gross profit. profit. be met. Restructuring and other related charges increased 2013. Arrangements") during 2013. During 2013, $29.4 million of certain deferred fees and original issue discount were written-off in connection with the amendments which reduced future accretion to Interest expense and did not reoccur in 2014. Additionally, the favorable impact of lower borrowing rates reduced Interest expense by $13.7 million and the lesser accretion of deferred fees and original issue discount decreased Interest expense by $6.2 million, which were also attributable to the amendments in 2013. A reduction of $3.1 million is included in Interest expense due to the change in expected settlement under the conditions specified in the contract of the mandatorily redeemable non-voting preferred stock of Sicelub, as the performance criteria were not met. 2014. 2013. 99%. and other restrictions. Less Than One Year More Than 5 Years We do not enter into derivative contracts for trading purposes. $14.8 million. contracts were not material. Page 16, 2016 16, 2016 amounts (LOSS) INCOME amounts notedtointo the environment, such as soil or groundwater, we could be required to remediate such contamination, which could be costly. Moreover, noncompliance could subject us to private claims for property damage or personal injury based on exposure to hazardous materials or unsafe working conditions. In addition, changes in applicable requirements or stricter interpretation of existing requirements may result in costly compliance requirements or otherwise subject us to future liabilities. The occurrence of any of the foregoing could have a material adverse effect on our business, financial condition and results of operations.15 will limit our ability to engage in specified types of transactions. These covenants would limit our ability to, among other things:pay dividends on, repurchase or make distributions in respect of, the capital stock of Colfax and its wholly-owned subsidiaries;assets; andassets.enter into certain transactions with affiliates.TheLimitations imposed by the 2015 Deutsche Bank Credit Agreement'sAgreement’s various covenants and the additional leverage taken on by us could increase our vulnerability to general economic slowdowns which could have a materially adverse effect on our business, financial condition and results of operations.businessesan acquired declines,business decline, we could incur, under current applicable accounting rules, a non-cash charge to operating earnings for Goodwill impairment. Any determination requiring the write-off of a significant portion of unamortized intangible assets would adversely affect our business, financial condition, results of operations and total capitalization, the effect of which could be material.plan'splan’s funding position is affected by the investment performance of the plan'splan’s investments, changes in the fair value of the plan'splan’s assets, the type of investments, the life expectancy of the plan'splan’s members, changes in the actuarial assumptions used to value the plan'splan’s liabilities, changes in the rate of inflation and interest rates, our financial position, as well as other changes in economic conditions. Furthermore, since a significant proportion of the plans'plans’ assets are invested in publicly traded debt and equity securities, they are, and will be, affected by market risks. Any detrimental change in any of the above factors is likely to worsen the funding position of each of the relevant plans, and this is likely to require the plans'plans’ sponsoring employers to increase the contributions currently made to the plans to satisfy our obligations. Any requirement to increase the level of contributions currently made could have a material adverse effect on our business, financial condition and results of operations.2012,2015, approximately 80%72% of our sales were derived from operations outside the U.S. A significant portion of our revenues and income are denominated in foreign currencies. Large fluctuations in the rate of exchange between foreign currencies and the U.S. dollar could have a material adverse effect on our business, financial condition and results of operations. Changes in the currency exchange rates may impact the financial results positively or negatively in one period and not another, which may make it difficult to compare our operating results from different periods.U.SU.S. dollar as our functional currency for reporting purposes, we have manufacturing sites throughout the world and a substantial portion of our costs are incurred and sales are generated in foreign currencies. Costs incurred and sales recorded by subsidiaries operating outside of the U.S. are translated into U.S. dollars using exchange rates effective during the respective period. As a result, we are exposed to movements in the exchange rates of various currencies against the U.S. dollar. In particular,Further, we may be subject to foreign currency translation losses depending upon whether foreign nations devalue their currencies, movements in exchange rates between highly inflationary currencies and our reporting currency and the Company has more salesamount of monetary assets and liabilities included in Europeanthe balance sheets of our operations denominated in currencies than it has expenses in those currencies. Although a significant portion of this difference is hedged, when European currencies strengthen or weaken against the U.S. dollar, operating profits are increased or decreased, respectively.requirepurchase a substantial amountsamount of raw materials, and purchase parts and components from suppliers. The availability and prices for raw materials, parts and components may be subject to curtailment or change due to, among other things, suppliers'suppliers’ allocations to other purchasers, interruptions in production by suppliers, changes in exchange rates and prevailing price levels. Any significant change in the supply of, or price for, these raw materials, or parts andor components could materially affect our business, financial condition and results of operations. In addition, delays in delivery of componentsraw materials, parts or raw materialscomponents by suppliers could cause delays in our delivery of products to our customers.internet,Internet, to process, transmit and store electronic information, and to manage or support a variety of business processes and activities, including procurement, manufacturing, distribution, invoicing and collection. These technology networks and systems may be susceptible to damage, disruptions or shutdowns due to failures during the process of upgrading or replacing software, databases or components, power outages, hardware failures or computer viruses. In addition, we may be subject to cyber-based attacks and security breaches, which could result in unauthorized disclosure of confidential information or damage to our information technology networks and systems if our efforts to mitigate or otherwise contain any attacks or breaches are unsuccessful. If these information technology systems suffer severe damage, disruption or shutdown and business continuity plans do not effectively resolve the issues in a timely manner, our business, financial condition and results of operations could be materially adversely affected.1720122015 includes $396.5$186.9 million held in jurisdictions outside the U.S., which may be subject to U.S. income tax penaltiesif repatriated into the U.S. and other restrictions if repatriated intorestrictions. In addition, the U.S. and foreign countries have considered changes to existing tax laws, including allowing existing provisions to expire, that could significantly impact the treatment of income earned outside the U.S. An increase in our effective tax rate could have a material adverse effect on our after-tax results of operations.In connection the Charter Acquisition, we issued a total of 20,182,293 shares of Colfax Common stock to BDT CF Acquisition Vehicle, LLC (the “BDT Investor”), Mitchell P. Rales, Steven M. Rales, BDT CF Acquisition Vehicle, LLC, and Markel Corporation (collectively, the “Investors”) and 13,877,552 shares of Colfax Series A Preferred Stock, which are initially convertible into an additional 12,173,291 shares of Colfax Common stock, to the BDT Investor. Pursuant to registration rights agreements we entered into with the Investors in January 2012,, the Investors and their permitted transferees have registration rights for the resale of the shares of Colfax Common stock acquired as a result of the Charter Acquisition and, with respect to the BDT Investor, shares of Colfax Common stock issuable upon conversion of the Series A Preferred Stock. In April 2012, we filed a prospectus supplement under which the Investors may resell these shares. In addition, Mitchell P. Rales and Steven M. Rales have registration rights for the resale of certain shares of Colfax Common stock pursuant to a 2003 registration rights agreement, as amended.stock. These registration rights would facilitate the resale of such securities into the public market, and any such resale would increase the number of shares of Colfax Common stock available for public trading. Sales by the BDT Investor, Markel, Mitchell P. Rales or Steven M. RalesInvestors or their permitted transferees of a substantial number of shares of Colfax Common stock in the public market, or the perception that such sales might occur, could have a material adverse effect on the price of Colfax Common stock.In March 2012, we sold 9,000,000 shares of newly issued Common stock to underwriters for public resale pursuant to a shelf registration statement. Understock, which, if subsequentlystock. Furthermore, we may issue a significant number of additional shares, in connection with acquisitions or otherwise. We also may issue a significant number of additional shares, either through an existing shelf registration statement or through other mechanisms. Additional shares issued couldwould have a further dilutive effect on outstanding Colfax Common stock.Our Amended and Restated Certificate of Incorporation contains provisions that grant the BDT Investor certain rights which may limit our flexibility in operating our business and structuring our corporate governance.So long as the BDT Investor and its permitted transferees beneficially own, in the aggregate, at least 50% of the Series A Preferred Stock issued to the BDT Investor under the securities purchase agreement with the BDT Investor (the “BDT Purchase Agreement”), the BDT Investor's written consent is required in order for us to take certain corporate actions, including:the incurrence of certain indebtedness (excluding certain permitted indebtedness) if the ratio of such indebtedness to EBITDA (as defined in the Deutsche Bank Credit Agreement) exceeds certain specified ratios, measured by reference to the last twelve-month period for which financial information is reported by Colfax (pro forma for acquisitions during such period);the issuance of any shares of preferred stock;any change to our dividend policy or the declaration or payment of any dividend or distribution on any of our stock ranking subordinate or junior to the Series A Preferred Stock with respect to the payment of dividends and distributions (including the Colfax Common stock) under certain circumstances;any voluntary liquidation, dissolution or winding up of Colfax;any change in our independent auditor;the election of anyone other than Mr. Mitchell P. Rales as Chairman of our Board of Directors;any acquisition of another entity or assets for a purchase price exceeding 30% of our equity market capitalization;any merger, consolidation, reclassification, joint venture or strategic partnership or similar transaction, or any disposition of any assets (excluding sale/leaseback transactions and other financing transactions in the ordinary course of business) of Colfax if the value of the resulting entity, level of investment by Colfax or value of the assets disposed, as applicable, exceeds 30% of our equity market capitalization;any amendments to our organizational or governing documents, including the Amended and Restated Certificate of Incorporation and the Amended and Restated Bylaws; andany change in the size of our Board of Directors.The Amended and Restated Certificate of Incorporation also provides that, so long as the BDT Investor and certain permitted transferees beneficially own at least 10% of the Colfax Common stock (on a fully-diluted basis), the BDT Investor's written consent is required to alter, amend or repeal the provisions of the Amended and Restated Certificate of Incorporation which sets forth the authorized number of members of our Board and the BDT Investor's nomination rights in respect of members of our Board. The above factors could limit our financial and operational flexibility, and as a result could have a material adverse effect on our business, financial condition and results of operations.The BDT Investor may exercise significant influence over us, including through its ability to elect up to two members of our Board of Directors.The shares of Colfax Common stock and Series A Preferred Stock owned by the BDT Investor represent approximately 22% of the voting rights in respect of the Company's issued share capital. The Amended and Restated Certificate of Incorporation provides that the BDT Investor's consent is required before we may take certain actions for so long as the BDT Investor and its permitted transferees beneficially own in the aggregate at least 50% of the Series A Preferred Stock issued pursuant to the BDT Purchase Agreement (as discussed above). As a result, the BDT Investor may have the ability to significantly influence the outcome of any matter submitted for the vote of our stockholders. The BDT Investor may have interests that diverge from, or even conflict with, those of Colfax and our other stockholders.The Amended and Restated Certificate of Incorporation also provides that the BDT Investor will have the right to exclusively nominate (1) two out of eleven directors to our Board of Directors so long as the BDT Investor holds at least 20% of the outstanding Colfax Common stock (calculated on a fully diluted basis, assuming conversion of the Series A Preferred Stock at the then-existing conversion price), with one of its nominees to serve on the Audit Committee of our Board of Directors and one of its nominees to serve on the Compensation Committee of our Board of Directors, and (2) one out of ten directors to our Board of Directors so long as the BDT Investor and its permitted transferees beneficially own in the aggregate less than 20% but more than 10% of the outstanding Colfax Common stock (calculated on a fully diluted basis, assuming conversion of the Series A Preferred Stock at the then-existing conversion price), with such nominee to serve on the Audit Committee and the Compensation Committee of our Board of Directors. Further, so long as the BDT Investor and certain permitted transferees beneficially own at least 10% of the Colfax Common stock (calculated on a fully diluted basis, assuming conversion of the Series A Preferred Stock at the then-existing conversion price), the BDT Investor’s written consent is required to alter, amend or repeal the provisions of the Amended and Restated Certificate of Incorporation which sets forth the authorized number of members of our Board and the BDT Investor’s nomination rights in respect of members of our Board.In addition, the percentage of Colfax Common stock owned by the BDT Investor, Mitchell P. Rales and Steven M. Rales and the governance rights of the BDT Investor could discourage a third party from proposing a change of control or other strategic transaction concerning Colfax.which could decrease the value of its shares.third-partythird party to acquire us without the consent of our Board of Directors. These include provisions include prohibiting stockholders from taking action by written consent, prohibiting special meetings of stockholders called by stockholders, and prohibiting stockholder nominations and approvals without complying with specific advance notice requirements.requirements, and mandating certain procedural steps for stockholders who wish to introduce business or nominate a director candidate. In addition, our Board of Directors has the right to issue Preferred stock without stockholder approval, which our Board of Directors could use to effect a rights plan or “poison pill” that could dilute the stock ownership of a potential hostile acquirer and may have the effect of delaying, discouraging or preventing an acquisition of Colfax. Delaware law also imposes some restrictions on mergers and other business combinations between Colfax and any holder of 15% or more of its outstanding voting stock. AlthoughInvestor holds more than 20%Capital Partners, LLC and its affiliates could discourage a third party from proposing a change of our outstanding voting stock, this provision of Delaware law does not apply to it.Fulton,Annapolis Junction, Maryland in a facility that we lease. As of December 31, 2012,2015, our gas- and fluid-handling reportable segment had 79 principal production facilities in the U.S. representing approximately 760,000982,000 and 36,00038,000 square feet of owned and leased space, respectively, and 2947 principal production facilities in 1322 different countries in Asia, Europe, Central and South America,the Americas, Australia and South Africa.Africa, representing a total of 2.9 million and 0.7 million square feet of owned and leased space, respectively. Additionally, as of December 31, 2015, our fabrication technology operating segment hashad a total of 46 production facilities in the U.S., representing a total of 1.3 million and 0.4 million square feet of owned and leased space, and 2731 production facilities outside the U.S., representing a total of 8.17.5 million and 1.22.0 million square feet of owned and leased facilities,space, respectively, in over 1317 countries in Australia, Central and Eastern Europe, Central and South America and Asia.16,15, “Commitments and Contingencies,” in the Notes to the Consolidated Financial Statements.Name Age Steven E. SimmsMatthew L. Trerotola 5748 C. Scott Brannan 5457 Senior Vice President, Finance, Chief Financial Officer and Treasurer Clay H. KiefaberDaniel A. Pryor 5747 Executive Vice President, Chief Executive Officer, ESAB GlobalStrategy and Director, Colfax CorporationBusiness DevelopmentIan Brander 5154 Chief Executive Officer, Howden William E. Roller50Executive Vice President, Colfax Fluid HandlingLynn Clark 5558 Senior Vice President, Global Human Resources Daniel A. PryorDarryl Mayhorn 4451 Senior Vice President, StrategyPresident and Business DevelopmentCEO of Colfax Fluid HandlingA. Lynne Puckett 5053 Senior Vice President, General Counsel and Secretary Stephen J. Wittig 5053 Senior Vice President, Colfax Business System and Supply Chain Strategy Steven E. SimmsOfficer since April 2012. He has served as a Director of ColfaxOffice since July 2011.2015. Prior to joining Colfax, Mr. Simms also served as Chairman of the Board of Directors of Apex Tools and is a formerTrerotola was an Executive Vice President of Danaher Corporation. Mr. Simms held a variety of leadership roles during his 11-year career at Danaher. He became Executive Vice President in 2000 and served in that role through his retirement in 2007, during which time he was instrumental in Danaher’s international growth and success. He previously served as Vice President–Group Executive from 1998 to 2000 and as an executive in Danaher’s tools and components business from 1996 to 1998. Prior to joining Danaher, Mr. Simms held roles of increasing authority at Black & Decker Corporation, most notably President–European Operations and President–Worldwide Accessories. Mr. Simms started his career at the Quaker Oats Company where he held a number of brand management roles. He currently serves as a member of DuPont’s Office of the BoardChief Executive, responsible for DuPont’s Electronics & Communications and Safety & Protection segments. Mr. Trerotola also had corporate responsibility for DuPont’s Asia-Pacific business. Many of TrusteesMr. Trerotola’s roles at DuPont involved applying innovation to improve margins and accelerate organic growth in global businesses. Prior to rejoining DuPont in 2013, Mr. Trerotola had served in leadership roles at Danaher since 2007, and was most recently Vice President and Group Executive for Life Sciences. Previously, Mr. Trerotola was Group Executive for Product Identification from 2009 to 2012, and President of The Boys’ Latinthe Videojet business from 2007 to 2009. While at McKinsey & Company from 1995 to 1999, Mr. Trerotola focused primarily on helping industrial companies accelerate growth. Mr. Trerotola earned his M.B.A. from Harvard Business School and his B.S. in Chemical Engineering from the University of Maryland and is actively involved in a number of other educational and charitable organizations in the Baltimore area.
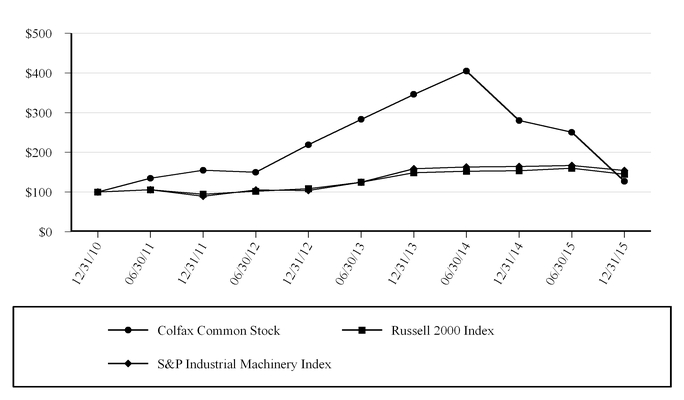
Virginia.21Clay H. KiefaberisChief Executive Officer ESAB GlobalStrategy and Business Development since July 2013. Mr. Pryor was Senior Vice President, Strategy and Business Development from January 2011 through July 2013. Prior to joining Colfax‚ he was a Partner and Managing Director of Colfax Corporation. Mr. Kiefaber haswith The Carlyle Group‚ a global alternative asset manager, where he focused on industrial leveraged buyouts and led numerous portfolio company and follow-on acquisitions. While at The Carlyle Group, he served on the Colfax Boardboards of Directors since the Company’s IPO in 2008portfolio companies Veyance Technologies, Inc., John Maneely Co., and was previously the President and Chief Executive Officer of Colfax from January 2010 through April 2012. Before joining Colfax‚HD Supply Inc. Prior to The Carlyle Group, he spent nearly 2011 years at Danaher Corporation in increasingly senior executive positions at Masco Corporation. Most recently‚ he was a Group President‚ where he was responsible for a $2.8 billion grouproles of architectural coatings‚ windows‚ and spa business units. Prior to becoming a Group President at Masco‚ Mr. Kiefaber was Groupincreasing responsibility‚ most recently as Vice President of Masco Builder Cabinet Group. He previously spent 14 years- Strategic Development. Mr. Pryor earned his M.B.A. from Harvard Business School and his B.A. in increasingly senior positions in Masco’s Merillat Industries subsidiary. Mr. Kiefaber holds an M.B.A. degreeEconomics from the University of Colorado and a B.A. degree from Miami University.William E. Roller has served as our Executive Vice President, Colfax Fluid Handling since November 2010. He most recently served as Executive Vice President‚ Colfax Americas and was responsible for Colfax’s business in the Americas as well as the global oil & gas and defense solutions organizations. He joined Colfax in 1999 as General Manager‚ Imo Pump. In addition to Imo Pump‚ he managed Zenith Pump‚ LSC and Baric Group upon the acquisition of those businesses. He joined Colfax from Precision Auto Care‚ Inc. where he was Senior Vice President of Manufacturing and Distribution for 2 years. From 1991 until 1997‚ Mr. Roller worked for AMF Industries in several increasingly responsible manufacturing roles. Previous to AMF‚ he spent 4 years with FMC Corporation in various manufacturing roles. Mr. Roller is a graduate of the Virginia Polytechnic Institute and State University‚ with a B.S. in Chemical Engineering and an M.B.A. from the University of Virginia Darden School.joined Colfax Corporation in 2013 ashas been the Senior Vice President, Global Human Resources.Resources since January 2013. Prior to joining Colfax, she served as senior vice president, global human resources for Mead Johnson Nutrition. Her experience includes extensive work at the board and operating levels, broad human resources leadership capabilities, talent management, organization design and development and M&A. Ms. Clark held roles of increasing responsibility in human resources at Bristol-Myers Squibb from 2001 to 2009, and wasprior to this, with Lucent Technologies and Allied Signal Corporation, leading executive development and then serving as human resources leader for headquarters functions between 1993 and 2001.Corporation. Prior to transferring intoher experience in human resources, she worked for 15 years in sales and marketing, most recently as a general manager for Drake Beam Morin – a global consulting firm in employee development, retention and transition – in Richmond, Virginia. Ms. Clark started her career as a career counselor at George Washington University in Washington, DC.marketing. Ms. Clark has a bachelor of science in education and a master of science in college student personnel from Bowling Green University in Ohio.Daniel A. Pryorserved as ourbeen the Senior Vice President‚ StrategyPresident, President and Business DevelopmentCEO of Colfax Fluid Handling since January 2011.July 2014. Prior to joining Colfax‚ heColfax, Mr. Mayhorn was a PartnerPresident of the Rexnord Aerospace Group from 2008 to 2014 and Managing Director with The Carlyle Group‚ awas previously the Chief Human Resources Officer of Rexnord Corporation. His professional career includes leadership roles at various global alternative asset manager,industrial companies, including Danaher Corporation and Eaton Corporation. Mr. Mayhorn is an alumnus of the University of Missouri, where he focused on industrial leveraged buyouts and led numerous portfolio company and follow-on acquisitions. While at The Carlyle Group, he served on the boardsearned a Bachelor of portfolio companies Veyance Technologies, Inc., John Maneely Co., and HD Supply Inc. Prior to The Carlyle Group‚ he spent 11 years at Danaher CorporationScience degree in roles of increasing responsibility‚ most recently as Vice President – Strategic Development. Mr. Pryor earned his M.B.A.Business Administration. He has a master’s degree in business administration from Harvard Business School and his B.A. in Economics from Williams College.22Item 5.Market for the Registrant’s Common Equity, Related Stockholder Matters and Issuer Purchases of Equity Securities4, 2013,2, 2016, there were approximately 18,91630,600 holders of record of our Common stock. The high and low sales prices per share of our Common stock, as reported on the New York Stock Exchange, for the fiscal periods presented are as follows: Year Ended December 31, 2012 2011 High Low High Low First Quarter $ 37.64 $ 27.61 $ 23.50 $ 17.79 Second Quarter $ 35.56 $ 26.01 $ 25.34 $ 20.46 Third Quarter $ 36.79 $ 24.43 $ 28.75 $ 20.10 Fourth Quarter $ 40.52 $ 33.14 $ 32.69 $ 17.90 Year Ended December 31, 2015 2014 High Low High Low First Quarter $ 53.59 $ 42.86 $ 72.56 $ 58.30 Second Quarter $ 53.17 $ 46.32 $ 75.37 $ 67.16 Third Quarter $ 46.92 $ 30.21 $ 75.26 $ 56.23 Fourth Quarter $ 32.23 $ 21.76 $ 58.63 $ 45.48 The Deutsche Bank Credit Agreement (as defined and further discussed in Item 7. “Management’s Discussion and Analysis of Financial Condition and Results of Operations—Liquidity and Capital Resources”) limits the amount of cash dividends and Common stock repurchases the Company may make to a total of $50 million annually.Index since the date of our initial public offering on May 8, 2008.Index. The graph assumes that $100 was invested on May 8, 2008December 31, 2010 in each of our Common stock, the Russell 2000 Index and the S&P Industrial Machinery Index, and that all dividends were reinvested.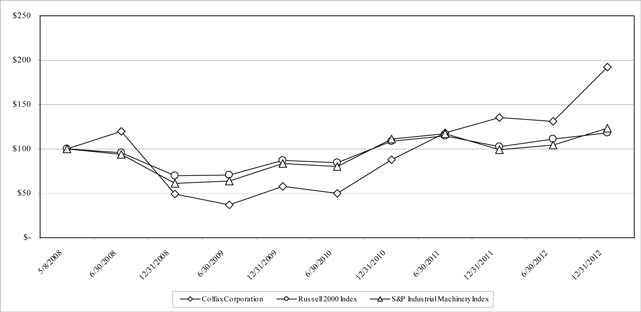
Period Total Number of Shares Purchased Average Price Paid per Share Total Number of Shares Purchased as Part of Publicly Announced Plans or Programs Approximate Dollar Value of Shares that May Yet Be Purchased under the Plans or Programs 9/26/15 - 10/23/15 480,539 27.84 480,539 86,621,794 10/24/15 - 11/20/15 505,740 27.66 505,740 72,633,026 11/21/15 - 12/31/15 — — — 72,633,026 Total 986,279 27.75 986,279 72,633,026 Represents the weighted-average price paid per share during the fourth quarter of 2015. Represents the repurchase program limit authorized by the Board of Directors of $100.0 million less the value of purchases made during the fourth quarter of 2015. 2012, 20112014 or 2010. Year Ended and As of December 31, 2012(1) 2011(2) 2010(3) 2009(4) 2008(5) (In thousands, except per share data) Statement of Operations Data: Net sales $ 3,913,856 $ 693,392 $ 541,987 $ 525,024 $ 604,854 Cost of sales 2,761,731 453,293 350,579 339,237 387,667 Gross profit 1,152,125 240,099 191,408 185,787 217,187 Selling, general and administrative expense 895,452 162,761 133,507 116,240 125,190 Initial public offering-related cost — — — — 57,017 Charter acquisition-related expense 43,617 31,052 — — — Restructuring and other related charges 60,060 9,680 10,323 18,175 — Asbestos coverage litigation expense 12,987 10,700 13,206 11,742 17,162 Operating income 140,009 25,906 34,372 39,630 17,818 Interest expense 91,570 5,919 6,684 7,212 11,822 Provision for income taxes 90,703 15,432 11,473 8,621 5,465 Net (loss) income (42,264 ) 4,555 16,215 23,797 531 Less: income attributable to noncontrolling interest, net of taxes 22,138 — — — — Dividends on preferred stock 18,951 — — — 3,492 Net (loss) income available to Colfax Corporation common shareholders $ (83,353 ) $ 4,555 $ 16,215 $ 23,797 $ (2,961 ) Net (loss) income per share—basic and diluted $ (0.92 ) $ 0.10 $ 0.37 $ 0.55 $ (0.08 ) Balance Sheet Data: Cash and cash equivalents $ 482,449 $ 75,108 $ 60,542 $ 49,963 $ 28,762 Goodwill and Intangible assets, net 2,853,279 245,873 200,636 175,370 175,210 Total assets 6,129,727 1,088,543 1,022,077 1,006,301 907,550 Total debt, including current portion 1,728,311 111,518 82,500 91,485 97,121 __________ Year Ended and As of December 31, (In thousands, except per share data) Statement of Income Data: Net sales $ 3,967,053 $ 4,624,476 $ 4,207,209 $ 3,913,856 $ 693,392 Cost of sales 2,715,279 3,145,631 2,900,987 2,761,731 453,293 Gross profit 1,251,774 1,478,845 1,306,222 1,152,125 240,099 Selling, general and administrative expense 905,952 1,011,171 864,328 908,439 173,461 Charter acquisition-related expense — — — 43,617 31,052 Restructuring and other related charges 61,177 58,121 35,502 60,060 9,680 Operating income 284,645 409,553 406,392 140,009 25,906 Interest expense 47,743 51,305 103,597 91,570 5,919 Provision for (benefit from) income taxes 49,724 (62,025 ) 93,652 90,703 15,432 Net income (loss) 187,178 420,273 209,143 (42,264 ) 4,555 Less: income attributable to noncontrolling interest, net of taxes 19,439 28,175 30,515 22,138 — Dividends on preferred stock — 2,348 20,396 18,951 — Preferred stock conversion inducement payment — 19,565 — — — Net income (loss) available to Colfax Corporation common shareholders $ 167,739 $ 370,185 $ 158,232 $ (83,353 ) $ 4,555 Net income (loss) per share—basic $ 1.35 $ 3.06 $ 1.56 $ (0.92 ) $ 0.10 Net income (loss) per share—diluted $ 1.34 $ 3.02 $ 1.54 $ (0.92 ) $ 0.10 Balance Sheet Data: Cash and cash equivalents $ 197,469 $ 305,448 $ 311,301 $ 482,449 $ 75,108 Goodwill and Intangible assets, net 3,813,399 3,916,606 3,242,252 2,853,279 245,873 Total assets 6,732,919 7,211,517 6,593,679 6,122,092 1,087,531 Total debt, including current portion 1,417,547 1,536,810 1,479,586 1,720,676 110,506 During 2015, we completed the acquisitions of Roots and Simsmart. See Note 4, “Acquisitions” in the accompanying Notes to Consolidated Financial Statements in this Form 10-K for additional information. In October 2015, we authorized the repurchase of up to $100.0 million of our Common Stock and we refinanced our debt in June 2015. See Note 11, “Equity” in the accompanying Notes to Consolidated Financial Statements in this Form 10-K and Part I, Item 7. “Management’s Discussion and Analysis of Financial Condition and Results of Operations—Liquidity and Capital Resources” for additional information. During 2014, we completed the Victor Acquisition. See Note 4, “Acquisitions” in the accompanying Notes to Consolidated Financial Statements in this Form 10-K for additional information. In February 2014, we sold newly issued Common stock and entered into a Conversion Agreement with BDT CF Acquisition Vehicle, LLC (the “BDT Investor”) pursuant to which the BDT Investor exercised its option to convert its shares of Series A Perpetual Convertible Preferred Stock into shares of our Common stock plus cash. See Note 11, “Equity” in the accompanying Notes to Consolidated Financial Statements in this Form 10-K for additional information. During 2013, we completed the acquisitions of GII, Clarus, TLT-Babcock, Alphair, ČKDK and Sicelub and increased our ownership of Soldex. In February 2013 and November 2013, we refinanced our Debt, and in May 2013 we sold newly issued Common stock. See Note 4, “Acquisitions” in the accompanying Notes to Consolidated Financial Statements in this Form 10-K and Part I, Item 7. “Management’s Discussion and Analysis of Financial Condition and Results of Operations—Liquidity and Capital Resources” for additional information. During 2012, we completed the acquisitions of Charter, Soldex and Co-Vent and increased our ownership of ESAB India Limited (“ESAB India”) and CJSC Sibes. The Charter Acquisition transformed Colfax from a fluid-handling business into a multi-platform enterprise with a strongbroad global footprint, which makes financial comparison to previous periods difficult. Additionally, in conjunction with the Charter Acquisition in January 2012, we refinanced our Debt and sold newly issued Common stock and Series A Preferred Stock. In March 2012, we sold newly issued Common stock. See Part I, Item 1. “Business,” Note 4, “Acquisitions” in the accompanying Notes to Consolidated Financial Statements in this Form 10-K and Part I, Item 7. “Management’s Discussion and Analysis of Financial Condition and Results of Operations—Liquidity and Capital Resources” for additional information.(2)(5)During 2011, we completed the acquisitions of Rosscor and COT-Puritech in February and December, respectively. See Part I, Item 1. “Business” and Note 4, “Acquisitions” in the accompanying Notes to Consolidated Financial Statements in this Form 10-K for additional information. (3)In August 2010, we acquired Baric. See Part I, Item 1. “Business” and Note 4, “Acquisitions” in the accompanying Notes to Consolidated Financial Statements in this Form 10-K for additional information.(4)In August 2009, we acquired PD Technik for $1.3 million, net of cash acquired. See Part I, Item 1. “Business” in this Form 10-K for additional information.(5)In May 2008, we refinanced our Debt in conjunction with our initial public offering.§Overview§Results of Operations§Liquidity and Capital Resources§Critical Accounting PoliciesData,”Data”, Part I, Item 1A. “Risk Factors” and the accompanying Consolidated Financial Statements and Notes to Consolidated Financial Statements included in this Form 10-K. The MD&A includes forward-looking statements. For a discussion of important factors that could cause actual results to differ materially from the results referred to in these forward-looking statements, see “Special Note Regarding Forward-Looking Statements.”Upon the closing of the Charter Acquisition, we changed the composition of our reportable segments to reflect the changes in our internal organization resulting from the integration of the acquired businesses. We now report our operations through the following reportable segments:·Gas & Fluid Handling – a global supplier of a broad range of gas- and fluid-handling products, including pumps, fluid-handling systems and controls, specialty valves, heavy-duty centrifugal and axial fans, rotary heat exchangers and gas compressors, which serves customers in the power generation, oil, gas and petrochemical, mining, marine (including defense) and general industrial and other end markets; and·Fabrication Technology–a global supplier of welding equipment and consumables, cutting equipment and consumables and automated welding and cutting systems. modeled on the Danaher Business System, is our business management system. It is a repeatable, teachable process that we use to create superior value for our customers, shareholders and associates. Rooted in our core values, it is our culture. CBS provides the tools and techniques to ensure that we are continuously improving our ability to meet or exceed customer requirements on a consistent basis.no longer usesdoes not use indices other than general economic trends to predict the overall outlook for the Company. Instead, the individual businesses monitor key competitors and customers, including to the extent possible their sales, to gauge relative performance and outlook for the future.As a result of the Charter Acquisition, weoperatingOperating income (loss) before Restructuring and other related charges.the Comparability of Our Reported Results2012,2015, approximately 83%74% of our sales were shipped to locations outside of the U.S. Accordingly, we are affected by levels of industrial activity and economic and political factors in countries throughout the world. Our ability to grow and our financial performance will be affected by our ability to address a variety of challenges and opportunities that are a consequence of our global operations, including efficiently utilizing our global sales, manufacturing and distribution capabilities, the expansion of market opportunities in Asia, successfully completing global strategic acquisitions and engineering innovative new product applications for end users in a variety of geographic markets. However, we believe that our geographic, end market and product diversification may limit the impact that any one country or economy could have on our consolidated results.80%72% for the year ended December 31, 20122015, is derived from operations outside the U.S., with the majority of those sales denominated in currencies other than the U.S. dollar. Because much of our manufacturing and employee costs are outside the U.S., a significant portion of our costs are also denominated in currencies other than the U.S. dollar. Changes in foreign exchange rates can impact our results of operations and are quantified when significant to our discussion.the Charter Acquisition hasthat our diversified our operations and limitsgenerally limit the impact of a downturn in any one market on our consolidated results.gasgas- and fluid-handling products typically have higher margins than products with commodity-like qualities. However, we are sensitive to price movements in our raw materials supply base. Our largest material purchases are for components and raw materials including steel, iron, copper and aluminum. Historically, we have been generally successful in passing raw material price increases on to our customers. While we seek to take actions to manage this risk, including commodity hedging where appropriate, such increased costs may adversely impact earnings. During 2012, our mix of consumables and aftermarket products and services was significantly impacted by the Charter Acquisition. Year Ended December 31, 2012 2011 2010 Foremarket and equipment 45 % 78 % 76 % Aftermarket and consumables 55 % 22 % 24 % Year Ended December 31, 2015 2014 2013 Foremarket and equipment 45 % 47 % 47 % Aftermarket and consumables 55 % 53 % 53 % discussion of Net sales, orders and order backlog for 2012 in comparison to 2011 is a proforma comparison that includes the operations acquired in the Charter Acquisition for the comparable period of the prior year, which excludes the first 12 days of each annual period presented. The change in Net sales due to acquisitions represents the change in sales due to the following acquisitions by both Colfaxacquisitions:Charter:October 31, 2012, the Company completed the acquisition of approximately 91% of the outstanding common and investment shares of Soldex for approximately $186.1 million (the “Soldex Acquisition”). Soldex is organized under the laws of Peru and complements our existing fabrication technology segment by supplying welding products from its plants in Colombia and Peru.On September 13, 2012,July 9, 2013, Colfax completed the acquisition of the Co-Ventcommon stock of Clarus for $34.6 million. Co-Vent specializes in the custom design, manufacture, and testing of industrial fans, with its primary operations based in Quebec, Canada. As a result of this acquisition, Colfax has expanded its product offerings in the industrial fan market.In May 2012, Colfax acquired the remaining 83.7% of Sibes not already owned by its ESAB business for approximately $8.5 million, including the assumption of debt. Sibes is a leading supplier of welding electrodes to customers in Eastern Russia and strengthens ESAB’s position in the attractive Russian welding consumables market, particularly in the energy and natural resources end markets.On December 6, 2011, Colfax completed the acquisition of COT-Puritech, Inc. for a total purchase price, net of cash acquired, of $39.4$13.2 million, which includesincluded the fair value of an estimated additional contingent cash paymentspayment of $4.3 million.$2.5 million at the acquisition date. The additional contingent cash payments willpayment would be paid over two yearsduring the year ending December 31, 2016 subject to the achievement of certain performance goals. COT-Puritech, Inc.However, we do not expect the performance goals to be achieved. Clarus is a nationaldomestic supplier of oil flushing and remediation services for marine applications primarily to power generation plants, refinery and petrochemical operations and other manufacturing sites,U.S. government agencies, with its primary operations based in Canton, Ohio.JulySeptember 30, 2013, the Company completed the acquisitions of TLT-Babcock and Alphair for an aggregate purchase price of $55.7 million. TLT-Babcock and Alphair are suppliers of heavy duty and industrial fans in Akron, Ohio and Winnipeg, Manitoba, respectively.2011, ESAB acquired 60% of Condor Equipamentos Industriais Ltda (“Condor”), a leading Brazilian manufacturer of gas apparatus used in welding applications, for cash consideration of R$25.2 million.On March 28, 2011, Howden2013, the Company completed the acquisition of Thomassen Compression Systems BV (“Thomassen”),ČKDK for $69.4 million, including the assumption of debt. ČKDK is a leading supplier of high-powered engineeredmulti-stage centrifugal compressors to the oil & gas, petrochemical, power and steel industries, based in Prague, Czech Republic.market, for approximately €100 million.March 3, 2011, ESABNovember 29, 2013, the Company completed the acquisition of LLC Sychevsky Electrodny Zavod (“Sychevsky”),GII for $246.0 million, including the assumption of debt, subject to certain adjustments. GII has operations around the world and expanded the Company’s product offerings in the heavy duty industrial and cooling fan market.Russian electrode manufacturer basedsupplier of blower and compressor technologies which service a broad range of end markets, including wastewater treatment, chemical production, and power generation. The acquisition builds on Howden’s global strength in compressors and blowers and adds important application expertise and product solutions to the Smolensk region for $19.2 million.February 14, 2011,October 5, 2015, Colfax completed the acquisition of Rosscor Simsmartfor $22.3cash consideration of $15.3 million, net of cash acquired. Rosscor isSimsmart provides a suppliersoftware product that controls ventilation conditions and increases fan efficiency. The acquisition of multiphase pumping technologySimsmart expands the Howden product portfolio primarily within the mining end market and certain other highly engineered fluid-handling systems,end markets with its primary operations based in Hengelo, The Netherlands.August 19, 2010,April 14, 2014, Colfax completed the Victor Acquisition for net cash consideration of $948.8 million, subject to certain adjustments. Victor is a pre-eminent global manufacturer of cutting, gas control and specialty welding solutions. The acquisition complemented the geographic footprint of Baric, a supplier of highly engineered fluid-handling systems primarily for lubrication applications, with its primary operations based in Blyth, United Kingdom.For 2012, our consolidatedproforma net sales of $3.8$4.2 billion in 20112013 to $3.9$4.6 billion (which excludes operations acquired in the Charter Acquisition for the first 12 days of each annual period presented)2014. In 2015, our Net sales decreased to $4.0 billion. The following tables presenttable presents the components of our proformachanges in consolidated Net sales and, for our gas- and fluid-handling segment, proformaorders and order backlog: Net Sales Backlog at Period End $ % $ % $ % (In millions) As of and for the year ended December 31, 2013 $ 4,207.2 $ 2,061.4 $ 1,577.4 Components of Change: (79.0 ) (1.9 )% (0.1 ) — % (42.9 ) (2.7 )% 635.2 15.1 % 251.7 12.2 % — — % (138.9 ) (3.3 )% (26.3 ) (1.3 )% (132.2 ) (8.4 )% 417.3 9.9 % 225.3 10.9 % (175.1 ) (11.1 )% As of and for the year ended December 31, 2014 $ 4,624.5 $ 2,286.7 $ 1,402.3 Components of Change: (304.5 ) (6.6 )% (287.1 ) (12.6 )% (145.4 ) (10.4 )% 171.2 3.7 % 57.9 2.5 % 43.3 3.1 % (524.1 ) (11.3 )% (221.1 ) (9.6 )% (159.3 ) (11.3 )% (657.4 ) (14.2 )% (450.3 ) (19.7 )% (261.4 ) (18.6 )% As of and for the year ended December 31, 2015 $ 3,967.1 $ 1,836.4 $ 1,140.9 growth: Net Sales Orders(1) Backlog at Period End $ % $ % $ % (In millions) Proforma as of and for the year ended December 31, 2011 $ 3,839.1 $ 1,924.6 $ 1,288.3 Components of Change: Existing businesses(2) 202.2 5.3 % 54.0 2.8 % 117.5 9.1 % Acquisitions(3) 86.5 2.2 % 100.4 5.2 % 9.4 0.7 % Foreign currency translation(4) (213.9 ) (5.6 )% (83.0 ) (4.3 )% (33.8 ) (2.6 )% 74.8 1.9 % 71.4 3.7 % 93.1 7.2 % As of and for the year ended December 31, 2012 $ 3,913.9 $ 1,996.0 $ 1,381.4 __________(1)Represents contracts for products or services, net of cancellations for the period.(2)Excludes the impact of foreign exchange rate fluctuations and acquisitions, thus providing a measure of growth due to factors such as price, product mix and volume.(3)Represents the incremental sales, orders and order backlog as a result of acquisitions.
Represents the difference between prior year sales, orders and order backlog valued at the actual prior year foreign exchange rates and prior year sales, orders and order backlog valued at current year foreign exchange rates.(4)Represents the difference between sales from existing businesses valued at current year foreign exchange rates and sales from existing businesses at prior year foreign exchange rates.proforma increasedecrease in Net sales from existing businesses in 2012during 2015 compared to 2014 was attributable to increasesdecreases of $161.5$170.3 million and $40.7$134.2 million in our gas- and fluid-handling and fabrication technology segments, respectively. Orders, net of cancellations, from existing businesses for our gas- and fluid-handling segment increaseddecreased during 20122015 in comparison to 2011 primarily2014 due to growthdeclining demand in the power generationall end markets from unfavorable domestic and mining end markets.following tables present components of our Net sales order and backlog growth for 2011: Net Sales Orders(1) Backlog at Period End $ % $ % $ % (In millions) As of and for the year ended December 31, 2010 $ 542.0 $ 532.8 $ 313.5 Components of Change: Existing businesses(2) 48.8 9.0 % 65.0 12.2 % (1.1 ) (0.4 )% Acquisitions(3) 81.3 15.0 % 64.0 12.0 % 40.2 12.8 % Foreign currency translation(4) 21.3 3.9 % 21.0 4.0 % (5.4 ) (1.7 )% 151.4 27.9 % 150.0 28.2 % 33.7 10.7 % As of and for the year ended December 31, 2011 $ 693.4 $ 682.8 $ 347.2 __________(1)Represents contracts for products or services, net of cancellations for the period.(2)Excludes the impact of foreign exchange rate fluctuations and acquisitions, thus providing a measure of growth due to factors such as price, product mix and volume.(3)Represents the incremental sales, orders and order backlog as a result of acquisitions.(4)Represents the difference between sales from existing businesses valued at current year foreign exchange rates and sales from existing businesses at prior year foreign exchange rates.increased by $48.8 million, or 9.0%, during 20112014 compared to 2010 due2013 was attributable to an increase in demand in all end markets, except defense. The timingdecreases of sales$47.7 million and orders to customers$31.3 million in our defense end market, which we began including with marine end market salesfabrication technology and orders in 2012, vary from period to period due to the timing of specific ship programs. Net sales were positively impacted by the changes in foreign exchange rates during 2011 in comparison to 2010.increasedfor our gas- and fluid-handling segment were flat during 20112014 in comparison to 2010 due to increased2013 as declines in demand in allfrom the oil, gas and petrochemical, power generation and mining end markets except defense. Additionally, we experienced a declinewere offset by growth in commercialdemand from the marine order cancellations from $16.4 million during 2010 to $6.1 million in 2011 primarily due to the impact of improved economic conditions. now reports results in two reportable segments: gas and fluid handling and fabrication technology. The following tables summarizetable summarizes Net sales by reportable segment for each of the following periods: Year Ended December 31, Proforma 2012 2011 (In millions) Gas and Fluid Handling $ 1,901.2 $ 1,757.1 Fabrication Technology 2,012.7 2,082.0 Total Net sales $ 3,913.9 $ 3,839.1 The sales comparisons discussed above, for 2012 in comparison to 2011, are on a proforma basis (which excludes operations acquired in the Charter Acquisition for the first 12 days of each annual period presented). Sales comparisons for 2011 in comparison to 2010 represent the Net sales reported by Colfax for those periods as a proforma comparison is not considered meaningful for those periods. Further, cost information for Charter, ESAB and Howden is not available for 2011 under the presentation required by the Exchange Act and, as such, proforma discussions are limited to sales. Year Ended December 31, 2015 2014 2013 (In millions) Gas and Fluid Handling $ 1,981.8 $ 2,329.6 $ 2,104.0 Fabrication Technology 1,985.3 2,294.9 2,103.2 Total Net sales $ 3,967.1 $ 4,624.5 $ 4,207.2 Baric, Fairmount Automation, Houttuin, Imo, LSC, COT-Puritech, Portland Valve, Tushaco, Warren and Zenith.Imo. Colfax Fluid Handling is a supplier of a broad range of fluid-handling products, including pumps, fluid-handling systems and controls, and specialty valves. the selected financial data for our gas- and fluid-handling segment: Year Ended December 31, 2012 2011 2010 (Dollars in millions) Net sales $ 1,901.2 $ 693.4 $ 542.0 Gross profit 567.1 240.1 191.4 Gross profit margin 29.8 % 34.6 % 35.3 % Restructuring and other related charges $ 8.7 $ 8.6 $ 5.8 Selling, general and administrative expense 412.6 142.7 112.8 Selling, general and administrative expense as a percentage of Net sales 21.7 % 20.6 % 20.8 % Asbestos coverage litigation expense $ 13.0 $ 10.7 $ 13.2 Segment operating income 141.5 86.7 65.4 Segment operating income margin 7.4 % 12.5 % 12.1 % Year over year fluctuations for 2012 in comparison to 2011 for selected financial data are primarily due to the addition of the Howden operations. Year Ended December 31, 2015 2014 2013 (Dollars in millions) Net sales $ 1,981.8 $ 2,329.6 $ 2,104.0 Gross profit 594.4 696.7 626.7 Gross profit margin 30.0 % 29.9 % 29.8 % Restructuring and other related charges $ 31.5 $ 26.5 $ 10.4 Selling, general and administrative expense 399.9 438.9 355.9 Selling, general and administrative expense as a percentage of Net sales 20.2 % 18.8 % 16.9 % Segment operating income 194.5 254.2 270.7 Segment operating income margin 9.8 % 10.9 % 12.9 % $161.5$170.3 million Net sales growthdecrease due to existing businesses, as discussed and defined under “Sales, Orders and Backlog” above, during 20122015 in comparison to 20112014 was primarily due to declines in the power generation, mining, and general industrial and other end markets, partially offset by growth in allthe marine and oil, gas, and petrochemical end markets, except marine.markets. Additionally, $56.6changes in foreign exchange rates had a negative impact of $225.4 million, partially offset by acquisition related growth of acquisition-related amortization expense$47.9 million. Gross profit decreased during 2015, which was primarily the result of changes in foreign exchange rates and $15.1 millionlower volumes. Gross profit margin increased recurring intangible amortization expenseduring 2015 in comparison to 2011 is reflected2014 as improved margins through cost control and restructuring savings were more than sufficient to offset the impact of lower volumes. Restructuring and other related charges increased during 2015 primarily due to accelerated cost reduction programs to eliminate excess in the cost structure of the Company in response to the current challenging, cyclical economic conditions. Selling, general and administrative expense for 2012.As further2015 decreased compared to 2014 primarily due to changes in foreign exchange rates, cost control activities and the impact of lower volumes, partially offset by acquisition-related growth, $8.1 million of charges associated with uncollectible accounts of a specific customer in South America, $2.8 million of asset impairment charges which includes a $1.7 million impairment loss related to a finite-lived intangible asset, approximately $8.0 million of transaction costs and year-one amortization charges associated with 2015 acquisitions, and a $4.1 million charge for revaluation of net asbestos-related liabilities. Additionally, Selling, general and administrative expense for 2014 includes a $13.4 million impairment loss related to identifiable intangible assets, a $4.0 million loss on disposition of a small fluid-handling business line and a $1.3 million foreign currency loss from the use of the SICAD II exchange rate at our Venezuelan fluid-handling business, partially offset by an unrealized gain of $2.9 million related to the Clarus contingent payment liability.$151.4$287.9 million or 27.9%,due to acquisitions and changes in foreign exchange rates had a negative impact of $31.0 million. Gross profit increased during 2011 compared2014 reflecting the impact of acquisitions. Gross profit margin increased during 2014 in comparison to 20102013 as improved margins through cost control and restructuring savings in our gas-handling business were more than sufficient to offset the lower margins of the acquired entities. Restructuring and other related charges increased during 2014 primarily due to an increase in demand in all end markets, except defense. Gross profit margin for 2011 decreased comparedrestructuring actions to 2010 primarily due to lower gross margin associated withreduce structural costs and integrate the foremarket sales of Rosscor and Baricacquisitions made during the period, partially offset by positive leveragefourth quarter of fixed costs given substantially higher sales volume in 2011. The acquisitions of Rosscor and Baric contributed $15.8 million to the increase in2013. Selling, general and administrative expense during 2011. Additionally, asbestos liability and defense costsfor 2014 increased by $4.4 million during 2011 compared to 2010.principally marketed under theseveral brand names, most notably ESAB brand name,and Victor, which we believe is a leadingare well known in the international cutting and welding company with roots dating back to the invention of the welding electrode.industry. ESAB’s comprehensive range of cutting and welding consumables includes electrodes, cored and solid wireswire and fluxes. ESAB’s fabrication technology equipment ranges from portable unitswelding machines to large customcustomized cutting and automated welding systems. The Victor Acquisition complemented the geographic footprint of our fabrication technology segment and expanded our cutting equipment and consumables, gas control and specialty welding product lines. Products are sold into a wide range of end markets, including oil & gas, power generation, wind power, shipbuilding, pipelines, mobile/off-highway equipment and mining. the selected financial data for our fabrication technology segment: (Dollars in millions) Net sales $ 2,012.7 Gross profit 585.1 Gross profit margin 29.1 % Restructuring and other related charges $ 45.2 Selling, general and administrative expense 444.9 Selling, general and administrative expense as a percentage of Net sales 22.1 % Segment operating income $ 140.2 Segment operating income margin 7.0 % Year Ended December 31, 2015 2014 2013 (Dollars in millions) Net sales $ 1,985.3 $ 2,294.9 $ 2,103.2 Gross profit 657.4 782.1 679.6 Gross profit margin 33.1 % 34.1 % 32.3 % Restructuring and other related charges $ 29.7 $ 31.6 $ 25.1 Selling, general and administrative expense 459.1 516.3 459.9 Selling, general and administrative expense as a percentage of Net sales 23.1 % 22.5 % 21.9 % Segment operating income $ 198.3 $ 265.8 $ 219.6 Segment operating income margin 10.0 % 11.6 % 10.4 % $40.7Net sales decrease during 2015 compared to 2014 was primarily the result of a decrease in existing businesses of $134.2 million and changes in foreign exchange rates which had a negative impact of $298.7 million, partially offset by acquisition-related growth of $123.3 million. The $134.2 million Net sales growthdecline due to existing businesses, as discussed and defined under “Sales, Orders and Backlog” above, during 20122015 in comparison to 20112014 was primarily the result of decreases in equipment sales and consumable volumes in most regions. Gross profit and gross profit margin for 2015 decreased reflecting changes in foreign exchange rates, lower volumes, mix impact from oil and gas and lower overall capital equipment spending. The decrease in Selling, general and administrative expense during 2015 was primarily due to increased consumable and equipment saleschanges in the Americas, Russiaforeign exchange rates, cost control activities and the Middle East. Year over year comparisonimpact of lower volumes, partially offset by an acquisition-related increase of $24.1 million, and a $1.5 million impairment loss related to an identifiable intangible asset during 2015. Additionally, Selling, general and administrative expense for 2014 includes a $5.0 million loss from the use of the other selected financial dataSICAD II exchange rate at our Venezuelan fabrication technology business, which did not repeat in 2015.is not practical, as further discussed above.during 2014 in comparison to 2013 was primarily the result of decreases in consumable volumes in most geographies. Gross profit and gross profit margin for 2014 increased reflecting the positive impact of cost control activities. Additionally, Gross profit and gross profit margin for 2012during 2014 were negativelypositively impacted by the higher gross margins at Victor, which were partially offset by acquisition-related inventory step-upstep up expense of $18.7$9.0 million.Profit-Profit - Total Company Year Ended December 31, 2012 2011 2010 (In millions) Gross profit $ 1,152.1 $ 240.1 $ 191.4 Gross profit margin 29.4 % 34.6 % 35.3 % Year Ended December 31, 2015 2014 2013 (Dollars in millions) Gross profit $ 1,251.8 $ 1,478.8 $ 1,306.2 Gross profit margin 31.6 % 32.0 % 31.0 % $912.0$227.0 million increasedecrease in Gross profit during 20122015 in comparison to 20112014 was attributable to increasesdecreases of $585.1$102.3 million in our fabrication technology segment and $326.9$124.7 million in our gas- and fluid-handling segment which wereand our fabrication technology segment, respectively. The decrease in gross profit in both of our segments during 2015 as compared to 2014 was primarily due to changes in foreign exchange rates and lower overall volumes, partially offset by acquisition related growth. The increase in gross profit margin in our gas- and fluid-handling segment during 2015 as compared to 2014 was more than offset by the Charter Acquisition.$48.7$172.6 million increase in Gross profit during 20112014 in comparison to 20102013 was attributable to increases of $20.0$70.0 million from existing businesses and $20.8$102.6 million duein our gas- and fluid-handling segment and our fabrication technology segment, respectively. The increase in gross profit margin in both of our segments during 2014 reflects the positive impact of cost control activities. Additionally, our fabrication technology segment was positively impacted during 2014 by the higher gross margins of Victor, which were partially offset by acquisition-related inventory step up expense. The increase in Gross profit in our gas- and fluid-handling segment during 2014 includes the impact of acquisitions, which also served to the acquisitions of Rosscor and Baric. Additionally, changesreduce gross profit margin. Changes in foreign exchange rates during 2014 had a $7.9$44.0 million positivenegative impact on Gross profit for 2011 in comparison to 2010. Gross profit margin for 2011 decreased compared to 2010 primarily due to the lower gross profit margin associated with the foremarket sales of Rosscor and Baric during the period, partially offset by positive leverage of fixed costs given substantially higher sales volume in 2011. Year Ended December 31, 2012 2011 2010 (In millions) Selling, general and administrative expense $ 895.5 $ 162.8 $ 133.5 Selling, general and administrative expense as a percentage of Net sales 22.9 % 23.5 % 24.6 % Charter acquisition-related expense $ 43.6 $ 31.1 $ — Restructuring and other related charges 60.1 9.7 10.3 Asbestos coverage litigation expense 13.0 10.7 13.2 Year Ended December 31, 2015 2014 2013 (Dollars in millions) Selling, general and administrative expense $ 906.0 $ 1,011.2 $ 864.3 Selling, general and administrative expense as a percentage of Net sales 22.8 % 21.9 % 20.5 % Restructuring and other related charges 61.2 58.1 35.5 increased $732.7decreased $105.2 million during 20122015 in comparison to 20112014. Changes in foreign exchange rates during 2015 decreased Selling, general, and administrative expenses by primarily due$111.3 million. An overall decrease in acquisition integration costs and the positive benefit of restructuring actions to reduce structural costs and integrate acquisitions also contributed to the Charter Acquisition. The decreasedecrease. These items were partially offset by a $40.4 million acquisition-related increase in Selling, general and administrative expense during 2015. Additionally, Selling, general and administrative expense for 2015 includes an increase in the allowance for doubtful accounts of specific South American customers of $9.4 million, asset impairment charges of $4.3 million, and transaction costs and year-one amortization of approximately $8.0 million, as discussed previously. Selling, general and administrative expense as a percentage of Net sales increased primarily as a result of lower Net sales driven by reasons discussed above. Selling, general and administrative expense for 2014 includes a $13.4 million impairment loss related to identifiable intangible assets, a $4.0 million loss on disposition of a small fluid-handling business line and a $6.3 million loss from the use of the SICAD II exchange rate at our Venezuelan businesses. The increase in Restructuring and other related charges during 20122015 is attributable to our gas- and fluid-handling segment due to accelerated cost reduction programs to eliminate excess in the cost structure of the Company in response to the current challenging, cyclical economic conditions.2011 resulted2013 primarily fromdue to an increase of $161.8 million attributable to the benefitaddition of higher sales volumesthe operations associated with the Victor Acquisition and efforts to reduce coststhe gas- and fluid-handling acquisitions during 2013. Additionally, Selling, general and administrative expense for 2014 includes the specific charges discussed above associated with impairment, loss on disposition of a business line and foreign currency, partially offset by $77.3significant cost saving programs in both segments and an unrealized gain of $2.9 million of higher intangible amortization expense. During 2012, we incurred $12.5 million of increased advisory, legal, valuation and other professional service fees and losses on acquisition-related foreign exchange derivatives in connection withrelated to the Charter Acquisition in comparisonClarus contingent payment liability, as the performance criteria are no longer expected to 2011.significantly during 2012 in comparisoncompared to the comparable period of 2011, primarily as a result of the substantial cost reduction programs under way in the fabrication technology segment.Selling, general and administrative expense increased $29.3 million during 2011 in comparison to 2010, $15.8 million of which resulted from the acquisitions of Rosscor, Baric and COT-Puritech. Selling, general and administrative expense from existing businesses increased2013 primarily due to higher selling and commissionan increase in restructuring actions to reduce structural costs and higher corporate overhead includingintegrate the operationacquisitions made during 2014 and the fourth quarter of two offices during the transition of our corporate headquarters to Maryland. Additionally, asbestos liability and defense costs increased by $4.3 million during 2011 compared to 2010 primarily due to a $2.1 million provision related to a court judgment received for one of our subsidiaries’ litigation against a number of its insurers and former parent, a $1.8 million pre-tax charge because of a statistically significant increase in mesothelioma claims had occurred and was expected to continue to occur related to one of our subsidiaries and a $0.7 million pre-tax charge resulting from higher settlement values per mesothelioma claim in a specific region related to another subsidiary. The decrease in Selling, general and administrative expense as a percentage of Net sales during 2011 in comparison to 2010 resulted primarily from higher sales volumes. Year Ended December 31, 2012 2011 2010 (In millions) Interest expense $ 91.6 $ 5.9 $ 6.7 Year Ended December 31, 2015 2014 2013 (Dollars in millions) Interest expense $ 47.7 $ 51.3 $ 103.6 increasedecrease in Interest expense during 20122015 was primarily due to decreases in comparison to 2011weighted average interest rates, outstanding borrowing levels and amortization of deferred financing fees and original issue discount. These decreases were partially offset by a $4.7 million write-off of certain deferred financings fees during 2015 in connection with the refinancing of our principal credit facility.interest on the financing relatedamendments to the Charter Acquisition. See “—LiquidityDeutsche Bank Credit Agreement (as defined and further discussed in "Liquidity and Capital Resources—Borrowing Arrangements” below for additional discussion.During 2012, - Total Company$48.4$236.9 million and the Provision for income taxes was $90.7 million.$49.7 million for 2015. The provisionProvision for income taxes was impacted by two significant items. Upon completiona tax benefit of $13.0 million associated with the resolution of a liability for unrecognized tax benefits and the effect of foreign earnings where international tax rates are lower than the U.S. tax rate.Charter Acquisition,realizability of certain deferred tax assets existing at that date were reassessed in lightas a result of the impacteffect of the acquired businessesVictor Acquisition on expected future income or loss by country and future tax planning, including the impact of the post-acquisition capital structure.U.S. income. This assessmentreassessment resulted in an increasea decrease in ourthe Company’s valuation allowance to provide full valuation allowances against U.S. deferred tax assets. The increasedreduction in the valuation allowances resulted inallowance created a non-cash increaseincome tax benefit for 2014 of $145.4 million. Additionally, a tax benefit of $21.8 million was included in the Provision forBenefit from income taxes for 2012 of $50.3 million. In addition, $43.6 million of Charter acquisition-related expense and increased corporate overhead and Interest expense reflected in the Consolidated StatementStatements of OperationsIncome during 2014 associated with the resolution of a liability for unrecognized tax benefits. These items, as well as the impact of foreign earnings where international tax rates are either non-deductible or were incurred in jurisdictions where nolower than the U.S. tax benefit can be recognized. These two itemsrate, are the principal cause of the Provisionreasons for income taxes being significantly highera tax benefit rather than thea tax provision, which would result from the application of the U.S. federal statutory rate.The effective income tax rate for 2011 was 77.2% as compared to an effective tax rate of 41.4% for 2010. Our effective tax rate for 2011 was higher than the U.S. federal statutory rate primarily due to a net increase in our valuation allowance that was partially offset by foreign earnings where international tax rates are lower than the U.S. tax rate and a net decrease in our liability for unrecognized tax benefits. The 77.2% effective tax rate for 2011 was higher than the 41.4% effective tax rate for 2010 primarily due to a $16.7 million net increase in our valuation allowance in 2011 compared to a net increase of $4.2 million in 2010 impacting the Provision forreported Income before income taxes for those periods.and borrowings under our bank credit facilities (discussed below). Additionally, duringand the first quarterissuances of 2012, we were successful in our efforts to raise additional funds in the form of debt and equity, as further discussed below.equity. We expect that our primary ongoing requirements for cash will be for working capital, funding of acquisitions, capital expenditures, share repurchases, asbestos-related cash outflows and funding of our pension plans. If additional funds are needed for strategic acquisitions or other corporate purposes, we believe we could raise additional funds in the form of debt or equity.In connection with the financing of the Charter Acquisition, on January 24, 2012,to the BDT Investor (i) 14,756,9457,500,000 shares of newly issued Colfax Common stock and (ii) 13,877,552 shares of newly created Series A perpetual convertible preferred stock, referred to as the Series A Preferred Stock, for an aggregate of $680 million (representing $24.50 per share of Series A Preferred Stock and $23.04 per share of Common stock) pursuant to a securities purchase agreement (the “BDT Purchase Agreement”) with the BDT Investor as well as BDT Capital Partners Fund I-A, L.P., and Mitchell P. Rales, Chairman of our Board of Directors, and his brother, Steven M. Rales (for the limited purpose of tag-along sales rights provided to the BDT Investor in the event of a sale or transfer of shares of our Common stock by either or both of Mitchell P. Rales and Steven M. Rales). Pursuant to the BDT Purchase Agreement, under the terms of the Series A Preferred Stock, holders are entitled to receive cumulative cash dividends, payable quarterly, at a per annum rate of 6% of the liquidation preference (defined as $24.50, subject to customary antidilution adjustments), provided that the dividend rate shall be increased to a per annum rate of 8% if Colfax fails to pay the full amount of any dividend required to be paid on such shares until the date that full payment is made.The Series A Preferred Stock is convertible, in whole or in part, at the option of the holders at any time after the date the shares were issued into shares of Colfax Common stock at a conversion rate determined by dividing the liquidation preference by a number equal to 114% of the liquidation preference, subject to certain adjustments. The Series A Preferred Stock is also convertible, in whole or in part, at our option on or after the third anniversary of the issuance of the shares at the same conversion rate if, among other things: (i) for the preceding thirty trading days, the closing price of Colfax Common stock on the New York Stock Exchange exceeds 133% of the applicable conversion price and (ii) Colfax has declared and paid or set apart for payment all accrued but unpaid dividends on the Series A Preferred Stock.On January 24, 2012, we sold 2,170,139 shares of newly issued Colfax Common stock to each of Mitchell P. Rales and Steven M. Rales and 1,085,070 shares of newly issued Colfax Common stock to Markel Corporation (“Markel”) at $23.04 per share, for an aggregate of $125 million pursuant to separate securities purchase agreements with Mitchell P. Rales, Chairman of Colfax’s Board of Directors, and his brother Steven M. Rales, each of whom were beneficial owners of 20.9% of Colfax’s Common stock at the time of the sale, and Markel. Thomas S. Gayner, a member of Colfax’s Board of Directors, is President and Chief Investment Officer of Markel.Consideration paid to Charter shareholders included 0.1241 shares of newly issued Colfax Common stock in exchange for each share of Charter’s ordinary stock, which resulted in the issuance of 20,735,493 shares of Common stock on January 24, 2012.In conjunction with the issuance of the Common and Preferred stock discussed above, the Company recognized $14.7 million in equity issuance costs which were recorded as a reduction to Additional paid-in capital during 2012.On March 5, 2012, we sold 8,000,000 shares of newly issued Common stock to underwriters for public resale pursuant to a shelf registration statement for an aggregate purchase price of $272 million. Further, on March 9, 2012, the underwriters of the March 5, 2012 equity offering exercised their over-allotment option and we sold an additional 1,000,000 shares of newly issued Common stock to the underwriters for public resale pursuant to a shelf registration statement for an aggregate purchase price of $34$331.9 million. In conjunction with these issuances,this issuance, we recognized $12.6$12.0 million in equity issuance costs which were recorded as a reduction to Additional paid-in capital during 2012.Borrowing ArrangementsAgreementAgreement”) on September 12, 2011. In connection with the closing of the Charter Acquisition, the Deutsche Bank Credit Agreement was amended on January 13, 2012 and we terminated our Bank of America Credit Agreement (defined and further discussed below)existing credit agreement as well as Charter’s outstanding indebtedness. The Deutsche Bank Credit Agreement has four tranches of term loans: (i)$200 million term A-1 facility, (ii) a $500 million term A-2 facility, (iii) a €157.6 million term A-3 facilitySecond and (iv) a $900 million term B facility. In addition,Third amendment to the Deutsche Bank Credit Agreement has twoon February 22, 2013 and November 7, 2013, respectively, which, among other things, reallocated our borrowing capacities of the tranches of loans and reduced our interest rate margins when compared to the terms of the amended Deutsche Bank Credit Agreement on January 13, 2012. In conjunction with the 2013 amendments, we recorded a charge to Interest expense in the Consolidated Statement of Income for the year ended December 31, 2013 of $29.4 million to write-off certain deferred financing fees and original issue discount and expensed approximately $1.2 million of costs incurred in connection with the refinancing.sub-facilities which total $300 million in commitmentsfacility (the “Revolver”)., each of which matures in five years. The Revolver includescontains a $200$50.0 million letterswing line loan sub-facility.credit sub-facility andthe 2015 Deutsche Bank Credit Agreement. Under the Increase Agreement, we increased the Revolver by $300.0 million, resulting in a $50 million swingline loan sub-facility.total Revolver commitment under the 2015 Deutsche Bank Credit Agreement of $1.3 billion. The term A-1, term A-2, term A-3Term Loan and the Revolver variable-rate borrowings are subjectbear interest, at the election of the Company, at either the base rate (as defined in the 2015 Deutsche Bank Credit Agreement) or the Eurocurrency rate (as defined in the 2015 Deutsche Bank Credit Agreement), in each case, plus the applicable interest rate margin.interest paymentscertain exceptions), the Company’s total leverage ratio and the corporate family rating of LIBOR or EURIBOR plus a margin ranging from 2.50% to 3.25%,the Company as determined by our leverage ratio. BorrowingsStandard & Poor’s and Moody’s (ranging from 1.25% to 2.00% , in the case of the Eurocurrency margin, and 0.25% to 1.00% , in the caseterm B facility are also variable rate and are subjectterms of the 2015 Deutsche Bank Credit Agreement, based upon the currency borrowed.interest paymentsInterest expense in the Consolidated Statement of LIBOR plus a margin of 3.5%. The Revolver is subject to a commitment fee ranging from 37.5 to 50 basis points, determined by our leverage ratio. Additionally, as ofIncome for the year ended December 31, 2012, there was2015 of $4.7 million to write-off certain deferred financing fees and original issue discount and expensed approximately $0.4 million of costs incurred in connection with the refinancing of the 2015 Deutsche Bank Credit Agreement. The Company had an original issue discount of $55.4$7.5 million and deferred financing fees of $8.5$8.1 million included in its Consolidated Balance Sheet as of December 31, 2015, which will be accreted to Interest expense primarily using the effective interest method.method, over the life of the 2015 Deutsche Bank Credit Agreement. As of December 31, 2012,2015, the weighted-average interest rate on outstandingof borrowings under the 2015 Deutsche Bank Credit Agreement was 3.93%1.83%, excluding accretion of original issue discount and there was $291.9 million available under the Revolver, including $191.9 million available under the letter of credit sub-facility.As of December 31, 2011, we were party to a credit agreement (the “Bank of America Credit Agreement”), led and administered by Bank of America, which included a senior secured revolving credit facility and a term credit facility. Upon the early termination of the Bank of America Credit Agreement, we incurred a total pre-tax charge of $1.5 million in 2012, which includes the write-off of $1.0 millionamortization of deferred financing fees, and $0.5there was $688.8 million available on the revolving credit facility.losses reclassifiedcredit facilities with total capacity of $718.8 million. Total letters of credit of $360.4 million were outstanding as of December 31, 2015.Accumulatedcertain of our subsidiaries on an ongoing basis and pledges them to support its obligation as borrower under the receivables financing facility. This special purpose subsidiary has a separate legal existence from its parent and its assets are not available to satisfy the claims of creditors of the selling subsidiaries or any other comprehensive lossmember of the consolidated group. Availability of funds may fluctuate over time given changes in eligible receivable balances, but will not exceed the program limit. On December 21, 2015, the Company increased the receivables financing facility by $15 million to $95 million and extended the facility through December 20, 2016. As of December 31, 2015, the total outstanding borrowings under the receivables financing facility were $75.8 million and the interest rate was 1.2%. The scheduled termination date for the related interest rate swap.In connection withreceivables financing facility may be extended from time to time. The facility contains representations, warranties, covenants and indemnities customary for facilities of this type. The facility does not contain any covenants that we view as materially constraining to the Deutsche Bank Credit Agreement, we have pledged substantially allactivities of our domestic subsidiaries’ assets and 65%business.sharesCompany have agreed to guarantee the obligations of certain first tier international subsidiaries as collateral against borrowings to our U.S. companies. In addition, subsidiaries in certain foreign jurisdictions have guaranteed our obligations on borrowings of one of our European subsidiaries, as well as pledged substantially all of their assets for such borrowings of this European subsidiarythe Company under the 2015 Deutsche Bank Credit Agreement. The 2015 Deutsche Bank Credit Agreement contains customary covenants limiting ourthe ability of the Company and its subsidiaries to, among other things, pay dividends, incur debt or liens, redeem or repurchase equity, enter into transactions with affiliates, make investments, merge or consolidate with others, or dispose of assets.assets, make investments or pay dividends. In addition, the 2015 Deutsche Bank Credit Agreement contains financial covenants requiring usthe Company to maintain a total leverage ratio, as defined therein, of not more than 4.953.5 to 1.0 and a minimum interest coverage ratio, as defined therein, of 2.03.0 to 1.0, measured at the end of each quarter, through 2012.quarter. The minimum interest coverage ratio increases by 25 basis points each year beginning in 2013 until it reaches 3.0 to 1.0 for 2016. The maximum total leverage ratio decreases to 4.75 to 1.0 for 2014 and decreases by 25 basis points for the two subsequent fiscal years until it reaches 4.25 to 1.0 for 2016. The2015 Deutsche Bank Credit Agreement contains various events of default including(including failure to comply with the financial covenants referenced above,under the 2015 Deutsche Bank Credit Agreement and related agreements) and upon an event of default the lenders may, subject to various customary cure rights, require the immediate payment of all amounts outstanding under the term loansTerm Loan and the Revolver and foreclose on the collateral.Revolver. The Company is in compliance with all such covenants as of December 31, 2012.2015. We believe that our sources of liquidity, including the 2015 Deutsche Bank Credit Agreement, are adequate to fund our operations for the next twelve months.2012,2015, we had $482.4$197.4 million of Cash and cash equivalents, an increasea decrease of $407.3$108.0 million from $75.1$305.4 million as of December 31, 2011.2014. The following table summarizes the change in Cash and cash equivalents during the periods indicated: Year Ended December 31, 2012 2011 2010 (In millions) Net cash provided by operating activities $ 164.3 $ 57.2 $ 62.0 Purchases of fixed assets, net (83.2 ) (13.7 ) (12.4 ) Acquisitions, net of cash received (1,859.6 ) (56.3 ) (28.0 ) Other sources, net 1.8 — — Net cash used in investing activities (1,941.0 ) (70.0 ) (40.4 ) Proceeds from (repayments of) borrowings, net 1,159.8 29.0 (8.8 ) Proceeds from issuance of common stock, net 756.8 3.7 0.9 Proceeds from issuance of preferred stock, net 333.0 — — ESAB India repurchase of additional noncontrolling interest (29.3 ) — — Other sources (uses), net (27.4 ) — (0.1 ) Net cash provided by (used in) financing activities 2,192.9 32.7 (8.0 ) Effect of exchange rates on Cash and cash equivalents (8.9 ) (5.3 ) (3.0 ) Increase in Cash and cash equivalents $ 407.3 $ 14.6 $ 10.6 Year Ended December 31, 2015 2014 2013 (In millions) Net cash provided by operating activities $ 303.8 $ 385.8 $ 362.2 Purchases of fixed assets, net (69.9 ) (84.5 ) (71.5 ) Acquisitions, net of cash received (196.0 ) (948.8 ) (372.5 ) Loans to non-trade creditors — — (31.0 ) Other, net 18.9 3.2 — Net cash used in investing activities (247.0 ) (1,030.1 ) (475.0 ) (Repayments of) proceeds from borrowings, net (88.9 ) 90.9 (309.0 ) Proceeds from issuance of common stock, net 6.1 613.9 324.2 Repurchases of common stock (27.4 ) — — Acquisition of shares held by noncontrolling interest — (10.3 ) (14.9 ) Preferred stock conversion inducement payment — (19.6 ) — Other uses (21.1 ) (24.9 ) (45.4 ) Net cash (used in) provided by financing activities (131.3 ) 650.0 (45.1 ) Effect of exchange rates on Cash and cash equivalents (33.5 ) (11.6 ) (13.2 ) Decrease in Cash and cash equivalents $ (108.0 ) $ (5.9 ) $ (171.1 ) Ÿ cash outflows of $24.7 million, $7.9 million and $11.4 million for asbestos-related costs paid, net of insurance settlements received during 2012, 2011 and 2010, respectively.ŸFunding requirements of our defined benefit plans, including pension plans and other post-retirement benefit plans, can vary significantly from period to period due to changes in the fair value of plan assets and actuarial assumptions. For 2012, 2011 and 2010, cash contributions for defined benefit and other post-employment benefit plans were $61.2 million, $9.3 million and $12.1 million, respectively. Contributions for 2012 include $18.9 million of supplemental contributions to pension plans in the United Kingdom as a result of the financing of the Charter Acquisition.ŸDuring 2012, 2011 and 2010, cash payments of $45.1 million, $6.8 million and $16.3 million, respectively were made related to our restructuring initiatives. Additionally, during 2012 and 2011 cash payments of approximately $46.1 million and $1.6 million, respectively, were made for advisory, legal, valuation and other professional service fees related to the Charter Acquisition.ŸChanges in net working capital also affected the operating cash flows for the periods presented. We define working capital as Trade receivables, net and Inventories, net reduced by Accounts payable. During 2012, net working capital decreased, primarily due to a decrease in inventory and an increase in payable levels, which increased our cash flows from operating activities by $78.3 million, a significant contributor to 2012 cash flows from operating activities. During 2011, net working capital increased, primarily due to an increase in receivables, which reduced our cash flows from operating activities. A decrease in net working capital, primarily as a result of a decrease in Inventories, net, positively impacted cash flows from operating activities during 2010.There were significant cash outflows of $22.7 million, $32.7 million and $39.6 million during 2015, 2014 and 2013, respectively.CharterRoots Acquisition in 2012. Theand $15.3 million for the Simsmart acquisition. Cash flows from investing activities during 2014 were impacted by the net cash costoutflows of $948.8 million associated with the Charter Acquisition, net of cash acquired, was approximately $1.7 billion.Victor Acquisition. During 2011,2013, the acquisitions of RosscorGII, Clarus, ČKDK, TLT-Babcock, Alphair and COT-PuritechSicelub resulted in net cash outflows of $56.3$399.9 million. During 2010, we had cash outflows of $28.0 million related to the acquisition of Baric. Capital expenditures for 2012 of $83.6 million were significantly higher than $14.8 million and $12.5 million used in 2011 and 2010, respectively, due to the much larger scale of our operations in 2012.in 2012during 2015 were also significantly impacted by the Charterrefinancing of the 2015 Deutsche Bank Credit Agreement further discussed under "—Borrowing Arrangements" above. Additionally, cash flows from financing activities during 2015 were impacted by the share repurchases discussed under “—Equity Capital”.AsThe Victor Acquisition was funded through net proceeds of $610.4 million from the sale of newly issued Common stock and $338.4 million of borrowings under our Deutsche Bank Credit Agreement. Cash flows from financing activities during 2014 were also impacted by the conversion of the Series A Perpetual Convertible Preferred Stock further discussed above under “—“—Equity Capital,Capital.” we raised $805.0 million of cashCash flows from sales of our equity securitiesfinancing activities for 2013 were impacted by the amendments to the BDT Investor, Steven and Mitchell Rales and Markel in January 2012, and $293.4 million in a primary offering settled in March 2012. Also, asDeutsche Bank Credit Agreement further discussed above under “—Borrowing Arrangements,Arrangements” and the May 2013 sale of newly issued Common stock further discussed above under “—Equity Capital.” we borrowed approximately $1.7 billionThe sale of term loans, $70.3our Common stock in May 2013 generated $319.9 million cash inflows from financing activities.which was repaid in 2012. The additional paymentshares of borrowings under term loans of $455 million primarily represents the repayment of borrowings under our Bank of America Credit Agreement, in conjunction with the financing of the Charter Acquisition. We also made cash payments for preferred stock dividends of $17.4 million.Ourless than wholly owned subsidiaries. During 2014, cash flows from financing activities during 2012 were also impacted by a $29.3included the $10.3 million acquisition of shares in ESAB India Limited, a publicly traded, less than wholly owned subsidiary in which the Company acquired a controlling interest in the Charter Acquisition. This acquisitionremaining ownership of shares was pursuant to a statutorily mandated tender offer triggered as a result of the Charter Acquisition.CashSvel and Howden Middle East. During 2013, cash flows from financing activities during 2011 included net borrowingsa $14.9 million acquisition of $29.0 million, which were primarily relatedcommon and investment shares of Soldex resulting in an increase in our ownership of the subsidiary from approximately 91% to the acquisitions of Rosscor and COT-Puritech.See “—Borrowing Arrangements” above for additional information regarding our outstanding indebtedness as of December 31, 2012.2012 includes $396.52015 included $186.9 million held in jurisdictions outside the U.S., which may be subject to tax penalties and other restrictions if repatriated into the U.S.2012. 1-3 Years 3-5 Years Total (In millions) Debt $ 34.8 $ 204.9 $ 673.3 $ 870.7 $ 1,783.7 Interest payments on debt(1) 69.8 131.7 153.3 50.8 405.6 Operating leases 30.2 37.5 17.1 40.9 125.7 Capital leases 31.6 2.3 — — 33.9 Purchase obligations(2) 359.8 20.1 0.3 0.4 380.6 Total $ 526.2 $ 396.5 $ 844.0 $ 962.8 $ 2,729.5 __________ 1-3 Years 3-5 Years Total (In millions) Debt $ 5.8 $ 9.1 $ 1,411.3 $ — $ 1,426.2 27.6 54.9 38.9 — 121.4 Operating leases 32.1 35.4 26.5 47.3 141.3 Capital leases 2.0 0.3 0.1 0.2 2.6 340.7 9.7 0.7 0.3 351.4 Total $ 408.2 $ 109.4 $ 1,477.5 $ 47.8 $ 2,042.9 Variable interest payments are estimated using a static rate of 3.93%1.83%.Excludes open purchase orders for goods or services that are provided on demand, the timing of which is not certain. cash funding requirements associated with our pension and other post-retirement benefit plans as of December 31, 2012,2015, which are estimated to be approximately $51.8$34.9 million for the year endedending December 31, 2013.2016. Other long-term liabilities, such as those for asbestos and other legal claims, employee benefit plan obligations, deferred income taxes and liabilities for unrecognized income tax benefits, are excluded from the above table since they are not contractually fixed as to timing and amount.$338.1$360.4 million, unconditional purchase obligations with suppliers of $351.4 million, and $59.7 million of bank guarantees at December 31, 2012 and $125.7$141.3 million of future operating lease payments.Disclosure under Section 13(r)(1)(D)(iii) of the Exchange ActDuring the fiscal year, a few of our independently operated foreign subsidiaries which we acquired in 2012 made the final shipments necessary to wind down four sales agreements involving parties identified in section 560.304 of title 31 of the Code of Federal Regulations. These foreign subsidiaries entered into the original sales agreements in the years before we acquired them. The shipments were made as part of our foreign subsidiaries’ voluntary withdrawal from the Iranian market, which was implemented as part of the foreign subsidiaries’ integration into our comprehensive international trade compliance program, which prohibits sales to Iran.The transactions were conducted in accordance with economic sanctions statutes and regulations administered by the U.S. Department of the Treasury’s Office of Foreign Assets Controls, other U.S. statutes restricting trade with Iran, and with applicable local laws in Europe. As part of our effort to ensure our compliance with U.S. sanctions, the Company consulted with U.S. government personnel who administer certain Iranian sanctions prior to some of the shipments. The transactions did not involve U.S.-origin content and U.S. persons did not control, approve, facilitate or otherwise participate in the transactions. In addition, our foreign subsidiaries requested and obtained the required authorizations under local export control laws in Europe to complete the transactions. The gross revenue for each shipment was $653,718, $1,499,400, $2,527,797, and $5,524,525, with profit margins of 23.6% and 20.4% on the first two shipments and losses on the remaining two shipments. Colfax is committed to continuing to comply fully with all U.S. economic sanctions. As part of that commitment, all of the Company’s foreign subsidiaries have voluntarily withdrawn from selling into the Iranian market. As a result, neither Colfax nor any of its foreign subsidiaries intend to conduct any future shipments to Iran.assessesassess whether an alternative forecast period is appropriate. Taking these factors into account and the inherent uncertainties, we believe that we can reasonably estimate the asbestos-related liability for pending and future claims that will be resolved in the next 15 years and have recorded that liability as our best estimate. While it is reasonably possible that the subsidiaries will incur costs after this period, we do not believe the reasonably possible loss or range of reasonably possible loss is estimable at the current time. Accordingly, no accrual has been recorded for any costs which may be paid after the next 15 years. Defense costs associated with asbestos-related liabilities as well as costs incurred related to litigation against the subsidiaries’ insurers are expensed as incurred.As of December 31, 2012, we had total asbestos liabilities, including current portion, of $434.0 million and total asbestos insurance assets, including current portion, of $394.8 million. 16,15, “Commitments and Contingencies” in the accompanying Notes to Consolidated Financial Statements for additional information regarding our asbestos liabilities and insurance assets.isand indefinite-lived intangible assets are considered to be impaired when the net book value of a reporting unit or asset exceeds its estimatedimplied fair value.orand a market valuation approach. The discounted cash flows model indicates the fair value of the reporting units based on the present value of the cash flows that the reporting units are expected to generate in the future. Significant estimates in the discounted cash flows model include: the weighted average cost of capital; long-term rate of growth and profitability of our business; and working capital effects. The market valuation approach indicates the fair value of the business based on a comparison of the Company against certain market information. Significant estimates in the market approach model include identifying appropriate market multiples and assessing earnings before interest, income taxes, depreciation and amortization in estimating the fair value of the reporting units.analysesannual Goodwill impairment analysis performed as of September 29, 2012, October 1, 201126, 2015, September 27, 2014 and October 2, 2010September 28, 2013 indicated no impairment to be present. However, actual2012,2015, we have Goodwill of $2.1$2.8 billion and indefinite lived trade names of $395.3 million that isare subject to at least annual review offor impairment. See Note 7, “Goodwill and Intangible Assets” in the accompanying Notes to Consolidated Financial Statements for further information.During 2012, the valuation allowance increased from $79.9 million to $372.0 million. The acquired Charter businesses operate in certain territories which have not historically been profitable or profitability is not expected in the near term. As such, valuation allowances were established in the initial accounts where realization of deferred tax assets was not more likely than not. For Colfax, certain deferred tax assets existing at the date were reassessed in light of the impact of the acquired businesses on expected future income or loss by country and future tax planning, including the impact of the post-acquisition capital structure. This assessment resulted in a $50.3 million increase in the Company’s valuation allowance to provide full valuation allowance against U.S. deferred tax assets.In 2012, additional losses were recorded in territories, including the U.S., where full valuation allowances were established at the time of the Charter Acquisition. The more likely than not realization standard was applied to these additional deferred tax assets and a full valuation allowance was provided.effectaffect our estimates, such as the availability of new information, the lapsing of applicable statutes of limitations, the conclusion of tax audits and, if applicable, the conclusion of any court proceedings. To the extent we prevail in matters for which liabilities for unrecognized tax benefits have been established or are required to pay amounts in excess of our liabilities for unrecognized tax benefits, our effective income tax rate in a given period could be materially affected. The Company recognizes interest and penalties related to unrecognized tax benefits in the Provision for (benefit from) income taxes in the Consolidated Statements of Operations.Income. Net liabilities for unrecognized income tax benefits, including accrued interest and penalties, were $84.2$52.8 million as of December 31, 20122015 and are included in Other liabilities in the accompanying Consolidated Balance Sheet.underwhen title passes to the completed contract method whenbuyer and all of the following criteria are met: persuasive evidence of an arrangement exists, the price is fixed or determinable, product delivery has occurred or services have been rendered, there are no further obligations to customers, and collectibility is probable. Product delivery occurs when title and risk of loss transfer to the customer. Our shipping terms vary based on the contract. If any significant obligations to the customer with respect to such sale remain to be fulfilled following shipment, typically involving obligations relating to installation and acceptance by the buyer, revenue recognition is deferred until such obligations have been fulfilled. Any customer allowances and discounts are recorded as a reduction in reported revenues at the time of sale because these allowances reflect a reduction in the sales price for the products sold. These allowances and discounts are estimated based on historical experience and known trends. Revenue related to service agreements is recognized as revenue over the term of the agreement.construction projectslong-term contracts using the “percentage of completion method” in accordance with U.S. GAAP. Under this method, contract revenues are recognized over the performance period of the contract in direct proportion to the costs incurred as a percentage of total estimated costs for the entirety of the contract. Any recognized revenues that have not been billed to a customer are recorded as a component of Trade receivables and any billings of customers in excess of recognized revenues are recorded as a component of Accounts payable. As of December 31, 2012,2015, there were $97.1$149.5 million of revenues in excess of billings and $178.3$146.3 million of billings in excess of revenues on constructionlong-term contracts in the Consolidated Balance Sheet.$16.5$39.5 million and $2.6$27.3 million as of December 31, 20122015 and 2011,2014, respectively. The current year increase was primarily driven by an increase in the allowance for doubtful accounts of specific South American customers of $9.4 million. If the financial condition of our customers were to deteriorate, resulting in an impairment of their ability to make payments, additional allowances could be required.20122015 are variable-ratevariable rate facilities based on LIBOR or EURIBOR. In order to mitigate our interest rate risk, we periodically enter into interest rate swap or collar agreements. A hypothetical increase in the interest rate of 1.00% during 2015would have increased Interest expense by approximately $17.8 million during 2012.2012,2015, approximately 80%72% of our sales were derived from operations outside the U.S. We have significant manufacturing operations in European countries that are not part of the Eurozone. Sales revenues are more highly weighted toward the Euro and U.S. dollar. We also have significant contractual obligations as discussed above, in U.S. dollars that are met with cash flows in other currencies as well as U.S. dollars. To better match revenue and expense as well as cash needs from contractual liabilities, we regularly enter into cross currency swaps and forward contracts.€157.6 million term A-3 facilityEuro denominated borrowings under the 2015 Deutsche Bank Credit Agreement (the “Term Loan A-3”), discussed above, providesprovide a natural hedge to a portion of our European net asset position. The effect of a change in currency exchange rates on our net investment in international subsidiaries, net of the translation effect of the Company’s Term Loan A-3,Euro denominated borrowings, is reflected in the Accumulated other comprehensive loss component of Equity. A 10% depreciation in major currencies, relative to the U.S. dollar as of December 31, 20122015 (net of the translation effect of our Term Loan A-3)Euro denominated borrowings) would result in a reduction in Equity of approximately $120$300 million.U.SU.S. dollar as our functional currency for reporting purposes, we have manufacturing sites throughout the world, and a substantial portion of our costs are incurred and sales are generated in foreign currencies. Costs incurred and sales recorded by subsidiaries operating outside of the U.S. are translated into U.S. dollars using exchange rates effective during the respective period. As a result, we are exposed to movements in the exchange rates of various currencies against the U.S. dollar. In particular, the Company has more sales in European currencies than it has expenses in those currencies. Although a significant portion of this difference is hedged, when European currencies strengthen or weaken against the U.S. dollar, operating profits are increased or decreased, respectively.2012, we had no2015, our open commodity futures contracts.ourthe accompanying Notes to Consolidated Financial Statements included in this Form 10-K for additional information regarding our derivative instruments. Report of Independent Registered Public Accounting Firm – Internal Control Over Financial Reporting Report of Independent Registered Public Accounting Firm – Consolidated Financial Statements Consolidated Statements of OperationsIncomeConsolidated Statements of Comprehensive Loss(Loss) IncomeConsolidated Balance Sheets Consolidated Statements of Equity Consolidated Statements of Cash Flows Notes to Consolidated Financial Statements Note 1. Organization and Nature of Operations Note 2. Summary of Significant Accounting Policies Note 3. Recently Issued Accounting Pronouncements 56Note 4. Acquisitions 56Note 5. Net (Loss) Income Per Share59Note 6. Income Taxes 60Note 7. Goodwill and Intangible Assets 63Note 8. Property, Plant and Equipment, Net 64Note 9. Inventories, Net 64Note 10. Debt 64Note 11. Equity 66Note 12. Accrued Liabilities 69Note 13. Defined Benefit Plans 71Note 14. Financial Instruments and Fair Value Measurements 78Note 15. Concentration of Credit RiskCommitments and Contingencies81Note 16. Commitments and ContingenciesSegment Information82Note 17. Segment Information85Note 18. Selected Quarterly Data—(unaudited)8743922012,2015, based on criteria established in Internal Control—IntegratedControl-Integrated Framework issued by the Committee of Sponsoring Organizations of the Treadway Commission (2013 framework) (the COSO criteria). Colfax Corporation’s management is responsible for maintaining effective internal control over financial reporting, and for its assessment of the effectiveness of internal control over financial reporting included in the accompanyingItem 9A, Management’s Annual Report on Internal Control Over Financial Reporting. Our responsibility is to express an opinion on the company’s internal control over financial reporting based on our audit.As indicated in the accompanying Management’s Annual Report on Internal Control Over Financial Reporting listed in the Index at Item 9A, management’s assessment of and conclusion on the effectiveness of internal control over financial reporting did not include the internal controls of Charter and Soldex, which are included in the 2012 consolidated financial statements of Colfax Corporation and collectively constituted 81% and 86% of total and net assets, respectively, as of December 31, 2012 and 83% of net sales for the year then ended. Our audit of internal control over financial reporting of Colfax Corporation also did not include an evaluation of the internal control over financial reporting of Charter and Soldex.2012,2015, based on the COSO criteria.20122015 and 2011,2014, and the related consolidated statements of operations andincome, comprehensive loss,(loss) income, equity and cash flows for each of the three years in the period ended December 31, 20122015 of Colfax Corporation and our report dated February 18, 201316, 2016 expressed an unqualified opinion thereon.18, 201320122015 and 2011,2014, and the related consolidated statements of operations andincome, comprehensive loss,(loss) income, equity and cash flows for each of the three years in the period ended December 31, 2012.2015. Our audits also included the financial statement schedule listedreferred to in the Index at Item 15.15(A)(2). These financial statements and schedule are the responsibility of the Company's management. Our responsibility is to express an opinion on these consolidated financial statements and schedule based on our audits.20122015 and 2011,2014, and the consolidated results of its operations and its cash flows for each of the three years in the period ended December 31, 2012,2015, in conformity with U.S. generally accepted accounting principles. Also, in our opinion, the related financial statement schedule, when considered in relation to the basic financial statements taken as a whole, presents fairly in all material respects the information set forth therein.2012,2015, based on criteria established in Internal Control-Integrated Framework issued by the Committee of Sponsoring Organizations of the Treadway Commission (2013 framework) and our report dated February 18, 201316, 2016 expressed an unqualified opinion thereon.18, 2013OPERATIONS(InINCOMEamounts) Year Ended December 31, 2012 2011 2010 Net sales $ 3,913,856 $ 693,392 $ 541,987 Cost of sales 2,761,731 453,293 350,579 Gross profit 1,152,125 240,099 191,408 Selling, general and administrative expense 895,452 162,761 133,507 Charter acquisition-related expense 43,617 31,052 — Restructuring and other related charges 60,060 9,680 10,323 Asbestos coverage litigation expense 12,987 10,700 13,206 Operating income 140,009 25,906 34,372 Interest expense 91,570 5,919 6,684 Income before income taxes 48,439 19,987 27,688 Provision for income taxes 90,703 15,432 11,473 Net (loss) income (42,264 ) 4,555 16,215 Less: income attributable to noncontrolling interest, net of taxes 22,138 — — Net (loss) income attributable to Colfax Corporation (64,402 ) 4,555 16,215 Dividends on preferred stock 18,951 — — Net (loss) income available to Colfax Corporation common shareholders $ (83,353 ) $ 4,555 $ 16,215 Net (loss) income per share – basic and diluted $ (0.92 ) $ 0.10 $ 0.37 Year Ended December 31, 2015 2014 2013 Net sales $ 3,967,053 $ 4,624,476 $ 4,207,209 Cost of sales 2,715,279 3,145,631 2,900,987 Gross profit 1,251,774 1,478,845 1,306,222 Selling, general and administrative expense 905,952 1,011,171 864,328 Restructuring and other related charges 61,177 58,121 35,502 Operating income 284,645 409,553 406,392 Interest expense 47,743 51,305 103,597 Income before income taxes 236,902 358,248 302,795 Provision for (benefit from) income taxes 49,724 (62,025 ) 93,652 Net income 187,178 420,273 209,143 Less: income attributable to noncontrolling interest, net of taxes 19,439 28,175 30,515 Net income attributable to Colfax Corporation 167,739 392,098 178,628 Dividends on preferred stock — 2,348 20,396 Preferred stock conversion inducement payment — 19,565 — Net income available to Colfax Corporation common shareholders $ 167,739 $ 370,185 $ 158,232 Net income per share- basic $ 1.35 $ 3.06 $ 1.56 Net income per share- diluted $ 1.34 $ 3.02 $ 1.54 46LOSS(In thousands) Year Ended December 31, 2012 2011 2010 Net (loss) income attributable to Colfax Corporation $ (64,402 ) $ 4,555 $ 16,215 Other comprehensive income (loss): Foreign currency translation, net of tax of $(304), $(18), and $(1,224) 117,703 (11,465 ) (8,260 ) Unrealized loss on hedging activities, net of tax of $632, $0, and $0 (4,008 ) (161 ) (1,201 ) Changes in unrecognized pension and other post-retirement benefits cost, net of tax of $(5,835), $(654), and $(1,717) (91,495 ) (34,291 ) (18,690 ) Amounts reclassified to net (loss) income: Realized loss on hedging activities, net of tax of $0, $0, and $0 471 1,479 2,447 Pension and other post-retirement benefit cost, net of tax of $256, $114, and $89 8,557 4,160 4,986 Other comprehensive income (loss) 31,228 (40,278 ) (20,718 ) Less: other comprehensive income attributable to noncontrolling interest, net of tax of $0, $0 and $0 4,385 — — Other comprehensive income (loss) attributable to Colfax Corporation 26,843 (40,278 ) (20,718 ) Comprehensive loss attributable to Colfax Corporation common shareholders $ (37,559 ) $ (35,723 ) $ (4,503 ) Year Ended December 31, 2015 2014 2013 Net income $ 187,178 $ 420,273 $ 209,143 Other comprehensive (loss) income: Foreign currency translation, net of tax of $751, $1,885 and $(3,634) (317,909 ) (356,243 ) 6,210 Unrealized gain (loss) on hedging activities, net of tax of $19,349, $4,141 and $404 11,659 30,404 (10,404 ) Changes in unrecognized pension and other post-retirement benefit cost, net of tax of $6,373, $(20,117) and $575 29,323 (89,920 ) 77,071 Changes in deferred tax related to pension and other post-retirement benefit cost 3,817 1,934 — Amounts reclassified from Accumulated other comprehensive loss: Net pension and other post-retirement benefit cost, net of tax of $3,859, $2,063 and $715 7,300 5,282 10,022 Other comprehensive (loss) income (265,810 ) (408,543 ) 82,899 Comprehensive (loss) income (78,632 ) 11,730 292,042 Less: comprehensive (loss) income attributable to noncontrolling interest (3,347 ) 15,781 13,039 Comprehensive (loss) income attributable to Colfax Corporation $ (75,285 ) $ (4,051 ) $ 279,003 (Indata) December 31, 2012 2011 ASSETS CURRENT ASSETS: Cash and cash equivalents $ 482,449 $ 75,108 Trade receivables, less allowance for doubtful accounts of $16,464 and $2,578 873,382 117,475 Inventories, net 493,649 56,136 Other current assets 281,302 102,489 Total current assets 2,130,782 351,208 Property, plant and equipment, net 688,570 90,939 Goodwill 2,074,230 204,844 Intangible assets, net 779,049 41,029 Other assets 457,096 400,523 Total assets $ 6,129,727 $ 1,088,543 LIABILITIES AND EQUITY CURRENT LIABILITIES: Current portion of long-term debt $ 34,799 $ 10,000 Accounts payable 699,626 54,035 Accrued liabilities 441,033 176,007 Total current liabilities 1,175,458 240,042 Long-term debt, less current portion 1,693,512 101,518 Other liabilities 1,104,471 557,708 Total liabilities 3,973,441 899,268 Equity: Preferred stock, $0.001 par value; 20,000,000 and 10,000,000 shares authorized; 13,877,552 and none issued and outstanding 14 — Common stock, $0.001 par value; 400,000,000 and 200,000,000 shares authorized; 94,067,418 and 43,697,570 issued and outstanding 94 44 Additional paid-in capital 2,197,694 415,527 Accumulated deficit (138,856 ) (55,503 ) Accumulated other comprehensive loss (146,594 ) (170,793 ) Total Colfax Corporation equity 1,912,352 189,275 Noncontrolling interest 243,934 — Total equity 2,156,286 189,275 Total liabilities and equity $ 6,129,727 $ 1,088,543 December 31, 2015 2014 ASSETS CURRENT ASSETS: Cash and cash equivalents $ 197,469 $ 305,448 Trade receivables, less allowance for doubtful accounts of $39,505 and $27,256 888,166 1,029,150 Inventories, net 420,386 442,732 Other current assets 253,744 296,948 Total current assets 1,759,765 2,074,278 Property, plant and equipment, net 644,536 727,435 Goodwill 2,817,687 2,873,023 Intangible assets, net 995,712 1,043,583 Other assets 515,219 493,198 Total assets $ 6,732,919 $ 7,211,517 LIABILITIES AND EQUITY CURRENT LIABILITIES: Current portion of long-term debt $ 5,792 $ 9,855 Accounts payable 718,893 780,287 Accrued liabilities 391,659 489,983 Total current liabilities 1,116,344 1,280,125 Long-term debt, less current portion 1,411,755 1,526,955 Other liabilities 948,264 1,051,993 Total liabilities 3,476,363 3,859,073 Equity: Common stock, $0.001 par value; 400,000,000 shares authorized; 123,486,425 and 123,730,578 issued and outstanding 123 124 Additional paid-in capital 3,199,267 3,200,832 Retained earnings 557,300 389,561 Accumulated other comprehensive loss (686,715 ) (443,691 ) Total Colfax Corporation equity 3,069,975 3,146,826 Noncontrolling interest 186,581 205,618 Total equity 3,256,556 3,352,444 Total liabilities and equity $ 6,732,919 $ 7,211,517 (Innoted) Common Stock Preferred Stock Additional
Paid-In Accumulated Accumulated
Other
Comprehensive Noncontrolling Shares $ Amount Shares $ Amount Capital Deficit Loss Interest Total Balance at January 1, 2010 43,413,553 $ 43 — $ — $ 402,852 $ (76,273 ) $ (109,797 ) $ — $ 216,825 Net (loss) income — — — — — 16,215 — — 16,215 Other comprehensive income (loss) — — — — — — (20,718 ) — (20,718 ) Common stock-based award activity — — — — 4,049 — — — 4,049 Balance at December 31, 2010 43,413,553 $ 43 — $ — $ 406,901 $ (60,058 ) $ (130,515 ) $ — $ 216,371 Net (loss) income — — — — — 4,555 — — 4,555 Other comprehensive income (loss) — — — — — — (40,278 ) — (40,278 ) Common stock-based award activity 284,017 1 — — 8,626 — — — 8,627 Balance at December 31, 2011 43,697,570 $ 44 — $ — $ 415,527 $ (55,503 ) $ (170,793 ) $ — $ 189,275 Net (loss) income — — — — — (64,402 ) — 22,138 (42,264 ) Acquisitions — — — — — — — 259,229 259,229 Sale of stock of entity previously controlled — — — — — — — (4,414 ) (4,414 ) Distributions to noncontrolling owners — — — — — — — (9,721 ) (9,721 ) ESAB India repurchase of additional noncontrolling interest — — — — 1,035 — (2,644 ) (27,683 ) (29,292 ) Preferred stock dividend — — — — — (18,951 ) — — (18,951 ) Other comprehensive income, net of tax of $5.3 million — — — — — — 26,843 4,385 31,228 Common stock issuances, net of costs of $20.2 million 49,917,786 50 — — 1,432,921 — — — 1,432,971 Preferred stock issuance, net of costs of $7.0 million — — 13,877,552 14 332,958 — — — 332,972 Common stock-based award activity 452,062 — — — 15,253 — — — 15,253 Balance at December 31, 2012 94,067,418 $ 94 13,877,552 $ 14 $ 2,197,694 $ (138,856 ) $ (146,594 ) $ 243,934 $ 2,156,286 Common Stock Preferred Stock Additional Paid-In Capital (Accumulated Deficit) Retained Earnings Accumulated Other Comprehensive Loss Noncontrolling Interest Total Shares $ Amount Shares $ Amount Balance at January 1, 2013 94,067,418 $ 94 13,877,552 $ 14 $ 2,197,694 $ (138,856 ) $ (146,594 ) $ 243,934 $ 2,156,286 Net income — — — — — 178,628 — 30,515 209,143 Distributions to noncontrolling owners — — — — — — — (14,260 ) (14,260 ) Acquisition of shares held by noncontrolling interest — — — — 955 — (381 ) (15,487 ) (14,913 ) Preferred stock dividend — — — — — (20,396 ) — — (20,396 ) Other comprehensive income (loss), net of tax of $(1.9) million — — — — — — 100,375 (17,476 ) 82,899 Common stock issuances, net of costs of $12.0 million 7,500,000 8 — — 319,890 — — — 319,898 Common stock-based award activity 265,995 — — — 17,589 — — — 17,589 Contribution to defined benefit pension plan 88,200 — — — 4,877 — — — 4,877 Balance at December 31, 2013 101,921,613 102 13,877,552 14 2,541,005 19,376 (46,600 ) 227,226 2,741,123 Net income — — — — — 392,098 — 28,175 420,273 Distributions to noncontrolling owners — — — — — — — (12,007 ) (12,007 ) Acquisition of shares held by noncontrolling interest — — — — 15,986 — (942 ) (25,382 ) (10,338 ) Preferred stock dividend — — — — — (2,348 ) — — (2,348 ) Preferred stock conversion 12,173,291 12 (13,877,552 ) (14 ) 2 (19,565 ) — — (19,565 ) Other comprehensive loss, net of tax of $(13.8) million and $(0.2) million — — — — — — (396,149 ) (12,394 ) (408,543 ) Common stock issuance, net of costs of $22.1 million 9,200,000 9 — — 610,354 — — — 610,363 Common stock-based award activity 252,674 — — — 21,636 — — — 21,636 Contribution to defined benefit pension plan 183,000 1 — — 11,849 — — — 11,850 Balance at December 31, 2014 123,730,578 124 — — 3,200,832 389,561 (443,691 ) 205,618 3,352,444 Net income — — — — — 167,739 — 19,439 187,178 Distributions to noncontrolling owners — — — — — — — (15,690 ) (15,690 ) Other comprehensive loss, net of tax of $(26.2) million and $(0.4) million — — — — — — (243,024 ) (22,786 ) (265,810 ) Stock repurchase (986,279 ) (1 ) — — (27,366 ) — — — (27,367 ) Common stock-based award activity 676,126 — — — 22,373 — — — 22,373 Contribution to defined benefit pension plan 66,000 — — — 3,428 — — — 3,428 Balance at December 31, 2015 123,486,425 $ 123 — $ — $ 3,199,267 $ 557,300 $ (686,715 ) $ 186,581 $ 3,256,556
(In thousands)
| Year Ended December 31, | ||||||||||||
| 2012 | 2011 | 2010 | ||||||||||
| Cash flows from operating activities: | ||||||||||||
| Net (loss) income | $ | (42,264 | ) | $ | 4,555 | $ | 16,215 | |||||
| Adjustments to reconcile net (loss) income to net cash provided by operating activities: | ||||||||||||
| Depreciation, amortization and fixed asset impairment charges | 200,400 | 23,333 | 16,807 | |||||||||
| Stock-based compensation expense | 9,373 | 4,908 | 3,137 | |||||||||
| Unrealized loss on acquisition-related foreign currency derivatives | — | 21,146 | — | |||||||||
| Deferred income tax expense (benefit) | 7,222 | (1,722 | ) | (296 | ) | |||||||
| Changes in operating assets and liabilities, net of acquisitions: | ||||||||||||
| Trade receivables, net | (37,338 | ) | (5,972 | ) | (6,060 | ) | ||||||
| Inventories, net | 26,694 | 10,844 | 11,598 | |||||||||
| Accounts payable | 88,927 | (7,298 | ) | 12,615 | ||||||||
| Changes in other operating assets and liabilities | (88,715 | ) | 7,359 | 7,949 | ||||||||
| Net cash provided by operating activities | 164,299 | 57,153 | 61,965 | |||||||||
| Cash flows from investing activities: | ||||||||||||
| Purchase of fixed assets | (83,586 | ) | (14,786 | ) | (12,527 | ) | ||||||
| Acquisitions, net of cash received | (1,859,645 | ) | (56,346 | ) | (27,960 | ) | ||||||
| Proceeds from sale of stock of entity previously controlled | 4,730 | — | — | |||||||||
| Cash contribution to unconsolidated entity | (2,873 | ) | — | — | ||||||||
| Proceeds from sale of fixed assets | 399 | 1,162 | 74 | |||||||||
| Net cash used in investing activities | (1,940,975 | ) | (69,970 | ) | (40,413 | ) | ||||||
| Cash flows from financing activities: | ||||||||||||
| Borrowings under term credit facility | 1,731,523 | — | — | |||||||||
| Payments under term credit facility | (531,415 | ) | (10,000 | ) | (8,750 | ) | ||||||
| Proceeds from borrowings on revolving credit facilities | 13,149 | 141,203 | 5,500 | |||||||||
| Repayments of borrowings on revolving credit facilities | (53,414 | ) | (102,180 | ) | (5,500 | ) | ||||||
| Payments of deferred loan costs | (9,887 | ) | — | — | ||||||||
| Proceeds from the issuance of common stock, net | 756,762 | 3,719 | 912 | |||||||||
| Proceeds from the issuance of preferred stock, net | 332,969 | — | — | |||||||||
| ESAB India repurchase of additional noncontrolling interest | (29,292 | ) | — | — | ||||||||
| Payments of dividends on preferred stock | (17,446 | ) | — | — | ||||||||
| Payments on capital leases | — | — | (205 | ) | ||||||||
| Net cash provided by (used in) financing activities | 2,192,949 | 32,742 | (8,043 | ) | ||||||||
| Effect of foreign exchange rates on Cash and cash equivalents | (8,932 | ) | (5,359 | ) | (2,930 | ) | ||||||
| Increase in Cash and cash equivalents | 407,341 | 14,566 | 10,579 | |||||||||
| Cash and cash equivalents, beginning of period | 75,108 | 60,542 | 49,963 | |||||||||
| Cash and cash equivalents, end of period | $ | 482,449 | $ | 75,108 | $ | 60,542 | ||||||
| Supplemental Disclosure of Cash Flow Information: | ||||||||||||
| Interest payments | $ | 79,857 | $ | 5,209 | $ | 6,105 | ||||||
| Income tax payments, net | 70,677 | 16,731 | 5,819 | |||||||||
| Year Ended December 31, | |||||||||||
| 2015 | 2014 | 2013 | |||||||||
| Cash flows from operating activities: | |||||||||||
| Net income | $ | 187,178 | $ | 420,273 | $ | 209,143 | |||||
| Adjustments to reconcile net income to net cash provided by operating activities: | |||||||||||
| Depreciation, amortization and impairment charges | 154,542 | 174,724 | 119,258 | ||||||||
| Stock-based compensation expense | 16,321 | 17,580 | 13,334 | ||||||||
| Non-cash interest expense | 10,101 | 9,094 | 44,377 | ||||||||
| Gain on revaluation of Sicelub investment | — | — | (13,784 | ) | |||||||
| Deferred income tax (benefit) provision | (22,717 | ) | (139,488 | ) | 9,946 | ||||||
| Changes in operating assets and liabilities, net of acquisitions: | |||||||||||
| Trade receivables, net | 64,048 | (19,916 | ) | (98,912 | ) | ||||||
| Inventories, net | (390 | ) | 57,847 | 79,987 | |||||||
| Accounts payable | (11,184 | ) | (54,666 | ) | 128,889 | ||||||
| Changes in other operating assets and liabilities | (94,086 | ) | (79,690 | ) | (130,069 | ) | |||||
| Net cash provided by operating activities | 303,813 | 385,758 | 362,169 | ||||||||
| Cash flows from investing activities: | |||||||||||
| Purchases of fixed assets | (69,877 | ) | (84,458 | ) | (71,482 | ) | |||||
| Acquisitions, net of cash received | (196,007 | ) | (948,800 | ) | (372,476 | ) | |||||
| Loans to non-trade creditors | — | — | (31,012 | ) | |||||||
| Other, net | 18,927 | 3,115 | — | ||||||||
| Net cash used in investing activities | (246,957 | ) | (1,030,143 | ) | (474,970 | ) | |||||
| Cash flows from financing activities: | |||||||||||
| Borrowings under term credit facility | 750,000 | 150,000 | 50,861 | ||||||||
| Payments under term credit facility | (1,232,872 | ) | (15,542 | ) | (679,755 | ) | |||||
| Proceeds from borrowings on revolving credit facilities and other | 1,498,039 | 1,370,626 | 648,000 | ||||||||
| Repayments of borrowings on revolving credit facilities and other | (1,104,055 | ) | (1,414,146 | ) | (328,133 | ) | |||||
| Proceeds from issuance of common stock, net | 6,052 | 613,927 | 324,153 | ||||||||
| Repurchases of common stock | (27,367 | ) | — | — | |||||||
| Acquisition of shares held by noncontrolling interest | — | (10,338 | ) | (14,913 | ) | ||||||
| Preferred stock conversion inducement payment | — | (19,565 | ) | — | |||||||
| Payments of dividend on preferred stock | — | (3,853 | ) | (20,396 | ) | ||||||
| Other | (21,066 | ) | (21,060 | ) | (24,870 | ) | |||||
| Net cash (used in) provided by financing activities | (131,269 | ) | 650,049 | (45,053 | ) | ||||||
| Effect of foreign exchange rates on Cash and cash equivalents | (33,566 | ) | (11,517 | ) | (13,294 | ) | |||||
| Decrease in Cash and cash equivalents | (107,979 | ) | (5,853 | ) | (171,148 | ) | |||||
| Cash and cash equivalents, beginning of period | 305,448 | 311,301 | 482,449 | ||||||||
| Cash and cash equivalents, end of period | $ | 197,469 | $ | 305,448 | $ | 311,301 | |||||
| Supplemental Disclosure of Cash Flow Information: | |||||||||||
| Interest payments | $ | 36,363 | $ | 42,041 | $ | 58,970 | |||||
| Income tax payments, net | 79,540 | 82,694 | 93,856 | ||||||||
these adjustments.
COLFAX CORPORATION
NOTES TO CONSOLIDATED FINANCIAL STATEMENTS – (Continued)
As of December 31, 2014, there were $190.7 million of revenues in excess of billings and $175.3 million of billings in excess of revenues on long-term contracts in the Consolidated Balance Sheet.
Customers may also request that the Company store products on their behalf until the product is needed. Under these arrangements, revenue is recognized when title and risk of loss have passed to the customer.
Advertising Costs
Advertising costs of $15.7 million, $1.2 million, and $0.5 million for the years ended December 31, 2012, 2011 and 2010,2013, respectively, are expensed as incurred and are included in Selling, general and administrative expense in the Consolidated Statements of Operations.
Income.
Accounts receivable
During the year ended December 31, 2015, the Company recorded an increase in the allowance for doubtful accounts of specific South American customers of $9.4 million.
COLFAX CORPORATION
NOTES TO CONSOLIDATED FINANCIAL STATEMENTS – (Continued)
Goodwill and indefinite-lived intangible assets are considered to be impaired when the net book value of a reporting unit or asset exceeds its implied fair value.
an indefinite-lived intangible asset included in the gas- and fluid-handling segment for the year ended December 31, 2013. This impairment resulted from a decline in anticipated revenue related to this asset. The impairment loss is included in Selling, general and administrative expense in the Consolidated Statement of Income for the year ended December 31, 2013 and was calculated as the difference between the fair value of the asset under the relief from royalty method and its carrying value as of the date of the impairment test.
COLFAX CORPORATION
NOTES TO CONSOLIDATED FINANCIAL STATEMENTS – (Continued)
2014. The fair value of these assets of $3.3 million as of December 31, 2014 are included in Level Three of the fair value hierarchy and are not material to the Consolidated Financial Statements.
Self-Insurance
The Company is self-insured for a portion of its product liability, workers’ compensation, general liability, medical coverage and certain other liability exposures. The Company accrues loss reserves up to the retention amounts when such amounts are reasonably estimable and probable. The Company’s reserves, included in Other accrued liabilities in the Consolidated Balance Sheets, related to self-insurance are as follows:
| December 31, | ||||||||
| 2012 | 2011 | |||||||
| (In thousands) | ||||||||
| Medical insurance | $ | 383 | $ | 1,086 | ||||
| Workers’ compensation | 260 | 246 | ||||||
| Total self-insurance reserves | $ | 643 | $ | 1,332 | ||||
COLFAX CORPORATION
NOTES TO CONSOLIDATED FINANCIAL STATEMENTS – (Continued)
Income. Revenues and expenses are translated at average rates of exchange in effect during the year. Operations.Income. Estimates are established using historical information as to the nature, frequency, and average costs of warranty claims. accrued liabilities in the Company’s Consolidated Financial Statements, consisted of the following: Year Ended December 31, 2012 2011 2010 (In thousands) Warranty liability, beginning of period $ 2,987 $ 2,963 $ 2,852 Accrued warranty expense 10,468 2,491 2,079 Changes in estimates related to pre-existing warranties 9 (368 ) (589 ) Cost of warranty service work performed (23,457 ) (2,479 ) (1,264 ) Acquisitions 51,367 477 — Foreign exchange translation effect (937 ) (97 ) (115 ) Warranty liability, end of period $ 40,437 $ 2,987 $ 2,963 Year Ended December 31, 2015 2014 (In thousands) Warranty liability, beginning of period $ 51,135 $ 65,512 Accrued warranty expense 21,092 23,019 Changes in estimates related to pre-existing warranties (1,820 ) (9,966 ) Cost of warranty service work performed (29,342 ) (27,389 ) Acquisitions 321 4,488 Foreign exchange translation effect (3,979 ) (4,529 ) Warranty liability, end of period $ 37,407 $ 51,135 Deferreddeferred income tax assets and liabilities of a change in tax rates is generally recognized in Provision for (benefit from) income taxes in the period that includes the enactment date.Deferreddeferred income taxestax assets will not be realized. In evaluating the need for a valuation allowance, the Company takes into account various factors, including the expected level of future taxable income and available tax planning strategies. Any changes in judgment about the valuation allowance are recorded through Provision for (benefit from) income taxes and are based on changes in facts and circumstances regarding realizability of deferred tax assets.Operations.Revenues and expenses are translated at average rates of exchange in effect during the year. The amounts recorded in each year in Foreign currency translation are net of income taxes to the extent the underlying equity balances in the entities are not deemed to be permanently reinvested.COLFAX CORPORATIONNOTES TO CONSOLIDATED FINANCIAL STATEMENTS – (Continued)OperationsIncome for that period.netCompany considers the Venezuelan bolivar fuerte (“bolivar”) a highly inflationary currency. Therefore, financial statements of the Company’s Venezuelan operations are remeasured into their parents’ reporting currency. During the years ended December 31, 2014 and 2013, currency devaluations of approximately 87% and 32%, respectively, of the bolivar relative to the U.S. dollar resulted in foreign currency transaction (loss) gain was $(1.2) million, $0.2losses of $6.3 million and $(0.4)$2.9 million recognized in Selling, general and administrative expense in the Consolidated Statements of Income for the years ended December 31, 2012, 20112014 and 2010,2013, respectively.DeferredNet deferred issuance costs of $11.4$8.1 million and $4.3$9.9 million, respectively, were included in Other assets in the Consolidated Balance Sheets as of December 31, 20122015 and 2011 net of $2.92014, which includes $13.4 million and $2.5$8.6 million, respectively, of accumulated amortization. As of December 31, 2015, $6.9 million and $1.2 million of deferred issuance costs were included in Other assets and as a reduction of Long-term debt, respectively. As of December 31, 2014, $7.5 million and $2.4 million of deferred issuance costs were included in Other assets and as a reduction of Long-term debt, respectively. See further discussion of presentation of deferred issuance costs in the Consolidated Balance Sheets in Note 3, “Recently Issued Accounting Pronouncements” as a result of adoption of Accounting Standards Update No. 2015-03, “Interest—Imputation of Interest (Subtopic 835-30)”. During the years ended December 31, 2015, 2014 and 2013, the Company deferred $3.4 million, $0.3 million and $7.1 million, respectively, of debt issuance costs. Further, the carrying value of Long-term debt is reduced by an original issue discount, which is accreted to Interest expense using the effective interest method over the term of the related obligation. See Note 10, “Debt” for additional discussion regarding the Company’s borrowing arrangements.Given the impact of the Charter Acquisition on the Consolidated Financial Statements, certainJuly 2012,May 2014, the Financial Accounting Standards Board (“FASB”) issued Accounting Standards Update (“ASU”) No. 2012-02, “Intangibles—Goodwill and Other”2014-09, “Revenue from Contracts with Customers (Topic 606)” (“ASU No. 2012-02”2014-09”). ASU No. 2012-02 was intended2014-09 clarifies the principles for recognizing revenue to reducedepict the costtransfer of promised goods or services to customers in an amount that reflects the consideration to which the entity expects to be entitled in exchange for those goods or services. This guidance affects entities that enter into contracts with customers to transfer goods or services, and complexitysupersedes prior GAAP guidance, namely Accounting Standards Codification Topic 605—Revenue Recognition. In August 2015, the FASB issued ASU No. 2015-14, “Revenue from Contracts with Customers (Topic 606)”, which delays the effective date of performing an impairment testASU No. 2014-09 by one year. As a result, ASU No. 2014-09 will be effective for indefinite-lived intangible assetsfiscal years beginning after December 15, 2017, with early adoption permitted but not prior to the original effective date of annual periods beginning after December 15, 2016. ASU 2014-09 is to be applied retrospectively, or on a modified retrospective basis. The Company plans to apply ASU 2014-09 retrospectively as of January 1, 2018 and is currently evaluating the impact on its Consolidated Financial Statements.permitting an entity firstrequiring debt issuance costs related to assess qualitative factorsa recognized debt liability be presented in the balance sheet as a direct deduction from the carrying amount of that debt liability, consistent with debt discounts. Currently, debt issuance costs are presented as a deferred charge under GAAP. ASU No. 2015-03 is effective for fiscal years beginning after December 15, 2015, and is to determine whether it is more likely than not that the fair value of an indefinite-lived intangible asset is less than its carrying amount.be applied retrospectively, with early adoption permitted. The Company has early adopted ASU No. 2012-022015-03 during the year ended December 31, 2015 resulting in conjunction with its September 29, 2012 impairment analysis.$1.2 million of debt issuance costs, net of accumulated amortization, presented as a direct deduction to the Company’s Long-term debt in the Consolidated Balance Sheet as of December 31, 2015. The adoptionretrospective application of ASU No. 2012-02 did not have an impact on the Company’s Consolidated Financial Statements.4. AcquisitionsCharter International plcOn January 13, 2012, Colfax completed the Charter Acquisition for a total purchase price of approximately $2.6 billion. Under the terms of the Charter Acquisition, Charter shareholders received 730 pence in cash2015-03 decreased Other assets and 0.1241 newly issued shares of Colfax Common stock in exchange for each share of Charter’s ordinary stock. Charter is a global industrial manufacturing company focused on welding, cutting and automation and air and gas handling. The acquisition is expected to:enhance the Company’s business profile by providing a meaningful recurring revenue stream and considerable exposure to emerging markets;•enable Colfax to benefit from strong secular growth drivers, with a balance of short- and long-cycle businesses; andprovide an additional growth platform in the fragmented fabrication technology industry.
See Note 10, “Debt” and Note 11, “Equity” for a discussion of the respective financing components of the Charter Acquisition.
In connection with the Charter Acquisition, the Company incurred advisory, legal, valuation and other professional service fees, termination payments to Charter executives and realized losses on acquisition-related foreign exchange derivatives, which comprised Charter Acquisition-related expense
acquisition:
| January 13, | ||||
| 2012 | ||||
| (In thousands) | ||||
| Trade receivables | $ | 683,976 | ||
| Inventories | 449,906 | |||
| Property, plant and equipment | 562,129 | |||
| Goodwill | 1,625,635 | |||
| Intangible assets | 715,643 | |||
| Accounts payable | (378,114 | ) | ||
| Debt | (399,466 | ) | ||
| Other assets and liabilities, net | (466,457 | ) | ||
| 2,793,252 | ||||
| Less: net assets attributable to noncontrolling interest | (241,201 | ) | ||
| Net consideration | $ | 2,552,051 | ||
| 2015 | 2014 | 2013 | |||||||||
| (In thousands) | |||||||||||
| Trade receivables | $ | 15,680 | $ | 76,678 | $ | 74,387 | |||||
| Inventories | 20,898 | 107,785 | 49,871 | ||||||||
| Property, plant and equipment | 20,653 | 56,988 | 92,247 | ||||||||
| Goodwill | 85,216 | 612,866 | 284,294 | ||||||||
| Intangible assets | 85,113 | 389,700 | 104,272 | ||||||||
| Accounts payable | (9,909 | ) | (34,271 | ) | (70,122 | ) | |||||
| Debt | — | — | (10,942 | ) | |||||||
| Other assets and liabilities, net | (21,644 | ) | (260,946 | ) | (99,205 | ) | |||||
| Consideration, net of cash acquired | $ | 196,007 | $ | 948,800 | $ | 424,802 | |||||
| Intangible | Weighted-Average | |||||||
| Asset | Amortization | |||||||
| (In thousands) | Period (Years) | |||||||
| Customer relationships | $ | 215,310 | 7.10 | |||||
| Acquired technology | 77,485 | 10.33 | ||||||
| Backlog | 54,805 | 1.00 | ||||||
| Trademarks | 4,415 | 5.00 | ||||||
| Total amortizable intangible assets | $ | 352,015 | 6.84 | |||||
| Trade names – indefinite life | $ | 363,628 | n/a | |||||
Soldex
On October$2.7 million, $2.7 million and $4.3 million, during the years ended December 31, 2012,2015, 2014 and 2013, respectively, in connection with completed acquisitions which are included in Selling, general and administrative expense in the Company completedConsolidated Statements of Income.
not material.
The following table summarizes the Company’s best estimate of the aggregate fair value of the assets acquired and liabilities assumed at the date of acquisition. These amounts are determined based upon certain valuations and studies that have yet to be finalized, and accordingly, the assets acquired and liabilities assumed, as detailed below, are subject to adjustment once the detailed analyses are completed. Substantially all of the Goodwill recognized is not expected to be deductible for income tax purposes.
| October 31, | ||||
| 2012 | ||||
| (In thousands) | ||||
| Trade receivables | $ | 22,848 | ||
| Inventories | 32,985 | |||
| Property, plant and equipment | 28,921 | |||
| Goodwill | 115,571 | |||
| Intangible assets | 65,325 | |||
| Accounts payable | (6,682 | ) | ||
| Debt | (36,734 | ) | ||
| Other assets and liabilities, net | (33,654 | ) | ||
| 188,580 | ||||
| Less: net assets attributable to noncontrolling interest | (18,028 | ) | ||
| Net consideration | $ | 170,552 | ||
The following table summarizes Intangible assets acquired, excluding Goodwill, as of October 31, 2012:
| Intangible | Weighted-Average | |||||||
| Asset | Amortization | |||||||
| (In thousands) | Period (Years) | |||||||
| Customer relationships | $ | 51,673 | 20.00 | |||||
| Acquired technology | 3,261 | 10.00 | ||||||
| Total amortizable intangible assets | $ | 54,934 | 19.41 | |||||
| Trade names – indefinite life | $ | 10,391 | n/a | |||||
Other
The following acquisitions were accounted for using the acquisition method of accounting and, accordingly, the Consolidated Financial Statements include the financial position and results of operations from the respective date of acquisition:
Gas and Fluid Handling
On September 13, 2012, the Company completed the acquisition of the common stock of Co-Vent Group Inc. (“Co-Vent”) for $34.6 million. Co-Vent specializes in the custom design, manufacture, and testing of industrial fans, with its primary operations based in Quebec, Canada. As a result of this acquisition, the Company has expanded its product offerings in the industrial fan market.
On December 6, 2011, the Company completed the acquisition of COT-Puritech, Inc. (“COT-Puritech”), a domestic supplier of oil flushing and remediation services to power generation plants, refinery and petrochemical operators and other industrial manufacturing sites, with primary operations based in Canton, Ohio, for a total purchase price, net of cash acquired, of $39.4 million which includes the fair value of estimated additional contingent cash payments of $4.3 million at the acquisition date. The additional contingent cash payments will be paid over two years subject to the achievement of certain performance goals. See Note 14, “Financial Instruments and Fair Value Measurements” for discussion regarding the Company’s liability for contingent payment associated with the acquisition of COT-Puritech, which is included in the total purchase price. As a result of this acquisition, the Company has expanded its lubrication services offerings in the oil and gas and power generation end markets to include oil flushing and remediation services.
On February 14, 2011, the Company completed the acquisition of Rosscor Holding, B.V. (“Rosscor”) for $22.3 million, net of cash acquired. Rosscor is a supplier of multiphase pumping technology and certain other highly engineered fluid-handling systems, with its primary operations based in Hengelo, The Netherlands. As a result of this acquisition, the Company has expanded its product offerings in the oil and gas end market to include multiphase pump systems that many of its customers already purchase.
COLFAX CORPORATION
NOTES TO CONSOLIDATED FINANCIAL STATEMENTS – (Continued)
On August 19, 2010, the Company completed the acquisition of Baric Group (“Baric”) for $27.0 million, net of cash acquired. Additionally, during the year ended December 31, 2010, a final working capital settlement of $0.2 million was paid pursuant to terms of the Baric purchase agreements. Baric is a supplier of highly engineered fluid-handling systems primarily for lubrication applications, with its primary operations based in Blyth, United Kingdom.
Fabrication Technology
On April 13, 2012, the Company completed a $29.3 million acquisition of shares in ESAB India Limited, a publicly traded, less than wholly owned subsidiary in which the Company acquired a controlling interest in the Charter Acquisition. This resulted in an increase in the Company’s ownership of the subsidiary from 56% to 74%. This acquisition of shares was pursuant to a statutorily mandated tender offer triggered as a result of the Charter Acquisition.
In May 2012, the Company completed an $8.5 million acquisition, including the assumption of debt, of the remaining ownership of CJSC Sibes (“Sibes”), a less than wholly owned subsidiary in which the Company did not have a controlling interest. This resulted in an increase in the Company’s ownership of Sibes from 16% to 100%.
Unaudited Pro Forma Financial Information
The following unaudited proforma financial information presents Colfax’s consolidated financial information assuming the acquisitions of Charter and Soldex had taken place on January 1, 2011. These amounts are presented in accordance with GAAP, consistent with the Company’s accounting policies.
| Year Ended December 31, | ||||||||
| 2012 | 2011 | |||||||
| (Unaudited, in thousands) | ||||||||
| Net sales | $ | 4,096,401 | $ | 4,027,796 | ||||
| Net income (loss) available to Colfax common shareholders(1) | 88,212 | (116,862 | ) | |||||
__________
(1) Proforma net loss available to Colfax common shareholders for the year ended December 31, 2011 reflects the impact of certain expenses included in the Consolidated Statements of Operations for the year ended December 31, 2012, but excluded from the calculation of proforma net income for that period. These expenses include increased acquisition-related amortization expense of $79.9 million, $43.6 million of Charter acquisition-related expense, and a $50.3 million increase in the valuation allowance related to the Company’s deferred tax assets in the U.S., discussed further in Note 6, “Income Taxes.”
| Year Ended December 31, | ||||||||||||
| 2012 | 2011 | 2010 | ||||||||||
| (In thousands, except share data) | ||||||||||||
| Net (loss) income available to Colfax Corporation common shareholders | $ | (83,353 | ) | $ | 4,555 | $ | 16,215 | |||||
| Weighted-average shares of Common stock outstanding – basic | 91,069,640 | 43,634,937 | 43,389,878 | |||||||||
| Net effect of potentially dilutive securities(1) | — | 633,173 | 277,347 | |||||||||
| Weighted-average shares of Common stock outstanding – diluted | 91,069,640 | 44,268,110 | 43,667,225 | |||||||||
| Net (loss) income per share – basic and diluted | $ | (0.92 | ) | $ | 0.10 | $ | 0.37 | |||||
__________
COLFAX CORPORATION
NOTES TO CONSOLIDATED FINANCIAL STATEMENTS – (Continued)
The Company calculates
| Year Ended December 31, | |||||||||||
| 2015 | 2014 | 2013 | |||||||||
| (In thousands, except share data) | |||||||||||
| Computation of Net income per share - basic: | |||||||||||
| Net income available to Colfax Corporation common shareholders | $ | 167,739 | $ | 370,185 | $ | 158,232 | |||||
Less: net income attributable to participating securities(1) | — | — | (3,740 | ) | |||||||
| $ | 167,739 | $ | 370,185 | $ | 154,492 | ||||||
| Weighted-average shares of Common stock outstanding - basic | 124,101,033 | 121,143,790 | 99,198,570 | ||||||||
| Net income per share - basic | $ | 1.35 | $ | 3.06 | $ | 1.56 | |||||
| Computation of Net income per share - diluted: | |||||||||||
| Net income available to Colfax Corporation common shareholders | $ | 167,739 | $ | 370,185 | $ | 158,232 | |||||
Less: net income attributable to participating securities(1) | — | — | (3,740 | ) | |||||||
| $ | 167,739 | $ | 370,185 | $ | 154,492 | ||||||
| Weighted-average shares of Common stock outstanding - basic | 124,101,033 | 121,143,790 | 99,198,570 | ||||||||
| Net effect of potentially dilutive securities - stock options and restricted stock units | 768,616 | 1,522,502 | 1,167,885 | ||||||||
| Weighted-average shares of Common stock outstanding - diluted | 124,869,649 | 122,666,292 | 100,366,455 | ||||||||
| Net income per share - diluted | $ | 1.34 | $ | 3.02 | $ | 1.54 | |||||
| Year Ended December 31, | ||||||||||||
| 2012 | 2011 | 2010 | ||||||||||
| (In thousands) | ||||||||||||
| (Loss) income before income taxes: | ||||||||||||
| Domestic operations | $ | (73,467 | ) | $ | (27,645 | ) | $ | (12,737 | ) | |||
| Foreign operations | 121,906 | 47,632 | 40,425 | |||||||||
| $ | 48,439 | $ | 19,987 | $ | 27,688 | |||||||
| Provision for (benefit from) income taxes: | ||||||||||||
| Current: | ||||||||||||
| Federal | $ | — | $ | 182 | $ | (30 | ) | |||||
| State | 362 | (94 | ) | 261 | ||||||||
| Foreign | 83,119 | 17,066 | 11,538 | |||||||||
| 83,481 | 17,154 | 11,769 | ||||||||||
| Deferred: | ||||||||||||
| Domestic operations | 50,340 | — | — | |||||||||
| Foreign operations | (43,118 | ) | (1,722 | ) | (296 | ) | ||||||
| 7,222 | (1,722 | ) | (296 | ) | ||||||||
| $ | 90,703 | $ | 15,432 | $ | 11,473 | |||||||
| Year Ended December 31, | |||||||||||
| 2015 | 2014 | 2013 | |||||||||
| (In thousands) | |||||||||||
| Income (loss) before income taxes: | |||||||||||
| Domestic operations | $ | (16,487 | ) | $ | 53,153 | $ | (7,899 | ) | |||
| Foreign operations | 253,389 | 305,095 | 310,694 | ||||||||
| $ | 236,902 | $ | 358,248 | $ | 302,795 | ||||||
| Provision for (benefit from) income taxes: | |||||||||||
| Current: | |||||||||||
| Federal | $ | 465 | $ | 798 | $ | (464 | ) | ||||
| State | 1,076 | 2,047 | 871 | ||||||||
| Foreign | 70,900 | 74,618 | 83,299 | ||||||||
| 72,441 | 77,463 | 83,706 | |||||||||
| Deferred: | |||||||||||
| Domestic operations | $ | (1,231 | ) | $ | (127,114 | ) | $ | 11,603 | |||
| Foreign operations | (21,486 | ) | (12,374 | ) | (1,657 | ) | |||||
| (22,717 | ) | (139,488 | ) | 9,946 | |||||||
| $ | 49,724 | $ | (62,025 | ) | $ | 93,652 | |||||
| Year Ended December 31, | ||||||||||||
| 2012 | 2011 | 2010 | ||||||||||
| (In thousands) | ||||||||||||
| Taxes calculated at the U.S. federal statutory rate | $ | 16,954 | $ | 6,995 | $ | 9,691 | ||||||
| State taxes | 362 | (421 | ) | (5 | ) | |||||||
| Effect of international tax rates | (24,070 | ) | (2,988 | ) | (2,522 | ) | ||||||
| Change in enacted international tax rates | (12,305 | ) | — | — | ||||||||
| Changes in valuation allowance and tax reserves | 106,802 | 11,177 | 3,827 | |||||||||
| Other | 2,960 | 669 | 482 | |||||||||
| Provision for income taxes | $ | 90,703 | $ | 15,432 | $ | 11,473 | ||||||
| Year Ended December 31, | |||||||||||
| 2015 | 2014 | 2013 | |||||||||
| (In thousands) | |||||||||||
| Taxes calculated at the U.S. federal statutory rate | $ | 82,940 | $ | 125,386 | $ | 105,978 | |||||
| State taxes | 768 | 2,323 | 871 | ||||||||
| Effect of tax rates on international operations | (36,364 | ) | (34,619 | ) | (42,972 | ) | |||||
| Change in enacted international tax rates | (4,415 | ) | (149 | ) | (5,217 | ) | |||||
| Changes in valuation allowance and tax reserves | 1,784 | (156,071 | ) | 30,554 | |||||||
| Other | 5,011 | 1,105 | 4,438 | ||||||||
| Provision for (benefit from) income taxes | $ | 49,724 | $ | (62,025 | ) | $ | 93,652 | ||||
| December 31, | ||||||||
| 2012 | 2011 | |||||||
| (In thousands) | ||||||||
| Deferred tax assets: | ||||||||
| Post-retirement benefit obligation | $ | 124,487 | $ | 39,172 | ||||
| Expenses currently not deductible | 124,537 | 50,121 | ||||||
| Net operating loss carryover | 288,017 | 51,614 | ||||||
| Tax credit carryover | 11,706 | 5,882 | ||||||
| Depreciation and amortization | 17,010 | — | ||||||
| Other | 7,228 | 1,358 | ||||||
| Valuation allowance | (372,039 | ) | (79,855 | ) | ||||
| Deferred tax assets, net | $ | 200,946 | $ | 68,292 | ||||
| Deferred tax liabilities: | ||||||||
| Depreciation and amortization | $ | (286,173 | ) | $ | (13,437 | ) | ||
| Post-retirement benefit obligation | (4,843 | ) | — | |||||
| Inventory | (4,400 | ) | — | |||||
| Other | (29,620 | ) | (14,688 | ) | ||||
| Total deferred tax liabilities | $ | (325,036 | ) | $ | (28,125 | ) | ||
| Total deferred tax (liabilities) assets, net | $ | (124,090 | ) | $ | 40,167 | |||
| December 31, | |||||||
| 2015 | 2014 | ||||||
| (In thousands) | |||||||
| Deferred tax assets: | |||||||
| Post-retirement benefit obligation | $ | 75,045 | $ | 92,995 | |||
| Expenses currently not deductible | 109,283 | 116,247 | |||||
| Net operating loss carryforward | 211,627 | 228,863 | |||||
| Tax credit carryforward | 10,343 | 11,509 | |||||
| Depreciation and amortization | 7,533 | 11,121 | |||||
| Other | 25,379 | 22,285 | |||||
| Valuation allowance | (161,030 | ) | (159,252 | ) | |||
| Deferred tax assets, net | $ | 278,180 | $ | 323,768 | |||
| Deferred tax liabilities: | |||||||
| Depreciation and amortization | $ | (317,464 | ) | $ | (353,660 | ) | |
| Post-retirement benefit obligation | (13,581 | ) | (12,116 | ) | |||
| Inventory | (17,122 | ) | (16,549 | ) | |||
| Other | (174,367 | ) | (193,618 | ) | |||
| Total deferred tax liabilities | $ | (522,534 | ) | $ | (575,943 | ) | |
| Total deferred tax liabilities, net | $ | (244,354 | ) | $ | (252,175 | ) | |
| (In thousands) | ||||
| Balance, December 31, 2010 | $ | 8,896 | ||
| Addition for tax positions taken in prior periods | 852 | |||
| Addition for tax positions taken in the current period | 191 | |||
| Reduction for tax positions taken in prior periods | (5,802 | ) | ||
| Other, including the impact of foreign currency translation | (60 | ) | ||
| Balance, December 31, 2011 | 4,077 | |||
| Aquisitions | 73,249 | |||
| Addition for tax positions taken in prior periods | 1,391 | |||
| Addition for tax positions taken in the current period | 5,241 | |||
| Reduction for tax positions taken in prior periods | (3,695 | ) | ||
| Other, including the impact of foreign currency translation | 4,393 | |||
| Balance, December 31, 2012 | $ | 84,656 | ||
Prior year amounts were reclassified to be consistent with the current year presentation.
| (In thousands) | |||
| Balance, December 31, 2013 | $ | 71,595 | |
| Acquisitions | 37,328 | ||
| Addition for tax positions taken in prior periods | 3,752 | ||
| Addition for tax positions taken in the current period | 894 | ||
| Reduction for tax positions taken in prior periods | (27,601 | ) | |
| Other, including the impact of foreign currency translation | (8,443 | ) | |
| Balance, December 31, 2014 | 77,525 | ||
| Addition for tax positions taken in prior periods | 3,924 | ||
| Addition for tax positions taken in the current period | 924 | ||
| Reduction for tax positions taken in prior periods | (23,616 | ) | |
| Other, including the impact of foreign currency translation | (5,879 | ) | |
| Balance, December 31, 2015 | $ | 52,878 | |
2008.
Gas and Fluid Handling | Fabrication Technology | Total | ||||||||||
| (In thousands) | ||||||||||||
| Balance, January 1, 2011 | $ | 172,338 | $ | — | $ | 172,338 | ||||||
| Goodwill attributable to Rosscor acquisition | 10,212 | — | 10,212 | |||||||||
| Goodwill attributable to COT-Puritech acquisition | 25,073 | — | 25,073 | |||||||||
| Impact of foreign currency translation | (2,779 | ) | — | (2,779 | ) | |||||||
| Balance, December 31, 2011 | 204,844 | — | 204,844 | |||||||||
| Goodwill attributable to Charter Acquisition | 933,545 | 692,090 | 1,625,635 | |||||||||
| Goodwill attributable to Soldex Acquisition | — | 115,571 | 115,571 | |||||||||
| Goodwill attributable to other acquisitions | 21,376 | 5,699 | 27,075 | |||||||||
| Impact of foreign currency translation | 58,228 | 42,877 | 101,105 | |||||||||
| Balance, December 31, 2012 | $ | 1,217,993 | $ | 856,237 | $ | 2,074,230 | ||||||
2014:
Gas and Fluid Handling | Fabrication Technology | Total | |||||||||
| (In thousands) | |||||||||||
| Balance, January 1, 2014 | $ | 1,532,201 | $ | 877,498 | $ | 2,409,699 | |||||
Goodwill attributable to acquisitions(1) | — | 612,866 | 612,866 | ||||||||
| Impact of foreign currency translation and other | (103,843 | ) | (45,699 | ) | (149,542 | ) | |||||
| Balance, December 31, 2014 | 1,428,358 | 1,444,665 | 2,873,023 | ||||||||
| Goodwill attributable to acquisitions | 85,216 | — | 85,216 | ||||||||
| Impact of foreign currency translation and other | (87,308 | ) | (53,244 | ) | (140,552 | ) | |||||
| Balance, December 31, 2015 | $ | 1,426,266 | $ | 1,391,421 | $ | 2,817,687 | |||||
| December 31, | ||||||||||||||||
| 2012 | 2011 | |||||||||||||||
Gross Carrying Amount | Accumulated Amortization | Gross Carrying Amount | Accumulated Amortization | |||||||||||||
| (In thousands) | ||||||||||||||||
| Trade names – indefinite life | $ | 401,123 | $ | — | $ | 6,803 | $ | — | ||||||||
| Acquired customer relationships | 300,253 | (24,763 | ) | 29,798 | (12,987 | ) | ||||||||||
| Acquired technology | 107,018 | (12,466 | ) | 17,961 | (2,791 | ) | ||||||||||
| Acquired backlog | 63,984 | (62,432 | ) | 3,451 | (2,033 | ) | ||||||||||
| Other intangible assets | 12,352 | (6,020 | ) | 4,962 | (4,135 | ) | ||||||||||
| $ | 884,730 | $ | (105,681 | ) | $ | 62,975 | $ | (21,946 | ) | |||||||
See Note 4, “Acquisitions” for additional information regarding the activity in Goodwill and Intangible assets, net associated with acquisitions made by the Company during the years presented.
| December 31, | |||||||||||||||
| 2015 | 2014 | ||||||||||||||
| Gross Carrying Amount | Accumulated Amortization | Gross Carrying Amount | Accumulated Amortization | ||||||||||||
| (In thousands) | |||||||||||||||
| Trade names – indefinite life | $ | 395,319 | $ | — | $ | 410,600 | $ | — | |||||||
| Acquired customer relationships | 573,589 | (117,573 | ) | 593,799 | (85,171 | ) | |||||||||
| Acquired technology | 149,578 | (37,012 | ) | 113,697 | (27,681 | ) | |||||||||
| Acquired backlog | 2,575 | (2,220 | ) | — | — | ||||||||||
| Other intangible assets | 48,413 | (16,957 | ) | 50,287 | (11,948 | ) | |||||||||
| $ | 1,169,474 | $ | (173,762 | ) | $ | 1,168,383 | $ | (124,800 | ) | ||||||
| Year Ended December 31, | ||||||||||||
| 2012 | 2011 | 2010 | ||||||||||
| (In thousands) | ||||||||||||
| Selling, general and administrative expense | $ | 85,106 | $ | 7,821 | $ | 3,501 | ||||||
| Year Ended December 31, | |||||||||||
| 2015 | 2014 | 2013 | |||||||||
| (In thousands) | |||||||||||
| Selling, general and administrative expense | $ | 60,629 | $ | 67,052 | $ | 41,012 | |||||
| December 31, | ||||||||||
| Depreciable Life | 2012 | 2011 | ||||||||
| (In years) | (In thousands) | |||||||||
| Land | n/a | $ | 40,319 | $ | 14,786 | |||||
| Buildings and improvements | 5-40 | 314,216 | 38,642 | |||||||
| Machinery and equipment | 3-15 | 440,975 | 134,548 | |||||||
| Software | 3-5 | 70,092 | 16,948 | |||||||
| 865,602 | 204,924 | |||||||||
| Accumulated depreciation | (177,032 | ) | (113,985 | ) | ||||||
| Property, plant and equipment, net | $ | 688,570 | $ | 90,939 | ||||||
| December 31, | |||||||||
| Depreciable Life | 2015 | 2014(1) | |||||||
| (In years) | (In thousands) | ||||||||
| Land | n/a | $ | 44,746 | $ | 52,539 | ||||
| Buildings and improvements | 5-40 | 327,122 | 363,716 | ||||||
| Machinery and equipment | 3-15 | 546,052 | 524,723 | ||||||
| Software | 3-5 | 95,556 | 98,069 | ||||||
| 1,013,476 | 1,039,047 | ||||||||
| Accumulated depreciation | (368,940 | ) | (311,612 | ) | |||||
| Property, plant and equipment, net | $ | 644,536 | $ | 727,435 | |||||
| December 31, | ||||||||
| 2012 | 2011 | |||||||
| (In thousands) | ||||||||
| Raw materials | $ | 154,771 | $ | 25,241 | ||||
| Work in process | 99,459 | 26,376 | ||||||
| Finished goods | 263,211 | 20,378 | ||||||
| 517,441 | 71,995 | |||||||
| Less: customer progress billings | (14,571 | ) | (9,124 | ) | ||||
| Less: allowance for excess, slow-moving and obsolete inventory | (9,221 | ) | (6,735 | ) | ||||
| Inventories, net | $ | 493,649 | $ | 56,136 | ||||
| December 31, | |||||||
| 2015 | 2014 | ||||||
| (In thousands) | |||||||
| Raw materials | $ | 160,640 | $ | 164,115 | |||
| Work in process | 68,541 | 81,110 | |||||
| Finished goods | 243,209 | 239,808 | |||||
| 472,390 | 485,033 | ||||||
| Less: customer progress payments | (15,876 | ) | (7,728 | ) | |||
| Less: allowance for excess, slow-moving and obsolete inventory | (36,128 | ) | (34,573 | ) | |||
| Inventories, net | $ | 420,386 | $ | 442,732 | |||
| December 31, | ||||||||
| 2012 | 2011 | |||||||
| (In thousands) | ||||||||
| Term loans | $ | 1,682,177 | $ | 72,500 | ||||
| Revolving credit facilities and other | 46,134 | 39,018 | ||||||
| Total Debt | 1,728,311 | 111,518 | ||||||
| Less: current portion | (34,799 | ) | (10,000 | ) | ||||
| Long-term debt | $ | 1,693,512 | $ | 101,518 | ||||
As of December 31, 2011,
| December 31, | |||||||
| 2015 | 2014 | ||||||
| (In thousands) | |||||||
| Term loans | $ | 713,175 | $ | 1,210,474 | |||
| Trade receivables financing arrangement | 75,800 | 80,000 | |||||
| Revolving credit facilities and other | 628,572 | 246,336 | |||||
| Total Debt | 1,417,547 | 1,536,810 | |||||
| Less: current portion | (5,792 | ) | (9,855 | ) | |||
| Long-term debt | $ | 1,411,755 | $ | 1,526,955 | |||
COLFAX CORPORATION
NOTES TO CONSOLIDATED FINANCIAL STATEMENTS – (Continued)
During the year ended December 31, 2012, the Company terminated the2015 Deutsche Bank of America Credit Agreement, inbased upon the currency borrowed.
On January 13, 2012Income for the year ended December 31, 2015 of $4.7 million to write-off certain deferred financing fees and January 25, 2012, Colfaxoriginal issue discount and expensed approximately $0.4 million of costs incurred debt consisting of: (i) a $200 million term A-1 facility, (ii) a $500 million term A-2 facility, (iii) a €157.6 million term A-3 facility and (iv) a $900 million term B facility pursuant to a credit agreement (the “Deutsche Bank Credit Agreement”)in connection with Deutsche Bank Securities Inc., HSBC Securities (USA) Inc. and certain other lender parties named therein. In addition, the refinancing of the 2015 Deutsche Bank Credit Agreement has two revolving credit sub-facilities which total $300 million in commitments (the “Revolver”).Agreement. The Revolver includes a $200 million letter of credit sub-facility and a $50 million swingline loan sub-facility. The term A-1, term A-2, term A-3 and the Revolver variable-rate borrowings are subject to interest payments of LIBOR or the Euro Interbank Offered Rate (“EURIBOR”) plus a margin ranging from 2.50% to 3.25%, determined by our leverage ratio. Borrowings under the term B facility are also variable rate and are subject to interest payments of LIBOR plus a margin of 3.5%. The Revolver is subject to a commitment fee ranging from 37.5 to 50 basis points, determined by the Company’s leverage ratio. Additionally, as of December 31, 2012 the Company had an original issue discount of $55.4$7.5 million and deferred financing fees of $8.5$8.1 million included in its Consolidated Balance Sheet as of December 31, 2015, which were recognized in connection withwill be accreted to Interest expense primarily using the effective interest method, over the life of the 2015 Deutsche Bank Credit Agreement. As of December 31, 2012,
facility.
2015.
| (In thousands) | ||||
| 2013 | $ | 34,799 | ||
| 2014 | 119,307 | |||
| 2015 | 190,557 | |||
| 2016 | 423,170 | |||
| 2017 | 145,167 | |||
| Thereafter | 870,667 | |||
| Total contractual maturities | 1,783,667 | |||
| Debt discount | (55,356 | ) | ||
| Total debt | $ | 1,728,311 | ||
__________
| (In thousands) | |||
| 2016 | $ | 5,792 | |
| 2017 | 4,536 | ||
| 2018 | 4,598 | ||
| 2019 | 2,405 | ||
| 2020 | 1,408,916 | ||
| Total contractual maturities | 1,426,247 | ||
Debt discount(2) | (8,700 | ) | |
| Total debt | $ | 1,417,547 | |
In March 2012, the Company used a portion2015, and reflects management’s intention to repay scheduled maturities of the proceeds from the sale of Common stock to pay off $35.0 million in borrowingsterm loans outstanding under the term A facilities in advance of the scheduled payments. During the year ended December 31, 2012, the Company repaid an additional $26.3 million in borrowings under the term A facilities in advance of the scheduled payments. See Note 11, “Equity” for additional discussion regarding the Company’s stock issuances.
COLFAX CORPORATION
NOTES TO CONSOLIDATED FINANCIAL STATEMENTS – (Continued)
In connection with the2015 Deutsche Bank Credit Agreement and the trade receivables financing arrangement (if not extended) with proceeds from the revolving credit facility.
under the 2015 Deutsche Bank Credit Agreement.
In connection with the financing of the Charter Acquisition, on January 24, 2012,May 13, 2013, the Company sold (i) 14,756,945 newly issued shares of Colfax Common stock and (ii) 13,877,552 shares of newly created Series A perpetual convertible preferred stock, referred to as the Series A Preferred Stock, for an aggregate of $680 million (representing $24.50 per share of Series A Preferred Stock and $23.04 per share of Common stock) pursuant to a securities purchase agreement (the “BDT Purchase Agreement”) with BDT CF Acquisition Vehicle, LLC (the “BDT Investor”) as well as BDT Capital Partners Fund I-A, L.P., and Mitchell P. Rales, Chairman of Colfax’s Board of Directors, and his brother, Steven M. Rales (for the limited purpose of tag-along sales rights provided to the BDT Investor in the event of a sale or transfer of shares of Colfax Common stock by either or both of Mitchell P. Rales and Steven M. Rales). Under the terms of the Series A Preferred Stock, holders are entitled to receive cumulative cash dividends, payable quarterly, at a per annum rate of 6% of the liquidation preference (defined as $24.50, subject to customary antidilution adjustments), provided that the dividend rate shall be increased to a per annum rate of 8% if Colfax fails to pay the full amount of any dividend required to be paid on such shares until the date that full payment is made.
The Series A Preferred Stock is convertible, in whole or in part, at the option of the holders at any time after the date the shares were issued into shares of Colfax Common stock at a conversion rate determined by dividing the liquidation preference by a number equal to 114% of the liquidation preference, subject to certain adjustments. The Series A Preferred Stock is also convertible, in whole or in part, at the option of Colfax on or after the third anniversary of the issuance of the shares at the same conversion rate if, among other things: (i) for the preceding thirty trading days, the closing price of Colfax Common stock on the New York Stock Exchange exceeds 133% of the applicable conversion price and (ii) Colfax has declared and paid or set apart for payment all accrued but unpaid dividends on the Series A Preferred Stock.
On January 24, 2012, Colfax sold 2,170,139 to each of Mitchell P. Rales, Chairman of Colfax’s Board of Directors, and his brother Steven M. Rales and 1,085,070 to Markel Corporation, a Virginia corporation (“Markel”) of newly issued Colfax Common stock at $23.04 per share, for a total aggregate of $125 million, pursuant to separate securities purchase agreements with Mitchell P. Rales and Steven M. Rales, each of whom were beneficial owners of 20.9% of Colfax’s Common stock at the time of the sale, and Markel. Thomas S. Gayner, a member of Colfax’s Board of Directors, is President and Chief Investment Officer of Markel.
Consideration paid to Charter shareholders included 0.1241 shares of newly issued Colfax Common stock in exchange for each share of Charter’s ordinary stock, which resulted in the issuance of 20,735,493 shares of Common stock on January 24, 2012.
COLFAX CORPORATION
NOTES TO CONSOLIDATED FINANCIAL STATEMENTS – (Continued)
In conjunction with the issuance of the Common and Preferred stock discussed above, the Company recognized $14.7 million in equity issuance costs which were recorded as a reduction to Additional paid-in capital during the year ended December 31, 2012.
On March 5, 2012, the Company sold 8,000,0007,500,000 shares of newly issued Colfax Common stock to underwriters for public resale pursuant to a shelf registration statement for an aggregate purchase price of $272 million. Further, on March 9, 2012, the underwriters of the March 5, 2012 equity offering exercised their over-allotment option and the Company sold an additional 1,000,000 shares of newly issued Colfax Common stock to the underwriters for public resale pursuant to a shelf registration statement for an aggregate purchase price of $34$331.9 million. In conjunction with these issuances,this issuance, the Company recognized $12.6$12.0 million in equity issuance costs which were recorded as a reduction to Additional paid-in capital during the year ended December 31, 2012.
Dividend Restrictions
2013.
Directors is approximately $52 million.
| December 31, | ||||||||
| 2012 | 2011 | |||||||
| (In thousands) | ||||||||
| Foreign currency translation adjustment | $ | 104,718 | $ | (5,537 | ) | |||
| Unrealized loss on hedging activities | (3,980 | ) | (471 | ) | ||||
| Net unrecognized pension and other post-retirement benefit cost | (247,332 | ) | (164,785 | ) | ||||
| Accumulated other comprehensive loss | $ | (146,594 | ) | $ | (170,793 | ) | ||
The activity in Accumulated other comprehensive loss for the yearyears ended December 31, 2012 excludes2015, 2014 and 2013. All amounts are net of tax and noncontrolling interest.
| Accumulated Other Comprehensive Loss Components | |||||||||||||||
| Net Unrecognized Pension And Other Post-Retirement Benefit Cost | Foreign Currency Translation Adjustment | Unrealized Gain (Loss) On Hedging Activities | Total | ||||||||||||
| (In thousands) | |||||||||||||||
| Balance at January 1, 2013 | $ | (247,332 | ) | $ | 96,877 | $ | 3,861 | $ | (146,594 | ) | |||||
| Acquisition of shares held by noncontrolling interest | — | (381 | ) | — | (381 | ) | |||||||||
| Other comprehensive income (loss) before reclassifications: | |||||||||||||||
| Net actuarial gain | 77,515 | — | — | 77,515 | |||||||||||
| Foreign currency translation adjustment | (3,297 | ) | 24,349 | 39 | 21,091 | ||||||||||
| Gain on long-term intra-entity foreign currency transactions | — | 2,176 | — | 2,176 | |||||||||||
| Loss on net investment hedges | — | — | (14,261 | ) | (14,261 | ) | |||||||||
| Unrealized gain on cash flow hedges | — | — | 3,832 | 3,832 | |||||||||||
| Other comprehensive income (loss) before reclassifications | 74,218 | 26,525 | (10,390 | ) | 90,353 | ||||||||||
| Amounts reclassified from Accumulated other comprehensive loss | 10,022 | — | — | 10,022 | |||||||||||
| Net current period Other comprehensive income (loss) | 84,240 | 26,525 | (10,390 | ) | 100,375 | ||||||||||
| Balance at December 31, 2013 | $ | (163,092 | ) | $ | 123,021 | $ | (6,529 | ) | $ | (46,600 | ) | ||||
| Acquisition of shares held by noncontrolling interest | — | (942 | ) | — | (942 | ) | |||||||||
| Other comprehensive (loss) income before reclassifications: | |||||||||||||||
| Net actuarial loss | (89,379 | ) | — | — | (89,379 | ) | |||||||||
| Foreign currency translation adjustment | 4,742 | (351,234 | ) | (32 | ) | (346,524 | ) | ||||||||
| Gain on long-term intra-entity foreign currency transactions | — | 2,096 | — | 2,096 | |||||||||||
| Gain on net investment hedges | — | — | 39,374 | 39,374 | |||||||||||
| Unrealized loss on cash flow hedges | — | — | �� | (8,932 | ) | (8,932 | ) | ||||||||
| Other | 1,934 | — | — | 1,934 | |||||||||||
| Other comprehensive (loss) income before reclassifications | (82,703 | ) | (349,138 | ) | 30,410 | (401,431 | ) | ||||||||
| Amounts reclassified from Accumulated other comprehensive loss | 5,282 | — | — | 5,282 | |||||||||||
| Net current period Other comprehensive (loss) income | (77,421 | ) | (349,138 | ) | 30,410 | (396,149 | ) | ||||||||
| Balance at December 31, 2014 | $ | (240,513 | ) | $ | (227,059 | ) | $ | 23,881 | $ | (443,691 | ) | ||||
| Other comprehensive income (loss) before reclassifications: | |||||||||||||||
| Net actuarial gain | 28,349 | — | — | 28,349 | |||||||||||
| Foreign currency translation adjustment | 7,747 | (301,011 | ) | (382 | ) | (293,646 | ) | ||||||||
| Loss on long-term intra-entity foreign currency transactions | — | (550 | ) | — | (550 | ) | |||||||||
| Gain on net investment hedges | — | — | 14,537 | 14,537 | |||||||||||
| Unrealized loss on cash flow hedges | — | — | (2,873 | ) | (2,873 | ) | |||||||||
| Other | 3,817 | — | — | 3,817 | |||||||||||
| Other comprehensive income (loss) before reclassifications | 39,913 | (301,561 | ) | 11,282 | (250,366 | ) | |||||||||
| Amounts reclassified from Accumulated other comprehensive loss | 7,342 | — | — | 7,342 | |||||||||||
| Net current period Other comprehensive income (loss) | 47,255 | (301,561 | ) | 11,282 | (243,024 | ) | |||||||||
| Balance at December 31, 2015 | $ | (193,258 | ) | $ | (528,620 | ) | $ | 35,163 | $ | (686,715 | ) | ||||
| Year Ended December 31, 2015 | |||||||||||
| Amounts Reclassified From Accumulated Other Comprehensive Loss | Tax Benefit | Total | |||||||||
| (In thousands) | |||||||||||
| Pension and other post-retirement benefit cost: | |||||||||||
Amortization of net loss(1) | $ | 10,953 | $ | (3,744 | ) | $ | 7,209 | ||||
Amortization of prior service cost(1) | 248 | (115 | ) | 133 | |||||||
| $ | 11,201 | $ | (3,859 | ) | $ | 7,342 | |||||
| Year Ended December 31, 2014 | |||||||||||
| Amounts Reclassified From Accumulated Other Comprehensive Loss | Tax Benefit | Total | |||||||||
| (In thousands) | |||||||||||
| Pension and other post-retirement benefit cost: | |||||||||||
Amortization of net loss(1) | $ | 7,097 | $ | (2,063 | ) | $ | 5,034 | ||||
Amortization of prior service cost(1) | 248 | — | 248 | ||||||||
| $ | 7,345 | $ | (2,063 | ) | $ | 5,282 | |||||
| Year Ended December 31, 2013 | |||||||||||
| Amounts Reclassified From Accumulated Other Comprehensive Loss | Tax Benefit | Total | |||||||||
| (In thousands) | |||||||||||
| Pension and other post-retirement benefit cost: | |||||||||||
Amortization of net loss(1) | $ | 10,489 | $ | (715 | ) | $ | 9,774 | ||||
Amortization of prior service cost(1) | 248 | — | 248 | ||||||||
| $ | 10,737 | $ | (715 | ) | $ | 10,022 | |||||
adjustment.
| Year Ended December 31, | ||||||||||||
| 2012 | 2011 | 2010 | ||||||||||
| (In thousands) | ||||||||||||
| Stock-based compensation expense | $ | 9,373 | $ | 4,908 | $ | 3,137 | ||||||
| Deferred tax benefit | 305 | 1,719 | 1,120 | |||||||||
COLFAX CORPORATION
NOTES TO CONSOLIDATED FINANCIAL STATEMENTS – (Continued)
| Year Ended December 31, | ||||||||||||
| 2015 | 2014 | 2013 | ||||||||||
| (In thousands) | ||||||||||||
| Stock-based compensation expense | $ | 16,321 | $ | 17,580 | $ | 13,334 | ||||||
| Deferred tax benefit | 5,342 | 4,054 | 434 | |||||||||
| Year Ended December 31, | ||||||||||||
| 2012 | 2011 | 2010 | ||||||||||
| Expected period that options will be outstanding (in years) | 5.41 | 4.50 | 4.50 | |||||||||
| Interest rate (based on U.S. Treasury yields at the time of grant) | 0.99 | % | 2.10 | % | 2.38 | % | ||||||
| Volatility | 42.59 | % | 52.50 | % | 52.22 | % | ||||||
| Dividend yield | — | — | — | |||||||||
| Weighted-average fair value of options granted | $ | 13.14 | $ | 9.68 | $ | 5.63 | ||||||
| Year Ended December 31, | ||||||||||||
| 2015 | 2014 | 2013 | ||||||||||
| Expected period that options will be outstanding (in years) | 5.02 | 4.87 | 4.90 | |||||||||
| Interest rate (based on U.S. Treasury yields at the time of grant) | 1.62 | % | 1.62 | % | 1.06 | % | ||||||
| Volatility | 28.75 | % | 34.67 | % | 43.22 | % | ||||||
| Dividend yield | — | — | — | |||||||||
| Weighted-average fair value of options granted | $ | 11.87 | $ | 22.65 | $ | 18.07 | ||||||
Number of Options | Weighted- Average Exercise Price | Weighted- Remaining Term (In years) | Aggregate Intrinsic Value(1) (In thousands) | |||||||||||||
| Outstanding at January 1, 2012 | 1,461,157 | $ | 14.76 | |||||||||||||
| Granted | 1,265,781 | 33.37 | ||||||||||||||
| Exercised | (425,782 | ) | 12.59 | |||||||||||||
| Forfeited | (73,494 | ) | 29.27 | |||||||||||||
| Expired | (17,546 | ) | 14.96 | |||||||||||||
| Outstanding at December 31, 2012 | 2,210,116 | $ | 25.35 | 5.63 | $ | 33,142 | ||||||||||
| Vested or expected to vest at December 31, 2012 | 2,178,251 | $ | 25.28 | 5.62 | $ | 32,828 | ||||||||||
| Exercisable at December 31, 2012 | 614,885 | $ | 14.40 | 4.20 | $ | 15,653 | ||||||||||
__________
| Number of Options | Weighted- Average Exercise Price | Weighted- Average Remaining Contractual Term (In years) | Aggregate Intrinsic Value(1) (In thousands) | ||||||||||
| Outstanding at January 1, 2015 | 2,910,109 | $ | 40.19 | ||||||||||
| Granted | 2,135,169 | 41.63 | |||||||||||
| Exercised | (364,211 | ) | 16.62 | ||||||||||
| Forfeited | (381,156 | ) | 60.74 | ||||||||||
| Expired | (38,321 | ) | 41.74 | ||||||||||
| Outstanding at December 31, 2015 | 4,261,590 | $ | 41.07 | 5.05 | $ | 1,916 | |||||||
| Vested or expected to vest at December 31, 2015 | 4,196,996 | $ | 40.97 | 5.04 | $ | 1,916 | |||||||
| Exercisable at December 31, 2015 | 1,701,182 | $ | 35.06 | 3.40 | $ | 1,916 | |||||||
(1) | The aggregate intrinsic value is based upon the difference between the Company’s closing stock price at the date of the Consolidated Balance Sheet and the exercise price of the stock option for in-the-money stock options. The intrinsic value of outstanding stock options fluctuates based upon the trading value of the Company’s Common stock. |
COLFAX CORPORATION
NOTES TO CONSOLIDATED FINANCIAL STATEMENTS – (Continued)
Restricted Stock Units
2015 and 2014.
| PRSUs | RSUs | |||||||||||||||
Number of Units | Weighted- Average Grant Date Fair Value | Number of Units | Weighted- Average Grant Date Fair Value | |||||||||||||
| Nonvested at January 1, 2012 | 324,447 | $ | 15.99 | 64,263 | $ | 14.71 | ||||||||||
| Granted | 283,804 | 33.48 | 38,511 | 33.30 | ||||||||||||
| Vested | (17,942 | ) | 18.11 | (44,140 | ) | 15.40 | ||||||||||
| Forfeited | (29,358 | ) | 23.12 | (3,758 | ) | 28.94 | ||||||||||
| Nonvested at December 31, 2012 | 560,951 | $ | 24.40 | 54,876 | $ | 26.23 | ||||||||||
| PRSUs | RSUs | |||||||||||||
| Number of Units | Weighted- Average Grant Date Fair Value | Number of Units | Weighted- Average Grant Date Fair Value | |||||||||||
| Nonvested at January 1, 2015 | 581,936 | $ | 38.67 | 168,911 | $ | 56.13 | ||||||||
| Granted | 343,715 | 40.55 | 353,887 | 39.53 | ||||||||||
| Vested | (259,539 | ) | 25.64 | (66,366 | ) | 42.69 | ||||||||
| Forfeited | (143,101 | ) | 61.28 | (42,911 | ) | 54.99 | ||||||||
| Nonvested at December 31, 2015 | 523,011 | $ | 40.19 | 413,521 | $ | 44.20 | ||||||||
| December 31, | ||||||||
| 2012 | 2011 | |||||||
| (In thousands) | ||||||||
| Accrued payroll | $ | 99,583 | $ | 21,415 | ||||
| Advance payment from customers | 61,431 | 14,704 | ||||||
| Accrued taxes | 39,919 | 4,911 | ||||||
| Accrued asbestos-related liability | 58,501 | 76,295 | ||||||
| Warranty liability – current portion | 35,678 | 2,987 | ||||||
| Accrued restructuring liability – current portion | 25,406 | 4,573 | ||||||
| Accrued third-party commissions | 12,320 | 5,884 | ||||||
| Accrued Charter Acquisition-related liability | — | 29,430 | ||||||
| Other | 108,195 | 15,808 | ||||||
| Accrued liabilities | $ | 441,033 | $ | 176,007 | ||||
COLFAX CORPORATION
NOTES TO CONSOLIDATED FINANCIAL STATEMENTS – (Continued)
Accrued Restructuring Liability
The Company initiated a series of restructuring actions beginning in 2009 in response to then current and expected future economic conditions. The Company also communicated initiatives to improve productivity and reduce structural costs by rationalizing and leveraging its existing assets and back office functions. These initiatives include the consolidation of the Company’s commercial marine end-market operations, reduction in the back office personnel at several distribution centers in Europe, the closure of a small facility that previously produced units sold to certain customers located in the Middle East that the Company ceased supplying to during the year ended December 31, 2010, and the closure of a Portland, Maine production facility and consolidation of the operations with a Warren, Massachusetts facility.
| December 31, | |||||||
| 2015 | 2014(1) | ||||||
| (In thousands) | |||||||
| Accrued payroll | $ | 99,383 | $ | 120,068 | |||
| Advance payment from customers | 45,590 | 58,049 | |||||
| Accrued taxes | 51,834 | 52,599 | |||||
| Accrued asbestos-related liability | 48,780 | 50,175 | |||||
| Warranty liability - current portion | 36,128 | 47,966 | |||||
| Accrued restructuring liability - current portion | 12,918 | 21,846 | |||||
| Accrued third-party commissions | 10,275 | 11,026 | |||||
| Other | 86,751 | 128,254 | |||||
| Accrued liabilities | $ | 391,659 | $ | 489,983 | |||
During the year endedfurther discussion regarding these adjustments. The Company also retrospectively adjusted amounts recorded as of December 31, 2011,2014 for the Company relocated its Richmond, Virginia corporate headquarters to Fulton, Maryland and eliminated an executive position in its German operations.
As a resultadoption of the Charter Acquisition in 2012, theASU 2015-17. See Note 3, “Recently Issued Accounting Pronouncements” for further discussion.
The Company’s Consolidated Statements of Operations reflect the following amounts related to its restructuring activities:
| Year Ended December 31, | ||||||||||||
| 2012 | 2011 | 2010 | ||||||||||
| (In thousands) | ||||||||||||
| Restructuring and other related charges | $ | 60,060 | $ | 9,680 | $ | 10,323 | ||||||
COLFAX CORPORATION
NOTES TO CONSOLIDATED FINANCIAL STATEMENTS – (Continued)
Company. A summary of the activity in the Company’s restructuring liability included in Accrued liabilities and Other liabilities in the Consolidated Balance Sheets is as follows:
| Year Ended December 31, 2012 | ||||||||||||||||||||||||
| Balance at Beginning of Year | Acquisitions | Provisions | Payments | Foreign Currency Translation | Balance at End of Year(3) | |||||||||||||||||||
| (In thousands) | ||||||||||||||||||||||||
| Restructuring and other related charges: | ||||||||||||||||||||||||
| Gas and Fluid Handling: | ||||||||||||||||||||||||
| Termination benefits(1) | $ | 3,868 | $ | — | $ | 7,062 | $ | (8,014 | ) | $ | 144 | $ | 3,060 | |||||||||||
| Facility closure costs(2) | 633 | — | 1,301 | (756 | ) | (1 | ) | 1,177 | ||||||||||||||||
| Other related charges | 72 | — | 289 | (363 | ) | 2 | — | |||||||||||||||||
| 4,573 | — | 8,652 | (9,133 | ) | 145 | 4,237 | ||||||||||||||||||
| Fabrication Technology: | ||||||||||||||||||||||||
| Termination benefits(1) | — | 6,276 | 30,292 | (22,277 | ) | 346 | 14,637 | |||||||||||||||||
| Facility closure costs(2) | — | 3,994 | 10,584 | (7,800 | ) | 147 | 6,925 | |||||||||||||||||
| Other related charges | — | — | 1,205 | (1,174 | ) | 2 | 33 | |||||||||||||||||
| — | 10,270 | 42,081 | (31,251 | ) | 495 | 21,595 | ||||||||||||||||||
| Non-cash impairment | 3,155 | |||||||||||||||||||||||
| 45,236 | ||||||||||||||||||||||||
| Corporate and Other: | ||||||||||||||||||||||||
| Termination benefits(1) | — | — | 3,020 | (3,020 | ) | — | — | |||||||||||||||||
| Facility closure costs(2) | — | — | 1,899 | (415 | ) | 38 | 1,522 | |||||||||||||||||
| Other related charges | — | — | 1,253 | (1,253 | ) | — | — | |||||||||||||||||
| — | — | 6,172 | (4,688 | ) | 38 | 1,522 | ||||||||||||||||||
| $ | 4,573 | $ | 10,270 | 56,905 | $ | (45,072 | ) | $ | 678 | $ | 27,354 | |||||||||||||
| Non-cash impairment | 3,155 | |||||||||||||||||||||||
| $ | 60,060 | |||||||||||||||||||||||
__________
| Year Ended December 31, 2015 | |||||||||||||||||||
| Balance at Beginning of Period | Provisions | Payments | Foreign Currency Translation | Balance at End of Period(3) | |||||||||||||||
| (In thousands) | |||||||||||||||||||
| Restructuring and other related charges: | |||||||||||||||||||
| Gas and Fluid Handling: | |||||||||||||||||||
Termination benefits(1) | $ | 7,551 | $ | 19,927 | $ | (22,994 | ) | $ | (505 | ) | $ | 3,979 | |||||||
Facility closure costs(2) | 1,445 | 9,031 | (7,643 | ) | (176 | ) | 2,657 | ||||||||||||
| 8,996 | 28,958 | (30,637 | ) | (681 | ) | 6,636 | |||||||||||||
| Non-cash impairment | 2,569 | ||||||||||||||||||
| 31,527 | |||||||||||||||||||
| Fabrication Technology: | |||||||||||||||||||
Termination benefits(1) | 11,155 | 15,507 | (20,196 | ) | (435 | ) | 6,031 | ||||||||||||
Facility closure costs(2) | 1,937 | 5,321 | (6,647 | ) | (185 | ) | 426 | ||||||||||||
| 13,092 | 20,828 | (26,843 | ) | (620 | ) | 6,457 | |||||||||||||
| Non-cash impairment | 8,822 | ||||||||||||||||||
| 29,650 | |||||||||||||||||||
| Corporate and Other: | |||||||||||||||||||
Facility closure costs(2) | 922 | — | (254 | ) | (43 | ) | 625 | ||||||||||||
| 922 | — | (254 | ) | (43 | ) | 625 | |||||||||||||
| $ | 23,010 | 49,786 | $ | (57,734 | ) | $ | (1,344 | ) | $ | 13,718 | |||||||||
| Non-cash impairment | 11,391 | ||||||||||||||||||
| $ | 61,177 | ||||||||||||||||||
| Year Ended December 31, 2014 | |||||||||||||||||||
| Balance at Beginning of Period | Provisions | Payments | Foreign Currency Translation | Balance at End of Period(3) | |||||||||||||||
| (In thousands) | |||||||||||||||||||
| Restructuring and other related charges: | |||||||||||||||||||
| Gas and Fluid Handling: | |||||||||||||||||||
Termination benefits(1) | $ | 3,638 | $ | 18,179 | $ | (13,887 | ) | $ | (379 | ) | $ | 7,551 | |||||||
Facility closure costs(2) | 756 | 5,491 | (4,714 | ) | (88 | ) | 1,445 | ||||||||||||
| 4,394 | 23,670 | (18,601 | ) | (467 | ) | 8,996 | |||||||||||||
| Non-cash impairment | 2,863 | ||||||||||||||||||
| 26,533 | |||||||||||||||||||
| Fabrication Technology: | |||||||||||||||||||
Termination benefits(1) | 7,033 | 26,790 | (22,227 | ) | (441 | ) | 11,155 | ||||||||||||
Facility closure costs(2) | 1,429 | 3,018 | (2,355 | ) | (155 | ) | 1,937 | ||||||||||||
| 8,462 | 29,808 | (24,582 | ) | (596 | ) | 13,092 | |||||||||||||
| Non-cash impairment | 1,780 | ||||||||||||||||||
| 31,588 | |||||||||||||||||||
| Corporate and Other: | |||||||||||||||||||
Facility closure costs(2) | 1,259 | — | (275 | ) | (62 | ) | 922 | ||||||||||||
| 1,259 | — | (275 | ) | (62 | ) | 922 | |||||||||||||
| $ | 14,115 | 53,478 | $ | (43,458 | ) | $ | (1,125 | ) | $ | 23,010 | |||||||||
| Non-cash impairment | 4,643 | ||||||||||||||||||
| $ | 58,121 | ||||||||||||||||||
COLFAX CORPORATION
NOTES TO CONSOLIDATED FINANCIAL STATEMENTS – (Continued)
| Pension Benefits | Other Post-Retirement Benefits | |||||||||||||||
| Year Ended December 31, | Year Ended December 31, | |||||||||||||||
| 2012 | 2011 | 2012 | 2011 | |||||||||||||
| (In thousands) | ||||||||||||||||
| Change in benefit obligation: | ||||||||||||||||
| Projected benefit obligation, beginning of year | $ | 347,911 | $ | 331,288 | $ | 15,397 | $ | 13,803 | ||||||||
| Acquisitions | 1,148,906 | — | 22,629 | — | ||||||||||||
| Service cost | 3,381 | 1,383 | 110 | — | ||||||||||||
| Interest cost | 67,745 | 16,408 | 1,507 | 690 | ||||||||||||
| Actuarial (gain) loss | 135,715 | 25,764 | (1,449 | ) | 1,507 | |||||||||||
| Settlement(1) | — | (2,857 | ) | — | — | |||||||||||
| Foreign exchange effect | 45,458 | (1,921 | ) | — | — | |||||||||||
| Benefits paid | (84,333 | ) | (22,154 | ) | (2,675 | ) | (603 | ) | ||||||||
| Other | 355 | — | — | — | ||||||||||||
| Projected benefit obligation, end of year | $ | 1,665,138 | $ | 347,911 | $ | 35,519 | $ | 15,397 | ||||||||
| Accumulated benefit obligation, end of year | $ | 1,641,252 | $ | 343,767 | $ | 33,405 | $ | — | ||||||||
| Change in plan assets: | ||||||||||||||||
| Fair value of plan assets, beginning of year | $ | 221,004 | $ | 231,240 | $ | — | $ | — | ||||||||
| Acquisitions | 954,919 | — | — | — | ||||||||||||
| Actual return on plan assets | 100,153 | 6,864 | — | — | ||||||||||||
| Employer contribution(2) | 58,494 | 8,684 | 2,675 | 603 | ||||||||||||
| Settlement(1) | — | (3,388 | ) | — | — | |||||||||||
| Foreign exchange effect | 37,359 | (242 | ) | — | — | |||||||||||
| Benefits paid | (84,333 | ) | (22,154 | ) | (2,675 | ) | (603 | ) | ||||||||
| Other | 248 | — | — | — | ||||||||||||
| Fair value of plan assets, end of year | $ | 1,287,844 | $ | 221,004 | $ | — | $ | — | ||||||||
| Funded status, end of year | $ | (377,294 | ) | $ | (126,907 | ) | $ | (35,519 | ) | $ | (15,397 | ) | ||||
| Amounts recognized on the Consolidated Balance Sheet at December 31: | ||||||||||||||||
| Non-current assets | $ | 31,826 | $ | — | $ | — | $ | — | ||||||||
| Current liabilities | (5,639 | ) | (1,079 | ) | (3,076 | ) | (795 | ) | ||||||||
| Non-current liabilities | (403,481 | ) | (125,828 | ) | (32,443 | ) | (14,602 | ) | ||||||||
| Total | $ | (377,294 | ) | $ | (126,907 | ) | $ | (35,519 | ) | $ | (15,397 | ) | ||||
__________
| Pension Benefits | Other Post-Retirement Benefits | |||||||||||||||
| Year Ended December 31, | Year Ended December 31, | |||||||||||||||
| 2015 | 2014 | 2015 | 2014 | |||||||||||||
| (In thousands) | ||||||||||||||||
| Change in benefit obligation: | ||||||||||||||||
| Projected benefit obligation, beginning of year | $ | 1,765,493 | $ | 1,640,418 | $ | 35,085 | $ | 28,823 | ||||||||
| Acquisitions | 31,914 | 48,938 | 4,983 | 1,011 | ||||||||||||
| Service cost | 4,612 | 4,883 | 33 | 155 | ||||||||||||
| Interest cost | 54,807 | 70,469 | 1,170 | 1,304 | ||||||||||||
| Actuarial (gain) loss | (93,878 | ) | 211,170 | (6,410 | ) | 5,553 | ||||||||||
| Foreign exchange effect | (77,854 | ) | (97,525 | ) | — | — | ||||||||||
| Benefits paid | (105,589 | ) | (111,971 | ) | (1,942 | ) | (1,761 | ) | ||||||||
| Settlements | (29,811 | ) | (1,387 | ) | — | — | ||||||||||
| Other | 949 | 498 | �� | 174 | — | |||||||||||
| Projected benefit obligation, end of year | $ | 1,550,643 | $ | 1,765,493 | $ | 33,093 | $ | 35,085 | ||||||||
| Accumulated benefit obligation, end of year | $ | 1,530,327 | $ | 1,739,642 | $ | 33,093 | $ | 35,085 | ||||||||
| Change in plan assets: | ||||||||||||||||
| Fair value of plan assets, beginning of year | $ | 1,469,103 | $ | 1,367,315 | $ | — | $ | — | ||||||||
| Acquisitions | 28,591 | 42,051 | — | — | ||||||||||||
| Actual return on plan assets | (9,390 | ) | 174,065 | — | — | |||||||||||
Employer contribution(1) | 45,594 | 69,714 | 1,942 | 1,761 | ||||||||||||
| Foreign exchange effect | (63,060 | ) | (70,851 | ) | — | — | ||||||||||
| Benefits paid | (105,589 | ) | (111,971 | ) | (1,942 | ) | (1,761 | ) | ||||||||
| Settlements | (28,399 | ) | (1,387 | ) | — | — | ||||||||||
| Other | 555 | 167 | — | — | ||||||||||||
| Fair value of plan assets, end of year | $ | 1,337,405 | $ | 1,469,103 | $ | — | $ | — | ||||||||
| Funded status, end of year | $ | (213,238 | ) | $ | (296,390 | ) | $ | (33,093 | ) | $ | (35,085 | ) | ||||
| Amounts recognized on the Consolidated Balance Sheet at December 31: | ||||||||||||||||
| Non-current assets | $ | 73,914 | $ | 58,997 | $ | — | $ | — | ||||||||
| Current liabilities | (4,741 | ) | (5,328 | ) | (2,915 | ) | (2,749 | ) | ||||||||
| Non-current liabilities | (282,411 | ) | (350,059 | ) | (30,178 | ) | (32,336 | ) | ||||||||
| Total | $ | (213,238 | ) | $ | (296,390 | ) | $ | (33,093 | ) | $ | (35,085 | ) | ||||
(1) |
| Contributions during the |
2014.
COLFAX CORPORATION
NOTES TO CONSOLIDATED FINANCIAL STATEMENTS – (Continued)
2014.
| Foreign Pension Benefits | ||||||||
| Year Ended December 31, | ||||||||
| 2012 | 2011 | |||||||
| (In thousands) | ||||||||
| Change in benefit obligation: | ||||||||
| Projected benefit obligation, beginning of year | $ | 97,108 | $ | 95,136 | ||||
| Acquisitions | 957,080 | — | ||||||
| Service cost | 3,381 | 1,383 | ||||||
| Interest cost | 49,291 | 5,132 | ||||||
| Actuarial loss | 85,167 | 5,704 | ||||||
| Settlement(1) | — | (2,857 | ) | |||||
| Foreign exchange effect | 45,458 | (1,921 | ) | |||||
| Benefits paid | (56,816 | ) | (5,469 | ) | ||||
| Other | 355 | — | ||||||
| Projected benefit obligation, end of year | $ | 1,181,024 | $ | 97,108 | ||||
| Accumulated benefit obligation, end of year | $ | 1,157,140 | $ | 92,964 | ||||
| Change in plan assets: | ||||||||
| Fair value of plan assets, beginning of year | $ | 32,339 | $ | 34,071 | ||||
| Acquisitions | 817,258 | — | ||||||
| Actual return on plan assets | 58,139 | 3,039 | ||||||
| Employer contribution(2) | 49,640 | 4,328 | ||||||
| Settlement(1) | — | (3,388 | ) | |||||
| Foreign exchange effect | 37,359 | (242 | ) | |||||
| Benefits paid | (56,816 | ) | (5,469 | ) | ||||
| Other | 248 | — | ||||||
| Fair value of plan assets, end of year | $ | 938,167 | $ | 32,339 | ||||
| Funded status, end of year | $ | (242,857 | ) | $ | (64,769 | ) | ||
__________
(2)Contributions during the year ended December 31, 2012 included $18.9 million of supplemental contributions to pension plans in the United Kingdom as a result of financing the Charter Acquisition.
| Foreign Pension Benefits | ||||||||
| Year Ended December 31, | ||||||||
| 2015 | 2014 | |||||||
| (In thousands) | ||||||||
| Change in benefit obligation: | ||||||||
| Projected benefit obligation, beginning of year | $ | 1,265,143 | $ | 1,205,554 | ||||
| Acquisitions | — | 21,578 | ||||||
| Service cost | 4,506 | 4,883 | ||||||
| Interest cost | 37,253 | 51,658 | ||||||
| Actuarial (gain) loss | (64,801 | ) | 144,232 | |||||
| Foreign exchange effect | (77,854 | ) | (97,525 | ) | ||||
| Benefits paid | (60,162 | ) | (64,347 | ) | ||||
| Settlements | (29,811 | ) | (1,387 | ) | ||||
| Other | 949 | 497 | ||||||
| Projected benefit obligation, end of year | $ | 1,075,223 | $ | 1,265,143 | ||||
| Accumulated benefit obligation, end of year | $ | 1,054,907 | $ | 1,239,292 | ||||
| Change in plan assets: | ||||||||
| Fair value of plan assets, beginning of year | $ | 1,079,497 | $ | 999,197 | ||||
| Acquisitions | — | 20,873 | ||||||
| Actual return on plan assets | 11,159 | 139,460 | ||||||
| Employer contribution | 41,659 | 56,384 | ||||||
| Foreign exchange effect | (63,060 | ) | (70,851 | ) | ||||
| Benefits paid | (60,162 | ) | (64,347 | ) | ||||
| Settlements | (28,399 | ) | (1,387 | ) | ||||
| Other | 555 | 168 | ||||||
| Fair value of plan assets, end of year | $ | 981,249 | $ | 1,079,497 | ||||
| Funded status, end of year | $ | (93,974 | ) | $ | (185,646 | ) | ||
| Pension Benefits | Other Post- | |||||||||||
| All Plans | Foreign Plans | Retirement Benefits | ||||||||||
| (In thousands) | ||||||||||||
| 2013 | $ | 88,543 | $ | 58,090 | $ | 3,076 | ||||||
| 2014 | 89,878 | 59,343 | 2,965 | |||||||||
| 2015 | 89,937 | 59,450 | 2,821 | |||||||||
| 2016 | 90,498 | 59,941 | 2,783 | |||||||||
| 2017 | 93,000 | 62,654 | 2,676 | |||||||||
| Thereafter | 469,090 | 321,728 | 9,899 | |||||||||
| Pension Benefits | Other Post-Retirement Benefits | |||||||||||
| All Plans | Foreign Plans | |||||||||||
| (In thousands) | ||||||||||||
| 2016 | $ | 88,062 | $ | 53,907 | $ | 2,915 | ||||||
| 2017 | 88,781 | 54,821 | 2,823 | |||||||||
| 2018 | 89,611 | 55,994 | 2,717 | |||||||||
| 2019 | 88,702 | 55,459 | 2,490 | |||||||||
| 2020 | 89,083 | 56,074 | 2,268 | |||||||||
| 2021- 2025 | 445,740 | 289,491 | 9,076 | |||||||||
COLFAX CORPORATION
NOTES TO CONSOLIDATED FINANCIAL STATEMENTS – (Continued)
Actual Asset Allocation December 31, |
Target | |||||||||
| 2012 | 2011 | Allocation | ||||||||
| U.S. Plans: | ||||||||||
| Equity securities: | ||||||||||
| U.S. | 36 | % | 32 | % | 30% - 45% | |||||
| International | 15 | % | 16 | % | 10% - 20% | |||||
| Fixed income | 37 | % | 33 | % | 30% - 50% | |||||
| Hedge funds | 11 | % | 19 | % | 0% - 20% | |||||
| Cash and cash equivalents | 1 | % | — | 0% - 5% | ||||||
| Foreign Plans: | ||||||||||
| Equity securities | 37 | % | 22 | % | 20% - 45% | |||||
| Fixed income securities | 58 | % | 54 | % | 50% - 80% | |||||
| Cash and cash equivalents | 2 | % | 23 | % | 0% - 25% | |||||
| Other | 3 | % | 1 | % | 0% -5% | |||||
| Actual Asset Allocation December 31, | Target | |||||||
| 2015 | 2014 | Allocation | ||||||
| U.S. Plans: | ||||||||
| Equity securities: | ||||||||
| U.S. | 42 | % | 43 | % | 30% - 45% | |||
| International | 16 | % | 15 | % | 10% - 20% | |||
| Fixed income | 41 | % | 41 | % | 30% - 50% | |||
| Other | 1 | % | 1 | % | 0% - 20% | |||
| Cash and cash equivalents | — | % | — | % | 0% - 5% | |||
| Foreign Plans: | ||||||||
| Equity securities | 32 | % | 30 | % | 10% - 50% | |||
| Fixed income securities | 64 | % | 66 | % | 50% - 90% | |||
| Cash and cash equivalents | 1 | % | 1 | % | 0% - 25% | |||
| Other | 3 | % | 3 | % | 0% - 5% | |||
| December 31, 2012 | ||||||||||||||||
Level One | Level Two | Level Three |
Total | |||||||||||||
| (In thousands) | ||||||||||||||||
| U.S. Plans: | ||||||||||||||||
| Cash and cash equivalents | $ | 2,645 | $ | — | $ | — | $ | 2,645 | ||||||||
| Equity securities: | ||||||||||||||||
| U.S. large cap | 89,293 | — | — | 89,293 | ||||||||||||
| U.S. small/mid cap | — | 37,671 | — | 37,671 | ||||||||||||
| International | 15,579 | 37,323 | — | 52,902 | ||||||||||||
| Fixed income mutual funds: | ||||||||||||||||
| U.S. government and corporate | 128,334 | — | — | 128,334 | ||||||||||||
| Multi-strategy hedge funds | — | — | 38,832 | 38,832 | ||||||||||||
| Foreign Plans: | ||||||||||||||||
| Cash and cash equivalents | 19,594 | — | — | 19,594 | ||||||||||||
| Equity securities | 234,228 | 108,598 | — | 342,826 | ||||||||||||
| Non-U.S. government and corporate bonds | 250,891 | 298,160 | — | 549,051 | ||||||||||||
| Other(1) | 2,108 | 24,588 | — | 26,696 | ||||||||||||
| $ | 742,672 | $ | 506,340 | $ | 38,832 | $ | 1,287,844 | |||||||||
__________
| December 31, 2015 | ||||||||||||||||||||
Measured at Net Asset Value(1) | Level One | Level Two | Level Three | Total | ||||||||||||||||
| (In thousands) | ||||||||||||||||||||
| U.S. Plans: | ||||||||||||||||||||
| Equity securities: | ||||||||||||||||||||
| U.S. large cap | $ | 100,226 | $ | — | $ | — | $ | — | $ | 100,226 | ||||||||||
| U.S. small/mid cap | 40,899 | 7,874 | — | — | 48,773 | |||||||||||||||
| International | 58,642 | — | — | — | 58,642 | |||||||||||||||
| Fixed income mutual funds: | ||||||||||||||||||||
| U.S. government and corporate | 143,787 | — | — | — | 143,787 | |||||||||||||||
Other(2) | 2,917 | 1,811 | — | — | 4,728 | |||||||||||||||
| Foreign Plans: | ||||||||||||||||||||
| Cash and cash equivalents | — | 12,832 | — | — | 12,832 | |||||||||||||||
| Equity securities | 130,078 | 150,376 | 32,398 | — | 312,852 | |||||||||||||||
| Non-U.S. government and corporate bonds | — | 282,504 | 343,870 | — | 626,374 | |||||||||||||||
Other(2) | — | 1,964 | 27,227 | — | 29,191 | |||||||||||||||
| $ | 476,549 | $ | 457,361 | $ | 403,495 | $ | — | $ | 1,337,405 | |||||||||||
(1) |
| December 31, 2011 | ||||||||||||||||
Level One | Level Two | Level Three |
Total | |||||||||||||
| (In thousands) | ||||||||||||||||
| U.S. Plans: | ||||||||||||||||
| Equity securities: | ||||||||||||||||
| U.S. large cap | $ | 50,572 | $ | — | $ | — | $ | 50,572 | ||||||||
| U.S. small/mid cap | 10,633 | — | — | 10,633 | ||||||||||||
| International | 29,400 | — | — | 29,400 | ||||||||||||
| Fixed income mutual funds: | ||||||||||||||||
| U.S. government and corporate | 40,561 | — | — | 40,561 | ||||||||||||
| High-yield bonds | 15,258 | — | — | 15,258 | ||||||||||||
| Emerging markets debt | 5,920 | — | — | 5,920 | ||||||||||||
| Multi-strategy hedge funds | — | — | 36,321 | 36,321 | ||||||||||||
| Foreign Plans: | ||||||||||||||||
| Cash and cash equivalents | 7,595 | — | — | 7,595 | ||||||||||||
| Equity securities | 6,953 | — | — | 6,953 | ||||||||||||
| Non-U.S. government bonds | — | 17,576 | — | 17,576 | ||||||||||||
| Other(1) | — | 215 | — | 215 | ||||||||||||
| $ | 166,892 | $ | 17,791 | $ | 36,321 | $ | 221,004 | |||||||||
__________
| December 31, 2014 | ||||||||||||||||||||
Measured at Net Asset Value(1) | Level One | Level Two | Level Three | Total | ||||||||||||||||
| (In thousands) | ||||||||||||||||||||
| U.S. Plans: | ||||||||||||||||||||
| Equity securities: | ||||||||||||||||||||
| U.S. large cap | $ | 100,263 | $ | 3,901 | $ | — | $ | — | $ | 104,164 | ||||||||||
| U.S. small/mid cap | 43,670 | 19,540 | — | — | 63,210 | |||||||||||||||
| International | 56,252 | 2,461 | — | — | 58,713 | |||||||||||||||
| Fixed income mutual funds: | ||||||||||||||||||||
| U.S. government and corporate | 147,364 | 10,508 | — | — | 157,872 | |||||||||||||||
| Structured loan fund | 1,226 | — | — | — | 1,226 | |||||||||||||||
Other(2) | 2,798 | 1,623 | — | — | 4,421 | |||||||||||||||
| Foreign Plans: | ||||||||||||||||||||
| Cash and cash equivalents | — | 12,951 | — | — | 12,951 | |||||||||||||||
| Equity securities | 125,273 | 161,524 | 39,310 | — | 326,107 | |||||||||||||||
| Non-U.S. government and corporate bonds | — | 308,705 | 399,285 | — | 707,990 | |||||||||||||||
Other(2) | — | 2,040 | 30,409 | — | 32,449 | |||||||||||||||
| $ | 476,846 | $ | 523,253 | $ | 469,004 | $ | — | $ | 1,469,103 | |||||||||||
(1) | In accordance with ASU No. 2015-07, certain investments that are measured at fair value using the net asset value per share (or its equivalent)practical expedient (the “NAV”) have not been classified in the fair value hierarchy. These investments, consisting primarily of common/collective trusts, are valued using the NAV provided by the Trustee. The NAV is based on the underlying investments held by the fund, that are traded in an active market, less its liabilities. These investments are able to be redeemed in the near-term. See further discussion in Note 3, “Recently Issued Accounting Pronouncements”. |
The Company’s pension assets included in Level Three of the fair value hierarchy consist of multi-strategy hedge funds and the fair value is equal to the aggregate net asset value of units held by the Company’s pensionreinsurance contracts maintained for certain plans. There were no transfers in or out of Level One, Two or Three during the years ended December 31, 2012 or 2011. A summary of changes in the fair value of the Company’s pension assets included in Level Three of the fair value hierarchy is as follows:
| (In thousands) | ||||
| Balance, January 1, 2010 | $ | 26,769 | ||
| Net purchases and sales | 9,036 | |||
| Realized loss | (316 | ) | ||
| Unrealized gain | 853 | |||
| Balance, December 31, 2010 | 36,342 | |||
| Unrealized loss | (21 | ) | ||
| Balance, December 31, 2011 | 36,321 | |||
| Realized loss | 152 | |||
| Unrealized gain | 2,359 | |||
| Balance, December 31, 2012 | $ | 38,832 | ||
| Pension Benefits | Other Post-Retirement Benefits | |||||||||||||||||||||||
| Year Ended December 31, | Year Ended December 31, | |||||||||||||||||||||||
| 2012 | 2011 | 2010 | 2012 | 2011 | 2010 | |||||||||||||||||||
| (In thousands) | ||||||||||||||||||||||||
| Components of Net Periodic Benefit Cost: | ||||||||||||||||||||||||
| Service cost | $ | 3,381 | $ | 1,383 | $ | 1,168 | $ | 110 | $ | — | $ | — | ||||||||||||
| Interest cost | 67,743 | 16,408 | 16,514 | 1,507 | 690 | 553 | ||||||||||||||||||
| Amortization | 8,091 | 5,839 | 4,593 | 801 | 852 | 482 | ||||||||||||||||||
| Plan combinations(1) | — | — | 2,877 | — | — | — | ||||||||||||||||||
| Settlement loss | — | 1,499 | — | — | — | — | ||||||||||||||||||
| Other | 28 | — | — | — | — | — | ||||||||||||||||||
| Expected return on plan assets | (61,094 | ) | (18,101 | ) | (19,331 | ) | — | — | — | |||||||||||||||
| Net periodic benefit cost | $ | 18,149 | $ | 7,028 | $ | 5,821 | $ | 2,418 | $ | 1,542 | $ | 1,035 | ||||||||||||
| Change in Plan Assets and Benefit Obligations Recognized in Other Comprehensive Loss (Income): | ||||||||||||||||||||||||
| Current year net actuarial loss (gain) | $ | 98,784 | $ | 37,037 | $ | 16,736 | $ | (1,449 | ) | $ | 1,507 | $ | 3,671 | |||||||||||
| Less amounts included in net periodic benefit cost: | ||||||||||||||||||||||||
| Amortization of net loss | (8,012 | ) | (5,839 | ) | (4,593 | ) | (553 | ) | (604 | ) | (234 | ) | ||||||||||||
| Settlement loss | — | (835 | ) | — | — | — | — | |||||||||||||||||
| Amortization of prior service cost | (79 | ) | — | — | (248 | ) | (248 | ) | (248 | ) | ||||||||||||||
| Total recognized in Other comprehensive loss (income) | $ | 90,693 | $ | 30,363 | $ | 12,143 | $ | (2,250 | ) | $ | 655 | $ | 3,189 | |||||||||||
__________
| Pension Benefits | Other Post-Retirement Benefits | |||||||||||||||||||||||
| Year Ended December 31, | Year Ended December 31, | |||||||||||||||||||||||
| 2015 | 2014 | 2013 | 2015 | 2014 | 2013 | |||||||||||||||||||
| (In thousands) | ||||||||||||||||||||||||
| Components of Net Periodic Benefit Cost: | ||||||||||||||||||||||||
| Service cost | $ | 4,612 | $ | 4,883 | $ | 3,985 | $ | 33 | $ | 155 | $ | 179 | ||||||||||||
| Interest cost | 54,807 | 70,469 | 63,132 | 1,170 | 1,304 | 1,090 | ||||||||||||||||||
| Amortization | 11,515 | 6,608 | 9,672 | 259 | 468 | 609 | ||||||||||||||||||
| Settlement (gain) loss | (582 | ) | 190 | (592 | ) | — | — | — | ||||||||||||||||
| Other | 525 | 328 | (154 | ) | 174 | — | 125 | |||||||||||||||||
| Expected return on plan assets | (58,107 | ) | (69,055 | ) | (58,511 | ) | — | — | — | |||||||||||||||
| Net periodic benefit cost | $ | 12,770 | $ | 13,423 | $ | 17,532 | $ | 1,636 | $ | 1,927 | $ | 2,003 | ||||||||||||
| Change in Plan Assets and Benefit Obligations Recognized in Other Comprehensive (Loss) Income: | ||||||||||||||||||||||||
| Current year net actuarial (gain) loss | $ | (33,558 | ) | $ | 96,005 | $ | (69,463 | ) | $ | (6,410 | ) | $ | 5,553 | $ | (6,072 | ) | ||||||||
| Less amounts included in net periodic benefit cost: | ||||||||||||||||||||||||
| Amortization of net loss | (11,515 | ) | (6,608 | ) | (9,672 | ) | (11 | ) | (220 | ) | (361 | ) | ||||||||||||
| Settlement loss | (952 | ) | (190 | ) | (32 | ) | — | — | — | |||||||||||||||
| Amortization of prior service cost | — | — | — | (248 | ) | (248 | ) | (248 | ) | |||||||||||||||
| Total recognized in Other comprehensive (loss) income | $ | (46,025 | ) | $ | 89,207 | $ | (79,167 | ) | $ | (6,669 | ) | $ | 5,085 | $ | (6,681 | ) | ||||||||
| Foreign Pension Benefits | ||||||||||||
| Year Ended December 31, | ||||||||||||
| 2012 | 2011 | 2010 | ||||||||||
| (In thousands) | ||||||||||||
| Components of Net Periodic Benefit Cost: | ||||||||||||
| Service cost | $ | 3,381 | $ | 1,383 | $ | 1,168 | ||||||
| Interest cost | 49,291 | 5,132 | 4,138 | |||||||||
| Amortization | 944 | 588 | 385 | |||||||||
| Plan combinations(1) | — | — | 2,877 | |||||||||
| Settlement loss | — | 1,499 | — | |||||||||
| Other | 28 | — | — | |||||||||
| Expected return on plan assets | (36,535 | ) | (1,400 | ) | (1,259 | ) | ||||||
| Net periodic benefit cost | $ | 17,109 | $ | 7,202 | $ | 7,309 | ||||||
| Change in Plan Assets and Benefit Obligations Recognized in Other Comprehensive Loss: | ||||||||||||
| Current year net actuarial loss | $ | 65,689 | $ | 4,101 | $ | 5,062 | ||||||
| Less amounts included in net periodic benefit cost: | ||||||||||||
| Amortization of net loss | (865 | ) | (588 | ) | (385 | ) | ||||||
| Settlement loss | — | (835 | ) | — | ||||||||
| Amortization of prior service cost | (79 | ) | — | — | ||||||||
| Total recognized in Other comprehensive loss | $ | 64,745 | $ | 2,678 | $ | 4,677 | ||||||
__________
| Foreign Pension Benefits | ||||||||||||
| Year Ended December 31, | ||||||||||||
| 2015 | 2014 | 2013 | ||||||||||
| (In thousands) | ||||||||||||
| Components of Net Periodic Benefit Cost: | ||||||||||||
| Service cost | $ | 4,506 | $ | 4,883 | $ | 3,985 | ||||||
| Interest cost | 37,253 | 51,658 | 46,775 | |||||||||
| Amortization | 4,272 | 1,669 | 2,305 | |||||||||
| Settlement (gain) loss | (582 | ) | 190 | (592 | ) | |||||||
| Other | 525 | 328 | (154 | ) | ||||||||
| Expected return on plan assets | (32,921 | ) | (44,287 | ) | (34,541 | ) | ||||||
| Net periodic benefit cost | $ | 13,053 | $ | 14,441 | $ | 17,778 | ||||||
| Change in Plan Assets and Benefit Obligations Recognized in Other Comprehensive (Loss) Income: | ||||||||||||
| Current year net actuarial (gain) loss | $ | (50,216 | ) | $ | 38,904 | $ | (16,121 | ) | ||||
| Less amounts included in net periodic benefit cost: | ||||||||||||
| Amortization of net loss | (4,272 | ) | (1,669 | ) | (2,305 | ) | ||||||
| Settlement loss | (952 | ) | (190 | ) | (32 | ) | ||||||
| Amortization of prior service cost | — | — | — | |||||||||
| Total recognized in Other comprehensive (loss) income | $ | (55,440 | ) | $ | 37,045 | $ | (18,458 | ) | ||||
| Pension Benefits | Other Post-Retirement Benefits | |||||||||||||||
| December 31, | December 31, | |||||||||||||||
| 2012 | 2011 | 2012 | 2011 | |||||||||||||
| (In thousands) | ||||||||||||||||
| Net actuarial loss | $ | 275,211 | $ | 184,532 | $ | 5,676 | $ | 7,677 | ||||||||
| Prior service cost | — | — | 1,303 | 1,552 | ||||||||||||
| Total | $ | 275,211 | $ | 184,532 | $ | 6,979 | $ | 9,229 | ||||||||
| Pension Benefits | Other Post-Retirement Benefits | |||||||||||||||
| December 31, | December 31, | |||||||||||||||
| 2015 | 2014 | 2015 | 2014 | |||||||||||||
| (In thousands) | ||||||||||||||||
| Net actuarial loss (gain) | $ | 239,225 | $ | 285,250 | $ | (1,845 | ) | $ | 4,576 | |||||||
| Prior service cost | — | — | 559 | 807 | ||||||||||||
| Total | $ | 239,225 | $ | 285,250 | $ | (1,286 | ) | $ | 5,383 | |||||||
| Pension Benefits | Other Post- Retirement Benefits | |||||||
| (In thousands) | ||||||||
| Net actuarial loss | $ | 10,151 | $ | 465 | ||||
| Prior service cost | — | 248 | ||||||
| Total | $ | 10,151 | $ | 713 | ||||
| Pension Benefits | Other Post- Retirement Benefits | |||||||
| (In thousands) | ||||||||
| Net actuarial loss | $ | 8,336 | $ | 8 | ||||
| Prior service cost | — | 248 | ||||||
| Total | $ | 8,336 | $ | 256 | ||||
| Pension Benefits | Other Post-Retirement Benefits | |||||||||||||||
| December 31, | December 31, | |||||||||||||||
| 2012 | 2011 | 2012 | 2011 | |||||||||||||
| Weighted-average discount rate: | ||||||||||||||||
| All plans | 4.0 | % | 4.2 | % | 3.4 | % | 4.2 | % | ||||||||
| Foreign plans | 4.2 | % | 4.9 | % | — | — | ||||||||||
| Weighted-average rate of increase in compensation levels for active foreign plans | 1.5 | % | 2.6 | % | — | — | ||||||||||
| Pension Benefits | Other Post-Retirement Benefits | |||||||||||
| December 31, | December 31, | |||||||||||
| 2015 | 2014 | 2015 | 2014 | |||||||||
| Weighted-average discount rate: | ||||||||||||
| All plans | 3.6 | % | 3.3 | % | 4.0 | % | 3.6 | % | ||||
| Foreign plans | 3.5 | % | 3.3 | % | — | — | ||||||
| Weighted-average rate of increase in compensation levels for active foreign plans | 1.5 | % | 1.6 | % | — | — | ||||||
| Pension Benefits | Other Post-Retirement Benefits | |||||||||||||||||||||||
| Year Ended December 31, | Year Ended December 31, | |||||||||||||||||||||||
| 2012 | 2011 | 2010 | 2012 | 2011 | 2010 | |||||||||||||||||||
| Weighted-average discount rate: | ||||||||||||||||||||||||
| All plans | 4.6 | % | 5.0 | % | 5.7 | % | 4.3 | % | 5.2 | % | 5.6 | % | ||||||||||||
| Foreign plans | 4.7 | % | 5.1 | % | 5.6 | % | — | — | — | |||||||||||||||
| Weighted-average expected return on plan assets: | ||||||||||||||||||||||||
| All plans | 5.3 | % | 7.7 | % | 8.3 | % | — | — | — | |||||||||||||||
| Foreign plans | 4.5 | % | 4.7 | % | 5.4 | % | — | — | — | |||||||||||||||
| Weighted-average rate of increase in compensation levels for active foreign plans | 1.3 | % | 2.6 | % | 2.2 | % | — | — | — | |||||||||||||||
| Pension Benefits | Other Post-Retirement Benefits | |||||||||||||||||
| Year Ended December 31, | Year Ended December 31, | |||||||||||||||||
| 2015 | 2014 | 2013 | 2015 | 2014 | 2013 | |||||||||||||
| Weighted-average discount rate: | ||||||||||||||||||
| All plans | 3.3 | % | 4.4 | % | 4.0 | % | 3.6 | % | 4.4 | % | 3.5 | % | ||||||
| Foreign plans | 3.3 | % | 4.4 | % | 4.2 | % | — | — | — | |||||||||
| Weighted-average expected return on plan assets: | ||||||||||||||||||
| All plans | 4.7 | % | 5.4 | % | 5.1 | % | — | — | — | |||||||||
| Foreign plans | 3.9 | % | 4.9 | % | 4.3 | % | — | — | — | |||||||||
| Weighted-average rate of increase in compensation levels for active foreign plans | 1.6 | % | 1.7 | % | 1.5 | % | — | — | — | |||||||||
| 1% Increase | 1% Decrease | |||||||
| (in thousands) | ||||||||
| Effect on total service and interest cost components for the year ended December 31, 2012 | $ | 165 | $ | (142 | ) | |||
| Effect on post-retirement benefit obligation at December 31, 2012 | 3,149 | (2,659 | ) | |||||
| 1% Increase | 1% Decrease | |||||||
| (in thousands) | ||||||||
| Effect on total service and interest cost components for the year ended December 31, 2015 | $ | 118 | $ | (95 | ) | |||
| Effect on post-retirement benefit obligation at December 31, 2015 | 3,035 | (2,471 | ) | |||||
| December 31, 2012 | ||||||||||||||||
Level One | Level Two | Level Three | Total | |||||||||||||
| (In thousands) | ||||||||||||||||
| Assets: | ||||||||||||||||
| Cash equivalents | $ | 133,878 | $ | — | $ | — | $ | 133,878 | ||||||||
| Foreign currency contracts related to sales – designated as hedges | — | 6,832 | — | 6,832 | ||||||||||||
| Foreign currency contracts related to sales – not designated as hedges | — | 2,249 | — | 2,249 | ||||||||||||
| Foreign currency contracts related to purchases – designated as hedges | — | 213 | — | 213 | ||||||||||||
| Foreign currency contracts related to purchases – not designated as hedges | — | 1,077 | — | 1,077 | ||||||||||||
| Deferred compensation plans | — | 2,542 | — | 2,542 | ||||||||||||
| $ | 133,878 | $ | 12,913 | $ | — | $ | 146,791 | |||||||||
| Liabilities: | ||||||||||||||||
| Foreign currency contracts related to sales – designated as hedges | $ | — | $ | 1,024 | $ | — | $ | 1,024 | ||||||||
| Foreign currency contracts related to sales – not designated as hedges | — | 1,693 | — | 1,693 | ||||||||||||
| Foreign currency contracts related to purchases – designated as hedges | — | 896 | — | 896 | ||||||||||||
| Foreign currency contracts related to purchases – not designated as hedges | — | 1,062 | — | 1,062 | ||||||||||||
| Deferred compensation plans | — | 2,542 | — | 2,542 | ||||||||||||
| Liability for contingent payments | — | — | 6,517 | 6,517 | ||||||||||||
| $ | — | $ | 7,217 | $ | 6,517 | $ | 13,734 | |||||||||
| December 31, 2011 | ||||||||||||||||
Level One | Level Two | Level Three | Total | |||||||||||||
| (In thousands) | ||||||||||||||||
| Assets: | ||||||||||||||||
| Cash equivalents | $ | 15,540 | $ | — | $ | — | $ | 15,540 | ||||||||
| Foreign currency contracts – primarily related to customer sales contracts | — | 5 | — | 5 | ||||||||||||
| $ | 15,540 | $ | 5 | $ | — | $ | 15,545 | |||||||||
| Liabilities: | ||||||||||||||||
| Interest rate swap | $ | — | $ | 471 | $ | — | $ | 471 | ||||||||
| Foreign currency contracts – acquisition-related | — | 14,986 | — | 14,986 | ||||||||||||
| Foreign currency contracts – primarily related to customer sales contracts | — | 371 | — | 371 | ||||||||||||
| Liability for contingent payments | — | — | 4,359 | 4,359 | ||||||||||||
| $ | — | $ | 15,828 | $ | 4,359 | $ | 20,187 | |||||||||
| December 31, 2015 | |||||||||||||||
| Level One | Level Two | Level Three | Total | ||||||||||||
| (In thousands) | |||||||||||||||
| Assets: | |||||||||||||||
| Cash equivalents | $ | 22,516 | $ | — | $ | — | $ | 22,516 | |||||||
| Foreign currency contracts related to sales - designated as hedges | — | 988 | — | 988 | |||||||||||
| Foreign currency contracts related to sales - not designated as hedges | — | 664 | — | 664 | |||||||||||
| Foreign currency contracts related to purchases - designated as hedges | — | 1,554 | — | 1,554 | |||||||||||
| Foreign currency contracts related to purchases - not designated as hedges | — | 338 | — | 338 | |||||||||||
| Deferred compensation plans | — | 4,000 | — | 4,000 | |||||||||||
| $ | 22,516 | $ | 7,544 | $ | — | $ | 30,060 | ||||||||
| Liabilities: | |||||||||||||||
| Foreign currency contracts related to sales - designated as hedges | $ | — | $ | 6,368 | $ | — | $ | 6,368 | |||||||
| Foreign currency contracts related to sales - not designated as hedges | — | 969 | — | 969 | |||||||||||
| Foreign currency contracts related to purchases - designated as hedges | — | 322 | — | 322 | |||||||||||
| Foreign currency contracts related to purchases - not designated as hedges | — | 128 | — | 128 | |||||||||||
| Deferred compensation plans | — | 4,000 | — | 4,000 | |||||||||||
| $ | — | $ | 11,787 | $ | — | $ | 11,787 | ||||||||
| December 31, 2014 | |||||||||||||||
| Level One | Level Two | Level Three | Total | ||||||||||||
| (In thousands) | |||||||||||||||
| Assets: | |||||||||||||||
| Cash equivalents | $ | 23,143 | $ | — | $ | — | $ | 23,143 | |||||||
| Foreign currency contracts related to sales - designated as hedges | — | 4,524 | — | 4,524 | |||||||||||
| Foreign currency contracts related to sales - not designated as hedges | — | 1,007 | — | 1,007 | |||||||||||
| Foreign currency contracts related to purchases - designated as hedges | — | 1,980 | — | 1,980 | |||||||||||
| Foreign currency contracts related to purchases - not designated as hedges | — | 478 | — | 478 | |||||||||||
| Deferred compensation plans | — | 2,941 | — | 2,941 | |||||||||||
| $ | 23,143 | $ | 10,930 | $ | — | $ | 34,073 | ||||||||
| Liabilities: | |||||||||||||||
| Foreign currency contracts related to sales - designated as hedges | $ | — | $ | 7,163 | $ | — | $ | 7,163 | |||||||
| Foreign currency contracts related to sales - not designated as hedges | — | 2,793 | — | 2,793 | |||||||||||
| Foreign currency contracts related to purchases - designated as hedges | — | 695 | — | 695 | |||||||||||
| Foreign currency contracts related to purchases - not designated as hedges | — | 661 | — | 661 | |||||||||||
| Deferred compensation plans | — | 2,941 | — | 2,941 | |||||||||||
| $ | — | $ | 14,253 | $ | — | $ | 14,253 | ||||||||
COLFAX CORPORATION
NOTES TO CONSOLIDATED FINANCIAL STATEMENTS – (Continued)
Foreign Currency Contracts – related to supplier purchases contracts: Unrealized (loss) gain (560 81 — Realized gain (loss) (20 — Contingencies percentage could change. final judgments of the Delaware Court of Chancery and Superior Court have been appealed to the Delaware Supreme Court, and an oral argument before the Delaware Supreme Court was held on May 27, 2015. The Delaware Supreme Court has certified certain questions of law to the New York Court of Appeals, New York’s highest appellate court, including the question of what allocation methodology should be applied to the subsidiary’s policies. In the event that the New York court were to apply a methodology other than “all sums”, the subsidiary’s future expected recovery would likely be reduced by amounts that we estimate could range from minimal to $30 million. liabilities of $20.2 claims. June 29, 2012(1)(2) September 28, 2012 December 31, 2012 July 1, 2011 September 30, 2011(1) December 31, 2011(1) 2014. 2015. Procedures.” 16, 2016 /s/ /s/ C. SCOTT BRANNAN /s/ MITCHELL P. RALES /s/ PATRICK W. ALLENDER /s/ THOMAS S. GAYNER /s/ RHONDA L. JORDAN /s/ A. CLAYTON PERFALL /s/ RAJIV VINNAKOTA * Unless otherwise noted, all exhibits are incorporated by reference to the Company’s Registration Statement on Form S-1 (File No. 001-34045). Charged to Expense(1) Charged to Other Accounts(2) 103,785 20,676 167,723 372,039Interest Rate Swap.The Company’s interest rate swap is valued based on forward curves observable in the market. The notional value of the Company’s interest rate swap was $25 million as of December 31, 2011, which exchanged its LIBOR-based variable-rate interest for a fixed rate of 4.1375%. On January 11, 2012, the Company terminated its interest rate swap in conjunction with the repayment of the Bank of America Credit Agreement and reclassified $0.5 million of net losses from Accumulated other comprehensive loss to Interest expense in the Consolidated Statement of Operations.The December 31, 2012 2011 (In thousands) Foreign currency contracts sold – not designated as hedges $ 301,185 $ — Foreign currency contracts sold – designated as hedges 238,537 5,116 Foreign currency contracts purchased – not designated as hedges 121,741 — Foreign currency contracts purchased – designated as hedges 37,065 — Foreign currency contracts – acquisition related — 4,249,954 Total foreign currency derivatives $ 698,528 $ 4,255,070 COLFAX CORPORATIONNOTES TO CONSOLIDATED FINANCIAL STATEMENTS – (Continued) December 31, 2015 2014 (In thousands) Foreign currency contracts sold - not designated as hedges $ 119,653 $ 124,838 Foreign currency contracts sold - designated as hedges 206,366 250,743 Foreign currency contracts purchased - not designated as hedges 41,480 36,080 Foreign currency contracts purchased - designated as hedges 62,794 53,944 Total foreign currency derivatives $ 430,293 $ 465,605 Year Ended December 31, 2012 2011 2010 (In thousands) Contracts Designated as Hedges: Interest Rate Swap: Unrealized loss $ — $ (161 ) $ (1,201 ) Realized loss (471 ) (1,479 ) (2,447 ) Foreign Currency Contracts – related to customer sales contracts: Unrealized gain 2,120 — — Realized gain 2,297 — — Foreign Currency Contracts – related to supplier purchases contracts: Unrealized loss (374 ) — — Realized loss (475 ) — — Unrealized loss on net investment hedge (7,783 ) — — Contracts Not Designated in a Hedge Relationship: Foreign Currency Contracts – acquisition-related: Unrealized loss, net — (21,013 ) — Realized loss, net (7,177 ) — — Foreign Currency Contracts – primarily related to customer sales contracts: Unrealized gain (loss) 778 (204 ) 93 Realized gain (loss) 712 152 (838 ) ) 868 ) Liability for Contingent Payments Year Ended December 31, 2015 2014 2013 (In thousands) Contracts Designated as Hedges: Foreign Currency Contracts - related to customer sales contracts: Unrealized (loss) gain $ (2,350 ) $ (4,706 ) $ 3,801 Realized (loss) gain (512 ) (5,776 ) 654 Foreign Currency Contracts - related to supplier purchase contracts: Unrealized (loss) gain (1,173 ) (1,719 ) 397 Realized gain (loss) 756 3,386 (298 ) 14,537 39,374 (14,261 ) Contracts Not Designated in a Hedge Relationship: Foreign Currency Contracts - related to customer sales contracts: Unrealized gain (loss) 2,260 (1,389 ) (762 ) Realized (loss) gain (5,644 ) (4,342 ) 1,112 Foreign Currency Contracts - related to supplier purchases contracts: Unrealized gain (loss) 393 (1,304 ) 1,687 Realized gain 1,165 1,355 1,359 Company’s liability for contingent payments represents the fair value of estimated additional cash payments related to its acquisition of COT-Puritech in December of 2011, which are subjectunrealized gain (loss) on net investment hedges is attributable to the achievementchange in valuation of certain performance goals, and is included in Other liabilities in the Consolidated Balance Sheets. The fair valueEuro denominated debt.the liability for contingent payments represents the present value of probability weighted expected cash flows based upon the Company’s internal model and projections and is included in Level Three of the fair value hierarchy. Accretion is recognized in Interest expense in the Consolidated Statements of Operations and realized or unrealized gains or losses are recognized in Selling, general and administrative expense in the Consolidated Statements of Operations.A summary of activity in the Company’s liability for contingent payments during the years ended December 31, 2011 and 2012 is as follows: (In thousands) Balance, January 1, 2011 $ — Additions 4,300 Interest accretion 59 Balance, December 31, 2011 4,359 Interest accretion 712 Unrealized loss (1,446 ) Balance, December 31, 2012 $ 6,517 15.Concentration of Credit RiskThe Company isCredit Riska concentrationconcentrations of credit risk consist primarily of trade accounts receivable. Concentrations of credit risk are considered to exist when there are amounts collectible from multiple counterparties with respectsimilar characteristics, which could cause their ability to its Trade receivables, net.meet contractual obligations to be similarly impacted by economic or other conditions. The Company performs credit evaluations of its customers prior to delivery or commencement of services and normally does not require collateral. Letters of credit are occasionally required for international customers when the Company deems necessary. The Company maintains an allowance for potential credit lossesCustomers purchasing from our operations in China represented 20% and losses have historically been within management’s expectations. The Company does not believe that accounts receivable represent significant concentrations of credit risk because18% of the diversified portfolioCompany’s Accounts receivable, net as of individual customersDecember 31, 2015 and geographical areas.COLFAX CORPORATIONNOTES TO CONSOLIDATED FINANCIAL STATEMENTS – (Continued)The Company may be exposed to credit-related losses in the event of non-performance by counterparties to financial instruments. The Company enters into derivative contracts with financial institutions of good standing,2014, respectively.the total credit exposure related to non-performance by those institutions is not material to the operations of the Company. The Company does not enter into derivative contracts for trading purposes.16.Commitments and Contingencies Year Ended December 31, 2012 2011 2010 (Number of Claims) Claims unresolved, beginning of period 23,682 24,764 25,295 Acquisitions 1,599 — — Claims filed(2) 4,335 4,927 3,692 Claims resolved(3) (6,093 ) (6,009 ) (4,223 ) Claims unresolved, end of period 23,523 23,682 24,764 (In dollars) Average cost of resolved claims(4) $ 6,606 $ 15,397 $ 12,037 __________(1)Excludes claims filed by one legal firm that have been “administratively dismissed.” Year Ended December 31, 2015 2014 2013 (Number of claims) Claims unresolved, beginning of period 21,681 22,393 23,523 4,821 4,850 6,299 (5,919 ) (5,562 ) (7,429 ) Claims unresolved, end of period 20,583 21,681 22,393 (In dollars) $ 6,056 $ 7,513 $ 5,979 (2)Claims filed include all asbestos claims for which notification has been received or a file has been opened.(3)Claims resolved include all asbestos claims that have been settled, dismissed or that are in the process of being settled or dismissed based upon agreements or understandings in place with counsel for the claimants.
Excludes claims filed by one legal firm that have been “administratively dismissed.”(4)Excludes claims settled in Mississippi for which the majority of claims have historically been resolved for no payment and insurance recoveries.–— (Continued)language ofDelaware Superior Court concerning the underlying insurance policies andsubsidiary’s coverage rights, the assertion and beliefCompany currently estimates that defense costs are outside policy limits, the Company’ssubsidiary’s future expected recovery percentage is 90%approximately 93% of asbestos-related costs followingwith the exhaustion of its primary and umbrella layers of insurance and expectssubsidiary expected to be responsible for approximately 10%7% of its future asbestos-related costs.For this subsidiary, during Depending on the year ended December 31, 2010, an insolvent carrier that had written approximately $1.4 million in limits for whichoutcome of the subsidiary had assumed noappeal discussed below, the expected insurance recovery made a cash settlement offer of approximately $0.7 million. As such, the subsidiary recorded a gain for this amount.withand the Superior Court issued a final ruling pending.judgment during the third quarter of 2014. Appeals have been entered. The subsidiary continues to work with its excess insurers to obtainhas been largely unsuccessful in obtaining defense and indemnity payments while the litigation is proceeding. Given the uncertainties of litigation, there is a variety of possible outcomes, including but not limited to the subsidiary being required to fund all or a portion of the subsidiary’s defense and indemnity payments until such time a final ruling orders payment by thefrom its excess insurers. While not impacting the results of operations, the Company has funded $78.4 million that it expects its excess insurers to ultimately reimburse through December 31, 2015, and until the final rulings ordering payment by the insurers are issued, cash funding requirement could range up to $10 million per quarter until final resolution. In addition, because a statistically significant increase in mesothelioma claims had occurred and was expected to continue to occur in certain regions, this subsidiary recorded a $1.8 million pre-tax charge, which was comprised of an increase in its asbestos-related liabilities of $18.1 million partially offset by an increase in expected insurance recoveries of $16.3 million, during the fourth quarteryear ended December 31, 2011.the otheranother subsidiary filed a lawsuit against a large number of its insurers and its former parent to resolve a variety of disputes concerning insurance for asbestos-related bodily injury claims asserted against it. Although none of these insurance companies contested coverage, they disputed the timing, reasonableness and allocation of payments.For this subsidiary it It was determined by court ruling in 2007 that the allocation methodology mandated by the New Jersey courts will apply. Further court rulings in December of 2009 clarified the allocation calculation related to amounts currently due from insurers as well as amounts the Company expects to be reimbursed for asbestos-related costs incurred in future periods.As a result, during the year ended December 31, 2010, the Company reduced the current asbestos receivable by $2.8 million, decreased the long-term asbestos asset by $1.2 million and recorded a net charge to asbestos liability and defense costs of $4.0 million. In May 2011, the court accepted the recommendation with modifications. A final judgment at the trial court level in this litigation was rendered during the year ended December 31, 2011, but appeals have been entered. As a result of this judgment,2011. The Appellate Division confirmed the Company recorded a provision for $2.1 milliontrial court rulings during the year ended December 31, 2011, which is reflected2014. In 2015, the New Jersey Supreme Court refused to grant certification of the appeals, effectively ending the matter. The subsidiary expects to be responsible for approximately 19.9% of all future asbestos-related costs.the Consolidated Balance Sheet as an increase of $1.4 million in Other accrued liabilitiesmesothelioma and a reduction of $0.7 million in Asbestos insurance asset. The Company made a payment of $5.0 million, which was previously accrued for, to return certain overpayments to the insurers. In addition, because of thelung cancer claims and higher settlement values per mesotheliomaclaim that have occurred and are expected to continue to occur in certain jurisdictions, partially offset by lower claims and lower settlement values per claim in 2011 in a specific region, this subsidiaryother jurisdictions, the Company recorded a $0.7$0.6 million pre-tax charge whichduring year ended December 31, 2013. The pre-tax charge was comprised of an increase to itsin asbestos-related liabilities of $4.7$10.8 million partially offset by an increase in expected insurance recoveries of $4.0 million, during the fourth quarter of$10.2 million. During the year ended December 31, 2011.2014, the Company recorded a $6.9 million pre-tax charge, comprised of an increase in asbestos-related liabilities of $14.5 million partially offset by an increase in expected insurance recoveries of $7.6 million, due to a higher number of asbestos claims settlements and a decline in the insurance recovery rate that have occurred. Due to an increase in mesothelioma and lung cancer claims and higher settlement values per claim that have occurred and are expected to continue to occur in certain jurisdictions, the Company recorded a $4.1 million pre-tax charge during the year ended December 31, 2015. The subsidiary expects to be responsible for approximately 17%pre-tax charge was comprised of all futurean increase in asbestos-related costs.–— (Continued)forrelated to asbestos-related litigation: December 31, 2012 2011 (In thousands) Current asbestos insurance asset(1) $ 35,566 $ 43,452 Current asbestos insurance receivable(1) 36,778 33,696 Long-term asbestos insurance asset(2) 315,363 326,838 Long-term asbestos insurance receivable(2) 7,063 14,034 Accrued asbestos liability(3) 58,501 76,295 Long-term asbestos liability(4) 375,493 382,394 __________(1)Included in Other current assets in the Consolidated Balance Sheets. December 31, 2015 2014 (In thousands) $ 28,872 $ 34,540 284,095 282,679 96,007 82,340 48,780 50,175 350,394 346,099 (2)Included in Other assets in the Consolidated Balance Sheets.
Included in Other current assets in the Consolidated Balance Sheets.(3)Represents current reserves for probable and reasonably estimable asbestos-related liability cost that the Company believes the subsidiaries will pay through the next 15 years, overpayments by certain insurers and unpaid legal costs related to defending themselves against asbestos-related liability claims and legal action against the Company’s insurers, which is included in Accrued liabilities in the Consolidated Balance Sheets.
Included in Other assets in the Consolidated Balance Sheets.(4)Included in Other liabilities in the Consolidated Balance Sheets.June 3, 1997, oneApril 10, 2015, the Court of Chancery of the Company’s subsidiaries was servedState of Delaware dismissed with a complaintprejudice, in a caseits entirety and on the merits, the derivative action brought in March 2014 by Litton Industries,two alleged stockholders of the Company against our directors, BDT CF Acquisition Vehicle, LLC and BDT Capital Partners, LLC.SuperiorUnited States District Court, Eastern District of New Jersey which allegesTexas, alleging infringement of certain patents allegedly owned by Lincoln Electric. The complaint, as amended, seeks undisclosed damages in excessplus interest, an award of $10.0 million incurred as a result of losses under a government contract bid transferred in connection with the sale of its former Electro-Optical Systems business. In 2004, this case was tried and the jury rendered a verdict of $2.1 million for the plaintiffs. After appeals by both parties, the Supreme Court of New Jersey upheld the plaintiffs’ right to a refund of their attorney’sattorneys’ fees and costsexpenses, and injunctive relief. The defendants answered the complaint, denying Lincoln Electric’s infringement allegations and asserting affirmative defenses, on October 20, 2015. The litigation is in an early stage, and is not expected to have a material adverse effect on the financial condition, results of trial, but remanded the issue to the trial court to reconsider the amount of fees using a proportionality analysisoperations or cash flow of the relationship betweenCompany. The defendants are vigorously defending against the fee requested and the damages recovered. In June 2012, the subsidiary entered into a settlement agreement for and made a payment of $8.5 million. The settlement did not have a significant impact on the Consolidated Statement of Operations for the year ended December 31, 2012.reservesaccruals to cover potential liabilities. Any costs that management estimates may be paid related to these proceedings or claims are accrued when the liability is considered probable and the amount can be reasonably estimated. There can be no assurance, however, as to the ultimate outcome of any of these matters, and if all or substantially all of these legal proceedings were to be determined adverse to the Company, there could be a material adverse effect on the financial condition, results of operations or cash flow of the Company.84–— (Continued)GuaranteesAs of December 31, 2012, the Company has $59.7 million of bank guarantees securing primarily customer prepayments, performance and product warranties. See Note 10, “Debt” for discussion regarding the Company’s letters of credit outstanding as of December 31, 2012. rental obligations under non-cancelable operating leases are as follows: December 31, 2012 (In thousands) 2013 $ 30,166 2014 21,324 2015 16,235 2016 10,440 2017 6,639 Thereafter 40,885 Total $ 125,689 December 31, 2015 (In thousands) 2016 $ 32,121 2017 19,798 2018 15,624 2019 14,064 2020 12,390 Thereafter 47,333 Total $ 141,330 2012, 20112015, 2014 and 2010,2013, the Company’s net rental expense related to operating leases was $39.5$39.9 million, $4.9$39.8 million and $4.6$35.4 million, respectively.17.Segment InformationUpon the closingthe Charter Acquisition,December 31, 2015, the Company changed the compositionhad $351.4 million of its reportable segmentsunconditional purchase obligations with suppliers, substantially all of which is expected to reflect the changes in its internal organization resulting from the integration of the acquired businesses. be paid by December 31, 2016.now reportsconducts its operations through three operating segments: gas handling, fluid handling and fabrication technology. The gas-handling and fluid-handling operating segments are aggregated into a single reportable segment. A description of the followingCompany’s reportable segments:segments is as follows:·▪ &and Fluid Handling – - a global supplier of a broad range of gas- and fluid-handling products, including pumps, fluid-handling systems and controls, specialty valves, heavy-duty centrifugal and axial fans, rotary heat exchangers, and gas compressors, pumps, fluid-handling systems, controls and specialty valves, which serves customers in the power generation, oil, gas and petrochemical, mining, marine (including defense) and general industrial and other end markets; and·▪ –-a global supplier of welding equipment and consumables, cutting equipment and consumables and automated welding and cutting systems.–— (Continued) Year Ended December 31, 2012 2011 2010 (In thousands) Net Sales: Gas and fluid handling $ 1,901,132 $ 693,392 $ 541,987 Fabrication technology 2,012,724 — — Total Net sales $ 3,913,856 $ 693,392 $ 541,987 Segment operating income (loss)(1): Gas and fluid handling $ 141,524 $ 86,664 $ 65,357 Fabrication technology 140,184 — — Corporate and other (81,639 ) (51,078 ) (20,662 ) Total segment operating income $ 200,069 $ 35,586 $ 44,695 Depreciation and Amortization: Gas and fluid handling $ 112,389 $ 22,375 $ 15,823 Fabrication technology 69,708 — — Corporate and other 18,303 958 984 Total depreciation and amortization $ 200,400 $ 23,333 $ 16,807 Capital Expenditures: Gas and fluid handling $ 42,343 $ 14,420 $ 12,118 Fabrication technology 41,146 — — Corporate and other 97 366 409 Total capital expenditures $ 83,586 $ 14,786 $ 12,527 ________(1)The following is a reconciliation of Income before income taxes to segment operating income: Year Ended December 31, 2012 2011 2010 (In thousands) Income before income taxes $ 48,439 $ 19,987 $ 27,688 Interest expense 91,570 5,919 6,684 Restructuring and other related charges 60,060 9,680 10,323 Segment operating income $ 200,069 $ 35,586 $ 44,695 Year Ended December 31, 2012 2011 (In thousands) Investment in Equity Method Investees: Gas and fluid handling $ 11,451 $ 7,680 Fabrication technology 44,106 — $ 55,557 $ 7,680 Total Assets: Gas and fluid handling $ 3,329,948 $ 947,773 Fabrication technology 2,565,582 — Corporate and other 234,197 140,770 $ 6,129,727 $ 1,088,543 Year Ended December 31, 2015 2014 2013 (In thousands) Net sales: Gas and fluid handling $ 1,981,816 $ 2,329,598 $ 2,104,048 Fabrication technology 1,985,237 2,294,878 2,103,161 Total Net sales $ 3,967,053 $ 4,624,476 $ 4,207,209 Gas and fluid handling $ 194,469 $ 254,240 $ 270,708 Fabrication technology 198,337 265,813 219,634 Corporate and other (46,984 ) (52,379 ) (48,448 ) Total segment operating income $ 345,822 $ 467,674 $ 441,894 Depreciation, amortization and impairment charges: Gas and fluid handling $ 68,457 $ 96,763 $ 62,792 Fabrication technology 84,913 76,406 55,339 Corporate and other 1,172 1,555 1,127 Total depreciation, amortization and impairment charges $ 154,542 $ 174,724 $ 119,258 Capital expenditures: Gas and fluid handling $ 34,303 $ 32,558 $ 37,995 Fabrication technology 35,261 47,955 33,437 Corporate and other 313 3,945 50 Total capital expenditures $ 69,877 $ 84,458 $ 71,482 Year Ended December 31, 2015 2014 2013 Income before income taxes $ 236,902 $ 358,248 $ 302,795 Interest expense 47,743 51,305 103,597 Restructuring and other related charges 61,177 58,121 35,502 Segment operating income $ 345,822 $ 467,674 $ 441,894 –— (Continued) December 31, 2015 2014 (In thousands) Investments in Equity Method Investees: Gas and fluid handling $ 3,805 $ 7,085 Fabrication technology 42,106 45,411 $ 45,911 $ 52,496 Gas and fluid handling $ 3,482,471 $ 3,648,860 Fabrication technology 3,157,078 3,470,426 Corporate and other 93,370 92,231 Total Assets $ 6,732,919 $ 7,211,517 geographyproduct type and product typegeography is as follows: Year Ended December 31, 2012 2011 2010 (In thousands) Net Sales by Origin: United States $ 789,259 $ 207,459 $ 183,803 Foreign locations 3,124,597 485,933 358,184 Total Net sales $ 3,913,856 $ 693,392 $ 541,987 Net Sales by Major Product: Gas handling $ 1,242,371 $ — $ — Fluid handling 658,761 693,392 541,987 Welding and cutting 2,012,724 — — Total Net sales $ 3,913,856 $ 693,392 $ 541,987 December 31, 2012 2011 (In thousands) Property, Plant and Equipment, Net: United States $ 127,719 $ 28,699 Foreign locations 560,851 62,240 Property, plant and equipment, net $ 688,570 $ 90,939 18.Selected Quarterly Data–(unaudited) Year Ended December 31, 2015 2014 2013 (In thousands) Net Sales by Major Product: Gas handling $ 1,449,115 $ 1,676,180 $ 1,440,731 Fluid handling 532,701 653,418 663,317 Welding and cutting 1,985,237 2,294,878 2,103,161 Total Net sales $ 3,967,053 $ 4,624,476 $ 4,207,209 United States $ 1,124,883 $ 1,097,864 $ 836,636 Foreign locations 2,842,170 3,526,612 3,370,573 Total Net sales $ 3,967,053 $ 4,624,476 $ 4,207,209 December 31, 2015 (In thousands) United States $ 179,194 $ 177,957 Czech Republic 75,540 79,430 China 63,784 76,959 Other Foreign Locations 326,018 393,089 Property, plant and equipment, net $ 644,536 $ 727,435 20122015 and 2011. Quarter Ended March 30,
2012(1)(2) (In thousands, except per share data) Net sales $ 886,366 $ 1,045,653 $ 954,440 $ 1,027,397 Gross profit 241,706 314,862 287,987 307,570 Net (loss) income (100,461 ) 18,632 14,499 25,066 Net (loss) income attributable to Colfax Corporation common shareholders (109,332 ) 7,293 4,022 14,664 Net (loss) income per share – basic $ (1.33 ) $ 0.07 $ 0.04 $ 0.14 Net (loss) income per share – diluted $ (1.33 ) $ 0.07 $ 0.04 $ 0.13 __________(1)Net (loss) income and Net (loss) income per share for the three months ended March 30, 2012 and June 29 2012, include $42.9 million and $0.8 million of pre-tax Charter acquisition-related expense. See Note 4, “Acquisitions” for additional information regarding the Company’s acquisition of Charter.(2)Gross profit for the three months ended March 30, 2012 and June 29, 2012 reflects the reclassification of $13.7 million and $13.0 million, respectively, of additional Cost of sales, which was included in Selling, general and administrative expense in the Condensed Consolidated Statements of Operations included in the respective quarterly report on Form 10-Q. These amounts were reclassified in order to comply with current period presentation.COLFAX CORPORATIONNOTES TO CONSOLIDATED FINANCIAL STATEMENTS – (Continued) Quarter Ended April 1,
2011 (In thousands, except per share data) Net sales $ 158,558 $ 186,749 $ 170,294 $ 177,791 Gross profit 53,254 64,674 60,627 61,544 Net income (loss) 6,555 10,390 3,690 (16,080 ) Net income (loss) per share – basic $ 0.15 $ 0.24 $ 0.08 $ (0.37 ) Net income (loss) per share – diluted $ 0.15 $ 0.23 $ 0.08 $ (0.37 ) __________(1)Net income (loss) and Net income (loss) per share for the three months ended September 30, 2011 and December 31, 2011 include $5.7 million and $25.3 million, respectively, of pre-tax Charter acquisition-related expense. See Note 4, “Acquisitions” for additional information regarding the Company’s acquisition of Charter. Quarter Ended
2015(3) (In thousands, except per share data) Net sales $ 911,070 $ 1,025,375 $ 969,144 $ 1,061,464 Gross profit 294,438 328,037 295,874 333,425 Net income 56,275 58,829 23,545 48,529 Net income attributable to Colfax Corporation common shareholders 52,056 53,127 18,359 44,197 Net income per share – basic $ 0.42 $ 0.43 $ 0.15 $ 0.36 Net income per share – diluted $ 0.42 $ 0.42 $ 0.15 $ 0.36 Quarter Ended
2014(1)
2014(2) September 26,
2014
2014(3) (In thousands, except per share data) Net sales $ 1,054,331 $ 1,199,336 $ 1,164,453 $ 1,206,356 Gross profit 325,632 388,171 373,195 391,847 Net income 54,837 198,344 81,303 85,789 Net income attributable to Colfax Corporation common shareholders 24,877 191,785 73,389 80,134 Net income per share – basic $ 0.22 $ 1.55 $ 0.59 $ 0.65 Net income per share – diluted $ 0.22 $ 1.53 $ 0.59 $ 0.64 the end of the period covered by this report on this Annual Report on Form 10-K.December 31, 2015. Based upon that evaluation, our Chief Executive Officer and Chief Financial Officer concluded that ourthe Company’s disclosure controls and procedures were effective in providing reasonable assurance that the information required to be disclosed in this report on Form 10-K has been recorded, processed, summarized and reported as of the end of the period covered by this report on Form 10-K.(the “SEC’s”) rules and forms, and that such information is accumulated and communicated to our management, including our Chief Executive Officer and Chief Financial Officer, as appropriate, to allow timely decisions regarding required disclosure.Overover Financial ReportingThe Company completed the Charter Acquisition and the Soldex Acquisition on January 13, 2012 and October 31, 2012, respectively. Management considers these transactions to be material to the Company’s Consolidated Financial Statements and believes that the internal controls and procedures of Charter and Soldex have a material effect on the Company’s internal control over financial reporting. We are currently in the process of incorporating the internal controls and procedures of Charter and Soldex into our internal controls over financial reporting and extending our compliance program under the Sarbanes-Oxley Act of 2002 to include Charter and Soldex. The Company has elected to exclude Charter and Soldex from the scope of its 2012 annual assessment of internal control over financial reporting as provided by the Act and the applicable SEC rules and regulations concerning business combinations.Other than the Charter Acquisition and the Soldex Acquisition noted above, thereperiod covered by this reportmost recently completed fiscal quarter that havehas materially affected, or areis reasonably likely to materially affect, our internal control over financial reporting.(i) pertain to the maintenance of records that, in reasonable detail, accurately and fairly reflect the transactions and dispositions of the company’s assets; (ii) provide reasonable assurance that transactions are recorded as necessary to permit preparation of financial statements in accordance with accounting principles generally accepted in the United States of America, and that receipts and expenditures are being made only in accordance with the authorization of management and directors of the company; and (iii) provide reasonable assurance regarding prevention or timely detection of unauthorized acquisition, use or disposition of the company’s assets that could have a material effect on the financial statements. 20122015 based on the criteria established inInternal Control –- Integrated Framework, issued by the Committee of Sponsoring Organizations of the Treadway Commission.Commission (2013 framework). Based on this assessment, our management has concluded that our internal control over financial reporting was effective as of December 31, 2012.In making its assessment of the effectiveness of the Company’s internal control over financial reporting as of December 31, 2012, management excluded Charter and Soldex from its assessment, as provided by the Act and the applicable SEC rules and regulations concerning business combinations, because these entities were acquired by Colfax Corporation in January and October 2012, respectively, and the Company has not yet fully incorporated the internal control procedures of these businesses into the Company’s internal control over financial reporting. During the year ended December 31, 2012, Charter and Soldex represented 83% of the Company’s Net sales. See Note 4, “Acquisitions” in the accompanying Notes to Consolidated Financial Statements for further discussion regarding these acquisitions.Firm—Firm—Internal Control Over Financial Reporting.”18, 2013,15, 2016, the Company entered into ana second amendment to the registration rights agreement, dated May 30, 2003 and as amended February 18, 2013, by the Company and each of Mitchell P. Rales and Steven M. Rales.2016.2019. In consideration for entering into the amendment, each of Mitchell P. Rales and Steven M. Rales agreed to refrain from exercising their registration rights prior to May 8, 2013,2016, the original expiration date of the registration rights period under the prior amended agreement.20132016 annual meeting to be filed with the SEC within 120 days after the end of the fiscal year covered by this Form 10-K (the “2013“2016 Proxy Statement”) under the captions “Election of Directors”, “Board of Directors and its Committees –- Audit Committee” and “Section 16(a) Beneficial Ownership Reporting Compliance”.20132016 Proxy Statement under the captions “Executive Compensation”, “Director Compensation”, “Compensation Discussion and Analysis”, “Compensation Committee Report” and “Compensation Committee Interlocks and Insider Participation.”20132016 Proxy Statement under the captions “Beneficial Ownership of Our Common Stock” and “Equity Compensation Plan Information.”20132016 Proxy Statement under the captions “Certain Relationships and Related Person Transactions” and “Director Independence.”20132016 Proxy Statement under the captions “Independent Registered Public AccountantAccounting Firm Fees and Services” and “Audit Committee’s Pre-Approval Policies and Procedures”.(a)(1)Financial Statements. The financial statements are set forth under “Item 8. Financial Statements and Supplementary Data” of this report on Form 10-K. (2)Schedules. An index of Exhibits and Schedules is on page 92 of this report. Schedules other than those listed below have been omitted from this Annual Report because they are not required, are not applicable or the required information is included in the financial statements or the notes thereto.(b)(B)Exhibits. The exhibits listed in the accompanying Exhibit Index are filed or incorporated by reference as part of this report. (c)Not applicable.18, 2013.COLFAX CORPORATIONBy: /s/ STEVEN E. SIMMS Steven E. Simms President and Chief Executive OfficerDate: February 18, 2013STEVEN E. SIMMSMATTHEW L. TREROTOLA Steven E. SimmsMatthew L. Trerotola President and Chief Executive Officer and Director(Principal Executive Officer) C. Scott Brannan Senior Vice President, Finance, Chief Financial Officer and Treasurer (Principal Financial and Accounting Officer) Mitchell P. Rales Chairman of the Board Patrick W. Allender Director DirectorThomas S. Gayner Director DirectorRhonda L. Jordan Director /s/ CLAY H. KIEFABERClay H. KiefaberDirector /s/ SAN W. ORR, III San W. Orr, III Director DirectorA. Clayton Perfall Director /s/ STEVEN E. SIMMS Steven E. Simms Director Rajiv Vinnakota Director 92Page Number inForm 10-KSchedules: Page Number in Form 10-K Valuation and Qualifying Accounts 9993104EXHIBIT INDEX 3.1 Amended and Restated Certificate of Incorporation of Colfax Corporation Incorporated by reference to Exhibit 3.01 to Colfax Corporation’s Form 8-K (File No. 001-34045) as filed with the CommissionSEC on January 30, 2012. 3.2 Colfax Corporation Amended and Restated Bylaws Incorporated by reference to Exhibit 3.2 to Colfax Corporation’s Form 8-K10-Q (File No. 001-34045) as filed with the CommissionSEC on May 13, 2008July 23, 2015 3.3Certificate of Designations of Series A Perpetual Convertible Preferred Stock of Colfax CorporationIncorporated by reference to Exhibit 3.02 to Colfax Corporation’s Form 8-K (File No. 001-34045) as filed with the Commission on January 30, 20124.1 Specimen Common Stock Certificate 10.1 Conversion Agreement, dated February 12, 2014, between Colfax Corporation and BDT CF Acquisition Vehicle, LLC Incorporated by reference to Exhibit 10.01 to Colfax Corporation’s Form 8-K (File No. 001-34045) as filed with the SEC on February 12, 2014 10.2 Colfax Corporation 2008 Omnibus Incentive Plan** 10.210.3 Colfax Corporation 2008 Omnibus Incentive Plan, as amended and restated April 2, 2012** Incorporated by reference to Exhibit 10.07 to Colfax Corporation’s Form 10-Q (File No. 001-34045) as filed with the SEC on August 7, 2012 10.310.4 Form of Non-Qualified Stock Option Agreement ** 10.410.5 Form of Performance Stock Unit Agreement** 10.510.6 Form of Outside Director Restricted Stock Unit Agreement (Three Year Vesting)** 10.610.7 Form of Outside Director Deferred Stock Unit Agreement** 10.710.8 Form of Outside Director Deferred Stock Unit Agreement for deferral of grants of restricted stock (Three Year Vesting)** 10.810.9 Form of Outside Director Deferred Stock Unit Agreement for deferral of director fees** 10.910.10 Incorporated by reference to Exhibit 10.08 to Colfax Corporation’s Form 10-Q (File No. 001-34045) filed with the SEC on August 7,20127, 2012 10.1010.11 Form of Outside Director Restricted Stock Unit Agreement (One Year Vesting)** Incorporated by reference to Exhibit 10.09 to Colfax Corporation’s Form 10-Q (File No. 001-34045) filed with the SEC on August 7,20127, 2012 10.1110.12 Incorporated by reference to Exhibit 10.10 to Colfax Corporation’s Form 10-Q (File No. 001-34045) filed with the SEC on August 7,20127, 2012 10.1210.13 unitsunits** 10.1310.14 Colfax Corporation Amended and Restated Excess Benefit Plan, effective as of January 1, 2013** Incorporated by reference to Exhibit 10.13 to Colfax Corporation’s Form 10-K (File No. 001-34045) as filed with the SEC on February 19, 2013 10.1410.15Colfax Corporation Nonqualified Deferred Compensation Plan, as effective January 1, 2016** Filed herewith 10.16 Employment Agreement between Matthew L. Trerotola and Colfax Corporation Incorporated by reference to Exhibit 10.01 to Colfax Corporation’s Form 10-Q (File No. 001-34045) as filed with the SEC on October 22, 2015 10.16 Employment Agreement between Colfax Corporation and Steven E. Simms** Incorporated by reference to Exhibit 10.1 to Colfax Corporation’s Form 8-K (File No. 001-34045) as filed with the SEC on April 23, 2012 10.1510.17Amendment No. 1 to the Employment Agreement between Colfax Corporation and Steven E. Simms** Incorporated by reference to Exhibit 10.1 to Colfax Corporation’s Form 8-K (File No. 001-34045) as filed with the SEC on April 28, 2014 10.18 Amendment No. 1 to the CEO Non-Qualified Stock Option Agreement and CEO Performance Stock Unit Agreement between Colfax Corporation and Steven E. Simms** Incorporated by reference to Exhibit 10.03 to Colfax Corporation’s Form 10-Q (File No. 001-34045) as filed with the SEC on October 22, 2015 10.19 Consulting Agreement dated July 23, 2015 between Steven E. Simms and Colfax Corporation** Incorporated by reference to Exhibit 10.02 to Colfax Corporation’s Form 10-Q (File No. 001-34045) as filed with the SEC on October 22, 2015 10.20 Employment Agreement between Colfax Corporation and Clay H. Kiefaber** Incorporated by reference to Exhibit 10.1 to Colfax Corporation’s Form 8-K (File No. 001-34045) as filed with the CommissionSEC on March 28, 2011 10.1610.21 Amendment No. 1 to the Employment Agreement between Colfax Corporation and Clay H. Kiefaber** Incorporated by reference to Exhibit 10.2 to Colfax Corporation’s Form 8-K (File No. 001-34045) as filed with the CommissionSEC on April 23, 2012 10.1710.22 Employment Agreement between Colfax Corporation and C. Scott Brannan** Incorporated by reference to Exhibit 10.1 to Colfax Corporation’s Form 8-K (File No. 001-34045) as filed with the CommissionSEC on September 22, 2010 10.1810.23 Employment Agreement between Colfax Corporation and Daniel A. Pryor** Incorporated by reference to Exhibit 10.04 to Colfax Corporation’s Form 10-Q (File No. 001-34045) as filed with the SEC on August 7, 2012 10.1910.24 EmploymentService Agreement between Colfax CorporationHowden Group Ltd. and A. Lynne Puckett*Ian Brander dated December 3, 2010** Incorporated by reference to Exhibit 10.0510.01 to Colfax Corporation’s Form 10-Q (File No. 001-34045) as filed with the SEC on August 7, 2012July 25, 2013 10.20 Employment Agreement between Colfax Corporation and William E. Roller** Incorporated by reference to Exhibit 10.1 to Colfax Corporation’s Form 10-Q (File No. 001-34045) as filed with the Commission on May 8, 200910.21Amendment to the Employment Agreement between Colfax Corporation and William E. Roller**Incorporated by reference to Exhibit 10.2 to Colfax Corporation’s Form 10-Q (File No. 001-34045) as filed with the Commission on May 8, 200910.22Letter to William E. Roller**Incorporated by reference to Exhibit 10.07 to Colfax Corporation’s Form 10-Q (File No. 001-345045), as filed with the Commission on October 27, 2011ExhibitNo.DescriptionLocation*10.23Consulting Agreement between Colfax Corporation and Joseph O. Bunting III**Incorporated by reference to Exhibit 10.3 to Colfax Corporation’s Form 8-K (File No. 001-34045) as filed with the Commission on April 23, 201210.2410.25 Colfax Corporation Annual Incentive Plan, as amended and restated April 2, 2012** Filed herewithIncorporated by reference to Exhibit 10.24 to Colfax Corporation’s Form 10-K (File No. 001-34045) as filed with the SEC on February 19, 2013 10.2510.26Colfax Executive Officer Severance Plan** Incorporated by reference to Exhibit 10.02 to Colfax Corporation’s Form 10-Q (File No. 001-34045) as filed with the SEC on July 23, 2015 10.27 Credit Agreement, dated September 12, 2011, by and among the Colfax Corporation, certain subsidiaries of Colfax Corporation identified therein, Deutsche Bank AG New York Branch and the lenders identified therein Incorporated by reference to Exhibit 99.6 to Colfax Corporation’s Form 8-K (File No. 001-34045) as filed with the CommissionSEC on September 15, 201110.2610.28 Amendment No. 1 to the Credit Agreement, dated January 13, 2012, by and among the Colfax Corporation, certain subsidiaries of Colfax Corporation identified therein, Deutsche Bank AG New York Branch and the lenders identified therein Incorporated by reference to Exhibit 10.1 to Colfax Corporation’s Form 8-K (File No. 001-34045) as filed with the CommissionSEC on January 17, 2012 10.2710.29 Share PurchaseSecond Amendment to the Credit Agreement, dated February 22, 2013, by and among Inversiones Breca S.A. andthe Colfax Corporation, dated ascertain subsidiaries of May 26, 2012Colfax Corporation identified therein, Deutsche Bank AG New York Branch and the lenders identified therein Incorporated by reference to Exhibit 2.110.1 to Colfax Corporation’s Form 8-K (File No. 001-34045) as filed with the CommissionSEC on May 31, 2012February 25, 2013 10.2810.30 Third Amendment No. 1 to the Share PurchaseCredit Agreement, dated November 7, 2013 by and among Inversiones Breca S.A. andthe Colfax Corporation, dated October 25, 2012certain subsidiaries of Colfax Corporation identified therein, Deutsche Bank AG New York Branch and the lenders identified therein Filed herewithIncorporated by reference to Exhibit 10.1 to Colfax Corporation’s Form 8-K (File No. 001-34045) as filed with the SEC on November 14, 2013 10.2910.31Incremental Amendment, dated May 14, 2014, by and among certain subsidiaries of Colfax Corporation identified therein, Deutsche Bank AG New York Branch and the lenders identified therein Incorporated by reference to Exhibit 10.1 to Colfax Corporation’s Form 8-K (File No. 001-34045) as filed with the SEC on May 14, 2014 10.32 Technical Amendment, dated December 10, 2014, by and among certain subsidiaries of Colfax Corporation identified therein and Deutsche Bank AG New York Branch Incorporated by reference to Exhibit 10.28 to Colfax Corporation’s Form 10-K (File No. 001-34045) as filed with the SEC on February 17, 2015 10.33 Credit Agreement, dated as of June 5, 2015, among Colfax Corporation, as the borrower, certain U.S. subsidiaries of Colfax Corporation identified therein, as guarantors, each of the lenders party thereto and Deutsche Bank AG New York Branch, as administrative agent, swing line lender and global coordinator Incorporated by reference to Exhibit 10.01 to Colfax Corporation’s Form 10-Q (File No. 001-34045) as filed with the SEC on July 23, 2015 10.34 Increase Agreement, dated as of September 25, 2015, among Colfax Corporation, as the borrower, the guarantors thereto, each of the lenders party thereto, Deutsche Bank AG New York Branch, as administrative agent, swing line leader and global coordinator and Deutsche Bank Securities, Inc., as lead arranger and bookrunnner Incorporated by reference to Exhibit 10.04 to Colfax Corporation’s Form 10-Q (File No. 001-34045) as filed with the SEC on July 23, 2015 10.35 Registration Rights Agreement, dated May 30, 2003, by and among Colfax Corporation, Colfax Capital Corporation, Janalia Corporation, Equity Group Holdings, L.L.C., and Mitchell P. Rales and Steven M. Rales 10.3010.36 Amendment No. 1 to the Registration Rights Agreement, by and among Colfax Corporation and Mitchell P. Rales and Steven M. Rales, dated February 18, 2013 Incorporated by reference to Exhibit 10.30 to Colfax Corporation’s Form 10-K (File No. 001-34045) as filed with the SEC on February 19, 2013 10.37 Amendment No. 2 to the Registration Rights Agreement, by and among Colfax Corporation and Mitchell P. Rales and Steven M. Rales, dated February 15, 2016 Filed herewith 10.3110.38 Securities Purchase Agreement, dated September 12, 2011, between BDT CF Acquisition Vehicle, LLC and Colfax Corporation Incorporated by reference to Exhibit 99.2 to Colfax Corporation’s Form 8-K (File No. 001-34045) as filed with the CommissionSEC on September 15, 2011 10.3210.39 Securities Purchase Agreement, dated September 12, 2011, between Mitchell P. Rales and Colfax Corporation Incorporated by reference to Exhibit 99.3 to Colfax Corporation’s Form 8-K (File No. 001-34045) as filed with the CommissionSEC on September 15, 2011 10.3310.40 Securities Purchase Agreement, dated September 12, 2011, between Steven M. Rales and Colfax Corporation Incorporated by reference to Exhibit 99.4 to Colfax Corporation’s Form 8-K (File No. 001-34045) as filed with the CommissionSEC on September 15, 2011ExhibitNo. Description Location*10.3410.41 Securities Purchase Agreement, dated September 12, 2011, between Markel Corporation and Colfax Corporation Incorporated by reference to Exhibit 99.5 to Colfax Corporation’s Form 8-K (File No. 001-34045) as filed with the CommissionSEC on September 15, 2011 10.3510.42 Registration Rights Agreement, dated as of January 24, 2012, between Colfax Corporation and BDT CF Acquisition Vehicle, LLC Incorporated by reference to Exhibit 10.01 to Colfax Corporation’s Form 8-K (File No. 001-34045) as filed with the CommissionSEC on January 30, 2012 10.3610.43 Registration Rights Agreement, dated as of January 24, 2012, between Colfax Corporation and Mitchell P. Rales Incorporated by reference to Exhibit 10.02 to Colfax Corporation’s Form 8-K (File No. 001-34045) as filed with the CommissionSEC on January 30, 2012 10.3710.44 Registration Rights Agreement, dated as of January 24, 2012, between Colfax Corporation and Steven M. Rales Incorporated by reference to Exhibit 10.03 to Colfax Corporation’s Form 8-K (File No. 001-34045) as filed with the CommissionSEC on January 30, 2012 10.3810.45 Registration Rights Agreement, dated as of January 24, 2012, between Colfax Corporation and Markel Corporation Incorporated by reference to Exhibit 10.04 to Colfax Corporation’s Form 8-K (File No. 001-34045) as filed with the CommissionSEC on January 30, 201212.1Computation of Ratio of Earnings to Fixed ChargesFiled herewith 21.1 Subsidiaries of registrant Filed herewith 23.1 Consent of Independent Registered Public Accounting Firm Filed herewith 31.131.01 Certification of Chief Executive Officer Pursuant to Item 601(b)(31) of Regulation S-K, as adopted pursuant to Section 302 of the Sarbanes-Oxley Act of 2002. Filed herewith 31.231.02 Certification of Chief Financial Officer Pursuant to Item 601(b)(31) of Regulation S-K, as adopted pursuant to Section 302 of the Sarbanes-Oxley Act of 2002. Filed herewith 32.132.01 Certification of Chief Executive Officer, Pursuant to 18 U.S.C. Section 1350, as adopted pursuant to Section 906 of the Sarbanes-Oxley Act of 2002 Filed herewith 32.232.02 Certification of Chief Financial Officer, Pursuant to 18 U.S.C. Section 1350, as adopted pursuant to Section 906 of the Sarbanes-Oxley Act of 2002 Filed herewith 101.INS***101.INS XBRL Instance Document Filed herewith 101.SCH***101.SCH XBRL Taxonomy Extension Schema Document Filed herewith 101.CAL***101.CAL XBRL Extension Calculation Linkbase Document Filed herewith 101.DEF***101.DEF XBRL Taxonomy Extension Definition Linkbase Document Filed herewith 101.LAB***101.LAB XBRL Taxonomy Extension Label Linkbase Document Filed herewith 101.PRE***101.PRE XBRL Taxonomy Extension Presentation Linkbase Document Filed herewith *** In accordance with Rule 406T of Regulation S-T, the XBRL related information in Exhibit 101 to this Annual Report on Form 10-K shall not be deemed to be “filed” for purposes of Section 18 of the Exchange Act, or otherwise subject to the liability of that section, and shall not be incorporated by reference into any registration statement or other document filed under the Securities Act of 1933, as amended, or the Exchange Act, except as shall be expressly set forth by specific reference in such filing. Balance at
Beginning
of Period
Cost and Write-Offs Write-Downs and
Deductions Acquisitions Foreign
Currency
Translation Balance at
End of
Period (In thousands) Year Ended December 31, 2012: Allowance for doubtful accounts $ 2,578 $ 13,917 $ — $ (192 ) $ — $ 161 $ 16,464 Allowance for excess slow-moving and obsolete inventory 6,735 3,341 — (1,001 ) — 146 9,221 Valuation allowance for deferred tax assets 79,855 — — Year Ended December 31, 2011: Allowance for doubtful accounts $ 2,562 $ 112 $ — $ (70 ) $ — $ (26 ) $ 2,578 Allowance for excess slow-moving and obsolete inventory 7,777 181 — (1,258 ) — 35 6,735 Valuation allowance for deferred tax assets 52,891 16,621 10,346 — — (3 ) 79,855 Year Ended December 31, 2010: Allowance for doubtful accounts $ 2,837 $ 218 $ — $ (405 ) $ — $ (88 ) $ 2,562 Allowance for excess slow-moving and obsolete inventory 8,025 1,942 — (1,849 ) — (341 ) 7,777 Valuation allowance for deferred tax assets 45,053 4,407 3,666 (180 ) — (55 ) 52,891 __________ Balance at
Beginning
of Period
Expense (1)
Accounts (2) Write-Offs Write-Downs and
Deductions Foreign
Currency
Translation Balance at
End of
Period (In thousands) Year Ended December 31, 2015: Allowance for doubtful accounts $ 27,256 $ 16,225 $ — $ (526 ) $ — $ (3,450 ) $ 39,505 Allowance for excess slow-moving and obsolete inventory 34,573 8,078 — (2,225 ) — (4,298 ) 36,128 Valuation allowance for deferred tax assets 159,252 11,461 (3,862 ) (2,845 ) — (2,976 ) 161,030 Year Ended December 31, 2014: Allowance for doubtful accounts $ 31,282 $ 2,950 $ — $ (4,100 ) $ — $ (2,876 ) $ 27,256 Allowance for excess slow-moving and obsolete inventory 32,773 8,748 — (5,098 ) — (1,850 ) 34,573 Valuation allowance for deferred tax assets 360,910 11,933 (65,999 ) (146,177 ) 1,356 (2,771 ) 159,252 Year Ended December 31, 2013: Allowance for doubtful accounts $ 16,464 $ 12,707 $ — $ — $ 2,753 $ (642 ) $ 31,282 Allowance for excess slow-moving and obsolete inventory 9,221 21,629 — (2,026 ) 4,207 (258 ) 32,773 Valuation allowance for deferred tax assets 357,638 30,554 (27,233 ) (3,373 ) 4,925 (1,601 ) 360,910 Amounts charged to other accounts isexpense are net of recoveries for the respective period.Represents amount chargedcharge to Accumulated other comprehensive loss.loss and, for the year ended December 31, 2014, includes reclassifications to deferred tax asset accounts.99The valuation allowance for deferred tax assets during the year ended December 31, 2013 reflects the impact of retrospective adjustments recorded during the year ended December 31, 2014. The valuation allowance for deferred tax assets during the year ended December 31, 2014 reflects the impact of retrospective adjustments recorded during the year ended December 31, 2015. See Note 4, “Acquisitions” for further discussion.