United States Securities and Exchange Commission
|
| |
| þ | ANNUAL REPORT PURSUANT TO SECTION 13 OR 15(d) OF THE SECURITIES EXCHANGE ACT OF 1934. |
For the fiscal year ended December 31,
2012.2014. |
| |
| ¨ | TRANSITION REPORT PURSUANT TO SECTION 13 OR 15(d) OF THE SECURITIES EXCHANGE ACT OF 1934. |
For the transition period from _____________________ to _____________________.
Commission file number 0-4604
Cincinnati Financial Corporation
(Exact name of registrant as specified in its charter)
|
| |
| Ohio | 31-0746871 |
| (State of incorporation) | (I.R.S. Employer Identification No.) |
|
|
Fairfield, Ohio 45014-5141 (Address of principal executive offices) (Zip Code) |
(Registrant’s telephone number, including area code) |
Securities registered pursuant to Section 12(b) of the Act:
Securities registered pursuant to Section 12(g) of the Act:
6.125% Senior Notes due 2034
6.9% Senior Debentures due 2028
6.92% Senior Debentures due 2028
Indicate by check mark if the registrant is a well-known seasoned issuer, as defined in Rule 405 of the Securities Act. Yesþ No¨ Indicate by check mark if the registrant is not required to file reports pursuant to Section 13 or Section 15(d) of the Act. Yes¨ Noþ Indicate by check mark whether the registrant: (1) has filed all reports required to be filed by Section 13 or 15(d) of the Securities Exchange Act of 1934 during the preceding 12 months (or for such shorter period that the registrant was required to file such reports) and (2) has been subject to such filing requirements for the past 90 days.
Cincinnati Financial Corporation - 2014 10-K - Page 1
Indicate by check mark whether the registrant has submitted electronically and posted on its corporate website, if any, every Interactive Data File required to be submitted and posted pursuant to Rule 405 if Regulation S-T(§232.405 of this chapter) during the preceding 12 months (or for such shorter period that the registrant was required to submit and post such files). Yesþ No¨ Indicate by check mark if disclosure of delinquent filers pursuant to Item 405 of Regulation S-K (§229.405 of this chapter) is not contained herein, and will not be contained, to the best of registrant'sregistrant’s knowledge, in definitive proxy or information statements incorporated by reference in Part III of this Form 10-K or any amendment to this Form 10-K.¨ Indicate by check mark whether the registrant is a large accelerated filer, an accelerated filer, a non-accelerated filer, or a smaller reporting company. See the definitions of "large accelerated filer,” “accelerated filer" and smaller reporting company in Rule 12b-2 of the Exchange Act.
Large accelerated filerþ Accelerated filer¨ Non-accelerated filer¨ Smaller reporting company¨ Indicate by check mark whether the registrant is a shell company (as defined in Rule 12b-2 of the Act). Yes¨ Noþ The aggregate market value of voting stock held by nonaffiliates of the Registrant was
$5,608,134,376$7,129,857,801 as of June 30,
2012.2014.
As of February
21, 2013,20, 2015, there were
163,227,008164,166,327 shares of common stock outstanding.
Document Incorporated by Reference
Portions of the definitive Proxy Statement for Cincinnati Financial Corporation’s Annual Meeting of Shareholders to be held on
April 27, 2013,May 2, 2015, are incorporated by reference into Part III of this Form 10-K.
Cincinnati Financial Corporation - 2014 10-K - Page 2
2014 ANNUAL REPORTON FORM 10-K
TABLEOF CONTENTS
2012 Annual Report on Form 10-K
Table of Contents
| | |
| Part I | | 3 |
| Item 1. | Business | 3 |
| Cincinnati Financial Corporation – Introduction | 3 |
| Our Business and Our Strategy | 3 |
| Our Segments | 12 |
| Other | 23 |
| Regulation | 24 |
| Item 1A. | Risk Factors | 26 |
| Item 1B. | Unresolved Staff Comments | 33 |
| Item 2. | Properties | 33 |
| Item 3. | Legal Proceedings | 33 |
| Item 4. | Mine Safety Disclosures | 33 |
| Part II | | 34 |
| Item 5. | Market for the Registrant’s Common Equity, Related Stockholder Matters and Issuer Purchases of Equity Securities | 34 |
Item 6.6 | Selected Financial Data | 37 |
| Item 7. | Management's Discussion and Analysis of Financial Condition and Results of Operations | 38 |
| Introduction | 38 |
| Executive Summary | 38 |
| Critical Accounting Estimates | 43 |
| Recent Accounting Pronouncements | 50 |
Results of Operations | 51Financial Results | |
| Liquidity and Capital Resources | 83 |
| Safe Harbor Statement | 98 |
| Item 7A. | Quantitative and Qualitative Disclosures About Market Risk | 100 |
Introduction | 100 |
Fixed-Maturity Investments | 101 |
Equity Investments | 102 |
Application of Asset Impairment Policy | 102 |
| Item 8. | Financial Statements and Supplementary Data | 105 |
| Responsibility for Financial Statements | 105 |
| Management’s Annual Report on Internal Control Over Financial Reporting | 106 |
| Report of Independent Registered Public Accounting Firm | 107 |
| Consolidated Balance Sheets | 108 |
| Consolidated Statements of Income | |
| Consolidated Statements of Comprehensive Income | 109 |
| Consolidated Statements of Shareholders’ Equity | 110 |
| Consolidated Statements of Cash Flows | 111 |
| Notes to Consolidated Financial Statements | 112 |
| Item 9. | Changes in and Disagreements with Accountants on Accounting and Financial Disclosure | 140 |
| Item 9A. | Controls and Procedures | 140 |
| Item 9B. | Other Information | 140 |
| Part III | | 141 |
| Item 10. | Directors, Executive Officers and Corporate Governance | 141 |
| Item 11. | Executive Compensation | 143 |
| Item 12. | Security Ownership of Certain Beneficial Owners and Management and Related Stockholder Matters | 143 |
| Item 13. | Certain Relationships and Related Transactions, and Director Independence | 143 |
| Item 14. | Principal Accounting Fees and Services | 143 |
| Part IV | | 143 |
| Item 15. | Exhibits, Financial Statement Schedules | 143 |
Cincinnati Financial Corporation - 2014 10-K - Page 3
Cincinnati Financial Corporation – Introduction
We are an Ohio corporation formed in 1968. Our lead subsidiary, The Cincinnati Insurance Company, was founded in 1950. Our main business is property casualty insurance marketed through independent insurance agencies in 39 states. Our headquarters is in Fairfield, Ohio. At year-end
2012,2014, we employed
4,0574,305 associates,
with 2,784including 2,954 headquarters associates
providingwho provide support to
1,2731,351 field associates.
Cincinnati Financial Corporation owns 100 percent of three subsidiaries: The Cincinnati Insurance Company, CSU Producer Resources Inc. and CFC Investment Company. In addition, the parent company has an investment portfolio, owns the headquarters property and is responsible for corporate borrowings and shareholder dividends.
The Cincinnati Insurance Company owns 100 percent of our four additional insurance subsidiaries. Our standard market property casualty insurance group includes two of those subsidiaries – The Cincinnati Casualty Company and The Cincinnati Indemnity Company. This group writes a broad range of business, homeowner and auto policies. Other subsidiaries of The Cincinnati Insurance Company include The Cincinnati Life Insurance Company, which provides life insurance, disability income policies and fixed annuities, and The Cincinnati Specialty Underwriters Insurance Company, which offers excess and surplus lines insurance products.
The two noninsurance subsidiaries of Cincinnati Financial Corporation are CSU Producer Resources, which offers insurance brokerage services to our independent agencies so their clients can access our excess and surplus lines insurance products; and CFC Investment Company, which offers commercial leasing and financing services to our agencies, their clients and other customers.
Our filings with the U.S. Securities and Exchange Commission (SEC) are available free of charge, on our website,www.cinfin.com/cinfin.com/investors, as soon as possible after they have been filed with the SEC. These filings include annual reports on Form 10-K, quarterly reports on Form 10-Q, current reports on Form 8-K and amendments to those reports filed or furnished pursuant to Section 13(a) or 15(d) of the Securities Exchange Act of 1934. In the following pages we reference various websites. These websites, including our own, are not incorporated by reference in this Annual Report on Form 10-K. Periodically, we refer to estimated industry data so that we can give information about our performance versus the overall insurance industry. Unless otherwise noted, the industry data is prepared by A.M. Best Co., a leading insurance industry statistical, analytical and insurer financial strength and credit rating organization. Information from A.M. Best is presented on a statutory accounting basis. When we provide our results on a comparable statutory accounting basis, we label it as such; all other company data is presented in accordance with accounting principles generally accepted in the United States of America (GAAP).
Cincinnati Financial Corporation - 2014 10-K - Page 4
Our Business and Our Strategy
The Cincinnati Insurance Company was founded
overmore than 60 years ago by four independent insurance agents. They established the mission that continues to guide all of the companies in the Cincinnati Financial Corporation family – to grow profitably and enhance the ability of local independent insurance agents to deliver quality financial protection to the people and businesses they serve by:
| · | providing insurance market stability through financial strength |
| · | producing competitive, up-to-date products and services |
| · | developing associates committed to superior service |
providing insurance market stability through financial strength
producing competitive, up-to-date products and services
developing associates committed to superior service
A select group of independent agencies in 39 states actively markets our property casualty insurance within their communities. At year-end
2012,2014, standard market commercial lines and excess and surplus lines policies were marketed in all of those states, while personal lines policies were marketed in 31 of those states. Within our select group of agencies, we also seek to become the life insurance carrier of choice and to help agents and their clients – our policyholders – by offering leasing and financing services.
Three competitive advantages distinguish our company, positioning us to build shareholder value and to be successful overall:
| · | Commitment to our network of professional independent insurance agencies and to their continued success |
| · | Financial strength that lets us be a consistent market for our agents’ business, supporting stability and confidence |
| · | Operating structure that supports local decision making, showcasing our claims excellence and allowing us to balance growth with underwriting discipline |
Commitment to our professional independent insurance agencies and to their continued success
Financial strength to fulfill our promises and be a consistent market for our agents’ business, supporting stability and confidence
Operating structure that supports local decision making, showcasing our claims excellence and allowing us to balance growth with underwriting discipline
The primary sources of our company’s net income are summarized below. We discuss the contribution to net income from each source in Item 7, Corporate Financial Highlights of Management’s Discussion and Analysis.
Underwriting profit (loss) – Includes revenues from earned premiums from insurance policies sold, reduced by losses and loss expenses from insurance coverages provided by those policies. Those revenues are further reduced by underwriting expenses from marketing policies or related administration of our insurance operation. The net result represents an underwriting profit when revenues exceed losses and expenses.
Investment income – Is generated primarily from investing the premiums collected from insurance policies, until funds from cash or invested assets are needed to pay losses for insurance claims or other expenses. Interest income from bond investments or dividend income from stock investments are the main categories of our investment income.
Realized investment gains (losses) – Occur from appreciation or depreciation of invested assets over time. Gains or losses are generally recognized when invested assets are sold or become impaired.
Independent Insurance Agency Marketplace
The U.S. property casualty insurance industry is a highly competitive marketplace with more than 2,000 stock and mutual companies operating independently or in groups. No single company or group dominates across all product lines and states. Standard market insurance companies (carriers) can market a broad array of products nationally or:
| · | choose to sell a limited product line or only one type of insurance (monoline carrier) |
| · | target a certain segment of the market (for example, personal insurance) |
| · | focus on one or more states or regions (regional carrier) |
choose to sell a limited product line or only one type of insurance (monoline carrier)
target a certain segment of the market (for example, personal insurance)
focus on one or more states or regions (regional carrier)
Cincinnati Financial Corporation - 2014 10-K - Page 5
Standard market property casualty insurers generally offer insurance products through one or more distribution channels:
| · | independent agents, who represent multiple carriers |
| · | captive agents, who represent one carrier exclusively |
| · | direct marketing to consumers |
independent agents, who represent multiple carriers
captive agents, who represent one carrier exclusively
direct marketing to consumers
For the most part, we compete with standard market insurance companies that market through independent insurance agents. Agencies marketing our commercial lines products typically represent six to 12 standard market insurance carriers for commercial lines products, including both national and regional carriers, most of which are mutual companies. Our agencies typically represent four to six standard personal lines
carriers, and wecarriers. We also compete with carriers that market personal lines products through captive agents and direct writers. Distribution through independent insurance agents or brokers represents
approximately halfnearly 60 percent of overall U.S. property casualty insurance premiums and approximately
two-thirds80 percent of commercial property casualty insurance premiums, according to
studies by the
Independent Insurance
Information Institute.Agents and Brokers of America.
We are committed exclusively to the independent agency channel. The independent agencies that we choose to market our standard lines insurance products share our philosophies. They do business person to person; offer broad, value-added services; maintain sound balance sheets; and manage their agencies professionally, targeting long-term success. We develop our relationships with agencies that are active in their
local communities, providing important knowledge of local market trends, opportunities and challenges.
In addition to providing
We help our agencies meet the broader needs of their clients and increase and diversify their revenues and profitability by offering insurance solutions beyond our standard market property casualty insurance
products. We market life insurance products
wethrough the agencies that offer our property casualty products and through other independent life agencies that represent The Cincinnati Life Insurance Company without also representing our other subsidiaries. We operate our own excess and surplus lines insurance brokerage firm and insurance carrier so that we can offer our excess and surplus lines products exclusively to the independent agencies who market our other property casualty insurance products.
We also market life insurance products through the agencies that market our property casualty products and through other independent agencies that represent The Cincinnati Life Insurance Company without also representing our other subsidiaries. Offering insurance solutions beyond our standard market property casualty insurance products helps our agencies meet the broader needs of their clients and also serves to increase and diversify agency revenues and profitability. The excess and surplus lines market exists due to a regulatory distinction. Generally, excess and surplus lines insurance carriers provide insurance that is unavailable in the standard market due to market conditions or characteristics of the insured
personpersons or
organizationorganizations that are caused by nature,
the insured'stheir claim history or the characteristics of their business. Insurers operating in the excess and surplus lines marketplace generally market business through excess and surplus lines insurance brokers, whether they are small specialty insurers or specialized divisions of larger insurance organizations. We established an excess and surplus lines operation
in response to requests to help meet the needs of agency clients when insurance is unavailable in the standard market. By providing superior service, we can help our agencies grow while also profitably growing our property casualty business.
At year-end
2012,2014, our
1,4081,466 property casualty agency relationships were marketing our standard market insurance products from
1,7581,884 reporting locations. An increasing number of agencies have multiple, separately identifiable locations, reflecting their growth and consolidation of ownership within the independent agency marketplace. The number of reporting agency locations indicates our agents’ regional scope and the extent of our presence within our 39 active states. At year-end
2011,2013, our
1,3121,450 agency relationships had
1,6481,823 reporting locations. At year-end
2010,2012, our
1,2451,408 agency relationships had
1,5441,758 reporting locations.
We made
140, 13399, 96 and
93140 new agency appointments in
2012, 20112014, 2013 and
2010,2012, respectively. Of these new appointments,
109, 9363, 59 and
70,109, respectively, were new relationships. The remainder included new branch offices opened by existing Cincinnati agencies and appointment of agencies that merged with a Cincinnati agency. These new appointments and other changes in agency structures or appointment status led to a net increase in agency relationships of
96, 6716, 42 and
6596 and a net increase in reporting agency locations of
61, 65 and 110
104in 2014, 2013 and
81 in 2012,
2011 and 2010, respectively.
On average, we have a
12.612.8 percent share of the standard lines property casualty insurance purchased through our reporting agency locations, according to
2013 data from agency surveys. Our share is
17.717.6 percent in reporting agency locations that have represented us for more than 10 years;
8.58.9 percent in agencies that have represented us for six to 10 years;
4.35.4 percent in agencies that have represented us for two to five years; and
1.20.9 percent in agencies that have represented us for one year or less.
Cincinnati Financial Corporation - 2014 10-K - Page 6
Our largest single agency relationship accounted for approximately
0.90.8 percent of our total property casualty earned premiums in
2012.2014. No aggregate locations under a single ownership structure accounted for more than 2.1 percent of our earned premiums in
2012.2014.
We believe that our financial strength and strong
capital and surplus position, reflected in our insurer financial strength ratings, are clear, competitive advantages in the segments of the insurance marketplace that we serve. This strength supports the consistent, predictable performance that our policyholders, agents, associates and shareholders have always expected and received, helping us withstand significant challenges.
While the potential exists for short-term financial performance variability due to our exposures to potential catastrophes or significant capital market losses, the rating agencies consistently have asserted that we have built appropriate financial strength and flexibility to manage that variability. We remain committed to strategies that emphasize being a consistent, stable market for our agents’ business
overrather than seeking short-term benefits that might accrue by quick, opportunistic reaction to changes in market conditions.
We use various principles and practices such as diversification and enterprise risk management to maintain strong capital. For example, we maintain a diversified investment portfolio by reviewing and applying diversification parameters and tolerances.
| · | Our $9.093 billion fixed-maturity portfolio is diversified and exceeds total insurance reserves. The portfolio had an average rating of A2/A, and its fair value exceeded total insurance reserve liability by nearly 40 percent at December 31, 2012. No corporate bond exposure accounted for more than 0.7 percent of our fixed-maturity portfolio, and no municipal exposure accounted for more than 0.2 percent. |
| · | The strength of our fixed-maturity portfolio provides an opportunity to invest for potential capital appreciation by purchasing equity securities. Our $3.373 billion equity portfolio minimizes concentrations in single stocks or industries. At December 31, 2012, no single security accounted for more than 4.2 percent of our portfolio of publicly traded common stocks, and no single sector accounted for more than 16 percent. |
Our $9.460 billion fixed-maturity portfolio is diversified and exceeds total insurance reserves. The portfolio had an average rating of A2/A, and its fair value exceeded total insurance reserve liabilities by approximately 35 percent at December 31, 2014. No corporate bond exposure accounted for more than 0.7 percent of our fixed-maturity portfolio, and no municipal exposure accounted for more than 0.3 percent.
The strength of our fixed-maturity portfolio provides an opportunity to invest for potential capital appreciation by purchasing equity securities. Our $4.858 billion equity portfolio minimizes concentrations in single stocks or industries. At December 31, 2014, no single security accounted for more than 3.3 percent of our portfolio of publicly traded common stocks, and no single sector accounted for more than 17.3 percent.
Strong liquidity increases our flexibility through all periods to maintain our cash dividend and to continue to invest in and expand our insurance operations. At December 31,
2012,2014, we held
$1.182$1.821 billion of our cash and invested assets at the parent company level, of which
$958 million,$1.639 billion, or
81.090.0 percent, was invested in common stocks, and
$90$72 million, or
7.64.0 percent, was cash
orand cash equivalents.
We minimize reliance on debt as a source of capital, maintaining
thea debt-to-total-capital ratio
of debt-to-total-capital below 20 percent. At December 31,
2012,2014, this ratio at
14.111.3 percent was well below the target limit as capital remained strong while debt levels
did not changewere reduced by $55 million from year-end
2011.2013. Long-term debt at year-end
20122014 totaled
$790$791 million and our short-term debt was
$104$49 million. The long-term debt consists of three nonconvertible, noncallable debentures, two due in 2028 and one in 2034. Ratings for our long-term debt are discussed in Item 7, Liquidity and Capital Resources, Additional Sources of
Liquidity, Page 84.Liquidity.
At year-end
20122014 and
2011,2013, risk-based capital (RBC) for our standard
andmarket property casualty insurance, excess and surplus lines
property casualty operationsinsurance and life
operationsinsurance subsidiaries was
very strong, far exceeding regulatory requirements.
| · | We ended 2012 with a 0.9-to-1 ratio of property casualty premiums to surplus, a key measure of property casualty insurance company capacity and security. A lower ratio indicates more security for policyholders and greater capacity for growth by an insurer. We believe our ratio provides ample flexibility to diversify risk by expanding our operations into new geographies and product areas. The estimated industry average ratio was 0.8-to-1 at year-end 2012. |
| · | We ended 2012 with an 11.1 percent ratio of life statutory adjusted risk-based surplus to liabilities, a key measure of life insurance company capital strength. The estimated industry average ratio was 11.1 percent at year-end 2012. A higher ratio indicates an insurer’s stronger security for policyholders and capacity to support business growth. |
Statutory Information
| (Dollars in millions) | | At December 31, | |
| | | 2012 | | | 2011 | |
| | | | | | | |
| Standard market property casualty insurance subsidiary | | | | | | | | |
| Statutory surplus | | $ | 3,914 | | | $ | 3,747 | |
| Risk-based capital (RBC) | | | 3,928 | | | | 3,754 | |
| Authorized control level risk-based capital | | | 487 | | | | 474 | |
| Ratio of risk-based capital to authorized control level risk-based capital | | | 8.1 | | | | 7.9 | |
| Written premium to surplus ratio | | | 0.9 | | | | 0.8 | |
| | | | | | | | | |
| Life insurance subsidiary | | | | | | | | |
| Statutory surplus | | $ | 276 | | | $ | 281 | |
| Risk-based capital (RBC) | | | 290 | | | | 288 | |
| Authorized control level risk-based capital | | | 29 | | | | 36 | |
| Ratio of risk-based capital to authorized control level risk-based capital | | | 10.1 | | | | 7.9 | |
| Total liabilities excluding separate account business | | | 2,626 | | | | 2,454 | |
| Life statutory risk-based adjusted surplus to liabilities ratio | | | 11.1 | | | | 11.8 | |
| | | | | | | | | |
| Excess and surplus insurance subsidiary | | | | | | | | |
| Statutory surplus | | $ | 199 | | | $ | 186 | |
| Risk-based capital (RBC) | | | 199 | | | | 186 | |
| Authorized control level risk-based capital | | | 20 | | | | 13 | |
| Ratio of risk-based capital to authorized control level risk-based capital | | | 10.2 | | | | 13.9 | |
| Written premium to surplus ratio | | | 0.5 | | | | 0.4 | |
We ended 2014 with a 0.9-to-1 ratio of property casualty premiums to surplus, a key measure of property casualty insurance company capacity and security. A lower ratio indicates more security for policyholders and greater capacity for growth by an insurer. We believe our ratio provides ample flexibility to diversify risk by expanding our operations into new geographies and product areas. The estimated industry average ratio was 0.7-to-1 at year-end 2014.
We ended 2014 with an 8.1 percent ratio of life statutory adjusted risk-based surplus to liabilities, a key measure of life insurance company capital strength. The estimated industry average ratio was 12.1 percent at year-end 2014. A higher ratio indicates an insurer’s stronger security for policyholders and capacity to support business growth.
Cincinnati Financial Corporation - 2014 10-K - Page 7
|
| | | | | | | | |
(Dollars in millions) Statutory Information | | At December 31, |
| | | 2014 | | 2013 |
| Standard market property casualty insurance subsidiary | | |
| | |
|
| Statutory capital and surplus | | $ | 4,472 |
| | $ | 4,326 |
|
| Risk-based capital (RBC) | | 4,490 |
| | 4,343 |
|
| Authorized control level risk-based capital | | 563 |
| | 534 |
|
| | | | | |
| Risk-based capital to authorized control level risk-based capital ratio | | 8.0 |
| | 8.1 |
|
| Written premium to surplus ratio | | 0.9 |
| | 0.9 |
|
| Life insurance subsidiary | | |
| | |
|
| Statutory capital and surplus | | $ | 223 |
| | $ | 247 |
|
| Risk-based capital (RBC) | | 241 |
| | 264 |
|
| Authorized control level risk-based capital | | 33 |
| | 31 |
|
| Total liabilities excluding separate account business | | 2,978 |
| | 2,807 |
|
| | | | | |
| Risk-based capital to authorized control level risk-based capital ratio | | 7.3 |
| | 8.1 |
|
| Life statutory risk-based adjusted surplus to liabilities ratio | | 8.1 |
| | 9.5 |
|
| Excess and surplus lines insurance subsidiary | | |
| | |
|
| Statutory capital and surplus | | $ | 266 |
| | $ | 228 |
|
| Risk-based capital (RBC) | | 266 |
| | 228 |
|
| Authorized control level risk-based capital | | 32 |
| | 25 |
|
| | | | | |
| Risk-based capital to authorized control level risk-based capital ratio | | 8.4 |
| | 9.2 |
|
| Written premium to surplus ratio | | 0.6 |
| | 0.6 |
|
| | | | | |
The consolidated property casualty insurance group’s ratio of investments in common stock,
at fair value, to statutory
capital and surplus was
58.167.7 percent at year-end
20122014 compared with
54.565.7 percent at year-end
2011.2013.
Cincinnati Financial Corporation’s senior debt is rated by four independent rating firms. In addition, the rating firms award our property casualty and life operations insurance financial strength ratings based on their quantitative and qualitative analyses. These ratings assess an insurer’s ability to meet financial obligations to policyholders and do not necessarily address all of the matters that may be important to shareholders. Ratings may be subject to revision or withdrawal at any time by the ratings agency, and each rating should be evaluated independently of any other rating.
All of our insurance subsidiaries continue to be highly rated. During
2012,2014, three of the four ratings firms affirmed our insurance financial strength
ratings andratings. Two of the four continued their stable outlook on the
ratings. No other rating agency actions occurred during 2012.ratings and one revised its outlook to positive from stable.
Cincinnati Financial Corporation - 2014 10-K - Page 8
As of February 25,
2013,2015, our insurance financial strength ratings were:
|
| | | | | | | | | | |
| | | Insurer Financial Strength Ratings | |
Rating
agency | | casualty insurance subsidiary | | Life insurance
subsidiary | | Excess and surplus
lines insurance subsidiary | | affirmation or action |
| | | | Rating Tier | | �� | Rating Tier | | | | Rating Tier | | | | Rating
Tier
| | |
A. M. Best Co. | ambest.com | A+ | Superior | 2 of 16 | A | Excellent | 3 of 16 | A | Excellent | 3 of 16 | | A | Excellent | 3 of 16 | | Stable outlook (12/19/12)12/14) |
Fitch Ratings | fitchratings.com | A+ | Strong | 5 of 21 | | A+ | Strong | 5 of 21 | | - | - | - | | Stable outlook (11/20/12)18/14) |
Moody's Investors Service | moodys.com | A1 | Good | 5 of 21 | - | - | - | - | | - | - | - | | NegativeStable outlook (10/21/11)(4/30/13) |
Standard & Poor's Ratings Services | spratings.com | A | Strong | 6 of 21 | | A | Strong | 6 of 21 | | - | - | - | | StablePositive outlook (7/30/12)(6/18/14) |
On December
19, 2012,12, 2014, A.M. Best affirmed our financial strength ratings that it had assigned in December 2008, continuing its stable outlook. A.M. Best cited our superior risk-adjusted capitalization, conservative loss reserving standards,
strong distribution network within our targeted regional markets and
growing use of predictive analytic modeling tools along with our historically strong operating
performance.performance that has improved in recent years. Concerns noted included
geographic concentrationvariability in earnings, primarily due to significant catastrophe-related losses, and
weakened underwriting results in recent years, primarily from above-average catastrophe-related losses.historically elevated common stock leverage. A.M. Best acknowledged
theseveral reasons for our strong
franchise value of our insurance subsidiaries and therelationships with independent agencies along with financial flexibility
of thethrough our holding company.
On
June 10, 2014, and on November
20, 2012,18, 2014, Fitch Ratings affirmed
our insurer financial strengththe ratings that it had assigned
to us in August 2009, continuing its stable outlook. Fitch
citedsaid our ratings strengths
includingincluded very strong capitalization, our
conservative operating subsidiary capitalization supported by strong holding
companycompany's sizeable position in cash and marketable securities
position and
our moderate
holding companyfinancial leverage
ratio. Fitch noted our reserve adequacy and
well-managed reserves.benefits from our implementation of claims and risk management tools in addition to pricing actions. Fitch
added that we have implemented predictive modeling tools that are anticipated to improve underwriting expertisesaid its rating could be unfavorably affected by a combined ratio exceeding 105 percent on a sustained basis, evidence of deteriorating profitability on recent growth or by material and
loss ratios over time. Rating concerns noted principally related to challenges from competitive market conditions and exposure to regional natural catastrophes and other weather-related losses.sustained deterioration in capitalization.
On July 30, 2012,June 18, 2014, Standard & Poor’s Ratings Services affirmed our insurer financialthe ratings that it had assigned in July2010, continuingrevising its stable outlook.outlook to positive from stable. S&P said its rating was based onreflected our strong competitive position, which is reinforced by a loyalfavorable geographical footprint and productive agency forceextremely strong capital. With the positive outlook, it acknowledged our general underwriting improvement in recent years and a low-cost infrastructure. S&P alsocited our very strong capitalizationtrack record of mitigating potential capital and high degree of financial flexibility.earnings volatility. S&P noted thatits rating could come under pressure if our strengths are partially offset by deteriorating property casualty underwriting results dueoverall operating performance or capital adequacy deteriorated significantly or upon perceived adverse changes to weather-related losses, and earnings volatility stemming from regional concentration and low reinsurance utilization.
our competitive position.
Our debt ratings are discussed in Item 7, Liquidity and Capital Resources, Additional Sources of
Liquidity, Page 84.Liquidity.
We offer our broad array of insurance products through the independent agency distribution channel. We recognize that locally based independent agencies have relationships in their communities and local marketplace intelligence that can lead to policyholder satisfaction, loyalty and profitable business. Several of our strategic initiatives are intended not only to help us compete but also to enhance support of agencies that represent us, thereby contributing to agency success. We seek to be a consistent and predictable property casualty carrier that agencies can rely on to serve their clients.
For our standard market business, field and headquarters underwriters make risk-specific decisions about both new business and renewals.In our 10 highest volume states for consolidated property casualty premiums,
1,0391,091 reporting agency locations wrote
65.462.8 percent of our
20122014 consolidated property casualty earned premium volume compared with
9921,067 locations and
66.563.8 percent in
2011.Consolidated Property Casualty Insurance Earned Premiums by State
| (Dollars in millions) | | Earned
premiums | | | % of total
earned | | | Agency
locations | | | Average
premium per
location | |
| Year ended December 31, 2012 | | | | | | | | | | | | | | | | |
| Ohio | | $ | 640 | | | | 19.1 | % | | | 235 | | | $ | 2.7 | |
| Illinois | | | 263 | | | | 7.9 | | | | 127 | | | | 2.1 | |
| Indiana | | | 228 | | | | 6.8 | | | | 110 | | | | 2.1 | |
| Pennsylvania | | | 196 | | | | 5.9 | | | | 91 | | | | 2.2 | |
| Georgia | | | 170 | | | | 5.1 | | | | 88 | | | | 1.9 | |
| North Carolina | | | 163 | | | | 4.9 | | | | 91 | | | | 1.8 | |
| Michigan | | | 153 | | | | 4.6 | | | | 134 | | | | 1.1 | |
| Virginia | | | 128 | | | | 3.8 | | | | 65 | | | | 2.0 | |
| Kentucky | | | 122 | | | | 3.7 | | | | 43 | | | | 2.8 | |
| Tennessee | | | 120 | | | | 3.6 | | | | 55 | | | | 2.2 | |
| Year ended December 31, 2011 | | | | | | | | | | | | | | | | |
| Ohio | | $ | 591 | | | | 19.5 | % | | | 233 | | | $ | 2.5 | |
| Illinois | | | 250 | | | | 8.3 | | | | 124 | | | | 2.0 | |
| Indiana | | | 208 | | | | 6.9 | | | | 107 | | | | 1.9 | |
| Pennsylvania | | | 184 | | | | 6.1 | | | | 85 | | | | 2.2 | |
| Georgia | | | 154 | | | | 5.1 | | | | 80 | | | | 1.9 | |
| North Carolina | | | 149 | | | | 4.9 | | | | 85 | | | | 1.8 | |
| Michigan | | | 134 | | | | 4.4 | | | | 118 | | | | 1.1 | |
| Virginia | | | 123 | | | | 4.1 | | | | 66 | | | | 1.9 | |
| Kentucky | | | 114 | | | | 3.8 | | | | 43 | | | | 2.7 | |
| Wisconsin | | | 103 | | | | 3.4 | | | | 51 | | | | 2.0 | |
2013. We continue efforts to geographically diversify our property casualty risks.
Cincinnati Financial Corporation - 2014 10-K - Page 9
Our 10 highest premium volume property casualty lines states are shown in the table below.
|
| | | | | | | | | | |
| (Dollars in millions) | Earned premiums | % of total earned | Agency locations | Average premium per location |
| Year ended December 31, 2014 | |
| |
| |
| |
|
| Ohio | $ | 715 |
| 17.7 | % | 246 |
| $ | 2.9 |
|
| Illinois | 288 |
| 7.1 |
| 136 |
| 2.1 |
|
| Indiana | 261 |
| 6.4 |
| 111 |
| 2.4 |
|
| Pennsylvania | 222 |
| 5.5 |
| 99 |
| 2.2 |
|
| Georgia | 216 |
| 5.3 |
| 95 |
| 2.3 |
|
| Michigan | 204 |
| 5.0 |
| 138 |
| 1.5 |
|
| North Carolina | 201 |
| 5.0 |
| 95 |
| 2.1 |
|
| Tennessee | 155 |
| 3.8 |
| 60 |
| 2.6 |
|
| Virginia | 146 |
| 3.6 |
| 65 |
| 2.2 |
|
| Alabama | 139 |
| 3.4 |
| 46 |
| 3.0 |
|
| | | | | |
We rely on our force of
1,2731,351 field associates to provide service and be accountable to our agencies for decisions we make at the local level. These associates live in the communities our agents serve, working from offices in their homes and providing 24/7 availability to our
agents.agents and policyholders. Headquarters associates support agencies and field associates with underwriting, accounting, technology assistance,
and training and other services. Company executives
and headquarters
underwriters and special teamsassociates regularly travel to visit agencies, strengthening the personal relationships we have with these organizations. Agents have opportunities for direct, personal conversations with our senior management team, and headquarters associates have opportunities to refresh their knowledge of marketplace conditions and field activities.
The field team is coordinated by field marketing representatives responsible for underwriting new commercial lines business. They are joined by field representatives specializing in claims, loss control, personal lines, excess and surplus lines, machinery and equipment, bond, premium audit and life insurance. The field team provides many services for agencies and policyholders; for example, our loss control field representatives and others specializing in machinery and equipment risks perform inspections and recommend specific actions to improve the safety of the policyholder’s operations and the quality of the agent’s account.
Agents work with us to carefully select risks and help assure pricing adequacy. They appreciate the time our associates invest in creating solutions for their clients while protecting profitability, whether that means working on an individual case or customizing policy terms and conditions that preserve flexibility, choice and other sales advantages. We seek to develop long-term relationships by understanding the unique needs of their clients, who are also our policyholders.
We also are responsive to agent needs for
well designedwell-designed property casualty products. Our commercial lines products are structured to allow flexible combinations of property and liability coverages in a single package with a single expiration date and several payment options. This approach brings policyholders convenience, discounts and a reduced risk of coverage gaps or disputes. At the same time, it increases account retention and saves time and expense for the agency and our company.
We employ technology solutions and business process improvements that:
| · | allow our field and headquarters associates to collaborate with each other and with agencies more efficiently |
| · | provide our agencies the ability to access our systems and data from their agency management systems to process business transactions from their offices |
| · | allow policyholders to directly access, from their systems and mobile devices, pertinent policy information online in order to further improve efficiency for our agencies |
| · | automate our internal processes so our associates can spend more time serving agents and policyholders |
| · | reduce duplicated effort or friction points in technology processes, introducing more efficiency that reduces company and agency costs |
allow our field and headquarters associates to collaborate with each other and with agencies more efficiently
provide our agencies the ability to access our systems and data from their agency management systems to process business transactions from their offices
allow policyholders to directly access, from their systems and mobile devices, pertinent policy information online in order to further improve efficiency for our agencies
automate our internal processes so our associates can spend more time serving agents and policyholders
reduce duplicated effort or friction points in technology processes, introducing more efficiency that reduces company and agency costs
Cincinnati Financial Corporation - 2014 10-K - Page 10
Agencies access our systems and other electronic services via their agency management systems or CinciLink®, our secure agency-only website. CinciLink provides an array of web-basedWeb-based services and content that makes doing business with us easier, such as commercial and personal lines rating and processing systems, policy loss information, educational courses about our products and services, accounting services, and electronic libraries for property and casualty coverage forms, state rating manuals and marketing materials. Our claims philosophy reflects our belief that we prosper as a company by responding to claims person to person, paying covered claims promptly, preventing false claims from unfairly adding to overall premiums and building financial strength to meet future obligations.
Our
770807 locally based field claims associates work from their homes, assigned to specific agencies. They respond personally to policyholders and claimants, typically within 24 hours of receiving an agency’s claim report. We believe we have a competitive advantage because of the person-to-person approach and the resulting high level of service that our field claims representatives provide. We also help our agencies provide prompt service to policyholders by giving
most agencies authority to immediately pay most first-party claims under standard market policies up to $2,500. We believe this same local approach to handling claims is a competitive advantage for our agents providing excess and surplus lines coverage in their communities. Handling of these claims includes guidance from headquarters-based excess and surplus lines claims managers.
Our property casualty claims operation uses
CMS, our claims management system
(CMS) to streamline processes and achieve operational efficiencies. CMS allows field and headquarters claims associates to collaborate on reported claims through a virtual claim file. Our field claims representatives use tablet computers to view and enter information into CMS from any location, including
an insured’sa policyholder’s home or
an agent’s office, and to print claim checks using portable printers. Agencies also can access selected CMS information such as activity notes on open claims.
Catastrophe response teams are comprised of volunteers from our experienced field claims staff
and we give themwho have the authority they need to do their jobs. In times of widespread loss, our field claims representatives confidently and quickly resolve claims, often writing checks on the same day they inspect the loss. CMS introduced
new efficiencies that are especially evident during catastrophes. Electronic claim files allow for fast initial contact with policyholders and easy sharing of information and data by rotating storm teams, headquarters
staff and local field claims representatives. When hurricanes or other weather events are predicted, we can identify through mapping technologies the expected number of our policyholders that may be impacted by the event and choose to have catastrophe response team members travel to strategic locations near the expected impact area. They are
then in position to quickly get to the affected area, set up temporary offices and start calling on policyholders.
Our claims associates work to control costs where appropriate. They use vendor resources that provide negotiated pricing to our
insuredspolicyholders and claimants. Our field claims representatives also are educated continuously on new techniques and repair
trends.trends for vehicles. They can leverage their local knowledge and experience with area body shops, which helps them negotiate the right price with any facility the policyholder chooses.
We staff a Special Investigations Unit (SIU) with former law enforcement and claims professionals whose qualifications make them well suited to gathering facts to uncover potential fraud. While we believe our job is to pay what is due under each policy contract, we also want to prevent false claims from unfairly increasing overall premiums. Our SIU also operates a computer forensics lab, using sophisticated software to recover data and mitigate the cost of computer-related claims for business interruption and loss of records.
We actively market property casualty insurance in 39 states through a select group of independent insurance agencies. For most agencies that represent us, we believe we offer insurance solutions for approximately 75 percent of the typical insurable risks of their clients. Our standard market commercial lines products and our excess and surplus lines are marketed in all 39 states while our standard market personal lines products are marketed in 31, offering31. We offer insurance coverage that includes business property and liability, automobile and homeowner as well as umbrella liability.
Cincinnati Financial Corporation - 2014 10-K - Page 11
The following table shows net written premiums by segment and business line at year-end 2014, 2013 and 2012:
|
| | | | | | | | | | | | | | | |
| (Dollars in millions) | | 2014 | | 2013 | | 2012 | | Percent of total 2014 |
| Segment: | | |
| | |
| | |
| | |
|
| Commercial lines insurance | | $ | 2,922 |
| | $ | 2,760 |
| | $ | 2,459 |
| | 66.5 | % |
| Personal lines insurance | | 1,068 |
| | 1,005 |
| | 918 |
| | 24.3 |
|
| Excess and surplus lines insurance | | 153 |
| | 128 |
| | 105 |
| | 3.5 |
|
| Life insurance | | 250 |
| | 241 |
| | 249 |
| | 5.7 |
|
| Total | | $ | 4,393 |
| | $ | 4,134 |
| | $ | 3,731 |
| | 100.0 | % |
| | | |
| | |
| | |
| | |
|
| Business line: | | |
| | |
| | |
| | |
|
| Commercial lines insurance | | | | | | | | |
| Commercial casualty | | $ | 969 |
| | $ | 897 |
| | $ | 793 |
| | 22.0 | % |
| Commercial property | | 776 |
| | 673 |
| | 573 |
| | 17.7 |
|
| Commercial auto | | 548 |
| | 507 |
| | 444 |
| | 12.5 |
|
| Workers' compensation | | 365 |
| | 374 |
| | 341 |
| | 8.3 |
|
| Other commercial | | 264 |
| | 309 |
| | 308 |
| | 6.0 |
|
| Total commercial lines insurance | | 2,922 |
| | 2,760 |
| | 2,459 |
| | 66.5 |
|
| | | | | | | | | |
| Personal lines insurance | | |
| | |
| | |
| | |
|
| Personal auto | | 489 |
| | 460 |
| | 425 |
| | 11.1 |
|
| Homeowner | | 456 |
| | 428 |
| | 378 |
| | 10.4 |
|
| Other personal | | 123 |
| | 117 |
| | 115 |
| | 2.8 |
|
| Total personal lines insurance | | 1,068 |
| | 1,005 |
| | 918 |
| | 24.3 |
|
| | | | | | | | | |
| Excess and surplus lines insurance | | 153 |
| | 128 |
| | 105 |
| | 3.5 |
|
| | | | | | | | | |
| Life insurance | | | | | | | | |
| Term life insurance | | 138 |
| | 129 |
| | 124 |
| | 3.2 |
|
| Universal life insurance | | 41 |
| | 41 |
| | 45 |
| | 0.9 |
|
| Other life insurance, annuity and disability income products | | 71 |
| | 71 |
| | 80 |
| | 1.6 |
|
| Subtotal | | 250 |
| | 241 |
| | 249 |
| | 5.7 |
|
| Total | | $ | 4,393 |
| | $ | 4,134 |
| | $ | 3,731 |
| | 100.0 | % |
| | | | | | | | | |
We discuss our commercial lines, personal lines and excess and surplus lines insurance operations and products in Commercial Lines
Property Casualty Insurance Segment,
Page 13, Personal Lines
Property Casualty Insurance Segment,
Page 15, and Excess and Surplus Lines
Property Casualty Insurance
Segment, Page 16.The Segment.
Cincinnati Specialty Underwriters
Insurance Company began excess and surplus lines insurance operations in January 2008. We structured this operation to exclusively serve the needs of the independent agencies that currently market our standard market insurance policies. When all or a portion of a current or potential client’s insurance program requires excess and surplus lines coverages, those agencies can write the whole account with Cincinnati, gaining benefits not often found in the broader excess and surplus lines market. Agencies have access to
The Cincinnati Specialty
Underwriters Insurance Company’sUnderwriters' product line through CSU Producer Resources, the wholly owned insurance brokerage subsidiary of
parent-company Cincinnati Financial Corporation.
We also support the independent agencies affiliated with our property casualty operations in their
programsefforts to sell life insurance. The life insurance, disability and fixed annuity products offered by our life insurance subsidiary round out and protect accounts and improve account persistency. At the same time, our life operation increases diversification of revenue and profitability sources for both the agency and our company.
Cincinnati Financial Corporation - 2014 10-K - Page 12
Our property casualty agencies make up the main distribution system for our life insurance products. To help build scale, we also develop life
insurance business from other independent life insurance agencies in geographic markets underserved through our property casualty agencies. We are careful to solicit business from these other agencies in a manner that does not compete with the life insurance marketing and sales efforts of our property casualty agencies. Our life insurance operation emphasizes up-to-date products, responsive underwriting, high-quality service and competitive pricing.
Other Services to Agencies
We complement
theour insurance operations by providing products and services that help attract and retain high-quality independent insurance agencies. When we appoint agencies, we look for organizations with knowledgeable, professional staffs. In turn, we make an exceptionally strong commitment to assist them in keeping their knowledge up to date and educating new people they bring on board as they grow. Numerous activities fulfill this commitment at our headquarters,
online and in regional and agency
locations and online.locations.
Except for travel-related expenses to classes held at our headquarters, most programs are offered at no cost to our agencies. While that approach may be extraordinary in our industry today, the result is quality service for our policyholders and increased success for our independent agencies.
In addition to broad education and training support, we make available noninsurance financial services. CFC Investment Company offers equipment and vehicle leases and loans for independent insurance agencies, their commercial clients and other businesses. We also provide commercial real estate loans or other financial assistance to help agencies operate, expand and perpetuate their businesses. We believe that providing these services enhances agency relationships with the company and their clients, increasing loyalty while diversifying the agency’s revenues.
We’re studying opportunities to begin developing our consumer brand.
Our goal is to
better support
our independent agents
as we servewith tools and resources that help communicate the value of a Cincinnati policy to their clients
who are our current and prospective
policyholders. As part of that study, we are runningclients. We’ll build on our 2013 and 2014 marketing efforts with a
small consumermodest national advertising campaign in
2013.2015. Our intent is to increase the visibility of our company, supporting our agents' efforts as they recommend Cincinnati Insurance policies. We also continue to build our social media presence, focusing on providing content that agents can share on their own sites.
Management has identified strategies that can position us for long-term success. The board of directors and management expect execution of our strategic plan to create significant value for shareholders over time. We broadly group these strategies into two areas of focus – improving insurance profitability and driving premium growth – correlating with important ways we measure our progress toward our long-term financialobjectives. A primary profitability long-term target is to produce a GAAP combined ratio over any five-year period that is consistently averages within the range of 95 percent to 100percent. A primary premium growth long-term target, established in late 2011, is to profitably grow to reach $5 billion of property casualty and life insurance annual direct written premiums by the end of 2015.
Effective capital management is an important part of creating shareholder value, serving as a foundation to support other strategies focused on profitable growth of our insurance business, with the overall objective of long-term benefit for shareholders. Our capital management philosophy is intended to preserve and build our capital while maintaining appropriate liquidity. A strong capital position provides the capacity to support premium growth, and liquidity provides for our investment in the people and infrastructure needed to implement our other strategic initiatives. Our strong capital and liquidity also provide financial flexibility for shareholder dividends or other capital management actions.
Our strategies seek to position us to compete successfully in the markets we have targeted while optimizing the balance of risk and returns. We believe successful implementation of key initiatives that support our strategies will help us better serve our agent customers, reduce volatility in our financial results and achieve our long-term objectives despite shorter-term effects of difficult economic, market or pricing cycles. We describe our expectations for the results of these initiatives in Item 7, Executive Summary of Management’s Discussion and Analysis,Analysis.
Cincinnati Financial Corporation - 2014 10-K - Page
38.13
Improve Insurance Profitability
Implementation of the initiatives described below is intended to enhance underwriting expertise and knowledge for our property casualty business, improving our ability to manage our business while also providing greater efficiency. By improving our capabilities to determine individual insurance policy pricing with better alignment to risk attributes, we can increase our effectiveness in managing profit margins. By improving internal processes and further developing performance metrics, we can
further improvecontinue improving efficiency and effectiveness. These initiatives also support the ability of the agencies that represent us to grow profitably by allowing them to
more efficiently serve clients
faster and
more efficiently manage expenses. Important initiatives for
20132015 to improve insurance profitability include:
| · | Enhance underwriting expertise and knowledge – We continue to increase our use of information and develop our skills for better underwriting performance, focusing on areas that will benefit most from additional effort. We also continue to expand our pricing and segmentation capabilities by using predictive analytics, expecting cumulative benefits of these efforts to improve loss ratios over time. Expanded capabilities include streamlining and optimizing data to increase our use of information and develop our skills for improved underwriting performance, focusing on areas that will benefit most from additional effort. We also continue to expand our pricing capabilities by using predictive analytics, expecting cumulative benefits of these efforts to improve loss ratios over time. Expanded capabilities include streamlining and optimizing data to improve accuracy, timeliness and ease of use. Development and use of additional business data to support more accurate underwriting, more granular pricing and other business decision-making also continues through a multi-year, phased project. Project deliverables include enhancing our data management program in phases, including further developing our data warehouse used in our property casualty and life insurance operations. |
Initiatives enhancing our ability to more profitably underwrite property coveragesdata management program in phases, including further developing the data warehouse used in our insurance operations, helping us achieve our strategic objectives.
Initiatives for
various lines of business are an area of emphasis for 2013. A multi-department, multi-disciplinary taskforce has been reviewing our property book2015 include expanding pricing precision by line of business and
continues to seek ways to improve profitability, similar to the approach we used to improve workers’ compensation results. Several profit improvement initiatives have been completed, such as filing with regulators certain modified deductible features of policy forms and revised underwriting guidelines. These features will be applied over time to existing policies as they renew. Other initiatives still in progress should also improve property-related underwriting results over time. Some of the more important commercial lines initiatives include increased specialization among selected claims and loss control associates, who bring enhanced expertise for property risks; increased commercial property inspections that give us enhanced underwriting knowledge for both new and renewal business; wind and hail deductibles in areas prone to convective storm losses; and use of new guidelines for underwriting hail risk. Some of the more important personal lines initiatives include increased use of higher loss deductibles and actual cash value claims settlement for insured damage to older roofs, and increased property inspections when homeowner policies renew, thereby providing more opportunities for underwritingby state or
pricing actions on a case-by-case basis.Initiatives for 2013 also include improving or expanding pricing precisionterritory with ongoing enhancement of analytics and predictive modeling tools. These tools better align individual insurance policy pricing to risk attributes, helping us to further segment policies. Our segmentation efforts emphasize identification and retention of policies we believe have relatively stronger pricing, while seeking more aggressive renewal terms and conditions on policies we believe have relatively weaker pricing. We continue to further integrate such tools with policy administration systems to help our underwriting associates better target profitability and discuss pricing impacts with agency personnel. Use of enhanced
For commercial autos we insure, pricing precision
toolsis an ongoing focus through actions such as improving premium rate classification and
techniques withusing other rating variables in risk selection and pricing, plus further automating collection of key rating variables. For our
existing policies as they renew should improve loss ratios over time, allowing us to ensure we are competitive on the most desirable business and able to adapt more rapidly to changes in marketconditions. We began using the second generation of our workers’ compensation predictive modeling tool in the second half of 2012. Since late 2011, we have used pricing precision tools for our commercialpersonal auto line of business, and alsoour rate changes for general liability and commercial property coverages in commercial package accounts. Similar tools for small business policies written through our CinciPakTM product began being used in several states in 2012 andeach respective state will be implemented for many more states in 2013. We also continue to enhance our model attributes used for personal auto and homeowner policies, expanding ourapply pricing points to add more precision to models used in past years. Wefeatures.
During 2015, we plan to introduce,
in select states, predictive modeling for dwelling fire
policiespolicies. In late 2014, we introduced a by-peril rating plan for homeowners in
2013. In addition, we are workingselect states, and plan to
expand it to other states in 2015. By-peril rating helps improve pricing precision
by separately pricing for
homeowner policies in select states over time through by-peril rating that allows for pricing in line with the
unique combination and magnituderisk of
hazards affecting a particular insured risk. | · | Improve internal processes – Improved processes support our strategic goals, reducing internal costs and allowing us to focus more resources on providing agency services. Important process improvement efforts include additional streamlining of policy processing between company and agency management systems, such as reduction of data entry by leveraging existing internal and external data. This allows for processing of some personal lines or small commercial lines business without intervention by an underwriter, for risks that meet qualifying underwriting criteria, and routing of complex work items to the most appropriate associate for optimal service. In 2013, we plan to expand this form of streamlined processing to personal lines policy renewal transactions, following successful 2012 implementation for new business policies. For small commercial lines policies that meet qualifying underwriting criteria, we plan to expand streamlined processing of renewal transactions to most states by the end of 2013, building on a pilot program implemented for a limited number of states and policy coverages. We also plan to add workers’ compensation policy processing to our e-CLAS® CPP commercial lines policy administration system. |
We measure the overall successlosses from distinct perils, such as wind versus fire.
As part of our strategyongoing effort to improve insurance profitability primarily throughmore profitably underwrite property coverages, we'll continue a robust level of inspections of insured property or other loss control activities that provide enhanced underwriting knowledge. We'll also continue to refine our GAAP combined ratio for property casualty results, which we believe can be consistently within the rangeuse of 95 percentdeductibles or other policy terms and conditions.
Improve internal processes – Improved processes support our strategic goals, helping to
100 percent for any five-year period. Wedeploy improved products and pricing more quickly. They also
compare our statutory combined ratiohelp reduce internal costs and allow us to
the industry average to gauge our progress.In addition, we expect these initiatives to contribute to our rank as the No. 1 or No. 2 carrier basedfocus more resources on premium volume in agencies that have represented us for at least five years. In 2011, we again earned that rank in nearly 75 percent of the agencies that have represented Cincinnati Insurance for more than five years, based on 2011 premiums. We are working to increase the percentage of agencies where we achieve that rank.
Drive Premium Growth
Implementation of the operational initiatives below is intended to further penetrate each market we serve through our independent agency network. We expect strategies aimed at specific market opportunities, along with service enhancements, to help our agents grow andservices. Improved workflow tools should increase our share of their business. Our strategy includes new initiativesefficiency, providing additional operational reporting metrics and execution of prior year growth initiatives, including use of profitability and growth models or plans at an agency levelmaking it easier for agencies to facilitate coordination and decision-making. In additiondo business with us.
During 2015, we'll continue to
estimating planned premium growth from existing agencies, these plans help project the number of additional agencies needed to achieve premium targets. Our focus remains on the key components of agent satisfaction based on factors agents tell us are most important. Significant 2013 initiatives to drive premium growth include: | · | Expansion oframp up operations for our marketing and service capabilities – We continue to enhance our generalist approach to allow our appointed agencies to better compete in the marketplace by providing services an agent’s clients want and need. During 2013, we continue to develop and coordinate targeted marketing, including cross-selling opportunities, through our Target Markets department. This area focuses on commercial product development, including identification of and promotional support for promising classes of business. We offered 13 target markets programs to our agencies at the end of 2012, and we plan to launch additional programs during 2013, in addition to expanding product offerings within various programs. |
We will pilot additional services in 2013 to select agencies that opt to use a customer care center we are developing for small commercial business policies.policies, also making things easier for agents. Our customer care center was piloted and implemented for a small number of select agencies during 2014, and by expanding that we expect nearly 10 percent of our agencies to be taking advantage of it by the end of 2015. Our services will include various policy administration functions routinely provided by agencies, allowing agency personnel to focus more on marketing efforts and on providing additional service to their clients as needed. We'll continue to seek other ways to improve policyholder satisfaction through identification and deployment of user-friendly services.
We measure the overall success of our strategy to improve insurance profitability primarily through our GAAP combined ratio for property casualty results, which we believe can consistently average within the range of 95 percent to 100percent for any five-yearperiod. We also compare our statutory combined ratio to the industry average to gauge our progress.
We expect these initiatives to contribute to our position as the No. 1 or No. 2 carrier based on premium volume in agencies that have represented us for at least five years. We again hit that mark in nearly 75percent of such agencies based on 2013 premiums. We are working to increase thepercentage of agencies where we achieve that rank.
Cincinnati Financial Corporation - 2014 10-K - Page 14
Drive Premium Growth
Implementation of the operational initiatives below is intended to further penetrate each market we serve through our independent agencies. We expect strategies aimed at specific market opportunities, along with service enhancements, to encourage our agents to grow and to increase our share of their business. Our strategy includes evaluating general business statistics, historical profitability trends and historical catastrophe trends to estimate premium growth from existing agencies and to make careful projections about the number of additional agencies needed to achieve premium targets. Our focus remains on the key components of agent satisfaction based on factors that agents tell us are most important. Significant 2015 initiatives to drive premium growth include:
Expansion of our marketing and service capabilities – We continue to enhance our generalist approach to allow our appointed agencies to better compete in the marketplace by providing services an agent’s clients want and need. During 2015, we willcontinue to develop and coordinate targeted marketing, including cross-selling opportunities. That includes working to further develop and market programs through our Target Markets department, which offered 17 programs at the end of 2014. We continue to migrate these programs to our enhanced policy administration platform and will make improvements to our programs during this migration. An early 2015 initiative aims to provide a platform for our agents to target group business such as professional and trade associations and franchises. We are also working with risk purchasing groups to provide liability coverages for homogeneous classes of business.
As part of our long-term plans, we expect to significantly expand marketing and enhance our products and services to independent agents serving high net worth personal lines clients. We expect that expansion will include, over the next five years, these states that were not part of our personal lines marketing area at the end of 2014: California, Massachusetts, New Jersey and Texas. Our Executive Classic™ homeowner product offers flexibility and broad coverages. We can also include coverages for automobiles, personal umbrella liability, watercraft and valuable articles sought by these clients. At year-end 2014, our appointed agencies produced for us more than $100 million in annual premiums from high net worth policyholders and we plan to continue to enhance our product line to remain competitive. In the second half of 2015, we plan to offer through agents in the state of New York a new suite of insurance products serving the unique needs of high net worth personal lines clients. Executive Capstone™ will offer higher coverage limits and new options for home, automobile, personal umbrella, watercraft and valuable article products. These improvements will be rolled out to all states over the next several years. While we don't expect expanded high net worth products and services to significantly contribute to growth for our personal lines insurance segment until 2016 and subsequent years, further development of our products and services should position us to be the carrier of choice for this portion of our agent’s accounts.
We will also continue to add field marketing representatives where needed for additional agency support in targeted areas, including some specializing in personal lines or excess and surplus lines. Associates in our life insurance segment plan to increase opportunities for agencies to cross-sell to their clients by providing updated products and services that aim to meet their life insurance needs.
New agency appointments – We continue to appoint new agencies to develop additional service, including realigned territories for field associatespoints of distribution, focusing on areas where our property casualty insurance market share is less than 1percent while also considering economic and catastrophe risk factors. In 2015, we are planning approximately 100appointments of independent agencies that write in aggregate $1 billion or more product education. | · | New agency appointments – We continue to appoint new agencies to develop additional points of distribution, focusing on markets where our market share is less than 1 percent while also considering economic and catastrophe risk factors. In 2013, we are targeting approximately 65 appointments of independent agencies that write in aggregate $750 million or more in property casualty business annually with various insurance carriers. While this target is lower than in recent years, we believe it is appropriate based on our long-term premium volume objective while also considering the geographic marketing reach assessment and the multi-year nature of premium growth from past agency appointments, as noted below. We are also targeting approximately 75 appointments of additional independent agencies to offer only our life insurance products and service, in addition to ones among the 65 noted above that also want to represent us for life insurance. |
in property casualty business annually
with various insurance carriers. We generally appoint those agencies in order to have them represent us to sell life insurance, as well as our property casualty insurance, to their clients. We plan to appoint approximately 50 additional independent life agencies to offer only our life insurance products and service. Our excess and surplus lines marketing will focus on selected areas and work to increase penetration with recently appointed agencies. We seek to build a close, long-term relationship with each agency we appoint. The contribution of new agencies to our property casualty premium growth should occur over several years, as time is required to fully realize the benefits of our agency relationships. We generally earn a 10percent share of an agency’sagency’s business within 10 years of its appointment. We also help our agents grow their business by attracting more clients in their communities through unique Cincinnati-style service. We carefully evaluate the marketing reach of each new appointment to ensure the territory can support both current and new agencies. In counting new agency appointments, we include appointment of new agency relationships with property casualty insurance group subsidiaries of The Cincinnati Insurance Companies.Company. For those that we believe will produce a meaningful amount of newbusiness premiums, we also count appointments of agencies that merge with aan existing Cincinnati agency and new branch offices opened by existingcurrent Cincinnati agencies. Wemade 140, 13399, 96 and 93 140new appointments in 2012, 20112014, 2013 and 2010,2012, respectively, with 109, 93 63,59and 70 109representing new relationships.
Cincinnati Financial Corporation - 2014 10-K - Page 15
We measure the overall success of our strategy to drive premium growth primarily through changes in net written premiums. Other important indicators that we are successfully executing initiatives to drive premium growth include tracking our progress toward our year-end 2015 direct written premiums target. We believe we can grow premiums faster than the industry average over any five-year period, while also achieving our long-term objective for underwriting profitability.
Consolidated financial results primarily reflect the results of our five reporting segments. These segments are defined based on financial information we use to evaluate performance and to determine the allocation of assets.
| · | Commercial lines property casualty insurance |
| · | Personal lines property casualty insurance |
| · | Excess and surplus lines property casualty insurance |
Commercial lines insurance
Personal lines insurance
Excess and surplus lines insurance
Life insurance
Investments
We
also evaluate results for our consolidated property casualty operations, which is the total of our commercial lines, personal lines and excess and surplus lines
insurance results.
Revenues, income before income taxes and identifiable assets for each segment are shown in a table in Item 8, Note 18 of the Consolidated Financial
Statements, Page 137.Statements. Some of that information
also is discussed in this section of this report, where we explain the business operations of each segment. The financial performance of each segment is discussed in Item 7, Management’s Discussion and Analysis of Financial Condition and Results of
Operations, which begins on Page 38.Operations.
Commercial Lines
Property Casualty Insurance Segment
The
In 2014, the commercial lines
property casualty insurance segment contributed net earned premiums of
$2.383$2.856 billion,
torepresenting 57.8 percent of consolidated total
revenues, or 58.0 percent of that total, andrevenues. This segment reported profit before income taxes of
$181 million in 2012.$146 million. Commercial lines net earned premiums rose 8 percent in
20122014 and
211 percent in
2011, following a decline of 2 percent in 2010.2013.
Approximately 95 percent of our commercial lines premiums are written to provide accounts with coverages from more than one of our business lines. As a result, we believe that our commercial lines business is best measured and evaluated on a segment basis. However, we provide line of business data to summarize growth and profitability trends separately for our business lines. The
sevenfive commercial business lines are:
Commercial casualty – Provides coverage to businesses against third-party liability from accidents occurring on their premises or arising out of their operations, including liability coverage for injuries sustained from products sold as well as coverage for professional services, such as dentistry. Specialized casualty policies may include liability coverage for excess insurance and umbrella liability, including personal umbrella liability written as an endorsement to commercial umbrella coverages, and employment practices liability (EPLI), which protects businesses against claims by employees that their legal rights as employees of the company have been violated, and against other acts or failures to act under specified circumstances. The commercial casualty business line includes liability coverage written as part of commercial package policies.
Commercial property – Provides coverage for loss or damage to buildings, inventory and equipment caused by covered causes of loss such as fire, wind, hail, water, theft and vandalism, as well as business interruption resulting from a covered loss. Commercial property also includes crime insurance, which provides coverage for losses such as embezzlement or misappropriation of funds by an employee, among others; and inland marine insurance, which provides coverage for builder’s risk, cargo, electronic data processing equipment and a variety of mobile equipment, such as contractor’s equipment. Various property coverages can be written as stand-alone policies or can be added to a commercial package policy.
Commercial auto – Protects businesses against liability to others for both bodily injury and property damage, medical payments to insureds and occupants of their vehicles, physical damage to an insured’s own vehicle from collision and various other perils, and damages caused by uninsured motorists.
Workers’ compensation – Covers employers for specified benefits payable under state or federal law for workplace injuries to employees. We write workers’ compensation coverage in all of our active states except
Cincinnati Financial Corporation - 2014 10-K - Page 16
North Dakota, Ohio, Washington and Wyoming, where coverage is provided solely by the state instead of by private insurers.
Other commercial lines – This includes the variety of other types of insurance products we offer to businesses. The main coverages offered are summarized below.
| · |
| ◦ | Commercial casualtyManagement liability and surety (formerly surety and executive risk) – Provides coverage to businesses against third-party liability from accidents occurring on their premises or arising out of their operations, including liability coverage for injuries sustained from products sold as well as coverage for professional services, such as dentistry. Specialized casualty policies may include liability coverage for employment practices liability (EPLI), which protects businesses against claims by employees that their legal rights as employees ofThis includes the company have been violated, and against other acts or failures to act under specified circumstances; and excess insurance and umbrella liability, including personal umbrella liability written as an endorsement to commercial umbrella coverages. The commercial casualty business line includes liability coverage written on both a nondiscounted and discounted basis as part of commercial package policies.following: |
Director and officer (D&O) liability insurance, which covers liability for actual or alleged errors in judgment, breaches of duty or other wrongful acts related to activities of for-profit or nonprofit organizations. Our director and officer liability policy can optionally include EPLI coverage, trustee and fiduciary coverage and Internet liability services coverage. We market primarily to nonprofit organizations and they represent approximately half of the premium volume in force for our 2014 director and officer liability business. The for-profit portion includes approximately 250 bank or savings and loan financial institutions, with only 11 having assets of $1 million or more.
Contract and commercial surety bonds, which guarantee a payment or reimbursement for financial losses resulting from dishonesty, failure to perform and other acts.
Fidelity bonds, which cover losses that policyholders incur as a result of fraudulent acts by specified individuals or dishonest acts by employees.
| · | Commercial property – Provides coverage for loss or damage to buildings, inventory and equipment caused by covered causes of loss such as fire, wind, hail, water, theft and vandalism, as well as business interruption resulting from a covered loss. Commercial property also includes crime insurance, which provides coverage for losses such as embezzlement or misappropriation of funds by an employee, among others; and inland marine insurance, which provides coverage for builder’s risk, cargo, electronic data processing equipment and a variety of mobile equipment, such as contractor’s equipment. Various property coverages can be written as stand-alone policies or can be added to a package policy. The commercial property business line includes property coverage written on both a nondiscounted and discounted basis as part of commercial package policies. |
| · | Commercial auto – Protects businesses against liability to others for both bodily injury and property damage, medical payments to insureds and occupants of their vehicles, physical damage to an insured’s own vehicle from collision and various other perils, and damages caused by uninsured motorists. |
| · | Workers’ compensation – Protects employers against specified benefits payable under state or federal law for workplace injuries to employees. We write workers’ compensation coverage in all of our active states except North Dakota, Ohio, Washington and Wyoming, where coverage is provided solely by the state instead of by private insurers. |
| ·◦ | Specialty packages – Includes coverages for property, liability and business interruption tailored to meet the needs of specific industry classes such as artisan contractors, dentists, garage operators, financial institutions, metalworkers, printers, religious institutions or smaller main street businesses. Businessowners policies, which combine property, liability and business interruption coverages for small businesses, are included in specialty packages. |
| · | Surety and executive risk – This business line includes: |
| o | Contract and commercial surety bonds, which guarantee a payment or reimbursement for financial losses resulting from dishonesty, failure to perform and other acts. |
| o | Fidelity bonds, which cover losses that policyholders incur as a result of fraudulent acts by specified individuals or dishonest acts by employees. |
| o | Director and officer (D&O) liability insurance, which covers liability for actual or alleged errors in judgment, breaches of duty or other wrongful acts related to activities of for-profit or nonprofit organizations. Approximately 81 percent of our D&O policies and 50 percent of the premium volume in force for 2012 were for nonprofit entities. Our director and officer liability policy can optionally include EPLI coverage. |
| ·◦ | Machinery and equipment – Specialized coverage provides protection for loss or damage to boilers and machinery, including production and computer equipment and business interruption, due to sudden and accidental mechanical breakdown, steam explosion or artificially generated electrical current. |
Our emphasis is on products that agents can market to small to midsized businesses in their communities. Of our
1,7581,884 reporting agency locations,
1520 market only our
suretymanagement liability and
executive risksurety products and
2633 market only our personal lines products. The remaining
1,7171,831 locations, located in all states in which we actively market, offer some or all of our standard market commercial insurance products.
In
2012,2014, our 10 highest volume commercial lines states generated
62.360.1 percent of our earned premiums compared with
63.361.1 percent in
20112013 and
64.362.3 percent in
20102012 as we continued efforts to geographically diversify our property casualty risks. Earned premiums in the 10 highest volume states increased 7 percent in
20122014 and increased
1211 percent in the remaining 29 states. The
aggregate number of reporting agency locations in our 10 highest volume states increased to
1,0351,086 in
20122014 from
9851,064 in
2011.Commercial Lines Earned Premiums by State
| (Dollars in millions) | | Earned
premiums | | | % of
total
earned | | | Agency
locations | | | Average
premium per
location | |
| Year ended December 31, 2012 | | | | | | | | | | | | | | | | |
| Ohio | | $ | 364 | | | | 15.3 | % | | | 234 | | | $ | 1.6 | |
| Illinois | | | 195 | | | | 8.2 | | | | 127 | | | | 1.5 | |
| Pennsylvania | | | 172 | | | | 7.2 | | | | 91 | | | | 1.9 | |
| Indiana | | | 148 | | | | 6.2 | | | | 108 | | | | 1.4 | |
| North Carolina | | | 123 | | | | 5.2 | | | | 88 | | | | 1.4 | |
| Michigan | | | 107 | | | | 4.5 | | | | 131 | | | | 0.8 | |
| Virginia | | | 103 | | | | 4.3 | | | | 65 | | | | 1.6 | |
| Georgia | | | 92 | | | | 3.9 | | | | 83 | | | | 1.1 | |
| Wisconsin | | | 91 | | | | 3.8 | | | | 53 | | | | 1.7 | |
| Tennessee | | | 88 | | | | 3.7 | | | | 55 | | | | 1.6 | |
| Year ended December 31, 2011 | | | | | | | | | | | | | | | | |
| Ohio | | $ | 341 | | | | 15.5 | % | | | 232 | | | $ | 1.5 | |
| Illinois | | | 189 | | | | 8.6 | | | | 123 | | | | 1.5 | |
| Pennsylvania | | | 163 | | | | 7.4 | | | | 85 | | | | 1.9 | |
| Indiana | | | 138 | | | | 6.3 | | | | 106 | | | | 1.3 | |
| North Carolina | | | 118 | | | | 5.4 | | | | 82 | | | | 1.4 | |
| Virginia | | | 101 | | | | 4.6 | | | | 66 | | | | 1.5 | |
| Michigan | | | 99 | | | | 4.5 | | | | 115 | | | | 0.9 | |
| Georgia | | | 83 | | | | 3.8 | | | | 75 | | | | 1.1 | |
| Wisconsin | | | 82 | | | | 3.7 | | | | 51 | | | | 1.6 | |
| Tennessee | | | 77 | | | | 3.5 | | | | 50 | | | | 1.5 | |
2013.
Our 10 highest premium volume commercial lines states are shown in the table below.
|
| | | | | | | | | | |
| (Dollars in millions) | Earned premiums | % of total earned | Agency locations | Average premium per location |
| Year ended December 31, 2014 | |
| |
| |
| |
|
| Ohio | $ | 413 |
| 14.5 | % | 243 |
| $ | 1.7 |
|
| Illinois | 209 |
| 7.3 |
| 136 |
| 1.5 |
|
| Pennsylvania | 191 |
| 6.7 |
| 99 |
| 1.9 |
|
| Indiana | 172 |
| 6.0 |
| 109 |
| 1.6 |
|
| North Carolina | 141 |
| 4.9 |
| 93 |
| 1.5 |
|
| Michigan | 133 |
| 4.7 |
| 134 |
| 1.0 |
|
| Georgia | 122 |
| 4.3 |
| 89 |
| 1.4 |
|
| Virginia | 118 |
| 4.1 |
| 64 |
| 1.8 |
|
| Tennessee | 111 |
| 3.9 |
| 59 |
| 1.9 |
|
| Wisconsin | 105 |
| 3.7 |
| 60 |
| 1.8 |
|
| | | | | |
Cincinnati Financial Corporation - 2014 10-K - Page 17
For new commercial lines business, case-by-case underwriting and pricing is coordinated by our locally based field marketing representatives. Our agents and our field marketing, claims, loss control, premium audit, bond and machinery and equipment representatives get to know the people and businesses in their communities and can make informed decisions about each risk.
These fieldField marketing representatives also are responsible for selecting new independent agencies, coordinating field teams of specialized company representatives and promoting all of the company’s products within the agencies they serve.
Commercial lines policy renewals are managed by headquarters underwriters who are assigned to specific agencies and consult with local field staff as needed. As part of our team approach, headquarters underwriters also help oversee agency growth and profitability. They are responsible for formal issuance of all new business and renewal policies as well as policy endorsements. Further, the headquarters underwriters provide day-to-day customer service to agencies and
our field marketing representatives by offering product training, answering underwriting questions, helping to determine underwriting eligibility and assisting with the mechanics of premium determination.
Our emphasis on small to midsized businesses is reflected in the mix of our commercial lines premium volume by policy size. Approximately
8580 percent of our commercial in-force policies have annual premiums of $10,000 or less, accounting in total for approximately
one-thirdone-quarter of our
20122014 commercial lines premium volume. The remainder of policies have annual premiums greater than $10,000, including in-force policies with annual premiums greater than $100,000 that account for
slightly less than 15approximately 17 percent of our
20122014 commercial lines premium volume.
Our commercial lines packages typically are offered on a three-year policy term for most insurance coverages
– a key competitive advantage. In our experience, multi-year packages appeal to the quality-conscious insurance buyers who we believe are typical clients of our independent agents. Customized insurance programs on a three-year term complement the long-term relationships these policyholders typically have with their agents and with the company. By reducing annual administrative efforts, multi-year policies lower expenses for our company and for our agents. The commitment we make to policyholders encourages long-term relationships and reduces their need to annually re-evaluate their insurance carrier or agency. We believe that the advantages of three-year policies in terms of improved policyholder convenience, increased account retention and reduced administrative costs outweigh the potential disadvantage of these policies, even in periods of rising rates.
Although we offer three-year policy terms, premiums for some coverages within those policies are adjustable at anniversary for the next annual period, and policies may be canceled at any time at the discretion of the policyholder. Contract terms often provide that rates for property, general liability, inland marine and crime coverages, as well as policy terms and conditions, are fixed for the term of the policy.
However, the exposure we insure is reviewed annually, near the policy anniversary date, and the amount of premiums may be adjusted based on changes to that exposure.
The general liability exposure basis may be audited annually. Commercial auto, workers’ compensation, professional liability and most umbrella liability coverages within multi-year packages are rated at each of the policy's annual anniversaries for the next one-year period. The annual pricing could incorporate rate changes approved by state insurance regulatory authorities between the date the policy was written and its annual anniversary date, as well as changes in risk exposures and premium credits or debits relating to loss experience and other underwriting judgment factors. We estimate that approximately 75 percent of
20122014 commercial premiums were subject to annual rating or were written on a one-year policy term.
We believe our commercial lines
insurance segment premiums reflect a higher concentration, relative to industry commercial lines premiums, in contractor-related businesses. Since economic activity related to construction, which can heavily influence insured exposures of contractors, may experience cycles that vary significantly with the economy as a whole, our commercial lines premium trends could vary from commercial lines premium trends for the property casualty insurance industry. In
2012,2014, we estimated that policyholders with a contractor-related Insurance Services Office (ISO) general liability code accounted for approximately
3436 percent of our general liability premiums, which are included in the commercial casualty line of business, and that policyholders with a contractor-related National Council on Compensation Insurance Inc. (NCCI) workers’ compensation code accounted for approximately
4750 percent of our workers’ compensation premiums.
Understanding evolving market conditions is a critical function for our success, accomplished in both an informal commentary and a formal manner. Informally, our field marketing representatives, underwriters and Target Markets department associates are routinely in receipt ofreceive market intelligence from a variety of channels, including from the agencies
Cincinnati Financial Corporation - 2014 10-K - Page 18
with which they
work, providing us with feedback. Our commercial lines product management group and field marketing representatives obtain competitive intelligence through various means.work. This market information helps identify the top competitors by line of business or specialty program and also identifies our market strengths and weaknesses. The information obtained encompasses pricing, breadth of coverage and underwriting/eligibility issues.
In addition to reviewing our competitive position, our product management group and our underwriting audit group review compliance with our underwriting standards as well as the pricing adequacy of our commercial insurance programs and coverages. Further, our Target Markets department analyzes opportunities and develops new products and services, new coverage options and improvements to existing insurance products.
We support our commercial lines operations with a variety of technology tools. At the end of 2014, e-CLAS CPP for commercial package and auto coverages now has rolled outwas available to all of our appointed agencies in 36 states.states, and in 14 states for workers' compensation that represent approximately 75 percent of our workers' compensation premium volume. It is being developed for additional coverages and remaining states that will be deployed over time. Since the initial deployment of e-CLAS in late 2009, approximately three-quarters of our non-workers’ compensation commercial lines policies in force at the end of 2012 have been processed through e-CLAS. In addition to increasing efficiency for our associates, the system allows our agencies options to quote and produce commercial package policies in paper or electronic format from their offices and to bill policies through their agencies or through us. These features increase their ease of doing business with us. The e-CLAS platform also makes use of our real-time agency interface, CinciBridge®, which allows the automated movement of key underwriting data from an agency’s management system to e-CLAS. This reduces agents’ data entry tasks and allows seamless quoting, rating and issuance capability. Personal Lines
Property Casualty Insurance Segment
The personal lines
property casualty insurance segment contributed net earned premiums of
$868 million$1.041 billion to consolidated total revenues, or 21.1 percent of the total, and reported
a lossprofit before income taxes of
$43$10 million in
2012.2014. Personal lines net earned premiums rose
148 percent in
2012, 62014 and 11 percent in
2011 and 5 percent in 2010.2013.
We prefer to write personal lines coverage in accounts that include both auto and homeowner coverages as well as coverages that are part of our other personal business line. At the end of
2012,2014, for example,
7681 percent of our homeowner policies were accompanied by a personal auto policy in the same account. As a result of our account-based approach, we believe that our personal lines business is best measured and evaluated on a segment basis. However, we provide line of business data to summarize growth and profitability trends separately for three business lines:
| · | Personal auto – Protects against liability to others for both bodily injury and property damage, medical payments to insureds and occupants of their vehicle, physical damage to an insured’s own vehicle from collision and various other perils, and damages caused by uninsured motorists. In addition, many states require policies to provide first-party personal injury protection, frequently referred to as no-fault coverage. |
| · | Homeowner – Protects against losses to dwellings and contents from a wide variety of perils, as well as liability arising out of personal activities both on and off the covered premises. We also offer coverage for condominium unit owners and renters. |
| · | Other personal lines – This includes the variety of other types of insurance products we offer to individuals such as dwelling fire, inland marine, personal umbrella liability and watercraft coverages. |
Personal auto – Protects against liability to others for both bodily injury and property damage, medical payments to insureds and occupants of their vehicle, physical damage to an insured’s own vehicle from collision and various other perils, and damages caused by uninsured motorists. In addition, many states require policies to provide first-party personal injury protection, frequently referred to as no-fault coverage.
Homeowner – Protects against losses to dwellings and contents from a wide variety of perils, as well as liability arising out of personal activities both on and off the covered premises. We also offer coverage for condominium unit owners and renters.
Other personal lines – This includes the variety of other types of insurance products we offer to individuals such as dwelling fire, inland marine, personal umbrella liability and watercraft coverages.
At year-end, we marketed personal lines insurance products through
1,3211,391 or approximately 75 percent of our
1,7581,884 reporting agency locations. The
1,3211,391 personal lines agency locations are in 31 of the 39 states in which we offer standard market commercial lines insurance.
Those agencies produced over 1.1 million personal lines policies in force for The Cincinnati Insurance companies, representing approximately 450,000 policyholders. We continue to evaluate opportunities to expand our marketing of personal lines to other states. Primary factors considered in the evaluation of a potential new state include
market opportunity or potential, weather-related catastrophe history and the legal climate.
As discussed in Strategic Initiatives, we are also expanding the marketing of our personal lines insurance segment through independent agencies to profitably grow our premiums for products and services to their high net worth personal lines clients. At year-end 2014, our appointed agencies produced for us more than $100 million in annual premiums of policyholders with insured home values of $1 million or more. We estimate those policyholders represent approximately 3 percent of our total personal lines policyholders. Our plans to further develop products and services for high net worth policyholders are discussed in Strategic Initiatives.
Cincinnati Financial Corporation - 2014 10-K - Page 19
In
2012,2014, our 10 highest volume personal lines states generated
80.679.1 percent of our earned premiums compared with
80.779.6 percent in
20112013 and
82.280.6 percent in
2010.2012. Earned premiums in the
sixfour highest volume states increased
104 percent in
20122014 while increasing
2213 percent in the remaining states, reflecting progress toward our long-term objective of geographic diversification through new states for our personal lines operation. The
aggregate number of reporting agency locations in our 10 highest volume states
increased 6 percent to 847at 875 in
2012 from 7982014 essentially matched the 874 in
2011.Personal Lines Earned Premiums by State
| (Dollars in millions) | | Earned
premiums | | | % of
total
earned | | | Agency
locations | | | Average
premium per
location | |
| Year ended December 31, 2012 | | | | | | | | | | | | | | | | |
| Ohio | | $ | 265 | | | | 30.6 | % | | | 208 | | | $ | 1.3 | |
| Georgia | | | 72 | | | | 8.2 | | | | 78 | | | | 0.9 | |
| Indiana | | | 71 | | | | 8.2 | | | | 88 | | | | 0.8 | |
| Illinois | | | 62 | | | | 7.2 | | | | 95 | | | | 0.7 | |
| Alabama | | | 49 | | | | 5.7 | | | | 43 | | | | 1.1 | |
| Kentucky | | | 47 | | | | 5.4 | | | | 37 | | | | 1.3 | |
| Michigan | | | 42 | | | | 4.8 | | | | 114 | | | | 0.4 | |
| North Carolina | | | 37 | | | | 4.3 | | | | 81 | | | | 0.5 | |
| Tennessee | | | 29 | | | | 3.4 | | | | 50 | | | | 0.6 | |
| Minnesota | | | 24 | | | | 2.8 | | | | 53 | | | | 0.5 | |
| Year ended December 31, 2011 | | | | | | | | | | | | | | | | |
| Ohio | | $ | 242 | | | | 31.7 | % | | | 207 | | | $ | 1.2 | |
| Georgia | | | 66 | | | | 8.6 | | | | 71 | | | | 0.9 | |
| Indiana | | | 64 | | | | 8.4 | | | | 85 | | | | 0.8 | |
| Illinois | | | 56 | | | | 7.4 | | | | 90 | | | | 0.6 | |
| Kentucky | | | 44 | | | | 5.7 | | | | 38 | | | | 1.2 | |
| Alabama | | | 42 | | | | 5.5 | | | | 41 | | | | 1.0 | |
| Michigan | | | 32 | | | | 4.2 | | | | 97 | | | | 0.3 | |
| North Carolina | | | 28 | | | | 3.7 | | | | 77 | | | | 0.4 | |
| Tennessee | | | 22 | | | | 2.8 | | | | 45 | | | | 0.5 | |
| Virginia | | | 20 | | | | 2.7 | | | | 47 | | | | 0.4 | |
2013.
Our 10 highest premium volume personal lines states are shown in the table below.
|
| | | | | | | | | | |
| (Dollars in millions) | Earned premiums | % of total earned | Agency locations | Average premium per location |
| Year ended December 31, 2014 | |
| |
| |
| |
|
| Ohio | $ | 288 |
| 27.6 | % | 219 |
| $ | 1.3 |
|
| Georgia | 84 |
| 8.1 |
| 84 |
| 1.0 |
|
| Indiana | 77 |
| 7.4 |
| 90 |
| 0.9 |
|
| Illinois | 69 |
| 6.6 |
| 97 |
| 0.7 |
|
| Michigan | 65 |
| 6.2 |
| 114 |
| 0.6 |
|
| Alabama | 56 |
| 5.4 |
| 44 |
| 1.3 |
|
| North Carolina | 55 |
| 5.3 |
| 82 |
| 0.7 |
|
| Kentucky | 52 |
| 5.0 |
| 38 |
| 1.4 |
|
| Tennessee | 41 |
| 3.9 |
| 53 |
| 0.8 |
|
| Minnesota | 37 |
| 3.6 |
| 54 |
| 0.7 |
|
| | | | | |
New and renewal personal lines business reflects our risk-specific underwriting philosophy. Each agency selects personal lines business primarily from within the geographic territory that it serves, based
in part on
the agent’sagency staff’s knowledge of the risks in those communities or familiarity with the policyholder. Personal lines activities are supported by headquarters associates assigned to individual agencies. At year-end
2012,2014, we had
11nine full-time personal lines field marketing representatives who have underwriting authority and visit agencies on a regular basis. They focus primarily on key states targeted for growth, reinforcing the advantages of our personal lines products and offering training in the use of our processing system.
All of our personal lines policies are written for a one-year term. Competitive advantages of our personal lines operation include broad coverage forms, flexible underwriting, superior claims service and endorsements allowing customization of coverage for both personal auto and homeowner policies. Our personal lines products are processed through Diamond, our
web-basedWeb-based, real-time personal lines policy processing system that supports streamlined processing. Diamond incorporates features frequently requested by our agencies such as
pre-fillingprefilling of selected data for improved efficiency, easy-to-use
screens,navigation, local and headquarters policy printing options, data transfer to and from popular agency management systems and real-time integration with third-party data such as insurance scores, motor vehicle reports and address verification.
Cincinnati Financial Corporation - 2014 10-K - Page 20
Excess and Surplus Lines
Property Casualty Insurance Segment
The excess and surplus lines
property casualty segment contributed net earned premiums of
$93$148 million to consolidated total revenues, or
2.33.0 percent of the total, and reported
a lossprofit before income taxes of
$1$30 million in
2012,2014, its
fifthseventh year of operation. Excess and surplus lines net earned premium increased
3328 percent in
2012, 432014 and 25 percent in
2011 and 81 percent in 2010.2013.
Our excess and surplus lines policies typically cover business risks with unique characteristics, such as the nature of the business or its claim history, that are difficult to profitably insure in the standard commercial lines market. Excess and surplus lines insurers have more flexibility in coverage terms and rates compared
with standard lines companies, generally resulting in policies with higher rates and terms and conditions customized for specific risks, including restricted coverage where appropriate. We target small to midsized risks, seeking to avoid those we consider exotic in nature. Our average excess and surplus lines policy size is approximately $5,000$6,000 in annual premiums, and policyholders in many cases also have standard market insurance with one of The Cincinnati Insurance Companies.our other subsidiaries. All of our excess and surplus lines policies are written for a maximum term of one year. Approximately 8587 percent of our 20122014 premium volume for the excess and surplus lines insurance segment provided commercial casualty coverages and about 1513 percent provided commercial property coverages. Those coverages are described below.
| · | Commercial casualty – Covers businesses for third-party liability from accidents occurring on their premises or arising out of their operations, including products and completed operations. The majority of these policies have coverage limits of $1 million or less. Miscellaneous errors and omissions and professional coverage for liability from actual or alleged errors in judgment, breaches of duty or other wrongful acts related to activities of insured businesses is also available, as is excess liability coverage that adds another layer of protection to the insured’s other liability insurance policies. Typical businesses covered include contractors, consultants, bars or taverns and manufacturers. Policies covering liability at special events are also available. |
| · | Commercial property – Insures loss or damage to buildings, inventory, equipment and business income from causes of loss such as fire, wind, hail, water, theft and vandalism. Examples of property we commonly insure with excess and surplus lines policies include temporarily vacant buildings, restaurants and relatively higher-hazard manufacturing classes. |
Commercial casualty – Covers businesses for third-party liability from accidents occurring on their premises or arising out of their operations, including products and completed operations. The majority of these policies have coverage limits of $1 million or less. Miscellaneous errors and omissions and professional coverage for liability from actual or alleged errors in judgment, breaches of duty or other wrongful acts related to activities of insured businesses is also available, as is excess liability coverage that adds another layer of protection to the insured’s other liability insurance policies. Typical businesses covered include contractors, manufacturers, real estate owners and managers, retail, consultants, and bars or taverns. Policies covering liability at special events are also available.
Commercial property – Insures buildings, inventory, equipment and business income from loss or damage due to causes such as fire, wind, hail, water, theft and vandalism. Examples of property we commonly insure with excess and surplus lines policies include temporarily vacant buildings, habitational, restaurants and relatively higher-hazard manufacturing classes.
At the end of
2012,2014, we marketed excess and surplus lines insurance products in each of the 39 states in which we offer standard market commercial lines insurance. Offering excess and surplus lines helps agencies representing The Cincinnati Insurance Companies meet the insurance needs of their clients when coverage is unavailable in the standard market. By providing outstanding service, we can help agencies grow and prosper while also profitably growing our property casualty business.
In
2012,2014, our 10 highest volume excess and surplus lines states generated
62.260.5 percent of our earned premiums compared with
62.861.9 percent in
20112013 and
65.162.2 percent in
2010.Excess2012.
Our 10 highest premium volume excess and
Surplus Lines Earned Premiums by State| (Dollars in millions) | | Earned
premiums | | | % of total
earned | |
| Year ended December 31, 2012 | | | | | | | | |
| Ohio | | $ | 11 | | | | 11.5 | % |
| Indiana | | | 9 | | | | 9.3 | |
| Texas | | | 7 | | | | 7.5 | |
| Georgia | | | 6 | | | | 6.8 | |
| Illinois | | | 6 | | | | 6.4 | |
| Missouri | | | 5 | | | | 4.9 | |
| Michigan | | | 4 | | | | 4.4 | |
| Alabama | | | 4 | | | | 4.1 | |
| Pennsylvania | | | 3 | | | | 3.7 | |
| Kentucky | | | 3 | | | | 3.6 | |
| Year ended December 31, 2011 | | | | | | | | |
| Ohio | | $ | 9 | | | | 12.4 | % |
| Indiana | | | 7 | | | | 9.7 | |
| Illinois | | | 5 | | | | 6.8 | |
| Georgia | | | 5 | | | | 6.6 | |
| Texas | | | 4 | | | | 6.3 | |
| Missouri | | | 4 | | | | 5.4 | |
| Pennsylvania | | | 3 | | | | 4.2 | |
| Michigan | | | 3 | | | | 4.0 | |
| Kentucky | | | 3 | | | | 3.7 | |
| North Carolina | | | 3 | | | | 3.7 | |
surplus lines states are shown in the table below.
|
| | | | | |
| (Dollars in millions) | Earned premiums | % of total earned |
| Year ended December 31, 2014 | |
| |
|
| Ohio | $ | 14 |
| 9.5 | % |
| Texas | 13 |
| 8.7 |
|
| Indiana | 11 |
| 7.5 |
|
| Illinois | 10 |
| 6.8 |
|
| Georgia | 10 |
| 6.6 |
|
| Alabama | 8 |
| 5.2 |
|
| Missouri | 7 |
| 4.6 |
|
| Michigan | 6 |
| 4.1 |
|
| North Carolina | 6 |
| 4.0 |
|
| Pennsylvania | 5 |
| 3.5 |
|
| | | |
Cincinnati Financial Corporation - 2014 10-K - Page 21
Agencies representing The Cincinnati Insurance Companies produce
over $2approximately $3 billion in annual premiums for all carriers writing excess and surplus lines policies for their clients. We estimate that approximately half of that premium volume matches the targeted business types and coverages we offer through our excess and surplus lines
insurance segment. We structured the operations of this segment to meet the needs of these agencies and to market exclusively through them.
Agencies have access to
The Cincinnati Specialty
Underwriters Insurance Company’sUnderwriters' product line through CSU Producer Resources, the wholly owned insurance brokerage subsidiary of
parent-company Cincinnati Financial Corporation. CSU Producer Resources has binding authority on all classes of business written through
The Cincinnati Specialty Underwriters
Insurance Company and maintains appropriate agent and surplus lines licenses to process nonadmitted business.
We seek to earn a share of each agency’s best excess and surplus lines accounts by offering several unique benefits. Agency producers have direct access through CSU Producer Resources to a group of our underwriters who focus exclusively on excess and surplus lines business. Those underwriters can tap into broader Cincinnati services to provide policyholders additional value and help agents build the relationship through experienced and responsive loss control
services and claims handling. CSU Producer Resources gives extra support to our independent agency producers by remitting surplus lines taxes and stamping fees and retaining admitted market diligent search affidavits, where required. Agencies marketing through CSU Producer Resources instead of a competing brokerage generally receive a higher commission because use of our internal brokerage subsidiary eliminates some of the intermediary costs. This business is
also factored in their profit-sharing agreement with The Cincinnati Insurance Companies.
We use a
web-basedWeb-based excess and surplus lines policy administration system to quote, bind, issue and deliver policies electronically to agents. This system provides integration to existing document management and data management systems, allowing for
real-timeexpedited processing of policies and billing. It provides a specimen policy detailing coverages when a policy is quoted and delivers electronic copies of policies to independent agency producers within minutes of underwriting approval and policy issue. In
2012,2014, more than 95 percent of policies were issued within 24 hours of a request to bind a policy.
The life insurance segment contributed
$178$198 million of net earned premiums, representing
4.34.0 percent of consolidated total revenues, and negative
$3$5 million of income before income taxes in
2012. Life insurance segment profitability is discussed in detail in Item 7, Life Insurance Results of Operations, Page 77.2014. Life insurance net earned premiums grew
85 percent in
2012, 42014 and 6 percent in
2011 and 10 percent in 2010.2013.
The Cincinnati Life Insurance Company supports our agency-centered business model. Cincinnati Life helps meet the needs of our agencies, including increasing and diversifying agency revenues. We primarily focus on life products that feature a steady stream of premium payments and that have the potential for generating revenue growth through increasing demand. By diversifying revenue and profitability for both the agency and our company, this strategy enhances the already strong relationship built by the combination of the property casualty and life companies.
Life Insurance Business Lines
Four lines of business – term life insurance, universal life insurance, worksite products and whole life insurance – account for
96.595.3 percent of the life insurance segment’s revenues:
| · | Term life insurance – policies under which a death benefit is payable only if the insured dies during a specific period of time. For policies without a return of premium provision, no benefit is payable if the insured person survives to the end of the term. For policies in force with a return of premium provision, a benefit equal to the sum of all paid base premiums is payable if the insured person survives to the end of the term. Premiums are fixed, and they must be paid as scheduled. The policies are fully underwritten. |
| · | Universal life insurance – long-duration life insurance policies. Contract premiums are neither fixed nor guaranteed; however, the contract does specify a minimum interest crediting rate and a maximum cost of insurance charge and expense charge. Premiums are not fixed and may be varied by the contract owner. The cash values, available as a loan collateralized by the cash surrender value, are not guaranteed and depend on the amount and timing of actual premium payments and the amount of actual contract assessments. The policies are fully underwritten. |
| · | Worksite products – term life insurance, return of premium term life insurance, whole life insurance, universal life and disability insurance offered to employees through their employer. Premiums are collected by the employer using payroll deduction. Policies are issued using a simplified underwriting approach and on a guaranteed issue basis. Worksite insurance products provide our property casualty agency force with excellent cross-serving opportunities for both commercial and personal accounts. Agents report that offering worksite marketing to employees of their commercial accounts provides a benefit to the employees at no cost to the employer. Worksite marketing also connects agents with new customers who may not have previously benefited from receiving the services of a professional independent insurance agent. |
| · | Whole life insurance – policies that provide life insurance for the entire lifetime of the insured. The death benefit is guaranteed never to decrease and premiums are guaranteed never to increase. While premiums are fixed, they must be paid as scheduled. These policies provide guaranteed cash values that are available as loans collateralized by the cash surrender value. The policies are fully underwritten. |
Term life insurance – Policies under which a death benefit is payable only if the insured dies during a specific period of time. For policies without a return of premium provision, no benefit is payable if the insured person survives to the end of the term. For policies in force with a return of premium provision, a benefit equal to the sum of all paid base premiums is payable if the insured person survives to the end of the term. Premiums are fixed, and they must be paid as scheduled. The policies are fully underwritten.
Universal life insurance – Long-duration life insurance policies. Contract premiums are neither fixed nor guaranteed; however, the contract does specify a minimum interest crediting rate and a maximum cost of insurance charge and expense charge. Premiums may be varied by the contract owner. The cash values, available as a loan collateralized by the cash surrender value, are not guaranteed and depend on the amount and timing of actual premium payments and the amount of actual contract assessments. The policies are fully underwritten.
Cincinnati Financial Corporation - 2014 10-K - Page 22
Worksite products – Term life insurance, return of premium term life insurance, whole life insurance, universal life and disability insurance offered to employees through their employer. Premiums are collected by the employer using payroll deduction. Policies are issued using a simplified underwriting approach and on a guaranteed issue basis. Worksite insurance products provide our property casualty agency force with excellent cross-serving opportunities for both commercial and personal accounts. Agents report that offering worksite marketing to employees of their commercial accounts provides a benefit to the employees at no cost to the employer. Worksite marketing also connects agents with new customers who may not have previously benefited from receiving the services of a professional independent insurance agent.
Whole life insurance – Policies that provide life insurance for the entire lifetime of the insured. The death benefit is guaranteed never to decrease and premiums are guaranteed never to increase. While premiums are fixed, they must be paid as scheduled. These policies provide guaranteed cash values that are available as loans collateralized by the cash surrender value. The policies are fully underwritten.
In addition, Cincinnati Life markets:
| · | Disability income insurance that provides monthly benefits to offset the loss of income when the insured person is unable to work due to accident or illness. |
| · | Deferred annuities that provide regular income payments that commence after the end of a specified period or when the annuitant attains a specified age. During the deferral period, any payments made under the contract accumulate at the crediting rate declared by the company but not less than a contract-specified guaranteed minimum interest rate. A deferred annuity may be surrendered during the deferral period for a cash value equal to the accumulated payments plus interest less the surrender charge, if any. |
| · | Immediate annuities that provide some combination of regular income and lump sum payments in exchange for a single premium. |
Disability income insurance that provides monthly benefits to offset the loss of income when the insured person is unable to work due to accident or illness.
Deferred annuities that provide regular income payments that commence after the end of a specified period or when the annuitant attains a specified age. During the deferral period, any payments made under the contract accumulate at the crediting rate declared by the company but not less than a contract-specified guaranteed minimum interest rate. A deferred annuity may be surrendered during the deferral period for a cash value equal to the accumulated payments plus interest less the surrender charge, if any.
Immediate annuities that provide some combination of regular income and lump-sum payments in exchange for a single premium.
Life Insurance Distribution
Our life insurance subsidiary is licensed in 49 states and the District of Columbia. At year-end
2012,2014, almost
8788 percent of our
1,7581,844 property casualty agency reporting locations offered Cincinnati Life products to their clients. We also develop life business from approximately
600620 other independent life insurance agencies. We are careful to solicit business from these other agencies in a manner that does not conflict with or compete with the marketing and sales efforts of our property casualty agencies.
When marketing through our property casualty agencies, we have specific competitive advantages:
| · | Because our property casualty operations are held in high regard, property casualty agency management is predisposed to consider selling our life products. |
| · | Marketing efforts for both our property casualty and life insurance businesses are directed by our field marketing department, which assures consistency of communication and operations. Life field marketing representatives are available to meet face-to-face with agency personnel and their clients as well. |
| · | Our life headquarters underwriters and other associates are available to the agents and field team to assist in the placement of business. Fewer and fewer of our competitors provide direct, personal support between the agent and the insurance carrier. |
Because our property casualty operations are held in high regard, property casualty agency management is predisposed to consider selling our life products.
Marketing efforts for both our property casualty and life insurance businesses are directed by our field marketing department, which assures consistency of communication and operations. Life field marketing representatives are available to meet face-to-face with agency personnel and their clients as well.
Our life headquarters underwriters and other associates are available to the agents and field team to assist in the placement of business. Fewer and fewer of our competitors provide direct, personal support between the agent and the insurance carrier.
Cincinnati Financial Corporation - 2014 10-K - Page 23
We continue to emphasize the cross-serving opportunities of our life insurance, including term and worksite products, for the property casualty agency’s personal and commercial accounts. In both the property casualty and independent life agency distribution systems, we enjoy the advantages of offering competitive, up-to-date products, providing close personal attention in combination with financial strength and stability.
| · | We primarily offer products addressing the needs of businesses with key person and buy-sell coverages. We offer quality, personal life insurance coverage to personal and commercial clients of our agencies. |
| · | Term life insurance is our largest life insurance product line. We continue to introduce new term products with features our agents indicate are important, such as a return of premium benefit. |
Term life insurance is our largest life insurance product line. We continue to introduce new term products with features our agents indicate are important, such as a return of premium benefit.
We also offer products addressing the needs of businesses with key person and buy-sell coverages. We offer quality, personal life insurance coverage to personal and commercial clients of our agencies.
Because of our strong capital position, we can offer a competitive product portfolio including guaranteed products, giving our agents a marketing edge. Our life insurance company maintains strong insurer financial strength ratings: A.M. Best, A (Excellent); Fitch, A+ (Strong); and Standard & Poor’s A (Strong); as discussed in Financial
Strength, Page 5.Strength. Our life insurance company has chosen not to establish a Moody’s rating.
In
2012 and 2011, the principal geographic distribution of2014, our five highest volume states for life insurance premiums, based on information contained in statements filed with state insurance departments,
isare reflected in the table below.
Life Insurance Premiums by State
| (Dollars in millions) | | Earned
premiums | | | % of total
earned | |
| Year ended December 31, 2012 | | | | | | | | |
| Ohio | | $ | 44 | | | | 18.4 | % |
| Pennsylvania | | | 18 | | | | 7.5 | |
| Indiana | | | 17 | | | | 7.1 | |
| Illinois | | | 16 | | | | 6.7 | |
| Michigan | | | 12 | | | | 5.0 | |
| Year ended December 31, 2011 | | | | | | | | |
| Ohio | | $ | 42 | | | | 18.9 | % |
| Pennsylvania | | | 17 | | | | 7.7 | |
| Indiana | | | 15 | | | | 6.8 | |
| Illinois | | | 16 | | | | 7.2 | |
| Michigan | | | 12 | | | | 5.4 | |
|
| | | | | |
| (Dollars in millions) |
Premiums | % of total earned |
| Year ended December 31, 2014 | |
| |
|
| Ohio | $ | 48 |
| 18.6 | % |
| Pennsylvania | 19 |
| 7.2 |
|
| Indiana | 17 |
| 6.5 |
|
| Illinois | 16 |
| 6.4 |
|
| Georgia | 13 |
| 5.1 |
|
| | | |
Cincinnati Financial Corporation - 2014 10-K - Page 24
Revenues of the investments segment are primarily from net investment income and from realized investment gains and losses from investment portfolios managed for the holding company and each of the operating subsidiaries.
Our investment department operates under guidelines set forth in our investment policy statement along with oversight of the investment committee of our board of directors. These guidelines set parameters for risk tolerances governing, among other items, the allocation of the portfolio as well as security and sector concentrations. These parameters are part of an integrated corporate risk management program.
The fair value of our investment portfolio was
$12.466$14.318 billion and
$11.735$13.496 billion at year-end
20122014 and
2011, respectively.2013, respectively, as shown in the table below. The overall portfolio remained in an unrealized gain position as equity
and fixed income markets experienced
strongsolid returns in
2012.2014, and the gain position for our fixed-maturity investments rose modestly due to a general decline in interest rates.
|
| | | | | | | | | | | | | | | | | | | | | | | |
| (Dollars in millions) | At December 31, 2014 | | At December 31, 2013 |
| | Cost or amortized cost | Percent of total | | | Percent of total | | Cost or amortized cost | Percent of total | | | Percent of total |
| | | Fair value | | | Fair value |
| Taxable fixed maturities | $ | 5,882 |
| 50.7 | % | | $ | 6,330 |
| 44.2 | % | | $ | 5,814 |
| 52.1 | % | | $ | 6,211 |
| 46.0 | % |
| Tax-exempt fixed maturities | 2,989 |
| 25.8 |
| | 3,130 |
| 21.9 | % | | 2,824 |
| 25.3 |
| | 2,910 |
| 21.6 |
|
| Common equity securities | 2,583 |
| 22.3 |
| | 4,679 |
| 32.7 | % | | 2,396 |
| 21.5 |
| | 4,213 |
| 31.2 |
|
Nonredeemable preferred equity securities | 145 |
| 1.2 |
| | 179 |
| 1.2 | % | | 127 |
| 1.1 |
| | 162 |
| 1.2 |
|
| Total | $ | 11,599 |
| 100.0 | % | | $ | 14,318 |
| 100.0 | % | | $ | 11,161 |
| 100.0 | % | | $ | 13,496 |
| 100.0 | % |
| | | | | | | | | | | | |
The cash we generate from insurance operations historically has been invested in two broad categories of investments:
| · | Fixed-maturity investments – Includes taxable and tax-exempt bonds and redeemable preferred stocks. During 2012 and 2011, purchases and market value gains more than offset sales and calls. |
| · | Equity investments – Includes common and nonredeemable preferred stocks. During 2012, purchases and fair value gains more than offset sales. During 2011, purchases and fair value gains partially offset sales. |
| (In millions) | | At December 31, 2012 | | | At December 31, 2011 | |
| | | Cost or | | | Percent | | | | | | Percent | | | Cost or | | | Percent | | | | | | Percent | |
| | | amortized cost | | | of total | | | Fair value | | | of total | | | amortized cost | | | of total | | | Fair value | | | of total | |
| Taxable fixed maturities | | $ | 5,473 | | | | 51.7 | % | | $ | 6,137 | | | | 49.2 | % | | $ | 5,369 | | | | 52.4 | % | | $ | 5,847 | | | | 49.8 | % |
| Tax-exempt fixed maturities | | | 2,749 | | | | 26.0 | | | | 2,956 | | | | 23.7 | | | | 2,715 | | | | 26.5 | | | | 2,932 | | | | 25.0 | |
| Common equities | | | 2,270 | | | | 21.4 | | | | 3,238 | | | | 26.0 | | | | 2,088 | | | | 20.4 | | | | 2,854 | | | | 24.3 | |
| Preferred equities | | | 99 | | | | 0.9 | | | | 135 | | | | 1.1 | | | | 74 | | | | 0.7 | | | | 102 | | | | 0.9 | |
| Total | | $ | 10,591 | | | | 100.0 | % | | $ | 12,466 | | | | 100.0 | % | | $ | 10,246 | | | | 100.0 | % | | $ | 11,735 | | | | 100.0 | % |
Fixed-maturity investments – Includes taxable and tax-exempt bonds and redeemable preferred stocks. During 2014, purchases and market value gains offset sales and calls. During 2013, purchases were largely offset by redemptions and fair value declines.
Equity investments – Includes common and nonredeemable preferred stocks. During both 2014 and 2013, purchases and fair value gains offset sales by relatively large amounts.
When allocating cash to various asset classes, we consider market-based factors such as risk adjusted after-tax yields as well as internal measures based
in part on
regulatoryinsurance department regulations and rating agency guidance. During
2012,2014, approximately
one-halfone-fifth of
new cash flow was investednet purchases were equity securities. We monitor a variety of metrics, including after-tax yields, the ratio of investments in
equity securities, exceeding our long-term historic average. This was our first year since 2007common stocks to statutory capital and surplus for the property casualty insurance operations, and the parent company’s ratio of
positive net investment
into common stocks. In 2011, we had net dispositions in all asset classes except investment grade corporate bonds. The primary driver of this was routine portfolio management as well as less new cash available for investment as a result of our unusual level of catastrophe activity.assets to total assets.
At year-end
2012,2014, less than 1 percent of the value of our investment portfolio was made up of securities that are classified as Level 3 assets and that require management’s judgment to develop pricing or valuation techniques. We generally obtain at least two outside valuations for these assets and generally use the more conservative estimate. These investments include private placements, small issues and various thinly traded securities. See Item 7,
Critical Accounting Estimates, Fair Value Measurements,
Page 48, and Item 8, Note 3 of the Consolidated Financial Statements,
Page 121, for additional discussion of our valuation techniques.
In addition to securities held in our investment portfolio, at year-end
2012,2014, other invested assets included
$37$31 million of life policy loans and
$31$37 million of
venture capital fundprivate equity investments.
Our investment portfolio is further described below. Additional information about the composition of investments is included in Item 8, Note 2 of the Consolidated Financial Statements. A detailed listing of our portfolio is updated on our website, cinfin.com/investors, each quarter when we report our quarterly financial results.
Cincinnati Financial Corporation - 2014 10-K - Page 25
Fixed-Maturity
Securities Investments
By maintaining a
well diversifiedwell-diversified fixed-maturity portfolio, we attempt to manage overall interest rate, reinvestment, credit and liquidity risk. We pursue a buy-and-hold strategy and do not attempt to make large-scale changes to the portfolio in anticipation of rate movements. By investing new money on a regular basis and analyzing risk-adjusted after-tax yields, we work to achieve a laddering effect to our portfolio that may mitigate some of the effects of adverse interest rate movements.
Fixed-Maturity Portfolio Ratings
At year-end
2012,2014, this portfolio’s fair value was
110.6106.6 percent of amortized cost, up from
last105.6 percent a year
ago as a result of
both a general decline in interest
rates and further credit spread tightening.rates.
The
portfolio grewportfolio's fair value rose in
2012 due2014 as an interest-rate driven increase in bond prices added to
a combination of market performance andnet purchases
that were most heavily concentrated in
the investment grade corporate sector. The majority of ourmunicipal bonds and commercial mortgage backed securities. Our nonrated securities
include smaller municipal issues and private placement corporate securities. Many of these, although not rated by Moody’s or Standard & Poor’s, are
tax-exempt municipal bonds fromrated by the NAIC’s Securities’ Valuation Office. Also included in this category are smaller
municipalities that chose not to pursuepublic corporate securities, many of which carry a
credit rating.rating by an agency other than Moody’s or S&P, such as Fitch or Kroll. Credit ratings at year-end
20122014 and
20112013 for the fixed-maturity portfolio were:
| (In millions) | | At December 31, 2012 | | | At December 31, 2011 | |
| | Fair
value | | | Percent
of total | | | Fair
value | | | Percent
of total | |
| Moody's Ratings and Standard & Poor's Ratings combined: | | | | | | | | | | | | | | | | |
| Aaa, Aa, A, AAA, AA, A | | $ | 5,544 | | | | 61.0 | % | | $ | 5,507 | | | | 62.7 | % |
| Baa, BBB | | | 3,180 | | | | 35.0 | | | | 2,842 | | | | 32.4 | |
| Ba, BB | | | 168 | | | | 1.8 | | | | 195 | | | | 2.2 | |
| B, B | | | 20 | | | | 0.2 | | | | 33 | | | | 0.4 | |
| Caa, CCC | | | 2 | | | | 0.0 | | | | 5 | | | | 0.1 | |
| Daa, Da, D | | | 1 | | | | 0.0 | | | | 2 | | | | 0.0 | |
| Non-rated | | | 178 | | | | 2.0 | | | | 195 | | | | 2.2 | |
| Total | | $ | 9,093 | | | | 100.0 | % | | $ | 8,779 | | | | 100.0 | % |
Our
|
| | | | | | | | | | | | | |
| (Dollars in millions) | At December 31, 2014 | | At December 31, 2013 |
| | Fair
value | | Percent
of total | | Fair
value | | Percent
of total |
| Combined ratings from Moody's and Standard & Poor's: | |
| | |
| | |
| | |
|
| Aaa, Aa, A, AAA, AA, A | $ | 5,686 |
| | 60.1 | % | | $ | 5,468 |
| | 59.9 | % |
| Baa, BBB | 3,198 |
| | 33.8 |
| | 3,197 |
| | 35.1 |
|
| Ba, BB | 305 |
| | 3.2 |
| | 231 |
| | 2.5 |
|
| B, B | 15 |
| | 0.2 |
| | 16 |
| | 0.2 |
|
| Caa, CCC | 3 |
| | 0.0 |
| | 4 |
| | 0.0 |
|
| Nonrated | 253 |
| | 2.7 |
| | 205 |
| | 2.3 |
|
| Total | $ | 9,460 |
| | 100.0 | % | | $ | 9,121 |
| | 100.0 | % |
| | | | | | | | |
Other selected attributes of the fixed-maturity portfolio as of December 31, 2012, included approximate maturing amounts with pretax average yields-to-book value as follows: 6.6 percent maturingare shown in 2013 with a 4.5 percent yield, 7.4 percent in 2014 with a 4.9 percent yield, and 8.8 percent in 2015 with a 4.5 percent yield.the table below. Additional maturity periods and other information for our fixed-maturity portfolio are shown in Item 8, Note 2 of the Consolidated Financial Statements,Statements.
|
| | | | | | |
| | At December 31, |
| | 2014 | | 2013 | |
| Weighted average yield-to-amortized cost | 4.76 |
| % | 4.86 |
| % |
| Weighted average maturity | 6.4 |
| yrs | 6.2 |
| yrs |
| Effective duration | 4.4 |
| yrs | 4.5 |
| yrs |
| | | | | |
Cincinnati Financial Corporation - 2014 10-K - Page
118. Attributes of the fixed-maturity portfolio include:| | | At December 31, | |
| | | 2012 | | | 2011 | |
| Weighted average yield-to-amortized cost | | | 5.0 | % | | | 5.3 | % |
| Weighted average maturity | | | 6.3 | yrs | | | 6.7 | yrs |
| Effective duration | | | 4.2 | yrs | | | 4.4 | yrs |
26
The fair values of our taxable fixed-maturity
securities portfolio
forat the end of the last two years were:
| (In millions) | | At December 31, | |
| | | 2012 | | | 2011 | |
| Investment-grade corporate | | $ | 5,388 | | | $ | 5,100 | |
| States, municipalities and political subdivisions | | | 334 | | | | 320 | |
| Below investment-grade corporate | | | 182 | | | | 198 | |
| Government sponsored enterprises | | | 164 | | | | 160 | |
| Convertibles and bonds with warrants attached | | | 31 | | | | 59 | |
| United States government | | | 7 | | | | 7 | |
| Foreign government | | | 3 | | | | 3 | |
| Commercial mortgage backed securities | | | 28 | | | | - | |
| Total | | $ | 6,137 | | | $ | 5,847 | |
|
| | | | | | | |
| (Dollars in millions) | At December 31, |
| | 2014 | | 2013 |
| Investment-grade corporate | $ | 5,208 |
| | $ | 5,293 |
|
| States, municipalities and political subdivisions | 313 |
| | 301 |
|
| Below investment-grade corporate | 318 |
| | 240 |
|
| Commercial mortgage backed | 259 |
| | 143 |
|
| Government sponsored enterprises | 208 |
| | 200 |
|
| Foreign government | 10 |
| | 10 |
|
| Convertibles and bonds with warrants attached | 7 |
| | 17 |
|
| United States government | 7 |
| | 7 |
|
| Total | $ | 6,330 |
| | $ | 6,211 |
|
| | | | |
While our strategy typically is to buy and hold fixed-maturity investments to maturity, we monitor credit profiles and fair value movements when determining holding periods for individual securities. With the exception of U.S. agency issues, no individual issuer's securities accounted for more than
1.11.0 percent of the taxable fixed-maturity portfolio at year-end
2012.2014. Investment grade corporate bonds had an average rating of Baa1 by Moody’s or BBB+ by Standard & Poor’s and represented
87.882.3 percent of the taxable fixed-maturity portfolio’s fair value at year end
2012,2014, compared with
87.285.2 percent in
2011.2013.
The investment-grade corporate bond portfolio is most heavily concentrated in the financial-related sectors, including banking, financial services and insurance. The financial sectors represented
31.236.9 percent of fair value of this portfolio at year-end
2012,2014, compared with
29.332.8 percent, at year-end
2011.2013. Although the financial-related sectors make up our largest group of investment-grade corporate bonds, we believe our concentration is below the average for the corporate bond market as a whole.
The real estate sector, including commercial mortgage back securities, accounted for 13.5 percent. No other sector exceeded 10 percent of our investment-grade corporate bond portfolio at year-end
2012.2014.
Most of the
$334$313 million of securities issued by states, municipalities and political subdivisions included in our taxable fixed-maturity portfolio at the end of
20122014 were Build America Bonds.
Cincinnati Financial Corporation - 2014 10-K - Page 27
Tax-Exempt Fixed Maturities
Our tax-exempt fixed-maturity
securities portfolio’s fair value was
$2.956$3.130 billion at December 31,
2012.2014. The portfolio is well diversified among
approximately 1,000more than 1,500 municipal bond
issuers.issues. No single municipal issuer accounted for more than 0.8 percent of the tax-exempt fixed-maturity portfolio at year-end
2012. Municipal2014. Our largest municipal bond holdings
were in
our larger states were:(In millions)
At December 31, 2012 | | State issued general
obligation bonds | | | Local issued general
obligation bonds | | | Special revenue
bonds | | | Total | | | Percent of
total | |
| Texas | | $ | - | | | $ | 398 | | | $ | 95 | | | $ | 493 | | | | 16.7 | % |
| Indiana | | | - | | | | 15 | | | | 286 | | | | 301 | | | | 10.2 | |
| Michigan | | | - | | | | 260 | | | | 12 | | | | 272 | | | | 9.2 | |
| Illinois | | | - | | | | 226 | | | | 20 | | | | 246 | | | | 8.3 | |
| Ohio | | | - | | | | 135 | | | | 96 | | | | 231 | | | | 7.8 | |
| Washington | | | 3 | | | | 174 | | | | 39 | | | | 216 | | | | 7.3 | |
| Wisconsin | | | 3 | | | | 106 | | | | 27 | | | | 136 | | | | 4.6 | |
| Pennsylvania | | | - | | | | 83 | | | | 8 | | | | 91 | | | | 3.1 | |
| Florida | | | - | | | | 21 | | | | 65 | | | | 86 | | | | 2.9 | |
| Arizona | | | - | | | | 55 | | | | 26 | | | | 81 | | | | 2.7 | |
| Colorado | | | - | | | | 45 | | | | 19 | | | | 64 | | | | 2.2 | |
| New Jersey | | | - | | | | 38 | | | | 17 | | | | 55 | | | | 1.9 | |
| New York | | | - | | | | 29 | | | | 24 | | | | 53 | | | | 1.8 | |
| Kansas | | | - | | | | 28 | | | | 21 | | | | 49 | | | | 1.7 | |
| Minnesota | | | - | | | | 36 | | | | 6 | | | | 42 | | | | 1.4 | |
| All other states | | | 2 | | | | 285 | | | | 253 | | | | 540 | | | | 18.2 | |
| Total | | $ | 8 | | | $ | 1,934 | | | $ | 1,014 | | | $ | 2,956 | | | | 100.0 | % |
| | | | | | | | | | | | | | | | | | | | | |
| At December 31, 2011 | | | | | | | | | | | | | | | |
| Texas | | $ | - | | | $ | 425 | | | $ | 99 | | | $ | 524 | | | | 17.9 | % |
| Indiana | | | - | | | | 16 | | | | 316 | | | | 332 | | | | 11.3 | |
| Michigan | | | - | | | | 257 | | | | 12 | | | | 269 | | | | 9.2 | |
| Illinois | | | - | | | | 226 | | | | 23 | | | | 249 | | | | 8.5 | |
| Ohio | | | - | | | | 132 | | | | 107 | | | | 239 | | | | 8.2 | |
| Washington | | | 3 | | | | 174 | | | | 39 | | | | 216 | | | | 7.4 | |
| Wisconsin | | | 2 | | | | 115 | | | | 25 | | | | 142 | | | | 4.8 | |
| Pennsylvania | | | - | | | | 76 | | | | 8 | | | | 84 | | | | 2.9 | |
| Florida | | | - | | | | 21 | | | | 61 | | | | 82 | | | | 2.8 | |
| Arizona | | | - | | | | 51 | | | | 27 | | | | 78 | | | | 2.7 | |
| Colorado | | | - | | | | 40 | | | | 15 | | | | 55 | | | | 1.9 | |
| Kansas | | | - | | | | 27 | | | | 20 | | | | 47 | | | | 1.6 | |
| New Jersey | | | - | | | | 30 | | | | 17 | | | | 47 | | | | 1.6 | |
| New York | | | - | | | | 18 | | | | 24 | | | | 42 | | | | 1.4 | |
| Utah | | | - | | | | 21 | | | | 19 | | | | 40 | | | | 1.4 | |
| All other states | | | 1 | | | | 264 | | | | 221 | | | | 486 | | | | 16.4 | |
| Total | | $ | 6 | | | $ | 1,893 | | | $ | 1,033 | | | $ | 2,932 | | | | 100.0 | % |
these states:
|
| | | | | | | | | | | | | | | | | | |
| (Dollars in millions) | Local issued general | | Special revenue | | State issued general | | Fair value | | Percent of |
| At December 31, 2014 | obligation bonds | | bonds | | obligation bonds | | total | | total |
| Texas | $ | 368 |
| | $ | 71 |
| | $ | — |
| | $ | 439 |
| | 14.0 | % |
| Indiana | 2 |
| | 244 |
| | — |
| | 246 |
| | 7.9 |
|
| Ohio | 120 |
| | 78 |
| | 9 |
| | 207 |
| | 6.6 |
|
| Michigan | 194 |
| | 8 |
| | — |
| | 202 |
| | 6.5 |
|
| Washington | 127 |
| | 30 |
| | 7 |
| | 164 |
| | 5.2 |
|
| Illinois | 146 |
| | 18 |
| | — |
| | 164 |
| | 5.2 |
|
| Arizona | 78 |
| | 47 |
| | — |
| | 125 |
| | 4.0 |
|
| Wisconsin | 87 |
| | 30 |
| | 2 |
| | 119 |
| | 3.8 |
|
| Pennsylvania | 83 |
| | 15 |
| | 10 |
| | 108 |
| | 3.5 |
|
| Florida | 26 |
| | 74 |
| | — |
| | 100 |
| | 3.2 |
|
| New York | 59 |
| | 36 |
| | 4 |
| | 99 |
| | 3.2 |
|
| New Jersey | 55 |
| | 15 |
| | 2 |
| | 72 |
| | 2.3 |
|
| Kansas | 51 |
| | 21 |
| | — |
| | 72 |
| | 2.3 |
|
| Colorado | 44 |
| | 25 |
| | — |
| | 69 |
| | 2.2 |
|
| California | 40 |
| | 19 |
| | 3 |
| | 62 |
| | 2.0 |
|
| All other states | 493 |
| | 337 |
| | 52 |
| | 882 |
| | 28.1 |
|
| Total | $ | 1,973 |
| | $ | 1,068 |
| | $ | 89 |
| | $ | 3,130 |
| | 100.0 | % |
| | | | | | | | | | |
| At December 31, 2013 | | | | | | | | | |
| Texas | $ | 385 |
| | $ | 66 |
| | $ | — |
| | $ | 451 |
| | 15.5 | % |
| Michigan | 238 |
| | 9 |
| | — |
| | 247 |
| | 8.5 |
|
| Indiana | 8 |
| | 232 |
| | — |
| | 240 |
| | 8.2 |
|
| Ohio | 119 |
| | 87 |
| | 6 |
| | 212 |
| | 7.3 |
|
| Illinois | 184 |
| | 19 |
| | — |
| | 203 |
| | 7.0 |
|
| Washington | 150 |
| | 32 |
| | 5 |
| | 187 |
| | 6.4 |
|
| Wisconsin | 108 |
| | 32 |
| | 2 |
| | 142 |
| | 4.9 |
|
| Pennsylvania | 93 |
| | 9 |
| | 9 |
| | 111 |
| | 3.8 |
|
| Arizona | 55 |
| | 31 |
| | — |
| | 86 |
| | 3.0 |
|
| Florida | 24 |
| | 62 |
| | — |
| | 86 |
| | 3.0 |
|
| New York | 48 |
| | 31 |
| | 4 |
| | 83 |
| | 2.9 |
|
| Colorado | 45 |
| | 17 |
| | — |
| | 62 |
| | 2.1 |
|
| New Jersey | 44 |
| | 17 |
| | — |
| | 61 |
| | 2.1 |
|
| Minnesota | 42 |
| | 7 |
| | 2 |
| | 51 |
| | 1.8 |
|
| Utah | 31 |
| | 19 |
| | — |
| | 50 |
| | 1.7 |
|
| All other states | 338 |
| | 270 |
| | 30 |
| | 638 |
| | 21.8 |
|
| Total | $ | 1,912 |
| | $ | 940 |
| | $ | 58 |
| | $ | 2,910 |
| | 100.0 | % |
| | | | | | | | | | |
At year-end
2012,2014, our tax-exempt fixed-maturity portfolio
with a fair value of $2.956 billion, had an average rating of Aa2/AA. Over
6843 percent or
$2.020$1.368 billion of the portfolio is insured, and approximately
9698 percent of the
insured portion carriedportfolio has an underlying rating of at least A3 or A- by Moody’s or Standard & Poor’s at year end. We strongly prefer general obligation or essential services bonds, which we believe provide a superior risk profile. The top three revenue resources of the
$1.014$1.068 billion in special revenue bonds owned at year-end
20122014 were
3733 percent from leasing,
2425 percent from water and sewer and
98 percent from higher education.
Cincinnati Financial Corporation - 2014 10-K - Page 28
Equity
Securities Investments
After covering both our intermediate and long-range insurance obligations with fixed-maturity investments, we historically
have used available cash flow to invest in equity securities. Investment in equity securities has played an important role in achieving our portfolio objectives and has contributed to portfolio appreciation. We remain committed to our long-term equity focus, which we believe is key to our company’s long-term growth and stability.
Our cash allocation for common stock purchases is implemented only after we ensure that our insurance reserves are adequately covered by our fixed-maturity investments. We believe our strategy of primarily investing in a diversified selection of
larger capitalization, high quality,larger-capitalization, high-quality, dividend-increasing companies generally results in reduced volatility relative to the broader equity markets.
At year-end
20122014 and
2011,2013, no holding had a fair value
equal to or greater than
53.3 percent of our publicly traded common stock portfolio.
PepsicoApple Inc.
(NYSE:PEP)(Nasdaq:AAPL) was our largest single common stock investment at year end
2014, comprising
4.23.3 percent of the publicly traded common stock portfolio and 1.1 percent of the entire investment portfolio.
At year-end
2012, 29.62014, 35.0 percent of our common stock holdings (measured by fair value) were held at the
parentparent- company level. The distribution of the portfolio among industry sectors is shown in the table below.
Common Stock Portfolio Industry Sector Distribution
| | | Percent of Publicly Traded Common Stock Portfolio | |
| | | At December 31, 2012 | | | At December 31, 2011 | |
| | | Cincinnati
Financial | | | S&P 500 Industry
Weightings | | | Cincinnati
Financial | | | S&P 500 Industry
Weightings | |
| Sector: | | | | | | | | | | | | | | | | |
| Information technology | | | 16.0 | % | | | 19.1 | % | | | 16.9 | % | | | 19.0 | % |
| Industrials | | | 12.9 | | | | 10.1 | | | | 11.8 | | | | 10.7 | |
| Healthcare | | | 12.2 | | | | 12.0 | | | | 12.0 | | | | 11.8 | |
| Energy | | | 12.0 | | | | 11.0 | | | | 14.0 | | | | 12.3 | |
| Consumer staples | | | 11.7 | | | | 10.6 | | | | 12.3 | | | | 11.5 | |
| Financial | | | 11.2 | | | | 15.6 | | | | 8.5 | | | | 13.4 | |
| Consumer discretionary | | | 9.7 | | | | 11.5 | | | | 9.4 | | | | 10.7 | |
| Materials | | | 5.7 | | | | 3.6 | | | | 5.7 | | | | 3.5 | |
| Utilities | | | 4.8 | | | | 3.4 | | | | 5.5 | | | | 3.9 | |
| Telecomm services | | | 3.8 | | | | 3.1 | | | | 3.9 | | | | 3.2 | |
| Total | | | 100.0 | % | | | 100.0 | % | | | 100.0 | % | | | 100.0 | % |
|
| | | | | | | | | | | |
| | Percent of publicly traded common stock portfolio |
| | At December 31, 2014 | | At December 31, 2013 |
| | Cincinnati
Financial | | S&P 500 Industry
Weightings | | Cincinnati
Financial | | S&P 500 Industry
Weightings |
| Sector: | |
| | |
| | |
| | |
|
| Information technology | 17.3 | % | | 19.8 | % | | 18.7 | % | | 18.6 | % |
| Industrials | 14.3 |
| | 10.3 |
| | 14.0 |
| | 10.9 |
|
| Financial | 13.8 |
| | 16.3 |
| | 12.0 |
| | 16.2 |
|
| Healthcare | 11.9 |
| | 14.7 |
| | 11.5 |
| | 13.0 |
|
| Energy | 10.5 |
| | 8.0 |
| | 10.5 |
| | 10.3 |
|
| Consumer staples | 10.5 |
| | 10.0 |
| | 10.5 |
| | 9.8 |
|
| Consumer discretionary | 10.2 |
| | 12.1 |
| | 9.8 |
| | 12.5 |
|
| Materials | 5.5 |
| | 3.2 |
| | 5.7 |
| | 3.5 |
|
| Utilities | 3.7 |
| | 3.3 |
| | 4.2 |
| | 2.9 |
|
| Telecomm services | 2.3 |
| | 2.3 |
| | 3.1 |
| | 2.3 |
|
| Total | 100.0 | % | | 100.0 | % | | 100.0 | % | | 100.0 | % |
| | | | | | | | |
Nonredeemable Preferred Stocks
We evaluate
nonredeemable preferred stocks in a manner similar to our evaluation of fixed-maturity investments, seeking attractive relative yields. We generally focus on investment-grade
nonredeemable preferred stocks issued by companies with strong histories of paying common dividends, providing us with another layer of protection. When possible, we seek out
nonredeemable preferred stocks that offer a dividend received deduction for income tax purposes. We purchased
$27$20 million and sold $2 million in this portfolio in
20122014. During 2013, we purchased $48 million and sold
$2$23 million.
We made no purchases or sales for this portfolio during 2011.Additional information about the composition of investments is included in Item 8, Note 2 of the Consolidated Financial Statements, Page 118. A detailed listing of our portfolio is updated on our website,www.cinfin.com/investors, each quarter when we report our quarterly financial results.
We report as Other the noninvestment operations of the parent company and its noninsurer subsidiary CFC Investment Company. This subsidiary offers commercial leasing and financing services to our agencies, their clients and other customers. At year-end
2012,2014, CFC Investment Company had
2,5622,141 accounts and $75 million in receivables, compared with
2,2172,516 accounts and
$76$85 million in receivables at year-end
2011.2013.
Cincinnati Financial Corporation - 2014 10-K - Page 29
The business of insurance primarily is regulated by state law. All of our insurance company subsidiaries are domiciled in the state of Ohio except The Cincinnati Specialty Underwriters Insurance Company, which is domiciled in Delaware. Each insurance subsidiary is governed by the insurance laws and regulations in its respective state of domicile. We also are subject to state regulatory authorities of all states in which we write insurance. The state laws and regulations that have the most significant effect on our insurance operations and financial reporting are discussed below.
| · | Insurance Holding Company Regulation – We are regulated as an insurance holding company system in the respective states of domicile of our primary standard market property casualty company subsidiary and its surplus lines and life insurance subsidiaries. These regulations require that we annually furnish financial and other information about the operations of the individual companies within the holding company system. All transactions within a holding company affecting insurers must be fair and equitable. Notice to the state insurance commissioner is required prior to the consummation of transactions affecting the ownership or control of an insurer and prior to certain material transactions between an insurer and any person or entity in its holding company group. In addition, some of those transactions cannot be consummated without the commissioner’s prior approval. Recent amendments to the Model Insurance Holding Company System Regulatory Act and Regulation, adopted by the National Association of Insurance Commissioners (NAIC), and passed by a number of state legislatures, requires insurance holding company systems to provide regulators with more information about the risks posed by any noninsurance company subsidiaries in the holding company system. |
| · | Subsidiary Dividends – The Cincinnati Insurance Company is 100 percent owned by Cincinnati Financial Corporation. The dividend-paying capacity of The Cincinnati Insurance Company and its 100 percent owned subsidiaries is regulated by the laws of the applicable state of domicile. Under these laws, our insurance subsidiaries must provide a 10-day advance informational notice to the insurance commissioner for the domiciliary state prior to payment of any dividend or distribution to its shareholders. Generally, the most our insurance subsidiary can pay without prior regulatory approval is the greater of 10 percent of policyholder surplus or 100 percent of statutory net income for the prior calendar year. |
Insurance Holding Company Regulation – We are regulated as an insurance holding company system in the respective states of domicile of our primary standard market property casualty company subsidiary and its surplus lines and life insurance subsidiaries. These regulations require that we annually furnish financial and other information about the operations of the individual companies within the holding company system. All transactions within a holding company affecting insurers must be fair and equitable. Notice to the state insurance commissioner is required prior to the consummation of transactions affecting the ownership or control of an insurer and prior to certain material transactions between an insurer and any person or entity in its holding company group. In addition, some of those transactions cannot be consummated without the commissioner’s prior approval. Recent amendments to the Model Insurance Holding Company System Regulatory Act and Regulation, adopted by the National Association of Insurance Commissioners (NAIC) and passed by a number of state legislatures, require insurance holding company systems to provide regulators with more information about the risks posed by any noninsurance company subsidiaries in the holding company system.
Subsidiary Dividends – The Cincinnati Insurance Company is 100 percent owned by Cincinnati Financial Corporation. The dividend-paying capacity of The Cincinnati Insurance Company and its 100 percent owned subsidiaries is regulated by the laws of the applicable state of domicile. Under these laws, our insurance subsidiaries must provide a 10-day advance informational notice to the insurance commissioner for the domiciliary state prior to payment of any dividend or distribution to its shareholders. Generally, the most our insurance subsidiary can pay without prior regulatory approval is the greater of 10 percent of statutory capital and surplus or 100 percent of statutory net income for the prior calendar year.
The insurance company subsidiaries must give 30 days’ notice to and obtain prior approval from the state insurance commissioner before the payment of an extraordinary dividend as defined by the state’s insurance code. You can find information about the dividends paid by our insurance subsidiary in 20122014 in Item 8, Note 9 of the Consolidated Financial Statements,Statements.
Insurance Operations – All of our insurance subsidiaries are subject to licensing and supervision by departments of insurance in the states in which they do business. The nature and extent of such regulations vary, but generally are rooted in statutes that delegate regulatory, supervisory and administrative powers to state insurance departments. Such regulations, supervision and administration of the insurance subsidiaries include, among others, the standards of solvency that must be met and maintained; the licensing of insurers and their agents and brokers; the nature and limitations on investments; deposits of securities for the benefit of policyholders; regulation of standard market policy forms and premium rates; policy cancellations and nonrenewals; periodic examination of the affairs of insurance companies; annual and other reports required to be filed on the financial condition of insurers or for other purposes; requirements regarding reserves for unearned premiums, losses and other matters; the nature of and limitations on dividends to policyholders and shareholders; the nature and extent of required participation in insurance guaranty funds; the involuntary assumption of hard-to-place or high-risk insurance business, primarily workers’ compensation insurance; and the collection, remittance and reporting of certain taxes and fees. Our primary insurance regulators have adopted the Model Audit Rule for annual statutory financial reporting. This regulation closely mirrors the Sarbanes-Oxley Act on matters such as auditor independence, corporate governance and internal controls over financial reporting. The regulation permits the audit committee of Cincinnati Financial Corporation’s board of directors to also serve as the audit committee of each of our insurance subsidiaries for purposes of this regulation.
Insurance Guaranty Associations – Each state has insurance guaranty association laws under which the associations may assess life and property casualty insurers doing business in the state for certain obligations of insolvent insurance companies to policyholders and claimants. Typically, states assess each member insurer in an amount related to the insurer’s proportionate share of business written by all member insurers in the state. Our insurance companies received a savings of less than $1 million from guaranty association refunds in both 2014 and 2013. We cannot predict the amount and timing of any future assessments or refunds on our insurance subsidiaries under these laws.
Shared Market and Joint Underwriting Plans – State insurance regulation requires insurers to participate in assigned risk plans, reinsurance facilities and joint underwriting associations, which are mechanisms that
Cincinnati Financial Corporation - 2014 10-K - Page
127 | · | Insurance Operations – All of our insurance subsidiaries are subject to licensing and supervision by departments of insurance in the states in which they do business. The nature and extent of such regulations vary, but generally are rooted in statutes that delegate regulatory, supervisory and administrative powers to state insurance departments. Such regulations, supervision and administration of the insurance subsidiaries include, among others, the standards of solvency that must be met and maintained; the licensing of insurers and their agents and brokers; the nature and limitations on investments; deposits of securities for the benefit of policyholders; regulation of standard market policy forms and premium rates; policy cancellations and nonrenewals; periodic examination of the affairs of insurance companies; annual and other reports required to be filed on the financial condition of insurers or for other purposes; requirements regarding reserves for unearned premiums, losses and other matters; the nature of and limitations on dividends to policyholders and shareholders; the nature and extent of required participation in insurance guaranty funds; the involuntary assumption of hard-to-place or high-risk insurance business, primarily workers’ compensation insurance; and the collection, remittance and reporting of certain taxes and fees. Our primary insurance regulators have adopted the Model Audit Rule for annual statutory financial reporting. This regulation closely mirrors the Sarbanes-Oxley Act on matters such as auditor independence, corporate governance and internal controls over financial reporting. The regulation permits the audit committee of Cincinnati Financial Corporation’s board of directors to also serve as the audit committee of each of our insurance subsidiaries for purposes of this regulation. |
| · | Insurance Guaranty Associations – Each state has insurance guaranty association laws under which the associations may assess life and property casualty insurers doing business in the state for certain obligations of insolvent insurance companies to policyholders and claimants. Typically, states assess each member insurer in an amount related to the insurer’s proportionate share of business written by all member insurers in the state. Our insurance companies received a savings of less than $1 million from guaranty association refunds in both 2012 and 2011. We cannot predict the amount and timing of any future assessments or refunds on our insurance subsidiaries under these laws. |
| · | Shared Market and Joint Underwriting Plans – State insurance regulation requires insurers to participate in assigned risk plans, reinsurance facilities and joint underwriting associations, which are mechanisms that generally provide applicants with various basic insurance coverages when they are not available in voluntary markets. Such mechanisms are most commonly instituted for automobile and workers’ compensation insurance, but many states also mandate participation in FAIR Plans or Windstorm Plans, which provide basic property coverages. Participation is based upon the amount of a company’s voluntary market share in a particular state for the classes of insurance involved. Underwriting results related to these organizations could be adverse to our company. |
| · | Statutory Accounting – For public reporting, insurance companies prepare financial statements in accordance with GAAP. However, certain data also must be calculated according to statutory accounting rules as defined in the NAIC’s Accounting Practices and Procedures Manual. While not a substitute for any GAAP measure of performance, statutory data frequently is used by industry analysts and other recognized reporting sources to facilitate comparisons of the performance of insurance companies. |
| · | Insurance Reserves – State insurance laws require that property casualty and life insurers annually analyze the adequacy of reserves. Our appointed actuaries must submit an opinion that reserves are adequate for policy claims-paying obligations and related expenses. |
| · | Investment Regulation – Insurance company investments must comply with laws and regulations pertaining to the type, quality and concentration of investments. Such laws and regulations permit investments in federal, state and municipal obligations, corporate bonds, preferred and common equity securities, mortgage loans, real estate and certain other investments, subject to specified limits and other qualifications. At December 31, 2012, the company believes it was in compliance with these laws and regulations in all material respects. |
| · | Risk-Based Capital Requirements – The NAIC’s risk-based capital (RBC) requirements for property casualty and life insurers serve as an early warning tool for the NAIC and state regulators to identify companies that may be undercapitalized and may merit further regulatory action. The NAIC has a standard formula for annually assessing RBC. The formula for calculating RBC for property casualty companies takes into account asset and credit risks but places more emphasis on underwriting factors for reserving and pricing. The formula for calculating RBC for life insurance companies takes into account factors relating to insurance, business, asset and interest rate risks. |
30
generally provide applicants with various basic insurance coverages when they are not available in voluntary markets. Such mechanisms are most commonly instituted for automobile and workers’ compensation insurance, but many states also mandate participation in FAIR Plans or Windstorm Plans, which provide basic property coverages. Participation is based upon the amount of a company’s voluntary market share in a particular state for the classes of insurance involved. Underwriting results related to these organizations could be adverse to our company.
Statutory Accounting – For public reporting, insurance companies prepare financial statements in accordance with GAAP. However, certain data also must be calculated according to statutory accounting rules as defined in the NAIC’s Accounting Practices and Procedures Manual. While not a substitute for any GAAP measure of performance, statutory data frequently is used by industry analysts and other recognized reporting sources to facilitate comparisons of the performance of insurance companies.
Insurance Reserves – State insurance laws require that property casualty and life insurers annually analyze the adequacy of reserves. Our appointed actuaries must submit an opinion that reserves are adequate for policy claims-paying obligations and related expenses.
Investment Regulation – Insurance company investments must comply with laws and regulations pertaining to the type, quality and concentration of investments. Such laws and regulations permit investments in federal, state and municipal obligations, corporate bonds, preferred and common equity securities, mortgage loans, real estate and certain other investments, subject to specified limits and other qualifications. At December 31, 2014, the company believes it was in compliance with these laws and regulations in all material respects.
Risk-Based Capital Requirements – The NAIC’s risk-based capital (RBC) requirements for property casualty and life insurers serve as an early warning tool for the NAIC and state regulators to identify companies that may be undercapitalized and may merit further regulatory action. The NAIC has a standard formula for annually assessing RBC. The formula for calculating RBC for property casualty companies takes into account asset and credit risks but places more emphasis on underwriting factors for reserving and pricing. The formula for calculating RBC for life insurance companies takes into account factors relating to insurance, business, asset and interest-rate risks.
Although the federal government and its regulatory agencies generally do not directly regulate the business of insurance, federal legislation and administrative rules adopted to implement them do affect our business. Privacy laws, such as the Gramm-Leach-Bliley Act, the Fair Credit Reporting Act and the Health Insurance Portability and Accounting Act (HIPAA) are the federal laws that most affect our day-to-day operations. These apply to us because we gather and use personal nonpublic information to underwrite insurance and process claims. We also are subject to other federal laws, such as the Terrorism Risk Insurance Act (TRIA), anti-money laundering statute (AML), the Nonadmitted and Reinsurance Reform Act (NRRA), and the rules and regulations of the Office of Foreign Assets Control (OFAC).
Title V of the Dodd-Frank Wall Street Reform and Consumer Protection Act of 2010 (Dodd-Frank) created the Federal Insurance Office to monitor the insurance industry and gather information to identify issues or gaps in the regulation of insurers that could contribute to a systemic crisis in the insurance industry of the United States financial system, and to recommend to the Financial Stability Oversight Council that it designate an insurer as a systemically significant entity requiring additional supervision by the Federal Reserve Board. We do not expect Dodd-Frank to result in federal oversight of our operations as a systemically significant entity.
We do not expect to have any material effects on our expenditures, earnings or competitive position as a result of compliance with any federal, state or local provisions enacted or adopted relating to the protection of the environment. We currently do not have any material estimated capital expenditures for environmental control facilities.
Enterprise Risk Management
We manage enterprise risk through formal risk management programs overseen by our chief risk officer, an executive officer of the company. Our ERM framework includes an enterprise risk management committee, which is responsible for overseeing risk activities and is comprised of senior executive-level risk owners from across the enterprise. The risk committee's activities are supported by a team of representatives from business areas that focus on identifying, evaluating and developing risk plans for emerging risks. A comprehensive report is provided quarterly to our chairman, our president and chief executive officer, our board of directors and our senior executive team, as appropriate, on the status of risk metrics relative to identified tolerances and limits, risk assessments and risk plans. Our use of operational audits, strategic plans and departmental business plans, as well as our culture of
Cincinnati Financial Corporation - 2014 10-K - Page 31
open communications and our fundamental respect for our Code of Conduct, continue to help us manage risks on an ongoing basis.
Our risk management programs include a formalized risk appetite element and a risk identification and quantification process. The overall enterprise objective is to appropriately balance risk and reward to achieve an appropriate return on risk capital. The company’s key risks are discussed in Item
1A.1A, Risk Factors,
including risks related to natural catastrophes, investments and operations.
We continue to study emerging risks, including climate change risk and its potential financial effects on our results of operation and on those we insure. These effects include deterioration in credit quality of our municipal or corporate bond portfolios and increased losses without sufficient corresponding increases in premiums. As with any risk, we seek to identify the extent of the risk exposure and possible actions to mitigate potential negative effects of risk, at an enterprise level.
Cincinnati Financial Corporation - 2014 10-K - Page 32
ITEM 1A. Risk Factors
Our business involves various risks and uncertainties that may affect achievement of our business objectives. Many of the risks could have ramifications across our organization. For example, while risks related to setting insurance rates and establishing and adjusting loss reserves are insurance activities, errors in these areas could have an impact on our investment activities, growth and overall results.
The following discussion should be viewed as a starting point for understanding the significant risks we face. It is not a definitive summary of their potential impacts or of our strategies to manage and control the risks. Please see Item 7, Management’s Discussion and Analysis of Financial Condition and Results of Operations,
Page 38, for a discussion of those strategies.
If any risks or uncertainties discussed here develop into actual events, they could have a material adverse effect on our business, financial condition or results of operations. In that case, the market price of our common stock could decline materially.
The failure of our risk management strategies could have a material adverse impact on our financial condition and/or results of operations.
Readers should carefully consider this information together with the other information we have provided in this report and in other reports and materials we file periodically with the Securities and Exchange Commission as well as news releases and other information we disseminate publicly.
We rely exclusively on independent insurance agents to distribute our products.
We market our products through independent, nonexclusive insurance agents. These agents are not obligated to promote our products and can and do sell our competitors’ products. We must offer insurance products that meet the needs of these agencies and their clients. We need to maintain good relationships with the agencies that market our products. If we do not, these agencies may market our competitors’ products instead of ours, which may lead to us having a less desirable mix of business and could affect our results of operations.
Certain events or conditions could diminish our agents’ desire to produce business for us and the competitive advantage that our independent agencies enjoy, including:
| · | Downgrade of the financial strength ratings of our insurance subsidiaries. We believe our strong insurer financial strength ratings, in particular, the A+ (Superior) ratings from A.M. Best for our standard market property casualty insurance group and each subsidiary, are an important competitive advantage. See Item 1, Financial Strength, Page 5, for additional discussion of our financial strength ratings. |
| · | Concerns that doing business with us is difficult or not profitable, perceptions that our level of service is no longer a distinguishing characteristic in the marketplace, perceptions that our products do not meet the needs of our agents’ clients or perceptions that our business practices are not compatible with agents’ business models. Mergers and acquisitions could result in a concentration of a significant amount of premium in one agency. |
| · | Delays in the development, implementation, performance and benefits of technology systems and enhancements or independent agent perceptions that our technology solutions do not match their needs. |
Downgrade of the financial strength ratings of our insurance subsidiaries. We believe our strong insurer financial strength ratings, in particular, the A+ (Superior) ratings from A.M. Best for our standard market property casualty insurance group and each subsidiary in that group, are an important competitive advantage. See Item 1, Our Business and Our Strategy, Financial Strength, for additional discussion of our financial strength ratings.
Concerns that doing business with us is difficult or not profitable, perceptions that our level of service is no longer a distinguishing characteristic in the marketplace, perceptions that our products do not meet the needs of our agents’ clients or perceptions that our business practices are not compatible with agents’ business models.
Mergers and acquisitions could result in a concentration of a significant amount of premium in one agency.
Delays in the development, implementation, performance and benefits of technology systems and enhancements or independent agent perceptions that our technology solutions do not match their needs.
A reduction in the number of independent agencies marketing our products, the failure of agencies to successfully market our products or pay their accounts to us, changes in the strategy or operations of agencies or the choice of agencies to reduce their writings of our products could affect our results of operations if we were unable to replace them with agencies that produce adequate and profitable premiums.
Further, policyholders may choose a competitor’s product rather than our own because of real or perceived differences in price, terms and conditions, coverage or service. If the quality of the independent agencies with which we do business were to decline, that also might cause policyholders to purchase their insurance through different agencies or channels. Consumers, especially in the personal insurance
segments,industry segment, may increasingly choose to purchase insurance from distribution channels other than independent insurance agents, such as direct marketers. Increased advertising by insurers, especially direct marketers, could cause consumers to shift their buying habits, bypassing independent agents altogether.
Our credit ratings or financial strength ratings of our insurance subsidiaries could be downgraded.
A downgrade in one or more of our company’s credit or debt ratings could adversely impact our borrowing costs or limit our access to capital. Financial strength ratings reflect a rating agency’s opinion of our insurance subsidiaries’
Cincinnati Financial Corporation - 2014 10-K - Page 33
financial strength, operating performance, strategic position and ability to meet obligations to policyholders. Our ratings are subject to periodic review and there is no assurance that our ratings will not be changed. Ratings agencies could change or expand their requirements or could find that our insurance subsidiaries no longer meet the criteria established for current ratings. If our property casualty insurer financial strength ratings were to be downgraded, our agents might find it more difficult to market our products or might choose to emphasize the products of other carriers. See Item 7, Liquidity and Capital Resources, Additional Sources of Liquidity,
Page 84, for additional discussion of ratings for our long-term debt.
We could experience an unusually high level of losses due to catastrophic, terrorism or pandemic events or risk concentrations.
In the normal course of our business, we provide coverage against perils for which estimates of losses are highly uncertain, in particular catastrophic and terrorism events. Catastrophes can be caused by a number of events, including hurricanes, tornadoes, windstorms, earthquakes, hailstorms, explosions, severe winter weather and fires. Due to the nature of these events, we are unable to predict precisely the frequency or potential cost of catastrophe occurrences. Various scientists and other experts believe that changing climate conditions have added to the unpredictability, frequency and severity of such natural disasters in certain parts of the world and have created additional uncertainty as to future trends and exposures. We cannot predict the impact that changing climate conditions may have on our results of operations nor can we predict how any legal, regulatory or social responses to concerns about climate change may impact our business. Additionally, man-made events, such as hydraulic fracturing, could cause damage from earth movement or create environmental
and/or health hazards.
The extent of losses from a catastrophe is a function of both the total amount of insured exposure in the area affected by the event and the severity of the event. Our ability to appropriately manage catastrophe risk depends partially on catastrophe models,
the accuracy of which may be affected by inaccurate or incomplete data, the uncertainty of the frequency and severity of future events and the uncertain impact of climate change. Additionally, these models are recalibrated and changed over time, with more data availability and changing opinions regarding the effect of current or emerging loss patterns and conditions. Please see Item 7,
2013Liquidity and Capital Resources, 2015 Reinsurance Programs,
Page 95, for a discussion of modeled losses considered in evaluating our reinsurance strategy.
The geographic regions in which we market insurance are exposed to numerous natural catastrophes, such as:
| · | Hurricanes in the gulf, eastern and southeastern coastal regions. |
| · | Earthquakes in many regions, most particularly in the New Madrid fault zone, which lies within the central Mississippi valley, extending from northeast Arkansas through southeast Missouri, western Tennessee and western Kentucky to southern Illinois, southern Indiana and parts of Ohio. |
| · | Tornado, wind and hail in the Midwest, South, Southeast, Southwest and the mid-Atlantic. |
Hurricanes in the gulf, eastern and southeastern coastal regions.
Earthquakes in many regions, most particularly in the New Madrid fault zone, which lies within the central Mississippi valley, extending from northeast Arkansas through southeast Missouri, western Tennessee and western Kentucky to southern Illinois, southern Indiana and parts of Ohio.
Tornado, wind and hail in the Midwest, South, Southeast, Southwest and the mid-Atlantic.
Wildfires in the West.
The occurrence of terrorist attacks in the geographic areas we serve could result in substantially higher claims under our insurance policies than we have anticipated. While we do insure terrorism risk in all areas we serve, we have identified our major terrorism exposure geographically as general commercial risks in the Tier 1 cities of metropolitan Chicago area, and to a much lesser degree, Washington
DC,D.C., Houston and Los Angeles. We have a greater amount of business in less hazardous Tier 2 cities such as Atlanta, Phoenix-Mesa, Minneapolis, Cleveland, St. Louis, Denver, Tampa-St. Petersburg, Pittsburgh and Cincinnati. We have exposure to small co-op utilities, water utilities, wholesale fuel distributors, small shopping malls and small colleges throughout our 39 active states and, because of the number of associates located there, our Fairfield, Ohio, headquarters. Additionally, our life insurance subsidiary could be adversely affected in the event of a terrorist event or an epidemic such as the avian or swine flu, particularly if the epidemic were to affect a broad range of the population beyond just the very young or the very old. Our associate health plan is self-funded and could similarly be affected.
Our results of operations would be adversely affected if the level of losses we experience over a period of time were to exceed our actuarially determined expectations. In addition, our financial condition may be adversely affected if we were required to sell securities prior to maturity or at unfavorable prices to pay an unusually high level of loss and loss expenses. Securities pricing might be even less favorable if a number of insurance or other companies and other investors needed to sell securities during a short period of time because of unusually high losses from catastrophic events.
Cincinnati Financial Corporation - 2014 10-K - Page 34
Our geographic concentration ties our performance to business, economic, environmental and regulatory conditions in certain states. We market our standard market property casualty insurance products in 39 states, but our business is concentrated in the Midwest and Southeast. We also have exposure in states where we do not actively market insurance when clients of our independent agencies have businesses or properties in multiple states.
The Cincinnati Insurance Company also participates in certain assumed reinsurance treaties with reinsurers that spread the risk of very large catastrophe losses among many insurers. At the beginning of
2013,2015, two surplus share treaties were in effect with the largest treaty representing exposure for us of up to
$3$2 million of assumed losses from a single catastrophic event. If there is a high frequency of very large catastrophe events during a coverage period of the treaty, our financial position and results of operations could be materially affected. Please see Item 7,
2013Liquidity and Capital Resources, 2015 Reinsurance Programs,
Page 95, for a discussion of our reinsurance treaties.
In the event of a severe catastrophic event or terrorist attack elsewhere in the world, our insurance losses may be immaterial. However, the companies
in which we invest
in might be severely affected, which could affect our financial condition and results of operations. Our reinsurers might experience significant losses, potentially jeopardizing their ability to pay losses we cede to them. It could also reduce the availability of reinsurance. If we cannot obtain adequate coverage at a reasonable cost, it could constrain where we can write business or reduce the amount of business we can write in certain areas. We also may be exposed to state guaranty fund assessments if other carriers in a state cannot meet their obligations to policyholders. A catastrophe or epidemic event also could affect our operations by damaging our headquarters facility, injuring associates and visitors at our Fairfield, Ohio, headquarters or disrupting our associates’ ability to perform their assigned tasks.
Our ability to achieve our performance objectives could be affected by changes in the financial, credit and capital markets or the general economy.
We invest premiums received from policyholders and other available cash to generate investment income and capital appreciation, while also maintaining sufficient liquidity to pay covered claims and operating expenses, service our debt obligations and pay dividends. The value of our invested assets is an important component of shareholders’ equity, also known as book value. Changes in the valuation of invested assets can significantly affect changes in book value per share, a key performance objective as discussed in Item 7, Executive Summary of
the Management’s Discussion and
Analysis, Page 38.Analysis.
For fixed-maturity investments such as bonds, which represented
approximately 72.565.8 percent of the fair value of our invested assets at the end of
2012,2014, the inverse relationship between interest rates and bond prices leads to falling bond values during periods of increasing interest rates. A significant increase in the general level of interest rates could have an adverse effect on our shareholders’
equity and our policyholders’ surplus.equity.
Investment income is an important component of our revenues and net income. The ability to increase investment income and generate longer-term growth in book value is affected by factors beyond our control, such as: inflation, economic growth, interest rates, world political conditions, changes in laws and regulations, terrorism attacks or threats, adverse events affecting other companies in our industry or the industries in which we invest, market events leading to credit constriction, and other widespread unpredictable events. These events may adversely affect the economy generally and could cause our investment income or the value of securities we own to decrease. A significant decline in our investment income could have an adverse effect on our net income, and thereby on our shareholders’ equity and our
policyholders’statutory capital and surplus. For example, a significant increase in the general level of interest rates could lead to falling bond values. For
a more detailed discussion of risks associated with our investments, please refer to Item 7A, Quantitative and Qualitative Disclosures About Market
Risk, Page 100.Risk.
We issue life contracts with guaranteed minimum returns, referred to as bank-owned life insurance contracts (BOLIs). BOLI investment assets must meet certain criteria established by the regulatory authorities in the jurisdiction for which the group contract holder is subject. Therefore, sales of investments may be mandated to maintain compliance with these regulations, possibly requiring gains or losses to be recorded. We could experience losses if the assets in the accounts were less than liabilities at the time of maturity or termination.
Our investment performance also could suffer because of the types of investments, industry groups and/or individual securities in which we choose to invest. Market value changes related to these choices could cause a material change in our financial condition or results of operations.
Cincinnati Financial Corporation - 2014 10-K - Page 35
At year-end
2012,2014, common stock holdings made up
25.832.7 percent of our
invested assets.investment portfolio. Adverse news or events affecting the global or U.S. economy or the equity markets could affect our net income, book value and overall results, as well as our ability to pay our common stock dividend. See Item 7, Investments Results,
of Operations, Page 79, and Item 7A, Quantitative and Qualitative Disclosures About Market Risk,
Page 100, for
a discussion of our investment activities.
Deterioration in the banking sector or in banks with which we have relationships could affect our results of operations. Our ability to maintain or obtain short-term lines of credit could be affected if the banks from which we obtain these lines are acquired, fail or are otherwise negatively affected. We may lose premium revenue if a bank that owns appointed agencies were to change its strategies. We could experience increased losses in our director and officer liability line of business if claims were made against insured financial institutions.
A deterioration of credit and market conditions could also impair our ability to access credit markets and could affect existing or future lending arrangements.
Our overall results could be affected if a significant portion of our commercial lines policyholders, including those purchasing surety bonds, are adversely affected by marked or prolonged economic downturns and events such as a downturn in construction and related sectors, tightening credit markets and higher fuel costs. Such events could make it more difficult for policyholders to finance new projects, complete projects or expand their businesses, leading to lower premiums from reduced payrolls and sales and lower
purchases of equipment and vehicles. These events could also cause claims, including surety claims, to increase due to a policyholder’s inability to secure necessary financing to complete projects or to collect on underlying lines of credit in the claims process. Such economic downturns and events could have a greater impact in the construction sector where we have a concentration of risks and in geographic areas that are hardest hit by economic downturns.
Deteriorating economic conditions could also increase the degree of credit risk associated with amounts due from independent agents who collect premiums for payment to us and could hamper our ability to recover amounts due from reinsurers.
Our ability to properly underwrite and price risks and increased competition could adversely affect our results.
Our financial condition, cash flow and results of operations depend on our ability to underwrite and set rates accurately for a full spectrum of risks. We establish our pricing based on assumptions about the level of losses that may occur within classes of business, geographic regions and other criteria.
To properly price our products, we must collect, properly analyze and use data to make decisions and take appropriate action; the data must be sufficient, reliable and accessible; we need to develop appropriate rating methodologies and formulae; and we may need to identify and respond to trends quickly. We may overestimate or underestimate loss cost trends or these trends may unexpectedly change, leading to losing business by pricing risks above our competitors or charging rates too low to maintain profitability. Inflation trends, especially outside of historical norms, may make it more difficult to determine adequate pricing. If rates are not accurate, we may not generate enough premiums to offset losses and expenses or we may not be competitive in the marketplace.
Our ability to set appropriate rates could be hampered if a state or states where we write business refuses to allow rate increases that we believe are necessary to cover the risks insured. At least one state requires us to purchase reinsurance from a mandatory reinsurance fund. Such reinsurance funds can create a credit risk for insurers if not adequately funded by the state and, in some cases, the existence of a reinsurance fund could affect the prices charged for our policies. The effect of these and similar arrangements could reduce our profitability in any given period or limit our ability to grow our business.
The insurance industry is cyclical and intensely competitive. From time to time, the insurance industry goes through prolonged periods of intense competition during which it is more difficult to attract new business, retain existing business and maintain profitability. Competition in our insurance business is based on many factors, including:
| · | Competitiveness of premiums charged |
| · | Relationships among carriers, agents, brokers and policyholders |
| · | Underwriting and pricing methodologies that allow insurers to identify and flexibly price risks |
| · | Compensation provided to agents |
| · | Terms and conditions of insurance coverage |
| · | Speed with which products are brought to market |
| · | Product and marketing innovations, including advertising |
| · | Technological competence and innovation |
| · | Ability to control expenses |
| · | Adequacy of financial strength ratings by independent ratings agencies such as A.M. Best |
| · | Quality of services and tools provided to agents and policyholders |
| · | Claims satisfaction and reputation |
Competitiveness of premiums charged
Relationships among carriers, agents, brokers and policyholders
Underwriting and pricing methodologies that allow insurers to identify and flexibly price risks
Compensation provided to agents
Underwriting discipline
Cincinnati Financial Corporation - 2014 10-K - Page 36
Terms and conditions of insurance coverage
Speed with which products are brought to market
Product and marketing innovations, including advertising
Technological competence and innovation
Ability to control expenses
Adequacy of financial strength ratings by independent ratings agencies such as A.M. Best
Quality of services and tools provided to agents and policyholders
Claims satisfaction and reputation
If our pricing were incorrect or we were unable to compete effectively because of one or more of these factors, our premium writings could decline and our results of operations and financial condition could be materially adversely affected. Large competitors could intentionally disrupt the market by targeting certain lines or underpricing the market.
Please see the discussion of our Commercial Lines, Personal Lines, Excess and Surplus Lines and Life Insurance Segments in Item 1,
Page 13, Page 15, Page 16 and Page 18,Our Segments, for a discussion of our competitive position in the insurance marketplace.
Our pricing and capital models could be flawed.
We use various predictive pricing models, stochastic models and/or forecasting techniques to help us to understand our business, analyze risk and estimate future trends. The output of these models is used to assist us in making underwriting, pricing, reinsurance, reserving and capital decisions and helps us set our strategic direction. These models contain numerous assumptions,
including the assumption that the data used is sufficient and accurate, and are subject to uncertainties and
limitations inherent in any statistical analysis. Actual results might differ from modeled output, resulting in pricing our products incorrectly, overestimating or underestimating reserves, or inaccurately forecasting the impact of modeled events on our results. This could materially adversely impact the results of our operations.
Our loss reserves, our largest liability, are based on estimates and could be inadequate to cover our actual losses.
Our consolidated financial statements are prepared using GAAP. These principles require us to make estimates and assumptions that affect the amounts reported in the Consolidated Financial Statements and accompanying Notes. Actual results could differ materially from those estimates. For a discussion of the significant accounting policies we use to prepare our financial statements, the material implications of uncertainties associated with the methods, assumptions and estimates underlying our critical accounting policies and the process used to determine our loss reserves, please refer to Item 8, Note 1 of the Consolidated Financial Statements,
Page 112, and Item 7, Critical Accounting Estimates, Property Casualty Insurance Loss and Loss Expense Reserves and Life Insurance Policy
Reserves, Page 43 and Page 47.Reserves.
Our most critical accounting estimate is loss reserves. Loss reserves are the amounts we expect to pay for covered claims and expenses we incur to settle those claims. The loss reserves we establish in our financial statements represent an estimate of amounts needed to pay and administer claims arising from insured events that have already occurred, including events that have not yet been reported to us. Loss reserves are estimates and are inherently uncertain; they do not and cannot represent an exact measure of liability. Inflationary scenarios, especially scenarios outside of historical norms or regulatory changes that affect the assumptions underlying our critical accounting estimates, may make it more difficult to estimate loss reserves. Accordingly, our loss reserves for past periods could prove to be inadequate to cover our actual losses and related expenses. Any changes in these estimates are reflected in our results of operations during the period in which the changes are made. An increase in our loss reserves would decrease earnings, while a decrease in our loss reserves would increase earnings.
Unforeseen losses, the type and magnitude of which we cannot predict, may emerge in the future. These additional losses could arise from changes in the legal environment, laws and regulations, climate change, catastrophic events, increases in loss severity or frequency,
environmental claims, mass torts or other causes. Such future losses could be substantial. Inflationary scenarios may cause the cost of claims, especially medical claims, to rise, impacting reserve adequacy and our results of operations.
Cincinnati Financial Corporation - 2014 10-K - Page 37
Our ability to obtain or collect on our reinsurance protection could affect our business, financial condition, results of operations and cash flows.
We buy property casualty and life reinsurance coverage to mitigate the liquidity risk and earnings volatility risk of an unexpected rise in claims severity or frequency from catastrophic events or a single large loss. The availability, amount and cost of reinsurance depend on market conditions and may vary significantly. If we were unable to obtain reinsurance on acceptable terms and in appropriate amounts, our business and financial condition could be adversely affected.
In addition, we are subject to credit risk with respect to our reinsurers. Although we purchase reinsurance to manage our risks and exposures to losses, this reinsurance does not discharge our direct obligations under the policies we write. We would remain liable to our policyholders even if we were unable to recover what we believe we are entitled to receive under our reinsurance contracts. Reinsurers might refuse or fail to pay losses that we cede to them, or they might delay payment. For long-tail claims, the creditworthiness of our reinsurers may change before we can recover amounts to which we are entitled. A reinsurer’s insolvency, inability or unwillingness to make payments under the terms of its reinsurance agreement with our insurance subsidiaries could have a material adverse effect on our financial position, results of operations and cash flows.
Please see Item 7,
2013Liquidity and Capital Resources, 2015 Reinsurance Programs,
Page 95, for a discussion of selected reinsurance transactions.
Our business depends on the uninterrupted operation of our facilities, systems and business functions.
Our business depends on our associates’ ability to perform necessary business functions, such as processing new and renewal policies and claims. We increasingly rely on technology and systems to accomplish these business functions in an efficient and uninterrupted fashion. Our inability to access our headquarters facilities or a failure of technology, telecommunications or other systems could significantly impair our ability to perform such functions on a timely basis or affect the accuracy of transactions. If sustained or repeated, such a business interruption or system failure could result in a deterioration of our ability to write and process new and renewal business, serve our agents and policyholders, pay claims in a timely manner, collect receivables or perform other necessary business functions. If our disaster recovery and business continuity plans did not sufficiently consider, address or reverse the circumstances of an interruption or failure, this could result in a materially adverse effect on our operating results and financial condition. This risk is exacerbated because approximately
7069 percent of our associates work at our Fairfield, Ohio, headquarters.
Our ability to successfully execute business functions also depends on hiring and retaining qualified associates. Competition for high-quality executives and other key associates occurs within the insurance industry and from other industries. We also must effectively develop and manage associates, including providing training and resources. Such tools and information can allow them to effectively perform critical business functions and adapt to changing business needs. If we were unable to attract and retain certain associates, or if we fail to provide adequate training or resources, we could limit the success of executing our strategic plans and vital business functions.
The effects of changes in industry practices, laws and regulations on our business are uncertain.
As industry practices and legal, judicial, legislative, regulatory, political, social and other environmental conditions change, unexpected and unintended issues related to insurance pricing, claims and coverage may emerge. These issues may adversely affect our business by impeding our ability to obtain adequate rates for covered risks, extending coverage beyond our underwriting intent, by increasing the number or size of claims, by varying assumptions underlying our critical accounting estimates or by increasing duties owed to policyholders beyond contractual obligations. In some instances, unforeseeable emerging and latent claim and coverage issues may not become apparent until sometime after we have issued the insurance policies that could be affected by the changes. As a result, the full extent of liability under our insurance contracts may not be known for many years after a policy is issued and our pricing and reserve estimates may not accurately reflect its effect.
We are required to adopt new or revised accounting standards issued by recognized authoritative organizations, including the Financial Accounting Standards Board (FASB) and the SEC. Future changes required to be adopted could change the current accounting treatment that we apply and could result in material adverse effects on our results of operations and financial condition.
Cincinnati Financial Corporation - 2014 10-K - Page 38
Our investment income benefits from tax rate preferences for municipal bond interest and dividend income from equity securities. Market valuations for these securities also benefit from the tax-preference aspect of current tax laws, affecting the value of our investment portfolio and also shareholders’ equity. Future changes in tax laws could result in material adverse effects on our results of operations and financial condition.
The NAIC, state insurance regulators and state legislators continually re-examine existing laws and regulations governing insurance companies and insurance holding companies, specifically focusing on modifications to statutory accounting principles, interpretations of existing laws, regulations relating to product forms and pricing methodologies and the development of new laws and regulations that affect a variety of financial and nonfinancial components of our business. Any proposed or future legislation, regulation or NAIC initiatives, if adopted, may be more restrictive on our ability to conduct business than current regulatory requirements or may result in higher costs.
The loss or significant restriction on the use of a particular variable, such as credit, in pricing and underwriting our products could lead to future unprofitability and increased costs.
Federal laws and regulations, including those that may be enacted in the wake of the financial and credit crises, may have adverse effects on our business, potentially including a change from a state-based system of regulation to a system of federal regulation, the repeal of the McCarran Ferguson Act, and/or measures under the Dodd-Frank Act that establish the Federal Insurance Office and provide for a determination that a nonbank financial company presents systemic risk and therefore should be subject to heightened supervision by the Federal Reserve Board. It is not known how this federal office will coordinate and interact with the NAIC and state insurance regulators. Adoption or implementation of any of these measures may restrict our ability to conduct our insurance business, govern our corporate affairs or increase our cost of doing business.
Implementation of the Affordable Care Act (ACA) may affect the ability of the company to grow profitably.
The effects of such changes could adversely affect our results of operations. Please see Item 7, Critical Accounting Estimates, Property Casualty Insurance Loss and Loss Expense Reserves and Life Insurance Policy Reserves,
Page 43 and Page 47, for a discussion of our reserving practices.
Managing technology initiatives and meeting data security requirements are significant challenges.
While technology can streamline many business processes and ultimately reduce the cost of operations, technology initiatives present short-term cost, and also have implementation and operational risks. In addition, we may have inaccurate expense projections, implementation schedules or expectations regarding the effectiveness and user acceptance of the end product. These issues could escalate over time. If we were unable to find and retain associates with key technical knowledge, our ability to develop and deploy key technology solutions could be hampered.
We necessarily collect, use and hold data concerning individuals and businesses with whom we have a relationship. Threats to data security, including unauthorized access and
cyber attacks,cyberattacks, rapidly emerge and change, exposing us to additional costs for protection or remediation and competing time constraints to secure our data in accordance with customer expectations and statutory and regulatory requirements.
While we take
all commercially reasonable measures to keep our systems and data secure, it is difficult or impossible to defend against every risk being posed by changing technologies as well as criminals’ intent on committing
cyber-crime.cybercrime. Increasing sophistication of
cyber-criminalscyber criminals and terrorists make keeping up with new threats difficult and could result in a breach. Patching and other measures to protect existing systems and servers could be inadequate, especially on systems that are being retired. Controls employed by our U.S., off-shore and cloud vendors could prove inadequate. We could also experience a breach by intentional or negligent conduct on the part of associates or other internal sources. Our systems and those of our third-party vendors may become vulnerable to damage or disruption due to circumstances beyond our or their control, such as from catastrophic events, power anomalies or outages, natural disasters, network failures, and viruses and malware.
A breach of our security that results in unauthorized access to our data could expose us to a disruption or challenges relating to our daily operations as well as to data loss, litigation, damages, fines and penalties, significant increases in compliance costs and reputational damage.
Cincinnati Financial Corporation - 2014 10-K - Page 39
Our status as an insurance holding company with no direct operations could affect our ability to pay dividends in the future.
Cincinnati Financial Corporation is a holding company that transacts substantially all of its business through its subsidiaries. Our primary assets are the stock in our operating subsidiaries and our investments. Consequently, our cash flow to pay cash dividends and interest on our long-term debt depends on dividends we receive from our operating subsidiaries and income earned on investments held at the parent-company level.
Dividends paid to our parent company by our insurance subsidiary are restricted by the insurance laws of Ohio, its domiciliary state. These laws establish minimum solvency and liquidity thresholds and limits. In
2013,2015, the maximum dividend that may be paid without prior regulatory approval is limited to the greater of 10 percent of statutory
capital and surplus or 100 percent of statutory net income for the prior calendar year, up to the amount of statutory unassigned
capital and surplus as of the end of the prior calendar year. Dividends exceeding these limitations may be paid only with prior approval of the Ohio Department of Insurance. Consequently, at times, we might not be able to receive dividends from our insurance subsidiary, or we might not receive dividends in the amounts necessary to meet our debt obligations or to pay dividends on our common stock without liquidating securities. This could affect our financial position.
Please see Item 1, Regulation,
Page 24, and Item 8, Note 9 of the Consolidated Financial Statements,
Page 127, for
a discussion of insurance holding company dividend regulations.
| Item 1B. | Unresolved Staff Comments |
ITEM 1B. Unresolved Staff Comments
ITEM 2. Properties
Cincinnati Financial Corporation owns our headquarters building located on 100 acres of land in Fairfield, Ohio. This building has
approximately 1,508,200
total square feet of
availabletotal space. The property, including land, is carried in our financial statements at
$145$137 million as of December 31,
2012,2014, and is classified as land, building and equipment, net, for company use. John J. & Thomas R. Schiff & Co. Inc., a related party, occupies
approximately 6,750 square feet (less than 1 percent). This property is used by all segments reported in the Consolidated Financial Statements and accompanying Notes.
Cincinnati Financial Corporation also owns
Gilmore Pointe, formerly known as the Fairfield Executive Center, which is located on the northwest corner of our headquarters property. This four-story office building has approximately 124,000 square feet of
availabletotal space. The property is carried in the financial statements at $7 million as of December 31,
2012,2014, and is classified as land, building and equipment, net, for company use. Unaffiliated tenants occupy
approximately 56 percent. This property is used by all segments reported in the Consolidated Financial Statements and accompanying Notes.
The Cincinnati Insurance Company owns
a buildingthe CFC Winton Center used for business continuity, with approximately 48,000 square feet of
availabletotal space, located approximately six miles from our headquarters. The property, including land, is carried on our financial statements at $10 million as of December 31,
2012,2014, and is classified as land, building and equipment, net, for company use. This property is used by all segments reported in the Consolidated Financial Statements and accompanying Notes.
ITEM 3. Legal Proceedings
Neither the company nor any of our subsidiaries is involved in any material litigation other than ordinary, routine litigation incidental to the nature of its business.
| Item 4. | Mine Safety Disclosures |
ITEM 4. Mine Safety Disclosures
This item is not applicable to the company.
Cincinnati Financial Corporation - 2014 10-K - Page 40
Part II
| Item 5. | Market for the Registrant’s Common Equity, Related Stockholder Matters and Issuer Purchases of Equity Securities |
ITEM 5. Market for the Registrant’s Common Equity, Related Stockholder Matters and Issuer Purchases of Equity Securities
Cincinnati Financial Corporation had approximately
76,00070,000 shareholders of record as of December 31,
2012.2014. While approximately
12,70013,000 shareholders are registered, the majority of shareholders are beneficial owners whose shares are held in “street name” by brokers and institutional accounts. We believe many of our independent agent representatives and most of the
4,0574,305 associates of our subsidiaries own the company’s common stock.
Our common shares are traded under the symbol CINF on the Nasdaq Global Select Market.
| (Source: Nasdaq Global Select Market) | | 2012 | | | 2011 | |
| Quarter: | | 1st | | | 2nd | | | 3rd | | | 4th | | | 1st | | | 2nd | | | 3rd | | | 4th | |
| High | | $ | 36.05 | | | $ | 38.12 | | | $ | 40.22 | | | $ | 40.96 | | | $ | 34.33 | | | $ | 33.55 | | | $ | 29.54 | | | $ | 30.79 | |
| Low | | | 30.06 | | | | 33.06 | | | | 36.50 | | | | 36.96 | | | | 31.43 | | | | 27.80 | | | | 23.65 | | | | 24.66 | |
| Period-end close | | | 34.51 | | | | 38.07 | | | | 37.87 | | | | 39.16 | | | | 32.79 | | | | 29.18 | | | | 26.33 | | | | 30.46 | |
| Cash dividends declared | | | 0.4025 | | | | 0.4025 | | | | 0.4075 | | | | 0.4075 | | | | 0.40 | | | | 0.40 | | | | 0.4025 | | | | 0.4025 | |
|
| | | | | | | | | | | | | | | | | | | | | | | | | | | | | | | | |
| (Source: Nasdaq Global Select Market) | | 2014 | | 2013 |
| Quarter: | | 1st | | 2nd | | 3rd | | 4th | | 1st | | 2nd | | 3rd | | 4th |
| High | | $ | 52.19 |
| | $ | 49.73 |
| | $ | 48.86 |
| | $ | 55.35 |
| | $ | 47.35 |
| | $ | 50.60 |
| | $ | 50.01 |
| | $ | 53.74 |
|
| Low | | 44.90 |
| | 47.00 |
| | 45.69 |
| | 45.09 |
| | 39.60 |
| | 44.53 |
| | 43.62 |
| | 46.61 |
|
| Period-end close | | 48.66 |
| | 48.04 |
| | 47.05 |
| | 51.83 |
| | 47.22 |
| | 45.92 |
| | 47.16 |
| | 52.37 |
|
| Cash dividends declared | | 0.44 |
| | 0.44 |
| | 0.44 |
| | 0.44 |
| | 0.4075 |
| | 0.4075 |
| | 0.42 |
| | 0.42 |
|
| | | | | | | | | | | | | | | | | |
We discuss the factors that affect our ability to pay cash dividends and repurchase shares in Item 7, Liquidity and Capital
Resources, Page 83. One factor we address is regulatoryResources. Regulatory restrictions on
the dividends our insurance subsidiary can pay to the parent company
which also isare discussed in Item 8, Note 9 of the Consolidated Financial
Statements, Page 127.Statements.
The following summarizes securities authorized for issuance under our equity compensation plans as of December 31,
2012:| Plan category | | Number of securities to be
issued upon exercise of
outstanding options,
warrants and rights at
December 31, 2012 | | | Weighted-average exercise
price of outstanding
options, warrants and rights | | | Number of securities remaining
available for future issuance under
equity compensation plan (excluding
securities reflected in column (a)) at
December 31, 2012 | |
| | | (a) | | | (b) | | | (c) | |
| Equity compensation plans approved by security holders | | | 7,937,331 | | | $ | 37.34 | | | | 9,316,008 | |
| Equity compensation plans not approved by security holders | | | - | | | | - | | | | - | |
| Total | | | 7,937,331 | | | $ | 37.34 | | | | 9,316,008 | |
2014:
|
| | | | | | | | | | |
| Plan category | | Number of securities to be issued upon exercise of outstanding options, warrants and rights at December 31, 2014 | | Weighted-average exercise price of outstanding options, warrants and rights | | Number of securities remaining available for future issuance under equity compensation plan (excluding securities reflected in column (a)) at December 31, 2014 |
| | | (a) | | (b) | | (c) |
Equity compensation plans approved by security holders | | 4,958,191 |
| | $ | 39.10 |
| | 6,199,048 |
|
Equity compensation plans not approved by security holders | | — |
| | — |
| | — |
|
| Total | | 4,958,191 |
| | $ | 39.10 |
| | 6,199,048 |
|
| | | | | | | |
The number of securities remaining available for future issuance includes: 7 million5,503,974 shares available for issuance under the Cincinnati Financial Corporation 2012 Stock Compensation Plan (the 2012 Plan), 2,095,928517,117 shares available for issuance under the Cincinnati Financial Corporation 2006 Stock Compensation Plan (the 2006 Plan), and 220,080177,957 shares available for issuance of share grants under the Director’s Stock Plan of 2009. Both the 2012 Plan and 2006 Plan allow for issuance of stock options, service-based, or performance-based restricted stock units, stock appreciation rights or other equity-based grants. Awards other than stock options and stock appreciation rights granted from the 2012 and 2006 plans are counted as three shares against the plan for each one share of common stock actually issued. Additional information about stock-based associate compensation granted under our equity compensation plans is available in Item 8, Note 17 of the Consolidated Financial Statements,Statements.
Cincinnati Financial Corporation - 2014 10-K - Page
135.| Period | | Total number
of shares
purchased | | | Average
price paid
per share | | | Total number of shares
purchased as part of
publicly announced
plans or programs | | | Maximum number of
shares that may yet be
purchased under the
plans or programs | |
| January 1-31, 2012 | | | 0 | | | $ | 0.00 | | | | 0 | | | | 7,438,762 | |
| February 1-29, 2012 | | | 0 | | | | 0.00 | | | | 0 | | | | 7,438,762 | |
| March 1-31, 2012 | | | 0 | | | | 0.00 | | | | 0 | | | | 7,438,762 | |
| April 1-30, 2012 | | | 0 | | | | 0.00 | | | | 0 | | | | 7,438,762 | |
| May 1-31, 2012 | | | 0 | | | | 0.00 | | | | 0 | | | | 7,438,762 | |
| June 1-30, 2012 | | | 0 | | | | 0.00 | | | | 0 | | | | 7,438,762 | |
| July 1-31, 2012 | | | 1,220 | | | | 38.17 | | | | 1,220 | | | | 7,437,542 | |
| August 1-31, 2012 | | | 108,148 | | | | 38.81 | | | | 108,148 | | | | 7,329,394 | |
| September 1-30, 2012 | | | 65,182 | | | | 38.99 | | | | 65,182 | | | | 7,264,212 | |
| October 1-31, 2012 | | | 10,509 | | | | 39.12 | | | | 10,509 | | | | 7,253,703 | |
| November 1-30, 2012 | | | 100,926 | | | | 39.71 | | | | 100,926 | | | | 7,152,777 | |
| December 1-31, 2012 | | | 25,539 | | | | 40.49 | | | | 25,539 | | | | 7,127,238 | |
| Totals | | | 311,524 | | | | 39.28 | | | | 311,524 | | | | | |
41
The following summarizes shares purchased under our repurchase programs:
|
| | | | | | | | | | | | | |
| Period | | Total number of shares purchased | | Average price paid per share | | Total number of shares purchased as part of publicly announced plans or programs | | Maximum number of shares that may yet be purchased under the plans or programs |
| January 1-31, 2014 | | — |
| | — |
| | — |
| | 5,549,493 |
|
| February 1-28, 2014 | | — |
| | — |
| | — |
| | 5,549,493 |
|
| March 1-31, 2014 | | 150,000 |
| | $ | 47.69 |
| | 150,000 |
| | 5,399,493 |
|
| April 1-30, 2014 | | — |
| | — |
| | — |
| | 5,399,493 |
|
| May 1-31, 2014 | | — |
| | — |
| | — |
| | 5,399,493 |
|
| June 1-30, 2014 | | — |
| | — |
| | — |
| | 5,399,493 |
|
| July 1-31, 2014 | | 100,000 |
| | 46.07 |
| | 100,000 |
| | 5,299,493 |
|
| August 1-31, 2014 | | 200,000 |
| | 46.11 |
| | 200,000 |
| | 5,099,493 |
|
| September 1-30, 2014 | | — |
| | — |
| | — |
| | 5,099,493 |
|
| October 1-31, 2014 | | — |
| | — |
| | — |
| | 5,099,493 |
|
| November 1-30, 2014 | | — |
| | — |
| | — |
| | 5,099,493 |
|
| December 1-31, 2014 | | — |
| | — |
| | — |
| | 5,099,493 |
|
| Totals | | 450,000 |
| | 46.63 |
| | 450,000 |
| | |
|
| | | | | | | | | |
We did not sell any of our shares that were not registered under the Securities Act during
2012.2014. The board of directors has authorized share repurchases since 1996. Purchases are expected to be made generally through open market transactions.
During 2012, we acquired 311,524 shares for $12 million from associates as consideration for options exercised. The board gives management discretion to purchase shares at reasonable prices in light of circumstances at the time of purchase, subject to SEC regulations. We have
7,127,2385,099,493 shares available for purchase under our programs at December 31,
2012.2014.
On October 24, 2007, the board of directors expanded the existing repurchase authorization to approximately 13 million shares. The prior repurchase program for 10 million shares was announced in 2005, replacing a program that had been in effect since 1999. No repurchase program has expired during the period covered by the above table. Neither the 2005 nor 1999 program had an expiration date, but no further repurchases will occur under the 1999 program.
As depicted in the graph below, the five-year total return on a $100 investment made December 31,
2007,2009, assuming the reinvestment of all dividends, was
29.6146.7 percent for Cincinnati Financial Corporation’s common stock compared with
8.4109.3 percent for the Standard & Poor’s Composite 1500 Property & Casualty Insurance Index and
8.6105.1 percent for the Standard & Poor’s 500 Index.
The Standard & Poor’s Composite 1500 Property & Casualty Insurance Index
includes 27 companies:included 26 companies at year-end 2014: Ace
Limited.,Limited, The Allstate Corporation, Amerisafe Inc., Aspen Insurance Holdings
Limited.,Limited, W. R. Berkley Corporation,
Berkshire Hathaway Inc., The Chubb Corporation, Cincinnati Financial Corporation, Employers Holdings Inc.,
Fidelity National Financial Inc., First American Financial Corporation, The Hanover Insurance
Group Inc., HCI Group Inc., Infinity Property and Casualty Corporation, Meadowbrook Insurance Group Inc., Mercury General Corporation, The Navigators Group Inc., Old Republic International Corporation, ProAssurance Corporation, The Progressive Corporation, RLI Corp., Safety Insurance Group Inc., Selective Insurance Group Inc., Stewart Information Services Corporation,
Tower Group Inc., The Travelers Companies Inc., United Fire & Casualty Company,
Universal Insurance Holdings Inc. and XL Group Public Limited Company.
The Standard & Poor’s 500 Index includes a representative sample of 500 leading companies in a cross section of industries of the U.S. economy. Although this index focuses on the large capitalization segment of the market, it is widely viewed as a proxy for the total market.
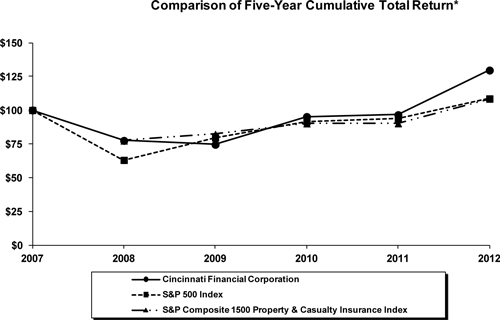
Cincinnati Financial Corporation - 2014 10-K - Page 42
Comparison of Five-Year Cumulative Total Return*
*$100 invested on December 31,
2007,2009, in stock or index, including reinvestment of dividends.
Fiscal year ending December 31.
| Item 6. | Selected Financial Data |
| (In millions except per share data, shares outstanding in thousands) | | Years ended December 31, | | | | |
| | | 2012 | | | 2011 | | | 2010 | | | 2009 | | | 2008 | |
| Consolidated Income Statement Data | | | | | | | | | | | | | | | | | | | | |
| Earned premiums | | $ | 3,522 | | | $ | 3,194 | | | $ | 3,082 | | | $ | 3,054 | | | $ | 3,136 | |
| Investment income, net of expenses | | | 531 | | | | 525 | | | | 518 | | | | 501 | | | | 537 | |
| Realized investment gains and losses* | | | 42 | | | | 70 | | | | 159 | | | | 336 | | | | 138 | |
| Total revenues | | | 4,111 | | | | 3,803 | | | | 3,772 | | | | 3,903 | | | | 3,824 | |
| Net income | | | 421 | | | | 164 | | | | 375 | | | | 431 | | | | 428 | |
| Net income per common share: | | | | | | | | | | | | | | | | | | | | |
| Basic | | $ | 2.59 | | | $ | 1.01 | | | $ | 2.30 | | | $ | 2.65 | | | $ | 2.62 | |
| Diluted | | | 2.57 | | | | 1.01 | | | | 2.30 | | | | 2.65 | | | | 2.62 | |
| Cash dividends per common share: | | | | | | | | | | | | | | | | | | | | |
| Declared | | | 1.62 | | | | 1.605 | | | | 1.59 | | | | 1.57 | | | | 1.56 | |
| Paid | | | 1.615 | | | | 1.6025 | | | | 1.585 | | | | 1.565 | | | | 1.525 | |
| Weighted average shares outstanding, diluted | | | 163,661 | | | | 163,259 | | | | 163,274 | | | | 162,867 | | | | 163,362 | |
| Consolidated Balance Sheet Data | | | | | | | | | | | | | | | | | | | | |
| Total investments | | $ | 12,534 | | | $ | 11,801 | | | $ | 11,508 | | | $ | 10,643 | | | $ | 8,890 | |
| Deferred policy acquisition costs | | | 470 | | | | 477 | | | | 458 | | | | 454 | | | | 482 | |
| Total assets | | | 16,548 | | | | 15,635 | | | | 15,065 | | | | 14,413 | | | | 13,342 | |
| Gross loss and loss expense reserves | | | 4,230 | | | | 4,339 | | | | 4,200 | | | | 4,142 | | | | 4,086 | |
| Life policy reserves | | | 2,295 | | | | 2,214 | | | | 2,034 | | | | 1,783 | | | | 1,551 | |
| Long-term debt | | | 790 | | | | 790 | | | | 790 | | | | 790 | | | | 791 | |
| Shareholders' equity | | | 5,453 | | | | 5,033 | | | | 5,012 | | | | 4,742 | | | | 4,169 | |
| Book value per share | | | 33.48 | | | | 31.03 | | | | 30.79 | | | | 29.14 | | | | 25.67 | |
| Shares outstanding | | | 162,874 | | | | 162,186 | | | | 162,782 | | | | 162,741 | | | | 162,411 | |
| Value creation ratio | | | 12.6 | % | | | 6.0 | % | | | 11.1 | % | | | 19.7 | % | | | (23.5 | )% |
| Consolidated Property Casualty Operations | | | | | | | | | | | | | | | | | | | | |
| Earned premiums | | $ | 3,344 | | | $ | 3,029 | | | $ | 2,924 | | | $ | 2,911 | | | $ | 3,010 | |
| Unearned premiums | | | 1,790 | | | | 1,631 | | | | 1,551 | | | | 1,507 | | | | 1,542 | |
| Gross loss and loss expense reserves | | | 4,169 | | | | 4,280 | | | | 4,137 | | | | 4,096 | | | | 4,040 | |
| Investment income, net of expenses | | | 351 | | | | 350 | | | | 348 | | | | 336 | | | | 350 | |
| Loss ratio | | | 53.8 | % | | | 64.4 | % | | | 56.5 | % | | | 58.6 | % | | | 57.7 | % |
| Loss expense ratio | | | 10.1 | | | | 12.6 | | | | 12.4 | | | | 13.1 | | | | 10.6 | |
| Underwriting expense ratio | | | 32.2 | | | | 32.3 | | | | 32.9 | | | | 32.8 | | | | 32.2 | |
| Combined ratio | | | 96.1 | % | | | 109.3 | % | | | 101.8 | % | | | 104.5 | % | | | 100.5 | % |
Cincinnati Financial Corporation - 2014 10-K - Page 43
ITEM 6. Selected Financial Data
|
| | | | | | | | | | | | | | | | | | | | |
| (In millions except per share data) | | Years ended December 31, |
| | | 2014 | | 2013 | | 2012 | | 2011 | | 2010 |
| Consolidated Income Statement Data | | |
| | |
| | |
| | |
| | |
|
| Earned premiums | | $ | 4,243 |
| | $ | 3,902 |
| | $ | 3,522 |
| | $ | 3,194 |
| | $ | 3,082 |
|
| Investment income, net of expenses | | 549 |
| | 529 |
| | 531 |
| | 525 |
| | 518 |
|
| Realized investment gains, net* | | 133 |
| | 83 |
| | 42 |
| | 70 |
| | 159 |
|
| Total revenues | | 4,945 |
| | 4,531 |
| | 4,111 |
| | 3,803 |
| | 3,772 |
|
| Net income | | 525 |
| | 517 |
| | 421 |
| | 164 |
| | 375 |
|
| Net income per common share: | | |
| | | | | | | | |
| Basic | | $ | 3.21 |
| | $ | 3.16 |
| | $ | 2.59 |
| | $ | 1.01 |
| | $ | 2.30 |
|
| Diluted | | 3.18 |
| | 3.12 |
| | 2.57 |
| | 1.01 |
| | 2.30 |
|
| Cash dividends per common share: | | | | | | | | | | |
| Declared | | 1.76 |
| | 1.655 |
| | 1.62 |
| | 1.605 |
| | 1.59 |
|
| Paid | | 1.74 |
| | 1.6425 |
| | 1.615 |
| | 1.6025 |
| | 1.585 |
|
| Diluted weighted average shares outstanding | | 165.1 |
| | 165.4 |
| | 163.7 |
| | 163.3 |
| | 163.3 |
|
| Consolidated Balance Sheet Data | | | | | | | | | | |
| Total investments | | $ | 14,386 |
| | $ | 13,564 |
| | $ | 12,534 |
| | $ | 11,801 |
| | $ | 11,508 |
|
| Net unrealized investment gains | | 2,719 |
| | 2,335 |
| | 1,875 |
| | 1,489 |
| | 1,250 |
|
| Deferred policy acquisition costs | | 578 |
| | 565 |
| | 470 |
| | 477 |
| | 458 |
|
| Total assets | | 18,753 |
| | 17,662 |
| | 16,548 |
| | 15,635 |
| | 15,065 |
|
| Gross loss and loss expense reserves | | 4,485 |
| | 4,311 |
| | 4,230 |
| | 4,339 |
| | 4,200 |
|
| Life policy reserves | | 2,497 |
| | 2,390 |
| | 2,295 |
| | 2,214 |
| | 2,034 |
|
| Long-term debt | | 791 |
| | 790 |
| | 790 |
| | 790 |
| | 790 |
|
| Shareholders' equity | | 6,573 |
| | 6,070 |
| | 5,453 |
| | 5,033 |
| | 5,012 |
|
| Book value per share | | 40.14 |
| | 37.21 |
| | 33.48 |
| | 31.03 |
| | 30.79 |
|
| Shares outstanding | | 163.7 |
| | 163.1 |
| | 162.9 |
| | 162.2 |
| | 162.8 |
|
| Value creation ratio | | 12.6 | % | | 16.1 | % | | 12.6 | % | | 6.0 | % | | 11.1 | % |
| Consolidated Property Casualty Operations Data | | | | | | | | | | |
| Earned premiums | | $ | 4,045 |
| | $ | 3,713 |
| | $ | 3,344 |
| | $ | 3,029 |
| | $ | 2,924 |
|
| Unearned premiums | | 2,081 |
| | 1,970 |
| | 1,790 |
| | 1,631 |
| | 1,551 |
|
| Gross loss and loss expense reserves | | 4,438 |
| | 4,241 |
| | 4,169 |
| | 4,280 |
| | 4,137 |
|
| Investment income, net of expenses | | 358 |
| | 348 |
| | 351 |
| | 350 |
| | 348 |
|
| Loss and loss expense ratio | | 65.0 | % | | 61.9 | % | | 63.9 | % | | 77.0 | % | | 68.9 | % |
| Underwriting expense ratio | | 30.6 |
| | 31.9 |
| | 32.2 |
| | 32.3 |
| | 32.9 |
|
| Combined ratio | | 95.6 | % | | 93.8 | % | | 96.1 | % | | 109.3 | % | | 101.8 | % |
| | | | | | | | | | | |
On January 1, 2012, we retrospectively adopted ASU 2010-26,Accounting for Costs Associated with Acquiring or Renewing Insurance Contracts.All prior years’ information has been restated.Per share data adjusted
* Realized investment gains and losses are integral to
reflect all stock splitsour financial results over the long term, but our substantial discretion in the timing of investment sales may cause this value to fluctuate substantially. Also, applicable accounting standards require us to recognize gains and
dividends prior to December 31, 2012. | * | Realized investment gains and losses are integral to our financial results over the long term, but our substantial discretion in the timing of investment sales may cause this value to fluctuate substantially. Also, applicable accounting standards require us to recognize gains and losses from certain changes in fair values of securities and embedded derivatives without actual realization of those gains and losses. We discuss realized investment gains for the past three years in Item 7, Investments Results of Operations, Page 79. |
| Item 7. | Management's Discussion and Analysis of Financial Condition and Results of Operations |
losses from certain changes in fair values of securities and embedded derivatives without actual realization of those gains and losses. We discuss realized investment gains for the past three years in Item 7, Investments Results.
Cincinnati Financial Corporation - 2014 10-K - Page 44
ITEM 7. Management's Discussion and Analysis of Financial Condition and Results of Operations
The purpose of Management’s Discussion and Analysis is to provide an understanding of Cincinnati Financial Corporation’s consolidated results of operations and financial condition. Our Management’s Discussion and Analysis should be read in conjunction with Item 6, Selected Financial Data,
Page 37, and Item 8, Consolidated Financial Statements and related
Notes, beginning on Page 108.Notes. We present per share data on a diluted basis unless otherwise noted, adjusting those amounts for all stock splits and stock dividends.
We begin with an executive summary of our results of operations,
andfollowed by other highlights, an overview of our strategy, an outlook
followed byfor future performance and details on critical accounting estimates. In several instances, we refer to estimated industry data so that we can provide information on our performance within the context of the overall insurance industry. Unless otherwise noted, the industry data is prepared by A.M. Best Co., a leading insurance industry statistical, analytical and financial strength rating organization. Information from A.M. Best is presented on a statutory accounting basis. When we provide our results on a comparable statutory accounting basis, we label it as such; all other company data is presented in accordance with accounting principles generally accepted in the United States of America (GAAP).
Executive Summary
Through The Cincinnati Insurance Company, Cincinnati Financial Corporation is one of the 25 largest property casualty insurers in the nation, based on
2012 directnet written premium volume for
the first nine months of 2014, among approximately 2,000 U.S. stock and mutual insurer groups. We market our insurance products through a select group of independent insurance agencies in 39 states as discussed in Item 1, Our Business and Our
Strategy, Page 3.Recent years have been challenging for theStrategy.
The U.S. economy, the insurance industry and our
company.company continue to face many challenges. Our long-term perspective has allowed us to address
the immediate challenges
of such times while also focusing on the major decisions that best position the company for success through all market cycles. We believe that this forward-looking view
has consistently
benefitedbenefits our shareholders, agents, policyholders and associates.
To measure our progress, we have defined a measure of value creation that we believe captures the contribution of our insurance operations, the success of our investment strategy and the importance we place on paying cash dividends to shareholders. We refer to this measure as our value creation ratio, or VCR, and it is made up of two primary components: (1) our rate of growth in book value per share plus (2) the ratio of dividends declared per share to beginning book value per share. This measure, intended to be all-inclusive regarding changes in book value per share, uses originally reported book value per share in cases where book value per share has been adjusted, such as after the adoption of Accounting Standards Updates with a cumulative effect of a change in accounting.
Executive Summary
Our value creation ratio, defined above, is our primary performance target. VCR trends are shown in the table below.
| | | One | | | Three-year | | | Five-year | |
| | | year | | | % average | | | % average | |
| Value creation ratio | | | | | | | | | | | | |
| as of December 31, 2012 | | | 12.6 | % | | | 9.9 | % | | | 5.2 | % |
| as of December 31, 2011 | | | 6.0 | | | | 12.3 | | | | 1.5 | |
| as of December 31, 2010 | | | 11.1 | | | | 2.4 | | | | 3.7 | |
|
| | | | | | | | | |
| | | One year | | Three-year % average | | Five-year % average |
| Value creation ratio: | | |
| | |
| | |
|
| As of December 31, 2014 | | 12.6 | % | | 13.8 | % | | 11.7 | % |
| As of December 31, 2013 | | 16.1 |
| | 11.6 |
| | 13.1 |
|
| As of December 31, 2012 | | 12.6 |
| | 9.9 |
| | 5.2 |
|
| | | | | | | |
For the period 2013 through 2017, we are targeting an annual value creation ratio averaging 10 percent to 13 percent is our primary performance target.percent. We were within that range for 2014, and for the five-year period that ended in 2014. For the period 2009 through 2012, our annual value creation ratio averaged 12.4 percent, within the 12 percent to 15 percent five-year target range established in early 2009, soon after the U.S. credit crisis. SinceFor several years following the credit crisis, interest rates have generally declined and credit spreads have tightened, increasing the VCR contribution fromof valuation gains from our fixed-maturity securities. As indicated insecurities to the table below, thoseVCR. Those gains contributed between 2 percent and 3 percent annually to VCR in the past three years. Thatduring 2010 through 2012. While that contribution is not expected to occur in the next
Cincinnati Financial Corporation - 2014 10-K - Page 45
subsequent five-year period,
butas indicated by a significant negative effect in 2013, management believes the company will
continue to produce strong underwriting results.
| (Dollars are per share) | | Years ended December 31, | |
| | | 2012 | | | 2011 | | | 2010 | |
| Book value change per share | | | | | | | | | | | | |
| End of year book value | | $ | 33.48 | | | $ | 31.03 | | | $ | 30.79 | |
| Less beginning of year book value | | | 31.03 | | | | 30.79 | | | | 29.14 | |
| Change in book value | | $ | 2.45 | | | $ | 0.24 | | | $ | 1.65 | |
| | | | | | | | | | | | | |
| Change in book value per share | | | | | | | | | | | | |
| Net income before net realized gains | | $ | 2.41 | | | $ | 0.74 | | | $ | 1.67 | |
| Change in net realized and unrealized gains, fixed-maturity securities | | | 0.84 | | | | 0.83 | | | | 0.65 | |
| Change in net realized and unrealized gains, equity securities | | | 0.86 | | | | 0.39 | | | | 0.84 | |
| Dividend declared to shareholders | | | (1.62 | ) | | | (1.61 | ) | | | (1.59 | ) |
| Other | | | (0.04 | ) | | | (0.11 | ) | | | 0.08 | |
| Total change in book value per share | | $ | 2.45 | | | $ | 0.24 | | | $ | 1.65 | |
The next two tables show the primary components of our value creation ratio, first on a percentage basis and then on a per-outstanding-share basis. Analysis of the components aids understanding of our financial performance. Our financial results are further analyzed in the Corporate Financial Highlights section below.
|
| | | | | | | | | |
| | | Years ended December 31, |
| | | 2014 | | 2013 | | 2012 |
| Value creation ratio major components: | | | | | | |
| Net income before net realized gains | | 7.2 | % | | 8.5 | % | | 7.7 | % |
| Change in realized and unrealized gains, fixed-maturity securities | | 1.2 |
| | (4.5 | ) | | 2.7 |
|
| Change in realized and unrealized gains, equity securities | | 4.3 |
| | 10.9 |
| | 2.8 |
|
| Other | | (0.1 | ) | | 1.2 |
| | (0.6 | ) |
| Value creation ratio | | 12.6 | % | | 16.1 | % | | 12.6 | % |
| | | | | | | |
The 2014 value creation ratio included operating results as its primary contributor, with higher valuation for our equity securities investment portfolio also contributing significantly. A higher valuation for our fixed-maturity securities investment portfolio also contributed, reversing the unfavorable 2013 effect that reflected lower valuation. The 2014 contribution from operating results was 1.3 percentage points lower than in 2013, while the contribution from realized gains plus the change in unrealized gains from our investment portfolios was 0.9 points lower. The 2013 VCR also benefited from other items that affected book value per share, primarily a contribution from updated valuations and related assumptions for our employee benefit pension plan, while the 2014 effect was minimal. The 2012 value creation ratio had contribution amounts fairly similar to 2014.
|
| | | | | | | | | | | | |
| (Dollars are per share) | | Years ended December 31, |
| | | 2014 | | 2013 | | 2012 |
| Book value change per share: | | | | | | |
| End of period book value | | $ | 40.14 |
| | $ | 37.21 |
| | $ | 33.48 |
|
| Less beginning of period book value | | 37.21 |
| | 33.48 |
| | 31.03 |
|
| Change in book value | | $ | 2.93 |
| | $ | 3.73 |
| | $ | 2.45 |
|
| | | | | | | |
| Change in book value: | | |
| | |
| | |
|
| Net income before realized gains | | $ | 2.69 |
| | $ | 2.84 |
| | $ | 2.41 |
|
| Change in realized and unrealized gains, fixed-maturity securities | | 0.43 |
| | (1.50 | ) | | 0.84 |
|
| Change in realized and unrealized gains, equity securities | | 1.61 |
| | 3.64 |
| | 0.86 |
|
| Dividend declared to shareholders | | (1.76 | ) | | (1.66 | ) | | (1.62 | ) |
| Other | | (0.04 | ) | | 0.41 |
| | (0.04 | ) |
| Change in book value | | $ | 2.93 |
| | $ | 3.73 |
| | $ | 2.45 |
|
| | | | | | | |
We believe
thisour value creation ratio, a non-GAAP measure, is a useful supplement to GAAP information. With the continuation of economic and market uncertainty in recent years, the long-term nature of this measure provides a meaningful measure of our long-term progress in creating shareholder value. A reconciliation of this non-GAAP measure to comparable GAAP measures is shown in the table below.
| (Dollars are per share) | | Years ended December 31, | |
| | | 2012 | | | 2011 | | | 2010 | |
| Book value change per share | | | | | | | | | | | | |
| Book value as originally reported December 31, 2011 | | | | | | $ | 31.16 | | | | | |
| Cumulative effect of a change in accounting for deferred policy acquisition costs, net of tax | | | | | | | (0.13 | ) | | | | |
| Book value as adjusted December 31, 2011 | | | | | | $ | 31.03 | | | | | |
| | | | | | | | | | | | | |
| Value creation ratio | | | | | | | | | | | | |
| End of year book value - as originally reported | | $ | 33.48 | | | $ | 31.16 | | | $ | 30.91 | |
| Less beginning of year book value - as originally reported | | | 31.16 | | | | 30.91 | | | | 29.25 | |
| Change in book value - as originally reported | | $ | 2.32 | | | $ | 0.25 | | | $ | 1.66 | |
| Dividend declared to shareholders | | | 1.62 | | | | 1.605 | | | | 1.59 | |
| Total contribution to value creation ratio | | $ | 3.94 | | | $ | 1.855 | | | $ | 3.25 | |
| | | | | | | | | | | | | |
| Contribution to value creation ratio from change in book value* | | | 7.4 | % | | | 0.8 | % | | | 5.7 | % |
| Contribution to value creation ratio from dividends declared to shareholders** | | | 5.2 | | | | 5.2 | | | | 5.4 | |
| Value creation ratio | | | 12.6 | % | | | 6.0 | % | | | 11.1 | % |
Cincinnati Financial Corporation - 2014 10-K - Page 46
|
| | | | | | | | | | | | |
| (Dollars are per share) | | Years ended December 31, |
| | | 2014 | | 2013 | | 2012 |
| Value creation ratio: | | |
| | |
| | |
|
| End of year book value | | $ | 40.14 |
| | $ | 37.21 |
| | $ | 33.48 |
|
| Less beginning of year book value | | 37.21 |
| | 33.48 |
| | 31.16 |
|
| Change in book value | | 2.93 |
| | 3.73 |
| | 2.32 |
|
| Dividend declared to shareholders | | 1.76 |
| | 1.655 |
| | 1.62 |
|
| Total value creation ratio | | $ | 4.69 |
| | $ | 5.385 |
| | $ | 3.94 |
|
| | | | | | | |
| Value creation ratio from change in book value* | | 7.9 | % | | 11.1 | % | | 7.4 | % |
| Value creation ratio from dividends declared to shareholders** | | 4.7 |
| | 5.0 |
| | 5.2 |
|
| Value creation ratio | | 12.6 | % | | 16.1 | % | | 12.6 | % |
| | | | | | | |
* Change in book value divided by the beginning of year book value as originally reported ** Dividend declared to shareholders divided by beginning of year book value as originally reported
In 2012, our value creation ratio of 12.6 percent was within the range of our performance objective. It improved significantly from 2011, as discussed in Corporate Financial Highlights below.
When looking at our longer-term objectives, we see three
primary performance
drivers:drivers for our value creation ratio: Premium growth – We believe over any five-year period our agency relationships and initiatives can lead to a property casualty written premium growth rate that exceeds the industry average. The compound annual growth rate of our net written premiums was 7.3 percent over the five-year period 2010 through 2014, approximately double the 3.4 percent estimated growth rate for the property casualty insurance industry. The industry’s growth rate excludes its mortgage and financial guaranty lines of business. Our long-term target for profitable premium growth, established in late 2011 for our property casualty and life insurance segments in aggregate, is to reach $5 billion of annual direct written premiums by the end of 2015. In 2014, our direct written premiums totaled $4.577 billion.
Combined ratio – We believe our underwriting philosophy and initiatives can drive performance to achieve our underwriting profitability target of a GAAP combined ratio over any five-year period that consistently averages within the range of 95 percent to 100 percent. Our GAAP combined ratio averaged 99.3 percent over the five-year period 2010 through 2014. Performance as measured by the combined ratio is discussed in Consolidated Property Casualty Insurance Results. Our statutory combined ratio averaged 98.8 percent over the five-year period 2010 through 2014 compared with an estimated 100.7 percent for the property casualty industry. The industry’s ratio again excludes its mortgage and financial guaranty lines of business.
Investment contribution – We believe our investment philosophy and initiatives can drive investment income growth and lead to a total return on our equity investment portfolio over a five-year period that exceeds the five-year total return of the Standard & Poor’s 500 Index.
| · | Premium growth – We believe over any five-year period our agency relationships and initiatives can lead to a property casualty written premium growth rate that exceeds the industry average. Our long-term target for profitable premium growth, for our property casualty and life insurance segments in aggregate, is to reach $5 billion of annual direct written premiums by the end of 2015. In 2012, our direct written premiums totaled $3.909 billion. The compound annual growth rate of our net written premiums was 2.2 percent over the five-year period 2008 through 2012, higher than the 0.7 percent estimated growth rate for the property casualty insurance industry. The industry’s growth rate excludes its mortgage and financial guaranty lines of business. |
| · | Combined ratio – We believe our underwriting philosophy and initiatives can drive performance to achieve our underwriting profitability target of a GAAP combined ratio over any five-year period that is consistently within the range of 95 percent to 100 percent. Our GAAP combined ratio has averaged 102.4 percent over the five-year period 2008 through 2012. Our combined ratio was below 100 percent in 2012, but above 100 percent for 2008 through 2011, when our average catastrophe loss ratio of 7.7 percentage points was 4.0 points higher than the average for the 10-year period prior to 2008. Performance as measured by the combined ratio is discussed in Consolidated Property Casualty Insurance Results of Operations, Page 52. Our statutory combined ratio averaged 102.2 percent over the five-year period 2008 through 2012 compared with an estimated 102.9 percent for the property casualty industry. The industry’s ratio again excludes its mortgage and financial guaranty lines of business. |
| · | Investment contribution – We believe our investment philosophy and initiatives can drive investment income growth and lead to a total return on our equity investment portfolio over a five-year period that exceeds the five-year return of the Standard & Poor’s 500 Index. |
| o◦ | Investment income growth, on a before-taxpretax basis, had a compound annual growth rate of 2.01.8 percent over the three-yearfive-year period 2010 through 2012.2014. It has grown every year since 2009, when we experienced a dramatic reduction in dividend payouts by financial services companies held in our equity portfolio.except for 2013 with its slight decrease of less than 1 percent. |
| o |
| ◦ | Over the five years ended December 31, 2012,2014, our equity portfolio compound annual equity portfoliototal return was 0.814.1 percent compared with a compound annual total return of 1.715.4 percent for the Index. OurBy design, our equity portfolio underperformedis comprised of larger capitalization, high-quality dividend-growing stocks. Therefore we would generally expect its return to lag during the market for the five-year period primarily becausetype of the 2008 decline in the market value of our previously large holdings in the financial services sector.extended, lower-quality rally that has occurred since early 2009. For the year 2012,2014, our annual equity portfolio total return was 10.912.3 percent, compared with 16.013.7 percent for the Index, as the large-cap, dividend paying stocks that we prefer were outperformed by the broader equity market.Index. |
The board of directors is committed to rewarding shareholders directly through cash dividends and through authorizing share repurchases.repurchase authorizations. The board also has periodically declared stock dividends and splits. Through 2012,2014, the company has increased the indicated annual cash dividend rate for 5254 consecutive years, a record we believe is matched by only nine other publicly traded companies. The board regularly evaluates relevant factors in dividend-related decisions, and the 2014 increase reflects confidence in our strong capital, liquidity and financial flexibility, as well as progress through our initiatives to improve earnings performance.performance while growing insurance premium revenues. We discuss our financial position in more detail in Liquidity and Capital Resources,Resources.
Cincinnati Financial Corporation - 2014 10-K - Page
83.Strategic Initiatives Highlights
Management has worked to identify a strategy that can lead to long-term success, with concurrence by the board of directors. Our strategy is intended to position us to compete successfully in the markets we have targeted while appropriately managing risk. We discuss our long-term, proven strategy in Item 1, Our Business and Our Strategy, Page 3. We believe successful implementation of initiatives that support our strategy will help us better serve our agent customers and reduce volatility in our financial results while we also grow earnings and book value over the long-term, successfully navigating challenging economic, market or industry pricing cycles.
| · | Improve insurance profitability – Implementation of these initiatives is intended to enhance underwriting expertise and knowledge, thereby increasing our ability to manage our business while also gaining efficiency. Additional information and more focused action on underperforming product lines, plus expanding pricing capabilities through the use of technology and analytics, can lead to better profit margins. Improved internal processes with additional performance metrics can help us be more efficient and effective. These initiatives also support the ability of the independent agencies that represent us to grow profitably by allowing them to serve clients faster and to more efficiently manage agency expenses. |
| · | Drive premium growth – Implementation of these initiatives is intended to further penetrate each market we serve through our independent agency network. Strategies aimed at specific market opportunities, along with service enhancements, can help our agents grow and increase our share of their business. Diversified growth also may reduce variability of losses from weather-related catastrophes. |
We discuss these strategic initiatives, along with related metrics to assess progress, in Item 1, Strategic Initiatives, Page 10. Below is a review of highlights of our financial results for the past three years. Detailed discussion of these topics appears in Results of Operations, Page 51, and Liquidity and Capital Resources, Page 83.
47
Corporate Financial Highlights
The
In addition to the value creation ratio
discusseddiscussion and analysis in the Executive Summary,
Page38, included contributions from the major components shownwe further analyze our financial results in the
tablesections below.
| | | Years ended December 31, | |
| | | 2012 | | | 2011 | | | 2010 | |
| Value creation ratio major components | | | | | | | | | |
| Net income before net realized gains | | | 7.7 | % | | | 2.4 | % | | | 5.7 | % |
| Change in realized and unrealized gains, fixed-maturity securities | | | 2.7 | | | | 2.7 | | | | 2.2 | |
| Change in realized and unrealized gains, equity securities | | | 2.8 | | | | 1.3 | | | | 2.9 | |
| Other | | | (0.6 | ) | | | (0.4 | ) | | | 0.3 | |
| Value creation ratio | | | 12.6 | % | | | 6.0 | % | | | 11.1 | % |
The 2012 value creation ratio benefited from improved operating results as well as a strong contribution from generally higher valuations in securities markets. The contribution from operating results rose 5.3 percentage points in 2012, compared with 2011, while the contribution from realized gains plus the change in unrealized gains from our investment portfolios rose 1.5 points. The 2011 value creation ratio was depressed primarily due to unusually high catastrophe losses that lowered the ratio by 3.3 percentage points compared with 2010, and also drove a 56 percent decline in net income. Higher valuations for our investment portfolio in recent years benefited the value creation ratio in addition to earnings.
Balance Sheet Data
| (Dollars in millions except share data) | | At December 31, | | | At December 31, | |
| | | 2012 | | | 2011 | |
| Balance sheet data | | | | | | | | |
| Total investments | | $ | 12,534 | | | $ | 11,801 | |
| Total assets | | | 16,548 | | | | 15,635 | |
| Short-term debt | | | 104 | | | | 104 | |
| Long-term debt | | | 790 | | | | 790 | |
| Shareholders' equity | | | 5,453 | | | | 5,033 | |
| Book value per share | | | 33.48 | | | | 31.03 | |
| Debt-to-total-capital ratio | | | 14.1 | % | | | 15.1 | % |
Invested assets
|
| | | | | | | | |
| (Dollars in millions except share data) | | At December 31, | | At December 31, |
| | | 2014 | | 2013 |
| Balance sheet data: | | |
| | |
|
| Total investments | | $ | 14,386 |
| | $ | 13,564 |
|
| Total assets | | 18,753 |
| | 17,662 |
|
| Short-term debt | | 49 |
| | 104 |
|
| Long-term debt | | 791 |
| | 790 |
|
| Shareholders' equity | | 6,573 |
| | 6,070 |
|
| Book value per share | | 40.14 |
| | 37.21 |
|
| Debt-to-total-capital ratio | | 11.3 | % | | 12.8 | % |
| | | | | |
Total investments grew 6 percent during
20122014 on a fair value basis, with market gains
outpacing anthat added to the 4 percent increase in the cost
basis of invested assets of approximately 3 percent.basis. Entering
2013,2015, we believe the portfolio continues to be well diversified and
it is well positioned to withstand short-term fluctuations. We discuss our investment strategy in Item 1, Investments Segment,
Page 20, and results for the segment in
Investment Results of Operations, Page 79.Investments Results. Total assets rose 6 percent, primarily due to the increase in
invested assets.total investments. Shareholders’ equity and book value per share each rose 8 percent, for reasons discussed in the preceding Executive Summary.
The amount of our debt obligations
did not changedecreased by $54 million in
2012.2014, compared with 2013. Our ratio of debt to total capital (debt plus shareholders’ equity) decreased by
11.5 percentage
pointpoints in
20122014 and remains comfortably within our target range.
Income Statement and Per Share Data
| (Dollars in millions except share data in thousands) | | Twelve months ended December 31, | | | 2012-2011 | | | 2011-2010 | |
| | | 2012 | | | 2011 | | | 2010 | | | Change % | | | Change % | |
| Income statement data | | | | | | | | | | | | | | | | | | | | |
| Earned premiums | | $ | 3,522 | | | $ | 3,194 | | | $ | 3,082 | | | | 10 | | | | 4 | |
| Investment income, net of expenses (pretax) | | | 531 | | | | 525 | | | | 518 | | | | 1 | | | | 1 | |
| Realized investment gains and losses (pretax) | | | 42 | | | | 70 | | | | 159 | | | | (40 | ) | | | (56 | ) |
| Total revenues | | | 4,111 | | | | 3,803 | | | | 3,772 | | | | 8 | | | | 1 | |
| Net income | | | 421 | | | | 164 | | | | 375 | | | | 157 | | | | (56 | ) |
| Per share data | | | | | | | | | | | | | | | | | | | | |
| Net income - diluted | | $ | 2.57 | | | $ | 1.01 | | | $ | 2.30 | | | | 154 | | | | (56 | ) |
| Cash dividends declared | | | 1.62 | | | | 1.605 | | | | 1.59 | | | | 1 | | | | 1 | |
| | | | | | | | | | | | | | | | | | | | | |
| Weighted average shares outstanding | | | 163,661 | | | | 163,259 | | | | 163,274 | | | | 0 | | | | 0 | |
|
| | | | | | | | | | | | | | | | | | |
| (Dollars in millions except per share data) | | Years ended December 31, | | 2014-2013 | | 2013-2012 |
| | | 2014 | | 2013 | | 2012 | | Change % | | Change % |
| Net income and comprehensive income data: | | |
| | |
| | |
| | |
|
| Earned premiums | | $ | 4,243 |
| | $ | 3,902 |
| | $ | 3,522 |
| | 9 |
| | 11 |
|
| Investment income, net of expenses (pretax) | | 549 |
| | 529 |
| | 531 |
| | 4 |
| | 0 |
|
| Realized investment gains, net (pretax) | | 133 |
| | 83 |
| | 42 |
| | 60 |
| | 98 |
|
| Total revenues | | 4,945 |
| | 4,531 |
| | 4,111 |
| | 9 |
| | 10 |
|
| Net income | | 525 |
| | 517 |
| | 421 |
| | 2 |
| | 23 |
|
| Comprehensive income | | 765 |
| | 892 |
| | 649 |
| | (14 | ) | | 37 |
|
| Net income - diluted | | $ | 3.18 |
| | $ | 3.12 |
| | $ | 2.57 |
| | 2 |
| | 21 |
|
| Cash dividends declared | | 1.76 |
| | 1.655 |
| | 1.62 |
| | 6 |
| | 2 |
|
| Diluted weighted average shares outstanding | | 165.1 |
| | 165.4 |
| | 163.7 |
| | 0 |
| | 1 |
|
| | | | | | | | | | | |
Net income in 20122014 rose $257$8 million or 1572 percent compared with 2011,2013, due primarily to the after-tax effects of property casualty underwriting results that improved by $270 million, including $44 million from lower natural catastrophe losses, and net realized investment gains that were $17$31 million lower. higher and investment income that rose by $18 million. Property casualty underwriting results for 2014, on an after-tax basis, were $31 million lower than in 2013, including $21 million from higher natural catastrophe losses and $34 million from higher noncatastrophe weather losses described below in Consolidated Property Casualty Insurance Results.
Net income
decreased $211increased $96 million in
2011,2013, compared with
2010,2012, reflecting the after-tax net effect of two major contributing items: a
$149$62 million
declineimprovement in property casualty underwriting results, including
$165$105 million from
higherlower catastrophe losses, and a
$58$26 million
declineincrease in net realized investment gains.
Cincinnati Financial Corporation - 2014 10-K - Page 48
As discussed in
InvestmentInvestments Results,
of Operations, Page 79, sales of securities that had appreciated in value led to realized investment gains in all three years. Realized and unrealized investment gains and losses are integral to our financial results over the long term. We have substantial discretion in the timing of investment sales and, therefore, the gains or losses that are recognized in any period. That discretion
generally is independent of the insurance underwriting process. Also, applicable accounting standards require us to recognize gains and losses from certain changes
Dividend income rose 13 percent in
fair values of securities and for securities with embedded derivatives without actual realization of those gains and losses.Higher dividend2014 while interest income was largely responsible forrose 1 percent, growthdriving a net increase in both 2012 and 2011 pretax investment income.income of $20 million, or 4 percent. In addition to a larger common stock portfolio generating more dividend income in 2012, both 20122014 and 20112013, both years also benefited from higher average dividend payment rates.
Our investment operation’s performance is discussed further in Investments Results.
Contribution from Insurance Operations
| (Dollars in millions) | | Years ended December 31, | | | 2012-2011 | | | 2011-2010 | |
| Consolidated property casualty highlights | | 2012 | | | 2011 | | | 2010 | | | Change % | | | Change % | |
| Net written premiums | | $ | 3,482 | | | $ | 3,098 | | | $ | 2,963 | | | | 12 | | | | 5 | |
| Earned premiums | | | 3,344 | | | | 3,029 | | | | 2,924 | | | | 10 | | | | 4 | |
| Underwriting gain (loss) | | | 137 | | | | (278 | ) | | | (49 | ) | | | nm | | | | nm | |
| | | | | | | | | | | | | | | | | | | | | |
| | | | | | | | | | | | | | | Pt. Change | | | Pt. Change | |
| GAAP combined ratio | | | 96.1 | % | | | 109.3 | % | | | 101.8 | % | | | (13.2 | ) | | | 7.5 | |
| Statutory combined ratio | | | 95.4 | | | | 108.9 | | | | 101.8 | | | | (13.5 | ) | | | 7.1 | |
| Written premium to statutory surplus | | | 0.9 | | | | 0.8 | | | | 0.8 | | | | 0.1 | | | | 0.0 | |
|
| | | | | | | | | | | | | | | | | | |
| (Dollars in millions) | | Years ended December 31, | | 2014-2013 | | 2013-2012 |
| | | 2014 | | 2013 | | 2012 | | Change % | | Change % |
| Consolidated property casualty data: | | | | | | | | | | |
| Net written premiums | | $ | 4,143 |
| | $ | 3,893 |
| | $ | 3,482 |
| | 6 |
| | 12 |
|
| Earned premiums | | 4,045 |
| | 3,713 |
| | 3,344 |
| | 9 |
| | 11 |
|
| Underwriting profit | | 186 |
| | 233 |
| | 137 |
| | (20 | ) | | 70 |
|
| | | | | | | | | | | |
| | | |
| | |
| | |
| | Pt. Change | | Pt. Change |
| GAAP combined ratio | | 95.6 | % | | 93.8 | % | | 96.1 | % | | 1.8 |
| | (2.3 | ) |
| Statutory combined ratio | | 95.1 |
| | 92.8 |
| | 95.4 |
| | 2.3 |
| | (2.6 | ) |
| Written premium to statutory surplus | | 0.9 |
| | 0.9 |
| | 0.9 |
| | 0.0 |
| | 0.0 |
|
| | | | | | | | | | | |
Property casualty net written premiums grew
126 percent in
20122014 and earned premiums grew
109 percent, largely due to higher pricing and premium growth initiatives.
That growth lagged the trend experienced in 2013, largely due to pricing increases that were not as strong in 2014. Trends and related factors are discussed in Commercial Lines, Personal Lines and Excess and Surplus Lines Insurance Results,
of Operations, beginning on Page 57, Page 68 and Page 74, respectively.
Our property casualty insurance operations generated
an underwriting
gainprofits for each of the three years ending in
2012 after reporting an2014, following underwriting
loss inlosses for each of the preceding four years. The
$415$47 million decrease in 2014, compared with 2013, included a $32 million increase in losses from natural catastrophe events and $52 million increase in weather-related losses. The $96 million improvement for
2012,2013, compared with
2011,2012, included a
$68$162 million decrease in losses from natural catastrophe events.
A 10 percent rise in 2012 earned premiums drove most of the improvement as noncatastrophe losses and underwriting expenses in total for 2012 were within 1 percent of 2011. The $229 million change in underwriting loss for 2011, compared with 2010, was driven by a $254 million rise in losses from natural catastrophe events.We measure property casualty underwriting profitability primarily by the combined ratio. Our combined ratio measures the percentage of each earned premium dollar spent on claims plus all expenses related to our property casualty
operations.operations, all on a pretax basis. A lower ratio indicates more favorable results and better underlying performance.
Our combinedA ratio
improved to underbelow 100 percent
in 2012 but was over 100 percent in each of the prior three years.represents an underwriting profit. Initiatives to improve our combined ratio are discussed in Item 1,
Our Business and Our Strategy, Strategic
Initiatives, Page 10.Initiatives. In
2012, 20112014, 2013 and
2010,2012, favorable development on reserves for claims that occurred in prior accident years helped offset
remainingother incurred
losslosses and loss expenses. Reserve development is discussed further in Property Casualty Loss and Loss Expense Obligations and
Reserves, beginning on Page 88.Reserves. Losses from weather-related catastrophes are another important item influencing the combined ratio and are discussed along with other factors in
Commercial Lines, Personal LinesFinancial Results for our property casualty business and
Excess and Surplus Lines Insurance Results of Operations, beginning on Page 57, Page 68 and Page 74, respectively.related segments.
Our life insurance segment reported a
smallmodest loss
because mostin 2014 and a modest profit in 2013, netting to a $4 million profit for both years combined. We discuss results for the segment in Life Insurance Results. Most of
itsthis segment’s investment income is included in our investments segment results.
We discuss results for the segment in Life Insurance Results of Operations, Page 77. In addition to investment income, realized investment gains from the life insurance investment portfolio are also included in our investments segment results.
Cincinnati Financial Corporation - 2014 10-K - Page 49
Strategic Initiatives Overview
Management has worked to identify a strategy that can lead to long-term success, with concurrence by the board of directors. Our strategy is intended to position us to compete successfully in the markets we have targeted while appropriately managing risk. We discuss our long-term, proven strategy in Item 1, Our Business and Our Strategy. We believe successful implementation of initiatives that support our strategy will help us better serve our agent customers and reduce volatility in our financial results while we also grow earnings and book value over the long-term, successfully navigating challenging economic, market or industry pricing cycles.
Improve insurance profitability – Implementation of these initiatives is intended to enhance underwriting expertise and knowledge, thereby increasing our ability to manage our business while also gaining efficiency. Better profit margins can arise from additional information and more focused action on underperforming product lines, plus pricing capabilities we are expanding through the use of technology and analytics. Improved internal processes with additional performance metrics can help us be more efficient and effective. These initiatives also support the ability of the independent agencies that represent us to grow profitably by allowing them to serve clients faster and to more efficiently manage agency expenses.
Drive premium growth – Implementation of these initiatives is intended to further penetrate each market we serve through our independent agencies. Strategies aimed at specific market opportunities, along with service enhancements, can help our agents grow and increase our share of their business. Diversified growth also may reduce variability of losses from weather-related catastrophes.
We discuss these strategic initiatives, along with related metrics to assess progress, in Item 1, Our Business and Our Strategy, Strategic Initiatives. Detailed discussion of related financial results appears below in Financial Results and Liquidity and Capital Resources.
Factors Influencing Our Future Performance
Our view of the shareholder value we can create over the next five years relies largely on
twothree assumptions
about– each highly dependent on the external environment. First, we anticipate
continued firming ofour average commercial and personal insurance
pricing throughout 2013.prices will increase in excess of our loss cost trends. Second, we assume that the economy can maintain a growth track during
2013.2015. Third, we assume that valuations of our marketable securities will vary within a typical range, based on historical trends. If those assumptions prove to be inaccurate, we may not be able to achieve our performance targets even if we accomplish our strategic objectives.
Other factors that could influence our ability to achieve our targets include:
| · | We expect the insurance marketplace to remain competitive, which is likely to cause carriers to pursue strategies that they believe could lead to economies of scale, market share gains or the potential for an improved competitive posture. |
| · | We expect the independent insurance agency system to remain strong, with continued agency consolidation. If soft insurance market conditions return in 2013, it will create additional risk for agencies. |
| · | We expect initiatives that make it easier for agents to do business with us will continue to be a significant factor in agency relationships, with technology being a major driver. Policyholders will increasingly demand online services and access from agents or carriers. |
We expect the insurance marketplace to remain competitive, which is likely to cause carriers to pursue strategies that they believe could lead to economies of scale, market share gains or the potential for an improved competitive posture.
We expect the independent insurance agency system to remain strong, with continued agency consolidation. If soft insurance market conditions return in 2015, it will create additional risk for agencies.
We expect initiatives that make it easier for agents to do business with us to continue to be a significant factor in agency relationships. Technology is a major driver, with policyholders increasingly demanding online services and access from agents or carriers.
We discuss in our Item 1A, Risk Factors,
Page 26, many potential risks to our business and our ability to achieve our qualitative and quantitative objectives. These are real risks, but their probability of occurring may not be high. We also believe that our risk management programs generally could mitigate their
potential effects, in the event they would occur. We continue to study emerging risks, including climate change risk and its potential financial effects on our results of operation and on those we insure. These effects include deterioration in credit quality of our municipal or corporate bond portfolios and increased losses without sufficient corresponding increases in premiums. As with any risk, we seek to identify the extent of the risk exposure and possible actions to mitigate potential negative effects of risk, at an enterprise level.
We have formal risk management programs overseen by an executive officer and supported by a team of representatives from business areas. The team provides reports to our chairman, our president and chief executive officer and our board of directors, as appropriate, on risk assessments, risk metrics and risk plans. Our use of operational audits, strategic plans and departmental business plans, as well as our culture of open communications and our fundamental respect for our Code of Conduct, continue to help us manage risks on an ongoing basis.
For the year
2013,2015, we believe our value creation ratio
maycould be below our long-term target for several reasons.
| · | The rally in financial markets during recent years had a favorable impact on our value creation ratio, offsetting the unfavorable impact of the sharp decline in financial markets during 2008. Financial markets continued to display volatility during 2012, and some predict more turbulence in 2013 from effects of events such as the sovereign debt crisis in several European countries or other geopolitical events that could also affect the U.S. economy and markets. Should financial markets decline during 2013, which could occur as part of typical market volatility patterns, the related component of our 2013 value creation ratio could also register a weak or negative result. |
| · | A return of soft insurance market pricing in recent years could significantly affect growth rates and earned premium levels into 2013 and for some time into the future, depending on insurance market conditions. After several years of market conditions that weakened loss ratios and hampered near-term profitability, conditions affecting property casualty markets improved in 2012. In the future, economic factors, including inflation, may increase our claims and settlement expenses related to medical care, litigation and construction. |
| · | The slowly recovering economy helped increase the value of business and personal insurable assets owned by policyholders in 2012. If the economy falters, we may experience low or no premium growth for the property casualty industry. Property casualty written premium growth also may lag as some of our growth initiatives require more time to reach their full contribution. |
| · | We will incur the cost of continued investment in our business, including technology, recent entry in new states and process initiatives to create long-term value. In addition, we will not see the full advantage of some of these investments for several years. |
The rally in financial markets during recent years had a favorable impact on our value creation ratio, offsetting the unfavorable impact of the sharp decline in financial markets during 2008. Financial markets continued to display volatility during 2014, and some predict more turbulence in 2015 from effects such as changes in government policy, growth challenges for emerging country economies or other geopolitical events that could also affect the U.S. economy and markets. Should financial markets decline during 2015, which could occur as part of typical market volatility patterns, the related book value component of our 2015 value creation ratio could also register a weak or negative result.
Cincinnati Financial Corporation - 2014 10-K - Page 50
A return of soft insurance market pricing could significantly affect growth rates and earned premium levels into 2015 and for some time into the future, depending on insurance market conditions. After several years of market conditions that weakened loss ratios and hampered near-term profitability, conditions affecting property casualty insurance markets have improved since late 2011. In the future, economic factors, including inflation, may increase our claims and settlement expenses related to medical care, litigation and construction.
The slowly recovering economy continued to help increase the value of business and personal insurable assets owned by policyholders in 2014. If the economy falters, we may experience low or no premium growth for the property casualty industry. Property casualty written premium growth also may lag as some of our growth initiatives require more time to reach their full contribution.
We will incur costs for continued investment in our business, including technology, geographic expansion and process initiatives to create long-term value. In addition, we will not see the full advantage of some of these investments for several years.
Critical Accounting Estimates
Cincinnati Financial Corporation’s financial statements are prepared using
U.S. GAAP. These principles require management to make estimates and assumptions that affect the amounts reported in the Consolidated Financial Statements and accompanying Notes. Actual results could differ materially from those estimates.
The significant accounting policies used in the preparation of the financial statements are discussed in Item 8, Note 1 of the Consolidated Financial
Statements, Page 112.Statements. In conjunction with that discussion, material implications of uncertainties associated with the methods, assumptions and estimates underlying the company’s critical accounting policies are discussed below. The audit committee of the board of directors reviews the annual financial statements with management and the independent registered public accounting firm. These discussions cover the quality of earnings, review of reserves and accruals, reconsideration of the suitability of accounting principles, review of highly judgmental areas including critical accounting
policies,estimates, audit adjustments and such other inquiries as may be appropriate.
Property Casualty Insurance Loss and Loss Expense Reserves
We establish loss and loss expense reserves for our property casualty insurance business as balance sheet liabilities. These reserves account for unpaid loss and loss expenses as of a financial statement date. Unpaid loss and loss expenses are the estimated amounts necessary to pay for and settle all outstanding insured claims, including incurred but not reported (IBNR) claims, as of that date.
For some lines of business that we write, a considerable and uncertain amount of time can elapse between the occurrence, reporting and payment of insured claims. The amount we will actually have to pay for such claims also can be highly uncertain. This uncertainty, together with the size of our reserves, makes the loss and loss expense reserves our most significant estimate. Gross loss and loss expense reserves were
$4.169$4.438 billion at year-end
20122014 compared with
$4.280$4.241 billion at year-end
2011.2013.
How Reserves Are Established
Our field claims representatives establish case reserves when claims are reported to the company to provide for our unpaid loss and loss expense obligation associated with individual claims. Field claims
managers supervise and review all claims with case reserves less than $35,000. Experienced$100,000. Additionally, a headquarters supervisor and regional manager review all claims supervisors review individualunder $100,000 if litigation or a certain specialty claim is involved. All claims with case reserves of $100,000 or greater thanare reviewed and approved by an experienced headquarters supervisor and regional claims manager, and that threshold amount was $35,000 that were established by field claims representatives. Headquartersfor several years prior to 2015. Upper-level headquarters claims managers also review case reserves greater than $100,000.
of $175,000 or more, a threshold amount that was $100,000 for several years prior to 2015.
Cincinnati Financial Corporation - 2014 10-K - Page 51
Our claims representatives base their case reserve estimates primarily upon case-by-case evaluations that consider:
| · | circumstances surrounding each claim |
| · | policy provisions pertaining to each claim |
| · | potential for subrogation or salvage recoverable |
| · | general insurance reserving practices |
type of claim involved
circumstances surrounding each claim
policy provisions pertaining to each claim
potential for subrogation or salvage recoverable
general insurance reserving practices
Case reserves of all sizes are subject to review on a 90-day cycle, or more frequently if new information about a loss becomes available. As part of the review process, we monitor industry trends, cost trends, relevant court cases, legislative activity and other current events in an effort to ascertain new or additional loss exposures.
We also establish IBNR reserves to provide for all unpaid loss and loss expenses not accounted for by case reserves:
| · | For weather events designated as catastrophes, we calculate bulk reserves directly as a result of an estimated IBNR claim count and an estimated average claim amount for each event. Once case reserves are established for a weather event, we reduce the bulk reserves. Our claims department management coordinates the assessment of these events and prepares the related bulk reserve estimates. Such an assessment involves a comprehensive analysis of the nature of the event, of policyholder exposures within the affected geographic area and of available claims intelligence. Depending on the nature of the event, available claims intelligence could include surveys of field claims associates within the affected geographic area, feedback from a catastrophe claims team sent into the area, as well as data on claims reported as of the financial statement date. To determine whether an event is designated as a catastrophe, we generally use the catastrophe definition provided by Property Claims Service (PCS), a division of Insurance Services Office (ISO). PCS defines a catastrophe as an event that causes countrywide damage of $25 million or more in insured property losses and affects a significant number of policyholders and insureds. |
| · | For asbestos and environmental claims, we calculate IBNR reserves by deriving an actuarially-based estimate of total unpaid loss and loss expenses. We then reduce the estimate by total case reserves. We discuss the reserve analysis that applies to asbestos and environmental reserves in Asbestos and Environmental Reserves, Page 88. |
| · | For loss expenses that pertain primarily to salaries and other costs related to our claims department associates, also referred to as adjusting and other expense or AOE for statutory accounting, we calculate reserves based on an analysis of the relationship between paid losses and paid AOE. Reserves for AOE are allocated to company, line of business and accident year based on a claim count algorithm. |
| · | For all other claims and events, IBNR reserves are calculated as the difference between an actuarial estimate of the ultimate cost of total loss and loss expenses incurred reduced by the sum of total loss and loss expense payments and total case reserves estimated for individual claims. We discuss below the development of actuarially based estimates of the ultimate cost of total loss and loss expenses incurred. |
For events designated as natural catastrophes, we calculate bulk reserves directly as a result of an estimated IBNR claim count and an estimated average claim amount for each event. Once case reserves are established for a catastrophe event, we reduce the bulk reserves. Our claims department management coordinates the assessment of these events and prepares the related bulk reserve estimates. Such an assessment involves a comprehensive analysis of the nature of the event, of policyholder exposures within the affected geographic area and of available claims intelligence. Depending on the nature of the event, available claims intelligence could include surveys of field claims associates within the affected geographic area, feedback from a catastrophe claims team sent into the area, as well as data on claims reported as of the financial statement date. To determine whether an event is designated as a catastrophe, we generally use the catastrophe definition provided by Property Claims Service (PCS), a division of Insurance Services Office (ISO). PCS defines a catastrophe as an event that causes countrywide damage of $25 million or more in insured property losses and affects a significant number of policyholders and insureds.
For asbestos and environmental claims, we calculate IBNR reserves by deriving an actuarially-based estimate of total unpaid loss and loss expenses. We then reduce the estimate by total case reserves. We discuss the reserve analysis that applies to asbestos and environmental reserves in Liquidity and Capital Resources, Asbestos and Environmental Reserves.
For loss expenses that pertain primarily to salaries and other costs related to our claims department associates, also referred to as adjusting and other expense or AOE, we calculate reserves based on an analysis of the relationship between paid losses and paid AOE. Reserves for AOE are allocated to company, line of business and accident year based on a claim count algorithm.
For all other claims and events, IBNR reserves are calculated as the difference between an actuarial estimate of the ultimate cost of total loss and loss expenses incurred reduced by the sum of total loss and loss expense payments and total case reserves estimated for individual claims. We discuss below the development of actuarially based estimates of the ultimate cost of total loss and loss expenses incurred.
Our actuarial staff applies significant judgment in selecting models and estimating model parameters when preparing reserve analyses.
In addition, unpaidUnpaid loss and loss expenses are inherently uncertain as to timing and amount. Uncertainties relating to model appropriateness, parameter estimates and actual loss and loss expense amounts are referred to as model, parameter and process uncertainty, respectively. Our management and actuarial staff address these uncertainties in the reserving process in a variety of ways.
Our actuarial staff bases its IBNR reserve estimates for these losses primarily on the indications of methods and models that analyze accident year data. Accident year is the year in which an insured claim, loss or loss expense occurred. The specific methods and models that our actuaries have used for the past several years are:
| · | paid and reported loss development methods |
| · | paid and reported loss Bornhuetter-Ferguson methods |
| · | individual and multiple probabilistic trend family models |
paid and reported loss development methods
paid and reported loss Bornhuetter-Ferguson methods
individual and multiple probabilistic trend family models
Our actuarial staff uses diagnostics provided by stochastic reserving software to evaluate the appropriateness of the models and methods listed above. The software’s diagnostics have indicated that the appropriateness of these
Cincinnati Financial Corporation - 2014 10-K - Page 52
models and methods for estimating IBNR reserves for our lines of business tends
to depend on a line'sline’s tail. Tail refers to the time interval between a typical claim'sclaim’s occurrence and its settlement. For our long-tail lines such as workers’ compensation and commercial casualty, models from the probabilistic trend family tend to provide superior fits and to validate well compared with models underlying the loss development and Bornhuetter-Ferguson methods. The loss development and Bornhuetter-Ferguson methods, particularly the reported loss variations, tend to produce the more appropriate IBNR reserve estimates for our short-tail lines such as homeowner and commercial property. For our mid-tail lines such as personal and commercial auto liability, all models and methods provide useful insights.
Our actuarial staff also devotes significant time and effort to the estimation of model and method parameters. The loss development and Bornhuetter-Ferguson methods require the estimation of numerous loss development factors. The Bornhuetter-Ferguson methods also involve the estimation of numerous ultimate loss ratios by accident year. Models from the probabilistic trend family require the estimation of development trends, calendar year inflation trends and exposure levels. Consequently, our actuarial staff monitors a number of trends and measures to gain key business insights necessary for exercising appropriate judgment when estimating the parameters
mentioned.These trendsmentioned, such as:
company and
measures include: | · | company and industry pricing |
| · | company and industry exposure |
| · | company and industry loss frequency and severity |
| · | past large loss events such as hurricanes |
| · | company and industry premium |
| · | company in-force policy count |
industry pricing
company and industry exposure
company and industry loss frequency and severity
past large loss events such as hurricanes
company and industry premium
company in-force policy count
These trends and measures also support the estimation of ultimate accident year loss ratios needed for applying the Bornhuetter-Ferguson methods and for assessing the reasonability of all IBNR reserve estimates computed. Our actuarial staff reviews these trends and measures quarterly, updating parameters derived from them as necessary.
Quarterly, our actuarial staff summarizes their reserve analysis by preparing an actuarial best estimate and a range of reasonable IBNR reserves intended to reflect the uncertainty of the estimate. An inter-departmental committee that includes our actuarial management team reviews the results of each quarterly reserve analysis. The committee establishes management’s best estimate of IBNR reserves, which is the amount that is included in each period’s financial statements. In addition to the information provided by actuarial staff, the committee also considers factors such as:
large loss activity and trends in large losses
new business activity
judicial decisions
general economic trends such as
the following: | · | large loss activity and trends in large losses |
| · | general economic trends such as inflation |
| · | trends in litigiousness and legal expenses |
| · | product and underwriting changes |
| · | changes in claims practices |
inflation
trends in litigiousness and legal expenses
product and underwriting changes
changes in claims practices
The determination of
management'smanagement’s best estimate, like the preparation of the reserve analysis that supports it, involves considerable judgment. Changes in reserving data or the trends and factors that influence reserving data may signal fundamental shifts or may simply reflect single-period anomalies. Even if a change reflects a fundamental shift, the full extent of the change may not become evident until years later. Moreover, since our methods and models do not explicitly relate many of the factors we consider directly to reserve levels, we typically cannot quantify the precise impact of such factors on the adequacy of reserves prospectively or retrospectively.
Due to the uncertainties described above, our ultimate loss experience could prove better or worse than our carried reserves reflect. To the extent that reserves are inadequate and increased, the amount of the increase is a charge in the period that the deficiency is recognized, raising our loss and loss expense ratio and reducing earnings. To the extent that reserves are redundant and released, the amount of the release is a credit in the period that the redundancy is recognized, reducing our loss and loss expense ratio and increasing earnings.
Cincinnati Financial Corporation - 2014 10-K - Page 53
Key Assumptions
-– Loss Reserving
Our actuarial staff makes a number of key assumptions when using their methods and models to derive IBNR reserve estimates. Appropriate reliance on these key assumptions essentially entails determinations of the likelihood that statistically significant patterns in historical data may extend into the future. The four most significant of the key assumptions used by our actuarial staff and approved by management are:
| · | Emergence of loss and defense and cost containment expenses on an accident year basis. Historical paid loss, reported loss and paid defense and cost containment expense data for the business lines we analyze contain patterns that reflect how unpaid losses, unreported losses and unpaid defense and cost containment expenses as of a financial statement date will emerge in the future on an accident year basis. Unless our actuarial staff or management identifies reasons or factors that invalidate the extension of historical patterns into the future, these patterns can be used to make projections necessary for estimating IBNR reserves. Our actuaries significantly rely on this assumption in the application of all methods and models mentioned above. |
| · | Calendar year inflation. For long-tail and mid-tail business lines, calendar year inflation trends for future paid losses and paid defense and cost containment expenses do not vary significantly from a stable, long-term average. Our actuaries base reserve estimates derived from probabilistic trend family models on this assumption. |
| · | Exposure levels. Historical earned premiums, when adjusted to reflect common levels of product pricing and loss cost inflation, can serve as a proxy for historical exposures. Our actuaries require this assumption to estimate expected loss ratios and expected defense and cost containment expense ratios used by the Bornhuetter-Ferguson reserving methods. They may also use this assumption to establish exposure levels for recent accident years, characterized by “green” or immature data, when working with probabilistic trend family models. |
| · | Claims having atypical emergence patterns. Characteristics of certain subsets of claims, such as high frequency, high severity, or mass tort claims, have the potential to distort patterns contained in historical paid loss, reported loss and paid defense and cost containment expense data. When testing indicates this to be the case for a particular subset of claims, our actuaries segregate these claims from the data and analyze them separately. Subsets of claims that could fall into this category include hurricane claims or claims for other weather events where total losses we incurred were very large, individual large claims and asbestos and environmental claims. |
Emergence of loss and defense and cost containment expenses, also referred to as DCCE, on an accident year basis. Historical paid loss, reported loss and paid DCCE data for the business lines we analyze contain patterns that reflect how unpaid losses, unreported losses and unpaid DCCE as of a financial statement date will emerge in the future on an accident year basis. Unless our actuarial staff or management identifies reasons or factors that invalidate the extension of historical patterns into the future, these patterns can be used to make projections necessary for estimating IBNR reserves. Our actuaries significantly rely on this assumption in the application of all methods and models mentioned above.
Calendar year inflation. For long-tail and mid-tail business lines, calendar year inflation trends for future paid losses and paid DCCE do not vary significantly from a stable, long-term average. Our actuaries base reserve estimates derived from probabilistic trend family models on this assumption.
Exposure levels. Historical earned premiums, when adjusted to reflect common levels of product pricing and loss cost inflation, can serve as a proxy for historical exposures. Our actuaries require this assumption to estimate expected loss ratios and expected DCCE ratios used by the Bornhuetter-Ferguson reserving methods. They may also use this assumption to establish exposure levels for recent accident years, characterized by “green” or immature data, when working with probabilistic trend family models.
Claims having atypical emergence patterns. Characteristics of certain subsets of claims, such as high frequency, high severity, or mass tort claims, have the potential to distort patterns contained in historical paid loss, reported loss and paid DCCE data. When testing indicates this to be the case for a particular subset of claims, our actuaries segregate these claims from the data and analyze them separately. Subsets of claims that could fall into this category include hurricane claims or claims for other weather events where total losses we incurred were very large, individual large claims and asbestos and environmental claims.
These key assumptions have not changed since 2005, when our actuarial staff began using probabilistic trend family models to estimate IBNR reserves.
Paid losses, reported losses and paid
defense and cost containment expensesDCCE are subject to random as well as systematic influences. As a result, actual paid losses, reported losses and paid
defense and cost containment expensesDCCE are virtually certain to differ from projections. Such differences are consistent with what specific models for our business lines predict and with the related patterns in the historical data used to develop these models. As a result, management does not closely monitor statistically insignificant differences between actual and projected data.
Reserve Estimate Variability
Management believes that the standard error of a reserve estimate, a measure of the
estimate'sestimate’s variability, provides the most appropriate measure of the
estimate'sestimate’s sensitivity. The reserves we establish depend on the models we use and the related parameters we estimate in the course of conducting reserve analyses. However, the actual amount required to settle all outstanding insured claims, including IBNR claims, as of a financial statement date depends on stochastic, or random, elements as well as the systematic elements captured by our models and estimated model parameters. For the lines of business we write, process uncertainty – the inherent variability of loss and loss expense payments – typically contributes more to the imprecision of a reserve estimate than parameter uncertainty.
Consequently, a sensitivity measure that ignores process uncertainty would provide an incomplete picture of the reserve
estimate'sestimate’s sensitivity. Since a reserve
estimate'sestimate’s standard error accounts for both process and parameter uncertainty, it reflects the
estimate'sestimate’s full sensitivity to a range of reasonably likely scenarios.
Cincinnati Financial Corporation - 2014 10-K - Page 54
The table below provides standard errors and reserve ranges by major property casualty lines of business and in total for
net loss and loss expense reserves as well as the potential effects on our net income, assuming a 35 percent federal tax rate. Standard errors and reserve ranges for assorted groupings of these lines of business cannot be computed by simply adding the standard errors and reserve ranges of the component lines of business, since such an approach would ignore the effects of product diversification. See
Liquidity and Capital Resources, Property Casualty Loss and Loss Expense Obligations and Reserves, Range of Reasonable Reserves,
Page 89, for more details on our total reserve range. While the table reflects our assessment of the most likely range within which each
line'sline’s actual unpaid loss and loss expenses may fall, one or more
lines'lines’ actual unpaid loss and loss expenses could nonetheless fall outside of the indicated ranges.
| (In millions) | | Net loss and loss expense range of reserves | | | | |
| | | Carried | | | Low | | | High | | | Standard | | | Net income | |
| | | reserves | | | point | | | point | | | error | | | effect | |
| At December 31, 2012 | | | | | | | | | | | | | | | | | | | | |
| Total | | $ | 3,813 | | | $ | 3,598 | | | $ | 3,918 | | | | | | | | | |
| | | | | | | | | | | | | | | | | | | | | |
| Commercial casualty | | $ | 1,512 | | | $ | 1,341 | | | $ | 1,588 | | | $ | 123 | | | $ | 80 | |
| Commercial property | | | 222 | | | | 199 | | | | 245 | | | | 23 | | | | 15 | |
| Commercial auto | | | 351 | | | | 333 | | | | 370 | | | | 19 | | | | 12 | |
| Workers' compensation | | | 931 | | | | 845 | | | | 1,018 | | | | 87 | | | | 57 | |
| Personal auto | | | 182 | | | | 174 | | | | 191 | | | | 9 | | | | 6 | |
| Homeowners | | | 120 | | | | 112 | | | | 127 | | | | 8 | | | | 5 | |
| | | | | | | | | | | | | | | | | | | | | |
| At December 31, 2011 | | | | | | | | | | | | | | | | | | | | |
| Total | | $ | 3,905 | | | $ | 3,677 | | | $ | 4,056 | | | | | | | | | |
| | | | | | | | | | | | | | | | | | | | | |
| Commercial casualty | | $ | 1,613 | | | $ | 1,432 | | | $ | 1,750 | | | $ | 159 | | | $ | 103 | |
| Commercial property | | | 209 | | | | 175 | | | | 229 | | | | 27 | | | | 18 | |
| Commercial auto | | | 349 | | | | 333 | | | | 365 | | | | 16 | | | | 10 | |
| Workers' compensation | | | 966 | | | | 875 | | | | 1,056 | | | | 90 | | | | 59 | |
| Personal auto | | | 176 | | | | 168 | | | | 184 | | | | 8 | | | | 5 | |
| Homeowners | | | 121 | | | | 107 | | | | 129 | | | | 11 | | | | 7 | |
If actual unpaid loss and loss expenses fall within these ranges, our cash flow and fixed-maturity investments should provide sufficient liquidity to make the subsequent payments. To date, our operating cash flow has covered our loss and loss expense payments, and we have never had to sell investments to make these payments. If this were to become necessary, however, our fixed-maturity investments should provide us with ample liquidity. At year-end 2012, consolidated fixed-maturity investments exceeded total insurance reserves (including life policy reserves) by $2.568 billion.
|
| | | | | | | | | | | | | | | | | | | | |
| (Dollars in millions) | | Net loss and loss expense range of reserves | | |
| | | Carried reserves | | Low point | | High point | | Standard error | | Net income effect |
| | | | | | |
| At December 31, 2014 | | |
| | |
| | |
| | |
| | |
|
| Total | | $ | 4,156 |
| | $ | 3,922 |
| | $ | 4,296 |
| | |
| | |
|
| | | | | | | | | | | |
| Commercial casualty | | $ | 1,647 |
| | $ | 1,477 |
| | $ | 1,779 |
| | $ | 151 |
| | $ | 98 |
|
| Commercial property | | 230 |
| | 202 |
| | 244 |
| | 21 |
| | 14 |
|
| Commercial auto | | 431 |
| | 411 |
| | 450 |
| | 19 |
| | 12 |
|
| Workers' compensation | | 983 |
| | 873 |
| | 1,067 |
| | 97 |
| | 63 |
|
| Personal auto | | 214 |
| | 204 |
| | 223 |
| | 9 |
| | 6 |
|
| Homeowners | | 104 |
| | 95 |
| | 112 |
| | 8 |
| | 5 |
|
| | | | | | | | | | | |
| At December 31, 2013 | | |
| | |
| | |
| | |
| | |
|
| Total | | $ | 3,942 |
| | $ | 3,727 |
| | $ | 4,078 |
| | |
| | |
|
| | | | | | | | | | | |
| Commercial casualty | | $ | 1,532 |
| | $ | 1,368 |
| | $ | 1,643 |
| | $ | 138 |
| | $ | 90 |
|
| Commercial property | | 241 |
| | 223 |
| | 260 |
| | 19 |
| | 12 |
|
| Commercial auto | | 371 |
| | 352 |
| | 391 |
| | 19 |
| | 12 |
|
| Workers' compensation | | 966 |
| | 873 |
| | 1,059 |
| | 93 |
| | 60 |
|
| Personal auto | | 198 |
| | 189 |
| | 207 |
| | 9 |
| | 6 |
|
| Homeowners | | 106 |
| | 98 |
| | 113 |
| | 7 |
| | 5 |
|
| | | | | | | | | | | |
Life Insurance Policy Reserves
We establish the reserves for traditional life insurance policies based on expected expenses, mortality, morbidity, withdrawal rates and investment yields, including a provision for uncertainty. Once these assumptions are established, they generally are maintained throughout the lives of the contracts. We use both our own experience and industry experience adjusted for historical trends in arriving at our assumptions for expected mortality, morbidity and withdrawal rates. We use our own experience and historical trends for setting our assumptions for expected expenses. We base our assumptions for expected investment income on our own experience adjusted for current economic conditions.
We establish reserves for our universal life, deferred annuity and investment contracts equal to the cumulative account balances, which include premium deposits plus credited interest less charges and withdrawals. Some of our universal life insurance policies contain no-lapse guarantee provisions. For these policies, we establish a reserve in addition to the account balance based on expected no-lapse guarantee benefits and expected policy assessments.
Our fixed-maturity and equity investment portfolios are our largest assets. The company’s asset impairment committee continually monitors the holdings in these portfolios and all other assets for signs of other-than-temporary or permanent impairment. The committee monitors decreases in the fair value of invested assets; an accumulation of company costs in excess of the amount originally expected to acquire or construct an asset; uncollectability of all receivable assets, or other factors such as bankruptcy, deterioration of creditworthiness, failure
Cincinnati Financial Corporation - 2014 10-K - Page 55
to pay interest or dividends; signs indicating that the receivable carrying amount may not be recoverable; and changes in legal factors or in the business climate.
The application of our impairment policy resulted in other-than-temporary impairment (OTTI) charges that reduced our income before income taxes by
$24 million in 2014, $2 million in 2013 and $33 million in
2012, $57 million in 2011 and $36 million in 2010.2012. Impairment charges are recorded for other-than-temporary declines in value, if, in the asset impairment committee’s judgment, the value is not expected to be recouped within a designated recovery period. OTTI losses represent noncash charges to income and are reported as realized investment losses.
Our internal investment portfolio managers monitor their assigned portfolios. If a security is valued below cost or amortized cost, the portfolio managers undertake additional reviews. Such declines often occur in conjunction with events taking place in the overall economy and market, combined with events specific to the industry or operations of the issuing organization. Managers review quantitative measurements such as a declining trend in fair value, the extent of the fair value decline and the length of time the value of the security has been depressed, as well as qualitative measures such as pending events, credit ratings and issuer liquidity. We are even more proactive when these declines in valuation are greater than might be anticipated when viewed in the context of overall economic and market conditions. We provide information about
valuationvaluations of our invested assets in Item 8, Note 2 of the Consolidated Financial
Statements, Page 118.Statements.
All securities valued below 100 percent of cost or amortized cost are reported to the asset impairment committee for evaluation. Securities valued between 95 percent and 100 percent of cost or amortized cost are reviewed but not monitored separately by the committee. When evaluating for OTTI, the committee considers the company’s intent and ability to retain a security for a period adequate to recover its cost. Because of the
company'scompany’s financial strength and other factors discussed below, management may not impair certain securities even when they are fair valued below cost or amortized cost.
Securities that have previously been other-than-temporarily impaired are evaluated based on their adjusted cost or amortized cost and further written down, if deemed appropriate. We provide detailed information about securities fair valued in a continuous loss position at year-end
20122014 in Item 7A, Application of Asset Impairment
Policy, Page 102.Policy.
When determining OTTI charges for our fixed-maturity portfolio, management places significant emphasis on whether issuers of debt are current on contractual payments and whether future contractual amounts are likely to be paid. Our fixed-maturity invested asset impairment policy states that OTTI is considered to have occurred (1) if we intend to sell the impaired fixed-maturity security; (2) if it is more likely than not we will be required to sell the fixed-maturity security before recovery of its amortized cost basis; or (3) if the present value of the expected cash flows is not sufficient to recover the entire amortized cost basis. If we intend to sell or it is more likely than not we will be required to sell, the amortized cost of any such securities is reduced to fair value as the new amortized cost basis, and a realized loss is recorded in the quarter in which it is recognized. When we believe that full collection of interest and/or principal is not likely, we determine the net present value of future cash flows by using the effective interest rate implicit in the security at the date of acquisition as the discount rate and compare that amount to the amortized cost and fair value of the security. The difference between the net present value of the expected future cash flows and amortized cost of the security is considered a credit loss and recognized as a realized loss in the quarter in which it occurs. The difference between the fair value and the net present value of the cash flows of the security, the noncredit loss, is recognized in other comprehensive income as an unrealized loss.
When determining OTTI charges for our equity portfolio, our invested asset impairment policy considers qualitative and quantitative factors, including facts and circumstances specific to individual securities, asset classes, the financial condition of the issuer, changes in dividend payment, the length of time fair value had been less than cost, the severity of the decline in fair value below cost, the volatility of the security and our ability and intent to hold each position until its forecasted recovery.
For each of our equity securities in an unrealized loss position at December 31,
2012,2014, we applied the objective quantitative and qualitative criteria of our invested asset impairment policy for OTTI.
Our long-term equity investment philosophy, emphasizing companies with strong indications of paying and growing dividends, combined with our strong surplus, liquidity and cash flow, provide us the ability to hold these investments through what we believe to be slightly longer recovery periods occasioned by the recession and historic levels of market volatility. Based on the individual qualitative and quantitative factors, as discussed above, we evaluate and determine an expected recovery period for each security. A change in the condition of a security can warrant impairment before the expected recovery period. If the security has not recovered cost within the expected recovery period, the security is other-than-temporarily impaired.
Our long-term equity investment philosophy, emphasizing companies with strong indications of paying and growing dividends, combined with our strong statutory capital and surplus, liquidity and cash flow,
Cincinnati Financial Corporation - 2014 10-K - Page 56
provide us the ability to hold these investments through what we believe to be slightly longer recovery periods during times of historic levels of market volatility.
Securities considered to have a temporary decline would be expected to recover their cost or amortized cost, which may be at maturity. Under the same accounting treatment as fair value gains, temporary declines (changes in the fair value of these securities) are reflected in shareholders’ equity on our
balance sheetConsolidated Balance Sheets in accumulated other comprehensive income (AOCI), net of tax, and have no impact on net income.
Valuation of Financial Instruments
Valuation of financial instruments, primarily securities held in our investment portfolio, is a critical component of our year-end financial statement preparation. Accounting Standards Codification (ASC) 820-10, Fair Value Measurements and Disclosures Accounting Standards Codification (ASC) 820-10,, defines fair value as the exit price or the amount that would be (1) received to sell an asset or (2) paid to transfer a liability in an orderly transaction between marketplace participants at the measurement date. When determining an exit price, we must, whenever possible, rely upon observable market data.In accordance with ASC 820-10, we
We have categorized our financial instruments, based on the priority of the inputs to the valuation technique, into a three-level fair value hierarchy. The fair value hierarchy gives the highest priority to quoted prices in active markets for identical assets or liabilities (Level 1) and the lowest priority to unobservable inputs (Level 3). If the inputs used to measure the financial instruments fall within different levels of the hierarchy, the categorization is based on the lowest level that is significant to the fair value measurement of the instrument. While we consider pricing data from outside services, we ultimately determine whether the data or inputs used by these outside services are observable or unobservable.
Financial assets and liabilities recorded
onin the Consolidated Balance Sheets are categorized based on the inputs to the valuation techniques as described in Item 8, Note 3
Page 121.of the Consolidated Financial Statements.
Level 1 and Level 2 Valuation Techniques
Over 99 percent of the
$12.466$14.318 billion of securities in our investment portfolio, measured at fair value, are classified as Level 1 or Level 2. Financial assets that fall within Level 1 and Level 2 are priced according to observable data from identical or similar securities that have traded in the marketplace. Also within Level 2 are securities that are valued by outside services or brokers where we have evaluated
and verified the pricing methodology and determined that the inputs are observable.
Level 3 Valuation Techniques
Financial assets that fall within the Level 3 hierarchy are valued based upon unobservable market inputs, normally because they are not actively traded on a public market. Pricing for each Level 3 security is based upon inputs that are market driven, including third-party reviews provided to the issuer or broker quotes. We placed in the Level 3 hierarchy securities for which we were unable to obtain the pricing methodology or we could not consider the price provided as binding. Pricing for securities classified as Level 3 could not be corroborated by similar securities priced using observable inputs.
Management ultimately determined the pricing for each Level 3 security that we considered to be the best exit price valuation. As of December 31,
2012,2014, total Level 3 assets were less than 1 percent of our investment portfolio measured at fair value. Broker quotes are obtained for thinly traded securities that subsequently fall within the Level 3 hierarchy. We have generally obtained and evaluated two nonbinding quotes from brokers; our investment professionals determine our best estimate of fair value.
Employee Benefit Pension Plan
We have a defined benefit pension plan that was modified during 2008; refer to Item 8, Note 13 of the Consolidated Financial Statements,
Page 130, for additional information. Contributions and pension costs are developed from annual actuarial valuations. These valuations involve key assumptions including discount rates, expected return on plan assets and compensation increase rates, which are updated annually. Any adjustments to these assumptions are based on considerations of current market conditions. Therefore, changes in the related pension costs or credits may occur in the future due to changes in assumptions.
Cincinnati Financial Corporation - 2014 10-K - Page 57
Key assumptions used in developing the
20122014 benefit obligation for our qualified plan were a
4.204.25 percent discount rate and rates of compensation increases ranging from 2.75 percent to 3.25 percent. To determine the discount rate, a
hypothetical diversifiedtheoretical settlement portfolio of
actual domestic Aahigh-quality, rated
corporate bonds was chosen to provide payments approximately matching the plan’s
expectedprojected benefit payments. A single interest rate was determined,
based on the anticipated yieldresulting in a discounted value of the
constructed portfolio.plan's benefit payments that equates to the market value of the selected bonds. The discount rate is reflective of current market interest rate conditions and our plan's liability characteristics.
Key assumptions used in developing the
20122014 net pension expense for our qualified plan were a
5.105.15 percent discount rate, a
7.507.25 percent expected return on plan assets and rates of compensation increases ranging from
3.502.75 percent to
5.503.25 percent.
See Note 13, Page 130 for additional information on assumptions.In
2012,2014, the net pension expense was
$18$13 million. In
2013,2015, we expect the net pension expense to
remain unchanged at $18be approximately $14 million.
Holding all other assumptions constant, a 0.5 percentage-point decrease in the discount rate would decrease our
20132015 income before income taxes by $1 million. A 0.5 percentage point decrease in the expected return on plan assets would decrease our
20132015 income before income taxes by $1 million.
The fair value of the plan assets exceeded the accumulated benefit obligation by $4 million and $23 million at year-end 2014 and 2013, respectively. The fair value of the plan assets was
$44 million less than the accumulated benefit obligation at year-end 2012 and $20 million less at year-end 2011. The fair value of the plan assets was $82$31 million less than the projected plan benefit obligation at year-end
20122014 and
$65$4 million less at year-end
2011.2013. Market conditions and interest rates significantly affect future assets and liabilities of the pension plan. During the
thirdfirst quarter of
2012,2015, we contributed
$14$5 million to our qualified plan.
We contributed $15 million to our qualified plan during the first quarter of 2013. Deferred Policy Acquisition Costs
We establish a deferred asset for expenses associated with successfully acquiring property casualty and life insurance policies, primarily commissions, premium taxes and underwriting costs. Underlying assumptions are updated periodically to reflect actual experience, and we evaluate our deferred acquisition cost recoverability.
For property casualty
insurance policies, deferred acquisition costs are amortized over the terms of the policies. These costs are principally agent commissions, premium taxes and certain underwriting costs related to successful contract acquisition, which are deferred and amortized into net income as premiums are earned. We assess recoverability of deferred acquisition costs at the segment level, consistent with the ways we acquire, service, manage and measure profitability. Deferred acquisition costs track with the change in premiums. Our property casualty insurance operations consist of three segments, commercial lines
insurance, personal lines
insurance and excess and surplus
lines.lines insurance.
For life insurance policies, acquisition costs are amortized into income either over the premium-paying period of the policies or the life of the policy, depending on the policy type. These costs are principally agent commissions and underwriting costs related to successful contract acquisition. We analyze our acquisition cost assumptions periodically to reflect actual experience; we evaluate our deferred acquisition cost for recoverability; and we regularly conduct reviews for potential premium deficiencies or loss recognition. Changes in the amounts or timing of estimated future profits could result in adjustments to the accumulated amortization of these costs.
Profit-Sharing Commission Accrual
We establish an accrual for property casualty profit-sharing commissions. We calculate the profit-sharing commission accrual estimate based on property casualty underwriting results. Profit-sharing commissions are paid to agencies using a formula that takes into account agency profitability over one-year and three-year periods and premium volume. Due to the complexity of the calculation, timing of the accrual determination and the variety of allocation factors that can affect profit-sharing commissions for an individual agency, the amount accrued can differ from the actual profit-sharing commissions paid. The profit-sharing commission accrual of $102 million in 2012 contributed 3.1 percentage points to the property casualty combined ratio. If profit-sharing commissions paid were to vary from that amount by 5 percent, it would affect 2013 net income by $2 million (after tax), or 1 cent per share, and the combined ratio by approximately 0.1 percentage point.
Recent Accounting Pronouncements
Information about recent accounting pronouncements is provided in Item 8, Note 1 of the Consolidated Financial
Statements, Page 112.Statements. We have determined that recent accounting pronouncements have not had, nor are they expected to have, any material impact on our consolidated financial statements.
Cincinnati Financial Corporation - 2014 10-K - Page 58
Financial Results
of Operations Consolidated financial results primarily reflect the results of our five reporting segments. These segments are defined based on financial information we use to evaluate performance and to determine the allocation of assets.
| · | Commercial lines property casualty insurance |
| · | Personal lines property casualty insurance |
| · | Excess and surplus lines property casualty insurance |
Commercial lines insurance
Personal lines insurance
Excess and surplus lines insurance
Life insurance
Investments
We report as Other the noninvestment operations of the parent company and its noninsurer subsidiary, CFC Investment Company.
We measure profit or loss for our commercial lines, personal lines and excess and surplus
property casualtylines and life insurance segments based upon underwriting results (profit or loss), which represent net earned premium less loss and loss expenses and underwriting expenses on a pretax basis. We also frequently evaluate results for our consolidated property casualty insurance operations, which is the total of our commercial, personal, and excess and surplus
lines insurance results. Underwriting results and segment pretax operating income are not substitutes for net income determined in accordance with GAAP.
For our consolidated property casualty insurance operations as well as the insurance segments, statutory accounting data and ratios are key performance indicators that we use to assess business trends and to make comparisons to industry results, since GAAP-based industry data generally is not as readily available.
Investments held by the parent company and the investment portfolios for the insurance subsidiaries are managed and reported as the investments segment, separate from the underwriting businesses. Net investment income and net realized investment gains and losses for our investment portfolios are discussed in the
Investment Results of Operations.Investments Results.
The calculations of segment data are described in more detail in Item 8, Note 18, of the Consolidated Financial Statements, Page 137.Statements. The following sections provide analysis and discussion of results of operations for each of the five segments. Commercial Lines Insurance Results of Operations begins on
Cincinnati Financial Corporation - 2014 10-K - Page
57, Personal Lines Insurance Results of Operations begins on Page 68, Excess and Surplus Lines Insurance Results of Operations begins on Page 74, Life Insurance Results of Operations begins on Page 77, and Investment Results of Operations begins on Page 79. We begin with an overview of our consolidated property casualty operations.59
Consolidated Property Casualty Insurance Results
of OperationsEarned and net written premiums for our consolidated property casualty operations grew in
2012,2014, reflecting
betterhigher pricing and strategic initiatives for targeted growth. A key measure of property casualty profitability is underwriting profit or loss. Our
20122014 underwriting profit of
$137$186 million
representswas $47 million less than in 2013. The decrease included a
$415$32 million
improvement over the 2011 underwriting loss of $278 million. Part of the improvement was due to a $68 million decreaseincrease in natural catastrophe losses, mostly from severe weather.
More importantly, underwriting results beforeIt also included a $52 million increase from weather-related losses not identified as part of designated catastrophe
events for the property casualty industry, typically referred to as noncatastrophe weather losses. The unfavorable effects of those higher weather-related losses
improved, demonstratingin aggregate during 2014 offset the benefits of higher pricing and our ongoing
benefits from various recent-year profit improvement and premium growth initiatives
that were designed to improve
results over time.pricing precision and loss experience related to claims and loss control practices. Prior accident year loss experience before catastrophes during 2014 was favorable but less so than in 2013. The less favorable experience was primarily due to re-estimates of losses and loss expenses incurred but not reported (IBNR), particularly for our commercial casualty line of business, as discussed in Commercial Lines Insurance Results.
The table below highlights property casualty results,
of operations, with analysis and discussion in the sections that follow.
Overview – Three-Year Highlights
| (Dollars in millions) | | Years ended December 31, | | | 2012-2011 | | | 2011-2010 | |
| | | 2012 | | | 2011 | | | 2010 | | | Change % | | | Change % | |
| | | | | | | | | | | | | | | | |
| Earned premiums | | $ | 3,344 | | | $ | 3,029 | | | $ | 2,924 | | | | 10 | | | | 4 | |
| Fee revenues | | | 6 | | | | 4 | | | | 4 | | | | 50 | | | | 0 | |
| Total revenues | | | 3,350 | | | | 3,033 | | | | 2,928 | | | | 10 | | | | 4 | |
| | | | | | | | | | | | | | | | | | | | | |
| Loss and loss expenses from: | | | | | | | | | | | | | | | | | | | | |
| Current accident year before catastrophe losses | | | 2,160 | | | | 2,213 | | | | 2,154 | | | | (2 | ) | | | 3 | |
| Current accident year catastrophe losses | | | 373 | | | | 407 | | | | 165 | | | | (8 | ) | | | 147 | |
| Prior accident years before catastrophe losses | | | (357 | ) | | | (280 | ) | | | (287 | ) | | | (28 | ) | | | 2 | |
| Prior accident years catastrophe losses | | | (39 | ) | | | (5 | ) | | | (17 | ) | | | (680 | ) | | | 71 | |
| Total loss and loss expenses | | | 2,137 | | | | 2,335 | | | | 2,015 | | | | (8 | ) | | | 16 | |
| Underwriting expenses | | | 1,076 | | | | 976 | | | | 962 | | | | 10 | | | | 1 | |
| Underwriting profit (loss) | | $ | 137 | | | $ | (278 | ) | | $ | (49 | ) | | | nm | | | | nm | |
| | | | | | | | | | | | | | | | | | | | | |
| | | | | | | | | | | Pt. Change | | | Pt. Change | |
| Ratios as a percent of earned premiums: | | | | | | | | | | | | | | | | | | | | |
| Current accident year before catastrophe losses | | | 64.6 | % | | | 73.0 | % | | | 73.6 | % | | | (8.4 | ) | | | (0.6 | ) |
| Current accident year catastrophe losses | | | 11.1 | | | | 13.4 | | | | 5.6 | | | | (2.3 | ) | | | 7.8 | |
| Prior accident years before catastrophe losses | | | (10.7 | ) | | | (9.3 | ) | | | (9.8 | ) | | | (1.4 | ) | | | 0.5 | |
| Prior accident years catastrophe losses | | | (1.1 | ) | | | (0.1 | ) | | | (0.5 | ) | | | (1.0 | ) | | | 0.4 | |
| Total loss and loss expenses | | | 63.9 | | | | 77.0 | | | | 68.9 | | | | (13.1 | ) | | | 8.1 | |
| Underwriting expenses | | | 32.2 | | | | 32.3 | | | | 32.9 | | | | (0.1 | ) | | | (0.6 | ) |
| Combined ratio | | | 96.1 | % | | | 109.3 | % | | | 101.8 | % | | | (13.2 | ) | | | 7.5 | |
| | | | | | | | | | | | | | | | | | | | | |
| Combined ratio: | | | 96.1 | % | | | 109.3 | % | | | 101.8 | % | | | (13.2 | ) | | | 7.5 | |
| Contribution from catastrophe losses and prior yearsreserve development | | | (0.7 | ) | | | 4.0 | | | | (4.7 | ) | | | (4.7 | ) | | | 8.7 | |
| Combined ratio before catastrophe losses and prioryears reserve development | | | 96.8 | % | | | 105.3 | % | | | 106.5 | % | | | (8.5 | ) | | | (1.2 | ) |
|
| | | | | | | | | | | | | | | | | | |
| (Dollars in millions) | | Years ended December 31, | | 2014-2013 | | 2013-2012 |
| | | 2014 | | 2013 | | 2012 | | Change % | | Change % |
| Earned premiums | | $ | 4,045 |
| | $ | 3,713 |
| | $ | 3,344 |
| | 9 |
| | 11 |
|
| Fee revenues | | 6 |
| | 4 |
| | 6 |
| | 50 |
| | (33 | ) |
| Total revenues | | 4,051 |
| | 3,717 |
| | 3,350 |
| | 9 |
| | 11 |
|
| Loss and loss expenses from: | | |
| | |
| | |
| | |
| | |
|
| Current accident year before catastrophe losses | | 2,495 |
| | 2,249 |
| | 2,160 |
| | 11 |
| | 4 |
|
| Current accident year catastrophe losses | | 230 |
| | 199 |
| | 373 |
| | 16 |
| | (47 | ) |
| Prior accident years before catastrophe losses | | (72 | ) | | (120 | ) | | (357 | ) | | 40 |
| | 66 |
|
| Prior accident years catastrophe losses | | (26 | ) | | (27 | ) | | (39 | ) | | 4 |
| | 31 |
|
| Total loss and loss expenses | | 2,627 |
| | 2,301 |
| | 2,137 |
| | 14 |
| | 8 |
|
| Underwriting expenses | | 1,238 |
| | 1,183 |
| | 1,076 |
| | 5 |
| | 10 |
|
| Underwriting profit | | $ | 186 |
| | $ | 233 |
| | $ | 137 |
| | (20 | ) | | 70 |
|
| | | | | | | | | | | |
| Ratios as a percent of earned premiums: | | | | | | | | Pt. Change | | Pt. Change |
| Current accident year before catastrophe losses | | 61.7 | % | | 60.6 | % | | 64.6 | % | | 1.1 |
| | (4.0 | ) |
| Current accident year catastrophe losses | | 5.7 |
| | 5.4 |
| | 11.1 |
| | 0.3 |
| | (5.7 | ) |
| Prior accident years before catastrophe losses | | (1.8 | ) | | (3.3 | ) | | (10.7 | ) | | 1.5 |
| | 7.4 |
|
| Prior accident years catastrophe losses | | (0.6 | ) | | (0.8 | ) | | (1.1 | ) | | 0.2 |
| | 0.3 |
|
| Total loss and loss expense | | 65.0 |
| | 61.9 |
| | 63.9 |
| | 3.1 |
| | (2.0 | ) |
| Underwriting expense | | 30.6 |
| | 31.9 |
| | 32.2 |
| | (1.3 | ) | | (0.3 | ) |
| Combined ratio | | 95.6 | % | | 93.8 | % | | 96.1 | % | | 1.8 |
| | (2.3 | ) |
| | | | | | | | | | | |
| Combined ratio: | | 95.6 | % | | 93.8 | % | | 96.1 | % | | 1.8 |
| | (2.3 | ) |
Contribution from catastrophe losses and prior years reserve development | | 3.3 |
| | 1.3 |
| | (0.7 | ) | | 2.0 |
| | 2.0 |
|
Combined ratio before catastrophe losses and prior years reserve development | | 92.3 | % | | 92.5 | % | | 96.8 | % | | (0.2 | ) | | (4.3 | ) |
| | | | | | | | | | | |
Performance highlights for consolidated property casualty operations include:
| · | Premiums – Strong growth in renewal and new business written premiums drove double-digit increases in 2012 earned premiums and net written premiums. The 2012 rate of growth for earned and net written premiums more than doubled that of 2011 as premium volume rose significantly in each of our property casualty segments. Higher and more precise pricing continues to benefit operating results and is further discussed in the results of operations sections below by segment. A fifth straight year of higher new business premiums reflected our premium growth initiatives from recent years that continue to favorably affect current year growth, particularly as newer agency relationships mature over time. Agents appointed during 2011 or 2012 produced an increase in standard lines new business of $35 million during 2012, compared with 2011. A higher level of insured exposures, reflecting improvement in some areas of the economy, also favorably affected premium growth, primarily in our commercial lines segment. The contributions to premiums from audits, which are significantly affected by economic trends, are further discussed in Commercial Lines Insurance Results of Operations beginning on Page 57. |
Premiums – Strong growth in renewal written premiums drove increases in earned premiums and net written premiums for both 2014 and 2013, rising in each of our property casualty segments. Higher and more precise pricing continues to benefit operating results and is further discussed by segment in the results sections below. New business written premiums in 2014 were down $40 million, compared with the record-high amount we reported in 2013. The year 2013 also represented the sixth straight year of higher new business premiums, reflecting our premium growth initiatives from recent years. Those initiatives also favorably affect growth in subsequent years, particularly as newer agency relationships mature over time. Agents appointed during 2014 or
Cincinnati Financial Corporation - 2014 10-K - Page 60
2013 produced an increase in standard lines new business of $20 million during 2014, compared with 2013. A higher level of insured exposures, reflecting improvement in some areas of the economy, also favorably affected growth in net written premiums, primarily in our commercial lines insurance segment. The contributions to commercial lines premiums from audits, which are significantly affected by economic trends, are further discussed in Commercial Lines Insurance Results.
Other written premiums – primarily premiums ceded to our reinsurers as part of our reinsurance program –
in total reduced 2014 net written premiums by $11 million more than in 2013. A decrease in ceded premiums contributed
$49$22 million to
the $384 million of growth in 2012 net written
premiums. The change in otherpremium growth for 2014, compared with 2013. Other written premiums
was primarily due to $42 millionalso included a less favorable adjustment for 2014, compared with 2013, for estimated direct written premiums of
ceded premiumspolicies in
2011 to reinstate coverage layers ofeffect but not yet processed in our
property catastrophe reinsurance treaty. There were no material cededcommercial lines insurance segment. This written premium
effects during 2012 or 2010 from unusual items such as reinstatement.adjustment has an immaterial effect on earned premiums.
The table below analyzes premium revenue components and trends. Premium trends by segment are further discussed
beginning on Page 58, Page 69 and Page 74, for the respective property casualty segments.
| (Dollars in millions) | | Years ended December 31, | | | 2012-2011 | | | 2011-2010 | |
| | | 2012 | | | 2011 | | | 2010 | | | Change % | | | Change % | |
| Agency renewal written premiums | | $ | 3,138 | | | $ | 2,867 | | | $ | 2,692 | | | | 9 | | | | 7 | |
| Agency new business written premiums | | | 501 | | | | 437 | | | | 414 | | | | 15 | | | | 6 | |
| Other written premiums | | | (157 | ) | | | (206 | ) | | | (143 | ) | | | 24 | | | | (44 | ) |
| Net written premiums | | | 3,482 | | | | 3,098 | | | | 2,963 | | | | 12 | | | | 5 | |
| Unearned premium change | | | (138 | ) | | | (69 | ) | | | (39 | ) | | | (100 | ) | | | (77 | ) |
| Earned premiums | | $ | 3,344 | | | $ | 3,029 | | | $ | 2,924 | | | | 10 | | | | 4 | |
| · | | | | | | | | | | | | | | | | | | | | | | (Dollars in millions) | | Years ended December 31, | | 2014-2013 | | 2013-2012 | | | | 2014 | | 2013 | | 2012 | | Change % | | Change % | | Agency renewal written premiums | | $ | 3,794 |
| | $ | 3,493 |
| | $ | 3,138 |
| | 9 |
| | 11 |
| | Agency new business written premiums | | 503 |
| | 543 |
| | 501 |
| | (7 | ) | | 8 |
| | Other written premiums | | (154 | ) | | (143 | ) | | (157 | ) | | (8 | ) | | 9 |
| | Net written premiums | | 4,143 |
| | 3,893 |
| | 3,482 |
| | 6 |
| | 12 |
| | Unearned premium change | | (98 | ) | | (180 | ) | | (138 | ) | | 46 |
| | (30 | ) | | Earned premiums | | $ | 4,045 |
| | $ | 3,713 |
| | $ | 3,344 |
| | 9 |
| | 11 |
| | | | | | | | | | | | |
Combined ratio – The 2012 combined ratio improved 13.2 percentage points compared with 2011, largely reflecting better pricing and other efforts that are lowering loss ratios before catastrophe losses. Lower catastrophe losses contributed 3.3 percentage points to the improved 2012 combined ratio. In 2011, additional ceded premiums to reinstate coverage layers of our property catastrophe reinsurance treaty contributed 1.4 percentage points to the 2011 combined ratio. |
The 2014 combined ratio before catastropherose 1.8 percentage points compared with 2013, as higher weather-related losses and prior year reserve development also improved significantly in 2012, benefiting fromlargely offset our recent-year initiatives to improve pricing precision and loss experience related to claims and loss control practices.
Compared with 2013, the 2014 ratio for natural catastrophe losses rose 0.5 points while the ratio for noncatastrophe weather losses rose 1.0 points. In addition, higher estimates of incurred but not reported (IBNR) losses and loss expenses for our commercial casualty line of business increased our 2014 consolidated property casualty combined ratio by 1.5 points, compared with 2013. We further discuss those ratios and ones related to reserve development in the sections that follow our discussion below in Catastrophe Losses Incurred.
Our statutory combined ratio was
95.1 percent in 2014 compared with 92.7 percent in 2013 and 95.4 percent in
2012 compared with 108.9 percent in 2011 and 101.8 percent in 2010.2012. The estimated statutory combined ratio for the property casualty industry, with the industry’s ratio excluding its mortgage and financial guaranty lines of business, was
106.297.2 percent in
2012, 106.52014, 96.4 percent in
20112013 and
101.0102.5 percent in
2010.2012. The contribution of catastrophe losses to our statutory combined ratio was
5.1 percentage points in 2014, 4.6 percentage points in 2013 and 10.0 percentage points in 2012,
13.3 percentage points in 2011 and 5.1 percentage points in 2010, compared with an
estimated 9.4, 9.6industry estimate of 4.4, 3.9 and
4.58.0 percentage points,
respectively, for the industry.respectively. Components of the combined ratio are discussed below, followed by additional discussion by segment.
Catastrophe loss trends are an important factor in assessing trends for overall underwriting results. Our 10-year historical annual average contribution of catastrophe losses to the combined ratio was
6.16.0 percentage points at December 31,
2012.2014. Our five-year average was
8.27.4 percentage
points, below the 10.0 percent experienced for the year 2012. Incurred losses from a May 20-27, 2011, storm system that included Joplin, Missouri, represent the single-largest catastrophe event in our company’s history.points.
Cincinnati Financial Corporation - 2014 10-K - Page 61
The following table shows catastrophe losses incurred, net of reinsurance, for the past three years, as well as the effect of loss development on prior period catastrophe reserves.
We individually list declared catastrophe events for which our incurred losses reached or exceeded $10 million.
Catastrophe Losses Incurred
| (In millions, net of reinsurance) | | | | | | | | | | Excess | | | | |
| | | | | | | Commercial | | | Personal | | | and surplus | | | | |
| Dates | | Event | | Region | | lines | | | lines | | | lines | | | Total | |
| 2012 | | | | | | | | | | | | | | | | | | | | |
| Feb. 28-29 | | Hail, wind, tornado | | Midwest | | $ | 19 | | | $ | 6 | | | $ | - | | | $ | 25 | |
| Mar. 2-3 | | Hail, wind, tornado | | Midwest, South | | | 30 | | | | 48 | | | | - | | | | 78 | |
| Mar. 18-25 | | Hail, lightning, wind | | Northeast, South | | | 2 | | | | 4 | | | | - | | | | 6 | |
| Apr. 28-29 | | Hail, lightning, wind | | Midwest, South | | | 53 | | | | 26 | | | | 1 | | | | 80 | |
| Jun. 11-13 | | Hail, lightning, wind | | West, South | | | 9 | | | | - | | | | - | | | | 9 | |
| Jun. 24-28 | | Fire | | West | | | 7 | | | | - | | | | - | | | | 7 | |
| Jun. 28-Jul. 2 | | Hail, lightning, wind | | Midwest, Northeast, South | | | 39 | | | | 42 | | | | - | | | | 81 | |
| Jul. 2-4 | | Hail, lightning, wind | | Midwest, Northeast | | | 7 | | | | 5 | | | | - | | | | 12 | |
| Sep. 7-8 | | Hail, lightning, wind | | Midwest, Northeast, South | | | 5 | | | | 1 | | | | 1 | | | | 7 | |
| Sep. 21-22 | | Hail, lightning, wind | | Midwest | | | 1 | | | | 5 | | | | - | | | | 6 | |
| Oct. 28-31 | | Sandy | | Midwest, Northeast, South | | | 20 | | | | 10 | | | | - | | | | 30 | |
| All other 2012 catastrophes | | | | | 19 | | | | 13 | | | | - | | | | 32 | |
| Development on 2011 and prior catastrophes | | | | | (17 | ) | | | (22 | ) | | | - | | | | (39 | ) |
| Calendar year incurred total | | | | $ | 194 | | | $ | 138 | | | $ | 2 | | | $ | 334 | |
| | | | | | | | | | | | | | | | | | | | | |
| 2011 | | | | | | | | | | | | | | | | | | | | |
| Jan. 31-Feb. 3 | | Freezing, wind | | South, Midwest | | $ | 4 | | | $ | 3 | | | $ | - | | | $ | 7 | |
| Feb. 21 | | Earthquake | | New Zealand | | | 4 | | | | - | | | | - | | | | 4 | |
| Feb. 27-28 | | Hail, wind, tornado | | Midwest | | | 3 | | | | 6 | | | | - | | | | 9 | |
| Mar. 11 | | Earthquake | | Japan | | | 7 | | | | - | | | | - | | | | 7 | |
| Mar. 26-28 | | Hail, wind | | South | | | 1 | | | | 6 | | | | - | | | | 7 | |
| Apr. 3-5 | | Hail, wind, tornado | | South, Midwest | | | 15 | | | | 23 | | | | - | | | | 38 | |
| Apr. 8-11 | | Hail, wind, tornado | | South, Midwest | | | 11 | | | | 8 | | | | - | | | | 19 | |
| Apr. 14-16 | | Hail, wind, tornado | | South, Midwest | | | 10 | | | | 4 | | | | - | | | | 14 | |
| Apr. 19-20 | | Hail, wind | | South, Midwest | | | 13 | | | | 11 | | | | - | | | | 24 | |
| Apr. 22-28 | | Hail, wind, tornado | | South, Midwest | | | 45 | | | | 31 | | | | - | | | | 76 | |
| May 20-27 | | Hail, wind, tornado | | South, Midwest | | | 42 | | | | 51 | | | | - | | | | 93 | |
| May 29-Jun. 1 | | Hail, wind, tornado | | East, Midwest | | | 2 | | | | 1 | | | | - | | | | 3 | |
| Jun. 16-22 | | Hail, wind, tornado | | South, Midwest | | | 7 | | | | 6 | | | | - | | | | 13 | |
| Jul. 1-4 | | Hail, wind, tornado | | Midwest | | | 3 | | | | 2 | | | | - | | | | 5 | |
| Jul. 10-14 | | Hail, wind, tornado | | Midwest, West | | | 4 | | | | 6 | | | | - | | | | 10 | |
| Aug. 18-19 | | Hail, wind, tornado | | Midwest | | | 9 | | | | 1 | | | | - | | | | 10 | |
| Aug. 26-28 | | Hurricane, wind, tornado | | East | | | 22 | | | | 6 | | | | - | | | | 28 | |
| Sep. 3-6 | | Tornado, wind | | South | | | 9 | | | | 5 | | | | - | | | | 14 | |
| All other 2011 catastrophes | | | | | 14 | | | | 11 | | | | 1 | | | | 26 | |
| Development on 2010 and prior catastrophes | | | | | 2 | | | | (7 | ) | | | - | | | | (5 | ) |
| Calendar year incurred total | | | | $ | 227 | | | $ | 174 | | | $ | 1 | | | $ | 402 | |
| | | | | | | | | | | | | | | | | | | | | |
| 2010 | | | | | | | | | | | | | | | | | | | | |
| Jan. 7-12 | | Freezing, wind | | South, Midwest | | $ | 4 | | | $ | 1 | | | $ | - | | | $ | 5 | |
| Feb. 9-11 | | Freezing, wind | | East, Midwest | | | 4 | | | | 1 | | | | - | | | | 5 | |
| Apr. 4-6 | | Hail, wind, tornado | | South, Midwest | | | 4 | | | | 6 | | | | - | | | | 10 | |
| Apr. 30-May 3 | | Hail, wind, tornado | | South | | | 21 | | | | 6 | | | | - | | | | 27 | |
| May 7-8 | | Hail, wind, tornado | | East, Midwest | | | 2 | | | | 12 | | | | - | | | | 14 | |
| May 12-16 | | Hail, wind, tornado | | South, Midwest | | | 7 | | | | 2 | | | | - | | | | 9 | |
| Jun. 4-6 | | Hail, wind, tornado | | Midwest | | | 2 | | | | 2 | | | | 1 | | | | 5 | |
| Jun. 17-20 | | Hail, wind, tornado | | Midwest, West | | | 5 | | | | 3 | | | | - | | | | 8 | |
| Jun. 21-24 | | Hail, wind, tornado | | Midwest | | | 2 | | | | 3 | | | | - | | | | 5 | |
| Jun. 25-28 | | Hail, wind, tornado | | Midwest | | | 3 | | | | 5 | | | | - | | | | 8 | |
| Jun. 30-Jul. 1 | | Hail, wind | | West | | | 4 | | | | 4 | | | | - | | | | 8 | |
| Jul. 20-23 | | Hail, wind, tornado | | Midwest | | | 12 | | | | 4 | | | | - | | | | 16 | |
| Oct. 4-6 | | Hail, wind | | South | | | 6 | | | | 1 | | | | - | | | | 7 | |
| Oct. 26-28 | | Hail, wind, tornado | | Midwest | | | 6 | | | | 4 | | | | - | | | | 10 | |
| All other 2010 catastrophes | | | | | 19 | | | | 9 | | | | - | | | | 28 | |
| Development on 2009 and prior catastrophes | | | | | (12 | ) | | | (5 | ) | | | - | | | | (17 | ) |
| | | | | | | $ | 89 | | | $ | 58 | | | $ | 1 | | | $ | 148 | |
|
| | | | | | | | | | | | | | | | | | |
| (Dollars in millions, net of reinsurance) | | | | | | | Excess | | |
| | | | | Commercial | | Personal | | and surplus | | |
| Dates | Events | Regions | | lines | | lines | | lines | | Total |
| 2014 | | | | |
| | |
| | |
| | |
|
| Jan. 5-8 | Freezing, ice, snow, wind | Midwest, Northeast, South | | $ | 45 |
| | $ | 24 |
| | $ | 1 |
| | $ | 70 |
|
| Apr. 27-May 1 | Flood, hail, wind | Midwest, Northeast, South | | 4 |
| | 9 |
| | — |
| | 13 |
|
| May 10-13 | Flood, hail, wind | Midwest | | 6 |
| | 7 |
| | — |
| | 13 |
|
| May 18-19 | Flood, hail, wind | Midwest, South, West | | 23 |
| | 19 |
| | 1 |
| | 43 |
|
| Jun. 3-4 | Flood, hail, wind | Midwest | | 9 |
| | 1 |
| | — |
| | 10 |
|
| All other 2014 catastrophes | | | 48 |
| | 32 |
| | 1 |
| | 81 |
|
| Development on 2013 and prior catastrophes | | (15 | ) | | (11 | ) | | — |
| | (26 | ) |
| Calendar year incurred total | | | $ | 120 |
| | $ | 81 |
| | $ | 3 |
| | $ | 204 |
|
| | | | | | | | | | | |
| 2013 | | | | |
| | |
| | |
| | |
|
| Mar. 18-19 | Hail, wind | South | | $ | 4 |
| | $ | 7 |
| | $ | — |
| | $ | 11 |
|
| Apr. 7-11 | Hail, lightning, wind | Midwest, West | | 12 |
| | 10 |
| | — |
| | 22 |
|
| Apr. 16-19 | Hail, lightning, wind | Midwest | | 5 |
| | 6 |
| | — |
| | 11 |
|
| May. 18-20 | Hail, lightning, wind | Midwest, Northeast, South | | 9 |
| | 1 |
| | — |
| | 10 |
|
| May. 28-29 | Hail, lightning, wind | South | | 8 |
| | 2 |
| | 1 |
| | 11 |
|
| Jun. 24-26 | Hail, lightning, wind | Midwest, Northeast | | 5 |
| | 6 |
| | — |
| | 11 |
|
| Jul. 9-11 | Hail, lightning, wind | Midwest, Northeast | | 5 |
| | 6 |
| | — |
| | 11 |
|
| Jul. 23-24 | Hail, lightning, wind | Midwest, South | | 14 |
| | 4 |
| | — |
| | 18 |
|
| Aug. 6-7 | Hail, lightning, wind | Midwest | | 6 |
| | 9 |
| | — |
| | 15 |
|
| Nov. 17-18 | Hail, lightning, wind | Midwest, South | | 18 |
| | 17 |
| | — |
| | 35 |
|
| All other 2013 catastrophes | | | 28 |
| | 16 |
| | — |
| | 44 |
|
| Development on 2012 and prior catastrophes | | | (17 | ) | | (10 | ) | | — |
| | (27 | ) |
| Calendar year incurred total | | | $ | 97 |
| | $ | 74 |
| | $ | 1 |
| | $ | 172 |
|
| | | | | | | | | | | |
| 2012 | | | | |
| | |
| | |
| | |
|
| Feb. 28-29 | Hail, tornado, wind | Midwest | | $ | 19 |
| | $ | 6 |
| | $ | — |
| | $ | 25 |
|
| Mar. 2-3 | Hail, tornado, wind | Midwest, South | | 30 |
| | 48 |
| | — |
| | 78 |
|
| Apr. 28-29 | Hail, lightning, wind | Midwest, South | | 53 |
| | 26 |
| | 1 |
| | 80 |
|
| Jun. 28-Jul. 2 | Hail, lightning, wind | Midwest, Northeast, South | | 39 |
| | 42 |
| | — |
| | 81 |
|
| Jul. 2-4 | Hail, lightning, wind | Midwest, Northeast | | 7 |
| | 5 |
| | — |
| | 12 |
|
| Oct. 28-31 | Sandy | Midwest, Northeast, South | | 20 |
| | 10 |
| | — |
| | 30 |
|
| All other 2012 catastrophes | | | 43 |
| | 23 |
| | 1 |
| | 67 |
|
| Development on 2011 and prior catastrophes | | | (17 | ) | | (22 | ) | | — |
| | (39 | ) |
| Calendar year incurred total | | | $ | 194 |
| | $ | 138 |
| | $ | 2 |
| | $ | 334 |
|
| | | | | | | | | | | |
Cincinnati Financial Corporation - 2014 10-K - Page 62
Consolidated Property Casualty Insurance Loss and Loss Expenses
Loss and loss expenses include both net paid losses and reserve changes for unpaid losses as well as the associated loss expenses. Most of the incurred losses and loss expenses shown in the consolidated property casualty insurance results three-year highlights table
on Page 52 are for the respective current accident years,
andwith reserve development on prior accident years
is shown separately. Since less than half of our consolidated property casualty current accident year incurred losses and loss expenses represents net paid
losses,amounts, the majority represents reserves for our estimate of ultimate losses and loss expenses. These reserves develop over time, and we re-estimate previously reported reserves as we learn more about the development of the related claims. The table below illustrates that development. For example, the
86.466.0 percent accident year
20112013 loss and loss expense ratio reported as of December 31,
2011,2013, developed favorably by
4.91.6 percentage points to
81.564.4 percent due to claims settling for less than previously estimated, or due to updated reserve estimates for unpaid claims, as of December 31,
2012.2014. Accident years
20112013 and
20102012 have both developed favorably, as indicated by the progression over time for the ratios in the table.
| (Dollars in millions) | | | | | | | | | | | | | | | | | | |
| Accident year loss and loss expenses incurred and ratios to earned premiums: | | | | | | | | | | |
| Accident Year: | | 2012 | | | 2011 | | | 2010 | | | 2012 | | | 2011 | | | 2010 | |
| as of December 31, 2012 | | $ | 2,533 | | | $ | 2,467 | | | $ | 2,072 | | | | 75.7 | % | | | 81.5 | % | | | 70.9 | % |
| as of December 31, 2011 | | | | | | | 2,620 | | | | 2,140 | | | | | | | | 86.4 | | | | 73.2 | |
| as of December 31, 2010 | | | | | | | | | | | 2,319 | | | | | | | | | | | | 79.2 | |
|
| | | | | | | | | | | | | | | | | | | | | |
| (Dollars in millions) | | | | | | | | | | | | |
| Accident year loss and loss expenses incurred and ratios to earned premiums: | | | | | | |
| Accident year: | | 2014 | | 2013 | | 2012 | | 2014 | | 2013 | | 2012 |
| as of December 31, 2014 | | $ | 2,725 |
| | $ | 2,391 |
| | $ | 2,416 |
| | 67.4 | % | | 64.4 | % | | 72.3 | % |
| as of December 31, 2013 | | |
| | 2,448 |
| | 2,431 |
| | |
| | 66.0 |
| | 72.7 |
|
| as of December 31, 2012 | | |
| | |
| | 2,533 |
| | |
| | |
| | 75.7 |
|
| | | | | | | | | | | | | |
Catastrophe loss trends, discussed above,
explainaccount for much of the movement in current accident year loss and loss expense ratios for years
2010 through 2012.2012 to 2013, while noncatastrophe weather and higher commercial casualty IBNR, noted above, account for most of the change between 2013 to 2014. Catastrophe losses added
11.15.7 percentage points
forin 2014, 5.4 points in 2013 and 11.1 points in 2012
13.4 points for 2011 and 5.6 points for 2010 to the respective consolidated property casualty
current accident year loss and loss expense ratios in the table above.
The
64.661.7 percent ratio for current accident year loss and loss expenses before catastrophe losses for
2012 declined 8.42014 rose 1.1 percentage points compared with the
73.060.6 percent accident year
20112013 ratio measured as of December 31,
2011. Large2013. Noncatastrophe weather losses
described below and
higher commercial casualty IBNR, noted above, largely accounted for the
corresponding ratios for new losses above $250,000 caused a 1.9 percentage-point decrease in the 2012 ratio. The effect of the $42 million ceded premiums to reinstate coverage layers of our property catastrophe reinsurance treaty increased the 2011 ratio by 1.0 percentage point. A refinement to our line of business allocation process for loss expenses reduced the 2011 accident year lossincrease and
loss expenses before catastrophes ratio by approximately 1.5 percentage points. We believe the remaining 7.0 percentage points of the reduction is largely due tooffset favorable effects from initiatives to improve pricing precision and loss experience related to claims and loss control
practices, somewhat offset by normal loss cost inflation.The refined allocation in 2011 had no effect on earnings or consolidated property casualty ratios reported on a calendar year basis. The allocation refinement pertained to the portion of loss expenses referred to as AOE, with the refined allocation to lines of business based on claim counts rather than the previous basis of claim dollar amounts. As a result of the allocation refinement, loss expense reserves for AOE at December 31, 2011, increased by $23 million for our personal lines insurance segment and decreased by $23 million for our commercial lines insurance segment. Discussion of AOE reserves is included in Critical Accounting Estimates, How Reserves Are Established, Page 43.
practices.
Reserve development on prior accident years continued to net to a favorable amount in 2012, as2014. We recognized $98million in favorable development in 2014, less benefit than $147 million in 2013 and $396 million in 2012. Of the $49 million decrease in 2014, compared with 2013, $74 million was recognized, higher than $285 million in 2011 and $304 million in 2010.attributable to our commercial casualty line of business. Approximately 6387 percent of our net favorable reserve development on prior accident years recognized during 20122014 occurred in our workers’ compensation and commercial property lines of business. In 2013, our commercial casualty and workers’workers' compensation lines of business. In 2011, those lines of business were responsible for approximately 8057 percent of the favorable reserve development. As discussed in ConsolidatedLiquidity and Capital Resources, Property Casualty Loss and Loss Expense Obligations and Reserves, Property Casualty Insurance Development of Estimated Reserves by Accident Year, Page 92, those linescommercial casualty and workers' compensation are considered long-tail lines with potential for revisions inherent in estimating reserves. DevelopmentFavorable development recognized during 20102012 was also primarily from our commercial casualty lineand workers’ compensation lines of business. Development by line of business is further analyzed in Consolidated Property Casualty Insurance Development of Estimated Reserves by Accident Year,Year.
Cincinnati Financial Corporation - 2014 10-K - Page
92.63
Consolidated Property Casualty Insurance Losses by Size
| (Dollars in millions) | | Years ended December 31, | | | 2012-2011 | | | 2011-2010 | |
| | | 2012 | | | 2011 | | | 2010 | | | Change % | | | Change % | |
| New losses greater than $4,000,000 | | $ | 68 | | | $ | 56 | | | $ | 49 | | | | 21 | | | | 14 | |
| New losses $1,000,000-$4,000,000 | | | 161 | | | | 173 | | | | 142 | | | | (7 | ) | | | 22 | |
| New losses $250,000-$1,000,000 | | | 205 | | | | 217 | | | | 200 | | | | (6 | ) | | | 9 | |
| Case reserve development above $250,000 | | | 250 | | | | 210 | | | | 178 | | | | 19 | | | | 18 | |
| Total large losses incurred | | | 684 | | | | 656 | | | | 569 | | | | 4 | | | | 15 | |
| Other losses excluding catastrophe losses | | | 794 | | | | 898 | | | | 935 | | | | (12 | ) | | | (4 | ) |
| Catastrophe losses | | | 321 | | | | 395 | | | | 148 | | | | (19 | ) | | | 167 | |
| Total net losses incurred | | $ | 1,799 | | | $ | 1,949 | | | $ | 1,652 | | | | (8 | ) | | | 18 | |
| | | | | | | | | | | | | | | | | | | | | |
| | | | | | | | | | | | | | Pt. Change | | | Pt. Change | |
| Ratios as a percent of earned premiums: | | | | | | | | | | | | | | | | | | | | |
| New losses greater than $4,000,000 | | | 2.0 | % | | | 1.9 | % | | | 1.7 | % | | | 0.1 | | | | 0.2 | |
| New losses $1,000,000-$4,000,000 | | | 4.8 | | | | 5.7 | | | | 4.8 | | | | (0.9 | ) | | | 0.9 | |
| New losses $250,000-$1,000,000 | | | 6.1 | | | | 7.2 | | | | 6.8 | | | | (1.1 | ) | | | 0.4 | |
| Case reserve development above $250,000 | | | 7.5 | | | | 6.9 | | | | 6.1 | | | | 0.6 | | | | 0.8 | |
| Total large loss ratio | | | 20.4 | | | | 21.7 | | | | 19.4 | | | | (1.3 | ) | | | 2.3 | |
| Other losses excluding catastrophe losses | | | 23.8 | | | | 29.6 | | | | 32.0 | | | | (5.8 | ) | | | (2.4 | ) |
| Catastrophe losses | | | 9.6 | | | | 13.1 | | | | 5.1 | | | | (3.5 | ) | | | 8.0 | |
| Total net loss ratio | | | 53.8 | % | | | 64.4 | % | | | 56.5 | % | | | (10.6 | ) | | | 7.9 | |
|
| | | | | | | | | | | | | | | | | | |
| (Dollars in millions, net of reinsurance) | | Years ended December 31, | | 2014-2013 | | 2013-2012 |
| | | 2014 | | 2013 | | 2012 | | Change % | | Change % |
| Current accident year losses greater than $5,000,000 | | $ | 30 |
| | $ | 23 |
| | $ | 22 |
| | 30 |
| | 5 |
|
| Current accident year losses $1,000,000-$5,000,000 | | 172 |
| | 167 |
| | 150 |
| | 3 |
| | 11 |
|
| Large loss prior accident year reserve development | | 7 |
| | 44 |
| | 9 |
| | (84 | ) | | nm |
|
| Total large losses incurred | | 209 |
| | 234 |
| | 181 |
| | (11 | ) | | 29 |
|
| Losses incurred but not reported | | 133 |
| | 123 |
| | (14 | ) | | 8 |
| | nm |
|
| Other losses excluding catastrophe losses | | 1,660 |
| | 1,412 |
| | 1,311 |
| | 18 |
| | 8 |
|
| Catastrophe losses | | 197 |
| | 166 |
| | 321 |
| | 19 |
| | (48 | ) |
| Total losses incurred | | $ | 2,199 |
| | $ | 1,935 |
| | $ | 1,799 |
| | 14 |
| | 8 |
|
| | | | | | | | | | | |
| Ratios as a percent of earned premiums: | | |
| | |
| | |
| | Pt. Change | | Pt. Change |
| Current accident year losses greater than $5,000,000 | | 0.7 | % | | 0.6 | % | | 0.7 | % | | 0.1 |
| | (0.1 | ) |
| Current accident year losses $1,000,000-$5,000,000 | | 4.3 |
| | 4.5 |
| | 4.5 |
| | (0.2 | ) | | — |
|
| Large loss prior accident year reserve development | | 0.2 |
| | 1.2 |
| | 0.3 |
| | (1.0 | ) | | 0.9 |
|
| Total large loss ratio | | 5.2 |
| | 6.3 |
| | 5.5 |
| | (1.1 | ) | | 0.8 |
|
| Losses incurred but not reported | | 3.3 |
| | 3.3 |
| | (0.4 | ) | | — |
| | 3.7 |
|
| Other losses excluding catastrophe losses | | 41.0 |
| | 38.0 |
| | 39.1 |
| | 3.0 |
| | (1.1 | ) |
| Catastrophe losses | | 4.9 |
| | 4.5 |
| | 9.6 |
| | 0.4 |
| | (5.1 | ) |
| Total loss ratio | | 54.4 | % | | 52.1 | % | | 53.8 | % | | 2.3 |
| | (1.7 | ) |
| | | | | | | | | | | |
In
2012,2014, total large losses incurred
increaseddecreased by
$28$25 million or
411 percent, net of reinsurance. The corresponding ratio decreased
1.31.1 percentage
points, as earned premium growth more than doubled the rate of growth in total large losses.points. Large loss trends are further analyzed in the segment discussion and analysis that follows discussion of consolidated property casualty results. Our analysis of large losses incurred indicated no unexpected concentration of these losses and reserve increases by geographic region, policy inception, agency or field marketing territory. We believe the inherent volatility of aggregate loss experience for our portfolio of larger policies is greater than that of our portfolio of smaller policies, and we continue to monitor the volatility in addition to general inflationary trends in loss costs.
Consolidated Property Casualty Insurance Underwriting Expenses
| (Dollars in millions) | | Years ended December 31, | | | 2012-2011 | | | 2011-2010 | |
| | | 2012 | | | 2011 | | | 2010 | | | Change % | | | Change % | |
| Commission expenses | | $ | 635 | | | $ | 565 | | | $ | 544 | | | | 12 | | | | 4 | |
| Other underwriting expenses | | | 425 | | | | 395 | | | | 404 | | | | 8 | | | | (2 | ) |
| Policyholder dividends | | | 16 | | | | 16 | | | | 14 | | | | 0 | | | | 14 | |
| Total underwriting expenses | | $ | 1,076 | | | $ | 976 | | | $ | 962 | | | | 10 | | | | 1 | |
| | | | | | | | | | | | | | | | | | | | | |
| | | | | | | | | | | | | | Pt. Change | | | Pt. Change | |
| Ratios as a percent of earned premiums: | | | | | | | | | | | | | | | | | | | | |
| Commission expenses | | | 19.0 | % | | | 18.7 | % | | | 18.6 | % | | | 0.3 | | | | 0.1 | |
| Other underwriting expenses | | | 12.7 | | | | 13.1 | | | | 13.8 | | | | (0.4 | ) | | | (0.7 | ) |
| Policyholder dividends | | | 0.5 | | | | 0.5 | | | | 0.5 | | | | 0.0 | | | | 0.0 | |
| Total underwriting expense ratio | | | 32.2 | % | | | 32.3 | % | | | 32.9 | % | | | (0.1 | ) | | | (0.6 | ) |
|
| | | | | | | | | | | | | | | | | | |
| (Dollars in millions) | | Years ended December 31, | | 2014-2013 | | 2013-2012 |
| | | 2014 | | 2013 | | 2012 | | Change % | | Change % |
| Commission expenses | | $ | 744 |
| | $ | 705 |
| | $ | 635 |
| | 6 |
| | 11 |
|
| Other underwriting expenses | | 478 |
| | 462 |
| | 425 |
| | 3 |
| | 9 |
|
| Policyholder dividends | | 16 |
| | 16 |
| | 16 |
| | 0 |
| | 0 |
|
| Total underwriting expenses | | $ | 1,238 |
| | $ | 1,183 |
| | $ | 1,076 |
| | 5 |
| | 10 |
|
| | | | | | | | | | | |
| Ratios as a percent of earned premiums: | | |
| | |
| | |
| | Pt. Change | | Pt. Change |
| Commission expense | | 18.4 | % | | 19.0 | % | | 19.0 | % | | (0.6 | ) | | 0.0 |
|
| Other underwriting expense | | 11.8 |
| | 12.5 |
| | 12.7 |
| | (0.7 | ) | | (0.2 | ) |
| Policyholder dividends | | 0.4 |
| | 0.4 |
| | 0.5 |
| | 0.0 |
| | (0.1 | ) |
| Total underwriting expense ratio | | 30.6 | % | | 31.9 | % | | 32.2 | % | | (1.3 | ) | | (0.3 | ) |
| | | | | | | | | | | |
Consolidated property casualty commission expenses rose $70$39 million or 126 percent in 2014, with profit-sharing commissions for agencies rising by $34$10 million. Commission expenses as a percent of earned premium increased during 2012,premiums resulted in a ratio that was 0.6 percentage points lower than in 2013, primarily due to lower commission rates for selected personal lines insurance products, beginning in March of 2014. The 2014 ratio for other underwriting expenses was 0.7 percentage-points lower than 2013, reflecting a 109 percent increase in earned premiums that was lowerhigher than the 12
Cincinnati Financial Corporation - 2014 10-K - Page 64
3 percent increase in
commissionthose expenses.
During 2014, we continued to carefully manage expenses by keeping growth of other underwriting expenses at a pace slower than premium growth.
Commission expenses include our profit-sharing commissions, which are primarily based on one-year and three-year profitability of an agency’s business. The aggregate profit trend for agencies that earn these profit-based commissions can differ from the aggregate profit trend for all agencies reflected in our consolidated property casualty results.
In 2011, the ratio for property casualty profit-sharing commissions declined slightly while the ratio for total commissions rose slightly, netting to a small increase of 0.1 percentage point.Other underwriting expenses as a percent of earned premium for 2012 decreased, as higher earned premiums offset an 8 percent increase in expenses. In 2011, other underwriting expenses were down $9 million or 2 percent, primarily due to a first-quarter 2010 provision for matters involving contingent liabilities.
Salaries, benefits and payroll taxes for our associates account for approximately half of our property casualty other underwriting expenses. Most of our associates either provide direct service to the property casualty portion of our agencies’
businessbusinesses or provide support to those associates. Since the end of 2009, the total number of associates, on a consolidated basis,
declinedrose by 3 percent, reflecting careful management of our noncommission
expenses.expenses during a period of significant premium growth. The total number of field associates providing direct service to agencies rose by
612 percent, reflecting our emphasis on providing excellent service in addition to territory expansion.
Discussions below of our property casualty insurance segments provide additional detail about our results.
Cincinnati Financial Corporation - 2014 10-K - Page 65
Commercial Lines Insurance Results
of OperationsOverview – Three-Year Highlights
| (Dollars in millions) | | Years ended December 31, | | | 2012-2011 | | | 2011-2010 | |
| | | 2012 | | | 2011 | | | 2010 | | | Change % | | | Change % | |
| | | | | | | | | | | | | | | | |
| Earned premiums | | $ | 2,383 | | | $ | 2,197 | | | $ | 2,154 | | | | 8 | | | | 2 | |
| Fee revenues | | | 4 | | | | 3 | | | | 2 | | | | 33 | | | | 50 | |
| Total revenues | | | 2,387 | | | | 2,200 | | | | 2,156 | | | | 9 | | | | 2 | |
| | | | | | | | | | | | | | | | | | | | | |
| Loss and loss expenses from: | | | | | | | | | | | | | | | | | | | | |
| Current accident year before catastrophe losses | | | 1,501 | | | | 1,579 | | | | 1,605 | | | | (5 | ) | | | (2 | ) |
| Current accident year catastrophe losses | | | 211 | | | | 225 | | | | 101 | | | | (6 | ) | | | 123 | |
| Prior accident years before catastrophe losses | | | (275 | ) | | | (236 | ) | | | (257 | ) | | | (17 | ) | | | 8 | |
| Prior accident years catastrophe losses | | | (17 | ) | | | 2 | | | | (12 | ) | | | nm | | | | nm | |
| Total loss and loss expenses | | | 1,420 | | | | 1,570 | | | | 1,437 | | | | (10 | ) | | | 9 | |
| Underwriting expenses | | | 786 | | | | 732 | | | | 705 | | | | 7 | | | | 4 | |
| Underwriting profit (loss) | | $ | 181 | | | $ | (102 | ) | | $ | 14 | | | | nm | | | | nm | |
| | | | | | | | | | | | | | | | | | | | | |
| | | | | | | | | | | | | | Pt. Change | | | Pt. Change | |
| Ratios as a percent of earned premiums: | | | | | | | | | | | | | | | | | | | | |
| Current accident year before catastrophe losses | | | 62.9 | % | | | 71.8 | % | | | 74.5 | % | | | (8.9 | ) | | | (2.7 | ) |
| Current accident year catastrophe losses | | | 8.9 | | | | 10.3 | | | | 4.7 | | | | (1.4 | ) | | | 5.6 | |
| Prior accident years before catastrophe losses | | | (11.6 | ) | | | (10.8 | ) | | | (11.9 | ) | | | (0.8 | ) | | | 1.1 | |
| Prior accident years catastrophe losses | | | (0.7 | ) | | | 0.1 | | | | (0.6 | ) | | | (0.8 | ) | | | 0.7 | |
| Total loss and loss expenses | | | 59.5 | | | | 71.4 | | | | 66.7 | | | | (11.9 | ) | | | 4.7 | |
| Underwriting expenses | | | 33.0 | | | | 33.4 | | | | 32.7 | | | | (0.4 | ) | | | 0.7 | |
| Combined ratio | | | 92.5 | % | | | 104.8 | % | | | 99.4 | % | | | (12.3 | ) | | | 5.4 | |
| | | | | | | | | | | | | | | | | | | | | |
| Combined ratio: | | | 92.5 | % | | | 104.8 | % | | | 99.4 | % | | | (12.3 | ) | | | 5.4 | |
| Contribution from catastrophe losses and prior years reserve development | | | (3.4 | ) | | | (0.4 | ) | | | (7.8 | ) | | | (3.0 | ) | | | 7.4 | |
| Combined ratio before catastrophe losses and prior years reserve development | | | 95.9 | % | | | 105.2 | % | | | 107.2 | % | | | (9.3 | ) | | | (2.0 | ) |
|
| | | | | | | | | | | | | | | | | | |
| (Dollars in millions) | | Years ended December 31, | | 2014-2013 | | 2013-2012 |
| | | 2014 | | 2013 | | 2012 | | Change % | | Change % |
| Earned premiums | | $ | 2,856 |
| | $ | 2,636 |
| | $ | 2,383 |
| | 8 |
| | 11 |
|
| Fee revenues | | 4 |
| | 3 |
| | 4 |
| | 33 |
| | (25 | ) |
| Total revenues | | 2,860 |
| | 2,639 |
| | 2,387 |
| | 8 |
| | 11 |
|
| Loss and loss expenses from: | | |
| | |
| | |
| | |
| | |
| Current accident year before catastrophe losses | | 1,734 |
| | 1,577 |
| | 1,501 |
| | 10 |
| | 5 |
|
| Current accident year catastrophe losses | | 135 |
| | 114 |
| | 211 |
| | 18 |
| | (46 | ) |
| Prior accident years before catastrophe losses | | (42 | ) | | (78 | ) | | (275 | ) | | 46 |
| | 72 |
|
| Prior accident years catastrophe losses | | (15 | ) | | (17 | ) | | (17 | ) | | 12 |
| | 0 |
|
| Total loss and loss expenses | | 1,812 |
| | 1,596 |
| | 1,420 |
| | 14 |
| | 12 |
|
| Underwriting expenses | | 902 |
| | 857 |
| | 786 |
| | 5 |
| | 9 |
|
| Underwriting profit | | $ | 146 |
| | $ | 186 |
| | $ | 181 |
| | (22 | ) | | 3 |
|
| Ratios as a percent of earned premiums: | | |
| | |
| | |
| | Pt. Change | | Pt. Change |
| Current accident year before catastrophe losses | | 60.7 | % | | 59.8 | % | | 62.9 | % | | 0.9 |
| | (3.1 | ) |
| Current accident year catastrophe losses | | 4.8 |
| | 4.3 |
| | 8.9 |
| | 0.5 |
| | (4.6 | ) |
| Prior accident years before catastrophe losses | | (1.5 | ) | | (3.0 | ) | | (11.6 | ) | | 1.5 |
| | 8.6 |
|
| Prior accident years catastrophe losses | | (0.5 | ) | | (0.6 | ) | | (0.7 | ) | | 0.1 |
| | 0.1 |
|
| Total loss and loss expense | | 63.5 |
| | 60.5 |
| | 59.5 |
| | 3.0 |
| | 1.0 |
|
| Underwriting expense | | 31.6 |
| | 32.5 |
| | 33.0 |
| | (0.9 | ) | | (0.5 | ) |
| Combined ratio | | 95.1 | % | | 93.0 | % | | 92.5 | % | | 2.1 |
| | 0.5 |
|
| | | | | | | | | | | |
| Combined ratio: | | 95.1 | % | | 93.0 | % | | 92.5 | % | | 2.1 |
| | 0.5 |
|
Contribution from catastrophe losses and prior years
reserve development | | 2.8 |
| | 0.7 |
| | (3.4 | ) | | 2.1 |
| | 4.1 |
|
Combined ratio before catastrophe losses and prior years reserve development | | 92.3 | % | | 92.3 | % | | 95.9 | % | | 0.0 |
| | (3.6 | ) |
| | | | | | | | | | | |
Performance highlights for the commercial lines
insurance segment include:
| · | Premiums – Earned premiums and net written premiums rose in 2012, primarily due to a $166 million increase in renewal written premiums that continued to reflect improved pricing. Premium growth initiatives that helped new business written premiums grow $45 million in 2012 also contributed to earned and net written premium growth. Other written premiums also helped increase 2012 earned and net written premiums, largely due to the effect in 2011 of $24 million for ceded premiums to reinstate coverage layers of our property catastrophe reinsurance treaty. |
| · | Combined ratio – The 2012 combined ratio improved 12.3 percentage points, largely due to a lower ratio for current accident year losses and loss expenses before catastrophe losses that benefited from recent-year initiatives to improve pricing precision and loss experience related to claims and loss control practices. Initiatives to improve commercial lines underwriting profitability complement our business practices that continue to leverage the local presence of our field staff, who meet with local agencies to assess each risk, determine limits of insurance and establish appropriate terms and conditions. Our field marketing representatives continue to underwrite new business while loss control, machinery and equipment and field claims representatives continue to conduct on-site inspections. Field claims representatives also assist underwriters by preparing full reports on their first-hand observations of risk quality. |
Premiums – Earned premiums and net written premiums each rose again in 2014, primarily due to a $207 million increase in renewal written premiums, which continued to reflect improved pricing. New business written premiums in 2014 were down $31 million, or 8 percent, compared with the record-high amount we reported in 2013.
Combined ratio – The 2014 combined ratio rose 2.1 percentage points compared with 2013, largely reflecting a 0.6 percentage-point increase in the ratio for natural catastrophe losses and a 1.0 point increase for noncatastrophe weather losses. Those unfavorable weather effects somewhat offset benefits from higher pricing and from recent-year initiatives to improve pricing precision and loss experience related to claims and loss control practices. Development on prior accident years’ loss and loss expense reserves before catastrophes during 2014 was 1.5 percentage points less favorable than in 2013, including 0.7 points from re-estimates of IBNR reserves for losses and loss expenses.
Our largest commercial line of business, commercial casualty, experienced an increase in its 2014 total loss and loss expense ratio. While that line was still profitable in 2014, its higher ratio had the effect of increasing our 2014 commercial lines insurance segment total loss and loss expense ratio by 4.2 percentage points, compared with 2013. As a percentage of its $938 million in 2014 earned premiums, our commercial casualty line of business experienced ratio increases of 1.6 points for paid losses and loss expenses for accident years three or more years ago in aggregate and 6.2 points for estimates of IBNR losses and loss expenses for all accident years in aggregate.
Cincinnati Financial Corporation - 2014 10-K - Page 66
As discussed in Critical Accounting Estimates, Property Casualty Insurance Loss and Loss Expense Reserves, stable historical paid loss patterns are a key assumption used to make projections necessary for estimating IBNR reserves. During 2014, paid losses for commercial casualty, especially related to a few umbrella liability claims, emerged at levels higher than we expected, particularly for accident years 2005 and 2007. Considering that new data, we estimated commercial casualty IBNR reserves for subsequent accident years at levels more likely to be adequate, compared with estimates at the end of 2013.
Pricing precision and other initiatives to improve commercial lines underwriting profitability complement our business practices that continue to leverage the local presence of our field staff. Field marketing representatives meet with local agencies to assess each risk, determine limits of insurance and establish appropriate terms and conditions. They continue to underwrite new business while field loss control, machinery and equipment and claims representatives continue to conduct on-site inspections. Field claims representatives also assist underwriters by preparing full reports on their first-hand observations of risk quality.
Our commercial lines statutory combined ratio was
94.3 percent in 2014 compared with 91.8 percent in 2013 and 92.1 percent in
2012 compared with 104.2 percent in 2011 and 99.6 percent in 2010.2012. The estimated commercial lines combined ratios for the industry were
109.097.7 percent in
2012, 106.72014, 98.3 percent in
20112013 and
102.7104.4 percent in
2010, with the2012. The industry’s
ratio excludingratios exclude its mortgage and financial guaranty lines of business. The contribution of catastrophe losses to our commercial lines statutory combined ratio was
4.3 percentage points in 2014, 3.7 percentage points in 2013 and 8.2 percentage points in 2012,
10.4 percent points in 2011compared with industry estimates of 3.5, 3.5 and
4.17.4 percentage points,
in 2010, compared with an estimated 9.3, 7.4 and 3.5 percentage points, respectively, for the industry.respectively.
Commercial Lines Insurance Premiums
| (Dollars in millions) | | Years ended December 31, | | | 2012-2011 | | | 2011-2010 | |
| | | 2012 | | | 2011 | | | 2010 | | | Change % | | | Change % | |
| Agency renewal written premiums | | $ | 2,229 | | | $ | 2,063 | | | $ | 1,978 | | | | 8 | | | | 4 | |
| Agency new business written premiums | | | 352 | | | | 307 | | | | 289 | | | | 15 | | | | 6 | |
| Other written premiums | | | (122 | ) | | | (152 | ) | | | (112 | ) | | | 20 | | | | (36 | ) |
| Net written premiums | | | 2,459 | | | | 2,218 | | | | 2,155 | | | | 11 | | | | 3 | |
| Unearned premium change | | | (76 | ) | | | (21 | ) | | | (1 | ) | | | (262 | ) | | | nm | |
| Earned premiums | | $ | 2,383 | | | $ | 2,197 | | | $ | 2,154 | | | | 8 | | | | 2 | |
|
| | | | | | | | | | | | | | | | | | |
| (Dollars in millions) | | Years ended December 31, | | 2014-2013 | | 2013-2012 |
| | | 2014 | | 2013 | | 2012 | | Change % | | Change % |
| Agency renewal written premiums | | $ | 2,678 |
| | $ | 2,471 |
| | $ | 2,229 |
| | 8 |
| | 11 |
|
| Agency new business written premiums | | 360 |
| | 391 |
| | 352 |
| | (8 | ) | | 11 |
|
| Other written premiums | | (116 | ) | | (102 | ) | | (122 | ) | | (14 | ) | | 16 |
|
| Net written premiums | | 2,922 |
| | 2,760 |
| | 2,459 |
| | 6 |
| | 12 |
|
| Unearned premium change | | (66 | ) | | (124 | ) | | (76 | ) | | 47 |
| | (63 | ) |
| Earned premiums | | $ | 2,856 |
| | $ | 2,636 |
| | $ | 2,383 |
| | 8 |
| | 11 |
|
| | | | | | | | | | | |
We continue to
increaserefine our use of predictive analytics tools to improve pricing precision
in response to highly competitiveas we further segment commercial lines
markets.policies, emphasizing identification and retention of policies we believe have relatively stronger price adequacy. These tools better align individual insurance policy pricing to risk attributes,
and provideproviding our underwriters with enhanced abilities to target profitability and to discuss pricing impacts with agency personnel. We also continue to leverage our local relationships with agents through the efforts of our teams that work closely with them. We believe our field focus is unique and has several advantages, including providing us with quality intelligence on local market conditions. We seek to maintain appropriate pricing discipline for both new and renewal business as management emphasizes the importance of our agencies and underwriters assessing account quality to make careful decisions on a case-by-case basis whether to write or renew a policy. Rate credits may be used to retain renewals of quality business and to earn new business, but we do so selectively in order to avoid commercial accounts that we believe have insufficient profit margins.
Our 8 percent increase in 20122014 agency renewal written premiums largely reflected higher pricing and improving economic conditions. We measure average changes in commercial lines renewal pricing as the rate of change in renewal premium for the new policy period compared with the premium for the expiring policy period, assuming no change in the level of insured exposures or policy coverage between those periods for respective policies. In 2012,2014, our standard commercial lines policies averaged an estimated pricing change that increased innear the high end of the low-single-digit range, compared with a mid-single-digit range.range in both 2013 and 2012. The average pricing change for policies renewed during 2011 was slightly positive, near the low end of the low-single-digit range. For policies renewed during both 2010 and 2009, the typical pricing change was a decline, on average, in the low-single-digit range, representing an improvement fromrange. Our average commercial lines pricing change includes the flat pricing effect of certain coverages within package policies written for a three-year term that were in force but did not expire during the period being measured. Therefore, the average commercial lines pricing change we report reflects a blend of policies that did not expire and other policies that did expire during the measurement period.
Cincinnati Financial Corporation - 2014 10-K - Page 67
For only those commercial lines policies that did expire and were then renewed during 2014, we estimate that the average price increase was in the mid-single-digit range,
slightly lower than in 2013, with smaller commercial property policies again experiencing average
renewal price percentage increases near the upper end of the high-single-digit range. During 2014, we continued to further segment our commercial lines policies, emphasizing identification and retention of policies we believed had relatively stronger price adequacy. Conversely, we continued to seek more aggressive renewal terms and conditions on policies we believed had relatively weaker pricing,
decline experienced in
2008.turn retaining fewer of those policies. As a result, the average change in commercial lines renewal pricing tended to be lower than in 2013.
In recent years prior to 2011, our agency renewal written premium trends included an unfavorable effect from the economic downturn and slow recovery in various regions.
In 2012 and 2011,Each year since then, the effect was favorable. Changes in the economy affect insured exposures that directly relate to premium amounts for any given policy. For commercial accounts, we usually calculate initial estimates for general liability premiums based on estimated sales or payroll volume, while we calculate workers’ compensation premiums based on estimated payroll volume. A change in sales or payroll volume generally indicates a change in demand for a business’s goods or services, as well as a change in its exposure to risk. Policyholders who experience sales or payroll volume changes due to economic factors may also have other exposures requiring insurance, such as commercial auto or commercial
property, in addition to general liability and workers’ compensation.property. Premium levels for these other types of coverages generally are not linked directly to sales or payroll volumes.
Premiums resulting from audits of actual sales or payrolls that confirmed or adjusted initial premium estimates
significantly affectedhave had a mixed effect on premium trends in recent years. On an earned premium basis
for our commercial lines insurance segment, audits contributed
$5 million to the $220 million earned premiums increase in 2014, negative $3 million of the $253 million earned premiums increase in 2013 and $35 million of the $186 million earned premiums increase in
2012 and $46 million of the $43 million earned premiums increase in 2011.2012. On a net written premium basis, audits contributed
$9 million of the $162 million net written premiums increase in 2014, $12 million of the $301 million net written premiums increase in 2013 and $30 million of the $241 million net written premiums increase in
2012 and $34 million of the $63 million net written premiums increase in 2011.2012.
In
2012,2014, our commercial lines new business premiums written by our agencies
grew 15decreased 8 percent
up from 6or $31 million, compared with 2013. Commercial lines new business premiums written rose 11 percent in
2011.2013 to a record-high amount of $391 million. In 2014, our workers' compensation line of business decreased by $18 million, reflecting strong competition in the marketplace and accounting for much of the $31 million commercial lines decrease. For new business, our field associates are frequently in our agents’ offices
helping toto: help judge the quality of each
account, emphasizingaccount; emphasize the Cincinnati value
proposition, callingproposition; call on sales prospects with those
agents,agents; carefully
evaluatingevaluate risk
exposureexposure; and
providingprovide their best quotes. Some of our new business comes from accounts that are not new to the agent. We believe these seasoned accounts tend to be priced more accurately than business that
may be less familiaris new to
our agent in cases where it was recently obtained from a competing agent.us and the agency. As we appoint new agencies who choose to move accounts to us, we report these accounts as new business to us.
New business premium volume in recent years has been significantly influenced by new agency appointments. All agencies appointed since the beginning of
2011 generated2013 produced commercial lines new business written premiums of
$39$24 million during
2012,2014, up
$26$17 million from
2011,what they produced during 2013, while all other agencies contributed the remaining
$313$336 million,
up $19down $48 million from
2011.the $384 million they produced in 2013.
Other written premiums
– primarily premiums
that are ceded to
our reinsurers
and that loweras part of our
reinsurance program – in total reduced our 2014 commercial lines net written premiums
had aby $14 million more
favorable effect in 2012 than in
2011. The $302013. A decrease in ceded premiums contributed $19 million
changeto net written premium growth for
2012,2014, compared with
2011, was largely due to $24 million2013. Other written premiums also included a less favorable adjustment for 2014, compared with 2013, for estimated direct written premiums of
additional ceded premiumspolicies in
2011 for our property catastrophe reinsurance treaty, a result of reinstatement premiums following two large catastrophe events during 2011, as discussed in Consolidated Property Casualty Insurance Results of Operations, Page52.effect but not yet processed. This written premium adjustment had an immaterial effect on earned premiums.
Commercial Lines Insurance Loss and Loss Expenses
Loss and loss expenses include both net paid losses and reserve changes for unpaid losses as well as the associated loss expenses. Most of the incurred losses and loss expenses shown in the commercial lines insurance segment three-year highlights table on Page 57 are for the respective current accident years, andwith reserve development on prior accident years is shown separately. Since less than half of our commercial lines insurance segment current accident year incurred losses and loss expenses represents net paid losses,amounts, the majority represents reserves for our estimate of ultimate losses and loss expenses. These reserves develop over time, and we re-estimate previously
Cincinnati Financial Corporation - 2014 10-K - Page 68
reported reserves as we learn more about the development of the related claims. The table below illustrates that development. For example, the
82.164.1 percent accident year
20112013 loss and loss expense ratio reported as of December 31,
2011,2013, developed favorably by
4.21.2 percentage points to
77.962.9 percent due to claims settling for less than previously estimated, or due to updated reserve estimates for unpaid claims, as of December 31,
2012.2014. Accident years
20112013 and
20102012 for the commercial lines
insurance segment have both developed favorably, as indicated by the progression over time for the ratios in the table.
| (Dollars in millions) | | | | | | | | | | | | | | | | | | |
| Accident year loss and loss expenses incurred and ratios to earned premiums: | | | | | | | | | | | | |
| Accident Year: | | 2012 | | | 2011 | | | 2010 | | | 2012 | | | 2011 | | | 2010 | |
| as of December 31, 2012 | | $ | 1,712 | | | $ | 1,711 | | | $ | 1,508 | | | | 71.8 | % | | | 77.9 | % | | | 70.0 | % |
| as of December 31, 2011 | | | | | | | 1,804 | | | | 1,557 | | | | | | | | 82.1 | | | | 72.3 | |
| as of December 31, 2010 | | | | | | | | | | | 1,706 | | | | | | | | | | | | 79.2 | |
|
| | | | | | | | | | | | | | | | | | | | | |
| (Dollars in millions) | | | | | | | | | | | | |
| Accident year loss and loss expenses incurred and ratios to earned premiums: | | | | | |
| Accident year: | | 2014 | | 2013 | | 2012 | | 2014 | | 2013 | | 2012 |
| as of December 31, 2014 | | $ | 1,869 |
| | $ | 1,658 |
| | $ | 1,639 |
| | 65.5 | % | | 62.9 | % | | 68.8 | % |
| as of December 31, 2013 | | |
| | 1,691 |
| | 1,646 |
| | |
| | 64.1 |
| | 69.1 |
|
| as of December 31, 2012 | | |
| | |
| | 1,712 |
| | |
| | |
| | 71.8 |
|
| | | | | | | | | | | | | |
Catastrophe losses, as discussed in Consolidated Property Casualty Insurance Results,
of Operations, Page 52, explain much of the movement in current accident year loss and loss expense ratios for accident years
20102012 through
2012.2014. Catastrophe losses added
8.94.8 percentage points
forin 2014, 4.3 points in 2013 and 8.9 points in 2012
10.3 points for 2011 and 4.7 points for 2010 to the respective commercial lines
current accident year loss and loss expense ratios in the table above.
The
62.960.7 percent ratio for current accident year loss and loss expenses before catastrophe losses for
2012 declined 8.92014 rose 0.9 percentage points compared with the
71.859.8 percent accident year
20112013 ratio measured as of December 31,
2011. Large2013. Noncatastrophe weather losses,
described below, and the corresponding ratiosnoted above, accounted for
new losses above $250,000 caused a 2.6 percentage-point decrease in the 2012 ratio. A refined line of business allocation process for loss expenses reduced the 2011 ratio by approximately 3 percentage points, and was partially offset by a 0.8-percentage-point effectmuch of the
$24 million ceded premiums to reinstate coverage layers of our property catastrophe reinsurance treaty. We believe the remainder of the reduction is largely due toincrease and helped offset favorable effects from initiatives to improve pricing precision and loss experience related to claims and loss control
practices, somewhat offset by normal loss cost inflation.practices. Large losses, described below, and the corresponding ratios for new losses above $1 million, contributed a 0.3 percentage-point increase to the 2014 ratio.
Commercial lines reserve development on prior accident years of $57 million in 2014 continued to net to a favorable amount, but represented a smaller benefit than the $95 million recognized in 2012, as $2922013. The $38 million was recognized, higher than $234decrease in 2014 included $74 million in 2011.from our commercial casualty line of business. More than 85 percent of our commercial lines reserve net favorable development on prior accident years recognized during 20122014 occurred in our commercial casualty and workers’ compensation linesline of business, with approximately 60 percent occurring in commercial casualty. Developmentbusiness. Favorable development recognized during 20112013 and 2012 was also mostly from our commercial casualty and workers’ compensation lines of business. In 2010, favorable development was mostly from our commercial casualty line of business. Development by line of business and other trends for commercial lines loss and loss expenses and the related ratios are further analyzed in Commercial Lines of Business Analysis beginning on Page 60, and in ConsolidatedLiquidity and Capital Resources, Property Casualty Insurance Development of Estimated Reserves by Accident Year,Year.
Cincinnati Financial Corporation - 2014 10-K - Page
92.69
Commercial Lines Insurance Losses by Size
| (Dollars in millions) | | Years ended December 31, | | | 2012-2011 | | | 2011-2010 | |
| | | 2012 | | | 2011 | | | 2010 | | | Change % | | | Change % | |
| New losses greater than $4,000,000 | | $ | 68 | | | $ | 56 | | | $ | 44 | | | | 21 | | | | 27 | |
| New losses $1,000,000-$4,000,000 | | | 122 | | | | 148 | | | | 120 | | | | (18 | ) | | | 23 | |
| New losses $250,000-$1,000,000 | | | 138 | | | | 156 | | | | 148 | | | | (12 | ) | | | 5 | |
| Case reserve development above $250,000 | | | 234 | | | | 187 | | | | 164 | | | | 25 | | | | 14 | |
| Total large losses incurred | | | 562 | | | | 547 | | | | 476 | | | | 3 | | | | 15 | |
| Other losses excluding catastrophe losses | | | 426 | | | | 517 | | | | 587 | | | | (18 | ) | | | (12 | ) |
| Catastrophe losses | | | 187 | | | | 223 | | | | 89 | | | | (16 | ) | | | 151 | |
| Total net losses incurred | | $ | 1,175 | | | $ | 1,287 | | | $ | 1,152 | | | | (9 | ) | | | 12 | |
| | | | | | | | | | | | | | | | | | | | | |
| | | | | | | | | | | | | | Pt. Change | | | Pt. Change | |
| Ratios as a percent of earned premiums: | | | | | | | | | | | | | | | | | | | | |
| New losses greater than $4,000,000 | | | 2.9 | % | | | 2.6 | % | | | 2.0 | % | | | 0.3 | | | | 0.6 | |
| New losses $1,000,000-$4,000,000 | | | 5.1 | | | | 6.7 | | | | 5.6 | | | | (1.6 | ) | | | 1.1 | |
| New losses $250,000-$1,000,000 | | | 5.8 | | | | 7.1 | | | | 6.9 | | | | (1.3 | ) | | | 0.2 | |
| Case reserve development above $250,000 | | | 9.8 | | | | 8.5 | | | | 7.6 | | | | 1.3 | | | | 0.9 | |
| Total large loss ratio | | | 23.6 | | | | 24.9 | | | | 22.1 | | | | (1.3 | ) | | | 2.8 | |
| Other losses excluding catastrophe losses | | | 17.9 | | | | 23.5 | | | | 27.3 | | | | (5.6 | ) | | | (3.8 | ) |
| Catastrophe losses | | | 7.8 | | | | 10.2 | | | | 4.1 | | | | (2.4 | ) | | | 6.1 | |
| Total net loss ratio | | | 49.3 | % | | | 58.6 | % | | | 53.5 | % | | | (9.3 | ) | | | 5.1 | |
|
| | | | | | | | | | | | | | | | | | |
| (Dollars in millions, net of reinsurance) | | Years ended December 31, | | 2014-2013 | | 2013-2012 |
| | | 2014 | | 2013 | | 2012 | | Change % | | Change % |
| Current accident year losses greater than $5,000,000 | | $ | 30 |
| | $ | 23 |
| | $ | 22 |
| | 30 |
| | 5 |
|
| Current accident year losses $1,000,000-$5,000,000 | | 149 |
| | 132 |
| | 117 |
| | 13 |
| | 13 |
|
| Large loss prior accident year reserve development | | 7 |
| | 36 |
| | 15 |
| | (81 | ) | | nm |
|
| Total large losses incurred | | 186 |
| | 191 |
| | 154 |
| | (3 | ) | | 24 |
|
| Losses incurred but not reported | | 90 |
| | 125 |
| | (7 | ) | | (28 | ) | | nm |
|
| Other losses excluding catastrophe losses | | 1,096 |
| | 923 |
| | 841 |
| | 19 |
| | 10 |
|
| Catastrophe losses | | 114 |
| | 93 |
| | 187 |
| | 23 |
| | (50 | ) |
| Total losses incurred | | $ | 1,486 |
| | $ | 1,332 |
| | $ | 1,175 |
| | 12 |
| | 13 |
|
| | | | | | | | | | | |
| Ratios as a percent of earned premiums: | | |
| | |
| | |
| | Pt. Change | | Pt. Change |
| Current accident year losses greater than $5,000,000 | | 1.0 | % | | 0.9 | % | | 0.9 | % | | 0.1 |
| | 0.0 |
|
| Current accident year losses $1,000,000-$5,000,000 | | 5.2 |
| | 5.0 |
| | 4.9 |
| | 0.2 |
| | 0.1 |
|
| Large loss prior accident year reserve development | | 0.3 |
| | 1.4 |
| | 0.6 |
| | (1.1 | ) | | 0.8 |
|
| Total large loss ratio | | 6.5 |
| | 7.3 |
| | 6.4 |
| | (0.8 | ) | | 0.9 |
|
| Losses incurred but not reported | | 3.1 |
| | 4.8 |
| | (0.2 | ) | | (1.7 | ) | | 5.0 |
|
| Other losses excluding catastrophe losses | | 38.4 |
| | 35.0 |
| | 35.3 |
| | 3.4 |
| | (0.3 | ) |
| Catastrophe losses | | 4.0 |
| | 3.5 |
| | 7.8 |
| | 0.5 |
| | (4.3 | ) |
| Total loss ratio | | 52.0 | % | | 50.6 | % | | 49.3 | % | | 1.4 |
| | 1.3 |
|
| | | | | | | | | | | |
In
2012,2014, total large losses incurred
increaseddecreased by
$15$5 million or 3 percent, net of reinsurance. The corresponding ratio decreased
1.30.8 percentage
points, as earned premium growth more than doubled the ratepoints. The 2014 decreases on both a dollar and ratio basis were largely due to lower amounts for our workers' compensation line of
growth in total large losses. An increase inbusiness and were somewhat offset by higher large losses for
our commercial
autocasualty and
general liability claims more than offset decreases for commercial
fire and workers’ compensation claims.property lines of business. In
20112013, the total large losses incurred ratio was higher than it was in
2010,2012, primarily due to higher
incurredlarge losses for
fires and commercial
auto claims.property. Our analysis indicated no unexpected concentration of these losses and reserve increases by geographic region, policy inception, agency or field marketing territory. We believe the inherent volatility of aggregate loss experience for our portfolio of larger policies is greater than that of our portfolio of smaller policies, and we continue to monitor the volatility in addition to general inflationary trends in loss costs.
Commercial Lines Insurance Underwriting Expenses
| (Dollars in millions) | | Years ended December 31, | | | 2012-2011 | | | 2011-2010 | |
| | | 2012 | | | 2011 | | | 2010 | | | Change % | | | Change % | |
| Commission expenses | | $ | 442 | | | $ | 415 | | | $ | 391 | | | | 7 | | | | 6 | |
| Other underwriting expenses | | | 328 | | | | 301 | | | | 300 | | | | 9 | | | | 0 | |
| Policyholder dividends | | | 16 | | | | 16 | | | | 14 | | | | 0 | | | | 14 | |
| Total underwriting expenses | | $ | 786 | | | $ | 732 | | | $ | 705 | | | | 7 | | | | 4 | |
| | | | | | | | | | | | | | | | | | | | | |
| | | | | | | | | | | | | | | | | | | | | |
| | | | | | | | | | | | | | Pt. Change | | | Pt. Change | |
| Ratios as a percent of earned premiums: | | | | | | | | | | | | | | | | | | |
| Commission expenses | | | 18.6 | % | | | 18.9 | % | | | 18.2 | % | | | (0.3 | ) | | | 0.7 | |
| Other underwriting expenses | | | 13.7 | | | | 13.8 | | | | 13.8 | | | | (0.1 | ) | | | 0.0 | |
| Policyholder dividends | | | 0.7 | | | | 0.7 | | | | 0.7 | | | | 0.0 | | | | 0.0 | |
| Total underwriting expense ratio | | | 33.0 | % | | | 33.4 | % | | | 32.7 | % | | | (0.4 | ) | | | 0.7 | |
|
| | | | | | | | | | | | | | | | | | |
| (Dollars in millions) | | Years ended December 31, | | 2014-2013 | | 2013-2012 |
| | | 2014 | | 2013 | | 2012 | | Change % | | Change % |
| Commission expenses | | $ | 526 |
| | $ | 492 |
| | $ | 442 |
| | 7 |
| | 11 |
|
| Other underwriting expenses | | 360 |
| | 349 |
| | 328 |
| | 3 |
| | 6 |
|
| Policyholder dividends | | 16 |
| | 16 |
| | 16 |
| | 0 |
| | 0 |
|
| Total underwriting expenses | | $ | 902 |
| | $ | 857 |
| | $ | 786 |
| | 5 |
| | 9 |
|
| Ratios as a percent of earned premiums: | | |
| | |
| | |
| | Pt. Change | | Pt. Change |
| Commission expense | | 18.4 | % | | 18.7 | % | | 18.6 | % | | (0.3 | ) | | 0.1 |
|
| Other underwriting expense | | 12.7 |
| | 13.2 |
| | 13.7 |
| | (0.5 | ) | | (0.5 | ) |
| Policyholder dividends | | 0.5 |
| | 0.6 |
| | 0.7 |
| | (0.1 | ) | | (0.1 | ) |
| Total underwriting expense ratio | | 31.6 | % | | 32.5 | % | | 33.0 | % | | (0.9 | ) | | (0.5 | ) |
| | | | | | | | | | | |
Commercial lines commission expenses as a percent of earned
premium decreasedpremiums were slightly lower in 2014, compared with 2013. The ratio increased slightly during
2012, largely due to higher2013, compared with 2012. The 2014 and 2013 ratios for other underwriting expenses each decreased by 0.5 percentage points, as earned premiums
that offset the effect of higher agency profit-sharing commissions.Other underwriting expenses as a percent of earned premium for 2012 also decreased slightly, as higher earned premiums offset an increase ingrew faster than expenses.
Cincinnati Financial Corporation - 2014 10-K - Page 70
Commercial Lines of Business Analysis
Approximately 95 percent of our commercial lines premiums relate to accounts with coverages from more than one of our business lines. As a result, we believe that the commercial lines
insurance segment is best measured and evaluated on a segment basis. However, we provide line-of-business data to analyze growth and profitability trends separately for each line.
The accident year loss data provides current estimates of incurred loss and loss expenses and corresponding ratios over the most recent three accident years. Accident year data classifies losses according to the year in which the corresponding loss events occur, regardless of when the losses are actually reported, recorded or paid.For
2012,2014, commercial casualty, our largest line of business representing over 30 percent of earned premiums for our commercial lines
insurance segment, continued to be
very profitable, based on the total loss and loss expense ratio. Commercial
property and specialty packages had 2012auto, representing approximately 18 percent of earned premiums for our commercial lines insurance segment, was the only commercial line of business with a 2014 total loss and loss expense
ratiosratio significantly higher than we
desired, largely due to unusually high weather-related losses in recent years.desired. As discussed below, we are taking actions to improve
commercial auto pricing
and reduce loss costs to benefit future profitability trends.
Profitability trends for workers’ compensation continued to improve, reflecting the results of initiatives to improve pricing and reduce loss costs. An approach similar to the one we used to improve workers’ compensation results is being used to address profitability challenges for commercial auto andproperty-oriented lines of business. The executive risk portion of bond and executive risk showed improvement in 2012, after experiencing several years of unfavorable effects from the U.S. credit crisis of 2008. Since the credit crisis, many of our financial institution policies have been nonrenewed, reducing exposure for this portion of our bond and executive risk business.
Commercial Casualty
| (Dollars in millions) | | Years ended December 31, | | | 2012-2011 | | | 2011-2010 | |
| | | 2012 | | | 2011 | | | 2010 | | | Change % | | | Change % | |
| Commercial casualty: | | | | | | | | | | | | | | | | | | | | |
| Net written premiums | | $ | 793 | | | $ | 710 | | | $ | 686 | | | | 12 | | | | 3 | |
| Earned premiums | | | 767 | | | | 711 | | | | 693 | | | | 8 | | | | 3 | |
| Loss and loss expenses from: | | | | | | | | | | | | | | | | | | | | |
| Current accident year before catastrophe losses | | | 492 | | | | 496 | | | | 555 | | | | (1 | ) | | | (11 | ) |
| Current accident year catastrophe losses | | | 0 | | | | 0 | | | | 0 | | | | nm | | | | nm | |
| Prior accident years before catastrophe losses | | | (177 | ) | | | (132 | ) | | | (186 | ) | | | (34 | ) | | | 29 | |
| Prior accident years catastrophe losses | | | 0 | | | | 0 | | | | 0 | | | | nm | | | | nm | |
| Total loss and loss expenses | | $ | 315 | | | $ | 364 | | | $ | 369 | | | | (13 | ) | | | (1 | ) |
| Ratios as a percent of earned premiums: | | | | | | | | | | | Pt. Change | | | Pt. Change | |
| Current accident year before catastrophe losses | | | 64.1 | % | | | 69.7 | % | | | 80.1 | % | | | (5.6 | ) | | | (10.4 | ) |
| Current accident year catastrophe losses | | | 0.0 | | | | 0.0 | | | | 0.0 | | | | 0.0 | | | | 0.0 | |
| Prior accident years before catastrophe losses | | | (23.1 | ) | | | (18.5 | ) | | | (26.9 | ) | | | (4.6 | ) | | | 8.4 | |
| Prior accident years catastrophe losses | | | 0.0 | | | | 0.0 | | | | 0.0 | | | | 0.0 | | | | 0.0 | |
| Total loss and loss expense ratio | | | 41.0 | % | | | 51.2 | % | | | 53.2 | % | | | (10.2 | ) | | | (2.0 | ) |
Accident year loss and loss expenses incurred and ratios to earned premiums:
| Accident Year: | | 2012 | | | 2011 | | | 2010 | | | 2012 | | | 2011 | | | 2010 | |
| as of December 31, 2012 | | $ | 492 | | | $ | 450 | | | $ | 419 | | | | 64.1 | % | | | 63.3 | % | | | 60.4 | % |
| as of December 31, 2011 | | | | | | | 496 | | | | 438 | | | | | | | | 69.7 | | | | 63.2 | |
| as of December 31, 2010 | | | | | | | | | | | 555 | | | | | | | | | | | | 80.1 | |
|
| | | | | | | | | | | | | | | | | | |
| (Dollars in millions) | | Years ended December 31, | | 2014-2013 | | 2013-2012 |
| | | 2014 | | 2013 | | 2012 | | Change % | | Change % |
| Written premiums | | $ | 969 |
| | $ | 897 |
| | $ | 793 |
| | 8 |
| | 13 |
|
| Earned premiums | | 938 |
| | 856 |
| | 767 |
| | 10 |
| | 12 |
|
| | | | | | | | | | | |
| Ratios as a percent of earned premiums: | | | | | | | | Pt. Change | | Pt. Change |
| Current accident year before catastrophe losses | | 59.4 | % | | 56.0 | % | | 64.1 | % | | 3.4 |
| | (8.1 | ) |
| Current accident year catastrophe losses | | — |
| | — |
| | — |
| | 0.0 |
| | 0.0 |
|
| Prior accident years before catastrophe losses | | 0.5 |
| | (8.2 | ) | | (23.1 | ) | | 8.7 |
| | 14.9 |
|
| Prior accident years catastrophe losses | | — |
| | — |
| | — |
| | 0.0 |
| | 0.0 |
|
| Total loss and loss expense ratio | | 59.9 | % | | 47.8 | % | | 41.0 | % | | 12.1 |
| | 6.8 |
|
| | | | | | | | | | | |
Commercial casualty
is our largest line of business and has
in recent years maintainedexperienced a
very satisfactory total loss and loss expense
ratio. Premiums grewratio for many years. Premium growth continued in
2012, compared with 2011,2014, largely due to higher pricing and
premium growth initiatives that helped new business written premiums grow nearly 20 percent. During 2011, our underwriters began fully using predictive modeling tools for general liability coveragesan increase in
our commercial package accounts, and we believe these tools are improving our pricing precision.Improving economic conditions also contributed to growth through higher premiums from audits that confirmed or adjusted initial premium estimates. Premium growth in 2013 was largely due to the same factors as in 2014, plus help from new business written premiums that increased more than 15 percent.
The 2014 total loss and loss expense ratio rose 12.1 percentage points, primarily due to the absence of a benefit from favorable development on prior accident year reserves. As discussed
above in the
commercial lines insurance premiumsoverview section of Commercial Lines Insurance Results,
of Operations, Page 57, economic trends cause corresponding changesour commercial casualty line experienced a 1.6 point increase in
underlying insured exposures, including general liability coverage where the premium amount is heavily influenced by economically-driven measures of risk exposure such as sales volume.The 2012 totalits paid loss and loss expense ratio improved by 10.2 percentage points, largely due to lower currentfor cumulative accident yearyears three or more years old, resulting in a significant increase in estimates for IBNR losses and loss expenses and higher earned premiums. Favorable development onfor all prior accident year reserves continuedyears in 2012total. This line of business experienced favorable reserve development in 2013 at a significantsatisfactory level, reflecting further moderationthough less than in 2012. Moderation in loss cost trends, particularly for umbrella liability coverage included in many commercial package accounts.accounts, had a larger than usual effect in 2012. Development trends are further discussed in ConsolidatedLiquidity and Capital Resources, Property Casualty Insurance Development of Estimated Reserves by Accident Year,Year.
Cincinnati Financial Corporation - 2014 10-K - Page
92.The 2011 current accident year loss and loss expense ratio before catastrophe losses improved by 10.4 percentage points compared with accident year 2010, largely reflecting higher earned premiums from improving economic trends and pricing that offset normal loss cost inflation. In addition, the refined line of business allocation process for loss expenses reduced the 2011 ratio by approximately 4 percentage points.
71
Commercial Property| (Dollars in millions) | | Years ended December 31, | | | 2012-2011 | | | 2011-2010 | |
| | | 2012 | | | 2011 | | | 2010 | | | Change % | | | Change % | |
| Commercial property: | | | | | | | | | | | | | | | | | | | | |
| Net written premiums | | $ | 573 | | | $ | 512 | | | $ | 497 | | | | 12 | | | | 3 | |
| Earned premiums | | | 545 | | | | 497 | | | | 489 | �� | | | 10 | | | | 2 | |
| Loss and loss expenses from: | | | | | | | | | | | | | | | | | | | | |
| Current accident year before catastrophe losses | | | 251 | | | | 309 | | | | 286 | | | | (19 | ) | | | 8 | |
| Current accident year catastrophe losses | | | 173 | | | | 146 | | | | 75 | | | | 18 | | | | 95 | |
| Prior accident years before catastrophe losses | | | (17 | ) | | | (21 | ) | | | (3 | ) | | | 19 | | | | (600 | ) |
| Prior accident years catastrophe losses | | | (9 | ) | | | 3 | | | | (7 | ) | | | nm | | | | nm | |
| Total loss and loss expenses | | $ | 398 | | | $ | 437 | | | $ | 351 | | | | (9 | ) | | | 25 | |
| Ratios as a percent of earned premiums: | | | | | | | | | | | Pt. Change | | | Pt. Change | |
| Current accident year before catastrophe losses | | | 46.1 | % | | | 62.1 | % | | | 58.4 | % | | | (16.0 | ) | | | 3.7 | |
| Current accident year catastrophe losses | | | 31.7 | | | | 29.4 | | | | 15.4 | | | | 2.3 | | | | 14.0 | |
| Prior accident years before catastrophe losses | | | (3.1 | ) | | | (4.1 | ) | | | (0.6 | ) | | | 1.0 | | | | (3.5 | ) |
| Prior accident years catastrophe losses | | | (1.8 | ) | | | 0.7 | | | | (1.4 | ) | | | (2.5 | ) | | | 2.1 | |
| Total loss and loss expense ratio | | | 72.9 | % | | | 88.1 | % | | | 71.8 | % | | | (15.2 | ) | | | 16.3 | |
Accident year loss and loss expenses incurred and ratios to earned premiums:
| Accident Year: | | 2012 | | | 2011 | | | 2010 | | | 2012 | | | 2011 | | | 2010 | |
| as of December 31, 2012 | | $ | 424 | | | $ | 439 | | | $ | 347 | | | | 77.8 | % | | | 88.2 | % | | | 71.0 | % |
| as of December 31, 2011 | | | | | | | 455 | | | | 352 | | | | | | | | 91.5 | | | | 72.0 | |
| as of December 31, 2010 | | | | | | | | | | | 361 | | | | | | | | | | | | 73.8 | |
|
| | | | | | | | | | | | | | | | | | |
| (Dollars in millions) | | Years ended December 31, | | 2014-2013 | | 2013-2012 |
| | | 2014 | | 2013 | | 2012 | | Change % | | Change % |
| Written premiums | | $ | 776 |
| | $ | 673 |
| | $ | 573 |
| | 15 |
| | 17 |
|
| Earned premiums | | 728 |
| | 623 |
| | 545 |
| | 17 |
| | 14 |
|
| | | | | | | | | | | |
| Ratios as a percent of earned premiums: | | | | | | | | Pt. Change | | Pt. Change |
| Current accident year before catastrophe losses | | 51.0 | % | | 50.7 | % | | 46.1 | % | | 0.3 |
| | 4.6 |
|
| Current accident year catastrophe losses | | 14.3 |
| | 14.9 |
| | 31.7 |
| | (0.6 | ) | | (16.8 | ) |
| Prior accident years before catastrophe losses | | (2.9 | ) | | (1.3 | ) | | (3.1 | ) | | (1.6 | ) | | 1.8 |
|
| Prior accident years catastrophe losses | | (1.8 | ) | | (2.3 | ) | | (1.8 | ) | | 0.5 |
| | (0.5 | ) |
| Total loss and loss expense ratio | | 60.6 | % | | 62.0 | % | | 72.9 | % | | (1.4 | ) | | (10.9 | ) |
| | | | | | | | | | | |
Commercial property net written premiums and earned premiums rose significantly in 2012, reflectingboth 2014 and 2013, largely due to higher pricing, rising insured exposures and premiummigrating certain polices formerly in our other commercial lines category. That ongoing migration pertains to property coverages in CinciPakTM, a newer program designed to replace many of our former specialty products. Premium growth initiatives that helpedhad a significant effect in 2013, as new business written premiums increaseincreased nearly 2515 percent.
The 2012, total loss and loss expense ratio improved largely1.4 percentage points in 2014, compared with 2013, primarily due to lower current accident year losses and loss expenses and higher earned premiums. The ratio components from catastrophe losses were nearly the same in 2012 as in 2011, andmore favorable development on prior accident year reserves before catastrophe losses. Higher pricing and profit improvement initiatives described below contributed to the ratio improvement, but were somewhat offset by a 2.9 percentage point increase in the ratio for noncatastrophe weather losses. The total loss and loss expense ratio improved 10.9 percentage points in 2013, compared with 2012, primarily due to lower catastrophe losses.
In addition to ongoing improvements in pricing precision and segmentation, we believe our property loss and loss expense ratio improvement is in part due to increased use of property inspections and similar loss control efforts. More specialization among selected claims associates and increased use of higher minimum loss deductible amounts, including per-building and wind or hail deductibles, also contributed to the improvement of those ratios.
Commercial Auto
|
| | | | | | | | | | | | | | | | | | |
| (Dollars in millions) | | Years ended December 31, | | 2014-2013 | | 2013-2012 |
| | | 2014 | | 2013 | | 2012 | | Change % | | Change % |
| Written premiums | | $ | 548 |
| | $ | 507 |
| | $ | 444 |
| | 8 |
| | 14 |
|
| Earned premiums | | 528 |
| | 479 |
| | 426 |
| | 10 |
| | 12 |
|
| | | | | | | | | | | |
| Ratios as a percent of earned premiums: | | | | | | | | Pt. Change | | Pt. Change |
| Current accident year before catastrophe losses | | 68.7 | % | | 67.8 | % | | 70.7 | % | | 0.9 |
| | (2.9 | ) |
| Current accident year catastrophe losses | | 0.9 |
| | 0.7 |
| | 1.3 |
| | 0.2 |
| | (0.6 | ) |
| Prior accident years before catastrophe losses | | 7.4 |
| | 0.4 |
| | (0.1 | ) | | 7.0 |
| | 0.5 |
|
| Prior accident years catastrophe losses | | (0.1 | ) | | (0.2 | ) | | (0.2 | ) | | 0.1 |
| | 0.0 |
|
| Total loss and loss expense ratio | | 76.9 | % | | 68.7 | % | | 71.7 | % | | 8.2 |
| | (3.0 | ) |
| | | | | | | | | | | |
Commercial auto net written premiums and earned premiums rose in 2014 and 2013, largely due to higher pricing in both years. New business written premiums rose nearly 15 percent in 2013, reflecting premium growth initiatives.
The 2014 total loss and loss expense ratio rose 8.2 percentage points in 2014, compared with 2013. That increase was largely due to an increase of 7.0 points in unfavorable development on prior accident year reserves before catastrophe losses,
decreased slightly.Inincluding 4.7 points attributable to case incurred experience on known claims and 2.3 points attributable to IBNR reserves. As part of the U.S. economic recession of a few years ago, slowing business activity influenced our estimates of reserves for ultimate losses and loss expenses during that period. As the economy slowly recovered, we believe we were slow to recognize some of the higher loss cost effects in current accident
Cincinnati Financial Corporation - 2014 10-K - Page 72
year reserve estimates for at least part of that period. As claims that occurred during that period have become more mature, paid and reported loss cost trends resulted in us increasing our reserve estimates for claims that have not yet been settled. The 2013 ratio improved, compared with 2012, we formedprimarily due to a lower ratio for current accident year losses and loss expenses. We believe that reflected better pricing precision and other initiatives to improve profitability.
During 2013 and 2014, a multi-department, multi-disciplinary taskforce
that has been reviewingstudied and began implementing initiatives to improve our
property book of business and continues to seek ways to improvecommercial auto profitability, similar to the approach we used to improve workers’ compensation results.
Several profit improvement initiatives are already underway and some are already completed. Some of the more importantImportant initiatives include
increasing specialization among selected claims and loss control associates, increasing the number of commercial property inspections for both new and renewal business, applying wind and hail deductibles in areas prone to convective storm losses and implementing new guidelinesadditional education for underwriting
associates and more focus on factors to improve pricing precision. These factors include improving premium rate classification and using other rating variables in risk selection and pricing,
hail risk.In 2011, we began fully using predictive modeling tools for property coverages in our commercial package accounts to improve our pricing precision. We believe these initiatives will improve profitability over time.
The 2011 total loss and loss expense ratio rose 16.3 percentage points primarily due to a 16.1 point increase in catastrophe losses. In addition, the ratio increased 5.2 percentage points from higher large losses related to fires, and it also rose from other weather-related losses that were not identified as partplus further automating collection of designated catastrophe events for the property casualty industry, typically referred to as noncatastrophe weather losses. The effect of the $13 million ceded to reinstate coverage layers of our property catastrophe reinsurance treaty increased the 2011 ratio by 2.2 percentage points. The refined line of business allocation process for loss expenses reduced the 2011 total loss and loss expense ratio by 3.5 percentage points and also had the effect of decreasing the ratio for current accident year before catastrophe losses.
The 2011 current accident year loss and loss expense ratio before catastrophe losses also rose, compared with accident year 2010, largely due to higher large losses from fires and increased losses from noncatastrophe weather.
Commercial Auto
| (Dollars in millions) | | Years ended December 31, | | | 2012-2011 | | | 2011-2010 | |
| | | 2012 | | | 2011 | | | 2010 | | | Change % | | | Change % | |
| Commercial auto: | | | | | | | | | | | | | | | | | | | | |
| Net written premiums | | $ | 444 | | | $ | 405 | | | $ | 385 | | | | 10 | | | | 5 | |
| Earned premiums | | | 426 | | | | 394 | | | | 384 | | | | 8 | | | | 3 | |
| Loss and loss expenses from: | | | | | | | | | | | | | | | | | | | | |
| Current accident year before catastrophe losses | | | 301 | | | | 294 | | | | 269 | | | | 2 | | | | 9 | |
| Current accident year catastrophe losses | | | 5 | | | | 7 | | | | 4 | | | | (29 | ) | | | 75 | |
| Prior accident years before catastrophe losses | | | 0 | | | | (27 | ) | | | (32 | ) | | | 100 | | | | 16 | |
| Prior accident years catastrophe losses | | | (1 | ) | | | 0 | | | | (1 | ) | | | nm | | | | nm | |
| Total loss and loss expenses | | $ | 305 | | | $ | 274 | | | $ | 240 | | | | 11 | | | | 14 | |
| Ratios as a percent of earned premiums: | | | | | | | | | | | Pt. Change | | | Pt. Change | |
| Current accident year before catastrophe losses | | | 70.7 | % | | | 74.5 | % | | | 70.0 | % | | | (3.8 | ) | | | 4.5 | |
| Current accident year catastrophe losses | | | 1.3 | | | | 1.9 | | | | 1.1 | | | | (0.6 | ) | | | 0.8 | |
| Prior accident years before catastrophe losses | | | (0.1 | ) | | | (6.9 | ) | | | (8.2 | ) | | | 6.8 | | | | 1.3 | |
| Prior accident years catastrophe losses | | | (0.2 | ) | | | (0.2 | ) | | | (0.3 | ) | | | 0.0 | | | | 0.1 | |
| Total loss and loss expense ratio | | | 71.7 | % | | | 69.3 | % | | | 62.6 | % | | | 2.4 | | | | 6.7 | |
Accident year loss and loss expenses incurred and ratios to earned premiums:
| Accident Year: | | 2012 | | | 2011 | | | 2010 | | | 2012 | | | 2011 | | | 2010 | |
| as of December 31, 2012 | | $ | 306 | | | $ | 295 | | | $ | 258 | | | | 72.0 | % | | | 75.0 | % | | | 67.3 | % |
| as of December 31, 2011 | | | | | | | 301 | | | | 259 | | | | | | | | 76.4 | | | | 67.5 | |
| as of December 31, 2010 | | | | | | | | | | | 273 | | | | | | | | | | | | 71.1 | |
Net written premiums and earned premiums for commercial auto rose in 2012, primarily due to higher pricing. Higher new business written premiums accounted for only $4 million of the $39 million increase in net written premiums, in part reflecting our efforts to increase pricing.
The 2012 total loss and loss expense ratio increased, primarily due to lower favorable development on prior accident year reserves that was partially offset by an improved ratio for current accident year losses and loss expenses.
In early 2013, we formed a multi-department, multi-disciplinary taskforce that has been reviewing our commercial auto business to determine ways to improve profitability, similar to the approach we used to improve workers’ compensation results.
The 2011 total loss and loss expense ratio rose 6.7 percentage points, largely due to a 3.6-point increase from higher large losses. The refined line of business allocation process for loss expenses contributed 1.7 percentage points to the 2011 total loss and loss expense ratio and also contributed to the increase in the ratio for the current accident year before catastrophe losses.
The 2011 current accident year loss and loss expense ratio before catastrophe losses rose 4.5 percentage points, compared with accident year 2010, primarily due to a rise in loss cost trends that may relate to the improving economy, combined with pricing that improved more slowly. Noncatastrophe weather losses also had a slight adverse effect on the ratio.
Workers’ Compensation
| (Dollars in millions) | | Years ended December 31, | | | 2012-2011 | | | 2011-2010 | |
| | | 2012 | | | 2011 | | | 2010 | | | Change % | | | Change % | |
| Workers' compensation: | | | | | | | | | | | | | | | | | | | | |
| Net written premiums | | $ | 341 | | | $ | 312 | | | $ | 310 | | | | 9 | | | | 1 | |
| Earned premiums | | | 344 | | | | 318 | | | | 311 | | | | 8 | | | | 2 | |
| Loss and loss expenses from: | | | | | | | | | | | | | | | | | | | | |
| Current accident year before catastrophe losses | | | 286 | | | | 307 | | | | 331 | | | | (7 | ) | | | (7 | ) |
| Current accident year catastrophe losses | | | 0 | | | | 0 | | | | 0 | | | | nm | | | | nm | |
| Prior accident years before catastrophe losses | | | (74 | ) | | | (97 | ) | | | (39 | ) | | | 24 | | | | (149 | ) |
| Prior accident years catastrophe losses | | | 0 | | | | 0 | | | | 0 | | | | nm | | | | nm | |
| Total loss and loss expenses | | $ | 212 | | | $ | 210 | | | $ | 292 | | | | 1 | | | | (28 | ) |
| Ratios as a percent of earned premiums: | | | | | | | | | | | Pt. Change | | | Pt. Change | |
| Current accident year before catastrophe losses | | | 83.0 | % | | | 96.6 | % | | | 106.5 | % | | | (13.6 | ) | | | (9.9 | ) |
| Current accident year catastrophe losses | | | 0.0 | | | | 0.0 | | | | 0.0 | | | | 0.0 | | | | 0.0 | |
| Prior accident years before catastrophe losses | | | (21.5 | ) | | | (30.5 | ) | | | (12.6 | ) | | | 9.0 | | | | (17.9 | ) |
| Prior accident years catastrophe losses | | | 0.0 | | | | 0.0 | | | | 0.0 | | | | 0.0 | | | | 0.0 | |
| Total loss and loss expense ratio | | | 61.5 | % | | | 66.1 | % | | | 93.9 | % | | | (4.6 | ) | | | (27.8 | ) |
Accident year loss and loss expenses incurred and ratios to earned premiums:
| Accident Year: | | 2012 | | | 2011 | | | 2010 | | | 2012 | | | 2011 | | | 2010 | |
| as of December 31, 2012 | | $ | 286 | | | $ | 280 | | | $ | 271 | | | | 83.0 | % | | | 87.9 | % | | | 87.1 | % |
| as of December 31, 2011 | | | | | | | 307 | | | | 299 | | | | | | | | 96.6 | | | | 96.3 | |
| as of December 31, 2010 | | | | | | | | | | | 331 | | | | | | | | | | | | 106.5 | |
|
| | | | | | | | | | | | | | | | | | |
| (Dollars in millions) | | Years ended December 31, | | 2014-2013 | | 2013-2012 |
| | | 2014 | | 2013 | | 2012 | | Change % | | Change % |
| Written premiums | | $ | 365 |
| | $ | 374 |
| | $ | 341 |
| | (2 | ) | | 10 |
|
| Earned premiums | | 370 |
| | 365 |
| | 344 |
| | 1 |
| | 6 |
|
| | | | | | | | | | | |
| Ratios as a percent of earned premiums: | | | | | | | | Pt. Change | | Pt. Change |
| Current accident year before catastrophe losses | | 77.8 | % | | 78.0 | % | | 83.0 | % | | (0.2 | ) | | (5.0 | ) |
| Current accident year catastrophe losses | | — |
| | — |
| | — |
| | 0.0 |
| | 0.0 |
|
| Prior accident years before catastrophe losses | | (13.9 | ) | | (3.9 | ) | | (21.5 | ) | | (10.0 | ) | | 17.6 |
|
| Prior accident years catastrophe losses | | — |
| | — |
| | — |
| | 0.0 |
| | 0.0 |
|
| Total loss and loss expense ratio | | 63.9 | % | | 74.1 | % | | 61.5 | % | | (10.2 | ) | | 12.6 |
|
| | | | | | | | | | | |
Workers’ compensation net written premiums
anddecreased in 2014, while earned premiums rose
slightly. Both increased in
2012, primarily due2013. Average renewal pricing rose in both 2014 and 2013, but an $18 million decrease in new business written premiums in 2014 offset the effect of price increases, netting to
higher pricing. Improving economic conditionsthe decrease in net written premiums. New business written premiums contributed
to growth through higher premiums from audits that confirmed or adjusted initial premium estimates. As discussednearly half of the increase in
the commercial lines insurance premiums section of Commercial Lines Insurance Results of Operations, Page 57, economic trends cause corresponding changes in underlying insured exposures, including workers’ compensation coverage where the premium amount is heavily influenced by economically-driven measures of risk exposure such as payroll volume.2013 net written premiums.
The
20122014 total loss and loss expense ratio improved
4.6 percentage points compared with
2011, reflecting lower current accident year losses and loss expenses that were partially offset by a lower amount of2013, primarily due to more benefit from favorable development on prior accident year reserves. We
believe our workers' compensation results continue to
see loss emergencereflect ongoing benefits of profit improvement initiatives that
was less than expected for nearly every accident year, resultingbegan in
another year of net favorable development. Development trends are further discussed in Consolidated Property Casualty Insurance Development of Estimated Reserves by Accident Year, Page 92.The 2011 total loss and loss expense ratio was 27.8 percentage points lower, reflecting both higher favorable development on prior accident year reserves and lower current accident year losses and loss expenses. The refined line of business allocation process for loss expenses reduced the 2011 total loss and loss expense ratio by 11.5 percentage points and also had the effect of decreasing the ratio for current accident year before catastrophe losses.
The 2011 current accident year loss and loss expense ratio declined 9.9 percentage points compared with accident year 2010, estimated as of December 31, 2010. In addition to the favorable effect of the refined line of business allocation process for loss expenses, the loss portion of the ratio improved, reflecting initiatives discussed below.
Since we pay a lower commission rate on workers’ compensation business, relative to our other commercial lines of business, this line has a higher calendar year loss and loss expense ratio breakeven point than our other commercial business lines. We believe various initiatives in recent years contributed to improved profitability. During 2009, we beganincluding using a predictive modeling tool to improve risk selection and pricing precision. In 2010, we added to ourprecision, adding staff of loss control field representatives, premium audit field representatives and field claims representatives specializing in workers’ compensation risks. We also implementedrisks and direct reporting of workers’ compensation claims, allowingclaims. Direct reporting allows us to quickly obtain detailed information from policyholders to promptly assign the appropriate level of claims handling expertise to each case. Obtaining more information sooner for specific claims allows for medical care appropriate to the nature of each injury, benefiting injured workers, employers and agents while ultimately lowering overall loss costs.
In addition, our medical provider bill review process continues to provide significant savings compared with initial charges by providers.
The 2013 total loss and loss expense ratio rose, compared with 2012, reflecting less benefit from favorable development on prior accident year reserves. Reserves were added during 2013 for older, pre-2009 accident years, reflecting paid loss data indicating it is taking longer to pay out older claims. Because some open workers’ compensation claims extend beyond 30 years, a small assumption change for the average life of a claim can add up to a considerable reserve amount recognized in any given period.
Development trends are further discussed in Liquidity and Capital Resources, Property Casualty Insurance Development of Estimated Reserves by Accident Year. The workers’ compensation business line includes our longest tail exposures, making initial estimates of accident year loss and loss expenses incurred more uncertain. Due to the lengthy payout period of workers’ compensation claims, small shifts in medical cost inflation and payout periods could have a significant effect on our potential future liability compared with our current projections.
Specialty Packages
| (Dollars in millions) | | Years ended December 31, | | | 2012-2011 | | | 2011-2010 | |
| | | 2012 | | | 2011 | | | 2010 | | | Change % | | | Change % | |
| Specialty packages: | | | | | | | | | | | | | | | | | | | | |
| Net written premiums | | $ | 153 | | | $ | 137 | | | $ | 149 | | | | 12 | | | | (8 | ) |
| Earned premiums | | | 151 | | | | 138 | | | | 149 | | | | 9 | | | | (7 | ) |
| Loss and loss expenses from: | | | | | | | | | | | | | | | | | | | | |
| Current accident year before catastrophe losses | | | 95 | | | | 98 | | | | 91 | | | | (3 | ) | | | 8 | |
| Current accident year catastrophe losses | | | 33 | | | | 72 | | | | 22 | | | | (54 | ) | | | 227 | |
| Prior accident years before catastrophe losses | | | (6 | ) | | | 6 | | | | 2 | | | | (200 | ) | | | 200 | |
| Prior accident years catastrophe losses | | | (7 | ) | | | (1 | ) | | | (4 | ) | | | (600 | ) | | | 75 | |
| Total loss and loss expenses | | $ | 115 | | | $ | 175 | | | $ | 111 | | | | (34 | ) | | | 58 | |
| Ratios as a percent of earned premiums: | | | | | | | | | | | Pt. Change | | | Pt. Change | |
| Current accident year before catastrophe losses | | | 63.4 | % | | | 70.9 | % | | | 61.1 | % | | | (7.5 | ) | | | 9.8 | |
| Current accident year catastrophe losses | | | 22.0 | | | | 51.8 | | | | 14.5 | | | | (29.8 | ) | | | 37.3 | |
| Prior accident years before catastrophe losses | | | (4.2 | ) | | | 3.9 | | | | 1.8 | | | | (8.1 | ) | | | 2.1 | |
| Prior accident years catastrophe losses | | | (4.5 | ) | | | (0.6 | ) | | | (2.6 | ) | | | (3.9 | ) | | | 2.0 | |
| Total loss and loss expense ratio | | | 76.7 | % | | | 126.0 | % | | | 74.8 | % | | | (49.3 | ) | | | 51.2 | |
Accident year loss
Cincinnati Financial Corporation - 2014 10-K - Page 73
Other Commercial Lines
|
| | | | | | | | | | | | | | | | | | |
| (Dollars in millions) | | Years ended December 31, | | 2014-2013 | | 2013-2012 |
| | | 2014 | | 2013 | | 2012 | | Change % | | Change % |
| Written premiums | | $ | 264 |
| | $ | 309 |
| | $ | 308 |
| | (15 | ) | | 0 |
|
| Earned premiums | | 292 |
| | 313 |
| | 301 |
| | (7 | ) | | 4 |
|
| | | | | | | | | | | |
| Ratios as a percent of earned premiums: | | | | | | | | Pt. Change | | Pt. Change |
| Current accident year before catastrophe losses | | 53.4 | % | | 55.3 | % | | 56.8 | % | | (1.9 | ) | | (1.5 | ) |
| Current accident year catastrophe losses | | 9.2 |
| | 5.8 |
| | 11.0 |
| | 3.4 |
| | (5.2 | ) |
| Prior accident years before catastrophe losses | | (4.8 | ) | | 3.8 |
| | (2.3 | ) | | (8.6 | ) | | 6.1 |
|
| Prior accident years catastrophe losses | | (0.7 | ) | | (0.6 | ) | | (2.3 | ) | | (0.1 | ) | | 1.7 |
|
| Total loss and loss expense ratio | | 57.1 | % | | 64.3 | % | | 63.2 | % | | (7.2 | ) | | 1.1 |
|
| | | | | | | | | | | |
Other commercial lines includes policies with various insurance coverages, including various specialty packages designed for certain classes of business. Also included are policies providing management liability or surety coverages, in addition to policies with specific coverages for machinery and
loss expenses incurred and ratiosequipment. In recent years prior to
earned premiums:| Accident Year: | | 2012 | | | 2011 | | | 2010 | | | 2012 | | | 2011 | | | 2010 | |
| as of December 31, 2012 | | $ | 128 | | | $ | 162 | | | $ | 112 | | | | 85.4 | % | | | 117.2 | % | | | 75.1 | % |
| as of December 31, 2011 | | | | | | | 170 | | | | 114 | | | | | | | | 122.7 | | | | 76.7 | |
| as of December 31, 2010 | | | | | | | | | | | 113 | | | | | | | | | | | | 75.6 | |
Specialty packages net2014, we separately reported more detailed results for these various types of policies.
Net written premiums and earned premiums rosefor our other commercial lines decreased in 2012, primarily2014, driven by a decrease in our specialty packages policies. Premiums for specialty packages decreased largely due to lower ceded premiums. In 2011, ceded premiums included $10 millionthe introduction of CinciPak, a newer program designed to reinstate coverage layersreplace many of our specialty products. Premiums for CinciPak are included in our commercial casualty or commercial property catastrophe reinsurance treaty. New business written premiums from agencies accounted for less than $1 millionlines of the $16 million increase in net written premiums, in part reflecting our efforts to increase price adequacy.business.
The
2012 total loss and loss expense ratio
for other commercial lines improved
49.3 percentage pointsin 2014, compared with 2013. The 2014 improvement was primarily due to
a 33.7-point decrease in catastrophe losses. The 2012 currentmore benefit from favorable development on prior accident year
loss and loss expensereserves. That ratio
before catastrophe losses also improved,rose modestly in 2013, compared with
accident year 2011, largely due to higher earned premiums that included higher pricing. In 2011, we began fully using predictive modeling tools for auto, general liability and property coverages for some commercial package accounts included in specialty packages. In 2012,
we began using predictive modeling tools to improve our pricing precision for certain additional business policies included in our specialty packages line of business. Initiatives for our property book of business, described in the commercial property section above, should alsowhen less benefit
our specialty packages line of business. We believe these initiatives will improve profitability over time.The 2011 total loss and loss expense ratio rose 51.2 percentage points primarily due to a 39.3-point increase in catastrophe losses. It also rose from other weather-related losses that were not identified as part of designated catastrophe events for the property casualty industry, typically referred to as noncatastrophe weather losses. The effect of the $10 million in premiums ceded to reinstate coverage layers of our property catastrophe reinsurance treaty increased the 2011 ratio by 8.4 percentage points.
The 2011 current accident year loss and loss expense ratio before catastrophe losses also increased, compared with accident year 2010, largely due to noncatastrophe weather and the effects of reinstatement premiums.
Surety and Executive Risk
| (Dollars in millions) | | Years ended December 31, | | | 2012-2011 | | | 2011-2010 | |
| | | 2012 | | | 2011 | | | 2010 | | | Change % | | | Change % | |
| Surety and executive risk: | | | | | | | | | | | | | | | | | | | | |
| Net written premiums | | $ | 114 | | | $ | 104 | | | $ | 93 | | | | 10 | | | | 12 | |
| Earned premiums | | | 111 | | | | 103 | | | | 95 | | | | 8 | | | | 8 | |
| Loss and loss expenses from: | | | | | | | | | | | | | | | | | | | | |
| Current accident year before catastrophe losses | | | 67 | | | | 65 | | | | 64 | | | | 3 | | | | 2 | |
| Current accident year catastrophe losses | | | 0 | | | | 0 | | | | 0 | | | | nm | | | | nm | |
| Prior accident years before catastrophe losses | | | 0 | | | | 34 | | | | 3 | | | | (100 | ) | | | nm | |
| Prior accident years catastrophe losses | | | 0 | | | | 0 | | | | 0 | | | | nm | | | | nm | |
| Total loss and loss expenses | | $ | 67 | | | $ | 99 | | | $ | 67 | | | | (32 | ) | | | 48 | |
| Ratios as a percent of earned premiums: | | | | | | | | | | | Pt. Change | | | Pt. Change | |
| Current accident year before catastrophe losses | | | 59.9 | % | | | 63.7 | % | | | 66.5 | % | | | (3.8 | ) | | | (2.8 | ) |
| Current accident year catastrophe losses | | | 0.0 | | | | 0.0 | | | | 0.0 | | | | 0.0 | | | | 0.0 | |
| Prior accident years before catastrophe losses | | | 0.4 | | | | 33.0 | | | | 3.4 | | | | (32.6 | ) | | | 29.6 | |
| Prior accident years catastrophe losses | | | 0.0 | | | | 0.0 | | | | 0.0 | | | | 0.0 | | | | 0.0 | |
| Total loss and loss expense ratio | | | 60.3 | % | | | 96.7 | % | | | 69.9 | % | | | (36.4 | ) | | | 26.8 | |
Accident year loss and loss expenses incurred and ratios to earned premiums:
| Accident Year: | | 2012 | | | 2011 | | | 2010 | | | 2012 | | | 2011 | | | 2010 | |
| as of December 31, 2012 | | $ | 67 | | | $ | 75 | | | $ | 92 | | | | 59.9 | % | | | 73.6 | % | | | 96.2 | % |
| as of December 31, 2011 | | | | | | | 65 | | | | 85 | | | | | | | | 63.7 | | | | 88.5 | |
| as of December 31, 2010 | | | | | | | | | | | 64 | | | | | | | | | | | | 66.5 | |
Net written premiums and earned premiums for surety and executive risk rose in 2012, with approximately one-third of the increase from renewal premiums that reflected higher pricing. Premiums ceded to reinsurers had less of a downward effect, by approximately $6 million, on net written premiums and earned premiums in both 2012 and 2011, compared with the respective prior year. Ceded premiums were reduced largely due to better than expected loss experience in recent years, resulting in lower rates charged by reinsurers.
The 2012 total loss and loss expense ratio improved 36.4 percentage points due to a 32.6-point decrease from unfavorablefavorable development on prior accident year reserves returning to a level close to 2010.
The 2011 total loss and loss expense ratio rose 26.8 percentage points due to a 29.6-point increase from unfavorable development on prior accident year reserves. Included in the unfavorable development was $13 million or 13.1 percentage points for the refined line of business allocation process for loss expenses. The refined allocation had a negligible effect on the ratio for the current accident year beforemore than offset lower catastrophe losses. Most of the remainder of unfavorable developmentDevelopment on prior accident year reserves was for four claims fromunfavorable in 2013, largely due to experience with our management liability policies. Prior accident year 2008, tworeserve development has been volatile for this business in recent years, reflecting varying loss experience for director and officer liability and two for fidelity bonding duerelated to fraud or lending practices at financial institutions.
The 2011 current accident year loss and loss expense ratio before catastrophe losses improved 2.8 percentage points, compared with accident year 2010, reflecting an improved loss climate for financial institutions.
We continue to address the potential risk inherent in the financial institutions portionwe insured during the U.S. credit crisis of our surety and executive risk business line as2008. We described how we work with our agents to identify the strongest financial institutions, in addition to using credit rating and other metrics to carefully re-underwrite in-force policies when they are considered for renewal.
We have actively managedmanage the potentially high risk of writing director and officer liability by:
| · | Marketing primarily to nonprofit organizations, accounting for approximately 81 percent of the policies and 50 percent of the premium volume in force for 2012 director and officer liability business. |
| · | Closely monitoring our for-profit policyholders – At year-end 2012, our director and officer liability policies in force provided coverage to 13 nonfinancial publicly traded companies, including two Fortune 1000 companies. We also provided this coverage to approximately 450 banks, savings and loans and other financial institutions. The majority of these financial institution policyholders are smaller community banks, and we believe they have no unusual exposure to credit-market concerns, including subprime mortgages. Based on new policy data or information from the most recent policy renewal, only 11 of our banks have assets greater than $2 billion; only 24 have assets from $1 billion to $2 billion; and 69 have assets from $500 million to $1 billion. The remaining 292 banks have assets below $500 million. |
| · | Writing on a claims-made basis, which normally restricts coverage to losses reported during the policy term. |
| · | Providing limits no higher than $10 million with facultative or treaty reinsurance in place in 2013 to cover losses greater than $7 million. |
Machinery and Equipment
| (Dollars in millions) | | Years ended December 31, | | | 2012-2011 | | | 2011-2010 | |
| | | 2012 | | | 2011 | | | 2010 | | | Change % | | | Change % | |
| Machinery and equipment: | | | | | | | | | | | | | | | | | | | | |
| Net written premiums | | $ | 41 | | | $ | 38 | | | $ | 35 | | | | 8 | | | | 9 | |
| Earned premiums | | | 39 | | | | 36 | | | | 33 | | | | 8 | | | | 9 | |
| Loss and loss expenses from: | | | | | | | | | | | | | | | | | | | | |
| Current accident year before catastrophe losses | | | 9 | | | | 10 | | | | 9 | | | | (10 | ) | | | 11 | |
| Current accident year catastrophe losses | | | 0 | | | | 0 | | | | 0 | | | | nm | | | | nm | |
| Prior accident years before catastrophe losses | | | (1 | ) | | | 1 | | | | (2 | ) | | | (200 | ) | | | nm | |
| Prior accident years catastrophe losses | | | 0 | | | | 0 | | | | 0 | | | | nm | | | | nm | |
| Total loss and loss expenses | | $ | 8 | | | $ | 11 | | | $ | 7 | | | | (27 | ) | | | 57 | |
| Ratios as a percent of earned premiums: | | | | | | | | | | | Pt. Change | | | Pt. Change | |
| Current accident year before catastrophe losses | | | 22.5 | % | | | 26.9 | % | | | 28.2 | % | | | (4.4 | ) | | | (1.3 | ) |
| Current accident year catastrophe losses | | | 0.0 | | | | 0.1 | | | | 0.0 | | | | (0.1 | ) | | | 0.1 | |
| Prior accident years before catastrophe losses | | | (1.9 | ) | | | 1.2 | | | | (6.0 | ) | | | (3.1 | ) | | | 7.2 | |
| Prior accident years catastrophe losses | | | 0.0 | | | | 0.0 | | | | (0.3 | ) | | | 0.0 | | | | 0.3 | |
| Total loss and loss expense ratio | | | 20.6 | % | | | 28.2 | % | | | 21.9 | % | | | (7.6 | ) | | | 6.3 | |
Accident year loss and loss expenses incurred and ratios to earned premiums:
| Accident Year: | | 2012 | | | 2011 | | | 2010 | | | 2012 | | | 2011 | | | 2010 | |
| as of December 31, 2012 | | $ | 9 | | | $ | 10 | | | $ | 10 | | | | 22.5 | % | | | 26.6 | % | | | 29.3 | % |
| as of December 31, 2011 | | | | | | | 10 | | | | 10 | | | | | | | | 27.0 | | | | 30.5 | |
| as of December 31, 2010 | | | | | | | | | | | 9 | | | | | | | | | | | | 28.2 | |
Machinery and equipment premiums continued to rise over the three-year period, reflecting higher pricing and our superior service, including experienced local specialists who support agencies in writing this line of business. The total and accident year loss and loss expense ratios remain at profitable levels, although they can fluctuate substantially due to the relatively small size of this business line.
Item 1, Commercial Lines Insurance Segment.
Commercial Lines Insurance Outlook
Net written premiums for the commercial lines industry, excluding
theits mortgage and financial guaranty lines of business, are projected to increase approximately
43 percent in
2013,2015, with the industry statutory combined ratio estimated at approximately
103100 percent. Over the past several years, renewal and new business pricing has experienced significant competitive pressure, reinforcing the need for more pricing analytics and careful risk selection. While competition remains intense, industrywide commercial lines market pricing turned positive toward the end of 2011 and continued to firm in 2012
and 2013, according to several industry surveys. Average renewal pricing for our commercial lines
insurance segment
also turned positive.generally followed a similar trend. Opinions
continue to vary, according to a variety of reports that focus on the commercial lines market, regarding the sustainability of improved pricing. According to A.M. Best, commercial lines pricing is
anticipatedexpected to continue
to improveexperiencing pressure during
2013, but will moderate slightly compared with rate increases in 2012.2015. Despite challenging market conditions, we believe we can manage our business and execute strategic initiatives to offset market pressures to some extent and
still profitably grow our commercial lines
insurance segment.
While our commercial lines new business written premiums were down in 2014, compared with 2013, we continued to increase pricing. That indicates continued improvement in our book of business. We believe that competition increased somewhat in 2014, compared with the previous few years. For 2015, it remains to be seen how that will play out, despite opinions about generally softening pricing in the commercial lines market.
Cincinnati Financial Corporation - 2014 10-K - Page 74
We intend to
continuekeep marketing our products to a broad range of business classes with a package approach, while
improvingalso continuing to improve our pricing precision. We intend to maintain our underwriting selectivity and carefully manage our rate levels as well as our programs that seek to accurately match exposures with appropriate premiums. We will continue to evaluate each risk individually and to make decisions about rates, the use of three-year commercial policies and other policy conditions on a case-by-case basis, even in lines and classes of business that are under competitive pressure. We believe
that our initiatives to improve pricing precision and lower loss costs will continue to benefit commercial lines profitability during
2013,2015, and that recent-year premium growth initiatives will continue to increase commercial lines premiums.
In Item 1, Our Business and Our Strategy, Strategic Initiatives, Page 10, we discuss the initiatives we are implementing to achieve our corporate performance objectives. We discuss factors influencing future results of our property casualty insurance operations in the Executive Summary,Summary.
Cincinnati Financial Corporation - 2014 10-K - Page
38.75
Personal Lines Insurance Results
of OperationsOverview – Three-Year Highlights
| (Dollars in millions) | | Years ended December 31, | | | 2012-2011 | | | 2011-2010 | |
| | | 2012 | | | 2011 | | | 2010 | | | Change % | | | Change % | |
| Earned premiums | | $ | 868 | | | $ | 762 | | | $ | 721 | | | | 14 | | | | 6 | |
| Fee revenues | | | 2 | | | | 1 | | | | 2 | | | | 100 | | | | (50 | ) |
| Total revenues | | | 870 | | | | 763 | | | | 723 | | | | 14 | | | | 6 | |
| | | | | | | | | | | | | | | | | | | | | |
| Loss and loss expenses from: | | | | | | | | | | | | | | | | | | | | |
| Current accident year before catastrophe losses | | | 591 | | | | 584 | | | | 508 | | | | 1 | | | | 15 | |
| Current accident year catastrophe losses | | | 160 | | | | 181 | | | | 63 | | | | (12 | ) | | | 187 | |
| Prior accident years before catastrophe losses | | | (77 | ) | | | (35 | ) | | | (29 | ) | | | (120 | ) | | | (21 | ) |
| Prior accident years catastrophe losses | | | (22 | ) | | | (7 | ) | | | (5 | ) | | | (214 | ) | | | (40 | ) |
| Total loss and loss expenses | | | 652 | | | | 723 | | | | 537 | | | | (10 | ) | | | 35 | |
| Underwriting expenses | | | 261 | | | | 222 | | | | 241 | | | | 18 | | | | (8 | ) |
| Underwriting loss | | $ | (43 | ) | | $ | (182 | ) | | $ | (55 | ) | | | 76 | | | | (231 | ) |
| Ratios as a percent of earned premiums: | | | | | | | | | | | Pt. Change | | | Pt. Change | |
| Current accident year before catastrophe losses | | | 68.2 | % | | | 76.7 | % | | | 70.4 | % | | | (8.5 | ) | | | 6.3 | |
| Current accident year catastrophe losses | | | 18.4 | | | | 23.6 | | | | 8.8 | | | | (5.2 | ) | | | 14.8 | |
| Prior accident years before catastrophe losses | | | (8.9 | ) | | | (4.5 | ) | | | (4.1 | ) | | | (4.4 | ) | | | (0.4 | ) |
| Prior accident years catastrophe losses | | | (2.5 | ) | | | (0.9 | ) | | | (0.7 | ) | | | (1.6 | ) | | | (0.2 | ) |
| Total loss and loss expenses | | | 75.2 | | | | 94.9 | | | | 74.4 | | | | (19.7 | ) | | | 20.5 | |
| Underwriting expenses | | | 30.1 | | | | 29.1 | | | | 33.4 | | | | 1.0 | | | | (4.3 | ) |
| Combined ratio | | | 105.3 | % | | | 124.0 | % | | | 107.8 | % | | | (18.7 | ) | | | 16.2 | |
| | | | | | | | | | | | | | | | | | | | | |
| Combined ratio: | | | 105.3 | % | | | 124.0 | % | | | 107.8 | % | | | (18.7 | ) | | | 16.2 | |
| Contribution from catastrophe losses and prior years reserve development | | | 7.0 | | | | 18.2 | | | | 4.0 | | | | (11.2 | ) | | | 14.2 | |
| Combined ratio before catastrophe losses and prior years reserve development | | | 98.3 | % | | | 105.8 | % | | | 103.8 | % | | | (7.5 | ) | | | 2.0 | |
|
| | | | | | | | | | | | | | | | | | |
| (Dollars in millions) | | Years ended December 31, | | 2014-2013 | | 2013-2012 |
| | | 2014 | | 2013 | | 2012 | | Change % | | Change % |
| Earned premiums | | $ | 1,041 |
| | $ | 961 |
| | $ | 868 |
| | 8 |
| | 11 |
|
| Fee revenues | | 2 |
| | 1 |
| | 2 |
| | 100 |
| | (50 | ) |
| Total revenues | | 1,043 |
| | 962 |
| | 870 |
| | 8 |
| | 11 |
|
| Loss and loss expenses from: | | |
| | |
| | |
| | |
| | |
| Current accident year before catastrophe losses | | 660 |
| | 594 |
| | 591 |
| | 11 |
| | 1 |
|
| Current accident year catastrophe losses | | 92 |
| | 84 |
| | 160 |
| | 10 |
| | (48 | ) |
| Prior accident years before catastrophe losses | | (1 | ) | | (29 | ) | | (77 | ) | | 97 |
| | 62 |
|
| Prior accident years catastrophe losses | | (11 | ) | | (10 | ) | | (22 | ) | | (10 | ) | | 55 |
|
| Total loss and loss expenses | | 740 |
| | 639 |
| | 652 |
| | 16 |
| | (2 | ) |
| Underwriting expenses | | 293 |
| | 290 |
| | 261 |
| | 1 |
| | 11 |
|
| Underwriting profit (loss) | | $ | 10 |
| | $ | 33 |
| | $ | (43 | ) | | (70 | ) | | nm |
|
| | | | | | | | | | | |
| Ratios as a percent of earned premiums: | | | | �� | | | | Pt. Change | | Pt. Change |
| Current accident year before catastrophe losses | | 63.4 | % | | 61.9 | % | | 68.2 | % | | 1.5 |
| | (6.3 | ) |
| Current accident year catastrophe losses | | 8.8 |
| | 8.8 |
| | 18.4 |
| | 0.0 |
| | (9.6 | ) |
| Prior accident years before catastrophe losses | | (0.1 | ) | | (3.0 | ) | | (8.9 | ) | | 2.9 |
| | 5.9 |
|
| Prior accident years catastrophe losses | | (1.0 | ) | | (1.1 | ) | | (2.5 | ) | | 0.1 |
| | 1.4 |
|
| Total loss and loss expense | | 71.1 |
| | 66.6 |
| | 75.2 |
| | 4.5 |
| | (8.6 | ) |
| Underwriting expense | | 28.1 |
| | 30.2 |
| | 30.1 |
| | (2.1 | ) | | 0.1 |
|
| Combined ratio | | 99.2 | % | | 96.8 | % | | 105.3 | % | | 2.4 |
| | (8.5 | ) |
| | | | | | | | | | | |
| Combined ratio: | | 99.2 | % | | 96.8 | % | | 105.3 | % | | 2.4 |
| | (8.5 | ) |
Contribution from catastrophe losses and prior years
reserve development | | 7.7 |
| | 4.7 |
| | 7.0 |
| | 3.0 |
| | (2.3 | ) |
Combined ratio before catastrophe losses and prior years
reserve development | | 91.5 | % | | 92.1 | % | | 98.3 | % | | (0.6 | ) | | (6.2 | ) |
| | | | | | | | | | | |
Performance highlights for the personal lines
insurance segment include:
| · | Premiums – Earned premiums and net written premiums grew significantly in 2012, primarily due to higher renewal written premiums that included price increases. The 2012 growth in earned and net written premiums was aided by the suppressing effect in 2011 from $18 million for ceded premiums to reinstate coverage layers of our property catastrophe reinsurance treaty. |
| · | Combined ratio – The 2012 combined ratio improved 18.7 percentage points compared with 2011, in part due to natural catastrophe losses that were 6.8 percentage points lower, plus better pricing and a decrease in other weather-related losses. Such losses, typically referred to as noncatastrophe weather losses, were not identified as part of designated catastrophe events for the property casualty industry. Additional ceded premiums to reinstate coverage layers of our property catastrophe reinsurance treaty and the effect of a refined line of business allocation process for loss expenses each contributed approximately 3 points to the 2011 combined ratio. |
Premiums – Earned premiums and net written premiums continued to grow in 2014, primarily due to higher renewal written premiums that included price increases. Renewal written premiums rose 8 percent in 2014, following an increase of 11 percent in 2013.
Combined ratio – The 2014 combined ratio rose 2.4 percentage points compared with 2013, largely due to a 1.4 percentage-point increase in noncatastrophe weather losses that were not identified as part of designated catastrophe event for the property casualty industry. That unfavorable weather effect somewhat offset benefits from a 2.1 percentage-point improvement in the underwriting expense ratio, primarily from lower commission rates for selected personal lines insurance products. Development on prior accident years’ loss and loss expense reserves before catastrophes during 2014 was 2.9 percentage points less favorable than in 2013, primarily due to increased estimates of reserves for personal umbrella liability coverage.
In recent years, we have increased our use of pricing precision and implemented numerous rate increases to improve our personal lines insurance segment results. To improve results, we also made more use of higher minimum loss deductibles and nonrenewed more policies in selected areas more prone to natural catastrophes. We have worked to improve our geographic diversification by expanding our personal lines operation to several states less prone to catastrophes.
Our personal lines statutory combined ratio was 99.1 percent in 2014, up from 96.3 percent in 2013 but improved from 104.0 percent in 2012, 124.2 percent in 2011 and 107.1 percent in 2010.2012. By comparison, the estimated industry personal lines combined ratio was 105.098.4 percent in 2012, 106.12014, 97.5 percent in 20112013 and 100.4101.3 percent in 2010.2012. Our concentration of business in areas affected by catastrophe events contributed to recent-year results that differed from the overall industry, an issue
Cincinnati Financial Corporation - 2014 10-K - Page 76
we are addressing in part through gradual geographic expansion. The contribution of catastrophe losses to our personal lines statutory combined ratio was
7.8 percentage points in 2014, 7.7 percentage points in 2013 and 15.9 percentage points in 2012,
22.7 percentage points in 2011 and 8.1 percentage points in 2010, compared with an
estimated 9.5, 10.4industry estimate of 5.5, 4.3 and
5.37.4 percentage points,
respectively, for the industry.As discussed below in respectively.
Personal Lines Insurance Premiums
in recent years we have increased our use of pricing precision and implemented numerous rate increases to improve our personal lines segment results. Since early 2008, we have worked to improve our geographic diversification by expanding our personal lines operation to several states less prone to catastrophes, including the western states of Arizona, Idaho, Montana and Utah. We have also nonrenewed approximately 2,300 homeowner policies in Florida and Alabama that we believe were the most exposed to losses from hurricane damage. Our progress in geographic diversification is demonstrated by higher premium growth rates in our smaller states, in terms of personal lines premium volume. Personal lines earned premiums in the six states with our largest personal lines volume increased 10 percent in 2012 while increasing 22 percent in the remaining states. Our new business written premiums rose 17 percent in 2012, with those six states declining 2 percent, while rising 34 percent in all other states.Personal Lines Insurance Premiums
| (Dollars in millions) | | Years ended December 31, | | | 2012-2011 | | | 2011-2010 | |
| | | 2012 | | | 2011 | | | 2010 | | | Change % | | | Change % | |
| Agency renewal written premiums | | $ | 836 | | | $ | 755 | | | $ | 685 | | | | 11 | | | | 10 | |
| Agency new business written premiums | | | 111 | | | | 95 | | | | 90 | | | | 17 | | | | 6 | |
| Other written premiums | | | (29 | ) | | | (49 | ) | | | (25 | ) | | | 41 | | | | (96 | ) |
| Net written premiums | | | 918 | | | | 801 | | | | 750 | | | | 15 | | | | 7 | |
| Unearned premium change | | | (50 | ) | | | (39 | ) | | | (29 | ) | | | (28 | ) | | | (34 | ) |
| Earned premiums | | $ | 868 | | | $ | 762 | | | $ | 721 | | | | 14 | | | | 6 | |
|
| | | | | | | | | | | | | | | | | | |
| (Dollars in millions) | | Years ended December 31, | | 2014-2013 | | 2013-2012 |
| | | 2014 | | 2013 | | 2012 | | Change % | | Change % |
| Agency renewal written premiums | | $ | 1,005 |
| | $ | 928 |
| | $ | 836 |
| | 8 |
| | 11 |
|
| Agency new business written premiums | | 92 |
| | 110 |
| | 111 |
| | (16 | ) | | (1 | ) |
| Other written premiums | | (29 | ) | | (33 | ) | | (29 | ) | | 12 |
| | (14 | ) |
| Net written premiums | | 1,068 |
| | 1,005 |
| | 918 |
| | 6 |
| | 9 |
|
| Unearned premium change | | (27 | ) | | (44 | ) | | (50 | ) | | 39 |
| | 12 |
|
| Earned premiums | | $ | 1,041 |
| | $ | 961 |
| | $ | 868 |
| | 8 |
| | 11 |
|
| | | | | | | | | | | |
Personal lines insurance is a strategic component of our overall relationship with most of our agencies and is an important component of our agencies’ relationships with their clients. We believe agents recommend
Cincinnatiour personal insurance products for their
value-oriented clients who seek to balance quality and price and who are attracted by our superior claims service and the benefits of our package approach. We also believe our efforts to continue improving pricing precision are helping us attract and retain more of our agencies’ preferred business, while also obtaining higher rates for more thinly-priced business.
Our progress toward improved geographic diversification is reflected in part through premium growth trends. Personal lines earned premiums in our four highest volume states increased in aggregate by 4 percent in 2014, while premiums for the remaining states that include our newer areas of operation increased 13 percent in aggregate.
The 8 percent increase in agency renewal written premiums in 2014 and the 11 percent increase in 2012 agency renewal written premiums2013 largely reflected various rate changes during recent years. In October 2012, we began ourBeginning in the fourth roundquarter of 2014, rate increases for theour homeowner line of business averagingaveraged approximately 9 percent, with some individual policy4 percent. That average varied widely by state, according to current rate increases lower or higher based on attributes of risklevel indications that characterize the insured exposure. Thathelp determine appropriate premium rates. The increases followed rate changes over several successive years averaging approximately 7 percent annually that were implemented beginning the fourth quarter of 2009percentages in a high-single-digit range for states representing the majority of our personal lines business. Beginning in the first half of 2013,
In 2014, we
are implementingimplemented rate changes for our personal auto line of business in the majority of the
3130 states where we market personal
linesauto policies. The average rate change
iswas an increase
innear the high end of the low-single-digit range, with some individual policies experiencing lower or higher
ratesrate changes based on enhanced pricing precision enabled by predictive models. Rate changes for personal auto implemented
in several recent years, beginning
late 2011 andin 2010,
alsoeach represented an annual average rate increase in the low-single-digit range.
In 2012, our personal
Personal lines new business
written premiums
written bywere down in 2014, compared with 2013. The downward trend began in the second half of 2013 and was expected due to our
agencies grew 17 percent, following 2011 growth at a ratehigher premium rates and underwriting actions such as expanded use of
6 percent. We believeactual cash value loss settlement for older roofs. For the
increased growth rate reflects the contribution from new agency appointments in addition to the effectmajority of
higher pricing from rate increases.states where we market personal lines policies, those underwriting actions were effective beginning April 1, 2013.
Other written premiums primarily consist of premiums that are ceded to reinsurers and that lower our net written premiums. Other written premiums contributed
$20 million to
20122014 net written premium
growth. The changegrowth by $4 million more than in
2012 other written premiums, compared with 2011, was driven by additional ceded premiums in 2011 for our property catastrophe reinsurance treaty.2013.
Personal Lines Insurance Loss and Loss Expenses
Loss and loss expenses include both net paid losses and reserve changes for unpaid losses as well as the associated loss expenses. Most of the incurred losses and loss expenses shown in the personal lines insurance segment three-year highlights table on Page 68 are for the respective current accident years, andwith reserve development on prior accident years is shown separately. Since approximately two-thirds of our personal lines current accident year incurred losses and loss expenses represent net paid losses,amounts, the remaining one-third represents reserves for our estimate of ultimate losses and loss expenses. These reserves develop over time, and we re-estimate previously reported reserves as we learn more about the development of the related claims. The table below illustrates that development. For example, the 100.370.7 percent accident year 20112013 loss and loss
Cincinnati Financial Corporation - 2014 10-K - Page 77
expense ratio reported as of December 31,
2011,2013, developed favorably by
7.81.6 percentage points to
92.569.1 percent due to claims settling for less than previously estimated, or due to updated reserve estimates for unpaid claims, as of December 31,
2012.2014. Accident years
20112013 and
20102012 for the personal lines
insurance segment have both developed favorably, as indicated by the progression over time for the ratios in the table.
(Dollars in millions)
Accident year loss and loss expenses incurred and ratios to earned premiums:
| Accident Year: | | 2012 | | | 2011 | | | 2010 | | | 2012 | | | 2011 | | | 2010 | |
| as of December 31, 2012 | | $ | 751 | | | $ | 705 | | | $ | 529 | | | | 86.6 | % | | | 92.5 | % | | | 73.4 | % |
| as of December 31, 2011 | | | | | | | 765 | | | | 545 | | | | | | | | 100.3 | | | | 75.6 | |
| as of December 31, 2010 | | | | | | | | | | | 571 | | | | | | | | | | | | 79.2 | |
|
| | | | | | | | | | | | | | | | | | | | | |
| (Dollars in millions) | | | | | | | | | | | | |
| Accident year loss and loss expenses incurred and ratios to earned premiums: | | | | | |
| Accident year: | | 2014 | | 2013 | | 2012 | | 2014 | | 2013 | | 2012 |
| as of December 31, 2014 | | $ | 752 |
| | $ | 664 |
| | $ | 723 |
| | 72.2 | % | | 69.1 | % | | 83.4 | % |
| as of December 31, 2013 | | |
| | 678 |
| | 723 |
| | |
| | 70.7 |
| | 83.4 |
|
| as of December 31, 2012 | | |
| | |
| | 751 |
| | |
| | |
| | 86.6 |
|
| | | | | | | | | | | | | |
Catastrophe losses, as discussed in Consolidated Property Casualty Insurance Results,
of Operations, Page 52, explain much of the movement in current accident year loss and loss expense ratios for accident years
2010 through2014 and 2013, compared with 2012. Catastrophe losses added
18.48.8 percentage points for
2012, 23.6both 2014 and 2013, and 18.4 points for
2011 and 8.8 points for 20102012 to the respective personal lines
current accident year loss and loss expense ratios in the table above. Personal lines catastrophe losses for
20122014 and
20112013 were
much higher thanbasically in line with our 8.7 percent 10-year annual average for the years 2001 through
2010.2010, while 2012 was much higher than that historical average. Personal lines catastrophe losses also are inherently volatile, as discussed above and in Consolidated Property Casualty Insurance
Results of Operations, Page 52.Results.
The
68.263.4 percent ratio for current accident year loss and loss expenses before catastrophe losses for
2012 improved 8.52014 rose 1.5 percentage points compared with the
76.761.9 percent accident year
20112013 ratio measured as of December 31,
2011. The effect of the $18 million ceded in 2011 to reinstate coverage layers of our property catastrophe reinsurance treaty increased the 2011 ratio by 1.8 percentage points.2013. Noncatastrophe weather losses,
noted above, largely accounted for
our homeowner line of business alone were approximately $10 million lower during 2012 compared with 2011, reducing the
2012 ratio for personal lines by approximately 1 percentage point, compared with 2011. Higher new large losses incurred described below increased the 2012 ratio by 0.6 percentage points, offsetting much of the benefit of lower noncatastrophe losses. We believe the majority of the 8.5 percentage points of improvement was largely due to initiatives to improve pricing precision, somewhat offset by normal loss cost inflation.increase.
Personal lines reserve development on prior accident years continued to net to a favorable amount in 2012,2014, as $99$12 million was recognized, higherrecognized. That total provided $27 million less benefit than $42 million in 2011 and $34 million in 2010. The homeownerthe 2013 total of $39 million. Our other personal line of business represented more than half ofwas primarily responsible for the 2012 increase. Approximately 50 percent of our2014 decrease, as reserve development from its personal umbrella liability coverage can fluctuate significantly over time. Our personal lines net favorable reserve development on prior accident years recognized during 20122014 primarily occurred in our homeowner line of business and nearly 30 percent occurred in our other personal line of business. DevelopmentFavorable development recognized during 20112013 and 2012 was mostly from those sameour homeowner and other personal lines of business and in 2010 was most of it was from our other personal line of business, primarily for personal umbrella liability coverage.business. Development by line of business and other trends for personal lines loss and loss expenses and the related ratios are further analyzed in Personal Lines of Business Analysis, beginning on Page 71, and in ConsolidatedLiquidity and Capital Resources, Property Casualty Insurance Development of Estimated Reserves by Accident Year,Year.
Cincinnati Financial Corporation - 2014 10-K - Page
92.78
Personal Lines Insurance Losses by Size
| (Dollars in millions) | | Years ended December 31, | | | 2012-2011 | | | 2011-2010 | |
| | | 2012 | | | 2011 | | | 2010 | | | Change % | | | Change % | |
| New losses greater than $4,000,000 | | $ | 0 | | | $ | 0 | | | $ | 5 | | | | nm | | | | (100 | ) |
| New losses $1,000,000-$4,000,000 | | | 35 | | | | 25 | | | | 20 | | | | 40 | | | | 25 | |
| New losses $250,000-$1,000,000 | | | 53 | | | | 48 | | | | 41 | | | | 10 | | | | 17 | |
| Case reserve development above $250,000 | | | 10 | | | | 19 | | | | 11 | | | | (47 | ) | | | 73 | |
| Total large losses incurred | | | 98 | | | | 92 | | | | 77 | | | | 7 | | | | 19 | |
| Other losses excluding catastrophe losses | | | 346 | | | | 365 | | | | 336 | | | | (5 | ) | | | 9 | |
| Catastrophe losses | | | 132 | | | | 171 | | | | 58 | | | | (23 | ) | | | 195 | |
| Total net losses incurred | | $ | 576 | | | $ | 628 | | | $ | 471 | | | | (8 | ) | | | 33 | |
| Ratios as a percent of earned premiums: | | | | | | | | | | | Pt. Change | | | Pt. Change | |
| New losses greater than $4,000,000 | | | 0.0 | % | | | 0.0 | % | | | 0.7 | % | | | 0.0 | | | | (0.7 | ) |
| New losses $1,000,000-$4,000,000 | | | 4.1 | | | | 3.3 | | | | 2.8 | | | | 0.8 | | | | 0.5 | |
| New losses $250,000-$1,000,000 | | | 6.1 | | | | 6.3 | | | | 5.7 | | | | (0.2 | ) | | | 0.6 | |
| Case reserve development above $250,000 | | | 1.2 | | | | 2.5 | | | | 1.6 | | | | (1.3 | ) | | | 0.9 | |
| Total large loss ratio | | | 11.4 | | | | 12.1 | | | | 10.8 | | | | (0.7 | ) | | | 1.3 | |
| Other losses excluding catastrophe losses | | | 39.8 | | | | 47.9 | | | | 46.5 | | | | (8.1 | ) | | | 1.4 | |
| Catastrophe losses | | | 15.2 | | | | 22.5 | | | | 8.1 | | | | (7.3 | ) | | | 14.4 | |
| Total net loss ratio | | | 66.4 | % | | | 82.5 | % | | | 65.4 | % | | | (16.1 | ) | | | 17.1 | |
|
| | | | | | | | | | | | | | | | | | |
| (Dollars in millions, net of reinsurance) | | Years ended December 31, | | 2014-2013 | | 2013-2012 |
| | | 2014 | | 2013 | | 2012 | | Change % | | Change % |
| Current accident year losses greater than $5,000,000 | | $ | — |
| | $ | — |
| | $ | — |
| | nm |
| | nm |
|
| Current accident year losses $1,000,000-$5,000,000 | | 20 |
| | 32 |
| | 31 |
| | (38 | ) | | 3 |
|
| Large loss prior accident year reserve development | | 1 |
| | 7 |
| | (5 | ) | | (86 | ) | | nm |
|
| Total large losses incurred | | 21 |
| | 39 |
| | 26 |
| | (46 | ) | | 50 |
|
| Losses incurred but not reported | | 19 |
| | (22 | ) | | (23 | ) | | nm |
| | (4 | ) |
| Other losses excluding catastrophe losses | | 539 |
| | 466 |
| | 441 |
| | 16 |
| | 6 |
|
| Catastrophe losses | | 79 |
| | 72 |
| | 132 |
| | 10 |
| | (45 | ) |
| Total losses incurred | | $ | 658 |
| | $ | 555 |
| | $ | 576 |
| | 19 |
| | (4 | ) |
| | | | | | | | | | | |
| Ratios as a percent of earned premiums: | | | | | | | | Pt. Change | | Pt. Change |
| Current accident year losses greater than $5,000,000 | | 0.0 | % | | 0.0 | % | | 0.0 | % | | 0.0 |
| | 0.0 |
|
| Current accident year losses $1,000,000-$5,000,000 | | 1.9 |
| | 3.4 |
| | 3.6 |
| | (1.5 | ) | | (0.2 | ) |
| Large loss prior accident year reserve development | | 0.1 |
| | 0.7 |
| | (0.6 | ) | | (0.6 | ) | | 1.3 |
|
| Total large loss ratio | | 2.0 |
| | 4.1 |
| | 3.0 |
| | (2.1 | ) | | 1.1 |
|
| Losses incurred but not reported | | 1.8 |
| | (2.3 | ) | | (2.7 | ) | | 4.1 |
| | 0.4 |
|
| Other losses excluding catastrophe losses | | 51.9 |
| | 48.5 |
| | 50.9 |
| | 3.4 |
| | (2.4 | ) |
| Catastrophe losses | | 7.6 |
| | 7.5 |
| | 15.2 |
| | 0.1 |
| | (7.7 | ) |
| Total loss ratio | | 63.3 | % | | 57.8 | % | | 66.4 | % | | 5.5 |
| | (8.6 | ) |
| | | | | | | | | | | |
In
2012,2014, personal lines total large losses incurred
increaseddecreased by
$6$18 million or
746 percent,
compared with 2013, net of reinsurance. The corresponding ratio decreased
0.72.1 percentage
points, as earned premium growth doubled the ratepoints. The 2014 decreases on both a dollar and ratio basis were primarily due to lower amounts for our personal auto line of
growth in total large losses. The majority of the 2012 increase was for homeowner fire claims.business. In
20112013, total large losses increased
over 2010,compared with 2012, primarily due to higher
amounts for our other personal
auto losses.line of business. Our analysis indicated no unexpected concentration of these losses and reserve increases by risk category, geographic region, policy inception, agency or field marketing territory. We believe the inherent volatility of aggregate loss experience for our portfolio of larger policies is greater than that of our portfolio of smaller policies, and we continue to monitor the volatility in addition to general inflationary trends in loss costs.
Personal Lines Insurance Underwriting Expenses
| (Dollars in millions) | | Years ended December 31, | | | 2012-2011 | | | 2011-2010 | |
| | | 2012 | | | 2011 | | | 2010 | | | Change % | | | Change % | |
| Commission expenses | | $ | 176 | | | $ | 139 | | | $ | 145 | | | | 27 | | | | (4 | ) |
| Other underwriting expenses | | | 85 | | | | 83 | | | | 96 | | | | 2 | | | | (14 | ) |
| Total underwriting expenses | | $ | 261 | | | $ | 222 | | | $ | 241 | | | | 18 | | | | (8 | ) |
| Ratios as a percent of earned premiums: | | | | | | | | | | | Pt. Change | | | Pt. Change | |
| Commission expenses | | | 20.3 | % | | | 18.2 | % | | | 20.1 | % | | | 2.1 | | | | (1.9 | ) |
| Other underwriting expenses | | | 9.8 | | | | 10.9 | | | | 13.3 | | | | (1.1 | ) | | | (2.4 | ) |
| Total underwriting expense ratio | | | 30.1 | % | | | 29.1 | % | | | 33.4 | % | | | 1.0 | | | | (4.3 | ) |
|
| | | | | | | | | | | | | | | | | | |
| (Dollars in millions) | | Years ended December 31, | | 2014-2013 | | 2013-2012 |
| | | 2014 | | 2013 | | 2012 | | Change % | | Change % |
| Commission expenses | | $ | 191 |
| | $ | 192 |
| | $ | 176 |
| | (1 | ) | | 9 |
|
| Other underwriting expenses | | 102 |
| | 98 |
| | 85 |
| | 4 |
| | 15 |
|
| Total underwriting expenses | | $ | 293 |
| | $ | 290 |
| | $ | 261 |
| | 1 |
| | 11 |
|
| Ratios as a percent of earned premiums: | | | | | | | | Pt. Change | | Pt. Change |
| Commission expense | | 18.3 | % | | 20.0 | % | | 20.3 | % | | (1.7 | ) | | (0.3 | ) |
| Other underwriting expense | | 9.8 |
| | 10.2 |
| | 9.8 |
| | (0.4 | ) | | 0.4 |
|
| Total underwriting expense ratio | | 28.1 | % | | 30.2 | % | | 30.1 | % | | (2.1 | ) | | 0.1 |
|
| | | | | | | | | | | |
Personal lines commission expense as a percent of earned
premium increasedpremiums decreased in
2012,2014 compared with both 2013 and 2012. The decrease is primarily due to
higher agency profit-sharing commissions. In 2011, lower agency profit-sharingchanges in commission
drove the decrease.rates for some products in our personal lines insurance segment. Other underwriting expenses as a percent of earned premium decreased in 2012, as earned premium growth outpaced a modest increase in expenses. Otherpremiums were at similar levels for 2014, 2013 and 2012. During those years, other underwriting expenses decreasedincreased roughly in 2011, primarily dueproportion to a first-quarter 2010 provision for matters involving contingent liabilities.
earned premiums.
Cincinnati Financial Corporation - 2014 10-K - Page 79
Personal Lines of Business Analysis
We prefer to write personal lines coverages within accounts that include both auto and homeowner coverages as well as coverages from the other personal business line. As a result, we believe that the personal lines
insurance segment is best measured and evaluated on a segment basis. However, we provide line-of-business data to analyze growth and profitability trends separately for each line.
The accident year loss data provides current estimates of incurred loss and loss expenses and corresponding ratios over the most recent three accident years. Accident year data classifies losses according to the year in which the corresponding loss events occur, regardless of when the losses are actually reported, recorded or paid.For
2012, the homeowner2014, our personal auto line of business
continued to havehad a total loss and loss expense ratio significantly higher than desired. As discussed in the overview section of Personal Lines Insurance Results,
of Operations, Page 68, and below, we are taking actions to improve pricing and reduce loss costs that we expect to benefit future profitability trends.
Personal Auto
| (Dollars in millions) | | Years ended December 31, | | | 2012-2011 | | | 2011-2010 | |
| | | 2012 | | | 2011 | | | 2010 | | | Change % | | | Change % | |
| Personal auto: | | | | | | | | | | | | | | | | | | | | |
| Net written premiums | | $ | 425 | | | $ | 385 | | | $ | 352 | | | | 10 | | | | 9 | |
| Earned premiums | | | 404 | | | | 368 | | | | 337 | | | | 10 | | | | 9 | |
| Loss and loss expenses from: | | | | | | | | | | | | | | | | | | | | |
| Current accident year before catastrophe losses | | | 294 | | | | 282 | | | | 239 | | | | 4 | | | | 18 | |
| Current accident year catastrophe losses | | | 12 | | | | 11 | | | | 3 | | | | 9 | | | | 267 | |
| Prior accident years before catastrophe losses | | | (17 | ) | | | (3 | ) | | | (7 | ) | | | (467 | ) | | | 57 | |
| Prior accident years catastrophe losses | | | (2 | ) | | | (1 | ) | | | 0 | | | | (100 | ) | | | nm | |
| Total loss and loss expenses | | $ | 287 | | | $ | 289 | | | $ | 235 | | | | (1 | ) | | | 23 | |
| Ratios as a percent of earned premiums: | | | | | | | | | | | Pt. Change | | | Pt. Change | |
| Current accident year before catastrophe losses | | | 72.8 | % | | | 76.7 | % | | | 70.9 | % | | | (3.9 | ) | | | 5.8 | |
| Current accident year catastrophe losses | | | 2.8 | | | | 3.0 | | | | 1.1 | | | | (0.2 | ) | | | 1.9 | |
| Prior accident years before catastrophe losses | | | (4.1 | ) | | | (0.8 | ) | | | (2.1 | ) | | | (3.3 | ) | | | 1.3 | |
| Prior accident years catastrophe losses | | | (0.5 | ) | | | (0.2 | ) | | | (0.1 | ) | | | (0.3 | ) | | | (0.1 | ) |
| Total loss and loss expense ratio | | | 71.0 | % | | | 78.7 | % | | | 69.8 | % | | | (7.7 | ) | | | 8.9 | |
Accident year A similar approach was used to improve the total loss and loss expenses incurredexpense ratio for our homeowner line of business to a satisfactory result in 2014 and ratios to earned premiums:
| Accident Year: | | 2012 | | | 2011 | | | 2010 | | | 2012 | | | 2011 | | | 2010 | |
| as of December 31, 2012 | | $ | 306 | | | $ | 278 | | | $ | 239 | | | | 75.6 | % | | | 75.6 | % | | | 71.0 | % |
| as of December 31, 2011 | | | | | | | 293 | | | | 241 | | | | | | | | 79.7 | | | �� | 71.6 | |
| as of December 31, 2010 | | | | | | | | | | | 242 | | | | | | | | | | | | 72.0 | |
2013.
Personal Auto
|
| | | | | | | | | | | | | | | | | | |
| (Dollars in millions) | | Years ended December 31, | | 2014-2013 | | 2013-2012 |
| | | 2014 | | 2013 | | 2012 | | Change % | | Change % |
| Written premiums | | $ | 489 |
| | $ | 460 |
| | $ | 425 |
| | 6 |
| | 8 |
|
| Earned premiums | | 476 |
| | 443 |
| | 404 |
| | 7 |
| | 10 |
|
| | | | | | | | | | | |
| Ratios as a percent of earned premiums: | | | | | | | | Pt. Change | | Pt. Change |
| Current accident year before catastrophe losses | | 76.0 | % | | 74.3 | % | | 72.8 | % | | 1.7 |
| | 1.5 |
|
| Current accident year catastrophe losses | | 1.3 |
| | 1.1 |
| | 2.8 |
| | 0.2 |
| | (1.7 | ) |
| Prior accident years before catastrophe losses | | 0.0 |
| | 0.0 |
| | (4.1 | ) | | 0.0 |
| | 4.1 |
|
| Prior accident years catastrophe losses | | (0.2 | ) | | (0.3 | ) | | (0.5 | ) | | 0.1 |
| | 0.2 |
|
| Total loss and loss expenses ratio | | 77.1 | % | | 75.1 | % | | 71.0 | % | | 2.0 |
| | 4.1 |
|
| | | | | | | | | | | |
Net written premiums for personal auto increased in
2012,2014 and 2013, with both years reflecting
recent-year rate increases,
in recent years, ongoing high levels of policy retention
premium growth initiatives and a higher level of insured exposures.
The 2014 total loss and loss expense ratio improved 7.7rose 2.0 percentage points, largely due to a 3.91.4 point decreaseincrease for IBNR reserves that contributed to a total increase of 1.7 points in the ratio for the current accident year before catastrophe losses that includedlosses. The 2013 total loss and loss expense ratio increase was primarily due to a 2.1 point declinereduction in paid losses. Catastrophe losses that declined 0.5 percentage points and a larger amount ofthe ratio for favorable reserve development on prior accident years also contributedyears. That reduction related to both case and IBNR reserves. For accident year 2013, a lower catastrophe loss and loss expenses ratio offset a modest increase in the noncatastrophe component. Larger losses, above $250,000 per claim, were $15 million or 37 percent higher in 2013, compared with 2012, contributing to the improvedrise in the total loss and loss expense ratio. Large losses above $250,000 per claim were approximately 40 percent higher
As discussed in
both 2012Personal Lines Insurance Premiums, we continue to implement rate changes and
2011, compared with 2010, contributingimprove our pricing precision to
the higherimprove our total loss and loss expense ratio for
our personal auto line of business. Rate increases that apply pricing precision features for our personal auto line of business became effective beginning the
past two years.second-quarter 2014 for the majority of states where we market personal lines products and continue to be implemented. On average, the rate increase percentage was in the low-single-digit range, with approximately half of those states experiencing a mid-single-digit increase. Similar rate increases are planned for the year 2015.
Cincinnati Financial Corporation - 2014 10-K - Page 80
Homeowner
|
| | | | | | | | | | | | | | | | | | |
| (Dollars in millions) | | Years ended December 31, | | 2014-2013 | | 2013-2012 |
| | | 2014 | | 2013 | | 2012 | | Change % | | Change % |
| Written premiums | | $ | 456 |
| | $ | 428 |
| | $ | 378 |
| | 7 |
| | 13 |
|
| Earned premiums | | 443 |
| | 403 |
| | 353 |
| | 10 |
| | 14 |
|
| | | | | | | | | | | |
| Ratios as a percent of earned premiums: | | | | | | | | Pt. Change | | Pt. Change |
| Current accident year before catastrophe losses | | 54.0 | % | | 49.9 | % | | 67.4 | % | | 4.1 |
| | (17.5 | ) |
| Current accident year catastrophe losses | | 18.3 |
| | 18.6 |
| | 38.8 |
| | (0.3 | ) | | (20.2 | ) |
| Prior accident years before catastrophe losses | | (0.9 | ) | | (2.8 | ) | | (9.7 | ) | | 1.9 |
| | 6.9 |
|
| Prior accident years catastrophe losses | | (2.2 | ) | | (2.0 | ) | | (5.1 | ) | | (0.2 | ) | | 3.1 |
|
| Total loss and loss expense ratio | | 69.2 | % | | 63.7 | % | | 91.4 | % | | 5.5 |
| | (27.7 | ) |
| | | | | | | | | | | |
Net written premiums for homeowner rose in both 2014 and 2013, primarily due to higher renewal premiums that largely reflected higher pricing.
The
2011 total loss and loss expense ratio
rose 8.9for 2014 increased 5.5 percentage points
incompared with 2013, including 2.8 percentage points from weather-related losses not identified as part
of designated catastrophe events for the property casualty industry, also known as noncatastrophe weather losses. The 2013 ratio improvement was largely due to
a 1.8 point increaselower catastrophe losses and losses before catastrophes. The 2014 catastrophe loss ratio of 16.1 percentage points was near the 17.4 percent 10-year average for the years 1998 through 2007. For the six-year period 2008 through 2013, the homeowner catastrophe loss ratio averaged 31.5 percent, almost double the average of the previous 10 years. Our pricing models are adjusted annually to account for expected losses from catastrophe
perils that relate to causes of insured losses
plus a 2.4 point increase from
losses above $250,000. The refined line of business allocation process for loss expenses added another 8.5 percentage points to the 2011 total loss and loss expense ratio and also contributed to the increase in the ratio for the current accident year beforeweather or earthquake catastrophe
losses.As discussed in Personal Lines Insurance Premiums, Page 69, we continue to implement rate changes to continue to improve results for our personal auto line of business.
Homeowner
| (Dollars in millions) | | Years ended December 31, | | | 2012-2011 | | | 2011-2010 | |
| | | 2012 | | | 2011 | | | 2010 | | | Change % | | | Change % | |
| Homeowner: | | | | | | | | | | | | | | | | | | | | |
| Net written premiums | | $ | 378 | | | $ | 312 | | | $ | 299 | | | | 21 | | | | 4 | |
| Earned premiums | | | 353 | | | | 294 | | | | 289 | | | | 20 | | | | 2 | |
| Loss and loss expenses from: | | | | | | | | | | | | | | | | | | | | |
| Current accident year before catastrophe losses | | | 238 | | | | 231 | | | | 208 | | | | 3 | | | | 11 | |
| Current accident year catastrophe losses | | | 137 | | | | 158 | | | | 56 | | | | (13 | ) | | | 182 | |
| Prior accident years before catastrophe losses | | | (34 | ) | | | (14 | ) | | | (2 | ) | | | (143 | ) | | | (600 | ) |
| Prior accident years catastrophe losses | | | (18 | ) | | | (6 | ) | | | (4 | ) | | | (200 | ) | | | (50 | ) |
| Total loss and loss expenses | | $ | 323 | | | $ | 369 | | | $ | 258 | | | | (12 | ) | | | 43 | |
| Ratios as a percent of earned premiums: | | | | | | | | | | | Pt. Change | | | Pt. Change | |
| Current accident year before catastrophe losses | | | 67.4 | % | | | 78.7 | % | | | 72.0 | % | | | (11.3 | ) | | | 6.7 | |
| Current accident year catastrophe losses | | | 38.8 | | | | 53.6 | | | | 19.3 | | | | (14.8 | ) | | | 34.3 | |
| Prior accident years before catastrophe losses | | | (9.7 | ) | | | (4.5 | ) | | | (0.9 | ) | | | (5.2 | ) | | | (3.6 | ) |
| Prior accident years catastrophe losses | | | (5.1 | ) | | | (2.0 | ) | | | (1.4 | ) | | | (3.1 | ) | | | (0.6 | ) |
| Total loss and loss expense ratio | | | 91.4 | % | | | 125.8 | % | | | 89.0 | % | | | (34.4 | ) | | | 36.8 | |
Accident year loss and loss expenses incurred and ratios to earned premiums:
| Accident Year: | | 2012 | | | 2011 | | | 2010 | | | 2012 | | | 2011 | | | 2010 | |
| as of December 31, 2012 | | $ | 375 | | | $ | 349 | | | $ | 242 | | | | 106.2 | % | | | 118.9 | % | | | 83.8 | % |
| as of December 31, 2011 | | | | | | | 389 | | | | 248 | | | | | | | | 132.3 | | | | 86.1 | |
| as of December 31, 2010 | | | | | | | | | | | 264 | | | | | | | | | | | | 91.3 | |
Net written premiums for homeowner rose $66 million or 21 percent in 2012, with higher renewal premiums driving almost two-thirds of the increase. Lower ceded premiums for reinsurance contributed $19 million of the increase in net written premiums. Premiums ceded for reinsurance, which reduce premium revenue, were $21 million in 2012, $40 million in 2011 and $18 million in 2010. The total ceded premiums for 2011 increased primarily from premiums to reinstate coverage layers of our property catastrophe reinsurance treaty.
events.
We continue efforts to improve pricing precision through predictive analytics, which we believe will help to
achievemaintain long-term profitability. Rate increases in recent years, discussed in Personal Lines Insurance Premiums,
Page 69, should help lower loss ratios as the rate increases are earned.
ThoseThat includes the 2014 effects of our fifth round of homeowner rate increases, averaging approximately 10 percent during the first three quarters of 2014, with some individual policy rate increases lower or higher based on each insured exposure’s specific risk characteristics. Homeowner rate changes
were implementedfor the five most recent prior years represented an average annual rate increase in the high-single-digit range. Rate changes effective beginning the last quarter of 2014 averaged approximately 4 percent. Other profit-improvement initiatives, beginning in
October of 2012, 2011, 2010 and 2009 and averaged approximately 9 percent, 8 percent, 7 percent and 6 percent, respectively. In 2013,
we areinclude increasing our use of higher loss deductibles and actual cash value claims settlement for insured damage to older
roofs. In addition, we areroofs and increasing the number of property inspections conducted
whenas homeowner policies
renew, providingrenew. Inspections provide more opportunities for underwriting or pricing actions on a case-by-case basis. We also continue our gradual expansion into states less prone to catastrophe losses, which we believe will reduce variability in the long-term future catastrophe loss ratio.
In recent years, we have nonrenewed approximately 2,300 policies in Florida and Alabama that we believe were the most exposed to losses from hurricane damage. Together these actions represent important steps we are taking to improve homeowner results.The total loss and loss expense ratio over the past three years largely fluctuated with catastrophe losses, noncatastrophe weather-related losses and other large losses. For the five-year period 2008 through 2012, the homeowner catastrophe loss ratio averaged 34.5 percent, approximately double the 17.4 percent 10-year average for the years 1998 through 2007. The 34.4 percentage-point improvement in the 2012 total loss and loss expense ratio included a decrease of 17.9 points for catastrophe losses, compared with 2011. Noncatastrophe weather losses were approximately $10 million lower during 2012, improving the 2012 loss ratio by 7.0 percentage points compared with 2011. The effect of the $16 million ceded premiums to reinstate coverage layers of our property catastrophe reinsurance treaty added 6.4 percentage points the 2011 ratio.
The current accident year loss and loss expense ratio before catastrophe losses for 2012 decreased 11.3 percentage points compared with the 2011 ratio, largely due to the same noncatastrophe weather-related losses and reinsurance reinstatement effects noted above that raised the 2011 total loss and loss expense ratio.
Favorable development on prior accident year reserves rose in 2012, primarily due to reduction in case reserves for losses. Development trends are further discussed in Consolidated Property Casualty Insurance Development of Estimated Reserves by Accident Year,
Other Personal
|
| | | | | | | | | | | | | | | | | | |
| (Dollars in millions) | | Years ended December 31, | | 2014-2013 | | 2013-2012 |
| | | 2014 | | 2013 | | 2012 | | Change % | | Change % |
| Written premiums | | $ | 123 |
| | $ | 117 |
| | $ | 115 |
| | 5 |
| | 2 |
|
| Earned premiums | | 122 |
| | 115 |
| | 111 |
| | 6 |
| | 4 |
|
| | | | | | | | | | | |
| Ratios as a percent of earned premiums: | | | | | | | | Pt. Change | | Pt. Change |
| Current accident year before catastrophe losses | | 48.3 | % | | 55.7 | % | | 53.8 | % | | (7.4 | ) | | 1.9 |
|
| Current accident year catastrophe losses | | 4.0 |
| | 3.6 |
| | 10.1 |
| | 0.4 |
| | (6.5 | ) |
| Prior accident years before catastrophe losses | | 2.5 |
| | (15.4 | ) | | (23.5 | ) | | 17.9 |
| | 8.1 |
|
| Prior accident years catastrophe losses | | (0.2 | ) | | (0.9 | ) | | (1.4 | ) | | 0.7 |
| | 0.5 |
|
| Total loss and loss expense ratio | | 54.6 | % | | 43.0 | % | | 39.0 | % | | 11.6 |
| | 4.0 |
|
| | | | | | | | | | | |
Cincinnati Financial Corporation - 2014 10-K - Page
92.Other Personal
| (Dollars in millions) | | Years ended December 31, | | | 2012-2011 | | | 2011-2010 | |
| | | 2012 | | | 2011 | | | 2010 | | | Change % | | | Change % | |
| Other personal: | | | | | | | | | | | | | | | | | | | | |
| Net written premiums | | $ | 115 | | | $ | 104 | | | $ | 99 | | | | 11 | | | | 5 | |
| Earned premiums | | | 111 | | | | 100 | | | | 95 | | | | 11 | | | | 5 | |
| Loss and loss expenses from: | | | | | | | | | | | | | | | | | | | | |
| Current accident year before catastrophe losses | | | 59 | | | | 71 | | | | 61 | | | | (17 | ) | | | 16 | |
| Current accident year catastrophe losses | | | 11 | | | | 12 | | | | 4 | | | | (8 | ) | | | 200 | |
| Prior accident years before catastrophe losses | | | (26 | ) | | | (18 | ) | | | (20 | ) | | | (44 | ) | | | 10 | |
| Prior accident years catastrophe losses | | | (2 | ) | | | 0 | | | | (1 | ) | | | nm | | | | nm | |
| Total loss and loss expenses | | $ | 42 | | | $ | 65 | | | $ | 44 | | | | (35 | ) | | | 48 | |
| Ratios as a percent of earned premiums: | | | | | | | | | | | Pt. Change | | | Pt. Change | |
| Current accident year before catastrophe losses | | | 53.8 | % | | | 70.7 | % | | | 64.1 | % | | | (16.9 | ) | | | 6.6 | |
| Current accident year catastrophe losses | | | 10.1 | | | | 11.7 | | | | 3.8 | | | | (1.6 | ) | | | 7.9 | |
| Prior accident years before catastrophe losses | | | (23.5 | ) | | | (17.9 | ) | | | (20.8 | ) | | | (5.6 | ) | | | 2.9 | |
| Prior accident years catastrophe losses | | | (1.4 | ) | | | (0.5 | ) | | | (0.5 | ) | | | (0.9 | ) | | | 0.0 | |
| Total loss and loss expense ratio | | | 39.0 | % | | | 64.0 | % | | | 46.6 | % | | | (25.0 | ) | | | 17.4 | |
Accident year loss and loss expenses incurred and ratios to earned premiums:
| Accident Year: | | 2012 | | | 2011 | | | 2010 | | | 2012 | | | 2011 | | | 2010 | |
| as of December 31, 2012 | | $ | 70 | | | $ | 78 | | | $ | 48 | | | | 63.9 | % | | | 77.3 | % | | | 50.2 | % |
| as of December 31, 2011 | | | | | | | 83 | | | | 56 | | | | | | | | 82.4 | | | | 58.0 | |
| as of December 31, 2010 | | | | | | | | | | | 65 | | | | | | | | | | | | 67.9 | |
81
Other personal premiums
increasedgrew in
2012both 2014 and
2011,2013. Premium trends for this line of business have generally
tracking withbeen similar to the growth
inpattern of our personal auto and homeowner lines before the effects of reinsurance. Most of our other personal coverages are
endorsed towritten in conjunction with homeowner or auto policies. In addition to umbrella liability coverage, our other personal lines policies provide property-oriented coverages such as dwelling fire and inland marine.
Loss and loss expense ratios
returned toin 2014 continued at a
more profitable level,
reversing the aberration of 2011 that was driven by higher catastrophes and noncatastrophe weather.in part due to lower catastrophe losses, compared with 2012. Reserve development on prior accident years
recognized during 2012 was somewhat higher thandid not benefit these ratios in
recent years, although it2014, following a significant benefit in both 2013 and 2012. Reserve development can fluctuate significantly for this business line because personal umbrella liability coverage is a major component of other personal losses.
Development trends are further discussed in Consolidated Property Casualty Insurance Development of Estimated Reserves by Accident Year, Page 92.Personal Lines Insurance Outlook
A.M. Best projects industrywideprojections for 2015 indicate personal lines written premiums for the U.S. property casualty industry may grow approximately 53 percent, in 2013, with an industry statutory combined ratio estimated at approximately 10199 percent. Due to rate increases and a stable policy retention rate, plus the effect of an accelerated pace for recent-year new agency appointments, weWe believe our growth rate will likely be higher than the industry projection for 2013. In2015, driven by our rate increases, stable policy retention rate, accelerated pace of new agency appointments in recent years and increased focus on the high net worth personal lines market. Our high net worth initiative, along with various other actions to improve performance in our personal lines insurance segment, is discussed in greater detail in Item 1, Our Business and Our Strategy, Strategic Initiatives, Page10, and Personal Lines Results of Operations, beginning on Page 68, we discuss various actions we are taking to address the unsatisfactory performance of our personal lines segment, in particular the homeowner line of business.Insurance Results. Our personal lines pricing trends need to exceed loss trends to improve personal lines profitability, thereby helping to achieve our corporate financial targets. We discuss our overall outlook for our property casualty insurance operations in the Executive Summary,Summary.
Cincinnati Financial Corporation - 2014 10-K - Page
38.82
Excess and Surplus Lines Insurance Results
of OperationsOverview – Three-Year Highlights
| (Dollars in millions) | | Years ended December 31, | | | 2012-2011 | | | 2011-2010 | |
| | | 2012 | | | 2011 | | | 2010 | | | Change % | | | Change % | |
| | | | | | | | | | | | | | | | |
| Earned premiums | | $ | 93 | | | $ | 70 | | | $ | 49 | | | | 33 | | | | 43 | |
| | | | | | | | | | | | | | | | | | | | | |
| Loss and loss expenses from: | | | | | | | | | | | | | | | | | | | | |
| Current accident year before catastrophe losses | | | 68 | | | | 50 | | | | 41 | | | | 36 | | | | 22 | |
| Current accident year catastrophe losses | | | 2 | | | | 1 | | | | 1 | | | | 100 | | | | 0 | |
| Prior accident years before catastrophe losses | | | (5 | ) | | | (9 | ) | | | (1 | ) | | | 44 | | | | nm | |
| Prior accident years catastrophe losses | | | 0 | | | | 0 | | | | 0 | | | | nm | | | | nm | |
| Total loss and loss expenses | | | 65 | | | | 42 | | | | 41 | | | | 55 | | | | 2 | |
| Underwriting expenses | | | 29 | | | | 22 | | | | 16 | | | | 32 | | | | 38 | |
| Underwriting profit (loss) | | $ | (1 | ) | | $ | 6 | | | $ | (8 | ) | | | nm | | | | nm | |
| Ratios as a percent of earned premiums: | | | | | | | | | | | Pt. Change | | | Pt. Change | |
| Current accident year before catastrophe losses | | | 72.8 | % | | | 71.0 | % | | | 83.8 | % | | | 1.8 | | | | (12.8 | ) |
| Current accident year catastrophe losses | | | 2.1 | | | | 2.1 | | | | 1.2 | | | | 0.0 | | | | 0.9 | |
| Prior accident years before catastrophe losses | | | (5.6 | ) | | | (12.9 | ) | | | (1.3 | ) | | | 7.3 | | | | (11.6 | ) |
| Prior accident years catastrophe losses | | | 0.1 | | | | 0.1 | | | | 0.0 | | | | 0.0 | | | | 0.1 | |
| Total loss and loss expenses | | | 69.4 | | | | 60.3 | | | | 83.7 | | | | 9.1 | | | | (23.4 | ) |
| Underwriting expenses | | | 31.6 | | | | 31.9 | | | | 33.5 | | | | (0.3 | ) | | | (1.6 | ) |
| Combined ratio | | | 101.0 | % | | | 92.2 | % | | | 117.2 | % | | | 8.8 | | | | (25.0 | ) |
| | | | | | | | | | | | | | | | | | | | | |
| Combined ratio: | | | 101.0 | % | | | 92.2 | % | | | 117.2 | % | | | 8.8 | | | | (25.0 | ) |
| Contribution from catastrophe losses and prior years reserve development | | | (3.4 | ) | | | (10.7 | ) | | | (0.1 | ) | | | 7.3 | | | | (10.6 | ) |
| Combined ratio before catastrophe losses and prior years reserve development | | | 104.4 | % | | | 102.9 | % | | | 117.3 | % | | | 1.5 | | | | (14.4 | ) |
|
| | | | | | | | | | | | | | | | | | |
| (Dollars in millions) | | Years ended December 31, | | 2014-2013 | | 2013-2012 |
| | | 2014 | | 2013 | | 2012 | | Change % | | Change % |
| Earned premiums | | $ | 148 |
| | $ | 116 |
| | $ | 93 |
| | 28 |
| | 25 |
|
| | | | | | | | | | | |
| Loss and loss expenses from: | | |
| | |
| | |
| | |
| | |
|
| Current accident year before catastrophe losses | | 101 |
| | 78 |
| | 68 |
| | 29 |
| | 15 |
|
| Current accident year catastrophe losses | | 3 |
| | 1 |
| | 2 |
| | 200 |
| | (50 | ) |
| Prior accident years before catastrophe losses | | (29 | ) | | (13 | ) | | (5 | ) | | (123 | ) | | (160 | ) |
| Prior accident years catastrophe losses | | — |
| | — |
| | — |
| | nm |
| | nm |
|
| Total loss and loss expenses | | 75 |
| | 66 |
| | 65 |
| | 14 |
| | 2 |
|
| Underwriting expenses | | 43 |
| | 36 |
| | 29 |
| | 19 |
| | 24 |
|
| Underwriting profit (loss) | | $ | 30 |
| | $ | 14 |
| | $ | (1 | ) | | 114 |
| | nm |
|
| | | | | | | | | | | |
| Ratios as a percent of earned premiums: | | | | | | | | Pt. Change | | Pt. Change |
| Current accident year before catastrophe losses | | 68.1 | % | | 67.1 | % | | 72.8 | % | | 1.0 |
| | (5.7 | ) |
| Current accident year catastrophe losses | | 1.8 |
| | 0.7 |
| | 2.1 |
| | 1.1 |
| | (1.4 | ) |
| Prior accident years before catastrophe losses | | (19.6 | ) | | (11.2 | ) | | (5.6 | ) | | (8.4 | ) | | (5.6 | ) |
| Prior accident years catastrophe losses | | 0.2 |
| | 0.1 |
| | 0.1 |
| | 0.1 |
| | 0.0 |
|
| Total loss and loss expense | | 50.5 |
| | 56.7 |
| | 69.4 |
| | (6.2 | ) | | (12.7 | ) |
| Underwriting expense | | 28.9 |
| | 31.1 |
| | 31.6 |
| | (2.2 | ) | | (0.5 | ) |
| Combined ratio | | 79.4 | % | | 87.8 | % | | 101.0 | % | | (8.4 | ) | | (13.2 | ) |
| | | | | | | | | | | |
| Combined ratio: | | 79.4 | % | | 87.8 | % | | 101.0 | % | | (8.4 | ) | | (13.2 | ) |
Contribution from catastrophe losses and prior years reserve development | | (17.6 | ) | | (10.4 | ) | | (3.4 | ) | | (7.2 | ) | | (7.0 | ) |
Combined ratio before catastrophe losses and prior years reserve development | | 97.0 | % | | 98.2 | % | | 104.4 | % | | (1.2 | ) | | (6.2 | ) |
| | | | | | | | | | | |
Our excess and surplus lines
insurance segment includes results of The Cincinnati Specialty Underwriters Insurance Company and CSU Producer Resources Inc. The year
20122014 represented our
fifthseventh full year of operations for our excess and surplus lines
insurance segment. Performance highlights for
the excess and surplus linesthis segment include:
| · | Premiums – Earned premiums continued to climb in 2012, a result of strong growth in net written premiums, similar to 2011. Growth of net written premiums in 2012 was driven by higher renewal written premiums that included rising average renewal price increases. New business written premiums for 2012 rose compared with 2011, reflecting higher pricing in an excess and surplus lines market that continued to experience strong competition. |
| · | Combined ratio – The combined ratio rose 8.8 percentage points in 2012, primarily due to unusually large net favorable reserve development on prior accident years during 2011. Most of this increase was from higher loss expenses. The loss ratio component rose 2.5 points, including 1.3 points from higher large losses, as shown on the Excess and Surplus Lines Insurance Losses by Size table on Page 76. |
Premiums – Earned premiums continued to rise in 2014, a result of strong growth in net written premiums, similar to recent years. Growth of net written premiums in 2014 was driven by higher renewal written premiums that included average renewal price increases in a mid-single-digit range. New business written premiums for 2014 again rose, compared with the prior year, largely reflecting strong agency relationships and premium growth initiatives.
Combined ratio – The combined ratio improved 8.4 percentage points in 2014, due to larger amounts of favorable reserve development on prior accident years.
Cincinnati Financial Corporation - 2014 10-K - Page 83
Excess and Surplus Lines Insurance Premiums
| (Dollars in millions) | | Years ended December 31, | | | 2012-2011 | | | 2011-2010 | |
| | | 2012 | | | 2011 | | | 2010 | | | Change % | | | Change % | |
| Renewal written premiums | | $ | 73 | | | $ | 49 | | | $ | 29 | | | | 49 | | | | 69 | |
| New business written premiums | | | 38 | | | | 35 | | | | 35 | | | | 9 | | | | 0 | |
| Other written premiums | | | (6 | ) | | | (5 | ) | | | (6 | ) | | | (20 | ) | | | 17 | |
| Net written premiums | | | 105 | | | | 79 | | | | 58 | | | | 33 | | | | 36 | |
| Unearned premium change | | | (12 | ) | | | (9 | ) | | | (9 | ) | | | (33 | ) | | | 0 | |
| Earned premiums | | $ | 93 | | | $ | 70 | | | $ | 49 | | | | 33 | | | | 43 | |
|
| | | | | | | | | | | | | | | | | | |
| (Dollars in millions) | | Years ended December 31, | | 2014-2013 | | 2013-2012 |
| | | 2014 | | 2013 | | 2012 | | Change % | | Change % |
| Agency renewal written premiums | | $ | 111 |
| | $ | 94 |
| | $ | 73 |
| | 18 |
| | 29 |
|
| Agency new business written premiums | | 51 |
| | 42 |
| | 38 |
| | 21 |
| | 11 |
|
| Other written premiums | | (9 | ) | | (8 | ) | | (6 | ) | | (13 | ) | | (33 | ) |
| Net written premiums | | 153 |
| | 128 |
| | 105 |
| | 20 |
| | 22 |
|
| Unearned premium change | | (5 | ) | | (12 | ) | | (12 | ) | | 58 |
| | 0 |
|
| Earned premiums | | $ | 148 |
| | $ | 116 |
| | $ | 93 |
| | 28 |
| | 25 |
|
| | | | | | | | | | | |
The $24$17 million increase in 20122014 renewal premiums reflected the opportunity to renew many policies for the first time as well as higher renewal pricing. Average renewal pricing roseincreases were in the mid-single-digit range during 2014, down from a high-single-digit range during each quarter2013. December 2014 was the 52nd consecutive month of 2012, improving over the mid-single-digit rangepositive average price changes for the last quarterthis segment of 2011.our property casualty business. We measure average changes in excess and surplus lines renewal pricing as the rate of change in renewal premium for the new policy period compared with the premium for the expiring policy period, assuming no change in the level of insured exposures or policy coverage between those periods for respective policies. New business written premiums for the year
20122014 rose
921 percent, compared with
2011, primarily due to2013, reflecting higher pricing
as theand an increase in submissions from agencies requesting an insurance policy quote. High-quality service provided by excess and surplus lines
market remained competitive, including activity by standard market companies writing policies for risks formerly insurable only infield marketing representatives and headquarters underwriters enhances the
excess and surplus lines market. We observed many cases where competing carriers offered policy terms and conditions that were less restrictive than those we observed in the past for similar risks, without a corresponding premium for the broadened insurance coverage. Therefore, we declined to write manybenefits of
thoseour strong agency relationships, also helping increase our new business
opportunities and also some renewal business opportunities.written premiums.
Other written premiums are primarily premiums that are ceded to reinsurers and that lower our net written premiums. Ceded premium volume for
20122014 increased relative to
2011,2013, reflecting higher written premiums subject to reinsurance.
Beginning in 2011, treaty reinsurance for our excess and surplus lines segment was provided by The Cincinnati Insurance Company, except for our corporate property catastrophe treaty, where The Cincinnati Specialty Underwriters Insurance Company is a named insured under the treaty. In previous years, all reinsurance for our excess and surplus lines segment was provided by third-party reinsurers that generally provided less favorable pricing. Reinsurance arrangements are further discussed in 2013 Reinsurance Programs, Page 95.Excess and Surplus Lines Loss and Loss Expenses
Loss and loss expenses include both net paid losses and reserve changes for unpaid losses, as well as the associated loss expenses.
MostThe majority of the
total incurred losses and loss expenses shown in our excess and surplus lines
insurance segment three-year highlights table
on Page 74 are for the respective current accident years,
andwith reserve development on prior accident years
is shown separately. Since less than 20 percent of our
20122014 excess and surplus lines current accident year incurred losses and loss expenses represents net paid
losses,amounts, a large majority represents reserves for our estimate of unpaid losses and loss expenses. These reserves develop over time, and we
re-estimateupdate our estimates of previously reported reserves as we learn more about the development of the related claims. The table below illustrates that development. For example, the
85.067.8 percent accident year
20102013 loss and loss expense ratio reported as of December 31,
2010,2013, developed favorably by
13.98.1 percentage points to
71.159.7 percent due to claims settling for less than previously estimated, or due to updated reserve estimates for unpaid claims, as of December 31,
2012.2014. Accident years
20112013 and
20102012 for this segment have both developed favorably, as indicated by the progression over time of the ratios in the table.
(Dollars
|
| | | | | | | | | | | | | | | | | | | | | |
| (Dollars in millions) | | | | | | | | | | | | |
| Accident year loss and loss expenses incurred and ratios to earned premiums: | | | | | |
| Accident year: | | 2014 | | 2013 | | 2012 | | 2014 | | 2013 | | 2012 |
| as of December 31, 2014 | | $ | 104 |
| | $ | 69 |
| | $ | 54 |
| | 69.9 | % | | 59.7 | % | | 57.4 | % |
| as of December 31, 2013 | | |
| | 79 |
| | 62 |
| | |
| | 67.8 |
| | 65.9 |
|
| as of December 31, 2012 | | |
| | |
| | 70 |
| | |
| | |
| | 74.9 |
|
| | | | | | | | | | | | | |
Catastrophe losses, as discussed in
millions)AccidentConsolidated Property Casualty Insurance Results, explain some of the movement in current accident year loss and loss expenses incurred andexpense ratios to earned premiums:
| Accident Year: | | 2012 | | | 2011 | | | 2010 | | | 2012 | | | 2011 | | | 2010 | |
| as of December 31, 2012 | | $ | 70 | | | $ | 51 | | | $ | 35 | | | | 74.9 | % | | | 73.0 | % | | | 71.1 | % |
| as of December 31, 2011 | | | | | | | 51 | | | | 38 | | | | | | | | 73.1 | | | | 77.6 | |
| as of December 31, 2010 | | | | | | | | | | | 42 | | | | | | | | | | | | 85.0 | |
Catastrophe losses for our commercial lines and personal lines segments were lower inaccident years 2012 compared with 2011. For the excess and surplus lines segment, catastrophe losses were higher, but the resulting ratio for the catastrophe loss component of the loss and loss expense ratio remained level due to higher earned premiums. through 2014.
Catastrophe losses added
1.8 percentage points in 2014, following 0.7 percentage points in 2013 and 2.1 percentage points
forin 2012,
and 2011, following 1.2 percentage points for 2010, to the respective excess and surplus lines
current accident year loss and loss expense ratios in the table above.
Cincinnati Financial Corporation - 2014 10-K - Page 84
The
2012 increase of 1.8 percentage points in the68.1 percent ratio for current accident year loss and loss
expense ratioexpenses before catastrophe losses
was primarily due to trends in large losses incurred relative to earned premium trends, as shown in the table below. New losses of $250,000 or more per claim totaled $18 million in 2012,for 2014 rose a modest 1.0 percentage point compared with
$13 million in 2011. Relative to growth in earned premiums, the
increase in new large losses raised the67.1 percent accident year 2013 ratio
by 1.2 percentage points.measured as of December 31, 2013.
Excess and surplus lines reserve development on prior accident years continued to net
to a favorable amount in
20122014 as
$5$29 million was recognized, compared with
$9$13 million in
2011. The 20112013. Nearly two-thirds of the 2014 favorable development was
for accident years 2013 and 2012 in aggregate, and related primarily
due to
beginning to place more reliancelower than anticipated loss emergence on
claims experience emergence patterns from our excess and surplus lines business for IBNR loss and loss expense estimates, with relatively less reliance on historical claims experience emergence patterns from similar lines of business for our standard commercial lines business.known claims.
We believe the loss and loss
expensesexpense reserves for our excess and surplus lines business are adequate. We establish case reserves in a manner consistent with standard lines coverages, despite the more restrictive terms and conditions for excess and surplus lines policies.
OurAfter the first
two years of our excess and surplus lines
policies were written in 2008. After two years of operation, reserves for estimated unpaid losses and loss expenses were $18 million as of December 31, 2009, for losses that occurred in 2008 and 2009. As of December 31,
2012, only an estimated $5 million remained2014, our estimate for the remaining unpaid
for loss eventslosses that occurred in
2008 and 2009.those years was less than $1 million. The inherent uncertainty in estimating reserves is discussed in
Liquidity and Capital Resources, Property Casualty Insurance Loss and Loss Expense
Reserves, Page 43.Reserves. Development trends are further analyzed in
Consolidated Property Casualty Insurance Development of Estimated Reserves by Accident
Year, Page 92.Year.
Excess and Surplus Lines Insurance Losses by Size
| (Dollars in millions) | | Years ended December 31, | | | 2012-2011 | | | 2011-2010 | |
| | | 2012 | | | 2011 | | | 2010 | | | Change % | | | Change % | |
| New losses greater than $4,000,000 | | $ | 0 | | | $ | 0 | | | $ | 0 | | | | nm | | | | nm | |
| New losses $1,000,000-$4,000,000 | | | 4 | | | | 0 | | | | 3 | | | | nm | | | | (100 | ) |
| New losses $250,000-$1,000,000 | | | 14 | | | | 13 | | | | 9 | | | | 8 | | | | 44 | |
| Case reserve development above $250,000 | | | 6 | | | | 4 | | | | 3 | | | | 50 | | | | 33 | |
| Total large losses incurred | | | 24 | | | | 17 | | | | 15 | | | | 41 | | | | 13 | |
| Other losses excluding catastrophe losses | | | 22 | | | | 16 | | | | 13 | | | | 38 | | | | 23 | |
| Catastrophe losses | | | 2 | | | | 1 | | | | 1 | | | | 100 | | | | 0 | |
| Total net losses incurred | | $ | 48 | | | $ | 34 | | | $ | 29 | | | | 41 | | | | 17 | |
| Ratios as a percent of earned premiums: | | | | | | | | | | | Pt. Change | | | Pt. Change | |
| New losses greater than $4,000,000 | | | 0.0 | % | | | 0.0 | % | | | 0.0 | % | | | 0.0 | | | | 0.0 | |
| New losses $1,000,000-$4,000,000 | | | 4.7 | | | | 0.0 | | | | 5.1 | | | | 4.7 | | | | (5.1 | ) |
| New losses $250,000-$1,000,000 | | | 14.9 | | | | 18.4 | | | | 18.4 | | | | (3.5 | ) | | | 0.0 | |
| Case reserve development above $250,000 | | | 5.9 | | | | 5.8 | | | | 14.2 | | | | 0.1 | | | | (8.4 | ) |
| Total large loss ratio | | | 25.5 | | | | 24.2 | | | | 37.7 | | | | 1.3 | | | | (13.5 | ) |
| Other losses excluding catastrophe losses | | | 23.9 | | | | 22.6 | | | | 27.0 | | | | 1.3 | | | | (4.4 | ) |
| Catastrophe losses | | | 2.1 | | | | 2.2 | | | | 1.2 | | | | (0.1 | ) | | | 1.0 | |
| Total net loss ratio | | | 51.5 | % | | | 49.0 | % | | | 65.9 | % | | | 2.5 | | | | (16.9 | ) |
|
| | | | | | | | | | | | | | | | | | |
| (Dollars in millions, net of reinsurance) | | Years ended December 31, | | 2014-2013 | | 2013-2012 |
| | | 2014 | | 2013 | | 2012 | | Change % | | Change % |
| Current accident year losses greater than $5,000,000 | | — |
| | $ | — |
| | $ | — |
| | nm |
| | nm |
|
| Current accident year losses $1,000,000-$5,000,000 | | 3 |
| | 3 |
| | 2 |
| | — |
| | nm |
|
| Large loss prior accident year reserve development | | (1 | ) | | 1 |
| | (1 | ) | | nm |
| | nm |
|
| Total large losses incurred | | 2 |
| | 4 |
| | 1 |
| | (50 | ) | | nm |
|
| Losses incurred but not reported | | 24 |
| | 20 |
| | 16 |
| | 20 |
| | 25 |
|
| Other losses excluding catastrophe losses | | 25 |
| | 23 |
| | 29 |
| | 9 |
| | (21 | ) |
| Catastrophe losses | | 4 |
| | 1 |
| | 2 |
| | nm |
| | (50 | ) |
| Total losses incurred | | $ | 55 |
| | $ | 48 |
| | $ | 48 |
| | 15 |
| | — |
|
| | | | | | | | | | | |
| Ratios as a percent of earned premiums: | | | | | | | | Pt. Change | | Pt. Change |
| Current accident year losses greater than $5,000,000 | | 0.0 | % | | 0.0 | % | | 0.0 | % | | 0.0 |
| | 0.0 |
|
| Current accident year losses $1,000,000-$5,000,000 | | 2.3 |
| | 2.7 |
| | 2.2 |
| | (0.4 | ) | | 0.5 |
|
| Large loss prior accident year reserve development | | (0.9 | ) | | 0.8 |
| | (0.9 | ) | | (1.7 | ) | | 1.7 |
|
| Total large loss ratio | | 1.4 |
| | 3.5 |
| | 1.3 |
| | (2.1 | ) | | 2.2 |
|
| Losses incurred but not reported | | 16.4 |
| | 16.8 |
| | 16.8 |
| | (0.4 | ) | | — |
|
| Other losses excluding catastrophe losses | | 17.2 |
| | 20.3 |
| | 31.3 |
| | (3.1 | ) | | (11.0 | ) |
| Catastrophe losses | | 1.8 |
| | 0.7 |
| | 2.1 |
| | 1.1 |
| | (1.4 | ) |
| Total loss ratio | | 36.8 | % | | 41.3 | % | | 51.5 | % | | (4.5 | ) | | (10.2 | ) |
| | | | | | | | | | | |
In
2012,2014, total large losses incurred
increaseddecreased by
$7$2 million or
4150 percent, net of reinsurance,
exceeding earned premium growth at 33 percent, helping to
raiselower the corresponding ratio by
1.32.1 percentage points, compared with
2011.2013. The ratio for
the year 20112013 trended in the opposite direction, as earned premium growth
significantly outpacedlagged the rate of growth in total large losses. Our analysis indicated no unexpected concentration of these losses and reserve increases by risk category, geographic region, policy inception, agency or field marketing territory. We believe the inherent volatility of aggregate loss experience for our portfolio of larger policies is greater than that of our portfolio of smaller policies, and we continue to monitor the volatility in addition to general inflationary trends in loss costs.
Cincinnati Financial Corporation - 2014 10-K - Page 85
Excess and Surplus Lines Insurance Underwriting Expenses
| (Dollars in millions) | | Years ended December 31, | | | 2012-2011 | | | 2011-2010 | |
| | | 2012 | | | 2011 | | | 2010 | | | Change % | | | Change % | |
| Commission expenses | | $ | 17 | | | $ | 12 | | | $ | 8 | | | | 42 | | | | 50 | |
| Other underwriting expenses | | | 12 | | | | 10 | | | | 8 | | | | 20 | | | | 25 | |
| Total underwriting expenses | | $ | 29 | | | $ | 22 | | | $ | 16 | | | | 32 | | | | 38 | |
| Ratios as a percent of earned premiums: | | | | | | | | | | | Pt. Change | | | Pt. Change | |
| Commission expenses | | | 18.2 | % | | | 17.0 | % | | | 16.5 | % | | | 1.2 | | | | 0.5 | |
| Other underwriting expenses | | | 13.4 | | | | 14.9 | | | | 17.0 | | | | (1.5 | ) | | | (2.1 | ) |
| Total underwriting expense ratio | | | 31.6 | % | | | 31.9 | % | | | 33.5 | % | | | (0.3 | ) | | | (1.6 | ) |
|
| | | | | | | | | | | | | | | | | | |
| (Dollars in millions) | | Years ended December 31, | | 2014-2013 | | 2013-2012 |
| | | 2014 | | 2013 | | 2012 | | Change % | | Change % |
| Commission expenses | | $ | 27 |
| | $ | 21 |
| | $ | 17 |
| | 29 |
| | 24 |
|
| Other underwriting expenses | | 16 |
| | 15 |
| | 12 |
| | 7 |
| | 25 |
|
| Total underwriting expenses | | $ | 43 |
| | $ | 36 |
| | $ | 29 |
| | 19 |
| | 24 |
|
| Ratios as a percent of earned premiums: | | | | | | | | Pt. Change | | Pt. Change |
| Commission expense | | 18.3 | % | | 18.6 | % | | 18.2 | % | | (0.3 | ) | | 0.4 |
|
| Other underwriting expense | | 10.6 |
| | 12.5 |
| | 13.4 |
| | (1.9 | ) | | (0.9 | ) |
| Total underwriting expense ratio | | 28.9 | % | | 31.1 | % | | 31.6 | % | | (2.2 | ) | | (0.5 | ) |
| | | | | | | | | | | |
Excess and surplus lines commission expense as a percent of earned premiums
rosewas fairly stable during the three-year period ending in
2012, primarily due to higher agency profit-sharing commissions.2014. Other underwriting expenses declined in 20122014 and 20112013 as a percent of earned premiums, primarily due to earned premiums rising faster than those expenses.
Excess and Surplus Lines Outlook
The excess and surplus lines
markets aremarket is expected to see
continued firmingthe magnitude of rate increases continue to decline on several classes of business due to increased capacity in
2013, according to several industry reports.the market. Competition is expected to remain strong,
in partespecially on large accounts, due
primarily to standard market insurance companies insuring businesses that previously were written by excess and surplus lines insurers.
While soft market conditions for commercial lines business overall is the driver of this trend, firmingFirming is expected
primarilyto continue for
property coverage due to industry catastrophe losses and for select casualtyspecific classes of business where loss costs are exceeding rates, such as habitational and lessors-risk
classes.classes for property coverages and also lawyers professional in errors and omissions coverages. The slowly recovering U.S. economy, another major factor in demand for insurance products, is also expected to contribute to
modestly increasing premium volumepremiums during
20122015 for the excess and surplus lines industry.
Industry reports suggest that there are opportunities for managing profitability and growth exist through greater useoftechnology. Technology and data are also being used by excess and surplus lines insurance companiestoidentify new exposures in emerging businesses that need insurance protection or other value-added services. Our strategy of providing superior service is expected to continue to grow our excess and surplus lines
insurance segment and
to achieve profitability despite challenging market conditions. We intend to
continuekeep carefully selecting and pricing risks, providing prompt delivery of insurance quotes and policies and
giving outstanding claims and loss control service from local field representatives who also handle the standard lines business for their assigned agencies. These local representatives are supported by headquarters underwriters and claims managers who specialize in excess and surplus lines.
Cincinnati Financial Corporation - 2014 10-K - Page 86
Life Insurance Results
of OperationsOverview – Three-Year Highlights
| (In millions) | | Years ended December 31, | | | 2012-2011 | | | 2011-2010 | |
| | | 2012 | | | 2011 | | | 2010 | | | Change % | | | Change % | |
| | | | | | | | | | | | | | | | |
| Earned premiums | | $ | 178 | | | $ | 165 | | | $ | 158 | | | | 8 | | | | 4 | |
| Separate account investment management fees | | | 1 | | | | 2 | | | | 1 | | | | (50 | ) | | | 100 | |
| Total revenues | | | 179 | | | | 167 | | | | 159 | | | | 7 | | | | 5 | |
| Contract holders' benefits incurred | | | 185 | | | | 189 | | | | 170 | | | | (2 | ) | | | 11 | |
| Investment interest credited to contract holders | | | (82 | ) | | | (81 | ) | | | (79 | ) | | | (1 | ) | | | (3 | ) |
| Operating expenses incurred | | | 79 | | | | 62 | | | | 62 | | | | 27 | | | | 0 | |
| Total benefits and expenses | | | 182 | | | | 170 | | | | 153 | | | | 7 | | | | 11 | |
| Life insurance segment profit (loss) | | $ | (3 | ) | | $ | (3 | ) | | $ | 6 | | | | 0 | | | | (150 | ) |
|
| | | | | | | | | | | | | | | | | | |
| (Dollars in millions) | | Years ended December 31, | | 2014-2013 | | 2013-2012 |
| | | 2014 | | 2013 | | 2012 | | Change % | | Change % |
| Earned premiums | | $ | 198 |
| | $ | 189 |
| | $ | 178 |
| | 5 |
| | 6 |
|
| Separate account investment management fees | | 6 |
| | 4 |
| | 1 |
| | 50 |
| | 300 |
|
| Total revenues | | 204 |
| | 193 |
| | 179 |
| | 6 |
| | 8 |
|
| Contract holders' benefits incurred | | 229 |
| | 204 |
| | 185 |
| | 12 |
| | 10 |
|
| Investment interest credited to contract holders | | (83 | ) | | (80 | ) | | (82 | ) | | (4 | ) | | 2 |
|
| Underwriting expenses incurred | | 63 |
| | 60 |
| | 79 |
| | 5 |
| | (24 | ) |
| Total benefits and expenses | | 209 |
| | 184 |
| | 182 |
| | 14 |
| | 1 |
|
| Life insurance segment (loss) profit | | $ | (5 | ) | | $ | 9 |
| | $ | (3 | ) | | nm |
| | nm |
|
| | | | | | | | | | | |
Performance highlights for the life insurance segment include:
| · | Revenues – Earned premiums rose 8 percent for the year 2012. The largest life insurance product line, term life insurance, continued to grow earned premiums at a strong pace, up 10 percent in 2012. Gross in-force policy face amounts rose 5 percent to $81.467 billion at year-end 2012 from $77.691 billion at year-end 2011 and $74.124 billion at year-end 2010. |
| · | Profitability – The life insurance segment frequently reports only a small profit or loss because most of its investment income is included in investment segment results. We include only investment income credited to contract holders (interest assumed in life insurance policy reserve calculations) in life insurance segment results. The segment reported a $3 million loss in 2012 and 2011, following a $6 million profit in 2010, and has averaged a $1 million profit over the past six years. |
Life Insurance Premiums
| (Dollars in millions) | | Years ended December 31, | | | 2012-2011 | | | 2011-2010 | |
| | | 2012 | | | 2011 | | | 2010 | | | Change % | | | Change % | |
| Term life insurance | | $ | 115 | | | $ | 105 | | | $ | 96 | | | | 10 | | | | 9 | |
| Universal life insurance | | | 34 | | | | 32 | | | | 35 | | | | 6 | | | | (9 | ) |
| Other life insurance, annuity, and disability income products | | | 29 | | | | 28 | | | | 27 | | | | 4 | | | | 4 | |
| Net earned premiums | | $ | 178 | | | $ | 165 | | | $ | 158 | | | | 8 | | | | 4 | |
Revenues – Earned premiums rose 5 percent for the year 2014, as shown in the table below. The largest life insurance product line, term life insurance, rose 7 percent. Net in-force policy face amounts rose 5 percent to $50.356 billion at year-end 2014 from $48.063 billion at year-end 2013 and $45.126 billion at year-end 2012.
Profitability – The life insurance segment frequently reports only a small profit or loss because most of its investment income is included in investments segment results. We include only investment income credited to contract holders (interest assumed in life insurance policy reserve calculations) in life insurance segment results. The segment reported a $5 million loss in 2014, following $9 million of profit in 2013 and a $3 million loss in 2012. It has averaged a $1 million profit over the past five years.
Earned premiums rose $9 million in 2014, primarily due to growth in our term life insurance business, as shown in the table below. Growth in 2013 was also primarily due to term life insurance.
|
| | | | | | | | | | | | | | | | |
| (Dollars in millions) | | Years ended December 31, | | 2014-2013 | | 2013-2012 |
| | | 2014 | | 2013 | | 2012 | | Change % | | Change % |
| Term life insurance | | $ | 131 |
| | $ | 122 |
| | $ | 115 |
| | 7 | | 6 |
| Universal life insurance | | 35 |
| | 35 |
| | 34 |
| | 0 | | 3 |
Other life insurance, annuity and disability income products | | 32 |
| | 32 |
| | 29 |
| | 0 | | 10 |
| Net earned premiums | | $ | 198 |
| | $ | 189 |
| | $ | 178 |
| | 5 | | 6 |
| | | | | | | | | | | |
We market term, whole and universal life products, fixed annuities and disability income products. In addition, we offer term, whole and universal life and disability insurance to employees at their worksite. These products provide our property casualty agency force with excellent cross-serving opportunities for both commercial and personal accounts.
Earned premiums rose by $13 million in 2012, primarily due to growth in our term life insurance business. Earned premiums from term life insurance grew $10 million, or 10 percent.
Separate account investment management fee income contributed $1 million to total revenue in 2012, compared with $2 million in 2011 and $1 million in 2010.
Over the past several years, we have worked to maintain a portfolio of simple yet competitive products primarily under the LifeHorizons banner. Our product development efforts emphasize death benefit protection and guarantees. Distribution expansion within our property casualty insurance agencies remains a high priority.
In the past several years, we have added life field marketing representatives for the western, southeastern and northeastern states. Our
3230 life field marketing representatives work in partnership with our
127133 property casualty field marketing representatives. Approximately 69 percent of our term and other life insurance product premiums were generated through our property casualty insurance agency relationships.
Life
Insurance ProfitabilityAlthough we exclude mostinsurance segment expenses consist principally of:
Contract holders’ benefits incurred, related to traditional life and interest-sensitive products, accounted for 78.4 percent of 2014 total benefits and expenses compared with 77.3 percent in 2013 and 70.1 percent in 2012. Total contract holders’ benefits increased as life policy reserves and net death claims were higher in 2014 compared with 2013. Net death claims increased over 2013, exceeding our projections while remaining within our range of pricing expectations.
Cincinnati Financial Corporation - 2014 10-K - Page 87
Underwriting expenses incurred, net of deferred acquisition costs, accounted for 21.6 percent of 2014 total benefits and expenses compared with 22.7 percent in 2013 and 29.9 percent in 2012. Expenses in 2014 increased 5 percent, matching the percentage increase in earned premiums. In 2013, expenses decreased, primarily due to the impact of unlocking of actuarial assumptions for our universal life insurance companycontracts.
Life insurance segment profitability depends largely on premium levels, the adequacy of product pricing, underwriting skill and operating efficiencies. This segment's results include only investment interest credited to contract holders (interest assumed in life insurance policy reserve calculations). The remaining investment income fromis reported in the investments segment results. The life investment segment results, weportfolio is managed to earn target spreads between earned investment rates on general account assets and rates credited to policyholders. We consider the value of assets under management and investment income for the life investment portfolio as key performance indicators for the life insurance segment.
We seek to maintain a competitive advantage with respect to benefits paid and reserve increases by consistently achieving better than average claims experience due to skilled underwriting. Commissions paid by the life insurance operation are on par with industry averages.
We recognize that assets under management, capital appreciation and investment income are integral to evaluation of the success of the life insurance segment because of the long duration of life products. On a basis that includes investment income and realized gains or losses from life insurance-related invested assets, the life insurance company reported a net profit of
$38$39 million in
2012,2014, compared with a net profit of
$20$48 million in
20112013 and a net profit of $38 million in
2010.2012. The life insurance company portfolio had after-tax net realized investment gains of
$3 million in 2014, compared with $4 million
each in
2012, compared with after-tax net realized investment losses of $12 million in 2011, which included $20 million in OTTI charges. Net realized investment gains after taxes were $2 million in 2010.2013 and 2012. Realized investment gains and losses are discussed under
Investment ResultsInvestments Results. We exclude most of
Operations, Page 79.Life segment expenses consist principally of:
| · | Contract holders’ benefits incurred, related to traditional life and interest-sensitive products, accounted for 70.1 percent of 2012 total benefits and expenses compared with 75.3 percent in 2011 and 73.4 percent in 2010. Total contract holders’ benefits decreased as the increase in life policy reserves was lower in 2012 compared with 2011. Partially offsetting the lower policy reserve increase were net death claims that increased over 2011, but remained within our range of pricing expectations. |
| · | Operating expenses incurred, net of deferred acquisition costs, accounted for 29.9 percent of 2012 total benefits and expenses compared with 24.7 percent in 2011 and 26.6 percent in 2010. Expenses in 2012 increased, primarily due to the unlocking of actuarial assumptions for our universal life insurance contracts. |
Life segment profitability depends largely on premium levels, the adequacy of product pricing, underwriting skill and operating efficiencies. Life segment results include only investment interest credited to contract holders (interest assumed in life insurance policy reserve calculations). The remainingcompany investment income is reported in the investmentfrom investments segment results. The life investment portfolio is managed to earn target spreads between earned investment rates on general account assets and rates credited to policyholders. We consider the value of assets under management and investment income for the life investment portfolio as key performance indicators for the life insurance segment.
We seek to maintain a competitive advantage with respect to benefits paid and reserve increases by consistently achieving better than average claims experience due to skilled underwriting. Commissions paid by the life insurance operation are on par with industry averages.
We expect 2013 to be another challenging year forview the life insurance industry as stable and remain optimistic moving into 2015 despite the persistently low interest rates appear unlikelyrate environment. The U.S. economy continued to move significantlygradually improve with unemployment dropping and Gross Domestic Product marginally improving during the year. We are also encouraged by recent guidance from their historic lows. Interestthe Federal Reserve that reiterates its plan to gradually increase the targeted short term interest rate margins will continuestarting in the latter half of 2015.
Disruption in the global oil industry and other foreign market upheaval led to
compress as maturing fixeda surge in demand for U.S. Treasury securities and a corresponding drop in yield. While decreased investment income
assets are replaced with lower yielding securities. Application activity was relatively flat in 2012 at approximately 1 percent growth and 2013 ushered in higher taxesis a concern, our focus on
all Americans, meaning less disposable incomemortality products insulates us to
purchase life insurance.Despite allsome degree from the impact of this, we retain a positive outlook for 2013. Our core product line, term life insurance, is not as sensitive tolow interest rates as other products. And because of our distribution system, we are able to grow our business as the footprint of our property and casualty parent expands.rates. We also see the historically low ownership of life insurance as a great opportunity and believe that independent agents are the perfect messengers to communicate the value and stability that our products offer.
We look for continued price increases on life products that have a heavy investment component. The term life insurance market looks to have stabilized for the time being and will likely remain little changed as companies wait to see how aggressively state legislatures move to pass a new principles-based reserve approach that was recently adopted by the National Association of Insurance Commissioners. Principles-based reserves, once effective, could prompt a wave of repricing activity, with rate reductions for term life insurance. While its ultimate passage is still not certain, industry consensus is that the beginning of 2015 would be the earliest implementation date for the new reserve law.
Our property casualty agencies remain the main distribution system for our life insurance segment, and we continue to emphasize securing an increasing share ofexpect the life insurance premium produced by these agencies. While otherindustry will be waiting and watching to see what transpires with interest rates later in 2015 before making any major pricing moves.
Another much-discussed threat to the life
insurers expand nontraditional distribution channels suchinsurance industry is changing buyer habits. Life insurance ownership is at historic lows, and we view this as
directan opportunity. We remain committed to emphasizing life insurance sales
we intend to market through
agencies affiliated with our property casualty
insurance operations or independent life-only agencies. In 2012, our property casualty agencies produced approximately 69 percentdistribution. Our agents give us access to middle market customers who are now more likely to need individual life insurance. Also, as predictive modeling begins to enhance and
our life-only agencies 31 percent of ourmake more efficient the life insurance
premium.Improvements inunderwriting process, we are uniquely positioned to benefit due to our operational technology continue to make it easier for our agents to do business with us. We recently introduced electronic enrollment software for our voluntary worksite marketing segment. We look for that segment to continue to grow as moreexisting personal and more employers are looking to supplement their employee benefit programs with voluntary options. We also plan to roll-out application functionality forcommercial lines customers.
On the
iPad, whichregulatory front, we expect
the implementation of principle-based statutory reserves to
increase agent use ofbe a long-term positive development, granting us greater flexibility with capital management. Recent legislative action indicates that we may be able to start using the new rules for new business by January 1, 2017. Term insurance remains our
electronic application process. Finally, we recently introduced acore product and stands to benefit the most under the new
commission system which will allow for more flexible compensation agreements with our independent agency force.Investmentreserving rules.
Cincinnati Financial Corporation - 2014 10-K - Page 88
Investments Results
of Operations Overview – Three-Year Highlights
Investment
Investments Results
| (In millions) | | Years ended December 31, | | | 2012-2011 | | | 2011-2010 | |
| | | 2012 | | | 2011 | | | 2010 | | | Change % | | | Change % | |
| | | | | | | | | | | | | | | | |
| Total investment income, net of expenses, pretax | | $ | 531 | | | $ | 525 | | | $ | 518 | | | | 1 | | | | 1 | |
| Investment interest credited to contract holders | | | (82 | ) | | | (81 | ) | | | (79 | ) | | | (1 | ) | | | (3 | ) |
| Realized investment gains and losses summary: | | | | | | | | | | | | | | | | | | | | |
| Realized investment gains and losses | | | 74 | | | | 128 | | | | 185 | | | | (42 | ) | | | (31 | ) |
| Change in fair value of securities with embedded derivatives | | | 1 | | | | (1 | ) | | | 10 | | | | nm | | | | nm | |
| Other-than-temporary impairment charges | | | (33 | ) | | | (57 | ) | | | (36 | ) | | | 42 | | | | (58 | ) |
| Total realized investment gains and losses | | | 42 | | | | 70 | | | | 159 | | | | (40 | ) | | | (56 | ) |
| Investment operations profit | | $ | 491 | | | $ | 514 | | | $ | 598 | | | | (4 | ) | | | (14 | ) |
|
| | | | | | | | | | | | | | | | | | |
| (Dollars in millions) | | Years ended December 31, | | 2014-2013 | | 2013-2012 |
| | | 2014 | | 2013 | | 2012 | | Change % | | Change % |
| | | | | | | | | | | |
| Total investment income, net of expenses | | $ | 549 |
| | $ | 529 |
| | $ | 531 |
| | 4 |
| | 0 |
|
| Investment interest credited to contract holders' | | (83 | ) | | (80 | ) | | (82 | ) | | (4 | ) | | 2 |
|
| Realized investment gains, net | | 133 |
| | 83 |
| | 42 |
| | 60 |
| | 98 |
|
| Investments profit, pretax | | $ | 599 |
| | $ | 532 |
| | $ | 491 |
| | 13 |
| | 8 |
|
| | | | | | | | | | | |
The investments segment contributes investment income and realized gains and losses to results of operations. Investments provide our primary source of pretax and after-tax profits.
| · | Investment income – Pretax investment income increased 1 percent in 2012, primarily because of higher dividends that reflected rising dividend rates and a greater asset allocation of available funds into equity securities. Interest income declined slightly due to both a decrease in asset allocation into fixed-maturity securities and the continuing investment yield effects of the low interest rate environment. Average yields in the investment income table below are based on the average invested asset and cash amounts indicated in the table, using fixed-maturity securities valued at amortized cost and all other securities at fair value. |
Pretax investment income increasedrose 4 percent in 2014, primarily due to higher dividend income. Dividend income reflected rising dividend rates and net purchases of equity securities from available funds. Interest income rose modestly, as net purchases of fixed-maturity securities offset the continuing effects on bond yields of the low interest rate environment. Pretax investment income decreased less than 1 percent in 2011, primarily because of a2013, as lower interest income essentially offset higher dividend income. Average yields in the investment income table below are based on the average dividend payment rate for common stocksinvested asset and cash amounts indicated in our equity portfolio.
| · | Realized investment gains and losses – We reported realized investment gains in all three years, largely due to investment sales that were discretionary in timing and amount. Those gains were somewhat offset by OTTI charges. |
the table, using fixed-maturity securities valued at amortized cost and all other securities at fair value.
Realized investment gains and losses – We reported realized investment gains in all three years, largely due to investment sales that were discretionary in timing and amount. Those gains were somewhat offset by OTTI charges.
We believe it is useful to analyze our overall investment performance by using total investment return over several years. Total investment return considers changes in unrealized gains and losses, which are not included in net income, in addition to net investment income and realized investment gains and losses that are included in net income. Changes in unrealized gains and losses shown in the table below include other invested assets. Considering investment gains and losses, both realized and unrealized, over several years helps evaluate performance since gains and losses may experience typical variability during shorter periods of time.
The table below shows total return based on calculation assumptions that simplify cash flow timing that is commonly used in total return measures. This simplified calculation uses data shown in our consolidated financial statements or notes to those statements. Added to invested asset amounts from our consolidated balance sheets are 50 percent of annual amounts pertaining to invested asset categories included in net cash used in investing activities from our consolidated statements of cash flows. The cash flow amounts are reduced by realized gains on investments, with the net result reduced by 50 percent to represent estimated new cash invested during each respective year. All new cash is assumed to be invested at the midpoint of the year.
Total investment return
rosedeclined 0.6 percentage points in
2012,2014, compared with
2011, primarily due to higher amounts of the change in unrealized investment gains and losses.2013. The
return contribution from the combination of
2014 investment income and net investment gains, both realized and the change in unrealized,
rose 0.9 percentage points and offset a 0.1 point decrease inessentially matched 2013. The base component of the
contribution of investment income. As discussed above, investment income yields have been pressured by the low interest rate environment.| (In millions) | | Years ended December 31, | | | 2012-2011 | | | 2011-2010 | |
| | | 2012 | | | 2011 | | | 2010 | | | Change % | | | Change % | |
| Beginning balance prior year: | | | | | | | | | | | | | | | | | | | | |
| Invested assets beginning balance | | | | | | | | | | | | | | | | | | | | |
| Fixed maturities | | $ | 8,779 | | | $ | 8,383 | | | $ | 7,861 | | | | 5 | | | | 7 | |
| Equity securities | | | 2,956 | | | | 3,041 | | | | 2,701 | | | | (3 | ) | | | 13 | |
| Other invested assets | | | 66 | | | | 84 | | | | 81 | | | | (21 | ) | | | 4 | |
| | | | 11,801 | | | | 11,508 | | | | 10,643 | | | | 3 | | | | 8 | |
| Average net acquisitions (dispositions) | | | 187 | | | | 64 | | | | 350 | | | | 194 | | | | (82 | ) |
| Estimated annual average invested assets | | $ | 11,988 | | | $ | 11,572 | | | $ | 10,993 | | | | 4 | | | | 5 | |
| | | | | | | | | | | | | | | | | | | | | |
| Invested assets total return | | | | | | | | | | | | | | | | | | | | |
| Total investment income net of expenses | | $ | 531 | | | $ | 525 | | | $ | 518 | | | | 1 | | | | 1 | |
| Total realized investment gains and losses | | | 42 | | | | 70 | | | | 159 | | | | (40 | ) | | | (56 | ) |
| Total invested assets change in unrealized gains | | | 391 | | | | 240 | | | | 228 | | | | 63 | | | | 5 | |
| Total | | $ | 964 | | | $ | 835 | | | $ | 905 | | | | 15 | | | | (8 | ) |
| | | | | | | | | | | | | | | | | | | | | |
| Total return on invested assets before tax | | | 8.0 | % | | | 7.2 | % | | | 8.2 | % | | | | | | | | |
return calculation, annual average invested assets, was up 8 percent.
Cincinnati Financial Corporation - 2014 10-K - Page 89
|
| | | | | | | | | | | | | | | | | | |
| (Dollars in millions) | | Years ended December 31, | | 2014-2013 | | 2013-2012 |
| | | 2014 | | 2013 | | 2012 | | Change % | | Change % |
| Invested assets beginning balance: | | |
| | |
| | |
| | |
| | |
|
| Fixed maturities | | $ | 9,121 |
| | $ | 9,093 |
| | $ | 8,779 |
| | 0 |
| | 4 |
|
| Equity securities | | 4,375 |
| | 3,373 |
| | 2,956 |
| | 30 |
| | 14 |
|
| Other invested assets | | 68 |
| | 68 |
| | 66 |
| | 0 |
| | 3 |
|
| Invested assets beginning balance | | 13,564 |
| | 12,534 |
| | 11,801 |
| | 8 |
| | 6 |
|
| Average acquisitions (dispositions), net | | 224 |
| | 288 |
| | 187 |
| | (22 | ) | | 54 |
|
| Annual average invested assets | | $ | 13,788 |
| | $ | 12,822 |
| | $ | 11,988 |
| | 8 |
| | 7 |
|
| | | | | | | | | | | |
| Total investment return: | | |
| | |
| | |
| | |
| | |
|
| Total investment income, net of expenses | | $ | 549 |
| | $ | 529 |
| | $ | 531 |
| | 4 |
| | 0 |
|
| Total realized investment gains and losses | | 133 |
| | 83 |
| | 42 |
| | 60 |
| | 98 |
|
| Total invested assets change in unrealized gains | | 391 |
| | 459 |
| | 391 |
| | (15 | ) | | 17 |
|
| Total | | $ | 1,073 |
| | $ | 1,071 |
| | $ | 964 |
| | 0 |
| | 11 |
|
| | | | | | | | | | | |
| Total return on invested assets before tax | | 7.8 | % | | 8.4 | % | | 8.0 | % | | |
| | |
|
| | | | | | | | | | | |
The primary drivers of investment income were:
| · | Interest income declined 1 percent in 2012 as the average fixed-maturity pretax yield declined by approximately 16 basis points, offsetting a larger fixed-maturity portfolio that rose 2 percent on an amortized cost basis. It was essentially flat in 2011 as a larger portfolio offset declining average yield. |
| · | Dividend income rose $11 million or 11 percent in 2012 after rising 5 percent in 2011. Increases in dividend payment rates for many of the holdings in our common stock portfolio during 2012, plus a greater asset allocation of available funds into equity securities droveInterest income rose $4 million or 1 percent in 2014. The average fixed-maturity pretax yield declined by approximately 14 basis points but was offset by a larger fixed-maturity portfolio that rose 3 percent on an amortized cost basis. Interest income declined in 2013 when that yield declined by approximately 25 basis points while the portfolio rose 5 percent on an amortized cost basis. Dividend income rose $16 million or 13 percent in 2014, after rising 6 percent in 2013. Increases in dividend payment rates for most of the holdings in our common stock portfolio during both 2014 and 2013, plus a net increase in funds invested in that portfolio for both years, drove the increases in dividend income. In addition, several of our common stock holdings in total issued an additional $5 million in 2012 dividends not typically paid in the fourth quarter, as a result of anticipated dividend tax rate changes effective for 2013. |
| (In millions) | | Years ended December 31, | | | 2012-2011 | | | 2011-2010 | |
| | | 2012 | | | 2011 | | | 2010 | | | Change % | | | Change % | |
| Investment income: | | | | | | | | | | | | | | | | | | | | |
| Interest | | $ | 420 | | | $ | 424 | | | $ | 423 | | | | (1 | ) | | | 0 | |
| Dividends | | | 115 | | | | 104 | | | | 99 | | | | 11 | | | | 5 | |
| Other | | | 3 | | | | 4 | | | | 4 | | | | (25 | ) | | | 0 | |
| Investment expenses | | | (7 | ) | | | (7 | ) | | | (8 | ) | | | 0 | | | | 13 | |
| Total investment income, net of expenses, pre-tax | | | 531 | | | | 525 | | | | 518 | | | | 1 | | | | 1 | |
| Income taxes | | | (129 | ) | | | (129 | ) | | | (126 | ) | | | 0 | | | | (2 | ) |
| Total investment income, net of expenses, after-tax | | $ | 402 | | | $ | 396 | | | $ | 392 | | | | 2 | | | | 1 | |
| | | | | | | | | | | | | | | | | | | | | |
| Effective tax rate | | | 24.2 | % | | | 24.6 | % | | | 24.4 | % | | | | | | | | |
| | | | | | | | | | | | | | | | | | | | | |
| Average invested assets plus cash and cash equivalents | | $ | 11,847 | | | $ | 11,471 | | | $ | 11,129 | | | | | | | | | |
| | | | | | | | | | | | | | | | | | | | | |
| Average yield pre-tax | | | 4.48 | % | | | 4.58 | % | | | 4.65 | % | | | | | | | | |
| Average yield after-tax | | | 3.39 | % | | | 3.45 | % | | | 3.52 | % | | | | | | | | |
| | | | | | | | | | | | | | | | | | | | | |
| Effective fixed-maturity tax rate | | | 26.9 | % | | | 26.7 | % | | | 26.4 | % | | | | | | | | |
| | | | | | | | | | | | | | | | | | | | | |
| Average fixed-maturity at amortized cost | | $ | 8,153 | | | $ | 7,986 | | | $ | 7,704 | | | | | | | | | |
| | | | | | | | | | | | | | | | | | | | | |
| Average fixed-maturity yield pre-tax | | | 5.15 | % | | | 5.31 | % | | | 5.49 | % | | | | | | | | |
| Average fixed-maturity yield after-tax | | | 3.77 | % | | | 3.89 | % | | | 4.04 | % | | | | | | | | |
In addition, several of our common stock holdings, in total, issued an additional $5 million in 2012 dividends not typically paid in the fourth quarter, as a result of anticipated dividend tax rate changes effective for 2013.
Cincinnati Financial Corporation - 2014 10-K - Page 90
|
| | | | | | | | | | | | | | | | | | |
| (Dollars in millions) | | Years ended December 31, | | 2014-2013 | | 2013-2012 |
| | | 2014 | | 2013 | | 2012 | | Change % | | Change % |
| Investment income: | | |
| | |
| | |
| | |
| | |
|
| Interest | | $ | 417 |
| | $ | 413 |
| | $ | 420 |
| | 1 |
| | (2 | ) |
| Dividends | | 138 |
| | 122 |
| | 115 |
| | 13 |
| | 6 |
|
| Other | | 2 |
| | 3 |
| | 3 |
| | (33 | ) | | 0 |
|
| Less investment expenses | | 8 |
| | 9 |
| | 7 |
| | (11 | ) | | 29 |
|
| Total investment income, net of expenses, pretax | | 549 |
| | 529 |
| | 531 |
| | 4 |
| | 0 |
|
| Less income taxes | | 130 |
| | 128 |
| | 129 |
| | 2 |
| | (1 | ) |
| Total investment income, net of expenses, after-tax | | $ | 419 |
| | $ | 401 |
| | $ | 402 |
| | 4 |
| | 0 |
|
| | | | | | | | | | | |
| Effective tax rate | | 23.7 | % | | 24.1 | % | | 24.2 | % | | |
| | |
|
| | | | | | | | | | | |
| Average invested assets plus cash and cash equivalents | | $ | 13,951 |
| | $ | 12,832 |
| | $ | 11,847 |
| | |
| | |
|
| Average yield pretax | | 3.94 | % | | 4.12 | % | | 4.48 | % | | |
| | |
|
| Average yield after-tax | | 3.00 |
| | 3.13 |
| | 3.39 |
| | |
| | |
|
| | | | | | | | | | | |
| Effective fixed-maturity tax rate | | 27.0 | % | | 27.1 | % | | 26.9 | % | | |
| | |
|
| | | | | | | | | | | |
| Average fixed-maturity at amortized cost | | $ | 8,755 |
| | $ | 8,430 |
| | $ | 8,153 |
| | |
| | |
|
| Average fixed-maturity yield pretax | | 4.76 | % | | 4.90 | % | | 5.15 | % | | |
| | |
|
| Average fixed-maturity yield after-tax | | 3.48 |
| | 3.57 |
| | 3.77 |
| | |
| | |
|
| | | | | | | | | | | |
In 2014, we continued to invest available cash flow in both fixed income and equity securities in a manner that we believe balances current income needs with longer-term invested asset growth goals. While our bond portfolio more than covers our insurance reserve liabilities, we believe our diversified common stock portfolio of mainly blue chip, dividend-paying companies represents one of our best investment opportunities for the long term. We position our portfolio with consideration to both the challenges presented by the current low interest rate environment and the risks presented by potential future inflation. As bonds in our generally laddered portfolio mature or are called over the near term, we will be challenged to replace their current yield. Approximately 23 percent ofThe table below summarizes yield data for bonds in our fixed-maturity investments mature during 2013 through 2015 with anportfolio by various maturity periods.
|
| | | | | |
| At December 31, 2014 | Yield | | % of fixed-maturities |
| Fixed-maturity yield profile: | | | |
| Maturing within one year | 4.37 | % | | 9.2 | % |
| Maturing within one to two years | 4.44 |
| | 7.0 |
|
| Maturing within two to three years | 4.89 |
| | 7.7 |
|
| Three year average and total maturing | 4.57 |
| | 23.9 |
|
| Maturing greater than three years | 4.91 |
| | 76.1 |
|
| Weighted average yield to amortized cost of fixed-maturities | 4.76 |
| | 100.0 | % |
| | | | |
Cincinnati Financial Corporation - 2014 10-K - Page 91
The average pretax
yield-to-amortizedyield of 3.88 percent for fixed-maturity securities acquired during 2014, shown in the table below, was lower than the 4.76 percent average yield to amortized cost of
4.6 percent, including 6.6 percentthe fixed-maturity securities portfolio at the end of
the portfolio maturing during 2013 and yielding 4.5 percent, 7.4 percent of the portfolio maturing during 2014 and yielding 4.9 percent and 8.8 percent of the portfolio maturing during 2015 and yielding 4.5 percent.2014.
|
| | | | | |
| | | | Year ended December 31, |
| | | | 2014 |
| Average pretax book yield on new fixed-maturities: | | | | |
| Acquired taxable fixed-maturities | | | | 4.43 | % |
| Acquired tax-exempt fixed-maturities | | | | 3.21 |
|
| Total fixed-maturities acquired | | | | 3.88 |
|
| | | | |
We discussed our portfolio strategies in Item 1, Investments
Segment, Page 20.Segment. We discuss risks related to our investment income and our fixed-maturity and equity investment portfolios in Item 7a, Quantitative and Qualitative Disclosures About Market
Risk, Page 100.Risk.
Net Realized Investment Gains and Losses
Net realized investment gains and losses are made up of
realized investment gains
andor losses
onfrom the
saledisposal of securities, changes in the valuation of embedded derivatives within certain convertible securities and OTTI
charges. These three areascharges from impaired securities. The factors we consider when evaluating impairments are discussed
below.in Critical Accounting Estimates, Asset Impairment.
Investment gains or losses are recognized upon the sales of investments or as otherwise required under GAAP. The timing of realized gains or losses from sales can have a material effect on results in any given period. However, such gains or losses usually have little, if any, effect on total shareholders’ equity because most equity and fixed-maturity investments are carried at fair value, with the unrealized gain or loss included as a component of other comprehensive income.
Realized Investment Gains and Losses
As appropriate, we buy, hold or sell both fixed-maturity and equity securities on an ongoing basis to help achieve our portfolio objectives.
We generally purchase fixed-maturity securities with the intention to hold until maturity. If they no longer meet our investment criteria, they are divested. Sales of fixed-maturity securities are usually due to a change in credit fundamentals. Pretax realized investment gains in the past three years largely were due to the sale of equity holdings.
Net realized investment gains and losses totaling
$42$133 million for the year ended December 31,
2012,2014, included:
| · | $37 million in net realized gains from equity security sales. |
| · | $35 million in gains from fixed-maturity security sales and calls. |
| · | $3 million in other net realized gains, including changes in the valuation of securities with embedded derivatives described below. |
| · | $33 million in OTTI charges to write down holdings of equity and fixed-maturity securities. |
$136 million in net realized gains from equity security sales.
$18 million in net realized gains from fixed-maturity security sales and calls.
$3 million in other net realized gains.
$24 million in OTTI charges to write down six holdings of equity and fixed-maturity securities.
The
$128$83 million net realized investment gains and losses in
20112013 were
primarilymostly due to
$111$64 million in net realized gains from equity security sales.
In
2010, most of2012, the
$185$42 million net realized investment gains and losses were
primarily due to
a $128 million gain from the sale of Verisk Analytics Inc. (NYSE: VRSK).We generally purchase fixed income securities with the intention to hold until maturity. Securities that no longer meet our investment criteria, usually due to a change in credit fundamentals, are divested.
Changes in the Fair Value of Securities with Embedded Derivatives
We have a small portfolio of convertible preferred stocks and bonds that have an embedded derivative component. In 2012, we recorded $1$37 million in fair value realized losses compared with fair valuenet realized gains of $1from equity security sales and $35 million in 2011gains from fixed-maturity security sales and $10 million in 2010. These changes in fair value were due to the application of ASC 815-15-25, which allows us to account for the entire hybrid financial instrument at fair value, with changes recognized in realized investment gains and losses. The changes in fair values are recognized in net income in the period they occur.
Other-than-temporary Impairment Charges
In 2012, we recordedcalls, partially offset by $33 million in write-downsof OTTI charges for 13 securities that we deemed had experienced an other-than-temporary decline in fair value compared with $57 million for 12 securities in 2011 and $36 million for 15 securities in 2010. The factors we consider when evaluating impairments are discussed in Critical Accounting Estimates, Asset Impairment,securities.
Cincinnati Financial Corporation - 2014 10-K - Page
47. The OTTI charges in 2012, 2011 and 2010 were each 1 percent or less of our investment portfolio at year-end. OTTI charges also include unrealized losses of holdings that we intend to sell but have not yet completed a transaction.92
OTTI charges from the investment portfolio by the asset classes we described in Item 1,
Our Segments, Investments Segment,
Page 20, are summarized below:
| (Dollars in millions) | | Years ended December 31, | |
| | | 2012 | | | 2011 | | | 2010 | |
| Taxable fixed maturities: | | | | | | | | | | | | |
| Impairment amount | | $ | (1 | ) | | $ | (4 | ) | | $ | (1 | ) |
| New amortized cost | | $ | 0 | | | $ | 6 | | | $ | 9 | |
| Percent to total amortized cost owned | | | 0 | % | | | 0 | % | | | 0 | % |
| Number of securities other-than-temporarily impaired | | | 1 | | | | 6 | | | | 5 | |
| Percent to number of securities owned | | | 0 | % | | | 0 | % | | | 0 | % |
| | | | | | | | | | | | | |
| Tax-exempt fixed maturities: | | | | | | | | | | | | |
| Impairment amount | | $ | 0 | | | $ | (1 | ) | | $ | (2 | ) |
| New amortized cost | | $ | 0 | | | $ | 9 | | | $ | 5 | |
| Percent to total amortized cost owned | | | 0 | % | | | 0 | % | | | 0 | % |
| Number of securities other-than-temporarily impaired | | | 1 | | | | 3 | | | | 4 | |
| Percent to number of securities owned | | | 0 | % | | | 0 | % | | | 0 | % |
| | | | | | | | | | | | | |
| Common equities: | | | | | | | | | | | | |
| Impairment amount | | $ | (32 | ) | | $ | (52 | ) | | $ | (33 | ) |
| New cost | | $ | 153 | | | $ | 56 | | | $ | 120 | |
| Percent to total cost owned | | | 7 | % | | | 3 | % | | | 5 | % |
| Number of securities other-than-temporarily impaired | | | 11 | | | | 3 | | | | 4 | |
| Percent to number of securities owned | | | 15 | % | | | 4 | % | | | 6 | % |
| | | | | | | | | | | | | |
| Preferred equities: | | | | | | | | | | | | |
| Impairment amount | | $ | 0 | | | $ | 0 | | | $ | 0 | |
| New cost | | $ | 0 | | | $ | 0 | | | $ | 0 | |
| Percent to total cost owned | | | 0 | % | | | 0 | % | | | 0 | % |
| Number of securities other-than-temporarily impaired | | | 0 | | | | 0 | | | | 2 | |
| Percent to number of securities owned | | | 0 | % | | | 0 | % | | | 8 | % |
| | | | | | | | | | | | | |
| Total: | | | | | | | | | | | | |
| Impairment amount | | $ | (33 | ) | | $ | (57 | ) | | $ | (36 | ) |
| New cost or amortized cost | | $ | 153 | | | $ | 71 | | | $ | 134 | |
| Percent to total cost or amortized cost owned | | | 1 | % | | | 1 | % | | | 1 | % |
| Number of securities other-than-temporarily impaired | | | 13 | | | | 12 | | | | 15 | |
| Percent to number of securities owned | | | 0 | % | | | 1 | % | | | 1 | % |
|
| | | | | | | | | | | | |
| (Dollars in millions) | | Years ended December 31, |
| | | 2014 | | 2013 | | 2012 |
| Taxable fixed maturities: | | |
| | |
| | |
|
| Impairment amount | | $ | 15 |
| | $ | 1 |
| | $ | 1 |
|
| New amortized cost | | $ | 22 |
| | $ | 4 |
| | $ | — |
|
| Percent to total amortized cost owned | | — | % | | — | % | | — | % |
| Number of securities other-than-temporarily impaired | | 1 |
| | 3 |
| | 1 |
|
| Percent to number of securities owned | | — | % | | — | % | | — | % |
| | | | | | | |
| Tax-exempt fixed maturities: | | |
| | |
| | |
|
| Impairment amount | | $ | — |
| | $ | 1 |
| | $ | — |
|
| New amortized cost | | $ | — |
| | $ | 5 |
| | $ | — |
|
| Percent to total amortized cost owned | | — | % | | — | % | | — | % |
| Number of securities other-than-temporarily impaired | | 1 |
| | 4 |
| | 1 |
|
| Percent to number of securities owned | | — | % | | — | % | | — | % |
| | | | | | | |
| Common equities: | | |
| | |
| | |
|
| Impairment amount | | $ | 9 |
| | $ | — |
| | $ | 32 |
|
| New cost | | $ | 79 |
| | $ | — |
| | $ | 153 |
|
| Percent to total cost owned | | 3 | % | | — | % | | 7 | % |
| Number of securities other-than-temporarily impaired | | 4 |
| | — |
| | 11 |
|
| Percent to number of securities owned | | 6 | % | | — | % | | 15 | % |
| | | | | | | |
| Totals: | | |
| | |
| | |
|
| Impairment amount | | $ | 24 |
| | $ | 2 |
| | $ | 33 |
|
| New cost or amortized cost | | $ | 101 |
| | $ | 9 |
| | $ | 153 |
|
| Percent to total cost or amortized cost owned | | 1 | % | | — | % | | 1 | % |
| Number of securities other-than-temporarily impaired | | 6 |
| | 7 |
| | 13 |
|
| Percent to number of securities owned | | — | % | | — | % | | — | % |
| | | | | | | |
OTTI charges from the investment portfolio by industry are summarized as follows:
| (In millions) | | Years ended December 31, | |
| | | 2012 | | | 2011 | | | 2010 | |
| Fixed maturities: | | | | | | | | | | | | |
| Financial | | $ | 0 | | | $ | (1 | ) | | $ | 0 | |
| Services cyclical | | | (1 | ) | | | (1 | ) | | | 0 | |
| Real estate | | | 0 | | | | 0 | | | | (1 | ) |
| Consumer cyclical | | | 0 | | | | (1 | ) | | | 0 | |
| Other | | | 0 | | | | (2 | ) | | | (2 | ) |
| Total fixed maturities | | | (1 | ) | | | (5 | ) | | | (3 | ) |
| | | | | | | | | | | | | |
| Common equities: | | | | | | | | | | | | |
| Consumer discretionary | | | (14 | ) | | | 0 | | | | 0 | |
| Industrials | | | (8 | ) | | | 0 | | | | 0 | |
| Material | | | (7 | ) | | | 0 | | | | 0 | |
| Energy | | | (2 | ) | | | 0 | | | | 0 | |
| Health | | | (1 | ) | | | (2 | ) | | | (21 | ) |
| Financial | | | 0 | | | | (50 | ) | | | 0 | |
| Information technology | | | 0 | | | | 0 | | | | (12 | ) |
| Total common equities | | | (32 | ) | | | (52 | ) | | | (33 | ) |
| Total | | $ | (33 | ) | | $ | (57 | ) | | $ | (36 | ) |
|
| | | | | | | | | | | | |
| (Dollars in millions) | | Years ended December 31, |
| | | 2014 | | 2013 | | 2012 |
| Fixed maturities: | | |
| | |
| | |
|
| Basic industry | | $ | 15 |
| | $ | — |
| | $ | — |
|
| Municipal | | — |
| | 1 |
| | — |
|
| Utilities | | — |
| | 1 |
| | — |
|
| Services cyclical | | — |
| | — |
| | 1 |
|
| Total fixed maturities | | 15 |
| | 2 |
| | 1 |
|
| | | | | | | |
| Common equities: | | |
| | |
| | |
|
| Consumer Staples | | 6 |
| | — |
| | — |
|
| Consumer discretionary | | — |
| | — |
| | 14 |
|
| Industrials | | — |
| | — |
| | 8 |
|
| Material | | — |
| | — |
| | 7 |
|
| Energy | | 3 |
| | — |
| | 2 |
|
| Health | | — |
| | — |
| | 1 |
|
| Total common equities | | 9 |
| | — |
| | 32 |
|
| Total | | $ | 24 |
| | $ | 2 |
| | $ | 33 |
|
| | | | | | | |
Cincinnati Financial Corporation - 2014 10-K - Page 93
The general market view is that, in light of Federal Reserve commentary, interest rates are likely to remain
well below historic averages for at least the next two years. This will continue to apply pressure on investment income.
We continue to focus on portfolio strategies to balance near-term income generation and long-term book value growth. In
2013,2015, we expect to continue to allocate a portion of cash available for investment to equity securities, taking into consideration corporate liquidity and income requirements, as well as insurance department regulations and rating agency comments. We discuss our portfolio strategies in Item 1,
Our Segments, Investments
Segment, Page 20.Segment.
We believe that a weak or prolonged recovery from current economic conditions could heighten the risk of renewed pressure on securities markets, which could lead to additional OTTI charges. Our asset impairment committee continues to monitor the investment portfolio. The current asset impairment policy is described in Critical Accounting Estimates, Asset
Impairment, Page 47.Impairment.
Revenues
and expenses in
20122014 for our Other operations
increased $1 million,each decreased slightly, compared with
2011, while expenses remained at the same level.2013. Other includes noninvestment operations of the parent company and its
commercial leasing and financial services subsidiary, CFC Investment Company. Losses before income taxes for Other were largely driven by interest expense from debt of the parent company.
| (In millions) | | Years ended December 31, | | | 2012-2011 | | | 2011-2010 | |
| | | 2012 | | | 2011 | | | 2010 | | | Change % | | | Change % | |
| Interest and fees on loans and leases | | $ | 7 | | | $ | 7 | | | $ | 7 | | | | 0 | | | | 0 | |
| Other revenues | | | 2 | | | | 1 | | | | 1 | | | | 100 | | | | 0 | |
| Total revenues | | | 9 | | | | 8 | | | | 8 | | | | 13 | | | | 0 | |
| Interest expense | | | 54 | | | | 54 | | | | 54 | | | | 0 | | | | 0 | |
| Operating expenses | | | 14 | | | | 14 | | | | 11 | | | | 0 | | | | 27 | |
| Total expenses | | | 68 | | | | 68 | | | | 65 | | | | 0 | | | | 5 | |
| Other loss | | $ | (59 | ) | | $ | (60 | ) | | $ | (57 | ) | | | 2 | | | | (5 | ) |
|
| | | | | | | | | | | | | | | | | | |
| (Dollars in millions) | | Years ended December 31, | | 2014-2013 | | 2013-2012 |
| | | 2014 | | 2013 | | 2012 | | Change % | | Change % |
| Interest and fees on loans and leases | | $ | 6 |
| | $ | 7 |
| | $ | 7 |
| | (14 | ) | | 0 |
|
| Other revenues | | 2 |
| | 2 |
| | 2 |
| | 0 |
| | 0 |
|
| Total revenues | | 8 |
| | 9 |
| | 9 |
| | (11 | ) | | 0 |
|
| Interest expense | | 53 |
| | 54 |
| | 54 |
| | (2 | ) | | 0 |
|
| Operating expenses | | 14 |
| | 15 |
| | 14 |
| | (7 | ) | | 7 |
|
| Total expenses | | 67 |
| | 69 |
| | 68 |
| | (3 | ) | | 1 |
|
| Other loss | | $ | (59 | ) | | $ | (60 | ) | | $ | (59 | ) | | 2 |
| | (2 | ) |
| | | | | | | | | | | |
We had
$145$196 million of
federal income tax expense in
20122014 compared with
$9$197 million in
20112013 and
$123$145 million in
2010.2012. Our corporate effective tax rate for
20122014 was
25.627.2 percent compared with
5.227.6 percent in
20112013 and
24.725.6 percent in
2010.2012.
The change in our effective tax rate was primarily due to changes in pretax income from underwriting results
changes in investment income and
the amount of realized investment gains and
losses. Changes to tax-exempt interest and the dividend received deductionlosses, with small changes in the
current year compared with prior years also contributed to the change.amount of permanent book-tax differences.
Historically, we have pursued a strategy of investing some portion of cash flow in tax-advantaged fixed-maturity and equity securities to minimize our overall tax liability and maximize after-tax earnings. See Item 1, Our Segments,Tax-Exempt Fixed Maturities, Page 22, for further discussion on municipal bond purchases in our fixed-maturity investment portfolio. For our property casualty insurance subsidiaries, approximately 85 percent of incomeinterest from tax-advantaged fixed-maturity investments isand approximately 60 percent of dividends from qualified equities are exempt from federal tax.tax after applying proration from the 1986 Tax Reform Act. Our noninsurance companies own an immaterial amount of tax-advantaged fixed-maturity investments. For our insurance subsidiaries, the dividend received deduction, after the dividend proration of the 1986 Tax Reform Act, exempts approximately 60 percent of dividends from qualified equities from federal tax. For our noninsurance subsidiaries,companies, the dividend received deduction exempts 70 percent of dividends from qualified equities. Details about ourOur life insurance company does not own tax-advantaged, fixed maturity investments or equities subject to the dividend received deduction. Our effective tax rate arereconciliation is found onin Item 8, Note 11 of the Consolidated Financial Statements.
Cincinnati Financial Corporation - 2014 10-K - Page
129.94
Liquidity and Capital Resources
We seek to maintain prudent levels of liquidity and financial strength for the protection of our policyholders, creditors and shareholders. We manage liquidity at two levels to meet the short- and long-term cash requirements of business obligations and growth needs. The first is the liquidity of the parent company. The second is the liquidity of our insurance subsidiary. The management of liquidity at both levels is essential because each has different funding needs and sources, and each is subject to certain regulatory guidelines and requirements.
At December 31, 2014, the parent company had $1.784 billion in cash and marketable securities, providing strong liquidity to fund cash outflows, as needed. The payment of dividends to shareholders is largely based upon receiving subsidiary dividends. Alternatively, we could sell investments or use our line of credit to support the dividend payment.
The parent company’s primary sources of cash inflows are dividends from our insurance subsidiary, investment income
maturity of fixed income securities and sale proceeds from investments. The parent company’s cash outflows are primarily interest and principal payments on long- and short-term debt, dividends to shareholders, common stock repurchases
pension contributions, investment purchases and general operating expenses.
As of December 31, 2012, the parent company had $1.151 billion in cash and marketable securities, providing strong liquidity to fund cash outflows, as needed.The payment of dividends to shareholders is largely based upon receiving subsidiary dividends. Otherwise, we could sell investments or use our line of credit to support the payment.
The table below shows a summary, by the direct cash flow method, of the major sources and uses of cash flow byof the parent company.
|
| | | | | | | | | | | | |
| (Dollars in millions) | | Years ended December 31, |
| | | 2014 | | 2013 | | 2012 |
| Sources of liquidity: | | | | | | |
| Insurance subsidiary dividends received | | $ | 400 |
| | $ | 350 |
| | $ | 285 |
|
| Proceeds from stock options exercised | | 22 |
| | 25 |
| | 9 |
|
| Investment income received | | 46 |
| | 41 |
| | 42 |
|
| Uses of liquidity: | | |
| | |
| | |
|
| Debt interest payments | | $ | 52 |
| | $ | 53 |
| | $ | 53 |
|
| Short-term debt repayment | | 55 |
| | — |
| | — |
|
| Pension contribution | | 5 |
| | 15 |
| | 14 |
|
| Shareholders' dividend payments | | 278 |
| | 263 |
| | 256 |
|
| Purchase of treasury shares | | 21 |
| | 52 |
| | — |
|
| | | | | | | |
Dividends received from
subsidiariesthe subsidiary in
20122014 were
$115$50 million more than
2011 due to lower catastrophe losses that increased2013, supported by strong property casualty insurance subsidiary net cash
provided byflow from operating activities. We expect
20132015 parent company sources of cash flows to be similar to
2012, assuming similar catastrophe losses.2014. The majority of expenditures for the parent company have been consistent during the last three years, and we expect future expenditures to remain fairly stable. Share repurchases are discretionary, depending on cash availability and capital management decisions.
| (In millions) | | Years ended December 31, | |
| | | 2012 | | | 2011 | | | 2010 | |
| Sources of liquidity: | | | | | | | | | |
| Insurance subsidiary dividends received | | $ | 285 | | | $ | 170 | | | $ | 270 | |
| Short-term debt | | | - | | | | 55 | | | | - | |
| Investment income received | | | 42 | | | | 41 | | | | 41 | |
| Uses of liquidity: | | | | | | | | | | | | |
| Debt interest payments | | $ | 53 | | | $ | 53 | | | $ | 52 | |
| Pension payments | | | 14 | | | | 35 | | | | 25 | |
| Shareholders' dividend payments | | | 256 | | | | 255 | | | | 252 | |
| Purchase of treasury shares | | | - | | | | 32 | | | | 10 | |
Insurance Subsidiary Liquidity
Our
The parent company’s insurance
subsidiary’ssubsidiary is largely the operations of the property casualty segments. The primary sources of cash inflows are collection of premiums, investment income, maturity of
fixed incomefixed-income securities and sale proceeds from investments. Property casualty insurance premiums generally are received before losses are paid under the policies purchased with those premiums.
Our insurance subsidiary’s cashCash outflows are primarily
property casualty loss and loss expenses, commissions, salaries, taxes, operating expenses and investment purchases. Over the
past three years,three-year period ended December 31, 2014, premium receipts and investment income have been more than sufficient to pay claims and operating expenses. Excess cash flows were partially used to pay dividends to the parent company. We are not aware of any known trends that would materially change historical cash flow results
over the next 12 months, other than fluctuations in catastrophe claims and other large losses either individually or in aggregate.
The table below shows a summary of operating cash flow for property casualty insurance (direct method).
LowerHistorically, annual variation in operating cash flow
for 2011 reflected the unusually high levelhas been largely related to changes in amounts of catastrophe losses.
| (In millions) | | Years ended December 31, | |
| | | 2012 | | | 2011 | | | 2010 | |
| Premiums collected | | $ | 3,451 | | | $ | 3,080 | | | $ | 2,978 | |
| Loss and loss expenses paid | | | (2,229 | ) | | | (2,241 | ) | | | (1,865 | ) |
| Commissions and other underwriting expenses paid | | | (1,035 | ) | | | (1,005 | ) | | | (954 | ) |
| Cash flow from underwriting activities | | | 187 | | | | (166 | ) | | | 159 | |
| Investment income received | | | 360 | | | | 357 | | | | 350 | |
| Cash flow from operating activities | | $ | 547 | | | $ | 191 | | | $ | 509 | |
Additional
Cincinnati Financial Corporation - 2014 10-K - Page 95
|
| | | | | | | | | | | | |
| (Dollars in millions) | | Years ended December 31, |
| | | 2014 | | 2013 | | 2012 |
| Premiums collected | | $ | 4,147 |
| | $ | 3,866 |
| | $ | 3,451 |
|
| Loss and loss expenses paid | | (2,413 | ) | | (2,172 | ) | | (2,229 | ) |
| Commissions and other underwriting expenses paid | | (1,239 | ) | | (1,164 | ) | | (1,035 | ) |
| Cash flow from underwriting | | 495 |
| | 530 |
| | 187 |
|
| Investment income received | | 371 |
| | 355 |
| | 360 |
|
| Cash flow from operations | | $ | 866 |
| | $ | 885 |
| | $ | 547 |
|
| | | | | | | |
Other Sources of Liquidity
Investment income is a primary source of liquidity for both the parent company and our insurance subsidiary operations. For both, cash
Cash in excess of operating requirements and shareholder dividends is invested in fixed-maturity and equity securities.
Equity securities provide the potential for future increases in dividend income and for capital appreciation.Cash generated from investment income is the mostprovides an important investment contribution to cash flow. While we have never sold investments to make claim payments, theflow and liquidity. The sale of investments could provide an additional source of liquidity at either the parent company or insurance subsidiary level, if required. However, we follow a buy-and-hold investment philosophy, seeking to compound cash flows over the long-term. In addition to possible sales of investments, proceeds of call or maturities of fixed-maturity securities also can provide liquidity. During the next five years, $3.747five-year period beginning in 2015, $4.138 billion, or 41.243.7 percent, of our fixed-maturity portfolio willis scheduled to mature. At year-end 2012,2014, total unrealized gains in the investment portfolio, before deferred income taxes, were $1.875$2.719 billion. Liquidity sourced from our investment portfolio is not materially at risk from European-based securities, as our total exposure to such securities at the end of 20122014 was $504$417 million on a fair value basis, or 4.02.9 percent of our total invested assets. We own no European sovereign debt. Our European-based securities are summarized by country in Item 7A, Qualitative and Quantitative Disclosures About Market Risk, Page 100.
Further, financialRisk.
Financial resources of the parent company also could be made available to our insurance subsidiaries, if circumstances required. This flexibility would include our ability to access the capital markets and short-term bank borrowings.
Our debt totaled $894 million at year-end 2012, consisting of $790 million of noncallable long-term debt and $104 million in borrowings on our short-term line of credit. We generally have minimized our reliance on debt financing although we may use the line to fund short-term cash needs.
We provide details of our three long-term notes in Item 8, Note 8 of the Consolidated Financial
Statements, Page 127.Statements. None of the notes are encumbered by rating triggers. The total principal amount of our long-term debt at December 31,
2012,2014, was $793 million and included:
| · | $391 million aggregate principal amount of 6.92% senior debentures due 2028. |
| · | $28 million aggregate principal amount of 6.9% senior debentures due 2028. |
| · | $374 million aggregate principal amount of 6.125% senior debentures due 2034. |
$391 million aggregate principal amount of 6.92% senior debentures due 2028.
$28 million aggregate principal amount of 6.9% senior debentures due 2028.
$374 million aggregate principal amount of 6.125% senior debentures due 2034.
The company’s senior debt is rated investment grade by independent rating firms. None of the four rating agencies made changes to our debt ratings in
2012.2014. Our debt ratings at February 25,
2013,2015, were: a- from A.M. Best, BBB+ from Fitch Ratings, A3 from Moody’s Investors Service and BBB from Standard & Poor’s Ratings Services.
At December 31,
2012,2014, we had a $225 million line of credit with commercial banks, with
$49 million borrowed. That line of credit had a $104 million
borrowed. There was no change in the amount of the $104 million short-term debt during 2012.balance at December 31, 2013. During
2011, there was a2014, we repaid $55 million
increase to the previous balanceas part of
$49 million in short-term debt by the parent company, primarily to fund share repurchases.routine cash management. Access to this line of credit requires compliance with various covenants, including maintaining a minimum consolidated net worth and not exceeding
a 30 percent
debt todebt-to-total capital
ratio, as defined by the agreement.
The minimum consolidated net worth requirement is $3 billion plus 50 percent of consolidated net income and net cash proceeds from issuance of equity securities after March 31, 2012. At December 31,
2012,2014, we
were wellhad in excess of $1.1 billion in net worth compared with our covenant net worth requirement. We are considerably within compliance with all covenants under the credit
agreementsagreement, and believe we will remain in compliance.
Our The credit agreement provides alternative interest charges based on the type of borrowing and our debt rating. The interest rate charged is adjusted LIBOR plus an applicable margin.
The $225 million unsecured revolving line of credit is administered by PNC Bank, N.A., a subsidiary of The PNC Financial Services Group Inc. (NYSE:PNC). ItThe agreement was established in 2012, extended for two years in 2014, and will expire in May 2017.2019. Our subsidiary CFC Investment Company also is a borrower under this line of credit. PNC Bank is the lead participant bookrunner with a $65 million share. Fifth Third Bancorp (Nasdaq:FITB) is
Cincinnati Financial Corporation - 2014 10-K - Page 96
the syndication agent with a $65 million share. U.S. Bancorp (NYSE:USB), BB&T Corp (NYSE:BBT) and Huntington Bancshares, Inc. (Nasdaq:HBAN) each provide $25 million of capacity, and Northern Trust Corporation (Nasdaq:NTRS), provides $20 million of capacity.
The credit agreement provides alternative interest charges based on the type of borrowing and our debt rating. The interest rate charged is adjusted LIBOR plus an applicable margin.
Capital resources consisting of shareholders’ equity and total debt represent our overall financial strength to support
writingcurrent obligations and
growinggrowth in our insurance businesses. At December 31,
2012,2014, we had total capital of
$6.347$7.413 billion. Shareholders’ equity was
$5.453$6.573 billion, an increase of
$420$503 million, or 8 percent, from the prior year. Our total debt was
$894$840 million,
unchangeddown $54 million from a year ago. We seek to maintain a solid financial position and provide capital flexibility by keeping our ratio of debt to total capital moderate. We target a ratio below 20 percent. At year-end
2012,2014, the ratio was
14.111.3 percent compared with
15.112.8 percent at year-end
2011.2013.
At the discretion of the board of directors, the company can return
cashcapital directly to
shareholders: | · | Dividends to shareholders –The ability of the company to continue paying cash dividends is subject to factors the board of directors deem relevant. While the board and management believe there is merit to sustaining the company’s long record of dividend increases, our first priority is the company’s financial strength. Over the past 10 years, the company has paid an average of 57 percent of net income as dividends. Through 2012, the board had increased our cash dividend for 52 consecutive years. The board decision in August 2012 to increase the dividend demonstrated confidence in the company’s strong capital, liquidity, financial flexibility and initiatives to improve earnings performance. |
| · | Common stock repurchase – Generally, our board believes that share repurchases can help fulfill our commitment to enhancing shareholder value. Consequently, the board has authorized the repurchase of outstanding shares, giving management discretion to purchase shares at reasonable prices in light of circumstances at the time of purchase. |
shareholders as discussed below.
Dividends to shareholders –The ability of our company to continue paying cash dividends is subject to factors the board of directors deem relevant. While the board and management believe there is merit to sustaining the company’s long record of dividend increases, our first priority is the company’s financial strength. Over the past 10 years, the company has paid an average of 60 percent of net income as dividends. Through 2014, the board had increased our cash dividend for 54 consecutive years. The board decision in January 2015 to increase the dividend demonstrated confidence in the company’s strong capital, liquidity, financial flexibility and initiatives to grow earnings.
Common stock repurchase – Generally, our board believes that share repurchases can help fulfill our commitment to enhancing shareholder value. Consequently, the board has authorized the repurchase of outstanding shares, giving management discretion to purchase shares at reasonable prices in light of circumstances at the time of purchase. Our approach since mid-2008 has been to
preservehold capital
adequate to support future growth of our insurance operations and repurchase a minimal amount of shares. Those repurchases were intended to partially offset the issuance of shares through equity compensation plans, primarily due to vesting of service-based restricted stock units of equity awards granted in the past. Our corporate Code of Conduct restricts repurchases during certain time periods. The details of the repurchase authorizations and activity are described in Item 5, Market for the Registrant’s Common Equity, Related Stockholder Matters and Issuer Purchases of Equity
Securities, Page 34.Securities.
We pay obligations to customers, suppliers and associates in the normal course of our business operations. Some are contractual obligations that define the amount, circumstances and/or timing of payments. We have other commitments for business expenditures; however, the amount, circumstances and/or timing of our other commitments are not dictated by contractual arrangements.
Cincinnati Financial Corporation - 2014 10-K - Page 97
As of December 31,
2012,2014, we estimate our future contractual obligations as follows:
| (In millions) | | Year | | | Years | | | Years | | | There- | | | | |
| Payment due by period | | 2013 | | | 2014-2015 | | | 2016-2017 | | | after | | | Total | |
| Gross property casualty loss and loss expense payments | | $ | 1,375 | | | $ | 1,326 | | | $ | 574 | | | $ | 894 | | | $ | 4,169 | |
| Gross life policyholder obligations | | | 77 | | | | 130 | | | | 171 | | | | 3,857 | | | | 4,235 | |
| Interest on long-term debt | | | 52 | | | | 104 | | | | 104 | | | | 682 | | | | 942 | |
| Long-term debt | | | - | | | | - | | | | - | | | | 793 | | | | 793 | |
| Short-term debt | | | 104 | | | | - | | | | - | | | | - | | | | 104 | |
| Profit-sharing commissions | | | 102 | | | | - | | | | - | | | | - | | | | 102 | |
| Operating property | | | 3 | | | | 1 | | | | - | | | | - | | | | 4 | |
| Capital lease obligations | | | 17 | | | | 17 | | | | 3 | | | | - | | | | 37 | |
| Computer hardware and software | | | 15 | | | | 26 | | | | - | | | | - | | | | 41 | |
| Qualified pension plan contribution | | | 15 | | | | - | | | | - | | | | - | | | | 15 | |
| Other invested assets | | | 5 | | | | 7 | | | | 5 | | | | - | | | | 17 | |
| Total | | $ | 1,765 | | | $ | 1,611 | | | $ | 857 | | | $ | 6,226 | | | $ | 10,459 | |
|
| | | | | | | | | | | | | | | | | | | | |
| (Dollars in millions) | | Year | | Years | | Years | | There- | | |
| Payment due by period | | 2015 | | 2016-2017 | | 2018-2019 | | after | | Total |
| Gross property casualty loss and loss expense payments | | $ | 1,439 |
| | $ | 1,438 |
| | $ | 620 |
| | $ | 941 |
| | $ | 4,438 |
|
| Gross life policyholder obligations | | 101 |
| | 136 |
| | 166 |
| | 4,373 |
| | 4,776 |
|
| Interest on long-term debt | | 52 |
| | 104 |
| | 104 |
| | 578 |
| | 838 |
|
| Long-term debt | | — |
| | — |
| | — |
| | 793 |
| | 793 |
|
| Short-term debt | | 49 |
| | — |
| | — |
| | — |
| | 49 |
|
| Profit-sharing commissions | | 121 |
| | — |
| | — |
| | — |
| | 121 |
|
| Operating property | | 1 |
| | 1 |
| | — |
| | — |
| | 2 |
|
| Capital lease obligations | | 18 |
| | 12 |
| | 5 |
| | 1 |
| | 36 |
|
| Computer software | | 13 |
| | 3 |
| | 1 |
| | — |
| | 17 |
|
| Qualified pension plan contribution | | 5 |
| | — |
| | — |
| | — |
| | 5 |
|
| Other invested assets | | 5 |
| | 9 |
| | 6 |
| | — |
| | 20 |
|
| Total | | $ | 1,804 |
| | $ | 1,703 |
| | $ | 902 |
| | $ | 6,686 |
| | $ | 11,095 |
|
| | | | | | | | | | | |
Our two most significant contractual obligations are discussed in conjunction with related insurance reserves in Property Casualty Loss and Loss Expense Obligations and Reserves and Life Insurance Policyholder Obligations and Reserves
beginning on Pages 88 and 94, respectively.in this report. Other future contractual obligations include:
| · | Interest on long-term debt – We expect total interest expense to be $52 million in 2013. We discuss outstanding debt in Additional Sources of Liquidity, Page 84. |
| · | Property casualty profit-sharing commissions – Profit-sharing commissions are paid to agencies using a formula that takes into account agency profitability and premium volume. We estimate 2013 profit-sharing commission payments of approximately $102 million. |
| · | Computer hardware and software – We expect to spend $41 million over the next three years for current material commitments for computer hardware and software, including maintenance contracts on hardware and other known obligations. We discuss below the noncontractual expenses we anticipate for computer hardware and software in 2013. |
Interest on long-term debt – We expect total interest expense to be $52 million in 2015. We discuss outstanding debt in Additional Sources of Liquidity.
Computer software – We expect to spend approximately $16 million over the next three years for current material commitments for computer software, including maintenance contracts on hardware and other known obligations.
At December 31,
2012,2014, we believe our most significant other commitments are:
| · | Commissions – We expect commission payments to generally track with written premiums. |
| · | Other operating expenses – Many of our operating expenses are not contractual obligations but reflect the ongoing expenses of our business. In addition to contractual obligations for hardware and software discussed above, we anticipate capitalizing approximately $5 million in spending for key technology initiatives in 2013. Capitalized development costs related to key technology initiatives totaled $4 million in 2012 and $5 million in 2011. These activities are conducted at our discretion, and we have no material contractual obligations for activities planned as part of these projects. |
Commissions – We expect commission payments to generally track with written premiums.
Other operating expenses – Many of our operating expenses are not contractual obligations but reflect the ongoing expenses of our business. In addition to contractual obligations for software disclosed above, we anticipate capitalizing approximately $5 million in spending for key technology initiatives in 2015. Capitalized development costs related to key technology initiatives totaled $5 million in 2014 and $4 million in 2013. These activities are conducted at our discretion, and we have no material contractual obligations for activities planned as part of these projects.
Liquidity and Capital Resources Outlook
A long-term perspective governs our liquidity and capital resources decisions, with the goal of benefitting our policyholders, agents, shareholders and associates over time. Our
20122014 insurance results
metwere within our
longer-term combined ratio objective of
being consistentlyaveraging within the range of 95 percent to 100 percent
although it was not metover five-year periods, resulting in
2011. Our capital position has improved significantly since year-end 2009, providing adequate financial cushion when short-term operating results do not meet our objectives.strong underwriting profits.
At December 31,
2012,2014, we had
$487$591 million in cash and cash equivalents. That strong liquidity and our consistent cash flows give us the flexibility to meet current obligations and commitments while building value by prudently investing where we see potential for both current income and long-term return.
They also provide adequate financial cushion when short-term operating results do not meet our objectives.
In any year, we consider the most likely source of pressure on liquidity would be an unusually high level of catastrophe loss payments within a short period of time, such as what occurred in the second quarter of 2011. We responded with a reduced insurance subsidiary dividend to our parent company in 2011. There could also be additional obligations for our insurance operations due to increasing severity or frequency of noncatastrophe claims. To address the risk of unusually large insurance loss obligations including catastrophe events, we maintain property
Cincinnati Financial Corporation - 2014 10-K - Page 98
casualty reinsurance contracts with highly rated reinsurers, as discussed under
20132015 Reinsurance
Programs, Page 95.Programs. We also monitor the financial condition of our
reinsurers because their insolvency could place in jeopardyjeopardize a portion of our $615$545 million in outstanding reinsurance recoverable asset at December 31, 2012.
2014.
Parent-company liquidity could be constrained by Ohio regulatory requirements that restrict the dividends insurance subsidiaries can pay. During 2015, our insurance subsidiary can declare $447 million in dividends to our parent company without regulatory approval. We do not expect future pension contributions to constrain our liquidity. The fair value of plan assets is
84101 percent of the accumulated benefit obligation at December 31,
2012.2014. Continued economic weakness also has the potential to affect our liquidity and capital resources in a number of different ways, potentially including:including delinquent payments from agencies, defaults on interest payments by fixed-maturity holdings in our portfolio, dividend reductions by holdings in our equity portfolio or declines in the market value of holdings in our portfolio.
Further, parent company liquidity could be constrained by Ohio regulatory requirements that restrict the dividends insurance subsidiaries can pay. During 2013, our insurance subsidiary can pay $391 million in dividends to our parent company without regulatory approval.
Off-Balance-Sheet Arrangements
We do not use any special-purpose financing vehicles or have any undisclosed off-balance-sheet arrangements (as that term is defined in applicable SEC rules) that are reasonably likely to have a current or future material effect on the company’s financial condition, results of operation, liquidity, capital expenditures or capital resources.
Property Casualty Loss and Loss Expense Obligations and Reserves
Our estimate of future gross property casualty loss and loss expense payments of $4.438 billion is lower than loss and loss expense reserves of $4.485 billion reported on our balance sheet at December 31, 2014. The $47 million difference is due to certain life and health loss reserves. Reserving practices are discussed in Critical Accounting Estimates, Property Casualty Insurance Loss and Loss Expense Reserves.
For the business lines in the commercial and personal lines insurance segments, and in total for the excess and surplus lines
insurance segment, the following table details gross reserves among case, IBNR and loss expense reserves, net of salvage and subrogation.
Reserving practices are discussed in Critical Accounting Estimates, Property Casualty Insurance Loss and Loss Expense Reserves, Page 43.Our estimate of future gross property casualty loss and loss expense payments of $4.169 billion is lower than loss and loss expense reserves of $4.230 billion reported on our balance sheet at December 31, 2012. The $61 million difference is due to certain life and health loss reserves.
The decreaseincrease in total gross reserves was largelyprimarily due to a $93$120 million reductionincrease in caseIBNR reserves, including $77 million for our commercial casualty and workers’ compensation linesline of business in total. The majority of the $40and $28 million decrease in IBNR reserves was from a $31 million reduction in for our commercial property and homeowner linesworkers' compensation line of business in total, in part due to lower catastrophe losses.business. Total gross reserves for our excess and surplus lines insurance segment rose $45 million, reflecting a 3328 percent increase in earned premiums.
Cincinnati Financial Corporation - 2014 10-K - Page 99
Property Casualty Gross
Loss and Loss Expense Reserves
| (In millions) | | Loss reserves | | | Loss | | | Total | | | | |
| | | Case | | | IBNR | | | expense | | | gross | | | Percent | |
| | | reserves | | | reserves | | | reserves | | | reserves | | | of total | |
| At December 31, 2012 | | | | | | | | | | | | | | | | | | | | |
| Commercial lines insurance | | | | | | | | | | | | | | | | | | | | |
| Commercial casualty | | $ | 816 | | | $ | 348 | | | $ | 503 | | | $ | 1,667 | | | | 40.0 | % |
| Commercial property | | | 197 | | | | 22 | | | | 38 | | | | 257 | | | | 6.2 | |
| Commercial auto | | | 252 | | | | 35 | | | | 66 | | | | 353 | | | | 8.5 | |
| Workers' compensation | | | 433 | | | | 473 | | | | 97 | | | | 1,003 | | | | 24.1 | |
| Specialty packages | | | 129 | | | | 3 | | | | 27 | | | | 159 | | | | 3.8 | |
| Surety and executive risk | | | 121 | | | | 6 | | | | 74 | | | | 201 | | | | 4.8 | |
| Machinery and equipment | | | 1 | | | | 2 | | | | 2 | | | | 5 | | | | 0.1 | |
| Subtotal | | | 1,949 | | | | 889 | | | | 807 | | | | 3,645 | | | | 87.5 | |
| | | | | | | | | | | | | | | | | | | | | |
| Personal lines insurance | | | | | | | | | | | | | | | | | | | | |
| Personal auto | | | 140 | | | | (10 | ) | | | 53 | | | | 183 | | | | 4.4 | |
| Homeowner | | | 81 | | | | 21 | | | | 27 | | | | 129 | | | | 3.1 | |
| Other personal | | | 39 | | | | 42 | | | | 5 | | | | 86 | | | | 2.1 | |
| Subtotal | | | 260 | | | | 53 | | | | 85 | | | | 398 | | | | 9.6 | |
| | | | | | | | | | | | | | | | | | | | | |
| Excess and surplus lines | | | 61 | | | | 35 | | | | 30 | | | | 126 | | | | 2.9 | |
| Total | | $ | 2,270 | | | $ | 977 | | | $ | 922 | | | $ | 4,169 | | | | 100.0 | % |
| At December 31, 2011 | | | | | | | | | | | | | | | | | | | | |
| Commercial lines insurance | | | | | | | | | | | | | | | | | | | | |
| Commercial casualty | | $ | 875 | | | $ | 365 | | | $ | 535 | | | $ | 1,775 | | | | 41.5 | % |
| Commercial property | | | 190 | | | | 35 | | | | 36 | | | | 261 | | | | 6.1 | |
| Commercial auto | | | 260 | | | | 30 | | | | 62 | | | | 352 | | | | 8.2 | |
| Workers' compensation | | | 467 | | | | 464 | | | | 108 | | | | 1,039 | | | | 24.3 | |
| Specialty packages | | | 100 | | | | 9 | | | | 32 | | | | 141 | | | | 3.3 | |
| Surety and executive risk | | | 126 | | | | 5 | | | | 77 | | | | 208 | | | | 4.9 | |
| Machinery and equipment | | | 1 | | | | 3 | | | | 1 | | | | 5 | | | | 0.1 | |
| Subtotal | | | 2,019 | | | | 911 | | | | 851 | | | | 3,781 | | | | 88.4 | |
| | | | | | | | | | | | | | | | | | | | | |
| Personal lines insurance | | | | | | | | | | | | | | | | | | | | |
| Personal auto | | | 129 | | | | (3 | ) | | | 52 | | | | 178 | | | | 4.2 | |
| Homeowner | | | 76 | | | | 39 | | | | 27 | | | | 142 | | | | 3.3 | |
| Other personal | | | 41 | | | | 52 | | | | 5 | | | | 98 | | | | 2.3 | |
| Subtotal | | | 246 | | | | 88 | | | | 84 | | | | 418 | | | | 9.8 | |
| | | | | | | | | | | | | | | | | | | | | |
| Excess and surplus lines | | | 43 | | | | 18 | | | | 20 | | | | 81 | | | | 1.8 | |
| Total | | $ | 2,308 | | | $ | 1,017 | | | $ | 955 | | | $ | 4,280 | | | | 100.0 | % |
|
| | | | | | | | | | | | | | | | | | | |
| (Dollars in millions) | | Loss reserves | | Loss | | Total | | |
| | | Case | | IBNR | | expense | | gross | | Percent |
| | | reserves | | reserves | | reserves | | reserves | | of total |
| At December, 31 2014 | | | | | | | | | | |
| Commercial lines insurance: | | |
| | |
| | |
| | |
| | |
|
| Commercial casualty | | $ | 794 |
| | $ | 470 |
| | $ | 520 |
| | $ | 1,784 |
| | 40.2 | % |
| Commercial property | | 203 |
| | (4 | ) | | 39 |
| | 238 |
| | 5.4 |
|
| Commercial auto | | 298 |
| | 58 |
| | 77 |
| | 433 |
| | 9.8 |
|
| Workers' compensation | | 412 |
| | 550 |
| | 94 |
| | 1,056 |
| | 23.8 |
|
| Other commercial | | 188 |
| | 11 |
| | 87 |
| | 286 |
| | 6.4 |
|
| Subtotal | | 1,895 |
| | 1,085 |
| | 817 |
| | 3,797 |
| | 85.6 |
|
| Personal lines insurance: | | |
| | |
| | |
| | |
| | |
|
| Personal auto | | 195 |
| | (21 | ) | | 63 |
| | 237 |
| | 5.3 |
|
| Homeowner | | 74 |
| | 12 |
| | 23 |
| | 109 |
| | 2.5 |
|
| Other personal | | 45 |
| | 43 |
| | 5 |
| | 93 |
| | 2.0 |
|
| Subtotal | | 314 |
| | 34 |
| | 91 |
| | 439 |
| | 9.8 |
|
| Excess and surplus lines | | 77 |
| | 79 |
| | 46 |
| | 202 |
| | 4.6 |
|
| Total | | $ | 2,286 |
| | $ | 1,198 |
| | $ | 954 |
| | $ | 4,438 |
| | 100.0 | % |
| | | | | | | | | | | |
| At December 31, 2013 | | |
| | |
| | |
| | |
| | |
|
| Commercial lines insurance: | | |
| | |
| | |
| | |
| | |
|
| Commercial casualty | | $ | 790 |
| | $ | 393 |
| | $ | 496 |
| | $ | 1,679 |
| | 39.6 | % |
| Commercial property | | 189 |
| | 30 |
| | 37 |
| | 256 |
| | 6.0 |
|
| Commercial auto | | 264 |
| | 40 |
| | 69 |
| | 373 |
| | 8.8 |
|
| Workers' compensation | | 421 |
| | 522 |
| | 95 |
| | 1,038 |
| | 24.5 |
|
| Other commercial | | 211 |
| | 15 |
| | 95 |
| | 321 |
| | 7.6 |
|
| Subtotal | | 1,875 |
| | 1,000 |
| | 792 |
| | 3,667 |
| | 86.5 |
|
| Personal lines insurance: | | |
| | |
| | |
| | |
| | |
|
| Personal auto | | 178 |
| | (18 | ) | | 61 |
| | 221 |
| | 5.2 |
|
| Homeowner | | 80 |
| | 9 |
| | 24 |
| | 113 |
| | 2.7 |
|
| Other personal | | 46 |
| | 32 |
| | 5 |
| | 83 |
| | 1.9 |
|
| Subtotal | | 304 |
| | 23 |
| | 90 |
| | 417 |
| | 9.8 |
|
| Excess and surplus lines | | 65 |
| | 55 |
| | 37 |
| | 157 |
| | 3.7 |
|
| Total | | $ | 2,244 |
| | $ | 1,078 |
| | $ | 919 |
| | $ | 4,241 |
| | 100.0 | % |
| | | | | | | | | | | |
Asbestos and Environmental
Loss and Loss Expense Reserves
We carried
$67$81 million of net loss and loss expense reserves for asbestos and environmental claims and
$54$51 million of reserves for mold claims at year-end
2012,2014, compared with
$74$77 million and
$62$51 million, respectively, for such claims at year-end
2011.2013. The asbestos and environmental claims amounts for each respective year constituted
1.82.0 percent and 1.9 percent of total
net loss and loss expense reserves at these year-end dates.
We believe our exposure to asbestos and environmental claims is limited, largely because our reinsurance retention was $500,000 or below prior to 1987. We also were predominantly a personal lines company in the 1960s and 1970s, when asbestos and pollution exclusions were not widely used by commercial lines insurers. During the 1980s and early 1990s, commercial lines grew as a percentage of our overall business and our exposure to asbestos and environmental claims grew accordingly. Over that period, we endorsed to or included in most policies an asbestos and environmental exclusion.
Additionally, since 2002, we have revised policy terms where permitted by state regulation to limit our exposure to mold claims prospectively and further reduce our exposure to other environmental claims
generally. Finally, we have not engaged in any mergers or acquisitions through which such a liability could have been assumed. We
Cincinnati Financial Corporation - 2014 10-K - Page 100
continue to monitor our claims for evidence of material exposure to other mass tort classes such as silicosis, but we have found no such credible evidence to date.
Reserving data for asbestos and environmental claims has characteristics that limit the usefulness of the methods and models used to analyze loss and loss expense reserves for other claims. Specifically, asbestos and environmental loss and loss expenses for different accident years do not emerge independently of one another as loss development and Bornhuetter-Ferguson methods assume. In addition, asbestos and environmental loss and loss expense data available to date
doesdid not reflect a well-defined tail, greatly complicating the identification of an appropriate probabilistic trend family model.
Due to these considerations, our actuarial staff reviewed additional reserving methods and elected to use At year-end 2014, we used a weighted average of a paid survival ratio method and report year method to estimate reserves for IBNR asbestos and environmental claims. The result is a decrease of approximately 10 percent in the indicated reserve as derived from the 2003 survival ratio analysis alone. Our exposure to such claims is limited; we believe moving toa weighted average of both methods produces a sufficient level of reserves.
Gross Property Casualty Loss and Loss Expense Payments
While we believe that historical performance of property casualty and life loss payment patterns is a reasonable source for projecting future claim payments, there is inherent uncertainty in this estimate of contractual obligations. We believe that we could meet our obligations under a significant and unexpected change in the timing of these payments because of the liquidity of our invested assets, strong financial position and access to lines of credit.
Our estimates of gross property casualty loss and loss expense payments do not include reinsurance receivables or ceded losses. As discussed in
20132015 Reinsurance Programs,
Page 95, we purchase reinsurance to mitigate our property casualty risk exposure. Ceded property casualty reinsurance unpaid receivables of
$356$282 million at year-end
20122014 are an offset to our gross property casualty loss and loss expense obligations. Our reinsurance program mitigates the liquidity risk of a single large loss or an unexpected rise in claim severity or frequency due to a catastrophic event. Reinsurance does not relieve us of our obligation to pay covered claims. The financial strength of our reinsurers is important because our ability to recover losses under our reinsurance agreements depends on the financial viability of the reinsurers.
We direct our associates and agencies to settle claims and pay losses as quickly as is practical, and we made
$2.229$2.413 billion of net claim payments during
2012.2014. At year-end
2012,2014, total net property casualty reserves of
$3.813$4.156 billion reflected
$2.015$2.091 billion in unpaid amounts on reported claims (case reserves),
$888$920 million in loss expense reserves and
$910 million$1.145 billion in estimates of claims that were incurred but had not yet been reported (IBNR). The specific amounts and timing of obligations related to case reserves and associated loss expenses are not set contractually. The amounts and timing of obligations for IBNR claims and related loss expenses are unknown. We discuss our methods of establishing loss and loss expense reserves and our belief that reserves are adequate in Critical Accounting Estimates, Property Casualty Insurance Loss and Loss Expense
Reserves, Page 43.Reserves.
The historical pattern of using premium receipts for the payment of loss and loss expenses has enabled us to extend slightly the maturities of our investment portfolio beyond the estimated settlement date of the loss reserves. The effective duration of our consolidated property casualty fixed-maturity portfolio was
4.24.4 years at year-end
2012.2014. By contrast, the duration of our loss and loss expense reserves was approximately
4.324.24 years. We believe this difference in duration does not affect our ability to meet current obligations because cash flow from operations is sufficient to meet these obligations. In addition, investment holdings could be sold, if necessary, to meet higher than anticipated loss and loss expenses.
Range of Reasonable Reserves
The company established a reasonably likely range for net loss and loss expense reserves of
$3.598$3.922 billion to
$3.918$4.296 billion at year-end
2012,2014, with the company carrying net reserves of
$3.813$4.156 billion. The likely range was
$3.677$3.727 billion to
$4.056$4.078 billion at year-end
2011,2013, with the company carrying net reserves of
$3.905$3.942 billion. Our loss and loss expense reserves are not discounted for the time-value of money, but we have reduced the reserves by an estimate of the amount of salvage and subrogation payments we expect to recover.
The low point of each year’s range corresponds to approximately one standard error below each year’s mean reserve estimate, while the high point corresponds to approximately one standard error above each year’s mean reserve estimate. We discussed management’s reasons for basing reasonably likely reserve ranges on standard errors in Critical Accounting Estimates, Reserve Estimate
Variability, Page 46.Variability.
The ranges reflect our assessment of the most likely unpaid loss and loss expenses at year-end
20122014 and
2011.2013. However, actual unpaid loss and loss expenses could nonetheless fall outside of the indicated ranges.
Cincinnati Financial Corporation - 2014 10-K - Page 101
Management’s best estimate of total loss and loss expense reserves as of year-end
20122014 was consistent with the corresponding actuarial best estimate. Management’s best estimate of total loss and loss expense reserves as of year-end
20112013 also was consistent with the corresponding actuarial best estimate.
Development of Reserves for Loss and Loss Expenses
We reconcile the beginning and ending balances of our reserves for loss and loss expenses at December 31,
2012, 20112014, 2013 and
2010,2012, in Item 8, Note 4 of the Consolidated Financial
Statements, Page 125.Statements. The reconciliation of our year-end
20112013 reserve balance to net incurred losses one year later
recognizes approximately $396recognized $98 million of favorable reserve development.
The table below shows the development of estimated reserves for loss and loss expenses for the past 10 years.
| · | Section A shows our total property casualty loss and loss expense reserves recorded at the balance sheet date for each of the indicated calendar years on a gross and net basis. Those reserves represent the estimated amount of unpaid loss and loss expenses for claims arising in the indicated calendar year and all prior accident years at the balance sheet date, including losses that were incurred but not yet reported to the company. |
| · | Section B shows the cumulative net amount paid with respect to the previously recorded reserve as of the end of each succeeding year. For example, as of December 31, 2012, we had paid $2.040 billion of loss and loss expenses in calendar years 2003 through 2012 for losses that occurred in accident years 2002 and prior. An estimated $263 million of losses remained unpaid as of year-end 2012 (net re-estimated reserves of $2.303 billion from Section C less cumulative net paid loss and loss expenses of $2.040 billion). |
| · | Section C shows the re-estimated amount of the previously reported reserves based on experience as of the end of each succeeding year. The estimate is increased or decreased as we learn more about the development of the related claims. |
| · | Section D, cumulative net reserve development, represents the aggregate change in the estimates for all years subsequent to the year the reserves were initially established. For example, reserves established at December 31, 2002, had developed favorably by $305 million over 10 years, net of reinsurance, which was reflected in income over the 10 years. The table shows favorable reserve development as a negative number. Favorable reserve development on prior accident years, which represents a negative expense, is favorable to income. The “One year later” line in the table shows the effects on income before income taxes in 2012, 2011 and 2010 of changes in estimates of the reserves for loss and loss expenses for all accident years. The effect was favorable to pretax income for those three years by $396 million, $285 million, and $304 million, respectively. |
Section A shows our total property casualty loss and loss expense reserves recorded at the balance sheet date for each of the indicated calendar years on a gross and net basis. Those reserves represent the estimated amount of unpaid loss and loss expenses for claims arising in the indicated calendar year and all prior accident years at the balance sheet date, including losses that were incurred but not yet reported to the company.
Section B shows the cumulative net amount paid with respect to the previously recorded reserve as of the end of each succeeding year. For example, as of December 31, 2014, we had paid $2.355 billion of loss and loss expenses in calendar years 2005 through 2014 for losses that occurred in accident years 2004 and prior. An estimated $330 million of losses remained unpaid as of year-end 2014 (net re-estimated reserves of $2.685 billion from Section C less cumulative net paid loss and loss expenses of $2.355 billion).
Section C shows the re-estimated amount of the previously reported reserves based on experience as of the end of each succeeding year. The estimate is increased or decreased as we learn more about the development of the related claims.
Section D, cumulative net reserve development, represents the aggregate change in the estimates for all years subsequent to the year the reserves were initially established. For example, reserves established at December 31, 2004, had developed favorably by $292 million over 10 years, net of reinsurance, which was reflected in income over the 10 years. The table shows favorable reserve development as a negative number. Favorable reserve development on prior accident years, which represents a negative expense, is favorable to income. The “One year later” line in the table shows the effects on income before income taxes in 2014, 2013 and 2012 of changes in estimates of the reserves for loss and loss expenses for all accident years. The effect was favorable to pretax income for those three years by $98 million, $147 million, and $396 million, respectively.
In evaluating the development of our estimated reserves for loss and loss expenses for the past 10 years, note that each amount includes the effects of all changes in amounts for prior periods. For example, payments or reserve adjustments related to losses settled in
20122014 but incurred in
20062008 are included in the cumulative deficiency or redundancy amount for
20062008 and each subsequent year. In addition, this table presents calendar year data, not accident or policy year development data, which readers may be more accustomed to analyzing. Conditions and trends that affected development of reserves in the past may not necessarily occur in the future. Accordingly, it may not be appropriate to extrapolate future reserve development based on this data.
Differences between the property casualty reserves reported in the accompanying consolidated balance sheets (prepared in accordance with GAAP) and those same reserves reported in the annual statements (filed with state insurance departments in accordance with statutory accounting practices – SAP), relate principally to the reporting of reinsurance recoverables, which are recognized as receivables for GAAP and as an offset to reserves for SAP.
Cincinnati Financial Corporation - 2014 10-K - Page 102
Development of Estimated Reserves for Property and Casualty Loss and Loss Expenses| (In millions) | | | | | | | | | | | | | | | | | | |
| | | 2002 | | | 2003 | | | 2004 | | | 2005 | | | 2006 | | | 2007 | | | 2008 | | | 2009 | | | 2010 | | | 2011 | | | 2012 | |
| A. Originally reported reserves for unpaid loss and loss expenses: | | | | | | | | | | | | | | | | | | | | | | | | | | | | | | | | | | | | | | | | | | | | |
| Gross of reinsurance | | $ | 3,150 | | | $ | 3,386 | | | $ | 3,514 | | | $ | 3,629 | | | $ | 3,860 | | | $ | 3,925 | | | $ | 4,040 | | | $ | 4,096 | | | $ | 4,137 | | | $ | 4,280 | | | $ | 4,169 | |
| Reinsurance recoverable | | | 542 | | | | 541 | | | | 537 | | | | 518 | | | | 504 | | | | 528 | | | | 542 | | | | 435 | | | | 326 | | | | 375 | | | | 356 | |
| Net of reinsurance | | $ | 2,608 | | | $ | 2,845 | | | $ | 2,977 | | | $ | 3,111 | | | $ | 3,356 | | | $ | 3,397 | | | $ | 3,498 | | | $ | 3,661 | | | $ | 3,811 | | | $ | 3,905 | | | $ | 3,813 | |
| | | | | | | | | | | | | | | | | | | | | | | | | | | | | | | | | | | | | | | | | | | | | |
| B. Cumulative net paid as of: | | | | | | | | | | | | | | | | | | | | | | | | | | | | | | | | | | | | | | | | | | | | |
| One year later | | $ | 799 | | | $ | 817 | | | $ | 907 | | | $ | 944 | | | $ | 1,006 | | | $ | 979 | | | $ | 994 | | | $ | 926 | | | $ | 1,035 | | | $ | 1,106 | | | | | |
| Two years later | | | 1,235 | | | | 1,293 | | | | 1,426 | | | | 1,502 | | | | 1,547 | | | | 1,523 | | | | 1,529 | | | | 1,511 | | | | 1,663 | | | | | | | | | |
| Three years later | | | 1,519 | | | | 1,626 | | | | 1,758 | | | | 1,845 | | | | 1,896 | | | | 1,857 | | | | 1,912 | | | | 1,921 | | | | | | | | | | | | | |
| Four years later | | | 1,716 | | | | 1,823 | | | | 1,963 | | | | 2,059 | | | | 2,096 | | | | 2,102 | | | | 2,174 | | | | | | | | | | | | | | | | | |
| Five years later | | | 1,823 | | | | 1,945 | | | | 2,096 | | | | 2,176 | | | | 2,247 | | | | 2,264 | | | | | | | | | | | | | | | | | | | | | |
| Six years later | | | 1,889 | | | | 2,031 | | | | 2,163 | | | | 2,282 | | | | 2,360 | | | | | | | | | | | | | | | | | | | | | | | | | |
| Seven years later | | | 1,940 | | | | 2,077 | | | | 2,238 | | | | 2,355 | | | | | | | | | | | | | | | | | | | | | | | | | | | | | |
| Eight years later | | | 1,973 | | | | 2,132 | | | | 2,291 | | | | | | | | | | | | | | | | | | | | | | | | | | | | | | | | | |
| Nine years later | | | 2,015 | | | | 2,170 | | | | | | | | | | | | | | | | | | | | | | | | | | | | | | | | | | | | | |
| Ten years later | | | 2,040 | | | | | | | | | | | | | | | | | | | | | | | | | | | | | | | | | | | | | | | | | |
| | | | | | | | | | | | | | | | | | | | | | | | | | | | | | | | | | | | | | | | | | | | | |
| C. Net reserves re-estimated as of: | | | | | | | | | | | | | | | | | | | | | | | | | | | | | | | | | | | | | | | | | | | | |
| One year later | | $ | 2,528 | | | $ | 2,649 | | | $ | 2,817 | | | $ | 2,995 | | | $ | 3,112 | | | $ | 3,074 | | | $ | 3,310 | | | $ | 3,357 | | | $ | 3,526 | | | $ | 3,509 | | | | | |
| Two years later | | | 2,377 | | | | 2,546 | | | | 2,743 | | | | 2,871 | | | | 2,893 | | | | 3,042 | | | | 3,197 | | | | 3,251 | | | | 3,283 | | | | | | | | | |
| Three years later | | | 2,336 | | | | 2,489 | | | | 2,657 | | | | 2,724 | | | | 2,898 | | | | 3,005 | | | | 3,124 | | | | 3,076 | | | | | | | | | | | | | |
| Four years later | | | 2,299 | | | | 2,452 | | | | 2,578 | | | | 2,776 | | | | 2,907 | | | | 2,957 | | | | 3,043 | | | | | | | | | | | | | | | | | |
| Five years later | | | 2,276 | | | | 2,414 | | | | 2,645 | | | | 2,788 | | | | 2,900 | | | | 2,925 | | | | | | | | | | | | | | | | | | | | | |
| Six years later | | | 2,259 | | | | 2,469 | | | | 2,662 | | | | 2,790 | | | | 2,890 | | | | | | | | | | | | | | | | | | | | | | | | | |
| Seven years later | | | 2,298 | | | | 2,491 | | | | 2,665 | | | | 2,792 | | | | | | | | | | | | | | | | | | | | | | | | | | | | | |
| Eight years later | | | 2,318 | | | | 2,496 | | | | 2,657 | | | | | | | | | | | | | | | | | | | | | | | | | | | | | | | | | |
| Nine years later | | | 2,323 | | | | 2,482 | | | | | | | | | | | | | | | | | | | | | | | | | | | | | | | | | | | | | |
| Ten years later | | | 2,303 | | | | | | | | | | | | | | | | | | | | | | | | | | | | | | | | | | | | | | | | | |
| | | | | | | | | | | | | | | | | | | | | | | | | | | | | | | | | | | | | | | | | | | | | |
| D. Cumulative net redundancy as of: | | | | | | | | | | | | | | | | | | | | | | | | | | | | | | | | | | | | | | | | | | | | |
| One year later | | $ | (80 | ) | | $ | (196 | ) | | $ | (160 | ) | | $ | (116 | ) | | $ | (244 | ) | | $ | (323 | ) | | $ | (188 | ) | | $ | (304 | ) | | $ | (285 | ) | | $ | (396 | ) | | | | |
| Two years later | | | (231 | ) | | | (299 | ) | | | (234 | ) | | | (240 | ) | | | (463 | ) | | | (355 | ) | | | (301 | ) | | | (410 | ) | | | (528 | ) | | | | | | | | |
| Three years later | | | (272 | ) | | | (356 | ) | | | (320 | ) | | | (387 | ) | | | (458 | ) | | | (392 | ) | | | (374 | ) | | | (585 | ) | | | | | | | | | | | | |
| Four years later | | | (309 | ) | | | (393 | ) | | | (399 | ) | | | (335 | ) | | | (449 | ) | | | (440 | ) | | | (455 | ) | | | | | | | | | | | | | | | | |
| Five years later | | | (332 | ) | | | (431 | ) | | | (332 | ) | | | (323 | ) | | | (456 | ) | | | (472 | ) | | | | | | | | | | | | | | | | | | | | |
| Six years later | | | (349 | ) | | | (376 | ) | | | (315 | ) | | | (321 | ) | | | (466 | ) | | | | | | | | | | | | | | | | | | | | | | | | |
| Seven years later | | | (310 | ) | | | (354 | ) | | | (312 | ) | | | (319 | ) | | | | | | | | | | | | | | | | | | | | | | | | | | | | |
| Eight years later | | | (290 | ) | | | (349 | ) | | | (320 | ) | | | | | | | | | | | | | | | | | | | | | | | | | | | | | | | | |
| Nine years later | | | (285 | ) | | | (363 | ) | | | | | | | | | | | | | | | | | | | | | | | | | | | | | | | | | | | | |
| Ten years later | | | (305 | ) | | | | | | | | | | | | | | | | | | | | | | | | | | | | | | | | | | | | | | | | |
| | | | | | | | | | | | | | | | | | | | | | | | | | | | | | | | | | | | | | | | | | | | | |
| Net reserves re-estimated—latest | | $ | 2,303 | | | $ | 2,482 | | | $ | 2,657 | | | $ | 2,792 | | | $ | 2,890 | | | $ | 2,925 | | | $ | 3,043 | | | $ | 3,076 | | | $ | 3,283 | | | $ | 3,509 | | | | | |
| Re-estimated recoverable—latest | | | 515 | | | | 491 | | | | 510 | | | | 476 | | | | 466 | | | | 449 | | | | 487 | | | | 388 | | | | 319 | | | | 381 | | | | | |
| Gross liability re-estimated—latest | | $ | 2,818 | | | $ | 2,973 | | | $ | 3,167 | | | $ | 3,268 | | | $ | 3,356 | | | $ | 3,374 | | | $ | 3,530 | | | $ | 3,464 | | | $ | 3,602 | | | $ | 3,890 | | | | | |
| | | | | | | | | | | | | | | | | | | | | | | | | | | | | | | | | | | | | | | | | | | | | |
| Cumulative gross redundancy | | $ | (332 | ) | | $ | (413 | ) | | $ | (347 | ) | | $ | (361 | ) | | $ | (504 | ) | | $ | (551 | ) | | $ | (510 | ) | | $ | (632 | ) | | $ | (535 | ) | | $ | (390 | ) | | | | |
Consolidated
|
| | | | | | | | | | | | | | | | | | | | | | | | | | | | | | | | | | | | | | | | | | | | |
| (Dollar in millions) | | | | | | | | | | | | | | | | | | | | | | |
| | | 2004 | | 2005 | | 2006 | | 2007 | | 2008 | | 2009 | | 2010 | | 2011 | | 2012 | | 2013 | | 2014 |
| A. Originally reported reserves for unpaid loss and loss expenses: |
| Gross of reinsurance | | $ | 3,514 |
| | $ | 3,629 |
| | $ | 3,860 |
| | $ | 3,925 |
| | $ | 4,040 |
| | $ | 4,096 |
| | $ | 4,137 |
| | $ | 4,280 |
| | $ | 4,169 |
| | $ | 4,241 |
| | $ | 4,438 |
|
| Reinsurance recoverable | | 537 |
| | 518 |
| | 504 |
| | 528 |
| | 542 |
| | 435 |
| | 326 |
| | 375 |
| | 356 |
| | 299 |
| | 282 |
|
| Net of reinsurance | | $ | 2,977 |
| | $ | 3,111 |
| | $ | 3,356 |
| | $ | 3,397 |
| | $ | 3,498 |
| | $ | 3,661 |
| | $ | 3,811 |
| | $ | 3,905 |
| | $ | 3,813 |
| | $ | 3,942 |
| | $ | 4,156 |
|
| | | | | | | | | | | | | | | | | | | | | | | |
| B. Cumulative net paid as of: |
| One year later | | $ | 907 |
| | $ | 944 |
| | $ | 1,006 |
| | $ | 979 |
| | $ | 994 |
| | $ | 926 |
| | $ | 1,035 |
| | $ | 1,106 |
| | $ | 1,127 |
| | $ | 1,201 |
| | |
| Two years later | | 1,426 |
| | 1,502 |
| | 1,547 |
| | 1,523 |
| | 1,529 |
| | 1,511 |
| | 1,663 |
| | 1,717 |
| | 1,822 |
| | |
| | |
|
| Three years later | | 1,758 |
| | 1,845 |
| | 1,896 |
| | 1,857 |
| | 1,912 |
| | 1,921 |
| | 2,052 |
| | 2,170 |
| | | | | | |
| Four years later | | 1,963 |
| | 2,059 |
| | 2,096 |
| | 2,102 |
| | 2,174 |
| | 2,188 |
| | 2,330 |
| | |
| | |
| | |
| | |
|
| Five years later | | 2,096 |
| | 2,176 |
| | 2,247 |
| | 2,264 |
| | 2,343 |
| | 2,359 |
| | | | | | | | | | |
| Six years later | | 2,163 |
| | 2,282 |
| | 2,360 |
| | 2,371 |
| | 2,455 |
| | |
| | |
| | |
| | |
| | |
| | |
|
| Seven years later | | 2,238 |
| | 2,355 |
| | 2,437 |
| | 2,443 |
| | | | | | | | | | | | | | |
| Eight years later | | 2,291 |
| | 2,402 |
| | 2,484 |
| | |
| | |
| | |
| | |
| | |
| | |
| | |
| | |
|
| Nine years later | | 2,328 |
| | 2,439 |
| | | | | | | | | | | | | | | | | | |
| Ten years later | | 2,355 |
| | |
| | |
| | |
| | |
| | |
| | |
| | |
| | |
| | |
| | |
|
| | | | | | | | | | | | | | | | | | | | | | | |
| C. Net reserves re-estimated as of: |
| One year later | | $ | 2,817 |
| | $ | 2,995 |
| | $ | 3,112 |
| | $ | 3,074 |
| | $ | 3,310 |
| | $ | 3,357 |
| | $ | 3,526 |
| | $ | 3,509 |
| | $ | 3,666 |
| | $ | 3,844 |
| | |
|
| Two years later | | 2,743 |
| | 2,871 |
| | 2,893 |
| | 3,042 |
| | 3,197 |
| | 3,251 |
| | 3,283 |
| | 3,464 |
| | 3,624 |
| | | | |
| Three years later | | 2,657 |
| | 2,724 |
| | 2,898 |
| | 3,005 |
| | 3,124 |
| | 3,076 |
| | 3,279 |
| | 3,437 |
| | |
| | |
| | |
|
| Four years later | | 2,578 |
| | 2,776 |
| | 2,907 |
| | 2,957 |
| | 3,043 |
| | 3,121 |
| | 3,270 |
| | | | | | | | |
| Five years later | | 2,645 |
| | 2,788 |
| | 2,900 |
| | 2,925 |
| | 3,073 |
| | 3,115 |
| | |
| | |
| | |
| | |
| | |
|
| Six years later | | 2,662 |
| | 2,790 |
| | 2,890 |
| | 2,949 |
| | 3,069 |
| | | | | | | | | | | | |
| Seven years later | | 2,665 |
| | 2,792 |
| | 2,918 |
| | 2,955 |
| | |
| | |
| | |
| | |
| | |
| | |
| | |
|
| Eight years later | | 2,657 |
| | 2,821 |
| | 2,918 |
| | | | | | | | | | | | | | | | |
| Nine years later | | 2,684 |
| | 2,818 |
| | |
| | |
| | |
| | |
| | |
| | |
| | |
| | |
| | |
|
| Ten years later | | 2,685 |
| | | | | | | | | | | | | | | | | | | | |
| | | | | | | | | | | | | | | | | | | | | | | |
| D. Cumulative net redundancy as of: |
| One year later | | $ | (160 | ) | | $ | (116 | ) | | $ | (244 | ) | | $ | (323 | ) | | $ | (188 | ) | | $ | (304 | ) | | $ | (285 | ) | | $ | (396 | ) | | $ | (147 | ) | | $ | (98 | ) | | |
| Two years later | | (234 | ) | | (240 | ) | | (463 | ) | | (355 | ) | | (301 | ) | | (410 | ) | | (528 | ) | | (441 | ) | | (189 | ) | | |
| | |
|
| Three years later | | (320 | ) | | (387 | ) | | (458 | ) | | (392 | ) | | (374 | ) | | (585 | ) | | (532 | ) | | (468 | ) | | | | | | |
| Four years later | | (399 | ) | | (335 | ) | | (449 | ) | | (440 | ) | | (455 | ) | | (540 | ) | | (541 | ) | | |
| | |
| | |
| | |
|
| Five years later | | (332 | ) | | (323 | ) | | (456 | ) | | (472 | ) | | (425 | ) | | (546 | ) | | | | | | | | | | |
| Six years later | | (315 | ) | | (321 | ) | | (466 | ) | | (448 | ) | | (429 | ) | | |
| | |
| | |
| | |
| | |
| | |
|
| Seven years later | | (312 | ) | | (319 | ) | | (438 | ) | | (442 | ) | | | | | | | | | | | | | | |
| Eight years later | | (320 | ) | | (290 | ) | | (438 | ) | | |
| | |
| | |
| | |
| | |
| | |
| | |
| | |
|
| Nine years later | | (293 | ) | | (293 | ) | | | | | | | | | | | | | | | | | | |
| Ten years later | | (292 | ) | | |
| | |
| | |
| | |
| | |
| | |
| | |
| | |
| | | | |
| | | | | | | | | | | | | | | | | | | | | | | |
| Net reserves re-estimated—latest | | $ | 2,685 |
| | $ | 2,818 |
| | $ | 2,918 |
| | $ | 2,955 |
| | $ | 3,069 |
| | $ | 3,115 |
| | $ | 3,270 |
| | $ | 3,437 |
| | $ | 3,624 |
| | $ | 3,844 |
| | |
| Re-estimated recoverable—latest | | 526 |
| | 500 |
| | 492 |
| | 480 |
| | 517 |
| | 422 |
| | 351 |
| | 413 |
| | 366 |
| | 307 |
| | |
| Gross liability re-estimated—latest | | $ | 3,211 |
| | $ | 3,318 |
| | $ | 3,410 |
| | $ | 3,435 |
| | $ | 3,586 |
| | $ | 3,537 |
| | $ | 3,621 |
| | $ | 3,850 |
| | $ | 3,990 |
| | $ | 4,151 |
| | |
| | | | | | | | | | | | | | | | | | | | | | | |
| Cumulative gross redundancy | | $(303) | | $(311) | | $(450) | | $(490) | | $(454) | | $(559) | | $(516) | | $(430) | | $(179) | | $(90) | | |
| | | | | | | | | | | | | | | | | | | | | | | |
Cincinnati Financial Corporation - 2014 10-K - Page 103
Property Casualty Insurance Development of Estimated Reserves by Accident Year
The following table shows net reserve changes at year-end
2012, 20112014, 2013 and
20102012 by property casualty segment and accident year:
| (In millions) | | Comm. | | | Pers. | | | E&S | | | | |
| | | lines | | | lines | | | lines | | | Totals | |
| | | Incremental development | |
| As of December 31, 2012 | | | | | | | | | | | | | | | | |
| 2011 accident year | | $ | (93 | ) | | $ | (60 | ) | | $ | 0 | | | $ | (153 | ) |
| 2010 accident year | | | (49 | ) | | | (16 | ) | | | (3 | ) | | | (68 | ) |
| 2009 accident year | | | (80 | ) | | | (11 | ) | | | (2 | ) | | | (93 | ) |
| 2008 accident year | | | (45 | ) | | | (5 | ) | | | 0 | | | | (50 | ) |
| 2007 accident year | | | (18 | ) | | | (3 | ) | | | 0 | | | | (21 | ) |
| 2006 accident year | | | (12 | ) | | | (1 | ) | | | 0 | | | | (13 | ) |
| 2005 and prior accident years | | | 5 | | | | (3 | ) | | | 0 | | | | 2 | |
| Deficiency/(redundancy) | | $ | (292 | ) | | $ | (99 | ) | | $ | (5 | ) | | $ | (396 | ) |
| | | | | | | | | | | | | | | | | |
| As of December 31, 2011 | | | | | | | | | | | | | | | | |
| 2010 accident year | | $ | (148 | ) | | $ | (26 | ) | | $ | (4 | ) | | $ | (178 | ) |
| 2009 accident year | | | (16 | ) | | | (10 | ) | | | (5 | ) | | | (31 | ) |
| 2008 accident year | | | (23 | ) | | | (2 | ) | | | 0 | | | | (25 | ) |
| 2007 accident year | | | (36 | ) | | | (3 | ) | | | 0 | | | | (39 | ) |
| 2006 accident year | | | (8 | ) | | | (2 | ) | | | 0 | | | | (10 | ) |
| 2005 accident year | | | (3 | ) | | | (1 | ) | | | 0 | | | | (4 | ) |
| 2004 and prior accident years | | | 0 | | | | 2 | | | | 0 | | | | 2 | |
| Deficiency/(redundancy) | | $ | (234 | ) | | $ | (42 | ) | | $ | (9 | ) | | $ | (285 | ) |
| | | | | | | | | | | | | | | | | |
| As of December 31, 2010 | | | | | | | | | | | | | | | | |
| 2009 accident year | | $ | (176 | ) | | $ | (13 | ) | | $ | (1 | ) | | $ | (190 | ) |
| 2008 accident year | | | (62 | ) | | | (13 | ) | | | 0 | | | | (75 | ) |
| 2007 accident year | | | (43 | ) | | | (2 | ) | | | 0 | | | | (45 | ) |
| 2006 accident year | | | 0 | | | | (3 | ) | | | 0 | | | | (3 | ) |
| 2005 accident year | | | (9 | ) | | | 1 | | | | 0 | | | | (8 | ) |
| 2004 accident year | | | (2 | ) | | | (2 | ) | | | 0 | | | | (4 | ) |
| 2003 and prior accident years | | | 23 | | | | (2 | ) | | | 0 | | | | 21 | |
| Deficiency/(redundancy) | | $ | (269 | ) | | $ | (34 | ) | | $ | (1 | ) | | $ | (304 | ) |
|
| | | | | | | | | | | | | | | | |
| (Dollars in millions) | | Commercial | | Personal | | E&S | | |
| | | lines | | lines | | lines | | Totals |
| As of December 31, 2014 |
| 2013 accident year | | $ | (33 | ) | | $ | (15 | ) | | $ | (10 | ) | | $ | (58 | ) |
| 2012 accident year | | (7 | ) | | — |
| | (8 | ) | | (15 | ) |
| 2011 accident year | | (9 | ) | | (1 | ) | | (6 | ) | | (16 | ) |
| 2010 accident year | | — |
| | 2 |
| | (5 | ) | | (3 | ) |
| 2009 accident year | | (3 | ) | | — |
| | — |
| | (3 | ) |
| 2008 accident year | | (9 | ) | | — |
| | — |
| | (9 | ) |
| 2007 and prior accident years | | 4 |
| | 2 |
| | — |
| | 6 |
|
| (Favorable)/unfavorable | | $ | (57 | ) | | $ | (12 | ) | | $ | (29 | ) | | $ | (98 | ) |
| | | | | | | | | |
| As of December 31, 2013 |
| 2012 accident year | | $ | (67 | ) | | $ | (27 | ) | | $ | (9 | ) | | $ | (103 | ) |
| 2011 accident year | | (25 | ) | | (13 | ) | | (3 | ) | | (41 | ) |
| 2010 accident year | | (48 | ) | | 1 |
| | (1 | ) | | (48 | ) |
| 2009 accident year | | 13 |
| | 2 |
| | — |
| | 15 |
|
| 2008 accident year | | 9 |
| | (1 | ) | | — |
| | 8 |
|
| 2007 accident year | | (5 | ) | | — |
| | — |
| | (5 | ) |
| 2006 and prior accident years | | 28 |
| | (1 | ) | | — |
| | 27 |
|
| (Favorable)/unfavorable | | $ | (95 | ) | | $ | (39 | ) | | $ | (13 | ) | | $ | (147 | ) |
| | | | | | | | | |
| As of December 31, 2012 |
| 2011 accident year | | $ | (93 | ) | | $ | (60 | ) | | $ | — |
| | $ | (153 | ) |
| 2010 accident year | | (49 | ) | | (16 | ) | | (3 | ) | | (68 | ) |
| 2009 accident year | | (80 | ) | | (11 | ) | | (2 | ) | | (93 | ) |
| 2008 accident year | | (45 | ) | | (5 | ) | | — |
| | (50 | ) |
| 2007 accident year | | (18 | ) | | (3 | ) | | — |
| | (21 | ) |
| 2006 accident year | | (12 | ) | | (1 | ) | | — |
| | (13 | ) |
| 2005 and prior accident years | | 5 |
| | (3 | ) | | — |
| | 2 |
|
| (Favorable)/unfavorable | | $ | (292 | ) | | $ | (99 | ) | | $ | (5 | ) | | $ | (396 | ) |
| | | | | | | | | |
Overall favorable development for consolidated property casualty reserves of
$396$98 million in
20122014 illustrated the potential for revisions inherent in estimating reserves, especially for long-tail lines such as commercial casualty and workers’ compensation. As noted in Critical Accounting Estimates, Key Assumptions
- Loss Reserving,
Page 46, our models predict that actual loss and loss expense emergence will differ from projections, and we do not attempt to monitor or identify such normal variations. The table
showing reserves by segment and lines of business in Property Casualty Loss and Loss Expense Obligations and Reserves
Page 88, shows
reserves by segment and lines of business and the components of gross reserves among case, IBNR and loss expense reserves.
Cincinnati Financial Corporation - 2014 10-K - Page 104
Reserve development on all prior accident years for our commercial casualty line of business netted to an unfavorable $5 million. Favorable reserve development of
$177 million for the commercial casualty line accounted for approximately 60 percent of the commercial lines insurance segment total in 2012, while favorable reserve development of $74$51 million for the workers’ compensation line accounted for
approximately 25nearly 90 percent of
theour commercial lines insurance segment
net total in
2012.2014. Our commercial property line of business experienced $34 million of favorable reserve development on prior accident years recorded during 2014, including $13 million for catastrophe losses. Our commercial auto line of business experienced $39 million of unfavorable reserve development on prior accident years recorded during 2014. Drivers of significant reserve development
for various lines of business are discussed below.
| · | Moderation in commercial casualty trend selections – We saw moderating loss cost trends continue in several commercial casualty coverages, most notably for umbrella liability coverage. A number of factors seem to have played a role, including a slow economic recovery, favorable court decisions, policy form restrictions and claims department initiatives. Accordingly, it is not entirely clear whether these moderating loss cost trends will persist, and our actuaries have responded cautiously to these changes, electing to recognize improvements in trends used for estimating reserves in a progressive, incremental fashion. |
| · | Commercial auto loss emergence – Commercial auto developed slightly unfavorably during calendar year 2012. This line has become troublesome for the industry as a whole, perhaps due to an improving economy. We continue to watch it closely. |
| · | Workers’ compensation trends and initiatives – We continue to see favorable calendar year development for this line. Loss emergence during 2012 was less than expected for nearly every accident year. The trend for payments to be made in future calendar years is down slightly. However, we are watching this line closely, as a sudden increase in trend for future payments has a highly leveraged effect. Initiatives to improve profitability of our workers’ compensation line of business are discussed in Commercial Lines Insurance Results of Operations, Commercial Lines of Business Analysis, Page 60. |
Commercial casualty adverse development for prior accident years – During 2014, we experienced unanticipated claims development on prior accident years, especially for umbrella liability coverage. That included an increase in aggregate paid losses or loss expenses for accident years three or more years old. Those payments emerged at levels higher than we expected, particularly for accident years 2005 and 2007. Considering that new data, our actuaries responded cautiously, and we increased our estimates for IBNR losses and loss expenses for all prior accident years in total. Our products liability coverage within commercial casualty experienced a higher-than-anticipated 2014 increase in paid losses or loss expenses, primarily for more recent prior accident years. That increase, plus an approximately equal increase in reserves, resulted in net unfavorable or adverse development on prior accident years for products liability. In 2014, our medical professional liability coverage within commercial casualty experienced net favorable development on prior accident years, but less so than in 2013, when it was more than twice the annual average of years 2010 through 2012.
Commercial auto loss emergence – Commercial auto continued to develop unfavorably during calendar year 2014. This line of business has been troublesome for the industry as a whole in recent years. As part of the U.S. economic recession of a few years ago, slowing business activity influenced our estimates of reserves for ultimate losses and loss expenses during that period. As the economy slowly recovered, we believe we were slow to recognize some of the higher loss cost effects in current accident year reserve estimates for at least part of that period. As claims that occurred during that period have become more mature, paid and reported loss cost trends resulted in us increasing our reserve estimates. Initiatives to improve profitability of our commercial auto line of business are discussed in Commercial Lines Insurance Results, Commercial Lines of Business Analysis.
Workers’ compensation – We continue to see favorable reserve development, for all prior accident years in aggregate. During 2014, the trend for estimated payments to be made in future calendar years was down slightly. However, we continue to monitor this line closely, as a sudden increase in trend for future payments has a highly leveraged effect. During 2013, paid loss amounts were higher than we expected for several older accident years, and we increased our reserve estimates accordingly. Initiatives to improve profitability of our workers’ compensation line of business are discussed in Commercial Lines Insurance Results, Commercial Lines of Business Analysis.
Favorable development of personal lines
insurance segment reserves illustrates the potential for revisions inherent in estimating reserves.
We continued to see favorableIn 2014, we experienced unfavorable reserve development related to umbrella liability
coverage in the other personal line of business. Among the factors that appeared to be causing moderating loss cost trends were a slow economic recovery,That followed several years of favorable court decisions, policy form restrictions and claims department initiatives.
reserve development.
In consideration of the data’s credibility, we analyze commercial and personal umbrella liability reserves together and then allocate the derived total reserve estimate to the commercial and personal coverages. Consequently, all of the umbrella factors that contributed to commercial lines reserve development also contributed to personal lines reserve development through the other personal line, of which personal umbrella coverages are a part.
For our homeowner line of business, the $52 million favorable reserve development on prior accident years recorded during 2012 was primarily due to a reduction in case reserves for losses, including an $18 million reduction for catastrophe losses. Total homeowner favorable reserve development included $39 million for accident year 2011 and $7 million for accident year 2010.
For the excess and surplus lines insurance segment, the table showing reserves by segment and lines of business in Property Casualty Loss and Loss Expense Obligations and Reserves,
Page 88, shows the components of gross reserves among case, IBNR and loss expense reserves. Total gross reserves were up $45 million from year-end
20112013 primarily due to the increase in premiums and exposures for this segment, as we discussed in Excess and Surplus Lines Insurance
Results of Operations, Page 74.Results. Favorable development during
20122014 of
$5$29 million for excess and surplus lines insurance segment reserves, shown in the table above, illustrates the potential for revisions inherent in estimating reserves. During 2011, we began to rely more heavily on development patterns from our own excess and surplus lines business, contributing to the modest decrease in reserves, especially for the defense and cost containment portion of loss expense reserves.
Cincinnati Financial Corporation - 2014 10-K - Page 105
Life Insurance Policyholder Obligations and Reserves
Gross Life Insurance Policyholder Obligations
Our estimates of life, annuity and disability policyholder obligations reflect future estimated cash payments to be made to policyholders for future policy benefits, policyholders’ account balances and separate account liabilities. These estimates include death and disability income claims, policy surrenders, policy maturities, annuity payments, minimum guarantees on separate account products, commissions and premium taxes offset by expected future deposits and premiums on in-force contracts.
Our estimates of gross life, annuity and disability obligations do not reflect net recoveries from reinsurance agreements. Ceded life reinsurance receivables were
$235$250 million at year-end
2012.2014. As discussed in
20132015 Reinsurance Programs,
Page 95, we purchase reinsurance to mitigate our life insurance risk exposure. At year-end
2012,2014, ceded death benefits represented approximately
44.642.8 percent of our total
gross policy face amounts in force.
These estimated cash outflows are undiscounted with respect to interest. As a result, the sum of the cash outflows for all years of
$4.235$4.776 billion (total of life insurance obligations) exceeds the liabilities recorded in life policy and investment contract reserves and separate accounts for future policy benefits and claims of
$2.943$3.194 billion (total of life insurance policy reserves and separate account policy reserves). Separate account policy reserves make up all but
$27$22 million of separate accounts liabilities.
We have made significant assumptions to determine the estimated undiscounted cash flows of these policies and contracts that include mortality, morbidity, timing of claims, future lapse rates and interest crediting rates. Due to the significance of the assumptions used, the amounts presented could materially differ from actual results.
Gross life policy reserves were
$2.295$2.497 billion at year-end
2012,2014, compared with
$2.214$2.390 billion at year-end
2011.2013. The increase was primarily due to reserves for traditional life insurance contracts. We establish reserves for traditional life insurance policies based on expected expenses, mortality, morbidity, withdrawal rates and investment yields, including a provision for uncertainty. Once these assumptions are established, they generally are maintained throughout the lives of the contracts. We use both our own experience and industry experience adjusted for historical trends in arriving at our assumptions for expected mortality, morbidity and withdrawal rates. We use our own experience and historical trends for setting our assumptions for expected expenses. We base our assumptions for expected investment income on our own experience adjusted for current economic conditions.
We establish reserves for our universal life, deferred annuity and investment contracts equal to the cumulative account balances, which include premium deposits plus credited interest less charges and withdrawals. Some of our universal life insurance policies contain no-lapse guarantee provisions. For these policies, we establish a reserve in addition to the account balance based on expected no-lapse guarantee benefits and expected policy assessments.
We regularly review our life insurance business to ensure that any deferred acquisition cost associated with the business is recoverable and that our actuarial liabilities (life insurance segment reserves) make sufficient provision for future benefits and related expenses.
2013
2015 Reinsurance Programs
A single large loss or an unexpected rise in claims severity or frequency due to a catastrophic event could present us with a liquidity risk. In an effort to control such losses, we avoid marketing property casualty insurance in specific geographic areas and monitor our exposure in certain coastal regions. An example of this is the reduction of our homeowner policies in the southeastern U.S. coastal region in recent years. This area was identified as a major contributor to our catastrophe probable maximum loss estimates and has subsequently been greatly reduced. We also continually review aggregate exposures to huge disasters and purchase reinsurance protection to cover these exposures. We use the Risk Management Solutions (RMS) and Applied Insurance Research (AIR) models to evaluate exposures to a once-in-a-100-year and a once-in-a-250-year event to help determine appropriate reinsurance coverage programs. In conjunction with these activities, we also continue to evaluate information provided by our reinsurance broker. These various sources explore and analyze credible scientific evidence, including the impact of global climate change, which may affect our exposure under insurance policies.
Cincinnati Financial Corporation - 2014 10-K - Page 106
To help determine appropriate reinsurance coverage for hurricane, earthquake and tornado/hail exposures, we use the RMS and AIR models to estimate the probable maximum loss from a single event or multiple events occurring in a one-year period. The models are proprietary in nature, and the vendors that provide them periodically update the models, sometimes resulting in significant changes to their estimate of probable maximum loss. As of the end of
2012,2014, both models indicated that a hurricane event represents our largest amount of exposure to losses. The table below summarizes estimated probabilities and the corresponding probable maximum loss from a single hurricane event occurring in a one-year period, and indicates the effect of such losses on consolidated shareholders’ equity
as ofat December 31,
2012.2014. Net losses are net of reinsurance and income
taxes.| (Dollars in millions) | | RMS | | | AIR | |
| | | | | | | | | Percent | | | | | | | | | Percent | |
| | | Gross | | | Net | | | of total | | | Gross | | | Net | | | of total | |
| Probability as of December 31, 2012 | | Losses | | | Losses | | | equity | | | Losses | | | Losses | | | equity | |
| 2.0% of a 1-in-50 year event | | $ | 555 | | | $ | 75 | | | | 1.4 | % | | $ | 340 | | | $ | 68 | | | | 1.2 | % |
| 1.0% of a 1-in-100 year event | | | 825 | | | | 222 | | | | 4.1 | | | | 502 | | | | 73 | | | | 1.3 | |
| 0.4% of a 1-in-250 year event | | | 1,258 | | | | 504 | | | | 9.2 | | | | 737 | | | | 165 | | | | 3.0 | |
| 0.2% of a 1-in-500 year event | | | 1,673 | | | | 774 | | | | 14.2 | | | | 920 | | | | 284 | | | | 5.2 | |
taxes, and assume our 2015 reinsurance programs apply.
|
| | | | | | | | | | | | | | | | |
| (Dollars in millions) | RMS Model | AIR Model |
| | | | Percent | | | Percent |
| | Gross | Net | of total | Gross | Net | of total |
| Probability at December 31, 2014 | losses | losses | equity | losses | losses | equity |
| 2.0% (1 in 50 year event) | $ | 366 |
| $ | 74 |
| 1.1 | % | $ | 333 |
| $ | 73 |
| 1.1 | % |
| 1.0% (1 in 100 year event) | 563 |
| 80 |
| 1.2 |
| 453 |
| 76 |
| 1.2 |
|
| 0.4% (1 in 250 year event) | 912 |
| 284 |
| 4.3 |
| 722 |
| 161 |
| 2.4 |
|
| 0.2% (1 in 500 year event) | 1,254 |
| 507 |
| 7.7 |
| 883 |
| 265 |
| 4.0 |
|
The modeled losses according to RMS in the table are based on its RiskLink version
11.013.1 catastrophe model and use a
near-termmedium-term storm catalog methodology. The
near-termmedium-term storm catalog theory is a more conservative approach and places a higher weighting on the increased hurricane activity of the past several years, thus producing higher probable maximum loss projections than a longer-term view. The modeled losses according to AIR in the table are based on its AIR Clasic/2 version
1315 catastrophe model and use a long-term methodology. The AIR storm catalog includes decades of documented weather events used in simulations for probable maximum loss projections.
Reinsurance mitigates the risk of highly uncertain exposures and limits the maximum net loss that can arise from large risks or risks concentrated in areas of exposure. Management’s decisions about the appropriate structure of reinsurance protection and level of risk retention are affected by various factors, including changes in our underwriting practices, capacity to retain risks and reinsurance market conditions.
Reinsurance does not relieve us of our obligation to pay covered claims. The financial strength of our reinsurers is important because our ability to recover for losses covered under any reinsurance agreement depends on the financial viability of the reinsurer.
Currently participating on our standard market property and casualty per-risk and per-occurrence programs are Hannover Reinsurance Company, Munich Reinsurance America, Partner Reinsurance Company of the U.S. and Swiss Reinsurance America Corporation, all of which had A.M. Best insurer financial strength ratings of A+ (Superior) or better as of December 31,
2012.2014. Our property catastrophe program is subscribed through a broker by reinsurers from the United States, Bermuda, London and the European markets. The largest participant in our property catastrophe program, representing approximately
4647 percent of total participation, is the Lloyds of London placement that features numerous syndicates, with R.J. Kiln & Company Limited and the Catlin Syndicate taking the largest participations. Other primary participants in our property catastrophe program include Liberty Syndicates,
Alterra, ArgoAxis Specialty, Amlin Re and
MAPFRE RE.Markel Ltd.
Cincinnati Financial Corporation - 2014 10-K - Page 107
The following table shows our five largest property casualty reinsurance receivable amounts by reinsurer at
year-end 2012year‑end 2014 and
2011.2013. USAIG is a joint underwriting association of individual insurance companies that collectively functions as a worldwide aviation insurance market. We terminated our participation in the association after policy year 2002. The A.M. Best insurer financial strength ratings as of
December 31, 2012,the end of the two most recent years are also shown for each those
reinsurers.| (Dollars in millions) | | 2012 | | 2011 |
| Name of reinsurer | | Total
Receivable | | | A.M. Best
Rating | | Total
Receivable | | | A.M. Best
Rating |
| | | | | | | | | | | |
| USAIG | | $ | 106 | | | NA | | $ | 108 | | | NA |
| Munich Reinsurance America | | | 80 | | | A+ | | | 47 | | | A+ |
| Swiss Reinsurance America Corporation | | | 78 | | | A+ | | | 71 | | | A+ |
| General Reinsurance Corporation | | | 33 | | | A++ | | | 36 | | | A++ |
| Partner Reinsurance Company of the U. S. | | | 24 | | | A+ | | | 19 | | | A+ |
reinsurers that are rated by Best.
|
| | | | | | | | | | | | |
| (Dollars in millions) | | 2014 | | 2013 |
| Name of reinsurer | | Total
receivable | | A.M. Best
Rating | | Total
receivable | | A.M. Best
Rating |
| USAIG | | $ | 98 |
| | NA | | $ | 105 |
| | NA |
| Swiss Reinsurance America Corporation | | 57 |
| | A+ | | 57 |
| | A+ |
| Munich Reinsurance America | | 35 |
| | A+ | | 37 |
| | A+ |
Michigan Catastrophic Claims Association
| | 32 |
| | NA | | 28 |
| | NA |
General Reinsurance Corporation
| | 28 |
| | A++ | | 30 |
| | A++ |
| | | | | | | | | |
Primary components of the
20132015 property and casualty reinsurance program include:
Property per risk treaty – The primary purpose of the property treaty is to provide capacity up to $25 million, adequate for the majority of the risks we write. It also includes protection for extra-contractual liability coverage losses. We retain the first $10 million of each loss. Losses between $10 million and $25 million are reinsured at 100 percent. The ceded premium is estimated at $19 million for 2015, compared with $28 million for 2014 and $38 million for 2013. Lower 2015 rates and a $2 million increase in our retention per loss offset the effect of estimates of increased direct written premiums that are subject to the treaty.
Property excess treaty – For 2015, we again purchased a property reinsurance treaty that provides an additional $10 million in protection for property losses. Effective February 1, 2015, we purchased an additional $15 million of coverage. These treaties, along with the property per risk treaty, provides a total of $50 million of protection. The ceded premium is estimated at approximately $6 million for 2015, compared with $4 million for both 2014 and 2013, when the coverage amount was $10 million.
Casualty per occurrence treaty – The casualty treaty provides capacity up to $25 million. Similar to the property treaty, it provides sufficient capacity to cover the vast majority of casualty accounts we insure and also includes protection for extra-contractual liability coverage losses. We retain the first $10 million of each loss. Losses between $10 million and $25 million are reinsured at 100 percent. The ceded premium is estimated at $13 million for 2015, compared with $23 million for 2014 and $30 million for 2013. Lower 2015 rates and a $2 million increase in our retention per loss offset the effect of estimates of increased direct written premiums that are subject to the treaty.
Casualty excess treaty – We purchase a casualty reinsurance treaty that provides an additional $45 million in protection for certain casualty losses. This treaty, along with the casualty per occurrence treaty, provides a total of $70 million of protection for workers’ compensation, extra-contractual liability coverage and clash coverage losses, which would apply when a single occurrence involves multiple policyholders of The Cincinnati Insurance Companies or multiple coverages for one insured. The ceded premium is estimated at approximately $3 million for 2015, similar to the premium for both 2014 and 2013.
Property catastrophe treaty – To protect against catastrophic events such as wind and hail, hurricanes or earthquakes, we purchased property catastrophe reinsurance with a limit up to $600 million. Losses from the same occurrence can now be aggregated into one limit over an 120 hour period and applied to the treaty towards recovery. This is an expansion in coverage over the previous treaty’s 96-hour limitation. The treaty contains one reinstatement provision. For the 2015 treaty, ceded premiums are estimated at $42 million, down from $50 million for 2014, reflecting a $25 million increase in our retention per event, lower rates and minor changes in our share of losses described below. We retain the first $100 million of any loss, and a share of losses up to $600 million, as indicated below:
| · |
| ◦ | Property per risk treaty – The primary purpose of the property treaty is to provide capacity up to $25 million, adequate for the majority of the risks we write. It also includes protection for extra-contractual liability coverage losses. We retain the first $7 million of each loss. Losses between $7 million and $25 million are reinsured at 100 percent. The ceded premium is estimated at $37 million for 2013, compared with $37 million in 2012 and $32 million in 2011. Lower 2013 rates were essentially offset by estimates of higher levels of property coverage direct written premiums that are subject to the treaty. |
| · | Property excess treaty – For 2013, we made our initial purchase of a property reinsurance treaty that provides an additional $10 million in protection for property losses. This treaty, along with the property per risk treaty, provides a total of $35 million of protection. The ceded premium is estimated at approximately $5 million in 2013, and should lower premiums for facultative reinsurance that was formerly obtained for certain individual risks with insured values in excess of $25 million. |
| · | Casualty per occurrence treaty – The casualty treaty provides capacity up to $25 million. Similar to the property treaty, it provides sufficient capacity to cover the vast majority of casualty accounts we insure and also includes protection for extra-contractual liability coverage losses. We retain the first $7 million of each loss. Losses between $7 million and $25 million are reinsured at 100 percent. The ceded premium is estimated at $29 million in 2013, compared with approximately $37 million in 2012 and in 2011. Lower 2013 rates for this treaty were partially offset by estimates of higher levels of liability coverage direct written premiums that are subject to the treaty. |
| · | Casualty excess treaty – We purchase a casualty reinsurance treaty that provides an additional $45 million in protection for certain casualty losses. This treaty, along with the casualty per occurrence treaty, provides a total of $75 million of protection for workers’ compensation, extra-contractual liability coverage and clash coverage losses, which would apply when a single occurrence involves multiple policyholders of The Cincinnati Insurance Companies or multiple coverages for one insured. The ceded premium is estimated at approximately $3 million in 2013, similar to the premium we paid in 2012 and 2011. |
| · | Property catastrophe treaty – To protect against catastrophic events such as wind and hail, hurricanes or earthquakes, we purchased property catastrophe reinsurance with a limit up to $600 million. The treaty contains one reinstatement provision. For the 2013 treaty, ceded premiums are estimated at $60 million, up slightly from approximately $59 million in 2012, primarily due to minor changes in our share of losses described below. We retain the first $75 million of any loss, plus varying shares of losses up to $600 million: |
| o | 61.3 percent of losses between $75 million and $100 million |
| o | 6.85.0 percent of losses between $100 million and $200 million |
| o |
| ◦ | 5.0 percent of losses between $200 million and $300 million |
| o |
| ◦ | 5.0 percent of losses between $300 million and $400 million |
| o |
| ◦ | 5.0 percent of losses between $400 million and $600 million |
| · | Beginning in 2013 we added an alternative reinsurance structure to protect against certain catastrophic events.
Cincinnati Financial Corporation - 2014 10-K - Page 108
Beginning in 2013 we added an alternative reinsurance structure to protect against certain catastrophic events, and a similar structure is in place for 2014 through 2016. For certain exposures in the United States, we arranged for the purchase of collateralized reinsurance funded through the issuance of collateralized risk-linked securities, known as catastrophe bonds. The catastrophe bond arrangements generally provide reinsurance coverage for specific types of losses in specific geographic locations. They are generally designed to supplement coverage provided under the property catastrophe treaty. Effective January 2014, we have a catastrophe bond arrangement providing up to $100 million in reinsurance protection. It expires in January 2017 and provides coverage for severe convective storm losses in certain key core regions as well as supplemental coverage in the event of an earthquake occurring along the New Madrid fault line and faults occurring in the states of Utah, Washington and Oregon.
After reinsurance, and before any applicable benefit from our catastrophe bond, arrangements generally provide reinsurance coverage for specific types of losses in specific geographic locations. They are generally designed to supplement coverage provided under the North American catastrophe treaty. Effective January 2013, we have a catastrophe bond arrangement providing up to $72 million in reinsurance protection. It expires in January 2014 and provides coverage for severe convective storm losses in certain key core regions as well as supplemental coverage in the event of an earthquake occurring along the New Madrid fault line. |
After reinsurance, our maximum exposure to a catastrophic event that causes $700$600 million in covered losses that qualified, in 2013 only, for the collateralized reinsurance described above2015 would be $145$125 million compared with $219$115 million in 2012.for 2014. The largest catastrophe loss event in our history occurred during 2011 from a May 20-27 storm system that included a tornado in Joplin, Missouri, and also significant losses from hail in the Dayton, Ohio, area. Our losses from that storm were estimated at December 31, 2012,2014, to be $231$225 million before reinsurance.
Individual risks with insured values in excess of
$35$50 million, as identified in the policy, are handled through a different reinsurance mechanism. We typically reinsure property coverage for individual risks with insured values between
$35$50 million and $65 million under an automatic facultative agreement. For risks with property values exceeding $65 million, we negotiate the purchase of facultative coverage on an individual certificate basis. For casualty coverage on individual risks with limits exceeding $25 million, facultative reinsurance coverage is placed on an individual certificate basis. For risks with
property or casualty limits that are between
$35$25 million and
$37$27 million, we sometimes forego facultative reinsurance and retain an additional $2 million of loss exposure.
Terrorism coverage at various levels has been secured in most of our reinsurance agreements. The broadest coverage for this peril is found in the property and casualty working treaties, the property per risk treaty and the casualty per occurrence treaty, which provide coverage for commercial and personal risks. Our property catastrophe treaty provides terrorism coverage for personal risks, and coverage for commercial risks with total insured values of
$10$13 million or less. For insured values between
$10$13 million and
$25$50 million, there also may be coverage in the property working treaty.
A form of reinsurance is also provided through The Terrorism Risk Insurance Act of 2002 (TRIA). TRIA was originally signed into law on November 26, 2002, and extended on December 22, 2005, in a revised form, and extended again on December 26,
2007.2007, and January 12, 2015. TRIA provides a temporary federal backstop for losses related to the writing of the terrorism peril in property casualty insurance policies.
TRIA now is scheduled to expire December 31, 2014. Under regulations promulgated under this statute, insurers are required to offer terrorism coverage for certain lines of property casualty insurance, including property, commercial multi-peril, fire, ocean marine, inland marine, liability, aircraft and workers’ compensation. In the event of a terrorism event defined by TRIA, the federal government would reimburse terrorism claim payments subject to the insurer’s deductible. The deductible is calculated as a percentage of subject written premiums for the preceding calendar year. Our deductible in
20122014 was
$383$459 million (20 percent of
20112013 subject premiums), and we estimate it is
$416$494 million (20 percent of
20122014 subject premiums)
in 2013.for 2015.
Reinsurance protection for the company’s surety business is covered under separate treaties with many of the same reinsurers that write the property casualty working treaties.
The Cincinnati Specialty Underwriters Insurance Company has separate property and casualty reinsurance treaties for
20132014 through
its parent, The Cincinnati Insurance Company. Primary components of the treaties include:
| · | Property per risk treaty – The property treaty provides limits up to $5 million, which is adequate capacity for the risk profile we insure. It also includes protection for extra-contractual liability coverage losses. Cincinnati Specialty Underwriters retains the first $500,000 of any policy loss. Losses between $500,000 and $5 million are reinsured at 100 percent by Cincinnati Insurance. |
| · | Casualty treaties – The casualty treaty is written on an excess of loss basis and provide limits up to $6 million, which is adequate capacity for the risk profile we insure. A second treaty layer of $5 million excess of $6 million is written to provide coverage for extra contractual obligations or clash exposures. The maximum retention for any one casualty loss is $1 million by Cincinnati Specialty Underwriters. Losses between $1 million and $11 million are reinsured at 100 percent by Cincinnati Insurance. |
| · | Basket retention – Cincinnati Specialty Underwriters has purchased this coverage to limit our retention to $1 million in the event that the same occurrence results in both a property and a casualty loss. |
| · | Property catastrophe treaty – As a subsidiary of Cincinnati Insurance, Cincinnati Specialty Underwriters has been added as a named insured under our corporate property catastrophe treaty, and for our collateralized reinsurance funded through the issuance of catastrophe bonds. All terms and conditions of this reinsurance coverage apply to policies underwritten by Cincinnati Specialty Underwriters. |
Property per risk treaty – The property treaty provides limits up to $5 million, which is adequate capacity for the risk profile we insure. It also includes protection for extra-contractual liability coverage losses. Cincinnati Specialty Underwriters retains the first $500,000 of any policy loss. Losses between $500,000 and $5 million are reinsured at 100 percent by Cincinnati Insurance.
Casualty treaties – The casualty treaty is written on an excess of loss basis and provide limits up to $6 million, which is adequate capacity for the risk profile we insure. A second treaty layer of $5 million excess of $6 million is written to provide coverage for extra contractual obligations or clash exposures. The maximum retention for any one casualty loss is $1 million by Cincinnati Specialty Underwriters. Losses between $1 million and $6 million are reinsured at 100 percent by Cincinnati Insurance.
Cincinnati Financial Corporation - 2014 10-K - Page 109
Basket retention – Cincinnati Specialty Underwriters has purchased this coverage to limit our retention to $1 million in the event that the same occurrence results in both a property and a casualty loss.
Property catastrophe treaty – As a subsidiary of Cincinnati Insurance, Cincinnati Specialty Underwriters is a named insured under our corporate property catastrophe treaty, and for our collateralized reinsurance funded through the issuance of catastrophe bonds. All terms and conditions of this reinsurance coverage apply to policies underwritten by Cincinnati Specialty Underwriters.
For property risks with limits exceeding $5 million or casualty risks with limits exceeding $6 million, underwriters place facultative reinsurance coverage on an individual certificate basis.
Cincinnati Life, our life insurance subsidiary, purchases reinsurance under separate treaties with many of the same reinsurers that write the property casualty working treaties. For our core term life insurance line of business, we retain no more than a $500,000 exposure on a single policy, ceding the balance using excess over retention mortality coverage and retaining the policy reserve. Because of the conservative nature of statutory reserving principles, retaining the policy reserve unduly depresses our statutory earnings and requires a large commitment of our capital. Our corporate retention is $1 million on a single life. For term life insurance business written prior to 2005, we retain 10 percent to 25 percent of each term policy, not to exceed $500,000, ceding the balance of mortality risk and policy reserve.
The following table shows our five largest life reinsurance receivable amounts by reinsurer at year-end 2014 and 2013. The A.M. Best insurer financial strength ratings as of the end of the two most recent years are also shown for each those reinsurers that are rated by Best.
|
| | | | | | | | | | | | |
| (Dollars in millions) | �� | 2014 | | 2013 |
| Name of reinsurer | | Total
receivable | | A.M. Best
Rating | | Total
receivable | | A.M. Best
Rating |
| Swiss Re Life & Health America, Inc. | | $ | 90 |
| | A+ | | $ | 89 |
| | A+ |
| Lincoln National Life Insurance Company | | 43 |
| | A+ | | 42 |
| | A+ |
| Security Life of Denver Insurance Company | | 30 |
| | A | | 28 |
| | A |
General Re Life Corporation
| | 30 |
| | A++ | | 27 |
| | A++ |
| Employers Reassurance Corporation | | 15 |
| | A- | | 14 |
| | A- |
| | | | | | | | | |
We also have catastrophe reinsurance coverage on our life insurance operations that reimburses us for covered net losses in excess of $9 million. Our recovery is capped at $75 million for losses involving our associates.
The Cincinnati Insurance Company’s reinsurance program for
20132015 includes participation in two assumed reinsurance treaties with R.J. Kiln & Company Limited, a reinsurer that spreads its losses to its property book of business among many reinsurers. The exposure to loss is usually triggered as a result of very high catastrophe losses. The First Surplus treaty has exposure for us of up to nearly $2 million of assumed losses from a single event and the Second Surplus treaty
also has exposure for us of up to nearly
$3$2 million of assumed losses from a single event. The treaties with Kiln Group Limited were in place during
20122014 at
similarslightly higher exposure levels.
Cincinnati Financial Corporation - 2014 10-K - Page 110
This is our “Safe Harbor” statement under the Private Securities Litigation Reform Act of 1995. Our business is subject to certain risks and uncertainties that may cause actual results to differ materially from those suggested by the forward-looking statements in this report. Some of those risks and uncertainties are discussed in Item 1A, Risk
Factors, Page 26.Factors.
Factors that could cause or contribute to such differences include, but are not limited to:
Unusually high levels of catastrophe losses due to risk concentrations, changes in weather patterns, environmental events, terrorism incidents or other causes
Increased frequency and/or severity of claims or development of claims that are unforeseen at the time of policy issuance
Inadequate estimates or assumptions used for critical accounting estimates
Declines in overall stock market values negatively affecting the company’s equity portfolio and book value
Domestic and global events resulting in capital market or credit market uncertainty, followed by prolonged periods of economic instability or recession, that lead to:
| · | Unusually high levels of catastrophe losses due to risk concentrations, changes in weather patterns, environmental events, terrorism incidents or other causes |
| · | Increased frequency and/or severity of claims |
| · | Inadequate estimates or assumptions used for critical accounting estimates |
| · | Recession or other economic conditions resulting in lower demand for insurance products or increased payment delinquencies |
| · | Declines in overall stock market values negatively affecting the company’s equity portfolio and book value |
| · | Events resulting in capital market or credit market uncertainty, followed by prolonged periods of economic instability or recession, that lead to: |
| o◦ | Significant or prolonged decline in the value of a particular security or group of securities and impairment of the asset(s) |
| o |
| ◦ | Significant decline in investment income due to reduced or eliminated dividend payouts from a particular security or group of securities |
| o |
| ◦ | Significant rise in losses from surety and director and officer policies written for financial institutions or other insured entities |
Prolonged low interest rate environment or other factors that limit the company’s ability to generate growth in investment income or interest rate fluctuations that result in declining values of fixed-maturity investments, including declines in accounts in which we hold bank-owned life insurance contract assets
Recession or other economic conditions resulting in lower demand for insurance products or increased payment delinquencies
Difficulties with technology or data security breaches, including cyberattacks, that could negatively affect our ability to conduct business and our relationships with agents, policyholders and others
Disruption of the insurance market caused by technology innovations such as driverless cars that could decrease consumer demand for insurance products
Delays or performance inadequacies from ongoing development and implementation of underwriting and pricing methods, including telematics and other usage-based insurance methods, or technology projects and enhancements expected to increase our pricing accuracy, underwriting profit and competitiveness
Increased competition that could result in a significant reduction in the company’s premium volume
Changing consumer insurance-buying habits and consolidation of independent insurance agencies that could alter our competitive advantages
Inability to obtain adequate reinsurance on acceptable terms, amount of reinsurance purchased, financial strength of reinsurers and the potential for nonpayment or delay in payment by reinsurers
Inability to defer policy acquisition costs for any business segment if pricing and loss trends would lead management to conclude that segment could not achieve sustainable profitability
Inability of our subsidiaries to pay dividends consistent with current or past levels
Events or conditions that could weaken or harm the company’s relationships with its independent agencies and hamper opportunities to add new agencies, resulting in limitations on the company’s opportunities for growth, such as:
| · | Prolonged low interest rate environment or other factors that limit the company’s ability to generate growth in investment income or interest rate fluctuations that result in declining values of fixed-maturity investments, including declines in accounts in which we hold bank-owned life insurance contract assets |
| · | Increased competition that could result in a significant reduction in the company’s premium volume |
| · | Delays or performance inadequacies from ongoing development and implementation of underwriting and pricing methods or technology projects and enhancements expected to increase our pricing accuracy, underwriting profit and competitiveness |
| · | Changing consumer insurance-buying habits and consolidation of independent insurance agencies that could alter our competitive advantages |
| · | Inability to obtain adequate reinsurance on acceptable terms, amount of reinsurance purchased, financial strength of reinsurers and the potential for nonpayment or delay in payment by reinsurers |
| · | Difficulties with technology or data security breaches, including cyber attacks, that could negatively affect our ability to conduct business and our relationships with agents, policyholders and others |
| · | Inability to defer policy acquisition costs for any business segment if pricing and loss trends would lead management to conclude that segment could not achieve sustainable profitability |
| · | Events or conditions that could weaken or harm the company’s relationships with its independent agencies and hamper opportunities to add new agencies, resulting in limitations on the company’s opportunities for growth, such as: |
| o◦ | Downgrades of the company’s financial strength ratings |
| o |
| ◦ | Concerns that doing business with the company is too difficult |
| o |
| ◦ | Perceptions that the company’s level of service, particularly claims service, is no longer a distinguishing characteristic in the marketplace |
| · |
| ◦ | Actions of insurance departments, state attorneys generalInability or other regulatory agencies, including a changeunwillingness to a federal system of regulation from a state-based system, that:nimbly develop and introduce coverage product updates and innovations that our competitors offer and consumers expect to find in the marketplace |
Cincinnati Financial Corporation - 2014 10-K - Page 111
Actions of insurance departments, state attorneys general or other regulatory agencies, including a change to a federal system of regulation from a state-based system, that:
| o |
| ◦ | Impose new obligations on us that increase our expenses or change the assumptions underlying our critical accounting estimates |
| o |
| ◦ | Place the insurance industry under greater regulatory scrutiny or result in new statutes, rules and regulations |
| o |
| ◦ | Restrict our ability to exit or reduce writings of unprofitable coverages or lines of business |
| o |
| ◦ | Add assessments for guaranty funds, other insurance related assessments or mandatory reinsurance arrangements; or that impair our ability to recover such assessments through future surcharges or other rate changes |
| o |
| ◦ | Increase our provision for federal income taxes due to changes in tax law |
| o |
| ◦ | Increase our other expenses |
| o |
| ◦ | Limit our ability to set fair, adequate and reasonable rates |
| o |
| ◦ | Place us at a disadvantage in the marketplace |
| o |
| ◦ | Restrict our ability to execute our business model, including the way we compensate agents |
| · | Adverse outcomes from litigation or administrative proceedings |
| · | Events or actions, including unauthorized intentional circumvention of controls, that reduce the company’s future ability to maintain effective internal control over financial reporting under the Sarbanes-Oxley Act of 2002 |
| · | Unforeseen departure of certain executive officers or other key employees due to retirement, health or other causes that could interrupt progress toward important strategic goals or diminish the effectiveness of certain longstanding relationships with insurance agents and others |
| · | Events, such as an epidemic, natural catastrophe or terrorism, that could hamper our ability to assemble our workforce at our headquarters location |
Adverse outcomes from litigation or administrative proceedings
Events or actions, including unauthorized intentional circumvention of controls, that reduce the company’s future ability to maintain effective internal control over financial reporting under the Sarbanes-Oxley Act of 2002
Unforeseen departure of certain executive officers or other key employees due to retirement, health or other causes that could interrupt progress toward important strategic goals or diminish the effectiveness of certain longstanding relationships with insurance agents and others
Events, such as an epidemic, natural catastrophe or terrorism, that could hamper our ability to assemble our workforce at our headquarters location
Further, the company’s insurance businesses are subject to the effects of changing social,
global, economic and regulatory environments. Public and regulatory initiatives have included efforts to adversely influence and restrict premium rates, restrict the ability to cancel policies, impose underwriting standards and expand overall regulation. The company also is subject to public and regulatory initiatives that can affect the market value for its common stock, such as measures affecting corporate financial reporting and governance. The ultimate changes and eventual effects, if any, of these initiatives are uncertain.
Item 7A.
Cincinnati Financial Corporation - 2014 10-K - Page 112
ITEM 7A. Quantitative and Qualitative Disclosures About Market Risk
Market risk is the potential for a decrease in securities value resulting from broad yet uncontrollable forces such as: inflation, economic growth, interest rates, world political conditions or other widespread unpredictable events. It is comprised of many individual risks that, when combined, create a macroeconomic impact. The company accepts and manages risks in the investment portfolio as part of the means of achieving portfolio objectives. Some of the risks are:
| · | Political – the potential for a decrease in value due to the real or perceived impact of governmental policies or conditions |
| · | Regulatory – the potential for a decrease in value due to the impact of legislative proposals or changes in laws or regulations |
| · | Economic – the potential for a decrease in value due to changes in general economic factors (recession, inflation, deflation, etc.) |
| · | Revaluation – the potential for a decrease in value due to a change in relative value (change in market multiple) of the market brought on by general economic factors |
| · | Interest-rate – the potential for a decrease in value of a security or portfolio due to its sensitivity to changes (increases or decreases) in the general level of interest rates |
| · | Company-specific risk – the potential for a particular issuer to experience a decline in value due to the impact of sector or market risk on the holding or because of issues specific to the firm |
| · | Fraud – the potential for a negative impact on an issuer’s performance due to actual or alleged illegal or improper activity of individuals it employs |
| · | Credit – the potential for deterioration in an issuer’s financial profile due to specific company issues, problems it faces in the course of its operations or industry-related issues |
| · | Default – the possibility that an issuer will not make a required payment (interest payment or return of principal) on its debt. Generally this occurs after its financial profile has deteriorated (credit risk) and it no longer has the means to make its payments. |
Political – the potential for a decrease in value due to the real or perceived impact of governmental policies or conditions
Regulatory – the potential for a decrease in value due to the impact of legislative proposals or changes in laws or regulations
Economic – the potential for a decrease in value due to changes in general economic factors (recession, inflation, deflation, etc.)
Revaluation – the potential for a decrease in value due to a change in relative value (change in market multiple) of the market brought on by general economic factors
Interest-rate – the potential for a decrease in value of a security or portfolio due to its sensitivity to changes (increases or decreases) in the general level of interest rates
Company-specific risk – the potential for a particular issuer to experience a decline in value due to the impact of sector or market risk on the holding or because of issues specific to the firm
Fraud – the potential for a negative impact on an issuer’s performance due to actual or alleged illegal or improper activity of individuals it employs
Credit – the potential for deterioration in an issuer’s financial profile due to specific company issues, problems it faces in the course of its operations or industry-related issues
Default – the possibility that an issuer will not make a required payment (interest payment or return of principal) on its debt. Generally this occurs after its financial profile has deteriorated (credit risk) and it no longer has the means to make its payments.
The investment committee of the board of directors monitors the investment risk management process primarily through its executive oversight of our investment activities. We take an active approach to managing market and other investment risks, including the accountabilities and controls over these activities. Actively managing these market risks is integral to our operations and could require us to change the character of future investments purchased or sold or require us to shift the existing asset portfolios to manage exposure to market risk within acceptable ranges.
Sector risk is the potential for a negative impact on a particular industry due to its sensitivity to factors that make up market risk. Market risk affects general supply/demand factors for an industry and affects companies within that industry to varying degrees.
Risks associated with the
five asset classes described in Item 1,
Our Segments, Investments Segment,
Page 20, can be summarized as follows (H – high, A – average, L – low):
|
| | | | | | | | |
| | | Taxable
fixed maturities | | Tax-exempt
fixed maturities | | Common
equities | | PreferredNonredeemable preferred
equities |
| Political | | A | | H | | A | | A |
| Regulatory | | A | | A | | A | | A |
| Economic | | A | | A | | H | | A |
| Revaluation | | A | | A | | H | | A |
| Interest rate | | H | | H | | A | | H |
| Fraud | | A | | L | | A | | A |
| Credit | | A | | L | | A | | A |
| Default | | A | | L | | A | | A |
| | | | | | | | |
Cincinnati Financial Corporation - 2014 10-K - Page 113
Our investment portfolio had no European sovereign debt holdings but did include a relatively small amount of other European-based securities. The December 31,
2012,2014, fair value total of
$504$417 million consisted of fixed-maturity securities. The table below summarizes amounts for those securities by country.
| (In millions) | | At December 31, 2012 | |
| | | Financial | | | Nonfinancial | | | Total | |
| | | Amortized | | | Fair | | | Amortized | | | Fair | | | Amortized | | | Fair | |
| | | cost | | | value | | | cost | | | value | | | cost | | | value | |
| Great Britain | | $ | 44 | | | $ | 47 | | | $ | 118 | | | $ | 130 | | | $ | 163 | | | $ | 178 | |
| Netherlands | | | 35 | | | | 37 | | | | 24 | | | | 29 | | | | 59 | | | | 66 | |
| France | | | 28 | | | | 28 | | | | 10 | | | | 10 | | | | 38 | | | | 39 | |
| Switzerland | | | 32 | | | | 35 | | | | 3 | | | | 4 | | | | 35 | | | | 38 | |
| Belgium | | | 0 | | | | 0 | | | | 29 | | | | 35 | | | | 28 | | | | 35 | |
| Sweden | | | 14 | | | | 15 | | | | 13 | | | | 14 | | | | 27 | | | | 28 | |
| Germany | | | 8 | | | | 8 | | | | 17 | | | | 17 | | | | 25 | | | | 25 | |
| Luxembourg | | | 0 | | | | 0 | | | | 21 | | | | 22 | | | | 21 | | | | 22 | |
| Ireland | | | 6 | | | | 6 | | | | 12 | | | | 14 | | | | 18 | | | | 20 | |
| Spain | | | 5 | | | | 6 | | | | 12 | | | | 12 | | | | 17 | | | | 18 | |
| Italy | | | 0 | | | | 0 | | | | 17 | | | | 18 | | | | 17 | | | | 18 | |
| Greece | | | 0 | | | | 0 | | | | 16 | | | | 17 | | | | 16 | | | | 17 | |
| Total European exposure | | $ | 172 | | | $ | 182 | | | $ | 292 | | | $ | 322 | | | $ | 464 | | | $ | 504 | |
|
| | | | | | | | | | | | | | | | | | | | | | | | |
| (Dollars in millions) | | Financial | | Nonfinancial | | Total |
| | | Amortized | | Fair | | Amortized | | Fair | | Amortized | | Fair |
| | | cost | | value | | cost | | value | | cost | | value |
| Great Britain | | $ | 36 |
| | $ | 40 |
| | $ | 83 |
| | $ | 89 |
| | $ | 119 |
| | $ | 129 |
|
| Netherlands | | 35 |
| | 36 |
| | 26 |
| | 29 |
| | 61 |
| | 65 |
|
| Switzerland | | 17 |
| | 18 |
| | 24 |
| | 25 |
| | 41 |
| | 43 |
|
| Sweden | | 19 |
| | 19 |
| | 13 |
| | 13 |
| | 32 |
| | 32 |
|
| Belgium | | — |
| | — |
| | 28 |
| | 32 |
| | 28 |
| | 32 |
|
| France | | 12 |
| | 12 |
| | 12 |
| | 13 |
| | 24 |
| | 25 |
|
| Spain | | 5 |
| | 6 |
| | 18 |
| | 19 |
| | 23 |
| | 25 |
|
| Germany | | 8 |
| | 8 |
| | 13 |
| | 13 |
| | 21 |
| | 21 |
|
| Luxembourg | | — |
| | — |
| | 18 |
| | 19 |
| | 18 |
| | 19 |
|
| Ireland | | — |
| | — |
| | 12 |
| | 14 |
| | 12 |
| | 14 |
|
| Italy | | — |
| | — |
| | 11 |
| | 12 |
| | 11 |
| | 12 |
|
| Total European exposure | | $ | 132 |
| | $ | 139 |
| | $ | 258 |
| | $ | 278 |
| | $ | 390 |
| | $ | 417 |
|
| | | | | | | | | | | | | |
Fixed-Maturity
Securities Investments
For investment-grade corporate bonds, the inverse relationship between interest rates and bond prices leads to falling bond values during periods of increasing interest rates. We address this risk by attempting to construct a generally laddered maturity schedule that allows us to reinvest cash flows at prevailing rates. Although the potential for a worsening financial condition, and ultimately default, does exist with investment-grade corporate bonds, we address this risk by performing credit analysis and monitoring as well as maintaining a diverse portfolio of holdings.
The primary risk related to high-yield corporate bonds is credit risk or the potential for a deteriorating financial structure. A weak financial profile can lead to rating downgrades from the credit rating agencies, which can put further downward pressure on bond prices. Interest rate risk, while significant, is less of a factor with high-yield corporate bonds, as valuation is related more directly to underlying operating performance than to general interest rates. This puts more emphasis on the financial results achieved by the issuer rather than on general economic trends or statistics within the marketplace. We address this concern by analyzing issuer- and industry-specific financial results and by closely monitoring holdings within this asset class.
The primary risks related to tax-exempt bonds are interest rate risk and political risk associated with the specific economic environment within the political boundaries of the issuing municipal entity. We address these concerns by focusing on municipalities’ general-obligation debt and on essential-service bonds. Essential-service bonds derive a revenue stream from municipal services that are vital to the people living in the area (water service, sewer service, etc.). Another risk related to tax-exempt bonds is regulatory risk or the potential for legislative changes that would negate the benefit of owning tax-exempt bonds. We monitor regulatory activity for situations that may negatively affect current holdings and our ongoing strategy for investing in these securities.
The final, less significant risk is our exposure to credit risk for a portion of the tax-exempt portfolio that has support from corporate entities. Examples are bonds insured by corporate bond insurers or bonds with interest payments made by a corporate entity through a municipal conduit/authority. Our decisions regarding these investments primarily consider the underlying municipal situation. The existence of third-party insurance is intended to reduce risk in the event of default. In circumstances in which the municipality is unable to meet its obligations, risk would be increased if the insuring entity were experiencing financial duress. Because of our diverse exposure and selection of higher-rated entities with strong financial profiles, we do not believe this is a material concern as we discuss in Item 1, Our Segments, Investments Segment,Segment.
Cincinnati Financial Corporation - 2014 10-K - Page
20.114
Interest Rate Sensitivity Analysis
Because of our strong shareholders’ equity, long-term investment horizon and ability to hold most fixed-maturity investments to maturity, we believe the company is well positioned if interest rates were to rise. A higher rate environment would provide the opportunity to invest cash flow in higher-yielding securities, while reducing the likelihood of untimely redemptions of currently callable securities. While higher interest rates would be expected to increase the number of fixed-maturity holdings fair valued below 100 percent of amortized cost, we believe lower fixed-maturity security values due solely to interest rate changes would not signal a decline in credit quality.
Our dynamic financial planning model uses analytical tools to assess market risks. As part of this model, the effective duration of the fixed-maturity portfolio is continually monitored by our investment department to evaluate the theoretical impact of interest rate movements.
The table below summarizes the effect of hypothetical changes in interest rates on
thefair value of our fixed-maturity
portfolio:| (In millions) | | Interest rate shift in basis points | |
| | | -200 | | | -100 | | | 0 | | | 100 | | | 200 | |
| At December 31, 2012 | | $ | 9,888 | | | $ | 9,479 | | | $ | 9,093 | | | $ | 8,704 | | | $ | 8,320 | |
| | | | | | | | | | | | | | | | | | | | | |
| At December 31, 2011 | | $ | 9,597 | | | $ | 9,179 | | | $ | 8,779 | | | $ | 8,390 | | | $ | 8,008 | |
portfolio.
|
| | | | | | | | | | | | | | | | | | | | |
| (Dollars in millions) | | Effect from interest rate change in basis points |
| | | -200 | | -100 | | — | | 100 | | 200 |
| At December 31, 2014 | | $ | 10,321 |
| | $ | 9,882 |
| | $ | 9,460 |
| | $ | 9,041 |
| | $ | 8,628 |
|
| At December 31, 2013 | | $ | 9,968 |
| | $ | 9,545 |
| | $ | 9,121 |
| | $ | 8,708 |
| | $ | 8,316 |
|
| | | | | | | | | | | |
The effective duration of the fixed-maturity portfolio was
4.2 years at year-end 2012, compared with 4.4 years at year-end
2011.2014, compared with 4.5 years at year-end 2013. A 100-basis-point movement in interest rates would result in an approximately
4.34.4 percent change in the fair value of the fixed-maturity portfolio. Generally speaking, the higher a bond is rated, the more directly correlated movements in its fair value are to changes in the general level of interest rates, exclusive of call features. The fair values of average- to lower-rated corporate bonds are additionally influenced by the expansion or contraction of credit spreads.
In the dynamic financial planning model, the selected interest rate change of 100 to 200 basis points represents our views of a shift in rates that is quite possible over a one-year period. The rates modeled should not be considered a prediction of future events as interest rates may be much more volatile in the future. The analysis is not intended to provide a precise forecast of the effect of changes in rates on our results or financial condition, nor does it take into account any actions that we might take to reduce exposure to such risks.
Equity
Securities Investments
Common stocks are subject to a variety of risk factors encompassed under the umbrella of market risk. General economic swings influence the performance of the underlying industries and companies within those industries.
In 2008 for example, a downturn in the economy had a negative effect on an equity portfolio. Industry- and company-specific risks also have the potential to substantially affect the value of our portfolio.
We implemented newOur investment guidelines
in 2008 to help address these risks by diversifying the portfolio and establishing parameters to help manage exposures.
The table below summarizes the effect of hypothetical changes in market prices on fair value of our equity portfolio.
|
| | | | | | | | | | | | | | | | | | | | | | | | | | | | |
| (Dollars in millions) | Effect from market price change in percent |
| | | -30% | | -20% | | -10% | | — | | 10% | | 20% | | 30% |
| At December 31, 2014 | | $ | 3,401 |
| | $ | 3,886 |
| | $ | 4,372 |
| | $ | 4,858 |
| | $ | 5,344 |
| | $ | 5,830 |
| | $ | 6,315 |
|
| At December 31, 2013 | | $ | 3,063 |
| | $ | 3,500 |
| | $ | 3,938 |
| | $ | 4,375 |
| | $ | 4,813 |
| | $ | 5,250 |
| | $ | 5,688 |
|
| | | | | | | | | | | | | | | |
Our equity holdings represented
$3.373$4.858 billion in fair value and accounted for approximately
5478 percent of the
net unrealized
appreciationgains and losses of the entire portfolio at year-end
2012.2014. No holding had a fair value equal to or greater than 4 percent of our $4.679 billion publicly traded common stock portfolio. We had 17 holdings among eight different sectors each with a fair value greater than $100 million. See Item 1,
Our Segments, Investments Segment
Page 20,and Item 8, Note 2 of the Consolidated Financial Statements, for additional details on our holdings.
The primary risks related to preferred stocks are similar to those related to investment grade corporate bonds. Rising interest rates adversely affect market values due to the normal inverse relationship between interest rates
Cincinnati Financial Corporation - 2014 10-K - Page 115
and bond prices. Credit risk exists due to the subordinate position of preferred stocks in the capital structure. We minimize this risk by primarily purchasing investment grade preferred stocks of issuers with a strong history of paying a common stock dividend.
Application of Asset Impairment Policy
As discussed in Item 7, Critical Accounting Estimates, Asset Impairment,
Page 47, our fixed-maturity and equity investment portfolios are evaluated differently for other-than-temporary impairments. The company’s asset impairment committee monitors a number of significant factors for indications of investments fair valued below the carrying amount may not be recoverable. The application of our impairment policy resulted in OTTI charges that reduced our income before income taxes by
$24 million in 2014, $2 million in 2013 and $33 million in
2012, $57 million in 2011 and $36 million in 2010.2012. Impairments are discussed in Item 7,
Investment Results of Operations, Page 79.Investments Results.
We expect the number of securities fair valued below 100 percent of cost or amortized cost to fluctuate as interest rates rise or fall and credit spreads expand or contract due to prevailing economic conditions. Further, cost or amortized cost for some securities have been revised due to impairment charges recognized in prior periods. At year-end
2012, 682014, 223 of the
2,7843,015 securities we owned were fair valued below 100 percent of cost or amortized cost compared with
137556 of the
2,7242,879 securities we owned at year-end
20112013 and
31668 of the
2,6712,784 securities we owned at year-end
2010.2012.
The
68223 holdings fair valued below cost or amortized cost at year-end
20122014 represented
1.95.9 percent of the investment portfolio and
$13$22 million in unrealized losses.
| · | 62 of these holdings were fair valued between 90 percent and 100 percent of cost or amortized cost. The value of these securities fluctuates primarily because of changes in interest rates. The fair value of these 62 securities was $224 million at year-end 2012, and they accounted for $8 million in unrealized losses. |
| · | Six of these holdings were fair valued between 70 percent and 90 percent of cost or amortized cost. The fair value of these holdings was $16 million, and they accounted for $5 million in unrealized losses. |
| · | No securities were trading below 70 percent of cost at year-end 2012. |
217 of these holdings were fair valued between 90 percent and 100 percent of cost or amortized cost. The value of these securities fluctuates primarily because of changes in interest rates. The fair value of these 217 securities was $815 million at year-end 2014, and they accounted for $19 million in unrealized losses.
Six of these holdings were fair valued between 70 percent and 90 percent of cost or amortized cost. The fair value of these holdings was $24 million, and they accounted for $3 million in unrealized losses.
No securities were trading below 70 percent of cost at year-end 2014.
Cincinnati Financial Corporation - 2014 10-K - Page 116
The following table summarizes the length of time securities in the investment portfolio have been in a continuous unrealized
gain or loss position.
| (In millions) | | Less than 12 months | | | 12 months or more | | | Total | |
| At December 31, 2012 | | Fair
value | | | Unrealized
losses | | | Fair
value | | | Unrealized
losses | | | Fair
value | | | Unrealized
losses | |
| Fixed maturities: |
| States, municipalities and political subdivisions | | $ | 53 | | | $ | 1 | | | | - | | | $ | - | | | $ | 53 | | | $ | 1 | |
| Government-sponsored enterprises | | | 1 | | | | - | | | | - | | | | - | | | | 1 | | | | - | |
| Corporate securities | | | 58 | | | | 1 | | | | 17 | | | | 1 | | | | 75 | | | | 2 | |
| Subtotal | | | 112 | | | | 2 | | | | 17 | | | | 1 | | | | 129 | | | | 3 | |
| Equity securities: | | | | | | | | | | | | | | | | | | | | | | | | |
| Common equities | | | 107 | | | | 9 | | | | - | | | | - | | | | 107 | | | | 9 | |
| Preferred equities | | | 4 | | | | 1 | | | | - | | | | - | | | | 4 | | | | 1 | |
| Subtotal | | | 111 | | | | 10 | | | | - | | | | - | | | | 111 | | | | 10 | |
| Total | | $ | 223 | | | $ | 12 | | | $ | 17 | | | $ | 1 | | | $ | 240 | | | $ | 13 | |
| | | | | | | | | | | | | | | | | | | | | | | | | |
| At December 31, 2011 | | | | | | | | | | | | | | | | | | | | | | | | |
| Fixed maturities: |
| States, municipalities and political subdivisions | | $ | - | | | $ | - | | | $ | 12 | | | $ | - | | | $ | 12 | | | $ | - | |
| United States government | | | 1 | | | | - | | | | - | | | | - | | | | 1 | | | | - | |
| Government-sponsored enterprises | | | 10 | | | | - | | | | - | | | | - | | | | 10 | | | | - | |
| Corporate securities | | | 380 | | | | 13 | | | | 57 | | | | 5 | | | | 437 | | | | 18 | |
| Subtotal | | | 391 | | | | 13 | | | | 69 | | | | 5 | | | | 460 | | | | 18 | |
| Equity securities: | | | | | | | | | | | | | | | | | | | | | | | | |
| Common equities | | | 333 | | | | 35 | | | | - | | | | - | | | | 333 | | | | 35 | |
| Preferred equities | | | 5 | | | | - | | | | 19 | | | | - | | | | 24 | | | | - | |
| Subtotal | | | 338 | | | | 35 | | | | 19 | | | | - | | | | 357 | | | | 35 | |
| Total | | $ | 729 | | | $ | 48 | | | $ | 88 | | | $ | 5 | | | $ | 817 | | | $ | 53 | |
|
| | | | | | | | | | | | | | | | | | | | | | | | |
| (Dollars in millions) | | Less than 12 months | | 12 months or more | | Total |
| At December 31, 2014 | | Fair
value | | Unrealized
losses | | Fair
value | | Unrealized
losses | | Fair
value | | Unrealized
losses |
| Fixed maturity securities: |
| Corporate | | $ | 261 |
| | $ | 8 |
| | $ | 90 |
| | $ | 3 |
| | $ | 351 |
| | $ | 11 |
|
| States, municipalities and political subdivisions | | 17 |
| | — |
| | 135 |
| | 2 |
| | 152 |
| | 2 |
|
| Government-sponsored enterprises | | 3 |
| | — |
| | 23 |
| | — |
| | 26 |
| | — |
|
| Commercial mortgage-backed | | 11 |
| | — |
| | 181 |
| | 5 |
| | 192 |
| | 5 |
|
| Foreign government | | — |
| | — |
| | — |
| | — |
| | — |
| | — |
|
| United States government | | — |
| | — |
| | — |
| | — |
| | — |
| | — |
|
| Subtotal | | 292 |
| | 8 |
| | 429 |
| | 10 |
| | 721 |
| | 18 |
|
| Equity securities: | | |
| | |
| | |
| | |
| | |
| | |
|
| Common equities | | 85 |
| | 3 |
| | — |
| | — |
| | 85 |
| | 3 |
|
| Nonredeemable preferred equities | | 16 |
| | — |
| | 17 |
| | 1 |
| | 33 |
| | 1 |
|
| Subtotal | | 101 |
| | 3 |
| | 17 |
| | 1 |
| | 118 |
| | 4 |
|
| Total | | $ | 393 |
| | $ | 11 |
| | $ | 446 |
| | $ | 11 |
| | $ | 839 |
| | $ | 22 |
|
| At December 31, 2013 | | |
| | |
| | |
| | |
| | |
| | |
|
| Fixed maturity securities: |
| Corporate | | $ | 572 |
| | $ | 20 |
| | $ | 43 |
| | $ | 2 |
| | $ | 615 |
| | $ | 22 |
|
| States, municipalities and political subdivisions | | 490 |
| | 18 |
| | 42 |
| | 3 |
| | 532 |
| | 21 |
|
| Commercial mortgage-backed | | 125 |
| | 5 |
| | — |
| | — |
| | 125 |
| | 5 |
|
| Government-sponsored enterprises | | 199 |
| | 27 |
| | 1 |
| | — |
| | 200 |
| | 27 |
|
| Foreign government | | 10 |
| | — |
| | — |
| | — |
| | 10 |
| | — |
|
| United States government | | 1 |
| | — |
| | — |
| | — |
| | 1 |
| | — |
|
| Subtotal | | 1,397 |
| | 70 |
| | 86 |
| | 5 |
| | 1,483 |
| | 75 |
|
| Equity securities: | | |
| | |
| | |
| | |
| | |
| | |
|
| Common equities | | 77 |
| | 1 |
| | — |
| | — |
| | 77 |
| | 1 |
|
| Nonredeemable preferred equities | | 42 |
| | 3 |
| | — |
| | — |
| | 42 |
| | 3 |
|
| Subtotal | | 119 |
| | 4 |
| | — |
| | — |
| | 119 |
| | 4 |
|
| Total | | $ | 1,516 |
| | $ | 74 |
| | $ | 86 |
| | $ | 5 |
| | $ | 1,602 |
| | $ | 79 |
|
| | | | | | | | | | | | | |
Cincinnati Financial Corporation - 2014 10-K - Page 117
The following table summarizes our investment portfolio, classifying securities based on fair values relative to cost or amortized cost:
| (Dollars in millions) | | Number
of issues | | | Cost or
amortized
cost | | | Fair
value | | | Gross
unrealized
gain/loss | | | Gross
investment
income | |
| At December 31, 2012 | | | | | | | | | | | | | | | | | | | | |
| Taxable fixed maturities: | | | | | | | | | | | | | | | | | | | | |
| Fair valued below 70% of amortized cost | | | 0 | | | $ | 0 | | | $ | 0 | | | $ | 0 | | | $ | 0 | |
| Fair valued at 70% to less than 100% of amortized cost | | | 19 | | | | 78 | | | | 76 | | | | (2 | ) | | | 2 | |
| Fair valued at 100% and above of amortized cost | | | 1,352 | | | | 5,395 | | | | 6,061 | | | | 666 | | | | 284 | |
| Securities sold in current year | | | 0 | | | | 0 | | | | 0 | | | | 0 | | | | 22 | |
| Total | | | 1,371 | | | | 5,473 | | | | 6,137 | | | | 664 | | | | 308 | |
| | | | | | | | | | | | | | | | | | | | | |
| Tax-exempt fixed maturities: | | | | | | | | | | | | | | | | | | | | |
| Fair valued below 70% of amortized cost | | | 0 | | | | 0 | | | | 0 | | | | 0 | | | | 0 | |
| Fair valued at 70% to less than 100% of amortized cost | | | 36 | | | | 54 | | | | 53 | | | | (1 | ) | | | 1 | |
| Fair valued at 100% and above of amortized cost | | | 1,282 | | | | 2,695 | | | | 2,903 | | | | 208 | | | | 109 | |
| Securities sold in current year | | | 0 | | | | 0 | | | | 0 | | | | 0 | | | | 4 | |
| Total | | | 1,318 | | | | 2,749 | | | | 2,956 | | | | 207 | | | | 114 | |
| | | | | | | | | | | | | | | | | | | | | |
| Common equities: | | | | | | | | | | | | | | | | | | | | |
| Fair valued below 70% of cost | | | 0 | | | | 0 | | | | 0 | | | | 0 | | | | 0 | |
| Fair valued at 70% to less than 100% of cost | | | 12 | | | | 116 | | | | 107 | | | | (9 | ) | | | 5 | |
| Fair valued at 100% and above of cost | | | 61 | | | | 2,154 | | | | 3,131 | | | | 977 | | | | 96 | |
| Securities sold in current year | | | 0 | | | | 0 | | | | 0 | | | | 0 | | | | 5 | |
| Total | | | 73 | | | | 2,270 | | | | 3,238 | | | | 968 | | | | 106 | |
| | | | | | | | | | | | | | | | | | | | | |
| Preferred equities: | | | | | | | | | | | | | | | | | | | | |
| Fair valued below 70% of cost | | | 0 | | | | 0 | | | | 0 | | | | 0 | | | | 0 | |
| Fair valued at 70% to less than 100% of cost | | | 1 | | | | 5 | | | | 4 | | | | (1 | ) | | | 0 | |
| Fair valued at 100% and above of cost | | | 21 | | | | 94 | | | | 131 | | | | 37 | | | | 7 | |
| Securities sold in current year | | | 0 | | | | 0 | | | | 0 | | | | 0 | | | | 0 | |
| Total | | | 22 | | | | 99 | | | | 135 | | | | 36 | | | | 7 | |
| | | | | | | | | | | | | | | | | | | | | |
| Portfolio summary: | | | | | | | | | | | | | | | | | | | | |
| Fair valued below 70% of cost or amortized cost | | | 0 | | | | 0 | | | | 0 | | | | 0 | | | | 0 | |
| Fair valued at 70% to less than 100% of cost or amortized cost | | | 68 | | | | 253 | | | | 240 | | | | (13 | ) | | | 8 | |
| Fair valued at 100% and above of cost or amortized cost | | | 2,716 | | | | 10,338 | | | | 12,226 | | | | 1,888 | | | | 496 | |
| Investment income on securities sold in current year | | | 0 | | | | 0 | | | | 0 | | | | 0 | | | | 31 | |
| Total | | | 2,784 | | | $ | 10,591 | | | $ | 12,466 | | | $ | 1,875 | | | $ | 535 | |
| | | | | | | | | | | | | | | | | | | | | |
| At December 31, 2011 | | | | | | | | | | | | | | | | | | | | |
| Portfolio summary: | | | | | | | | | | | | | | | | | | | | |
| Fair valued below 70% of cost or amortized cost | | | 1 | | | $ | 1 | | | $ | 1 | | | $ | 0 | | | $ | 0 | |
| Fair valued at 70% to less than 100% of cost or amortized cost | | | 136 | | | | 869 | | | | 816 | | | | (53 | ) | | | 29 | |
| Fair valued at 100% and above of cost or amortized cost | | | 2,587 | | | | 9,376 | | | | 10,918 | | | | 1,542 | | | | 472 | |
| Investment income on securities sold in current year | | | 0 | | | | 0 | | | | 0 | | | | 0 | | | | 27 | |
| Total | | | 2,724 | | | $ | 10,246 | | | $ | 11,735 | | | $ | 1,489 | | | $ | 528 | |
Item
|
| | | | | | | | | | | | | | | | | | | |
| (Dollars in millions) | | Number
of issues | | Cost or
amortized
cost | | Fair
value | | Gross
unrealized
gain/loss | | Gross
investment
income |
| At December 31, 2014 | | |
| | |
| | |
| | |
| | |
|
| Taxable fixed maturities: | | |
| | |
| | |
| | |
| | |
|
| Fair valued below 70% of amortized cost | | — |
| | $ | — |
| | $ | — |
| | $ | — |
| | $ | — |
|
| Fair valued at 70% to less than 100% of amortized cost | | 114 |
| | 589 |
| | 572 |
| | (17 | ) | | 20 |
|
| Fair valued at 100% and above of amortized cost | | 1,283 |
| | 5,293 |
| | 5,758 |
| | 465 |
| | 271 |
|
| Securities sold in current year | | — |
| | — |
| | — |
| | — |
| | 15 |
|
| Total | | 1,397 |
| | 5,882 |
| | 6,330 |
| | 448 |
| | 306 |
|
| | | | | | | | | | | |
| Tax-exempt fixed maturities: | | |
| | |
| | |
| | |
| | |
|
| Fair valued below 70% of amortized cost | | — |
| | — |
| | — |
| | — |
| | — |
|
| Fair valued at 70% to less than 100% of amortized cost | | 100 |
| | 150 |
| | 149 |
| | (1 | ) | | 3 |
|
| Fair valued at 100% and above of amortized cost | | 1,418 |
| | 2,839 |
| | 2,981 |
| | 142 |
| | 99 |
|
| Securities sold in current year | | — |
| | — |
| | — |
| | — |
| | 8 |
|
| Total | | 1,518 |
| | 2,989 |
| | 3,130 |
| | 141 |
| | 110 |
|
| | | | | | | | | | | |
| Common equities: | | |
| | |
| | |
| | |
| | |
|
| Fair valued below 70% of cost | | — |
| | — |
| | — |
| | — |
| | — |
|
| Fair valued at 70% to less than 100% of cost | | 4 |
| | 88 |
| | 85 |
| | (3 | ) | | 2 |
|
| Fair valued at 100% and above of cost | | 68 |
| | 2,495 |
| | 4,594 |
| | 2,099 |
| | 120 |
|
| Securities sold in current year | | — |
| | — |
| | — |
| | — |
| | 6 |
|
| Total | | 72 |
| | 2,583 |
| | 4,679 |
| | 2,096 |
| | 128 |
|
| | | | | | | | | | | |
| Nonredeemable preferred equities: | | |
| | |
| | |
| | |
| | |
|
| Fair valued below 70% of cost | | — |
| | — |
| | — |
| | — |
| | — |
|
| Fair valued at 70% to less than 100% of cost | | 5 |
| | 34 |
| | 33 |
| | (1 | ) | | 2 |
|
| Fair valued at 100% and above of cost | | 23 |
| | 111 |
| | 146 |
| | 35 |
| | 8 |
|
| Securities sold in current year | | — |
| | — |
| | — |
| | — |
| | — |
|
| Total | | 28 |
| | 145 |
| | 179 |
| | 34 |
| | 10 |
|
| | | | | | | | | | | |
| Portfolio summary: | | |
| | |
| | |
| | |
| | |
|
| Fair valued below 70% of cost or amortized cost | | — |
| | — |
| | — |
| | — |
| | — |
|
| Fair valued at 70% to less than 100% of cost or amortized cost | | 223 |
| | 861 |
| | 839 |
| | (22 | ) | | 27 |
|
| Fair valued at 100% and above of cost or amortized cost | | 2,792 |
| | 10,738 |
| | 13,479 |
| | 2,741 |
| | 498 |
|
| Investment income on securities sold in current year | | — |
| | — |
| | — |
| | — |
| | 29 |
|
| Total | | 3,015 |
| | $ | 11,599 |
| | $ | 14,318 |
| | $ | 2,719 |
| | $ | 554 |
|
| | | | | | | | | | | |
| At December 31, 2013 | | |
| | |
| | |
| | |
| | |
|
| Portfolio summary: | | |
| | |
| | |
| | |
| | |
|
| Fair valued below 70% of cost or amortized cost | | — |
| | $ | — |
| | $ | — |
| | $ | — |
| | $ | — |
|
| Fair valued at 70% to less than 100% of cost or amortized cost | | 556 |
| | 1,681 |
| | 1,602 |
| | (79 | ) | | 41 |
|
| Fair valued at 100% and above of cost or amortized cost | | 2,323 |
| | 9,480 |
| | 11,894 |
| | 2,414 |
| | 471 |
|
| Investment income on securities sold in current year | | — |
| | — |
| | — |
| | — |
| | 23 |
|
| Total | | 2,879 |
| | $ | 11,161 |
| | $ | 13,496 |
| | $ | 2,335 |
| | $ | 535 |
|
| | | | | | | | | | | |
Cincinnati Financial Corporation - 2014 10-K - Page 118
ITEM 8. Financial Statements and Supplementary Data Responsibility for Financial Statements
We have prepared the consolidated financial statements of Cincinnati Financial Corporation and our subsidiaries for the year ended December 31,
2012,2014, in accordance with accounting principles generally accepted in the United States of America (GAAP).
We are responsible for the integrity and objectivity of these financial statements. The amounts, presented on an accrual basis, reflect our best estimates and judgment. These statements are consistent in all material aspects with other financial information in the Annual Report on Form 10-K. Our accounting system and related internal controls are designed to assure that our books and records accurately reflect the company’s transactions in accordance with established policies and procedures as implemented by qualified personnel.
Our board of directors has established an audit committee of independent outside directors. We believe these directors are free from any relationships that could interfere with their independent judgment as audit committee members.
The audit committee meets periodically with management, our independent registered public accounting firm and our internal auditors to discuss how each is handling its respective responsibilities. The audit committee reports its findings to the board of directors. The audit committee recommends to the board the annual appointment of the independent registered public accounting firm. The audit committee reviews with this firm the scope of the audit assignment and the adequacy of internal controls and procedures.
Deloitte & Touche LLP, our independent registered public accounting firm, audited the consolidated financial statements of Cincinnati Financial Corporation and subsidiaries for the year ended December 31,
2012. Its report is on Page 107.2014. Deloitte & Touche LLP met with our audit committee to discuss the results of
theirits examination. They have the opportunity to discuss the adequacy of internal controls and the quality of financial reporting without management present.
Cincinnati Financial Corporation - 2014 10-K - Page 119
Management’s Annual Report on Internal Control Over Financial Reporting
The management of Cincinnati Financial Corporation and its subsidiaries is responsible for establishing and maintaining adequate internal controls, designed to provide reasonable assurance regarding the reliability of financial reporting and the preparation of financial statements for external purposes in accordance with accounting principles generally accepted in the United States of America (GAAP). The company’s internal control over financial reporting includes those policies and procedures that:
| · | Pertain to the maintenance of records that, in reasonable detail, accurately and fairly reflect the transactions and dispositions of the assets of the company; |
| · | Provide reasonable assurance that transactions are recorded as necessary to permit preparation of financial statements in accordance with GAAP and that receipts and expenditures of the company are being made only in accordance with authorizations of management and the directors of the company; and |
| · | Provide reasonable assurance regarding prevention or timely detection of unauthorized acquisition, use or disposition of the company’s assets that could have a material effect on the financial statements. |
Pertain to the maintenance of records that, in reasonable detail, accurately and fairly reflect the transactions and dispositions of the assets of the company;
Provide reasonable assurance that transactions are recorded as necessary to permit preparation of financial statements in accordance with GAAP and that receipts and expenditures of the company are being made only in accordance with authorizations of management and the directors of the company; and
Provide reasonable assurance regarding prevention or timely detection of unauthorized acquisition, use or disposition of the company’s assets that could have a material effect on the financial statements.
All internal control systems, no matter how well designed, have inherent limitations, including the possibility of human error and the circumvention of overriding controls. Accordingly, even effective internal control can provide only reasonable assurance with respect to financial statement preparation and presentation. Further, because of changes in conditions, the effectiveness of internal control may vary over time.
The company’s management assessed the effectiveness of the company’s internal control over financial reporting as of December 31,
2012,2014, as required by Section 404 of the Sarbanes Oxley Act of 2002. Management’s assessment was based on the criteria established in the Internal Control – Integrated Framework
(2013) issued by the Committee of Sponsoring Organizations of the Treadway Commission and was designed to provide reasonable assurance that the company maintained effective internal control over financial reporting as of December 31,
2012.2014. The assessment led management to conclude that, as of December 31,
2012,2014, the company’s internal control over financial reporting was effective based on those criteria.
The company’s independent registered public accounting firm has issued an audit report on our internal control over financial reporting as of December 31,
2012. This report appears on Page 107.2014.
Steven J. Johnston, FCAS, MAAA, CFA, CERA
President and Chief Executive Officer
Chief Financial Officer, Senior Vice President and Treasurer
Cincinnati Financial Corporation - 2014 10-K - Page 120
Report of Independent Registered Public Accounting Firm
To the Shareholders and Board of Directors of Cincinnati Financial Corporation
We have audited the accompanying consolidated balance sheets of Cincinnati Financial Corporation and subsidiaries (the “Company”) as of December 31,
20122014 and
2011,2013, and the related consolidated statements of
income, comprehensive income, shareholders’ equity, and cash flows for each of the three years in the period ended December 31,
2012.2014. Our audits also included the financial statement schedules listed in the Index at Item 15(c). We also have audited the Company’s internal control over financial reporting as of December 31,
2012,2014, based on criteria established in
the Internal Control
–- Integrated Framework
(2013) issued by the Committee of Sponsoring Organizations of the Treadway Commission. The
company’sCompany’s management is responsible for these financial statements and financial statement schedules, for maintaining effective internal control over financial reporting, and for its assessment of the effectiveness of internal control over financial reporting, included in
the accompanying Management’s Annual Report on Internal Control Over Financial Reporting. Our responsibility is to express an opinion on these financial statements and financial statement schedules and an opinion on the Company’s internal control over financial reporting based on our audits.
We conducted our audits in accordance with the standards of the Public Company Accounting Oversight Board (United States). Those standards require that we plan and perform the audit to obtain reasonable assurance about whether the financial statements are free of material misstatement and whether effective internal control over financial reporting was maintained in all material respects. Our audits of the financial statements included examining, on a test basis, evidence supporting the amounts and disclosures in the financial statements, assessing the accounting principles used and significant estimates made by management, and evaluating the overall financial statement presentation. Our audit of internal control over financial reporting included obtaining an understanding of internal control over financial reporting, assessing the risk that a material weakness exists, and testing and evaluating the design and operating effectiveness of internal control based on the assessed risk. Our audits also included performing such other procedures as we considered necessary in the circumstances. We believe that our audits provide a reasonable basis for our opinions.
A company’s internal control over financial reporting is a process designed by, or under the supervision of, the company’s principal executive and principal financial officers, or persons performing similar functions, and effected by the company’s board of directors, management, and other personnel to provide reasonable assurance regarding the reliability of financial reporting and the preparation of financial statements for external purposes in accordance with generally accepted accounting principles. A company’s internal control over financial reporting includes those policies and procedures
that:that (1) pertain to the maintenance of records that, in reasonable detail, accurately and fairly reflect the transactions and dispositions of the assets of the company; (2) provide reasonable assurance that transactions are recorded as necessary to permit preparation of financial statements in accordance with generally accepted accounting principles and that receipts and expenditures of the company are being made only in accordance with authorizations of management and directors of the company; and (3) provide reasonable assurance regarding prevention or timely detection of unauthorized acquisition, use, or disposition of the company’s assets that could have a material effect on the financial statements.
Because of the inherent limitations of internal control over financial reporting, including the possibility of collusion or improper management override of controls, material misstatements due to error or fraud may not be prevented or detected on a timely basis. Also, projections of any evaluation of the effectiveness of the internal control over financial reporting to future periods are subject to the risk that the controls may become inadequate because of changes in conditions, or that the degree of compliance with the policies or procedures may deteriorate.
Cincinnati Financial Corporation - 2014 10-K - Page 121
In our opinion, the consolidated financial statements referred to above present fairly, in all material respects, the financial position of the Company as of December 31,
20122014 and
20112013 and the results of their operations and their cash flows for each of the three years in the period ended December 31,
2012,2014, in conformity with accounting principles generally accepted in the United States of America. Also, in our opinion, such financial statement schedules, when considered in relation to the basic consolidated financial statements taken as a whole, present fairly, in all material respects, the information set forth therein. Also, in our opinion, the Company maintained, in all material respects, effective internal control over financial reporting as of December 31,
2012,2014, based on the criteria established in Internal Control
–- Integrated Framework
(2013) issued by the Committee of Sponsoring Organizations of the Treadway Commission.
As discussed in Note 1 to the consolidated financial statements, the Company changed its accounting for costs associated with acquiring or renewing insurance contracts in 2012.
/S/ Deloitte & Touche LLP
Cincinnati Financial Corporation - 2014 10-K - Page 122
Cincinnati Financial Corporation and Subsidiaries
Consolidated Balance Sheets| (In millions except per share data) | | December 31, | | | December 31, | |
| | 2012 | | | 2011 | |
| | | | | | | |
| ASSETS | | | | | | | | |
| Investments | | | | | | | | |
| Fixed maturities, at fair value (amortized cost: 2012—$8,222; 2011—$8,084) | | $ | 9,093 | | | $ | 8,779 | |
| Equity securities, at fair value (cost: 2012—$2,369; 2011—$2,162) | | | 3,373 | | | | 2,956 | |
| Other invested assets | | | 68 | | | | 66 | |
| Total investments | | | 12,534 | | | | 11,801 | |
| Cash and cash equivalents | | | 487 | | | | 438 | |
| Investment income receivable | | | 115 | | | | 119 | |
| Finance receivable | | | 75 | | | | 76 | |
| Premiums receivable | | | 1,214 | | | | 1,087 | |
| Reinsurance recoverable | | | 615 | | | | 622 | |
| Prepaid reinsurance premiums | | | 26 | | | | 24 | |
| Deferred policy acquisition costs | | | 470 | | | | 477 | |
| Land, building and equipment, net, for company use (accumulated depreciation: 2012—$397; 2011—$376) | | | 217 | | | | 227 | |
| Other assets | | | 61 | | | | 93 | |
| Separate accounts | | | 734 | | | | 671 | |
| Total assets | | $ | 16,548 | | | $ | 15,635 | |
| | | | | | | | | |
| LIABILITIES | | | | | | | | |
| Insurance reserves | | | | | | | | |
| Loss and loss expense reserves | | $ | 4,230 | | | $ | 4,339 | |
| Life policy and investment contract reserves | | | 2,295 | | | | 2,214 | |
| Unearned premiums | | | 1,792 | | | | 1,633 | |
| Other liabilities | | | 660 | | | | 517 | |
| Deferred income tax | | | 453 | | | | 303 | |
| Note payable | | | 104 | | | | 104 | |
| Long-term debt and capital lease obligations | | | 827 | | | | 821 | |
| Separate accounts | | | 734 | | | | 671 | |
| Total liabilities | | | 11,095 | | | | 10,602 | |
| | | | | | | | | |
| Commitments and contingent liabilities (Note 16) | | | — | | | | — | |
| | | | | | | | | |
| SHAREHOLDERS' EQUITY | | | | | | | | |
| Common stock, par value—$2 per share; (authorized: 2012 and 2011—500 million shares; issued and outstanding: 2012—197 million shares, 2011—196 million shares) | | | 394 | | | | 393 | |
| Paid-in capital | | | 1,134 | | | | 1,096 | |
| Retained earnings | | | 4,021 | | | | 3,863 | |
| Accumulated other comprehensive income | | | 1,129 | | | | 901 | |
| Treasury stock at cost (2012 and 2011—34 million shares) | | | (1,225 | ) | | | (1,220 | ) |
| Total shareholders' equity | | | 5,453 | | | | 5,033 | |
| Total liabilities and shareholders' equity | | $ | 16,548 | | | $ | 15,635 | |
|
| | | | | | | | |
| (Dollars in millions except per share data) | | December 31, | | December 31, |
| | | 2014 | | 2013 |
| Assets | | |
| | |
|
| Investments | | |
| | |
|
| Fixed maturities, at fair value (amortized cost: 2014—$8,871; 2013—$8,638) | | $ | 9,460 |
| | $ | 9,121 |
|
| Equity securities, at fair value (cost: 2014—$2,728; 2013—$2,523) | | 4,858 |
| | 4,375 |
|
| Other invested assets | | 68 |
| | 68 |
|
| Total investments | | 14,386 |
| | 13,564 |
|
| Cash and cash equivalents | | 591 |
| | 433 |
|
| Investment income receivable | | 123 |
| | 121 |
|
| Finance receivable | | 75 |
| | 85 |
|
| Premiums receivable | | 1,405 |
| | 1,346 |
|
| Reinsurance recoverable | | 545 |
| | 547 |
|
| Prepaid reinsurance premiums | | 29 |
| | 26 |
|
| Deferred policy acquisition costs | | 578 |
| | 565 |
|
Land, building and equipment, net, for company use (accumulated depreciation: 2014—$446; 2013—$420) | | 194 |
| | 210 |
|
| Other assets | | 75 |
| | 73 |
|
| Separate accounts | | 752 |
| | 692 |
|
| Total assets | | $ | 18,753 |
| | $ | 17,662 |
|
| | | | | |
| Liabilities | | |
| | |
|
| Insurance reserves | | |
| | |
|
| Loss and loss expense reserves | | $ | 4,485 |
| | $ | 4,311 |
|
| Life policy and investment contract reserves | | 2,497 |
| | 2,390 |
|
| Unearned premiums | | 2,082 |
| | 1,976 |
|
| Other liabilities | | 648 |
| | 611 |
|
| Deferred income tax | | 840 |
| | 673 |
|
| Note payable | | 49 |
| | 104 |
|
| Long-term debt and capital lease obligations | | 827 |
| | 835 |
|
| Separate accounts | | 752 |
| | 692 |
|
| Total liabilities | | 12,180 |
| | 11,592 |
|
| | | | | |
| Commitments and contingent liabilities (Note 16) | | — |
| | — |
|
| | | | | |
| Shareholders' Equity | | |
| | |
|
Common stock, par value—$2 per share; (authorized: 2014 and 2013—500 million shares; issued: 2014 and 2013—198.3 million shares) | | 397 |
| | 397 |
|
| Paid-in capital | | 1,214 |
| | 1,191 |
|
| Retained earnings | | 4,505 |
| | 4,268 |
|
| Accumulated other comprehensive income | | 1,744 |
| | 1,504 |
|
| Treasury stock at cost (2014—34.6 million shares and 2013—35.2 million shares) | | (1,287 | ) | | (1,290 | ) |
| Total shareholders' equity | | 6,573 |
| | 6,070 |
|
| Total liabilities and shareholders' equity | | $ | 18,753 |
| | $ | 17,662 |
|
| | | | | |
Accompanying
notesNotes are an integral part of these
consolidated financial statements.Consolidated Financial Statements.
Cincinnati Financial Corporation - 2014 10-K - Page 123
Cincinnati Financial Corporation and Subsidiaries
Consolidated Statements of
Comprehensive Income
| (In millions except per share data) | | Years ended December 31, | |
| | | 2012 | | | 2011 | | | 2010 | |
| REVENUES | | | | | | | | | | | | |
| Earned premiums | | $ | 3,522 | | | $ | 3,194 | | | $ | 3,082 | |
| Investment income, net of expenses | | | 531 | | | | 525 | | | | 518 | |
| Realized investment gains, net | | | 42 | | | | 70 | | | | 159 | |
| Fee revenues | | | 6 | | | | 4 | | | | 4 | |
| Other revenues | | | 10 | | | | 10 | | | | 9 | |
| Total revenues | | | 4,111 | | | | 3,803 | | | | 3,772 | |
| | | | | | | | | | | | | |
| BENEFITS AND EXPENSES | | | | | | | | | | | | |
| Insurance losses and policyholder benefits | | | 2,322 | | | | 2,524 | | | | 2,180 | |
| Underwriting, acquisition and insurance expenses | | | 1,155 | | | | 1,039 | | | | 1,024 | |
| Interest expense | | | 54 | | | | 54 | | | | 54 | |
| Other operating expenses | | | 14 | | | | 13 | | | | 16 | |
| Total benefits and expenses | | | 3,545 | | | | 3,630 | | | | 3,274 | |
| | | | | | | | | | | | | |
| INCOME BEFORE INCOME TAXES | | | 566 | | | | 173 | | | | 498 | |
| | | | | | | | | | | | | |
| PROVISION (BENEFIT) FOR INCOME TAXES | | | | | | | | | | | | |
| Current | | | 119 | | | | 27 | | | | 94 | |
| Deferred | | | 26 | | | | (18 | ) | | | 29 | |
| Total provision for income taxes | | | 145 | | | | 9 | | | | 123 | |
| | | | | | | | | | | | | |
| NET INCOME | | $ | 421 | | | $ | 164 | | | $ | 375 | |
| | | | | | | | | | | | | |
| PER COMMON SHARE | | | | | | | | | | | | |
| Net income—basic | | $ | 2.59 | | | $ | 1.01 | | | $ | 2.30 | |
| Net income—diluted | | | 2.57 | | | | 1.01 | | | | 2.30 | |
| | | | | | | | | | | | | |
| NET INCOME | | $ | 421 | | | $ | 164 | | | $ | 375 | |
| OTHER COMPREHENSIVE INCOME, BEFORE TAX | | | | | | | | | | | | |
| Unrealized gains on investments available-for-sale | | | 428 | | | | 309 | | | | 383 | |
| Reclassification adjustment for (gains) included in net income | | | (42 | ) | | | (70 | ) | | | (159 | ) |
| Unrealized (losses) on other | | | (21 | ) | | | (11 | ) | | | (4 | ) |
| Unrealized gains on investments available-for-sale and other | | | 365 | | | | 228 | | | | 220 | |
| Amortization of pension actuarial (loss) gain and prior service cost | | | (13 | ) | | | (25 | ) | | | 3 | |
| Other comprehensive income before tax | | | 352 | | | | 203 | | | | 223 | |
| Income taxes on above | | | 124 | | | | 71 | | | | 78 | |
| Other comprehensive income, net of tax | | | 228 | | | | 132 | | | | 145 | |
| COMPREHENSIVE INCOME | | $ | 649 | | | $ | 296 | | | $ | 520 | |
| | | | | | | | | | | | | |
|
| | | | | | | | | | | | |
| (Dollars in millions except per share data) | | Years ended December 31, |
| | | 2014 | | 2013 | | 2012 |
| Revenues | | |
| | |
| | |
|
| Earned premiums | | $ | 4,243 |
| | $ | 3,902 |
| | $ | 3,522 |
|
| Investment income, net of expenses | | 549 |
| | 529 |
| | 531 |
|
| Realized investment gains, net | | 133 |
| | 83 |
| | 42 |
|
| Fee revenues | | 12 |
| | 8 |
| | 6 |
|
| Other revenues | | 8 |
| | 9 |
| | 10 |
|
| Total revenues | | 4,945 |
| | 4,531 |
| | 4,111 |
|
| Benefits and Expenses | | |
| | |
| | |
|
| Insurance losses and policyholder benefits | | 2,856 |
| | 2,505 |
| | 2,322 |
|
| Underwriting, acquisition and insurance expenses | | 1,301 |
| | 1,243 |
| | 1,155 |
|
| Interest expense | | 53 |
| | 54 |
| | 54 |
|
| Other operating expenses | | 14 |
| | 15 |
| | 14 |
|
| Total benefits and expenses | | 4,224 |
| | 3,817 |
| | 3,545 |
|
| Income Before Income Taxes | | 721 |
| | 714 |
| | 566 |
|
| Provision for Income Taxes | | |
| | |
| | |
|
| Current | | 159 |
| | 178 |
| | 119 |
|
| Deferred | | 37 |
| | 19 |
| | 26 |
|
| Total provision for income taxes | | 196 |
| | 197 |
| | 145 |
|
| Net Income | | $ | 525 |
| | $ | 517 |
| | $ | 421 |
|
| Per Common Share | | |
| | |
| | |
|
| Net income—basic | | $ | 3.21 |
| | $ | 3.16 |
| | $ | 2.59 |
|
| Net income—diluted | | 3.18 |
| | 3.12 |
| | 2.57 |
|
| | | | | | | |
Accompanying
notesNotes are an integral part of these
consolidated financial statements.Consolidated Financial Statements.
Cincinnati Financial Corporation - 2014 10-K - Page 124
Cincinnati Financial Corporation and Subsidiaries
Consolidated Statements of
Shareholders’ Equity | (In millions) | | | | | | | | | | | | | | Accumulated | | | | | | Total | |
| | | Common Stock | | | | | | | | | Other | | | | | | Share- | |
| | | Outstanding | | | | | | Paid-In | | | Retained | | | Comprehensive | | | Treasury | | | holders' | |
| | | Shares | | | Amount | | | Capital | | | Earnings | | | Income | | | Stock | | | Equity | |
| | | | | | | | | | | | | | | | | | | | | | |
| Balance December 31, 2009 | | | 162 | | | $ | 393 | | | $ | 1,081 | | | $ | 3,862 | | | $ | 624 | | | $ | (1,200 | ) | | $ | 4,760 | |
| Cumulative effect of a change in accounting for deferred policy acquisition costs, net of tax | | | - | | | | - | | | | - | | | | (18 | ) | | | - | | | | - | | | | (18 | ) |
| Balance as adjusted January 1, 2010 | | | 162 | | | | 393 | | | | 1,081 | | | | 3,844 | | | | 624 | | | | (1,200 | ) | | | 4,742 | |
| | | | | | | | | | | | | | | | | | | | | | | | | | | | | |
| Net income | | | - | | | | - | | | | - | | | | 375 | | | | - | | | | - | | | | 375 | |
| Other comprehensive income, net | | | - | | | | - | | | | - | | | | - | | | | 145 | | | | - | | | | 145 | |
| Dividends declared | | | - | | | | - | | | | - | | | | (259 | ) | | | - | | | | - | | | | (259 | ) |
| Stock-based awards exercised and vested | | | 1 | | | | - | | | | (2 | ) | | | - | | | | - | | | | 2 | | | | - | |
| Stock-based compensation | | | - | | | | - | | | | 11 | | | | - | | | | - | | | | - | | | | 11 | |
| Purchases | | | - | | | | - | | | | - | | | | - | | | | - | | | | (10 | ) | | | (10 | ) |
| Other | | | - | | | | - | | | | 1 | | | | - | | | | - | | | | 7 | | | | 8 | |
| Balance December 31, 2010 | | | 163 | | | $ | 393 | | | $ | 1,091 | | | $ | 3,960 | | | $ | 769 | | | $ | (1,201 | ) | | $ | 5,012 | |
| | | | | | | | | | | | | | | | | | | | | | | | | | | | | |
| Balance December 31, 2010 | | | 163 | | | $ | 393 | | | $ | 1,091 | | | $ | 3,960 | | | $ | 769 | | | $ | (1,201 | ) | | $ | 5,012 | |
| | | | | | | | | | | | | | | | | | | | | | | | | | | | | |
| Net income | | | - | | | | - | | | | - | | | | 164 | | | | - | | | | - | | | | 164 | |
| Other comprehensive income, net | | | - | | | | - | | | | - | | | | - | | | | 132 | | | | - | | | | 132 | |
| Dividends declared | | | - | | | | - | | | | - | | | | (261 | ) | | | - | | | | - | | | | (261 | ) |
| Stock-based awards exercised and vested | | | - | | | | - | | | | (10 | ) | | | - | | | | - | | | | 6 | | | | (4 | ) |
| Stock-based compensation | | | - | | | | - | | | | 13 | | | | - | | | | - | | | | - | | | | 13 | |
| Purchases | | | (1 | ) | | | - | | | | - | | | | - | | | | - | | | | (32 | ) | | | (32 | ) |
| Other | | | - | | | | - | | | | 2 | | | | - | | | | - | | | | 7 | | | | 9 | |
| Balance December 31, 2011 | | | 162 | | | $ | 393 | | | $ | 1,096 | | | $ | 3,863 | | | $ | 901 | | | $ | (1,220 | ) | | $ | 5,033 | |
| | | | | | | | | | | | | | | | | | | | | | | | | | | | | |
| Balance December 31, 2011 | | | 162 | | | $ | 393 | | | $ | 1,096 | | | $ | 3,863 | | | $ | 901 | | | $ | (1,220 | ) | | $ | 5,033 | |
| | | | | | | | | | | | | | | | | | | | | | | | | | | | | |
| Net income | | | - | | | | - | | | | - | | | | 421 | | | | - | | | | - | | | | 421 | |
| Other comprehensive income, net | | | - | | | | - | | | | - | | | | - | | | | 228 | | | | - | | | | 228 | |
| Dividends declared | | | - | | | | - | | | | - | | | | (263 | ) | | | - | | | | - | | | | (263 | ) |
| Stock-based awards exercised and vested | | | 1 | | | | 1 | | | | 19 | | | | - | | | | - | | | | 2 | | | | 22 | |
| Stock-based compensation | | | - | | | | - | | | | 16 | | | | - | | | | - | | | | - | | | | 16 | |
| Purchases | | | - | | | | - | | | | - | | | | - | | | | - | | | | (12 | ) | | | (12 | ) |
| Other | | | - | | | | - | | | | 3 | | | | - | | | | - | | | | 5 | | | | 8 | |
| Balance December 31, 2012 | | | 163 | | | $ | 394 | | | $ | 1,134 | | | $ | 4,021 | | | $ | 1,129 | | | $ | (1,225 | ) | | $ | 5,453 | |
| | | | | | | | | | | | | | | | | | | | | | | | | | | | | |
Comprehensive Income
|
| | | | | | | | | | | | |
| (Dollars in millions) | | Years ended December 31, |
| | | 2014 | | 2013 | | 2012 |
| Net Income | | $ | 525 |
| | $ | 517 |
| | $ | 421 |
|
| Other Comprehensive Income | | |
| | |
| | |
|
| Unrealized gains on investments, net of tax of $134, $161, and $135, respectively | | 250 |
| | 299 |
| | 251 |
|
| Amortization of pension actuarial loss and prior service cost, net of tax of $(6), $29, and $(4), respectively | | (12 | ) | | 54 |
| | (9 | ) |
| Change in life deferred acquisition costs, life policy reserves and other, net of tax of $2, $12, and $(7), respectively | | 2 |
| | 22 |
| | (14 | ) |
| Other comprehensive income, net of tax | | 240 |
| | 375 |
| | 228 |
|
| Comprehensive Income | | $ | 765 |
| | $ | 892 |
| | $ | 649 |
|
| | | | | | | |
Accompanying
notesNotes are an integral part of these
consolidated financial statements.Consolidated Financial Statements.
Cincinnati Financial Corporation - 2014 10-K - Page 125
Cincinnati Financial Corporation and Subsidiaries
Consolidated Statements of Cash Flows| (In millions) | | Years ended December 31, | |
| | | 2012 | | | 2011 | | | 2010 | |
| CASH FLOWS FROM OPERATING ACTIVITIES | | | | | | | | | | | | |
| Net income | | $ | 421 | | | $ | 164 | | | $ | 375 | |
| Adjustments to reconcile net income to net cash provided by operating activities: | | | | | | | | | | | | |
| Depreciation and amortization | | | 44 | | | | 42 | | | | 41 | |
| Realized gains on investments, net | | | (42 | ) | | | (70 | ) | | | (159 | ) |
| Stock-based compensation | | | 16 | | | | 13 | | | | 11 | |
| Interest credited to contract holders | | | 44 | | | | 51 | | | | 48 | |
| Deferred income tax (benefit)expense | | | 26 | | | | (18 | ) | | | 29 | |
| Changes in: | | | | | | | | | | | | |
| Investment income receivable | | | 4 | | | | - | | | | (1 | ) |
| Premiums and reinsurance receivable | | | (122 | ) | | | (128 | ) | | | 80 | |
| Deferred policy acquisition costs | | | (28 | ) | | | (30 | ) | | | (20 | ) |
| Other assets | | | (4 | ) | | | 2 | | | | 3 | |
| Loss and loss expense reserves | | | (109 | ) | | | 139 | | | | 58 | |
| Life policy reserves | | | 72 | | | | 76 | | | | 113 | |
| Unearned premiums | | | 159 | | | | 80 | | | | 44 | |
| Other liabilities | | | 78 | | | | (49 | ) | | | (18 | ) |
| Current income tax receivable/payable | | | 79 | | | | (25 | ) | | | (73 | ) |
| Net cash provided by operating activities | | | 638 | | | | 247 | | | | 531 | |
| CASH FLOWS FROM INVESTING ACTIVITIES | | | | | | | | | | | | |
| Sale of fixed maturities | | | 144 | | | | 71 | | | | 199 | |
| Call or maturity of fixed maturities | | | 927 | | | | 808 | | | | 886 | |
| Sale of equity securities | | | 216 | | | | 539 | | | | 273 | |
| Purchase of fixed maturities | | | (1,166 | ) | | | (1,087 | ) | | | (1,483 | ) |
| Purchase of equity securities | | | (425 | ) | | | (337 | ) | | | (396 | ) |
| Change in short-term investments, net | | | - | | | | - | | | | 7 | |
| Investment in buildings and equipment, net | | | (6 | ) | | | (7 | ) | | | (17 | ) |
| Investment in finance receivables | | | (33 | ) | | | (32 | ) | | | (27 | ) |
| Collection of finance receivables | | | 34 | | | | 30 | | | | 29 | |
| Change in other invested assets, net | | | 5 | | | | 7 | | | | - | |
| Net cash used in investing activities | | | (304 | ) | | | (8 | ) | | | (529 | ) |
| CASH FLOWS FROM FINANCING ACTIVITIES | | | | | | | | | | | | |
| Payment of cash dividends to shareholders | | | (256 | ) | | | (255 | ) | | | (252 | ) |
| Purchase of treasury shares | | | - | | | | (32 | ) | | | (10 | ) |
| Increase in notes payable | | | - | | | | 55 | | | | - | |
| Proceeds from stock options exercised | | | 10 | | | | 1 | | | | - | |
| Contract holders' funds deposited | | | 99 | | | | 172 | | | | 170 | |
| Contract holders' funds withdrawn | | | (126 | ) | | | (121 | ) | | | (74 | ) |
| Excess tax benefits on share-based compensation | | | 1 | | | | 5 | | | | 2 | |
| Other | | | (13 | ) | | | (11 | ) | | | (10 | ) |
| Net cash used in financing activities | | | (285 | ) | | | (186 | ) | | | (174 | ) |
| Net change in cash and cash equivalents | | | 49 | | | | 53 | | | | (172 | ) |
| Cash and cash equivalents at beginning of year | | | 438 | | | | 385 | | | | 557 | |
| Cash and cash equivalents at end of period | | $ | 487 | | | $ | 438 | | | $ | 385 | |
| | | | | | | | | | | | | |
| Supplemental disclosures of cash flow information: | | | | | | | | | | | | |
| Interest paid | | $ | 54 | | | $ | 53 | | | $ | 53 | |
| Income taxes paid | | | 38 | | | | 51 | | | | 167 | |
| Non-cash activities: | | | | | | | | | | | | |
| Conversion of investment securities | | $ | 26 | | | $ | - | | | $ | 5 | |
| Equipment acquired under capital lease obligations | | | 23 | | | | 28 | | | | - | |
| Cashless exercise of stock options | | | 12 | | | | - | | | | - | |
Shareholders’ Equity
|
| | | | | | | | | | | | | | | | | | | | | | | | | | |
| | | | | | | | Accumulated Other
Comprehensive
Income | | | | Total Share-
holders'
Equity |
| (In millions) | Common Stock | | Paid-In Capital | | Retained Earnings | | | Treasury Stock | |
| | Outstanding
Shares | | Amount | | | | | |
| Balance, December 31, 2011 | 162.2 |
| | $ | 393 |
| | $ | 1,096 |
| | $ | 3,863 |
| | $ | 901 |
| | $ | (1,220 | ) | | $ | 5,033 |
|
| Net income | — |
| | — |
| | — |
| | 421 |
| | — |
| | — |
| | 421 |
|
| Other comprehensive income, net | — |
| | — |
| | — |
| | — |
| | 228 |
| | — |
| | 228 |
|
| Dividends declared | — |
| | — |
| | — |
| | (263 | ) | | — |
| | — |
| | (263 | ) |
| Share-based awards exercised and vested | 0.7 |
| | 1 |
| | 19 |
| | — |
| | — |
| | 2 |
| | 22 |
|
| Share-based compensation | — |
| | — |
| | 16 |
| | — |
| | — |
| | — |
| | 16 |
|
| Treasury shares acquired—share repurchase authorization | — |
| | — |
| | — |
| | — |
| | — |
| | — |
| | — |
|
| Shares acquired under employee share-based compensation plans | (0.3 | ) | | — |
| | — |
| | — |
| | — |
| | (12 | ) | | (12 | ) |
| Other | 0.3 |
| | — |
| | 3 |
| | — |
| | — |
| | 5 |
| | 8 |
|
| Balance, December 31, 2012 | 162.9 |
| | $ | 394 |
| | $ | 1,134 |
| | $ | 4,021 |
| | $ | 1,129 |
| | $ | (1,225 | ) | | $ | 5,453 |
|
| | | | | | | | | | | | | | |
| Balance, December 31, 2012 | 162.9 |
| | $ | 394 |
| | $ | 1,134 |
| | $ | 4,021 |
| | $ | 1,129 |
| | $ | (1,225 | ) | | $ | 5,453 |
|
| Net income | — |
| | — |
| | — |
| | 517 |
| | — |
| | — |
| | 517 |
|
| Other comprehensive income, net | — |
| | — |
| | — |
| | — |
| | 375 |
| | — |
| | 375 |
|
| Dividends declared | — |
| | — |
| | — |
| | (270 | ) | | — |
| | — |
| | (270 | ) |
| Share-based awards exercised and vested | 1.6 |
| | 3 |
| | 36 |
| | — |
| | — |
| | 10 |
| | 49 |
|
| Share-based compensation | — |
| | — |
| | 18 |
| | — |
| | — |
| | — |
| | 18 |
|
| Treasury shares acquired—share repurchase authorization | (1.0 | ) | | — |
| | — |
| | — |
| | — |
| | (52 | ) | | (52 | ) |
| Shares acquired under employee share-based compensation plans | (0.6 | ) | | — |
| | — |
| | — |
| | — |
| | (28 | ) | | (28 | ) |
| Other | 0.2 |
| | — |
| | 3 |
| | — |
| | — |
| | 5 |
| | 8 |
|
| Balance, December 31, 2013 | 163.1 |
| | $ | 397 |
| | $ | 1,191 |
| | $ | 4,268 |
| | $ | 1,504 |
| | $ | (1,290 | ) | | $ | 6,070 |
|
| | | | | | | | | | | | | | |
| Balance, December 31, 2013 | 163.1 |
| | $ | 397 |
| | $ | 1,191 |
| | $ | 4,268 |
| | $ | 1,504 |
| | $ | (1,290 | ) | | $ | 6,070 |
|
| Net income | — |
| | — |
| | — |
| | 525 |
| | — |
| | — |
| | 525 |
|
| Other comprehensive income, net | — |
| | — |
| | — |
| | — |
| | 240 |
| | — |
| | 240 |
|
| Dividends declared | — |
| | — |
| | — |
| | (288 | ) | | — |
| | — |
| | (288 | ) |
| Share-based awards exercised and vested | 1.3 |
| | — |
| | — |
| | — |
| | — |
| | 37 |
| | 37 |
|
| Share-based compensation | — |
| | — |
| | 19 |
| | — |
| | — |
| | — |
| | 19 |
|
| Treasury shares acquired—share repurchase authorization | (0.5 | ) | | — |
| | — |
| | — |
| | — |
| | (21 | ) | | (21 | ) |
| Shares acquired under employee share-based compensation plans | (0.4 | ) | | — |
| | — |
| | — |
| | — |
| | (19 | ) | | (19 | ) |
| Other | 0.2 |
| | — |
| | 4 |
| | — |
| | — |
| | 6 |
| | 10 |
|
| Balance, December 31, 2014 | 163.7 |
| | $ | 397 |
| | $ | 1,214 |
| | $ | 4,505 |
| | $ | 1,744 |
| | $ | (1,287 | ) | | $ | 6,573 |
|
| | | | | | | | | | | | | | |
notesNotes are an integral part of these consolidated financial statements.Consolidated Financial Statements.
Cincinnati Financial Corporation - 2014 10-K - Page 126
Cincinnati Financial Corporation and Subsidiaries
Consolidated Statements of Cash Flows
|
| | | | | | | | | | | | |
| (Dollars in millions) | | Years ended December 31, |
| | | 2014 | | 2013 | | 2012 |
| Cash Flows From Operating Activities | | |
| | |
| | |
|
| Net income | | $ | 525 |
| | $ | 517 |
| | $ | 421 |
|
| Adjustments to reconcile net income to net cash provided by operating activities: | | |
| | |
| | |
|
| Depreciation and amortization | | 51 |
| | 50 |
| | 44 |
|
| Realized investment gains, net | | (133 | ) | | (83 | ) | | (42 | ) |
| Share-based compensation | | 19 |
| | 18 |
| | 16 |
|
| Interest credited to contract holders | | 47 |
| | 44 |
| | 44 |
|
| Deferred income tax expense | | 37 |
| | 19 |
| | 26 |
|
| Changes in: | | | | |
| | |
|
| Investment income receivable | | (2 | ) | | (6 | ) | | 4 |
|
| Premiums and reinsurance recoverable | | (60 | ) | | (64 | ) | | (122 | ) |
| Deferred policy acquisition costs | | (20 | ) | | (44 | ) | | (28 | ) |
| Other assets | | 19 |
| | (32 | ) | | (4 | ) |
| Loss and loss expense reserves | | 174 |
| | 81 |
| | (109 | ) |
| Life policy reserves | | 119 |
| | 84 |
| | 72 |
|
| Unearned premiums | | 106 |
| | 184 |
| | 159 |
|
| Other liabilities | | (11 | ) | | 77 |
| | 78 |
|
| Current income tax receivable/payable | | 2 |
| | (49 | ) | | 79 |
|
| Net cash provided by operating activities | | 873 |
| | 796 |
| | 638 |
|
| Cash Flows From Investing Activities | | |
| | |
| | |
|
| Sale of fixed maturities | | 26 |
| | 40 |
| | 144 |
|
| Call or maturity of fixed maturities | | 1,019 |
| | 930 |
| | 927 |
|
| Sale of equity securities | | 335 |
| | 178 |
| | 216 |
|
| Purchase of fixed maturities | | (1,312 | ) | | (1,381 | ) | | (1,166 | ) |
| Purchase of equity securities | | (392 | ) | | (265 | ) | | (425 | ) |
| Investment in finance receivables | | (18 | ) | | (39 | ) | | (33 | ) |
| Collection of finance receivables | | 31 |
| | 30 |
| | 34 |
|
| Investment in buildings and equipment, net | | (9 | ) | | (7 | ) | | (6 | ) |
| Change in other invested assets, net | | 9 |
| | 5 |
| | 5 |
|
| Net cash used in investing activities | | (311 | ) | | (509 | ) | | (304 | ) |
| Cash Flows From Financing Activities | | |
| | |
| | |
|
| Payment of cash dividends to shareholders | | (278 | ) | | (263 | ) | | (256 | ) |
| Purchase of treasury shares | | (21 | ) | | (52 | ) | | — |
|
| Payments on note payable | | (55 | ) | | — |
| | — |
|
| Proceeds from stock options exercised | | 22 |
| | 25 |
| | 10 |
|
| Contract holders' funds deposited | | 86 |
| | 86 |
| | 99 |
|
| Contract holders' funds withdrawn | | (143 | ) | | (128 | ) | | (126 | ) |
| Excess tax benefits on share-based compensation | | 2 |
| | 5 |
| | 1 |
|
| Other | | (17 | ) | | (14 | ) | | (13 | ) |
| Net cash used in financing activities | | (404 | ) | | (341 | ) | | (285 | ) |
| Net change in cash and cash equivalents | | 158 |
| | (54 | ) | | 49 |
|
| Cash and cash equivalents at beginning of year | | 433 |
| | 487 |
| | 438 |
|
| Cash and cash equivalents at end of year | | $ | 591 |
| | $ | 433 |
| | $ | 487 |
|
| Supplemental Disclosures of Cash Flow Information: | | |
| | |
| | |
|
| Interest paid | | $ | 53 |
| | $ | 53 |
| | $ | 54 |
|
| Income taxes paid | | 154 |
| | 222 |
| | 38 |
|
| Noncash Activities: | | | | |
| | |
|
| Conversion of securities | | $ | 7 |
| | $ | — |
| | $ | 26 |
|
| Equipment acquired under capital lease obligations | | 12 |
| | 28 |
| | 23 |
|
| Cashless exercise of stock options | | 19 |
| | 28 |
| | 12 |
|
| | | | | | | |
Accompanying Notes are an integral part of these Consolidated Financial Statements.
Cincinnati Financial Corporation - 2014 10-K - Page 127
Notes to Consolidated Financial Statements
1.
NOTE 1 – Summary of Significant Accounting Policies
Cincinnati Financial Corporation (CFC) operates through our insurance group and two complementary subsidiary companies.
The Cincinnati Insurance Company leads our standard market property casualty insurance group that also includes two subsidiaries: The Cincinnati Casualty Company and The Cincinnati Indemnity Company. This group markets a broad range of standard market business, homeownercommercial and autopersonal policies. The group providesfocuses on delivery of quality customer service to our select group of 1,4081,466 independent insurance agencies with 1,7581,884 reporting locations across 39 states. Other subsidiaries of The Cincinnati Insurance Company include The Cincinnati Life Insurance Company, which markets life and disability income insurance and fixed annuities, and The Cincinnati Specialty Underwriters Insurance Company, which offers excess and surplus lines property and casualty insurance products. The two CFC complementary subsidiaries are CSU Producer Resources Inc., which offersprovides insurance brokerage services to our independent agencies so their clients can access our excess and surplus lines insurance products, and CFC Investment Company (CFC-I), which offers commercial leasing and financing services to our agents, their clients and other customers. Our consolidated financial statements include the accounts of the parent and its wholly owned subsidiaries and are presented in conformity with accounting principles generally accepted in the United States of America (GAAP). All intercompany balances and transactions have been eliminated in consolidation.
The preparation of financial statements in conformity with GAAP requires us to make estimates and assumptions that affect amounts reported in the financial statements and accompanying notes. Our actual results could differ from those estimates.
On January 1, 2012, we retrospectively adopted ASU 2010-26,Accounting for Costs Associated with Acquiring or Renewing Insurance Contracts.All prior years’ information has been restated.
Net income per common share is based on the weighted average number of common shares outstanding during each of the respective years. We calculate net income per common share (diluted) assuming the exercise
or conversion of
stock-based awards.Stock-Basedshare‑based awards using the treasury stock method.
We account for stock-basedshare-based compensation in accordance with Accounting Standards Codification (ASC) 718,Compensation – Stock Compensation. We grant qualified and nonqualified stock-basedshare-based compensation under authorized plans. The stock options vest ratably over three years following the date of grant and are exercisable over 10-year10-year periods. We grant service-based restricted stock units that cliff vest three years after the date of grant. We also grant performance-based restricted stock units that vest if certain market conditions are attained. In 2012,2014, the CFC compensation committee approved a mix ofshare-based awards including incentive stock options, nonqualified stock options, service-based restricted and performance-based restricted stock units. See Note 17, Stock-BasedShare-Based Associate Compensation Plans, Page 135, for further details. Employee Benefit Pension Plan
We sponsor a defined benefit pension plan that was modified during 2008. We frozeclosed entry into the pension plan, and only participants 40 years of age or older could elect to remain in the plan. Our pension expense is based on certain actuarial assumptions and also is composed of several components that are determined using the projected unit credit actuarial cost method. Refer to Note 13, Employee Retirement Benefits, Page 130 for more information about our defined benefit pension plan. Property Casualty Insurance
The consolidated property casualty companies actively write property casualty insurance through independent agencies in 39 states. Our 10 largest states generated 62.8 percent and 63.8 percent of total earned premiums in 2014 and 2013, respectively. Ohio, our largest state, accounted for 17.7 percent and 18.5 percent of total earned
Cincinnati Financial Corporation - 2014 10-K - Page 128
premiums in 2014 and 2013, respectively. Illinois, Indiana, Pennsylvania, Georgia, Michigan and North Carolina each accounted for between 5 percent and 8 percent of total earned premiums in 2014. Our largest single agency relationship accounted for approximately 0.8 percent of our total property casualty earned premiums in 2014. No aggregate agency relationship locations under a single ownership structure accounted for more than 2.1 percent of our total property casualty earned premiums in 2014. We record revenues for installment charges as Fee revenues in the consolidated statements of income.
Property casualty written premiums are deferred and recorded as earned premiums on a pro rata basis over the terms of the policies. We record as unearned premiums the portion of written premiums that applies to unexpired policy terms. Certain expensesExpenses associated with successfully acquiring insurance policies – primarily commissions, premium taxes and underwriting costs – are deferred and amortized over the terms of the policies. All acquisition costs reflect the retrospective adoption ofare in accordance with ASU 2010-26,Accounting for Costs Associated with Acquiring or Renewing Insurance Contracts, which we adopted on January 1, 2012.. We assess recoverability of deferred acquisition costs at the segment level, consistent with the way we acquire, service and manage insurance policies and measure profitability. We analyze our acquisition cost assumptions to reflect actual experience, and we test forevaluate potential premium deficiencies.A segment premium deficiency is recorded when the sum of expected loss and loss adjustment expenses, expected policyholder dividends and unamortized deferred acquisition expenses exceeds the total of unearned premiums and anticipated investment income. A premium deficiency is first recognized by charging any unamortized acquisition costs to expense to the extent required to eliminate the deficiency. If the premium deficiency is greater than unamortized acquisition costs, a liability is accrued for the excess deficiency. We did not record a premium deficiency for the three years ended 2012, 2011 and 2010.
Certain property casualty policies are not entered into
policy underwriting systems
beforeas of the effective
date.date of coverage. An actuarial estimate is made to determine the amount of these unprocessed written premiums. A large majority of the estimate is unearned and
does not have ahas no material impact on earned premiums.
Premiums receivable are reviewed for impairment on a quarterly basis. We
currently do not havemaintain an allowance for uncollectible premiums.
We establish reserves to cover the expected cost of claims, losses and expenses related to investigating, processing and resolving claims. Although the appropriate amount of reserves is inherently uncertain, we base our decisions on past experience and current facts. Reserves are based on claims reported prior to the end of the year and estimates of unreported claims. We take into account the fact that we may recover some of our costs through salvage and subrogation. We regularly review and update reserves using the most current information available. Any resulting adjustments are reflected in current calendar year insurance losses and policyholder benefits.
The consolidated property casualty companies actively write property casualty insurance through independent agencies in 39 states. Our 10 largest states generated 65.4 percent and 66.5 percent of total earned premiums in 2012 and 2011, respectively. Ohio, our largest state, accounted for 19.1 percent and 19.5 percent of total earned premiums in 2012 and 2011, respectively. Illinois, Indiana, Pennsylvania, Georgia, North Carolina and Michigan each accounted for between 4 percent and 8 percent of total earned premiums in 2012. Our largest single agency relationship accounted for approximately 0.9 percent of our total property casualty earned premiums in 2012. No aggregate agency relationship locations under a single ownership structure accounted for more than 2.1 percent of our total property casualty earned premiums in 2012.
Certain workers’ compensation policies include the possibility of a policyholder earning a return of a portion of its premium in the form of a policyholder dividend. The dividend generally is calculated by determining the profitability of a policy year along with the associated premium. We reserve for all probable future policyholder dividend payments. We record policyholder dividends as
other underwriting
acquisition and insurance expenses.
Profit-Sharing Commission Accrual
We calculate the profit-sharing commission accrual estimate from property casualty underwriting results. These commissions are paid to agencies using a formula that takes into account agency profitability and premium volume. The commission accrual of $102 million at December 31, 2012, contributed 3.1 percentage points to the consolidated property casualty combined ratio. The profit-sharing commission accrual at December 31, 2011, was $68 million.
Life
and Health Insurance
We offer several types of life insurance and disability income insurance, and we account for each according to the duration of the contract. Short-duration
life and health contracts are written to cover claims that arise during a short, fixed term of coverage. We generally have the right to change the amount of premium charged or cancel the coverage at the end of each contract term. Group life insurance is an example. We record premiums for short-duration life and health contracts similarly to property casualty contracts.
Long-duration contracts are written to provide coverage for an extended period of time. Traditional long-duration contracts require policyholders to pay scheduled gross premiums, generally not less frequently than annually, over the term of the coverage. Premiums for these contracts,
are recognizedsuch as
revenue when due. Wholewhole life insurance and disability income insurance, are
examples.recognized as revenue when due. Some traditional long-duration contracts,
such as ten-pay whole life insurance, have premium payment periods shorter than the period over which coverage is provided. For these contracts, the excess of premium over the amount required to pay expenses and benefits is recognized over the term of the coverage rather than over the premium payment period.
Ten-pay whole life insurance is an example.
We establish a liability for traditional long-duration contracts as we receive premiums. The amount of this liability is the present value of future expenses and benefits less the present value of future net premiums. Net premium is the portion of gross premium required to provide for all expenses and benefits. We estimate future expenses and benefits and net premium using assumptions for expected expenses, mortality, morbidity, withdrawal rates and investment income. We include a provision for deviation, meaning we allow for some uncertainty in making our assumptions. We establish our assumptions when the contract is issued, and we generally maintain those assumptions for the life of the contract. We use both our own experience and industry experience, adjusted for
Cincinnati Financial Corporation - 2014 10-K - Page 129
historical trends, in arriving at our assumptions for expected mortality, morbidity and withdrawal rates. We use our own experience and historical trends for setting our assumption for expected expenses. We base our assumption for expected investment income on our own experience, adjusted for current economic conditions.
When we issue a
We capitalize acquisition costs for traditional long-duration contracts. We charge these capitalized costs associated with successfully acquiring traditional long-duration contract we capitalize acquisition costs. Acquisition costs are related to the successful acquisition of new business. We then charge these deferred policy acquisition costs to expensesinsurance policies over the premium-paying period of the contract, and wepolicies. We use the same assumptions used in establishing the liability for the contract.All acquisition costs reflect the retrospective adoption of ASUAccounting Standards Update (ASU) 2010-26,Accounting for Costs Associated with Acquiring or Renewing Insurance Contracts, which we adopted on January 1, 2012.. We update our acquisition cost assumptions periodically to reflect actual experience, and we evaluate our deferred acquisition cost for recoverability. Universal life contracts are long-duration contracts for which contractual provisions are not fixed, unlike whole life insurance. Universal life contracts allow policyholders to vary the amount of premium, within limits, without our consent. However, we may vary the mortality, expense charges and the interest crediting rate, within limits, used to accumulate policy values. We do not record universal life premiums as revenue. Instead we recognize as revenue the mortality charges, administration charges and surrender charges when received. Some of our universal life contracts assess administration charges in the early years of the contract that are compensation for services we will provide in the later years of the contract. These administration charges are deferred and are recognized over the period when we provide those future services.
For universal life long-duration contracts, we
We maintain a liability equal to the policyholder account value. There is no provision for adverse deviation. Some of our universal life policies contain no-lapse guarantee provisions. For these policies, we establish a reserve in addition to the account balance, based on expected no-lapse guarantee benefits and expected policy assessments.
When we issue a
We capitalize acquisition costs for universal life long-duration
contract, we capitalize acquisition costs.contracts. We
then charge these capitalized costs to expenses over the term of coverage of the contract in accordance with the recognition of gross profit from the contract. When we charge deferred policy acquisition costs to expenses, we use assumptions based on our best estimates of long-term experience. We review and modify these assumptions on a regular basis.
We
issuehave issued universal life contracts with guaranteed minimum returns, referred to as bank-owned life insurance contracts (BOLIs). A BOLI is designed so the bank is the policy owner and the policy beneficiary. We legally segregate and record as separate accounts the assets and liabilities for some of our BOLIs, based on the specific contract provisions. We guarantee minimum investment returns, account values and death benefits for our separate account BOLIs. Our other BOLIs are general account products.
We carry the assets of separate account BOLIs at fair value. The liabilities on separate account BOLIs primarily are the contract holders’ claims to the related assets and are carried at an amount equal to the contract holders’ account value. At December 31,
2012,2014, the current fair value of the BOLI invested assets and cash exceeded the current fair value of the contract holders’ account value by approximately
$77$47 million. If the BOLI projected fair value were to fall below the value we guaranteed, a liability would be established
bywith a
corresponding charge to the company’s earnings.
Generally, investment income and realized investment gains and losses of the separate accounts accrue directly to the contract holder, and we do not include them in the consolidated statements of
comprehensive income. Revenues and expenses related to separate accounts consist of contractual fees and mortality, surrender and expense risk charges. Also, each separate account BOLI includes a negotiated capital gain and loss sharing arrangement between the company and the bank. A percentage of each separate account’s realized capital gain and loss representing contract fees and assessments accrues to us and is transferred from the separate account to our general account and is recognized as revenue or expense.
We record as revenues separate account investment management fees in Fee revenues of the consolidated statements of income.
We reduce risk and uncertainty by buying property casualty and life reinsurance. Reinsurance contracts do not relieve us from our
dutyobligation to policyholders, but rather help protect our financial strength to perform that duty. All of these ceded reinsurance contracts transfer the economic risk of loss. We
continue to assume risk
in awith limited
wayexposure as a reinsurer for other insurance companies, reinsurers and involuntary state pools.
Cincinnati Financial Corporation - 2014 10-K - Page 130
Both reinsurance assumed and ceded premiums are deferred and recorded as earned premiums on a pro rata basis over the terms of the contract. We estimate loss amounts recoverable from our reinsurers based on the reinsurance policy terms. Historically, our claims with reinsurers have been paid. We do not have an allowance for uncollectible reinsurance.
Cash and Cash Equivalents
Cash and cash equivalents are highly liquid instruments that include liquid debt instruments with original maturities of less than three months. These are carried at cost, which approximates fair value.
Our portfolio investments are primarily in publicly traded fixed-maturity, equity and short-term investments. Fixed-maturity investments (taxable bonds, tax-exempt bonds, redeemable preferred
stocksequities and commercial mortgage backed securities) and equity investments (common and nonredeemable preferred
stocks)equities) are classified as available for sale and recorded at fair value in the consolidated financial statements. The number of fixed-maturity securities with fair value below 100 percent of amortized cost can be expected to fluctuate as interest rates rise or fall. Because of our strong surplus and long-term investment horizon, our general intent is to hold fixed-maturity investments until maturity, regardless of short-term fluctuations in fair values.
Our invested asset impairment policy states that fixed maturities below their amortized cost that the company (1) intends to sell or (2) more likely than not will be required to sell before recovery of their amortized cost basis are deemed to be other-than-temporarily impaired (OTTI). The amortized cost of any such securities is reduced to fair value as the new cost basis, and a realized loss is recorded in the period in which it is recognized. When these two criteria are not met, and the company believes that full collection of interest and/or principal is not likely, we determine the net present value of future cash flows by using the effective interest rate implicit in the security at the date of acquisition as the discount rate and compare that amount with the amortized cost and fair value of the security. The difference between the net present value of the expected future cash flows and amortized cost of the security is considered a credit loss and recognized as a realized loss in the period in which it occurred. The difference between the fair value and the net present value of the cash flows of the security, the noncredit loss, is recognized in other comprehensive income as an unrealized loss.
We had no fixed-maturity securities with a noncredit loss for the years ended 2014 and 2013.
When determining OTTI charges for our equity portfolio, our invested asset impairment policy considers qualitative and quantitative factors, including facts and circumstances specific to individual securities, asset classes, the financial condition of the issuer, changes in dividend payment, the length of time fair value had been less than cost, the severity of the decline in fair value below cost, the volatility of the security and our ability and intent to hold each position until its forecasted recovery.
We include the noncredit portion of fixed-maturity OTTI charges and all other unrealized gains and losses on investments, net of taxes, in shareholders’ equity as accumulated other comprehensive income (AOCI). Realized gains and losses on investments are recognized in net income based on the trade date accounting method.
Included within our other invested assets are
$37$31 million of life policy loans and
$31$37 million of
venture capital fundprivate equity investments. Life policy loans are carried at the receivable
value, which approximates fair value. The
venture capital fundsprivate equity investments provide their financial statements to us and generally report investments on their balance sheets at fair value. We use the equity method of accounting for
venture capital fundprivate equity investments.
Investment income consists mainly of interest and dividends. We record interest on an accrual basis and record dividends at the ex-dividend date. We amortize premiums and discounts on fixed-maturity securities using the effective interest method over the expected life of the security.
We account for our investment portfolio at fair value and apply fair value measurements as defined by ASC 820, Fair Value Measurements and Disclosures, to financial instruments. Fair value is applicable to ASC 320, Investments-Debt and Equity Securities,
ASC 815, Derivatives and Hedging, and ASC 825, Financial Instruments.
ASC 820 defines fair value as the exit price or the amount that would be (1) received to sell an asset or (2) paid to transfer a liability in an orderly transaction between marketplace participants at the measurement date. When determining an exit price, we rely upon observable market data whenever possible. We primarily base fair value for
Cincinnati Financial Corporation - 2014 10-K - Page 131
investments in equity and fixed-maturity securities (including redeemable preferred stock and assets held in separate accounts) on quoted market prices or on prices from a pricing
vendor, an outside resource that supplies global securities pricing, dividend, corporate action and descriptive information to support fund pricing, securities operations, research and portfolio management. The company obtains and reviews the pricing service’s valuation methodologies and related inputs and validates these prices by replicating a sample across each asset class using a discounted cash flow model. When a price is not available from these sources, as in the case of securities that are not publicly traded, we determine the fair value using various inputs including quotes from independent brokers. The fair value of investments not priced by a pricing vendor is less than 1 percent of the fair value of our total investment portfolio.
For the purpose of ASC 825 disclosure, we base fair value for long-term senior notes on market pricing of similar debt instruments that are actively trading. We base fair value for notes payable on our year-end outstanding balance because it is short term and tied to a variable interest rate. We estimate the fair value of liabilities for investment contracts and annuities using discounted cash flow calculations across a wide range of economic interest rate scenarios with a provision for our nonperformance risk. We estimate the fair value for policyholder loans on insurance contracts using a discounted cash flow model. Determination of fair value for structured settlements assumes the discount rates used to calculate the present value of expected payments are the risk-free spot rates plus an A3 rated bond spread for financial issuers at December 31,
2012,2014, to account for nonperformance risk. See Note 3, Fair Value Measurements,
Page 121, for further details.
Land, Building and Equipment
We record land at cost, and record building and equipment at cost less accumulated depreciation. Equipment held under capital leases also is classified as property and equipment with the related lease obligations recorded as liabilities. We capitalize and amortize costs for internally developed computer software during the application development stage. These costs generally consist of external consulting, payroll and payroll-related costs. Our depreciation is based on estimated useful lives (ranging from three years to 39.5 years) using straight-line and accelerated methods. Depreciation expense was $37 million for each year in 2014, 2013 and 2012. We monitor land, building and equipment and software assets for potential impairments. Potential impairments may include a significant decrease in the fair values of the assets, considerable cost overruns on projects, a change in legal factors or business climate or other factors that indicate that the carrying amount may not be recoverable or useful. There were no recorded land, building and equipment impairments for 2014, 2013 or 2012.
Income Taxes
We calculate deferred income tax liabilities and assets using tax rates in effect when temporary differences in financial statement income and taxable income are expected to reverse. We recognize deferred income taxes for numerous temporary differences between our taxable income and financial statement income and other changes in shareholders’ equity. Such temporary differences relate primarily to unrealized gains and losses on investments and differences in the recognition of deferred acquisition costs, unearned premium and insurance reserves. We charge deferred income taxes associated with balances that impact other comprehensive income, such as unrealized appreciation and depreciation of investments (except the amounts related to the effect of income tax rate changes), to shareholders’ equity in AOCI. We charge deferred taxes associated with other differences to income.
See Note 11, Income Taxes, for further detail on our uncertain tax positions. Although no Internal Revenue Service (IRS) penalties currently are accrued, if incurred, they would be recognized as a component of income tax expense.
Our leasing subsidiary provides auto and equipment direct financing (leases and loans) to commercial and individual clients. We generally transfer ownership of the property to the client as the terms of the leases expire. Our lease contracts contain bargain purchase options. We account for these leases and loans as direct financing-type leases. We capitalize and amortize lease or loan origination costs over the life of the financing, using the effective interest method. These costs may include, but are not limited to finder fees, broker fees, filing fees and the cost of credit reports. We record income
in the Other revenues of the consolidated statements of income over the financing term using the effective interest method. Finance receivables are reviewed for impairment on a quarterly basis and considered insignificant to our consolidated financial condition, results of operations and cash flows.
Land, Building and Equipment
We record land at cost, and record building and equipment at cost less accumulated depreciation. Equipment held under capital leases also is classified as property and equipment with the related lease obligations recorded as liabilities. We capitalize and amortize costs for internally developed computer software during the application development stage. These costs generally consist of external consulting, payroll and payroll-related costs. Our depreciation is based on estimated useful lives (ranging from three years to 39½ years) using straight-line and accelerated methods. Depreciation expense was $37 million in 2012, $46 million in 2011, and $40 million in 2010. We monitor land, building and equipment and software assets for potential impairments. Potential impairments may include a significant decrease in the fair values of the assets, considerable cost overruns on projects, a change in legal factors or business climate or other factors that indicate that the carrying amount may not be recoverable or useful. There were no recorded land, building and equipment impairments for 2012, 2011 or 2010.
Income Taxes
We calculate deferred income tax liabilities and assets using tax rates in effect when temporary differences in financial statement income and taxable income are expected to reverse. We recognize deferred income taxes for numerous temporary differences between our taxable income and financial statement income and other changes in shareholders’ equity. Such temporary differences relate primarily to unrealized gains and losses on investments and differences in the recognition of deferred acquisition costs, unearned premium and insurance reserves. We charge deferred income taxes associated with unrealized appreciation and depreciation of investments (except the amounts related to the effect of income tax rate changes) to shareholders’ equity in AOCI. We charge deferred taxes associated with other differences to income.
See Note 11, Income Taxes,
Cincinnati Financial Corporation - 2014 10-K - Page
129, for further detail on our uncertain tax positions. Although no Internal Revenue Service (IRS) penalties currently are accrued, if incurred, they would be recognized as a component of income tax expense. Accrued IRS interest expense is recognized as other operating expense in the consolidated statements of comprehensive income.132
There were no subsequent events requiring adjustment to the financial statements or disclosure.
Pending Accounting
Standards | · | In December 2011,Updates
ASU 2014-09, Revenue from Contracts with Customers
In May 2014, the Financial Accounting Standards Board (FASB) issued Accounting Standards Update (ASU) 2011-11,Disclosures About Offsetting Assets and Liabilities. ASU 2011-11 requires entities to disclose information about offsetting and related arrangements to enable users of its financial statements to understand the effect of those arrangements on its financial position. The ASU is effective for interim and annual reporting periods beginning on or after January 1, 2013, and should be applied retrospectively for all comparative periods presented. The ASU has not yet been adopted and will not have a material impact on our company’s financial position, cash flows or results of operations. |
| · | In February 2013, the FASB issued ASU 2013-02,Reporting of Amounts Reclassified Out of Accumulated Other Comprehensive Income. ASU 2013-02 requires entities to present in either a single note or parenthetically on the face of the financial statements, the effect of significant amounts reclassified from each component of accumulated other comprehensive income based on its source and the income statement line items affected by the reclassification. Items not required to be reclassified to net income in their entirety are cross referenced to a related footnote for additional information. The ASU is effective for interim and annual periods beginning after December 15, 2012. The ASU has not yet been adopted and will not have a material impact on our company’s financial position, cash flows or results of operations. |
Adopted Accounting Standards
| · | In October 2010, the FASB issued ASU 2010-26,Accounting for Costs Associated with Acquiring or Renewing Insurance Contracts. ASU 2010-26 modified the definitions of the type of costs incurred by insurance entities that can be capitalized in the successful acquisition of new and renewal contracts. ASU 2010-26 requires incremental direct costs of successful contract acquisition as well as certain costs related to underwriting, policy issuance and processing, medical and inspection and sales force contract selling for successful contract acquisition to be capitalized. These incremental direct costs and other costs are those that are essential to the contract transaction and would not have been incurred had the contract transaction not occurred. We retrospectively adopted as of January 1, 2008, ASU 2010-26 on January 1, 2012. |
Board (FASB) issued ASU 2014-09, Revenue from Contracts with Customers. ASU 2014-09 requires an entity to recognize revenue to depict the transfer of promised goods or services to customers in an amount that reflects the consideration to which the entity expects to be entitled in exchange for those goods and services. Insurance contracts do not fall within the scope of this ASU. The following table illustrateseffective date of ASU 2014-09 is for annual reporting periods beginning after December 15, 2016. The ASU has not yet been adopted; however, there is not expected to be a material impact on our company’s consolidated financial position, cash flows or results of operations.
ASU 2014-12, Compensation-Stock Compensation: Accounting for Share-Based Payments When the effectTerms of adoptingan Award Provide That a Performance Target Could Be Achieved after the Requisite Service Period
In June 2014, the FASB Issued ASU 2010-26 in2014-12, Compensation-Stock Compensation: Accounting for Share-Based Payments When the Terms of an Award Provide That a Performance Target Could Be Achieved after the Requisite Service Period. ASU 2014-12 requires that performance targets that affect vesting and that could be achieved after the requisite service period be treated as performance conditions. The effective date of ASU 2014-12 is for interim and annual reporting periods beginning after December 15, 2015. The ASU has not yet been adopted and will not have a material impact on our company’s consolidated balance sheets:| (In millions, except per share amounts) | | December 31, | | | December 31, | |
| | | 2012 | | | 2011 | |
| | | | | | As originally
reported | | | As
adjusted | | | Difference | |
| Deferred policy acquisition costs | | $ | 470 | | | $ | 510 | | | $ | 477 | | | $ | (33 | ) |
| Total assets | | | 16,548 | | | | 15,668 | | | | 15,635 | | | | (33 | ) |
| Deferred income tax liability | | | 453 | | | | 314 | | | | 303 | | | | (11 | ) |
| Shareholders' equity | | | 5,453 | | | | 5,055 | | | | 5,033 | | | | (22 | ) |
| Book value per share | | | 33.48 | | | | 31.16 | | | | 31.03 | | | | (0.13 | ) |
financial position, cash flows or results of operations.
ASU 2015-02, Consolidation (Topic 810) - Amendments to the Consolidation Analysis
In February 2015, the FASB Issued ASU 2015-02, Consolidation (Topic 810) - Amendments to the Consolidation Analysis. ASU 2015-02 makes amendments to the current consolidation guidance, focusing mainly on the investment management industry; however entities across all industries will be impacted. The following table illustrates the effecteffective date of adopting ASU 2010-26 in the2015-02 is for interim and annual reporting periods beginning after December 15, 2015. The ASU has not yet been adopted; however, there is not expected to be a material impact on our company’s consolidated statementsfinancial position, cash flows or results of comprehensive income:| (In millions, except per share amounts) | | Years ended December 31, | |
| | | 2012 | | | 2011 | | | 2010 | |
| | | | | | As
originally
reported | | | As adjusted | | | Difference | | | As
originally
reported | | | As adjusted | | | Difference | |
| Underwriting, acquisition and insurance expenses | | $ | 1,155 | | | $ | 1,036 | | | $ | 1,039 | | | $ | 3 | | | $ | 1,021 | | | $ | 1,024 | | | $ | 3 | |
| Net income | | | 421 | | | | 166 | | | | 164 | | | | (2 | ) | | | 377 | | | | 375 | | | | (2 | ) |
| Net income per share: | | | | | | | | | | | | | | | | | | | | | | | | | | | | |
| Basic | | $ | 2.59 | | | $ | 1.02 | | | $ | 1.01 | | | $ | (0.01 | ) | | $ | 2.32 | | | $ | 2.30 | | | $ | (0.02 | ) |
| Diluted | | | 2.57 | | | | 1.02 | | | | 1.01 | | | | (0.01 | ) | | | 2.31 | | | | 2.30 | | | | (0.01 | ) |
| · | In May 2011, the FASB issued ASU 2011-04,Fair Value Measurements, Amendments to Achieve Common Fair Value Measurement and Disclosure Requirements in U.S. GAAP and International Financial Reporting Standards (IFRS). The ASU converges fair value measurement and disclosures among U.S. GAAP and IFRS. ASU 2011-04 changes certain fair value measurement principles and expands disclosure requirements. The company adopted ASU 2011-04 during the first quarter of 2012, and it did not have a material impact on our company’s financial position, cash flows or results of operations. |
| · | In December 2011, the FASB issued ASU 2011-12, Deferral of the Effective Date for Amendments to the Presentation of Reclassifications of Items Out of Accumulated Other Comprehensive Income in Accounting Standards Update 2011-05, Presentation of Comprehensive Income. ASU 2011-05 requires entities to present the total of comprehensive income, the components of net income and the components of other comprehensive income either in a single, continuous statement of comprehensive income or in two separate but consecutive statements. ASU 2011-12 defers the changes in ASU 2011-05 that relate to the presentation of reclassification adjustments. The company adopted ASU 2011-12 and ASU 2011-05 during the first quarter of 2012, and it did not have a material impact on our company’s financial position, cash flows or results of operations. |
operations.
Cincinnati Financial Corporation - 2014 10-K - Page 133
NOTE 2 – Investments
The following table provides cost or amortized cost, gross unrealized gains, gross unrealized losses and fair value for our
invested assets:| (In millions) | | Cost or | | | | | | | |
| | | amortized | | | Gross unrealized | | | Fair | |
| | cost | | | gains | | | losses | | | value | |
| At December 31, 2012 | | | | | | | | | | | | |
| Fixed maturities: | | | | | | | | | | | | | | | | |
| States, municipalities and political subdivisions | | $ | 3,040 | | | $ | 250 | | | $ | 1 | | | $ | 3,289 | |
| Convertibles and bonds with warrants attached | | | 31 | | | | - | | | | - | | | | 31 | |
| United States government | | | 7 | | | | 1 | | | | - | | | | 8 | |
| Government-sponsored enterprises | | | 164 | | | | - | | | | - | | | | 164 | |
| Foreign government | | | 3 | | | | - | | | | - | | | | 3 | |
| Commercial mortgage-backed securities | | | 27 | | | | 1 | | | | - | | | | 28 | |
| Corporate securities | | | 4,950 | | | | 622 | | | | 2 | | | | 5,570 | |
| Subtotal | | | 8,222 | | | | 874 | | | | 3 | | | | 9,093 | |
| Equity securities: | | | | | | | | | | | | | | | | |
| Common equities | | | 2,270 | | | | 977 | | | | 9 | | | | 3,238 | |
| Preferred equities | | | 99 | | | | 37 | | | | 1 | | | | 135 | |
| Subtotal | | | 2,369 | | | | 1,014 | | | | 10 | | | | 3,373 | |
| Total | | $ | 10,591 | | | $ | 1,888 | | | $ | 13 | | | $ | 12,466 | |
| | | | | | | | | | | | | | | | | |
| At December 31, 2011 | | | | | | | | | | | | | | | | |
| Fixed maturities: | | | | | | | | | | | | | | | | |
| States, municipalities and political subdivisions | | $ | 3,006 | | | $ | 246 | | | $ | - | | | $ | 3,252 | |
| Convertibles and bonds with warrants attached | | | 59 | | | | - | | | | - | | | | 59 | |
| United States government | | | 6 | | | | 1 | | | | - | | | | 7 | |
| Government-sponsored enterprises | | | 159 | | | | 1 | | | | - | | | | 160 | |
| Foreign government | | | 3 | | | | - | | | | - | | | | 3 | |
| Corporate securities | | | 4,851 | | | | 465 | | | | 18 | | | | 5,298 | |
| Subtotal | | | 8,084 | | | | 713 | | | | 18 | | | | 8,779 | |
| Equity securities: | | | | | | | | | | | | | | | | |
| Common equities | | | 2,088 | | | | 801 | | | | 35 | | | | 2,854 | |
| Preferred equities | | | 74 | | | | 28 | | | | - | | | | 102 | |
| Subtotal | | | 2,162 | | | | 829 | | | | 35 | | | | 2,956 | |
| Total | | $ | 10,246 | | | $ | 1,542 | | | $ | 53 | | | $ | 11,735 | |
fixed-maturity and equity securities:
|
| | | | | | | | | | | | | | | | |
| (Dollars in millions) | | Cost or amortized cost | | Gross unrealized | | Fair
value |
| At December 31, 2014 | | | gains | | losses | |
| Fixed-maturity securities: | | |
| | |
| | |
| | |
|
| Corporate | | $ | 5,117 |
| | $ | 420 |
| | $ | 11 |
| | $ | 5,526 |
|
| States, municipalities and political subdivisions | | 3,267 |
| | 178 |
| | 2 |
| | 3,443 |
|
| Commercial mortgage-backed | | 250 |
| | 9 |
| | — |
| | 259 |
|
| Government-sponsored enterprises | | 213 |
| | — |
| | 5 |
| | 208 |
|
| Foreign government | | 10 |
| | — |
| | — |
| | 10 |
|
| Convertibles and bonds with warrants attached | | 7 |
| | — |
| | — |
| | 7 |
|
| United States government | | 7 |
| | — |
| | — |
| | 7 |
|
| Subtotal | | 8,871 |
| | 607 |
| | 18 |
| | 9,460 |
|
| Equity securities: | | |
| | |
| | |
| | |
|
| Common equities | | 2,583 |
| | 2,099 |
| | 3 |
| | 4,679 |
|
| Nonredeemable preferred equities | | 145 |
| | 35 |
| | 1 |
| | 179 |
|
| Subtotal | | 2,728 |
| | 2,134 |
| | 4 |
| | 4,858 |
|
| Total | | $ | 11,599 |
| | $ | 2,741 |
| | $ | 22 |
| | $ | 14,318 |
|
| | | | | | | | | |
| At December 31, 2013 | | |
| | |
| | |
| | |
|
| Fixed-maturity securities: | | |
| | |
| | |
| | |
|
| Corporate | | $ | 5,122 |
| | $ | 433 |
| | $ | 22 |
| | $ | 5,533 |
|
| States, municipalities and political subdivisions | | 3,107 |
| | 125 |
| | 21 |
| | 3,211 |
|
| Commercial mortgage-backed | | 148 |
| | — |
| | 5 |
| | 143 |
|
| Government-sponsored enterprises | | 227 |
| | — |
| | 27 |
| | 200 |
|
| Foreign government | | 10 |
| | — |
| | — |
| | 10 |
|
| Convertibles and bonds with warrants attached | | 17 |
| | — |
| | — |
| | 17 |
|
| United States government | | 7 |
| | — |
| | — |
| | 7 |
|
| Subtotal | | 8,638 |
| | 558 |
| | 75 |
| | 9,121 |
|
| Equity securities: | | |
| | |
| | |
| | |
|
| Common equities | | 2,396 |
| | 1,818 |
| | 1 |
| | 4,213 |
|
| Nonredeemable preferred equities | | 127 |
| | 38 |
| | 3 |
| | 162 |
|
| Subtotal | | 2,523 |
| | 1,856 |
| | 4 |
| | 4,375 |
|
| Total | | $ | 11,161 |
| | $ | 2,414 |
| | $ | 79 |
| | $ | 13,496 |
|
| | | | | | | | | |
The net unrealized investment gains in our fixed-maturity portfolio are primarily the result of the currentcontinued low interest rate environment that has increased the fair value of our fixed-maturity portfolio. The threeseven largest net unrealized investment gains in our common stock portfolio are from Exxon Mobil Corporation (NYSE:XOM), The Procter & Gamble Company (NYSE:PG), Honeywell International Incorporated (NYSE:HON), BlackRock Inc. (NYSE:BLK), Genuine Parts Company (NYSE:GPC), RPM International (NYSE:RPM) and Chevron CorporationJohnson and Johnson (NYSE:CVX)JNJ), which had a combined net gain position of $282 million.$619 million. At December 31, 2012, we had $31 million2014, Apple Inc. (Nasdaq:AAPL) was our largest single combined stock holding with a fair value of hybrid securities included in fixed maturities that follow ASC 815-15-25,Accounting for Certain Hybrid3.3 percent of our publicly traded common stock portfolio and 1.1 percent of the total investment portfolio.
Cincinnati Financial
Instruments. The hybrid securities are carried at fair value, and the changes in fair value are included in realized investment gains and losses.Corporation - 2014 10-K - Page 134
The table below provides fair values and unrealized losses by investment category and by the duration of the securities’ continuous unrealized loss position:
| (In millions) | | Less than 12 months | | | 12 months or more | | | Total | |
| | | Fair
value | | | Unrealized
losses | | | Fair
value | | | Unrealized
losses | | | Fair
value | | | Unrealized
losses | |
| At December 31, 2012 | | | | | | | | | | | | | | | | | | | | | | | | |
| Fixed maturities: | | | | | | | | | | | | | | | | | | | | | | | | |
| States, municipalities and political subdivisions | | $ | 53 | | | $ | 1 | | | $ | - | | | $ | - | | | $ | 53 | | | $ | 1 | |
| Government-sponsored enterprises | | | 1 | | | | - | | | | - | | | | - | | | | 1 | | | | - | |
| Corporate securities | | | 58 | | | | 1 | | | | 17 | | | | 1 | | | | 75 | | | | 2 | |
| Subtotal | | | 112 | | | | 2 | | | | 17 | | | | 1 | | | | 129 | | | | 3 | |
| Equity securities: | | | | | | | | | | | | | | | | | | | | | | | | |
| Common equities | | | 107 | | | | 9 | | | | - | | | | - | | | | 107 | | | | 9 | |
| Preferred equities | | | 4 | | | | 1 | | | | - | | | | - | | | | 4 | | | | 1 | |
| Subtotal | | | 111 | | | | 10 | | | | - | | | | - | | | | 111 | | | | 10 | |
| Total | | $ | 223 | | | $ | 12 | | | $ | 17 | | | $ | 1 | | | $ | 240 | | | $ | 13 | |
| | | | | | | | | | | | | | | | | | | | | | | | | |
| At December 31, 2011 | | | | | | | | | | | | | | | | | | | | | | | | |
| Fixed maturities: | | | | | | | | | | | | | | | | | | | | | | | | |
| States, municipalities and political subdivisions | | $ | - | | | $ | - | | | $ | 12 | | | $ | - | | | $ | 12 | | | $ | - | |
| United States government | | | 1 | | | | - | | | | - | | | | - | | | | 1 | | | | - | |
| Government-sponsored enterprises | | | 10 | | | | - | | | | - | | | | - | | | | 10 | | | | - | |
| Corporate securities | | | 380 | | | | 13 | | | | 57 | | | | 5 | | | | 437 | | | | 18 | |
| Subtotal | | | 391 | | | | 13 | | | | 69 | | | | 5 | | | | 460 | | | | 18 | |
| Equity securities: | | | | | | | | | | | | | | | | | | | | | | | | |
| Common equities | | | 333 | | | | 35 | | | | - | | | | - | | | | 333 | | | | 35 | |
| Preferred equities | | | 5 | | | | - | | | | 19 | | | | - | | | | 24 | | | | - | |
| Subtotal | | | 338 | | | | 35 | | | | 19 | | | | - | | | | 357 | | | | 35 | |
| Total | | $ | 729 | | | $ | 48 | | | $ | 88 | | | $ | 5 | | | $ | 817 | | | $ | 53 | |
At December 31, 2012, contractual
|
| | | | | | | | | | | | | | | | | | | | | | | | |
| (Dollars in millions) | | Less than 12 months | | 12 months or more | | Total |
| At December 31, 2014 | | Fair value | | Unrealized losses | | Fair value | | Unrealized losses | | Fair value | | Unrealized losses |
| Fixed maturity securities: |
| Corporate | | $ | 261 |
| | $ | 8 |
| | $ | 90 |
| | $ | 3 |
| | $ | 351 |
| | $ | 11 |
|
| States, municipalities and political subdivisions | | 17 |
| | — |
| | 135 |
| | 2 |
| | 152 |
| | 2 |
|
| Commercial mortgage-backed | | 3 |
| | — |
| | 23 |
| | — |
| | 26 |
| | — |
|
| Government-sponsored enterprises | | 11 |
| | — |
| | 181 |
| | 5 |
| | 192 |
| | 5 |
|
| Subtotal | | 292 |
| | 8 |
| | 429 |
| | 10 |
| | 721 |
| | 18 |
|
| Equity securities: | | |
| | |
| | |
| | |
| | |
| | |
|
| Common equities | | 85 |
| | 3 |
| | — |
| | — |
| | 85 |
| | 3 |
|
| Nonredeemable preferred equities | | 16 |
| | — |
| | 17 |
| | 1 |
| | 33 |
| | 1 |
|
| Subtotal | | 101 |
| | 3 |
| | 17 |
| | 1 |
| | 118 |
| | 4 |
|
| Total | | $ | 393 |
| | $ | 11 |
| | $ | 446 |
| | $ | 11 |
| | $ | 839 |
| | $ | 22 |
|
| At December 31, 2013 | | |
| | |
| | |
| | |
| | |
| | |
|
| Fixed maturity securities: |
| Corporate | | $ | 572 |
| | $ | 20 |
| | $ | 43 |
| | $ | 2 |
| | $ | 615 |
| | $ | 22 |
|
| States, municipalities and political subdivisions | | 490 |
| | 18 |
| | 42 |
| | 3 |
| | 532 |
| | 21 |
|
| Commercial mortgage-backed | | 125 |
| | 5 |
| | — |
| | — |
| | 125 |
| | 5 |
|
| Government-sponsored enterprises | | 199 |
| | 27 |
| | 1 |
| | — |
| | 200 |
| | 27 |
|
| Foreign government | | 10 |
| | — |
| | — |
| | — |
| | 10 |
| | — |
|
| United States government | | 1 |
| | — |
| | — |
| | — |
| | 1 |
| | — |
|
| Subtotal | | 1,397 |
| | 70 |
| | 86 |
| | 5 |
| | 1,483 |
| | 75 |
|
| Equity securities: | | |
| | |
| | |
| | |
| | |
| | |
|
| Common equities | | 77 |
| | 1 |
| | — |
| | — |
| | 77 |
| | 1 |
|
| Nonredeemable preferred equities | | 42 |
| | 3 |
| | — |
| | — |
| | 42 |
| | 3 |
|
| Subtotal | | 119 |
| | 4 |
| | — |
| | — |
| | 119 |
| | 4 |
|
| Total | | $ | 1,516 |
| | $ | 74 |
| | $ | 86 |
| | $ | 5 |
| | $ | 1,602 |
| | $ | 79 |
|
| | | | | | | | | | | | | |
Contractual maturity dates for fixed-maturity investments were:
| (Dollars in millions) | | Amortized | | | Fair | | | % of fair | |
| | | cost | | | value | | | value | |
| Maturity dates occurring: | | | | | | | | | | | | |
| Less than 1 year | | $ | 588 | | | $ | 598 | | | | 6.6 | % |
| Years 1 - 5 | | | 2,927 | | | | 3,149 | | | | 34.6 | |
| Years 6 - 10 | | | 3,511 | | | | 4,002 | | | | 44.0 | |
| Due after ten years | | | 1,196 | | | | 1,344 | | | | 14.8 | |
| Total | | $ | 8,222 | | | $ | 9,093 | | | | 100.0 | % |
|
| | | | | | | | | | | |
| (Dollars in millions) | | Amortized cost | | Fair value | | % of fair value |
| At December 31, 2014 | | | |
| Maturity dates occurring: | | |
| | |
| | |
|
| Less than 1 year | | $ | 502 |
| | $ | 509 |
| | 5.4 | % |
| Years 1 - 5 | | 3,404 |
| | 3,687 |
| | 39.0 |
|
| Years 5 - 10 | | 3,322 |
| | 3,506 |
| | 37.0 |
|
| Due after ten years | | 1,643 |
| | 1,758 |
| | 18.6 |
|
| Total | | $ | 8,871 |
| | $ | 9,460 |
| | 100.0 | % |
| | | | | | | |
Actual maturities may differ from contractual maturities when there is a right to call or prepay obligations with or without call or prepayment penalties.
At December 31, 2012,2014, fixed-maturity investments with amortized cost of $85$75 million and fair value of $78 million were on deposit with various states in compliance with regulatory requirements. At December 31, 2013, fixed‑maturity investments with amortized cost of $80 million and fair value of $93$84 million were on deposit with various states in compliance with regulatory requirements.
Cincinnati Financial Corporation - 2014 10-K - Page 135
The following table provides investment income, realized investment gains and losses and the change in unrealized investment gains and losses,
and other items, by investment category:
| (In millions) | | Years ended December 31, | |
| | | 2012 | | | 2011 | | | 2010 | |
| Investment income summary: | | | | | | | | | | | | |
| Interest on fixed maturities | | $ | 420 | | | $ | 424 | | | $ | 423 | |
| Dividends on equity securities | | | 115 | | | | 104 | | | | 99 | |
| Other investment income | | | 3 | | | | 4 | | | | 4 | |
| Total | | | 538 | | | | 532 | | | | 526 | |
| Less investment expenses | | | 7 | | | | 7 | | | | 8 | |
| Total | | $ | 531 | | | $ | 525 | | | $ | 518 | |
| | | | | | | | | | | | | |
| Realized investment gains and losses summary: | | | | | | | | | | | | |
| Fixed maturities: | | | | | | | | | | | | |
| Gross realized gains | | $ | 35 | | | $ | 11 | | | $ | 25 | |
| Gross realized losses | | | - | | | | - | | | | (12 | ) |
| Other-than-temporary impairments | | | (1 | ) | | | (5 | ) | | | (3 | ) |
| Equity securities: | | | | | | | | | | | | |
| Gross realized gains | | | 39 | | | | 151 | | | | 174 | |
| Gross realized losses | | | (2 | ) | | | (40 | ) | | | - | |
| Other-than-temporary impairments | | | (32 | ) | | | (52 | ) | | | (33 | ) |
| Securities with embedded derivatives | | | 1 | | | | (1 | ) | | | 10 | |
| Other | | | 2 | | | | 6 | | | | (2 | ) |
| Total | | $ | 42 | | | $ | 70 | | | $ | 159 | |
| | | | | | | | | | | | | |
| Change in unrealized investment gains and losses and other summary: | | | | | | | | | | | | |
| Fixed maturities | | $ | 176 | | | $ | 200 | | | $ | 154 | |
| Equity securities | | | 210 | | | | 39 | | | | 70 | |
| Adjustment to deferred acquisition costs and life policy reserves | | | (28 | ) | | | (14 | ) | | | (9 | ) |
| Pension obligations | | | (13 | ) | | | (25 | ) | | | 3 | |
| Other | | | 7 | | | | 3 | | | | 5 | |
| Income taxes on above | | | (124 | ) | | | (71 | ) | | | (78 | ) |
| Total | | $ | 228 | | | $ | 132 | | | $ | 145 | |
|
| | | | | | | | | | | | |
| (Dollars in millions) | | Years ended December 31, |
| | | 2014 | | 2013 | | 2012 |
| Investment income: | | |
| | |
| | |
|
| Interest | | $ | 417 |
| | $ | 413 |
| | $ | 420 |
|
| Dividends | | 138 |
| | 122 |
| | 115 |
|
| Other | | 2 |
| | 3 |
| | 3 |
|
| Total | | 557 |
| | 538 |
| | 538 |
|
| Less investment expenses | | 8 |
| | 9 |
| | 7 |
|
| Total | | $ | 549 |
| | $ | 529 |
| | $ | 531 |
|
| | | | | | | |
| Realized investment gains and losses summary: | | |
| | |
| | |
|
| Fixed maturities: | | |
| | |
| | |
|
| Gross realized gains | | $ | 21 |
| | $ | 15 |
| | $ | 36 |
|
| Gross realized losses | | (3 | ) | | — |
| | — |
|
| Other-than-temporary impairments | | (15 | ) | | (2 | ) | | (1 | ) |
| Equity securities: | | | | | | |
|
| Gross realized gains | | 136 |
| | 64 |
| | 39 |
|
| Gross realized losses | | — |
| | — |
| | (2 | ) |
| Other-than-temporary impairments | | (9 | ) | | — |
| | (32 | ) |
| Other | | 3 |
| | 6 |
| | 2 |
|
| Total | | $ | 133 |
| | $ | 83 |
| | $ | 42 |
|
| | | | | | | |
| Change in unrealized investment gains and losses: | | |
| | |
| | |
|
| Fixed maturities | | $ | 106 |
| | $ | (387 | ) | | $ | 176 |
|
| Equity securities | | 278 |
| | 847 |
| | 210 |
|
| Less income taxes | | 134 |
| | 161 |
| | 135 |
|
| Total | | $ | 250 |
| | $ | 299 |
| | $ | 251 |
|
| | | | | | | |
For the years ended December 31,
20122014, 2013 and
2011,2012, there were no credit losses on fixed-maturity securities for which a portion of OTTI has been recognized in other comprehensive income.
During 2012,2014, we other-than-temporarily impaired 13six securities. At December 31, 2012, four2014, 144 fixed-maturity investments with a total unrealized loss of $10 million had been in an unrealized loss position for 12 months or more. Of that total, no fixed-maturity investments had fair values below 70 percent of amortized cost. There were three equity security investments in an unrealized loss position for 12 months or more with a total unrealized loss of $1 million as of December 31, 2014. Of that total, no equity security investments had fair values below 70 percent of cost.
During 2013, we other-than-temporarily impaired seven securities. At December 31, 2013, 40 fixed-maturity investments with a total unrealized loss of $5 million had been in an unrealized loss position for 12 months or more. Of that total, no fixed-maturity investments had fair values below 70 percent of amortized cost. There were no equity security investments in an unrealized loss position for 12 months or more as of December 31, 2012.2013.
During 2011,2012, we other-than-temporarily impaired 1213 securities. At December 31, 2011, 202012, four fixed-maturity investments with a total unrealized loss of $5$1 million had been in an unrealized loss position for 12 months or more. Of that total, no fixed-maturity investments had fair values below 70 percent of amortized cost. TwoThere were no equity security investments with a total unrealized loss of less than $1 million had been in an unrealized loss position for 12 months or more as of December 31, 2011. Of that total, no equity investments were trading below 70 percent of cost.During 2010, we other-than-temporarily impaired 15 securities. At December 31, 2010, 17 fixed-maturity investments with a total unrealized loss of $4 million had been in an unrealized loss position for 12 months or more. Of that total, no fixed-maturity investments had fair values below 70 percent of amortized cost. Three equity investments with a total unrealized loss of $1 million had been in an unrealized loss position for 12 months or more as of December 31, 2010. Of that total, no equity investments were trading below 70 percent of cost.
When determining OTTI charges for our fixed-maturity portfolio, management places significant emphasis on whether issuers of debt are current on contractual payments and whether future contractual amounts are likely to be paid. As required by ASC 320, our invested asset impairment policy for fixed-maturity securities states that OTTI is considered to have occurred (1) if we intend to sell the impaired fixed-maturity security or (2) if it is more likely than not we will be required to sell the impaired fixed-maturity security before recovery of its amortized cost basis. If we intend to sell or it is more likely than not we will be required to sell, the amortized cost of any such securities is reduced to fair value as the new cost basis, and a realized loss is recorded in the period in which it is recognized. When we believe that full collection of interest and/or principal is not likely, we determine the net present value of future cash flows by using the effective interest rate implicit in the security at the date of acquisition as the discount rate and compare that amount to the amortized cost and fair value of the security. The difference between the net present value of the expected future cash flows and amortized cost of the security is considered a credit loss and recognized as a realized loss in the period in which it occurred. The difference between the fair value and the net present value of the
cash flows of the security, the noncredit loss, is recognized in other comprehensive income as an unrealized loss.
When determining OTTI charges for our equity portfolio, our invested asset impairment policy considers qualitative and quantitative factors, including facts and circumstances specific to individual securities, asset classes, the financial condition of the issuer, changes in dividend payment, the length of time fair value had been less than cost, the severity of the decline in fair value below cost, the volatility of the security and our ability and intent to hold each position until its forecasted recovery.
For each of our equity securities in an unrealized loss position at December 31, 2012, we applied the objective qualitative and quantitative criteria of our invested asset impairment policy for OTTI. Our long-term equity investment philosophy, emphasizing companies with strong indications of paying and growing dividends, combined with our strong surplus, liquidity and cash flow, supports our ability to hold these investments to recovery. Based on the individual qualitative and quantitative factors, as discussed above, we evaluate and determine an expected recovery period for each security. A change in the condition of a security can warrant impairment before the expected recovery period. If the security has not recovered cost within the expected recovery period, the security is other-than-temporarily impaired.
3. | Fair Value Measurements |
2012.
Cincinnati Financial Corporation - 2014 10-K - Page 136
NOTE 3 – Fair Value Measurements
Fair Value Hierarchy
In accordance with accounting guidance for fair value measurements and disclosures, we categorized our financial instruments, based on the priority of the observable and market-based data for the valuation technique used, into a three-level fair value hierarchy.
The fair value hierarchy gives the highest priority to quoted prices with readily available independent data in active markets for identical assets or liabilities (Level 1) and the lowest priority to unobservable market inputs (Level 3). When various inputs for measurement fall within different levels of the fair value hierarchy, the lowest observable input that has a significant impact on fair value measurement is used. Our valuation techniques have not changed from those used at December 31,
2011,2013, and ultimately management determines fair value.
Financial instruments reported at fair value in our consolidated financial statements are categorized based upon the following characteristics or inputs to the valuation techniques:
Level 1 – Financial assets and liabilities for which inputs are observable and are obtained from reliable quoted prices for identical assets or liabilities in active markets. This is the most reliable fair value measurement and includes, for example, active exchange-traded equity securities.
Level 2 – Financial assets and liabilities for which values are based on quoted prices in markets that are not active or for which values are based on similar assets and liabilities that are actively traded. This also includes pricing models for which the inputs are corroborated by market data.
Level 3 – Financial assets and liabilities for which values are based on prices or valuation techniques that require inputs that are both unobservable and significant to the overall fair value measurement. Level 3 inputs include the following:
| · | Level 1 – Financial assets and liabilities for which inputs are observable and are obtained from reliable quoted prices for identical assets or liabilities in active markets. This is the most reliable fair value measurement and includes, for example, active exchange-traded equity securities. |
| · | Level 2 – Financial assets and liabilities for which values are based on quoted prices in markets that are not active or for which values are based on similar assets and liabilities that are actively traded. This also includes pricing models for which the inputs are corroborated by market data. |
| · | Level 3 – Financial assets and liabilities for which values are based on prices or valuation techniques that require inputs that are both unobservable and significant to the overall fair value measurement. Level 3 inputs include the following: |
| o◦ | Quotes from brokers or other external sources that are not considered binding; |
| | |
| o |
| ◦ | Quotes from brokers or other external sources where it cannot be determined that market participants would in fact transact for the asset or liability at the quoted price; or |
| | |
| o |
| ◦ | Quotes from brokers or other external sources where the inputs are not deemed observable. |
We conduct a thorough review of fair value hierarchy classifications on a quarterly basis. We primarily base fair value for investments in equity and fixed-maturity securities (including redeemable preferred stock and assets held in separate accounts) on quoted market prices or on prices from a nationally recognized pricing vendor, an outside resource that supplies global securities pricing, dividend, corporate action and descriptive information to support fund pricing, securities operations, research and portfolio management. The company obtains and reviews the pricing service’s valuation methodologies and related inputs and validates these prices by replicating a sample across each asset class using a discounted cash flow model. When a price is not available from these sources, as in the case of securities that are not publicly traded, we determine the fair value using various inputs including quotes from independent brokers. We have generally obtained and evaluated two nonbinding quotes from brokers; our investment professionals determine our best estimate of fair value. The fair value of investments not priced by a pricing vendor is less than 1 percent of the fair value of our total investment portfolio. Reclassification of certain financial instruments may occur when input observability changes. All reclassifications are reported as transfers in or out of the Level 3 category as of the beginning of the quarter in which the reclassification occurred.
The technique used for the Level 2 fixed-maturity securities and taxable fixed maturities in separate accounts is the application of matrix pricing. The inputs used include relevant market information by asset class, trade activity of like securities, yield to maturity and economic events. All of the Level 2 fixed-maturity securities are priced by a nationally recognized pricing vendor.
The Level 2
nonredeemable preferred equities technique used is the application of matrix pricing. The inputs used, similar to those used by the pricing vendor for our fixed-maturity securities, include relevant market information, trade activity of like securities, yield to maturity, corporate action notices and economic events. All of the Level 2
nonredeemable preferred equities are priced by a nationally recognized pricing vendor.
The following tables illustrate the fair value hierarchy for those assets measured at fair value on a recurring basis
for the years endedat December 31,
20122014 and
2011.2013. We do not have any material liabilities carried at fair value. There were no transfers between Level 1 and Level
2.| (In millions) | | Quoted prices in
active markets for
identical assets
(Level 1) | | | Significant other
observable inputs
(Level 2) | | | Significant
unobservable
inputs
(Level 3) | | | Total | |
| At December 31, 2012 | | | | | | | | | | | | | | | | |
| Fixed maturities, available for sale: | | | | | | | | | | | | | | | | |
| States, municipalities and political subdivisions | | $ | - | | | $ | 3,288 | | | $ | 1 | | | $ | 3,289 | |
| Convertibles and bonds with warrants attached | | | - | | | | 31 | | | | - | | | | 31 | |
| United States government | | | 8 | | | | - | | | | - | | | | 8 | |
| Government-sponsored enterprises | | | - | | | | 164 | | | | - | | | | 164 | |
| Foreign government | | | - | | | | 3 | | | | - | | | | 3 | |
| Commercial mortgage-backed securities | | | - | | | | 28 | | | | - | | | | 28 | |
| Corporate securities | | | - | | | | 5,567 | | | | 3 | | | | 5,570 | |
| Subtotal | | | 8 | | | | 9,081 | | | | 4 | | | | 9,093 | |
| Common equities, available for sale | | | 3,238 | | | | - | | | | - | | | | 3,238 | |
| Preferred equities, available for sale | | | - | | | | 134 | | | | 1 | | | | 135 | |
| Taxable fixed-maturities separate accounts | | | - | | | | 689 | | | | - | | | | 689 | |
| Top Hat Savings Plan | | | 9 | | | | - | | | | - | | | | 9 | |
| Total | | $ | 3,255 | | | $ | 9,904 | | | $ | 5 | | | $ | 13,164 | |
| | | | | | | | | | | | | | | | | |
| At December 31, 2011 | | | | | | | | | | | | | | | | |
| Fixed maturities, available for sale: | | | | | | | | | | | | | | | | |
| States, municipalities and political subdivisions | | $ | - | | | $ | 3,249 | | | $ | 3 | | | $ | 3,252 | |
| Convertibles and bonds with warrants attached | | | - | | | | 59 | | | | - | | | | 59 | |
| United States government | | | 7 | | | | - | | | | - | | | | 7 | |
| Government-sponsored enterprises | | | - | | | | 160 | | | | - | | | | 160 | |
| Foreign government | | | - | | | | 3 | | | | - | | | | 3 | |
| Corporate securities | | | - | | | | 5,280 | | | | 18 | | | | 5,298 | |
| Subtotal | | | 7 | | | | 8,751 | | | | 21 | | | | 8,779 | |
| Common equities, available for sale | | | 2,854 | | | | - | | | | - | | | | 2,854 | |
| Preferred equities, available for sale | | | - | | | | 98 | | | | 4 | | | | 102 | |
| Taxable fixed-maturities separate accounts | | | - | | | | 628 | | | | - | | | | 628 | |
| Top Hat Savings Plan | | | 8 | | | | - | | | | - | | | | 8 | |
| Total | | $ | 2,869 | | | $ | 9,477 | | | $ | 25 | | | $ | 12,371 | |
2 for the years ended December 31, 2014 and 2013.
Cincinnati Financial Corporation - 2014 10-K - Page 137
|
| | | | | | | | | | | | | | | | |
| (Dollars in millions) | | Quoted prices in active markets for
identical assets
(Level 1) | | | | Significant unobservable
inputs
(Level 3) | | |
| At December 31, 2014 | | | Significant other observable inputs (Level 2) | | | Total |
| Fixed maturities, available for sale: | | |
| | |
| | |
| | |
|
| Corporate | | $ | — |
| | $ | 5,508 |
| | $ | 18 |
| | $ | 5,526 |
|
| States, municipalities and political subdivisions | | — |
| | 3,443 |
| | — |
| | 3,443 |
|
| Commercial mortgage-backed | | — |
| | 259 |
| | — |
| | 259 |
|
| Government-sponsored enterprises | | — |
| | 208 |
| | — |
| | 208 |
|
| Foreign government | | — |
| | 10 |
| | — |
| | 10 |
|
| Convertibles and bonds with warrants attached | | — |
| | 7 |
| | — |
| | 7 |
|
| United States government | | 7 |
| | — |
| | — |
| | 7 |
|
| Subtotal | | 7 |
| | 9,435 |
| | 18 |
| | 9,460 |
|
| Common equities, available for sale | | 4,679 |
| | — |
| | — |
| | 4,679 |
|
| Nonredeemable preferred equities, available for sale | | — |
| | 177 |
| | 2 |
| | 179 |
|
| Separate accounts taxable fixed maturities | | — |
| | 731 |
| | — |
| | 731 |
|
| Top Hat Savings Plan - mutual funds and common equities (included in Other assets) | | 18 |
| | — |
| | — |
| | 18 |
|
| Total | | $ | 4,704 |
| | $ | 10,343 |
| | $ | 20 |
| | $ | 15,067 |
|
| | | | | | | | | |
| At December 31, 2013 | | |
| | |
| | |
| | |
|
| Fixed maturities, available for sale: | | |
| | |
| | |
| | |
|
| Corporate | | $ | — |
| | $ | 5,531 |
| | $ | 2 |
| | $ | 5,533 |
|
| States, municipalities and political subdivisions | | — |
| | 3,211 |
| | — |
| | 3,211 |
|
| Commercial mortgage-backed | | — |
| | 143 |
| | — |
| | 143 |
|
| Government-sponsored enterprises | | — |
| | 200 |
| | — |
| | 200 |
|
| Foreign government | | — |
| | 10 |
| | — |
| | 10 |
|
| Convertibles and bonds with warrants attached | | — |
| | 17 |
| | — |
| | 17 |
|
| United States government | | 7 |
| | — |
| | — |
| | 7 |
|
| Subtotal | | 7 |
| | 9,112 |
| | 2 |
| | 9,121 |
|
| Common equities, available for sale | | 4,213 |
| | — |
| | — |
| | 4,213 |
|
| Nonredeemable preferred equities, available for sale | | — |
| | 160 |
| | 2 |
| | 162 |
|
| Separate accounts taxable fixed maturities | | — |
| | 682 |
| | — |
| | 682 |
|
| Top Hat Savings Plan - mutual funds and common equities (included in Other assets) | | 14 |
| | — |
| | — |
| | 14 |
|
| Total | | $ | 4,234 |
| | $ | 9,954 |
| | $ | 4 |
| | $ | 14,192 |
|
| | | | | | | | | |
Each financial instrument that was deemed to have significant unobservable inputs when determining valuation is identified in the following tables by security type with a summary of changes in fair value as offor the years ended December 31, 2012.2014 and 2013. Total Level 3 assets continue to be less than 1 percent of financial assets measured at fair value in the consolidated balance sheets. Assets presented in the table below were valued based primarily on broker/dealer quotes for which there is a lack of transparency as to inputs used to develop the valuations. Transfers into Level 3 included situations where a fair value quote was not provided by the company's nationally recognized pricing vendor and as a result the price was stale or had been replaced with a broker quote where the inputs had not been corroborated to be market observable resulting in the security being classified as Level 3. Transfers out of Level 3 included situations where a broker quote was used in the prior period and a fair value quote became available from the company's pricing vendor in the current period. A quote utilizing the new pricing source was not available as of the prior period, and any gains or losses related to the change in valuation source for individual securities were not significant.
Cincinnati Financial Corporation - 2014 10-K - Page 138
The quantitative detail of these unobservable inputs is neither provided nor reasonably available to us.
The following
tables providetable provides the change in Level 3 assets during
20122014 and
2011:| (In millions) | | Asset fair value measurements using significant unobservable inputs (Level 3) | |
| | | Corporate fixed
maturities | | | Taxable fixed
maturities-
separate
accounts | | | States,
municipalities
and political
subdivisions
fixed maturities | | | Preferred
equities | | | Total | |
| Beginning balance, January 1, 2012 | | $ | 18 | | | $ | - | | | $ | 3 | | | $ | 4 | | | $ | 25 | |
| Total gains or losses (realized/unrealized): | | | | | | | | | | | | | | | | | | | | |
| Included in earnings (or changes in net assets) | | | - | | | | - | | | | - | | | | - | | | | - | |
| Included in other comprehensive income | | | 2 | | | | - | | | | - | | | | 2 | | | | 4 | |
| Purchases | | | - | | | | - | | | | - | | | | 1 | | | | 1 | |
| Sales | | | (4 | ) | | | - | | | | (2 | ) | | | - | | | | (6 | ) |
| Transfers into Level 3 | | | 1 | | | | - | | | | - | | | | - | | | | 1 | |
| Transfers out of Level 3 | | | (14 | ) | | | - | | | | - | | | | (6 | ) | | | (20 | ) |
| Ending balance, December 31, 2012 | | $ | 3 | | | $ | - | | | $ | 1 | | | $ | 1 | | | $ | 5 | |
| | | | | | | | | | | | | | | | | | | | | |
| Beginning balance, January 1, 2011 | | $ | 20 | | | $ | 2 | | | $ | 4 | | | $ | 5 | | | $ | 31 | |
| Total gains or losses (realized/unrealized): | | | | | | | | | | | | | | | | | | | | |
| Included in earnings (or changes in net assets) | | | - | | | | - | | | | - | | | | - | | | | - | |
| Included in other comprehensive income | | | - | | | | - | | | | - | | | | - | | | | - | |
| Purchases | | | 16 | | | | - | | | | - | | | | - | | | | 16 | |
| Sales | | | - | | | | - | | | | (1 | ) | | | - | | | | (1 | ) |
| Transfers into Level 3 | | | 10 | | | | - | | | | - | | | | 1 | | | | 11 | |
| Transfers out of Level 3 | | | (28 | ) | | | (2 | ) | | | - | | | | (2 | ) | | | (32 | ) |
| Ending balance, December 31, 2011 | | $ | 18 | | | $ | - | | | $ | 3 | | | $ | 4 | | | $ | 25 | |
2013:
|
| | | | | | | | | | | | | | | | |
| (Dollars in millions) | Asset fair value measurements using significant unobservable inputs (Level 3) |
| | | Corporate fixed maturities | | States, municipalities and political subdivisions fixed maturities | | Nonredeemable preferred equities | | Total |
| Beginning balance, January 1, 2014 | | $ | 2 |
| | $ | — |
| | $ | 2 |
| | $ | 4 |
|
| Total gains or losses (realized/unrealized): | | |
| | |
| | |
| | |
|
| Included in net income | | — |
| | — |
| | — |
| | — |
|
| Included in other comprehensive income | | — |
| | — |
| | — |
| | — |
|
| Purchases | | — |
| | — |
| | — |
| | — |
|
| Sales | | — |
| | — |
| | — |
| | — |
|
| Transfers into Level 3 | | 16 |
| | — |
| | — |
| | 16 |
|
| Transfers out of Level 3 | | — |
| | — |
| | — |
| | — |
|
| Ending balance, December 31, 2014 | | $ | 18 |
| | $ | — |
| | $ | 2 |
| | $ | 20 |
|
| | | | | | | | | |
| Beginning balance, January 1, 2013 | | $ | 3 |
| | $ | 1 |
| | $ | 1 |
| | $ | 5 |
|
| Total gains or losses (realized/unrealized): | | |
| | |
| | |
| | |
|
| Included in net income | | — |
| | — |
| | — |
| | — |
|
| Included in other comprehensive income | | — |
| | — |
| | — |
| | — |
|
| Purchases | | — |
| | — |
| | 1 |
| | 1 |
|
| Sales | | — |
| | (1 | ) | | — |
| | (1 | ) |
| Transfers into Level 3 | | — |
| | — |
| | — |
| | — |
|
| Transfers out of Level 3 | | (1 | ) | | — |
| | — |
| | (1 | ) |
| Ending balance, December 31, 2013 | | $ | 2 |
| | $ | — |
| | $ | 2 |
| | $ | 4 |
|
| | | | | | | | | |
With the exception of the Level 3
reconciliationrollforward table, additional disclosure for the Level 3 category is not material.
Fair Value Disclosure for Assets and Liabilities Not Carried at Fair Value
The disclosures below are presented to provide information about the effects of current market conditions on financial instruments that are not reported at fair value in our consolidated financial statements.
The following table shows fair values of our note payable and long-term
debt subject to fair value disclosure requirements:| (In millions) | | Quoted prices
in active
markets for
identical assets
(Level 1) | | | Significant
other
observable
inputs
(Level 2) | | | Significant
unobservable
inputs
(Level 3) | | | Total | |
| At December 31, 2012 | | | | | | | | | | | | | | | | |
| Note payable | | $ | - | | | $ | 104 | | | $ | - | | | $ | 104 | |
| 6.900% senior debentures, due 2028 | | | - | | | | 31 | | | | - | | | | 31 | |
| 6.920% senior debentures, due 2028 | | | - | | | | 479 | | | | - | | | | 479 | |
| 6.125% senior notes, due 2034 | | | - | | | | 431 | | | | - | | | | 431 | |
| Total | | $ | - | | | $ | 1,045 | | | $ | - | | | $ | 1,045 | |
| | | | | | | | | | | | | | | | | |
| At December 31, 2011 | | | | | | | | | | | | | | | | |
| Note payable | | $ | - | | | $ | 104 | | | $ | - | | | $ | 104 | |
| 6.900% senior debentures, due 2028 | | | - | | | | 31 | | | | - | | | | 31 | |
| 6.920% senior debentures, due 2028 | | | - | | | | 410 | | | | - | | | | 410 | |
| 6.125% senior notes, due 2034 | | | - | | | | 373 | | | | - | | | | 373 | |
| Total | | $ | - | | | $ | 918 | | | $ | - | | | $ | 918 | |
debt:
|
| | | | | | | | | | | | | | | | |
| (Dollars in millions) | | Quoted prices in active markets for
identical assets
(Level 1) | | Significant other
observable inputs
(Level 2) | | Significant unobservable inputs (Level 3) | | Total |
| At December 31, 2014 | | | | |
| Note payable | | $ | — |
| | $ | 49 |
| | $ | — |
| | $ | 49 |
|
| 6.900% senior debentures, due 2028 | | — |
| | 34 |
| | — |
| | 34 |
|
| 6.920% senior debentures, due 2028 | | — |
| | 496 |
| | — |
| | 496 |
|
| 6.125% senior notes, due 2034 | | — |
| | 449 |
| | — |
| | 449 |
|
| Total | | $ | — |
| | $ | 1,028 |
| | $ | — |
| | $ | 1,028 |
|
| | | | | | | | | |
| At December 31, 2013 | | | | | | | | |
| Note payable | | $ | — |
| | $ | 104 |
| | $ | — |
| | $ | 104 |
|
| 6.900% senior debentures, due 2028 | | — |
| | 30 |
| | — |
| | 30 |
|
| 6.920% senior debentures, due 2028 | | — |
| | 458 |
| | — |
| | 458 |
|
| 6.125% senior notes, due 2034 | | — |
| | 399 |
| | — |
| | 399 |
|
| Total | | $ | — |
| | $ | 991 |
| | $ | — |
| | $ | 991 |
|
| | | | | | | | | |
Cincinnati Financial Corporation - 2014 10-K - Page 139
Fair value of the note payable was determined based upon the outstanding balance at December 31,
2012,2014 and 2013, because it is short term and tied to a variable interest rate. The note payable was classified as Level 2 as a market does not exist.
Fair value of the long-term debt was determined under the fair value measurements and disclosure accounting rules based on market pricing of similar debt instruments that are actively trading. We determine fair value for our debt the same way that we value corporate fixed maturities in our investment portfolio. Fair value can vary with macroeconomic conditions. Regardless of the fluctuations in fair value, the outstanding principal amount of our long-term debt is $793 million.$793 million at both December 31, 2014 and 2013. None of the long-term debt is encumbered by rating triggers.
The following table shows the fair value of our life policy loans, included in other invested
assets, subject to fair value disclosure requirements:| (In millions) | | Quoted prices in
active markets for
identical assets
(Level 1) | | | Significant other
observable inputs
(Level 2) | | | Significant
unobservable
inputs
(Level 3) | | | Total | |
| At December 31, 2012 | | | | | | | | | | | | | | | | |
| Life policy loans | | $ | - | | | $ | - | | | $ | 50 | | | $ | 50 | |
| | | | | | | | | | | | | | | | | |
| At December 31, 2011 | | | | | | | | | | | | | | | | |
| Life policy loans | | $ | - | | | $ | - | | | $ | 43 | | | $ | 43 | |
Outstandingassets:
|
| | | | | | | | | | | | | | | | |
| (Dollars in millions) | | Quoted prices in active markets for identical assets (Level 1) | | Significant other observable inputs (Level 2) | | Significant unobservable inputs (Level 3) | | Total |
| At December 31, 2014 | | | | |
| Life policy loans | | $ | — |
| | $ | — |
| | $ | 39 |
| | $ | 39 |
|
| | | | | | | | | |
| At December 31, 2013 | | | | | | | | |
| Life policy loans | | $ | — |
| | $ | — |
| | $ | 45 |
| | $ | 45 |
|
| | | | | | | | | |
Recorded outstanding principal and interest for these life policy loans was $37were $31 million and $36 million at December 31, 2012,2014 and December 31, 2011.2013, respectively. To determine the fair value, we make the following significant assumptions: (1) the discount rates used to calculate the present value of expected payments are the risk-free spot rates, as nonperformance risk is minimal; and (2) the loan repayment rate by which policyholders pay off their loan balances is in line with past experience. The following table shows fair value of our deferred annuities and structured settlements included in life policy and investment contract
reserves, subject to fair value disclosure requirements:| (In millions) | | Quoted prices in
active markets for
identical assets
(Level 1) | | | Significant other
observable inputs
(Level 2) | | | Significant
unobservable
inputs
(Level 3) | | | Total | |
| At December 31, 2012 | | | | | | | | | | | | | | | | |
| Deferred annuities | | $ | - | | | $ | - | | | $ | 898 | | | $ | 898 | |
| Structured settlements | | | - | | | | 240 | | | | - | | | | 240 | |
| Total | | $ | - | | | $ | 240 | | | $ | 898 | | | $ | 1,138 | |
| | | | | | | | | | | | | | | | | |
| At December 31, 2011 | | | | | | | | | | | | | | | | |
| Deferred annuities | | $ | - | | | $ | - | | | $ | 794 | | | $ | 794 | |
| Structured settlements | | | - | | | | 208 | | | | - | | | | 208 | |
| Total | | $ | - | | | $ | 208 | | | $ | 794 | | | $ | 1,002 | |
reserves:
|
| | | | | | | | | | | | | | | | |
| (Dollars in millions) | | Quoted prices in active markets for identical assets (Level 1) | | Significant other observable inputs (Level 2) | | Significant unobservable inputs (Level 3) | | Total |
| At December 31, 2014 | | | | |
| Deferred annuities | | $ | — |
| | $ | — |
| | $ | 897 |
| | $ | 897 |
|
| Structured settlements | | — |
| | 217 |
| | — |
| | 217 |
|
| Total | | $ | — |
| | $ | 217 |
| | $ | 897 |
| | $ | 1,114 |
|
| | | | | | | | | |
| At December 31, 2013 | | | | | | | | |
| Deferred annuities | | $ | — |
| | $ | — |
| | $ | 911 |
| | $ | 911 |
|
| Structured settlements | | — |
| | 219 |
| | — |
| | 219 |
|
| Total | | $ | — |
| | $ | 219 |
| | $ | 911 |
| | $ | 1,130 |
|
| | | | | | | | | |
Recorded reserves for the deferred annuities
were $863 million and
$862 million at December 31, 2014 and 2013, respectively. Recorded reserves for the structured settlements were
$1.043 billion$182 million and
$1.025 billion$189 million at December 31,
2012,2014 and
December 31, 2011,2013, respectively.
Fair values for deferred annuities
arewere calculated based upon internally developed models because active, observable markets do not exist for those items. To determine the fair value, we
makemade the following significant assumptions: (1) the discount rates used to calculate the present value of expected payments are the risk-free spot rates plus an A3 rated bond spread for financial issuers at December 31,
2012,2014 and 2013, to account for nonperformance risk; (2) the rate of interest credited to policyholders is the portfolio net earned interest rate less a spread for expenses and profit; and (3) additional lapses occur when the credited interest rate is exceeded by an assumed competitor credited rate, which is a function of the risk-free rate of the economic scenario being modeled.
Cincinnati Financial Corporation - 2014 10-K - Page 140
Determination of fair value for structured settlements assumes the discount rates used to calculate the present value of expected payments are the risk-free spot rates plus an A3 rated bond spread for financial issuers at December
2012,31, 2014 and 2013, to account for nonperformance risk.
4. | Property Casualty Loss and Loss Expenses |
NOTE 4 – Property Casualty Loss and Loss Expenses
This table summarizes activity for our consolidated property casualty loss and loss expense reserves:
| (In millions) | | Years ended December 31, | |
| | | 2012 | | | 2011 | | | 2010 | |
| Gross loss and loss expense reserves, January 1 | | $ | 4,280 | | | $ | 4,137 | | | $ | 4,096 | |
| Less reinsurance receivable | | | 375 | | | | 326 | | | | 435 | |
| Net loss and loss expense reserves, January 1 | | | 3,905 | | | | 3,811 | | | | 3,661 | |
| Net incurred loss and loss expenses related to: | | | | | | | | | | | | |
| Current accident year | | | 2,533 | | | | 2,620 | | | | 2,319 | |
| Prior accident years | | | (396 | ) | | | (285 | ) | | | (304 | ) |
| Total incurred | | | 2,137 | | | | 2,335 | | | | 2,015 | |
| Net paid loss and loss expenses related to: | | | | | | | | | | | | |
| Current accident year | | | 1,123 | | | | 1,206 | | | | 939 | |
| Prior accident years | | | 1,106 | | | | 1,035 | | | | 926 | |
| Total paid | | | 2,229 | | | | 2,241 | | | | 1,865 | |
| | | | | | | | | | | | | |
| Net loss and loss expense reserves, December 31 | | | 3,813 | | | | 3,905 | | | | 3,811 | |
| Plus reinsurance receivable | | | 356 | | | | 375 | | | | 326 | |
| Gross loss and loss expense reserves, December 31 | | $ | 4,169 | | | $ | 4,280 | | | $ | 4,137 | |
|
| | | | | | | | | | | | |
| (Dollars in millions) | | Years ended December 31, |
| | | 2014 | | 2013 | | 2012 |
| Gross loss and loss expense reserves, January 1 | | $ | 4,241 |
| | $ | 4,169 |
| | $ | 4,280 |
|
| Less reinsurance recoverable | | 299 |
| | 356 |
| | 375 |
|
| Net loss and loss expense reserves, January 1 | | 3,942 |
| | 3,813 |
| | 3,905 |
|
| Net incurred loss and loss expenses related to: | | |
| | |
| | |
|
| Current accident year | | 2,725 |
| | 2,448 |
| | 2,533 |
|
| Prior accident years | | (98 | ) | | (147 | ) | | (396 | ) |
| Total incurred | | 2,627 |
| | 2,301 |
| | 2,137 |
|
| Net paid loss and loss expenses related to: | | |
| | |
| | |
|
| Current accident year | | 1,212 |
| | 1,045 |
| | 1,123 |
|
| Prior accident years | | 1,201 |
| | 1,127 |
| | 1,106 |
|
| Total paid | | 2,413 |
| | 2,172 |
| | 2,229 |
|
| | | | | | | |
| Net loss and loss expense reserves, December 31 | | 4,156 |
| | 3,942 |
| | 3,813 |
|
| Plus reinsurance recoverable | | 282 |
| | 299 |
| | 356 |
|
| Gross loss and loss expense reserves, December 31 | | $ | 4,438 |
| | $ | 4,241 |
| | $ | 4,169 |
|
| | | | | | | |
We use actuarial methods, models and judgment to estimate, as of a financial statement date, the property casualty loss and loss expense reserves required to pay for and settle all outstanding insured claims, including incurred but not reported (IBNR) claims, as of that date. The actuarial estimate is subject to review and adjustment by an
inter-departmental committee that includes actuarial management that is familiar with relevant company and industry business, claims and underwriting trends, as well as general economic and legal trends that could affect future loss and loss expense payments. The amount we will actually have to pay for claims can be highly uncertain. This uncertainty, together with the size of our reserves, makes the loss and loss expense reserves our most significant estimate. The reserve for loss and loss expenses in the consolidated balance sheets also includes $61
$47 million, $59$70 million and $63$61 million for certain accident, life and health loss reserves at December 31, 2014, 2013 and 2012, 2011 and 2010, respectively.
During
2012,2014, we experienced
$396$98 million of favorable
loss and loss expense reserve development on prior accident years including
$292$57 million
of favorable development in commercial
lines, $12 million of favorable development in personal lines and $29 million of favorable development in excess and surplus lines. Favorable development in
20122014 was
$111$49 million
moreless than in
2011, in part2013, largely due to
$39 million for catastrophe losses.the change in prior accident years before catastrophes. Overall favorable development for commercial lines reserves illustrated the potential for revisions inherent in estimating reserves, especially for long-tail lines such as commercial casualty and workers’ compensation. We recognized favorable reserve development of
$177 million for the commercial casualty line, $74$51 million for the workers’ compensation line,
$34 million for the commercial property line and
$52$14 million for the homeowner line, due to reduced uncertainty of
prior accident year loss and loss adjustment expense for these
lines one year later.lines. Our commercial casualty line experienced $5 million of adverse development due to an increase in its paid loss and loss expenses for cumulative accident years three or more years old, resulting in an increase recognized in estimates for IBNR losses and loss expenses for all prior accident years in total compared to 2013 and 2012. Our commercial auto line developed unfavorably by $39 million during 2014 due to higher loss cost effects in recent accident years, resulting in an increase of our reserve estimate for claims that have not yet been settled.
During 2011,2013, we experienced $285$147 million of favorable loss development on prior accident years including $234$95 million
of favorable development in commercial lines, $39 million of favorable development in personal lines and $13 million of favorable development in excess and surplus lines. Favorable development in 2013 was $249 million less than in 2012, largely due to the change in prior accident years before catastrophes. Overall favorable
Cincinnati Financial Corporation - 2014 10-K - Page 141
development for commercial lines reserves illustrated the potential for revisions inherent in estimating reserves, especially for long-tail lines such as commercial casualty and workers’ compensation. We recognized favorable reserve development of $70 million for the commercial casualty line, $22 million for the commercial property line, $14 million for the workers' compensation line and $19 million for the homeowner line, due to reduced uncertainty of prior accident year loss and loss adjustment expense for these lines.
During 2012, we experienced $396 million of favorable development on prior accident years including $292 million of favorable development in commercial lines, $99 million of favorable development in personal lines and $5 million of favorable development in excess and surplus lines. Overall favorable development for commercial lines reserves illustrated the potential for revisions inherent in estimating reserves, especially for long-tail lines such as commercial casualty and workers’ compensation. We recognized favorable reserve development of $132$177 million for the commercial casualty line, $74 million for the workers’ compensation line and $97$52 million for the workers’ compensationhomeowner line, due to reduced uncertainty of these lines one year later.During 2010, we experienced $304 million of favorable loss development on prior accident years including $269 million in commercialyear loss and loss adjustment expense for these lines. Overall favorable development for commercial lines reserves illustrated the potential for revisions inherent in estimating reserves, especially for long-tail lines such as commercial casualty and workers’ compensation. We recognized favorable reserve development of $186 million for the commercial casualty line and $39 million for the workers’ compensation line due to reduced uncertainty of these lines one year later.
Asbestos and Environmental Reserves
We carried $67$81 million of net loss and loss expense reserves for asbestos and environmental claims and $54
$51 million of reserves for mold claims at year-end 2012,December 31, 2014, compared with $74$77 million and $62$51 million, respectively, for such claims at year-end 2011.December 31, 2013. The asbestos and environmental claims amounts for each respective year constituted 1.82.0 percent and 1.9 percent of total net loss and loss expense reserves at these year-end dates. We believe our exposure to asbestos and environmental claims is limited, largely because our reinsurance retention was $500,000$500,000 or below prior to 1987. We also were predominantly a personal lines company in the 1960s and 1970s. During the 1980s and early 1990s, commercial lines grew as a percentage of our overall business and our exposure to asbestos and environmental claims grew accordingly. Over that period, we included an asbestos and environmental exclusion in most policies or endorsed the exclusion to the policies. We have not engaged in any mergers or acquisitions through which such a liability could have been assumed. We continue to monitor our claims for evidence of material exposure to other mass tort classes such as silicosis, but we have found no such credible evidence to date.5. | Life Policy and Investment Contract Reserves |
NOTE 5 – Life Policy and Investment Contract Reserves
We establish the reserves for traditional life insurance policies based on expected expenses, mortality, morbidity, withdrawal rates, timing of claim presentation and investment yields, including a provision for uncertainty. Once these assumptions are established, they generally are maintained throughout the lives of the contracts. We use both our own experience and industry experience, adjusted for historical trends, in arriving at our assumptions for expected mortality, morbidity and withdrawal rates as well as for expected expenses. We base our assumptions for expected investment income on our own experience adjusted for current economic conditions.
We establish reserves for the company’s universal life, deferred annuity and structured settlement policies equal to the cumulative account balances, which include premium deposits plus credited interest less charges and withdrawals. Some of our universal life policies contain no-lapse guarantee provisions. For these policies, we establish a reserve in addition to the account balance, based on expected no-lapse guarantee benefits and expected policy assessments.
This table summarizes our life policy and investment contract reserves:
| (In millions) | | At December 31, | |
| | | 2012 | | | 2011 | |
| Ordinary/traditional life | | $ | 752 | | | $ | 691 | |
| Universal life | | | 483 | | | | 481 | |
| Deferred annuities | | | 850 | | | | 827 | |
| Structured settlements | | | 193 | | | | 198 | |
| Other | | | 17 | | | | 17 | |
| Total life policy and investment contract reserves | | $ | 2,295 | | | $ | 2,214 | |
6. | Deferred Policy Acquisition Costs |
|
| | | | | | | | |
| (Dollars in millions) | | At December 31, |
| | | 2014 | | 2013 |
| Ordinary/traditional life | | $ | 875 |
| | $ | 815 |
|
| Deferred annuities | | 863 |
| | 862 |
|
| Universal life | | 530 |
| | 508 |
|
| Structured settlements | | 182 |
| | 189 |
|
| Other | | 47 |
| | 16 |
|
| Total life policy and investment contract reserves | | $ | 2,497 |
| | $ | 2,390 |
|
| | | | | |
Cincinnati Financial Corporation - 2014 10-K - Page 142
NOTE 6 – Deferred Policy Acquisition Costs
Expenses associated with successfully acquiring insurance policies – primarily commissions, premium taxes and underwriting costs – are deferred and amortized over the terms of the policies. We update our acquisition cost assumptions periodically to reflect actual experience, and we evaluate the costs for recoverability. All acquisition costs reflect ASU 2010-26,Accounting for Costs Associated with Acquiring or Renewing Insurance Contracts, which we retrospectively adopted on January 1, 2012.
The table below shows the deferred policy acquisition costs and asset
reconciliation.| (In millions) | | Years ended December 31, | |
| | | 2012 | | | 2011 | | | 2010 | |
| Deferred policy acquisition costs asset at January 1 | | $ | 477 | | | $ | 458 | | | $ | 454 | |
| Capitalized deferred policy acquisition costs | | | 734 | | | | 661 | | | | 627 | |
| Amortized deferred policy acquisition costs | | | (706 | ) | | | (631 | ) | | | (607 | ) |
| Amortized shadow deferred policy acquisition costs | | | (35 | ) | | | (11 | ) | | | (16 | ) |
| Deferred policy acquisition costs asset at December 31 | | $ | 470 | | | $ | 477 | | | $ | 458 | |
reconciliation:
|
| | | | | | | | | | | | |
| (Dollars in millions) | | Years ended December 31, |
| | | 2014 | | 2013 | | 2012 |
| Deferred policy acquisition costs asset, January 1 | | $ | 565 |
| | $ | 470 |
| | $ | 477 |
|
| Capitalized deferred policy acquisition costs | | 827 |
| | 802 |
| | 734 |
|
| Amortized deferred policy acquisition costs | | (807 | ) | | (758 | ) | | (706 | ) |
| Amortized shadow deferred policy acquisition costs | | (7 | ) | | 51 |
| | (35 | ) |
| Deferred policy acquisition costs asset, December 31 | | $ | 578 |
| | $ | 565 |
| | $ | 470 |
|
| | | | | | | |
The change in amortized shadow deferred policy acquisition costs in 2013 compared with 2014 and 2012 was the result of rising interest rates. No premium deficiencies were recorded in the consolidated statements of
comprehensive income
in 2014, 2013 and 2012, as the sum of the anticipated loss and loss adjustment expenses, policyholder dividends and unamortized deferred acquisition expenses did not exceed the related unearned premiums and anticipated investment income.
NOTE 7 – Note Payable
We have one line of credit within 2014 and 2013 through multiple commercial banks with a borrowing capacity of $225
$225 million withand an additional $50 million accordion feature. At December 31, 2012, $104 million was drawn on the line of credit. This credit agreement replaces the two lines of credit with commercial banks with an aggregate borrowing capacity of $225 million at December 31, 2011. The 2012 credit agreement is a new $225 millionOur unsecured revolving credit facility withhas a term of five years expiringthat expires May 31, 2017.13, 2019. We had no compensating balance requirements on short-term debt for either 20122014 or 2011.2013. At December 31, 2014, $49 million was drawn on the line of credit. At December 31, 2013,
$104 million was drawn on the line of credit. The interest rate charged on our borrowings on this credit agreement ranged from
0.71.15 percent to
2.581.30 percent during
2012.8. | Long-Term Debt and Capital Lease Obligation |
2014 and ranged from 1.30 percent to 1.35 percent during 2013.
NOTE 8 – Long-Term Debt and Capital Lease Obligations
This table summarizes the principal amounts of our long-term debt excluding unamortized discounts, none of which are encumbered by rating triggers:
| (In millions) | | | | | | | | Book value | | | Principal amount | |
| | | | | | | | | December 31, | | | December 31, | | | December 31, | | | December 31, | |
| Interest rate | | | Year of issue | | | | | 2012 | | | 2011 | | | 2012 | | | 2011 | |
| | | | | | | | | | | | | | | | | | | |
| | 6.900 | % | | | 1998 | | | Senior debentures, due 2028 | | $ | 28 | | | $ | 28 | | | $ | 28 | | | $ | 28 | |
| | 6.920 | % | | | 2005 | | | Senior debentures, due 2028 | | | 391 | | | | 391 | | | | 391 | | | | 391 | |
| | 6.125 | % | | | 2004 | | | Senior notes, due 2034 | | | 371 | | | | 371 | | | | 374 | | | | 374 | |
| | | | | | | | | Total | | $ | 790 | | | $ | 790 | | | $ | 793 | | | $ | 793 | |
|
| | | | | | | | | | | | | | | | | | | | |
| (Dollars in millions) | | | | Book value | | Principal amount |
| Interest rate | | Year of issue | | | | December 31, | | December 31, | | December 31, | | December 31, |
| | | | | 2014 | | 2013 | | 2014 | | 2013 |
| 6.900% | | 1998 | | Senior debentures, due 2028 | | $ | 28 |
| | $ | 28 |
| | $ | 28 |
| | $ | 28 |
|
| 6.920% | | 2005 | | Senior debentures, due 2028 | | 391 |
| | 391 |
| | 391 |
| | 391 |
|
| 6.125% | | 2004 | | Senior notes, due 2034 | | 372 |
| | 371 |
| | 374 |
| | 374 |
|
| | | | | Total | | $ | 791 |
| | $ | 790 |
| | $ | 793 |
| | $ | 793 |
|
| | | | | | | | | | | | | |
Capital lease obligations, excluding an insignificant amount of interest, totaled $36 million and $45 million in 2014 and 2013, respectively. Below are the expected capital lease obligations
totaling $37 million, excluding an insignificant amount of interest, that we expect to pay over the next
fivesix years:
| (In millions) | | Years ended December 31, | |
| | | 2013 | | | 2014 | | | 2015 | | | 2016 | | | 2017 | |
| Capital lease obligations | | $ | 17 | | | $ | 10 | | | $ | 7 | | | $ | 3 | | | $ | 0 | |
9. | Shareholders’ Equity and Dividend Restrictions |
|
| | | | | | | | | | | | | | | | | | | | | | |
| (Dollars in millions) | Years ended December 31, | |
| | 2015 | | 2016 | | 2017 | | 2018 | | 2019 | 2020 |
| Capital lease obligations | $ | 18 |
| | $ | 9 |
| | $ | 3 |
| | $ | 2 |
| | $ | 3 |
| $ | 1 |
|
| | | | | | | | | | | |
Cincinnati Financial Corporation - 2014 10-K - Page 143
NOTE 9 – Shareholders’ Equity and Dividend Restrictions
Declared cash dividends per share were $1.76, $1.655 and $1.62 for the years ended December 31, 2014, 2013 and 2012, respectively.
Our insurance subsidiary declared dividends to the parent company of
$400 million in 2014, $375 million in 2013 and $300 million in
2012, $180 million in 2011 and $220 million in 2010.2012. State regulatory requirements restrict the dividends insurance subsidiaries can pay.
Dividends must be paid within 30 days of declaration. Generally, the most our insurance subsidiary can pay without prior regulatory approval is the greater of 10 percent of
policyholderstatutory capital and surplus or 100 percent of statutory net income for the prior calendar year. Dividends exceeding these limitations may be paid only with approval of the insurance department of the domiciliary state. During
2013,2015, the total that our insurance subsidiary, which is the parent of all other insurance subsidiaries, may declare in dividends is approximately
$391$447 million.
As of December 31, 2012, 9.3 million shares of common stock were available for future equity award grants.
Declared cash dividends per share were $1.62, $1.605 and $1.59 for the years ended December 31, 2012, 2011 and 2010, respectively.
Accumulated Other Comprehensive Income
The
change in AOCI includes changes in unrealized gainstable below shows beginning and
losses onend of year accumulated other comprehensive income or loss for investments,
and pension obligations,
as follows:| (In millions) | | Years ended December 31, | |
| | | 2012 | | | 2011 | | | 2010 | |
| | | Before | | | Income | | | | | | Before | | | Income | | | | | | Before | | | Income | | | | |
| | | tax | | | tax | | | Net | | | tax | | | tax | | | Net | | | tax | | | tax | | | Net | |
| Accumulated unrealized gains on investments available for sale and other at January 1 | | $ | 1,460 | | | $ | 502 | | | $ | 958 | | | $ | 1,232 | | | $ | 422 | | | $ | 810 | | | $ | 1,012 | | | $ | 345 | | | $ | 667 | |
| | | | | | | | | | | | | | | | | | | | | | | | | | | | | | | | | | | | | |
| Increase in unrealized gains | | | 428 | | | | 152 | | | | 276 | | | | 309 | | | | 108 | | | | 201 | | | | 383 | | | | 136 | | | | 247 | |
| Reclassification adjustment for (gains) losses included in net income | | | (42 | ) | | | (15 | ) | | | (27 | ) | | | (70 | ) | | | (25 | ) | | | (45 | ) | | | (159 | ) | | | (56 | ) | | | (103 | ) |
| Adjustment to deferred acquisition costs and life policy reserves and other | | | (21 | ) | | | (9 | ) | | | (12 | ) | | | (11 | ) | | | (3 | ) | | | (8 | ) | | | (4 | ) | | | (3 | ) | | | (1 | ) |
| Effect on other comprehensive income | | | 365 | | | | 128 | | | | 237 | | | | 228 | | | | 80 | | | | 148 | | | | 220 | | | | 77 | | | | 143 | |
| Accumulated unrealized gains on investments available for sale and other at December 31 | | $ | 1,825 | | | $ | 630 | | | $ | 1,195 | | | $ | 1,460 | | | $ | 502 | | | $ | 958 | | | $ | 1,232 | | | $ | 422 | | | $ | 810 | |
| | | | | | | | | | | | | | | | | | | | | | | | | | | | | | | | | | | | | |
| Accumulated unrealized losses for pension obligations at January 1 | | $ | (88 | ) | | $ | (31 | ) | | $ | (57 | ) | | $ | (63 | ) | | $ | (22 | ) | | $ | (41 | ) | | $ | (66 | ) | | $ | (23 | ) | | $ | (43 | ) |
| Change in pension obligations | | | (13 | ) | | | (4 | ) | | | (9 | ) | | | (25 | ) | | | (9 | ) | | | (16 | ) | | | 3 | | | | 1 | | | | 2 | |
| Accumulated unrealized losses for pension obligations at December 31 | | $ | (101 | ) | | $ | (35 | ) | | $ | (66 | ) | | $ | (88 | ) | | $ | (31 | ) | | $ | (57 | ) | | $ | (63 | ) | | $ | (22 | ) | | $ | (41 | ) |
| | | | | | | | | | | | | | | | | | | | | | | | | | | | | | | | | | | | | |
| Accumulated other comprehensive income at January 1 | | $ | 1,372 | | | $ | 471 | | | $ | 901 | | | $ | 1,169 | | | $ | 400 | | | $ | 769 | | | $ | 946 | | | $ | 322 | | | $ | 624 | |
| Unrealized investment gains and losses and other adjustments | | | 365 | | | | 128 | | | | 237 | | | | 228 | | | | 80 | | | | 148 | | | | 220 | | | | 77 | | | | 143 | |
| Change in pension obligations | | | (13 | ) | | | (4 | ) | | | (9 | ) | | | (25 | ) | | | (9 | ) | | | (16 | ) | | | 3 | | | | 1 | | | | 2 | |
| Accumulated other comprehensive income at December 31 | | $ | 1,724 | | | $ | 595 | | | $ | 1,129 | | | $ | 1,372 | | | $ | 471 | | | $ | 901 | | | $ | 1,169 | | | $ | 400 | | | $ | 769 | |
life deferred acquisition costs, life policy reserves and other. The changes from the beginning of year to the end of year are the result of changes to other comprehensive income or loss (OCI).
|
| | | | | | | | | | | | | | | | | | | | | | | | | | | | | | | | | | | | | | |
| (Dollars in millions) | | 2014 | | | 2013 | | | 2012 |
| | | Before tax | | Income tax | | Net | | | Before
tax | | Income
tax | | Net | | | Before
tax | | Income
tax | | Net |
| Investments: | | | | | | | | | | | | | | | | | | | | |
| AOCI, January 1 | | $ | 2,335 |
| | $ | 808 |
| | $ | 1,527 |
| | | $ | 1,875 |
| | $ | 647 |
| | $ | 1,228 |
| | | $ | 1,489 |
| | $ | 512 |
| | $ | 977 |
|
| OCI before realized gains recognized in net income | | 514 |
| | 181 |
| | 333 |
| | | 537 |
| | 188 |
| | 349 |
| | | 426 |
| | 149 |
| | 277 |
|
| Realized gains recognized in net income | | (130 | ) | | (47 | ) | | (83 | ) | | | (77 | ) | | (27 | ) | | (50 | ) | | | (40 | ) | | (14 | ) | | (26 | ) |
| OCI | | 384 |
| | 134 |
| | 250 |
| | | 460 |
| | 161 |
| | 299 |
| | | 386 |
| | 135 |
| | 251 |
|
| AOCI, December 31 | | $ | 2,719 |
| | $ | 942 |
| | $ | 1,777 |
| | | $ | 2,335 |
| | $ | 808 |
| | $ | 1,527 |
| | | $ | 1,875 |
| | $ | 647 |
| | $ | 1,228 |
|
| | | | | | | | | | | | | | | | | | | | | |
| Pension Obligations: | | | | | | | | | | | | | | | | | | | | |
| AOCI, January 1 | | $ | (18 | ) | | $ | (6 | ) | | $ | (12 | ) | | | $ | (101 | ) | | $ | (35 | ) | | $ | (66 | ) | | | $ | (88 | ) | | $ | (31 | ) | | $ | (57 | ) |
| OCI before realized losses recognized in net income | | (21 | ) | | (7 | ) | | (14 | ) | | | 83 |
| | 29 |
| | 54 |
| | | (13 | ) | | (4 | ) | | (9 | ) |
| Realized losses recognized in net income | | 3 |
| | 1 |
| | 2 |
| | | — |
| | — |
| | — |
| | | — |
| | — |
| | — |
|
| OCI | | (18 | ) | | (6 | ) | | (12 | ) | | | 83 |
| | 29 |
| | 54 |
| | | (13 | ) | | (4 | ) | | (9 | ) |
| AOCI, December 31 | | $ | (36 | ) | | $ | (12 | ) | | $ | (24 | ) | | | $ | (18 | ) | | $ | (6 | ) | | $ | (12 | ) | | | $ | (101 | ) | | $ | (35 | ) | | $ | (66 | ) |
| | | | | | | | | | | | | | | | | | | | | |
| Life deferred acquisition costs, life policy reserves and other: | | | | | | | | | | | | | | | | | | | | |
| AOCI, January 1 | | $ | (16 | ) | | $ | (5 | ) | | $ | (11 | ) | | | $ | (50 | ) | | $ | (17 | ) | | $ | (33 | ) | | | $ | (29 | ) | | $ | (10 | ) | | $ | (19 | ) |
| OCI before realized gains recognized in net income | | 7 |
| | 3 |
| | 4 |
| | | 40 |
| | 14 |
| | 26 |
| | | (19 | ) | | (7 | ) | | (12 | ) |
| Realized gains recognized in net income | | (3 | ) | | (1 | ) | | (2 | ) | | | (6 | ) | | (2 | ) | | (4 | ) | | | (2 | ) | | — |
| | (2 | ) |
| OCI | | 4 |
| | 2 |
| | 2 |
| | | 34 |
| | 12 |
| | 22 |
| | | (21 | ) | | (7 | ) | | (14 | ) |
| AOCI, December 31 | | $ | (12 | ) | | $ | (3 | ) | | $ | (9 | ) | | | $ | (16 | ) | | $ | (5 | ) | | $ | (11 | ) | | | $ | (50 | ) | | $ | (17 | ) | | $ | (33 | ) |
| | | | | | | | | | | | | | | | | | | | | |
| Summary of AOCI: | | | | | | | | | | | | | | | | | | | | |
| AOCI, January 1 | | $ | 2,301 |
| | $ | 797 |
| | $ | 1,504 |
| | | $ | 1,724 |
| | $ | 595 |
| | $ | 1,129 |
| | | $ | 1,372 |
| | $ | 471 |
| | $ | 901 |
|
| Investments OCI | | 384 |
| | 134 |
| | 250 |
| | | 460 |
| | 161 |
| | 299 |
| | | 386 |
| | 135 |
| | 251 |
|
| Pension obligations OCI | | (18 | ) | | (6 | ) | | (12 | ) | | | 83 |
| | 29 |
| | 54 |
| | | (13 | ) | | (4 | ) | | (9 | ) |
| Life deferred acquisition costs, life policy reserves and other OCI | | 4 |
| | 2 |
| | 2 |
| | | 34 |
| | 12 |
| | 22 |
| | | (21 | ) | | (7 | ) | | (14 | ) |
| Total OCI | | 370 |
| | 130 |
| | 240 |
| | | 577 |
| | 202 |
| | 375 |
| | | 352 |
| | 124 |
| | 228 |
|
| AOCI, December 31 | | $ | 2,671 |
| | $ | 927 |
| | $ | 1,744 |
| | | $ | 2,301 |
| | $ | 797 |
| | $ | 1,504 |
| | | $ | 1,724 |
| | $ | 595 |
| | $ | 1,129 |
|
| | | | | | | | | | | | | | | | | | | | | |
Cincinnati Financial Corporation - 2014 10-K - Page 144
NOTE 10 – Reinsurance
Reinsurance mitigates the risk of highly uncertain exposures and limitsreduces the maximum net loss that can arise from large risks or risks concentrated in areas of exposure. Management’s decisions about the appropriate level of risk retention are affected by various factors, including changes in our underwriting practices, capacity to retain risks and reinsurance market conditions.
Primary components of our property and casualty reinsurance program include a property
per risk
treaty, property excess treaty, casualty per occurrence treaty,
andcasualty excess treaty, property catastrophe
treaty.treaty and catastrophe bonds.
Our consolidated statements of
comprehensive income include earned consolidated property casualty insurance premiums on assumed and ceded business:
| (In millions) | | Years ended December 31, | |
| | 2012 | | | 2011 | | | 2010 | |
| Direct earned premiums | | $ | 3,520 | | | $ | 3,236 | | | $ | 3,080 | |
| Assumed earned premiums | | | 9 | | | | 12 | | | | 10 | |
| Ceded earned premiums | | | (185 | ) | | | (219 | ) | | | (166 | ) |
| Net earned premiums | | $ | 3,344 | | | $ | 3,029 | | | $ | 2,924 | |
Changes in 2012 ceded earned premiums compared with 2011 are related to ceded earned reinstatement premiums for additional reinsurance coverage as a result of the increase in catastrophe losses that occurred during 2011.
|
| | | | | | | | | | | | |
| (Dollars in millions) | | Years ended December 31, |
| | | 2014 | | 2013 | | 2012 |
| Direct earned premiums | | $ | 4,209 |
| | $ | 3,903 |
| | $ | 3,520 |
|
| Assumed earned premiums | | 12 |
| | 11 |
| | 9 |
|
| Ceded earned premiums | | (176 | ) | | (201 | ) | | (185 | ) |
| Earned premiums | | $ | 4,045 |
| | $ | 3,713 |
| | $ | 3,344 |
|
| | | | | | | |
Our consolidated statements of
comprehensive income include incurred consolidated property casualty insurance loss and loss expenses on assumed and ceded business:
| (In millions) | | Years ended December 31, | |
| | 2012 | | | 2011 | | | 2010 | |
| Direct incurred loss and loss expenses | | $ | 2,235 | | | $ | 2,588 | | | $ | 2,003 | |
| Assumed incurred loss and loss expenses | | | 6 | | | | 24 | | | | 11 | |
| Ceded incurred loss and loss expenses | | | (104 | ) | | | (277 | ) | | | (4 | ) |
| Net incurred loss and loss expenses | | $ | 2,137 | | | $ | 2,335 | | | $ | 2,010 | |
Changes in 2012 ceded loss and loss expenses compared with 2011 are related to our increase in catastrophe losses in 2011 that resulted in increased
|
| | | | | | | | | | | | |
| (Dollars in millions) | | Years ended December 31, |
| | | 2014 | | 2013 | | 2012 |
| Direct incurred loss and loss expenses | | $ | 2,661 |
| | $ | 2,323 |
| | $ | 2,235 |
|
| Assumed incurred loss and loss expenses | | 6 |
| | 11 |
| | 6 |
|
| Ceded incurred loss and loss expenses | | (40 | ) | | (33 | ) | | (104 | ) |
| Incurred loss and loss expenses | | $ | 2,627 |
| | $ | 2,301 |
| | $ | 2,137 |
|
| | | | | | | |
Our ceded incurred
losses toresults generally vary with our
reinsurers.For the year ended December 31, 2010, a reserve reduction occurred in our USAIG pool. Direct and ceded incurred loss and loss expenses were reduced by $33 million, and there was no effect on net incurred loss and loss expenses.
catastrophe experience.
Our life insurance company purchases reinsurance for protection of a portion of the risk that is written. Primary components of our life reinsurance program include individual mortality coverage,
and aggregate catastrophe and accidental death coverage in excess of certain deductibles.
Our consolidated statements of
comprehensive income include earned life insurance premiums on ceded business:
| (In millions) | | Years ended December 31, | |
| | 2012 | | | 2011 | | | 2010 | |
| Direct earned premiums | | $ | 235 | | | $ | 220 | | | $ | 211 | |
| Ceded earned premiums | | | (57 | ) | | | (55 | ) | | | (53 | ) |
| Net earned premiums | | $ | 178 | | | $ | 165 | | | $ | 158 | |
|
| | | | | | | | | | | | |
| (Dollars in millions) | | Years ended December 31, |
| | | 2014 | | 2013 | | 2012 |
| Direct earned premiums | | $ | 259 |
| | $ | 248 |
| | $ | 235 |
|
| Ceded earned premiums | | (61 | ) | | (59 | ) | | (57 | ) |
| Earned premiums | | $ | 198 |
| | $ | 189 |
| | $ | 178 |
|
| | | | | | | |
Cincinnati Financial Corporation - 2014 10-K - Page 145
Our consolidated statements of
comprehensive income include life insurance contract holders’ benefits incurred on
assumed and ceded business:
| (In millions) | | Years ended December 31, | |
| | 2012 | | | 2011 | | | 2010 | |
| Direct contract holders' benefits incurred | | $ | 232 | | | $ | 232 | | | $ | 233 | |
| Ceded contract holders' benefits incurred | | | (47 | ) | | | (43 | ) | | | (63 | ) |
| Net incurred loss and loss expenses | | $ | 185 | | | $ | 189 | | | $ | 170 | |
|
| | | | | | | | | | | | |
| (Dollars in millions) | | Years ended December 31, |
| | | 2014 | | 2013 | | 2012 |
| Direct contract holders' benefits incurred | | $ | 299 |
| | $ | 266 |
| | $ | 232 |
|
| Ceded contract holders' benefits incurred | | (70 | ) | | (62 | ) | | (47 | ) |
| Contract holders' benefits incurred | | $ | 229 |
| | $ | 204 |
| | $ | 185 |
|
| | | | | | | |
The ceded benefits incurred can vary depending on the type of life insurance policy held and the year the policy was
sold.issued.
NOTE 11 – Income Taxes
The significant components of deferred tax assets and liabilities included in the consolidated balance sheets at December 31 were
as as��follows:
| (In millions) | | At December 31, | |
| | 2012 | | | 2011 | |
| Deferred tax assets: | | | | | | | | |
| Loss and loss expense reserves | | $ | 202 | | | $ | 201 | |
| Unearned premiums | | | 124 | | | | 113 | |
| Investments | | | 31 | | | | 36 | |
| Other | | | 39 | | | | 46 | |
| Total | | | 396 | | | | 396 | |
| Deferred tax liabilities: | | | | | | | | |
| Unrealized investment gains and other | | | 605 | | | | 481 | |
| Deferred acquisition costs | | | 163 | | | | 156 | |
| Life policy reserves | | | 65 | | | | 42 | |
| Other | | | 16 | | | | 20 | |
| Total | | | 849 | | | | 699 | |
| Net deferred tax liability | | $ | 453 | | | $ | 303 | |
|
| | | | | | | | |
| (Dollars in millions) | | At December 31, |
| | | 2014 | | 2013 |
| Deferred tax assets: | | |
| | |
|
| Loss and loss expense reserves | | $ | 197 |
| | $ | 206 |
|
| Unearned premiums | | 145 |
| | 137 |
|
| Investments | | 16 |
| | 19 |
|
| Other | | 41 |
| | 46 |
|
| Total | | 399 |
| | 408 |
|
| Deferred tax liabilities: | | |
| | |
|
| Unrealized investment gains, net | | 937 |
| | 807 |
|
| Deferred acquisition costs | | 183 |
| | 178 |
|
| Life policy reserves | | 110 |
| | 86 |
|
| Other | | 9 |
| | 10 |
|
| Total | | 1,239 |
| | 1,081 |
|
| Net deferred income tax liability | | $ | 840 |
| | $ | 673 |
|
| | | | | |
Deferred tax assets and liabilities reflect temporary differences between the carrying amounts of assets and liabilities for financial reporting purposes and the amount recognized for tax purposes.
The differences between the 35 percent statutory federal income tax rate and our effective income tax rate were as follows:| (Dollars in millions) | | Years ended December 31, | |
| | 2012 | | | 2011 | | | 2010 | |
| Tax at statutory rate | | $ | 198 | | | | 35.0 | % | | $ | 61 | | | | 35.0 | % | | $ | 174 | | | | 35.0 | % |
| Increase (decrease) resulting from: | | | | | | | | | | | | | | | | | | | | | | | | |
| Tax-exempt income from municipal bonds | | | (33 | ) | | | (5.9 | ) | | | (35 | ) | | | (20.0 | ) | | | (36 | ) | | | (7.2 | ) |
| Dividend received exclusion | | | (24 | ) | | | (4.2 | ) | | | (20 | ) | | | (11.7 | ) | | | (19 | ) | | | (3.8 | ) |
| Other | | | 4 | | | | 0.7 | | | | 3 | | | | 1.9 | | | | 4 | | | | 0.7 | |
| Effective tax | | $ | 145 | | | | 25.6 | % | | $ | 9 | | | | 5.2 | % | | $ | 123 | | | | 24.7 | % |
|
| | | | | | | | | | | | | | | | | | | | | |
| (Dollars in millions) | | Years ended December 31, |
| | | 2014 | | 2013 | | 2012 |
| Tax at statutory rate: | | $ | 252 |
| | 35.0 | % | | $ | 250 |
| | 35.0 | % | | $ | 198 |
| | 35.0 | % |
| Increase (decrease) resulting from: | | |
| | |
| | | | |
| | |
| | |
|
| Tax-exempt income from municipal bonds | | (33 | ) | | (4.6 | ) | | (32 | ) | | (4.5 | ) | | (33 | ) | | (5.9 | ) |
| Dividend received exclusion | | (29 | ) | | (4.0 | ) | | (26 | ) | | (3.6 | ) | | (24 | ) | | (4.2 | ) |
| Other | | 6 |
| | 0.8 |
| | 5 |
| | 0.7 |
| | 4 |
| | 0.7 |
|
| Provision for income taxes | | $ | 196 |
| | 27.2 | % | | $ | 197 |
| | 27.6 | % | | $ | 145 |
| | 25.6 | % |
| | | | | | | | | | | | | |
The provision for federal income taxes is based upon filing a consolidated income tax return for the company and its subsidiaries. As of December 31,
2012,2014 and 2013, we had no operating or capital loss carry forwards.
The change in our effective tax rate was primarily due to changes in pretax income from underwriting results, changes in investment income and the amount of realized investment gains and losses. Changes to tax-exempt interest and the dividend received deduction in the current year compared with prior years also contributed to the change.
Cincinnati Financial Corporation - 2014 10-K - Page 146
Unrecognized Tax Benefits
As a result of positions either taken in our 2011
through 2013 federal tax
returnreturns filed with the IRS or expected to be taken in the
20122014 filing, we believe it is more likely than not that our tax liability will be sustained upon examination by the IRS. We therefore carry no amount for unrecognized tax benefits for the years ended
2012, 2011
and 2010.through 2014.
The statute of limitations for federal and state income tax purposes have closed for tax years 2008 and earlier. In November, 2011,Although all issues for tax years 2009 and 2010 have been settled and agreed to, the statute of limitations for these two tax years remains open until December 31, 2015. Our recent settlement with the IRS began its audit of tax years 2009 and 2010. In December 2012, the IRS Exam Team completed its phase of the audit with2010 resulted in no material changes to the returns as filed. As is standard practice whenever large refunds are received, the Joint Committee on Taxation in Washington DC is currently reviewing the 2009 and 2010 IRS audit and is expected to complete its review by mid-2013.
Income taxes paid in our Consolidated Statementsconsolidated statements of Cash Flowscash flows are shown net of refunds received of $11less than
$1 million $2 in both 2014 and 2013 and $11 million and $10 million for 2012, 2011 and 2010, respectively. in 2012. In addition to our IRS filings, we file income tax returns with immaterial amounts in various state jurisdictions.
12. | Net Income Per Common Share |
The statute of limitations for state income tax purposes has closed for tax years 2009 and earlier.
NOTE 12 – Net Income Per Common Share
Basic earnings per share are computed based on the weighted average number of common shares outstanding. Diluted earnings per share are computed based on the weighted average number of common and dilutive potential common shares outstanding using the treasury stock method. The table shows calculations for basic and diluted earnings per share:
| (In millions except share data in thousands) | | Years ended December 31, | |
| | 2012 | | | 2011 | | | 2010 | |
| Numerator: | | | | | | | | | | | | |
| Net income—basic and diluted | | $ | 421 | | | $ | 164 | | | $ | 375 | |
| | | | | | | | | | | | | |
| Denominator: | | | | | | | | | | | | |
| Weighted-average common shares outstanding | | | 162,504 | | | | 162,667 | | | | 162,778 | |
| Effect of stock-based awards: | | | | | | | | | | | | |
| Nonvested shares | | | 684 | | | | 509 | | | | 484 | |
| Stock options | | | 473 | | | | 83 | | | | 12 | |
| Adjusted diluted weighted-average shares | | | 163,661 | | | | 163,259 | | | | 163,274 | |
| | | | | | | | | | | | | |
| Earnings per share: | | | | | | | | | | | | |
| Basic | | $ | 2.59 | | | $ | 1.01 | | | $ | 2.30 | |
| Diluted | | | 2.57 | | | | 1.01 | | | | 2.30 | |
| | | | | | | | | | | | | |
| Number of anti-dilutive stock-based awards | | | 5,938 | | | | 7,758 | | | | 9,538 | |
|
| | | | | | | | | | | | |
| (In millions except per share data) | | Years ended December 31, |
| | 2014 | | 2013 | | 2012 |
| Numerator: | | |
| | |
| | |
|
| Net income—basic and diluted | | $ | 525 |
| | $ | 517 |
| | $ | 421 |
|
| Denominator: | | |
| | |
| | |
|
| Basic weighted-average common shares outstanding | | 163.5 |
| | 163.5 |
| | 162.5 |
|
| Effect of stock-based awards: | | |
| | |
| | |
|
| Stock options | | 1.0 |
| | 1.2 |
| | 0.5 |
|
| Nonvested shares | | 0.6 |
| | 0.7 |
| | 0.7 |
|
| Diluted weighted-average shares | | 165.1 |
| | 165.4 |
| | 163.7 |
|
| Earnings per share: | | |
| | |
| | |
|
| Basic | | $ | 3.21 |
| | $ | 3.16 |
| | $ | 2.59 |
|
| Diluted | | 3.18 |
| | 3.12 |
| | 2.57 |
|
| Number of anti-dilutive stock-based awards | | 0.7 |
| | 0.4 |
| | 5.9 |
|
| | | | | | | |
The current sources of dilution of our common shares are certain equity-based awards as discussed in Note 17,
Stock-BasedShare-Based Associate Compensation
Plans, Page 135.Plans. The above table includes the number of anti-dilutive stock-based awards at year-end
2012, 20112014, 2013 and
2010.2012. We did not include these stock-based awards in the computation of net income per common share (diluted) because their exercise would have anti-dilutive effects.
13. | Employee Retirement Benefits |
Cincinnati Financial Corporation - 2014 10-K - Page 147
NOTE 13 – Employee Retirement Benefits
We sponsor a
qualified defined benefit pension plan. During 2008, we changed the form of retirement benefit we offer some associates to a company match on contributions to a 401(k) plan from the defined benefit pension plan. We
frozeclosed entry into the pension plan for new associates as of June 30, 2008, and only participants 40 years of age or older as of August 31, 2008, could elect to continue to participate. For participants remaining in the pension plan, we continue to contribute to fund future benefit obligations. Benefits for the defined benefit pension plan are based on years of credited service and compensation level. Contributions are based on the prescribed method defined in the Pension Protection Act. Our pension expense is based on certain actuarial assumptions and also is composed of several components that are determined using the projected unit credit actuarial cost method.
During the fourth quarters of 2012 and 2011, we offered limited opportunities for distribution of vested balances to terminated participants in the qualified pension plan. The plan paid $2 million and $9 million to these terminated vested participants during 2012 and 2011, respectively. The qualified plan
washas been amended to allow for distribution of vested balances to terminated
participants on an ongoing basis.participants.
We also sponsor a defined contribution plan (401(k) plan). Matching company contributions totaled $9$11 million, $8
$10 million and
$8$9 million during the years
2012, 20112014, 2013 and
2010,2012, respectively. Associates who are not accruing benefits under the pension plan are eligible to receive the company match of up to 6 percent of cash compensation. We also pay all operating expenses for the 401(k) plan. Participants vest in the company match for the 401(k) plan after three years of eligible service.
We maintain a supplemental executive retirement plan (SERP) with obligationsa benefit obligation of $13 million at
year-end 2014 and $9 million at year-end
2012 and $8 million at year-end 2011,2013, which
areis included in the
obligation and expense amounts.projected benefit obligation. The company also makes available to a select group of associates the CFC Top Hat Savings Plan, a nonqualified deferred compensation
plan.plan, which had a fair value of $18 million and $14 million at December 31, 2014 and 2013, respectively.
Defined Benefit Pension Plan Assumptions
We evaluate our pension plan assumptions annually and update them as necessary.
TheThis is a summary of the weighted-average assumptions used to determine
our benefit obligations at December 31
follow:| | | Qualified Pension Plan | | | SERP | |
| | | 2012 | | | 2011 | | | 2012 | | | 2011 | |
| Discount rate | | | 4.20 | % | | | 5.10 | % | | | 3.95 | % | | | 4.75 | % |
| Rate of compensation increase | | | 2.75-3.25 | | | | 3.50-5.50 | | | | 2.75-3.25 | | | | 3.50-5.50 | |
for the plans:
|
| | | | | | | | | | | | |
| | | Qualified Pension Plan | | SERP |
| | | 2014 | | 2013 | | 2014 | | 2013 |
| Discount rate | | 4.25 | % | | 5.15 | % | | 4.05 | % | | 4.80 | % |
| Rate of compensation increase | | 2.75-3.25 |
| | 2.75-3.25 |
| | 2.75-3.25 |
| | 2.75-3.25 |
|
| | | | | | | | | |
To determine the discount rate for each plan, a
hypothetical diversifiedtheoretical settlement portfolio of
actual domestic Aahigh quality rated
corporate bonds was chosen to provide payments approximately matching the plan’s
expectedprojected benefit payments. A single interest rate for each plan was determined
based on the anticipated yieldresulting in a discounted value of the
constructed portfolio.plan's benefit payments that equates to the market value of the selected bonds. The discount rate is reflective of current market interest rate conditions and our plan's liability characteristics. Based on this analysis, we decreased the rate from the prior year by 0.90 percentage points for the qualified
pension plan and by
0.800.75 percentage points for the
SERP due to market interest rate conditions at year-end 2012.SERP. Compensation increase assumptions reflect anticipated rates of inflation, real return on wage growth and merit and promotional increases.
We decreasedThe mortality assumption was updated in 2014 to the RP-2014 Employee Mortality Tables and RP-2014 Annuitant Mortality Tables for males and females projected generationally with Scale MP-2014. The updated mortality table did not have a significant impact on our
compensation assumption to reflect the current demographics of participantsfinancial statements as our qualified plan assumes benefits will be paid in the
plans and expectationsform of
near-term salary increases.lump sums.
This is a summary of the weighted-average assumptions
we useused to determine our net expense for the plans:
| | | Qualified Pension Plan | | | SERP | |
| | | 2012 | | | 2011 | | | 2010 | | | 2012 | | | 2011 | | | 2010 | |
| Discount rate | | | 5.10 | % | | | 5.85 | % | | | 6.10 | % | | | 4.75 | % | | | 5.55 | % | | | 6.10 | % |
| Expected return on plan assets | | | 7.50 | | | | 7.50 | | | | 8.00 | | | | n/a | | | | n/a | | | | n/a | |
| Rate of compensation increase | | | 3.50-5.50 | | | | 3.50-5.50 | | | | 4.00-6.00 | | | | 3.50-5.50 | | | | 3.50-5.50 | | | | 4.00-6.00 | |
|
| | | | | | | | | | | | | | | | | | |
| | | Qualified Pension Plan | | SERP |
| | | 2014 | | 2013 | | 2012 | | 2014 | | 2013 | | 2012 |
| Discount rate | | 5.15 | % | | 4.20 | % | | 5.10 | % | | 4.80 | % | | 3.95 | % | | 4.75 | % |
| Expected return on plan assets | | 7.25 |
| | 7.50 |
| | 7.50 |
| | n/a |
| | n/a |
| | n/a |
|
| Rate of compensation increase | | 2.75-3.25 |
| | 2.75-3.25 |
| | 3.50-5.50 |
| | 2.75-3.25 |
| | 2.75-3.25 |
| | 3.50-5.50 |
|
| | | | | | | | | | | | | |
Cincinnati Financial Corporation - 2014 10-K - Page 148
The discount rate was
decreasedincreased by
0.750.95 percentage points for the qualified pension plan and
0.800.85 percentage points for the SERP due to market interest rate conditions
at the beginning of 2012.in 2014. The discount rate assumptions for our benefit obligation generally track with high
gradequality rated corporate bond yields chosen in our
hypotheticaltheoretical settlement portfolio, and yearly adjustments reflect any changes to those bond yields. We believe the expected return on plan assets is representative of the expected long-term rate of return on these
assets. We reduced the return on plan assets,
assumption from 8.00 percent to 7.50 percent during 2011, which is consistent with
20122014 expectations of interest rates and based partially on the fact that the plan’s common stock holdings pay dividends. We believe this rate is representative of the expected long-term rate of return on these plan assets.
We review historical actual return on plan assets when determining our expected long-term rate of return. Total portfolio return for 2014 was 11.7 percent and for 2013 was 24.0 percent. Our compensation increase assumptions in
20122014 reflect anticipated rates of inflation, real return on wage growth and merit and promotional increases.
Benefit obligation activity using an actuarial measurement date for our qualified plan and SERP at December 31 follows:
| (In millions) | | At December 31, | |
| | 2012 | | | 2011 | |
| Change in projected benefit obligation: | | | | | | | | |
| Benefit obligation at January 1 | | $ | 281 | | | $ | 245 | |
| Service cost | | | 12 | | | | 11 | |
| Interest cost | | | 14 | | | | 14 | |
| Actuarial loss | | | 28 | | | | 30 | |
| Benefits paid | | | (15 | ) | | | (19 | ) |
| Projected benefit obligation at December 31 | | $ | 320 | | | $ | 281 | |
| | | | | | | | | |
| Accumulated benefit obligation | | $ | 282 | | | $ | 236 | |
| | | | | | | | | |
| Change in plan assets: | | | | | | | | |
| Fair value of plan assets at January 1 | | $ | 216 | | | $ | 183 | |
| Actual return on plan assets | | | 23 | | | | 17 | |
| Employer contributions | | | 14 | | | | 35 | |
| Benefits paid | | | (15 | ) | | | (19 | ) |
| Fair value of plan assets at December 31 | | $ | 238 | | | $ | 216 | |
| | | | | | | | | |
| Unfunded status: | | | | | | | | |
| Unfunded status at December 31 | | $ | (82 | ) | | $ | (65 | ) |
|
| | | | | | | | |
| (Dollars in millions) | | At December 31, |
| | | 2014 | | 2013 |
| Change in projected benefit obligation: | | |
| | |
|
| Benefit obligation, January 1 | | $ | 284 |
| | $ | 320 |
|
| Service cost | | 10 |
| | 13 |
|
| Interest cost | | 15 |
| | 13 |
|
| Actuarial loss (gain) | | 35 |
| | (34 | ) |
| Benefits paid | | (27 | ) | | (28 | ) |
| Other | | 2 |
| | — |
|
| Projected benefit obligation, December 31 | | $ | 319 |
| | $ | 284 |
|
| | | | | |
| Accumulated benefit obligation | | $ | 284 |
| | $ | 257 |
|
| | | | | |
| Change in plan assets: | | |
| | |
|
| Fair value of plan assets, January 1 | | $ | 280 |
| | $ | 238 |
|
| Actual return on plan assets | | 30 |
| | 55 |
|
| Employer contribution | | 5 |
| | 15 |
|
| Benefits paid | | (27 | ) | | (28 | ) |
| Fair value of plan assets, December 31 | | $ | 288 |
| | $ | 280 |
|
| | | | | |
| Funded status, December 31 | | $ | (31 | ) | | $ | (4 | ) |
| | | | | |
The decreases in discount rate and lump sum rate resulted in an increase in actuarial loss and projected benefit obligation from 2013 and an increase in unfunded status.
Cincinnati Financial Corporation - 2014 10-K - Page 149
A reconciliation follows of the funded status for our qualified plan and SERP at the end of the measurement period to the amounts recognized in the consolidated balance sheets at December 31:
| (In millions) | | At December 31, | |
| | 2012 | | | 2011 | |
| | | | | | | |
| Pension amounts recognized as other liabilities in the consolidated balance sheets: | | $ | (82 | ) | | $ | (65 | ) |
| | | | | | | | | |
| Amounts recognized in accumulated other comprehensive income not yet recognized: | | | | | | | | |
| Net actuarial loss | | $ | 100 | | | $ | 86 | |
| Prior service cost | | | 1 | | | | 2 | |
| Total | | $ | 101 | | | $ | 88 | |
|
| | | | | | | | |
| (Dollars in millions) | | At December 31, |
| | | 2014 | | 2013 |
| Pension amounts recognized in the consolidated balance sheets: | | | | |
| Other assets | | $ | — |
| | $ | 4 |
|
| Other liabilities | | (31 | ) | | (8 | ) |
| Net amount recognized | | $ | (31 | ) | | $ | (4 | ) |
| | | | | |
| Amounts recognized in accumulated other comprehensive income: | | |
| | |
|
| Net actuarial loss | | $ | 34 |
| | $ | 18 |
|
| Prior service cost | | 2 |
| | — |
|
| Total | | $ | 36 |
| | $ | 18 |
|
| | | | | |
The change in the amount recognized in other comprehensive income is largely due to the decrease in discount rate and corresponding decreases in assumed lump sum rates.
We assume that 100 percent of participants will choose lump sum payments.Below are the components of our net periodic benefit cost, as well as other changes in plan assets and benefit obligations recognized in other comprehensive income for our qualified plan and SERP at December 31:
| (In millions) | | Years ended December 31, | |
| | 2012 | | | 2011 | | | 2010 | |
| Service cost | | $ | 12 | | | $ | 11 | | | $ | 10 | |
| Interest cost | | | 14 | | | | 14 | | | | 14 | |
| Expected return on plan assets | | | (16 | ) | | | (16 | ) | | | (14 | ) |
| Amortization of actuarial loss and prior service cost | | | 8 | | | | 4 | | | | 2 | |
| Net periodic benefit cost | | $ | 18 | | | $ | 13 | | | $ | 12 | |
| (In millions) | | Years ended December 31, | |
| | 2012 | | | 2011 | | | 2010 | |
| Current year actuarial loss | | $ | 20 | | | $ | 30 | | | $ | 0 | |
| Recognition of actuarial loss | | | (6 | ) | | | (4 | ) | | | (2 | ) |
| Recognition of prior service cost | | | (1 | ) | | | (1 | ) | | | (1 | ) |
| Total loss (gain) recognized in other comprehensive income | | $ | 13 | | | $ | 25 | | | $ | (3 | ) |
|
| | | | | | | | | | | | |
| (Dollars in millions) | | Years ended December 31, |
| | | 2014 | | 2013 | | 2012 |
| Net periodic benefit cost: | | | | | | |
| Service cost | | $ | 10 |
| | $ | 13 |
| | $ | 12 |
|
| Interest cost | | 15 |
| | 13 |
| | 14 |
|
| Expected return on plan assets | | (17 | ) | | (17 | ) | | (16 | ) |
| Amortization of actuarial loss and prior service cost | | 2 |
| | 9 |
| | 8 |
|
| Other | | 3 |
| | 2 |
| | — |
|
| Net periodic benefit cost | | $ | 13 |
| | $ | 20 |
| | $ | 18 |
|
| | | | | | | |
|
| | | | | | | | | | | | |
| (Dollars in millions) | | Years ended December 31, |
| | | 2014 | | 2013 | | 2012 |
| Other changes in plan assets and benefit obligations recognized in | | | | | | |
| other comprehensive income: | | | | | | |
| Current year actuarial loss (gain) | | $ | 21 |
| | $ | (72 | ) | | $ | 20 |
|
| Amortization of actuarial loss | | (5 | ) | | (10 | ) | | (6 | ) |
| Current year prior service cost | | 2 |
| | — |
| | — |
|
| Amortization of prior service cost | | — |
| | (1 | ) | | (1 | ) |
| Total recognized in other comprehensive loss (income) | | $ | 18 |
| | $ | (83 | ) | | $ | 13 |
|
| | | | | | | |
The total recognized in net periodic benefit cost and other comprehensive income was a net cost of $31 million, $38net benefit of $63 million, and $9a net cost of $31 million for the years ended December 31, 2012, 20112014, 2013 and 2010,2012, respectively. The increasechange in the amount recognized in other comprehensive income from 20102013 is largely due to the decreases in discount rate and lump sum rate.rates, partially offset with greater than anticipated return on plan assets. The estimated costs to be amortized from AOCI into net periodic benefit cost over the next year for our plans are an $8
$5 million
in actuarial loss and
a $1 million
in prior service cost.
Cincinnati Financial Corporation - 2014 10-K - Page 150
Defined Benefit Pension Plan Assets
The pension plan assets are managed to maximize total return over the long term while providing sufficient liquidity and current return to satisfy the cash flow requirements of the plan. The plan’s day-to-day investment decisions are managed by our internal investment department; however, overall investment strategies are discussed with our employee benefits committee.
Our investment strategy, currently driven by the low interest rate environment, is to weight our portfolio towards large cap, high quality, dividend growing equities that we have historically favored. As our plan matures and interest rates normalize, we expect a greater allocation to fixed income securities to better align asset and liability market risks. Our fixed-maturity bond portfolio is investment grade. The plan does not engage in derivative transactions.
Excluding cash, during
20122014 we held approximately
7581 percent of our pension portfolio in domestic common equity investments, which reflect the long-term time horizon of pension obligations. The remainder of the portfolio
consistsconsisted of
1512 percent in states, municipalities and taxable political subdivisions fixed-maturity investments and
107 percent in domestic corporate fixed-maturity investments. Our common equity portfolio
consistsconsisted of
2223 percent in the financial sector, 19 percent in the information technology sector,
1314 percent in the healthcare sector
11and 12 percent in the industrial sector
and 10 percent in the consumer discretionary sector during 2012. We had noat year-end 2014. No additional sectors
which accounted for 10 percent or more of our common equity portfolio balance at
year end 2012.year-end 2014. We had
$3$11 million of cash on hand at December 31,
2012, with carrying value approximating fair value. We have purchased more fixed maturities over the past several years2014, to
increase the duration of the fixed-maturity portfolio, diversify the types of credit risk and to better match our liability risks, which is consistent with our investment strategy. Our fixed-maturity bond portfolio is investment grade. The plan does not engage in derivative transactions. We do not expect to change the current allocation of pension investments for 2013.cover retirements.
Investments in securities are valued based on the fair value hierarchy outlined in Note 3, Fair Value
Measurements, Page 121.Measurements. The pension plan did not have any liabilities carried at fair value during the years ended December 31, 2014 and 2013. There have been no transfers between Level 1 and Level 2 for the years ended December 31, 2014 and 2013. The following table
illustratesshows the fair value hierarchy for those assets measured at fair value on a recurring basis at December 31,
20122014 and
2011. The pension plan did not have any liabilities carried2013. Excluded from the table below is cash on hand of $11 million and $19 million at
fair value or any Level 3 assets at or during the years ended December 31,
20122014 and
2011. There have been no transfers between Level 1 and Level 2 for the years ended December 31, 2012 and 2011.| (In millions) | | Quoted prices in
active markets for
identical assets | | | Significant other
observable inputs | | | Significant
unobservable
inputs | | | | |
| | (Level 1) | | | (Level 2) | | | (Level 3) | | | Total | |
| At December 31, 2012 | | | | | | | | | | | | |
| Fixed maturities, available for sale: | | | | | | | | | | | | | | | | |
| States, municipalities and political subdivisions | | $ | - | | | $ | 36 | | | $ | - | | | $ | 36 | |
| Corporate securities | | | - | | | | 24 | | | | - | | | | 24 | |
| Total fixed maturities, available for sale | | | - | | | | 60 | | | | - | | | | 60 | |
| Common equities, available for sale | | | 175 | | | | - | | | | - | | | | 175 | |
| Total | | $ | 175 | | | $ | 60 | | | $ | - | | | $ | 235 | |
| | | | | | | | | | | | | | | | | |
| At December 31, 2011 | | | | | | | | | | | | |
| Fixed maturities, available for sale: | | | | | | | | | | | | | | | | |
| States, municipalities and political subdivisions | | $ | - | | | $ | 34 | | | $ | - | | | $ | 34 | |
| Corporate securities | | | - | | | | 25 | | | | - | | | | 25 | |
| Total fixed maturities, available for sale | | | - | | | | 59 | | | | - | | | | 59 | |
| Common equities, available for sale | | | 149 | | | | - | | | | - | | | | 149 | |
| Preferred equities, available for sale | | | 4 | | | | - | | | | - | | | | 4 | |
| Total | | $ | 153 | | | $ | 59 | | | $ | - | | | $ | 212 | |
2013.
|
| | | | | | | | | | | | | | | | |
| (Dollars in millions) | | Quoted prices in
active markets for
identical assets (Level 1) | | Significant other
observable inputs (Level 2) | | Significant
unobservable
inputs (Level 3) | | Total |
| At December 31, 2014 | | | | |
| Fixed maturities, available for sale: | | |
| | |
| | |
| | |
|
| States, municipalities and political subdivisions | | $ | — |
| | $ | 33 |
| | $ | — |
| | $ | 33 |
|
| Corporate securities | | — |
| | 19 |
| | — |
| | 19 |
|
| Total fixed maturities, available for sale | | — |
| | 52 |
| | — |
| | 52 |
|
| Common equities, available for sale | | 225 |
| | — |
| | — |
| | 225 |
|
| Total | | $ | 225 |
| | $ | 52 |
| | $ | — |
| | $ | 277 |
|
| | | | | | | | | |
| At December 31, 2013 | | | | | | | | |
| Fixed maturities, available for sale: | | |
| | |
| | |
| | |
|
| States, municipalities and political subdivisions | | $ | — |
| | $ | 32 |
| | $ | — |
| | $ | 32 |
|
| Corporate securities | | — |
| | 21 |
| | — |
| | 21 |
|
| Total fixed maturities, available for sale | | — |
| | 53 |
| | — |
| | 53 |
|
| Common equities, available for sale | | 208 |
| | — |
| | — |
| | 208 |
|
| Total | | $ | 208 |
| | $ | 53 |
| | $ | — |
| | $ | 261 |
|
| | | | | | | | | |
Cincinnati Financial Corporation - 2014 10-K - Page 151
Our pension plan assets included
567,113467,113 shares of the company’s common stock
at both December 31, 2014 and 2013, which had a fair value of
$22 million and $17$24 million at
both December 31,
20122014 and
2011.2013. The defined benefit pension plan did not purchase any shares of our common stock during
20122014 and
2011.2013. No shares of our common stock were sold during
2012.2014. During
2011,2013, the pension plan sold
75,000100,000 shares of the company’s common stock for a realized gain of
$2$5 million. The company paid $1 million in cash dividends on our common stock to the pension plan in both
20122014 and
2011.2013.
We contributed
$15$5 million to our qualified plan during the first quarter of
20132015 and expect to
contributepay out $3 million of benefit payments from the SERP during
2013.2015. We expect to make the following benefit payments for our qualified plan and SERP, reflecting expected future service:
| (In millions) | | Years ended December 31, | |
| | 2013 | | | 2014 | | | 2015 | | | 2016 | | | 2017 | | | 2018 - 2022 | |
| Expected future benefit payments | | $ | 30 | | | $ | 25 | | | $ | 27 | | | $ | 26 | | | $ | 26 | | | $ | 134 | |
| | | | | | | | | | | | | | | | | | | | | | | | | |
14. | Statutory accounting Information |
|
| | | | | | | | | | | | | | | | | | | | | | | | |
| (Dollars in millions) | | Years ended December 31, |
| | | 2015 | | 2016 | | 2017 | | 2018 | | 2019 | | 2020 - 2024 |
| Expected future benefit payments | | $ | 26 |
| | $ | 32 |
| | $ | 29 |
| | $ | 23 |
| | $ | 24 |
| | $ | 142 |
|
| | | | | | | | | | | | | |
Cincinnati Financial Corporation - 2014 10-K - Page 152
NOTE 14 – Statutory Accounting Information
Insurance companies’ statutory financial statements are presented on the basis of accounting practices prescribed or permitted by applicable state insurance departments of domicile. Insurance companies use statutory accounting practices (SAP) as recognized by various states. We have adopted the National Association of Insurance Commissioners’ (NAIC)Accounting Practices and Procedures manual, version effective January 1, 2001, and updates through the current year as a component of prescribed or permitted practices by laws of the state of domicile. The primary differences between SAP and GAAP include the valuation of unrealized investment gains and losses, expensing of policy acquisition costs, actuarial assumptions for life insurance reserves and deferred income taxes based on differences in statutory and taxable income. Statutory net income
(loss) and capital and surplus are determined in accordance with SAP prescribed or permitted by insurance regulatory authorities for five legal entities, our insurance subsidiary and its four insurance subsidiaries. Statutory capital and surplus for our insurance subsidiary, The Cincinnati Insurance Company, includes capital and surplus of its four insurance subsidiaries.
All capital and surplus amounts exceed statutory risk-based capital requirements. The statutory net income
(loss) and statutory
capital and surplus are presented below:
| (In millions) | | SAP Net Income (Loss) | | | Capital and Surplus | |
| | | Years ended December 31, | | | At December 31, | |
| | 2012 | | | 2011 | | | 2010 | | | 2012 | | | 2011 | |
| The Cincinnati Insurance Company | | $ | 334 | | | $ | 120 | | | $ | 318 | | | $ | 3,914 | | | $ | 3,747 | |
| The Cincinnati Casualty Company | | | 10 | | | | 15 | | | | 10 | | | | 293 | | | | 280 | |
| The Cincinnati Indemnity Company | | | 2 | | | | 2 | | | | 2 | | | | 76 | | | | 73 | |
| The Cincinnati Specialty Underwriters Insurance Company | | | 6 | | | | 11 | | | | 1 | | | | 199 | | | | 186 | |
| The Cincinnati Life Insurance Company | | | 5 | | | | (13 | ) | | | 15 | | | | 276 | | | | 281 | |
15. | Transactions with Affiliated Parties |
|
| | | | | | | | | | | | | | | | | | | | |
| (Dollars in millions) | | Net income (loss) | | Capital and surplus |
| | | Years ended December 31, | | At December 31, |
| | | 2014 | | 2013 | | 2012 | | 2014 | | 2013 |
| The Cincinnati Insurance Company | | $ | 436 |
| | $ | 418 |
| | $ | 334 |
| | $ | 4,472 |
| | $ | 4,326 |
|
| The Cincinnati Casualty Company | | 12 |
| | 10 |
| | 10 |
| | 330 |
| | 317 |
|
| The Cincinnati Indemnity Company | | 3 |
| | 2 |
| | 2 |
| | 86 |
| | 82 |
|
| The Cincinnati Specialty Underwriters Insurance Company | | 32 |
| | 18 |
| | 6 |
| | 266 |
| | 228 |
|
| The Cincinnati Life Insurance Company | | (19 | ) | | (20 | ) | | 5 |
| | 223 |
| | 247 |
|
| | | | | | | | | | | |
NOTE 15 – Transactions With Affiliated Parties
We paid certain officers and directors, or insurance agencies of which they are shareholders, commissions of approximately
$7 million in 2014, $6 million in 2013 and $5 million in 2012, and $6 in 2011 and 2010, on premium volume of approximately$41 million, $35 million $34 million and $36
$35 million for 2014, 2013 and 2012, 2011respectively.
NOTE 16 – Commitments and
2010, respectively.16. | Commitments and Contingent Liabilities |
Contingent Liabilities
In the ordinary course of conducting business, the company and its subsidiaries are
named as defendantsinvolved in various legal
proceedings. Mostproceedings, namely claims litigation. The company's insurance subsidiaries participate in most of these proceedings
are claims litigation involving the company’s insurance subsidiaries in which the company isby either defending
or providing indemnity for third-party claims brought against insureds
who areor litigating first-party coverage claims. The company accounts for such activity through the establishment of unpaid loss and loss adjustment expense reserves. We believe that the ultimate liability, if any, with respect to such ordinary-course claims litigation, after consideration of provisions made for potential losses and costs of defense, is immaterial to our consolidated financial condition, results of operations and cash flows.
The company and its subsidiaries also are occasionally involved in other legal and regulatory proceedings, some of which assert claims for substantial amounts. These actions include, among others, putative class actions seeking certification of a state or national class. Such proceedings have alleged, for example, breach of an alleged duty to search national data bases to ascertain unreported deaths of insureds under life insurance policies. The company’s insurance subsidiaries also are occasionally parties to individual actions in which extra-contractual damages, punitive damages or penalties are sought, such as claims alleging bad faith in the handling of insurance claims or claims alleging discrimination by former associates.
Cincinnati Financial Corporation - 2014 10-K - Page 153
On a quarterly basis, we review these outstanding matters. Under current accounting guidance, we establish accruals when it is probable that a loss has been incurred and we can reasonably estimate its potential exposure. The company accounts for such probable and estimable losses, if any, through the establishment of legal expense reserves. Based on our quarterly review, we believe that our accruals for probable and estimable losses are reasonable and that the amounts accrued do not have a material effect on our consolidated financial condition or results of operations. However, if any one or more of these matters results in a judgment against us or settlement for an amount that is significantly greater than the amount accrued, the resulting liability could have a material effect on the company’s consolidated results of operations or cash flows. Based on our most recent review, our estimate for any other matter for which the risk of loss is more than remote is less than
$500,000.17. | Stock-Based Associate Compensation Plans |
$1 million.
NOTE 17 – Share-Based Associate Compensation Plans
Four equity compensation plans currently permit us to grant various types of equity awards. We currently grant incentive stock options, nonqualified stock options, service-based restricted stock units and performance-based restricted stock units to associates, including some with market-based performance objectives under our shareholder-approved plans. We also have a Holiday Stock Plan that permits annual awards of one share of common stock to each full-time associate for each full calendar year of service up to a maximum of 10 shares. One of our equity compensation plans permits us to grant stock to our outside directors as a component of their annual compensation.Stock-based We used treasury shares for share-based compensation award issues or exercises during 2014.
Share-based compensation cost after tax was $11$13 million $9, $12 million and $8$11 million for the years ended
December 31, 2012, 20112014, 2013 and 2010,2012, respectively. The related income tax benefit recognized was $5$6 million $4,
$6 million and $3$5 million for the years ended December 31, 2014, 2013 and 2012, 2011 and 2010, respectively. Options exercised during the year ended December 31, 2012, had intrinsic value of $6 million. Options exercised during the years ended December 31, 20112014, 2013 and 20102012, had intrinsic value less than $1 million. (Intrinsicof $13 million,
$17 million, and $6 million, respectively. Intrinsic value is the market price less the exercise price.) Options vested during the yearyears ended December 31, 2012, 20112014, 2013 and 20102012, had total intrinsic value of $5$9 million $2, $15 million and $1$5 million, respectively. As of December 31, 2012,2014, we had $19$21 million of unrecognized total compensation cost related to nonvested stock options and restricted stock unit awards. That cost will be recognized over a weighted-average period of 1.81.7 years. Stock options are granted to associates at an exercise price that is equal to the fair value as determined by the average high and low sales price reported on the Nasdaq Global Select Market for the grant date and are exercisable over 10-year10-year periods. The stock options generally vest ratably over a three-year period. In determining the share-based compensation amounts, we estimate the fair value of each option granted on the date of grant using a binomial option-pricing model. We make the following assumptions in four areas to develop the binomial option-pricing model: | · | Weighted-average expected term is based on historical experience of similar awards with consideration for current exercise trends. |
| · | Expected volatility is based on our stock price over a historical period that approximates the expected term. |
| · | Dividend yield is determined by dividing the annualized per share dividend by the stock price on the date of grant. |
| · | Risk-free rates are the implied yield currently available on zero-coupon U.S. Treasury issues with a remaining term approximating the expected term. |
model as follows:
Weighted-average expected term is based on historical experience of similar awards with consideration for current exercise trends.
Expected volatility is based on our stock price over a historical period that approximates the expected term.
Dividend yield is determined by dividing the annualized per share dividend by the stock price on the date of grant.
Risk-free rates are the implied yield currently available on zero-coupon U.S. Treasury issues with a remaining term approximating the expected term.
Cincinnati Financial Corporation - 2014 10-K - Page 154
The following weighted average assumptions were used in determining fair value for option grants issued during
20122014 and
2011:| | | 2012 | | 2011 |
| Weighted-average expected term | | | 8-10 years | | | 9 years |
| Expected volatility | | | 25.26-26.20% | | | 26.06-26.12% |
| Dividend yield | | | 4.51-4.52% | | | 4.70-5.29% |
| Risk-free rates | | | 1.58-2.00% | | | 2.86-3.41% |
| Weighted-average fair value of options granted during the period | | $ | 6.78 | | $ | 7.29 |
2013:
|
| | | | | | |
| | | 2014 | | 2013 | | 2012 |
| Weighted-average expected term | | 8-9 years | | 9-10 years | | 8-10 years |
| Expected volatility | | 25.20-26.22% | | 25.25-26.31% | | 25.26-26.20% |
| Dividend yield | | 3.76% | | 3.65% | | 4.51-4.52% |
| Risk-free rates | | 2.42-2.62% | | 1.82-2.00% | | 1.58-2.00% |
| Weighted-average fair value of options granted during the period | | $10.16 | | $9.71 | | $6.78 |
| | | | | | | |
This is a summary of options information:
| (Dollars in millions, shares in thousands) | | Shares | | | Weighted-
average exercise
price | | | Aggregate
intrinsic
value | |
| Outstanding at January 1, 2012 | | | 9,357 | | | $ | 36.71 | | | | | |
| Granted | | | 536 | | | | 35.63 | | | | | |
| Exercised | | | (708 | ) | | | 30.77 | | | | | |
| Forfeited or expired | | | (1,248 | ) | | | 35.66 | | | | | |
| Outstanding at December 31, 2012 | | | 7,937 | | | | 37.34 | | | $ | 26 | |
| | | | | | | | | | | | | |
| Options exercisable at end of period | | | 6,594 | | | $ | 38.20 | | | $ | 18 | |
|
| | | | | | | | | | | |
| (Dollars in millions, shares in thousands) | | Shares | | Weighted-
average exercise price | | Aggregate
intrinsic
value |
| Outstanding shares at January 1, 2014 | | 6,332 |
| | $ | 38.39 |
| | |
|
| Granted | | 401 |
| | 46.81 |
| | |
|
| Exercised | | (1,086 | ) | | 37.59 |
| | |
|
| Forfeited or expired | | (689 | ) | | 39.49 |
| | |
|
| Outstanding shares at December 31, 2014 | | 4,958 |
| | 39.10 |
| | $ | 66 |
|
| | | | | | | |
| Options exercisable at end of period | | 4,165 |
| | $ | 38.17 |
| | $ | 59 |
|
| | | | | | | |
Cash received from the exercise of options was $10$22 million, $25 millionand $1$10 million for the years ended December 31, 2014, 2013 and 2012, and 2011, and less than $1 million for the year ended 2010.respectively. We acquired 378,276, 577,745 and 311,524 shares totaling
$19 million, $28 million and $12 million, respectively, from associates in consideration for option exercises during 2014, 2013 and 2012. The weighted-average remaining contractual life for options expected to vest as of December 31, 2014, was 8.4 years.
Options outstanding and exercisable consisted of the following at December 31,
2012:| (Shares in thousands) | | | Options outstanding | | | Options exercisable | |
| Range of exercise prices | | | Shares | | | Weighted-average
remaining contractual
life | | | Weighted-
average
exercise price | | | Shares | | | Weighted-
average
exercise price | |
| $25.00 to $29.99 | | | | 1,359 | | | | 6.39yrs | | | $ | 26.58 | | | | 1,087 | | | $ | 26.57 | |
| $30.00 to $34.99 | | | | 1,355 | | | | 5.06yrs | | | | 33.40 | | | | 797 | | | | 32.99 | |
| $35.00 to $39.99 | | | | 2,328 | | | | 3.95yrs | | | | 38.08 | | | | 1,815 | | | | 38.77 | |
| $40.00 to $44.99 | | | | 1,740 | | | | 2.53yrs | | | | 42.56 | | | | 1,740 | | | | 42.56 | |
| $45.00 to $49.99 | | | | 1,155 | | | | 2.93yrs | | | | 45.26 | | | | 1,155 | | | | 45.26 | |
| | Total | | | | 7,937 | | | | 4.10yrs | | | | 37.34 | | | | 6,594 | | | | 38.20 | |
| | | | | | | | | | | | | | | | | | | | | | | | | | | |
2014:
|
| | | | | | | | | | | | | | | | |
| (Shares in thousands) | | Options outstanding | | Options exercisable |
| Range of exercise prices | | Shares | | Weighted-average
remaining contractual
life | | Weighted-
average
exercise price | | Shares | | Weighted-
average
exercise price |
| $25.00 to $29.99 | | 731 |
| | 4.58 years | | $ | 26.58 |
| | 731 |
| | $ | 26.58 |
|
| $30.00 to $34.99 | | 675 |
| | 6.01 years | | 33.96 |
| | 675 |
| | 33.96 |
|
| $35.00 to $39.99 | | 981 |
| | 4.90 years | | 37.31 |
| | 824 |
| | 37.63 |
|
| $40.00 to $44.99 | | 1,258 |
| | 3.09 years | | 43.58 |
| | 1,015 |
| | 43.32 |
|
| $45.00 to $49.99 | | 1,313 |
| | 3.50 years | | 45.73 |
| | 920 |
| | 45.26 |
|
| Total | | 4,958 |
| | 4.17 years | | 39.10 |
| | 4,165 |
| | 38.17 |
|
| | | | | | | | | | | |
The weighted-average remaining contractual life for exercisable awards as of December 31, 2012,2014, was 3.23.4 years. Under all active shareholder approved plans, a total of 17.3 million shares were authorized to be granted. These include the 7 million shares available under the Cincinnati Financial Corporation 2012 Stock Compensation Plan approved by shareholders in 2012. At December 31, 2012, 9.32014, 6.2 million shares remained available for future issuance under the plans. During 2012,2014, we granted 24,11820,760 shares of common stock to our directors for 20112013 board service fees. We currently issue new shares or use treasury shares for stock-based compensation award issues or exercises.
Cincinnati Financial Corporation - 2014 10-K - Page 155
Service-based restricted stock units are granted to associates are valued at fair value of the shares on the date of grant less the present value of the dividends that holders of restricted stock units willdo not receive on the shares underlying the restricted stock units during the vesting period. Service-based restricted stock units cliff vest three years after the date of grant. Service-based restricted stock units vested during the year had an intrinsic value of $14 million, $15 million and less than $1$1 million $13 million and $5 million for the years ended December 31, 2014, 2013 and 2012, 2011 and 2010, respectively. Service-based shares are issued out of treasury shares. We have performance-based awards that vest on the first day of March after a three-calendar-year performance period. These awards vest according to the level of three-year total shareholder return achieved compared towith a peer group over a three-year performance period with payouts ranging from 0-125%. Total0 - 200 percent for awards granted in 2013 and 2014. For awards granted in 2012, the payout range on these performance awards is 0 - 125 percent. Three-year total shareholder return is calculated by Bloomberg, using annualized total return of a stock to an investor due to capital gain appreciation plus reinvestment of all dividends. We issued 53,15059,615 shares of performance-based restricted stock units during 20122014 at the target-levelmaximum-level performance hurdle for the three-yearthree-year performance period endingended December 31, 2011,2013, as we achieved a three-year total shareholder return whichthat exceeded fourall seven of the companies in our eight peers.2011 peer group. For the three-year performance period ended December 31, 2012,2014, our total shareholder return exceeded allsix of 10 peers in our 2012 peer group. We expect payout of these shares at the maximumtarget level to occur onin March 1, 2013.of 2015. Performance-based shares are issued outawards vested during the year had an intrinsic value of treasury shares.$3 million, $3 million and $2 million for the years ended December 31, 2014, 2013 and 2012, respectively.
These performance-based awards are valued using a Monte-Carlo valuation on the date of grant, which uses a
risk-neutralrisk‑neutral framework to model future stock price movements based upon the risk-free rate of return, the volatility of each peer and the
pairwise correlations of each peer being modeled. Compensation cost is recognized regardless of whether the market-based performance objective has been satisfied. We make assumptions to develop the Monte-Carlo model as follows:
| · | Correlation coefficients are based upon the price data used to calculate the historical volatilities. The correlation coefficients are used to model the way in which each entity tends to move in relation to each other. |
| · | Expected volatility is based on our stock price over a historical period that approximates the expected term. We have used the historical volatilities of 2.87 for 2012 grants and 2.59-2.87 years for 2011 grants. |
| · | Dividend yield has been modeled assuming that the holder of the award is not entitled to receive dividends that are paid during the performance period. Dividend yields of 4.51% for 2012 grants and 4.68%-5.26% for 2011 grants were used. |
| · | Risk-free rates are equal to the yield, as of the measurement date, of the zero-coupon U.S. Treasury bill that is commensurate with the performance period. Risk-free rates used were 0.40% for 2012 grants and 0.65%-1.25% for 2011 grants. |
Correlation coefficients are based upon the price data used to calculate the historical volatilities. The correlation coefficients are used to model the way each entity tends to move in relation to each other.
Expected volatility is based on our stock price over a historical period that approximates the remainder of the performance period. We have used the historical volatilities of 2.88 percent for 2014 grants and 2.87 percent for 2013 grants.
Dividend yield has been modeled assuming dividends are reinvested in the issuing entity on a continuous basis and the holder of the award is not entitled to receive dividends paid during the performance period. Dividend yields of 3.74 percent for 2014 grants and 3.63 percent for 2013 grants were used.
Risk-free rates are equal to the yield, as of the measurement date, of the zero-coupon U.S. Treasury bill that is commensurate with the performance measurement period. Risk-free rates used were 0.66 percent for 2014 and 0.40 percent for 2013 grants.
This is a summary of
restricted stock unitservice-based and performance-based share information, assuming a target payout for performance-based shares, for the year
2012:| (Shares in thousands) | | Service-based
shares | | | Weighted-
average grant
date fair value | | | Performance-based
shares | | | Weighted-
average grant
date fair value | |
| Nonvested at January 1, 2012 | | | 563 | | | $ | 26.05 | | | | 156 | | | $ | 25.86 | |
| Granted | | | 403 | | | | 31.14 | | | | 110 | | | | 34.89 | |
| Vested | | | (7 | ) | | | 27.84 | | | | (53 | ) | | | 22.88 | |
| Forfeited or canceled | | | (29 | ) | | | 27.96 | | | | (4 | ) | | | 30.98 | |
| Nonvested at December 31, 2012 | | | 930 | | | | 28.18 | | | | 209 | | | | 31.26 | |
2014:
|
| | | | | | | | | | | | | | |
| (Shares in thousands) | | Service-based
shares | | Weighted-
average grant
date fair value | | Performance-based
shares | | Weighted-
average grant
date fair value |
| Nonvested at January 1, 2014 | | 936 |
| | $ | 33.61 |
| | 246 |
| | $ | 37.66 |
|
| Granted | | 331 |
| | 41.84 |
| | 99 |
| | 36.03 |
|
| Vested | | (271 | ) | | 29.79 |
| | (60 | ) | | 30.91 |
|
| Forfeited or canceled | | (28 | ) | | 36.28 |
| | (2 | ) | | 31.77 |
|
| Nonvested at December 31, 2014 | | 968 |
| | 37.42 |
| | 283 |
| | 38.55 |
|
| | | | | | | | | |
Cincinnati Financial Corporation - 2014 10-K - Page 156
NOTE 18 – Segment Information
We operate primarily in two industries, property casualty insurance and life insurance. We regularly review our reporting segments to make decisions about allocating resources and assessing performance.
| · | Commercial lines property casualty insurance |
| · | Personal lines property casualty insurance |
| · | Excess and surplus lines property casualty insurance |
On January 1, 2012, we retrospectively adopted ASU 2010-26,Accounting for Costs Associated with Acquiring or Renewing Insurance Contracts.All prior years’ information has been restated.
Our reporting segments are:
Commercial lines insurance
Personal lines insurance
Excess and surplus lines insurance
Life insurance
Investments
We report as Other the noninvestment operations of the parent company and its noninsurer subsidiary, CFC Investment Company.
Revenues come primarily from unaffiliated customers:
| · | All four insurance segments record revenues from insurance premiums earned. Life insurance segment revenues also include separate account investment management fees. |
| · | Fee revenues for the commercial and personal insurance segments primarily represent installment fees. |
| · | Our investment operations’ revenues consist of pretax net investment income and realized investment gains and losses. |
| · | Other revenues are primarily finance income. |
All four insurance segments record revenues from insurance premiums earned. Life insurance segment revenues also include separate account investment management fees.
Fee revenues for the commercial and personal insurance segments primarily represent installment fees. Fee revenues for the life insurance segment represent separate account investment management fees.
Our investments’ revenues consist of pretax net investment income and realized investment gains and losses.
Other revenues are primarily finance income.
Income or loss before income taxes for each segment is reported based on the nature of that business area’s operations:
Income before income taxes for the insurance segments is defined as underwriting profit or loss.
| · | Income before income taxes for the insurance segments is defined as underwriting profit or loss. |
| o◦ | For commercial lines, personal lines and excess and surplus lines insurance segments, we calculate underwriting profit or loss as premiums earned and fee revenue minus loss and loss expenses and underwriting expenses incurred. |
| o |
| ◦ | For the life insurance segment, we calculate underwriting profit or loss as premiums earned and separate account investment management fees, minus contract holders’ benefits and expenses incurred, plus investment interest credited to contract holders. |
| · | Income before income taxes for the investment operations segment is net investment income plus realized investment gains and losses for investments of the entire company, minus investment interest credited to contract holders of the life insurance segment. |
| · | Loss before income taxes for the Other category is primarily due to interest expense from debt of the parent company and operating expenses of our headquarters. |
Income before income taxes for the investments segment is net investment income plus realized investment gains and losses for investments of the entire company, minus investment interest credited to contract holders of the life insurance segment.
Loss before income taxes for the Other category is primarily due to interest expense from debt of the parent company and operating expenses of our headquarters.
Identifiable assets are used by each segment in its operations. We do not separately report the identifiable assets for the commercial, personal or excess and surplus lines segments because we do not use that measure to analyze the segments. We include all investment assets, regardless of ownership, in the
investment operationsinvestments segment.
Cincinnati Financial Corporation - 2014 10-K - Page 157
This table summarizes segment information:
| (In millions) | | Years ended December 31, | |
| | 2012 | | | 2011 | | | 2010 | |
| Revenues: | | | | | | | | | | | | |
| Commercial lines insurance | | | | | | | | | | | | |
| Commercial casualty | | $ | 767 | | | $ | 711 | | | $ | 693 | |
| Commercial property | | | 545 | | | | 497 | | | | 489 | |
| Commercial auto | | | 426 | | | | 394 | | | | 384 | |
| Workers' compensation | | | 344 | | | | 318 | | | | 311 | |
| Specialty packages | | | 151 | | | | 138 | | | | 149 | |
| Surety and executive risk | | | 111 | | | | 103 | | | | 95 | |
| Machinery and equipment | | | 39 | | | | 36 | | | | 33 | |
| Commercial lines insurance premiums | | | 2,383 | | | | 2,197 | | | | 2,154 | |
| Fee revenue | | | 4 | | | | 3 | | | | 2 | |
| Total commercial lines insurance | | | 2,387 | | | | 2,200 | | | | 2,156 | |
| | | | | | | | | | | | | |
| Personal lines insurance | | | | | | | | | | | | |
| Personal auto | | | 404 | | | | 368 | | | | 337 | |
| Homeowner | | | 353 | | | | 294 | | | | 289 | |
| Other personal lines | | | 111 | | | | 100 | | | | 95 | |
| Personal lines insurance premiums | | | 868 | | | | 762 | | | | 721 | |
| Fee revenue | | | 2 | | | | 1 | | | | 2 | |
| Total personal lines insurance | | | 870 | | | | 763 | | | | 723 | |
| | | | | | | | | | | | | |
| Excess and surplus lines insurance | | | 93 | | | | 70 | | | | 49 | |
| | | | | | | | | | | | | |
| Life insurance premiums | | | 178 | | | | 165 | | | | 158 | |
| Separate account investment management fees | | | 1 | | | | 2 | | | | 1 | |
| Total life insurance | | | 179 | | | | 167 | | | | 159 | |
| | | | | | | | | | | | | |
| Investment operations | | | | | | | | | | | | |
| Investment income, net of expenses | | | 531 | | | | 525 | | | | 518 | |
| Realized investment gains, net | | | 42 | | | | 70 | | | | 159 | |
| Total investment revenue | | | 573 | | | | 595 | | | | 677 | |
| | | | | | | | | | | | | |
| Other | | | 9 | | | | 8 | | | | 8 | |
| Total revenues | | $ | 4,111 | | | $ | 3,803 | | | $ | 3,772 | |
| | | | | | | | | | | | | |
| Income (loss) before income taxes: | | | | | | | | | | | | |
| Insurance underwriting results: | | | | | | | | | | | | |
| Commercial lines insurance | | $ | 181 | | | $ | (102 | ) | | $ | 14 | |
| Personal lines insurance | | | (43 | ) | | | (182 | ) | | | (55 | ) |
| Excess and surplus lines insurance | | | (1 | ) | | | 6 | | | | (8 | ) |
| Life insurance | | | (3 | ) | | | (3 | ) | | | 6 | |
| Investment operations | | | 491 | | | | 514 | | | | 598 | |
| Other | | | (59 | ) | | | (60 | ) | | | (57 | ) |
| Total income before income taxes | | $ | 566 | | | $ | 173 | | | $ | 498 | |
| | | | | | | | | | | | | |
| | | December 31, | | | December 31, | | | | |
| | | 2012 | | | 2011 | | | | |
| Identifiable assets: | | | | | | | | | | | | |
| Property casualty insurance | | $ | 2,395 | | | $ | 2,272 | | | | | |
| Life insurance | | | 1,201 | | | | 1,237 | | | | | |
| Investment operations | | | 12,599 | | | | 11,883 | | | | | |
| Other | | | 353 | | | | 243 | | | | | |
| Total | | $ | 16,548 | | | $ | 15,635 | | | | | |
| 19. | Quarterly Supplementary Data |
|
| | | | | | | | | | | | |
| (Dollars in millions) | | Years ended December 31, |
| | | 2014 | | 2013 | | 2012 |
| Revenues: | | |
| | |
| | |
|
| Commercial lines insurance | | |
| | |
| | |
|
| Commercial casualty | | $ | 938 |
| | $ | 856 |
| | $ | 767 |
|
| Commercial property | | 728 |
| | 623 |
| | 545 |
|
| Commercial auto | | 528 |
| | 479 |
| | 426 |
|
| Workers' compensation | | 370 |
| | 365 |
| | 344 |
|
| Other commercial lines | | 292 |
| | 313 |
| | 301 |
|
| Commercial lines insurance premiums | | 2,856 |
| | 2,636 |
| | 2,383 |
|
| Fee revenues | | 4 |
| | 3 |
| | 4 |
|
| Total commercial lines insurance | | 2,860 |
| | 2,639 |
| | 2,387 |
|
| | | | | | | |
| Personal lines insurance | | |
| | |
| | |
|
| Personal auto | | 476 |
| | 443 |
| | 404 |
|
| Homeowner | | 443 |
| | 403 |
| | 353 |
|
| Other personal lines | | 122 |
| | 115 |
| | 111 |
|
| Personal lines insurance premiums | | 1,041 |
| | 961 |
| | 868 |
|
| Fee revenues | | 2 |
| | 1 |
| | 2 |
|
| Total personal lines insurance | | 1,043 |
| | 962 |
| | 870 |
|
| | | | | | | |
| Excess and surplus lines insurance | | 148 |
| | 116 |
| | 93 |
|
| | | | | | | |
| Life insurance premiums | | 198 |
| | 189 |
| | 178 |
|
| Separate account investment management fees | | 6 |
| | 4 |
| | 1 |
|
| Total life insurance | | 204 |
| | 193 |
| | 179 |
|
| | | | | | | |
| Investments | | |
| | |
| | |
|
| Investment income, net of expenses | | 549 |
| | 529 |
| | 531 |
|
| Realized investment gains, net | | 133 |
| | 83 |
| | 42 |
|
| Total investment revenue | | 682 |
| | 612 |
| | 573 |
|
| | | | | | | |
| Other | | 8 |
| | 9 |
| | 9 |
|
| Total revenues | | $ | 4,945 |
| | $ | 4,531 |
| | $ | 4,111 |
|
| | | | | | | |
| Income (loss) before income taxes: | | |
| | |
| | |
|
| Insurance underwriting results: | | |
| | |
| | |
|
| Commercial lines insurance | | $ | 146 |
| | $ | 186 |
| | $ | 181 |
|
| Personal lines insurance | | 10 |
| | 33 |
| | (43 | ) |
| Excess and surplus lines insurance | | 30 |
| | 14 |
| | (1 | ) |
| Life insurance | | (5 | ) | | 9 |
| | (3 | ) |
| Investments | | 599 |
| | 532 |
| | 491 |
|
| Other | | (59 | ) | | (60 | ) | | (59 | ) |
| Total income before income taxes | | $ | 721 |
| | $ | 714 |
| | $ | 566 |
|
| | | | | | | |
| | | December 31, | | December 31, | | |
| Identifiable assets: | | 2014 | | 2013 | | |
| Property casualty insurance | | $ | 2,656 |
| | $ | 2,455 |
| | |
|
| Life insurance | | 1,316 |
| | 1,225 |
| | |
| Investments | | 14,441 |
| | 13,618 |
| | |
|
| Other | | 340 |
| | 364 |
| | |
|
| Total | | $ | 18,753 |
| | $ | 17,662 |
| | |
|
| | | | | | | |
Cincinnati Financial Corporation - 2014 10-K - Page 158
NOTE 19 – Quarterly Supplementary Data
This table includes unaudited quarterly financial information for the years ended December 31,
20122014 and
2011:| (Dollars in millions except per share data) | | Quarter | | | | |
| | 1st | | | 2nd | | | 3rd | | | 4th | | | Full year | |
| 2012 | | | | | | | | | | | | | | | | | | | | |
| Revenues * | | $ | 986 | | | $ | 1,020 | | | $ | 1,035 | | | $ | 1,070 | | | $ | 4,111 | |
| Income before income taxes | | | 112 | | | | 29 | | | | 152 | | | | 273 | | | | 566 | |
| Net income | | | 86 | | | | 32 | | | | 111 | | | | 192 | | | | 421 | |
| Net income per common share—basic | | | 0.53 | | | | 0.20 | | | | 0.69 | | | | 1.18 | | | | 2.59 | |
| Net income per common share—diluted | | | 0.53 | | | | 0.20 | | | | 0.68 | | | | 1.17 | | | | 2.57 | |
| | | | | | | | | | | | | | | | | | | | | |
| 2011 | | | | | | | | | | | | | | | | | | | | |
| Revenues * | | $ | 929 | | | $ | 975 | | | $ | 944 | | | $ | 955 | | | $ | 3,803 | |
| Income (loss) before income taxes | | | 75 | | | | (99 | ) | | | 11 | | | | 186 | | | | 173 | |
| Net income (loss) | | | 61 | | | | (50 | ) | | | 19 | | | | 134 | | | | 164 | |
| Net income (loss) per common share—basic | | | 0.38 | | | | (0.31 | ) | | | 0.12 | | | | 0.82 | | | | 1.01 | |
| Net income (loss) per common share—diluted | | | 0.38 | | | | (0.31 | ) | | | 0.12 | | | | 0.82 | | | | 1.01 | |
2013:
|
| | | | | | | | | | | | | | | | | | | | |
| (Dollars in millions except per share data) | | Quarter | | |
| | | 1st | | 2nd | | 3rd | | 4th | | Full year |
| 2014 | | |
| | |
| | |
| | |
| | |
|
| Revenues | | $ | 1,189 |
| | $ | 1,214 |
| | $ | 1,280 |
| | $ | 1,262 |
| | $ | 4,945 |
|
| Income before income taxes | | 119 |
| | 107 |
| | 259 |
| | 236 |
| | 721 |
|
| Net income | | 91 |
| | 84 |
| | 183 |
| | 167 |
| | 525 |
|
| Net income per common share—basic | | 0.56 |
| | 0.51 |
| | 1.12 |
| | 1.03 |
| | 3.21 |
|
| Net income per common share—diluted | | 0.55 |
| | 0.51 |
| | 1.11 |
| | 1.02 |
| | 3.18 |
|
| | | | | | | | | | | |
| 2013 | | |
| | |
| | |
| | |
| | |
|
| Revenues | | $ | 1,103 |
| | $ | 1,104 |
| | $ | 1,152 |
| | $ | 1,172 |
| | $ | 4,531 |
|
| Income before income taxes | | 217 |
| | 148 |
| | 182 |
| | 167 |
| | 714 |
|
| Net income | | 154 |
| | 110 |
| | 131 |
| | 122 |
| | 517 |
|
| Net income per common share—basic | | 0.95 |
| | 0.67 |
| | 0.80 |
| | 0.75 |
| | 3.16 |
|
| Net income per common share—diluted | | 0.94 |
| | 0.66 |
| | 0.79 |
| | 0.74 |
| | 3.12 |
|
| | | | | | | | | | | |
Note: The sum of the quarterly reported per share amounts may not equal the full year as each is computed independently.
| * | Revenues including realized investment gains and losses, which are integral to our financial results over the long term, may cause this value to fluctuate substantially because we have substantial discretion in the timing of investment sales. Also, applicable accounting standards require us to recognize gains and losses from certain changes in fair values of securities and embedded derivatives without actual realization of those gains and losses. We discuss realized investment gains for the past three years in Item 7, Investments Results of Operations, Page 79. |
| Item 9. | Changes in and Disagreements with Accountants on Accounting and Financial Disclosure |
Revenues including realized investment gains and losses, which are integral to our financial results over the long term, may cause this value to fluctuate substantially because we have substantial discretion in the timing of investment sales. Also, applicable accounting standards require us to recognize gains and losses from certain changes in fair values of securities and embedded derivatives without actual realization of those gains and losses.
Cincinnati Financial Corporation - 2014 10-K - Page 159
ITEM 9. Changes in and Disagreements With Accountants on
Accounting and Financial Disclosure
We had no disagreements with the independent registered public accounting firm on accounting and financial disclosure during the last two fiscal years.
| Item 9A. | Controls and Procedures |
ITEM 9A. Controls and Procedures
Evaluation of Disclosure Controls and Procedures – The company maintains disclosure controls and procedures (as that term is defined in Rules 13a-15(e) and 15d-15(e) under the Securities Exchange Act of 1934, as amended (Exchange Act)).
Any controls and procedures, no matter how well designed and operated, can provide only reasonable assurance of achieving the desired control objectives. The company’s management, with the participation of the company’s chief executive officer and chief financial officer, has evaluated the effectiveness of the design and operation of the company’s disclosure controls and procedures as of December 31,
2012.2014. Based upon that evaluation, the company’s chief executive officer and chief financial officer concluded that the design and operation of the company’s disclosure controls and procedures provided reasonable assurance that the disclosure controls and procedures are effective to ensure that:
| · | information required to be disclosed in the company’s reports under the Exchange Act is recorded, processed, summarized and reported within the time periods specified in the Securities and Exchange Commission’s rules and forms, and |
| · | such information is accumulated and communicated to the company’s management, including its chief executive officer and chief financial officer, as appropriate, to allow timely decisions regarding required disclosures. |
information required to be disclosed in the company’s reports under the Exchange Act is recorded, processed, summarized and reported within the time periods specified in the Securities and Exchange Commission’s rules and forms, and
such information is accumulated and communicated to the company’s management, including its chief executive officer and chief financial officer, as appropriate, to allow for timely decisions regarding required disclosures.
Changes in Internal Control over Financial Reporting – During the three months ended December 31,
2012,2014, there were no changes in our internal controls over financial reporting that have materially affected, or are reasonably likely to materially affect, our internal control over financial reporting. Management’s Annual Report on Internal Control Over Financial Reporting and the Report of the Independent Registered Public Accounting Firm are set forth in Item
8, Pages 106 and 107. | Item 9B. | Other Information |
8.
ITEM 9B. Other Information
Cincinnati Financial Corporation - 2014 10-K - Page 160
Our Proxy Statement will be filed with the SEC no later than
March 18, 2013,April 30, 2015, in preparation for the
20132015 Annual Meeting of Shareholders scheduled for
April 27, 2013.May 2, 2015. As permitted in Paragraph G(3) of the General Instructions for Form 10-K, we are incorporating by reference to that statement portions of the information required by Part III as noted in Item 10 through Item 14 below.
ITEM 10. Directors, Executive Officers and Corporate Governance
a) The following sections of our Proxy Statement for our Annual Meeting of Shareholders to be held May 2, 2015, are incorporated herein by reference: “Section 16(a) Beneficial Ownership Reporting Compliance,” “Information about the Board of Directors,” and “Governance of Your Company.”
b) Information about the “Code of Ethics for Senior Financial Officers” appeared in the 2004 Proxy Statement as an appendix and is available at cinfin.com/investors. Our Code of Ethics applies to those who are responsible for preparing and disclosing our financial information. This includes our chief executive officer, chief financial officer and others performing similar functions.
c) Set forth below is information concerning the company’s executive officers who are not also directors of the company, as of February 27, 2015.
| Item 10. | Directors, Executive Officers and Corporate Governance |
| a) | The following sections of our Proxy Statement for our Annual Meeting of Shareholders to be held April 27, 2013, are incorporated herein by reference: “Section 16(a) Beneficial Ownership Reporting Compliance,” “Information about the Board of Directors,” and “Governance of Your Company.” |
| b) | Information about the “Code of Ethics for Senior Financial Officers” appeared in the 2004 Proxy Statement as an appendix and is available atwww.cinfin.com/investors. Our Code of Ethics applies to those who are responsible for preparing and disclosing our financial information. This includes our chief executive officer, chief financial officer and others performing similar functions. |
| c) | Set forth below is information concerning about the company’s executive officers who are not also directors of the company, as of February 27, 2013. |
Name and Age as of
February 27, 20132015 | | Primary Title(s) and Business Responsibilities
Since February 20082010 | | Executive
Officer Since |
Teresa C. Cracas, (47)Esq. (49) | | Chief risk officer and senior vice president of The Cincinnati Insurance Company; until 2011, vice president and counsel.counsel until 2011. Responsible for strategic planning and risk management, including oversight of modeling for financial analysis, and property casualty reserving, pricing and pricing.insurance regulatory filings. | | 2011 |
Donald J. Doyle, Jr., CPCU, AIM (46)(48) | | Senior vice president of The Cincinnati Insurance Company. Responsible for excess and surplus lines underwriting and operations. | | 2008 |
Martin F. Hollenbeck, CFA, CPCU (53)(55) | | President and chief operating officer of CFC Investment Company, a commercial lease and finance subsidiary. Chief investment officer since 2009,and senior vice president, assistant secretary and assistant treasurer since 2008 of Cincinnati Financial Corporation. Chief investment officer and senior vice president since 2009 of The Cincinnati Insurance Company; until 2009, vice president. President from 2008 to 2009 of CinFin Capital Management Company, a former subsidiary.Company. Responsible for all investment operations, including oversight of leasing and financing services; also responsible until 2009 for operation of asset management services.operations. | | 2008 |
John S. Kellington (51)(53) | | Chief information officer and senior vice president of The Cincinnati Insurance Company. Responsible for enterprise strategic technology and oversight of all technology activities. Until 2010, seniorSenior vice president of ACORD Corporation, a nonprofit group that develops global insurance standards.standards until 2010. | | 2010 |
Lisa A. Love, (53)Esq. (55) | | Senior vice president, general counsel and corporate secretary of Cincinnati Financial Corporation and The Cincinnati Insurance Company. Until 2011, seniorSenior counsel of The Cincinnati Insurance Company.Company until 2011. Responsible for corporate legal, governance and compliance activities, including oversight of regulatory and consumer relations, operations.shareholder services and contract administration. | | 2011 |
Eric N. Mathews, CPCU, AIAF (57)(59) | | Principal accounting officer, since 2008, and vice president, assistant secretary and assistant treasurer of Cincinnati Financial Corporation. Senior vice president of The Cincinnati Insurance Company. Responsible for corporate accounting includingand SEC accounting. | | 2001 |
Cincinnati Financial Corporation - 2014 10-K - Page 161
|
| | | | |
Name and Age as of
February 27, 20132015 | | Primary Title(s) and Business Responsibilities
Since February 20082010 | | Executive
Officer Since |
Martin J. Mullen, CPCU (57)(59) | | Chief claims officer and senior vice president of The Cincinnati Insurance Company; vice president until 2008.Company. Responsible for oversight of all headquarters and field claims operations, including special investigations unit and claims administration; responsible until 2008 for casualty claims.administration. | | 2008 |
David H. Popplewell, FALU, LLIF (69)(71) | | President and chief operating officer of The Cincinnati Life Insurance Company. Responsible for life insurance underwriting and operations. | | 1997 |
Jacob F. Scherer, Jr. (60)(62) | | Chief insurance officer since 2012 and executive vice president of The Cincinnati Insurance Company; senior vice president until 2008.Company. Responsible for executive oversight of business and personal property casualty insurance sales, marketing, underwriting, related field services, relationships with independent agents and reinsurance.reinsurance programs. Executive vice president of business insurance until 2012 and executive vice president of sales and marketing until 2011. | | 1995 |
Michael J. Sewell, (49)CPA (51) | | Chief financial officer and senior vice president since 2011 of Cincinnati Financial Corporation and The Cincinnati Insurance Company. Treasurer since 2011Company, and treasurer of Cincinnati Financial Corporation. Until 2011, partner at Deloitte & Touche LLP. Responsible for oversight of all accounting, finance, financial reporting, purchasing and investor relations and shareholder services.relations. Partner at Deloitte & Touche LLP until 2011. | | 2011 |
Joan O. Shevchik, CPCU, CLU (62) | | Senior vice president of The Cincinnati Insurance Company. Responsible for corporate communications, including media relations and website content management. | | 2003 |
Stephen M. Spray (46)(48) | | Senior vice president of The Cincinnati Insurance Company; vice president until 2012. Responsible for sales and marketing, including management of field underwriters and independent agency plant;relationships; responsible from 2010 to 2011 for target markets and, prior to 2010, for excess and surplus lines marketing and underwriting.commercial products. | | 2012 |
Charles P. Stoneburner II, CPCU, AIM (60)(62) | | Senior vice president of The Cincinnati Insurance Company. Responsible for commercial lines underwriting and operations, including oversight of loss control, premium auditmanagement liability and surety insurance, machinery and equipment insurance; responsible until 2008 for field claims operations.insurance, loss control and premium audit. | | 2008 |
Timothy L. Timmel, (64)Esq. (66) | | Senior vice president of The Cincinnati Insurance Company. Responsible for operations including oversight of administrative services, corporate communications, data entry, facilities maintenance and security, government relations, human resources, learning and development and legal litigation and printing; also responsible until 2008 for oversight of field claims operations.litigation. | | 1997 |
| William H. Van Den Heuvel (48) | Item11. | Executive CompensationSenior vice president of The Cincinnati Insurance Company. Responsible for personal lines underwriting and operations. Chief operating officer and executive vice president for U.S. and Canada personal lines insurance at AIG until 2014. Western Zone executive and senior vice president for AIG Private Client Group until 2012. | | 2014 |
Cincinnati Financial Corporation - 2014 10-K - Page 162
ITEM 11. Executive Compensation
The “Compensation of Named Executive Officers and Directors,” section of our Proxy Statement for our Annual Meeting of Shareholders to be held April 27, 2013, whichMay 2, 2015, is incorporated herein by reference. It includes the “Report of the Compensation Committee,” “Compensation Committee Interlocks and Insider Participation,” and the “Compensation Discussion and Analysis,Analysis.”
ITEM 12. Security Ownership of Certain Beneficial Owners and Management and Related Stockholder Matters
a) The “Security Ownership of Principal Shareholders and Management” section of our Proxy Statement for our Annual Meeting of Shareholders to be held May 2, 2015, is incorporated herein by reference.
| Item12. | Security Ownership of Certain Beneficial Owners and Management and Related Stockholder Matters |
| a) | The “Security Ownership of Principal Shareholders and Management” section of our Proxy Statement for our Annual Meeting of Shareholders to be held April 27, 2013, is incorporated herein by reference. |
| b) | Information on securities authorized for issuance under equity compensation plans appears in Part II, Item 5, Market for the Registrant’s Common Equity, Related Stockholder Matters and Issuer Purchases of Equity Securities, Page 34. Additional information on share-based compensation under our equity compensation plans is available in Item 8, Note 17 of the Consolidated Financial Statements, Page 135. |
| Item13. | Certain Relationships and Related Transactions, and Director Independence |
b) Information on securities authorized for issuance under equity compensation plans appears in Part II, Item 5, Market for the Registrant’s Common Equity, Related Stockholder Matters and Issuer Purchases of Equity Securities. Additional information on share-based compensation under our equity compensation plans is available in Item 8, Note 17 of the Consolidated Financial Statements.
ITEM 13. Certain Relationships and Related Transactions, and Director Independence
The following sections of our Proxy Statement for our Annual Meeting of Shareholders to be held
April 27, 2013,May 2, 2015, are incorporated herein by reference: “Governance of Your Company
—– Director Independence” and “Governance of Your Company
—– Certain Relationships and Transactions.”
| Item14. | Principal Accounting Fees and Services |
ITEM 14. Principal Accounting Fees and Services
The “Audit-Related Matters,” section of our Proxy Statement for our Annual Meeting of Shareholders to be held
April 27, 2013, whichMay 2, 2015, is incorporated herein by reference. It includes the “Proposal 2
—Ratification– Ratification of Selection of Independent Registered Public Accounting Firm,” “Report of the Audit Committee,” “Fees Billed by the Independent Registered Public Accounting
Firm,”Firm” and “Services Provided by the Independent Registered Public Accounting
Firm,” is incorporated herein by reference.Firm”.
Cincinnati Financial Corporation - 2014 10-K - Page 163
Part IV
| Item 15. | Exhibits, Financial Statement Schedules |
| a) | Financial Statements – information contained in Part II, Item 8, of this report, Page 108 to Page 111 |
| b) | Exhibits – see Index of Exhibits, Page 155 |
| c) | Financial Statement Schedules |
| | Schedule I – Summary of Investments — Other Than Investments in Related Parties, Page 144 |
| | Schedule II – Condensed Financial Statements of Parent Company, Page 146 |
| | Schedule III – Supplementary Insurance Information, Page 149 |
| | Schedule IV – Reinsurance, Page 151 |
| | Schedule V – Valuation and Qualifying Accounts, Page 152 |
| | Schedule VI – Supplementary Information Concerning Property Casualty Insurance Operations, Page 153 |
ITEM 15. Exhibits, Financial Statement Schedules
a) Financial Statements – information contained in Part II, Item 8, of this report, Page 123 to Page 127
b) Exhibits – see Index of Exhibits, Page 177
c) Financial Statement Schedules
Schedule I
Cincinnati Financial Corporation and Subsidiaries |
Summary of Investments - Other Than Investments in Related Parties |
| (In millions) | | At December 31, 2012 | |
| Type of investment | | Cost or
amortized cost | | | Fair
value | | | Balance sheet | |
| Fixed maturities: | | | | | | | | | | | | |
| States, municipalities and political subdivisions: | | | | | | | | | | | | |
| The Cincinnati Insurance Company | | $ | 2,528 | | | $ | 2,717 | | | $ | 2,717 | |
| The Cincinnati Casualty Company | | | 123 | | | | 133 | | | | 133 | |
| The Cincinnati Indemnity Company | | | 36 | | | | 39 | | | | 39 | |
| The Cincinnati Specialty Underwriters Insurance Company | | | 152 | | | | 169 | | | | 169 | |
| CSU Producer Resources Inc. | | | 1 | | | | 1 | | | | 1 | |
| The Cincinnati Life Insurance Company | | | 200 | | | | 230 | | | | 230 | |
| Total | | | 3,040 | | | | 3,289 | | | | 3,289 | |
| Convertibles and bonds with warrants attached: | | | | | | | | | | | | |
| The Cincinnati Insurance Company | | | 27 | | | | 27 | | | | 27 | |
| Cincinnati Financial Corporation | | | 4 | | | | 4 | | | | 4 | |
| Total | | | 31 | | | | 31 | | | | 31 | |
| United States government: | | | | | | | | | | | | |
| The Cincinnati Insurance Company | | | 1 | | | | 1 | | | | 1 | |
| The Cincinnati Casualty Company | | | 1 | | | | 2 | | | | 2 | |
| The Cincinnati Indemnity Company | | | 1 | | | | 1 | | | | 1 | |
| The Cincinnati Life Insurance Company | | | 4 | | | | 4 | | | | 4 | |
| Total | | | 7 | | | | 8 | | | | 8 | |
| Government-sponsored enterprises: | | | | | | | | | | | | |
| The Cincinnati Life Insurance Company | | | 164 | | | | 164 | | | | 164 | |
| Total | | | 164 | | | | 164 | | | | 164 | |
| Foreign government: | | | | | | | | | | | | |
| The Cincinnati Insurance Company | | | 3 | | | | 3 | | | | 3 | |
| Total | | | 3 | | | | 3 | | | | 3 | |
| All other corporate bonds: | | | | | | | | | | | | |
| The Cincinnati Insurance Company | | | 2,356 | | | | 2,664 | | | | 2,664 | |
| The Cincinnati Casualty Company | | | 96 | | | | 107 | | | | 107 | |
| The Cincinnati Indemnity Company | | | 22 | | | | 24 | | | | 24 | |
| The Cincinnati Specialty Underwriters Insurance Company | | | 131 | | | | 143 | | | | 143 | |
| The Cincinnati Life Insurance Company | | | 2,285 | | | | 2,555 | | | | 2,555 | |
| CSU Producer Resources Inc. | | | 6 | | | | 6 | | | | 6 | |
| Cincinnati Financial Corporation | | | 81 | | | | 99 | | | | 99 | |
| Total | | | 4,977 | | | | 5,598 | | | | 5,598 | |
| Total fixed maturities | | $ | 8,222 | | | $ | 9,093 | | | $ | 9,093 | |
– Summary of Investments – Other Than Investments in Related Parties, Page 165
Schedule II – Condensed Financial Statements of Parent Company, Page 167
Schedule III – Supplementary Insurance Information, Page 171
Schedule IV – Reinsurance, Page 173
Schedule V – Valuation and Qualifying Accounts, Page 174
Schedule VI – Supplementary Information Concerning Property Casualty Insurance Operations, Page 175
Cincinnati Financial Corporation - 2014 10-K - Page 164
Schedule I
|
| | | | | | | | | | | | |
| Cincinnati Financial Corporation and Subsidiaries |
| Summary of Investments - Other Than Investments in Related Parties |
| (Dollars in millions) | | At December 31, 2014 |
| Type of investment | | Cost or amortized cost | | Fair value | | Balance sheet |
| Fixed maturities: | | |
| | |
| | |
|
| States, municipalities and political subdivisions: | | |
| | |
| | |
|
| The Cincinnati Insurance Company | | $ | 2,634 |
| | $ | 2,759 |
| | $ | 2,759 |
|
| The Cincinnati Casualty Company | | 136 |
| | 143 |
| | 143 |
|
| The Cincinnati Indemnity Company | | 39 |
| | 41 |
| | 41 |
|
| The Cincinnati Life Insurance Company | | 187 |
| | 213 |
| | 213 |
|
| The Cincinnati Specialty Underwriters Insurance Company | | 270 |
| | 286 |
| | 286 |
|
| CSU Producer Resources Inc. | | 1 |
| | 1 |
| | 1 |
|
| Total | | 3,267 |
| | 3,443 |
| | 3,443 |
|
| Convertibles and bonds with warrants attached: | | |
| | |
| | |
|
| The Cincinnati Insurance Company | | 7 |
| | 7 |
| | 7 |
|
| Total | | 7 |
| | 7 |
| | 7 |
|
| United States government: | | |
| | |
| | |
|
| The Cincinnati Insurance Company | | 1 |
| | 1 |
| | 1 |
|
| The Cincinnati Casualty Company | | 2 |
| | 2 |
| | 2 |
|
| The Cincinnati Indemnity Company | | 1 |
| | 1 |
| | 1 |
|
| The Cincinnati Life Insurance Company | | 3 |
| | 3 |
| | 3 |
|
| Total | | 7 |
| | 7 |
| | 7 |
|
| Government-sponsored enterprises: | | |
| | |
| | |
|
| The Cincinnati Life Insurance Company | | 209 |
| | 204 |
| | 204 |
|
| The Cincinnati Insurance Company | | 4 |
| | 4 |
| | 4 |
|
| Total | | 213 |
| | 208 |
| | 208 |
|
| Foreign government: | | |
| | |
| | |
|
| The Cincinnati Insurance Company | | 10 |
| | 10 |
| | 10 |
|
| Total | | 10 |
| | 10 |
| | 10 |
|
| All other corporate bonds: | | |
| | |
| | |
|
| The Cincinnati Insurance Company | | 2,507 |
| | 2,706 |
| | 2,706 |
|
| The Cincinnati Casualty Company | | 110 |
| | 118 |
| | 118 |
|
| The Cincinnati Indemnity Company | | 21 |
| | 23 |
| | 23 |
|
| The Cincinnati Specialty Underwriters Insurance Company | | 151 |
| | 159 |
| | 159 |
|
| The Cincinnati Life Insurance Company | | 2,517 |
| | 2,706 |
| | 2,706 |
|
| CSU Producer Resources Inc. | | 4 |
| | 4 |
| | 4 |
|
| Cincinnati Financial Corporation | | 57 |
| | 69 |
| | 69 |
|
| Total | | 5,367 |
| | 5,785 |
| | 5,785 |
|
| Total fixed maturities | | $ | 8,871 |
| | $ | 9,460 |
| | $ | 9,460 |
|
| | | | | | | |
Cincinnati Financial Corporation - 2014 10-K - Page 165
Schedule I (continued)
Cincinnati Financial Corporation and Subsidiaries |
Summary of Investments - Other Than Investments in Related Parties |
| (In millions) | | At December 31, 2012 | |
| Type of investment | | Cost or
amortized cost | | | Fair
value | | | Balance sheet | |
| Equity securities: | | | | | | | | | | | | |
| Common stocks: | | | | | | | | | | | | |
| The Cincinnati Insurance Company | | $ | 1,432 | | | $ | 2,136 | | | $ | 2,136 | |
| The Cincinnati Casualty Company | | | 47 | | | | 68 | | | | 68 | |
| The Cincinnati Indemnity Company | | | 13 | | | | 16 | | | | 16 | |
| The Cincinnati Specialty Underwriters Insurance Company | | | 43 | | | | 52 | | | | 52 | |
| The Cincinnati Life Insurance Company | | | 3 | | | | 4 | | | | 4 | |
| CSU Producer Resources Inc. | | | 4 | | | | 5 | | | | 5 | |
| Cincinnati Financial Corporation | | | 728 | | | | 957 | | | | 957 | |
| Total | | | 2,270 | | | | 3,238 | | | | 3,238 | |
| Nonredeemable preferred stocks: | | | | | | | | | | | | |
| The Cincinnati Insurance Company | | | 91 | | | | 121 | | | | 121 | |
| The Cincinnati Life Insurance Company | | | 7 | | | | 13 | | | | 13 | |
| Cincinnati Financial Corporation | | | 1 | | | | 1 | | | | 1 | |
| Total | | | 99 | | | | 135 | | | | 135 | |
| Total equity securities | | $ | 2,369 | | | $ | 3,373 | | | $ | 3,373 | |
| Other invested assets: | | | | | | | | | | | | |
| Policy loans: | | | | | | | | | | | | |
| The Cincinnati Life Insurance Company | | | 37 | | | | — | | | | 37 | |
| Limited partnerships: | | | | | | | | | | | | |
| Cincinnati Financial Corporation | | | 31 | | | | — | | | | 31 | |
| Total other invested assets | | $ | 68 | | | | — | | | $ | 68 | |
| Total investments | | $ | 10,659 | | | | — | | | $ | 12,534 | |
|
| | | | | | | | | | | | |
| Cincinnati Financial Corporation and Subsidiaries |
| Summary of Investments - Other Than Investments in Related Parties |
| (Dollars in millions) | | At December 31, 2014 |
| Type of investment | | Cost or amortized cost | | Fair value | | Balance sheet |
| Equity securities: | | |
| | |
| | |
|
| Common equities: | | |
| | |
| | |
|
| The Cincinnati Insurance Company | | $ | 1,462 |
| | $ | 2,831 |
| | $ | 2,831 |
|
| The Cincinnati Casualty Company | | 45 |
| | 91 |
| | 91 |
|
| The Cincinnati Indemnity Company | | 12 |
| | 22 |
| | 22 |
|
| The Cincinnati Specialty Underwriters Insurance Company | | 51 |
| | 85 |
| | 85 |
|
| CSU Producer Resources Inc. | | 9 |
| | 11 |
| | 11 |
|
| Cincinnati Financial Corporation | | 1,004 |
| | 1,639 |
| | 1,639 |
|
| Total | | 2,583 |
| | 4,679 |
| | 4,679 |
|
| Nonredeemable preferred equities: | | |
| | |
| | |
|
| The Cincinnati Insurance Company | | 137 |
| | 167 |
| | 167 |
|
| The Cincinnati Life Insurance Company | | 5 |
| | 8 |
| | 8 |
|
| Cincinnati Financial Corporation | | 3 |
| | 4 |
| | 4 |
|
| Total | | 145 |
| | 179 |
| | 179 |
|
| Total equity securities | | $ | 2,728 |
| | $ | 4,858 |
| | $ | 4,858 |
|
| Other invested assets: | | |
| | |
| | |
|
| Policy loans: | | |
| | |
| | |
|
| The Cincinnati Life Insurance Company | | $ | 31 |
| | — |
| | $ | 31 |
|
| Private equity: | | |
| | |
| | |
|
| Cincinnati Financial Corporation | | 37 |
| | — |
| | 37 |
|
| Total other invested assets | | $ | 68 |
| | — |
| | $ | 68 |
|
| Total investments | | $ | 11,667 |
| | — |
| | $ | 14,386 |
|
| | | | | | | |
Cincinnati Financial Corporation - 2014 10-K - Page 166
Schedule II
Cincinnati Financial Corporation (parent company only) |
Condensed Balance Sheets |
| (In millions) | | At December 31, | |
| | | 2012 | | | 2011 | |
| ASSETS | | | | | | | | |
| Investments | | | | | | | | |
| Fixed maturities, at fair value | | $ | 103 | | | $ | 225 | |
| Equity securities, at fair value | | | 958 | | | | 806 | |
| Other invested assets | | | 31 | | | | 29 | |
| Cash and cash equivalents | | | 90 | | | | 20 | |
| Equity in net assets of subsidiaries | | | 5,103 | | | | 4,776 | |
| Investment income receivable | | | 3 | | | | 4 | |
| Land, building and equipment, net, for company use (accumulated depreciation: | | | | | | | | |
| 2012—$100; 2011—$94) | | | 153 | | | | 158 | |
| Prepaid income tax | | | 14 | | | | - | |
| Other assets | | | 35 | | | | 13 | |
| Due from subsidiaries | | | 75 | | | | 65 | |
| Total assets | | $ | 6,565 | | | $ | 6,096 | |
| | | | | | | | | |
| LIABILITIES | | | | | | | | |
| Dividends declared but unpaid | | $ | 66 | | | $ | 65 | |
| Deferred federal income tax | | | 63 | | | | 40 | |
| Long-term debt | | | 790 | | | | 790 | |
| Other liabilities | | | 193 | | | | 168 | |
| Total liabilities | | | 1,112 | | | | 1,063 | |
| | | | | | | | | |
| SHAREHOLDERS' EQUITY | | | | | | | | |
| Common stock | | | 394 | | | | 393 | |
| Paid-in capital | | | 1,134 | | | | 1,096 | |
| Retained earnings | | | 4,021 | | | | 3,863 | |
| Accumulated other comprehensive income | | | 1,129 | | | | 901 | |
| Treasury stock at cost | | | (1,225 | ) | | | (1,220 | ) |
| Total shareholders' equity | | | 5,453 | | | | 5,033 | |
| Total liabilities and shareholders' equity | | $ | 6,565 | | | $ | 6,096 | |
|
| | | | | | | | |
| Cincinnati Financial Corporation (parent company only) |
| Condensed Balance Sheets |
| (Dollars in millions) | | At December 31, |
| | | 2014 | | 2013 |
| Assets | | |
| | |
|
| Investments | | |
| | |
|
| Fixed maturities, at fair value | | $ | 69 |
| | $ | 75 |
|
| Equity securities, at fair value | | 1,643 |
| | 1,366 |
|
| Other invested assets | | 37 |
| | 32 |
|
| Total investments | | 1,749 |
| | 1,473 |
|
| Cash and cash equivalents | | 72 |
| | 91 |
|
| Equity in net assets of subsidiaries | | 5,627 |
| | 5,351 |
|
| Investment income receivable | | 6 |
| | 5 |
|
Land, building and equipment, net, for company use (accumulated depreciation:
2014—$112; 2013—$106) | | 144 |
| | 148 |
|
| Prepaid income tax | | — |
| | 2 |
|
| Other assets | | 23 |
| | 24 |
|
| Due from subsidiaries | | 107 |
| | 114 |
|
| Total assets | | $ | 7,728 |
| | $ | 7,208 |
|
| Liabilities | | |
| | |
|
| Dividends declared but unpaid | | $ | 72 |
| | $ | 68 |
|
| Deferred federal income tax | | 216 |
| | 185 |
|
| Long-term debt | | 791 |
| | 790 |
|
| Other liabilities | | 76 |
| | 95 |
|
| Total liabilities | | 1,155 |
| | 1,138 |
|
| Shareholders' Equity | | |
| | |
|
| Common stock | | 397 |
| | 397 |
|
| Paid-in capital | | 1,214 |
| | 1,191 |
|
| Retained earnings | | 4,505 |
| | 4,268 |
|
| Accumulated other comprehensive income | | 1,744 |
| | 1,504 |
|
| Treasury stock at cost | | (1,287 | ) | | (1,290 | ) |
| Total shareholders' equity | | 6,573 |
| | 6,070 |
|
| Total liabilities and shareholders' equity | | $ | 7,728 |
| | $ | 7,208 |
|
| | | | | |
This condensed financial information should be read in conjunction with the Consolidated Financial Statements and Notes included in Part II, Item 8,8.
Cincinnati Financial Corporation - 2014 10-K - Page
105.167
Schedule II (continued)
Cincinnati Financial Corporation (parent company only) |
Condensed Statements of Comprehensive Income |
| (In millions) | | Years ended December 31, | |
| | | 2012 | | | 2011 | | | 2010 | |
| REVENUES | | | | | | | | | | | | |
| Investment income, net of expenses | | $ | 42 | | | $ | 41 | | | $ | 41 | |
| Realized gains on investments | | | 34 | | | | 15 | | | | 17 | |
| Other revenue | | | 15 | | | | 14 | | | | 14 | |
| Total revenues | | | 91 | | | | 70 | | | | 72 | |
| | | | | | | | | | | | | |
| EXPENSES | | | | | | | | | | | | |
| Interest expense | | | 53 | | | | 53 | | | | 52 | |
| Other expenses | | | 27 | | | | 25 | | | | 24 | |
| Total expenses | | | 80 | | | | 78 | | | | 76 | |
| | | | | | | | | | | | | |
| INCOME (LOSS) BEFORE INCOME TAXES AND EARNINGS OF SUBSIDIARIES | | | 11 | | | | (8 | ) | | | (4 | ) |
| | | | | | | | | | | | | |
| BENEFIT FOR INCOME TAXES | | | (4 | ) | | | (9 | ) | | | (7 | ) |
| | | | | | | | | | | | | |
| NET INCOME BEFORE EARNINGS OF SUBSIDIARIES | | | 15 | | | | 1 | | | | 3 | |
| | | | | | | | | | | | | |
| Increase in equity of subsidiaries | | | 406 | | | | 163 | | | | 372 | |
| | | | | | | | | | | | | |
| NET INCOME | | $ | 421 | | | $ | 164 | | | $ | 375 | |
| OTHER COMPREHENSIVE INCOME, BEFORE TAX | | | | | | | | | | | | |
| Unrealized gains on investments available-for-sale | | | 67 | | | | 59 | | | | 45 | |
| Unrealized gains on investments held by subsidiaries | | | 361 | | | | 250 | | | | 338 | |
| Reclassification adjustment for (gains) losses included in net income | | | (34 | ) | | | (15 | ) | | | 17 | |
| Reclassification adjustment for (gains) included in net income on subsidiaries | | | (8 | ) | | | (55 | ) | | | (176 | ) |
| Unrealized gains on other | | | 5 | | | | 1 | | | | 4 | |
| Unrealized losses on other subsidiaries | | | (26 | ) | | | (12 | ) | | | (8 | ) |
| Unrealized gains on investments available-for-sale, investments held by subsidiaries and other | | | 365 | | | | 228 | | | | 220 | |
| Amortization of pension actuarial (loss) gain and prior service cost | | | (13 | ) | | | (25 | ) | | | 3 | |
| Other comprehensive income before tax | | | 352 | | | | 203 | | | | 223 | |
| Income taxes on above of other comprehensive income | | | 124 | | | | 71 | | | | 78 | |
| Other comprehensive income, net of tax | | | 228 | | | | 132 | | | | 145 | |
| COMPREHENSIVE INCOME | | $ | 649 | | | $ | 296 | | | $ | 520 | |
|
| | | | | | | | | | | | |
| Cincinnati Financial Corporation (parent company only) |
| Condensed Statements of Income |
| (Dollars in millions) | | Years ended December 31, |
| | | 2014 | | 2013 | | 2012 |
| Revenues | | |
| | |
| | |
|
| Investment income, net of expenses | | $ | 46 |
| | $ | 41 |
| | $ | 42 |
|
| Realized investment gains, net | | 34 |
| | 21 |
| | 34 |
|
| Other revenue | | 16 |
| | 15 |
| | 15 |
|
| Total revenues | | 96 |
| | 77 |
| | 91 |
|
| Expenses | | |
| | |
| | |
|
| Interest expense | | 52 |
| | 53 |
| | 53 |
|
| Other expenses | | 28 |
| | 29 |
| | 27 |
|
| Total expenses | | 80 |
| | 82 |
| | 80 |
|
| Income (Loss) Before Income Taxes and Earnings of Subsidiaries | | 16 |
| | (5 | ) | | 11 |
|
| Benefit for income taxes | | (5 | ) | | (11 | ) | | (4 | ) |
| Net Income Before Earnings of Subsidiaries | | 21 |
| | 6 |
| | 15 |
|
| Increase in equity of subsidiaries | | 504 |
| | 511 |
| | 406 |
|
| Net Income | | $ | 525 |
| | $ | 517 |
| | $ | 421 |
|
| | | | | | | |
This condensed financial information should be read in conjunction with the Consolidated Financial Statements and Notes included in Part II, Item 8,8.
Cincinnati Financial Corporation - 2014 10-K - Page
105.168
Schedule II (continued)
Cincinnati Financial Corporation (parent company only) |
Condensed Statements of Cash Flows |
| (In millions) | | Years ended December 31, | |
| | | 2012 | | | 2011 | | | 2010 | |
| CASH FLOWS FROM OPERATING ACTIVITIES | | | | | | | | | | | | |
| Net income | | $ | 421 | | | $ | 164 | | | $ | 375 | |
| Adjustments to reconcile net income to net cash provided by operating activities: | | | | | | | | | | | | |
| Depreciation and amortization | | | 7 | | | | 7 | | | | 7 | |
| Realized gains on investments, net | | | (34 | ) | | | (15 | ) | | | (17 | ) |
| Dividends from subsidiaries | | | 300 | | | | 180 | | | | 220 | |
| Changes in: | | | | | | | | | | | | |
| Increase in equity of subsidiaries | | | (406 | ) | | | (163 | ) | | | (372 | ) |
| Investment income receivable | | | 1 | | | | 1 | | | | - | |
| Current federal income taxes | | | (24 | ) | | | 25 | | | | 3 | |
| Deferred income taxes | | | 18 | | | | (10 | ) | | | 2 | |
| Other assets | | | (2 | ) | | | 2 | | | | - | |
| Other liabilities | | | 7 | | | | (23 | ) | | | (12 | ) |
| Net cash provided by operating activities | | | 288 | | | | 168 | | | | 206 | |
| | | | | | | | | | | | | |
| CASH FLOWS FROM INVESTING ACTIVITIES | | | | | | | | | | | | |
| Sale of fixed-maturities | | | 114 | | | | 5 | | | | 32 | |
| Call or maturity of fixed maturities | | | 13 | | | | 13 | | | | 21 | |
| Sale of equity securities | | | 111 | | | | 101 | | | | 85 | |
| Purchase of fixed maturities | | | (1 | ) | | | - | | | | (27 | ) |
| Purchase of equity securities | | | (212 | ) | | | (78 | ) | | | (92 | ) |
| Investment in buildings and equipment, net | | | (1 | ) | | | (1 | ) | | | - | |
| Change in other invested assets, net | | | 4 | | | | 5 | | | | - | |
| Net cash provided by investing activities | | | 28 | | | | 45 | | | | 19 | |
| | | | | | | | | | | | | |
| CASH FLOWS FROM FINANCING ACTIVITIES | | | | | | | | | | | | |
| Increase in notes payable | | | - | | | | 55 | | | | - | |
| Payment of cash dividends to shareholders | | | (256 | ) | | | (255 | ) | | | (252 | ) |
| Purchase of treasury shares | | | - | | | | (32 | ) | | | (10 | ) |
| Proceeds from stock options exercised | | | 9 | | | | (4 | ) | | | (2 | ) |
| Net transfers to subsidiaries | | | (2 | ) | | | 2 | | | | 21 | |
| Other | | | 3 | | | | 3 | | | | 2 | |
| Net cash used in financing activities | | | (246 | ) | | | (231 | ) | | | (241 | ) |
| Net increase (decrease) in cash and cash equivalents | | | 70 | | | | (18 | ) | | | (16 | ) |
| Cash and cash equivalents at beginning of year | | | 20 | | | | 38 | | | | 54 | |
| Cash and cash equivalents at end of year | | $ | 90 | | | $ | 20 | | | $ | 38 | |
|
| | | | | | | | | | | | |
| Cincinnati Financial Corporation (parent company only) |
| Condensed Statements of Comprehensive Income |
| (Dollars in millions) | | Years ended December 31, |
| | | 2014 | | 2013 | | 2012 |
| Net Income | | $ | 525 |
| | $ | 517 |
| | $ | 421 |
|
| Other Comprehensive Income, Before Tax | | |
| | |
| | |
|
| Unrealized gains on investments available-for-sale | | 150 |
| | 303 |
| | 67 |
|
| Unrealized gains on investments held by subsidiaries | | 367 |
| | 240 |
| | 361 |
|
| Reclassification adjustment for (gains) included in net income | | (34 | ) | | (21 | ) | | (34 | ) |
| Reclassification adjustment for (gains) included in net income on subsidiaries | | (99 | ) | | (62 | ) | | (8 | ) |
| Unrealized gains (losses) on other | | 7 |
| | (1 | ) | | 5 |
|
| Unrealized (losses) gains on other subsidiaries | | (3 | ) | | 35 |
| | (26 | ) |
| Unrealized gains on investments available-for-sale, investments held by subsidiaries and other | | 388 |
| | 494 |
| | 365 |
|
| Amortization of pension actuarial (loss) gain and prior service cost | | (18 | ) | | 83 |
| | (13 | ) |
| Other comprehensive income before tax | | 370 |
| | 577 |
| | 352 |
|
| Income taxes on above of other comprehensive income | | 130 |
| | 202 |
| | 124 |
|
| Other comprehensive income, net of tax | | 240 |
| | 375 |
| | 228 |
|
| Comprehensive Income | | $ | 765 |
| | $ | 892 |
| | $ | 649 |
|
| | | | | | | |
This condensed financial information should be read in conjunction with the Consolidated Financial Statements and Notes included in Part II, Item 8,8.
Cincinnati Financial Corporation - 2014 10-K - Page
105.169
Schedule II (continued)
|
| | | | | | | | | | | | |
| Cincinnati Financial Corporation (parent company only) |
| Condensed Statements of Cash Flows |
| (Dollars in millions) | | Years ended December 31, |
| | | 2014 | | 2013 | | 2012 |
| Cash Flows From Operating Activities | | |
| | |
| | |
|
| Net income | | $ | 525 |
| | $ | 517 |
| | $ | 421 |
|
| Adjustments to reconcile net income to net cash provided by operating activities: | | |
| | |
| | |
|
| Depreciation and amortization | | 7 |
| | 7 |
| | 7 |
|
| Realized investment gains, net | | (34 | ) | | (21 | ) | | (34 | ) |
| Dividends from subsidiaries | | 400 |
| | 378 |
| | 300 |
|
| Changes in: | | |
| | |
| | |
|
| Increase in equity of subsidiaries | | (504 | ) | | (511 | ) | | (406 | ) |
| Investment income receivable | | (1 | ) | | (2 | ) | | 1 |
|
| Current federal income taxes | | 3 |
| | 12 |
| | (24 | ) |
| Deferred income tax | | (6 | ) | | (6 | ) | | 18 |
|
| Other assets | | 20 |
| | (30 | ) | | (2 | ) |
| Other liabilities | | (14 | ) | | 39 |
| | 7 |
|
| Intercompany receivable for operations | | 22 |
| | (39 | ) | | — |
|
| Net cash provided by operating activities | | 418 |
| | 344 |
| | 288 |
|
| | | | | | | |
| Cash Flows From Investing Activities | | |
| | |
| | |
|
| Sale of fixed maturities | | — |
| | — |
| | 114 |
|
| Call or maturity of fixed maturities | | 4 |
| | 23 |
| | 13 |
|
| Sale of equity securities | | 112 |
| | 75 |
| | 111 |
|
| Purchase of fixed maturities | | — |
| | — |
| | (1 | ) |
| Purchase of equity securities | | (225 | ) | | (179 | ) | | (212 | ) |
| Investment in buildings and equipment, net | | (2 | ) | | (1 | ) | | (1 | ) |
| Change in other invested assets, net | | 4 |
| | 4 |
| | 4 |
|
| Return of capital from subsidiaries | | — |
| | 22 |
| | — |
|
| Net cash (used) provided by investing activities | | (107 | ) | | (56 | ) | | 28 |
|
| | | | | | | |
| Cash Flows From Financing Activities | | |
| | |
| | |
|
| Payments on notes payable | | (55 | ) | | — |
| | — |
|
| Payment of cash dividends to shareholders | | (278 | ) | | (263 | ) | | (256 | ) |
| Purchase of treasury shares | | (21 | ) | | (52 | ) | | — |
|
| Proceeds from stock options exercised | | 22 |
| | 25 |
| | 9 |
|
| Net transfers to subsidiaries | | — |
| | — |
| | (2 | ) |
| Other | | 2 |
| | 3 |
| | 3 |
|
| Net cash used in financing activities | | (330 | ) | | (287 | ) | | (246 | ) |
| Net change in cash and cash equivalents | | (19 | ) | | 1 |
| | 70 |
|
| Cash and cash equivalents at beginning of year | | 91 |
| | 90 |
| | 20 |
|
| Cash and cash equivalents at end of year | | $ | 72 |
| | $ | 91 |
| | $ | 90 |
|
| | | | | | | |
This condensed financial information should be read in conjunction with the Consolidated Financial Statements and Notes included in Part II, Item 8.
Cincinnati Financial Corporation - 2014 10-K - Page 170
Schedule III
| Cincinnati Financial Corporation and Subsidiaries |
| Supplementary Insurance Information |
| (In millions) | | Years ended December 31, | |
| | | 2012 | | | 2011 | | | 2010 | |
| Deferred policy acquisition costs: | | | | | | | | | | | | |
| Commercial lines insurance | | $ | 235 | | | $ | 204 | | | $ | 204 | |
| Personal lines insurance | | | 93 | | | | 92 | | | | 76 | |
| Excess and surplus lines insurance | | | 9 | | | | 7 | | | | 6 | |
| Total property casualty insurance | | | 337 | | | | 303 | | | | 286 | |
| Life insurance | | | 133 | | | | 174 | | | | 172 | |
| Total | | $ | 470 | | | $ | 477 | | | $ | 458 | |
| | | | | | | | | | | | | |
| Gross future policy benefits, losses, claims and expense losses: | | | | | | | | | | | | |
| Commercial lines insurance | | $ | 3,645 | | | $ | 3,780 | | | $ | 3,728 | |
| Personal lines insurance | | | 398 | | | | 419 | | | | 353 | |
| Excess and surplus lines insurance | | | 126 | | | | 81 | | | | 56 | |
| Total property casualty insurance | | | 4,169 | | | | 4,280 | | | | 4,137 | |
| Life insurance | | | 2,341 | | | | 2,257 | | | | 2,073 | |
| Total (1) | | $ | 6,510 | | | $ | 6,537 | | | $ | 6,210 | |
| | | | | | | | | | | | | |
| Gross unearned premiums: | | | | | | | | | | | | |
| Commercial lines insurance | | $ | 1,246 | | | $ | 1,149 | | | $ | 1,116 | |
| Personal lines insurance | | | 490 | | | | 440 | | | | 401 | |
| Excess and surplus lines insurance | | | 54 | | | | 42 | | | | 34 | |
| Total property casualty insurance | | | 1,790 | | | | 1,631 | | | | 1,551 | |
| Life insurance | | | 2 | | | | 2 | | | | 2 | |
| Total (1) | | $ | 1,792 | | | $ | 1,633 | | | $ | 1,553 | |
| | | | | | | | | | | | | |
| Other policy claims and benefits payable: | | | | | | | | | | | | |
| Commercial lines insurance | | $ | - | | | $ | - | | | $ | - | |
| Personal lines insurance | | | - | | | | - | | | | - | |
| Excess and surplus lines insurance | | | - | | | | - | | | | - | |
| Total property casualty insurance | | | - | | | | - | | | | - | |
| Life insurance | | | 15 | | | | 16 | | | | 24 | |
| Total (1) | | $ | 15 | | | $ | 16 | | | $ | 24 | |
| | | | | | | | | | | | | |
| Earned premiums: | | | | | | | | | | | | |
| Commercial lines insurance | | $ | 2,383 | | | $ | 2,197 | | | $ | 2,154 | |
| Personal lines insurance | | | 868 | | | | 762 | | | | 721 | |
| Excess and surplus lines insurance | | | 93 | | | | 70 | | | | 49 | |
| Total property casualty insurance | | | 3,344 | | | | 3,029 | | | | 2,924 | |
| Life insurance | | | 178 | | | | 165 | | | | 158 | |
| Total | | $ | 3,522 | | | $ | 3,194 | | | $ | 3,082 | |
|
| | | | | | | | | | | | |
| Cincinnati Financial Corporation and Subsidiaries |
| Supplementary Insurance Information |
| (Dollars in millions) | | Years ended December 31, |
| | | 2014 | | 2013 | | 2012 |
| Deferred policy acquisition costs: | | |
| | |
| | |
|
| Commercial lines insurance | | $ | 257 |
| | $ | 251 |
| | $ | 235 |
|
| Personal lines insurance | | 108 |
| | 104 |
| | 93 |
|
| Excess and surplus lines insurance | | 14 |
| | 11 |
| | 9 |
|
| Total property casualty insurance | | 379 |
| | 366 |
| | 337 |
|
| Life insurance | | 199 |
| | 199 |
| | 133 |
|
| Total | | $ | 578 |
| | $ | 565 |
| | $ | 470 |
|
| | | | | | | |
| Gross future policy benefits, losses, claims and expense losses: | | |
| | |
| | |
|
| Commercial lines insurance | | $ | 3,797 |
| | $ | 3,667 |
| | $ | 3,645 |
|
| Personal lines insurance | | 439 |
| | 417 |
| | 398 |
|
| Excess and surplus lines insurance | | 202 |
| | 157 |
| | 126 |
|
| Total property casualty insurance | | 4,438 |
| | 4,241 |
| | 4,169 |
|
| Life insurance | | 2,519 |
| | 2,441 |
| | 2,341 |
|
| Total (1) | | $ | 6,957 |
| | $ | 6,682 |
| | $ | 6,510 |
|
| | | | | | | |
| Gross unearned premiums: | | |
| | |
| | |
|
| Commercial lines insurance | | $ | 1,441 |
| | $ | 1,372 |
| | $ | 1,246 |
|
| Personal lines insurance | | 562 |
| | 535 |
| | 490 |
|
| Excess and surplus lines insurance | | 78 |
| | 67 |
| | 54 |
|
| Total property casualty insurance | | 2,081 |
| | 1,974 |
| | 1,790 |
|
| Life insurance | | 1 |
| | 2 |
| | 2 |
|
| Total (1) | | $ | 2,082 |
| | $ | 1,976 |
| | $ | 1,792 |
|
| | | | | | | |
| Other policy claims and benefits payable: | | |
| | |
| | |
|
| Commercial lines insurance | | $ | — |
| | $ | — |
| | $ | — |
|
| Personal lines insurance | | — |
| | — |
| | — |
|
| Excess and surplus lines insurance | | — |
| | — |
| | — |
|
| Total property casualty insurance | | — |
| | — |
| | — |
|
| Life insurance | | 25 |
| | 19 |
| | 15 |
|
| Total (1) | | $ | 25 |
| | $ | 19 |
| | $ | 15 |
|
| | | | | | | |
| Earned premiums: | | |
| | |
| | |
|
| Commercial lines insurance | | $ | 2,856 |
| | $ | 2,636 |
| | $ | 2,383 |
|
| Personal lines insurance | | 1,041 |
| | 961 |
| | 868 |
|
| Excess and surplus lines insurance | | 148 |
| | 116 |
| | 93 |
|
| Total property casualty insurance | | 4,045 |
| | 3,713 |
| | 3,344 |
|
| Life insurance | | 198 |
| | 189 |
| | 178 |
|
| Total | | $ | 4,243 |
| | $ | 3,902 |
| | $ | 3,522 |
|
| | | | | | | |
Cincinnati Financial Corporation - 2014 10-K - Page 171
Schedule III (continued)
| Cincinnati Financial Corporation and Subsidiaries |
| Supplementary Insurance Information |
| (In millions) | | Years ended December 31, | |
| | | 2012 | | | 2011 | | | 2010 | |
| Investment income, net of expenses: | | | | | | | | | |
| Commercial lines insurance | | $ | - | | | $ | - | | | $ | - | |
| Personal lines insurance | | | - | | | | - | | | | - | |
| Excess and surplus lines insurance | | | - | | | | - | | | | - | |
| Total property casualty insurance (2) | | | 351 | | | | 350 | | | | 348 | |
| Life insurance | | | 137 | | | | 134 | | | | 129 | |
| Total | | $ | 488 | | | $ | 484 | | | $ | 477 | |
| | | | | | | | | | | | | |
| Benefits, claims losses and settlement expenses: | | | | | | | | | | | | |
| Commercial lines insurance | | $ | 1,420 | | | $ | 1,570 | | | $ | 1,437 | |
| Personal lines insurance | | | 652 | | | | 723 | | | | 537 | |
| Excess and surplus lines insurance | | | 65 | | | | 42 | | | | 41 | |
| Total property casualty insurance | | | 2,137 | | | | 2,335 | | | | 2,015 | |
| Life insurance | | | 185 | | | | 189 | | | | 170 | |
| Consolidated eliminations | | | - | | | | - | | | | (5 | ) |
| Total | | $ | 2,322 | | | $ | 2,524 | | | $ | 2,180 | |
| | | | | | | | | | | | | |
| Amortization of deferred policy acquisition costs: | | | | | | | | | | | | |
| Commercial lines insurance | | $ | 462 | | | $ | 441 | | | $ | 424 | |
| Personal lines insurance | | | 183 | | | | 144 | | | | 139 | |
| Excess and surplus lines insurance | | | 17 | | | | 13 | | | | 9 | |
| Total property casualty insurance | | | 662 | | | | 598 | | | | 572 | |
| Life insurance | | | 45 | | | | 33 | | | | 36 | |
| Total (3) | | $ | 707 | | | $ | 631 | | | $ | 608 | |
| | | | | | | | | | | | | |
| Underwriting, acquisition and insurance expenses: | | | | | | | | | | | | |
| Commercial lines insurance | | $ | 324 | | | $ | 291 | | | $ | 281 | |
| Personal lines insurance | | | 78 | | | | 78 | | | | 102 | |
| Excess and surplus lines insurance | | | 12 | | | | 9 | | | | 7 | |
| Total property casualty insurance | | | 414 | | | | 378 | | | | 390 | |
| Life insurance | | | 34 | | | | 30 | | | | 26 | |
| Total (3) | | $ | 448 | | | $ | 408 | | | $ | 416 | |
| | | | | | | | | | | | | |
| Net written premiums: | | | | | | | | | | | | |
| Commercial lines insurance | | $ | 2,459 | | | $ | 2,218 | | | $ | 2,155 | |
| Personal lines insurance | | | 918 | | | | 801 | | | | 750 | |
| Excess and surplus lines insurance | | | 105 | | | | 79 | | | | 58 | |
| Total property casualty insurance | | | 3,482 | | | | 3,098 | | | | 2,963 | |
| Accident health insurance | | | 3 | | | | 3 | | | | 3 | |
| Total | | $ | 3,485 | | | $ | 3,101 | | | $ | 2,966 | |
|
| | | | | | | | | | | | |
| Cincinnati Financial Corporation and Subsidiaries |
| Supplementary Insurance Information |
| (Dollars in millions) | | Years ended December 31, |
| | | 2014 | | 2013 | | 2012 |
| Investment income, net of expenses: | | | | | | |
| Commercial lines insurance | | $ | — |
| | $ | — |
| | $ | — |
|
| Personal lines insurance | | — |
| | — |
| | — |
|
| Excess and surplus lines insurance | | — |
| | — |
| | — |
|
| Total property casualty insurance (2) | | 358 |
| | 348 |
| | 351 |
|
| Life insurance | | 144 |
| | 140 |
| | 137 |
|
| Total | | $ | 502 |
| | $ | 488 |
| | $ | 488 |
|
| | | | | | | |
| Benefits, claims losses and settlement expenses: | | |
| | |
| | |
|
| Commercial lines insurance | | $ | 1,812 |
| | $ | 1,596 |
| | $ | 1,420 |
|
| Personal lines insurance | | 740 |
| | 639 |
| | 652 |
|
| Excess and surplus lines insurance | | 75 |
| | 66 |
| | 65 |
|
| Total property casualty insurance | | 2,627 |
| | 2,301 |
| | 2,137 |
|
| Life insurance | | 229 |
| | 204 |
| | 185 |
|
| Total | | $ | 2,856 |
| | $ | 2,505 |
| | $ | 2,322 |
|
| | | | | | | |
| Amortization of deferred policy acquisition costs: | | |
| | |
| | |
|
| Commercial lines insurance | | $ | 537 |
| | $ | 514 |
| | $ | 462 |
|
| Personal lines insurance | | 209 |
| | 192 |
| | 183 |
|
| Excess and surplus lines insurance | | 24 |
| | 21 |
| | 17 |
|
| Total property casualty insurance | | 770 |
| | 727 |
| | 662 |
|
| Life insurance | | 37 |
| | 31 |
| | 45 |
|
| Total (3) | | $ | 807 |
| | $ | 758 |
| | $ | 707 |
|
| | | | | | | |
| Underwriting, acquisition and insurance expenses: | | |
| | |
| | |
|
| Commercial lines insurance | | $ | 365 |
| | $ | 343 |
| | $ | 324 |
|
| Personal lines insurance | | 84 |
| | 98 |
| | 78 |
|
| Excess and surplus lines insurance | | 19 |
| | 15 |
| | 12 |
|
| Total property casualty insurance | | 468 |
| | 456 |
| | 414 |
|
| Life insurance | | 26 |
| | 29 |
| | 34 |
|
| Total (3) | | $ | 494 |
| | $ | 485 |
| | $ | 448 |
|
| | | | | | | |
| Net written premiums: | | |
| | |
| | |
|
| Commercial lines insurance | | $ | 2,922 |
| | $ | 2,760 |
| | $ | 2,459 |
|
| Personal lines insurance | | 1,068 |
| | 1,005 |
| | 918 |
|
| Excess and surplus lines insurance | | 153 |
| | 128 |
| | 105 |
|
| Total property casualty insurance | | 4,143 |
| | 3,893 |
| | 3,482 |
|
| Accident health insurance | | 3 |
| | 2 |
| | 3 |
|
| Total | | $ | 4,146 |
| | $ | 3,895 |
| | $ | 3,485 |
|
| | | | | | | |
(1) The sum of gross future policy benefits, losses, claims and expense losses, gross unearned premium and other policy claims and benefits payable is equal to the sum of Loss and loss expense reserves, Life policy reserves and investment contract reserves and Unearned premiums reported in the company’s consolidated balance
sheets, Page 108.sheets.
(2) This segment information is not regularly allocated to segments and reviewed by company management in making decisions about resources to be allocated to the segments or to assess their performance.
(3) The sum of amortization of deferred policy acquisition costs and other underwriting and insurance expenses is equal to Underwriting, acquisition and insurance expenses in the consolidated statements of income.
Cincinnati Financial Corporation - 2014 10-K - Page 172
Schedule IV
| Cincinnati Financial Corporation and Subsidiaries |
| Reinsurance |
| (Dollars in millions) | | Years ended December 31, | |
| | | 2012 | | | 2011 | | | 2010 | |
| Gross amounts: | | | | | | | | | | | | |
| Life insurance in force | | $ | 81,467 | | | $ | 77,691 | | | $ | 74,123 | |
| Earned premiums | | | | | | | | | | | | |
| Commercial lines insurance | | $ | 2,524 | | | $ | 2,348 | | | $ | 2,281 | |
| Personal lines insurance | | | 897 | | | | 812 | | | | 746 | |
| Excess and surplus lines insurance | | | 99 | | | | 76 | | | | 53 | |
| Total property casualty insurance | | | 3,520 | | | | 3,236 | | | | 3,080 | |
| Life insurance | | | 235 | | | | 220 | | | | 211 | |
| Total | | $ | 3,755 | | | $ | 3,456 | | | $ | 3,291 | |
| | | | | | | | | | | | | |
| Ceded amounts to other companies: | | | | | | | | | | | | |
| Life insurance in force | | $ | 36,340 | | | $ | 35,690 | | | $ | 35,016 | |
| Earned premiums | | | | | | | | | | | | |
| Commercial lines insurance | | $ | 149 | | | $ | 162 | | | $ | 136 | |
| Personal lines insurance | | | 30 | | | | 51 | | | | 26 | |
| Excess and surplus lines insurance | | | 6 | | | | 6 | | | | 4 | |
| Total | | | 185 | | | | 219 | | | | 166 | |
| Life insurance | | | 57 | | | | 55 | | | | 53 | |
| Total | | $ | 242 | | | $ | 274 | | | $ | 219 | |
| | | | | | | | | | | | | |
| Assumed amounts from other companies: | | | | | | | | | | | | |
| Life insurance in force | | $ | - | | | $ | 1 | | | $ | 1 | |
| Earned premiums | | | | | | | | | | | | |
| Commercial lines insurance | | $ | 8 | | | $ | 11 | | | $ | 9 | |
| Personal lines insurance | | | 1 | | | | 1 | | | | 1 | |
| Excess and surplus lines insurance | | | - | | | | - | | | | - | |
| Total property casualty insurance | | | 9 | | | | 12 | | | | 10 | |
| Life insurance | | | - | | | | - | | | | - | |
| Total | | $ | 9 | | | $ | 12 | | | $ | 10 | |
| | | | | | | | | | | | | |
| Net amounts: | | | | | | | | | | | | |
| Life insurance in force | | $ | 45,126 | | | $ | 42,001 | | | $ | 39,108 | |
| Earned premiums | | | | | | | | | | | | |
| Commercial lines insurance | | $ | 2,383 | | | $ | 2,197 | | | $ | 2,154 | |
| Personal lines insurance | | | 868 | | | | 762 | | | | 721 | |
| Excess and surplus lines insurance | | | 93 | | | | 70 | | | | 49 | |
| Total property casualty insurance | | | 3,344 | | | | 3,029 | | | | 2,924 | |
| Life insurance | | | 178 | | | | 165 | | | | 158 | |
| Total | | $ | 3,522 | | | $ | 3,194 | | | $ | 3,082 | |
| | | | | | | | | | | | | |
| Percentage of amounts assumed to net: | | | | | | | | | | | | |
| Life insurance in force | | | 0.0 | % | | | 0.0 | % | | | 0.0 | % |
| Earned premiums | | | | | | | | | | | | |
| Commercial lines insurance | | | 0.3 | % | | | 0.5 | % | | | 0.4 | % |
| Personal lines insurance | | | 0.1 | | | | 0.2 | | | | 0.2 | |
| Excess and surplus lines insurance | | | 0.0 | | | | 0.0 | | | | 0.0 | |
| Total property casualty insurance | | | 0.3 | | | | 0.4 | | | | 0.4 | |
| Life insurance | | | 0.0 | | | | 0.0 | | | | 0.0 | |
| Total | | | 0.3 | | | | 0.4 | | | | 0.4 | |
|
| | | | | | | | | | | | |
| Cincinnati Financial Corporation and Subsidiaries |
| Reinsurance |
| (Dollars in millions) | | Years ended December 31, |
| | | 2014 | | 2013 | | 2012 |
| Gross amounts: | | |
| | |
| | |
|
| Life insurance in force | | $ | 88,045 |
| | $ | 85,015 |
| | $ | 81,467 |
|
| Earned premiums | | |
| | |
| | |
|
| Commercial lines insurance | | $ | 2,973 |
| | $ | 2,777 |
| | $ | 2,524 |
|
| Personal lines insurance | | 1,080 |
| | 1,002 |
| | 897 |
|
| Excess and surplus lines insurance | | 156 |
| | 124 |
| | 99 |
|
| Total property casualty insurance | | 4,209 |
| | 3,903 |
| | 3,520 |
|
| Life insurance | | 259 |
| | 248 |
| | 235 |
|
| Total | | $ | 4,468 |
| | $ | 4,151 |
| | $ | 3,755 |
|
| | | | | | | |
| Ceded amounts to other companies: | | |
| | |
| | |
|
| Life insurance in force | | $ | 37,689 |
| | $ | 36,952 |
| | $ | 36,340 |
|
| Earned premiums | | |
| | |
| | |
|
| Commercial lines insurance | | $ | 128 |
| | $ | 151 |
| | $ | 149 |
|
| Personal lines insurance | | 40 |
| | 42 |
| | 30 |
|
| Excess and surplus lines insurance | | 8 |
| | 8 |
| | 6 |
|
| Total property casualty insurance | | 176 |
| | 201 |
| | 185 |
|
| Life insurance | | 61 |
| | 59 |
| | 57 |
|
| Total | | $ | 237 |
| | $ | 260 |
| | $ | 242 |
|
| | | | | | | |
| Assumed amounts from other companies: | | |
| | |
| | |
|
| Life insurance in force | | $ | — |
| | $ | — |
| | $ | — |
|
| Earned premiums | | |
| | |
| | |
|
| Commercial lines insurance | | $ | 11 |
| | $ | 10 |
| | $ | 8 |
|
| Personal lines insurance | | 1 |
| | 1 |
| | 1 |
|
| Excess and surplus lines insurance | | — |
| | — |
| | — |
|
| Total property casualty insurance | | 12 |
| | 11 |
| | 9 |
|
| Life insurance | | — |
| | — |
| | — |
|
| Total | | $ | 12 |
| | $ | 11 |
| | $ | 9 |
|
| | | | | | | |
| Net amounts: | | |
| | |
| | |
|
| Life insurance in force | | $ | 50,356 |
| | $ | 48,063 |
| | $ | 45,126 |
|
| Earned premiums | | |
| | |
| | |
|
| Commercial lines insurance | | $ | 2,856 |
| | $ | 2,636 |
| | $ | 2,383 |
|
| Personal lines insurance | | 1,041 |
| | 961 |
| | 868 |
|
| Excess and surplus lines insurance | | 148 |
| | 116 |
| | 93 |
|
| Total property casualty insurance | | 4,045 |
| | 3,713 |
| | 3,344 |
|
| Life insurance | | 198 |
| | 189 |
| | 178 |
|
| Total | | $ | 4,243 |
| | $ | 3,902 |
| | $ | 3,522 |
|
| | | | | | | |
| Percentage of amounts assumed to net: | | |
| | |
| | |
|
| Life insurance in force | | — | % | | — | % | | — | % |
| Earned premiums | | |
| | |
| | |
|
| Commercial lines insurance | | 0.4 | % | | 0.4 | % | | 0.3 | % |
| Personal lines insurance | | 0.1 |
| | 0.1 |
| | 0.1 |
|
| Excess and surplus lines insurance | | — |
| | — |
| | — |
|
| Total property casualty insurance | | 0.5 |
| | 0.5 |
| | 0.3 |
|
| Life insurance | | — |
| | — |
| | — |
|
| Total | | 0.5 |
| | 0.5 |
| | 0.3 |
|
| | | | | | | |
Cincinnati Financial Corporation - 2014 10-K - Page 173
Schedule V
| Cincinnati Financial Corporation and Subsidiaries |
| Valuation and Qualifying Accounts |
| (In millions) | | At December 31, | |
| | | 2012 | | | 2011 | | | 2010 | |
| Allowance for doubtful receivables: | | | | | | | | | | | | |
| Balance at beginning of period | | $ | 2 | | | $ | 3 | | | $ | 3 | |
| Additions charged to costs and expenses | | | 1 | | | | 2 | | | | 2 | |
| Deductions | | | (1 | ) | | | (3 | ) | | | (2 | ) |
| Balance at end of period | | $ | 2 | | | $ | 2 | | | $ | 3 | |
|
| | | | | | | | | | | | |
| Cincinnati Financial Corporation and Subsidiaries |
| Valuation and Qualifying Accounts |
| (Dollars in millions) | | At December 31, |
| | | 2014 | | 2013 | | 2012 |
| Allowance for doubtful receivables: | | |
| | |
| | |
|
| Balance at beginning of year | | $ | 2 |
| | $ | 2 |
| | $ | 2 |
|
| Additions charged to costs and expenses | | 2 |
| | 1 |
| | 1 |
|
| Deductions | | (1 | ) | | (1 | ) | | (1 | ) |
| Balance at end of year | | $ | 3 |
| | $ | 2 |
| | $ | 2 |
|
| | | | | | | |
Cincinnati Financial Corporation - 2014 10-K - Page 174
Schedule VI
| Cincinnati Financial Corporation and Subsidiaries |
| Supplementary Information Concerning Property Casualty Insurance Operations |
| (In millions) | | Years ended December 31, | |
| | | 2012 | | | 2011 | | | 2010 | |
| Deferred policy acquisition costs: | | | | | | | | | | | | |
| Commercial lines insurance | | $ | 235 | | | $ | 204 | | | $ | 204 | |
| Personal lines insurance | | | 93 | | | | 92 | | | | 76 | |
| Excess and surplus lines insurance | | | 9 | | | | 7 | | | | 6 | |
| Total | | $ | 337 | | | $ | 303 | | | $ | 286 | |
| | | | | | | | | | | | | |
| Reserves for unpaid claims and claim adjustment expenses: | | | | | | | | | | | | |
| Commercial lines insurance | | $ | 3,645 | | | $ | 3,780 | | | $ | 3,728 | |
| Personal lines insurance | | | 398 | | | | 419 | | | | 353 | |
| Excess and surplus lines insurance | | | 126 | | | | 81 | | | | 56 | |
| Total | | $ | 4,169 | | | $ | 4,280 | | | $ | 4,137 | |
| | | | | | | | | | | | | |
| Reserve discount deducted | | $ | - | | | $ | - | | | $ | - | |
| | | | | | | | | | | | | |
| Unearned premiums: | | | | | | | | | | | | |
| Commercial lines insurance | | $ | 1,246 | | | $ | 1,149 | | | $ | 1,116 | |
| Personal lines insurance | | | 490 | | | | 440 | | | | 401 | |
| Excess and surplus lines insurance | | | 54 | | | | 42 | | | | 34 | |
| Total | | $ | 1,790 | | | $ | 1,631 | | | $ | 1,551 | |
| | | | | | | | | | | | | |
| Earned premiums: | | | | | | | | | | | | |
| Commercial lines insurance | | $ | 2,383 | | | $ | 2,197 | | | $ | 2,154 | |
| Personal lines insurance | | | 868 | | | | 762 | | | | 721 | |
| Excess and surplus lines insurance | | | 93 | | | | 70 | | | | 49 | |
| Total | | $ | 3,344 | | | $ | 3,029 | | | $ | 2,924 | |
| | | | | | | | | | | | | |
| Investment income: | | | | | | | | | | | | |
| Commercial lines insurance | | $ | - | | | $ | - | | | $ | - | |
| Personal lines insurance | | | - | | | | - | | | | - | |
| Excess and surplus lines insurance | | | - | | | | - | | | | - | |
| Total (1) | | $ | 351 | | | $ | 350 | | | $ | 348 | |
| | | | | | | | | | | | | |
| Loss and loss expenses incurred related to current accident year: | | | | | | | | | | | | |
| Commercial lines insurance | | $ | 1,712 | | | $ | 1,804 | | | $ | 1,706 | |
| Personal lines insurance | | | 751 | | | | 765 | | | | 571 | |
| Excess and surplus lines insurance | | | 70 | | | | 51 | | | | 42 | |
| Total | | $ | 2,533 | | | $ | 2,620 | | | $ | 2,319 | |
| | | | | | | | | | | | | |
| Loss and loss expenses incurred related to prior accident years: | | | | | | | | | | | | |
| Commercial lines insurance | | $ | (292 | ) | | $ | (234 | ) | | $ | (269 | ) |
| Personal lines insurance | | | (99 | ) | | | (42 | ) | | | (34 | ) |
| Excess and surplus lines insurance | | | (5 | ) | | | (9 | ) | | | (1 | ) |
| Total | | $ | (396 | ) | | $ | (285 | ) | | $ | (304 | ) |
| | | | | | | | | | | | | |
| Amortization of deferred policy acquisition costs: | | | | | | | | | | | | |
| Commercial lines insurance | | $ | 461 | | | $ | 441 | | | $ | 423 | |
| Personal lines insurance | | | 183 | | | | 144 | | | | 139 | |
| Excess and surplus lines insurance | | | 17 | | | | 13 | | | | 9 | |
| Total | | $ | 661 | | | $ | 598 | | | $ | 571 | |
| | | | | | | | | | | | | |
| Paid loss and loss expenses: | | | | | | | | | | | | |
| Commercial lines insurance | | $ | 1,546 | | | $ | 1,545 | | | $ | 1,330 | |
| Personal lines insurance | | | 659 | | | | 676 | | | | 526 | |
| Excess and surplus lines insurance | | | 24 | | | | 20 | | | | 9 | |
| Total | | $ | 2,229 | | | $ | 2,241 | | | $ | 1,865 | |
| | | | | | | | | | | | | |
| Net written premiums: | | | | | | | | | | | | |
| Commercial lines insurance | | $ | 2,459 | | | $ | 2,218 | | | $ | 2,155 | |
| Personal lines insurance | | | 918 | | | | 801 | | | | 750 | |
| Excess and surplus lines insurance | | | 105 | | | | 79 | | | | 58 | |
| Total | | $ | 3,482 | | | $ | 3,098 | | | $ | 2,963 | |
|
| | | | | | | | | | | | |
| Cincinnati Financial Corporation and Subsidiaries |
| Supplementary Information Concerning Property Casualty Insurance Operations |
| (Dollars in millions) | | Years ended December 31, |
| | | 2014 | | 2013 | | 2012 |
| Deferred policy acquisition costs: | | |
| | |
| | |
|
| Commercial lines insurance | | $ | 257 |
| | $ | 251 |
| | $ | 235 |
|
| Personal lines insurance | | 108 |
| | 104 |
| | 93 |
|
| Excess and surplus lines insurance | | 14 |
| | 11 |
| | 9 |
|
| Total | | $ | 379 |
| | $ | 366 |
| | $ | 337 |
|
| | | | | | | |
| Reserves for unpaid claims and claim adjustment expenses: | | |
| | |
| | |
|
| Commercial lines insurance | | $ | 3,797 |
| | $ | 3,667 |
| | $ | 3,645 |
|
| Personal lines insurance | | 439 |
| | 417 |
| | 398 |
|
| Excess and surplus lines insurance | | 202 |
| | 157 |
| | 126 |
|
| Total | | $ | 4,438 |
| | $ | 4,241 |
| | $ | 4,169 |
|
| | | | | | | |
| Reserve discount deducted | | $ | — |
| | $ | — |
| | $ | — |
|
| | | | | | | |
| Unearned premiums: | | |
| | |
| | |
|
| Commercial lines insurance | | $ | 1,441 |
| | $ | 1,370 |
| | $ | 1,246 |
|
| Personal lines insurance | | 562 |
| | 534 |
| | 490 |
|
| Excess and surplus lines insurance | | 78 |
| | 66 |
| | 54 |
|
| Total | | $ | 2,081 |
| | $ | 1,970 |
| | $ | 1,790 |
|
| | | | | | | |
| Earned premiums: | | |
| | |
| | |
|
| Commercial lines insurance | | $ | 2,856 |
| | $ | 2,636 |
| | $ | 2,383 |
|
| Personal lines insurance | | 1,041 |
| | 961 |
| | 868 |
|
| Excess and surplus lines insurance | | 148 |
| | 116 |
| | 93 |
|
| Total | | $ | 4,045 |
| | $ | 3,713 |
| | $ | 3,344 |
|
| | | | | | | |
| Investment income: | | |
| | |
| | |
|
| Commercial lines insurance | | $ | — |
| | $ | — |
| | $ | — |
|
| Personal lines insurance | | — |
| | — |
| | — |
|
| Excess and surplus lines insurance | | — |
| | — |
| | — |
|
| Total (1) | | $ | 358 |
| | $ | 348 |
| | $ | 351 |
|
| | | | | | | |
| Loss and loss expenses incurred related to current accident year: | | |
| | |
| | |
|
| Commercial lines insurance | | $ | 1,869 |
| | $ | 1,691 |
| | $ | 1,712 |
|
| Personal lines insurance | | 752 |
| | 678 |
| | 751 |
|
| Excess and surplus lines insurance | | 104 |
| | 79 |
| | 70 |
|
| Total | | $ | 2,725 |
| | $ | 2,448 |
| | $ | 2,533 |
|
| | | | | | | |
| Loss and loss expenses incurred related to prior accident years: | | |
| | |
| | |
|
| Commercial lines insurance | | $ | (57 | ) | | $ | (95 | ) | | $ | (292 | ) |
| Personal lines insurance | | (12 | ) | | (39 | ) | | (99 | ) |
| Excess and surplus lines insurance | | (29 | ) | | (13 | ) | | (5 | ) |
| Total | | $ | (98 | ) | | $ | (147 | ) | | $ | (396 | ) |
| | | | | | | |
| Amortization of deferred policy acquisition costs: | | |
| | |
| | |
|
| Commercial lines insurance | | $ | 537 |
| | $ | 514 |
| | $ | 461 |
|
| Personal lines insurance | | 209 |
| | 192 |
| | 183 |
|
| Excess and surplus lines insurance | | 24 |
| | 21 |
| | 17 |
|
| Total | | $ | 770 |
| | $ | 727 |
| | $ | 661 |
|
| | | | | | | |
| Paid loss and loss expenses: | | |
| | |
| | |
|
| Commercial lines insurance | | $ | 1,666 |
| | $ | 1,498 |
| | $ | 1,546 |
|
| Personal lines insurance | | 717 |
| | 639 |
| | 659 |
|
| Excess and surplus lines insurance | | 30 |
| | 35 |
| | 24 |
|
| Total | | $ | 2,413 |
| | $ | 2,172 |
| | $ | 2,229 |
|
| | | | | | | |
| Net written premiums: | | |
| | |
| | |
|
| Commercial lines insurance | | $ | 2,922 |
| | $ | 2,760 |
| | $ | 2,459 |
|
| Personal lines insurance | | 1,068 |
| | 1,005 |
| | 918 |
|
| Excess and surplus lines insurance | | 153 |
| | 128 |
| | 105 |
|
| Total | | $ | 4,143 |
| | $ | 3,893 |
| | $ | 3,482 |
|
| | | | | | | |
(1) This segment information is not regularly allocated to segments and not reviewed by company management in making decisions about resources to be allocated to the segments or to assess their performance.
Cincinnati Financial Corporation - 2014 10-K - Page 175
Pursuant to the requirements of Section 13 or
15 (d)15(d) of the Securities Exchange Act of 1934, the registrant has duly caused this report to be signed on its behalf by the undersigned, thereunto duly authorized.
Cincinnati Financial Corporation
/S/ Eric N. Mathews
By: | Eric N. Mathews, CPCU, AIAF |
Title: | Principal Accounting Officer, Vice President, Assistant Secretary and Assistant Treasurer |
Date: | February 27, 2013 |
By: Eric N. Mathews, CPCU, AIAF
Title: Principal Accounting Officer, Vice President, Assistant Secretary and Assistant Treasurer
Date: February 27, 2015
Pursuant to the requirements of the Securities Exchange Act of 1934, this report has been duly signed below by the following persons on behalf of the registrant and in the capacities and on the dates indicated.
|
| | |
| Signature | | Title | | Date |
| | | | |
| /S/ Kenneth W. Stecher | | Chairman of the Board | | February 27, 20132015 |
| Kenneth W. Stecher | |
| /S/ Steven J. Johnston | | President, Chief Executive Officer and Director | | February 27, 20132015 |
| Steven J. Johnston | |
| /S/ Michael J. Sewell | | Chief Financial Officer, Senior Vice President and Treasurer | | February 27, 20132015 |
| Michael J. Sewell | |
| /S/ William F. Bahl | | Director | | February 27, 20132015 |
| William F. Bahl | |
| /S/ Gregory T. Bier | | Director | | February 27, 20132015 |
| Gregory T. Bier | |
| /S/ Dirk J. Debbink | | Director | | February 27, 20132015 |
| Dirk J. Debbink | |
| /S/ Linda W. Clement-Holmes | | Director | | February 27, 20132015 |
| Linda W. Clement-Holmes | |
| /S/ Kenneth C. Lichtendahl | | Director | | February 27, 20132015 |
| Kenneth C. Lichtendahl | |
| /S/ W. Rodney McMullen | | Director | | February 27, 20132015 |
| W. Rodney McMullen |
| /S/ David P. Osborn | Director | February 27, 2015 |
| David P. Osborn |
| /S/ Gretchen W. Price | | Director | | February 27, 20132015 |
| Gretchen W. Price | |
| /S/ John J. Schiff, Jr. | | Director | | February 27, 20132015 |
| John J. Schiff, Jr. | |
| /S/ Thomas R. Schiff | | Director | | February 27, 20132015 |
| Thomas R. Schiff | |
| /S/ Douglas S. Skidmore | | Director | | February 27, 20132015 |
| Douglas S. Skidmore | |
| /S/ John F. Steele, Jr. | | Director | | February 27, 20132015 |
| John F. Steele, Jr. | |
| /S/ Larry R. Webb | | Director | | February 27, 20132015 |
| Larry R. Webb | |
/S/ E. Anthony Woods | | Director | | February 27, 2013 |
E. Anthony Woods | |
Cincinnati Financial Corporation - 2014 10-K - Page 176
|
| |
| Exhibit No. | | Exhibit Description |
| | |
| 3.1 | | Amended and Restated Articles of Incorporation of Cincinnati Financial Corporation (incorporated by reference to the company’s 2010 Annual Report on Form 10-K dated February 25, 2011, Exhibit 3.1) |
| | |
| 3.2 | | Regulations of Cincinnati Financial Corporation (incorporated by reference to the company'scompany’s Quarterly Report on Form 10-Q for the quarter ended June 30, 2010, Exhibit 3.2) (File No. 000-04604) |
| | |
| 4.1 | | Indenture with The Bank of New York Trust Company (incorporated by reference to the company’s Current Report on Form 8-K dated November 2, 2004, filed with respect to the issuance of the company’s 6.125% Senior Notes due November 1, 2034) |
| | |
| 4.2 | | Supplemental Indenture with The Bank of New York Trust Company (incorporated by reference to the company’s Current Report on Form 8-K dated November 2, 2004, filed with respect to the issuance of the company’s 6.125% Senior Notes due November 1, 2034) |
| | |
| 4.3 | | Second Supplemental Indenture with The Bank of New York Trust Company (incorporated by reference to the company’s Current Report on Form 8-K dated May 9, 2005, filed with respect to the completion of the company’s exchange offer and rescission offer for its 6.90% senior debentures due 2028) |
| | |
| 4.4 | | Form of 6.125% Exchange Note Due 2034 (included in Exhibit 4.2) |
| | |
| 4.5 | | Form of 6.92% Debentures Due 2028 (included in Exhibit 4.3) |
| | |
| 4.6 | | Indenture with the First National Bank of Chicago (subsequently assigned to The Bank of New York Trust Company) (incorporated by reference to the company’s registration statement on Form S-3 effective May 22, 1998 (File No. 333-51677)) |
| | |
| 4.7 | | Form of 6.90% Debentures Due 2028 (included in Exhibit 4.6) |
| | |
| 10.1 | | Cincinnati Financial Corporation Directors’ Stock Plan of 2009 (incorporated by reference to the company’s definitive Proxy Statement dated March 20, 2009) |
| | |
| 10.2 | | Cincinnati Financial Corporation Stock Option Plan No. VI (incorporated by reference to the company’s definitive Proxy Statement dated March 1, 1999) (File No. 000-04604) |
| | |
| 10.3 | | Cincinnati Financial Corporation Stock Option Plan No. VII (incorporated by reference to the company’s definitive Proxy Statement dated March 8, 2002) (File No. 000-04604) |
| | |
| 10.4 | | Cincinnati Financial Corporation Annual Incentive Compensation Plan of 2009, as amended January 31, 2014 (incorporated by reference to Exhibit 10.1 filed with the company’s definitive Proxy StatementCurrent Report on Form 8-K dated March 20, 2009) |
| | February 3, 2014) |
| 10.5 | | Cincinnati Financial Corporation 2006 Stock Compensation Plan (incorporated by reference to the company’s definitive Proxy Statement dated March 30, 2007) |
| | |
| 10.6 | | Cincinnati Financial Corporation 2012 Stock Compensation Plan (incorporated by reference to the company’s definitive Proxy Statement dated March 16, 2012) |
| | |
| 10.7 | | Amended and Restated Cincinnati Financial Corporation Supplemental Retirement Plan dated January 1, 2009 |
| | (incorporated by reference to Exhibit 10.7 filed with the company’s Annual Report on Form 10-K dated February 27, 2013) |
| 10.8 | | Form of Incentive Stock Option Agreement for Stock Option Plan VII (incorporated by reference to Exhibit 10.1 filed with the company’s Current Report on Form 8-K dated October 20, 2006) |
| | |
| 10.9 | | Form of Nonqualified Stock Option Agreement for Stock Option Plan VII (incorporated by reference to Exhibit 10.2 filed with the company’s Current Report on Form 8-K dated October 20, 2006) |
| | |
| 10.10 | | Form of Incentive Stock Option Agreement for the 2006 Stock Compensation Plan (incorporated by reference to Exhibit 10.3 filed with the company’s Current Report on Form 8-K dated October 20, 2006) |
| | |
| 10.11 | | Form of Nonqualified Stock Option Agreement for the 2006 Stock Compensation Plan (incorporated by reference to Exhibit 10.4 filed with the company’s Current Report on Form 8-K dated October 20, 2006) |
| | |
| 10.12 | | Form of Restricted Stock Unit Agreement for use under the Cincinnati Financial Corporation 2006 Stock Compensation Plan (performance-based) (incorporated by reference to Exhibit 10.1 filed with the company'scompany’s Current Report on Form 8-K dated November 18, 2008) |
| | |
| 10.13 | | Form of Incentive Compensation Agreement for the Cincinnati Financial Corporation Incentive Compensation Plan of 2009 (incorporated by reference to Exhibit 10.1 filed with the company'scompany’s Current Report on Form 8-K dated March 16, 2009) |
| | |
| 10.14 | | Amended and RestatedForm of Incentive Stock Option Agreement for the Cincinnati Financial Corporation Top Hat Savings2012 Stock Compensation Plan dated January 1, 2011 |
| | |
10.15 | | Letter Agreement by and among Cincinnati Financial Corporation , CFC Investment Company and PNC Bank, National Association, dated August 25, 2011 renewing $75 million committed line of credit pursuant to the Credit Agreement referenced in Exhibit 10.39 above (incorporated by reference to Exhibit 10.1 filed with the company’s Current Report on Form 8-K dated August 25, 2011)February 21, 2013) |
| 10.15 | Form of Nonqualified Stock Option Agreement for the Cincinnati Financial Corporation 2012 Stock Compensation Plan (incorporated by reference to Exhibit 10.2 filed with the company’s Current Report on Form 8-K dated February 21, 2013) |
Cincinnati Financial Corporation - 2014 10-K - Page 177
|
| |
| Exhibit No. | Exhibit Description |
| 10.16 | Form of Restricted Stock Unit Agreement (service based) for the Cincinnati Financial Corporation 2012 Stock Compensation Plan (incorporated by reference to Exhibit 10.3 filed with the company’s Current Report on Form 8-K dated February 21, 2013) |
| 10.17 | Form of Restricted Stock Unit Agreement (performance based) for the Cincinnati Financial Corporation 2012 Stock Compensation Plan (incorporated by reference to Exhibit 10.4 filed with the company’s Current Report on Form 8-K dated February 21, 2013) |
| 10.18 | Amended and Restated Cincinnati Financial Corporation Top Hat Savings Plan dated January 1, 2011 (incorporated by reference to Exhibit 10.14 filed with the company’s Annual Report on Form 10-K dated February 27, 2013) |
| 10.19 | Cincinnati Financial Corporation Executive Deferred Compensation Agreement by and between the Cincinnati Financial Corporation and Michael J. Sewell, dated as of October 25, 2011 (incorporated by reference to Exhibit 10.2 filed with the Company’scompany’s Quarterly Report on Form 10-Q for the quarter ended September 30, 2011) |
Exhibit No.10.20 | | Exhibit Description |
| | |
10.17 | | Amended and Restated Credit Agreement by and among Cincinnati Financial Corporation, CFC Investment Company, PNC Bank, N.A. as Administrative Agent, PNC Capital Markets LLC, as Sole Bookrunner and Joint Lead Arranger, Fifth Third Bank, N.A., as Joint Lead Arranger and Syndication Agent, The Huntington National Bank and U.S. Bank, N.A., as Documentation Agents, dated May 31, 201213, 2014 (incorporated by reference to the company’scompany’s Current Report on Form 8-K dated May 31, 2012,13, 2014, Exhibit 10.1) |
| | |
10.18 | 10.21 | Agreement by and between The Cincinnati Insurance Company and its affiliated and subsidiary companies and Thomas A. Joseph dated October 19, 2012 (incorporated by reference Exhibit 10.1 filed with the company’s Quarterly Report on Form 10-Q for the quarter ended September 30, 2012) |
| | |
| 11 | | Statement re: Computation of per share earnings for the years ended December 31, 2012, 2011,2014, 2013, and 20102012, contained in Part II, Item 8, Note 12, to the Consolidated Financial Statements |
| | |
| 14 | | Cincinnati Financial Corporation Code of Ethics for Senior Financial Officers (incorporated by reference to the company’s definitive Proxy Statement dated March 18, 2004 (File No. 000-04604)) |
| | |
| 21 | | Cincinnati Financial Corporation subsidiaries contained in Part I, Item 1, of this report |
| | |
| 23 | | Consent of Independent Registered Public Accounting Firm |
| | |
| 31A | | Certification pursuant to Section 302 of the Sarbanes Oxley Act of 2002 – Chief Executive Officer |
| | |
| 31B | | Certification pursuant to Section 302 of the Sarbanes Oxley Act of 2002 – Chief Financial Officer |
| | |
| 32 | | Certification pursuant to Section 906 of the Sarbanes Oxley Act of 2002 |
156101.INS | XBRL Instance Document |
| 101.SCH | XBRL Taxonomy Extension Schema Document |
| 101.CAL | XBRL Taxonomy Extension Calculation Linkbase Document |
| 101.DEF | XBRL Taxonomy Extension Definition Linkbase Document |
| 101.LAB | XBRL Taxonomy Extension Label Linkbase Document |
| 101.PRE | XBRL Taxonomy Extension Presentation Linkbase Document |
Cincinnati Financial Corporation - 2014 10-K - Page 178