Part III of this Annual Report on Form 10-K incorporates by reference portions of the Registrant’s definitive proxy statement, to be filed with the Securities and Exchange Commission no later than 120 days after the close of its fiscal year; provided that if such proxy statement is not filed with the Commission in such 120-day period, an amendment to this Form 10-K shall be filed no later than the end of the 120-day period.
SPECIAL NOTE REGARDING FORWARD-LOOKING STATEMENTS
Some of the statements under “Business,” “Risk Factors,” “Legal Proceedings,” “Market for Registrant’s Common Stock and Related Stockholder Matters” and “Management Discussion and Analysis of Financial Condition and Results of Operations” and elsewhere in this Annual Report on Form 10-K (this “Form 10-K”) constitute forward-looking statements under Section 27A of the Securities Act of 1933, as amended, and Section 21E of the Securities Exchange Act of 1934, as amended, including statements made with respect to future earnings per share, future revenues, future operating income, future cash flows, competitive and strategic initiatives, potential stock repurchases and future liquidity needs. These statements involve known and unknown risks, uncertainties and other factors that may cause results, levels of activity, growth, performance, earnings per share or achievements to be materially different from any future results, levels of activity, growth, performance, earnings per share or achievements expressed or implied by such forward-looking statements.
The forward-looking statements included in this Form 10-K and referred to elsewhere are related to future events or our strategies or future financial performance. In some cases, you can identify forward-looking statements by terminology such as “may,” “should,” “believe,” “anticipate,” “future,” “potential,” “estimate,” “encourage,” “opportunity,” “growth,” “leader,” “could”, “expect,” “intend,” “plan,” “expand,” “focus,” “through,” “strategy,” “provide,” “offer,” “allow,” “commitment,” “implement,” “result,” “increase,” “establish,” “perform,” “make,” “continue,” “can,” “ongoing,” “include” or the negative of such terms or comparable terminology. All forward-looking statements included in this Form 10-K are based on information available to us as of the filing date of this report, and the Company assumes no obligation to update any such forward-looking statements. Our actual results could differ materially from the forward-looking statements. Important
Factors that may cause such differences include but are not limited to: (1) intense competition in the drug testing industry, particularly among companies that test utilizing hair samples; (2) risks associated with the development of markets for new products and services offered; (3) risks associated with capacity expansion; (4) risks associated with U.S. government regulations, including, but not limited to, FDA regulations, (5) risks associated with our international operations, including, but not limited to, Brazilian laws, proposed laws and regulations, and currency risks; (6) Psychemedics' ability to maintain its reputation and brand image; (7) the ability of Psychemedics to achieve its business plans, productivity improvements, cost controls, leveraging of its global operating platform, and acceleration of the rate of innovation; (8) information technology system failures and data security breaches; (9) the uncertain global economy; (10) our ability to attract, develop and retain executives and other qualified employees; (11) Psychemedics' ability to obtain and protect intellectual property rights; and (12) changes in economic conditions which affect demand for our products and services.
Additional important factors that could cause actual results to differ materially from expectations reflected in our forward-looking statements include those described in Item 1A, “Risk Factors.”
| i | ||
FORM 10-K
ANNUAL REPORT
For the Year Ended December 31,
TABLE OF CONTENTS
| ii | ||
Available Information; Background
Psychemedics Corporation (“the Company” or “Psychemedics”) maintains executive offices located at 125 Nagog Park, Acton, MA 01720. Our telephone number is (978) 206-8220. Our stock is traded on the NASDAQ Stock Exchange Market under the symbol “PMD”. Our Internet address iswww.psychemedics.com. The Company makes available, free of charge, on the Investor Information section of its website, its Annual Report on Form 10-K, Quarterly Reports on Form 10-Q, Current Reports on Form 8-K and all amendments to those reports as soon as reasonably practicable after such material is electronically filed with the Securities and Exchange Commission (the “SEC”). Copies are also available, without charge, from Psychemedics Corporation, Attn: Investor Relations, 125 Nagog Park, Acton, MA 01720. Alternatively, reports filed with the SEC may be viewed or obtained at the SEC Public Reference Room in Washington, D.C., or the SEC’s Internet site atwww.sec.gov. We do not intend for information contained in our website to be part of this Annual Report on Form 10-K.
General
Psychemedics Corporation is a Delaware corporation organized on September 24, 1986 to provide testing services for the detection of drugs of abuse through the analysis of hair samples. The Company’s testing methods utilize a patented technology that digests the hair and releases drugs trapped in the hair without destroying the drugs. This is fundamental to the entire process because the patented method gets virtually 100% of the drug out of the hair, and if you cannot get the drug out of the hair, you cannot measure it. The Company then performs a proprietary custom-designed enzyme immunoassay (EIA) on the liquid supernatant, with confirmation testing by mass spectrometry.
The Company’s primary application of its patented technology is as a testing service that analyzes hair samples for the presence of certain drugs of abuse. The Company’s customized proprietary EIA procedures to drug test hair samples differ from the more commonly-usedcommonly used immunoassay procedures employed to test urine samples. The Company’s tests provide quantitative information that can indicate the approximate amount of drug ingested as well as historical data, which can show a pattern of individual drug use over a longer period of time, thereby providing superior detection compared to other types of drug testing. This information is useful to employers for both applicant and employee testing, as well as to physicians, treatment professionals, law enforcement agencies, school administrators, and parents concerned about their children’s drug use. The Company provides screening and confirmation by mass spectrometry using industry-accepted practices for cocaine, marijuana, PCP, amphetamines (including ecstasy)ecstasy, eve and Adderall) and opiates (including heroin, hydrocodone, hydromorphone, oxycodone, oxymorphone and codeine). In addition, in 2013, the Company launched a hair test for alcohol which also looks back on use over a 90 day period, as our hair drug tests do.
Testing services are currently performed at the Company’s laboratoryCulver City, California campus located at 5832 Uplander Way Culver City, California.
Background on Drug Testing with Hair
When certain chemical substances enter the bloodstream, the blood carries these substances to the hair where they become “entrapped” in the protein matrix in amounts approximately proportional to the amount ingested. The Company utilizes a patented drug extraction method followed by a unique enzyme immunoassay (EIA) procedure to identify drugs in the hair. The patented drug extraction method effectively releases drugs from the hair without destroying the drugs---gettingdrugs, getting virtually 100% of the drug out of the hair. The patented method can be used with a broad range of immunoassay screen techniques and mass spectrometry methods, and chromatographic procedures.methods.
The immunoassays produced by the Psychemedics R&D team were uniquely designed specifically to meet and even exceed the standards of radioimmunoassay (“RIAH”), the original testing method created and utilized by the Company prior to 2013. Because Psychemedics is the only hair testing laboratory that manufactures its own screening assays, it has full control over all aspects of its technology, and that powerful advantage facilitated the Company's creation of the its EIA assays with equivalence to its own previously FDA-cleared radioimmunoassays.
The EIA screened positive results are then confirmed by mass spectrometry. Depending upon the length of hair, the Company is able to provide historical information on drug use by the person from whom the sample was obtained. Because head hair grows approximately 1.3 centimeters per month, a 3.9 centimeter head hair sample can reflect drug ingestion over the approximate three months prior to the collection of the sample. Another option is sectional analysis of the head hair sample, in which the hair is sectioned lengthwise to approximately correspond to certain time periods, thereby providing information on patterns of drug use.
Validation of the Company’s Proprietary Testing Methods
The process of analyzing human hair for the presence of drugs has been the subject of numerous peer-reviewed, scientific field studies. Some of these studies were performed with the following organizations: Boston University School of Public Health; Citizens for a Better Community Court, Columbia University; Connecticut Department of Mental Health and Addictive Services; Koba Associates-DC Initiative, Harvard Cocaine Recovery Project; Hutzel Hospital, ISA Associates (Interscience America)-NIDA Workplace Study; University of California-Sleep State Organization; Maternal/Child Substance Abuse Project, Matrix Center, National Public Services Research Institute, Narcotic and Drug Research Institute, San Diego State University-Chemical Dependency Center, Spectrum Inc.; Stapleford Centre (London); Task Force on Violent Crime (Cleveland, Ohio); University of Miami-Department of Psychiatry, University of Miami-Division of Neonatology; University of South Florida-Operation Par Inc.; University of Washington, VA Medical Center-Georgia; U.S. Probation Parole-Santa Ana; and Wayne State University. The above studies included research in the following areas: effects of prenatal drug use, treatment evaluation, workplace drug use, the criminal justice system and epidemiology. Many of the studies have been funded by the National Institute of Justice or the National Institute on Drug Abuse (“NIDA”). Several hundred research articles written by independent researchers have been published supporting the general validity and usefulness of hair analysis.
Some of the Company’s customers have also completed their own testing to validate the Company’s hair test results compared to other companies’ urine test results. These studies consistently confirmed the Company’s superior detection rate compared to urinalysis testing. When results from the Company’s hair testing methods were compared to urine results in side-by-side evaluations, 5 to 10 times as many drug abusers were accurately identified by the Company’s proprietary methods.
In 1998, the National Institute of Justice, utilizing Psychemedics’ previously utilized RIAH hair testing assay, completed a Pennsylvania Prison study where hair analysis revealed an average prison drug use level of approximately 7.9% in 1996. Comparatively, urinalysis revealed virtually no positives. After measures to curtail drug use were instituted (drug-sniffing dogs, searches and scanners), the use level fell to approximately 2% according to the results of hair analysis in 1998. Again, the urine tests showed virtually no positives. The study illustrates the usefulness of hair analysis to monitor populations and the weakness of urinalysis.
The Company has received 510k clearance from the Food and Drug Administration (FDA) on seven EIA assays used to test head and body hair for drugs of abuse. As of the date of this document, Psychemedics is the only company to receive FDA clearance for testing of drugs of abuse using both head and body hairfor seven drugs of abuse.
The Company’s decontamination wash protocol and the effects in eliminating surface contamination were analyzed in a study conducted by scientists at the Laboratory of the Federal Bureau of Investigation and published in August 2014 in the Journal of Analytical Toxicology. The FBI concluded that the use of an extended wash protocol of the type used by the Company will exclude false positive results from environmental contact with cocaine. In the study, the FBI cited Psychemedics’ studies published in 1993, 2002, 2004, and 2005, and named our lab director Dr. Michael Schaffer and our lab in its acknowledgments. The FBI study also supported the use of metabolites known as hydroxycocaines as evidence of ingestion. These metabolites were first identified in hair by Psychemedics.
Advantages of Using the Company’s Patented Method
The Company asserts that hair testing using its patented method confers substantive advantages over detection through urinalysis. Although urinalysis testing can provide accurate drug use information, the scope of the information is short-term and is generally limited to the type of drug ingested within a few days of the test. Studies published in many scientific publications have indicated that most drugs disappear from urine within a few days.
In contrast to urinalysis testing, hair testing using the Company’s patented method can provide long-term historical drug use information resulting in a significantly wider window of detection. This window may be several months or longer depending on the length of the hair sample. The Company’s standard test offering, however, uses a 3.9 centimeter length head hair sample cut close to the scalp, which measures use for approximately three months prior to collection of the sample.
This wider window enhances the detection efficiency of hair analysis, making it particularly useful in pre-employment and random testing. Hair testing not only identifies more drug users, but it may also uncover patterns and severity of drug use (information most helpful in determining the scope of an individual’s involvement with drugs), while serving as a deterrent against drug use. Hair testing employing the Company’s patented method greatly reduces the incidence of “false negatives” associated with evasive measures typically encountered with urinalysis testing. For example, urinalysis test results are adversely impacted by excessive fluid intake prior to testing and by adulteration or substitution of the urine sample. Moreover, a drug user who abstains from use for a few days prior to urinalysis testing can usually escape detection. Hair testing is effectively free of these problems, as it cannot be thwarted by evasive measures typically encountered with urinalysis testing. Hair testing is also attractive to customers since sample collection is typically performed under close supervision yet is less intrusive and less embarrassing for test subjects.
Hair testing using the Company’s patented method (with mass spectrometry confirmation) further reduces the prospects of error in conducting drug detection tests. Urinalysis testing is more susceptible to problems such as “evidentiary false positives” resulting from passive drug exposure or poppy seeds. To combat this problem, in federally mandated testing, the opiate cutoff levels for urine testing were raised 667% (from 300 to 2,000 ng/ml) on December 1, 1998, and testing for the presence of a heroin metabolite, 6-AM,6-MAM, was required. These requirements, however, effectively reduced the detection time frame for confirmed heroin with 6-AMuse, such that 6-MAM in urine down tocan typically only be detected for several hours post drug use. In contrast, the metabolite 6-AM6-MAM is stable in hair and can be detected for months.
In the event a positive urinalysis test result is challenged, a test on a newly collected urine sample is not a viable remedy. Unless the forewarned individual continues to use drugs prior to the date of the newly collected sample, a re-test may yield a negative result when using urinalysis testing because of temporary abstinence. In contrast, when the Company’s hair testing method is offered on a repeat hair sample, the individual suspected of drug use cannot as easily affect the results because historical drug use data remains locked in the hair fiber.
When compared to other hair testing methods, not only are the Company’s assays cleared by the FDA for head and body hair, they also employ a unique patented method ofdigesting hair that the Company believes allows for the most efficient release of drugs from the hair without destroying the drugs. The Company’s method of releasing drugs from hair is a key advantage and results in superior detection rates.
Disadvantages of Hair Testing
There are some disadvantages of hair testing as compared to drug detection through urinalysis. Because hair starts growing below the skin surface, drug ingestion evidence does not appear in hair above the scalp until approximately five to seven days after use.
Thus, hair testing is not suitable for determining drug presence in “for cause” testing as is done in connection with an accident investigation. It does, however, provide a drug history which can complement urinalysis information in “for cause” testing.
The Company’s prices for its tests are generally somewhat higher than prices for tests using urinalysis, but the Company believes that its superior detection rates provide more value to the customer. This pricing policy could, however, adversely impact the growth of the Company’s sales volume.
Hair Alcohol Testing
In 2013, the Company launched a test for alcohol using hair. This test measures average alcohol consumption over a period of approximately three months, indicates the approximate level of alcohol use during that time period, and can provide a behavioral indication of excessive use. The test measures the amount of ethyl glucuronide (EtG) in the hair – a trace metabolite of ethanol and a direct alcohol biomarker. The test follows the guidelines determined by the World Health Organization in association with the Society of Hair Testing for measuring consumption.
Intellectual Property
Certain aspects of the hair analysis method currently used by the Company are covered by US and foreign patents owned by the Company. The Company has been granted a total of eightten US patents, including a patent issued to the Company in 2011 that focuses on digesting hair and releasing drugs trapped in the hair without destroying the drugs. This patent can be used with a broad range of immunoassay screen techniques, mass spectrometry methods, and chromatographic procedures. In 2012, the Company received an additional patent that extended the range of the patent received in 2011.
The Company also relies on trade secrets to protect certain aspects of its proprietary technology. The Company’s ability to protect the confidentiality of its trade secrets is dependent upon the Company’s internal safeguards and upon the laws protecting trade secrets and unfair competition.
In the event that patent protection or protection under the laws of trade secrets is not sufficient and the Company’s competitors succeed in duplicating the Company’s products, the Company’s business could be materially adversely affected.
Target Markets
Workplace
Workplace
The Company focuses its primary marketing efforts on the private sector, with particular emphasis on job applicant and employee testing.
Most businesses use drug testing to screen job applicants and employees. The Hazeldon Foundation survey from 2007 indicated that 85 percent of human resource (“HR”) professionals believe that drug testing is an effective way to diagnoseidentify substance abuse. The prevalence of drug screening programs reflects a concern that drug use contributes to employee health problems and costs (as the same study found that 62 percent of HR professionals believe that absenteeism is the most significant problem caused by substance abuse and addiction, followed at 49 percent by reduced productivity, a lack of trustworthiness at 39 percent, a negative impact on the company’s external image at 32 percent, missed deadlines at 31 percent, and in certain industries, safety hazards.) It has been estimated that the cost to American businesses is more than $100 billion annually.
The principal criticism of employee drug testing programs centers on the effectiveness of the testing program. Most private sector testing programs use urinalysis. Such programs are susceptible to evasive maneuvers and the inability to obtain confirmation through repeat samples in the event of a challenged result. An industry has developed over the Internet, and through direct mail, marketing a wide variety of adulterants, dilutants, clean urine and devices to assist drug users in falsifying urine test results.
Moreover, scheduled tests such as pre-employment testing and some random testing programs provide an opportunity for many drug users to simply abstain for a few days in order to escape detection by urinalysis.
The Company presents its patented hair analysis method to potential clients as a better technology well suited to employer needs. Field studies and actual client results support the accuracy and superior effectiveness of the Company’s patented technology and its ability to detect varying levels of drug use. This information provides an employer with greater flexibility in assessing the scope of an applicant’s or an employee’s drug problem.
The Company performs a confirmation test of all screened positive results through mass spectrometry. The use of mass spectrometry is an industry accepted practice used to confirm a positive test result from the screening process. The Company offers its clients an expanded drug screen with mass spectrometry confirmation of cocaine, PCP, marijuana, amphetamines (including Ecstasy and Eve), and opiates (including heroin, codeine, hydrocodone, hydromorphone, and oxycodone). In addition, the Company offers a hair test for alcohol which also looks back on use over a 90 day period, as our hair drug tests do.
3
Schools
The Company currently serves hundreds of schools throughout the United States and in several foreign countries. The Company offers its school clients the same five-drug screen with mass spectrometry confirmation that is used with the Company’s workplace testing service. In addition, the Company offers a hair test for alcohol which also looks back on use over a 90 day period, as our hair drug tests do.
Parents
Parents
The Company also offers a personal drug testing service, known as “PDT-90”®, for parents concerned about drug use by their children. It allows parents to collect a small sample of hair from their child in the privacy of the home, send it to the Company’s laboratory and have it tested for drugs of abuse by the Company. The PDT-90 testing service uses the same patented method that is used with the Company’s workplace testing service.
Research
The Company is involved in the following ongoing studies involving use of drugs of abuse in various populations: Mclean Hospital;Hospital and Wayne State University and Chemistry and Drug Metabolism Section; and Emmes Corporation.
Sales and Marketing
The Company markets its corporate drug testing services primarily through its own sales force and through distributors. Sales offices are located in several major cities in the United States in order to facilitate communications with corporate employers. The Company markets its home drug testing service, PDT-90, through the Internet.
Competition
The Company competes directly with numerous commercial laboratories that test for drugs primarily through urinalysis testing. Most of these laboratories, such as Quest Diagnostics, have substantially greater financial resources, market identity, marketing organizations, facilities, and more personnel than the Company. The Company has been steadily increasing its base of corporate customers and believes that future success with new customers is dependent on the Company’s ability to communicate the advantages of implementing a drug program utilizing the Company’s patented hair analysis method.
The Company’s ability to compete is also a function of pricing. The Company’s prices for its tests are generally somewhat higher than prices for tests using urinalysis. However, the Company believes that its superior detection rates, coupled with the customer’s ability to test less frequently due to hair testing’s wider window of detection (several months versus approximately three days with urinalysis), provide more value to the customer. This pricing policy could, however, lead to slower sales growth for the Company.
The Company also competes with other hair testing laboratories. The Company distinguishes itself from hair testing competitors by emphasizing the superior results the Company obtains through use of its unique patented extraction method (getting drug out of the hair), in combination with the Company’s FDA cleared immunoassay screen.
Government Regulation
The Company is licensed as a clinical laboratory by the State of California as well as certain other states. All tests are performed according to the laboratory standards established by the Department of Health and Human Services, through the Clinical Laboratories Improvement Amendments (“CLIA”), and various state licensing statutes.
A substantial number of states regulate drug testing. The scope and nature of such regulations varies greatly from state to state and is subject to change from time to time. The Company addresses state law issues on an ongoing basis.
The Federal Food, Drug and Cosmetic Act, as amended (the “FDC Act”) requires companies engaged in the business of testing for drugs of abuse using a test (screening assay) not previously recognized by the FDA are required to submit their assay to the FDA for recognition prior to marketing. In addition, the laboratory performing the tests is required to be certified by a recognized agency. In 2002, the Company received 510k clearance to market all five of its assays utilizing RIAH technology.
In 2008, the Company received the first CAP (College of American Pathologists) certification specifically including hair testing.
In 2011, the Company received ISO/IEC 17025 International Accreditation for a broad spectrum of laboratory testing including drugs of abuse and forensics in hair and urine specimens. ISO/IEC 17025 accreditation provides formal recognition to laboratories that demonstrate technical competency, and maintains this recognition through periodic evaluations to ensure continued compliance.
In 2012, the Company received 510k clearance from the FDA to market five of its assays utilizing the Company’s custom developed EIA technology.
In 2013, the Company had received 510k clearance from the FDA to market two additional assays utilizing the Company’s custom developed EIA technology.
4
Research and Development
The Company is continuously engaged in research and development activities. During the years ended December 31, 2015, 2014 and 2013, 2012$1.6 million, $1.3 million and 2011, $825,102, $825,518, and $607,408,$825 thousand, respectively, were expended for research and development. The Company continues to perform research activities to develop new products and services and to improve existing products and services utilizing the Company’s proprietary technology. The Company also continues to evaluate methodologies to enhance its drug screening capabilities. Additional research using the Company’s proprietary technology is being conducted by outside research organizations through government-funded studies.
Employees
As of December 31, 2013,2015, the Company had 151154 full-time equivalent employees, 7 of whom are full-time employees in R&D. None of the Company’s employees are subject to a collective bargaining agreement.
In addition to other information contained in this Form 10-K, the following risk factors should be carefully considered in evaluating Psychemedics Corporation and its business because such factors could have a significant impact on our business, operating results and financial condition. These risk factors could cause actual results to materially differ from those projected in any forward-looking statements.
Companies may develop products that compete with our products and some of these companies may be larger and better capitalized than we are.
Many of our competitors and potential competitors are larger and have greater financial resources than we do and offer a range of products broader than our products. Some of the companies with which we now compete or may compete in the future may develop more extensive research and marketing capabilities and greater technical and personnel resources than we do, and may become better positioned to compete in an evolving industry. Failure to compete successfully could harm our business and prospects.
Increased competition, including price competition, could have a material impact on the Company’s net revenues and profitability.
Our business is intensely competitive, both in terms of price and service. Pricing of drug testing services is a significant factor often considered by customers in selecting a drug testing laboratory. As a result of the clinical laboratory industry undergoing significant consolidation, larger clinical laboratory providers are able to increase cost efficiencies afforded by large-scale automated testing. This consolidation results in greater price competition. The Company may be unable to increase cost efficiencies sufficiently, if at all, and as a result, its net earnings and cash flows could be negatively impacted by such price competition. The Company may also face increased competition from companies that do not comply with existing laws or regulations or otherwise disregard compliance standards in the industry. Additionally, the Company may also face changes in fee schedules, competitive bidding for laboratory services or other actions or pressures reducing payment schedules as a result of increased or additional competition. Additional competition, including price competition, could have a material adverse impact on the Company’s net revenues and profitability.
Our results of operations are subject in part to variation in our customers’ hiring practices and other factors beyond our control.
Our results of operations have been and may continue to be subject to variation in our customers’ hiring practices, which in turn is dependent, to a large extent, on the general condition of the economy. Results for a particular quarter may vary due to a number of factors, including:
A failure to obtain and retain new customers, or a loss of existing customers, or a reduction in tests ordered, could impact the Company’s ability to successfully grow its business.
The Company needs to obtain and retain new customers. In addition, a reduction in tests ordered, without offsetting growth in its customer base, could impact the Company’s ability to successfully grow its business and could have a material adverse impact on the Company’s net revenues and profitability. We compete primarily on the basis of the quality of testing, reputation in the industry, the pricing of services and ability to employ qualified personnel. The Company’s failure to successfully compete on any of these factors could result in the loss of customers and a reduction in the Company’s ability to expand its customer base.
Our business could be harmed if we are unable to protect our technology.
We rely primarily on a combination of trade secrets, patents and trademark laws and confidentiality procedures to protect our technology. Despite these precautions, unauthorized third parties may infringe or copy portions of our technology. In addition, because patent applications in the United States are not publicly disclosed until either (1) 18 months after the application filing date or (2) the publication date of an issued patent wherein applicant(s) seek only US patent protection, applications not yet disclosed may have been filed which relate to our technology. Moreover, there is a risk that foreign intellectual property laws will not protect our intellectual property rights to the same extent as United States intellectual property laws. In the absence of the foregoing protections, we may be vulnerable to competitors who attempt to copy our products, processes or technology.
Our business could be affected by a computer or other IT Systemsystem failure.
A computer or IT system failure could affect our ability to perform tests, report test results or properly bill customers. Failures could occur as a result of the standardization of our IT systems and other system conversions, telecommunications failures, malicious human acts (such as electronic break-ins or computer viruses) or natural disasters. Sustained system failures or interruption of the Company’s systems in one or more of its operations could disrupt the Company’s ability to process and provide test results in a timely manner and/or bill the appropriate party. Failure of the Company’s information systems could adversely affect the Company’s business, profitability and financial condition.
6
Failure to maintain confidential information could result in a significant financial impact.
The Company maintains confidential information regarding the results of drug tests and other information including credit card and payment information from our customers. The failure to protect this information could result in lawsuits, fines or penalties. Any loss of data or breach of confidentiality, such as through a computer security breach, could expose the Company to a financial liability.
Our future success will depend on the continued services of our key personnel.
The loss of any of our key personnel could harm our business and prospects. We may not be able to attract and retain personnel necessary for the development of our business. We do not have key personnel under contract other than 3 officers who have agreements providing for severance and non competenon-compete covenants in the event of termination of employment following a change of control. Further, we do not have any key man life insurance for any of our officers or other key personnel.
There is a risk that our insurance will not be sufficient to protect us from errors and omissions liability or other claims, or that in the future errors and omissions insurance will not be available to us at a reasonable cost, if at all.
Our business involves the risk of claims of errors and omissions and other claims inherent to our business. We maintain errors and omissions and general liability insurance subject to deductibles and exclusions. There is a risk that our insurance will not be sufficient to protect us from all such possible claims. An under-insured or uninsured claim could harm our operating results or financial condition.
Our research and development capabilities may not produce viable new services or products.
In order to remain competitive, we need to continually improve our products, develop new technologies to replace older technologies that have either become obsolete or for which patent protection is no longer available. It is uncertain whether we will continually be able to develop services that are more efficient, effective or that are suitable for our customers. Our ability to create viable products or services depends on many factors, including the implementation of appropriate technologies, the development of effective new research tools, the complexity of the chemistry and biology, the lack of predictability in the scientific process and the performance and decision-making capabilities of our scientists. There is no guarantee that our research and development teams will be successful in developing improvements to our technology.
Improved testing technologies, or the Company’s customers using new technologies to perform their own tests, could adversely affect the Company’s business.
Advances in technology may lead to the development of more cost-effective technologies such as point-of-care testing equipment that can be operated by third parties or customers themselves in their own offices, without requiring the services of a freestanding laboratory. Development of such technology and its use by the Company’s customers could reduce the demand for its testing services and negatively impact our revenues.
We may not be able to recruit and retain the experienced scientists and management we need to compete in our industry.
Our future success depends upon our ability to attract, retain and motivate highly skilled scientists and management. Our ability to achieve our business strategies depends on our ability to hire and retain high caliber scientists and other qualified experts. We compete with other testing companies, research companies and academic and research institutions to recruit personnel and face significant competition for qualified personnel. We may incur greater costs than anticipated, or may not be successful, in attracting new scientists or management or in retaining or motivating our existing personnel.
Our future success also depends on the personal efforts and abilities of the principal members of our senior management and scientific staff to provide strategic direction, to manage our operations and maintain a cohesive and stable environment.
Our facilities and practices may fail to comply with government regulations.
Our testing facilities and processes must be operated in conformity with current government regulations. These requirements include, among other things, quality control, quality assurance and the maintenance of records and documentation. If we fail to comply with these requirements, we may not be able to continue our services to certain customers, or we could be subject to fines and penalties, suspension of production, or withdrawal of our certifications. We operate a facility that we believe conforms to all applicable requirements. This facility and our testing practices are subject to periodic regulatory inspections to ensure compliance.
Our business could be harmed from the loss or suspension of any licenses.
The forensic laboratory testing industry is subject to significant regulation and many of these statutes and regulations are subject to change. The Company cannot assure that applicable statutes and regulations will not be interpreted or applied by a regulatory authority in a manner that would adversely affect its business. Potential sanctions for violation of these regulations could include the suspension or loss of various licenses, certificates and authorizations, which could have a material adverse effect on the Company’s business.
If our use of chemical and hazardous materials violates applicable laws or regulations or causes personal injury we may be liable for damages.
Our drug testing activities, including the analysis and synthesis of chemicals, involve the controlled use of chemicals, including flammable, combustible, and toxic materials that are potentially hazardous. Our use, storage, handling and disposal of these materials is subject to federal, state and local laws and regulations, including the Resource Conservation and Recovery Act, the Occupational Safety and Health Act and local fire codes, and regulations promulgated by the Department of Transportation, the Drug Enforcement Agency, the Department of Energy, and the California Department of Public Health and Environment. We may incur significant costs to comply with these laws and regulations in the future. In addition, we cannot completely eliminate the risk of accidental contamination or injury from these materials, which could result in material unanticipated expenses, such as substantial fines or penalties, remediation costs or damages, or the loss of a permit or other authorization to operate or engage in our business. Those expenses could exceed our net worth and limit our ability to raise additional capital.
Our operations could be interrupted by damage to our specialized laboratory facilities.
Our operations are dependent upon the continued use of our highly specialized laboratories and equipment in Culver City, California. Catastrophic events, including earthquakes, fires or explosions, could damage our laboratories, equipment, scientific data, work in progress or inventories of chemicals and may materially interrupt our business. We employ safety precautions in our laboratory activities in order to reduce the likelihood of the occurrence of certain catastrophic events; however, we cannot eliminate the chance that such events will occur. The availability of laboratory space in these locations is limited, and rebuildingRebuilding our facilities could be time consuming and result in substantial delays in fulfilling our agreements with our customers. We maintain business interruption insurance to cover continuing expenses and lost revenue caused by such occurrences. However, this insurance does not compensate us for the loss of opportunity and potential harm to customer relations that our inability to meet our customers’ needs in a timely manner could create.
Agreements we have with our employees, consultants and customers may not afford adequate protection for our trade secrets, confidential information and other proprietary information.
In addition to patent protection, we also rely on copyright and trademark protection, trade secrets, know-how, continuing technological innovation and licensing opportunities. In an effort to maintain the confidentiality and ownership of our trade secrets and proprietary information, we require our employees, consultants and advisors to execute confidentiality and proprietary information agreements. However, these agreements may not provide us with adequate protection against improper use or disclosure of confidential information and there may not be adequate remedies in the event of unauthorized use or disclosure. Furthermore, we may from time to time hire scientific personnel formerly employed by other companies involved in one or more areas similar to the activities we conduct. In some situations, our confidentiality and proprietary information agreements may conflict with, or be subject to, the rights of third parties with whom our employees, consultants or advisors have prior employment or consulting relationships. Although we require our employees and consultants to maintain the confidentiality of all proprietary information of their previous employers, these individuals, or we, may be subject to allegations of trade secret misappropriation or other similar claims as a result of their prior affiliations. Finally, others may independently develop substantially equivalent proprietary information and techniques or otherwise gain access to our trade secrets. Our failure or inability to protect our proprietary information and techniques may inhibit or limit our ability to compete effectively, or exclude certain competitors from the market.
Risks Related to Our Stock
Our quarterly operating results could fluctuate significantly, which could cause our stock price to decline.
Our quarterly operating results have fluctuated in the past and are likely to fluctuate in the future. Our results are impacted by the extent to which we are able to gain new customers, both domestically and internationally, and on the hiring practices of our existing customers, which are, in turn, impacted by changes in government requirements regarding testing for drugs of abuse, delays in implementation of such requirements, as well as general economic conditions. Entering into new customer contracts can involve a long lead time. Accordingly, negotiation can be lengthy and is subject to a number of significant risks, including customers’ budgetary constraints and internal reviews. Due to these and other market factors, our operating results could fluctuate significantly from quarter to quarter. In addition, we may experience significant fluctuations in quarterly operating results due to factors such as general and industry-specific economic conditions that may affect the budgets and the hiring practices of our customers.
Due to the possibility of fluctuations in our revenue and expenses, we believe that quarter-to-quarter comparisons of our operating results are not necessarily a good indication of our future performance. Our operating results in some quarters may not meet the expectations of stock market analysts and investors. If we do not meet analysts’ and/or investors’ expectations, our stock price could decline.
Our stock price could experience substantial volatility.
The market price of our common stock has historically experienced and may continue to experience extensive volatility. Our quarterly operating results, the success or failure of future development efforts, changes in general conditions in the economy or the financial markets and other developments affecting our customers, our competitors or us could cause the market price of our common stock to fluctuate substantially. This volatility may adversely affect the price of our common stock. In the past, securities class action litigation has often been instituted following periods of volatility in the market price of a company’s securities. A securities class action suit against us could result in potential liabilities, substantial costs and the diversion of management’s attention and resources, regardless of whether we win or lose.
Payment of a dividend could decline or cease.
Because we have historically paid dividends, any cessation of our program or reduction in our quarterly dividend could affect our stock price. We have paid dividends on our common stock for 6977 consecutive quarters. It is our intent to continue this practice as long as we are able. However, if we are forced to cease this practice or reduce the amount of the regular dividend, due to operating or economic conditions, our stock price could suffer. Further, if the Company ceases its future dividends, a return on investment in our common stock would depend entirely upon future appreciation. There is no guarantee that our common stock will appreciate in value or even maintain the price at which stockholders have purchased their shares.
The general economic condition could deteriorate.
Our business is dependent upon new hiring and the supply of new jobs created by overall economic conditions. If the economy deteriorates, leading to a downturn in new job creation, our business and stock price could be adversely affected.
Not applicable.
The Company maintains its corporate office and northeast sales office at 125 Nagog Park, Acton, Massachusetts; the office consists of 3,971 square feet and is leased through February 2015.
The Company leases 18,000two facilities for laboratory purposes in Culver City, California. The first is 13,900 square feet of space in Culver City, California, for laboratory purposes.with an additional 9,600 feet of storage space. This facility is leased through December 31, 20152020 with an option to renew for an additional two years. TheIn 2014, the Company also leases an additional 5,400added a second facility of 16,000 square feet of space in Culver City, California for customer service and information technology purposes.space. This office spacefacility is leased through December 31, 2015March 14, 2017 with an option to renew for an additional two years.
The Company is involved in various suits and claims in the ordinary course of business. The Company does not believe that the disposition of any such suits or claims will have a material adverse effect on the continuing operations or financial condition of the Company.
Not applicable.
Item 5. Market for Registrant’s Common Equity, Related Shareholder Matters and Issuer Purchases of Equity Securities
The Company’s common stock is traded on the NASDAQ Stock Market under the symbol “PMD”. As of February 28, 2014,26, 2016, there were 184180 record holders of the Company’s common stock. The number of record owners was determined from the Company’s stockholder records maintained by the Company’s transfer agent and does not include beneficial owners of the Company’s common stock whose shares are held in the names of various security holders, dealers and clearing agencies. The Company believes that the number of beneficial owners of the Company’s common stock held by others as or in nominee names exceeds 2,000.
The following table sets forth for the periods indicated the range of prices for the Company’s common stock as reported by the NASDAQ Stock ExchangeMarket and dividends declared by the Company.
| High | Low | Dividends | ||||||||
| Fiscal 2012: | ||||||||||
| First Quarter | $ | 10.40 | $ | 9.11 | $ | 0.150 | ||||
| Second Quarter | 10.48 | 9.46 | 0.150 | |||||||
| Third Quarter | 12.19 | 10.10 | 0.150 | |||||||
| Fourth Quarter | 12.49 | 10.60 | 0.150 | |||||||
| Fiscal 2013: | ||||||||||
| First Quarter | $ | 12.48 | $ | 10.76 | $ | 0.150 | ||||
| Second Quarter | 12.03 | 10.55 | 0.150 | |||||||
| Third Quarter | 13.40 | 10.75 | 0.150 | |||||||
| Fourth Quarter | 14.90 | 12.00 | 0.150 | |||||||
| High | Low | Dividends | ||||||||||
| Fiscal 2015: | ||||||||||||
| First Quarter | $ | 16.85 | $ | 14.25 | $ | 0.15 | ||||||
| Second Quarter | 17.83 | 14.10 | 0.15 | |||||||||
| Third Quarter | 15.10 | 9.82 | 0.15 | |||||||||
| Fourth Quarter | 11.80 | 9.50 | 0.15 | |||||||||
| Fiscal 2014: | ||||||||||||
| First Quarter | $ | 18.76 | $ | 14.41 | $ | 0.15 | ||||||
| Second Quarter | 17.47 | 14.06 | 0.15 | |||||||||
| Third Quarter | 15.39 | 12.42 | 0.15 | |||||||||
| Fourth Quarter | 15.46 | 13.06 | 0.15 | |||||||||
The Company has paid dividends over the past seventeennineteen years. It most recently declared a dividend on February 10, 2014,9, 2016, which will be paid on March 7, 2014.4, 2016. The Company’s current intention is to continue to declare dividends to the extent funds are available and not required for operating purposes or capital requirements, and only then, upon approval by the Board of Directors.
Issuer Purchases of Equity Securities
During 2013,2015, the Company did not repurchase any common shares for treasury.
Unregistered Sales of Equity Securities and Use of Proceeds
There were no unregistered sales of common stock of the Company during 2013.2015.
| Plan Category | Number of Securities to Be Issued Upon Exercise of Outstanding Options, Warrants and Rights (a) | Weighted Average Exercise Price of Outstanding Options, Warrants and Rights (b) | Number of Securities That Remained Available for Future Issuance (c) | |||||
Equity compensation plans approved by security holders(1)(2) | 138,975 | $ | 0.00 | 181,581 | ||||
| Equity compensation plans not approved by security holders | — | — | — | |||||
| Total | 138,975 | $ | 0.00 | 181,581 | ||||
Performance Graph
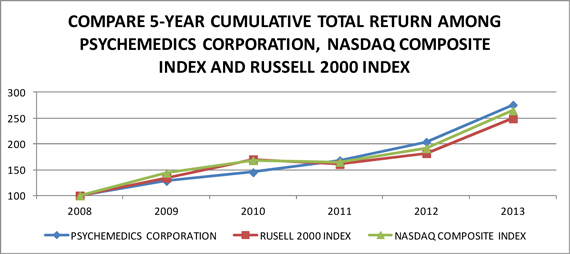
| 2008 | 2009 | 2010 | 2011 | 2012 | 2013 | ||||||||
| Psychemedics Corporation | 100.00 | 128.10 | 145.08 | 168.25 | 203.97 | 275.87 | |||||||
| Russell 2000 Index | 100.00 | 134.63 | 170.09 | 160.91 | 182.06 | 249.42 | |||||||
| NASDAQ Composite Index | 100.00 | 143.89 | 168.22 | 165.19 | 191.47 | 264.84 |

| 2010 | 2011 | 2012 | 2013 | 2014 | 2015 | |||||||||||||||||||
| Psychemedics Corp. | 100.00 | 117.96 | 145.63 | 201.35 | 214.39 | 160.15 | ||||||||||||||||||
| Russell 2000 Index | 100.00 | 94.60 | 107.03 | 146.64 | 151.81 | 143.14 | ||||||||||||||||||
| NASDAQ Composite Index | 100.00 | 98.20 | 113.82 | 157.44 | 178.53 | 188.75 | ||||||||||||||||||
Calculated by the Company usingwww.yahoo.com/finance historical prices
| (1) | The above graph assumes a $100 investment on December 31, |
| (2) | The Russell 2000 Index is composed of the smallest 2,000 companies in the Russell 3,000 Index. The Company has been unable to identify a peer group of companies that engage in testing of drugs of abuse, except for large pharmaceutical companies where such business is insignificant to such companies’ other lines of businesses. The Company therefore uses in its proxy statements a peer index based on market capitalization. |
| (3) | The NASDAQ Composite Index includes companies whose shares are traded on the NASDAQ Stock |
The selected financial data presented below is derived from our financial statements and should be read in connection with those statements.
| As of and for the Years Ended December 31, | ||||||||||||||||||||
| 2015 | 2014 | 2013 | 2012 | 2011 | ||||||||||||||||
| (In Thousands, Except for per Share Data) | ||||||||||||||||||||
| Revenue | $ | 26,975 | $ | 29,205 | $ | 26,870 | $ | 25,224 | $ | 24,090 | ||||||||||
| Gross profit | 12,717 | 15,138 | 15,394 | 14,252 | 14,473 | |||||||||||||||
| Income from operations | 1,471 | 4,690 | 5,706 | 4,936 | 5,800 | |||||||||||||||
| Net income | 1,511 | 3,206 | 3,805 | 2,980 | 3,489 | |||||||||||||||
| Total assets | 22,363 | 24,078 | 16,550 | 14,121 | 13,801 | |||||||||||||||
| Working capital | 4,892 | 6,980 | 6,998 | 7,491 | 9,217 | |||||||||||||||
| Shareholders’ equity | 11,674 | 12,837 | 12,277 | 11,223 | 11,035 | |||||||||||||||
| Basic net income per share | 0.28 | 0.60 | 0.72 | 0.57 | 0.67 | |||||||||||||||
| Diluted net income per share | 0.28 | 0.60 | 0.72 | 0.57 | 0.67 | |||||||||||||||
| Cash dividends declared per common share | 0.60 | 0.60 | 0.60 | 0.60 | 0.48 | |||||||||||||||
| As of and for the Years Ended December 31, | ||||||||||||||||
| 2013 | 2012 | 2011 | 2010 | 2009 | ||||||||||||
| (In Thousands, Except for per Share Data) | ||||||||||||||||
| Revenue | $ | 26,870 | $ | 25,224 | $ | 24,090 | $ | 20,109 | $ | 16,955 | ||||||
| Gross profit | 15,394 | 14,252 | 14,473 | 12,042 | 9,610 | |||||||||||
| Income from operations | 5,706 | 4,936 | 5,800 | 4,414 | 2,584 | |||||||||||
| Net income | 3,805 | 2,980 | 3,489 | 2,614 | 1,527 | |||||||||||
| Basic net income per share | 0.72 | 0.57 | 0.67 | 0.50 | 0.29 | |||||||||||
| Diluted net income per share | 0.72 | 0.57 | 0.67 | 0.50 | 0.29 | |||||||||||
| Total assets | 16,550 | 14,121 | 13,801 | 11,766 | 10,602 | |||||||||||
| Working capital | 6,998 | 7,491 | 9,217 | 8,566 | 8,471 | |||||||||||
| Shareholders’ equity | 12,277 | 11,223 | 11,035 | 9,748 | 9,294 | |||||||||||
| Basic net income per share | 0.72 | 0.57 | 0.67 | 0.50 | 0.29 | |||||||||||
| Diluted net income per share | 0.72 | 0.57 | 0.67 | 0.50 | 0.29 | |||||||||||
| Cash dividends declared per common share | 0.60 | 0.60 | 0.48 | 0.48 | 0.53 | |||||||||||
The Management’s Discussion and Analysis of Financial Condition and Results of Operations should be read together with the more detailed business information and financial statements and related notes that appear elsewhere in this annual report on Form 10-K. This annual report may contain certain “forward-looking” information within the meaning of the Private Securities Litigation Reform Act of 1995. This information involves risks and uncertainties. Actual results may differ materially from the results discussed in the forward-looking statements. Factors that might cause such a difference include, but are not limited to, those discussed in “Item 1A — Risk Factors.”
Overview
Psychemedics Corporation is the world’s largest provider of hair testing for drugs of abuse, utilizing a patented hair analysis method involvingdigestion of hair, enzyme immunoassay technology and confirmation by mass spectrometry to analyze human hair to detect abused substances. The Company’s customers include Fortune 500 companies, as well as small to mid-size corporations, schools and governmental entities located in the United States and internationally. During the year ended December 31, 2013,2015, the Company generated $26.9$27.0 million in revenue, while maintaining a gross margin of 57%47% and pre-tax margins of 22%5%. The Company received $710 thousand of R&D tax credits in 2015, of which $479 thousand related to prior years. At December 31, 2013,2015, the Company had $4.0$2.7 million of cash, and cash equivalents.cash. During 2013,2015, the Company had operating cash flow of $6.0$4.6 million and it distributed approximately $3.2 million or $0.60 per share of cash dividends to its shareholders. In addition, the Company spent approximately $1.8 million on equipment, leasehold improvements and software development which was partially financed with a loan of $1.0 million. To date, the Company has paid sixty-nineseventy-seven consecutive quarterly cash dividends.
The following table sets forth, for the periods indicated, the selected statements of operations data as a percentage of total revenue:
| Year Ended December 31, | |||||||||
| 2013 | 2012 | 2011 | |||||||
| Revenue | 100.0 | % | 100.0 | % | 100.0 | % | |||
| Cost of revenue | 42.7 | % | 43.5 | % | 39.9 | % | |||
| Gross profit | 57.3 | % | 56.5 | % | 60.1 | % | |||
| Operating expenses: | |||||||||
| General and administrative | 15.5 | % | 15.6 | % | 16.4 | % | |||
| Marketing and selling | 17.5 | % | 18.0 | % | 17.1 | % | |||
| Research and development | 3.1 | % | 3.3 | % | 2.5 | % | |||
| Total operating expenses | 36.1 | % | 36.9 | % | 36.0 | % | |||
| Operating income | 21.2 | % | 19.6 | % | 24.1 | % | |||
| Other income | |||||||||
| Other income | 0.4 | % | 0.0 | % | 0.0 | % | |||
| Total other income | 0.4 | % | 0.0 | % | 0.0 | % | |||
| Income before taxes | 21.6 | % | 19.6 | % | 24.1 | % | |||
| Provision for income taxes | 7.4 | % | 7.8 | % | 9.6 | % | |||
| Net income | 14.2 | % | 11.8 | % | 14.5 | % | |||
| Year Ended December 31, | ||||||||||||
| 2015 | 2014 | 2013 | ||||||||||
| Revenue | 100.0 | % | 100.0 | % | 100.0 | % | ||||||
| Cost of revenue | 52.9 | % | 48.2 | % | 42.7 | % | ||||||
| Gross profit | 47.1 | % | 51.8 | % | 57.3 | % | ||||||
| Operating expenses: | ||||||||||||
| General and administrative | 16.9 | % | 15.3 | % | 15.5 | % | ||||||
| Marketing and selling | 18.7 | % | 15.8 | % | 17.5 | % | ||||||
| Research and development | 6.0 | % | 4.6 | % | 3.1 | % | ||||||
| Total operating expenses | 41.6 | % | 35.7 | % | 36.1 | % | ||||||
| Operating income | 5.5 | % | 16.1 | % | 21.2 | % | ||||||
| Other income (expense) | -0.5 | % | -0.2 | % | 0.4 | % | ||||||
| Income before taxes | 5.0 | % | 15.9 | % | 21.6 | % | ||||||
| Provision for income taxes | -0.6 | % | 4.9 | % | 7.4 | % | ||||||
| Net income | 5.6 | % | 11.0 | % | 14.2 | % | ||||||
Results for the Year Ended December 31, 20132015 Compared to Results for the Year Ended December 31, 2012
Revenue decreased $2.2 million or 8% to $27.0 million in 2015 compared to $29.2 million in 2014. This decrease was due to a decrease in volume from both existing customers and from new customers. Volume was negatively impacted by the price of oil and other economic factors which reduced hiring, and consequently testing, with our customer base. Average revenue per sample was unchanged from 2014 to 2015.
Gross profit decreased $2.4 million to $12.7 million in 2015 compared to $15.1 million in 2014. Direct costs increased by $192 thousand from 2014 to 2015. The capacity expansion costs within cost of sales was approximately $1.4 million and included; $0.4 million for hiring and training of additional personnel and $1.0 million for building related costs. The gross profit margin decreased from 52% in 2014 to 47% in 2015.
General and administrative (“G&A”) expenses were $4.6 million in 2015 compared to $4.5 million in 2014, an increase of 2%. As a percentage of revenue, G&A expenses were 16.9% and 15.3% for 2015 and 2014, respectively.
Marketing and selling expenses were $5.1 million in 2015 compared to $4.6 million in 2014, an increase of 9%. The increase was driven by spending on information technology projects supporting the sales function. Total marketing and selling expenses represented 18.7% and 15.8% of revenue for 2015 and 2014, respectively.
12
Revenue
Research and development (“R&D”)expenses were $1.6 million in 2015 compared to $1.3 million in 2014, an increase of 21%. R&D expenses increased $1.7from additional personnel and supplies used to develop new tests for drugs of abuse as well as process improvements. R&D expenses represented 6.0% and 4.6% of revenue for 2015 and 2014, respectively.
Other income (expense) represented $125 thousand of other expenses for 2015 compared to $57 thousand of other income for 2014. The other expense primarily consists of interest expense related to long term debt.
During the year ended December 31, 2015, the Company recorded a tax benefit of $164 thousand, representing an effective tax rate of (12.2%). The tax rate for 2015 was affected by additional R&D tax credits related to information technology development projects. The Company recognized $479 thousand of R&D tax credits related to these projects for prior years. Without the prior year credits, the 2015 tax rate would have been 23.3%. During the year ended December 31, 2014, the Company recorded a tax provision of $1.4 million, representing an effective tax rate of 30.8%. We expect the tax rate to range from 32% to 34% for the foreseeable future.
Results for the Year Ended December 31, 2014 Compared to Results for the Year Ended December 31, 2013
Revenue increased $2.3 million or 7%9% to $29.2 million in 2014 compared to $26.9 million in 2013 compared to $25.2 million in 2012.2013. This increase was due to an increase in volume from new and existing clients.The increase in volume was primarily driven by new customers which is a result of our recently expanded sales force and several sales initiatives. Average revenue per sample decreased 2%remained the same between 20132014 and 2012.The revenue per sample decrease was driven primarily from by the mix of customers, with a larger percentage of the business coming from lower priced customers.
Gross profit increased $1.1 decreased $256 thousand to $15.1 million in 2014 compared to $15.4 million in 2013 compared to $14.3 million in 2012.2013. Direct costs increased by 5%23% from 20122013 to 2013,2014, driven by the Company’s capacity expansion project and higher volume. The capacity expansion costs within cost of sales was approximately $1.3 million and included; $0.5 million for hiring and training of additional personnel, $0.5 million for building related costs, and $0.3 million for information technology and other one-time project costs. The gross profit margin remained the same atdecreased from 57% in 2013 and 2012.
General and administrative (“G&A”) expenses were $4.5 million in 2014 compared to $4.2 million in 2013, compared to $3.9 in 2012, an increase of 5%8%. In 2014, G&A costs included approximately $0.2 million related to the Company’s capacity expansion project. As a percentage of revenue, G&A expenses were 15.3% and 15.5% for 2014 and 15.6% for 2013, and 2012, respectively.
Marketing and selling expenses were $4.6 million in 2014, compared to $4.7 million in 2013, compared to $4.5 million in 2012, an increasea decrease of 4%2%. Total marketing and selling expenses represented 17.5%15.8% and 18.0%17.5% of revenue for 2014 and 2013, and 2012, respectively.
Research and development (“R&D”)expenses were $1.3 million in 2014 compared to $0.8 million in 20132013. R&D expenses increased from additional personnel and 2012.supplies used to develop new tests for drugs of abuse as well as process improvements. R&D expenses represented 3.1%4.6% and 3.3%3.1% of revenue for 2014 and 2013, and 2012, respectively.
Other income (expense) increased approximately $90 represented $57 thousand of other expenses for 2014 compared to approximately $92 thousand of other income for 2013. The expense in 2014 was driven by interest expense related to long term debt incurred in 2014, while the income in 2013 compared to $2 thousand for 2012. The increase was from anrepresented a one- time insurance reimbursement of legal expenses.
During the year ended December 31, 2014, the Company recorded a tax provision of $1.4 million, representing an effective tax rate of 30.8%. During the year ended December 31, 2013, the Company recorded a tax provision of $2.0 million, representing an effective tax rate of 34.4%. During the year ended December 31, 2012, the Company recorded a tax provision of $2.0 million, representing an effective tax rate of 39.7%. The change in tax rate was driven by R&D tax credits from higher R&D spending and from a new allocation method for calculating income tax in California. This new calculation requires income tax to be paid only on the sales made within California. The old method taxed all income produced in California and as the Company has only one laboratory, which is located in California, 100% of the income had been subject to California income tax. The rate also benefited from an R&D tax credit from 2012 which was recognized in 2013. We expect the tax rate to be approximately 34% for the foreseeable future.
Liquidity and Capital Resources
At December 31, 2013,2015, the Company had $4.0$2.7 million of cash, and cash equivalents, compared to $3.1$3.6 million at December 31, 2012.2014. The Company’s operating activities generated net cash of $4.6 million in 2015, $4.5 million in 2014 and $6.0 million in 2013, $3.1 million in 2012 and $3.9 million in 2011.2013. Investing activities used $1.8 million in 2013, used $2.32015, $7.8 million in 20122014 and generated $0.5$1.8 million in 2011.2013. Financing activities used $3.7 million in 2015, generated $3.0 million in 2014 and used $3.3 million in 2013,2013.
Operating cash flow of $4.6 million in 2015 primarily reflected net income of $1.5 million adjusted for depreciation and amortization of $1.7 million, stock compensation expense of $0.7 million, and an increase in net deferred tax liabilities of $0.1 million. This was affected by the following changes in assets and liabilities: a decrease in accounts receivable of $0.5 million, a decrease in accounts payable of $0.1 million, a decrease in accrued expenses of $0.5 million, and a decrease in prepaid expenses (and other current assets) of $0.6 million. While the operating cash flow was $0.1 million greater than in 2014, the net income was down $1.7 million. This was offset by a decrease in income tax receivable of $1.0 million which reduced the current tax due and an increase in depreciation and amortization of $0.7 million due to new equipment and leasehold improvements.
Operating cash flow of $4.5 million in 2014 primarily reflected net income of $3.2 million adjusted for depreciation and amortization of $1.1 million, stock compensation expense of $0.6 million, and an increase in 2012net deferred tax liabilities of $1.4 million. This was affected by the following changes in assets and $2.6liabilities: a decrease in accounts receivable of $0.3 million, an increase in 2011.accounts payable of $0.3 million, a decrease in accrued expenses of $1.2 million, and an increase in prepaid expenses (and other current assets) of $1.2 million. The decrease in accrued expenses was driven by a $1.2 million reduction in the liability for equipment purchases which were paid for in 2014. The change in deferred tax liabilities and other current assets was driven by bonus depreciation on new assets purchased as part of the tax extender bill passed in December 2014.
Operating cash flow of $6.0 million in 2013 primarily reflected net income of $3.8 million adjusted for depreciation and amortization of $0.9 million, stock compensation expense of $0.5 million, and an increase in net deferred tax liabilities of $0.4 million. This was affected by the following changes in assets and liabilities: a decrease in accounts receivable of $0.3 million, a decrease in accounts payable of $0.2 million, a decrease in accrued expenses of $0.1 million, and a decrease in prepaid expenses (and other current assets) of $0.4 million. The increase in operating cash flow of $2.9 million over 2012 was primarily driven by higher net income and a reduction of income tax receivable. Operating cash flow of $3.1 million in 2012 primarily reflected net income of $3.0 million adjusted for depreciation and amortization of $0.6 million, stock compensation expense of $0.5 million, and an increase in net deferred tax liabilities of $0.4 million. This was affected by the following changes in assets and liabilities: an increase in accounts receivable of $0.1 million, a decrease in accounts payable of $0.3 million, a decrease in accrued expenses of $0.4 million, and an increase in prepaid expenses (and other current assets) of $0.5 million, Operating cash flow of $3.9 million in 2011 primarily reflected net income of $3.5 million adjusted for depreciation and amortization of $0.4 million, stock compensation expense of $0.4 million, and an increase in net deferred tax liabilities of $0.4 million. This was affected by the following changes in assets and liabilities: an increase in accounts receivable of $0.6 million, an increase in accounts payable of $0.3 million, and an increase in prepaid expenses (and other current assets) of $0.4 million,
Investing cash flow principally reflected the purchase and sale of short-term investments and capital expenditures. During 2013, there was an increase of $0.2 million in other assets which primarily related to patent costs. During 2012, there was an increase of $0.1 million in other assets which primarily related to patent costs. During 2011, the Company redeemed at par short-term investments of $2.0 million. Also in 2011, there was an increase of $0.1 million in other assets which primarily related to patent costs. Capital expenditures were $1.8 million, $7.6 million, and $1.5 million $2.2 million,in 2015, 2014 and $1.4 million in 2013, 2012 and 2011, respectively. TheIn 2015, the expenditures related principally to newlaboratory equipment, andcomputer equipment, new software, including laboratory and computer equipment.
During 20132015, 2014 and 2012,2013, the Company did not repurchase any shares of common stock for treasury. During 2011, the Company repurchased 2,785 shares of common stock for treasury. The Company has authorized 750,000 shares for repurchase since June of 1998, of which 250,000 shares of common stock were authorized in March of 2008 for repurchase. Since 1998, a total of 550,684 shares have been repurchased. The Company also distributed $3.2 million $3.2 million, and $2.5 million of cash dividends to its shareholders in 2013, 2012,2015, 2014 and 2011 respectively.
At December 31, 2013,2015, the Company’s principal sources of liquidity included approximately $4.0$2.7 million of cash and cash equivalents.$700 thousand of available credit under its equipment financing arrangement. See Note 10 – Debt and Other Financing to the Financial Statements for further detail on the equipment financing arrangement. Management currently believes that such funds, together with future operating profits, should be adequate to fund anticipated working capital requirements, including debt obligations, and capital expenditures in the near term. Depending upon the Company’s results of operations, its future capital needs and available marketing opportunities, the Company may use various financing sources to raise additional funds. Such sources could include, joint ventures, issuance of common stock or debt financing, lines of credit, or equipment leasing, although there is no assurance that such financings will be available to the Company on terms it deems acceptable, if at all. At December 31, 2013, the Company had no long-term debt.
The Company has paid dividends over the past sixty-nineseventy-seven quarters. It most recently declared a dividend in February 20142016 which will be paid in March 20142016 in the amount of $798,053.$813 thousand. The Company’s current intention is to continue to declare dividends to the extent funds are available and not required for operating purposes or capital requirements, and only then, upon approval by the Board of Directors. There can be no assurance that in the future the Company will declare dividends.
Contractual obligations as of December 31, 20132015 were as follows:
| Payments Due by Period | ||||||||||||||||
| Contractual Obligation | Less Than 1 Year | 1 – 3 Years | 4 – 5 Years | Greater Than 5 Years | Total | |||||||||||
| (Amounts in Thousands) | ||||||||||||||||
| Operating leases | $ | 609 | $ | 575 | $ | — | $ | — | $ | 1,184 | ||||||
| Payments Due by Period | ||||||||||||||||||||
| Contractual Obligation | Less Than 1 Year | 1 – 3 Years | 4 – 5 Years | Greater Than 5 Years | Total | |||||||||||||||
| (Amounts in Thousands) | ||||||||||||||||||||
| Operating leases | $ | 889 | $ | 993 | $ | 763 | $ | — | $ | 2,645 | ||||||||||
| Loan Obligations | $ | 1,620 | $ | 3,239 | $ | 1,033 | $ | — | $ | 5,892 | ||||||||||
| Total | $ | 2,509 | $ | 4,232 | $ | 1,795 | $ | — | $ | 8,537 | ||||||||||
Purchase Commitment
Operating leases consist of rent obligations for the company’s facilities. The Company has no significant contractual obligation for supply agreements as of December 31, 2013.
Significant Customers
The Company did not have any individual customers that exceeded 10% of revenue for the years ended December 31, 2013, 20122015, 2014 and 2011 or2013. The Company had one customer that accounted for 11% of the total accounts receivable balance as of December 31, 2013, 2012 and 2011.
Critical Accounting Policies
The Company’s significant accounting policies are described in Note 2 to the financial statements included in Item 8 of this Form 10-K. Management believes the most critical accounting policies are as follows:
Revenue Recognition
The Company is in the business of performing drug testing and reporting the results thereof. The Company’s drug testing services include training for collection of samples and storage of positive samples for its customers for an agreed-upon fee per unit tested of samples. The revenues are recognized when the predominant deliverable, drug testing, is provided and reported to the customer.
The Company recognizes revenue in accordance with Accounting Standards Codification “ASC” 605, “Revenue Recognition .”.” In accordance with ASC 605, the Company considers testing, training and storage elements as one unit of accounting for revenue recognition purposes, as the training and storage costs are de minimis and do not have stand-alone value to the customer. The Company recognizes revenue as the service is performed and reported to the customer, since the predominant deliverable in each arrangement is the testing of the units.
The Company also provides expert testimony, when and if necessary, to support the results of the tests, which is generally billed separately and recognized as the services are provided.
Estimates
Estimates
The preparation of financial statements in conformity with accounting principles generally accepted in the United States requires management to make estimates, including bad debts, long-lived asset lives, income tax valuation and assumptions that affect the reported amounts of assets and liabilities and disclosure of contingent assets and liabilities at the date of the financial statements and the reported amounts of revenues and expenses during the reporting period. Actual results could differ from those estimates.
Capitalized Development Costs
We capitalize costs related to significant software projects developed or obtained for internal use in accordance with U.S. generally accepted accounting standards. Costs incurred during the preliminary project work stage or conceptual stage, such as determining the performance requirements, system requirements and data conversion, are expensed as incurred. Costs incurred in the application development phase, such as coding, testing for new software and upgrades that result in additional functionality, are capitalized and are amortized using the straight-line method over the useful life of the software for 5 years. Costs incurred during the post-implementation/operation stage, including training costs and maintenance costs, are expensed as incurred. We capitalized internally developed software costs of $715,000, $794,000approximately $364 thousand, $403 thousand and $387,000$715 thousand during the years ended December 31, 2013, 20122015, 2014 and 2011,2013, respectively. The software development is for primarily for twothree projects. Determining whether particular costs incurred are more properly attributable to the preliminary or conceptual stage, and thus expensed, or to the application development phase, and thus capitalized and amortized, depends on subjective judgments about the nature of the development work, and our judgments in this regard may differ from those made by other companies. General and administrative costs related to developing or obtaining such software are expensed as incurred.
Allowance for Doubtful Accounts
The allowance for doubtful accounts is based on management’s assessment of the ability to collect amounts owed to it by its customers. Management reviews its accounts receivable aging for doubtful accounts and uses a methodology based on calculating the allowance using a combination of factors including the age of the receivable along with management’s judgment to identify accounts that may not be collectible. The Company routinely assesses the financial strength of its customers and, as a consequence, believes that its accounts receivable credit risk exposure is limited. The Company maintains an allowance for potential credit losses but historically has not experienced any significant losses related to individual customers or groups of customers in any particular industry or geographic area. Bad debt expense has been within management’s expectations.
Income Taxes
The Company accounts for income taxes using the liability method, which requires the Company to recognize a current tax liability or asset for current taxes payable or refundable and a deferred tax liability or asset for the estimated future tax effects of temporary differences between the financial statement and tax reporting bases of assets and liabilities to the extent that they are realizable. Deferred tax expense (benefit) results from the net change in deferred tax assets and liabilities during the year. A deferred tax valuation allowance is required if it is more likely than not that all or a portion of the recorded deferred tax assets will not be realized.
The Company had net deferred tax liabilities in the amount of $1.0$2.5 million at December 31, 2013,2015, which primarily relaterelated to timing differences.
In 2015, the Company had a net tax benefit as a result of R&D tax credits related to information technology projects. This is the first year this benefit was recognized. The benefit from prior years related to these tax credits was $479 thousand. Without the prior year impact, the current year tax rate would have been 23.3%. In 2015, there was $108 thousand of tax credits related to information technology projects. The Company operates within multiple taxing jurisdictions and could be subject to audit in these jurisdictions. These audits may involve complex issues, which may require an extended period of time to resolve. The Company has provided for its estimated taxes payable in the accompanying financial statements. Interest and penalties related to income tax matters are recognized as a general and administrative expense. The Company did not have any unrecognized tax benefits and did not have any interest or penalties accrued as of December 31, 20132015 or 2012.2014. The Company does not expect the unrecognized tax benefits to change significantly over the next twelve months.
The above listing is not intended to be a comprehensive list of all of the Company’s accounting policies. In many cases, the accounting treatment of a particular transaction is specifically dictated by accounting principles generally accepted in the United States, with no need for management’s judgment in their application. There are also areas in which management’s judgment in selecting any available alternative would not produce a materially different result.
Recent Accounting Pronouncements
There were no new accounting pronouncements issued or effective during the fiscal year which have had or are expected to have a material impact on the Financial Statements. See Note 2 – Accounting Policies, to the Financial Statements for further detail on applicable accounting pronouncements that were adopted in 2013.
Not Required.
(a) Financial Statements:
| Page | ||||
| 17 | ||||
| 2014 | 18 | |||
| 2013 | 19 | |||
| 2013 | 20 | |||
| 2013 | 21 | |||
| 22 | ||||
Board of Directors and
Psychemedics Corporation
Acton, Massachusetts:
We have audited the accompanying balance sheets of Psychemedics Corporation (the “Company”) as of December 31, 20132015 and 20122014 and the related statements of income and comprehensive income, shareholders’ equity and cash flows for each of the three years in the period ended December 31, 2013.2015. These financial statements are the responsibility of the Company’s management. Our responsibility is to express an opinion on these financial statements based on our audits.
We conducted our audits in accordance with the standards of the Public Company Accounting Oversight Board (United States). Those standards require that we plan and perform the audit to obtain reasonable assurance about whether the financial statements are free of material misstatement. The Company is not required to have, nor were we engaged to perform, an audit of its internal control over financial reporting. Our auditaudits included consideration of internal control over financial reporting as a basis for designing audit procedures that are appropriate in the circumstances, but not for the purpose of expressing an opinion on the effectiveness of the Company’s internal control over financial reporting. Accordingly, we express no such opinion. An audit also includes examining, on a test basis, evidence supporting the amounts and disclosures in the financial statements, assessing the accounting principles used and significant estimates made by management, as well as evaluating the overall financial statement presentation. We believe that our audits provide a reasonable basis for our opinion.
In our opinion, the financial statements referred to above present fairly, in all material respects, the financial position of the CompanyPsychemedics Corporation at December 31, 20132015 and 20122014 and the results of its operations and its cash flows for each of the three years in the period ended December 31, 2013,2015, in conformity with accounting principles generally accepted in the United States of America.
/s/ BDO USA, LLP
Boston, Massachusetts
February 26, 2016
BALANCE SHEETS
| December 31, | December 31, | ||||||
| 2013 | 2012 | ||||||
| ASSETS | |||||||
| Current Assets: | |||||||
| Cash and cash equivalents | $ | 3,970,512 | $ | 3,065,785 | |||
| Accounts receivable, net of allowance for doubtful accounts of $144,921 in 2013 and $121,583 in 2012 | 4,368,864 | 4,620,768 | |||||
| Prepaid expenses and other current assets | 769,269 | 823,274 | |||||
| Income tax receivable | 554,828 | 854,212 | |||||
| Deferred tax assets | 292,795 | 209,877 | |||||
| Total Current Assets | 9,956,268 | 9,573,916 | |||||
| Property and equipment: | |||||||
| Computer software | 1,958,780 | 1,210,734 | |||||
| Office furniture and equipment | 779,891 | 659,866 | |||||
| Laboratory equipment | 8,047,840 | 6,634,043 | |||||
| Leasehold improvements | 439,414 | 92,371 | |||||
| 11,225,925 | 8,597,014 | ||||||
| Less – accumulated depreciation and amortization | (5,175,722) | (4,395,605) | |||||
| 6,050,203 | 4,201,409 | ||||||
| Other assets | 543,345 | 345,293 | |||||
| Total Assets | $ | 16,549,816 | $ | 14,120,618 | |||
| LIABILITIES AND SHAREHOLDERS' EQUITY | |||||||
| Current Liabilities: | |||||||
| Accounts payable | $ | 510,550 | $ | 669,789 | |||
| Accrued expenses | 2,447,920 | 1,413,541 | |||||
| Total Current Liabilities | 2,958,470 | 2,083,330 | |||||
| Deferred tax liabilities, long-term | 1,314,221 | 814,619 | |||||
| Total Liabilities | 4,272,691 | 2,897,949 | |||||
| Commitments and Contingencies (Note 9) | |||||||
| Shareholders' Equity: | |||||||
| Preferred-stock, $0.005 par value, 872,521 shares authorized, no shares issued or outstanding | — | — | |||||
| Common stock, $0.005 par value; 50,000,000 shares authorized 5,981,896 shares issued in 2013 and 5,940,558 shares issued 2012, 5,313,766 shares outstanding in 2013 and 5,272,428 shares outstanding in 2012 | 29,910 | 29,703 | |||||
| Additional paid-in capital | 28,888,712 | 28,460,764 | |||||
| Less - Treasury stock, at cost, 668,130 shares | (10,081,789) | (10,081,789) | |||||
| Accumulated deficit | (6,559,708) | (7,186,009) | |||||
| Total Shareholders' Equity | 12,277,125 | 11,222,669 | |||||
| Total Liabilities and Shareholders' Equity | $ | 16,549,816 | $ | 14,120,618 | |||
| December 31, | December 31, | |||||||
| 2015 | 2014 | |||||||
| ASSETS | ||||||||
| Current Assets: | ||||||||
| Cash and cash equivalents | $ | 2,689,464 | $ | 3,612,153 | ||||
| Accounts receivable, net of allowance for doubtful accounts of $58,684 in 2015 and $95,525 in 2014 | 3,538,765 | 4,078,133 | ||||||
| Prepaid expenses and other current assets | 1,060,587 | 689,995 | ||||||
| Income tax receivable | 840,122 | 1,819,743 | ||||||
| Deferred tax assets | 327,442 | 376,529 | ||||||
| Total Current Assets | 8,456,380 | 10,576,553 | ||||||
| Property and equipment: | ||||||||
| Computer software | 2,745,214 | 2,361,388 | ||||||
| Office furniture and equipment | 1,209,307 | 1,068,264 | ||||||
| Laboratory equipment | 13,723,760 | 13,297,548 | ||||||
| Leasehold improvements | 2,096,334 | 1,801,482 | ||||||
| 19,774,615 | 18,528,682 | |||||||
| Less – accumulated depreciation and amortization | (6,642,501 | ) | (5,788,551 | ) | ||||
| 13,132,114 | 12,740,131 | |||||||
| Other assets | 774,474 | 761,025 | ||||||
| Total Assets | $ | 22,362,968 | $ | 24,077,709 | ||||
| LIABILITIES AND SHAREHOLDERS' EQUITY | ||||||||
| Current Liabilities: | ||||||||
| Accounts payable | $ | 747,291 | $ | 845,071 | ||||
| Accrued expenses | 1,197,632 | 1,351,333 | ||||||
| Current portion of long-term debt | 1,619,633 | 1,399,925 | ||||||
| Total Current Liabilities | 3,564,556 | 3,596,329 | ||||||
| Long-term debt | 4,272,137 | 4,848,158 | ||||||
| Deferred tax liabilities, long-term | 2,852,745 | 2,796,666 | ||||||
| Total Liabilities | 10,689,438 | 11,241,153 | ||||||
| Commitments and Contingencies (Note 9) | ||||||||
| Shareholders' Equity: | ||||||||
| Preferred stock, $0.005 par value, 872,521 shares authorized, no shares issued or outstanding | — | — | ||||||
| Common stock, $0.005 par value; 50,000,000 shares authorized 6,090,671 shares issued in 2015 and 6,043,191 shares issued 2014, 5,422,541 shares outstanding in 2015 and 5,375,061 shares outstanding in 2014 | 30,453 | 30,216 | ||||||
| Additional paid-in capital | 30,021,604 | 29,454,023 | ||||||
| Less - Treasury stock, at cost, 668,130 shares | (10,081,789 | ) | (10,081,789 | ) | ||||
| Accumulated deficit | (8,296,738 | ) | (6,565,894 | ) | ||||
| Total Shareholders' Equity | 11,673,530 | 12,836,556 | ||||||
| Total Liabilities and Shareholders' Equity | $ | 22,362,968 | $ | 24,077,709 | ||||
The accompanying notes are an integral part of these financial statements.
STATEMENTS OF INCOME AND COMPREHENSIVE INCOME
| Year Ended December 31, | ||||||||||
| 2013 | 2012 | 2011 | ||||||||
| Revenues | $ | 26,870,297 | $ | 25,223,534 | $ | 24,089,608 | ||||
| Cost of revenues | 11,476,263 | 10,971,886 | 9,616,985 | |||||||
| Gross profit | 15,394,034 | 14,251,648 | 14,472,623 | |||||||
| Operating Expenses: | ||||||||||
| General & administrative | 4,157,597 | 3,946,844 | 3,948,706 | |||||||
| Marketing & selling | 4,704,970 | 4,543,598 | 4,116,059 | |||||||
| Research & development | 825,102 | 825,518 | 607,408 | |||||||
| Total Operating Expenses | 9,687,669 | 9,315,960 | 8,672,173 | |||||||
| Operating income | 5,706,365 | 4,935,688 | 5,800,450 | |||||||
| Other income | 92,273 | 1,889 | 5,346 | |||||||
| Net income before provision for income taxes | 5,798,638 | 4,937,577 | 5,805,796 | |||||||
| Provision for income taxes | 1,993,428 | 1,957,948 | 2,316,513 | |||||||
| Net income and comprehensive income | $ | 3,805,210 | $ | 2,979,629 | $ | 3,489,283 | ||||
| Basic net income per share | $ | 0.72 | $ | 0.57 | $ | 0.67 | ||||
| Diluted net income per share | $ | 0.72 | $ | 0.57 | $ | 0.67 | ||||
| Dividends declared per share | $ | 0.60 | $ | 0.60 | $ | 0.48 | ||||
| Weighted average common shares outstanding, basic | 5,299,060 | 5,260,320 | 5,229,646 | |||||||
| Weighted average common shares outstanding, diluted | 5,315,463 | 5,272,542 | 5,235,940 | |||||||
| Common Stock | ||||||||||||||||||||
| $0.005 | Paid-In | Treasury Stock | Accumulated | |||||||||||||||||
| Shares | par Value | Capital | Shares | Cost | Deficit | Total | ||||||||||||||
| BALANCE, December 31, 2010 | 5,877,358 | $ | 29,387 | $ | 27,764,992 | 665,345 | $ | (10,059,398) | $ | (7,987,468) | $ | 9,747,513 | ||||||||
| Shares issued – vested | 26,194 | 131 | (131) | — | — | — | — | |||||||||||||
| Tax withholding related to vested shares from employee stock plans | — | — | (86,992) | — | — | — | (86,992) | |||||||||||||
| Stock compensation expense | — | — | 418,077 | — | — | — | 418,077 | |||||||||||||
| Acquisition of treasury stock | — | — | — | 2,785 | (22,391) | — | (22,391) | |||||||||||||
| Cash dividends declared ($0.48 per share) | — | — | — | — | — | (2,510,861) | (2,510,861) | |||||||||||||
| Net income | — | — | — | — | — | 3,489,283 | 3,489,283 | |||||||||||||
| BALANCE, December 31, 2011 | 5,903,552 | 29,518 | 28,095,946 | 668,130 | (10,081,789) | (7,009,046) | 11,034,629 | |||||||||||||
| Shares issued – vested | 37,006 | 185 | (185) | — | — | — | — | |||||||||||||
| Tax withholding related to vested shares from employee stock plans | — | — | (93,164) | — | — | — | (93,164) | |||||||||||||
| Stock compensation expense | — | — | 458,167 | — | — | — | 458,167 | |||||||||||||
| Cash dividends declared ($0.60 per share) | — | — | — | — | — | (3,156,592) | (3,156,592) | |||||||||||||
| Net income | — | — | — | — | — | 2,979,629 | 2,979,629 | |||||||||||||
| BALANCE, December 31, 2012 | 5,940,558 | 29,703 | 28,460,764 | 668,130 | (10,081,789) | (7,186,009) | 11,222,669 | |||||||||||||
| Shares issued – vested | 36,988 | 185 | (185) | — | — | — | — | |||||||||||||
| Exercise of stock options | 4,350 | 22 | 20,817 | — | — | — | 20,839 | |||||||||||||
| Tax withholding related to vested shares from employee stock plans | — | — | (154,522) | — | — | — | (154,522) | |||||||||||||
| Stock compensation expense | — | — | 538,304 | — | — | — | 538,304 | |||||||||||||
| Excess tax benefit from stock-based compensation plans | — | — | 23,534 | — | — | — | 23,534 | |||||||||||||
| Cash dividends declared ($0.60 per share) | — | — | — | — | — | (3,178,909) | (3,178,909) | |||||||||||||
| Net income | — | — | — | — | — | 3,805,210 | 3,805,210 | |||||||||||||
| BALANCE, December 31, 2013 | 5,981,896 | $ | 29,910 | $ | 28,888,712 | 668,130 | $ | (10,081,789) | $ | (6,559,708) | $ | 12,277,125 | ||||||||
| Year Ended December 31, | ||||||||||
| 2013 | 2012 | 2011 | ||||||||
| Cash flows from operating activities: | ||||||||||
| Net income | $ | 3,805,210 | $ | 2,979,629 | $ | 3,489,283 | ||||
| Adjustments to reconcile net income to net cash provided by operating activities: | ||||||||||
| Depreciation and amortization | 872,171 | 586,968 | 370,020 | |||||||
| Deferred income taxes | 416,684 | 437,720 | 406,853 | |||||||
| Stock compensation expense | 538,304 | 458,167 | 418,077 | |||||||
| Changes in operating assets and liabilities: | ||||||||||
| Accounts receivable | 251,904 | (129,792) | (585,155) | |||||||
| Prepaid expenses, other current assets and income tax receivable | 353,389 | (547,895) | (428,769) | |||||||
| Accounts payable | (159,239) | (292,055) | 262,011 | |||||||
| Accrued expenses | (126,876) | (406,011) | 19,486 | |||||||
| Deferred revenue | — | — | (16,605) | |||||||
| Net cash provided by operating activities | 5,951,547 | 3,086,731 | 3,935,201 | |||||||
| Cash flows from investing activities: | �� | |||||||||
| Maturities of short-term investments | — | — | 2,018,452 | |||||||
| Increase in long-term assets; capitalized patent costs | (226,130) | (121,375) | (130,874) | |||||||
| Purchases of property and equipment and capitalized software development costs | (1,531,632) | (2,214,048) | (1,358,790) | |||||||
| Net cash provided by (used in) investing activities | (1,757,762) | (2,335,423) | 528,788 | |||||||
| Cash flows from financing activities: | ||||||||||
| Dividends paid | (3,178,909) | (3,156,592) | (2,510,861) | |||||||
| Tax withholding related to vested shares from employee stock plans | (110,149) | (93,164) | (86,992) | |||||||
| Acquisition of treasury stock | — | —) | (22,391) | |||||||
| Net cash used in financing activities | (3,289,058) | (3,249,756) | (2,620,244) | |||||||
| Net increase (decrease) in cash and cash equivalents | 904,727 | (2,498,448) | 1,843,745 | |||||||
| Cash and cash equivalents, beginning of year | 3,065,785 | 5,564,233 | 3,720,488 | |||||||
| Cash and cash equivalents, end of year | $ | 3,970,512 | $ | 3,065,785 | $ | 5,564,233 | ||||
| Supplemental disclosures of cash flow information: | ||||||||||
| Cash paid for income taxes | $ | 1,233,000 | $ | 1,715,000 | $ | 2,401,957 | ||||
| Non-cash investing and financing activities: | ||||||||||
| Issuance of restricted stock awards | $ | 185 | $ | 185 | $ | 131 | ||||
| Exercise of stock options | $ | 20,817 | $ | — | $ | — | ||||
| Purchases of equipment through accrued liabilities | $ | 1,161,255 | $ | 497,696 | $ | — | ||||
18
PSYCHEMEDICS CORPORATION
STATEMENTS OF INCOME AND COMPREHENSIVE INCOME
| Year Ended December 31, | ||||||||||||
| 2015 | 2014 | 2013 | ||||||||||
| Revenues | $ | 26,975,406 | $ | 29,204,818 | $ | 26,870,297 | ||||||
| Cost of revenues | 14,258,465 | 14,066,652 | 11,476,263 | |||||||||
| Gross profit | 12,716,941 | 15,138,166 | 15,394,034 | |||||||||
| Operating Expenses: | ||||||||||||
| General & administrative | 4,560,684 | 4,474,654 | 4,157,597 | |||||||||
| Marketing & selling | 5,053,217 | 4,625,375 | 4,704,970 | |||||||||
| Research & development | 1,631,664 | 1,348,496 | 825,102 | |||||||||
| Total Operating Expenses | 11,245,565 | 10,448,525 | 9,687,669 | |||||||||
| Operating income | 1,471,376 | 4,689,641 | 5,706,365 | |||||||||
| Other income (expense) | (124,588 | ) | (56,576 | ) | 92,273 | |||||||
| Net income before provision for income taxes | 1,346,788 | 4,633,065 | 5,798,638 | |||||||||
| (Benefit from) / provision for income taxes | (164,388 | ) | 1,426,984 | 1,993,428 | ||||||||
| Net income and comprehensive income | $ | 1,511,176 | $ | 3,206,081 | $ | 3,805,210 | ||||||
| Basic net income per share | $ | 0.28 | $ | 0.60 | $ | 0.72 | ||||||
| Diluted net income per share | $ | 0.28 | $ | 0.60 | $ | 0.72 | ||||||
| Dividends declared per share | $ | 0.60 | $ | 0.60 | $ | 0.60 | ||||||
| Weighted average common shares outstanding, basic | 5,405,032 | 5,355,367 | 5,299,060 | |||||||||
| Weighted average common shares outstanding, diluted | 5,412,487 | 5,376,998 | 5,315,463 | |||||||||
The accompanying notes are an integral part of these financial statements.
PSYCHEMEDICS CORPORATION
STATEMENTS OF SHAREHOLDERS’ EQUITY
| Common Stock | Treasury Stock | |||||||||||||||||||||||||||
| $0.005 | Paid-In | Accumulated | ||||||||||||||||||||||||||
| Shares | par Value | Capital | Shares | Cost | Deficit | Total | ||||||||||||||||||||||
| BALANCE, December 31, 2012 | 5,940,558 | 29,703 | 28,460,764 | 668,130 | (10,081,789 | ) | (7,186,009 | ) | 11,222,669 | |||||||||||||||||||
| Shares issued – vested | 36,988 | 185 | (185 | ) | — | — | — | — | ||||||||||||||||||||
| Exercise of stock options | 4,350 | 22 | 20,817 | — | — | — | 20,839 | |||||||||||||||||||||
| Tax withholding related to vested shares from employee stock plans | — | — | (154,522 | ) | — | — | — | (154,522 | ) | |||||||||||||||||||
| Stock compensation expense | — | — | 538,304 | — | — | — | 538,304 | |||||||||||||||||||||
| Excess tax benefit from stock-based compensation plans | — | — | 23,534 | — | — | — | 23,534 | |||||||||||||||||||||
| Cash dividends declared ($0.60 per share) | — | — | — | — | — | (3,178,909 | ) | (3,178,909 | ) | |||||||||||||||||||
| Net income | — | — | — | — | — | 3,805,210 | 3,805,210 | |||||||||||||||||||||
| BALANCE, December 31, 2013 | 5,981,896 | 29,910 | 28,888,712 | 668,130 | (10,081,789 | ) | (6,559,708 | ) | 12,277,125 | |||||||||||||||||||
| Shares issued – vested | 52,046 | 260 | (260 | ) | — | — | — | — | ||||||||||||||||||||
| Exercise of stock options | 9,249 | 46 | 32,722 | — | — | — | 32,768 | |||||||||||||||||||||
| Tax withholding related to vested shares from employee stock plans | — | — | (147,378 | ) | — | — | — | (147,378 | ) | |||||||||||||||||||
| Stock compensation expense | — | — | 608,645 | — | — | — | 608,645 | |||||||||||||||||||||
| Excess tax benefit from stock-based compensation plans | — | — | 71,582 | — | — | — | 71,582 | |||||||||||||||||||||
| Cash dividends declared ($0.60 per share) | — | — | — | — | — | (3,212,267 | ) | (3,212,267 | ) | |||||||||||||||||||
| Net income | — | — | — | — | — | 3,206,081 | 3,206,081 | |||||||||||||||||||||
| BALANCE, December 31, 2014 | 6,043,191 | $ | 30,216 | $ | 29,454,023 | 668,130 | $ | (10,081,789 | ) | $ | (6,565,894 | ) | $ | 12,836,556 | ||||||||||||||
| Shares issued – vested | 39,814 | 199 | (199 | ) | — | — | — | — | ||||||||||||||||||||
| Exercise of stock options | 7,666 | 38 | 60,394 | — | — | — | 60,432 | |||||||||||||||||||||
| Tax withholding related to vested shares from employee stock plans | — | — | (226,612 | ) | — | — | — | (226,612 | ) | |||||||||||||||||||
| Stock compensation expense | — | — | 673,855 | — | — | — | 673,855 | |||||||||||||||||||||
| Excess tax benefit from stock-based compensation plans | — | — | 60,143 | — | — | — | 60,143 | |||||||||||||||||||||
| Cash dividends declared ($0.60 per share) | — | — | — | — | — | (3,242,020 | ) | (3,242,020 | ) | |||||||||||||||||||
| Net income | — | — | — | — | — | 1,511,176 | 1,511,176 | |||||||||||||||||||||
| BALANCE, December 31, 2015 | 6,090,671 | $ | 30,453 | $ | 30,021,604 | 668,130 | $ | (10,081,789 | ) | $ | (8,296,738 | ) | $ | 11,673,530 | ||||||||||||||
The accompanying notes are an integral part of these financial statements.
STATEMENTS OF CASH FLOWS
| Year Ended December 31, | ||||||||||||
| 2015 | 2014 | 2013 | ||||||||||
| Cash flows from operating activities: | ||||||||||||
| Net income | $ | 1,511,176 | $ | 3,206,081 | $ | 3,805,210 | ||||||
| Adjustments to reconcile net income to net cash provided by operating activities: | ||||||||||||
| Depreciation and amortization | 1,730,306 | 1,050,281 | 872,171 | |||||||||
| Deferred income taxes | 105,166 | 1,398,711 | 416,684 | |||||||||
| Stock compensation expense | 673,855 | 608,645 | 538,304 | |||||||||
| Changes in operating assets and liabilities: | ||||||||||||
| Accounts receivable | 539,368 | 290,731 | 251,904 | |||||||||
| Prepaid expenses, other current assets and income tax receivable | 609,029 | (1,185,641 | ) | 353,389 | ||||||||
| Accounts payable | (97,780 | ) | 334,521 | (159,239 | ) | |||||||
| Accrued expenses | (491,283 | ) | (1,246,096 | ) | (126,876 | ) | ||||||
| Net cash provided by operating activities | 4,579,837 | 4,457,233 | 5,951,547 | |||||||||
| Cash flows from investing activities: | ||||||||||||
| Increase in long-term assets; capitalized patent costs | (45,573 | ) | (243,704 | ) | (226,130 | ) | ||||||
| Purchases of property and equipment and capitalized software development costs | (1,752,583 | ) | (7,564,676 | ) | (1,531,632 | ) | ||||||
| Net cash used in investing activities | (1,798,156 | ) | (7,808,380 | ) | (1,757,762 | ) | ||||||
| Cash flows from financing activities: | ||||||||||||
| Dividends paid | (3,242,020 | ) | (3,212,267 | ) | (3,178,909 | ) | ||||||
| Proceeds from stock options and tax withholding related to vested shares from employee stock plans | (106,037 | ) | (43,028 | ) | (110,149 | ) | ||||||
| Proceeds from equipment financing | 1,098,539 | 6,999,626 | - | |||||||||
| Payments of equipment financing | (1,454,852 | ) | (751,543 | ) | - | |||||||
| Net cash (used in) provided by financing activities | (3,704,370 | ) | 2,992,788 | (3,289,058 | ) | |||||||
| Net (decrease) increase in cash and cash equivalents | (922,689 | ) | (358,359 | ) | 904,727 | |||||||
| Cash and cash equivalents, beginning of year | 3,612,153 | 3,970,512 | 3,065,785 | |||||||||
| Cash and cash equivalents, end of year | $ | 2,689,464 | $ | 3,612,153 | $ | 3,970,512 | ||||||
| Supplemental disclosures of cash flow information: | ||||||||||||
| Cash paid for income taxes | $ | 39,813 | $ | 1,167,920 | $ | 1,233,000 | ||||||
| Cash paid for interest | $ | 128,250 | $ | 77,046 | $ | - | ||||||
| Non-cash investing and financing activities: | ||||||||||||
| Issuance of restricted stock awards | $ | 199 | $ | 260 | $ | 185 | ||||||
| Exercise of stock options | $ | 60,394 | $ | 32,722 | 20,817 | |||||||
| Purchases of equipment through accrued liabilities | $ | 337,582 | $ | 149,509 | $ | 1,161,255 | ||||||
The accompanying notes are an integral part of these financial statements.
December 31,
1. Nature of Business and Basis of Presentation
Psychemedics Corporation (the “Company”) is the world’s largest provider of hair testing for drugs of abuse, utilizing a patented hair analysis method involvingdigestion of hair, enzyme immunoassay technology and confirmation by mass spectrometry to analyze human hair to detect abused substances. The Company’s customers include Fortune 500 companies, as well as small to mid-size corporations, schools and governmental entities located in the United States and internationally.
2. Summary of Significant Accounting Policies
Risks and Uncertainties
The Company is subject to a number of risks and uncertainties similar to those of other companies, such as those associated with the continued expansion of the Company’s sales and marketing network, technological developments, intellectual property protection, development of markets for new products and services offered by the Company, the economic health of principal customers of the Company, financial and operational risks associated with possible expansion of testing facilities used by the Company, government regulation (including, but not limited to, Food and Drug Administration regulations, Brazilian laws, proposed laws and regulations, and delays in implementation of laws and regulations), competition and general economic conditions.
Estimates
Estimates
The preparation of financial statements in conformity with accounting principles generally accepted in the United States requires management to make estimates, including those related to bad debts and income tax valuation, and assumptions that affect the reported amounts of assets and liabilities and disclosure of contingent assets and liabilities at the date of the financial statements and the reported amounts of revenues and expenses during the reporting period. Actual results could differ from those estimates. Changes in estimates are recorded in the period in which they become known.
Cash Equivalents
All highly liquid investments with original maturities of 90 days or less are considered cash equivalents. These consist of cash savings and U.S. government reserve money market accounts at December 31, 2013. While the money market account contains U.S. federal government backed issues, the account itself is not federally insured.savings. As of December 31, 2013, $0.4 million was in U.S. federal government-backed money-market accounts, which is2015 and 2014, there were no investments classified as cash equivalents.
Fair Value Measurements
The Company follows the provisions of Accounting Standards Codification (ASC) 820,Fair Value Measurements and Disclosures (“ASC 820”), which defines fair value, establishes guidelines for measuring fair value and expands disclosures regarding fair value measurements and expands disclosures regarding fair value measurements. Fair value is defined under ASC 820 as the exchange price that would be received for an asset or paid to transfer a liability (an exit price) in the principal or most advantageous market for the asset or liability in an orderly transaction between market participants on the measurement date. Valuation techniques used to measure fair value under ASC 820 must maximize the use of observable inputs and minimize the use of unobservable inputs. The standard describes a fair value hierarchy based on three levels of inputs, of which the first two are considered observable and the last unobservable, that may be used to measure fair value which are the following:
Level 1 – Quoted prices in active markets for identical assets or liabilities.
Level 2 – Inputs other than Level 1 that are observable, either directly or indirectly, such as quoted prices for similar assets or liabilities; quoted prices in markets that are not active; or other inputs that are observable or can be corroborated by observable market data for substantially the full term of the assets or liabilities.
Level 3 – Unobservable inputs that are supported by little or no market activity and that are significant to the fair value
A financial instrument’s level within the fair value hierarchy is based on the lowest level of any input that is significant to the fair value measurement.
Inventory
Inventory
The Company typically expenses consumables such as chemicals, antibodies and tubes as purchased.
PSYCHEMEDICS CORPORATION
NOTES TO FINANCIAL STATEMENTS
December 31,
2. Summary of Significant Accounting Policies – (continued)
Property and Equipment
Property and equipment are stated at cost. Depreciation and amortization are provided over the estimated useful lives of the assets, using the straight-line method. Repair and maintenance costs are expensed as incurred. The estimated useful lives of the assets are as follows:
| Computer software | 3 to 5 years | |
| Office furniture and equipment | 3 to 7 years | |
| Laboratory equipment | 5 to 7 years | |
| Leasehold improvements | Lesser of estimated |
The Company recorded depreciation and amortization related to property and equipment and capitalized software of $844,093, $573,712$1.7 million, $1.0 million, and $362,282$844 thousand in 2015, 2014 and 2013 2012 and 2011 respectively.
Capitalized Software Development Costs
We capitalize costs related to significant software projects developed or obtained for internal use. Costs incurred during the preliminary project work stage or conceptual stage, such as determining the performance requirements, system requirements and data conversion, are expensed as incurred. Costs incurred in the application development phase, such as coding, testing for new software and upgrades that result in additional functionality, are capitalized and are amortized using the straight-line method over the useful life of the software for 5 years. Costs incurred during the post-implementation/operation stage, including training costs and maintenance costs, are expensed as incurred. In accordance with Company policy, during the years ended December 31, 20132015, 2014 and 2012,2013, we capitalized internally developed software costs of $715,000$364 thousand, $403 thousand and $794,000,$715 thousand, respectively. Amortization expense related to software development costs was $145,251, $98,301,$429 thousand, $224 thousand and $8,840$145 thousand in 2013, 2012,2015, 2014, and 2011,2013, respectively. Determining whether particular costs incurred are more properly attributable to the preliminary or conceptual stage, and thus expensed, or to the application development phase, and thus capitalized and amortized, depends on subjective judgments about the nature of the development work, and our judgments in this regard may differ from those made by other companies. General and administrative costs related to developing or obtaining such software areis expensed as incurred.
Other Assets
Other assets primarily consist of capitalized legal costs relating to patent applications. The Company amortizes these costs over the lesser of the legal life or estimated useful life of the patent from the date of grant of the applicable patent. The typical patent life is twenty years. As of December 31, 2013 2012,2015, 2014, and 20112013 the Company had capitalized legal costs relating to outstanding patent applications of $497,857, $299,389,$670 thousand, $656 thousand and $194,704,$498 thousand, respectively. Amortization expense was $28,078, $13,256$32 thousand, $26 thousand, and $7,738$28 thousand in 2013, 2012,2015, 2014 and 2011,2013, respectively. The amount of amortization related to patent applications is expected to remain below $40,000$50 thousand per year for the next five years.
Revenue Recognition
The Company is in the business of performing drug testing services and reporting the results thereof. The Company’s services include, drug testing, training for collection of samples and storage of positive samples for its customers for an agreed-upon fee per unit tested of samples.tested. The revenues are recognized when the predominant deliverable, drug testing, is providedperformed and reported to the customer.
The Company recognizes revenue under ASC 605, “Revenue Recognition” (“ASC 605”). In accordance with ASC 605, the Company considers testing, training and storage elements as one unit of accounting for revenue recognition purposes, as the training and storage costs are de minimis and do not have stand-alone value to the customer. The Company recognizes revenue as the service is performed and reported to the customer, since the predominant deliverable in each arrangement is the testing of the units.
The Company also provides expert testimony, when and if necessary, to support the results of the tests, which is generally billed separately and recognized as the services are provided.
Research and Development Expenses
The Company chargesexpenses all research and development expenses to operationscosts as incurred.
Income Taxes
The Company accounts for income taxes using the liability method pursuant to ASC 740,“Income Taxes”. Under this method, the Company recognizes deferred tax assets and liabilities for the expected tax consequences of temporary differences between the tax bases of assets and liabilities and their reported amounts using enacted tax rates in effect for the year the differences are expected to reverse. The Company evaluates uncertain tax positions annually and considers whether the amounts recorded for income taxes are adequate to address the Company’s tax risk profile. The Company analyzes the potential tax liabilities of specific transactions and tax positions based on management’s judgment as to the expected outcome.
PSYCHEMEDICS CORPORATION
NOTES TO FINANCIAL STATEMENTS
December 31,
2. Summary of Significant Accounting Policies – (continued)
Concentration of Credit Risk and Off-Balance Sheet Risk
The Company has no significant off-balance-sheet risk such as foreign exchange contracts, option contracts, or other foreign hedging arrangements. Financial instruments that potentially subject the Company to concentrations of credit risk are principally cash and cash equivalents, short-term investments and accounts receivable. The Company placesCompany’s policy is to place its cash and cash equivalents and short-term investments in highly ratedhigh quality financial institutions. These include money market accounts holding U.S. federal government reserve securities. While the underlying securities areAt time, these deposits may exceed federally issued, the account itself isinsured limits. The Company does not insured.believe significant credit risk exists with respect to these institutions. Concentration of credit risk with respect to accounts receivable is limited to certain customers to whom the Company makes substantial sales. To reduce risk, the Company routinely assesses the financial strength of its customers and, as a consequence, believes that its accounts receivable credit risk exposure is limited. The Company maintains an allowance for potential credit losses but historically has not experienced any significant losses related to individual customers or groups of customers in any particular industry or geographic area. The Company does not require collateral.
Significant Customers
The Company did not have any individual customers that exceeded 10% of revenue for the years ended December 31, 2013, 20122015, 2014 and 2011 or2013. The Company had one customer that accounted for 11% of the total accounts receivable balance as of December 31, 2013, 2012 and 2011.
Comprehensive Income
The Company’s comprehensive income was the same as its reported net income for the years ended December 31, 2013, 20112015, 2014 and 2010.
Stock-Based Compensation
The Company accounts for equity awards in accordance with ASC 718, “Compensation — Stock CompensationCompensation”(” (”ASC 718”). ASC 718 requires employee equity awards to be accounted for under the fair value method. Accordingly, share-based compensation is measured at the grant date based on the fair value of the award. It also requires the measurement of compensation cost at fair value on the date of grant and recognition of compensation expense over the service period for awards expected to vest. The Company uses the straight-line method to recognize share-based compensation over the service period of the award, which is generally equal to the vesting period.
Under ASC 718, the Company recorded $538,304, $458,167,$674 thousand, $609 thousand and $418,077$538 thousand of stock compensation expense in the accompanying statements of income for the years ended December 31, 2015, 2014 and 2013, 2012 and 2011, respectively.
Stock compensation expense by income statement account is as follows:
| 2013 | 2012 | 2011 | ||||||||
| Cost of revenues | $ | 112,348 | $ | 91,118 | $ | 85,731 | ||||
| General & administrative | 339,098 | 282,375 | 266,915 | |||||||
| Marketing and selling | 77,789 | 81,819 | 65,431 | |||||||
| Research and development | 9,069 | 2,855 | — | |||||||
| Total stock compensation | $ | 538,304 | $ | 458,167 | $ | 418,077 | ||||
| 2015 | 2014 | 2013 | ||||||||||
| Cost of revenues | $ | 100,887 | $ | 114,795 | $ | 112,348 | ||||||
| General & administrative | 433,362 | 372,325 | 339,098 | |||||||||
| Marketing and selling | 107,853 | 103,798 | 77,789 | |||||||||
| Research and development | 31,753 | 17,727 | 9,069 | |||||||||
| Total stock compensation | $ | 673,855 | $ | 608,645 | $ | 538,304 | ||||||
See Note 7 for additional information relating to the Company’s stock plans.
Basic and Diluted Net Income per Share
Basic net income per share is computed by dividing net income available to common shareholders by the weighted average number of common shares outstanding during the period. Diluted net income per share is computed by dividing net income available to common shareholders by the weighted average number of common shares and dilutive common stock equivalents outstanding during the period. The number of dilutive common stock equivalents outstanding during the period has been determined in accordance with the treasury-stock method. Common equivalent shares consist of common stock issuable upon the exercise of outstanding options and the unvested portion of stock unit awards (“SUAs”).
PSYCHEMEDICS CORPORATION
NOTES TO FINANCIAL STATEMENTS
December 31, 20132015
2. Summary of Significant Accounting Policies – (continued)
Basic and diluted weighted average common shares outstanding are as follows:
| 2013 | 2012 | 2011 | |||||
| Weighted average common shares outstanding, basic | 5,299,060 | 5,260,320 | 5,229,646 | ||||
| Dilutive common equivalent shares | 16,403 | 12,222 | 6,294 | ||||
| Weighted average common shares outstanding, assuming dilution | 5,315,463 | 5,272,542 | 5,235,940 |
| 2015 | 2014 | 2013 | ||||||||||
| Weighted average common shares outstanding, basic | 5,405,032 | 5,355,367 | 5,299,060 | |||||||||
| Dilutive common equivalent shares | 7,455 | 21,631 | 16,403 | |||||||||
| Weighted average common shares outstanding, assuming dilution | 5,412,487 | 5,376,998 | 5,315,463 | |||||||||
For the years ended December 31, 2013, 2012,2015 and 2011,2013, options to purchase 80,975 and 152,650,191,597, and264,088 common shares, respectively, were outstanding but not included in the dilutive common equivalent share calculation as their effect would have been anti-dilutive.
Financial Instruments
Financial instruments include cash equivalents and accounts receivable/receivable and accounts payable. Estimated fair values of these financial instruments approximate carrying values due to their short-term nature.
Segment Reporting
The Company manages its operations as one segment, drug testing services. As a result, the financial information disclosed herein materially represents all of the financial information related to the Company’s principal operating segment. Most of the Company’s revenues and all of the Company’s assets are in the United States.
Subsequent Events
The Company evaluated all events and transactions that occurred after December 31, 20132015 through the time of filing with the Securities and Exchange Commission of the Company’s annual report on Form 10-K for the year ended December 31, 2013.2015. On February 10, 2014,2016, the Company declared a quarterly dividend of $0.15$0.15 per share for a total of $798$813 thousand, which will be paid on March 7, 20144, 2016 to shareholders of record on February 21, 2014.
Recent Accounting Pronouncements
In November 2015, the yearFASB issued Accounting Standards Update No 2015-17, Income Taxes - Balance Sheet Classification of Deferred Taxes, that simplifies the presentation of deferred taxes by requiring deferred tax assets and liabilities be classified as noncurrent on the balance sheet. ASU 2015-17 is effective for public companies for annual reporting periods beginning after December 15, 2016, and interim periods within those fiscal years. Early application for public entities is permitted. The amendments can be applied either prospectively to all deferred tax liabilities and assets or retrospectively to all periods presented. We are currently evaluating the Company’sprovisions of ASU 2015-17, but do not expect it to have a material impact on our financial statements.
In May 2014, the FASB issued Accounting Standards Update No. 2014-09, Revenue from Contracts with Customers (ASU 2014-09), which supersedes nearly all existing revenue recognition guidance under U.S. GAAP. The core principle of ASU 2014-09 is to recognize revenues when promised goods or services are transferred to customers in an amount that reflects the consideration to which an entity expects to be entitled for those goods or services. ASU 2014-09 defines a five step process to achieve this core principle and, in doing so, more judgment and estimates may be required within the revenue recognition process than are required under existing U.S. GAAP.
The standard’s implementation date, as amended by ASU 2015-14, is effective for annual periods beginning after December 15, 2017, and interim periods therein, using either of the following transition methods: (i) a full retrospective approach reflecting the application of the standard in each prior reporting period with the option to elect certain practical expedients, or (ii) a retrospective approach with the cumulative effect of initially adopting ASU 2014-09 recognized at the date of adoption (which includes additional footnote disclosures). We are currently evaluating the impact of our pending adoption of ASU 2014-09 on our financial statements and have not yet determined the method by which we will adopt the standard in 2018.
25
PSYCHEMEDICS CORPORATION
NOTES TO FINANCIAL STATEMENTS
December 31, 2015
3. Accounts Receivable
The Company maintains an allowance for uncollectible accounts receivable based on management’s assessment of the collectability of its customer accounts by reviewing customer payment patterns and other relevant factors. The Company reviews the adequacy of the allowance for uncollectible accounts on a quarterly basis and adjusts the balance as determined necessary.Write-offs are recorded at the time a customer account is deemed uncollectable.The following is a rollforward of the Company’s allowance for doubtful accounts:
| 2013 | 2012 | ||||||
| Balance, beginning of period | $ | 121,583 | $ | 169,191 | |||
| Provision for (recoveries of) doubtful accounts | 82,332 | (28,866) | |||||
| Write-offs | (58,994) | (18,742) | |||||
| Balance, end of period | $ | 144,921 | $ | 121,583 | |||
| 2015 | 2014 | |||||||
| Balance, beginning of period | $ | 95,525 | $ | 144,921 | ||||
| Provision for (recoveries of) doubtful accounts | (2,966 | ) | 44,178 | |||||
| Write-offs | (33,875 | ) | (93,574 | ) | ||||
| Balance, end of period | $ | 58,684 | $ | 95,525 | ||||
4. Accrued Expenses
Accrued expenses consist of the following:
| 2013 | 2012 | ||||||
| Accrued payroll and employee benefits | $ | 185,937 | $ | 360,702 | |||
| Accrued bonus expense | 251,700 | 90,000 | |||||
| Accrued vacation expense | 267,080 | 119,703 | |||||
| Accrued hair collection expense | 119,587 | 113,355 | |||||
| Accrued audit and tax consulting | 144,018 | 110,491 | |||||
| Accrued payable for equipment purchases | 1,161,255 | 497,696 | |||||
| Accrued payable for building maintenance | 142,340 | 63,785 | |||||
| Other accrued expenses | 176,003 | 57,809 | |||||
| Total Accrued Expenses | $ | 2,447,920 | $ | 1,413,541 | |||
| 2015 | 2014 | |||||||
| Accrued payroll and employee benefits | $ | 211,978 | $ | 208,252 | ||||
| Accrued bonus expense | 192,113 | 300,008 | ||||||
| Accrued vacation expense | 365,952 | 319,118 | ||||||
| Accrued hair collection expense | 45,681 | 147,787 | ||||||
| Accrued audit and tax consulting | 30,675 | 104,615 | ||||||
| Accrued payable for building maintenance | 138,482 | 85,283 | ||||||
| Other accrued expenses | 212,751 | 186,270 | ||||||
| Total Accrued Expenses | $ | 1,197,632 | $ | 1,351,333 | ||||
5. Income Taxes
The income tax provision consists of the following:
| 2013 | 2012 | 2011 | ||||||||
| Current – | ||||||||||
| Federal | $ | 1,499,400 | $ | 1,196,926 | $ | 1,450,941 | ||||
| State | 77,344 | 323,302 | 458,719 | |||||||
| 1,576,744 | 1,520,228 | 1,909,660 | ||||||||
| Deferred – | ||||||||||
| Federal | 406,116 | 346,974 | 370,710 | |||||||
| State | 10,568 | 90,746 | 36,143 | |||||||
| 416,684 | 437,720 | 406,853 | ||||||||
| Income Tax Provision | $ | 1,993,428 | $ | 1,957,948 | $ | 2,316,513 | ||||
| 2015 | 2014 | 2013 | ||||||||||
| Current – | ||||||||||||
| Federal | $ | (214,297 | ) | $ | 155,602 | $ | 1,499,400 | |||||
| State | (55,258 | ) | (127,329 | ) | 77,344 | |||||||
| (269,555 | ) | 28,273 | 1,576,744 | |||||||||
| Deferred – | ||||||||||||
| Federal | 544,492 | 1,363,093 | 406,116 | |||||||||
| State | (439,325 | ) | 35,618 | 10,568 | ||||||||
| 105,167 | 1,398,711 | 416,684 | ||||||||||
| Income Tax Provision | $ | (164,388 | ) | $ | 1,426,984 | $ | 1,993,428 | |||||
A reconciliation of the effective rate with the federal statutory rate is as follows:
| 2013 | 2012 | 2011 | |||||||
| Federal statutory rate | 34.0 | % | 34.0 | % | 34.0 | % | |||
| State income taxes, net of federal benefit | 1.1 | % | 5.5 | % | 5.6 | % | |||
| Permanent differences | -0.7 | % | 0.1 | % | 0.1 | % | |||
| Stock based compensation | 0.0 | % | 0.0 | % | 0.2 | % | |||
| Effective tax rate | 34.4 | % | 39.6 | % | 39.9 | % |
| 2015 | 2014 | 2013 | ||||||||||
| Federal statutory rate | 34.0 | % | 34.0 | % | 34.0 | % | ||||||
| State income taxes, net of federal benefit | -22.0 | % | 1.1 | % | 1.1 | % | ||||||
| Permanent differences | 1.3 | % | -2.7 | % | 0.6 | % | ||||||
| Stock based compensation | 3.9 | % | 0.0 | % | 0.0 | % | ||||||
| Federal R&D Credits | -29.4 | % | -1.6 | % | -1.3 | % | ||||||
| Effective tax rate | -12.2 | % | 30.8 | % | 34.4 | % | ||||||
The Company had a significant reduction in theCompany’s -12.2% effective state income tax rate from 5.5% to 1.1%. This change was a result of a change in the apportionment methodology in California, where the Company’s primary operation is located. The Company recognized the total impact of this change in the fourth quarter of 2013. The Company expects this to be a permanent rate change. The actual effective rate may change in future periods as the percentage of customers located in California changes in relation to the Company’s total sales. The permanent difference is primarily fromdue to Federal and California research and development (R&D) tax credits. The total benefit recognized from R&D tax credits was $710 thousand in 2015, $208 thousand in 2014 and $75 thousand in 2013, respectively. As of December 31, 2015, there were $95 thousand of Federal tax credit carryforwards from 2015 which have a 20 year carryforward period. As of December 31, 2015, there were $463 thousand of California tax credit carryforwards relating to 2012 to 2015 which have an unlimited carryforward period.
PSYCHEMEDICS CORPORATION
NOTES TO FINANCIAL STATEMENTS
December 31, 2015
The components of the net deferred tax assets included in the accompanying balance sheets are as follows at December 31:
| 2013 | 2012 | ||||||
| Deferred tax assets: | |||||||
| Stock-based compensation | $ | 160,850 | $ | 162,792 | |||
| Allowance for doubtful accounts | 48,578 | 47,959 | |||||
| Accrued expenses | 83,367 | 55,401 | |||||
| $ | 292,795 | $ | 266,152 | ||||
| Deferred tax liabilities: | |||||||
| Prepaid expenses | — | $ | (56,275) | ||||
| Excess of tax over book depreciation and amortization | (1,314,221) | (814,619) | |||||
| (1,314,221) | (870,894) | ||||||
| Net deferred tax liabilities | $ | (1,021,426) | $ | (604,742) | |||
| 2015 | 2014 | |||||||
| Deferred tax assets: | ||||||||
| Stock-based compensation | $ | 127,754 | $ | 168,926 | ||||
| Allowance for doubtful accounts | 20,599 | 33,585 | ||||||
| Accrued expenses | 115,221 | 89,212 | ||||||
| R&D tax credits | 407,705 | 84,806 | ||||||
| $ | 671,279 | $ | 376,529 | |||||
| Deferred tax liabilities: | ||||||||
| Prepaid expenses | (57,697 | ) | (44,565 | ) | ||||
| Excess of tax over book depreciation and amortization | (3,138,885 | ) | (2,752,101 | ) | ||||
| (3,196,582 | ) | (2,796,666 | ) | |||||
| Net deferred tax liabilities | $ | (2,525,303 | ) | $ | (2,420,137 | ) | ||
These amounts are shown net on the balance sheets as follows:
| Deferred tax asset short-term | $ | 292,795 | $ | 209,877 | |||
| Deferred tax liability long-term | (1,314,221) | (814,619) | |||||
| Net deferred tax liabilities | $ | (1,021,426) | $ | (604,742) |
| 2015 | 2014 | |||||||
| Deferred tax asset short-term | $ | 327,442 | $ | 376,529 | ||||
| Deferred tax liability long-term | (2,852,745 | ) | (2,796,666 | ) | ||||
| Net deferred tax liabilities | $ | (2,525,303 | ) | $ | (2,420,137 | ) | ||
ASC 740 contains a two-step approach to recognizing and measuring uncertain tax positions (tax contingencies). The first step is to evaluate the tax position for recognition by determining if the weight of available evidence indicates it is more likely than not that the position will be sustained on an audit, including resolution of related appeals or litigation processes, if any. The second step is to measure the tax benefit as the largest amount which is more than 50% likely of being realized upon ultimate settlement. The Company considers many factors when evaluating and estimating the Company’s tax positions and tax benefits, which may require periodic adjustments and which may not accurately forecast actual outcomes.
The Company operates within multiple taxing jurisdictions and could be subject to audit in these jurisdictions. These audits may involve complex issues, which may require an extended period of time to resolve. The Company has provided for its estimated taxes payable in the accompanying financial statements. Interest and penalties related to income tax matters are recognized as a general and administrative expense. The Company did not have any unrecognized tax benefits and did not have any interest or penalties accrued as of December 31, 20132015 and 2012.2014. The tax years ended December 31, 20102012 through December 31, 20132015 remain subject to examination by all major taxing authorities.
6. Preferred Stock
The Board of Directors has the authority to designate authorized preferred shares in one or more series and to fix the relative rights and preferences without vote or action by the stockholders. The Board of Directors has no present plans to designate or issue any shares of preferred stock.
7. Stock-Based Awards
The 2006 Incentive Plan initially adopted in 2006, and amended and restated in 2011, (the “2006 Incentive Plan”), provides forgrants of options with terms of up to ten years,, grants of restricted stock or stock unit awards (SUAs), issuances of stock bonuses or grants other stock-based awards covering up to500,000 shares of common stock, plus cash based awards, to officers, directors, employees, and consultants.Such shares are issuable out of the Company’s authorized but unissued common stock.As of December 31, 2013,181,5812015, 70,232 shares remained available for future grant under the 2006 Incentive Plan.
The fair value of the SUAs is determined by the closing price on the date of grant. The fair value of options is determined using a Black-Scholes model. The SUAs vest over a period of two to four years and are convertible into an equivalent number of shares of the Company’s common stock provided that the employee receiving the award remains continuously employed throughout the vesting period. The For the options granted in September 2015, the Company accelerated the expense for employees who had reached retirement age as the agreement guaranteed vesting upon reaching retirement age. Otherwise, the Company records compensation expense related to the SUAs and options on a straight-line basis over the vesting term of the SUA.term. Employees are issued shares upon vesting, net of tax withholdings.
PSYCHEMEDICS CORPORATION
NOTES TO FINANCIAL STATEMENTS
December 31,
7. Stock-Based Awards – (continued)
The following table represents all shares granted by the Company under the 2006 Incentive Plan for the last three years:
| Grant Date | Type | Shares | Price (1) | |||||||
| September 15, 2015 | Options | 47,000 | $ | 1.91 | ||||||
| September 15, 2015 | SUA | 1,000 | $ | 10.21 | ||||||
| April 29, 2015 | SUA | 43,950 | $ | 16.10 | ||||||
| May 8, 2014 | SUA | 44,575 | $ | 14.97 | ||||||
| May 23, 2013 | SUA | 56,500 | $ | 11.45 | ||||||
| (1) | The price for the SUA represents the fair value of the award, which was the closing price of the Company’s stock on that date. The price which represents the fair value for options are calculated using the Black-Scholes model. The options granted on September 15,2015 have contractual lives of 10 years, an exercise price of $10.21 per share and become exercisable ratably over 5 years. |
A summary of stock option activity for the Company’s expired stock option plans is as follows:
| Weighted | Weighted | ||||||||||
| Average | Average | ||||||||||
| Exercise | Remaining | Aggregate | |||||||||
| Number of | Price | Contractual | Intrinsic | ||||||||
| Shares | per Share | Life | Value(1) | ||||||||
| Outstanding & exercisable, December 31, 2010 | 289,371 | 13.96 | |||||||||
| Granted | — | — | |||||||||
| Exercised | — | — | |||||||||
| Cancelled | (68,132) | 15.06 | |||||||||
| Outstanding & exercisable, December 31, 2011 | 221,239 | 13.62 | |||||||||
| Granted | — | — | |||||||||
| Exercised | — | — | |||||||||
| Cancelled | (21,401) | 13.61 | |||||||||
| Outstanding & exercisable, December 31, 2012 | 199,838 | 13.62 | |||||||||
| Granted | — | — | |||||||||
| Exercised | (14,988) | 8.58 | $ | 53,636 | |||||||
| Cancelled | (7,900) | 13.75 | |||||||||
| Outstanding & exercisable, December 31, 2013 | 176,950 | $ | 14.04 | 1.2 years | $ | 115,135 | |||||
| Weighted | Weighted | |||||||||||||||
| Average | Average | |||||||||||||||
| Exercise | Remaining | Aggregate | ||||||||||||||
| Number of | Price | Contractual | Intrinsic | |||||||||||||
| Shares | per Share | Life | Value(2) | |||||||||||||
| Outstanding & exercisable, December 31, 2012 | 199,838 | 13.62 | $ | 32,492 | ||||||||||||
| Granted | — | — | ||||||||||||||
| Exercised | (14,988 | ) | 8.58 | $ | 53,636 | |||||||||||
| Cancelled | (7,900 | ) | 13.75 | |||||||||||||
| Outstanding & exercisable, December 31, 2013 | 176,950 | 14.04 | $ | 115,135 | ||||||||||||
| Granted | — | — | ||||||||||||||
| Exercised | (40,900 | ) | 12.84 | $ | 157,897 | |||||||||||
| Cancelled | — | — | ||||||||||||||
| Outstanding & exercisable, December 31, 2014 | 136,050 | $ | 14.40 | $ | 102,038 | |||||||||||
| Granted | — | — | ||||||||||||||
| Exercised (3) | (134,350 | ) | 14.40 | $ | 65,232 | |||||||||||
| Cancelled | (1,700 | ) | — | |||||||||||||
| Outstanding & exercisable, December 31, 2015 | - | $ | - | - | $ | - | ||||||||||
The aggregate intrinsic value on this table was calculated based on the amount, if any, by which the closing market value of the Company’s stock on December 31 |
| (3) | The 134,350 options were exercised on a net basis, resulting in 7,666 shares issued. |
A summary of stock option activity for the Company’s current stock option plans is as follows:
| Weighted | Weighted | |||||||||||||
| Average | Average | |||||||||||||
| Exercise | Remaining | Aggregate | ||||||||||||
| Number of | Price | Contractual | Intrinsic | |||||||||||
| Shares | per Share | Life | Value(4) | |||||||||||
| Outstanding & exercisable, December 31, 2014 | - | $ | - | $ | - | |||||||||
| Granted | 47,000 | 10.21 | ||||||||||||
| Exercised | - | - | ||||||||||||
| Cancelled | - | - | ||||||||||||
| Outstanding & exercisable, December 31, 2015 | 47,000 | $ | 10.21 | 9.7 years | $ | - | ||||||||
| (4) | The aggregate intrinsic value on this table was calculated based on the amount, if any, by which the closing market value of the Company’s stock on December 31, 2015 ($10.14) exceeded the exercise price of any of the underlying options, multiplied by the number of shares subject to each such option. |
| (5) | The fair value of the options using the Black-Scholes model is $1.91 per share. This was calculated using an exercise price of $10.21, 10 year terms with an estimated 6.5 year expiration based on vesting schedule, stock price volatility of 36, interest rate of 2.2% and dividend yield of 6%. |
PSYCHEMEDICS CORPORATION
NOTES TO FINANCIAL STATEMENTS
December 31, 2015
7. Stock-Based Awards – (continued)
A summary of stock unit award activity for the Company is as follows:
| Weighted | ||||||||
| Average | ||||||||
| Remaining | Aggregate | |||||||
| Number of | Contractual | Intrinsic | ||||||
| Shares | Life | Value(2) | ||||||
| Outstanding & Unvested, December 31, 2010 | 94,700 | $ | 776,540 | |||||
| Granted | 59,000 | |||||||
| Converted to common stock* | (34,600) | $ | 355,351 | |||||
| Cancelled | — | |||||||
| Outstanding & Unvested, December 31, 2011 | 119,100 | $ | 1,083,810 | |||||
| Granted | 65,000 | |||||||
| Converted to common stock* | (46,625) | $ | 458,211 | |||||
| Cancelled | — | |||||||
| Outstanding & Unvested, December 31, 2012 | 137,475 | $ | 1,477,856 | |||||
| Granted | 56,500 | |||||||
| Converted to common stock* | (50,350) | $ | 577,321 | |||||
| Cancelled | (4,650) | |||||||
| Outstanding & Unvested, December 31, 2013 | 138,975 | 2.7 years | $ | 2,041,543 | ||||
| Available for grant, December 31, 2013 | 181,581 | |||||||
| Weighted | ||||||||||
| Average | Aggregate | |||||||||
| Number of | Period to | Intrinsic | ||||||||
| Shares | Vest | Value(5) | ||||||||
| Outstanding & Unvested, December 31, 2012 | 137,475 | $ | 1,477,856 | |||||||
| Granted | 56,500 | |||||||||
| Converted to common stock (6) | (50,350 | ) | $ | 577,321 | ||||||
| Cancelled | (4,650 | ) | ||||||||
| Outstanding & Unvested, December 31, 2013 | 138,975 | $ | 2,041,543 | |||||||
| Granted | 44,575 | |||||||||
| Converted to common stock (6) | (61,925 | ) | $ | 922,330 | ||||||
| Cancelled | — | |||||||||
| Outstanding & Unvested, December 31, 2014 | 121,625 | $ | 1,842,619 | |||||||
| Granted | 44,950 | |||||||||
| Converted to common stock (6) | (55,111 | ) | $ | 824,215 | ||||||
| Cancelled | — | |||||||||
| Outstanding & Unvested, December 31, 2015 | 111,464 | 2.7 years | $ | 1,130,245 | ||||||
| Available for grant, December 31, 2015 | 70,232 | |||||||||
The aggregate intrinsic value on this table was calculated based on the closing market price of the Company’s stock. The price at year end was | ||
As of December 31, 2013,2015, a total of497,506 228,696 shares of common stock were reserved for issuance under the various stock plans. As of December 31, 2013,2015, the unamortized fair value of awards relating to SUAs was $1,057,142$1,190,004 to be amortized over a weighted average period of approximately 2.7 years.
8. Employee Benefit Plan
The Psychemedics Corporation 401(k) Savings and Retirement Plan (the 401(k) Plan) is a qualified defined contribution plan in accordance with Section 401(k) of the Internal Revenue Code. All employees over the age of 21 are eligible to make pre-tax contributions up to a specified percentage of their compensation. Under the 401(k) Plan, the Company may, but is not obligated to, match a portion of the employees’ contributions up to a defined maximum. Matching contributions of $141,661, $147,360,$242 thousand, $152 thousand, and $122,961$142 thousand were made in the years ended December 31, 2015, 2014 and 2013, 2012 and 2011, respectively.
PSYCHEMEDICS CORPORATION
NOTES TO FINANCIAL STATEMENTS
December 31, 2015
9. Commitments and Contingencies
Commitments
Commitments
The Company leases certain of its facilities and equipment under operating lease agreements expiring on various dates through April 2016.December 2020. Total minimum lease payments, including scheduled increases, are charged to operations on the straight-line basis over the life of the respective lease. Rent expense was approximately $605,000, $555,000$1.0 million, $908 thousand and $548,000$605 thousand in 2015, 2014 and 2013, 2012 and 2011, respectively.
At December 31, 2013,2015, minimum commitments remaining under lease agreements were approximately as follows:
| Amount (000’s) | ||||
| Years Ending December 31: | ||||
| 2014 | $ | 609 | ||
| 2015 | 550 | |||
| 2016 | 25 | |||
| $ | 1,184 | |||
| Years Ending December 31: | Amount (000’s) | |||
| 2016 | $ | 889 | ||
| 2017 | 579 | |||
| 2018 | 414 | |||
| 2019 | 390 | |||
| 2020 | 373 | |||
| Total | $ | 2,645 | ||
Contingencies
The Company is subject to legal proceedings and claims, which arise in the ordinary course of its business. The Company believes that although there can be no assurance as to the disposition of these proceedings, based upon information available to the Company at this time, the expected outcome of these matters would not have a material impact on the Company’s results of operations or financial condition.
10. Debt and Other Financing Arrangements
On March 20, 2014, the Company entered into an equipment financing arrangement with Banc of America Leasing & Capital, LLC (the “Lender”), which it amended on August 8, 2014 and September 15, 2015, including a Master Loan and Security Agreement and related documentation (collectively the “Equipment Loan Arrangement”) which provided the Company with the ability to finance, at its option, up to $8.8 million of new and used equipment purchases. Each such purchase financed under the Equipment Loan Arrangement is documented by the execution of an equipment note. Each note has a maturity date of 60 months from the applicable loan date, and bears interest at the then current 30-day LIBOR rate + 2.00%. Principal and interest are payable over the 60-month repayment period and principal is repayable without premium or penalty. Borrowings under the Equipment Loan Arrangement are secured by a first priority security interest in the equipment acquired with the proceeds of the equipment notes. Under the Equipment Loan Arrangement, the Company is subject to a maximum quarterly funded debt to EBITDA ratio and a minimum fixed charge coverage ratio. The Company was in compliance with all loan covenants as of December 31, 2015.
Under the Equipment Loan Arrangement, the Company executed notes on March 24, 2014, May 22, 2014, June 13, 2014, August 8, 2014 and September 15, 2015 in the amounts of $1,052,943, $1,935,241, $3,011,816, $999,626 and 1,098,539, respectively, for total borrowings of $8.1 million, of which $1.5 million and $700 thousand was repaid in 2015 and 2014, respectively. The interest rate for these notes for the year ended December 31, 2015 was 2.19%, and represented $128,700 of interest expense. As of December 31, 2015, the interest rate was 2.34%.
The annual principal repayment requirements for debt obligations as of December 31, 2015 are as follows:
| 2016 | $ | 1,619,633 | ||
| 2017 | $ | 1,619,633 | ||
| 2018 | $ | 1,619,633 | ||
| 2019 | $ | 868,090 | ||
| 2020 | $ | 164,781 | ||
| Total long-term debt | $ | 5,891,770 | ||
| Less current portion of long-term debt | $ | (1,619,633 | ) | |
| Total long-term debt, net of current portion | $ | 4,272,137 |
PSYCHEMEDICS CORPORATION
NOTES TO FINANCIAL STATEMENTS
December 31,
11. Selected Quarterly Financial Data (Unaudited)
The following are selected quarterly financial data for the years ended December 31, 20132015 and 2012:2014:
| Quarter Ended (000’s Except Share Amounts) | ||||||||||||||||
| March 31, 2015 | June 30, 2015 | September 30, 2015 | December 31, 2015 | |||||||||||||
| Revenues | $ | 6,756 | $ | 7,001 | $ | 7,084 | $ | 6,134 | ||||||||
| Gross profit | 3,339 | 3,270 | 3,457 | 2,652 | ||||||||||||
| Income from operations | 451 | 356 | 551 | 114 | ||||||||||||
| Net income and comprehensive income | 278 | 252 | 796 | 185 | ||||||||||||
| Basic net income per share | 0.05 | 0.05 | 0.15 | 0.03 | ||||||||||||
| Diluted net income per share | 0.05 | 0.05 | 0.15 | 0.03 | ||||||||||||
| Quarter Ended (000’s Except Share Amounts) | ||||||||||||||||
| March 31, 2014 | June 30, 2014 | September 30, 2014 | December 31, 2014 | |||||||||||||
| Revenues | $ | 7,045 | $ | 7,694 | $ | 7,704 | $ | 6,762 | ||||||||
| Gross profit | 3,796 | 3,891 | 3,970 | 3,482 | ||||||||||||
| Income from operations | 1,168 | 1,320 | 1,244 | 958 | ||||||||||||
| Net income and comprehensive income | 756 | 857 | 917 | 676 | ||||||||||||
| Basic net income per share | 0.14 | 0.16 | 0.17 | 0.13 | ||||||||||||
| Diluted net income per share | 0.14 | 0.16 | 0.17 | 0.13 | ||||||||||||
| Quarter Ended (000’s Except Share Amounts) | |||||||||||||
| March 31, 2013 | June 30, 2013 | September 30, 2013 | December 31, 2013 | ||||||||||
| Revenues | $ | 6,432 | $ | 6,899 | $ | 7,055 | $ | 6,484 | |||||
| Gross profit | 3,487 | 4,079 | 4,176 | 3,652 | |||||||||
| Income from operations | 1,202 | 1,732 | 1,739 | 1,033 | |||||||||
| Net income and comprehensive income | 822 | 1,063 | 1,052 | 868 | |||||||||
| Basic net income per share | 0.16 | 0.20 | 0.20 | 0.16 | |||||||||
| Diluted net income per share | 0.16 | 0.20 | 0.20 | 0.16 | |||||||||
| Quarter Ended (000’s Except Share Amounts) | |||||||||||||
| March 31, 2012 | June 30, 2012 | September 30, 2012 | December 31, 2012 | ||||||||||
| Revenues | $ | 6,244 | $ | 6,862 | $ | 6,460 | $ | 5,658 | |||||
| Gross profit | 3,665 | 4,103 | 3,718 | 2,766 | |||||||||
| Income from operations | 1,377 | 1,664 | 1,431 | 464 | |||||||||
| Net income and comprehensive income | 827 | 1,001 | 879 | 273 | |||||||||
| Basic net income per share | 0.16 | 0.19 | 0.17 | 0.05 | |||||||||
| Diluted net income per share | 0.16 | 0.19 | 0.17 | 0.05 | |||||||||
None.
Disclosure Controls and Procedures
The Company maintains disclosure controls and procedures (as defined in Exchange Act Rules 13a-15(e) and 15d-15(e)) that are designed to ensure that information required to be disclosed in reports filed with the SEC are recorded, processed, summarized and reported within the time period specified by the SEC’s rules and forms and that such information is accumulated and communicated to our management, including to our Chief Executive Officer and our Vice President - Finance, as appropriate, to allow for timely decisions regarding required disclosure.
As required by Rule 13a-15 under the Exchange Act, the Company’s management, with the participation of the Company’s Chief Executive Officer and its Vice President - Finance, has evaluated the effectiveness of its disclosure controls and procedures as of December 31, 2013.2015. Based on this evaluation, our Chief Executive Officer and Vice President - Finance concluded that the Company’s disclosure controls and procedures were effective for ensuring that information required to be disclosed by the Company in the reports that it files or submits under the Securities Exchange Act of 1934 is recorded, processed, summarized and reported within the time periods specified in the SEC’s rules and forms, and that its disclosure controls and procedures were also effective to ensure that information required to be disclosed in the reports that it files or submits under the Exchange Act is accumulated and communicated to management, including the Company’s principal executive and financial officers, to allow timely decisions regarding required disclosure.
Changes in Internal Control Over Financial Reporting
There were no changes in the Company’s internal control over financial reporting that occurred during the Company’s last fiscal quarter that have materially affected, or are reasonably likely to materially affect, the Company’s internal control over financial reporting.
Management’s Report on Internal Control Over Financial Reporting
The Company’s management is responsible for establishing and maintaining adequate internal control over financial reporting (as defined in Rules 13a-15(f) and 15d-15(f) under the Exchange Act). Under the supervision and with the participation of management, including our Chief Executive Officer and Vice President - Finance, the Company conducted an evaluation of the effectiveness of our internal control over financial reporting based on the framework inInternal Control — Integrated Framework issued by the Committee of Sponsoring Organizations of the Treadway Commission.Commission in 1992. Based on the Company’s evaluation under the framework inInternal Control — Integrated Framework , the Company’s management concluded that our internal control over financial reporting was effective as of December 31, 2013.
This annual report does not include an attestation report of our independent registered public accounting firm regarding internal control over financial reporting. Management’s report was not subject to attestation by our registered public accounting firm pursuant to rules of the Securities and Exchange Commission that permit us to provide only management’s report in this annual report.
Inherent Limitations on Effectiveness of Controls
The Company’s management, including its Chief Executive Officer and its Vice President, Finance, does not expect that the Company’s disclosure controls and procedures or the Company’s internal controls will prevent all error and all fraud. A control system, no matter how well conceived and operated, can provide only reasonable, not absolute, assurance that the objectives for the control system are met. Further, the design of a control system must reflect the fact that there are resource constraints, and the benefits of controls must be considered relative to their costs. Because of the inherent limitations in all control systems, no evaluation of controls can provide absolute assurance that all control issues, misstatements, errors and instances of fraud, if any, within our company have been or will be prevented or detected. Further, internal controls may become inadequate as a result of changes in conditions, or through the deteriorations of the degree of compliance with policies or procedures.
None
Following is a list that sets forth as of February 28, 201426, 2016 the names, ages and positions within the Company of all of the Executive Officers of the Company and the Directors of the Company. Each such director has been nominated for reelection at the Company’s 20142015 Annual Meeting, to be held on May 8, 201412, 2016 at 2:00 P.M. at the The Seaport Hotel, 200 Seaport Boulevard, Boston, Massachusetts.
Name | Age | Position | |||
| Raymond C. Kubacki | Chairman, Chief Executive Officer, President, Director | ||||
Neil Lerner James Dyke | 48 51 | Vice President, Finance | |||
Corporate Vice President, Sales & Marketing | |||||
| Michael I. Schaffer, Ph.D. | Vice President, Laboratory Operations | ||||
| Harry Connick | Director, Audit Committee member, Compensation Committee Member, Nominating Committee member | ||||
| Walter S. Tomenson, Jr. | Director, Audit Committee member, Compensation Committee Member, Nominating Committee member | ||||
| A. Clinton Allen | 72 | Director, Audit Committee member, Nominating Committee member | |||
| Fred J. Weinert | Director, Audit Committee member, Compensation Committee Member, Nominating Committee member |
All Directors hold office until the next annual meeting of stockholders or until their successors are elected. Officers serve at the discretion of the Board of Directors.
Mr. Kubacki has been the Company’s President and Chief Executive Officer since 1991. He has also served as Chairman of the Board of the Company since 2003. He is a director of Integrated Environmental Technologies, LTD. From 2007 until 2012, he served as a director of Protection One, Inc. and from 2004 to 2007 he served as a director of Integrated Alarm Services Group, Inc.He is also a trustee of the Center for Excellence in Education based in Washington, D.C. and holds an Executive Masters Professional Director Certification, their highest level award, from the American College of Corporate Directors, a public company director education and credentialing organization. Mr. Kubacki has been a director of the Company since 1991.
Mr. Lerner has served as Vice President, Finance and Treasurer since May 2011. From October 2010 until May 2011, he served as Vice President, Controller. Prior to joining the Company, he served as Director of Operational Accounting at Beacon Roofing Supply, Inc., Corporate Controller with Atlas TMS, Divisional Controller with Mastec, Inc, and multiple financial management roles with Johnson & Johnson, including plant controller in the Netherlands.Johnson. Mr. Lerner is a Certified Public Accountant and has a Masters degree in International Management.
Mr. Dyke joined the Company as Corporate Vice President, Sales and Marketing in 2010. Prior to joining the Company, he held the position of Vice President US Sales and Marketing for Pitney Bowes DMT and worked as a Strategic Sales ConsultantConsultant. Prior to immigrating to the USA from Canada, he held the position of General Manager DMT United Kingdom and held a variety of Vice President of Sales/Sales & MarketingIreland from 2005 to 2007, and VP/General Management positionsManager DMT Canada 2002 to 2005, both with Pitney Bowes Inc. in Canada,Ltd. Since joining the United KingdomCompany, he has served on drug testing industry advisory boards and United States.
Dr. Schaffer has served as Vice President of Laboratory Operations since 1999. From 1990 to 1999, he served as Director of Toxicology, Technical Manager and Responsible Person for the Leesburg, Florida laboratory of SmithKline Beecham Clinical Laboratories. From 1990 to 1999, he was also a member of the Board of Directors of the American Board of Forensic Toxicologists. Dr. Schaffer has beenalso served as an inspector for the Substance Abuse and Mental Health Services Administration’s National Laboratory Certification ProgramCollege of American Pathologists since 1989.
Mr. Connick served as District Attorney for Orleans Parish (New Orleans, LA) from 1974 to 2003. In 2002, Mr. Connick received from Drug Czar, John P. Walters, the Director's Award for Distinguished Service in recognition of exemplary accomplishment and distinguished service in the fight against illegal drugs. Mr. Connick has been a director of the Company since 2003.
Mr. Tomenson is a Senior Advisor to Integro Ltd. Mr. Tomenson was Managing Director and Chairman of Client Development of Marsh, Inc. from 1998 until 2004. From 1993 to 1998, he was chairman of FINPRO, the financial services division of Marsh, Inc. Mr. Tomenson is a Director of the Trinity College School Fund, Inc. He also serves on the Executive Council of the Inner-City Scholarship Fund and holdsan Executive Masters Professional Director Certification, their highest level award, from the American College of Corporate Directors, a public company director education and credentialing organization.organization. Mr. Tomenson has been a director of the Company since 1999.
Mr. Allen is the Founder and President of the American College of Corporate Directors, a public company director education and credentialing organization. Mr. Allen also serves as the Chairman of the Board of Collectors Universe,(CLCT : NASDAQ), a member of the board of Brooks Automation (BRKS : NASDAQ), and is Lead Director of LKQ Corporation (LKQ:NASDAQ), a Fortune 500 Company. Mr. Allen had previously served as Vice-Chairman of the Company from 1990 to 2000 and Chairman from 2000 to 2002. He rejoined the Board as an independent member in 2015.
Mr. Weinert is an entrepreneur whose current activities are concentrated in commercial real estate, newinternational business development and environmental consulting. He has served on the Business Advisory Council for the University of Dayton for over 20 years.years from 1984 until 2005. From 1973 until 1989, Mr. Weinert held various executive positions in the Finance and Operations groups of Waste Management, Inc. and its subsidiaries, including 6 years as the President of Waste Management International, Inc. Mr. Weinert has been a director of the Company since 1991.
The information required by Item 405 of Regulation S-K will be set forth in the Proxy Statement of the Company relating to the 20142015 Annual Meeting of Stockholders to be held on May 8, 201412, 2016 and is incorporated herein by reference.
The Company has a code of ethics that applies to all employees and non-employee directors. This code satisfies the requirements set forth in Item 406 of Regulation S-K and applies to all relevant persons set forth therein. The Company will mail to interested parties a copy of the Code of Ethics upon written request and without charge. Such request shall be made to our General Counsel, 125 Nagog Park, Acton, Massachusetts 01720.
The information required by Item 407 of Regulation S-K will be set forth in the Proxy Statement of the Company relating to the 20142015 Annual Meeting of Stockholders to be held on May 8, 201412, 2016 and is incorporated herein by reference.
The information required by this item will be set forth in the Proxy Statement of the Company relating to the 20142015 Annual Meeting of Stockholders to be held on May 8, 201412, 2016 and is incorporated herein by reference.
Item 12. Security Ownership of Certain Beneficial Owners and Management and Related Stockholder Matters
The information required by this item will be set forth in the Proxy Statement of the Company relating to the 20142015 Annual Meeting of Stockholders to be held on May 8, 201412, 2016 and is incorporated herein by reference.
The information required by this item will be set forth in the Proxy Statement of the Company relating to the 20142015 Annual Meeting of Stockholders to be held on May 8, 201412, 2016 and is incorporated herein by reference.
The information required by this item will be set forth in the Proxy Statement of the Company relating to the 20142015 Annual Meeting of Stockholders to be held on May 8, 201412, 2016 and is incorporated herein by reference.
(a) (1) Financial Statements required by Item 15 are included and indexed in Part II, Item 8
(a) (2) Financial Statement Schedules included in Part IV of this report. Schedule II is omitted because information is included in Notes to Financial Statements. All other schedules under the accounting regulations of the SEC are not required under the related instructions and are inapplicable and, thus have been omitted.
(a) (3) See “Exhibit Index” included elsewhere in this Report.
Pursuant to the requirements of Section 13 or 15(d) of the Securities Exchange Act of 1934, the registrant has duly caused this Report to be signed on its behalf by the undersigned, thereunto duly authorized.
PSYCHEMEDICS CORPORATION | |||
| Date: February 26, 2016 | By: | /s/ RAYMOND C. KUBACKI | |
| Raymond C. Kubacki Chairman, President and Chief Executive Officer | |||
Pursuant to the requirements of the Securities Exchange Act of 1934, this Report has been signed below by the following persons on behalf of the Registrant and in the capacities and on the dates indicated.
| /s/ Raymond C. Kubacki | Chairman, President and Chief Executive Officer, Director | February 26, 2016 | ||
| Raymond C. Kubacki | (Principal Executive Officer) | |||
| /s/ Neil Lerner | Vice President, Finance | February 26, 2016 | ||
| Neil Lerner | (Principal Financial and Accounting Officer) | |||
Harry Connick | ||||
| HARRY CONNICK* | Director | |||
| WALTER S. Walter S. Tomenson, Jr. | Director | |||
| FRED J. Fred J. Weinert | Director |
Number | ||||
| A. CLINTON ALLEN* | Director | |||
| A. Clinton Allen | ||||
| *By: /s/ RAYMOND C. KUBACKI | Attorney-in-Fact | February 26, 2016 | ||
| Raymond C. Kubacki |
EXHIBIT INDEX
| Exhibit Number | Description | |
| 3.1 | Amended and Restated Certificate of Incorporation filed on August 1, 2002 — (Incorporated by reference from the Registrant’s Quarterly Report on Form 10-Q for the Quarter ended September 30, 2002). | |
| 3.2 | Amended and Restated By-Laws of the Company — (Incorporated by reference from the Registrant’s | |
| 4.1 | Specimen Stock Certificate — (Incorporated by reference from the Registrant’s Registration Statement on Form 8-A filed on July 31, 2002). | |
| 10.2.1 | Lease dated October 6, 1992 with Mitchell H. Hersch, et. al with respect to premises in Culver City, California — (Incorporated by reference from the Registrant’s Annual Report on Form 10-KSB for the fiscal year ended December 31, 1992). | |
| 10.2.2 | Security Agreement dated October 6, 1992 with Mitchell H. Hersch et. al — (Incorporated by reference from the Registrant’s Annual Report on Form 10-KSB for the fiscal year ended December 31, 1992). | |
| 10.2.3 | First Amendment to Lease dated with Mitchell H. Hersch, et.al California — (Incorporated by reference from the Registrant’s Annual Report on Form 10-K for the fiscal year ended December 31, 1997). | |
| 10.2.4 | Second Amendment to Lease dated with Mitchell H. Hersch, et.al. California — (Incorporated by reference from the Registrant’s Annual Report on Form 10-K for the fiscal year ended December 31, 1997). | |
| 10.2.5 | Third Amendment to Lease dated December 31, 1997 with Mitchell H. Hersch, et.al. California — (Incorporated by reference from the Registrant’s Annual Report on Form 10-K for the fiscal year ended December 31, 1997). | |
| 10.2.6 | Fourth Amendment to Lease dated May 24, 2005 with Mitchell H. Hersch, et.al. California — (Incorporated by reference from the Registrant’s Annual Report on Form 10-K for the fiscal year ended December 31, 2005). | |
| 10.2.7 | Fifth Amendment to Lease dated November 22, 2011 with Mitchell H. Hersch, et.al. California — (Incorporated by reference from the Registrant’s Annual Report on Form 10-K for the fiscal year ended December 31, 2011). | |
| 10.2.8 | Sixth Amendment to Lease dated October 13, 2015 with Mitchell H. Hersch, et.al. California | |
| 10.3* | 2000 Stock Option Plan, — (Incorporated by reference from the Registrant’s Quarterly Report on Form 10-Q for the Quarter ended September 30, 2002). | |
| 10.4* | ||
| 2006 Incentive Plan, as amended — (Incorporated by reference from the Registrant’s Current Report on Form 8-K filed on May 26, 2011). |
Exhibit Number | Description | |
| Form of Stock Unit Award used with employees and consultants under the 2006 Incentive Plan — (Incorporated by reference from the Registrant’s Current Report on Form 8-K filed on May 26, 2011). | ||
| Form of Stock Unit Award used with non-employee directors under the 2006 Equity Incentive Plan — (Incorporated by reference from the Registrant’s Current Report on Form 8-K filed on May 26, 2011). | ||
| 10.7* | Form of Incentive Stock Option Agreement used with employees under the 2006 Incentive Plan (Incorporated by reference from the Registrant’s Quarterly Report on Form 10-Q for the quarter ended September 30, 2015) | |
| 10.8* | Form of Non Qualified Stock Option Agreement used with employees, non-employee directors and consultants under the 2006 Incentive Plan (Incorporated by reference from the Registrant’s Quarterly Report on Form 10-Q for the quarter ended September 30, 2015) | |
| 10.9* | Form of Stock Unit Award Agreement used with employees, non-employee directors and consultants under the 2006 Incentive Plan (Incorporated by reference from the Registrant’s Quarterly Report on Form 10-Q for the quarter ended September 30, 2015) | |
| 10.10* | Change in control severance agreement with Ray Kubacki dated March 2014. (Incorporated by reference from the Registrant’s Current Report on Form 8-K filed March 8, 2014). | |
| 10.11* | Change in control severance agreement with Michael Schaffer | |
| Employment offer letter dated April 7, 2010 with James V. Dyke (incorporated by reference from Registrant’s Quarterly Report on Form 10-Q for the quarter ended June 30, 2010) | ||
| Change in Control Severance Agreement with James | ||
| Employment offer letter dated October 25, 2010 with Neil Lerner (incorporated by reference from Registrant’s Quarterly Report on Form 10-Q for the year ended December 31, 2010) | ||
| 10.15 | Lease dated March 12, 2015 with Bristol-Culver Associates, LLC and Mountain Organic Farms, LLC with respect to 6100 Bristol parkway premises in Culver City, CA — (Incorporated by reference from the Quarterly Report on Form 10-Q for the quarter ended March 31, 2015) | |
| 10.16 | Loan agreement dated March 20, 2015 with Banc of America Leasing and Capital, LLC — (Incorporated by reference from the Quarterly Report on Form 10-Q for the quarter ended March 31, 2015) | |
| 10.17 | Letter Agreement dated September 15, 2015 with Banc of America Leasing and Capital, LLC, together with Equipment Security Note dated September 15, 2015 and Proposal Letter dated August 19, 2015 — (Incorporated by reference from the Quarterly Report on Form 10-Q for the quarter ended September 30, 2015) | |
| 23.1 | Consent of BDO USA, LLP, Independent Registered Public Accounting Firm | |
| 24 | Power of Attorney | |
| 31.1 | Certification of Chief Executive Officer Pursuant to Section 302 of the Sarbanes-Oxley Act of 2002 | |
| 31.2 | Certification of Vice President - Finance Pursuant to Section 302 of the Sarbanes-Oxley Act of 2002 | |
| 32.1 | Certification of Chief Executive Officer Pursuant to 18 U.S.C. Section 1350 as Adopted Pursuant to Section 906 of the Sarbanes-Oxley Act of 2002 | |
| 32.2 | Certification of Vice President - Finance Pursuant to 18 U.S.C. Section 1350 as Adopted Pursuant to Section 906 of the Sarbanes-Oxley Act of 2002 |
| EX-101.INS | XBRL Instance Document | |
| XBRL Taxonomy Extension Schema | ||
| EX-101.CAL | XBRL Taxonomy Extension Calculation Linkbase | |
| EX-101.DEF | XBRL Taxonomy Extension Definition Linkbase | |
| EX-101.LAB | XBRL Taxonomy Extension Label Linkbase | |
| EX-101.PRE | XBRL Taxonomy Extension Presentation Linkbase |
| * | Management compensation plan or arrangement |