SECURITIES AND EXCHANGE COMMISSION
Washington, D.C. 20549

FORM 10-K
(Mark One)
(Mark One) | |||
☒ | ANNUAL REPORT PURSUANT TO SECTION 13 OR 15(d) OF THE SECURITIES EXCHANGE ACT OF 1934 | ||
For the fiscal year ended January 31, 2015
For the fiscal year ended February 3, 2018
OR
☐ | TRANSITION REPORT PURSUANT TO SECTION 13 OR 15(d) OF THE SECURITIES EXCHANGE ACT OF 1934 | ||
For the transition period from __________ to __________ | |||
Commission File No. 1-10299 | |||
(Exact name of registrant as specified in its charter) | |||

For the transition period from to
Commission File No. 1-10299
![]()
(Exact name of Registrant as specified in its charter)
New York | 13-3513936 | |
(State or other jurisdiction of | (I.R.S. Employer Identification No.) |
incorporation or organization) | ||
330 West 34th Street, New York, New York | 10001 | |
(Address of principal executive offices) | (Zip Code) |
Registrant’s telephone number, including area code: (212) 720-3700
Securities registered pursuant to Section 12(b) of the Act:
Title of each class | Name of each exchange on which registered | |
Common Stock, par value $0.01 | New York Stock Exchange |
Securities registered pursuant to Section 12(g) of the Act: None
Indicate by check mark if the registrant is a well-known seasoned issuer, as defined in Rule 405 of the Securities Act.YesAct. Yesx☒No ☐ Noo
Indicate by check mark if the registrant is not required to file reports pursuant to Section 13 or Section 15(d) of the Act.YesAct. Yes o☐ Nox☒
Indicate by check mark whether the Registrant (1) has filed all reports required to be filed by Section 13 or 15(d) of the Securities Exchange Act of 1934 during the preceding 12 months (or for such shorter period that the Registrant was required to file such reports), and (2) has been subject to such filing requirements for the past 90 days.Yesxdays. Yes ☒ Noo☐
Indicate by check mark whether the Registrant has submitted electronically and posted on its corporate Website, if any, every Interactive Data File required to be submitted and posted pursuant to Rule 405 of Regulation S-T (§232.405 of this chapter) during the preceding 12 months (or for such shorter period that the registrant was required to submit and post such files).Yesx. Yes ☒Noo☐
Indicate by check mark if disclosure of delinquent filers pursuant to Item 405 of Regulation S-K is not contained herein, and will not be contained, to the best of Registrant’s knowledge, in definitive proxy or information statements incorporated by reference in Part III of this Form 10-K or any amendment to this Form 10-K.o☐
Indicate by check mark whether the registrant is a large accelerated filer, an accelerated filer, a non-accelerated filer, or a smaller reporting company, or an emerging growth company. See the definitions of “large accelerated filer,” “accelerated filer,” and “smaller reporting company,” and “emerging growth company” in Rule 12b-2 of the Exchange Act.
Large accelerated filer | Accelerated filer | Non-accelerated filer | Smaller reporting company | ||||
Emerging growth company ☐ |
If an emerging growth company, indicate by check mark if the registrant has elected not to use the extended transition period for complying with any new or revised financial accounting standards pursuant to Section 13(a) of the Exchange Act. ☐
Indicate by check mark whether the registrant is a shell company (as defined in Rule 12b-2 of the Act).Yes. Yes o☐ Nox☒
| The number of shares of the Registrant’s Common Stock, par value $0.01 per share, outstanding at March 16, 2015: | 139,649,989 | |||
| The aggregate market value of voting stock held by non-affiliates of the Registrant computed by reference to the closing price as of the last business day of the Registrant’s most recently completed second fiscal quarter, August 2, 2014, was approximately: | $ | 5,363,852,719 | * | |
The number of shares of the Registrant’s Common Stock, par value $0.01 per share, outstanding as of March 26, 2018: | 118,115,818 | |
The aggregate market value of voting stock held by non-affiliates of the Registrant computed by reference to the closing price as of the last business day of the Registrant’s most recently completed second fiscal quarter, July 29, 2017, was approximately: | $4,504,950,585* |
* | For purposes of this calculation only (a) all directors plus three executive officers and owners of five percent or more of the Registrant are deemed to be affiliates of the Registrant and (b) shares deemed to be “held” by such persons include only outstanding shares of the Registrant’s voting stock with respect to which such persons had, on such date, voting or investment power. |
DOCUMENTS INCORPORATED BY REFERENCE
Portions of the Registrant’s definitive Proxy Statement (the “Proxy Statement”) to be filed in connection with the Annual Meeting of Shareholders to be held on May 20, 2015:23, 2018: Parts III and IV.
PART I | |||||||
Item 1. |
| 1 | |||||
Item 1A. | 1 | ||||||
Item 1B. | 9 | ||||||
Item 2. |
| 9 | |||||
Item 3. | 9 | ||||||
Item 4. | 9 | ||||||
Item 4A. | 10 | ||||||
PART II | |||||||
Item 5. | 11 | ||||||
Item 6. | 13 | ||||||
Item 7. | Management’s Discussion and Analysis of Financial Condition and Results of Operations | 14 | |||||
Item 7A. | 35 | ||||||
Item 8. | 35 | ||||||
Item 9. | Changes in and Disagreements with Accountants on Accounting and Financial Disclosure | 74 | |||||
Item 9A. | 74 | ||||||
Item 9B. | 76 | ||||||
PART III | |||||||
Item 10. | 76 | ||||||
Item 11. | 76 | ||||||
Item 12. | Security Ownership of Certain Beneficial Owners and Management and Related Stockholder Matters | 76 | |||||
Item 13. | Certain Relationships and Related Transactions, and Director Independence | 76 | |||||
Item 14. | 76 | ||||||
PART IV | |||||||
Item 15. | 77 | ||||||
| 78 | |||||||
| 79 | |||||||
PART I
General
Foot Locker, Inc., incorporated under the laws of the State of New York in 1989, is a leading global retailer of athletically inspired shoes and apparel, operating 3,423apparel. As of February 3, 2018, the Company operated 3,310 primarily mall-based stores, as well as stores in high-traffic urban retail areas and high streets, in the United States, Canada, Europe, Australia, and New Zealand as of January 31, 2015.Zealand. Foot Locker, Inc. and its subsidiaries hereafter are referred to as the “Registrant,” “Company,” “we,” “our,” or “us.” Information regarding the business is contained under the “Business Overview” section in “Item 7. Management’s Discussion and Analysis of Financial Condition and Results of Operations.”
The Company maintains a website on the Internet atwww.footlocker-inc.com. The Company’s filings with the U.S. Securities and Exchange Commission (the “SEC”), including its annual reports on Form 10-K, quarterly reports on Form 10-Q, current reports on Form 8-K, and all amendments to those reports are available free of charge through this website as soon as reasonably practicable after they are filed with or furnished to the SEC by clicking on the “SEC Filings” link. The Corporate Governance section of the Company’s corporate website contains the Company’s Corporate Governance Guidelines, Committee Charters, and the Company’s Code of Business Conduct for directors, officers and employees, including the Chief Executive Officer, Chief Financial Officer, and Chief Accounting Officer. Copies of these documents may also be obtained free of charge upon written request to the Company’s Corporate Secretary at 112330 West 34th Street, New York, N.Y. 10120. The Company intends to promptly disclose amendments to the Code of Business Conduct and waivers of the Code for directors and executive officers on the Corporate Governance section of the Company’s corporate website.10001.
Information Regarding Business Segments and Geographic Areas
The financial information concerning business segments, divisions, and geographic areas is contained under the “Business Overview” and “Segment Information” sections in “Item 7. Management’s Discussion and Analysis of Financial Condition and Results of Operations.” Information regarding sales, operating results, and identifiable assets of the Company by business segment and by geographic area is contained under theSegment Information note in “Item 8. Consolidated Financial Statements and Supplementary Data.”
The service marks, trade names, and trademarks appearing in this report (except for Nike, Inc.)Jordan, adidas, and Puma) are owned by Foot Locker, Inc. or its subsidiaries.
Employees
The Company and its consolidated subsidiaries had 14,56715,141 full-time and 30,00134,068 part-time employees at January 31, 2015.as of February 3, 2018. The Company considers employee relations to be satisfactory.
Competition
Financial information concerning competition is contained under the “Business Risk” section in theFinancial Instruments and Risk Management note in “Item 8. Consolidated Financial Statements and Supplementary Data.”
Merchandise Purchases
Financial information concerning merchandise purchases is contained under the “Liquidity” section in “Item 7. Management’s Discussion and Analysis of Financial Condition and Results of Operations” and under the “Business Risk” section in theFinancial Instruments and Risk Management note in “Item 8. Consolidated Financial Statements and Supplementary Data.”
Item 1A. Risk Factors
The statements contained in this Annual Report on Form 10-K (“Annual Report”) that are not historical facts, including, but not limited to, statements regarding our expected financial position, business and financing plans found in “Item 1. Business” and “Item 7. Management’s Discussion and Analysis of Financial Condition and Results of Operations,” constitute “forward-looking statements” within the meaning of the Private Securities Litigation Reform Act of 1995.
1
Please also see “Disclosure Regarding Forward-Looking Statements.” Our actual results may differ materially due to the risks and uncertainties discussed in this Annual Report, including those discussed below. Additional risks and uncertainties that we do not presently know about or that we currently consider to be insignificant may also affect our business operations and financial performance.
Our inability to implement our long-range strategic long range plan may adversely affect our future results.
Our ability to successfully implement and execute our long-range plan is dependent on many factors. Our strategies may require significant capital investment and management attention, which may result in the diversion of these resources from our core business and other business issues and opportunities.attention. Additionally, any new initiative is subject to certain risks including customer acceptance of our products and renovated store designs, competition, product differentiation, and the ability to attract and retain qualified personnel.personnel, and our ability to successfully implement technological initiatives. If we cannot successfully execute our strategic growth initiatives or if the long-range plan does not adequately address the challenges or opportunities we face, our financial condition and results of operations may be adversely affected. Additionally, failure to meet marketshareholder expectations, particularly with respect to sales, operating margins, and earnings per share, would likely result in volatility in the market value of our stock.
The retail athletic footwear and apparel business is highly competitive.
Our athletic footwear and apparel operations compete primarily with athletic footwear specialty stores, sporting goods stores, department stores, discount stores, traditional shoe stores, mass merchandisers, and Internet retailers, many of which are units of national or regional chains that have significant financial and marketing resources. The principal competitive factors in our markets are selection of merchandise, customer experience, reputation, store location, quality, advertising, price, and customer service. Our success also depends on our ability to differentiate ourselves from our competitors with respect to a quality merchandise assortment and superior customer service.price. We cannot assure that we will continue to be able to compete successfully against existing or future competitors. Our expansion into markets served by our competitors, and entry of new competitors or expansion of existing competitors into our markets, could have a material adverse effect on our business, financial condition, and results of operations.
Although we sell an increasing proportion of our merchandise via the Internet, a significantsignificantly faster shift in customer buying patterns to purchasing athletic footwear, athletic apparel, and sporting goods via the Internet could have a material adverse effect on our business results. In addition, all of our significant suppliers operate retail stores and distribute products directly through the Internet and others may follow. Some of our suppliers currently operate retail stores and some have indicated that they intend to open additional retail stores. Should this continue to occur, and if our customers decide to purchase directly from our suppliers, it could have a material adverse effect on our business, financial condition, and results of operations.
The industry in which we operate is dependent upon fashion trends, customer preferences, product innovations, and other fashion-related factors.
The athletic footwear and apparel industry, especially at the premium end of the price spectrum, is subject to changing fashion trends and customer preferences. In addition, retailers in the athletic industry rely on their suppliers to maintain innovation in the products they develop. We cannot guarantee that our merchandise selection will accurately reflect customer preferences when it is offered for sale or that we will be able to identify and respond quickly to fashion changes, particularly given the long lead times for ordering much of our merchandise from suppliers. A substantial portion of our highest margin sales are to young males (ages 12 – 12–25), many of whom we believe purchase athletic footwear and athletic apparel as a fashion statement and are frequent purchasers. Our failure to anticipate, identify or react appropriately in a timely manner to changes in fashion trends that would make athletic footwear or athletic apparel less attractive to theseour customers could have a material adverse effect on our business, financial condition, and results of operations.
If we do not successfully manage our inventory levels, our operating results will be adversely affected.
We must maintain sufficient inventory levels to operate our business successfully. However, we also must guard against accumulating excess inventory. For example, we order most of our athletic footwear four to six months prior to delivery to our stores. If we fail to anticipate accurately either the market for the merchandise in our stores or our customers’ purchasing habits, we may be forced to rely on markdowns or promotional sales to dispose of excess or slow moving inventory, which could have a material adverse effect on our business, financial condition, and results of operations.
2
A change in the relationship with any of our key suppliers or the unavailability of our key products at competitive prices could affect our financial health.
Our business is dependent to a significant degree upon our ability to obtain exclusive product and the ability to purchase brand-name merchandise at competitive prices from a limited number of suppliers. In addition, our suppliers providewe have negotiated volume discounts, cooperative advertising, and markdown allowances with our suppliers, as well as the ability to negotiate returns ofcancel orders and return excess or unneeded merchandise. We cannot be certain that such terms with our suppliers will continue in the future.
The Company
We purchased approximately 8993 percent of itsour merchandise in 20142017 from itsour top five suppliers and expectswe expect to continue to obtain a significant percentage of itsour athletic product from these suppliers in future periods. Approximately 7367 percent of all merchandise purchased in 2017 was purchased from one supplier — Nike, Inc. (“Nike”). Each of our operating divisions is highly dependent on Nike;Nike: they individually purchased 4744 to 8473 percent of their merchandise from Nike.Nike during the year. Merchandise that is high profile and in high demand is allocated by our suppliers based upon their internal criteria. Although we have generally been able to purchase sufficient quantities of this merchandise in the past, we cannot be certain that our suppliers will continue to allocate sufficient amounts of such merchandise to us in the future. Our inability to obtain merchandise in a timely manner from major suppliers (particularly Nike) as a result of business decisions by our suppliers or any disruption in the supply chain could have a material adverse effect on our business, financial condition, and results of operations. Because of our strong dependence onthe high proportion of purchases from Nike, any adverse development in Nike’s reputation, financial condition or results of operations or the inability of Nike to develop and manufacture products that appeal to our target customers could also have an adverse effect on our business, financial condition, and results of operations. We cannot be certain that we will be able to acquire merchandise at competitive prices or on competitive terms in the future. These risks could have a material adverse effect on our business, financial condition, and results of operations.
We depend onare affected by mall traffic and our ability to secure suitable store locations.
Our
Many of our stores, especially in North America, are located primarily in enclosed regional and neighborhood malls. Our sales are dependent,affected, in part, onby the volume of mall traffic. Mall traffic may be adversely affected by, among other factors, economic downturns, the closing or continued decline of anchor department stores and/or specialty stores, and a decline in the popularity of mall shopping among our target customers. Further, any terrorist act, natural disaster, or public health or safety concern that decreases the level of mall traffic, or that affects our ability to open and operate stores in affected areas,such locations, could have a material adverse effect on our business.
To take advantage of customer traffic and the shopping preferences of our customers, we need to maintain or acquire stores in desirable locations such as in regional and neighborhood malls, anchored by major department stores.as well as high-traffic urban retail areas and high streets. We cannot be certain that desirable mall locations will continue to be available at favorable rates. Some traditional enclosed malls are experiencing significantly lower levels of customer traffic, driven by economic conditions as well as the closure of certain mall anchor tenants.
Several large landlords dominate the ownership of prime malls particularly in the United States, Canada, and Australia, and because of our dependence upon these landlords for a substantial number of our locations, any significant erosion of their financial condition or our relationships with these landlords wouldcould negatively affect our ability to obtain and retain store locations. Additionally, further landlord consolidation may negatively affect our ability to negotiate favorable lease terms.
We may experience fluctuations in, and cyclicality of, our comparable-store sales results.
Our comparable-store sales have fluctuated significantly in the past, on both an annual and a quarterly basis, and we expect them to continue to fluctuate in the future. A variety of factors affect our comparable-store sales results, including, among others, fashion trends, product innovation, promotional events, the highly competitive retail sales environment, economic conditions, timing of promotional events,income tax refunds, changes in our merchandise mix, calendar shifts of holiday periods, supply chain disruptions, and weather conditions. Many of our products represent discretionary purchases. Accordingly, customer demand for these products could decline in a recessionan economic downturn or if our customers develop other priorities for their discretionary spending. These risks could have a material adverse effect on our business, financial condition, and results of operations.
3
Economic or political conditions in other countries, including fluctuations in foreign currency exchange rates and tax rates may adversely affect our operations.
A significant portion of our sales and operating income for 20142017 was attributable to our operations in Europe, Canada, Australia, and New Zealand. As a result, our business is subject to the risks associated with doing business outside of the United States such as foreignlocal customer product preferences, political unrest, disruptions or delays in shipments, changes in economic conditions in countries in which we operate, foreign currency fluctuations, real estate costs, and labor and employment practices in non-U.S. jurisdictions that may differ significantly from those that prevail in the United States. In addition, because we and our suppliers havemanufacture a substantial amount of our products manufactured in foreign countries, our ability to obtain sufficient quantities of merchandise on favorable terms may be affected by governmental regulations, trade restrictions, and economic, labor, and other conditions in the countries from which our suppliers obtain their product.
Fluctuations in the value of the euro and the British Pound may affect the value of our European earnings when translated into U.S. dollars. Similarly our earnings in Canada, Australia, and New Zealand may be affected by the value of currencies when translated into U.S. dollars. Our operating results may be adversely affected by significant changesExcept for our business in these foreign currencies relative to the U.S. dollar. For the most part,United Kingdom (the “U.K”), our international subsidiaries transactconduct most of their business in their functional currency, other than in thelocal currency. Inventory purchases for our U.K., whose inventory purchases business are denominated in euro,euros, which could result in foreign currency transaction gains or losses.
Our products are subject to import and excise duties and/or sales or value-added taxes in many jurisdictions. Fluctuations in tax rates and duties and changes in tax legislation or regulation could have a material adverse effect on our results of operations and financial condition.
Significant developments stemming from the U.K.’s decision to withdraw from the European Union could have a material adverse effect on the Company.
The U.K. has voted in favor of leaving the European Union (“E.U.”), and such withdrawal (commonly referred to as “Brexit”) is scheduled to take effect over the next two years. This decision has created political and economic uncertainty, particularly in the U.K. and the E.U., and this uncertainty may last for several years. The pending withdrawal and its possible future consequences have caused and may continue to cause significant volatility in global financial markets, including in global currency and debt markets. This volatility could cause a slowdown in economic activity in the U.K., Europe or globally, which could adversely affect the Company's operating results and growth prospects. In addition, Brexit could lead to legal uncertainty and potentially divergent national laws and regulations as the U.K. determines which E.U. laws to replace or replicate, and those laws and regulations may be cumbersome, difficult or costly in terms of compliance. Any of these effects of Brexit, among others, could adversely affect our business, results of operations and financial condition.
Macroeconomic developments may adversely affect our business.business.
Our performance is subject to global economic conditions and the related impacteffects on consumer spending levels. Continued uncertainty about global economic conditions poses a risk as consumers and businesses may postpone spending in response to tighter credit, unemployment, negative financial news, and/or declines in income or asset values, which could have a material negative effect on demand for our products.
As a retailer that is dependent upon consumer discretionary spending, our results of operations are sensitive to changes in macroeconomic conditions. Our customers may have less money for discretionary purchases as a result of job losses, foreclosures, bankruptcies, increased fuel and energy costs, higher interest rates, higher taxes, reduced access to credit, and lower home prices. There is also a risk that if negative economic conditions persist for a long period of time or worsen, consumers may make long-lasting reductions to their discretionary purchasing behavior. values. These and other economic factors could adversely affect demand for our products, andwhich could adversely affect our financial condition and operating results.
Instability in the financial markets may adversely affect our business.
Any instability
Instability in the global financial markets could result in diminishedreduce availability of credit availability.to our business. Although we currently have a revolving credit agreement in place until January 27, 2017, and other than amounts used for standby letters of credit, do not have any borrowings under it,May 19, 2021, tightening of credit markets could make it more difficult for us to access funds, refinance our existing indebtedness, enter into agreements for new indebtedness, or obtain funding through the issuance of the Company’s securities. Other than insignificant amounts used for standby letters of credit, we do not have any borrowings under our credit facility.
4
We rely on a few key suppliers for a majority of our merchandise purchases (including a significant portion from one key supplier). The inability of these key suppliers to access liquidity, or the insolvency of key suppliers, could lead to their failure to deliver merchandise to us. Our inability to obtain merchandise in a timely manner from major suppliers could have a material adverse effect on our business, financial condition, and results of operations.
Material changes in the market value of the securities we hold may adversely affect our results of operations and financial condition.
At January 31, 2015,February 3, 2018, our cash and cash equivalents totaled $967$849 million. The majority of our investments were short-term deposits in highly-rated banking institutions. As of January 31, 2015, we had $537February 3, 2018, $669 million of our cash and cash equivalents were held in foreign jurisdictions.jurisdictions, almost half of which was held in U.S. dollars. We regularly monitor our counterparty credit risk and mitigate our exposure by making short-term investments only in highly-rated institutions and by limiting the amount we invest in any one institution. We continually monitor the creditworthiness of our counterparties. At January 31, 2015, almostFebruary 3, 2018, all of the investments were in institutions rated A or better from a major creditinvestment grade institutions. Despite an investment grade rating, agency. Despite those ratings, it is possible that the value or liquidity of our investments may decline due to any number of factors, including general market conditions and bank-specific credit issues.
Our U.S. pension plan trust holds assets totaling $613$639 million at January 31, 2015.February 3, 2018. The fair values of these assets held in the trust are compared to the plan’s projected benefit obligation to determine the pension funding liability. We attempt to mitigate funding risk through asset diversification, and we regularly monitor investment risk of our portfolio through quarterly investment portfolio reviews and periodic asset and liability studies. Despite these measures, it is possible that the value of our portfolio may decline in the future due to any number of factors, including general market conditions and credit issues. Such declines could have an impact onaffect the funded status of our pension plan and future funding requirements.
If our long-lived assets, goodwill or other intangible assets become impaired, we may need to record significant non-cash impairment charges.
We review our long-lived assets, goodwill and other intangible assets when events indicate that the carrying value of such assets may be impaired. Goodwill and other indefinite lived intangible assets are reviewed for impairment if impairment indicators arise and, at a minimum, annually. As of January 31, 2015,February 3, 2018, we had $157$160 million of goodwill; this asset is not amortized but is subject to an impairment test, which consists of either a qualitative assessment on a reporting unit level, or a two-step impairment test, if necessary. The determination of impairment losses arecharges is significantly affected by estimates of future operating cash flows and estimates of fair value. Our estimates of future operating cash flows are identified from our long-range strategic long-range plans, which are based upon our experience, knowledge, and expectations; however, these estimates can be affected by factors such factors as our future operating results, future store profitability, and future economic conditions, all of which can be difficult to predict accurately. Any significant deterioration in macroeconomic conditions could affect the fair value of our long-lived assets, goodwill, and other intangible assets and could result in future impairment charges, which would adversely affect our results of operations.
Our financial results may be adversely affected by tax rates or exposure to additional tax liabilities.
We are a U.S.-based multinational company subject to tax in multiple U.S. and foreign tax jurisdictions. Our provision for income taxes is based on a jurisdictional mix of earnings, statutory rates, and enacted tax rules, including transfer pricing. Significant judgment is required in determining our provision for income taxes and in evaluating our tax positions on a worldwide basis. Our effective tax rate could be adversely affected by a number of factors, including shifts in the mix of pretax results by tax jurisdiction, changes in tax laws or related interpretations in the jurisdictions in which we operate, and tax assessments and related interest and penalties resulting from income tax audits.
A substantial portion
Changes in tax laws and interpretations may affect our earnings negatively.
On December 22, 2017, the Tax Cuts and Jobs Act (H.R. 1) (the “Tax Act”) was signed into law. The Tax Act includes a number of our cash and investments is invested outsidechanges in existing tax law affecting businesses including, among other things, a reduction in the U.S. corporate income tax rate from 35 percent to 21 percent, disallowance of certain deductions that had previously been allowed, limitations on interest deductions, alteration of the United States.expensing of capital expenditures, adoption of a territorial tax system, assessment of a repatriation tax or “toll-charge” on undistributed earnings and profits of U.S.-owned foreign corporations, and introduction of certain anti-base erosion provisions.
5
In the fourth quarter of 2017, we recognized a provisional net tax expense of $99 million associated with the Tax Act; however, the ultimate effect on our financial condition and results of operations in 2018 and future years remains uncertain and may differ materially from our expectations due to the issuance of technical guidance regarding elements of the Tax Act and changes in interpretations and assumptions we have made with respect to the Tax Act. In addition, it is unclear how these U.S. federal income tax changes will affect state and local taxation, which often uses federal taxable income as a starting point for computing state and local tax liabilities. As we plan to permanently reinvest our foreign earnings outsidesuch, there may be material adverse effects resulting from the United States, in accordance with U.S. GAAP,Tax Act that we have not provided for U.S. federal and state income taxes or foreign withholding taxes that may result from future remittances of undistributed earnings of foreign subsidiaries. Recent proposals to reform U.S. tax rules may result in a reduction or elimination of the deferral of U.S. income tax on our foreign earnings, which could adversely affect our effective tax rate. Any of these changes could have an adverse effect on our results of operations and financial condition.yet identified.
The effects of natural disasters, terrorism, acts of war, and public health issues may adversely affect our business.
Natural disasters, including earthquakes, hurricanes, floods, and tornadostornadoes may affect store and distribution center operations. In addition, acts of terrorism, acts of war, and military action both in the United States and abroad can have a significant effect on economic conditions and may negatively affect our ability to purchase merchandise from suppliers for sale to our customers. Public health issues, such as flu or other pandemics, whether occurring in the United States or abroad, could disrupt our operations and result in a significant part of our workforce being unable to operate or maintain our infrastructure or perform other tasks necessary to conduct our business.business. Additionally, public health issues may disrupt, or have an adverse effect on, our suppliers’ operations, our operations, our customers, or customer demand. Our ability to mitigate the adverse impacteffect of these events depends, in part, upon the effectiveness of our disaster preparedness and response planning as well as business continuity planning. However, we cannot be certain that our plans will be adequate or implemented properly in the event of an actual disaster. We may be required to suspend operations in some or all of our locations, which could have a material adverse effect on our business, financial condition, and results of operations. Any significant declines in public safety or uncertainties regarding future economic prospects that affect customer spending habits could have a material adverse effect on customer purchases of our products.
Manufacturer compliance with our social compliance program requirements.
We require our independent manufacturers to comply with our policies and procedures, which cover many areas including labor, health and safety, and environmental standards. We monitor compliance with our policies and procedures using internal resources, as well as third-party monitoring firms. Although we monitor their compliance with these policies and procedures, we do not control the manufacturers or their practices. Any failure of our independent manufacturers to comply with our policies and procedures or local laws in the country of manufacture could disrupt the shipment of merchandise to us, force us to locate alternate manufacturing sources, reduce demand for our merchandise, or damage our reputation.
Complications in our distribution centers and other factors affecting the distribution of merchandise may affect our business.
We operate multiple distribution centers worldwide to support our businesses. In addition to the distribution centers that we operate, we have third-party arrangements to support our operations in the United States, Canada, Australia, and New Zealand. If complications arise with any facility or if any facility is severely damaged or destroyed, our other distribution centers may be unable to support the resulting additional distribution demands. We also may be affected by disruptions in the global transportation network such as a port strike,strikes, weather conditions, work stoppages or other labor unrest. These factors may adversely affect our ability to deliver inventory on a timely basis. We depend upon third-party carriers for shipment of a significant amount of merchandise. Anmerchandise; any interruption in service by these carriers for any reason could cause temporary disruptions in our business, a loss of sales and profits, and other material adverse effects.
Our freight cost is affected by changes in fuel prices through surcharges. Increases in fuel prices and surcharges, among and other factors, may increase freight costs and thereby increase our cost of sales.
We enter into diesel fuel forward and option contractsare subject to mitigate a portion of the risk associated with the variability caused by these surcharges.
Disruptions,technology risks including failures, or security breaches, of our information technology infrastructure or unauthorized disclosure of sensitive or confidential customer informationand cybersecurity risks which could harm our business, damage our reputation, and standing withincrease our customers.
costs in an effort to protect against such risks.Information technology is a critically important part of our business operations. We depend on information systems to process transactions, make operational decisions, manage inventory, operate our websites, purchase, sell and ship goods on a timely basis, and maintain cost-efficient operations.operations. There is a risk that we could experience a business interruption, theft of information, or reputational damage as a result of a cyber-attack, such as an infiltration of a data center or data leakage of confidential information, either internally or at our third-party providers. We may experience operational problems with our information systems as a result of system failures, system implementation issues, viruses, malicious hackers, sabotage, or other causes.
6
Our business involves the storage and transmission of customers’ personal information, such as consumer preferences and credit card information. We invest in security technology to protect the data stored by the Company, as well asus, including our data and business processes, against the risk of data security breaches and cyber-attacks. Our data security management program includes enforcement of standard data protection policies such as Payment Card Industry compliance. Additionally, we certify our major technology suppliers and any outsourced services through accepted security certification measures. We maintain and routinely test backup systems and disaster recovery, along with external network security penetration testing by an independent third party as part of our business continuity preparedness.
While we believe that our security technology and processes follow leading practices in the prevention of security breaches and the mitigation of cyber securitycybersecurity risks, given the ever-increasing abilities of those intent on breaching cyber securitycybersecurity measures and given the necessity of our reliance on the security procedures of third-party vendors, the total security effort at any point in time may not be completely effective. Any such security breaches and cyber incidents could adversely affect our business. Failure of our systems, including failures due to cyber-attacks that would prevent the ability of systems to function as intended, could cause transaction errors, loss of customers and sales, and negative consequences to us, our employees, and those with whom we do business. Any security breach involving the misappropriation, loss, or other unauthorized disclosure of confidential information by us could also severely damage our reputation, expose us to the risks of litigation and liability, increase operating costs associated with remediation, and harm our business. While we carry insurance that would mitigate the losses, such insurance may be insufficient to compensate us for potentially significant losses.
Risks associated with digital operations.
Our digital operations are subject to numerous risks, including risks related to the failure of the computer systems that operate our websites and mobile sites and their related support systems, computer viruses, cybersecurity risks, telecommunications failures, denial of service attacks, and similar disruptions. Also, we maywill require additional capital in the future to sustain or grow our digital commerce. Business riskscommerce business. Risks related to digital commerce include risksthose associated with credit card fraud, the need to keep pace with rapid technological change, Internet cyber security risks, risks of system failure or inadequacy, governmental regulation, and legal uncertainties with respect to Internet regulatory compliance, and collection of sales or other taxes by additional states or foreign jurisdictions.compliance. If any of these risks materializes,materialize, it could have a material adverse effect on our business.
Privacy and data security concerns and regulation could result in additional costs and liabilities.
The protection of customer, employee, and Company data is critical. The regulatory environment surrounding information security and privacy is demanding, with the frequent imposition of new and changing requirements. In addition, customers have a high expectation that we will adequately protect their personal information. Any actual or perceived misappropriation or breach involving this data could attract negative media attention, cause harm to our reputation or result in liability (including but not limited to fines, penalties or lawsuits), any of which could have a material adverse effect on our business, operational results, financial position and cash flows. Additionally, the E.U. adopted a comprehensive General Data Privacy Regulation (the “GDPR”), which will become fully effective in May 2018. The GDPR requires companies to satisfy new requirements regarding the handling of personal and sensitive data, including its use, protection and the ability of persons whose data is stored to correct or delete such data about themselves. Failure to comply with GDPR requirements could result in penalties of up to 4 percent of worldwide revenue. The GDPR and other similar laws and regulations, as well as any associated inquiries or investigations or any other government actions, may be costly to comply with, result in negative publicity, increase our operating costs, require significant management time and attention, and subject us to remedies that may harm our business, including fines or demands or orders that we modify or cease existing business practices.
The technology enablement of omni-channel in our business is complex and involves the development of a new digital platform and a new order management system in order to enhance the complete customer experience.
We continue to invest in initiatives designed to deliver a high-quality, coordinated shopping experience online, in-stores, and on mobile devices, which requires substantial investment in technology, information systems, and employee training, as well as significant management time and resources.Our omni-channel retailing efforts include the integration and implementation of new technology, software, and processes to be able to fulfill orders from any point within our system of stores and distribution centers, which is extremely complex and may not meet customer expectations for timely and accurate deliveries. These efforts involve substantial risk, including risk of implementation delays, cost overruns, technology interruptions, supply and distribution delays, and other issues that can affect the successful implementation and operation of our omni-channel initiatives.
7
If our omni-channel initiatives are not successful, or we do not realize the return on our omni-channel investments that we anticipate, our financial performance and future growth could be materially adversely affected.
Our reliance on key management.
Future performance will depend upon our ability to attract, retain, and motivate our executive and senior management team.teams. Our executive and senior management teamteams have substantial experience and expertise in our business and have made significant contributions to our recent growth and success. Our future performance depends to a significant extent both upon the continued services of our current executive and senior management team,teams, as well as our ability to attract, hire, motivate, and retain additional qualified management in the future. While we feel that we have adequate succession planning and executive development programs, competition for key executives in the retail industry is intense, and our operations could be adversely affected if we cannot retain and attract qualified executives.
Risks associated with attracting and retaining store and field associates.
Many
Our success depends, in part, upon our ability to attract, develop, and retain a sufficient number of thequalified store and field associates areassociates. The turnover rate in entry level or part-time positions which, historically, have had high rates of turnover.the retail industry is generally high. If we are unable to attract and retain quality associates, our ability to meet our growth goals or to sustain expected levels of profitability may be compromised. Our ability to meet our labor needs while controlling costs is subject to external factors such as unemployment levels, prevailing wage rates, minimum wage legislation, overtime regulations, and changing demographics.
We face risks arising
Changes in employment laws or regulation could harm our performance.
Various foreign and domestic labor laws govern our relationship with our employees and affect our operating costs. These laws include minimum wage requirements, overtime and sick pay, paid time off, work scheduling, healthcare reform and the Patient Protection and Affordable Care Act (“ACA”), unemployment tax rates, workers’ compensation rates, European works council requirements, and union organization. A number of factors could adversely affect our operating results, including additional government-imposed increases in minimum wages, overtime and sick pay, paid leaves of absence and mandated health benefits, and changing regulations from activity by the National Labor Relations Board or other agencies. At this time, there is uncertainty concerning whether the ACA will be repealed or what requirements will be included in a new law, if enacted. Complying with any new legislation and/or reversing changes implemented under the United States.
The National Labor Relations Board continually considers changes to labor regulations, many of whichACA could significantly affect the nature of labor relations in the United Statesbe time-intensive and how union electionsexpensive, and contract negotiations are conducted. The National Labor Relations Board’s current definition of a bargaining unit makes it possible for smaller groups of employees to organize labor unions.
Furthermore, recent regulations shorten the election process, significantly reducing the time between the filing of a petition and an election being held. These regulations and recent decisions could impose more labor relations requirements and union activity on our business conducted in the United States, thereby potentially increasing our costs, which could negativelymay affect our profitability.business.
Health care reform could adversely affect our business.
In 2010, Congress enacted comprehensive health care reform legislation which, among other things, includes guaranteed coverage requirements, eliminates pre-existing condition exclusions and annual and lifetime maximum limits, restricts the extent to which policies can be rescinded, and imposes new and significant taxes on health insurers and health care benefits. Due to the breadth and complexity of the health care reform legislation and the large number of eligible employees who currently choose not to participate in our plans, it is difficult to predict the overall effect of the statute and related regulations on our business over the coming years. Due to the health care law changes, some eligible employees who had historically not chosen to participate in our health care plans have found it more advantageous to participate in our plans effective January 1, 2015. Such changes include tax penalties to persons for not obtaining health care coverage and being ineligible for certain health care subsidies if an employee is eligible for health care coverage under an employer’s plan. If a larger number of eligible employees, who currently choose not to participate in our plans, choose to enroll over the next few years, it may significantly increase our health care coverage costs and negatively affect our financial results.
Legislative or regulatory initiatives related to global warming/climate change concerns may negatively affect our business.
There has been an increasing focus and significant debate on global climate change, including increased attention from regulatory agencies and legislative bodies. This increased focus may lead to new initiatives directed at regulating an as-yet unspecified array of environmental matters. Legislative, regulatory, or other efforts in the United States to combat climate change could result in future increases in taxes or in the cost of transportation and utilities, which could decrease our operating profits and could necessitate future additional investments in facilities and equipment. We are currently unable to predict the potential effects that any such future environmental initiatives may have on our business.
We may be adversely affected by regulatory and litigation developments.
We are exposed to the risk that federal or state legislation may negatively impactaffect our operations. Changes in federal or state wage requirements, employee rights, health care, social welfare or entitlement programs, such as health insurance, paid leave programs, or other changes in workplace regulation could increase our cost of doing business or otherwise adversely affect our operations. Additionally, we are regularly involved in various litigation matters, including class actions, and patent infringement claims, which arise in the ordinary course of our business. Litigation or regulatory developments could adversely affect our business operations and financial performance.
8
We operate in many different jurisdictions and we could be adversely affected by violations of the U.S. Foreign Corrupt Practices Act and similar worldwide anti-corruption laws.
The U.S. Foreign Corrupt Practices Act (“FCPA”) and similar worldwide anti-corruption laws, including the U.K. Bribery Act of 2010, which is broader in scope than the FCPA, generally prohibit companies and their intermediaries from making improper payments to non-U.S.government officials for the purpose of obtaining or retaining business.
Our internal policies mandate compliance with these anti-corruption laws. Despite our training and compliance programs, we cannot be assured that our internal control policies and procedures will always protect us from reckless or criminal acts committed by our employees or agents.
Our continued expansion outside the United States, including in developing countries, could increase the risk of FCPA violations in the future. Violations of these laws, or allegations of such violations, could disrupt our business and result in a material adverse effect on our results of operations or financial condition.
Failure to fully comply with Section 404 of the Sarbanes-Oxley Act of 2002 could negatively affect our business, market confidence in our reported financial information, and the price of our common stock.
We continue to document, test, and monitor our internal controls over financial reporting in order to satisfy all of the requirements of Section 404 of the Sarbanes-Oxley Act of 2002; however, we cannot be assured that our disclosure controls and procedures and our internal controls over financial reporting will prove to be completely adequate in the future. Failure to fully comply with Section 404 of the Sarbanes-Oxley Act of 2002 could negatively affect our business, market confidence in our reported financial information, and the price of our common stock.
Item 1B. Unresolved Staff Comments
None.
The properties of the Company and its consolidated subsidiaries consist of land, leased stores, administrative facilities, and distribution centers. Gross square footage and total selling area for the Athletic Stores segment at the end of 20142017 were approximately 12.7313.30 and 7.487.71 million square feet, respectively. These properties, which are primarily leased, are located in the United States and its territories, Canada, various European countries, Australia, and New Zealand.
The Company
We currently operates sevenoperate five distribution centers, of which threetwo are owned and fourthree are leased, occupying an aggregate of 2.9 million square feet. Three distribution centers are located in the United States, threeone in Germany, and one in the Netherlands. The three locationslocation in Germany relate toserves as the central warehouse distribution centerscenter for the Runners Point Group store locations, as well as a distribution center for itsand Sidestep stores and their direct-to-customer business. During 2014, we opened a new distribution center in Germany which provides us with increased capacity that will enable us to support the planned growth of both the store and direct-to-customer businesses. This larger distribution center will also allow us to consolidate the other two locations in Germany in 2015.
We also own a cross-dock and manufacturing facility, and operate a leased warehouse in the United States, both of which support our Team Edition apparel business. The lease for our leased distribution center in Germany expires during 2019 and the Company is currently negotiating a lease extension for this facility.
We believe that all leases of properties that are material to our operations may be renewed, or that alternative properties are available, on terms not materially less favorable to us than existing leases.
Information regarding the Company’s legal proceedings is contained in theLegal Proceedings note under “Item 8. Consolidated Financial Statements and Supplementary Data.”
Item 4. Mine Safety Disclosures
Not applicable.
9
Item 4A. Executive Officers of the Registrant
Information
The following table provides information with respect to Executive Officers of the Company,all persons serving as executive officers as of March 30, 2015, is set forth below:
29, 2018, including business experience for the last five years.
Chairman, | |||
| President and Chief Executive Officer | Richard A. Johnson | ||
Executive Vice President and Chief Executive Officer — | Stephen D. Jacobs | ||
Executive Vice President and Chief Executive Officer — International | Lewis P. Kimble | ||
Executive Vice President and Chief Financial Officer | Lauren B. Peters | ||
Executive Vice President and Chief Information and Customer Connectivity Officer | Pawan Verma | ||
Senior Vice President and Chief Human Resources Officer | Paulette R. Alviti | ||
Senior Vice President and Chief Accounting Officer | Giovanna Cipriano | ||
Senior Vice President, General Counsel and Secretary | Sheilagh M. Clarke | ||
Senior Vice President — | W. Scott Martin | ||
Vice President, Treasurer | John A. Maurer | ||
Ken C. Hicks,
Richard A. Johnson, age 62, 60, has served as Executive Chairman of the Board since January 31, 2010. He served as PresidentMay 2016 and Chief Executive Officer from August 17, 2009 through November 30, 2014. Mr. Hicks is also a director of Avery Dennison Corporation.
Richard A. Johnson, age 57, has served as President and Chief Executive Officer since December 1, 2014. Mr. Johnson previously served as Executive Vice President and Chief Operating Officer from May 16, 2012 through November 30, 2014. He served as Executive Vice President and Group President from July 2011 to May 15, 2012; President and Chief Executive Officer of Foot Locker U.S., Lady Foot Locker, Kids Foot Locker, and Footaction from January 2010 to July 2011; President and Chief Executive Officer of Foot Locker Europe from August 2007 to January 2010; and President and Chief Executive Officer of Footlocker.com/Eastbay from April 2003 to August 2007.
Robert W. McHugh,
Stephen D. Jacobs, age 56,55, has served as Executive Vice President — Operations Support since July 2011. He served as Executive Vice President and Chief FinancialExecutive Officer-North America since February 2016. He previously served as Executive Vice President and Chief Executive Officer Foot Locker North Americafrom May 2009December 2014 through February 2016 and President and Chief Executive Officer of Foot Locker U.S., Lady Foot Locker, Kids Foot Locker, and Footaction from July 2011 to July 2011.November 2014.
Lewis P. Kimble, age59, has served as Executive Vice President and Chief Executive Officer-International since February 2016. Mr. Kimble previously served as President and Chief Executive Officer of Foot Locker Europe from February 2010 to February 2016.
Lauren B. Peters, age 53,56, has served as Executive Vice President and Chief Financial Officer since July 2011. She
Pawan Verma, age 41, has served as Executive Vice President, Chief Information and Customer Connectivity Officer since October 2017 and as Senior Vice President — Strategic Planningand Chief Information Officer from April 2002August 2015 to September 2017. From February 2013 to July 2011.2015, Mr. Verma served in various technology leadership roles at Target Corporation ranging from enterprise architecture, e-commerce, mobile and digital, with his most recent role at Target as Vice President - Digital Technology and API Platforms.
Paulette R. Alviti,age 44,47, has served as Senior Vice President and Chief Human Resources Officer since June 2013. From March 2010 to May 2013, Ms. Alviti served in various roles at PepsiCo, Inc.: SVP, with her most recent role as Senior Vice President and Chief Human Resources Officer Asia, Middle East, Africa (February to May 2013); SVP Global Talent Acquisition and Deployment (July 2012 to February 2013); and SVP — Human Resources (March 2010 to July 2012). From March 2008 to March 2010, sheAfrica.
Giovanna Cipriano, age 48, has served as VP — Human Resources of The Pepsi Bottling Group, Inc.Senior Vice President and Chief Accounting Officer since May 2009.
Sheilagh M. Clarke, age 55,58, has served as Senior Vice President, General Counsel and Secretary since June 1, 2014. She previously served as Vice President, Associate General Counsel and Assistant Secretary from May 2007 to May 31, 2014.
Jeffrey L. Berk,
W. Scott Martin, age 59,50, has served as Senior Vice President - Strategy and Store Development since October 2017 and as Senior Vice President — Real Estate since February 2000.
Peter D. Brown, age 60, hasfrom June 2016 to September 2017. Mr. Martin previously served as Senior Vice President, Store Development – Asia Pacific with Gap Inc. from June 2014 to June 2016. Prior to that role, he served in various roles at Starbucks Coffee Company: Director, Strategy Development, China, Asia Pacific and Chief Information Officer since February 2011. He served as Senior Vice President, Chief Information Officer and Investor Relations from September 2006Emerging Brands (July 2013 to February 2011.July 2014); Director, Global Store Development (June 2007 to July 2013).
Giovanna Cipriano, age 45, has served as Senior Vice President and Chief Accounting Officer since May 2009.
John A. Maurer, age 55,58, has served as Vice President, Treasurer and Investor Relations since February 2011. Mr. MaurerSeptember 2006. In addition to this role, he also served as the Vice President and Treasurerof Investors Relations from September 2006 to February 2011.2011 through March 2018.
There are no family relationships among the executive officers or directors of the Company.
10
PART II
Market for the Company’s Common Equity, Related Stockholder Matters and Issuer Purchases of Equity Securities |
Foot Locker, Inc. common stock (ticker symbol “FL”) is listed on The New York Stock Exchange as well as on the Börse Stuttgart stock exchange in Germany. As of January 31, 2015,February 3, 2018, the Company had 15,35313,244 shareholders of record owning 140,864,188119,829,023 common shares.
The following table provides for the period indicated, the intra-day high and low sales prices for the Company’s common stock:stock for the periods indicated below:
|
|
|
|
|
|
|
|
| ||||||||||||||||||||
|
|
|
|
|
|
|
|
|
|
|
| |||||||||||||||||
| 2014 | 2013 |
| 2017 |
| 2016 | |||||||||||||||||||||||
| High | Low | High | Low |
|
| High |
| Low |
| High |
| Low | ||||||||||||||||
| 1st Quarter | $ | 48.71 | $ | 36.65 | $ | 35.64 | $ | 31.30 |
| $ | 77.86 |
| $ | 65.88 |
| $ | 69.65 |
| $ | 58.17 | ||||||||
| 2nd Quarter | 52.07 | 46.20 | 37.70 | 32.61 |
|
| 77.71 |
|
| 44.59 |
|
| 62.45 |
|
| 50.90 | ||||||||||||
| 3rd Quarter | 58.40 | 47.90 | 37.85 | 31.91 |
|
| 51.29 |
|
| 29.89 |
|
| 69.61 |
|
| 56.80 | ||||||||||||
| 4th Quarter | 59.19 | 51.12 | 41.73 | 34.09 |
|
| 53.17 |
|
| 28.42 |
|
| 79.43 |
|
| 65.39 | ||||||||||||
During each of the quarters of 2014,2017, the Company declared a dividend of $0.22$0.31 per share. The Board of Directors reviews the dividend policy and rate, taking into consideration the overall financial and strategic outlook for our earnings, liquidity, and cash flow. On February 17, 2015,20, 2018, the Board of Directors declared a quarterly dividend of $0.25$0.345 per share to be paid on May 1, 2015.4, 2018. This dividend represents a 14an 11 percent increase over the Company’s previous quarterly per share amount.
The following table is a summary of our fourth quarter share repurchases:
| Date Purchased | Total Number of Shares Purchased(1) | Average Price Paid per Share(1) | Total Number of Shares Purchased as Part of Publicly Announced Program(2) | Approximate Dollar Value of Shares that may yet be Purchased Under the Program(2) | ||||||||||||
| Nov. 2, 2014 – Nov. 29, 2014 | 1,059,790 | (3) | $ | 55.92 | 1,059,790 | $ | 136,841,263 | |||||||||
| Nov. 30, 2014 – Jan. 3, 2015 | 862,663 | $ | 56.06 | 861,771 | $ | 88,527,414 | ||||||||||
| Jan. 4, 2015 – Jan. 31, 2015 | 419,584 | (3) | $ | 55.67 | 419,584 | $ | 65,167,625 | |||||||||
| 2,342,037 | $ | 55.93 | 2,341,145 | |||||||||||||
|
|
|
|
|
|
|
|
|
|
|
|
|
|
|
|
|
|
|
|
|
|
|
|
|
|
|
|
|
|
| Approximate | |
|
|
|
|
|
| Total Number of |
| Dollar Value of | ||
|
| Total |
| Average | Shares Purchased as |
| Shares that may | |||
|
| Number |
| Price | Part of Publicly |
| yet be Purchased | |||
|
| of Shares |
| Paid Per | Announced |
| Under the | |||
Date Purchased |
| Purchased (1) |
| Share (1) | Program (2) |
| Program (2) | |||
Oct. 29 - Nov. 25, 2017 |
| 1,500,000 |
| $ | 30.96 |
| 1,500,000 |
| $ | 816,552,335 |
Nov. 26 - Dec. 30, 2017 |
| 1,333,433 |
|
| 43.87 |
| 1,323,930 |
|
| 758,463,867 |
Dec. 31 - Feb. 3, 2018 |
| — |
|
| — |
| — |
|
| 758,463,867 |
|
| 2,833,433 |
| $ | 37.04 |
| 2,823,930 |
|
|
|
(1) | These columns also reflect shares |
(2) | On February 14, 2017, the Board of Directors approved a 3-year, $1.2 billion share repurchase program extending through January 2020. Through |
On February 17, 2015, the Board of Directors approved a new 3-year, $1 billion share repurchase program extending through January 2018, replacing the Company’s previous $600 million program.
11
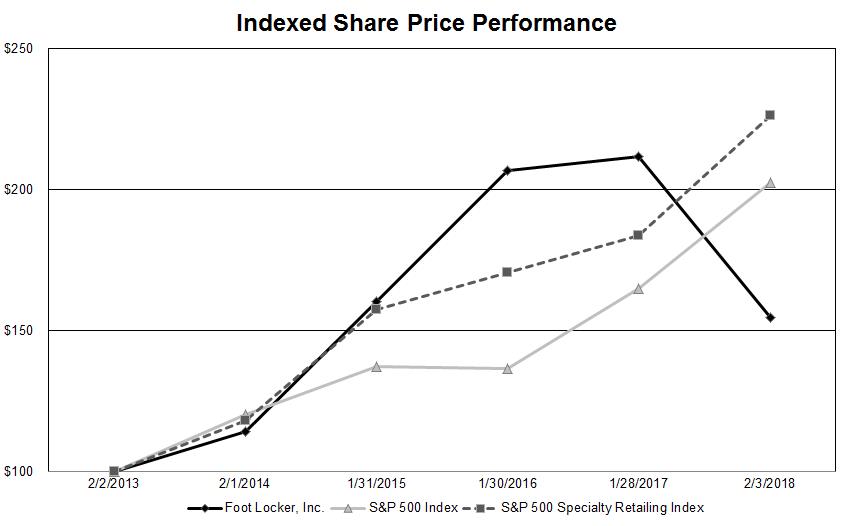
Performance Graph
The graph below compares the cumulative five-year total return to shareholders (common stock price appreciation plus dividends, on a reinvested basis) on Foot Locker, Inc.’s common stock relative to the total returns of the S&P 400500 Specialty Retailing Index and the Russell MidcapS&P 500 Index.
The following Performance Graph and related information shall not be deemed “soliciting material” or deemed to be filed with the SEC, nor shall such information be incorporated by reference into any future filing under the Securities Act of 1933 or Securities Exchange Act of 1934, each as amended, except to the extent that we specifically incorporate it by reference into such filing.
Indexed Share Price Performance

|
|
|
|
|
|
|
|
|
|
|
|
|
|
|
|
|
|
|
|
|
|
|
|
|
|
|
|
|
|
|
|
|
|
|
|
|
|
|
| 2/2/2013 |
| 2/1/2014 |
| 1/31/2015 |
| 1/30/2016 |
| 1/28/2017 |
| 2/3/2018 | ||||||
Foot Locker, Inc. |
| $ | 100.00 |
| $ | 114.24 |
| $ | 160.33 |
| $ | 206.69 |
| $ | 211.63 |
| $ | 154.65 |
S&P 500 Index |
| $ | 100.00 |
| $ | 120.29 |
| $ | 137.39 |
| $ | 136.47 |
| $ | 164.93 |
| $ | 202.57 |
S&P 500 Specialty Retailing Index |
| $ | 100.00 |
| $ | 118.15 |
| $ | 157.66 |
| $ | 170.76 |
| $ | 183.70 |
| $ | 226.17 |
12
| 1/30/2010 | 1/29/2011 | 1/28/2012 | 2/2/2013 | 2/1/2014 | 1/31/2015 | |||||||||||||||||||
| Foot Locker, Inc. | $ | 100.00 | $ | 157.40 | $ | 234.19 | $ | 306.11 | $ | 341.90 | $ | 471.39 | ||||||||||||
| S&P 400 Retailing Index | $ | 100.00 | $ | 141.60 | $ | 170.80 | $ | 209.23 | $ | 234.04 | $ | 281.84 | ||||||||||||
| Russell Midcap Index | $ | 100.00 | $ | 129.27 | $ | 132.08 | $ | 153.77 | $ | 185.53 | $ | 207.66 | ||||||||||||
Item 6. Selected Financial Data
FIVE-YEAR SUMMARY OF SELECTED FINANCIAL DATA
The selected financial data below should be read in conjunction with the Consolidated Financial Statements and the Notes thereto and other information contained elsewhere in this report.
|
|
|
|
|
|
|
|
|
|
| |||||||||||||||||||||
| ($ in millions, except per share amounts) | 2014 | 2013 | 2012(1) | 2011 | 2010 | ||||||||||||||||||||||||||
|
|
|
|
|
|
|
|
|
|
|
| ||||||||||||||||||||
|
|
| 2017 (1) |
| 2016 |
| 2015 |
| 2014 |
| 2013 | ||||||||||||||||||||
| Summary of Operations | Summary of Operations | (in millions, except per share amounts) | |||||||||||||||||||||||||||||
| Sales | $ | 7,151 | 6,505 | 6,182 | 5,623 | 5,049 | Sales | $ | 7,782 |
| 7,766 |
| 7,412 |
| 7,151 |
| 6,505 | ||||||||||||||
| Gross margin | 2,374 | 2,133 | 2,034 | 1,796 | 1,516 | Gross margin |
| 2,456 |
| 2,636 |
| 2,505 |
| 2,374 |
| 2,133 | |||||||||||||||
| Selling, general and administrative expenses | 1,426 | 1,334 | 1,294 | 1,244 | 1,138 | Selling, general and administrative expenses |
| 1,501 |
| 1,472 |
| 1,415 |
| 1,426 |
| 1,334 | |||||||||||||||
| Impairment and other charges | 4 | 2 | 12 | 5 | 10 | ||||||||||||||||||||||||||
| Depreciation and amortization | 139 | 133 | 118 | 110 | 106 | Depreciation and amortization |
| 173 |
| 158 |
| 148 |
| 139 |
| 133 | |||||||||||||||
| Interest expense, net | 5 | 5 | 5 | 6 | 9 | ||||||||||||||||||||||||||
Litigation and other charges | Litigation and other charges |
| 211 |
| 6 |
| 105 |
| 4 |
| 2 | ||||||||||||||||||||
Interest (income) / expense, net | Interest (income) / expense, net |
| (2) |
| 2 |
| 4 |
| 5 |
| 5 | ||||||||||||||||||||
| Other income | (9 | ) | (4 | ) | (2 | ) | (4 | ) | (4 | ) | Other income |
| (5) |
| (6) |
| (4) |
| (9) |
| (4) | ||||||||||
| Net income | 520 | 429 | 397 | 278 | 169 | Net income |
| 284 |
| 664 |
| 541 |
| 520 |
| 429 | |||||||||||||||
| Per Common Share Data | Per Common Share Data |
|
|
|
|
|
|
|
|
|
| ||||||||||||||||||||
| Basic earnings | 3.61 | 2.89 | 2.62 | 1.81 | 1.08 | Basic earnings |
| 2.23 |
| 4.95 |
| 3.89 |
| 3.61 |
| 2.89 | |||||||||||||||
| Diluted earnings | 3.56 | 2.85 | 2.58 | 1.80 | 1.07 | Diluted earnings |
| 2.22 |
| 4.91 |
| 3.84 |
| 3.56 |
| 2.85 | |||||||||||||||
| Common stock dividends declared per share | 0.88 | 0.80 | 0.72 | 0.66 | 0.60 | Common stock dividends declared per share |
| 1.24 |
| 1.10 |
| 1.00 |
| 0.88 |
| 0.80 | |||||||||||||||
| Weighted-average Common Shares Outstanding | Weighted-average Common Shares Outstanding |
|
|
|
|
|
|
|
|
|
| ||||||||||||||||||||
| Basic earnings | 143.9 | 148.4 | 151.2 | 153.0 | 155.7 | Basic earnings |
| 127.2 |
| 134.0 |
| 139.1 |
| 143.9 |
| 148.4 | |||||||||||||||
| Diluted earnings | 146.0 | 150.5 | 154.0 | 154.4 | 156.7 | Diluted earnings |
| 127.9 |
| 135.1 |
| 140.8 |
| 146.0 |
| 150.5 | |||||||||||||||
| Financial Condition | Financial Condition |
|
|
|
|
|
|
|
|
|
| ||||||||||||||||||||
| Cash, cash equivalents, and short-term investments | $ | 967 | 867 | 928 | 851 | 696 | Cash, cash equivalents, and short-term investments | $ | 849 |
| 1,046 |
| 1,021 |
| 967 |
| 867 | ||||||||||||||
| Merchandise inventories | 1,250 | 1,220 | 1,167 | 1,069 | 1,059 | Merchandise inventories |
| 1,278 |
| 1,307 |
| 1,285 |
| 1,250 |
| 1,220 | |||||||||||||||
| Property and equipment, net | 620 | 590 | 490 | 427 | 386 | Property and equipment, net |
| 866 |
| 765 |
| 661 |
| 620 |
| 590 | |||||||||||||||
| Total assets | 3,577 | 3,487 | 3,367 | 3,050 | 2,896 | Total assets |
| 3,961 |
| 3,840 |
| 3,775 |
| 3,577 |
| 3,487 | |||||||||||||||
| Long-term debt and obligations under capital leases | 134 | 139 | 133 | 135 | 137 | Long-term debt and obligations under capital leases |
| 125 |
| 127 |
| 130 |
| 134 |
| 139 | |||||||||||||||
| Total shareholders’ equity | 2,496 | 2,496 | 2,377 | 2,110 | 2,025 | Total shareholders’ equity |
| 2,519 |
| 2,710 |
| 2,553 |
| 2,496 |
| 2,496 | |||||||||||||||
| Financial Ratios | Financial Ratios |
|
|
|
|
|
|
|
|
|
| ||||||||||||||||||||
| Sales per average gross square foot(2) | $ | 490 | 460 | 443 | 406 | 360 | Sales per average gross square foot (2) | $ | 495 |
| 515 |
| 504 |
| 490 |
| 460 | ||||||||||||||
| SG&A as a percentage of sales | 19.9 | % | 20.5 | 20.9 | 22.1 | 22.5 | SG&A as a percentage of sales |
| 19.3 | % | 19.0 |
| 19.1 |
| 19.9 |
| 20.5 | ||||||||||||||
| Earnings before interest and taxes (EBIT) | $ | 814 | 668 | 612 | 441 | 266 | |||||||||||||||||||||||||
| EBIT margin | 11.4 | % | 10.3 | 9.9 | 7.8 | 5.3 | |||||||||||||||||||||||||
| EBIT margin (non-GAAP)(3) | 11.4 | % | 10.4 | 9.9 | 7.9 | 5.4 | |||||||||||||||||||||||||
| Net income margin | 7.3 | % | 6.6 | 6.4 | 4.9 | 3.3 | Net income margin |
| 3.6 | % | 8.6 |
| 7.3 |
| 7.3 |
| 6.6 | ||||||||||||||
| Net income margin (non-GAAP)(3) | 7.3 | % | 6.6 | 6.2 | 5.0 | 3.4 | |||||||||||||||||||||||||
Adjusted net income margin (3) | Adjusted net income margin (3) |
| 6.6 | % | 8.4 |
| 8.2 |
| 7.3 |
| 6.6 | ||||||||||||||||||||
Earnings before interest and taxes (EBIT) (3) | Earnings before interest and taxes (EBIT) (3) | $ | 576 |
| 1,006 |
| 841 |
| 814 |
| 668 | ||||||||||||||||||||
EBIT margin (3) | EBIT margin (3) |
| 7.4 | % | 13.0 |
| 11.3 |
| 11.4 |
| 10.3 | ||||||||||||||||||||
Adjusted EBIT (3) | Adjusted EBIT (3) | $ | 762 |
| 1,012 |
| 946 |
| 816 |
| 676 | ||||||||||||||||||||
Adjusted EBIT margin (3) | Adjusted EBIT margin (3) |
| 9.9 | % | 13.0 |
| 12.8 |
| 11.4 |
| 10.4 | ||||||||||||||||||||
| Return on assets (ROA) | 14.7 | % | 12.5 | 12.4 | 9.4 | 5.9 | Return on assets (ROA) |
| 7.3 | % | 17.4 |
| 14.7 |
| 14.7 |
| 12.5 | ||||||||||||||
| Return on invested capital (ROIC)(3) | 15.0 | % | 14.1 | 14.2 | 11.8 | 8.3 | Return on invested capital (ROIC) (3) |
| 11.0 | % | 15.1 |
| 15.8 |
| 15.0 |
| 14.1 | ||||||||||||||
| Net debt capitalization percent(3), (4) | 43.4 | % | 42.5 | 37.2 | 36.0 | 39.0 | Net debt capitalization percent (3), (4) |
| 54.4 | % | 48.5 |
| 47.4 |
| 43.4 |
| 42.5 | ||||||||||||||
| Current ratio | 3.5 | 3.8 | 3.7 | 3.8 | 4.0 | Current ratio |
| 4.1 |
| 4.3 |
| 3.7 |
| 3.5 |
| 3.8 | |||||||||||||||
| Other Data | Other Data |
|
|
|
|
|
|
|
|
|
| ||||||||||||||||||||
| Capital expenditures | $ | 190 | 206 | 163 | 152 | 97 | Capital expenditures | $ | 274 |
| 266 |
| 228 |
| 190 |
| 206 | ||||||||||||||
| Number of stores at year end | 3,423 | 3,473 | 3,335 | 3,369 | 3,426 | Number of stores at year end |
| 3,310 |
| 3,363 |
| 3,383 |
| 3,423 |
| 3,473 | |||||||||||||||
| Total selling square footage at year end (in millions) | 7.48 | 7.47 | 7.26 | 7.38 | 7.54 | Total selling square footage at year end (in millions) |
| 7.71 |
| 7.63 |
| 7.58 |
| 7.48 |
| 7.47 | |||||||||||||||
| Total gross square footage at year end (in millions) | 12.73 | 12.71 | 12.32 | 12.45 | 12.64 | Total gross square footage at year end (in millions) |
| 13.30 |
| 13.12 |
| 12.92 |
| 12.73 |
| 12.71 | |||||||||||||||
(1) | 2017 represents the 53 weeks ended February |
(2) | Calculated as Athletic Store sales divided by the average monthly ending gross square footage of the last thirteen months. The computation for each of the years presented reflects the foreign exchange rate in |
(3) | These represent non-GAAP measures, see Item 7, “Management’s Discussion and Analysis of Financial Condition and Results of Operations” for additional information and calculation. |
(4) | Represents total debt and obligations under capital leases, net of cash, cash equivalents, and short-term investments. |
Item 7. Management’s Discussion and Analysis of Financial Condition and Results of OperationsBusiness OverviewFoot Locker, Inc., through its subsidiaries, operates in two reportable segments — Athletic Stores and Direct-to-Customers. The Athletic Stores segment is one of the largest athletic footwear and apparel retailers in the world, with formats that include Foot Locker, Lady Foot Locker, Kids Foot Locker, Champs Sports, Footaction, SIX:02, as well as the retail stores of Runners Point Group, including Runners Point and Sidestep. The Direct-to-Customers segment includes Footlocker.com, Inc. and other affiliates, including Eastbay, Inc., and the direct-to-customer subsidiary of Runners Point Group, which sell to customers through their Internet and mobile sites and catalogs.
The Foot Locker brand is one of the most widely recognized names in the markets in which the Company operates, epitomizing premium quality for the active lifestyle customer. This brand equity has aided the Company’s ability to successfully develop and increase its portfolio of complementary retail store formats, such as Lady Foot Locker, and Kids Foot Locker, as well as Footlocker.com, its direct-to-customer business. Through various marketing channels, including broadcast, digital, print, and various sports sponsorships and events, the Company reinforces its image with a consistent message — namely, that it is the destination for athletically inspired shoes and apparel with a wide selection of merchandise in a full-service environment.
Store Profile
| Square Footage | ||||||||||||||||||||||||||||
| (in thousands) | ||||||||||||||||||||||||||||
| February 1, 2014 | Opened | Closed | January 31, 2015 | Relocations/ Remodels | Selling | Gross | ||||||||||||||||||||||
| Foot Locker US | 1,044 | 11 | 40 | 1,015 | 94 | 2,494 | 4,298 | |||||||||||||||||||||
| Foot Locker Europe | 604 | 13 | 14 | 603 | 40 | 846 | 1,839 | |||||||||||||||||||||
| Foot Locker Canada | 128 | — | 2 | 126 | 31 | 270 | 422 | |||||||||||||||||||||
| Foot Locker Asia Pacific | 92 | 3 | 4 | 91 | 4 | 125 | 204 | |||||||||||||||||||||
| Lady Foot Locker/SIX:02 | 257 | 8 | 52 | 213 | 51 | 299 | 501 | |||||||||||||||||||||
| Kids Foot Locker | 336 | 28 | 7 | 357 | 25 | 529 | 912 | |||||||||||||||||||||
| Footaction | 277 | 2 | 7 | 272 | 20 | 789 | 1,258 | |||||||||||||||||||||
| Champs Sports | 542 | 11 | 6 | 547 | 50 | 1,913 | 2,927 | |||||||||||||||||||||
| Runners Point | 115 | 5 | 4 | 116 | 4 | 143 | 244 | |||||||||||||||||||||
| Sidestep | 78 | 5 | — | 83 | — | 75 | 129 | |||||||||||||||||||||
| Total | 3,473 | 86 | 136 | 3,423 | 319 | 7,483 | 12,734 | |||||||||||||||||||||
Athletic Stores
The Company operates 3,423 stores in the Athletic Stores segment. The following is a brief description of the Athletic Stores segment’s operating businesses and their respective taglines:
Foot Locker — “Approved” — Foot Locker is a leading global athletic footwear and apparel retailer, which caters to the sneaker enthusiast — If it’s at Foot Locker, it’s Approved. Its stores offer the latest in athletically-inspired footwear and apparel, manufactured primarily by the leading athletic brands. Foot Locker provides the best selection of premium products for a wide variety of activities, including basketball, running, and training. Additionally, we operate 178 House of Hoops, primarily a shop-in-shop concept, which sells premier basketball-inspired footwear and apparel. Foot Locker’s 1,835 stores are located in 23 countries including 1,015 in the United States, Puerto Rico, U.S. Virgin Islands, and Guam, 126 in Canada, 603 in Europe, and a combined 91 in Australia and New Zealand. The domestic stores have an average of 2,500 selling square feet and the international stores have an average of 1,500 selling square feet.
Lady Foot Locker —“The Place for Her” — Lady Foot Locker is a leading U.S. retailer of athletic footwear, apparel, and accessories for active women. Its stores carry major athletic footwear, apparel, and accessories brands designed for a variety of activities, including running, walking, training, and fitness. Lady Foot Locker operates 198 stores that are located in the United States and Puerto Rico. These stores have an average of 1,400 selling square feet.
SIX:02 —“It’s Your Time” — SIX:02 is an elevated retail concept designed for her, featuring top brands in fitness apparel, footwear, and accessories for a variety of activities, including running, yoga, strength training, dance, and CrossFit. This banner connects with each local market’s fitness community through gym, studio, and trainer partnerships, and celebrates the time each woman invests in herself. SIX:02 operates 15 stores in the United States and have an average of 2,100 selling square feet.
Kids Foot Locker — “Go Big” — Kids Foot Locker is a children’s athletic retailer that offers the largest selection of brand-name athletic footwear, apparel and accessories for children. Its stores feature an environment geared to appeal to both parents and children. Of its 357 stores, 336 are located in the United States, Puerto Rico, and the U.S. Virgin Islands, 16 in Europe, and 5 in Canada. These stores have an average of 1,500 selling square feet.
Footaction — “Own It” — Footaction is a national athletic footwear and apparel retailer that offers the freshest, best edited selection of athletic lifestyle brands and looks. This banner is uniquely positioned at the intersection of sport and style. The primary customer is a style-obsessed, confident, influential young male who is always dressed to impress. Its 272 stores are located throughout the United States and Puerto Rico and focus on authentic, premium product. The Footaction stores have an average of 2,900 selling square feet.
Champs Sports — “We Know Game” — Champs Sports is one of the largest mall-based specialty athletic footwear and apparel retailers in North America. Its product categories include athletic footwear and apparel, and sport-lifestyle inspired accessories. This assortment allows Champs Sports to differentiate itself from other mall-based stores by presenting complete head-to-toe merchandising stories representing the most powerful athletic brands, sports teams, and athletes in North America. Of its 547 stores, 517 are located throughout the United States, Puerto Rico, and the U.S. Virgin Islands and 30 in Canada. The Champs Sports stores have an average of 3,500 selling square feet.
Runners Point — “Your Way, Our Passion” — Runners Point specializes in running footwear, apparel, and equipment for performance and lifestyle purposes. Its 116 stores are located in Germany and Austria. This banner caters to local running communities providing technical products, training tips and access to local running and group events. The Runners Point stores have an average of 1,200 selling square feet.
Sidestep — “Sneaker Lifestyle” — Sidestep is a predominantly sports fashion footwear banner. Its 83 stores are located in Germany, Austria, and the Netherlands. Sidestep caters to a more discerning, fashion consumer. Sidestep stores have an average of 900 selling square feet.
Direct-to-Customers
The Company’s Direct-to-Customers segment is multi-branded and multi-channeled. This segment sells directly to customers through its Internet and mobile sites and catalogs.
The Direct-to-Customers segment operates the websites for eastbay.com, final-score.com, eastbayteamsales.com, as well as websites aligned with the brand names of its store banners (footlocker.com, ladyfootlocker.com, six02.com kidsfootlocker.com, footaction.com, footlocker.ca, footlocker.eu, and champssports.com). Additionally, this segment includes the direct-to-customer subsidiary of Runners Point Group, which operates the websites for runnerspoint.com, sidestep-shoes.com, and sp24.com. These sites offer one of the largest online selections of running sport items in Europe, while providing a seamless link between e-commerce and store banners.
Eastbay — “First Choice For Athletes” — Eastbay is among the largest direct marketers in the United States, providing high school and other athletes with a complete sports solution including athletic footwear, apparel, equipment, team licensed, and private-label merchandise for a broad range of sports.
Franchise Operations
The Company has two separate ten-year agreements with third parties for the operation of Foot Locker stores located within the Middle East and the Republic of Korea. Additionally, franchised stores located in Germany and Switzerland operate under the Runners Point and Sidestep banners. A total of 78 franchised stores were operating at January 31, 2015, of which 31 are operating in the Middle East, 27 in Germany and Switzerland, and 20 in the Republic of Korea. Royalty income from the franchised stores was not significant for any of the periods presented. These stores are not included in the Company’s operating store count above.
Reconciliation of Non-GAAP Measures
In the following tables, the Company has presented certain financial measures and ratios identified as non-GAAP. The Company believes this non-GAAP information is a useful measure to investors because it allows for a more direct comparison of the Company’s performance for 2014 as compared with prior years and is useful in assessing the Company’s progress in achieving its long-term financial objectives. The 2014 and 2013 results represent the 52 weeks ended January 31, 2015 and February 1, 2014, respectively, as compared with the 53 weeks in the 2012 reporting year. The following represents a reconciliation of the non-GAAP measures discussed throughout the Overview of Consolidated Results:
| 2014 | 2013 | 2012 | ||||||||||
| (in millions, except per share amounts) | ||||||||||||
| Sales: | ||||||||||||
| Sales | $ | 7,151 | $ | 6,505 | $ | 6,182 | ||||||
| 53rd week | — | — | 81 | |||||||||
| Sales excluding 53rd week (non-GAAP) | $ | 7,151 | $ | 6,505 | $ | 6,101 | ||||||
| Pre-tax income: | ||||||||||||
| Income before income taxes | $ | 809 | $ | 663 | $ | 607 | ||||||
| Pre-tax amounts excluded from GAAP: | ||||||||||||
| Runners Point Group integration and acquisition costs | 2 | 6 | — | |||||||||
| Impairment and other charges | 4 | 2 | 12 | |||||||||
| Gain on sale of real estate | (4 | ) | — | — | ||||||||
| 53rd week | — | — | (22 | ) | ||||||||
| Total pre-tax amounts excluded | 2 | 8 | (10 | ) | ||||||||
| Income before income taxes (non-GAAP) | $ | 811 | $ | 671 | $ | 597 | ||||||
| Calculation of Earnings Before Interest and Taxes (EBIT): | ||||||||||||
| Income before income taxes | $ | 809 | $ | 663 | $ | 607 | ||||||
| Interest expense, net | 5 | 5 | 5 | |||||||||
| EBIT | $ | 814 | $ | 668 | $ | 612 | ||||||
| Income before income taxes (non-GAAP) | $ | 811 | $ | 671 | $ | 597 | ||||||
| Interest expense, net | 5 | 5 | 5 | |||||||||
| EBIT (non-GAAP) | $ | 816 | $ | 676 | $ | 602 | ||||||
| EBIT margin% | 11.4 | % | 10.3 | % | 9.9 | % | ||||||
| EBIT margin% (non-GAAP) | 11.4 | % | 10.4 | % | 9.9 | % | ||||||
| After-tax income: | ||||||||||||
| Net income | $ | 520 | $ | 429 | $ | 397 | ||||||
| After-tax amounts excluded from GAAP: | ||||||||||||
| Runners Point Group acquisition and integration costs | 2 | 5 | — | |||||||||
| Impairment and other charges | 3 | 1 | 7 | |||||||||
| Gain on sale of property | (3 | ) | — | — | ||||||||
| 53rd week | — | — | (14 | ) | ||||||||
| Settlement of foreign tax audits | — | (3 | ) | (9 | ) | |||||||
| Canadian tax rate changes | — | — | (1 | ) | ||||||||
| Net income (non-GAAP) | $ | 522 | $ | 432 | $ | 380 | ||||||
| Net income margin% | 7.3 | % | 6.6 | % | 6.4 | % | ||||||
| Net income margin% (non-GAAP) | 7.3 | % | 6.6 | % | 6.2 | % | ||||||
| Diluted earnings per share: | ||||||||||||
| Net income | $ | 3.56 | $ | 2.85 | $ | 2.58 | ||||||
| Runners Point Group acquisition and integration costs | 0.01 | 0.03 | — | |||||||||
| Impairment and other charges | 0.02 | 0.01 | 0.05 | |||||||||
| Gain on sale of property | (0.01 | ) | — | — | ||||||||
| 53rd week | — | — | (0.09 | ) | ||||||||
| Settlement of foreign tax audits | — | (0.02 | ) | (0.06 | ) | |||||||
| Canadian tax rate changes | — | — | (0.01 | ) | ||||||||
| Net income (non-GAAP) | $ | 3.58 | $ | 2.87 | $ | 2.47 | ||||||
The Company estimates the tax effect of the non-GAAP adjustments by applying its marginal tax rate to each of the respective items.
During 2013 and 2012, the Company recorded benefits of $3 million and $9 million, or $0.02 per diluted share and $0.06 per diluted share, respectively, to reflect the settlement of foreign tax audits, which resulted in a reduction in tax reserves established in prior periods. Additionally, in 2012, the Company recorded a benefit of $1 million, or $0.01 per diluted share, to reflect the repeal of the last two stages of certain Canadian provincial tax rate changes.
When assessing Return on Invested Capital (“ROIC”), the Company adjusts its results to reflect its operating leases as if they qualified for capital lease treatment. Operating leases are the primary financing vehicle used to fund store expansion and, therefore, we believe that the presentation of these leases as if they were capital leases is appropriate. Accordingly, the asset base and net income amounts are adjusted to reflect this in the calculation of ROIC. ROIC, subject to certain adjustments, is also used as a measure in executive long-term incentive compensation.
The closest U.S. GAAP measure is Return on Assets (“ROA”) and is also represented below. ROA increased to 14.7 percent as compared with 12.5 percent in the prior year reflecting the Company’s overall strong performance in 2014. Our ROIC improvement is due to an increase in our earnings before interest and income taxes, partially offset by an increase in our average invested capital, primarily related to an increase in capitalized operating leases. This reflected the effect of opening larger stores, and resulting additional rent, supporting the various shop-in-shop initiatives.
| 2014 | 2013 | 2012 | ||||||||||
| ROA (1) | 14.7 | % | 12.5 | % | 12.4 | % | ||||||
| ROIC% (non-GAAP)(2) | 15.0 | % | 14.1 | % | 14.2 | % | ||||||
| 2014 | 2013 | 2012 | ||||||||||
| (in millions) | ||||||||||||
| EBIT (non-GAAP) | $ | 816 | $ | 676 | $ | 602 | ||||||
| + Rent expense | 635 | 600 | 560 | |||||||||
| - Estimated depreciation on capitalized operating leases(3) | (482 | ) | (443 | ) | (409 | ) | ||||||
| Net operating profit | 969 | 833 | 753 | |||||||||
| - Adjusted income tax expense(4) | (347 | ) | (298 | ) | (274 | ) | ||||||
| = Adjusted return after taxes | $ | 622 | $ | 535 | $ | 479 | ||||||
| Average total assets | $ | 3,532 | $ | 3,427 | $ | 3,209 | ||||||
| - Average cash, cash equivalents and short-term investments | (917 | ) | (898 | ) | (890 | ) | ||||||
| - Average non-interest bearing current liabilities | (659 | ) | (630 | ) | (592 | ) | ||||||
| - Average merchandise inventories | (1,235 | ) | (1,194 | ) | (1,118 | ) | ||||||
| + Average estimated asset base of capitalized operating leases(3) | 2,093 | 1,829 | 1,552 | |||||||||
| + 13-month average merchandise inventories | 1,325 | 1,269 | 1,200 | |||||||||
| = Average invested capital | $ | 4,139 | $ | 3,803 | $ | 3,361 | ||||||
| ROIC% | 15.0 | % | 14.1 | % | 14.2 | % | ||||||
Overview of Consolidated Results
The following represents our long-term financial objectives and our progress towards meeting those objectives. The following represents non-GAAP results for all the periods presented. In addition, the 2012 results are shown on a 53-week basis.
| Long-term Objectives | 2014 | 2013 | 2012 | |||||||||||||
| Sales (in millions) | $ | 7,500 | $ | 7,151 | $ | 6,505 | $ | 6,101 | ||||||||
| Sales per gross square foot | $ | 500 | $ | 490 | $ | 460 | $ | 443 | ||||||||
| EBIT margin | 11.0 | % | 11.4 | % | 10.4 | % | 9.9 | % | ||||||||
| Net income margin | 7.0 | % | 7.3 | % | 6.6 | % | 6.2 | % | ||||||||
| ROIC | 14.0 | % | 15.0 | % | 14.1 | % | 14.2 | % | ||||||||
Our results in 2014 were very strong and we achieved three of our long-term objectives. Highlights of our 2014 financial performance include:
| 2014 | 2013 | 2012 | ||||||||||
| Sales increase | 9.9 | % | 6.6 | % | 8.5 | % | ||||||
| Comparable-store sales increase | 8.0 | % | 4.2 | % | 9.4 | % | ||||||
Summary of Consolidated Statements of Operations
| 2014 | 2013 | 2012 | ||||||||||
| (in millions, except per share data) | ||||||||||||
| Sales | $ | 7,151 | $ | 6,505 | $ | 6,182 | ||||||
| Gross margin | 2,374 | 2,133 | 2,034 | |||||||||
| Selling, general and administrative expenses | 1,426 | 1,334 | 1,294 | |||||||||
| Depreciation and amortization | 139 | 133 | 118 | |||||||||
| Interest expense, net | 5 | 5 | 5 | |||||||||
| Net income | $ | 520 | $ | 429 | $ | 397 | ||||||
| Diluted earnings per share | $ | 3.56 | $ | 2.85 | $ | 2.58 | ||||||
Sales
All references to comparable-store sales for a given period relate to sales of stores that were open at the period-end and had been open for more than one year. The computation of comparable-store sales also includes the sales of the Direct-to-Customers segment. Stores opened or closed during the period are not included in the comparable-store base; however, stores closed temporarily for relocation or remodeling are included. Computations exclude the effect of foreign currency fluctuations. Sales from acquired businesses that include inventory are included in the computation of comparable-store sales after 15 months of operations. Accordingly, sales of Runners Point Group were included in the computation of comparable-store sales beginning October 2014.
Sales of $7,151 million in 2014 increased by 9.9 percent from sales of $6,505 million in 2013, this represented comparable-store sales of 8.0 percent. Excluding the effect of foreign currency fluctuations and sales of Runners Point Group, sales increased 8.5 percent as compared with 2013.
Sales of $6,505 million in 2013 increased by 5.2 percent from sales of $6,182 million in 2012, this represented comparable-store sales of 4.2 percent. Excluding the effect of foreign currency fluctuations and sales of Runners Point Group, sales increased 2.4 percent as compared with the 53 weeks of 2012. Results for 2012 include the effect of the 53rd week, which represented sales of $81 million.
The following represents the percentage of sales from each of the major product categories:
| 2014 | 2013 | 2012 | ||||||||||
| Footwear sales | 79% | 77% | 76% | |||||||||
| Apparel and accessories sales | 21% | 23% | 24% | |||||||||
Gross Margin
| 2014 | 2013 | 2012 | ||||||||||
| Gross margin rate | 33.2% | 32.8% | 32.9% | |||||||||
| Change in the gross margin rate is comprised of: | 2014 vs. 2013 | 2013 vs. 2012 | ||||||||||
| Occupancy and buyers’ compensation | 0.7 | — | ||||||||||
| Merchandise margin | (0.3) | (0.1) | ||||||||||
| Increase (decrease) in gross margin rate | 0.4% | (0.1)% | ||||||||||
The decrease in the occupancy and buyers’ compensation rate reflects improved leverage of primarily fixed costs. Merchandise margin declined by 30 basis points as the cost of merchandise increased in 2014 as compared with 2013. This primarily reflects the effect of lower initial markups driven by supplier and category mix, and lower shipping and handling margin, partially offset by lower markdowns.
The decline in the gross margin rate in 2013 as compared to 2012 primarily reflects the effect of lower initial markups. Excluding the effect of the 53rd week in 2012, the gross margin rate in 2013 was flat as compared with 2012.
Selling, General and Administrative Expenses (SG&A)
| 2014 | 2013 | 2012 | ||||||||||
| (in millions) | ||||||||||||
| SG&A | $ | 1,426 | $ | 1,334 | $ | 1,294 | ||||||
| $ Change | $ | 92 | $ | 40 | ||||||||
| % Change | 6.9 | % | 3.1 | % | ||||||||
| SG&A as a percentage of sales | 19.9 | % | 20.5 | % | 20.9 | % | ||||||
Excluding the effect of foreign currency fluctuations, SG&A increased by $101 million for 2014 as compared with 2013. Runners Point Group, which was acquired in early July 2013, represented an incremental $39 million in expenses in 2014. Additionally, the Company incurred $2 million in integration costs during 2014. Excluding these items, the increase was driven by higher variable expenses to support sales, such as store wages and banking expenses. As a percentage of sales, SG&A improved 60 basis points representing improved leverage on our sales increase. This improvement reflected continued effective expense management, including store wages, which benefitted from the utilization of hiring and scheduling tools, as well as enhanced associate training.
Excluding the effect of foreign currency fluctuations, SG&A increased by $34 million for 2013 as compared with 2012. Runners Point Group represented an incremental $45 million in expenses. Additionally, the Company incurred $6 million in integration and acquisition costs during 2013. Excluding foreign currency fluctuations, the effect of the acquisition, and the effect of the 53rd week in 2012, SG&A decreased by $4 million. The decrease reflects effective expense management, specifically variable costs.
Depreciation and Amortization
| 2014 | 2013 | 2012 | ||||||||||
| (in millions) | ||||||||||||
| Depreciation and Amortization | $ | 139 | $ | 133 | $ | 118 | ||||||
| % Change | 4.5 | % | 12.7 | % | 7.3 | % | ||||||
The increases in both 2014 and 2013 reflect increased capital spending on store improvements and technology. Excluding the effect of foreign currency fluctuations, depreciation and amortization increased $7 million in 2014. The 2014 amount included $2 million of capital accrual adjustments made during the third quarter of 2014 which reduced depreciation and amortization. The change in 2013 as compared with 2012 also included $6 million of Runners Point Group expense.
Interest Expense, Net
| 2014 | 2013 | 2012 | ||||||||||
| (in millions) | ||||||||||||
| Interest expense | $ | 11 | $ | 11 | $ | 11 | ||||||
| Interest income | (6 | ) | (6 | ) | (6 | ) | ||||||
| Interest expense, net | $ | 5 | $ | 5 | $ | 5 | ||||||
| Weighted-average interest rate (excluding fees) | 7.2 | % | 7.1 | % | 7.6 | % | ||||||
Net interest expense in 2014 was essentially unchanged from 2013 and 2012. The Company did not have any short-term borrowings, other than amounts outstanding in connection with capital leases, for any of the periods presented.
Income Taxes
The effective tax rate for 2014 was 35.7 percent, as compared with 35.3 percent in 2013. The Company regularly assesses the adequacy of the provisions for income tax contingencies in accordance with the applicable authoritative guidance on accounting for income taxes.
As a result, the reserves for unrecognized tax benefits may be adjusted due to new facts and developments, such as changes to interpretations of relevant tax law, assessments from taxing authorities, settlements with taxing authorities, and lapses of statutes of limitations. The effective tax rate for 2014 includes reserve releases totaling $5 million due to audit settlements and lapses of statutes of limitations.
Excluding the reserve releases in 2014 and in 2013, the effective tax rate for 2014 increased slightly as compared with 2013 primarily due to the higher proportion of income earned in higher tax jurisdictions in 2014.
The effective tax rate for 2013 was 35.3 percent, as compared with 34.6 percent in 2012. The effective tax rate for 2013 includes reserve releases totaling $6 million due to audit settlements and lapses of statutes of limitations. Additionally, in connection with the purchase of Runners Point Group, the Company recorded a tax expense of $1 million related to non-deductible acquisition costs. Excluding these items as well as the reserve releases in 2012, the effective tax rate for 2013 decreased as compared with 2012 primarily due to the effect of full implementation of international tax planning initiatives in 2013.
Segment Information
The Company’s two reportable segments, Athletic Stores and Direct-to-Customers, are based on its method of internal reporting. The Company evaluates performance based on several factors, the primary financial measure of which is division results. Division profit reflects income before income taxes, corporate expense, non-operating income, and net interest expense.
| 2014 | 2013 | 2012 | ||||||||||
| (in millions) | ||||||||||||
| Sales | ||||||||||||
| Athletic Stores | $ | 6,286 | $ | 5,790 | $ | 5,568 | ||||||
| Direct-to-Customers | 865 | 715 | 614 | |||||||||
| $ | 7,151 | $ | 6,505 | $ | 6,182 | |||||||
| Operating Results | ||||||||||||
| Athletic Stores(1) | $ | 777 | $ | 656 | $ | 653 | ||||||
| Direct-to-Customers(2) | 109 | 84 | 65 | |||||||||
| Division profit | 886 | 740 | 718 | |||||||||
| Less: Corporate expense (3) | 81 | 76 | 108 | |||||||||
| Operating profit | 805 | 664 | 610 | |||||||||
| Other income(4) | 9 | 4 | 2 | |||||||||
| Earnings before interest expense and income taxes | 814 | 668 | 612 | |||||||||
| Interest expense, net | 5 | 5 | 5 | |||||||||
| Income before income taxes | $ | 809 | $ | 663 | $ | 607 | ||||||
Athletic Stores
| 2014 | 2013 | 2012 | ||||||||||
| (in millions) | ||||||||||||
| Sales | $ | 6,286 | $ | 5,790 | $ | 5,568 | ||||||
| $ Change | $ | 496 | $ | 222 | ||||||||
| % Change | 8.6 | % | 4.0 | % | ||||||||
| Division profit | $ | 777 | $ | 656 | $ | 653 | ||||||
| Division profit margin | 12.4 | % | 11.3 | % | 11.7 | % | ||||||
2014 compared with 2013
Excluding the effect of foreign currency fluctuations, primarily related to the euro and Canadian dollar, sales from the Athletic Stores segment increased 9.4 percent. Comparable-store sales increased by 6.7 percent. This segment includes $133 million of incremental sales related to the Runners Point stores, which were acquired in early July 2013. Excluding the sales of the Runners Point stores, the comparable-store gain was primarily driven by Kids Foot Locker, Foot Locker U.S., Footaction, and Foot Locker Europe. While Lady Foot Locker’s overall sales declined in 2014, the banner experienced a comparable-store gain for the year. The shift into more performance oriented assortments has been resonating with customers, as both footwear and apparel grew on a comparable-store basis. The overall Lady Foot Locker sales decrease primarily reflects a net decline of 44 stores.
Basketball, running, and children’s footwear were strong drivers of sales increases. Sales of basketball footwear were driven by Jordan and key marquee player styles, while running shoes from Nike and Adidas had strong results. Additionally, children’s footwear continued to perform well across multiple divisions. Apparel sales were challenging primarily in Foot Locker Europe and Champs Sports, as customers have shifted away from certain lifestyle and licensed apparel programs, which had previously driven strong results. This segment continues to benefit from strong banner differentiation, which has created unique store designs and product assortments which have resonated with customers and enhanced the shopping experience.
Included in the 2014 division profit was a $1 million impairment charge related to the write-down of a tradename for our stores operating in the Republic of Ireland, reflecting historical and projected underperformance, and a $1 million charge to fully write down the value of a private-label brand acquired as part of the Runners Point Group acquisition, as a result of exiting the product line. The overall improvement primarily reflected higher sales, an improved gross margin rate, and effective control over variable expenses, such as store wages.
2013 compared with 2012
Excluding the effect of foreign currency fluctuations, primarily related to the euro, sales from the Athletic Stores segment increased by 3.7 percent in 2013. Comparable-store sales increased by 3.0 percent. The Athletic Stores segment included $146 million of sales related to the Runners Point stores. Excluding the sales of the Runners Point stores, the increase was primarily driven by Kids Foot Locker, Foot Locker Europe, and Foot Locker U.S. Kids Foot Locker and Foot Locker Europe increased their store count during 2013 by 31 and 14 stores, respectively. The increase in these banners was partially offset by sales declines in Lady Foot Locker, Footaction, and Champs Sports. Lady Foot Locker’s sales declined in 2013 as management closed underperforming stores and redefined the product offerings. Lady Foot Locker’s store count declined by 46 stores during 2013. On a comparable-store sales basis, Footaction reported a modest increase for 2013. Comparable-store sales for Champs Sports were negatively affected, in part, by the level of store remodel projects, which require temporary store closure during remodel.
Within the Athletic Stores segment, footwear was the biggest driver, led by our children’s category, which had strong gains across all banners. Footwear sales increased in our largest category, basketball, which benefited from key marquee player shoes. The segment is also benefiting from the continued expansion of the shop-in-shop partnerships with our various suppliers.
Athletic Stores reported a division profit of $656 million in 2013 as compared with $653 million in 2012, an increase of $3 million. Included in the 2013 results are costs of $2 million associated with the closure of the CCS stores. While the results of the Runners Point stores were accretive during the period, it was not significant.
Additionally, the 2013 results reflect the reallocation of corporate expense to this segment. Excluding these items, division profit margin for 2013 would have been essentially unchanged.
Direct-to-Customers
| 2014 | 2013 | 2012 | ||||||||||
| (in millions) | ||||||||||||
| Sales | $ | 865 | $ | 715 | $ | 614 | ||||||
| $ Change | $ | 150 | $ | 101 | ||||||||
| % Change | 21 | % | 16 | % | ||||||||
| Division profit | $ | 109 | $ | 84 | $ | 65 | ||||||
| Division profit margin | 12.6 | % | 11.7 | % | 10.6 | % | ||||||
2014 compared with 2013
Comparable sales increased 17.8 percent from the prior year, led by basketball and running footwear. The Direct-to-Customers segment includes $18 million of incremental sales related to the e-commerce division of Runners Point Group, which the Company acquired during the second quarter of 2013. Excluding these sales, the increase was primarily a result of continued strong sales performance related to the Company’s store-banner websites both in the U.S. and in Europe, as well as increased Eastbay sales. Of the total increase, sales from our U.S. store-banner websites comprised the majority of the increase, reflecting the continued success of several initiatives, including improving the connectivity of the store banners to the e-commerce sites, enhancements to the mobile e-commerce sites, investments in technology to improve the shopping experience, and investments in making the sites more engaging. These increases were offset, in part, by a decline in the CCS business, which was transitioned to the Eastbay banner during the third quarter of 2014.
Division profit increased by $25 million as compared to 2013, representing a division profit margin improvement of 90 basis points. The 2014 results include a $2 million impairment charge related to the CCS business which was triggered by the Company’s decision to transition the skate business to the Eastbay banner. Gross margin was negatively affected by the liquidation of the CCS merchandise and the effects of providing additional free shipping offers. Notwithstanding this, the increase in division profit was the result of strong flow-through of sales to profit and good expense management.
2013 compared with 2012
Comparable sales increased 14.8 percent from the prior year. The Direct-to-Customers segment included $18 million of sales related to the e-commerce division of Runners Point Group. Excluding these sales, the increase was primarily a result of continued strong sales performance related to the Company’s store-banner websites, as well as increased Eastbay sales. Of the total increase, sales from our store-banner websites comprised approximately three quarters of the increase reflecting success of several e-commerce initiatives. These increases were offset, in part, by a further decline in the CCS business.
The Direct-to-Customers business generated division profit of $84 million in 2013, as compared with $65 million in 2012. The 2013 results reflect the reallocation of corporate expense. Excluding this change, division profit margin would have been 12.3 percent. During 2012, an impairment charge of $7 million was recorded to write down CCS intangible assets. Excluding these items, division profit increased by $17 million. The effect of the Runners Point Group acquisition was not significant to this segment’s 2013 division profit.
Corporate Expense
| 2014 | 2013 | 2012 | ||||||||||
| (in millions) | ||||||||||||
| Corporate expense | $ | 81 | $ | 76 | $ | 108 | ||||||
| $ Change | $ | 5 | $ | (32 | ) | |||||||
Corporate expense consists of unallocated general and administrative expenses as well as depreciation and amortization related to the Company’s corporate headquarters, centrally managed departments, unallocated
insurance and benefit programs, certain foreign exchange transaction gains and losses, and other items. Depreciation and amortization included in corporate expense was $13 million, $12 million, and $13 million in 2014, 2013, and 2012, respectively.
Corporate expense increased by $5 million in 2014, as compared with 2013. This increase is primarily related to incentive compensation and legal costs, which increased $8 million and $2 million, respectively. Additionally, depreciation and amortization included in corporate expense increased by $1 million. These increases were partially offset by the annual adjustment to the allocation of corporate expense to the operating divisions, which reduced corporate expense by $4 million. In addition, acquisition and integration costs related to Runners Point Group were $4 million less in the current year.
Corporate expense decreased by $32 million to $76 million in 2013, as compared with 2012. The allocation of corporate expenses to the operating divisions was increased thereby reducing corporate expense by $27 million for 2013. In addition, incentive compensation decreased by $11 million and legal expenses, which in 2012 included a litigation charge, decreased by $4 million. Additionally, depreciation and amortization expense decreased by $1 million. These decreases were partially offset by $6 million of costs related to the Company’s acquisition and integration of Runners Point Group, as well as an increase of $5 million for share-based compensation expense.
Liquidity and Capital Resources
Liquidity
The Company’s primary source of liquidity has been cash flow from earnings, while the principal uses of cash have been to: fund inventory and other working capital requirements; finance capital expenditures related to store openings, store remodelings, Internet and mobile sites, information systems, and other support facilities; make retirement plan contributions, quarterly dividend payments, and interest payments; and fund other cash requirements to support the development of its short-term and long-term operating strategies. The Company generally finances real estate with operating leases. Management believes its cash, cash equivalents, and future cash flow from operations will be adequate to fund these requirements.
As of January 31, 2015, the Company had $537 million of cash and cash equivalents held in foreign jurisdictions. Because we plan to permanently reinvest our foreign earnings, in accordance with U.S. GAAP, we have not provided for U.S. federal and state income taxes or foreign withholding taxes that may result from potential future remittances of undistributed earnings of foreign subsidiaries. Depending on the source, amount, and timing of a repatriation, some tax may be payable. The Company believes that its cash invested domestically and future domestic cash flows are sufficient to satisfy domestic requirements.
The Company may also from time to time repurchase its common stock or seek to retire or purchase outstanding debt through open market purchases, privately negotiated transactions, or otherwise. Such repurchases, if any, will depend on prevailing market conditions, liquidity requirements, contractual restrictions, and other factors. The amounts involved may be material. As of January 31, 2015, approximately $65 million was remaining on the share repurchase program. On February 17, 2015, the Board of Directors approved a new 3-year, $1 billion share repurchase program extending through January 2018, replacing the Company’s previous $600 million program.
Also on February 17, 2015, the Board of Directors declared a quarterly dividend of $0.25 per share to be paid on May 1, 2015. This dividend represents a 14 percent increase over the Company’s previous quarterly per share amount.
Any material adverse change in customer demand, fashion trends, competitive market forces, or customer acceptance of the Company’s merchandise mix and retail locations, uncertainties related to the effect of competitive products and pricing, the Company’s reliance on a few key suppliers for a significant portion of its merchandise purchases and risks associated with global product sourcing, economic conditions worldwide, the effects of currency fluctuations, as well as other factors listed under the heading “Disclosure Regarding Forward-Looking Statements,” could affect the ability of the Company to continue to fund its needs from business operations.
Maintaining access to merchandise that the Company considers appropriate for its business may be subject to the policies and practices of its key suppliers. Therefore, the Company believes that it is critical to continue to maintain satisfactory relationships with its key suppliers. In 2014 and 2013, the Company purchased approximately 89 percent and 88 percent, respectively, of its merchandise from its top five suppliers and expects to continue to obtain a significant percentage of its athletic product from these suppliers in future periods. Approximately 73 percent in 2014 and 68 percent in 2013 was purchased from one supplier — Nike, Inc.
The Company’s 2015 planned capital expenditures and lease acquisition costs are approximately $220 million. Planned capital expenditures are $218 million and planned lease acquisition costs related to the Company’s operations in Europe are $2 million. The Company’s planned capital expenditures include $176 million related to remodeling and expansion of existing stores and the planned opening of approximately 100 new stores primarily related to Kids Foot Locker, European expansion, and SIX:02. Additionally, the planned spending includes $42 million for the development of information systems and infrastructure, including a new e-commerce order management system, point of sale device enhancements, and further rollout of our merchandise allocation system. The Company has the ability to revise and reschedule much of the anticipated capital expenditure program, should the Company’s financial position require it.
Free Cash Flow (non-GAAP measure)
In addition to net cash provided by operating activities, the Company uses free cash flow as a useful measure of performance and as an indication of the strength of the Company and its ability to generate cash. The Company defines free cash flow as net cash provided by operating activities less capital expenditures (which is classified as an investing activity). The Company believes the presentation of free cash flow is relevant and useful for investors because it allows investors to evaluate the cash generated from the Company’s underlying operations in a manner similar to the method used by management.
Free cash flow is not defined under U.S. GAAP. Therefore, it should not be considered a substitute for income or cash flow data prepared in accordance with U.S. GAAP, and may not be comparable to similarly titled measures used by other companies. It should not be inferred that the entire free cash flow amount is available for discretionary expenditures.
The following table presents a reconciliation of the Company’s net cash flow provided by operating activities, the most directly comparable U.S. GAAP financial measure, to free cash flow.
| 2014 | 2013 | 2012 | ||||||||||
| (in millions) | ||||||||||||
| Net cash provided by operating activities | $ | 712 | $ | 530 | $ | 416 | ||||||
| Capital expenditures | (190 | ) | (206 | ) | (163 | ) | ||||||
| Free cash flow (non-GAAP) | $ | 522 | $ | 324 | $ | 253 | ||||||
Operating Activities
| 2014 | 2013 | 2012 | ||||||||||
| (in millions) | ||||||||||||
| Net cash provided by operating activities | $ | 712 | $ | 530 | $ | 416 | ||||||
| $ Change | $ | 182 | $ | 114 | ||||||||
The amount provided by operating activities reflects income adjusted for non-cash items and working capital changes. Adjustments to net income for non-cash items include non-cash impairment charges, depreciation and amortization, deferred income taxes, share-based compensation expense and related tax benefits. The improvement in 2014 represented the Company’s earnings strength and working capital improvements. During 2014, the Company contributed $6 million to its Canadian qualified pension plans as compared with $2 million contributed in 2013. Cash paid for income taxes was $251 million for 2014 as compared with $175 million for 2013.
The improvement in 2013 as compared with 2012 also reflected the Company’s earnings strength. During 2012, the Company contributed $25 million and $1 million to its U.S. and Canadian qualified pension plans, respectively. Cash paid for income taxes was $175 million for 2013 as compared with $230 million for 2012.
Investing Activities
| 2014 | 2013 | 2012 | ||||||||||
| (in millions) | ||||||||||||
| Net cash used in investing activities | $ | 176 | $ | 248 | $ | 212 | ||||||
| $ Change | $ | (72 | ) | $ | 36 | |||||||
Capital expenditures in 2014 were $190 million, primarily related to the remodeling of 319 stores, the build-out of 86 new stores, and various corporate technology upgrades. This represented a decrease of $16 million as compared with the prior year, as the timing of certain projects shifted to later in the current year. During 2014, the Company sold real estate for proceeds of $5 million and recorded a gain on sale of $4 million. During 2014, maturities of short-term investments totaled $9 million. This compares with net sales and maturities of $37 million of short-term investments during 2013.
During 2013, the Company completed its purchase of Runners Point Group for $81 million, net of cash acquired. Capital expenditures in 2013 were $206 million, primarily related to the remodeling of 320 stores, the build-out of 84 new stores, and various corporate technology upgrades. This represented an increase of $43 million as compared with 2012. Net sales and maturities of short-term investments were $37 million during 2013, as compared with net purchases of $49 million during 2012.
Financing Activities
| 2014 | 2013 | 2012 | ||||||||||
| (in millions) | ||||||||||||
| Net cash used in financing activities | $ | 401 | $ | 309 | $ | 181 | ||||||
| $ Change | $ | 92 | $ | 128 | ||||||||
Cash used in financing activities consists primarily of the Company’s return to shareholders initiatives, including its share repurchase program and cash dividend payments, as follows:
| 2014 | 2013 | 2012 | ||||||||||
| (in millions) | ||||||||||||
| Share repurchases | $ | 305 | $ | 229 | $ | 129 | ||||||
| Dividends paid on common stock | 127 | 118 | 109 | |||||||||
| Total returned to shareholders | $ | 432 | $ | 347 | 238 | |||||||
During 2014, 2013, and 2012, the Company repurchased 5,888,698 shares, 6,424,286 shares, and 4,000,161 shares of its common stock under its share repurchase programs. Additionally, the Company declared and paid dividends representing a quarterly rate of $0.22, $0.20 and $0.18 per share in 2014, 2013, and 2012, respectively.
Offsetting the amounts above were proceeds received from the issuance of common stock and treasury stock in connection with the employee stock programs of $22 million, $30 million, and $48 million for 2014, 2013, and 2012, respectively. In connection with stock option exercises, the Company recorded excess tax benefits related to share-based compensation of $12 million, $9 million, and $11 million for 2014, 2013, and 2012, respectively.
The activity during 2014 also reflected payments on capital lease obligations of $3 million, as compared with $1 million during 2013. These obligations were recorded in connection with the acquisition of the Runners Point Group.
Capital Structure
The 2011 Restated Credit Agreement provides for a $200 million asset based revolving credit facility maturing on January 27, 2017. In addition, during the term of the 2011 Restated Credit Agreement, the Company may make up to four requests for additional credit commitments in an aggregate amount not to exceed $200 million. Interest is based on the LIBOR rate in effect at the time of the borrowing plus a 1.25 to 1.50 percent margin depending on certain provisions as defined in the 2011 Restated Credit Agreement.
The 2011 Restated Credit Agreement provides for a security interest in certain of the Company’s domestic assets, including certain inventory assets, but excluding intellectual property. The Company is not required to comply with any financial covenants as long as there are no outstanding borrowings. With regard to the payment of dividends and share repurchases, there are no restrictions if the Company is not borrowing and the payments are funded through cash on hand. If the Company is borrowing, Availability as of the end of each fiscal month during the subsequent projected six fiscal months following the payment must be at least 20 percent of the lesser of the Aggregate Commitments and the Borrowing Base (all terms as defined in the 2011 Restated Credit Agreement). The Company’s management currently does not expect to borrow under the facility in 2015, other than amounts used to support standby letters of credit.
Credit Rating
As of March 30, 2015, the Company’s corporate credit ratings from Standard & Poor’s and Moody’s Investors Service are BB+ and Ba1, respectively. In addition, Moody’s Investors Service has rated the Company’s senior unsecured notes Ba2.
Debt Capitalization and Equity (non-GAAP Measure)
For purposes of calculating debt to total capitalization, the Company includes the present value of operating lease commitments in total net debt. Total net debt including the present value of operating leases is considered a non-GAAP financial measure. The present value of operating leases is discounted using various interest rates ranging from 2.8 percent to 14.5 percent, which represent the Company’s incremental borrowing rate at inception of the lease. Operating leases are the primary financing vehicle used to fund store expansion and, therefore, we believe that the inclusion of the present value of operating leases in total debt is useful to our investors, credit constituencies, and rating agencies.
The following table sets forth the components of the Company’s capitalization, both with and without the present value of operating leases:
| 2014 | 2013 | |||||||||||
| (in millions) | ||||||||||||
| Long-term debt and obligations under capital leases | $ | 134 | $ | 139 | ||||||||
| Present value of operating leases | 2,745 | 2,571 | ||||||||||
| Total debt including the present value of operating leases | 2,879 | 2,710 | ||||||||||
| Less: | ||||||||||||
| Cash and cash equivalents | 967 | 858 | ||||||||||
| Short-term investments | — | 9 | ||||||||||
| Total net debt including the present value of operating leases | 1,912 | 1,843 | ||||||||||
| Shareholders’ equity | 2,496 | 2,496 | ||||||||||
| Total capitalization | $ | 4,408 | $ | 4,339 | ||||||||
| Total net debt capitalization percent | — | % | — | % | ||||||||
| Total net debt capitalization percent including the present value of | ||||||||||||
| operating leases (non-GAAP) | 43.4 | % | 42.5 | % | ||||||||
The Company’s cash, cash equivalents, and short-term investments increased by $100 million during 2014, which was the result of strong cash flow generation from operating activities. Including the present value of operating leases, the Company’s net debt capitalization percent increased 90 basis points in 2014. The change in total debt including the present value of the operating leases, as compared with the prior-year period, primarily reflects the effect of lease renewals, partially offset by foreign exchange fluctuations.
Contractual Obligations and Commitments
The following tables represent the scheduled maturities of the Company’s contractual cash obligations and other commercial commitments at January 31, 2015:
| Payments Due by Fiscal Period | ||||||||||||||||||||
| Total | 2015 | 2016 – 2017 | 2018 – 2019 | 2020 and Beyond | ||||||||||||||||
| (in millions) | ||||||||||||||||||||
| Long-term debt(1) | $ | 195 | $ | 11 | $ | 22 | $ | 22 | $ | 140 | ||||||||||
| Operating leases(2) | 3,426 | 567 | 969 | 726 | 1,164 | |||||||||||||||
| Capital leases | 4 | 2 | 2 | — | — | |||||||||||||||
| Other long-term liabilities(3) | — | — | — | — | — | |||||||||||||||
| Total contractual cash obligations | $ | 3,625 | $ | 580 | $ | 993 | $ | 748 | $ | 1,304 | ||||||||||
| Other Commercial Commitments | ||||||||||||||||||||
| Purchase commitments(4) | 2,238 | 2,238 | — | — | — | |||||||||||||||
| Other(5) | 24 | 15 | 9 | — | — | |||||||||||||||
| Total commercial commitments | $ | 2,262 | $ | 2,253 | $ | 9 | $ | — | $ | — | ||||||||||
Off-Balance Sheet Arrangements
The majority the Company’s contractual obligations relate to operating leases for our stores. Future scheduled lease payments under non-cancellable operating leases as of January 31, 2015 are described in the table underContractual Obligations and Commitmentsabove and with additional information in theLeasesnote in “Item 8. Consolidated Financial Statements and Supplementary Data.”
The Company does not participate in transactions that generate relationships with unconsolidated entities or financial partnerships, including variable interest entities. Our policy prohibits the use of derivatives for which there is no underlying exposure.
In connection with the sale of various businesses and assets, the Company may be obligated for certain lease commitments transferred to third parties and pursuant to certain normal representations, warranties, or indemnifications entered into with the purchasers of such businesses or assets. Although the maximum potential amounts for such obligations cannot be readily determined, management believes that the resolution of such contingencies will not significantly affect the Company’s consolidated financial position, liquidity, or results of operations. The Company is also operating certain stores for which lease agreements are in the process of being negotiated with landlords. Although there is no contractual commitment to make these payments, it is likely that leases will be executed.
Critical Accounting Policies
Management’s responsibility for integrity and objectivity in the preparation and presentation of the financial statements requires diligent application of appropriate accounting policies. Generally, the Company’s accounting policies and methods are those specifically required by U.S. generally accepted accounting principles. Included in theSummary of Significant Accounting Policiesnote in “Item 8. Consolidated Financial Statements and Supplementary Data” is a summary of the Company’s most significant accounting policies. In some cases, management is required to calculate amounts based on estimates for matters that are inherently uncertain. The Company believes the following to be the most critical of those accounting policies that necessitate subjective judgments.
Merchandise Inventories and Cost of Sales
Merchandise inventories for the Company’s Athletic Stores are valued at the lower of cost or market using the retail inventory method (“RIM”). The RIM is commonly used by retail companies to value inventories at cost and calculate gross margins due to its practicality. Under the retail method, cost is determined by applying a cost-to-retail percentage across groupings of similar items, known as departments. The cost-to-retail percentage is applied to ending inventory at its current owned retail valuation to determine the cost of ending inventory on a department basis. The RIM is a system of averages that requires management’s estimates and assumptions regarding markups, markdowns and shrink, among others, and as such, could result in distortions of inventory amounts.
Significant judgment is required for these estimates and assumptions, as well as to differentiate between promotional and other markdowns that may be required to correctly reflect merchandise inventories at the lower of cost or market. The Company provides reserves based on current selling prices when the inventory has not been marked down to market. The failure to take permanent markdowns on a timely basis may result in an overstatement of cost under the retail inventory method. The decision to take permanent markdowns includes many factors, including the current retail environment, inventory levels, and the age of the item. Management believes this method and its related assumptions, which have been consistently applied, to be reasonable.
Impairment of Long-Lived Assets, Goodwill and Other Intangibles
The Company performs an impairment review when circumstances indicate that the carrying value of long-lived tangible and intangible assets with finite lives may not be recoverable. Management’s policy in determining whether an impairment indicator exists, a triggering event, comprises measurable operating performance criteria at the division level as well as qualitative measures. If an analysis is necessitated by the occurrence of a triggering event, the Company uses assumptions, which are predominately identified from the Company’s strategic long-range plans, in performing an impairment review. In the calculation of the fair value of long-lived assets, the Company compares the carrying amount of the asset with the estimated future cash flows expected to result from the use of the asset. If the carrying amount of the asset exceeds the estimated expected undiscounted future cash flows, the Company measures the amount of the impairment by comparing the carrying amount of the asset with its estimated fair value. The estimation of fair value is measured by discounting expected future cash flows at the Company’s weighted-average cost of capital. Management believes its policy is reasonable and is consistently applied. Future expected cash flows are based upon estimates that, if not achieved, may result in significantly different results.
The Company reviews goodwill for impairment annually during the first quarter of its fiscal year or more frequently if impairment indicators arise. The review of impairment consists of either using a qualitative approach to determine whether it is more likely than not that the fair value of the assets is less than their respective carrying values or a two-step impairment test, if necessary. In performing the qualitative assessment, management considers many factors in evaluating whether the carrying value of goodwill may not be recoverable, including declines in stock price and market capitalization in relation to the book value of the Company and macroeconomic conditions affecting retail. If, based on the results of the qualitative assessment, it is concluded that it is not more likely than not that the fair value of a reporting unit exceeds its carrying value, additional quantitative impairment testing is performed using a two-step test. The initial step requires that the carrying value of each reporting unit be compared with its estimated fair value. The second step — to evaluate goodwill of a reporting unit for impairment — is only required if the carrying value of that reporting unit exceeds its estimated fair value.
In 2014, the Company elected to perform its review of goodwill using the two-step impairment test approach. The Company used a combination of a discounted cash flow approach and market-based approach to determine the fair value of a reporting unit. The determination of discounted cash flows of the reporting units and assets and liabilities within the reporting units requires significant estimates and assumptions. These estimates and assumptions primarily include, but are not limited to, the discount rate, terminal growth rates, earnings before depreciation and amortization, and capital expenditures forecasts. The market approach requires judgment and uses one or more methods to compare the reporting unit with similar businesses, business ownership interests, or securities that have been sold. Due to the inherent uncertainty involved in making these estimates, actual results could differ from those estimates. The Company has evaluated the merits of each significant assumption, both individually and in the aggregate, used to determine the fair value of the reporting units, as well as the fair values of the corresponding assets and liabilities within the reporting units, and concluded they are reasonable and are consistent with prior valuations. The fair value of all the reporting units substantially exceeded their carrying values.
Owned trademarks and tradenames that have been determined to have indefinite lives are not subject to amortization but are reviewed at least annually for potential impairment. The fair values of purchased intangible assets are estimated and compared to their carrying values. We estimate the fair value of these intangible assets based on an income approach using the relief-from-royalty method. This methodology assumes that, in lieu of ownership, a third party would be willing to pay a royalty in order to exploit the related benefits of these types of assets. This approach is dependent on a number of factors, including estimates of future growth and trends, royalty rates in the category of intellectual property, discount rates, and other variables. We base our fair value estimates on assumptions we believe to be reasonable, but which are unpredictable and inherently uncertain. Actual future results may differ from those estimates. We recognize an impairment loss when the estimated fair value of the intangible asset is less than the carrying value. During 2014, impairment charges totaled $4 million.
Share-Based Compensation
The Company estimates the fair value of options granted using the Black-Scholes option pricing model. The Black-Scholes option pricing valuation model requires the use of subjective assumptions. Changes in these assumptions, listed below, can materially affect the fair value of the options.
Risk-free Interest Rate — The risk-free interest rate is determined using the Federal Reserve nominal rates for U.S. Treasury zero-coupon bonds with maturities similar to those of the expected term of the award being valued.
Expected Volatility — The Company estimates the expected volatility of its common stock at the grant date using a weighted-average of the Company’s historical volatility and implied volatility from traded options on the Company’s common stock. A 50 basis point change in volatility would cause a 1 percent change to the fair value.
Expected Term — The expected term of options granted is estimated using historical exercise and post-vesting employment termination patterns, which the Company believes are representative of future behavior. Changing the expected term by one year changes the fair value by 7 to 8 percent depending on if the change was an increase or decrease to the expected term.
Dividend Yield — The expected dividend yield is derived from the Company’s historical experience. A 50 basis point change to the dividend yield would change the fair value by approximately 5 percent.
Share-based compensation expense is recorded for those awards expected to vest using an estimated forfeiture rate based on the Company’s historical pre-vesting forfeiture data, which it believes are representative of future behavior, and periodically will revise those estimates in subsequent periods if actual forfeitures differ from those estimates.
Pension and Postretirement Liabilities
Management reviews all assumptions used to determine its obligations for pension and postretirement liabilities annually with its independent actuaries, taking into consideration existing and future economic conditions and the Company’s intentions with regard to the plans. The assumptions used are:
Long-Term Rate of Return — The expected rate of return on plan assets is the long-term rate of return expected to be earned on the plans’ assets and is recognized as a component of pension expense. The rate is based on the plans’ weighted-average target asset allocation, as well as historical and future expected performance of those assets. The target asset allocation is selected to obtain an investment return that is sufficient to cover the expected benefit payments and to reduce future contributions by the Company. The expected rate of return on plan assets is reviewed annually and revised, as necessary, to reflect changes in the financial markets and our investment strategy. The weighted-average long-term rate of return used to determine 2014 pension expense was 6.25 percent.
A decrease of 50 basis points in the weighted-average expected long-term rate of return would have increased 2014 pension expense by approximately $3 million. The actual return on plan assets in a given year typically differs from the expected long-term rate of return, and the resulting gain or loss is deferred and amortized into expense over the average life expectancy of its inactive participants.
Discount Rate — An assumed discount rate is used to measure the present value of future cash flow obligations of the plans and the interest cost component of pension expense and postretirement income. The cash flows are then discounted to their present value and an overall discount rate is determined. The discount rate is determined by reference to the Bond:Link interest rate model based upon a portfolio of highly rated U.S. corporate bonds with individual bonds that are theoretically purchased to settle the plan’s anticipated cash outflows. The discount rate selected to measure the present value of the Company’s Canadian benefit obligations was developed by using the plan’s bond portfolio indices, which match the benefit obligations. The weighted-average discount rates used to determine the 2014 benefit obligations related to the Company’s pension and postretirement plans were 3.43 percent and 3.40 percent, respectively.
Changing the weighted-average discount rate by 50 basis points would have changed the accumulated benefit obligation of the pension plans at January 31, 2015 by approximately $35 million and $38 million, depending on if the change was an increase or decrease, respectively. A decrease of 50 basis points in the weighted-average discount rate would have increased the accumulated benefit obligation on the postretirement plan by approximately $2 million. Such a decrease would not have significantly changed 2014 pension expense or postretirement income.
Trend Rate — The Company maintains two postretirement medical plans, one covering certain executive officers and key employees of the Company (“SERP Medical Plan”), and the other covering all other associates. With respect to the SERP Medical Plan, a one percent change in the assumed health care cost trend rate would change this plan’s accumulated benefit obligation by approximately $4 million and $3 million, depending on if the change was an increase or decrease, respectively. With respect to the postretirement medical plan covering all other associates, there is limited risk to the Company for increases in health care costs since, beginning in 2001, new retirees have assumed the full expected costs and then-existing retirees have assumed all increases in such costs.
Mortality Assumptions — In 2014, the Company changed the mortality table used to calculate the present value of pension and postretirement plan liabilities, excluding the SERP Medical Plan. We previously used the RP 2000 mortality table projected with scale AA to 2019 for males and to 2013 for females. In 2014, we used the RP 2000 mortality table with generational projection using scale AA for both males and females. This mortality table was chosen after considering alternative tables including the RP-2014 table. We chose the RP 2000 table because it resulted in the closest match to the Company’s actual experience. For the SERP Medical Plan, the mortality assumption was updated to the RP 2014 table with generational projection using MP 2014. These changes did not significantly affect the Company’s total obligations.
The Company expects to record postretirement income of approximately $1 million and pension expense of approximately $16 million in 2015.
Income Taxes
In accordance with U.S. GAAP, deferred tax assets are recognized for tax credit and net operating loss carryforwards, reduced by a valuation allowance, which is established when it is more likely than not that some portion or all of the deferred tax assets will not be realized. Management is required to estimate taxable income for future years by taxing jurisdiction and to use its judgment to determine whether or not to record a valuation allowance for part or all of a deferred tax asset. Estimates of taxable income are based upon the Company’s strategic long-range plans. A one percent change in the Company’s overall statutory tax rate for 2014 would have resulted in a $5 million change in the carrying value of the net deferred tax asset and a corresponding charge or credit to income tax expense depending on whether the tax rate change was a decrease or an increase.
The Company has operations in multiple taxing jurisdictions and is subject to audit in these jurisdictions. Tax audits by their nature are often complex and can require several years to resolve. Accruals of tax contingencies require management to make estimates and judgments with respect to the ultimate outcome of tax audits. Actual results could vary from these estimates.
The Company expects its 2015 effective tax rate to approximate 36.5 percent, excluding the effect of any nonrecurring items that may occur. The actual tax rate will vary depending primarily on the level and mix of income earned in the United States as compared with its international operations.
Recent Accounting Pronouncements
Descriptions of the recently issued accounting principles, if any, and the accounting principles adopted by the Company during the year ended January 31, 2015 are included in theSummary of Significant Accounting Policiesnote in “Item 8. Consolidated Financial Statements and Supplementary Data.”
Disclosure Regarding Forward-Looking Statements
This report contains forward-looking statements within the meaning of the federal securities laws. Other than statements of historical facts, all statements which address activities, events, or developments that the Company anticipates will or may occur in the future, including, but not limited to, such things as future capital expenditures, expansion, strategic plans, financial objectives, dividend payments, stock repurchases, growth of the Company’s business and operations, including future cash flows, revenues, and earnings, and other such matters, are forward-looking statements. These forward-looking statements are based on many assumptions and factors which are detailed in the Company’s filings with the U.S. Securities and Exchange Commission, including the effectsCommission.
These forward-looking statements are based largely on our expectations and judgments and are subject to a number of currency fluctuations, customer demand, fashion trends, competitive market forces,risks and uncertainties, related to the effectmany of competitive productswhich are unforeseeable and pricing, customer acceptance of the Company’s merchandise mix and retail locations, the Company’s reliance on a few key suppliers for a majority of its merchandise purchases (including a significant portion from one key supplier), pandemics and similar major health concerns, unseasonable weather, deterioration of global financial markets, economic conditions worldwide, deterioration of business and economic conditions, any changes in business, political and economic conditions due to the threat of future terrorist activities in the United States or in other parts of the world and related U.S. military action overseas, the ability of the Company to execute its business and strategic plans effectively with regard to each of its business units, and risks associated with global product sourcing, including political instability, changes in import regulations, and disruptions to transportation services and distribution.
beyond our control. For additional discussion on risks and uncertainties that may affect forward-looking statements, see “Risk Factors” in Part I, Item 1A. Any changes in such assumptions or factors could produce significantly different results. The Company undertakes no obligation to update forward-looking statements, whether as a result of new information, future events, or otherwise.
Business Overview
Foot Locker, Inc., through its subsidiaries, operates in two reportable segments — Athletic Stores and Direct-to-Customers. The Athletic Stores segment is one of the largest athletic footwear and apparel retailers in the world, with formats that include Foot Locker, Kids Foot Locker, Lady Foot Locker, Champs Sports, Footaction, Runners Point, Sidestep, and SIX:02. The Direct-to-Customers segment includes Footlocker.com, Inc. and other affiliates, including Eastbay, Inc., and our international e-commerce businesses, which sell to customers through their Internet and mobile sites and catalogs.
The Foot Locker brand is one of the most widely recognized names in the markets in which we operate, epitomizing premium quality for the active lifestyle customer. This brand equity has aided our ability to successfully develop and increase our portfolio of complementary retail store formats, such as Lady Foot Locker and Kids Foot Locker, as well as Footlocker.com, part of our direct-to-customer business. Through various marketing channels and experiences, including social, digital, broadcast, and print media, as well as various sports sponsorships and events, we reinforce our image with a consistent message — namely, that we are the destination for premium athletically-inspired shoes and apparel with a wide selection of merchandise in a full-service environment.
Store Profile
|
|
|
|
|
|
|
|
|
|
|
|
|
|
|
|
|
|
|
|
|
| Square Footage | |
| January 28, |
|
| February 3, | Relocations/ | (in thousands) | |
| 2017 | Opened | Closed | 2018 | Remodels | Selling | Gross |
Foot Locker U.S. | 948 | 4 | 42 | 910 | 44 | 2,430 | 4,225 |
Foot Locker Europe | 622 | 24 | 10 | 636 | 47 | 957 | 2,071 |
Foot Locker Canada | 119 | 1 | 9 | 111 | 6 | 264 | 431 |
Foot Locker Asia Pacific | 95 | 5 | 2 | 98 | 9 | 140 | 230 |
Kids Foot Locker | 411 | 39 | 14 | 436 | 25 | 747 | 1,285 |
Lady Foot Locker | 124 | — | 39 | 85 | — | 115 | 195 |
Champs Sports | 545 | 4 | 8 | 541 | 23 | 1,934 | 2,994 |
Footaction | 261 | 13 | 14 | 260 | 21 | 829 | 1,374 |
Runners Point | 122 | 1 | 5 | 118 | — | 150 | 258 |
Sidestep | 86 | — | 3 | 83 | 8 | 76 | 131 |
SIX:02 | 30 | 3 | 1 | 32 | — | 65 | 109 |
Total | 3,363 | 94 | 147 | 3,310 | 183 | 7,707 | 13,303 |
14
Athletic Stores
We operated 3,310 stores in the Athletic Stores segment as of the end of 2017. The following is a brief description of the Athletic Stores segment’s operating businesses:
Foot Locker — Foot Locker is a leading global youth culture brand that connects the sneaker obsessed consumer with the most innovative and culturally relevant sneakers and apparel. Across all of our consumer touchpoints (stores, websites, mobile apps, social media), Foot Locker enables consumers to fulfill their desire to be part of sneaker and youth culture. We curate special product assortments and marketing content that supports our premium position – from leading global brands such as Nike, Jordan, adidas, and Puma, as well as new and emerging brands in the athletic and lifestyle space. We connect emotionally with our consumers through a combination of global brand events and highly targeted and personalized experiences in local markets. Foot Locker’s 1,755 stores are located in 24 countries including 910 in the United States, Puerto Rico, U.S. Virgin Islands, and Guam, 111 in Canada, 636 in Europe, and a combined 98 in Australia and New Zealand. Our domestic stores have an average of 2,700 selling square feet and our international stores have an average of 1,600 selling square feet.
Kids Foot Locker — Kids Foot Locker offers the largest selection of brand-name athletic footwear, apparel and accessories for children. Our stores, websites and social media channels feature products, content and experiences geared toward youth sneaker culture. Of our 436 stores, 375 are located in the United States, Puerto Rico, and the U.S. Virgin Islands, 40 in Europe, 19 in Canada, and a combined 2 in Australia and New Zealand. These stores have an average of 1,700 selling square feet.
Lady Foot Locker — Lady Foot Locker is a U.S. retailer of athletic footwear, apparel, and accessories dedicated to sneaker-obsessed young women. Our stores provide premium sneakers and apparel, carefully selected to reflect the latest styles. Lady Foot Locker operates 85 stores that are located in the United States and Puerto Rico. These stores have an average of 1,400 selling square feet.
Champs Sports — Champs Sports is one of the largest mall-based specialty athletic footwear and apparel retailers in North America. With a focus on the lifestyle expression of sport, Champs Sports’ product categories include athletic footwear and apparel, and sport-lifestyle inspired accessories. This assortment allows Champs Sports to offer the best head-to-toe fashion stories representing the most powerful athletic brands, sports teams, and athletes in North America. Of our 541 stores, 512 are located throughout the United States, Puerto Rico, and the U.S. Virgin Islands and 29 in Canada. The Champs Sports stores have an average of 3,600 selling square feet.
Footaction — Footaction is a North American athletic footwear and apparel retailer that offers the freshest, best edited selection of athletic lifestyle brands and looks. This banner is uniquely positioned at the intersection of sport and style, with a focus on authentic, premium product. The primary consumer is a style-obsessed, confident, influential young male who is always dressed to impress. Of our 260 stores, 258 are located throughout the United States and Puerto Rico and 2 are in Canada. The Footaction stores have an average of 3,200 selling square feet.
Runners Point— Runners Point specializes in running footwear, apparel, and equipment for both performance and lifestyle purposes. This banner offers athletically inspired premium products and personalized service. Runners Point also caters to local running communities providing technical products, training tips and access to local running and group events, while also serving their lifestyle running needs. Our 118 stores are located in Germany, Austria, and Switzerland. Runners Point stores have an average of 1,300 selling square feet.
Sidestep— Sidestep is a predominantly athletic fashion footwear banner. Our 83 stores are located in Germany, Austria, the Netherlands, and Switzerland. Sidestep caters to a more discerning, fashion forward consumer. Sidestep stores have an average of 900 selling square feet.
SIX:02 — SIX:02 is for women who want to look and feel great both at the gym and in everyday life. This banner provides stylish casual and fitness looks for women on the go. SIX:02 is unique in the market place because of the ability to feature both footwear and apparel assortments across many brands – from traditional athletic brands, such as Nike, adidas and Puma – to new up-and-coming brands. Whether she is working out, going out or just hanging out, SIX:02 has an expansive selection of apparel, footwear, and accessories to choose from. SIX:02 operates 32 stores in the United States and have an average of 2,000 selling square feet.
15
Direct-to-Customers
Our Direct-to-Customers segment is multi-branded and sells directly to customers through Internet and mobile sites and catalogs. The Direct-to-Customers segment operates the websites for eastbay.com, final-score.com, and eastbayteamsales.com. Additionally, this segment includes the websites, both desktop and mobile, aligned with the brand names of our store banners (footlocker.com, ladyfootlocker.com, six02.com, kidsfootlocker.com, champssports.com, footaction.com, footlocker.ca, footlocker.eu, footlocker.au, runnerspoint.com, and sidestep-shoes.com). These sites offer some of the largest online selections of athletically inspired shoes and apparel, while providing a seamless link between e-commerce and physical stores.
Eastbay— Eastbay is among the largest direct marketers in the United States, providing serious high school and other athletes with a complete sports solution including athletic footwear, apparel, equipment, and team licensed merchandise for a broad range of sports.
Franchise Operations
The Company operates franchised Foot Locker stores located within the Middle East, as well as franchised stores in Germany under the Runners Point banner. In addition, we entered into a franchise agreement during 2017 with Fox-Wizel Ltd for franchised stores operating in Israel. Also during 2017, we terminated our franchise agreement with the third party that operated stores in the Republic of Korea.
A total of 112 franchised stores were operating at February 3, 2018, 14 were operating in Germany and 98 were operating in the Middle East, of which 25 are in Israel.
U.S. Tax Reform
On December 22, 2017, the United States enacted tax reform legislation (“Tax Act”) that included a broad range of business tax provisions, including but not limited to a reduction in the U.S. corporate income tax rate from 35 percent to 21 percent as well as provisions that limit or eliminate various deductions or credits. The legislation also results in certain U.S. allocated expenses (e.g. interest and general administrative expenses) to be taxed and imposes a new tax on U.S. cross-border payments. Furthermore, the legislation includes a one-time transition tax on accumulated foreign earnings and profits.
In response to the enactment of the Tax Act, the SEC issued Staff Accounting Bulletin No. 118 which provides guidance to address the complexity in accounting for this new legislation. When the initial accounting for items under the new legislation is incomplete, the guidance allows us to recognize provisional amounts when reasonable estimates can be made or to continue to apply the prior tax law if a reasonable estimate cannot be made. The SEC has provided up to a one-year window for companies to finalize the accounting for the effect of this new legislation and we anticipate finalizing our accounting during 2018. While our accounting for the new U.S. tax legislation is not complete, we have made reasonable estimates for some provisions and recognized a $99 million tax liability for the mandatory deemed repatriation of foreign sourced net earnings and a change in our permanent reinvestment assertion. The remeasurement of our deferred tax assets and liabilities was not significant. The 2017 charge for these provisions reflects our best estimate based on information currently available and our current interpretation of the Tax Act.
The Tax Act includes a provision effective in 2018, to tax global intangible low-taxed income ("GILTI") of the Company’s foreign subsidiaries. Under generally accepted accounting principles (“GAAP”), we can make an accounting policy election to either treat taxes due on the GILTI inclusion as a current period expense, or factor such amounts into our measurement of deferred taxes. Due to the complexity of the new GILTI rules, we are continuing to evaluate this provision of the Tax Act and the application of GAAP and we have not yet elected an accounting policy.
As of the date of this Form 10-K, we are continuing to evaluate the accounting for this legislation. We continue to assemble and analyze all the information required to prepare and analyze these effects and await additional guidance from the U.S. Treasury Department, the IRS or other standard-setting bodies. Additionally, we continue to analyze other information. Accordingly, we may record additional provisional amounts or adjustments to provisional amounts. Any subsequent adjustments will be recorded to tax expense in the quarter when the analysis is complete. See Critical Accounting Policies within this item and Note 17, Income Taxes in “Item 8. Consolidated Financial Statements and Supplementary Data” for further details on U.S. tax reform.
16
Reconciliation of Non-GAAP Measures
In addition to reporting the Company’s financial results in accordance with GAAP, the Company reports certain financial results that differ from what is reported under GAAP. In the following tables, we have presented certain financial measures and ratios identified as non-GAAP such as sales excluding 53rd week, Earnings Before Interest and Taxes (“EBIT”), adjusted EBIT, adjusted EBIT margin, adjusted income before income taxes, adjusted net income, adjusted net income margin, adjusted diluted earnings per share, Return on Invested Capital (“ROIC”), free cash flow, and net debt capitalization. We present these non-GAAP measures because we believe they assist investors in comparing our performance across reporting periods on a consistent basis by excluding items that are not indicative of our core business or which affect comparability. In addition, these non-GAAP measures are useful in assessing our progress in achieving our long-term financial objectives.
Additionally, we present certain amounts as excluding the effects of foreign currency fluctuations, which are also considered non-GAAP measures. Throughout the following discussions, where amounts are expressed as excluding the effects of foreign currency fluctuations, such changes are determined by translating all amounts in both years using the prior-year average foreign exchange rates. Presenting amounts on a constant currency basis is useful to investors because it enables them to better understand the changes in our businesses that are not related to currency movements.
Fiscal year 2017 represents the fifty-three weeks ended February 3, 2018. Accordingly, certain non-GAAP results have also been adjusted to exclude the effects of the 53rd week to assist in comparability.
We estimate the tax effect of the non-GAAP adjustments by applying a marginal rate to each of the respective items. The income tax items represent the discrete amount that affected the period.
The non-GAAP financial information is provided in addition to, and not as an alternative to, our reported results prepared in accordance with GAAP. Presented below is a reconciliation of GAAP and non-GAAP results discussed throughout this Annual Report on Form 10-K. Please see the non-GAAP reconciliations for free cash flow and net debt capitalization in the “Liquidity and Capital Resources” section.
|
|
|
|
|
|
|
|
|
|
|
|
| 2017 |
| 2016 |
| 2015 |
| |||
| ($ in millions) |
| ||||||||
Sales |
| $ | 7,782 |
| $ | 7,766 |
| $ | 7,412 |
|
53rd week |
|
| 95 |
|
| — |
|
| — |
|
Sales excluding 53rd week (non-GAAP) |
| $ | 7,687 |
| $ | 7,766 |
| $ | 7,412 |
|
|
|
|
|
|
|
|
|
|
|
|
Pre-tax income: |
|
|
|
|
|
|
|
|
|
|
Income before income taxes |
| $ | 578 |
| $ | 1,004 |
| $ | 837 |
|
Pre-tax adjustments excluded from GAAP: |
|
|
|
|
|
|
|
|
|
|
Litigation and other charges (1) |
|
| 211 |
|
| 6 |
|
| 105 |
|
53rd week |
|
| (25) |
|
| — |
|
| — |
|
Adjusted income before income taxes (non-GAAP) |
| $ | 764 |
| $ | 1,010 |
| $ | 942 |
|
|
|
|
|
|
|
|
|
|
|
|
Calculation of Earnings Before Interest and Taxes (EBIT): |
|
|
|
|
|
|
|
|
|
|
Income before income taxes |
| $ | 578 |
| $ | 1,004 |
| $ | 837 |
|
Interest (income) / expense, net |
|
| (2) |
|
| 2 |
|
| 4 |
|
EBIT |
| $ | 576 |
| $ | 1,006 |
| $ | 841 |
|
|
|
|
|
|
|
|
|
|
|
|
Adjusted income before income taxes |
| $ | 764 |
| $ | 1,010 |
| $ | 942 |
|
Interest (income) / expense, net |
|
| (2) |
|
| 2 |
|
| 4 |
|
Adjusted EBIT |
| $ | 762 |
| $ | 1,012 |
| $ | 946 |
|
|
|
|
|
|
|
|
|
|
|
|
EBIT margin % |
|
| 7.4 | % |
| 13.0 | % |
| 11.3 | % |
Adjusted EBIT margin % |
|
| 9.9 | % |
| 13.0 | % |
| 12.8 | % |
17
|
| 2017 |
| 2016 |
| 2015 |
| |||
| ($ in millions, except per share amounts) |
| ||||||||
After-tax income: |
|
|
|
|
|
|
|
|
|
|
Net income |
| $ | 284 |
| $ | 664 |
| $ | 541 |
|
After-tax adjustments excluded from GAAP: |
|
|
|
|
|
|
|
|
|
|
Litigation and other charges, net of income tax benefit of $78, $1, and $40 million, respectively (1) |
|
| 133 |
|
| 5 |
|
| 65 |
|
U.S. tax reform (2) |
|
| 99 |
|
| — |
|
| — |
|
Income tax valuation allowances (3) |
|
| 8 |
|
| — |
|
| — |
|
Tax expense related to French tax rate change (4) |
|
| 2 |
|
| 2 |
|
| — |
|
Tax benefit related to enacted change in foreign branch currency regulations (5) |
|
| — |
|
| (9) |
|
| — |
|
Tax benefit related to intellectual property reassessment (6) |
|
| — |
|
| (10) |
|
| — |
|
53rd week, net of income tax expense of $9 million |
|
| (16) |
|
| — |
|
| — |
|
Adjusted net income (non-GAAP) |
| $ | 510 |
| $ | 652 |
| $ | 606 |
|
|
|
|
|
|
|
|
|
|
|
|
Earnings per share: |
|
|
|
|
|
|
|
|
|
|
Diluted EPS |
| $ | 2.22 |
| $ | 4.91 |
| $ | 3.84 |
|
Diluted EPS amounts excluded from GAAP: |
|
|
|
|
|
|
|
|
|
|
Litigation and other charges (1) |
|
| 1.02 |
|
| 0.03 |
|
| 0.45 |
|
U.S. tax reform (2) |
|
| 0.78 |
|
| — |
|
| — |
|
Income tax valuation allowances (3) |
|
| 0.07 |
|
| — |
|
| — |
|
Tax expense related to French tax rate change (4) |
|
| 0.02 |
|
| 0.02 |
|
| — |
|
Tax benefit related to enacted change in foreign branch currency regulations (5) |
|
| — |
|
| (0.07) |
|
| — |
|
Tax benefit related to intellectual property reassessment (6) |
|
| — |
|
| (0.07) |
|
| — |
|
53rd week |
|
| (0.12) |
|
| — |
|
| — |
|
Adjusted diluted EPS (non-GAAP) |
| $ | 3.99 |
| $ | 4.82 |
| $ | 4.29 |
|
|
|
|
|
|
|
|
|
|
|
|
Net income margin % |
|
| 3.6 | % |
| 8.6 | % |
| 7.3 | % |
Adjusted net income margin % |
|
| 6.6 | % |
| 8.4 | % |
| 8.2 | % |
(1) | Litigation and other charges for 2017 includes a pension litigation charge ($178 million, or $111 million after-tax), severance and related costs ($13 million, or $8 million after-tax), and non-cash impairment charges ($20 million, or $14 million after-tax). The 2016 amount represents non-cash impairment charges of $6 million, or $5 million after-tax. The 2015 amount includes a charge of $100 million related to the pension litigation ($61 million after-tax) and non-cash impairment charges of $5 million ($4 million after-tax). Pension litigation - The Company recorded pre-tax charges of $50 million and $128 million in connection with its U.S. retirement plan litigation during the second and fourth quarters of 2017, respectively. The Company had previously recorded a pre-tax charge for $100 million during 2015. These charges reflect the Company’s revised estimate of its exposure for this matter, bringing the total pre-tax amount accrued to $278 million. The Company has exhausted all of its legal remedies and will reform the pension plan as required by the court rulings. Severance and related costs – The Company recorded a pre-tax charge of $13 million during the third quarter of 2017 associated with the reorganization and the reduction of staff taken to improve efficiency. Impairment charges – The Company recognized pre-tax non-cash impairment charges totaling $20 million during the fourth quarter of 2017. These charges were associated with our SIX:02, Runners Point, and Sidestep businesses and primarily represented the write-down of store fixtures and leasehold improvements. The 2016 and 2015 amounts related to Runners Point and Sidestep. |
(2) | On December 22, 2017, the United States enacted tax reform legislation that included a broad range of business tax provisions. The recognized charge was based on current interpretation of the tax law changes and includes a $99 million tax liability for the mandatory deemed repatriation of foreign sourced net earnings and a corresponding change in our permanent reinvestment assertion under ASC 740-30. The effect of remeasurement of our deferred tax assets and liabilities was not significant. Our accounting for the new legislation is not complete and we have made reasonable estimates for some tax provisions. We exclude the discrete U.S. tax reform effect from our Adjusted diluted EPS as it does not reflect our ongoing tax obligations under U.S. tax reform. |
(3) | During the fourth quarter of 2017, the Company determined that certain valuation allowances should be established against deferred tax assets associated with the Runners Point and Sidestep stores and e-commerce businesses. |
(4) | During the fourth quarters of 2017 and 2016, the Company recognized tax expense of $2 million in both periods in connection to two separate tax rate reductions in France. |
(5) | In the fourth quarter of 2016, the U.S. Treasury issued regulations under Internal Revenue Code Section 987, which required us to change our method for determining the tax effects of foreign currency translation gains and losses for our foreign businesses that are operated as branches and are reported in a currency other than the currency of their parent. This change resulted in an increase to deferred tax assets and a corresponding reduction in our income tax provision in the amount of $9 million. |
(6) | During the third quarter of 2016, we performed a scheduled reassessment of the value of the intellectual property provided to our European business by Foot Locker in the U.S. during the fourth quarter of 2012. The new, higher valuation resulted in catch-up deductions that reduced tax expense by $10 million. |
18
ROIC is presented below and represents a non-GAAP measure. We believe it is a meaningful measure because it quantifies how efficiently we generated operating income relative to the capital we have invested in the business. In order to calculate ROIC, we adjust our results to reflect our operating leases as if they qualified for capital lease treatment. Operating leases are the primary financing vehicle used to fund store expansion and, therefore, we believe that the presentation of these leases as if they were capital leases is appropriate. Accordingly, the asset base and net income amounts are adjusted to reflect this in the calculation of ROIC. ROIC, subject to certain adjustments, is also used as a measure in executive long-term incentive compensation.
The closest U.S. GAAP measure to ROIC is Return on Assets (“ROA”) and is also represented below. ROA decreased to 7.3 percent as compared to 17.4 percent in the prior year, with the decline primarily due to litigation and other charges recorded during 2017, as well as a provisional charge of $99 million relating to tax reform as discussed earlier in this section.
Our ROIC decreased to 11.0 percent in 2017, as compared to 15.1 percent in the prior year. Average invested capital increased compared with the prior year and earnings declined, which resulted in the overall decrease in ROIC. Average invested capital increased as a result of the effect of opening larger stores, as well as signing certain high-profile leases with longer lease terms. The earnings decline is more fully discussed on the following pages.
|
|
|
|
|
|
|
|
|
|
|
|
| 2017 |
| 2016 |
| 2015 | ||||
ROA (1) |
|
| 7.3 | % |
| 17.4 | % |
| 14.7 | % |
ROIC % |
|
| 11.0 | % |
| 15.1 | % |
| 15.8 | % |
(1) | Represents net income of $284 million, $664 million, and $541 million divided by average total assets of $3,901 million, $3,808 million, and $3,676 million for 2017, 2016, and 2015, respectively. |
Calculation of ROIC:
|
|
|
|
|
|
|
|
|
|
|
|
| 2017 |
| 2016 |
| 2015 |
| |||
|
| ($ in millions) |
| |||||||
Adjusted EBIT |
| $ | 762 |
| $ | 1,012 |
| $ | 946 |
|
+ Rent expense |
|
| 735 |
|
| 690 |
|
| 640 |
|
- Estimated depreciation on capitalized operating leases (1) |
|
| (593) |
|
| (552) |
|
| (498) |
|
Adjusted net operating profit |
|
| 904 |
|
| 1,150 |
|
| 1,088 |
|
- Adjusted income tax expense (2) |
|
| (304) |
|
| (409) |
|
| (391) |
|
= Adjusted return after taxes (3) |
| $ | 600 |
| $ | 741 |
| $ | 697 |
|
Average total assets |
| $ | 3,901 |
| $ | 3,808 |
| $ | 3,676 |
|
- Average cash and cash equivalents |
|
| (948) |
|
| (1,034) |
|
| (994) |
|
- Average non-interest bearing current liabilities |
|
| (614) |
|
| (656) |
|
| (697) |
|
- Average merchandise inventories |
|
| (1,293) |
|
| (1,296) |
|
| (1,268) |
|
+ Average estimated asset base of capitalized operating leases (1) |
|
| 2,978 |
|
| 2,687 |
|
| 2,346 |
|
+ 13-month average merchandise inventories |
|
| 1,413 |
|
| 1,388 |
|
| 1,337 |
|
= Average invested capital |
| $ | 5,437 |
| $ | 4,897 |
| $ | 4,400 |
|
ROIC % |
|
| 11.0 | % |
| 15.1 | % |
| 15.8 | % |
(1) | The determination of the capitalized operating leases and the adjustments to income have been calculated on a lease-by-lease basis and have been consistently calculated in each of the years presented above. Capitalized operating leases represent the best estimate of the asset base that would be recorded for operating leases as if they had been classified as capital or as if the property were purchased. The present value of operating leases is discounted using various interest rates ranging from 2.5 percent to 14.5 percent, which represents our incremental borrowing rate at inception of the lease. The capitalized operating leases and related income statement amounts disclosed above do not reflect the requirements of Accounting Standards Update 2016-02, Leases. |
(2) | The adjusted income tax expense represents the marginal tax rate applied to net operating profit for each of the periods presented. |
(3) | The adjusted return after taxes does not include interest expense that would be recorded on a capital lease. |
19
Overview of Consolidated Results
The following represents our long-term objectives and our progress towards meeting those objectives. Non-GAAP results are presented for all the periods. Please see “Reconciliation of Non-GAAP Measures” earlier in this section for further information relating to non-GAAP measures, including why we believe they are useful and how they are calculated.
|
|
|
|
|
|
|
|
|
|
|
|
|
|
|
| Long-term |
|
|
|
|
|
|
|
|
|
| |
|
| Objectives |
| 2017 |
| 2016 |
| 2015 |
| ||||
Sales ($ in millions) |
| $ | 10,000 |
| $ | 7,782 |
| $ | 7,766 |
| $ | 7,412 |
|
Sales per gross square foot |
| $ | 600 |
| $ | 495 |
| $ | 515 |
| $ | 504 |
|
Adjusted net income margin % |
|
| 8.5 | % |
| 6.6 | % |
| 8.4 | % |
| 8.2 | % |
Adjusted EBIT margin % |
|
| 12.5 | % |
| 9.9 | % |
| 13.0 | % |
| 12.8 | % |
ROIC % |
|
| 17.0 | % |
| 11.0 | % |
| 15.1 | % |
| 15.8 | % |
Highlights of our 2017 financial performance include:
· | Despite a challenging retail year, the Company remained highly profitable and our financial position is strong. We are well positioned for the future. |
· | Total sales increased 0.2 percent to a record $7,782 million, with the 53rd week contributing $95 million of sales. Footwear sales represented 82 percent of total sales for all periods presented. The overall comparable-sales gains of 6.9 percent in our Direct-to-Customer segment was not enough to offset the declines experienced by our Athletic Store Segment, which experienced a comparable-store sales decline of 4.7 percent. |
|
|
|
|
|
|
|
|
|
|
|
|
| 2017 |
| 2016 |
| 2015 |
| |||
Sales increase |
|
| 0.2 | % |
| 4.8 | % |
| 3.6 | % |
Comparable-store sales (decrease) / increase |
|
| (3.1) | % |
| 4.3 | % |
| 8.5 | % |
· | Sales of the Direct-to-Customers segment increased by 8.5 percent to $1,109 million, compared with $1,022 million in 2016 and increased 110 basis points as a percentage of total sales to 14.3 percent. The direct business has been steadily increasing as a percentage of total sales over the last several years, led by the continued growth and expansion into new geographies of our store banners’ e-commerce businesses. |
· | Gross margin, as a percentage of sales, decreased by 230 basis points to 31.6 percent in 2017. The decline was primarily driven by a decrease in our merchandise margin rate, reflecting a higher markdown rate as compared with the prior year. The 53rd week contributed an improvement to the gross margin rate of 20 basis points. |
· | SG&A expenses were 19.3 percent of sales, an increase of 30 basis points as compared with the prior year, and primarily reflected store wage pressures. The 53rd week did not significantly affect the SG&A expense rate. |
· | EBIT margin was 7.4 percent and our adjusted EBIT margin was 9.9 percent in 2017. As compared with the prior year, the decline in the adjusted EBIT margin from 13.0 percent to 9.9 percent reflected lower pre-tax income, which was primarily due to lower gross margin and higher SG&A expenses described above. |
· | Net income was $284 million, or $2.22 diluted earnings per share, a decrease of 54.8 percent from the prior-year period. Adjusted net income was $510 million, or $3.99 diluted earnings per share, a decline of 17.2 percent from the corresponding non-GAAP prior-year period. |
· | Net income margin decreased to 3.6 percent as compared with 8.6 percent in the prior year. Our adjusted net income margin declined to 6.6 percent in 2017 as compared to 8.4 percent in the prior year. |
Highlights of our financial position for the period ended February 3, 2018 include:
· | We ended the year in a strong financial position. At year end, we had $724 million of cash and cash equivalents, net of debt. Cash and cash equivalents at February 3, 2018 were $849 million. |
· | Net cash provided by operating activities was $813 million, representing a $31 million decrease over last year, related to the earnings decline partially offset by substantial working capital improvements. |
· | Cash capital expenditures during 2017 totaled $274 million and were primarily directed to the remodeling or relocation of 183 stores, the build-out of 94 new stores, as well as other technology and infrastructure projects. |
· | During 2017 we returned significant amounts of cash to our shareholders. Dividends totaling $157million were declared and paid during 2017, and 12.4 million shares were repurchased under our share repurchase program at a cost of $467 million. |
20
Summary of Consolidated Statements of Operations
|
|
|
|
|
|
|
|
|
|
|
|
|
|
|
|
|
|
| 2017 |
| 2016 |
| 2015 | |||
| (in millions, except per share data) | |||||||
Sales | $ | 7,782 |
| $ | 7,766 |
| $ | 7,412 |
Gross margin |
| 2,456 |
|
| 2,636 |
|
| 2,505 |
Selling, general and administrative expenses |
| 1,501 |
|
| 1,472 |
|
| 1,415 |
Depreciation and amortization |
| 173 |
|
| 158 |
|
| 148 |
Interest (income) / expense, net |
| (2) |
|
| 2 |
|
| 4 |
Net income | $ | 284 |
| $ | 664 |
| $ | 541 |
Diluted earnings per share | $ | 2.22 |
| $ | 4.91 |
| $ | 3.84 |
Sales
All references to comparable-store sales for a given period relate to sales of stores that were open at the period-end and had been open for more than one year. The computation of consolidated comparable-store sales also includes the sales of the Direct-to-Customers segment. Stores opened or closed during the period are not included in the comparable-store base; however, stores closed temporarily for relocation or remodeling are included. Computations exclude the effect of foreign currency fluctuations. Comparable-store sales for 2017 does not include the sales from the 53rd week.
Sales of $7,782 million in 2017 increased by 0.2 percent from sales of $7,766 million in 2016. Results from 2017 include the effect of the 53rd week, which represented sales of $95 million. Excluding the effect of foreign currency fluctuations, sales declined 0.5 percent as compared with 2016. Comparable-store sales declined 3.1percent during 2017 as compared with 2016. Sales of $7,766 million in 2016 increased by 4.8 percent from sales of $7,412 million in 2015, this represented a comparable-store sales increase of 4.3 percent. Excluding the effect of foreign currency fluctuations, sales increased 5.2 percent as compared with 2015.
Gross Margin
|
|
|
|
|
|
|
|
|
|
|
|
|
|
|
|
|
|
|
|
| 2017 |
| 2016 |
| 2015 |
| |||
Gross margin rate |
| 31.6 | % |
| 33.9 | % |
| 33.8 | % |
Basis point (decrease) / increase in the gross margin rate |
| (230) |
|
| 10 |
|
|
|
|
Components of the change- |
|
|
|
|
|
|
|
|
|
Merchandise margin rate (decline) / improvement |
| (160) |
|
| 20 |
|
|
|
|
Higher occupancy and buyers' compensation expense rate |
| (70) |
|
| (10) |
|
|
|
|
Gross margin is calculated as sales minus cost of sales. Cost of sales includes: the cost of merchandise, freight, distribution costs including related depreciation expense, shipping and handling, occupancy and buyers’ compensation. Occupancy costs include rent, common area maintenance charges, real estate taxes, general maintenance, and utilities.
The gross margin rate decreased to 31.6 percent in 2017 as compared to 33.9 percent in the prior year. The decline in the merchandise margin rate in 2017 primarily reflects a higher markdown rate in both our Athletic Stores and Direct-to-Customer segments. The higher markdowns were the result of a more promotional environment and were necessary to ensure merchandise inventory remained current and in line with the sales trend. Although to a lesser degree, a decline in our shipping and handling revenue also negatively affected the merchandise margin for the Direct-to-Customer segment. The decline in the gross margin rate also reflects an increase in the occupancy and buyers’ compensation rate as compared to 2016. Rent-related costs continued to increase while our sales were relatively flat. The increase in rent-related costs was primarily driven by recently entering into leases for high-profile locations.
Gross margin in 2016 improved 10 basis points to 33.9 percent as compared with 2015. The improvement was driven by a lower markdown rate, primarily in our Athletic Stores segment, due to an increase in full-priced selling. This improvement was partially offset by increased promotional activity within our Direct-to-Customers segment. The change in the gross margin rate also reflected an increase in the occupancy and buyers’ compensation rate compared to 2015. This pressured our gross margin rate as certain high-profile locations were closed for remodeling for all or part of 2016, which increased the occupancy expense rate since these locations were not generating sales while incurring tenancy costs.
21
Selling, General and Administrative Expenses (SG&A)
|
|
|
|
|
|
|
|
|
|
|
|
|
|
|
|
|
|
|
|
| 2017 |
| 2016 |
| 2015 |
| |||
| ($ in millions) | ||||||||
SG&A | $ | 1,501 |
| $ | 1,472 |
| $ | 1,415 |
|
$ Change | $ | 29 |
| $ | 57 |
|
|
|
|
% Change |
| 2.0 | % |
| 4.0 | % |
|
|
|
SG&A as a percentage of sales |
| 19.3 | % |
| 19.0 | % |
| 19.1 | % |
SG&A increased by $29 million and 2.0 percent in 2017, as compared with the prior year. As a percentage of sales, the SG&A rate increased by 30 basis points as compared with 2016. Excluding the effect of foreign currency fluctuations, SG&A increased by $16 million compared to the prior year. The 53rd week contributed $16 million of additional expenses, however as a percent of sales the SG&A rate remained unchanged at 19.3 percent.
The rise in the SG&A expense rate during 2017 primarily relates to the Athletic Stores segment, partially offset by a decline in the Direct-to-Customers segment’s SG&A rate. The Athletic Stores segment reflected an increase in store-related compensation costs as a result of increased minimum wage levels. Additionally, we incurred higher expenses related to wages, such as payroll taxes and benefits. These increases in the SG&A expense rate were partially offset by declines in incentive compensation and marketing related costs.
SG&A increased by $57 million in 2016 as compared with 2015. As a percentage of sales, the SG&A rate in 2016 decreased by 10 basis points as compared with 2015, which reflected diligent expense management specifically in store wages by our Athletic Stores segment and was partially offset by increased marketing costs incurred by our Direct-to-Customers segment in order to drive traffic to its websites.
Depreciation and Amortization
|
|
|
|
|
|
|
|
|
|
|
|
|
|
|
|
|
|
|
|
| 2017 |
| 2016 |
| 2015 |
| |||
| ($ in millions) | ||||||||
Depreciation and amortization | $ | 173 |
| $ | 158 |
| $ | 148 |
|
$ Change | $ | 15 |
| $ | 10 |
|
|
|
|
% Change |
| 9.5 | % |
| 6.8 | % |
|
|
|
Depreciation and amortization increased $15 million in 2017 as compared with 2016. Excluding the effect of foreign currency fluctuations, depreciation and amortization increased $13 million as compared with the prior year. The increases in both 2017 and 2016 reflect a rise in capital spending on store improvements, the enhancement of our digital sites, and various other technologies and infrastructure. The increase in 2016 as compared with 2015 also reflected capital spending on our relocated corporate headquarters.
Litigation and Other Charges
Litigation and other charges recorded totaled $211 million, $6 million, and $105 million for 2017, 2016, and 2015, respectively.
Related to our pension litigation, we recorded charges totaling $178 million during 2017. We previously recorded a $100 million pension litigation charge during 2015. These charges relate to a class action in which the plaintiffs alleged that the Company failed to properly disclose the effects of the 1996 conversion of the U.S. retirement plan to a defined benefit plan with a cash balance formula. In February 2018, the Company’s Petition for Writ of Certiorari with the U.S. Supreme Court was denied. Accordingly, the Company must reform the pension plan consistent with the trial court’s order. The Company has estimated that the cost of plan reformation is $278 million as of February 3, 2018 based upon our current understanding of the court order. This amount will increase with interest until paid, as required by the provisions of the required plan reformation. The Company is currently formulating the actions and steps necessary to reform the plan.
During 2017, we reduced and reorganized our division and corporate staff which resulted in a charge of $13 million. The substantial majority of the charge was for severance and related costs.
22
Impairment charges recorded during 2017 totaled $20 million. The charges related to the write-down of store fixtures and leasehold improvements of our SIX:02, Runners Point, and Sidestep stores. During 2016 and 2015, we also recorded non-cash impairment charges totaling $6 million and $4 million, respectively, relating to the write down of store fixtures and leasehold improvements for our Runners Point and Sidestep stores. Also during 2015, we recorded a non-cash impairment charge totaling $1 million to fully write down the value of an e-commerce trade name.
Interest (Income) / Expense, Net
|
|
|
|
|
|
|
|
|
|
|
|
|
|
|
|
|
|
|
|
| 2017 |
| 2016 |
| 2015 |
| |||
| ($ in millions) | ||||||||
Interest expense | $ | 12 |
| $ | 11 |
| $ | 11 |
|
Interest income |
| (14) |
|
| (9) |
|
| (7) |
|
Interest (income) / expense, net | $ | (2) |
| $ | 2 |
| $ | 4 |
|
Weighted-average interest rate (excluding fees) |
| 7.3 | % |
| 7.2 | % |
| 7.2 | % |
The changes during 2017 and 2016 primarily relate to the amounts earned as interest income. Interest income increased by $5 million in 2017 as compared with 2016, and increased $2 million in 2016 as compared with 2015. The increase for both periods primarily represented increased income due to higher average interest rates on our cash investments. We did not have any short-term borrowings, other than small amounts related to capital leases, for any of the periods presented.
Income Taxes
Our effective tax rate for 2017 was 50.8 percent, as compared with 33.9 percent in 2016. The increase was primarily attributable to the Tax Act. We recorded a provisional tax of $99 million for the mandatory deemed repatriation of historical foreign sourced net earnings and related items. The tax effect of the remeasurement of our deferred tax assets and liabilities was not significant. Also contributing to the increased rate was tax expense of $8 million related to the establishment of certain valuation allowances against the deferred tax assets associated with Runners Point, Sidestep, and their respective e-commerce businesses. In both 2017 and 2016 we recorded tax expense of $2 million for two separate tax rate reductions in France. Partially offsetting these increases were $9 million in excess tax benefits reflecting the change required by ASC 718 adopted during 2017.
We regularly assess the adequacy of provisions for income tax contingencies in accordance with the applicable authoritative guidance on accounting for income taxes. As a result, reserves for unrecognized tax benefits may be adjusted due to new facts and developments, such as changes to interpretations of relevant tax law, assessments from taxing authorities, settlements with taxing authorities, and lapses of statutes of limitations. The effective tax rate, for both 2017 and 2016, includes reserve releases totaling $1 million due to audit settlements and lapses of statutes of limitations.
In the fourth quarter of 2016, the U.S. Treasury issued regulations under Internal Revenue Code Section 987, which required us to change our method for determining the tax effects of foreign currency translation gains and losses for our foreign businesses that are operated as branches and are reported in a currency other than the currency of their parent. This change resulted in an increase to deferred tax assets and a corresponding reduction in our income tax provision in the amount of $9 million. Also during 2016, we performed a scheduled reassessment of the value of the intellectual property provided to our European business by Foot Locker in the U.S. during the fourth quarter of 2012. The new, higher valuation resulted in catch-up deductions that reduced tax expense by $10 million.
Excluding the provisional repatriation and related items, the establishment of valuation allowances, the effects of excess tax benefits, the effect of the charges recorded during 2017, the IP valuation catch-up deductions in 2016, and the effect of Section 987 Regulations on 2016, the effective tax rate for 2017 decreased as compared with 2016, primarily due to the partial year benefit of the federal income tax rate reduction as well as mix of income.
The effective tax rate for 2016 was 33.9 percent, as compared with 35.4 percent in 2015. Excluding the reserve releases, the effects of the IP valuation catch-up deductions, the French rate change, the effect of Section 987 Regulations, and the pension litigation charge in 2015, the effective tax rate for 2016 decreased slightly as compared with 2015, primarily due to the mix of income as well as current year tax benefit related to the higher IP valuation.
23
Segment Information
As of February 3, 2018, we had two reportable segments, Athletic Stores and Direct-to-Customers, which were based on our method of internal reporting. We evaluate performance based on several factors, the primary financial measure of which is division results. Division profit reflects income before income taxes, pension litigation and reorganization charges, corporate expense, non-operating income, and net interest (income) / expense. Effective as of the beginning of fiscal year 2018, the Company will report one reportable segment based upon the change in our method of internal reporting.
|
|
|
|
|
|
|
|
|
|
|
|
|
|
|
|
|
|
|
|
|
| 2017 |
| 2016 |
| 2015 | |||
Sales |
| ($ in millions) | |||||||
Athletic Stores |
| $ | 6,673 |
| $ | 6,744 |
| $ | 6,468 |
Direct-to-Customers |
|
| 1,109 |
|
| 1,022 |
|
| 944 |
|
| $ | 7,782 |
| $ | 7,766 |
| $ | 7,412 |
Operating Results |
|
|
|
|
|
|
|
|
|
Athletic Stores |
| $ | 675 |
| $ | 927 |
| $ | 872 |
Direct-to-Customers |
|
| 135 |
|
| 143 |
|
| 142 |
Division profit |
|
| 810 |
|
| 1,070 |
|
| 1,014 |
Less: Pension litigation and reorganization charges |
|
| 191 |
|
| — |
|
| 100 |
Less: Corporate expense |
|
| 48 |
|
| 70 |
|
| 77 |
Operating profit |
|
| 571 |
|
| 1,000 |
|
| 837 |
Other income |
|
| 5 |
|
| 6 |
|
| 4 |
Earnings before interest expense and income taxes |
|
| 576 |
|
| 1,006 |
|
| 841 |
Interest (income) / expense, net |
|
| (2) |
|
| 2 |
|
| 4 |
Income before income taxes |
| $ | 578 |
| $ | 1,004 |
| $ | 837 |
|
|
|
|
|
|
|
|
|
|
|
|
|
|
|
|
|
|
|
|
|
|
Athletic Stores |
| 2017 |
| 2016 |
| 2015 |
| |||
|
| ($ in millions) |
| |||||||
Sales |
| $ | 6,673 |
| $ | 6,744 |
| $ | 6,468 |
|
$ Change |
| $ | (71) |
| $ | 276 |
|
|
|
|
% Change |
|
| (1.1) | % |
| 4.3 | % |
|
|
|
Division profit |
| $ | 675 |
| $ | 927 |
| $ | 872 |
|
Division profit margin |
|
| 10.1 | % |
| 13.7 | % |
| 13.5 | % |
2017 compared with 2016
Excluding the effect of foreign currency fluctuations, sales from our Athletic Stores segment decreased by 1.9 percent. The sales decline during 2017, excluding the effect of foreign currency fluctuations, was across almost all of our store banners. The Company experienced declines in sales of footwear and accessories, partially offset by a gain in apparel sales.
Comparable-store sales decreased by 4.7 percent during 2017, as compared with the corresponding prior-year period. The overall decline in comparable-store sales was primarily driven by a decrease in footwear sales. The decline in footwear sales reflected a lack of depth and variety of innovative new product at the premium end of the athletic footwear market to suit our customers’ quickly-changing style preferences. Children’s and women’s footwear sales were the major contributors to the comparable-store declines in footwear, although men’s footwear also experienced a modest comparable-store decline. Women’s court styles primarily contributed to the comparable-store decline in women’s footwear, particularly in Foot Locker, Lady Foot Locker, and Foot Locker Europe. The comparable store-sales decrease in children’s footwear mostly reflected declines in the basketball category. All of our store banners, with the exception of Foot Locker Canada, experienced declines in men’s footwear. Gains in men’s lifestyle running shoes were not enough to compensate for the comparable-store sales declines in basketball and court lifestyle footwear, again due to insufficient product depth.
The comparable-store sales increase in apparel as compared to the prior year was across almost all of our store banners, with gains experienced across all genders. The gain in men’s apparel sales was driven by strong results in branded outerwear partially offset by declines in sales of private label and licensed apparel.
24
Included in our 2017 division profit was a non-cash impairment charge of $20 million related to the write-down of primarily store fixtures and leasehold improvements. SIX:02 recorded a charge of $16 million and our Runners Point and Sidestep stores recorded a charge of $4 million. The effect of the impairment charges decreased the division profit rate by 30 basis points. Most of the remaining decline in the division profit rate was related to a decrease in the merchandise margin rate reflecting higher markdowns coupled with an increase in the SG&A rate. The division profit decline was most pronounced in our European business. The 53rd week did not have a significant effect on the overall division profit rate.
2016 compared with 2015
Excluding the effect of foreign currency fluctuations, sales from our Athletic Stores segment increased by 4.7percent. Of the total increase, 69 percent was generated by our domestic businesses, with almost all banners contributing to the growth. Champs Sports produced the best domestic performance, while internationally the increase was driven by our Foot Locker Europe operations. Partially offsetting these increases were declines in our Lady Foot Locker and our Runners Point and Sidestep banners. The Lady Foot Locker sales decline primarily represented the effect of store closures. The Runners Point and Sidestep banners continued to experience sales declines during 2016 as a result of assortment and traffic challenges. During 2016, we continued our focus on improving these banners by better diversifying and refining our product offerings, along with providing a more elevated in-store experience. During 2015 and 2016, we began broadening the assortment in the Runners Point stores beyond performance running to include more lifestyle running products, while the Sidestep stores shifted to lifestyle and casual footwear.
Comparable-store sales increased by 3.6 percent as compared with 2015. Footwear sales continued to be the primary contributor to our sales growth during 2016 and reflected strong gains across men’s, children’s, and women’s footwear categories. Our children’s footwear business had a very successful year, experiencing comparable-store gains across almost all of our store banners, led by sales from Champs Sports and Kids Foot Locker. During 2016, we opened 45 new Kids Foot Locker stores, 16 of which are in Europe or Canada. The addition of these stores reflected our expectation that the momentum of our children’s business would continue. Within footwear, lifestyle running was the strongest category, while our basketball business slightly declined for the year.
Our apparel sales also generated positive results during 2016. This category was led primarily by gains in branded and private-label apparel sales at Champs Sports. Foot Locker Europe’s apparel sales also increased during 2016 and was driven by sales of men’s branded apparel.
Division profit, as a percentage of sales, increased 20 basis points as compared with 2015. During 2016, a $6million non-cash impairment charge was recorded to write down the value of store fixtures and leasehold improvements for 116 Runners Point and Sidestep stores. Excluding the effect of the impairment charge, division profit, as a percentage of sales, increased 30 basis points as compared with 2015. The division profit rate improvement reflected an improved merchandise margin rate due to a lower markdown rate coupled with diligent expense management.
|
|
|
|
|
|
|
|
|
|
|
|
|
|
|
|
|
|
|
|
|
|
Direct-to-Customers |
| 2017 |
| 2016 |
| 2015 |
| |||
|
| ($ in millions) |
| |||||||
Sales |
| $ | 1,109 |
| $ | 1,022 |
| $ | 944 |
|
$ Change |
| $ | 87 |
| $ | 78 |
|
|
|
|
% Change |
|
| 8.5 | % |
| 8.3 | % |
|
|
|
Division profit |
| $ | 135 |
| $ | 143 |
| $ | 142 |
|
Division profit margin |
|
| 12.2 | % |
| 14.0 | % |
| 15.0 | % |
2017 compared with 2016
Comparable-sales for the Direct-to-Customers segment increased 6.9 percent as compared with the prior year. The comparable-sales gain primarily reflected growth in our domestic and international store-banner e-commerce businesses coupled with an increase in our Eastbay business. Internationally, we continued to expand the geographies that we serve in 2017, including most notably launching our e-commerce business in Australia.
25
The footwear category, across men’s, women’s and children’s, was the main driver for the overall comparable-sales gains experienced for this segment. Combined, apparel and accessories sales increased modestly. The men’s and women’s lifestyle running category and men’s basketball styles primarily drove the increase in footwear sales. Additionally, the children’s footwear category contributed to the overall increase.
Direct-to-Customers division profit, as a percent of sales, declined 180 basis points as compared with the prior year. Although sales increased during the year, the gross margin rate declined as a result of increased markdowns due to a more promotional sales environment, including additional free shipping offers that reduced our shipping and handling revenue and thereby deteriorated our gross margin. The gross margin rate decline was partially offset by an expense rate improvement relating to lower marketing costs and incentive compensation.
2016 compared with 2015
Comparable-sales for the Direct-to-Customers segment increased 8.8 percent as compared with 2015. Our domestic and international store-banner websites continued to represent the majority of the overall growth in sales, which was partially offset by declines in the Eastbay, Runners Point, and Sidestep e-commerce businesses. The overall increase in sales was led by our footwear category. Consistent with our Athletic Stores segment, footwear sales increased in men’s, women’s, and children’s. The positive sales increase in men’s footwear was primarily driven by strong gains by the Jordan brand. The increase in women’s footwear was driven by casual styles.
Direct-to-Customers division profit, as a percent of sales, declined 100 basis points as compared with 2015. The decline in the division profit rate reflected increased spending in marketing-related costs, which was incurred in order to drive traffic to our websites. Also contributing to the decline in the division profit rate was a decrease in the gross margin rate as a result of greater promotional activity by our domestic e-commerce business, especially Eastbay.
Corporate Expense
|
|
|
|
|
|
|
|
|
|
|
|
|
|
|
|
|
|
|
|
|
| 2017 |
| 2016 |
| 2015 | |||
|
| ($ in millions) | |||||||
Corporate expense |
| $ | 48 |
| $ | 70 |
| $ | 77 |
$ Change |
| $ | (22) |
| $ | (7) |
|
|
|
Corporate expense consists of unallocated general and administrative expenses as well as depreciation and amortization related to the Company’s corporate headquarters, centrally managed departments, unallocated insurance and benefit programs, certain foreign exchange transaction gains and losses, and other items. Depreciation and amortization included in corporate expense was $16 million, $14 million, and $11 million in 2017, 2016, and 2015, respectively.
The allocation of corporate expense to the operating divisions is adjusted annually based upon an internal study; accordingly, the allocation increased by $4 million in 2017, thus reducing corporate expense. Excluding the corporate allocation change, corporate expense decreased by $18 million as compared to 2016. This was primarily due to a $13 million decline in incentive compensation, which reflects the Company’s underperformance relative to its plan. Share-based compensation declined by $7 million and is also primarily related to the portion of share-based compensation that is tied directly to the Company’s performance. Additionally, the decline in corporate expense also reflects a decrease of $4 million relating to the prior-year corporate headquarters relocation costs. These decreases were partially offset by a $2 million litigation charge, increased corporate support costs, such as information technology and real estate management, and increased depreciation and amortization expense. The effect of the 53rd week on corporate expense was not significant.
Corporate expense decreased by $7 million in 2016 as compared with 2015. The annual adjustment of the allocation of corporate expense to the operating divisions reduced corporate expense by $9 million. This was partially offset by an increase of $3 million in depreciation and amortization included in corporate expense. During 2016, we also incurred $4 million of expenses related to our corporate headquarters relocation within New York City, as compared with $3 million spent during 2015. The remaining change primarily reflected lower incentive compensation expense in 2016.
26
Liquidity and Capital Resources
Liquidity
Our primary source of liquidity has been cash flow from earnings, while the principal uses of cash have been: to fund inventory and other working capital requirements; to finance capital expenditures related to store openings, store remodelings, Internet and mobile sites, information systems, and other support facilities; to make retirement plan contributions, quarterly dividend payments, and interest payments; and to fund other cash requirements to support the development of our short-term and long-term operating strategies. We generally finance real estate with operating leases. We believe our cash, cash equivalents, and future cash flow from operations will be adequate to fund these requirements.
As of February 3, 2018, we had $849 million of cash and cash equivalents, of which $669 million was held in foreign jurisdictions. After accounting for the deemed repatriation tax required by the Tax Act, our offshore cash can be repatriated without significant additional U.S. income tax cost. In connection with the Tax Act, the Company recorded a $99 million tax liability for the mandatory deemed repatriation of foreign sourced net earnings and related items. The tax for the mandatory deemed repatriation is payable over an 8 year period beginning with 2017, 8 percent is payable for years 1 to 5, 15 percent in year 6, 20 percent in year 7, and 25 percent in the final year.
The Company may also from time to time repurchase its common stock or seek to retire or purchase outstanding debt through open market purchases, privately negotiated transactions, or otherwise. Such repurchases and retirement of debt, if any, will depend on prevailing market conditions, liquidity requirements, contractual restrictions, and other factors. The amounts involved may be material. As of February 3, 2018, approximately $758 million remained available under our current $1.2 billion share repurchase program.
On February 20, 2018, the Board of Directors declared a quarterly dividend of $0.345 per share to be paid on May 4, 2018, representing an 11 percent increase over the previous quarterly per share amount.
As discussed further in the Legal Proceedings note under “Item 8. Financial Statements and Supplementary Data,” during 2017, in connection with our pension litigation, we recorded pre-tax charges of $178 million. The accrued amount as of February 3, 2018 was $278 million and is classified as a long-term liability. The Company has exhausted all legal remedies and will reform the pension plan. The Company will be working with the plaintiffs’ counsel and the court on the specific steps needed to implement the trial court’s judgment. During the fourth quarter of 2017, we deposited $150 million into a qualified settlement fund, classified as restricted cash. This settlement fund will be used for future pension contributions and plaintiffs’ legal costs related to the pension plan reformation. Also, the Company expects to make a $128 million contribution to the pension plan during 2018. The timing and the amount of actual contributions to the pension plan are dependent on the funded status of the plan and various other factors, such as interest rates and the performance of the plan’s assets.
Any material adverse change in customer demand, fashion trends, competitive market forces, or customer acceptance of our merchandise mix and retail locations, uncertainties related to the effect of competitive products and pricing, our reliance on a few key suppliers for a significant portion of our merchandise purchases and risks associated with global product sourcing, economic conditions worldwide, the effects of currency fluctuations, as well as other factors listed under the heading “Disclosure Regarding Forward-Looking Statements,” could affect our ability to continue to fund our liquidity needs from business operations.
Maintaining access to merchandise that we consider appropriate for our business may be subject to the policies and practices of our key suppliers. Therefore, we believe that it is critical to continue to maintain satisfactory relationships with these key suppliers. In 2017 and 2016, we purchased approximately 93 percent and 91 percent, respectively, of our merchandise from our top five suppliers and expect to continue to obtain a significant percentage of our athletic product from these suppliers in future periods. Approximately 67 percent in 2017 and 68 percent in 2016 was purchased from one supplier — Nike, Inc.
Planned capital expenditures in 2018 are $229 million and lease acquisition costs related to our operations in Europe are $1 million. Capital expenditures reflect $124 million dedicated to elevating our in-store experience through continued relocation and remodels in major cities and key markets. It also includes the remodeling and expansion of over 100 existing stores, as well as the planned opening of approximately 40 stores, primarily related to the continued expansion of Foot Locker in Europe and our entry into Asia in a limited number of locations.
27
Planned spending for 2018 also includes $105 million for digital and other investments, including enhancements to our mobile and web platforms, the global roll-out of our new point-of-sale software, expanding data analytics capabilities, and supply chain initiatives. We have the ability to revise and reschedule much of the anticipated capital expenditure program, should our financial position require it.
Free Cash Flow (non-GAAP measure)
In addition to net cash provided by operating activities, we use free cash flow as a useful measure of performance and as an indication of our financial strength and our ability to generate cash. We define free cash flow as net cash provided by operating activities less capital expenditures (which is classified as an investing activity). We believe the presentation of free cash flow is relevant and useful for investors because it allows investors to evaluate the cash generated from underlying operations in a manner similar to the method used by management. Free cash flow is not defined under U.S. GAAP. Therefore, it should not be considered a substitute for income or cash flow data prepared in accordance with U.S. GAAP, and may not be comparable to similarly titled measures used by other companies. It should not be inferred that the entire free cash flow amount is available for discretionary expenditures.
The following table presents a reconciliation of net cash flow provided by operating activities, the most directly comparable U.S. GAAP financial measure, to free cash flow.
|
|
|
|
|
|
|
|
|
|
|
|
|
|
|
|
|
|
| 2017 |
| 2016 |
| 2015 | |||
| ($ in millions) | |||||||
Net cash provided by operating activities | $ | 813 |
| $ | 844 |
| $ | 791 |
Capital expenditures |
| (274) |
|
| (266) |
|
| (228) |
Free cash flow | $ | 539 |
| $ | 578 |
| $ | 563 |
Operating Activities
|
|
|
|
|
|
|
|
|
|
|
|
|
|
|
|
|
|
| 2017 |
| 2016 |
| 2015 | |||
| ($ in millions) | |||||||
Net cash provided by operating activities | $ | 813 |
| $ | 844 |
| $ | 791 |
$ Change | $ | (31) |
| $ | 53 |
|
|
|
The amount provided by operating activities reflects income adjusted for non-cash items and working capital changes. Adjustments to net income for non-cash items include non-cash impairment charges, depreciation and amortization, deferred income taxes, share-based compensation expense and related tax benefits. The decline in 2017 primarily reflects the decrease in net income partially offset by working capital improvements.
During 2017, we contributed $25 million to our U.S. qualified pension plan. We contributed $33 million to our U.S. qualified pension plan and $3 million to our Canadian qualified pension plan in 2016. During 2015, we contributed $4 million to the U.S. qualified pension plan. The amounts and timing of pension contributions are dependent on several factors, including asset performance. Cash paid for income taxes was $237 million, $341 million, and $283 million for 2017, 2016, and 2015, respectively.
Investing Activities
|
|
|
|
|
|
|
|
|
|
|
|
|
|
|
|
|
|
| 2017 |
| 2016 |
| 2015 | |||
| ($ in millions) | |||||||
Net cash used in investing activities | $ | 289 |
| $ | 266 |
| $ | 230 |
$ Change | $ | 23 |
| $ | 36 |
|
|
|
Capital expenditures in 2017 were $274 million, an increase of $8 million as compared with the prior year. The increase was due to increased spending on technology projects and cash payments related to the prior year capital program. During 2017, we completed the remodeling or relocation of 183 existing stores and opened 94 new stores. As of the end of fiscal 2017, approximately 40 percent of our Foot Locker, Champs Sports, and Footaction stores have been remodeled to their respective new store formats. Capital expenditures in 2016 were $266 million, primarily related to the remodeling or relocation of 218 existing stores, and the build-out of 96 new stores. The increase in 2016 as compared with 2015 primarily related to our corporate headquarters build out and two new flagship stores.
28
The Company invested $15 million in a privately-held company during 2017, which was accounted for as a cost method investment.
During the third quarter of 2015, we completed an asset acquisition for $2 million involving 10 previously franchised Runners Point and Sidestep stores in Switzerland.
Financing Activities
|
|
|
|
|
|
|
|
|
|
|
|
|
|
|
|
|
|
| 2017 |
| 2016 |
| 2015 | |||
| ($ in millions) | |||||||
Net cash used in financing activities | $ | 616 |
| $ | 556 |
| $ | 500 |
$ Change | $ | 60 |
| $ | 56 |
|
|
|
Cash used in financing activities consisted primarily of our return to shareholders initiatives, including our share repurchase program and cash dividend payments, as follows:
|
|
|
|
|
|
|
|
|
|
|
|
|
|
|
|
|
|
| 2017 |
| 2016 |
| 2015 | |||
| ($ in millions) | |||||||
Share repurchases | $ | 467 |
| $ | 432 |
| $ | 419 |
Dividends paid on common stock |
| 157 |
|
| 147 |
|
| 139 |
Total returned to shareholders | $ | 624 |
| $ | 579 |
| $ | 558 |
During 2017, 2016, and 2015, we repurchased 12,413,590 shares, 6,984,643 shares, and 6,693,100 shares of our common stock under our share repurchase programs, respectively. Additionally, the Company declared and paid dividends representing a quarterly rate of $0.31, $0.275, and $0.25 per share in 2017, 2016, and 2015, respectively. During 2017, 2016 and 2015, we paid $10 million, $7 million and $9 million, respectively, to satisfy tax withholding obligations relating to the vesting of share-based equity awards. Offsetting the amounts above were proceeds received from the issuance of common stock and treasury stock in connection with the employee stock programs of $18 million, $33 million, and $69 million for 2017, 2016, and 2015, respectively.
During 2016, we paid fees of $2 million in connection with the credit agreement, see below for further details. During 2016 and 2015, we made payments relating to capital lease obligations of $1 million and $2 million, respectively. These obligations were recorded in connection with the acquisition of the Runners Point Group.
Capital Structure
On May 19, 2016, we entered into a credit agreement with our banks (“2016 Credit Agreement”). The 2016 Credit Agreement provides for a $400 million asset-based revolving credit facility maturing on May 19, 2021. During the term of the 2016 Credit Agreement, we may also increase the commitments by up to $200 million, subject to customary conditions. Interest is determined, at our option, by the federal funds rate plus a margin of 0.125 percent to 0.375 percent, or a Eurodollar rate, determined by reference to LIBOR, plus a margin of 1.125 percent to 1.375 percent depending on availability under the 2016 Credit Agreement. In addition, we are paying a commitment fee of 0.20 percent per annum on the unused portion of the commitments.
The 2016 Credit Agreement provides for a security interest in certain of our domestic store assets, including inventory assets, accounts receivable, cash deposits, and certain insurance proceeds. We are not required to comply with any financial covenants unless certain events of default have occurred and are continuing, or if availability under the 2016 Credit Agreement does not exceed the greater of $40 million and 10 percent of the Loan Cap (as defined in the 2016 Credit Agreement). There are no restrictions relating to the payment of dividends and share repurchases as long as no default or event of default has occurred and the aggregate principal amount of unused commitments under the 2016 Credit Agreement is not less than 15 percent of the lesser of the aggregate amount of the commitments and the Borrowing Base, determined as of the preceding fiscal month and on a proforma basis for the following six fiscal months. We do not currently expect to borrow under the facility in 2018, other than amounts used to support standby letters of credit.
Credit Rating
As of March 29, 2018, our corporate credit ratings from Standard & Poor’s and Moody’s Investors Service are BB+ and Ba1, respectively. In addition, Moody’s Investors Service has rated our senior unsecured notes Ba2.
29
Debt Capitalization and Equity (non-GAAP Measure)
For purposes of calculating debt to total capitalization, we include the present value of operating lease commitments in total net debt. Total net debt including the present value of operating leases is considered a non-GAAP financial measure. The present value of operating leases is discounted using various interest rates ranging from 2.5 percent to 14.5 percent, which represent our incremental borrowing rate at inception of the lease. Operating leases are the primary financing vehicle used to fund store expansion and, therefore, we believe that the inclusion of the present value of operating leases in total debt is useful to our investors, credit constituencies, and rating agencies.
|
|
|
|
|
|
|
|
|
|
|
|
|
|
| 2017 |
| 2016 |
| ||
| ($ in millions) | |||||
Long-term debt and obligations under capital leases | $ | 125 |
| $ | 127 |
|
Present value of operating leases |
| 3,729 |
|
| 3,469 |
|
Total debt including the present value of operating leases |
| 3,854 |
|
| 3,596 |
|
Less: |
|
|
|
|
|
|
Cash and cash equivalents |
| 849 |
|
| 1,046 |
|
Total net debt including the present value of operating leases |
| 3,005 |
|
| 2,550 |
|
Shareholders’ equity |
| 2,519 |
|
| 2,710 |
|
Total capitalization | $ | 5,524 |
| $ | 5,260 |
|
Total net debt capitalization percent |
| — | % |
| — | % |
Total net debt capitalization percent including the present value of operating leases |
| 54.4 | % |
| 48.5 | % |
Including the present value of operating leases, net debt capitalization percent increased 590 basis points in 2017, primarily reflecting the effect of new high-profile leases and ongoing lease renewals coupled with foreign exchange fluctuations. Also contributing to the net capitalization increase during 2017 was a $197 million decline in our cash and cash equivalents, which primarily reflected the $150 million deposit to a qualified settlement fund in connection with the pension litigation matter.
Contractual Obligations and Commitments
The following tables represent the scheduled maturities of the Company’s contractual cash obligations and other commercial commitments at February 3, 2018:
|
|
|
|
|
|
|
|
|
|
|
|
|
|
|
|
|
|
|
|
|
|
|
|
|
|
|
|
|
|
|
|
|
|
|
|
| Payments Due by Fiscal Period | ||||||||||
Contractual Cash |
|
|
|
|
|
|
|
|
|
|
|
|
| 2023 and | |
Obligations |
| Total |
| 2018 |
| 2019-2020 |
| 2021-2022 |
| Beyond | |||||
|
| ($ in millions) | |||||||||||||
Long-term debt (1) |
| $ | 162 |
| $ | 11 |
| $ | 22 |
| $ | 129 |
| $ | — |
Operating leases (2) |
|
| 4,680 |
|
| 678 |
|
| 1,231 |
|
| 1,050 |
|
| 1,721 |
Other long-term liabilities (3) |
|
| 217 |
|
| 145 |
|
| 14 |
|
| 20 |
|
| 38 |
Total contractual cash obligations |
| $ | 5,059 |
| $ | 834 |
| $ | 1,267 |
| $ | 1,199 |
| $ | 1,759 |
(1) | The amounts presented above represent the contractual maturities of our long-term debt, including interest; however, it excludes the unamortized gain of the interest rate swap of $7 million. Additional information is included in the Long-Term Debt note under “Item 8. Consolidated Financial Statements and Supplementary Data.” | ||||||||||||||
(2) | The amounts presented represent the future minimum lease payments under non-cancellable operating leases. In addition to minimum rent, certain of our leases require the payment of additional costs for insurance, maintenance, and other costs. These costs have historically represented approximately 20 to 30 percent of the minimum rent amount. These additional amounts are not included in the table of contractual commitments as the timing and/or amounts of such payments are unknown. | ||||||||||||||
(3) | Other liabilities in the Consolidated Balance Sheet at February 3, 2018 primarily comprise pension and postretirement benefits, deferred rent liability, income taxes, workers’ compensation and general liability reserves, and various other accruals. The amount presented in the table includes the 2018 scheduled contribution of $128 million to our U.S. qualified pension plan. However, it does not include any amounts that will be paid from the $150 million qualified settlement fund as the timing and amount are not presently known. With regards to amounts payable related to the Tax Act, we have included $89 million in the table above but we have excluded other payments totaling $10 million, as the timing is not determinable at this time. Other than these liabilities, other amounts (including our unrecognized tax benefits of $44 million) have been excluded from the table above as the timing and/or amount of any cash payment is uncertain. Remaining amounts for which the timing is known have not been included as they are minimal and not useful to the presentation. Additional information is included in the Other Liabilities, Financial Instruments and Risk Management, and Retirement Plans and Other Benefits notes under “Item 8. Consolidated Financial Statements and Supplementary Data. | ||||||||||||||
30
|
|
|
|
|
|
|
|
|
|
|
|
|
|
|
|
|
|
|
|
|
|
|
|
|
|
|
|
|
|
|
|
|
|
|
|
| Payments Due by Fiscal Period | ||||||||||
Other Commercial |
|
|
|
|
|
|
|
|
|
|
|
| 2023 and | ||
Commitments |
| Total |
| 2018 |
| 2019-2020 |
| 2021-2022 |
| Beyond | |||||
|
| ($ in millions) | |||||||||||||
Purchase commitments (1) |
| $ | 2,130 |
| $ | 2,130 |
| $ | — |
| $ | — |
| $ | — |
Other (2) |
|
| 44 |
|
| 21 |
|
| 22 |
|
| 1 |
|
| — |
Total other commercial commitments |
| $ | 2,174 |
| $ | 2,151 |
| $ | 22 |
| $ | 1 |
| $ | — |
(1) | Represents open purchase orders, as well as other commitments for merchandise purchases, at February 3, 2018. We are obligated under the terms of purchase orders; however, we are generally able to renegotiate the timing and quantity of these orders with certain suppliers in response to shifts in consumer preferences. |
(2) | Represents payments required by non-merchandise purchase agreements. |
Off-Balance Sheet Arrangements
The majority of our contractual obligations relate to operating leases for our stores. Future scheduled lease payments under non-cancellable operating leases as of February 3, 2018 are described in the table under Contractual Obligations and Commitments on the preceding page and with additional information in the Leases note in “Item 8. Consolidated Financial Statements and Supplementary Data.”
We have not entered into any transactions with unconsolidated entities that expose the Company to material continuing risks, contingent liabilities, or any other obligation under a variable interest in an unconsolidated entity. Also, our financial policies prohibit the use of derivatives for which there is no underlying exposure.
In connection with the sale of various businesses and assets, we may be obligated for certain lease commitments transferred to third parties and pursuant to certain normal representations, warranties, or indemnifications entered into with the purchasers of such businesses or assets. Although the maximum potential amounts for such obligations cannot be readily determined, we believe that the resolution of such contingencies will not significantly affect our consolidated financial position, liquidity, or results of operations. We also operate certain stores for which lease agreements are in the process of being negotiated with landlords. Although there is no contractual commitment to make these payments, it is likely that leases will be executed.
Critical Accounting Policies
Our responsibility for integrity and objectivity in the preparation and presentation of the financial statements requires diligent application of appropriate accounting policies. Generally, our accounting policies and methods are those specifically required by U.S. generally accepted accounting principles. Included in the Summary of Significant Accounting Policies note in “Item 8. Consolidated Financial Statements and Supplementary Data” is a summary of the most significant accounting policies. In some cases, we are required to calculate amounts based on estimates for matters that are inherently uncertain. We believe the following to be the most critical of those accounting policies that necessitate subjective judgments.
Merchandise Inventories and Cost of Sales
Merchandise inventories for the Athletic Stores segment are valued at the lower of cost or market using the retail inventory method (“RIM”). The RIM is commonly used by retail companies to value inventories at cost and calculate gross margins due to its practicality. Under the retail method, cost is determined by applying a cost-to-retail percentage across groupings of similar items, known as departments. The cost-to-retail percentage is applied to ending inventory at its current owned retail valuation to determine the cost of ending inventory on a department basis.
The RIM is a system of averages that requires estimates and assumptions regarding markups, markdowns and shrink, among others, and as such, could result in distortions of inventory amounts. Judgment is required for these estimates and assumptions, as well as to differentiate between promotional and other markdowns that may be required to correctly reflect merchandise inventories at the lower of cost or market. Reserves are established based on current selling prices when the inventory has not been marked down to market. The failure to take permanent markdowns on a timely basis may result in an overstatement of cost under the retail inventory method. The decision to take permanent markdowns includes many factors, including the current retail environment, inventory levels, and the age of the item. We believe this method and its related assumptions, which have been consistently applied, to be reasonable.
Impairment of Long-Lived Tangible Assets and Goodwill
Long-Lived Tangible Assets | We perform an impairment review when circumstances indicate that the carrying value of long-lived tangible assets may not be recoverable. Our policy for determining whether an impairment indicator exists, a triggering event, comprises measurable operating performance criteria at the division level as well as qualitative measures. If an analysis is necessitated by the occurrence of a triggering event, we use assumptions which are predominately identified from our long-range strategic plans in performing an impairment review. In the calculation of the fair value of long-lived assets, we compare the carrying amount of the asset with the estimated future cash flows expected to result from the use of the asset. If the carrying amount of the asset exceeds the estimated expected undiscounted future cash flows, we measure the amount of the impairment by comparing the carrying amount of the asset with its estimated fair value. The estimation of fair value is measured by discounting expected future cash flows at our weighted-average cost of capital. We believe our policy is reasonable and is consistently applied. Future expected cash flows are based upon estimates that, if not achieved, may result in significantly different results. |
During 2017 and 2016, we conducted impairment reviews of the Runners Point and Sidestep store-level assets, which resulted in non-cash impairment charges of $4 million and $6 million, respectively. Also during 2017, we recorded a $16 million non-cash impairment charge related to our SIX:02 business. | |
Goodwill | We review goodwill for impairment annually during the first quarter of our fiscal year or more frequently if impairment indicators arise. The review of impairment consists of either using a qualitative approach to determine whether it is more likely than not that the fair value of the assets is less than their respective carrying values or a two-step impairment test, if necessary. |
In performing the qualitative assessment, we consider many factors in evaluating whether the carrying value of goodwill may not be recoverable, including declines in our stock price and market capitalization in relation to the book value of the Company and macroeconomic conditions affecting retail. If, based on the results of the qualitative assessment, it is concluded that it is not more likely than not that the fair value of a reporting unit exceeds its carrying value, additional quantitative impairment testing is performed using a two-step test. | |
The initial step requires that the carrying value of each reporting unit be compared with its estimated fair value. The second step — to evaluate goodwill of a reporting unit for impairment — is only required if the carrying value of that reporting unit exceeds its estimated fair value. We use a discounted cash flow approach to determine the fair value of a reporting unit. The determination of discounted cash flows of the reporting units and assets and liabilities within the reporting units requires significant estimates and assumptions. These estimates and assumptions primarily include, but are not limited to, the discount rate, terminal growth rates, earnings before depreciation and amortization, and capital expenditures forecasts. Due to the inherent uncertainty involved in making these estimates, actual results could differ from those estimates. We evaluate the merits of each significant assumption, both individually and in the aggregate, used to determine the fair value of the reporting units, as well as the fair values of the corresponding assets and liabilities within the reporting units. | |
In 2017, we elected to perform the first step of the two-step impairment analysis in connection with our annual review. This analysis concluded that the fair value of all of the reporting units substantially exceeded their carrying values. In 2015 and 2016, we elected to perform our review of goodwill using a qualitative approach, and no reporting units were evaluated using the two-step impairment method and based on that assessment we concluded that it was more likely than not that the fair values of our reporting units exceeded their respective carrying values and that there are no reporting units at risk of impairment. |
32
Legal Contingencies
We are exposed to various legal proceedings and claims arising in the ordinary course of business. We record a liability when a loss is probable and the amount of loss can be reasonably estimated. The accrual is recorded based on the reasonably estimable loss or range of loss. When no point of loss is more likely than another, we record the lowest amount in the estimated range of loss and disclose the estimated range. In 2017, we recorded pre-tax charges of $178 million related to the pension plan litigation. We previously recorded a pre-tax charge of $100 million related to this matter in 2015.
There is significant judgment required in both the probability determination and as to whether an exposure can be reasonably estimated. We believe the accruals recorded within the consolidated financial statements properly reflect loss exposures that are both probable and reasonably estimable. Due to the inherent uncertainty involved in making these estimates, actual results could differ from those estimates.
Pension and Postretirement Liabilities
We review all assumptions used to determine our obligations for pension and postretirement liabilities annually with our independent actuaries, taking into consideration existing and future economic conditions and our intentions with regard to the plans. The assumptions used are:
Long-Term Rate of Return | The expected rate of return on plan assets is the long-term rate of return expected to be earned on the plans’ assets and is recognized as a component of pension expense. The rate is based on the plans’ weighted-average target asset allocation, as well as historical and future expected performance of those assets. The target asset allocation is selected to obtain an investment return that is sufficient to cover the expected benefit payments and to reduce the variability of future contributions. The expected rate of return on plan assets is reviewed annually and revised, as necessary, to reflect changes in the financial markets and our investment strategy. The weighted-average long-term rate of return used to determine 2017 pension expense was 5.8 percent. |
A decrease of 50 basis points in the weighted-average expected long-term rate of return would have increased 2017 pension expense by approximately $3 million. The actual return on plan assets in a given year typically differs from the expected long-term rate of return, and the resulting gain or loss is deferred and amortized into expense over the average life expectancy of the inactive participants. | |
Discount Rate | An assumed discount rate is used to measure the present value of future cash flow obligations of the plans and the interest cost component of pension expense and postretirement income. The cash flows are then discounted to their present value and an overall discount rate is determined. The discount rate is determined by reference to the Bond:Link interest rate model based upon a portfolio of highly-rated U.S. corporate bonds with individual bonds that are theoretically purchased to settle the plan’s anticipated cash outflows. The discount rate selected to measure the present value of our Canadian benefit obligations was developed by using that plan’s bond portfolio indices, which match the benefit obligations. The weighted-average discount rates used to determine the 2017 benefit obligations related to our pension and postretirement plans was 3.7 percent. Changing the weighted-average discount rate by 50 basis points would have changed the accumulated benefit obligation of the pension plans at February 3, 2018 by approximately $32 million and $35 million, depending on if the change was an increase or decrease, respectively. A decrease of 50 basis points in the weighted-average discount rate would have increased the accumulated benefit obligation on the postretirement plan by approximately $1 million. Such a decrease would not have significantly changed 2017 pension expense or postretirement income. |
33
Trend Rate | We maintain two postretirement medical plans, one covering certain executive officers and key employees (“SERP Medical Plan”), and the other covering all other associates. With respect to the SERP Medical Plan, a one percent change in the assumed health care cost trend rate would change this plan’s accumulated benefit obligation by approximately $3 million and $2 million, depending on if the change was an increase or decrease, respectively. With respect to the postretirement medical plan covering all other associates, there is limited risk to us for increases in health care costs since, beginning in 2001, new retirees have assumed the full expected costs and then-existing retirees have assumed all increases in such costs. |
Mortality Assumptions | In 2017, the mortality table used to determine the U.S. pension obligations was updated to the modified RP-2017 mortality table with generational projection using modified MP-2017 for both males and females and terminated vested participants. The mortality table was updated as the Company’s actual experience more closely matched the RP-2017 than the previous table. In 2016, the mortality table used to determine the pension obligation was the RP-2000 mortality table with generational projection using scale AA for both males and females. This table was also used to value the Canadian pension obligations for 2017 and 2016. For the SERP Medical Plan, the mortality assumption used to value the 2017 obligation was updated to the RPH-2017 table with generational projection using MP-2017, while in the prior year the obligation was valued using the RPH-2016 table with generational projection using MP-2016, which represents the most recent study from the Society of Actuaries. |
Income Taxes
In accordance with U.S. GAAP, deferred tax assets are recognized for tax credit and net operating loss carryforwards, reduced by a valuation allowance, which is established when it is more likely than not that some portion or all of the deferred tax assets will not be realized. We are required to estimate taxable income for future years by taxing jurisdiction and to use our judgment to determine whether or not to record a valuation allowance for part or all of a deferred tax asset. Estimates of taxable income are based upon our long-range strategic plans.
A one percent change in the overall statutory tax rate for 2017 would have resulted in a change of $1 million to the carrying value of the net deferred tax asset and a corresponding charge or credit to income tax expense depending on whether the tax rate change was a decrease or an increase.
We have operations in multiple taxing jurisdictions and we are subject to audit in these jurisdictions. Tax audits by their nature are often complex and can require several years to resolve. Accruals of tax contingencies require us to make estimates and judgments with respect to the ultimate outcome of tax audits. Actual results could vary from these estimates.
The Tax Act significantly changes how the U.S. taxes corporations. It requires complex computations to be performed that were not previously required in U.S. tax law, significant judgments to be made in interpretation of the provisions of the law and significant estimates in calculations, and the preparation and analysis of information not previously relevant or regularly produced. The U.S. Department of the Treasury, the Internal Revenue Service, and other standard-setting bodies could interpret or issue guidance on how provisions of the law will be applied or otherwise administered that is different from our interpretation underlying our income tax accruals. As we complete our analysis of the Tax Act, collect data and prepare the necessary calculations, and interpret any additional guidance, we may make adjustments to provisional amounts that we have recorded that may materially affect our provision for income taxes in the period in which the adjustments are made.
Excluding the effect of any nonrecurring items that may occur, we expect the 2018 effective tax rate to approximate 27.5 percent. The actual tax rate will vary if the level of stock option exercise activity and the stock price at the vesting or exercise date differs from our expectations. Additionally, the tax rate will also depend on the level and mix of income earned in the United States, as compared with our international operations.
Recent Accounting Pronouncements
Descriptions of the recently issued accounting principles, and the accounting principles adopted by us during the year ended February 3, 2018 are included in the Summary of Significant Accounting Policies note in “Item 8. Consolidated Financial Statements and Supplementary Data.”
34
Item 7A. Quantitative and Qualitative Disclosures About Market Risk
Information regarding foreign exchange risk management is included in theFinancial Instruments and Risk Managementnote under “Item 8. Consolidated Financial Statements and Supplementary Data.”
Item 8. Consolidated Financial Statements and Supplementary Data
The following Consolidated Financial Statements of the Company for the years ended January 31, 2015, February 1, 2014, and February 2, 2013 are included as part of this Report:
· | Consolidated Statements of Operations for the fiscal years ended: |
· | February 3, 2018 |
· | January 28, 2017 |
· | January 30, 2016 |
· | Consolidated Statements of Comprehensive Income for the fiscal years ended: |
· | February 3, 2018 |
· | January 28, 2017 |
· | January 30, 2016 |
· | Consolidated Balance Sheets as of: |
· | February 3, 2018 |
· | January 28, 2017 |
·
Consolidated Statements of Shareholders’ Equity for the fiscal years ended:
·
February 3, 2018
·
January 28, 2017
·
January 30, 2016
· | Consolidated Statements of Shareholders’ Equity for the fiscal years ended: |
· | February 3, 2018 |
· | January 28, 2017 |
· | January 30, 2016 |
· | Consolidated Statements of Cash Flows for the fiscal years ended: |
· | February 3, 2018 |
· | January 28, 2017 |
· | January 30, 2016 |
· | Notes to the Consolidated Financial Statements. |
35
REPORT OF INDEPENDENT REGISTERED PUBLIC ACCOUNTING FIRM
The
To the Board of Directors and Shareholders of
Foot Locker, Inc.:
Opinion on the Consolidated Financial Statements
We have audited the accompanying consolidated balance sheets of Foot Locker, Inc. and subsidiaries (the “Company”) as of February 3, 2018 and January 31, 2015 and February 1, 2014, and28, 2017, the related consolidated statements of operations, comprehensive income, shareholders’stockholders’ equity, and cash flows for each of the years in the three-yearthree‑year period ended February 3, 2018 and the related notes (collectively, the “consolidated financial statements”). In our opinion, the consolidated financial statements present fairly, in all material respects, the financial position of the Company as of February 3, 2018 and January 31, 2015. 28, 2017, and the results of its operations and its cash flows for each of the years in the three‑year period ended February 3, 2018, in conformity with U.S. generally accepted accounting principles.
We also have audited, in accordance with the standards of the Public Company Accounting Oversight Board (United States) (PCAOB), the Company’s internal control over financial reporting as of February 3, 2018, based on criteria established in Internal Control – Integrated Framework (2013) issued by the Committee of Sponsoring Organizations of the Treadway Commission”, and our report dated March 29, 2018 expressed an unqualified opinion on the effectiveness of the Company’s internal control over financial reporting.
Basis for Opinion
These consolidated financial statements are the responsibility of the Company’s management. Our responsibility is to express an opinion on these consolidated financial statements based on our audits. We are a public accounting firm registered with the PCAOB and are required to be independent with respect to the Company in accordance with the U.S. federal securities laws and the applicable rules and regulations of the Securities and Exchange Commission and the PCAOB.
We conducted our audits in accordance with the standards of the Public Company Accounting Oversight Board (United States).PCAOB. Those standards require that we plan and perform the audit to obtain reasonable assurance about whether the consolidated financial statements are free of material misstatement. An audit includesmisstatement, whether due to error or fraud. Our audits included performing procedures to assess the risks of material misstatement of the consolidated financial statements, whether due to error or fraud, and performing procedures that respond to those risks. Such procedures included examining, on a test basis, evidence supportingregarding the amounts and disclosures in the consolidated financial statements. An auditOur audits also includes assessingincluded evaluating the accounting principles used and significant estimates made by management, as well as evaluating the overall presentation of the consolidated financial statement presentation.statements. We believe that our audits provide a reasonable basis for our opinion.
In our opinion, the consolidated financial statements referred to above present fairly, in all material respects, the financial position of Foot Locker, Inc. and subsidiaries as of January 31, 2015 and February 1, 2014, and the results of their operations and their cash flows for each of the years in the three-year period ended January 31, 2015, in conformity with U.S. generally accepted accounting principles.
We also have audited, in accordance with the standards of the Public Company Accounting Oversight Board (United States), Foot Locker, Inc.’s internal control over financial reporting as of January 31, 2015, based on criteria established inInternal Control — Integrated Framework (2013) issued by the Committee of Sponsoring Organizations of the Treadway Commission, and our report dated March 30, 2015 expressed an unqualified opinion on the effectiveness of the Company’s internal control over financial reporting.
/s/ KPMG LLP
We have served as the Company’s auditor since 1995.
New York, New York
March 30, 201529, 2018
36
FOOT LOCKER, INC.
CONSOLIDATED STATEMENTS OF OPERATIONS
|
|
|
|
|
|
|
|
| |||||||||||||
| 2014 | 2013 | 2012 |
| 2017 |
| 2016 |
| 2015 | |||||||||||||
| (in millions, except per share amounts) |
| (in millions, except per share amounts) | |||||||||||||||||||
| Sales | $ | 7,151 | $ | 6,505 | $ | 6,182 |
| $ | 7,782 |
| $ | 7,766 |
| $ | 7,412 | ||||||
|
|
|
|
|
|
|
|
|
| ||||||||||||
| Cost of sales | 4,777 | 4,372 | 4,148 |
|
| 5,326 |
|
| 5,130 |
|
| 4,907 | |||||||||
| Selling, general and administrative expenses | 1,426 | 1,334 | 1,294 |
|
| 1,501 |
|
| 1,472 |
|
| 1,415 | |||||||||
| Depreciation and amortization | 139 | 133 | 118 |
|
| 173 |
|
| 158 |
|
| 148 | |||||||||
| Impairment and other charges | 4 | 2 | 12 | ||||||||||||||||||
| Interest expense, net | 5 | 5 | 5 | ||||||||||||||||||
Litigation and other charges |
|
| 211 |
|
| 6 |
|
| 105 | ||||||||||||
Income from operations |
|
| 571 |
|
| 1,000 |
|
| 837 | ||||||||||||
|
|
|
|
|
|
|
|
|
| ||||||||||||
Interest (income) / expense, net |
|
| (2) |
|
| 2 |
|
| 4 | ||||||||||||
| Other income | (9 | ) | (4 | ) | (2 | ) |
|
| (5) |
|
| (6) |
|
| (4) | ||||||
| 6,342 | 5,842 | 5,575 | |||||||||||||||||||
| Income before income taxes | 809 | 663 | 607 |
|
| 578 |
|
| 1,004 |
|
| 837 | |||||||||
| Income tax expense | 289 | 234 | 210 |
|
| 294 |
|
| 340 |
|
| 296 | |||||||||
| Net income | $ | 520 | $ | 429 | $ | 397 |
| $ | 284 |
| $ | 664 |
| $ | 541 | ||||||
|
|
|
|
|
|
|
|
|
| ||||||||||||
| Basic earnings per share | $ | 3.61 | $ | 2.89 | $ | 2.62 |
| $ | 2.23 |
| $ | 4.95 |
| $ | 3.89 | ||||||
| Weighted-average shares outstanding | 143.9 | 148.4 | 151.2 |
|
| 127.2 |
|
| 134.0 |
|
| 139.1 | |||||||||
|
|
|
|
|
|
|
|
|
| ||||||||||||
| Diluted earnings per share | $ | 3.56 | $ | 2.85 | $ | 2.58 |
| $ | 2.22 |
| $ | 4.91 |
| $ | 3.84 | ||||||
| Weighted-average shares outstanding, assuming dilution | 146.0 | 150.5 | 154.0 |
|
| 127.9 |
|
| 135.1 |
|
| 140.8 | |||||||||
See Accompanying Notes to Consolidated Financial Statements.
FOOT LOCKER, INC.
CONSOLIDATED STATEMENTS OF COMPREHENSIVE INCOME
|
|
|
|
|
|
| |||||||||||||||
|
|
|
|
|
|
|
| ||||||||||||||
| 2014 | 2013 | 2012 |
| 2017 |
| 2016 |
| 2015 | |||||||||||||
| (in millions) |
| ($ in millions) | |||||||||||||||||||
| Net income | $ | 520 | $ | 429 | $ | 397 |
| $ | 284 |
| $ | 664 |
| $ | 541 | ||||||
| Other comprehensive income, net of income tax |
|
|
|
|
|
|
| ||||||||||||||
|
|
|
|
|
|
|
| ||||||||||||||
| Foreign currency translation adjustment: |
|
|
|
|
|
|
| ||||||||||||||
| Translation adjustment arising during the period, net of income tax | (132 | ) | (25 | ) | 19 | ||||||||||||||||
Translation adjustment arising during the period, net of income tax expense (benefit) of $18, $1 and $(2) million, respectively |
|
| 114 |
| (8) |
| (44) | ||||||||||||||
Reclassification due to the adoption of ASU 2018-02 |
|
| 4 |
| — |
| — | ||||||||||||||
|
|
|
|
|
|
|
| ||||||||||||||
| Cash flow hedges: |
|
|
|
|
|
|
| ||||||||||||||
| Change in fair value of derivatives, net of income tax | (1 | ) | (5 | ) | 4 |
|
| (1) |
| (1) |
| 5 | |||||||||
| Pension and postretirement adjustments: | |||||||||||||||||||||
| Net actuarial gain (loss) and prior service cost and foreign currency fluctuations arising during the year, net of income tax expense (benefit) of $(7), $2, and $1 million, respectively | (8 | ) | 6 | 1 | |||||||||||||||||
| Amortization of net actuarial gain/loss and prior service cost included in net periodic benefit costs, net of income tax expense of $4, $5, and $5 million, respectively | 8 | 9 | 8 | ||||||||||||||||||
|
|
|
|
|
|
|
| ||||||||||||||
| Available for sale securities: |
|
|
|
|
|
|
| ||||||||||||||
| Unrealized gain on available-for-sale securities | — | — | 1 |
|
| 1 |
| — |
| — | |||||||||||
|
|
|
|
|
|
|
| ||||||||||||||
Pension and postretirement adjustments: |
|
|
|
|
|
|
| ||||||||||||||
Net actuarial gain (loss) and foreign currency fluctuations arising during the year, net of income tax expense (benefit) of $2, $4 and $(10) million, respectively |
|
| 4 |
| 4 |
| (16) | ||||||||||||||
Amortization of net actuarial gain/loss and prior service cost included in net periodic benefit costs, net of income tax expense of $4, $4 and $5 million, respectively |
|
| 7 |
| 8 |
| 8 | ||||||||||||||
Reclassification due to the adoption of ASU 2018-02 |
|
| (45) |
| — |
| — | ||||||||||||||
| Comprehensive income | $ | 387 | $ | 414 | $ | 430 |
| $ | 368 |
| $ | 667 |
| $ | 494 | ||||||
See Accompanying Notes to Consolidated Financial Statements.
FOOT LOCKER, INC.
CONSOLIDATED BALANCE SHEETS
|
|
|
|
| ||||||||||
|
|
|
|
| ||||||||||
| 2014 | 2013 |
| 2017 |
| 2016 | |||||||||
| (in millions) |
| ($ in millions) | ||||||||||||
| ASSETS |
|
|
|
|
| |||||||||
| Current assets | ||||||||||||||
|
|
|
|
|
| |||||||||
Current assets: |
|
|
|
|
| |||||||||
| Cash and cash equivalents | $ | 967 | $ | 858 |
| $ | 849 |
| $ | 1,046 | ||||
| Short-term investments | — | 9 | ||||||||||||
| Merchandise inventories | 1,250 | 1,220 |
|
| 1,278 |
| 1,307 | |||||||
| Other current assets | 239 | 263 |
|
| 424 |
| 280 | |||||||
| 2,456 | 2,350 |
|
| 2,551 |
| 2,633 | ||||||||
| Property and equipment, net | 620 | 590 |
|
| 866 |
| 765 | |||||||
| Deferred taxes | 221 | 241 |
|
| 48 |
| 161 | |||||||
| Goodwill | 157 | 163 |
|
| 160 |
| 155 | |||||||
| Other intangible assets, net | 49 | 67 |
|
| 46 |
| 42 | |||||||
| Other assets | 74 | 76 |
|
| 290 |
| 84 | |||||||
| $ | 3,577 | $ | 3,487 |
| $ | 3,961 |
| $ | 3,840 | |||||
|
|
|
|
|
|
| ||||||||
| LIABILITIES AND SHAREHOLDERS’ EQUITY |
|
|
|
|
| |||||||||
| Current liabilities | ||||||||||||||
|
|
|
|
|
| |||||||||
Current liabilities: |
|
|
|
|
| |||||||||
| Accounts payable | $ | 301 | $ | 263 |
| $ | 258 |
| $ | 249 | ||||
| Accrued and other liabilities | 393 | 360 |
|
| 358 |
| 363 | |||||||
| Current portion of capital lease obligations | 2 | 3 | ||||||||||||
| 696 | 626 |
|
| 616 |
| 612 | ||||||||
| Long-term debt and obligations under capital leases | 132 | 136 | ||||||||||||
Long-term debt |
|
| 125 |
| 127 | |||||||||
| Other liabilities | 253 | 229 |
|
| 701 |
| 391 | |||||||
| Total liabilities | 1,081 | 991 |
|
| 1,442 |
| 1,130 | |||||||
| Shareholders’ equity | 2,496 | 2,496 |
|
| 2,519 |
| 2,710 | |||||||
| $ | 3,577 | $ | 3,487 |
| $ | 3,961 |
| $ | 3,840 | |||||
See Accompanying Notes to Consolidated Financial Statements.
39
FOOT LOCKER, INC.
CONSOLIDATED STATEMENTS OF SHAREHOLDERS’ EQUITY
| Additional Paid-In Capital & Common Stock | Treasury Stock | Retained Earnings | Accumulated Other Comprehensive Loss | Total Shareholders' Equity | ||||||||||||||||||||||||
| Shares | Amount | Shares | Amount | |||||||||||||||||||||||||
| (shares in thousands, amounts in millions) | ||||||||||||||||||||||||||||
| Balance at January 28, 2012 | 164,460 | $ | 779 | (12,841 | ) | $ | (253 | ) | $ | 1,788 | $ | (204 | ) | $ | 2,110 | |||||||||||||
| Restricted stock issued | 99 | — | — | — | — | |||||||||||||||||||||||
| Issued under director and stock plans | 2,350 | 46 | — | — | 46 | |||||||||||||||||||||||
| Share-based compensation expense | — | 20 | — | — | 20 | |||||||||||||||||||||||
| Total tax benefit from exercise of options | — | 11 | — | 11 | ||||||||||||||||||||||||
| Shares of common stock used to satisfy tax withholding obligations | — | (214 | ) | (7 | ) | (7 | ) | |||||||||||||||||||||
| Acquired in exchange of stock options | — | — | (2 | ) | — | — | ||||||||||||||||||||||
| Share repurchases | — | — | (4,000 | ) | (129 | ) | (129 | ) | ||||||||||||||||||||
| Reissued – employee stock purchase plan | — | — | 218 | 5 | 5 | |||||||||||||||||||||||
| Net income | 397 | 397 | ||||||||||||||||||||||||||
| Cash dividends declared on common stock ($0.72 per share) | (109 | ) | (109 | ) | ||||||||||||||||||||||||
| Translation adjustment, net of tax | 19 | 19 | ||||||||||||||||||||||||||
| Change in cash flow hedges, net of tax | 4 | 4 | ||||||||||||||||||||||||||
| Pension and postretirement adjustments, net of tax | 9 | 9 | ||||||||||||||||||||||||||
| Unrealized gain on available-for-sale securities, with no tax | 1 | 1 | ||||||||||||||||||||||||||
| Balance at February 2, 2013 | 166,909 | $ | 856 | (16,839 | ) | $ | (384 | ) | $ | 2,076 | $ | (171 | ) | $ | 2,377 | |||||||||||||
| Restricted stock issued | 665 | — | — | — | — | |||||||||||||||||||||||
| Issued under director and stock plans | 1,465 | 31 | — | — | 31 | |||||||||||||||||||||||
| Share-based compensation expense | — | 25 | — | — | 25 | |||||||||||||||||||||||
| Total tax benefit from exercise of options | — | 9 | 9 | |||||||||||||||||||||||||
| Forfeitures of restricted stock | — | — | (2 | ) | ||||||||||||||||||||||||
| Shares of common stock used to satisfy tax withholding obligations | — | — | (479 | ) | (16 | ) | (16 | ) | ||||||||||||||||||||
| Acquired in exchange of stock options | — | — | (1 | ) | — | — | ||||||||||||||||||||||
| Share repurchases | — | — | (6,424 | ) | (229 | ) | (229 | ) | ||||||||||||||||||||
| Reissued – employee stock purchase plan | — | — | 133 | 3 | 3 | |||||||||||||||||||||||
| Net income | 429 | 429 | ||||||||||||||||||||||||||
| Cash dividends declared on common stock ($0.80 per share) | (118 | ) | (118 | ) | ||||||||||||||||||||||||
| Translation adjustment, net of tax | (25 | ) | (25 | ) | ||||||||||||||||||||||||
| Change in cash flow hedges, net of tax | (5 | ) | (5 | ) | ||||||||||||||||||||||||
| Pension and postretirement adjustments, net of tax | 15 | 15 | ||||||||||||||||||||||||||
| Balance at February 1, 2014 | 169,039 | $ | 921 | (23,612 | ) | $ | (626 | ) | $ | 2,387 | $ | (186 ) | $ | 2,496 | ||||||||||||||
| Restricted stock issued | 578 | — | — | — | — | |||||||||||||||||||||||
| Issued under director and stock plans | 912 | 22 | — | — | 22 | |||||||||||||||||||||||
| Share-based compensation expense | — | 24 | — | — | 24 | |||||||||||||||||||||||
| Total tax benefit from exercise of options | — | 12 | 12 | |||||||||||||||||||||||||
| Shares of common stock used to satisfy tax withholding obligations | — | — | (324 | ) | (16 | ) | (16 | ) | ||||||||||||||||||||
| Share repurchases | — | — | (5,889 | ) | (305 | ) | (305 | ) | ||||||||||||||||||||
| Reissued – employee stock purchase plan | — | — | 160 | 3 | 3 | |||||||||||||||||||||||
| Net income | 520 | 520 | ||||||||||||||||||||||||||
| Cash dividends declared on common stock ($0.88 per share) | (127 | ) | (127 ) | |||||||||||||||||||||||||
| Translation adjustment, net of tax | (132 | ) | (132 | ) | ||||||||||||||||||||||||
| Change in cash flow hedges, net of tax | (1 | ) | (1 | ) | ||||||||||||||||||||||||
| Balance at January 31, 2015 | 170,529 | $ | 979 | (29,665 | ) | $ | (944 | ) | $ | 2,780 | $ | (319 | ) | $ | 2,496 | |||||||||||||
|
|
|
|
|
|
|
|
|
|
|
|
|
|
|
|
|
|
|
|
| Additional Paid-In |
|
|
|
|
|
|
|
|
| Accumulated |
|
|
| |||||
| Capital & |
|
|
|
|
|
|
|
|
| Other |
| Total | ||||||
| Common Stock |
| Treasury Stock |
| Retained |
| Comprehensive |
| Shareholders' | ||||||||||
(shares in thousands, amounts in millions) | Shares |
| Amount |
| Shares |
| Amount |
| Earnings |
| Loss |
| Equity | ||||||
Balance at January 31, 2015 |
| 170,529 |
| $ | 979 |
| (29,665) |
| $ | (944) |
| $ | 2,780 |
| $ | (319) |
| $ | 2,496 |
Restricted stock issued |
| 299 |
|
| — |
| — |
|
| — |
|
|
|
|
|
|
|
| — |
Issued under director and stock plans |
| 2,570 |
|
| 70 |
| — |
|
| — |
|
|
|
|
|
|
|
| 70 |
Share-based compensation expense |
| — |
|
| 22 |
| — |
|
| — |
|
|
|
|
|
|
|
| 22 |
Excess tax benefits from equity awards |
| — |
|
| 35 |
|
|
|
|
|
|
|
|
|
|
|
|
| 35 |
Forfeitures of restricted stock |
| — |
|
| 2 |
| (45) |
|
| (2) |
|
|
|
|
|
|
|
| — |
Shares of common stock used to satisfy tax withholding obligations |
| — |
|
| — |
| (142) |
|
| (9) |
|
|
|
|
|
|
|
| (9) |
Share repurchases |
| — |
|
| — |
| (6,693) |
|
| (419) |
|
|
|
|
|
|
|
| (419) |
Reissued - employee stock purchase plan ("ESPP") |
| — |
|
| — |
| 124 |
|
| 3 |
|
|
|
|
|
|
|
| 3 |
Net income |
|
|
|
|
|
|
|
|
|
|
|
| 541 |
|
|
|
|
| 541 |
Cash dividends declared on common stock ($1.00 per share) |
|
|
|
|
|
|
|
|
|
|
|
| (139) |
|
|
|
|
| (139) |
Translation adjustment, net of tax |
|
|
|
|
|
|
|
|
|
|
|
|
|
|
| (44) |
|
| (44) |
Change in cash flow hedges, net of tax |
|
|
|
|
|
|
|
|
|
|
|
|
|
|
| 5 |
|
| 5 |
Pension and postretirement adjustments, net of tax |
|
|
|
|
|
|
|
|
|
|
|
|
|
|
| (8) |
|
| (8) |
Balance at January 30, 2016 |
| 173,398 |
| $ | 1,108 |
| (36,421) |
| $ | (1,371) |
| $ | 3,182 |
| $ | (366) |
| $ | 2,553 |
Restricted stock issued |
| 203 |
|
| — |
| — |
|
| — |
|
|
|
|
|
|
|
| — |
Issued under director and stock plans |
| 1,342 |
|
| 32 |
| — |
|
| — |
|
|
|
|
|
|
|
| 32 |
Share-based compensation expense |
| — |
|
| 22 |
| — |
|
| — |
|
|
|
|
|
|
|
| 22 |
Excess tax benefits from equity awards |
| — |
|
| 20 |
|
|
|
|
|
|
|
|
|
|
|
|
| 20 |
Forfeitures of restricted stock |
| — |
|
| 1 |
| (20) |
|
| (1) |
|
|
|
|
|
|
|
| — |
Shares of common stock used to satisfy tax withholding obligations |
| — |
|
| — |
| (102) |
|
| (7) |
|
|
|
|
|
|
|
| (7) |
Share repurchases |
| — |
|
| — |
| (6,985) |
|
| (432) |
|
|
|
|
|
|
|
| (432) |
Reissued - ESPP |
| — |
|
| — |
| 81 |
|
| 2 |
|
|
|
|
|
|
|
| 2 |
Retirement of treasury stock |
| (42,327) |
|
| (283) |
| 42,327 |
|
| 1,728 |
|
| (1,445) |
|
|
|
|
| — |
Net income |
|
|
|
|
|
|
|
|
|
|
|
| 664 |
|
|
|
|
| 664 |
Cash dividends declared on common stock ($1.10 per share) |
|
|
|
|
|
|
|
|
|
|
|
| (147) |
|
|
|
|
| (147) |
Translation adjustment, net of tax |
|
|
|
|
|
|
|
|
|
|
|
|
|
|
| (8) |
|
| (8) |
Change in cash flow hedges, net of tax |
|
|
|
|
|
|
|
|
|
|
|
|
|
|
| (1) |
|
| (1) |
Pension and postretirement adjustments, net of tax |
|
|
|
|
|
|
|
|
|
|
|
|
|
|
| 12 |
|
| 12 |
Balance at January 28, 2017 |
| 132,616 |
| $ | 900 |
| (1,120) |
| $ | (81) |
| $ | 2,254 |
| $ | (363) |
| $ | 2,710 |
Restricted stock issued |
| 169 |
|
| — |
| — |
|
| — |
|
|
|
|
|
|
|
| — |
Issued under director and stock plans |
| 608 |
|
| 11 |
| — |
|
| — |
|
|
|
|
|
|
|
| 11 |
Share-based compensation expense |
| — |
|
| 15 |
| — |
|
| — |
|
|
|
|
|
|
|
| 15 |
Shares of common stock used to satisfy tax withholding obligations |
| — |
|
| — |
| (140) |
|
| (10) |
|
|
|
|
|
|
|
| (10) |
Share repurchases |
| — |
|
| — |
| (12,414) |
|
| (467) |
|
|
|
|
|
|
|
| (467) |
Reissued - ESPP |
| — |
|
| — |
| 110 |
|
| 8 |
|
|
|
|
|
|
|
| 8 |
Retirement of treasury stock |
| (12,131) |
|
| (84) |
| 12,131 |
|
| 487 |
|
| (403) |
|
|
|
|
| — |
Net income |
|
|
|
|
|
|
|
|
|
|
|
| 284 |
|
|
|
|
| 284 |
Cash dividends declared on common stock ($1.24 per share) |
|
|
|
|
|
|
|
|
|
|
|
| (157) |
|
|
|
|
| (157) |
Translation adjustment, net of tax |
|
|
|
|
|
|
|
|
|
|
|
|
|
|
| 114 |
|
| 114 |
Change in cash flow hedges, net of tax |
|
|
|
|
|
|
|
|
|
|
|
|
|
|
| (1) |
|
| (1) |
Pension and postretirement adjustments, net of tax |
|
|
|
|
|
|
|
|
|
|
|
|
|
|
| 11 |
|
| 11 |
Unrealized gain on available-for-sale securities |
|
|
|
|
|
|
|
|
|
|
|
|
|
|
| 1 |
|
| 1 |
Reclassification due to the adoption of ASU 2018-02 |
|
|
|
|
|
|
|
|
|
|
|
| 41 |
|
| (41) |
|
| — |
Balance at February 3, 2018 |
| 121,262 |
| $ | 842 |
| (1,433) |
| $ | (63) |
| $ | 2,019 |
| $ | (279) |
| $ | 2,519 |
See Accompanying Notes to Consolidated Financial Statements.
40
FOOT LOCKER, INC.
CONSOLIDATED STATEMENTS OF CASH FLOWS
|
|
|
|
|
| ||||||||||||||||
| 2014 | 2013 | 2012 |
|
|
|
|
|
|
|
| |||||||||||
| (in millions) |
| 2017 |
| 2016 * |
| 2015 * | |||||||||||||||
| From Operating Activities | |||||||||||||||||||||
|
| ($ in millions) | |||||||||||||||||||
From operating activities: |
|
|
|
|
|
|
|
| |||||||||||||
| Net income | $ | 520 | $ | 429 | $ | 397 |
| $ | 284 |
| $ | 664 |
| $ | 541 | ||||||
| Adjustments to reconcile net income to net cash provided by operating activities: |
|
|
|
|
|
|
| ||||||||||||||
| Non-cash impairment charges | 4 | — | 12 |
|
| 20 |
| 6 |
| 5 | |||||||||||
| Depreciation and amortization | 139 | 133 | 118 |
|
| 173 |
| 158 |
| 148 | |||||||||||
| Deferred tax provision | 20 | 19 | 20 | ||||||||||||||||||
Deferred income taxes |
|
| 105 |
| (1) |
| (6) | ||||||||||||||
| Share-based compensation expense | 24 | 25 | 20 |
|
| 15 |
| 22 |
| 22 | |||||||||||
| Excess tax benefits on share-based compensation | (12 | ) | (8 | ) | (9 | ) | |||||||||||||||
| Gain on sale of real estate | (4 | ) | — | — | |||||||||||||||||
| Qualified pension plan contributions | (6 | ) | (2 | ) | (26 | ) |
|
| (25) |
| (36) |
| (4) | ||||||||
| Change in assets and liabilities: |
|
|
|
|
|
|
| ||||||||||||||
| Merchandise inventories | (81 | ) | (20 | ) | (91 | ) |
|
| 69 |
| (25) |
| (49) | ||||||||
| Accounts payable | 51 | (48 | ) | 57 |
|
| — |
| (31) |
| (17) | ||||||||||
| Accrued and other liabilities | 33 | (10 | ) | (4 | ) |
|
| (30) |
| 27 |
| — | |||||||||
| Income tax receivables and payables | — | 38 | (34 | ) | |||||||||||||||||
Pension litigation accrual |
|
| 178 |
| — |
| 100 | ||||||||||||||
| Other, net | 24 | (26 | ) | (44 | ) |
|
| 24 |
| 60 |
| 51 | |||||||||
| Net cash provided by operating activities | 712 | 530 | 416 |
|
| 813 |
| 844 |
| 791 | |||||||||||
| From Investing Activities | |||||||||||||||||||||
| Gain from lease terminations | — | 2 | — | ||||||||||||||||||
| Proceeds from sale of real estate | 5 | — | — | ||||||||||||||||||
| Purchases of short-term investments | — | (23 | ) | (88 | ) | ||||||||||||||||
| Sales and maturities of short-term investments | 9 | 60 | 39 | ||||||||||||||||||
|
|
|
|
|
|
|
| ||||||||||||||
From investing activities: |
|
|
|
|
|
|
| ||||||||||||||
Capital expenditures |
|
| (274) |
| (266) |
| (228) | ||||||||||||||
Cash paid for a cost method investment |
|
| (15) |
| — |
| — | ||||||||||||||
| Purchase of business, net of cash acquired | — | (81 | ) | — |
|
| — |
| — |
| (2) | ||||||||||
| Capital expenditures | (190 | ) | (206 | ) | (163 | ) | |||||||||||||||
| Net cash used in investing activities | (176 | ) | (248 | ) | (212 | ) |
|
| (289) |
| (266) |
| (230) | ||||||||
| From Financing Activities | |||||||||||||||||||||
|
|
|
|
|
|
|
| ||||||||||||||
From financing activities: |
|
|
|
| �� |
|
|
| |||||||||||||
| Purchase of treasury shares | (305 | ) | (229 | ) | (129 | ) |
|
| (467) |
| (432) |
| (419) | ||||||||
| Dividends paid on common stock | (127 | ) | (118 | ) | (109 | ) |
|
| (157) |
| (147) |
| (139) | ||||||||
| Issuance of common stock | 17 | 27 | 43 | ||||||||||||||||||
Proceeds from exercise of stock options |
|
| 13 |
| 29 |
| 64 | ||||||||||||||
| Treasury stock reissued under employee stock plan | 5 | 3 | 5 |
|
| 5 |
| 4 |
| 5 | |||||||||||
| Excess tax benefits on share-based compensation | 12 | 9 | 11 | ||||||||||||||||||
| Reduction in long-term debt and obligations under capital leases | (3 | ) | (1 | ) | (2 | ) | |||||||||||||||
Shares of common stock repurchased to satisfy tax withholding obligations |
|
| (10) |
| (7) |
| (9) | ||||||||||||||
Payment of revolving credit agreement costs |
|
| — |
| (2) |
| — | ||||||||||||||
Reduction in obligations under capital leases |
|
| — |
| (1) |
| (2) | ||||||||||||||
| Net cash used in financing activities | (401 | ) | (309 | ) | (181 | ) |
|
| (616) |
| (556) |
| (500) | ||||||||
| Effect of Exchange Rate Fluctuations on Cash and Cash Equivalents | (26 | ) | 5 | 6 | |||||||||||||||||
| Net Change in Cash and Cash Equivalents | 109 | (22 | ) | 29 | |||||||||||||||||
| Cash and Cash Equivalents at Beginning of Year | 858 | 880 | 851 | ||||||||||||||||||
| Cash and Cash Equivalents at End of Year | $ | 967 | $ | 858 | $ | 880 | |||||||||||||||
| Cash Paid During the Year: | |||||||||||||||||||||
|
|
|
|
|
|
|
| ||||||||||||||
Effect of exchange rate fluctuations on cash, cash equivalents, and restricted cash |
|
| 50 |
| 3 |
| (6) | ||||||||||||||
Net change in cash, cash equivalents, and restricted cash |
|
| (42) |
| 25 |
| 55 | ||||||||||||||
Cash, cash equivalents, and restricted cash at beginning of year |
|
| 1,073 |
| 1,048 |
| 993 | ||||||||||||||
Cash, cash equivalents, and restricted cash at end of year |
| $ | 1,031 |
| $ | 1,073 |
| $ | 1,048 | ||||||||||||
|
|
|
|
|
|
|
| ||||||||||||||
Cash paid during the year: |
|
|
|
|
|
|
| ||||||||||||||
| Interest | $ | 11 | $ | 11 | $ | 11 |
| $ | 11 |
| $ | 11 |
| $ | 11 | ||||||
| Income taxes | $ | 251 | $ | 175 | $ | 230 |
| $ | 237 |
| $ | 341 |
| $ | 283 | ||||||
See Accompanying Notes to Consolidated Financial Statements.
* Amounts for 2016 and 2015 have been revised from previously reported amounts to reflect the adoption of new accounting standards in 2017. For additional information, see Note 1, Summary of Significant Accounting Policies.
FOOT LOCKER, INC.
NOTES TO CONSOLIDATED FINANCIAL STATEMENTS
1. Summary of Significant Accounting Policies
Basis of Presentation
The consolidated financial statements include the accounts of Foot Locker, Inc. and its domestic and international subsidiaries (the “Company”), all of which are wholly owned. All significant intercompany amounts have been eliminated. The preparation of financial statements in conformity with U.S. generally accepted accounting principles requires management to make estimates and assumptions relating to the reporting of assets and liabilities and the disclosure of contingent liabilities at the date of the financial statements, and the reported amounts of revenues and expenses during the reporting period. Actual results may differ from those estimates.
Reporting Year
The fiscal year end for the Company is the Saturday closest to the last day in January. Fiscal year 20142017 represents the 53 weeks ended February 3, 2018. Fiscal years 2016 and 2015 represented the 52 weeks endingended January 31, 2015. Fiscal years 201328, 2017 and 2012 represent the 52 week period ending February 1, 2014, and the 53 week period ending February 2, 2013,January 30, 2016, respectively. References to years in this annual report relate to fiscal years rather than calendar years.
Revenue Recognition
Revenue from retail stores is recognized at the point of sale when the product is delivered to customers. Internet and catalog sales revenue is recognized upon estimated product receipt by the customer. Sales include shipping and handling fees for all periods presented. Sales include merchandise, net of returns, and exclude taxes. The Company provides for estimated returns based on return history and sales levels. Revenue from layaway sales is recognized when the customer receives the product, rather than when the initial deposit is paid.
Please see the Recent Accounting Pronouncements section later in this note regarding the accounting changes relating to the 2018 adoption of Accounting Standards Update (“ASU”) 2014-09, Revenue from Contracts with Customers.
Gift Cards
The Company sells gift cards to its customers, which do not have expiration dates. Revenue from gift card sales is recorded when the gift cards are redeemed or when the likelihood of the gift card being redeemed by the customer is remote and there is no legal obligation to remit the value of unredeemed gift cards to the relevant jurisdictions, referred to as breakage. The Company has determined its gift card breakage rate based upon historical redemption patterns. Historical experience indicates that after 12 months, the likelihood of redemption is deemed to be remote. Gift card breakage income is included in selling, general and administrative expenses and unredeemed gift cards are recorded as a current liability. Gift card breakage was $6 million for both 2017 and 2016, and was $5 million for 2014, $4 million for 2013, and $3 million for 2012.2015.
Please see the Recent Accounting Pronouncements section later in this note regarding the accounting changes relating to the 2018 adoption of ASU 2014-09, Revenue from Contracts with Customers.
Store Pre-Opening and Closing Costs
Store pre-opening costs are charged to expense as incurred. In the event a store is closed before its lease has expired, the estimated post-closing lease exit costs, less any sublease rental income, is provided for once the store ceases to be used.
Advertising Costs and Sales Promotion
Advertising and sales promotion costs are expensed at the time the advertising or promotion takes place, net of reimbursements for cooperative advertising. Advertising expenses also include advertising costs as required by some of the Company’s mall-based leases. Cooperative advertising reimbursements earned for the launch and promotion of certain products agreed upon with vendors are recorded in the same period as the associated expenses are incurred.
42
FOOT LOCKER, INC.
NOTES TO CONSOLIDATED FINANCIAL STATEMENTS
Digital advertising costs are expensed as incurred, net of reimbursements for cooperative advertising. Digital advertising includes search engine marketing, such as display ads and keyword search terms, and other various forms of digital advertising.Reimbursement received in excess of expenses incurred related to specific, incremental, and identifiable advertising costs is accounted for as a reduction to the cost of merchandise whichand is reflected in cost of sales as the merchandise is sold.
FOOT LOCKER, INC.
NOTES TO CONSOLIDATED FINANCIAL STATEMENTS
1. Summary of Significant Accounting Policies – (continued)
Advertising costs, including digital advertising, which are included as a component of selling, general and administrative expenses, were as follows:
|
|
|
|
|
|
|
|
|
|
|
|
|
|
|
|
|
| 2017 | 2016 | 2015 | |||
|
| ($ in millions) | |||||
Advertising expenses |
| $ | 108 | $ | 118 | $ | 119 |
Digital advertising expenses |
|
| 96 |
| 84 |
| 65 |
Cooperative advertising reimbursements |
|
| (20) |
| (20) |
| (19) |
Net advertising expense |
| $ | 184 | $ | 182 | $ | 165 |
| 2014 | 2013 | 2012 | ||||||||||
| (in millions) | ||||||||||||
| Advertising expenses | $ | 125 | $ | 124 | $ | 132 | ||||||
| Cooperative advertising reimbursements | (21 | ) | (22 | ) | (25 | ) | ||||||
| Net advertising expense | $ | 104 | $ | 102 | $ | 107 | ||||||
Catalog Costs
Catalog costs, which are primarily comprised of paper, printing, and postage, are capitalized and amortized over the expected customer response period related to each catalog, which is generally 90 days. Cooperative reimbursements earned for the promotion of certain products are agreed upon with vendors and are recorded in the same period as the associated catalog expenses are amortized. Prepaid catalog costs totaled $3were $1 million forat both February 3, 2018 and January 31, 2015 and February 1, 2014.28, 2017.
Catalog costs, which are included as a component of selling, general and administrative expenses, were as follows:
|
|
|
|
|
|
|
|
|
|
|
|
|
|
|
|
|
| 2017 | 2016 | 2015 | |||
|
| ($ in millions) | |||||
Catalog costs |
| $ | 19 | $ | 26 | $ | 28 |
Cooperative reimbursements |
|
| (2) |
| (6) |
| (7) |
Net catalog expense |
| $ | 17 | $ | 20 | $ | 21 |
| 2014 | 2013 | 2012 | ||||||||||
| (in millions) | ||||||||||||
| Catalog costs | $ | 32 | $ | 36 | $ | 45 | ||||||
| Cooperative reimbursements | (7 | ) | (5 | ) | (6 | ) | ||||||
| Net catalog expense | $ | 25 | $ | 31 | $ | 39 | ||||||
Earnings Per Share
The Company accounts for and discloses earnings per share using the treasury stock method. Basic earnings per share is computed by dividing reported net income for the period by the weighted-average number of common shares outstanding at the end of the period. Restricted stock awards, which contain non-forfeitable rights to dividends, are considered participating securities and are included in the calculation of basic earnings per share. Diluted earnings per share reflects the weighted-average number of common shares outstanding during the period used in the basic earnings per share computation plus dilutive common stock equivalents.
The computation of basic and diluted earnings per share is as follows:
|
|
|
|
|
|
|
|
|
|
|
|
|
|
|
|
|
| 2017 | 2016 | 2015 | |||
| (in millions, except per share data) | ||||||
Net Income |
| $ | 284 | $ | 664 | $ | 541 |
|
|
|
|
|
|
|
|
Weighted-average common shares outstanding |
|
| 127.2 |
| 134.0 |
| 139.1 |
Dilutive effect of potential common shares |
|
| 0.7 |
| 1.1 |
| 1.7 |
Weighted-average common shares outstanding assuming dilution |
|
| 127.9 |
| 135.1 |
| 140.8 |
|
|
|
|
|
|
|
|
Earnings per share - basic |
| $ | 2.23 | $ | 4.95 | $ | 3.89 |
Earnings per share - diluted |
| $ | 2.22 | $ | 4.91 | $ | 3.84 |
|
|
|
|
|
|
|
|
Anti-dilutive share-based awards excluded from diluted calculation |
|
| 1.6 |
| 0.4 |
| 0.6 |
| 2014 | 2013 | 2012 | ||||||||||
| (in millions, except per share data) | ||||||||||||
| Net Income | $ | 520 | $ | 429 | $ | 397 | ||||||
| Weighted-average common shares outstanding | 143.9 | 148.4 | 151.2 | |||||||||
| Basic earnings per share | $ | 3.61 | $ | 2.89 | $ | 2.62 | ||||||
| Weighted-average common shares outstanding | 143.9 | 148.4 | 151.2 | |||||||||
| Dilutive effect of potential common shares | 2.1 | 2.1 | 2.8 | |||||||||
| Weighted-average common shares outstanding assuming dilution | 146.0 | 150.5 | 154.0 | |||||||||
| Diluted earnings per share | $ | 3.56 | $ | 2.85 | $ | 2.58 | ||||||
43
The Company adopted ASU 2016-09 during the first quarter of Significant Accounting Policies – (continued)
Potential common shares include the dilutive effect of stock options2017. As a result, excess tax benefits and restricted stock units. Options to purchase 0.6 million, 1.0 million, and 0.8 million shares of common stock at January 31, 2015, February 1, 2014, and February 2, 2013, respectively, were nottax deficiencies are no longer included as assumed proceeds in the computations primarily because the exercise pricecalculation of the optionsdiluted shares outstanding. This change was greater than the average market price of the common shares and, therefore, the effect of their inclusion would be antidilutive. adopted prospectively.
Contingently issuable shares of 0.3 million, 0.2 million, and 0.1 million at January 31, 2015, February 1, 2014, and February 2, 2013, respectively,for all periods presented, have not been included as the vesting conditions have not been satisfied. These shares relate to restricted stock unit awards issued in connection with the Company’s long-term incentive program.
Share-Based Compensation
The Company recognizes compensation expense in the financial statements for share-based awards based on the grant date fair value of those awards. Additionally, stock-based compensation expense includes an estimate for pre-vesting forfeitures and is recognized on a straight-line basis over the requisite service periodsperiod for each vesting tranche of the awards.award. See Note 21,Share-Based Compensation, for information on the assumptions the Company used to calculate the fair value of share-based compensation.
Upon exercise of stock options, issuance of restricted stock or units, or issuance of shares under the employees stock purchase plan, the Company will issue authorized but unissued common stock or use common stock held in treasury. The Company may make repurchases
Cash, Cash Equivalents and Restricted Cash
Cash consists of its common stock from time to time, subject to legalfunds held on hand and contractual restrictions, market conditions, and other factors.
Cash and Cash Equivalents
Cash equivalents at January 31, 2015 and February 1, 2014 were $930 million and $819 million, respectively.in bank accounts. Cash equivalents include amounts on demand with banks and all highly liquid investments with original maturities of three months or less, including money market funds. Additionally, amounts due from third-party credit card processors for the settlement of debit and credit card transactions are included as cash equivalents as they are generally collected within three business days. Restricted cash represents cash that is restricted as to withdrawal or use under the terms of various agreements. Restricted cash includes amounts held in a qualified settlement fund in connection with the pension litigation, amounts held in escrow in connection with various leasing arrangements in Europe, and deposits held in insurance trusts in order to satisfy the requirement to collateralize part of the self-insured workers’ compensation and liability claims.
The following table provides the reconciliation of cash, cash equivalents, and restricted cash, as reported on our consolidated statements of cash flows.
|
|
|
|
|
|
|
|
|
|
|
|
|
|
|
|
|
|
|
|
|
| 2017 |
| 2016 |
| 2015 | |||
|
| ($ in millions) | |||||||
Cash and cash equivalents (1) |
| $ | 849 |
| $ | 1,046 |
| $ | 1,021 |
Restricted cash included in other current assets |
|
| 1 |
|
| — |
|
| 1 |
Restricted cash included in other non-current assets (2) |
|
| 181 |
|
| 27 |
|
| 26 |
Cash, cash equivalents, and restricted cash |
| $ | 1,031 |
| $ | 1,073 |
| $ | 1,048 |
(1) | Includes cash equivalents of $780 million, $1,000 million, and $983 million for the year ended February 3, 2018, January 28, 2017, and January 30, 2016, respectively. | |
(2) | Restricted cash for the year ended February 3, 2018 includes $150 million deposited to a qualified settlement fund in connection with the pension litigation. Please see Note 22, Legal Proceedings for further information. |
Investments
Changes in the fair value of available-for-sale securities are reported as a component of accumulated other comprehensive loss in the Consolidated Statements of Shareholders’ Equity and are not reflected in the Consolidated Statements of Operations until a sale transaction occurs or when declines in fair value are deemed to be other-than-temporary. The CompanyAvailable-for-sale securities are routinely reviews available-for-sale securitiesreviewed for other-than-temporary declines in fair value below the cost basis, and when events or changes in circumstances indicate the carrying value of a security may not be recoverable, the security is written down to fair value. As of January 31, 2015,February 3, 2018, the Company held $6 million ofone available-for-sale securities,security, which representedwas the Company’s $7 million auction rate security. See Note 19, Fair Value Measurements, for further discussiondiscussion.
44
FOOT LOCKER, INC.
NOTES TO CONSOLIDATED FINANCIAL STATEMENTS
Additionally, the Company’s investment in a privately-held company is accounted for using the cost method and had a carrying value of these investments.$15 million as of February 3, 2018. This investment is included within other assets.If a significant adverse effect on the fair value of the investment were to occur and was deemed to be other-than-temporary, the fair value of the investment would be estimated, and the amount by which the carrying value of the cost-method investment exceeds its fair value would be recorded as an impairment loss.
Merchandise Inventories and Cost of Sales
Merchandise inventories for the Company’s Athletic Stores are valued at the lower of cost or market using the retail inventory method. Cost for retail stores is determined on the last-in, first-out (“LIFO”) basis for domestic inventories and on the first-in, first-out (“FIFO”) basis for international inventories. Merchandise inventories of the Direct-to-Customers business are valued at the lower of cost or market using weighted-average cost, which approximates FIFO.
The retail inventory method is commonly used by retail companies to value inventories at cost and calculate gross margins due to its practicality. Under the retail inventory method, cost is determined by applying a cost-to-retail percentage across groupings of similar items, known as departments. The cost-to-retail percentage is applied to ending inventory at its current owned retail valuation to determine the cost of ending inventory on a department basis. The Company provides reserves based on current selling prices when the inventory has not been marked down to market. Merchandise inventories of the Direct-to-Customers business are valued at the lower of cost or market using weighted-average cost, which approximates FIFO.
Transportation, distribution center,
FOOT LOCKER, INC.
NOTES TO CONSOLIDATED FINANCIAL STATEMENTS
1. Summary of Significant Accounting Policies – (continued)
and sourcing costs are capitalized in merchandise inventories. The Company expenses the freight associated with transfers between its store locations in the period incurred. The Company maintains an accrual for shrinkage based on historical rates.
Cost of sales is comprised of the cost of merchandise, as well as occupancy, buyers’ compensation, and shipping and handling costs. The cost of merchandise is recorded net of amounts received from suppliers for damaged product returns, markdown allowances, and volume rebates, as well as cooperative advertising reimbursements received in excess of specific, incremental advertising expenses. Occupancy costs include the amortization of amounts received from landlords for tenant improvements.
Property and Equipment
Property and equipment are recorded at cost, less accumulated depreciation and amortization. Significant additions and improvements to property and equipment are capitalized. Depreciation and amortization are computed on a straight-line basis over the following estimated useful lives:
Buildings | Maximum of 50 years | ||
Store leasehold improvements | Shorter of the asset useful life or expected term of the lease | ||
Furniture, fixtures, and equipment | 3-10 years | ||
Software | 2-7 years |
Maintenance and repairs are charged to current operations as incurred. Major renewals or replacements that substantially extend the useful life of an asset are capitalized and depreciated.
Internal-Use Software Development Costs
The Company capitalizes certain external and internal computer software and software development costs incurred during the application development stage. The application development stage generally includes software design and configuration, coding, testing, and installation activities. Capitalized costs include only external direct cost of materials and services consumed in developing or obtaining internal-use software, and payroll and payroll-related costs for employees who are directly associated with and devote time to the internal-use software project. Capitalization of such costs ceases no later than the point at which the project is substantially complete and ready for its intended use. Training and maintenance costs are expensed as incurred, while upgrades and enhancements are capitalized if it is probable that such expenditures will result in additional functionality. Capitalized software, net of accumulated amortization, is included as a component of property and equipment and was $39$67 million and $38$59 million at February 3, 2018 and January 31, 2015 and February 1, 2014,28, 2017, respectively.
45
FOOT LOCKER, INC.
NOTES TO CONSOLIDATED FINANCIAL STATEMENTS
Recoverability of Long-Lived Tangible Assets
The Company reviews long-lived tangible and intangible assets with finite lives forperforms an impairment losses whenever events or changes inreview when circumstances indicate that the carrying amountsvalue of long-lived tangible assets may not be recoverable. Management’s policy in determining whether an impairment indicator exists, a triggering event, comprises measurable operating performance criteria at the division level, as well as qualitative measures. The Company considers historical performance and future estimated results, which are predominately identified from the Company’s long-range strategic long-range plans, in its evaluation of potential store-level impairment and then compares the carrying amount of the asset with the estimated future cash flows expected to result from the use of the asset. If the carrying amount of the asset exceeds the estimated expected undiscounted future cash flows, the Company measures the amount of the impairment by comparing the carrying amount of the asset with its estimated fair value. The estimation of fair value is measured by discounting expected future cash flows at the Company’s weighted-average cost of capital. The Company estimates fair value based on the best information available using estimates, judgments, and projections as considered necessary.
FOOT LOCKER, INC.
NOTES TO CONSOLIDATED FINANCIAL STATEMENTS
1. Summary of Significant Accounting Policies – (continued)
Goodwill and Other Intangible Assets
Goodwill and intangible assets with indefinite lives are reviewed for impairment annually during the first quarter of itseach fiscal year or more frequently if impairment indicators arise.
The review of goodwill impairment consists of either using a qualitative approach to determine whether it is more likely than not that the fair value of the assets is less than their respective carrying values or a two-step impairment test, if necessary. If, based on the results of the qualitative assessment, it is concluded that it is not more likely than not that the fair value of the intangible asset is greater than its carrying value, the two-step test is performed to identify potential impairment. If it is determined that it is not more likely than not that the fair value of the reporting unit is less than its carrying value, it is unnecessary to perform the two-step impairment test.
Based on certain circumstances, we may elect to bypass the qualitative assessment and proceed directly to performing the first step of the two-step impairment test. The first step of the two-step goodwill impairment test compares the fair value of the reporting unit to its carrying amount, including goodwill. The second step includes hypothetically valuing all the tangible and intangible assets of the reporting unit as if the reporting unit had been acquired in a business combination. Then, the implied fair value of the reporting unit’s goodwill is compared to the carrying amount of that goodwill. If the carrying value of the asset exceeds its fair value, an impairment loss is recognized in the amount of the excess. The fair value of each reporting unit is determined using a combination of market and discounted cash flow approaches.approach.
Intangible assets that are determined to have finite lives are amortized over their useful lives and are measured for impairment only when events or changes in circumstances indicate that the carrying value may be impaired. Intangible assets with indefinite lives are tested for impairment if impairment indicators arise and, at a minimum, annually. We estimateThe impairment review for intangible assets with indefinite lives consists of either performing a qualitative or a quantitative assessment. If the results of the qualitative assessment indicate that it is more likely than not that the fair value of the indefinite-lived intangible is less than its carrying amount, or if we elect to proceed directly to a quantitative assessment, we calculate the fair value using a discounted cash flow method, based on an income approach using the relief-from-royalty method.relief from royalty concept, and compare the fair value to the carrying value to determine if the asset is impaired.
Derivative Financial Instruments
All derivative financial instruments are recorded in the Company’s Consolidated Balance Sheets at their fair values. For derivatives designated as a hedge, and effective as part of a hedge transaction, the effective portion of the gain or loss on the hedging derivative instrument is reported as a component of other comprehensive income/loss or as a basis adjustment to the underlying hedged item and reclassified to earnings in the period in which the hedged item affects earnings. The effective portion of the gain or loss on hedges of foreign net investments is generally not reclassified to earnings unless the net investment is disposed of. To the extent derivatives do not qualify or are not designated as hedges, or are ineffective, their changes in fair value are recorded in earnings immediately, which may subject the Company to increased earnings volatility.
46
FOOT LOCKER, INC.
NOTES TO CONSOLIDATED FINANCIAL STATEMENTS
Fair Value
The Company categorizes its financial instruments into a three-level fair value hierarchy that prioritizes the inputs to valuation techniques used to measure fair value into three broad levels. The fair value hierarchy gives the highest priority to quoted prices in active markets for identical assets or liabilities (Level 1) and the lowest priority to unobservable inputs (Level 3). If the inputs used to measure fair value fall within different levels of the hierarchy, the category level is based on the lowest priority level input that is significant to the fair value measurement of the instrument. Fair value is determined based upon the exit price that would be received to sell an asset or paid to transfer a liability in an orderly transaction between market participants exclusive of any transaction costs. The Company’s financial assets recorded at fair value are categorized as follows:
Level 1 —
Level 1 - | Quoted prices for identical instruments in active markets. | |
Level 2 - | Quoted prices for similar instruments in active markets; quoted prices for identical or similar instruments in markets that are not active; and model-derived valuations in which all significant inputs or significant value-drivers are observable in active markets. | |
Level 3 - | Model-derived valuations in which one or more significant inputs or significant value-drivers are unobservable. |
Level 2 — Quoted prices for similar instruments in active markets; quoted prices for identical or similar instruments in markets that are not active; and model-derived valuations in which all significant inputs or significant value-drivers are observable in active markets.
Level 3 — Model-derived valuations in which one or more significant inputs or significant value-drivers are unobservable.
FOOT LOCKER, INC.
NOTES TO CONSOLIDATED FINANCIAL STATEMENTS
1. Summary of Significant Accounting Policies – (continued)
Income Taxes
The Company accounts for its income taxes under the asset and liability method, which requires the recognition of deferred tax assets and liabilities for the expected future tax consequences of events that have been included in the financial statements. Under this method, deferred tax assets and liabilities are determined on the basis of the differences between the financial statements and the tax basis of assets and liabilities, using enacted tax rates in effect for the year in which the differences are expected to reverse. The effect of a change in tax rates on deferred tax assets and liabilities is recognized in income in the period that includes the enactment date. Deferred tax assets are recognized for tax credits and net operating loss carryforwards, reduced by a valuation allowance, which is established when it is more likely than not that some portion or all of the deferred tax assets will not be realized. The effect of a change in tax rates on deferred tax assets and liabilities of a change in tax rates is recognized in income in the period that includes the enactment date.
The Company recognizes net deferred tax assets to the extent that it believes these assets are more likely than not to be realized. In making such a determination, the Company considers all available positive and negative evidence, including future reversals of existing taxable temporary differences, projected future taxable income, tax-planning strategies, and results of recent operations. If the Company determines that it would be able to realize theirits deferred tax assets in the future in excess of their net recorded amount, the Company would make an adjustment to the deferred tax asset valuation allowance, which would reduce the provision for income taxes.
A taxing authority may challenge positions that the Company adopted in its income tax filings. Accordingly, the Company may apply different tax treatments for transactions in filing its income tax returns than for income tax financial reporting. The Company regularly assesses its tax positions for such transactions and records reserves for those differences when considered necessary. Tax positions are recognized only when it is more likely than not, based on technical merits, that the positions will be sustained upon examination. Tax positions that meet the more-likely-than-not threshold are measured using a probability weighted approach as the largest amount of tax benefit that is greater than fifty percent likely of being realized upon settlement. Whether the more-likely-than-not recognition threshold is met for a tax position is a matter of judgment based on the individual facts and circumstances of that position evaluated in light of all available evidence. The Company recognizes interest and penalties related to unrecognized tax benefits within income tax expense in the accompanying consolidated statementConsolidated Statement of operations.Operations. Accrued interest and penalties are included within the related tax liability line in the consolidated balance sheet. Consolidated Balance Sheet.
Provision for U.S. income taxes on undistributed earnings of foreign subsidiaries is made only on those amounts in excess of the funds considered to be permanently reinvested.
47
FOOT LOCKER, INC.
NOTES TO CONSOLIDATED FINANCIAL STATEMENTS
Our income tax provision for 2017 includes the estimated effects of U.S. tax reform (“Tax Act”) enacted on December 22, 2017. The Tax Act significantly revises U.S. corporate income taxation, among other changes, lowering corporate income tax rates, implementing a modified territorial tax regime, and imposing a one-time transition tax through a deemed repatriation of accumulated untaxed earnings and profits of foreign subsidiaries. The Company has made estimates of the effects and recorded provisional amounts in its 2017 financial statements as permitted under Staff Accounting Bulletin No. 118, Income Tax Accounting Implications of the Tax Cuts and Jobs Act, which provides guidance on accounting for the Tax Act’s effects. The ultimate effect of the Tax Act may differ from the provisional amount, possibly materially, due to, among other things, further refinement of our calculations, changes in interpretations and assumptions we have made, regulatory and administrative guidance that may be issued, and actions we may take as a result of the Tax Act. See also Note 17, Income Taxes for more information.
Pension and Postretirement Obligations
The discount rate for the U.S. plans is determined by reference to the Bond:Link interest rate model based upon a portfolio of highly ratedhighly-rated U.S. corporate bonds with individual bonds that are theoretically purchased to settle the plan’s anticipated cash outflows. The cash flows are discounted to their present value and an overall discount rate is determined. The discount rate selected to measure the present value of the Company’s Canadian benefit obligations was developed by using thethat plan’s bond portfolio indices, which match the benefit obligations. The Company measures its plan assets and benefit obligations using the month-end date that is closest to our fiscal year end.
Insurance Liabilities
The Company is primarily self-insured for health care, workers’ compensation, and general liability costs. Accordingly, provisions are made for the Company’s actuarially determined estimates of discounted future claim costs for such risks, for the aggregate of claims reported, and claims incurred but not yet reported. Self-insured liabilities totaled $13$10 million and $11$12 million at February 3, 2018 and January 31, 2015 and February 1, 2014,28, 2017, respectively. The Company discounts its workers’ compensation and general liability reserves using a risk-free interest rate. Imputed interest expense related to these liabilities was not significant for any of the periods presented.
FOOT LOCKER, INC.
NOTES TO CONSOLIDATED FINANCIAL STATEMENTS
1. Summary of Significant Accounting Policies – (continued)
Accounting for Leases
The Company recognizes rent expense for operating leases as of the possession date for store leases or the commencement of the agreement for a non-store lease. Rental expense, inclusive of rent holidays, concessions, and tenant allowances are recognized over the lease term on a straight-line basis. Contingent payments based upon sales and future increases determined by inflation related indices cannot be estimated at the inception of the lease and, accordingly, are charged to operations as incurred.
Treasury Stock Retirement
The Company periodically retires treasury shares that it acquires through share repurchases and returns those shares to the status of authorized but unissued. The Company accounts for treasury stock transactions under the cost method. For each reacquisition of common stock, the number of shares and the acquisition price for those shares is added to the existing treasury stock count and total value. When treasury shares are retired, the Company’s policy is to allocate the excess of the repurchase price over the par value of shares acquired to both retained earnings and additional paid-in capital. The portion allocated to additional paid-in capital is determined by applying a percentage, which is determined by dividing the number of shares to be retired by the number of shares issued, to the balance of additional paid-in capital as of the retirement date.
During 2017 and 2016, the Company retired 12 million and 42 million shares, respectively, of its common stock held in treasury. The shares were returned to the status of authorized but unissued. As a result, treasury stock decreased by $487 million and $1,728 million as of February 3, 2018 and January 28, 2017, respectively.
48
FOOT LOCKER, INC.
NOTES TO CONSOLIDATED FINANCIAL STATEMENTS
Foreign Currency Translation
The functional currency of the Company’s international operations is the applicable local currency. The translation of the applicable foreign currency into U.S. dollars is performed for balance sheet accounts using current exchange rates in effect at the balance sheet date and for revenue and expense accounts using the weighted-average rates of exchange prevailing during the year. The unearned gains and losses resulting from such translation are included as a separate component of accumulated other comprehensive loss within shareholders’ equity.
Recent Accounting Pronouncements
In May 2014, the Financial Accounting Standards Board (“FASB”) issued Accounting Standards Update (“ASU”) 2014-09,Revenue from Contracts with Customers, issued as a new Topic, Accounting Standards Codification Topic 606.. The core principle of this amendment is that an entity should recognize revenue to depict the transfer of promised goods or services to customers in an amount that reflects the consideration to which the entity expects to be entitled in exchange for those goods or services. ASU 2014-09 is effective for annual reporting periods beginning after December 15, 2016, including2017, and interim periods within that reporting period, with earlier adoption not permitted.therein. This ASU 2014-09 can be adopted either retrospectively to each prior reporting period presented or on a modified retrospective basis with the cumulative-effect recognized as a cumulative-effectan adjustment to retained earnings as of the date of adoption.adoption. The adoptionCompany has identified a change for the following items:
· | Timing change relating to the recognition of gift card breakage as well as recognition of gift card breakage as part of sales instead of recognition of breakage as part of SG&A expense. |
· | Timing change relating to the recognition of revenue for our e-commerce sales to be recognized at the shipping point rather than upon receipt by the customer. |
· | Timing change relating to the recognition of expenses for direct-response advertising costs. |
· | Balance sheet reclassification from inventory to other current assets relating to our right to recover products for expected returns. |
· | Change to the accounting for our unredeemed rewards for our loyalty program as a reduction to sales instead of recording the charge to cost of goods sold. |
We have substantially completed our evaluation of thisthe effect of ASU 2014-09, and will adopt the guidance beginning with our first quarter ending May 5, 2018, using the modified retrospective transition method. The adjustment to retained earnings will primarily represent the change in timing relating to gift card breakage and the change in timing related to the recognition of e-commerce sales, and is not expected to havebe significant.
In February 2016, the FASB issued ASU 2016-02, Leases. This ASU requires lessees to recognize a significantlease liability and a right-of-use asset for all leases, as well as additional disclosure regarding leasing arrangements. This standard will be effective for fiscal years beginning after December 15, 2018, including interim periods therein, and requires a modified retrospective adoption, with earlier adoption permitted. The Company does not expect to adopt this ASU until required and is evaluating the effect of this guidance. The Company has historically presented a non-GAAP measure to adjust its balance sheet to present operating leases as if they were capital leases. Based upon that analysis and preliminary evaluation of the standard, we estimate the adoption will result in the addition of $3 to $4 billion of assets and liabilities on our consolidated financial position, resultsbalance sheet, with no significant change to our consolidated statements of operations or cash flows.
In October 2016, the FASB issued ASU 2016-16, Income Taxes (Topic 740):Intra-Entity Transfers of Assets Other Than Inventory. ASU 2016-16 requires recognition of income tax consequences of an intra-entity transfer of an asset other than inventory when the transfer occurs. This ASU is effective and will be adopted by the Company for annual reporting periods beginning after December 15, 2017, including interim periods therein. The amendments in this update should be applied on a modified retrospective basis through a cumulative-effect adjustment directly to retained earnings as of the beginning of the period of adoption. Upon adoption, a company would write off any income tax effects that had been deferred from past intercompany transactions involving non-inventory assets to opening retained earnings. In addition, an entity would record deferred tax assets with an offset to opening retained earnings for amounts that entity had previously not recognized under existing guidance but would recognize under the new guidance. Based on deferred tax amounts related to applicable past intercompany transactions and the foreign exchange rates as of February 3, 2018, we expect the adoption will result in an increase in deferred income tax assets of $37 million.
49
FOOT LOCKER, INC.
NOTES TO CONSOLIDATED FINANCIAL STATEMENTS
Other recently issued accounting pronouncements did not, or are not believed by management to, have a material effect on the Company’s present or future consolidated financial statements.
Recently Adopted Accounting Pronouncements
In March 2016, the FASB issued ASU 2016-09, Improvements to Employee Share-Based Payment Accounting. ASU 2016-09 simplifies the accounting for share-based payment transactions, including tax consequences, forfeitures, and classifications of the tax related items in the statement of cash flows. The Company adopted ASU 2016-09 during the first quarter of 2017. Amendments relating to accounting for excess tax benefits and deficiencies have been adopted prospectively. For the year ended February 3, 2018, the Company recorded $9 million of excess tax benefits related to share-based compensation awards to the income statement, within the income tax provision, whereas such benefits were previously recognized in equity. Also, in the diluted net earnings per share calculation, when applying the treasury stock method for shares that could be repurchased, the assumed proceeds no longer include the amount of excess tax benefits. This ASU also requires that we present excess tax benefits or deficiencies as operating activities in our consolidated statement of cash flow. As a result of adopting this change retrospectively, we reclassified excess tax benefits of $20 million and $35 million, which were previously classified as cash flows from financing activities, to operating activities for the years ended January 28, 2017 and January 30, 2016, respectively. Additionally, the presentation of employee taxes paid to taxing authorities for share-based transactions of $7 million and $9 million, previously classified as cash flows from operating activities, were reclassified to financing activities for the years ended January 28, 2017 and January 30, 2016, respectively. The Company has made a policy election of recording forfeitures as they occur instead of estimating forfeitures using a modified retrospective approach. The cumulative effect of this change was not significant.
In November 2016, the FASB issued ASU 2016-18, Statement of Cash Flows (Topic 230): Restricted Cash. ASU 2016-18 requires that a statement of cash flows explain the change during the period in the total cash, cash equivalents, and amounts generally described as restricted cash and restricted cash equivalents when reconciling the beginning-of-period and end-of-period total amounts. This ASU is effective for annual reporting periods beginning after December 15, 2017 including interim periods therein. The Company has adopted this ASU as of the first quarter of 2017. Accordingly, we restated our cash and cash equivalents balances in the consolidated statements of cash flows to include restricted cash of $27 million as of January 28, 2017 and January 30, 2016. Please see the Cash, Cash Equivalents, and Restricted Cash section earlier in this note for a reconciliation of cash and cash equivalents as presented on our consolidated balance sheets to cash, cash equivalents, and restricted cash as reported on our consolidated statements of cash flows.
In February 2018, the FASB issued ASU 2018-02, Income Statement—Reporting Comprehensive Income (Topic 220): Reclassification of Certain Tax Effects from Accumulated Other Comprehensive Income. ASU 2018-02 allows a reclassification from accumulated other comprehensive income to retained earnings for stranded tax effects resulting from the newly enacted corporate tax rates. As permitted by the ASU, the Company has elected to adopt this ASU early as of the year ended February 3, 2018, resulting in a reclassification of $41 million from accumulated other comprehensive loss to retained earnings. The amount of the reclassification is calculated on the basis of the difference between the historical and newly enacted tax rates on deferred taxes related primarily to our pension and postretirement benefit plans.
2. Segment Information
The Company has determined that its reportable segments are those that are based on its method of internal reporting. As of January 31, 2015,February 3, 2018, the Company hashad two reportable segments, Athletic Stores and Direct-to-Customers. The accounting policies of both segments are the same as those described in theNote 1, Summary of Significant Accounting Policiesnote.
. The Company evaluates performance based on several factors, of which the primary financial measure is division results. Division profit reflects income before income taxes, pension litigation and reorganization charges, corporate expense, non-operating income, and net interest (income) / expense.
Effective as of the beginning of fiscal year 2018, the Company will report one reportable segment based upon the change in our method of internal reporting.
| 2014 | 2013 | 2012 | ||||||||||
| (in millions) | ||||||||||||
| Sales | ||||||||||||
| Athletic Stores | $ | 6,286 | $ | 5,790 | $ | 5,568 | ||||||
| Direct-to-Customers | 865 | 715 | 614 | |||||||||
| Total sales | $ | 7,151 | $ | 6,505 | $ | 6,182 | ||||||
50
FOOT LOCKER, INC.
NOTES TO CONSOLIDATED FINANCIAL STATEMENTS
2. Segment Information – (continued)
|
|
|
|
|
| ||||||||||||||
| 2014 | 2013 | 2012 |
|
|
|
|
|
|
| ||||||||||
| (in millions) |
| 2017 | 2016 | 2015 | |||||||||||||||
Sales |
| ($ in millions) | |||||||||||||||||
| Athletic Stores |
| $ | 6,673 | $ | 6,744 | $ | 6,468 | ||||||||||||
| Direct-to-Customers |
|
| 1,109 |
| 1,022 |
| 944 | ||||||||||||
Total sales |
| $ | 7,782 | $ | 7,766 | $ | 7,412 | ||||||||||||
| Operating Results |
|
|
|
|
|
|
| ||||||||||||
| Athletic Stores | $ | 777 | $ | 656 | $ | 653 |
| $ | 675 | $ | 927 | $ | 872 | ||||||
| Direct-to-Customers | 109 | 84 | 65 |
|
| 135 |
| 143 |
| 142 | |||||||||
| Division profit | 886 | 740 | 718 |
|
| 810 |
| 1,070 |
| 1,014 | |||||||||
| Less: Corporate expense(3) | 81 | 76 | 108 | ||||||||||||||||
Less: Pension litigation and reorganization charges (3), (4) |
|
| 191 |
| — |
| 100 | ||||||||||||
Less: Corporate expense (5) |
|
| 48 |
| 70 |
| 77 | ||||||||||||
| Operating profit | 805 | 664 | 610 |
|
| 571 |
| 1,000 |
| 837 | |||||||||
Interest (income) / expense, net |
|
| (2) |
| 2 |
| 4 | ||||||||||||
| Other income | 9 | 4 | 2 |
|
| 5 |
| 6 |
| 4 | |||||||||
| Interest expense, net | 5 | 5 | 5 | ||||||||||||||||
| Income before income taxes | $ | 809 | $ | 663 | $ | 607 |
| $ | 578 | $ | 1,004 | $ | 837 | ||||||
(1) | Included in the results for | ||||||||||||||||||||||
(2) | Included in the results for | ||||||||||||||||||||||
(3) | Included in the 2017 and 2015 amounts is a pre-tax charge of | ||||||||||||||||||||||
(4) | Included in the 2017 amount is $13 million in pre-tax reorganization costs related to the | ||||||||||||||||||||||
(5) | Corporate expense for | ||||||||||||||||||||||
|
|
|
|
|
|
|
|
|
|
|
|
|
|
|
|
|
|
| |||||||||||||||||||||||||||||||||||||||
|
|
|
|
|
|
|
|
|
|
|
|
|
|
|
|
|
|
|
| ||||||||||||||||||||||||||||||||||||||
| Depreciation and |
|
|
|
|
|
|
|
|
|
|
|
| ||||||||||||||||||||||||||||||||||||||||||||
| Depreciation and Amortization | Capital Expenditures(1) | Total Assets |
| Amortization |
| Capital Expenditures (1) |
| Total Assets | |||||||||||||||||||||||||||||||||||||||||||||||||
| 2014 | 2013 | 2012 | 2014 | 2013 | 2012 | 2014 | 2013 | 2012 |
| 2017 | 2016 | 2015 |
| 2017 | 2016 | 2015 |
| 2017 | 2016 | 2015 | |||||||||||||||||||||||||||||||||||||
| (in millions) |
| ($ in millions) | |||||||||||||||||||||||||||||||||||||||||||||||||||||||
| Athletic Stores | $ | 119 | $ | 112 | $ | 96 | $ | 151 | $ | 163 | $ | 128 | $ | 2,499 | $ | 2,398 | $ | 2,310 |
| $ | 153 | $ | 140 | $ | 130 |
| $ | 202 | $ | 193 | $ | 181 |
| $ | 2,775 | $ | 2,802 | $ | 2,612 | ||||||||||||||||||
| Direct-to-Customers | 7 | 9 | 9 | 9 | 5 | 5 | 315 | 320 | 290 |
|
| 4 |
| 4 |
| 7 |
| 3 |
| 4 |
| 7 |
| 357 |
| 338 |
| 330 | |||||||||||||||||||||||||||||
| 126 | 121 | 105 | 160 | 168 | 133 | 2,814 | 2,718 | 2,600 |
|
| 157 |
| 144 |
| 137 |
| 205 |
| 197 |
| 188 |
| 3,132 |
| 3,140 |
| 2,942 | ||||||||||||||||||||||||||||||
| Corporate | 13 | 12 | 13 | 30 | 38 | 30 | 763 | 769 | 767 |
|
| 16 |
| 14 |
| 11 |
| 69 |
| 69 |
| 40 |
| 829 |
| 700 |
| 833 | |||||||||||||||||||||||||||||
| Total Company | $ | 139 | $ | 133 | $ | 118 | $ | 190 | $ | 206 | $ | 163 | $ | 3,577 | $ | 3,487 | $ | 3,367 |
| $ | 173 | $ | 158 | $ | 148 |
| $ | 274 | $ | 266 | $ | 228 |
| $ | 3,961 | $ | 3,840 | $ | 3,775 | ||||||||||||||||||
(1) | Reflects cash capital expenditures for all years presented. |
Sales and long-lived asset information by geographic area as of and for the fiscal years ended February 3, 2018, January 31, 2015, February 1, 2014,28, 2017, and February 2, 2013January 30, 2016 are presented in the following tables. Sales are attributed to the country in which the sales originate.transaction is fulfilled. Long-lived assets reflect property and equipment.
|
|
|
|
|
|
|
|
|
|
|
|
|
|
|
|
|
| 2017 | 2016 | 2015 | |||
Sales |
| ($ in millions) | |||||
United States |
| $ | 5,532 | $ | 5,562 | $ | 5,305 |
International |
|
| 2,250 |
| 2,204 |
| 2,107 |
Total sales |
| $ | 7,782 | $ | 7,766 | $ | 7,412 |
| 2014 | 2013 | 2012 | ||||||||||
| (in millions) | ||||||||||||
| Sales | ||||||||||||
| United States | $ | 4,976 | $ | 4,567 | $ | 4,495 | ||||||
| International | 2,175 | 1,938 | 1,687 | |||||||||
| Total sales | $ | 7,151 | $ | 6,505 | $ | 6,182 | ||||||
51
| 2014 | 2013 | 2012 | ||||||||||
| (in millions) | ||||||||||||
| Long-Lived Assets | ||||||||||||
| United States | $ | 446 | $ | 394 | $ | 321 | ||||||
| International | 174 | 196 | 169 | |||||||||
| Total long-lived assets | $ | 620 | $ | 590 | $ | 490 | ||||||
FOOT LOCKER, INC.
NOTES TO CONSOLIDATED FINANCIAL STATEMENTS
2. Segment Information – (continued)
|
|
|
|
|
|
|
|
|
|
|
|
|
|
|
|
|
| 2017 | 2016 | 2015 | |||
Long-Lived Assets |
| ($ in millions) | |||||
United States |
| $ | 607 | $ | 575 | $ | 486 |
International |
|
| 259 |
| 190 |
| 175 |
Total long-lived assets |
| $ | 866 | $ | 765 | $ | 661 |
For the periodyear ended January 31, 2015,February 3, 2018, the countries that comprised the majority of the sales and long-lived assets for the international category were Germany,Canada, Italy, Canada,Germany, and France. No other individual country included in the Internationalinternational category iswas significant.
3. ImpairmentLitigation and Other Charges
| 2014 | 2013 | 2012 | ||||||||||
| (in millions) | ||||||||||||
| Charges recorded in connection with CCS- | ||||||||||||
| Impairment of intangible assets | $ | 2 | $ | — | $ | 7 | ||||||
| Impairment of long-lived assets | — | — | 5 | |||||||||
| CCS store closure costs | — | 2 | — | |||||||||
| Total CCS charges | $ | 2 | $ | 2 | $ | 12 | ||||||
| Other intangible asset impairments | 2 | — | — | |||||||||
| Total impairment and other charges | $ | 4 | $ | 2 | $ | 12 | ||||||
|
|
|
|
|
|
|
|
|
|
|
|
|
|
|
|
|
| 2017 | 2016 | 2015 | |||
|
| ($ in millions) | |||||
Pension litigation charge |
| $ | 178 | $ | — | $ | 100 |
Reorganization costs |
|
| 13 |
| — |
| — |
Impairment of long-lived assets |
|
| 20 |
| 6 |
| 4 |
Other intangible asset impairments |
|
| — |
| — |
| 1 |
Total litigation and other charges |
| $ | 211 | $ | 6 | $ | 105 |
During the third quarter of 2017, the Company reorganized its organizational structure by adjusting certain responsibilities between our various businesses. As a result of this, as well as certain corporate staff reductions taken to improve corporate efficiency, the Company recorded a charge of $13 million. The charge consisted primarily of severance payments and benefit continuation costs for approximately 190 associates.
The Company acquiredfollowing is a reconciliation of the CCS e-commerce business in 2008 and later expanded its operations to include physical stores. accrual as of February 3, 2018:
|
|
|
|
|
|
|
|
|
|
|
|
|
|
|
|
|
|
|
|
|
|
| Severance and |
|
| Other Related |
|
|
|
|
|
| Benefit Costs |
|
| Charges |
|
| Total |
|
| ($ in millions) | |||||||
Balance at January 28, 2017 |
| $ | — |
| $ | — |
| $ | — |
Amounts charged to expense |
|
| 11 |
|
| 2 |
|
| 13 |
Cash payments |
|
| (6) |
|
| — |
|
| (6) |
Balance at February 3, 2018 |
| $ | 5 |
| $ | 2 |
| $ | 7 |
During 2012,2017, due to the underperformance of our SIX:02 stores, and the continued underperformance of this business, impairmentour Runners Point and other charges totaling $12 million were recorded. This representedSidestep stores, management determined that a triggering event had occurred and, therefore, an impairment ofreview was conducted. The Company evaluated the tradename of $7 million and $5 million to writedown long-lived assets of our SIX:02 stores for impairment and recorded a non-cash charge of $16 million to write down store fixtures and leasehold improvements for 30 stores. The Company also evaluated the CCSlong-lived assets of our Runners Point and Sidestep stores for impairment and recorded a non-cash charge of $4 million to write down store fixtures and leasehold improvements for 123 stores. During 2013,As of February 3, 2018, the remaining net book value of long-lived assets totaled $2 million for SIX:02, and totaled $12 million for Runners Point and Sidestep. The Company recorded $2 millionalso performed an impairment review of store closing costs, primarily related to lease buy-out expenses,other intangible assets for Runners Point and Sidestep, and the resulting from the decision to close the CCS store locations. Finally, during 2014 the Company exited the e-commerce businessnon-cash impairment charge was not significant.
In 2016 and further impaired the CCS tradename to its fair value, which was realized upon sale.
During 2014,2015, the Company also recorded non-cash impairment charges for Runners Point and Sidestep stores to write down long-lived assets of $6 million for 116 stores and $4 million for 61 stores, respectively. As a result of the impairment review related to long-lived assets, the Company performed a review of other intangible assets in 2016 and 2015. No impairment charges of these assets was required as a result of the 2016 review; however, in 2015 a non-cash impairment charge of $1 million to fully write down the remaining value of the tradename related to the Company’s stores in the Republic of Ireland, reflecting historical and projected underperformance. Additionally, the Companywas recorded a non-cash impairment charge to fully write down the value of an e-commerce trade name resulting from a private-label brand acquireddecline in sales, as part of the Runners Point Group acquisition, to reflectCompany shifted away from the exituse of this product line.website.
The Company recorded $178 million and $100 million in pension litigation charges during 2017 and 2015, respectively. Please see Note 22, Legal Proceedings for further information.
52
FOOT LOCKER, INC.
NOTES TO CONSOLIDATED FINANCIAL STATEMENTS
4. Other Income
Other income includes non-operating items, such as: gains from insurance recoveries; discounts/premiums paid on the repurchase and retirement of bonds; royalty income; and the changes in fair value, premiums paid, and realized gains associated with foreign currency option contractscontracts; and property sales. Other income was $9$5 million in 2014,2017, $6 million in 2016, and $4 million in 2013, and $2 million in 2012.2015.
For 2014,2017, other income includes a $4 million gain on a sale of property, $2 million of royalty income $2 million of realized gain associated with foreign currency option contracts and $1 million of lease termination gains related to the sales of leasehold interests. For 2013, otherOther income includesin 2016 included a gain of $2 million on a forward foreign currency contract associated with an intercompany transaction that did not qualify for hedge accounting; $2 million of royalty incomeincome; $1 million related to an insurance recovery; and $2$1 million of lease termination gains related to the sales of leasehold interests. For 2012, other income primarily includesIncluded in 2015 is a $2 million insurance recovery related to a business interruption claim and $2 million of royalty income.
FOOT LOCKER, INC.
NOTES TO CONSOLIDATED FINANCIAL STATEMENTS
5. Merchandise Inventories
|
|
|
|
| |||||||||
|
|
|
|
| |||||||||
| 2014 | 2013 |
| 2017 | 2016 | |||||||||
| (in millions) |
| ($ in millions) | |||||||||||
| LIFO inventories | $ | 821 | $ | 746 |
| $ | 809 | $ | 861 | ||||
| FIFO inventories | 429 | 474 |
|
| 469 |
| 446 | ||||||
| Total merchandise inventories | $ | 1,250 | $ | 1,220 |
| $ | 1,278 | $ | 1,307 | ||||
The value of the Company’s LIFO inventories, as calculated on a LIFO basis, approximates their value as calculated on a FIFO basis.
6. Other Current Assets
|
|
|
| ||||||||||
| 2014 | 2013 |
|
|
|
|
| |||||||
| (in millions) |
| 2017 | 2016 | ||||||||||
|
| ($ in millions) | |||||||||||
Prepaid income taxes |
| $ | 174 | $ | 48 | ||||||||
| Net receivables | $ | 78 | $ | 99 |
|
| 106 |
| 101 | ||||
| Prepaid rent | 77 | 75 |
|
| 96 |
| 86 | ||||||
| Prepaid income taxes | 34 | 35 | |||||||||||
| Prepaid expenses and other current assets | 32 | 34 | |||||||||||
| Deferred taxes and costs | 17 | 20 | |||||||||||
| Income tax receivable | 1 | — | |||||||||||
Other prepaid expenses |
|
| 31 |
| 27 | ||||||||
Deferred tax costs |
|
| 13 |
| 13 | ||||||||
Other |
|
| 4 |
| 5 | ||||||||
| $ | 239 | $ | 263 |
| $ | 424 | $ | 280 | |||||
7. Property and Equipment, Net
|
|
|
|
|
|
|
|
|
|
|
|
|
| 2017 | 2016 | ||
|
| ($ in millions) | |||
Land |
| $ | 4 | $ | 4 |
Buildings: |
|
|
|
|
|
Owned |
|
| 44 |
| 43 |
Furniture, fixtures, equipment and software development costs: |
|
|
|
|
|
Owned |
|
| 1,145 |
| 1,029 |
Assets under capital leases |
|
| — |
| 2 |
|
|
| 1,193 |
| 1,078 |
Less: accumulated depreciation |
|
| (753) |
| (674) |
|
|
| 440 |
| 404 |
Alterations to leased and owned buildings: |
|
|
|
|
|
Cost |
|
| 965 |
| 849 |
Less: accumulated amortization |
|
| (539) |
| (488) |
|
|
| 426 |
| 361 |
|
| $ | 866 | $ | 765 |
| 2014 | 2013 | |||||||
| (in millions) | ||||||||
| Land | $ | 4 | $ | 6 | ||||
| Buildings: | ||||||||
| Owned | 44 | 44 | ||||||
| Furniture, fixtures, equipment and software development costs: | ||||||||
| Owned | 900 | 888 | ||||||
| Assets under capital leases | 9 | 10 | ||||||
| 957 | 948 | |||||||
| Less: accumulated depreciation | (606 | ) | (621 | ) | ||||
| 351 | 327 | |||||||
| Alterations to leased and owned buildings | ||||||||
| Cost | 779 | 804 | ||||||
| Less: accumulated amortization | (510 | ) | (541 | ) | ||||
| 269 | 263 | |||||||
| $ | 620 | $ | 590 | |||||
53
FOOT LOCKER, INC.
NOTES TO CONSOLIDATED FINANCIAL STATEMENTS
8. Goodwill
The Athletic Stores segment’s goodwill is net of accumulated impairment charges of $167 million for all periods presented. The 20142017 and 20132016 annual goodwill impairment tests did not result in an impairment charge.
| Athletic Stores | Direct-to- Customers | Total | ||||||||||
| (in millions) | ||||||||||||
| Goodwill at February 2, 2013 | $ | 18 | $ | 127 | $ | 145 | ||||||
| Goodwill from Runners Point Group acquisition | 3 | 15 | 18 | |||||||||
| Goodwill at February 1, 2014 | $ | 21 | $ | 142 | $ | 163 | ||||||
| Foreign currency translation adjustment | (4 | ) | (2 | ) | (6 | ) | ||||||
| Goodwill at January 31, 2015 | $ | 17 | $ | 140 | $ | 157 | ||||||
|
|
|
|
|
|
|
|
|
|
|
|
|
|
|
|
|
|
|
|
|
|
|
|
| Direct-to- |
|
|
| |
|
| Athletic Stores |
| Customers |
| Total | |||
|
| ($ in millions) | |||||||
Goodwill at January 30, 2016 |
| $ | 17 |
| $ | 139 |
| $ | 156 |
Foreign currency translation adjustment |
|
| (1) |
|
| — |
|
| (1) |
Goodwill at January 28, 2017 |
| $ | 16 |
| $ | 139 |
| $ | 155 |
Foreign currency translation adjustment |
|
| 3 |
|
| 2 |
|
| 5 |
Goodwill at February 3, 2018 |
| $ | 19 |
| $ | 141 |
| $ | 160 |
FOOT LOCKER, INC.
NOTES TO CONSOLIDATED FINANCIAL STATEMENTS
9. Other Intangible Assets, net
| January 31, 2015 | Wtd. Avg. Life in Years(2) | February 1, 2014 | ||||||||||||||||||||||||||
| (in millions) | Gross value | Accum. amort. | Net Value | Gross value | Accum. amort. | Net Value | ||||||||||||||||||||||
| Amortized intangible assets:(1) | ||||||||||||||||||||||||||||
| Lease acquisition costs | $ | 128 | $ | (116 | ) | $ | 12 | 12.0 | $ | 155 | $ | (137 | ) | $ | 18 | |||||||||||||
| Trademarks | 21 | (12 | ) | 9 | 19.7 | 21 | (11 | ) | 10 | |||||||||||||||||||
| Favorable leases | 7 | (4 | ) | 3 | 7.4 | 8 | (3 | ) | 5 | |||||||||||||||||||
| $ | 156 | $ | (132 | ) | $ | 24 | 14.2 | $ | 184 | $ | (151 | ) | $ | 33 | ||||||||||||||
| Indefinite life intangible assets(1) | ||||||||||||||||||||||||||||
| Runners Point Group trademarks(3) | 25 | 30 | ||||||||||||||||||||||||||
| Other trademarks(4) | — | 4 | ||||||||||||||||||||||||||
| $ | 25 | $ | 34 | |||||||||||||||||||||||||
| Other intangible assets, net | $ | 49 | $ | 67 | ||||||||||||||||||||||||
|
|
|
|
|
|
|
|
|
|
|
|
|
|
|
|
|
|
|
|
|
|
|
|
|
|
|
|
|
|
|
|
|
|
|
|
|
|
|
|
|
|
|
|
|
|
| February 3, 2018 |
| January 28, 2017 | ||||||||||||||||
|
|
|
|
|
|
|
|
|
|
| Wtd. Avg. |
|
|
|
|
|
|
|
|
| |
|
|
| Gross |
| Accum. |
| Net |
| Life in |
| Gross |
| Accum. |
| Net | ||||||
($ in millions) |
| value |
| amort. |
| value |
| Years (2) |
| value |
| amort. |
| value | |||||||
Amortized intangible assets: (1) |
|
|
|
|
|
|
|
|
|
|
|
|
|
|
|
|
|
|
|
| |
| Lease acquisition costs |
| $ | 135 |
| $ | (122) |
| $ | 13 |
| 10.0 |
| $ | 116 |
| $ | (105) |
| $ | 11 |
| Trademarks / trade names |
|
| 20 |
|
| (14) |
|
| 6 |
| 20.0 |
|
| 20 |
|
| (13) |
|
| 7 |
| Favorable leases |
|
| 7 |
|
| (6) |
|
| 1 |
| 8.6 |
|
| 7 |
|
| (5) |
|
| 2 |
|
|
| $ | 162 |
| $ | (142) |
| $ | 20 |
| 13.8 |
| $ | 143 |
| $ | (123) |
| $ | 20 |
|
|
|
|
|
|
|
|
|
|
|
|
|
|
|
|
|
|
|
|
|
|
Indefinite life intangible assets: (1) |
|
|
|
|
|
|
|
|
|
|
|
|
|
|
|
|
|
|
|
| |
| Runners Point Group trademarks / trade names |
|
|
|
|
|
|
|
| 26 |
|
|
|
|
|
|
|
|
|
| 22 |
Other intangible assets, net |
|
|
|
|
|
|
| $ | 46 |
|
|
|
|
|
|
|
|
| $ | 42 | |
(1) | The change in the ending balances also reflect the effect of foreign currency |
(2) | The weighted-average useful life |
Amortizing intangible assets primarily represent lease acquisition costs, which are amounts that are required to secure prime lease locations and other lease rights, primarily in Europe. The amortizing intangible asset activity during 2014During 2017, the Company recorded $2 million of $9 million reflects a $4 million decreaselease acquisition additions, primarily related to foreign currency exchange fluctuations, partially offset byour European businesses. These additions are being amortized over a weighted-average life of $1 million related to new leases in Europe.10 years. Amortization expense for intangibles subject to amortization was $6 million, $11 million, and $14 million for 2014, 2013, and 2012, respectively.recorded is as follows:
|
|
|
|
|
|
|
|
|
|
($ in millions) |
| 2017 |
|
| 2016 |
|
| 2015 | |
Amortization expense |
| $ | 4 |
| $ | 4 |
| $ | 4 |
Estimated future amortization expense for finite lived intangibles for the next five years is as follows:
|
|
|
|
|
|
|
|
|
|
|
| ($ in millions) | |
2018 |
|
|
|
| $ | 4 |
2019 |
|
|
|
|
| 4 |
2020 |
|
|
|
|
| 3 |
2021 |
|
|
|
|
| 3 |
2022 |
|
|
|
|
| 2 |
| (in millions) | ||||
| 2015 | $ | 4 | ||
| 2016 | 4 | |||
| 2017 | 3 | |||
| 2018 | 3 | |||
| 2019 | 3 | |||
54
10. Other Assets
| 2014 | 2013 | |||||||
| (in millions) | ||||||||
| Restricted cash(1) | $ | 22 | $ | 25 | ||||
| Pension asset | 13 | 4 | ||||||
| Auction rate security | 6 | 6 | ||||||
| Deferred tax costs | 5 | 7 | ||||||
| Funds deposited in insurance trust(2) | 4 | 6 | ||||||
| Other | 24 | 28 | ||||||
| $ | 74 | $ | 76 | |||||
FOOT LOCKER, INC.
NOTES TO CONSOLIDATED FINANCIAL STATEMENTS
10. Other Assets
|
|
|
|
|
|
|
|
|
|
|
|
|
| 2017 | 2016 | ||
|
| ($ in millions) | |||
Restricted cash (1) |
| $ | 181 | $ | 27 |
Pension asset |
|
| 36 |
| 10 |
Deferred tax costs |
|
| 11 |
| 10 |
Auction rate security |
|
| 7 |
| 6 |
Cost method investment |
|
| 15 |
| — |
Other |
|
| 40 |
| 31 |
|
| $ | 290 | $ | 84 |
(1) | Restricted cash for the year ended February 3, 2018 includes $150 million deposited to a qualified settlement fund in connection with the pension litigation. Please see Note 22, Legal Proceedings for further information. |
11. Accrued and Other Liabilities
|
|
|
| ||||||||||
| 2014 | 2013 |
|
|
|
| ||||||||
| (in millions) |
| 2017 | 2016 | ||||||||||
|
| ($ in millions) | |||||||||||
Other payroll and payroll related costs, excluding taxes |
| $ | 67 | $ | 57 | ||||||||
| Taxes other than income taxes | $ | 56 | $ | 56 |
|
| 63 |
| 66 | ||||
| Other payroll and payroll related costs, excluding taxes | 54 | 54 | |||||||||||
Property and equipment (1) |
|
| 58 |
| 38 | ||||||||
Customer deposits (2) |
|
| 49 |
| 49 | ||||||||
Advertising |
|
| 22 |
| 35 | ||||||||
Income taxes payable |
|
| 11 |
| 5 | ||||||||
| Incentive bonuses | 51 | 41 |
|
| 6 |
| 32 | ||||||
| Property and equipment(1) | 49 | 39 | |||||||||||
| Current deferred tax liabilities | 48 | 46 | |||||||||||
| Customer deposits(2) | 44 | 38 | |||||||||||
| Income taxes payable | 10 | 5 | |||||||||||
| Other | 81 | 81 |
|
| 82 |
| 81 | ||||||
| $ | 393 | $ | 360 |
| $ | 358 | $ | 363 | |||||
(1) | Accruals for property and equipment are |
(2) | Customer deposits include unredeemed gift cards, |
12. Revolving Credit Facility
On January 27, 2012,May 19, 2016, the Company entered into an amended and restateda credit agreement (the “2011 Restatedwith its banks (“2016 Credit Agreement”) with its banks.. The 2011 Restated2016 Credit Agreement provides for a $200$400 million asset basedasset-based revolving credit facility maturing on January 27, 2017. In addition, duringMay19,2021. During the term of the 2011 Restated2016 Credit Agreement, the Company may makealso increase the commitments by up to four requests for additional credit commitments in an aggregate amount not$200 million, subject to exceed $200 million.customary conditions. Interest is baseddetermined, at the Company’s option, by the federal funds rate plus a margin of 0.125 percent to 0.375 percent, or a Eurodollar rate, determined by reference to LIBOR, plus a margin of 1.125 percent to 1.375 percent depending on availability under the 2016 Credit Agreement. In addition, the Company is paying a commitment fee of 0.20 percent per annum on the LIBOR rate in effect at the timeunused portion of the borrowing plus a 1.25 to 1.50 percent margin depending on certain provisions as defined in the 2011 Restated Credit Agreement.commitments.
The 2011 Restated2016 Credit Agreement provides for a security interest in certain of the Company’s domestic store assets, including certain inventory assets, but excluding intellectual property.accounts receivable, cash deposits, and certain insurance proceeds. The Company is not required to comply with any financial covenants as long as thereunless certain events of default have occurred and are continuing, or if availability under the 2016 Credit Agreement does not exceed the greater of $40 million and 10 percent of the Loan Cap (as defined in the 2016 Credit Agreement). There are no outstanding borrowings. With regardrestrictions relating to the payment of dividends and share repurchases there areas long as no restrictions ifdefault or event of default has occurred and the Companyaggregate principal amount of unused commitments under the 2016 Credit Agreement is not borrowing and the payments are funded through cash on hand. If the Company is borrowing, Availability as of the end of each fiscal month during the subsequent projected six fiscal months following the payment must be at least 20less than 15 percent of the lesser of the Aggregate Commitmentsaggregate amount of the commitments and the Borrowing Base, (all termsdetermined as defined inof the 2011 Restatedpreceding fiscal month and on a proforma basis for the following six fiscal months.
55
FOOT LOCKER, INC.
NOTES TO CONSOLIDATED FINANCIAL STATEMENTS
The Company uses the 2016 Credit Agreement). The Company’s management does not currently expect to borrow under the facility in 2015, other than amounts usedAgreement to support standby letters of credit in connection with insurance programs. The letters of credit outstanding as of January 31, 2015February 3, 2018 were not significant.
During 2016, the Company paid approximately $2 million in fees relating to the 2016 Credit Agreement. Deferred financing fees are amortized over the life of the facility on a straight-line basis, which is comparable to the interest method. The unamortized balance at January 31, 2015February 3, 2018 is $1 million.
The quarterly facility fees paid on the unused portion was 0.250.20 percent for both 2014 and 2013. There were no short-term borrowings during 2014 or 2013.in 2017. Interest expense, including facility fees, related to the revolving credit facility was $1 million for all years presented.
FOOT LOCKER, INC.
NOTES TO CONSOLIDATED FINANCIAL STATEMENTS
13. Long-Term Debt and Obligations Under Capital Leases
| 2014 | 2013 | |||||||
| (in millions) | ||||||||
| 8.5% debentures payable 2022 | $ | 118 | $ | 118 | ||||
| Unamortized gain related to interest rate swaps(1) | 12 | 13 | ||||||
| Obligations under capital leases | 4 | 8 | ||||||
| $ | 134 | $ | 139 | |||||
| Less: current portion of obligations under capital leases | 2 | 3 | ||||||
| $ | 132 | $ | 136 | |||||
|
|
|
|
|
|
|
|
|
|
|
|
|
|
|
| 2017 |
| 2016 | ||
|
| ($ in millions) | ||||
8.5% debentures payable January 2022 |
| $ | 118 |
| $ | 118 |
Unamortized gain related to interest rate swaps (1) |
|
| 7 |
|
| 9 |
|
| $ | 125 |
| $ | 127 |
(1) | In 2009, the Company terminated an interest rate swap at a gain. This gain is being amortized as part of interest expense over the remaining term of the debt using the effective-yield method. |
Interest expense related to long-term debt and the amortization of the associated debt issuance costs was $9million for all years presented.and $8 million as of February 3, 2018 and January 28, 2017, respectively.
Maturities of long-term debt and minimum rent payments under capital leases in future periods are:
| Long-Term Debt | Capital Leases | Total | ||||||||||
| (in millions) | ||||||||||||
| 2015 | $ | — | $ | 2 | $ | 2 | ||||||
| 2016 | — | 1 | 1 | |||||||||
| 2017 | — | 1 | 1 | |||||||||
| 2018 – 2019 | — | — | — | |||||||||
| Thereafter | 118 | — | 118 | |||||||||
| $ | 118 | $ | 4 | $ | 122 | |||||||
| Less: Imputed interest | — | — | — | |||||||||
| Current portion | — | 2 | 2 | |||||||||
| $ | 118 | $ | 2 | $ | 120 | |||||||
14. Other Liabilities
|
|
|
| |||||||||||
| 2014 | 2013 |
|
|
|
|
|
| |||||||
| (in millions) |
| 2017 |
| 2016 | ||||||||||
| Straight-line rent liability | $ | 124 | $ | 116 | ||||||||||
|
| ($ in millions) | ||||||||||||
Pension litigation liability |
| $ | 278 |
| $ | 100 | ||||||||
Straight-line rent liability (1) |
|
| 245 |
|
| 205 | ||||||||
Income taxes |
|
| 114 |
|
| 23 | ||||||||
| Pension benefits | 46 | 25 |
|
| 19 |
|
| 26 | ||||||
| Income taxes | 24 | 27 | ||||||||||||
Deferred taxes |
|
| 15 |
|
| 3 | ||||||||
| Postretirement benefits | 18 | 14 |
|
| 14 |
|
| 14 | ||||||
| Deferred taxes | 14 | 18 | ||||||||||||
| Workers’ compensation and general liability reserves | 9 | 9 |
|
| 7 |
|
| 8 | ||||||
| Other | 18 | 20 |
|
| 9 |
|
| 12 | ||||||
| $ | 253 | $ | 229 |
| $ | 701 |
| $ | 391 | |||||
(1) | Includes unamortized tenant allowances of $64 million and $59 million for the year ended February 3, 2018 and January 28, 2017, respectively. |
15. Leases
The Company is obligated under operating leases for almost all of its store properties. Some of the store leases contain renewal options with varying terms and conditions. Management expects that in the normal course of business, expiring leases will generally be renewed or, upon making a decision to relocate, replaced by leases on other premises. Operating lease periods generally range from 5 to 10 years.
Certain leases provide for additional rent payments based on a percentage of store sales.
FOOT LOCKER, INC.
NOTES TO CONSOLIDATED FINANCIAL STATEMENTS
15. Leases – (continued)
Most Also, most of the Company’s leases require the payment of certain executory costs such as insurance, maintenance, and other costs in addition to the future minimum lease payments. These costs, including the amortization of lease rights, totaled $132$146 million in 2014 and $1282017, $141 million in both 20132016, and 2012. $137 million in 2015.
56
FOOT LOCKER, INC.
NOTES TO CONSOLIDATED FINANCIAL STATEMENTS
Included in the amounts below are non-store expenses that totaled $17 million in 2014 and $16$24 million in both 20132017 and 2012.2016, and $18 million in 2015.
|
|
|
|
|
|
| ||||||||||||
|
|
|
|
|
| |||||||||||||
| 2014 | 2013 | 2012 | 2017 | 2016 | 2015 | |||||||||||||
| (in millions) | ($ in millions) | |||||||||||||||||
| Minimum rent | $ | 615 | $ | 580 | $ | 537 | $ | 714 | $ | 667 | $ | 618 | ||||||
| Contingent rent based on sales | 25 | 22 | 24 |
| 26 |
| 29 |
| 27 | |||||||||
| Sublease income | (5 | ) | (2 | ) | (1 | ) |
| (5) |
| (6) |
| (5) | ||||||
| $ | 635 | $ | 600 | $ | 560 | $ | 735 | $ | 690 | $ | 640 | |||||||
Future minimum lease payments under non-cancelablenon-cancellable operating leases, net of future non-cancelablenon-cancellable operating sublease payments, are:
|
| |||||
| (in millions) |
|
| ||||
| 2015 | $ | 567 | ||||
| 2016 | 516 | |||||
| 2017 | 453 | |||||
| ($ in millions) | |||||
| 2018 | 387 | $ | 678 | |||
| 2019 | 339 |
| 637 | |||
2020 |
| 594 | ||||
2021 |
| 554 | ||||
2022 |
| 496 | ||||
| Thereafter | 1,164 |
| 1,721 | |||
| Total operating lease commitments | $ | 3,426 | $ | 4,680 | ||
16. Accumulated Other Comprehensive Loss
Accumulated other comprehensive loss, net of tax, is comprised of the following:
|
|
|
|
|
|
| ||||||||||||
|
|
|
|
|
| |||||||||||||
| 2014 | 2013 | 2012 | 2017 | 2016 | 2015 | |||||||||||||
| (in millions) | ($ in millions) | |||||||||||||||||
| Foreign currency translation adjustments | $ | (75 | ) | $ | 57 | $ | 82 | $ | (9) | $ | (127) | $ | (119) | |||||
| Cash flow hedges | (3 | ) | (2 | ) | 3 |
| — |
| 1 |
| 2 | |||||||
| Unrecognized pension cost and postretirement benefit | (240 | ) | (240 | ) | (255 | ) |
| (270) |
| (236) |
| (248) | ||||||
| Unrealized loss on available-for-sale security | (1 | ) | (1 | ) | (1 | ) |
| — |
| (1) |
| (1) | ||||||
| $ | (319 | ) | $ | (186 | ) | $ | (171 | ) | $ | (279) | $ | (363) | $ | (366) | ||||
The changes in accumulated other comprehensive loss for the period ended January 31, 2015February 3, 2018 were as follows:
| (in millions) | Foreign currency translation adjustments | Cash flow hedges | Items related to pension and postretirement benefits | Unrealized loss on available-for- sale security | Total | |||||||||||||||
| Balance as of February 1, 2014 | $ | 57 | $ | (2 | ) | $ | (240 | ) | $ | (1 | ) | $ | (186 | ) | ||||||
| OCI before reclassification | (132 | ) | (1 | ) | (8 | ) | — | (141 | ) | |||||||||||
| Reclassified from AOCI | — | — | 8 | — | 8 | |||||||||||||||
| Other comprehensive income/(loss) | (132 | ) | (1 | ) | — | — | (133 | ) | ||||||||||||
| Balance as of January 31, 2015 | $ | (75 | ) | $ | (3 | ) | $ | (240 | ) | $ | (1 | ) | $ | (319 | ) | |||||
|
|
|
|
|
|
|
|
|
|
|
|
|
|
|
|
|
|
|
|
|
|
|
|
|
|
|
|
|
|
|
|
|
|
|
|
|
|
|
|
|
| Unrealized |
|
|
| ||
|
| Foreign |
|
|
| Items Related |
| (Loss)/Gain |
|
|
| ||||
|
| Currency |
|
|
| to Pension and |
| on |
|
|
| ||||
|
| Translation |
| Cash Flow |
| Postretirement |
| Available-For- |
|
| |||||
($ in millions) |
| Adjustments |
| Hedges |
| Benefits |
| Sale Security |
| Total | |||||
Balance as of January 28, 2017 |
| $ | (127) |
| $ | 1 |
| $ | (236) |
| $ | (1) |
| $ | (363) |
|
|
|
|
|
|
|
|
|
|
|
|
|
|
|
|
OCI before reclassification |
|
| 114 |
|
| (1) |
|
| 4 |
|
| 1 |
|
| 118 |
Reclassified from AOCI |
|
| — |
|
| — |
|
| 7 |
|
| — |
|
| 7 |
Reclassification of tax effects due to the adoption of ASU 2018-02 |
|
| 4 |
|
| — |
|
| (45) |
|
| — |
|
| (41) |
Other comprehensive income/ (loss) |
|
| 118 |
|
| (1) |
|
| (34) |
|
| 1 |
|
| 84 |
|
|
|
|
|
|
|
|
|
|
|
|
|
|
|
|
Balance as of February 3, 2018 |
| $ | (9) |
| $ | — |
| $ | (270) |
| $ | — |
| $ | (279) |
FOOT LOCKER, INC.
NOTES TO CONSOLIDATED FINANCIAL STATEMENTS
16. Accumulated Other Comprehensive Loss – (continued)
Reclassifications to income from accumulated other comprehensive loss for the period ended January 31, 2015February 3, 2018 were as follows:
($ in millions) | ||
Amortization of actuarial (gain) loss: | ||
Pension benefits- amortization of actuarial loss | $ | 13 |
Postretirement benefits- amortization of actuarial gain | (2) | |
Net periodic benefit cost (see Note 20) | 11 | |
Income tax benefit | 4 | |
Net of tax | $ | 7 |
| (in millions) | ||||
| Amortization of actuarial (gain) loss: | ||||
| Pension benefits – amortization of actuarial loss | $ | 15 | ||
| Postretirement benefits – amortization of actuarial gain | (3 | ) | ||
| Net periodic benefit cost (see Note 20) | 12 | |||
| Income tax expense | 4 | |||
| Net of tax | $ | 8 | ||
17. Income Taxes
Following are the
The domestic and international components of pre-tax income:income are as follows:
|
|
|
|
|
|
|
|
|
|
|
|
|
|
|
|
|
|
| 2017 |
| 2016 |
| 2015 | |||
| ($ in millions) | |||||||
Domestic | $ | 432 |
| $ | 779 |
| $ | 668 |
International |
| 146 |
|
| 225 |
|
| 169 |
Total pre-tax income | $ | 578 |
| $ | 1,004 |
| $ | 837 |
Domestic pre-tax income includes the results of non-U.S. businesses that are operated in branches owned directly by the U.S. which, therefore, are subject to U.S. income tax.
| 2014 | 2013 | 2012 | ||||||||||
| (in millions) | ||||||||||||
| Domestic | $ | 654 | $ | 558 | $ | 508 | ||||||
| International | 155 | 105 | 99 | |||||||||
| Total pre-tax income | $ | 809 | $ | 663 | $ | 607 | ||||||
The income tax provision consists of the following:
|
|
|
|
|
| |||||||||||||||
| 2014 | 2013 | 2012 |
|
|
|
|
|
|
|
| ||||||||||
| (in millions) | 2017 |
| 2016 |
| 2015 | |||||||||||||||
| Current: | ($ in millions) | |||||||||||||||||||
| Federal | $ | 195 | $ | 164 | $ | 152 | $ | 129 |
| $ | 249 |
| $ | 212 | ||||||
| State and local | 34 | 26 | 22 |
| 18 |
|
| 44 |
|
| 37 | |||||||||
| International | 40 | 25 | 16 |
| 42 |
|
| 48 |
|
| 53 | |||||||||
| Total current tax provision | 269 | 215 | 190 |
| 189 |
|
| 341 |
|
| 302 | |||||||||
| Deferred: |
|
|
|
|
|
|
|
| ||||||||||||
| Federal | 16 | 13 | 13 |
| 98 |
|
| (6) |
|
| (8) | |||||||||
| State and local | 3 | 5 | 5 |
| 5 |
|
| 1 |
|
| (1) | |||||||||
| International | 1 | 1 | 2 |
| 2 |
|
| 4 |
|
| 3 | |||||||||
| Total deferred tax provision | 20 | 19 | 20 |
| 105 |
|
| (1) |
|
| (6) | |||||||||
| Total income tax provision | $ | 289 | $ | 234 | $ | 210 | $ | 294 |
| $ | 340 |
| $ | 296 | ||||||
Provision has been made
The Company previously considered the earnings in its non-U.S. subsidiaries to be indefinitely reinvested and, accordingly, recorded no deferred income taxes. Given the Tax Act’s significant changes and potential opportunities to repatriate cash without significant incremental U.S. federal tax, the Company is in the accompanying Consolidated Statementsprocess of Operationsevaluating its current permanent reinvestment assertions. This evaluation includes the possible repatriation of historical earnings (2017 and prior) that have now been taxed under the Tax Act.
The Company had aggregate undistributed earnings and profits (“E&P”) from foreign subsidiaries of approximately $1,407 million at February 3, 2018, which is now classified as previously taxed income (“PTI”) subsequent to the Tax Act. The Company recorded a provisional $86 million “transition tax” in connection with this E&P. Additionally, the Company has recorded a provisional $13 million deferred tax liability as of the date of the change in the Company’s permanent reinvestment assertion primarily for additionalstate income taxes applicable to dividends received or expectedand foreign withholding taxes on the future repatriation of PTI. The Company currently considers the remaining financial statement carrying amounts over the tax basis of investments in its foreign subsidiaries to be received, if any, from international subsidiaries. The amount of unremitted earnings of international subsidiaries for which no suchindefinitely reinvested, and has not recorded a provisional deferred tax is provided and which is considered to be permanently reinvested in the subsidiaries totaled $999 million and $890 million at January 31, 2015 and February 1, 2014, respectively.liability. The determination of the amount of theany unrecorded provisional deferred tax liability related to permanently reinvested earningson this amount is not practicable.practicable due to the uncertainty of how these investments would be recovered.
58
FOOT LOCKER, INC.
NOTES TO CONSOLIDATED FINANCIAL STATEMENTS
17. Income Taxes – (continued)
A reconciliation of the significant differences between the federal statutory income tax rate and the effective income tax rate on pre-tax income is as follows:
|
|
|
|
|
|
|
|
|
|
|
|
|
|
|
|
|
|
|
|
|
| 2017 |
| 2016 |
| 2015 | |||
Federal statutory income tax rate (1) |
| 33.7 | % |
| 35.0 | % |
| 35.0 | % |
Deemed repatriation tax |
| 17.1 |
|
| — |
|
| — |
|
Increase in valuation allowance |
| 1.6 |
|
| — |
|
| — |
|
State and local income taxes, net of federal tax benefit |
| 2.0 |
|
| 3.1 |
|
| 2.8 |
|
International income taxed at varying rates |
| (2.3) |
|
| (3.7) |
|
| (2.1) |
|
Foreign tax credits |
| (2.6) |
|
| (1.9) |
|
| (2.8) |
|
Domestic/foreign tax settlements |
| (0.2) |
|
| (0.1) |
|
| (0.1) |
|
Federal tax credits |
| (0.2) |
|
| (0.2) |
|
| (0.2) |
|
Other, net |
| 1.7 |
|
| 1.7 |
|
| 2.8 |
|
Effective income tax rate |
| 50.8 | % |
| 33.9 | % |
| 35.4 | % |
| 2014 | 2013 | 2012 | ||||||||||
| Federal statutory income tax rate | 35.0 | % | 35.0 | % | 35.0 | % | ||||||
| State and local income taxes, net of federal tax benefit | 3.2 | 3.5 | 3.2 | |||||||||
| International income taxed at varying rates | (1.9 | ) | (1.6 | ) | (0.4 | ) | ||||||
| Foreign tax credits | (2.5 | ) | (2.5 | ) | (1.8 | ) | ||||||
| Domestic/foreign tax settlements | (0.6 | ) | (1.1 | ) | (2.2 | ) | ||||||
| Federal tax credits | (0.2 | ) | (0.2 | ) | (0.2 | ) | ||||||
| Other, net | 2.7 | 2.2 | 1.0 | |||||||||
| Effective income tax rate | 35.7 | % | 35.3 | % | 34.6 | % | ||||||
(1) | On December 22, 2017, the United States enacted tax reform legislation that included a broad range of business tax provisions, including but not limited to a reduction in the U.S. corporate income tax rate from 35 percent to 21 percent as well as provisions that limit or eliminate various deductions or credits. In accordance with Section 15 of the Internal Revenue Code, the tax rate for 2017 represented a blended rate of 33.7 percent, calculated by applying a prorated percentage of the number of days prior to and subsequent to the January 1, 2018 effective date. |
Deferred income taxes are provided for the effects of temporary differences between the amounts of assets and liabilities recognized for financial reporting purposes and the amounts recognized for income tax purposes. Items that give rise to significant portions of the Company’s deferred tax assets and deferred tax liabilities are as follows:
|
|
|
|
|
|
|
|
|
|
|
|
| 2017 |
| 2016 | ||
Deferred tax assets: | ($ in millions) | ||||
Tax loss/credit carryforwards and capital loss | $ | 23 |
| $ | 12 |
Employee benefits |
| 16 |
|
| 76 |
Property and equipment |
| 54 |
|
| 110 |
Straight-line rent |
| 44 |
|
| 51 |
Other |
| 27 |
|
| 47 |
Total deferred tax assets | $ | 164 |
| $ | 296 |
Valuation allowance |
| (17) |
|
| (7) |
Total deferred tax assets, net | $ | 147 |
| $ | 289 |
Deferred tax liabilities: |
|
|
|
|
|
Merchandise inventories | $ | 79 |
| $ | 104 |
Goodwill and other intangible assets |
| 20 |
|
| 21 |
Other |
| 15 |
|
| 6 |
Total deferred tax liabilities | $ | 114 |
| $ | 131 |
Net deferred tax asset | $ | 33 |
| $ | 158 |
Balance Sheet caption reported in: |
|
|
|
|
|
Deferred taxes | $ | 48 |
| $ | 161 |
Other liabilities |
| (15) |
|
| (3) |
| $ | 33 |
| $ | 158 |
| 2014 | 2013 | |||||||
| (in millions) | ||||||||
| Deferred tax assets: | ||||||||
| Tax loss/credit carryforwards and capital loss | $ | 9 | $ | 12 | ||||
| Employee benefits | 65 | 55 | ||||||
| Property and equipment | 137 | 147 | ||||||
| Straight-line rent | 33 | 30 | ||||||
| Goodwill and other intangible assets | — | 6 | ||||||
| Other | 38 | 33 | ||||||
| Total deferred tax assets | 282 | 283 | ||||||
| Valuation allowance | (6 | ) | (6 | ) | ||||
| Total deferred tax assets, net | $ | 276 | $ | 277 | ||||
| Deferred tax liabilities: | ||||||||
| Merchandise inventories | 96 | 85 | ||||||
| Goodwill and other intangible assets | 17 | — | ||||||
| Other | 1 | 11 | ||||||
| Total deferred tax liabilities | $ | 114 | $ | 96 | ||||
| Net deferred tax asset | $ | 162 | $ | 181 | ||||
| Balance Sheet caption reported in: | ||||||||
| Deferred taxes | $ | 221 | $ | 241 | ||||
| Other current assets | 3 | 4 | ||||||
| Accrued and other current liabilities | (48 | ) | (46 | ) | ||||
| Other liabilities | (14 | ) | (18 | ) | ||||
| $ | 162 | $ | 181 | |||||
TABLE OF CONTENTSAs a result of the Tax Act’s corporate income tax rate reduction to 21 percent, the Company remeasured its deferred tax assets and liabilities, and the adjustment was not significant.
FOOT LOCKER, INC.
NOTES TO CONSOLIDATED FINANCIAL STATEMENTS
17. Income Taxes – (continued)
Based upon the level of historical taxable income and projections for future taxable income, which are based upon the Company’s long-range strategic long-range plans, over the periods in which the temporary differences are anticipated to reverse, management believes it is more likely than not that the Company will realize the benefits of these deductible differences, net of the valuation allowances at January 31, 2015.February 3, 2018, over the periods in which the temporary differences are anticipated to reverse. However, the amount of the deferred tax asset considered realizable could be adjusted in the future if estimates of taxable income are revised.
59
FOOT LOCKER, INC.
NOTES TO CONSOLIDATED FINANCIAL STATEMENTS
As of January 31, 2015,February 3, 2018, the Company has a valuation allowance of $6$17 million to reduce its deferred tax assets to an amount that is more likely than not to be realized. A valuation allowance of $3$15 million was recorded against tax loss carryforwards of certain foreign entities. Based on the history of losses and the absence of prudent and feasible business plans for generating future taxable income in these entities, the Company believes it is more likely than not that the benefit of these loss carryforwards will not be realized. An additional valuation allowance of $2 million relates to the deferred tax assets arising from a capital loss associated with an impairment of the Northern Group note receivable in 2008. The Company does not anticipate realizing capital gains to utilize the capital loss associated with the note receivable impairment. A valuation allowance of $2 million was recorded against tax loss carryforwards of certain foreign entities. Based on the history of losses and the absence of prudent and feasible business plans for generating future taxable income in certain foreign entities, the Company believes it is more likely than not that the benefit of these loss carryforwards will not be realized. Additionally, the Company recorded an unrealized loss related to its investment in an auction rate security. This loss, if and when recognized for tax purposes, would be a capital loss. The Company has not identified any reliable sources of future capital gains that would be generated to absorb this potential loss. In recognition of this risk,
At February 3, 2018, the Company has a valuation allowance of $1 million for any loss that would be recognized upon disposition of this security.
At January 31, 2015, the Company hasU.S. state operating loss carryforwards with a potential tax benefit of $2$1 million that expire between 20152021 and 2034.2037. The Company will have, when realized, a capital loss with a potential benefit of $3$2 million arising from a note receivable. This loss will carryforward for 5 years after realization. The Company has U.S. state creditsinternational minimum tax credit carryforwards with a potential tax benefit of $1$4 million that expire in 2024. The Company has internationaland operating loss carryforwards with a potential tax benefit of $3$16 million, a portion of which will expire between 20152018 and 20342026 and a portion of which will never expire. The state and international operating loss carryforwards do not include unrecognized tax benefits.
The Company operates in multiple taxing jurisdictions and is subject to audit. Audits can involve complex issues that may require an extended period of time to resolve. A taxing authority may challenge positions that the Company has adopted in its income tax filings. Accordingly, the Company may apply different tax treatments for transactions in filing its income tax returns than for income tax financial reporting. The Company regularly assesses its tax positions for such transactions and records reserves for those differences.
The Company’s U.S. Federal income tax filings have been examined by the Internal Revenue Service through 2013.2016. The Company is participating in the IRS’s Compliance Assurance Process (“CAP”) for 2014,2017, which is expected to conclude during 2015.2018. The Company has started the CAP for 2015.2018. Due to the recent utilization of net operating loss carryforwards, the Company is subject to state and local tax examinations effectively including years from 19962000 to the present. To date, no adjustments have been proposed in any audits that will have a material effect on the Company’s financial position or results of operations.
At February 3, 2018 and January 31, 2015 and February 1, 2014,28, 2017, the Company had $40$44 million and $48$38 million, respectively, of gross unrecognized tax benefits, and $39$44 million and $46$38 million, respectively, of net unrecognized tax benefits that would, if recognized, affect the Company’s annual effective tax rate. The Company has classified certain income tax liabilities as current or noncurrent based on management’s estimate of when these liabilities will be settled. Interest expense and penalties related to unrecognized tax benefits are classified as income tax expense. Interest expense for 2014income was not significant. The Company recognizedsignificant in 2017, was $1 million of interest income, in 20132016, and 2012. The total amount of accruedwas not significant for 2015. Accrued interest and penalties was not significant for 2017, $1 million in 2016, and $2 million in 2014 and 2013, and $3 million in 2012.2015.
FOOT LOCKER, INC.
NOTES TO CONSOLIDATED FINANCIAL STATEMENTS
17. Income Taxes – (continued)
The following table summarizes the activity related to unrecognized tax benefits:
|
|
|
|
|
|
| ||||||||||||||
|
|
|
|
|
|
|
| |||||||||||||
| 2014 | 2013 | 2012 | 2017 |
| 2016 |
| 2015 | |||||||||||||
| (in millions) | ($ in millions) | |||||||||||||||||||
| Unrecognized tax benefits at beginning of year | $ | 48 | $ | 54 | $ | 65 | $ | 38 |
| $ | 38 |
| $ | 40 | ||||||
| Foreign currency translation adjustments | (6 | ) | (4 | ) | 1 |
| 4 |
| 1 |
|
| (2) | ||||||||
| Increases related to current year tax positions | 3 | 3 | 4 |
| 3 |
| 8 |
|
| 4 | ||||||||||
| Increases related to prior period tax positions | 1 | 4 | 3 |
| 1 |
| 1 |
|
| 2 | ||||||||||
| Decreases related to prior period tax positions | (1 | ) | (2 | ) | (3 | ) |
| — |
|
| (2) |
|
| — | ||||||
| Settlements | (1 | ) | (7 | ) | (15 | ) |
| (1) |
| (7) |
|
| (1) | |||||||
| Lapse of statute of limitations | (4 | ) | — | (1 | ) |
| (1) |
| (1) |
|
| (5) | ||||||||
| Unrecognized tax benefits at end of year | $ | 40 | $ | 48 | $ | 54 | $ | 44 |
| $ | 38 |
| $ | 38 | ||||||
60
FOOT LOCKER, INC.
NOTES TO CONSOLIDATED FINANCIAL STATEMENTS
It is reasonably possible that the liability associated with the Company’s unrecognized tax benefits will increase or decrease within the next twelve months. These changes may be the result of foreign currency fluctuations, ongoing audits, or the expiration of statutes of limitations. Settlements could increase earnings in an amount ranging from $0up to $5 million based on current estimates. Audit outcomes and the timing of audit settlements are subject to significant uncertainty. Although management believes that adequate provision has been made for such issues, the ultimate resolution could have an adverse effect on the earnings of the Company. Conversely, if these issues are resolved favorably in the future, the related provision would be reduced, generating a positive effect on earnings. Due to the uncertainty of amounts and in accordance with its accounting policies, the Company has not recorded any potential impactconsequences of these settlements.
18. Financial Instruments and Risk Management
The Company operates internationally and utilizes certain derivative financial instruments to mitigate its foreign currency exposures, primarily related to third-party and intercompany forecasted transactions. As a result of the use of derivative instruments, the Company is exposed to the risk that counterparties will fail to meet their contractual obligations. To mitigate this counterparty credit risk, the Company has a practice of entering into contracts only with major financial institutions selected based upon their credit ratings and other financial factors. The Company monitors the creditworthiness of counterparties throughout the duration of the derivative instrument.
Additional information is contained within Note 19,Fair Value Measurements.
Derivative Holdings Designated as Hedges
For a derivative to qualify as a hedge at inception and throughout the hedged period, the Company formally documents the nature of the hedged items and the relationships between the hedging instruments and the hedged items, as well as its risk-management objectives, strategies for undertaking the various hedge transactions, and the methods of assessing hedge effectiveness and ineffectiveness. In addition, for hedges of forecasted transactions, the significant characteristics and expected terms of a forecasted transaction must be specifically identified, and it must be probable that each forecasted transaction would occur. If it were deemed probable that the forecasted transaction would not occur, the gain or loss on the derivative instrument would be recognized in earnings immediately. No such gainsGains or losses were recognized in earnings for any of the periods presented.presented were not significant. Derivative financial instruments qualifying for hedge accounting must maintain a specified level of effectiveness between the hedging instrument and the item being hedged, both at inception and throughout the hedged period, which management evaluates periodically.
The primary currencies to which the Company is exposed are the euro, British pound, Canadian dollar, and Australian dollar. For the most part, merchandise inventories are purchased by each geographic area in their respective local currency other than incurrency. The most significant exception to this is the United Kingdom, whichwhose merchandise inventory purchases its merchandise inventories using the euro.are denominated in euros.
FOOT LOCKER, INC.
NOTES TO CONSOLIDATED FINANCIAL STATEMENTS
18. Financial Instruments and Risk Management – (continued)
For option and foreign exchange forward contracts designated as cash flow hedges of the purchase of inventory, the effective portion of gains and losses is deferred as a component of Accumulated Other Comprehensive Loss (“AOCL”) and is recognized as a component of cost of sales when the related inventory is sold. The amount reclassified to cost of sales related to such contracts was not significant for any of the periods presented. The effective portion of gains or losses associated with other forward contracts is deferred as a component of AOCL until the underlying transaction is reported in earnings. The ineffective portion of gains and losses related to cash flow hedges recorded to earnings was also not significant for any of the periods presented. When using a forward contract as a hedging instrument, the Company excludes the time value of the contract from the assessment of effectiveness. For all years presented,
61
FOOT LOCKER, INC.
NOTES TO CONSOLIDATED FINANCIAL STATEMENTS
As of February 3, 2018, all of the Company’s hedged forecasted transactions areextend less than twelve months into the future, and the Company expects all derivative-related amounts reported in AOCL to be reclassified to earnings within twelve months. The balance in AOCL was a gain of $1 million as of January 28, 2017. During 2014,2017, the net change in the fair value of the foreign exchange derivative financial instruments designated as cash flow hedges of the purchase of inventory resultedwas more than offset by amounts recognized in a losscost of $1 million andsales, therefore increased AOCL. At January 31, 2015 thereAOCL was a $3 million loss included in AOCL.reduced to zero.
The notional value of the contracts outstanding at January 31, 2015February 3, 2018 was $63$118 million, and these contracts extendmature at various dates through January 2016.2019.
Derivative Holdings Not Designated as Non-HedgesHedges
The Company enters into foreign exchange forwardcertain derivative contracts that are not designated as hedges, in ordersuch as foreign exchange forward contracts and currency option contracts. These derivative contracts are used to manage thecertain costs of certain foreign currency-denominated merchandise purchases, and intercompany transactions. Changes in the fair value of these foreign exchange forward contracts are recorded in earnings immediately within selling, generaltransactions, and administrative expenses. The net change in fair value was not significant for 2014, was $1 million for 2013, and was not significant for 2012. The notional value of the contracts outstanding at January 31, 2015 was $34 million, and these contracts extend through October 2015.
The Company may mitigate the effect of fluctuating foreign exchange rates on the reporting of foreign currency-denominated earnings. Changes in the fair value of derivative holdings not designated as hedges, as well as realized gains and premiums paid, are recorded in earnings immediately within selling, general and administrative expenses or other income, depending on the type of transaction. The aggregate amount recognized for these contracts was not significant as of February 3, 2018 and represented income of $1 million as of January 28, 2017. The notional value of foreign exchange forward contracts outstanding at February 3, 2018 was $2 million, and these contracts mature during September 2018.
From time to time, the Company mitigates the effect of fluctuating foreign exchange rates on the reporting of foreign-currency denominated earnings by entering into currency option contracts. Changes in the fair value of these foreign currency option contracts, which are not designated as non-hedges,hedges, are recorded in earnings immediately within other income. During 2014, the Company recordedThe realized gains, of $1 million, net of premiums paid, and changes in connection with such contracts. The amountsthe fair market value recorded in prior years were not significant.significant for any of the periods presented. There were no currency option contracts outstanding at January 31, 2015.February 3, 2018.
Fair Value of Derivative Contracts
The following represents the fair value of the Company’s derivative contracts. Many of the Company’s agreements allow for a netting arrangement. The following is presented on a gross basis, by type of contract:
|
|
|
|
|
| |||||||||||||||
| (in millions) | Balance Sheet Caption | 2014 | 2013 | |||||||||||||||||
|
|
|
|
|
|
| ||||||||||||||
|
| Balance Sheet |
|
|
|
| ||||||||||||||
($ in millions) |
| Caption |
| 2017 |
| 2016 | ||||||||||||||
| Hedging Instruments: |
|
|
|
|
|
|
|
| ||||||||||||
| Foreign exchange forward contracts | Current liabilities | $ | 4 | $ | 2 |
| Current assets |
| $ | 1 |
| $ | 3 | |||||||
| Non-hedging Instruments: | ||||||||||||||||||||
| Foreign exchange forward contracts | Current liabilities | $ | 1 | $ | — |
| Current liabilities |
| $ | 1 |
| $ | 3 | |||||||
FOOT LOCKER, INC.
NOTES TO CONSOLIDATED FINANCIAL STATEMENTS
18. Financial Instruments and Risk Management – (continued)
Notional Values and Foreign Currency Exchange Rates
The table below presents the notional amounts for all outstanding derivatives and the weighted-average exchange rates of foreign exchange forward contracts at January 31, 2015:February 3, 2018:
|
|
|
|
|
| Contract Value |
| Weighted-Average | |
| ($ in millions) |
| Exchange Rate | |
Inventory |
|
|
|
|
Buy €/Sell British £ | $ | 111 |
| 0.8749 |
|
|
|
|
|
Intercompany |
|
|
|
|
Buy US $/Sell € | $ | 7 |
| 1.2118 |
Buy US $/Sell CAD $ | $ | 2 |
| 1.2568 |
| Contract Value (U.S. in millions) | Weighted-Average Exchange Rate | |||||||
| Inventory | ||||||||
| Buy €/Sell British £ | $ | 63 | .7996 | |||||
| Intercompany | ||||||||
| Buy €/Sell British £ | $ | 32 | .7640 | |||||
| Buy US/Sell CAD | $ | 2 | 1.1912 | |||||
62
FOOT LOCKER, INC.
NOTES TO CONSOLIDATED FINANCIAL STATEMENTS
Business Risk
The retailing business is highly competitive. Price, quality, selection of merchandise, reputation, store location, advertising, and customer serviceexperience are important competitive factors in the Company’s business. The Company operates in 2324 countries and purchased approximately 8993 percent of its merchandise in 20142017 from its top 5 suppliers. In 2014,2017, the Company purchased approximately 7367 percent of its athletic merchandise from one major supplier, Nike, Inc. (“Nike”), and approximately 11 percent from another major supplier.. Each of our operating divisions is highly dependent on Nike; they individually purchased 4744 to 8473 percent of their merchandise from Nike.
Included in the Company’s Consolidated Balance Sheet at January 31, 2015,February 3, 2018, are the net assets of the Company’s European operations, which total $883$1,058 million and are located in 1920 countries, 11 of which have adopted the euro as their functional currency.
19. Fair Value Measurements
The following table provides a summary of the recognized assets and liabilities that are measured at fair value on a recurring basis:
|
|
|
|
|
|
|
|
|
|
|
|
| ||||||||||||||||||||||||||||||
|
|
|
|
|
|
|
|
|
|
|
| |||||||||||||||||||||||||||||||
| As of January 31, 2015 | As of February 1, 2014 |
| As of February 3, 2018 |
| As of January 28, 2017 | |||||||||||||||||||||||||||||||||||||
| (in millions) |
| ($ in millions) | ||||||||||||||||||||||||||||||||||||||||
| Level 1 | Level 2 | Level 3 | Level 1 | Level 2 | Level 3 |
| Level 1 |
| Level 2 |
| Level 3 |
| Level 1 |
| Level 2 |
| Level 3 | |||||||||||||||||||||||||
| Assets |
|
|
|
|
|
|
|
|
|
|
|
| ||||||||||||||||||||||||||||||
| Available-for-sale securities | $ | — | $ | 6 | $ | — | $ | — | $ | 6 | $ | — | ||||||||||||||||||||||||||||||
| Short-term investments | — | — | — | — | 9 | — | ||||||||||||||||||||||||||||||||||||
Available-for-sale security |
| $ | — |
| $ | 7 |
| $ | — |
| $ | — |
| $ | 6 |
| $ | — | ||||||||||||||||||||||||
Foreign exchange forward contracts |
| — |
|
| 1 |
| — |
|
| — |
|
| 3 |
|
| — | ||||||||||||||||||||||||||
| Total Assets | $ | — | $ | 6 | $ | — | $ | — | $ | 15 | $ | — |
| $ | — |
| $ | 8 |
| $ | — |
| $ | — |
| $ | 9 |
| $ | — | ||||||||||||
|
|
|
|
|
|
|
|
|
|
|
|
|
|
|
|
| ||||||||||||||||||||||||||
| Liabilities | �� |
|
|
|
|
|
|
|
|
|
|
|
|
|
|
|
| |||||||||||||||||||||||||
| Foreign exchange forward contracts | — | 5 | — | — | 2 | — |
| — |
|
| 1 |
| — |
|
| — |
|
| 3 |
|
| — | ||||||||||||||||||||
| Total Liabilities | $ | — | $ | 5 | $ | — | $ | — | $ | 2 | $ | — |
| $ | — |
| $ | 1 |
| $ | — |
| $ | — |
| $ | 3 |
| $ | — | ||||||||||||
Available-for-sale securities
Securities classified as available-for-sale are recorded at fair value with unrealized gains and losses reported, net of tax, in other comprehensive income, unless the unrealized gains or losses are determined to be other than temporary. The fair value of the auction rate security is determined by using quoted prices for similar instruments in active markets and accordingly is classified as a Level 2 instrument.
The Company’s short-term investments matured during the second quarter of 2014. In the prior periods presented, these investments represented corporate bonds with maturity dates within one year of the purchase date. These securities were valued using model-derived valuations in which all significant inputs or significant value-drivers were observable in active markets and therefore are classified as Level 2 instruments.
The Company’s derivative financial instruments are valued using market-based inputs to valuation models. These valuation models require a variety of inputs, including contractual terms, market prices, yield curves, and measures of volatility and therefore are classified as Level 2 instruments.
instrumentsFOOT LOCKER, INC.
NOTES TO CONSOLIDATED FINANCIAL STATEMENTS
19. Fair Value Measurements – (continued)
. There were no transfers into or out of Level 1, Level 2, or Level 3 assets and liabilities for any of the periods presentedpresented.
In 2017 and 2016, the Company performed impairment reviews of long-lived and intangible assets for Runners Point and Sidestep. Additionally, during 2017, the Company performed an impairment review of long-lived assets for SIX:02. The fair value of all of the assets reviewed for both periods were measured using Level 3 inputs. Please see Note 3, Litigation and Other Charges for further information.
The carrying value and estimated fair value of long-term debt and obligations under capital leases were as follows:
|
|
|
|
|
|
|
|
|
|
|
|
|
|
|
| 2017 |
| 2016 | ||
|
| ($ in millions) | ||||
Carrying value |
| $ | 125 |
| $ | 127 |
Fair value |
| $ | 144 |
| $ | 148 |
| 2014 | 2013 | |||||||
| (in millions) | ||||||||
| Carrying value | $ | 134 | $ | 139 | ||||
| Fair value | $ | 163 | $ | 159 | ||||
The fair value of long-term debt is determined by using model-derived valuations in which all significant inputs or significant value-drivers are observable in active markets and therefore are classified as Level 2. The carrying values of cash and cash equivalents, short-term investments,restricted cash, and other current receivables and payables approximate their fair value.
63
FOOT LOCKER, INC.
NOTES TO CONSOLIDATED FINANCIAL STATEMENTS
20. Retirement Plans and Other Benefits
The Company and the Company’s U.S. retirement plan are defendants in a class action lawsuit. Please see Note 22, Legal Proceedings for further information. The amounts presented in this note do not include the expected plan reformation.
Pension and Other Postretirement Plans
The Company has defined benefit pension plans covering certain of its North American employees, which are funded in accordance with the provisions of the laws where the plans are in effect. In addition, the Company has a defined benefit plan for certain individuals of Runners Point Group. The Company also sponsors postretirement medical and life insurance plans, which are available to most of its retired U.S. employees. These plans are contributory and are not funded. The measurement date of the assets and liabilities is the last day of themonth-end date that is closest to our fiscal year.year end.
The following tables set forth the plans’ changes in benefit obligations and plan assets, funded status, and amounts recognized in the Consolidated Balance Sheets, measured atas of February 3, 2018 and January 31, 2015 and February 1, 2014:28, 2017:
|
|
|
|
|
|
|
|
|
|
|
|
|
|
| Pension Benefits |
| Postretirement Benefits | ||||||||
|
| 2017 |
| 2016 |
| 2017 |
| 2016 | ||||
|
| ($ in millions) | ||||||||||
Change in benefit obligation |
|
|
|
|
|
|
|
|
|
|
|
|
Benefit obligation at beginning of year |
| $ | 666 |
| $ | 667 |
| $ | 15 |
| $ | 14 |
Service cost |
|
| 17 |
|
| 16 |
|
| — |
|
| — |
Interest cost |
|
| 25 |
|
| 26 |
|
| 1 |
|
| 1 |
Plan participants’ contributions |
|
| — |
|
| — |
|
| 1 |
|
| 1 |
Actuarial loss |
|
| 25 |
|
| 7 |
|
| — |
|
| 1 |
Foreign currency translation adjustments |
|
| 3 |
|
| 4 |
|
| — |
|
| — |
Benefits paid |
|
| (53) |
|
| (54) |
|
| (2) |
|
| (2) |
Benefit obligation at end of year |
| $ | 683 |
| $ | 666 |
| $ | 15 |
| $ | 15 |
|
|
|
|
|
|
|
|
|
|
|
|
|
Change in plan assets |
|
|
|
|
|
|
|
|
|
|
|
|
Fair value of plan assets at beginning of year |
| $ | 647 |
| $ | 602 |
|
|
|
|
|
|
Actual return on plan assets |
|
| 70 |
|
| 55 |
|
|
|
|
|
|
Employer contributions |
|
| 29 |
|
| 40 |
|
|
|
|
|
|
Foreign currency translation adjustments |
|
| 4 |
|
| 4 |
|
|
|
|
|
|
Benefits paid |
|
| (53) |
|
| (54) |
|
|
|
|
|
|
Fair value of plan assets at end of year |
| $ | 697 |
| $ | 647 |
|
|
|
|
|
|
|
|
|
|
|
|
|
|
|
|
|
|
|
Funded status |
| $ | 14 |
| $ | (19) |
| $ | (15) |
| $ | (15) |
|
|
|
|
|
|
|
|
|
|
|
|
|
Amounts recognized on the balance sheet: |
|
|
|
|
|
|
|
|
|
|
|
|
Other assets |
| $ | 36 |
| $ | 10 |
| $ | — |
| $ | — |
Accrued and other liabilities |
|
| (3) |
|
| (3) |
|
| (1) |
|
| (1) |
Other liabilities |
|
| (19) |
|
| (26) |
|
| (14) |
|
| (14) |
|
| $ | 14 |
| $ | (19) |
| $ | (15) |
| $ | (15) |
|
|
|
|
|
|
|
|
|
|
|
|
|
Amounts recognized in accumulated other |
|
|
|
|
|
|
|
|
|
|
|
|
comprehensive loss, pre-tax: |
|
|
|
|
|
|
|
|
|
|
|
|
Net loss (gain) |
| $ | 368 |
| $ | 387 |
| $ | (5) |
| $ | (7) |
Prior service cost |
|
| 1 |
|
| 1 |
|
| — |
|
| — |
|
| $ | 369 |
| $ | 388 |
| $ | (5) |
| $ | (7) |
| Pension Benefits | Postretirement Benefits | |||||||||||||||
| 2014 | 2013 | 2014 | 2013 | |||||||||||||
| (in millions) | ||||||||||||||||
| Change in benefit obligation | ||||||||||||||||
| Benefit obligation at beginning of year | $ | 674 | $ | 706 | $ | 15 | $ | 15 | ||||||||
| Service cost | 15 | 14 | — | — | ||||||||||||
| Interest cost | 28 | 25 | 1 | 1 | ||||||||||||
| Plan participants’ contributions | — | — | 2 | 2 | ||||||||||||
| Actuarial (gain) loss | 67 | (11 | ) | 4 | — | |||||||||||
| Foreign currency translation adjustments | (9 | ) | (9 | ) | — | — | ||||||||||
| Runners Point Group acquisition | — | 1 | — | — | ||||||||||||
| Benefits paid | (53 | ) | (52 | ) | (3 | ) | (3 | ) | ||||||||
| Benefit obligation at end of year | $ | 722 | $ | 674 | $ | 19 | $ | 15 | ||||||||
| Change in plan assets | ||||||||||||||||
| Fair value of plan assets at beginning of year | $ | 650 | $ | 673 | ||||||||||||
| Actual return on plan assets | 90 | 33 | ||||||||||||||
| Employer contributions | 9 | 5 | ||||||||||||||
| Foreign currency translation adjustments | (10 | ) | (9 | ) | ||||||||||||
| Benefits paid | (53 | ) | (52 | ) | ||||||||||||
| Fair value of plan assets at end of year | $ | 686 | $ | 650 | ||||||||||||
64
FOOT LOCKER, INC.
NOTES TO CONSOLIDATED FINANCIAL STATEMENTS
20. Retirement Plans and Other Benefits – (continued)
As of February 3, 2018, the assets of both the Canadian and U.S. qualified pension plans exceeded their accumulated benefit obligations. As of January 31, 2015 and February 1, 2014,28, 2017, the Canadian qualified pension plan’s assets exceeded its accumulated benefit obligation. Information for thoseThe Company’s non-qualified pension plans withhave an accumulated benefit obligation in excess of plan assets, is as follows:
these plans are unfunded. Accordingly, the table below reflects the non-qualified plans for 2017, whereas the amounts presented for 2016 included both the U.S. qualified plan and the non-qualified plans.
|
|
|
|
|
|
| ||||||||
|
|
|
|
|
| |||||||||
| 2014 | 2013 |
| 2017 |
| 2016 | |||||||||
| (in millions) |
| ($ in millions) | ||||||||||||
| Projected benefit obligation | $ | 662 | $ | 603 |
| $ | 22 |
| $ | 617 | ||||
| Accumulated benefit obligation | 662 | 603 |
|
| 22 |
|
| 617 | ||||||
| Fair value of plan assets | 613 | 575 |
|
| — |
|
| 589 | ||||||
The following tables set forth the changes in accumulated other comprehensive loss (pre-tax) at January 31, 2015:
February 3, 2018:
|
|
|
|
|
|
| ||||||||
|
|
|
|
|
|
| ||||||||
| Pension |
| Postretirement | |||||||||||
| Pension Benefits | Postretirement Benefits |
| Benefits |
| Benefits | |||||||||
| (in millions) |
| ($ in millions) | ||||||||||||
| Net actuarial loss (gain) at beginning of year | $ | 399 | $ | (13 | ) |
| $ | 387 |
| $ | (7) | |||
| Amortization of net (loss) gain | (15 | ) | 3 |
|
| (13) |
|
| 2 | |||||
| Loss arising during the year | 15 | 4 | ||||||||||||
Gain arising during the year |
|
| (8) |
|
| — | ||||||||
| Foreign currency fluctuations | (5 | ) | — |
|
| 2 |
|
| — | |||||
| Net actuarial loss (gain) at end of year(1) | $ | 394 | $ | (6 | ) |
| $ | 368 |
| $ | (5) | |||
| Net prior service cost at end of year(1) | 1 | — | ||||||||||||
Net prior service cost at end of year (2) |
|
| 1 |
|
| — | ||||||||
| Total amount recognized | $ | 395 | $ | (6 | ) |
| $ | 369 |
| $ | (5) | |||
(1) | The amounts in accumulated other comprehensive loss that are expected to be recognized as components of net periodic benefit cost (income) during the next year are approximately |
(2) | The net prior service cost did not change during the year and is not expected to change significantly during the next year. |
FOOT LOCKER, INC.
NOTES TO CONSOLIDATED FINANCIAL STATEMENTS
20. Retirement Plans and Other Benefits – (continued)
The following weighted-average assumptions were used to determine the benefit obligations under the plans:
|
|
|
|
|
|
|
|
|
|
|
|
|
|
|
|
|
|
|
|
|
|
|
|
|
|
|
|
|
| Pension Benefits |
| Postretirement Benefits |
| ||||||||
|
| 2017 |
| 2016 |
| 2017 |
| 2016 |
| ||||
Discount rate |
|
| 3.7 | % |
| 4.0 | % |
| 3.7 | % |
| 4.0 | % |
Rate of compensation increase |
|
| 3.6 | % |
| 3.7 | % |
|
|
|
|
|
|
| Pension Benefits | Postretirement Benefits | |||||||||||||||
| 2014 | 2013 | 2014 | 2013 | |||||||||||||
| Discount rate | 3.43 | % | 4.32 | % | 3.40 | % | 4.20 | % | ||||||||
| Rate of compensation increase | 3.67 | % | 3.69 | % | ||||||||||||
Pension expense is actuarially calculated annually based on data available at the beginning of each year. The expected return on plan assets is determined by multiplying the expected long-term rate of return on assets by the market-related value of plan assets for the U.S. qualified pension plan and market value for the Canadian qualified pension plan. The market-related value of plan assets is a calculated value that recognizes investment gains and losses in fair value related to equities over three or five years, depending on which computation results in a market-related value closer to market value. Market-related value for the U.S. qualified plan was $557$585 million and $579$550 million for 20142017 and 2013,2016, respectively.
Assumptions used in the calculation of net benefit cost include the discount rate selected and disclosed at the end of the previous year, as well as other assumptions detailed in the table below:
|
|
|
|
|
|
|
|
|
|
|
|
|
|
|
|
|
|
|
|
|
|
|
|
|
|
|
|
|
|
|
|
|
|
|
|
|
|
|
|
|
| Pension Benefits |
| Postretirement Benefits |
| ||||||||||||||
|
| 2017 |
| 2016 |
| 2015 |
| 2017 |
| 2016 |
| 2015 |
| ||||||
Discount rate |
|
| 4.0 | % |
| 4.1 | % |
| 3.4 | % |
| 4.0 | % |
| 4.1 | % |
| 3.4 | % |
Rate of compensation increase |
|
| 3.6 | % |
| 3.7 | % |
| 3.7 | % |
|
|
|
|
|
|
|
|
|
Expected long-term rate of return on assets |
|
| 5.8 | % |
| 6.1 | % |
| 6.1 | % |
|
|
|
|
|
|
|
|
|
| Pension Benefits | Postretirement Benefits | |||||||||||||||||||||||
| 2014 | 2013 | 2012 | 2014 | 2013 | 2012 | |||||||||||||||||||
| Discount rate | 4.33 | % | 3.79 | % | 4.16 | % | 4.20 | % | 3.70 | % | 4.00 | % | ||||||||||||
| Rate of compensation increase | 3.67 | % | 3.69 | % | 3.68 | % | ||||||||||||||||||
| Expected long-term rate of return on assets | 6.25 | % | 6.24 | % | 6.63 | % | ||||||||||||||||||
65
FOOT LOCKER, INC.
NOTES TO CONSOLIDATED FINANCIAL STATEMENTS
The expected long-term rate of return on invested plan assets is based on the plans’ weighted-average target asset allocation, as well as historical and future expected performance of those assets. The target asset allocation is selected to obtain an investment return that is sufficient to cover the expected benefit payments and to reduce the variability of future contributions by the Company.
The components of net benefit expense (income) are:
|
|
|
|
|
|
|
|
|
|
|
|
|
|
|
|
|
|
|
|
|
|
|
|
|
|
|
|
|
|
|
|
|
|
|
|
|
|
|
| Pension Benefits |
| Postretirement Benefits | ||||||||||||||
|
| 2017 |
| 2016 |
| 2015 |
| 2017 |
| 2016 |
| 2015 | ||||||
|
| ($ in millions) | ||||||||||||||||
Service cost |
| $ | 17 |
| $ | 16 |
| $ | 17 |
| $ | — |
| $ | — |
| $ | — |
Interest cost |
|
| 25 |
|
| 26 |
|
| 24 |
|
| 1 |
|
| 1 |
|
| 1 |
Expected return on plan assets |
|
| (37) |
|
| (37) |
|
| (39) |
|
| — |
|
| — |
|
| — |
Amortization of net loss (gain) |
|
| 13 |
|
| 14 |
|
| 14 |
|
| (2) |
|
| (2) |
|
| (1) |
Net benefit expense (income) |
| $ | 18 |
| $ | 19 |
| $ | 16 |
| $ | (1) |
| $ | (1) |
| $ | — |
| Pension Benefits | Postretirement Benefits | |||||||||||||||||||||||
| 2014 | 2013 | 2012 | 2014 | 2013 | 2012 | |||||||||||||||||||
| (in millions) | ||||||||||||||||||||||||
| Service cost | $ | 15 | $ | 14 | $ | 13 | $ | — | $ | — | $ | — | ||||||||||||
| Interest cost | 28 | 25 | 28 | 1 | 1 | — | ||||||||||||||||||
| Expected return on plan assets | (38 | ) | (39 | ) | (40 | ) | — | — | — | |||||||||||||||
| Amortization of prior service cost | — | — | — | — | — | — | ||||||||||||||||||
| Amortization of net loss (gain) | 15 | 17 | 17 | (3 | ) | (3 | ) | (4 | ) | |||||||||||||||
| Net benefit expense (income) | $ | 20 | $ | 17 | $ | 18 | $ | (2 | ) | $ | (2 | ) | $ | (4 | ) | |||||||||
Beginning within 2001, new retirees were charged the expected full cost of the medical plan, and then-existing retirees will incur 100 percent of the expected future increases in medical plan costs. Any changes in the health care cost trend rates assumed would not affect the accumulated benefit obligation or net benefit income, since retirees will incur 100 percent of such expected future increase.increases.
FOOT LOCKER, INC.NOTES TO CONSOLIDATED FINANCIAL STATEMENTS
20. Retirement Plans and Other Benefits – (continued)
The Company maintains a Supplemental Executive Retirement Plan (“SERP”), which is an unfunded plan that includes provisions for the continuation of medical and dental insurance benefits to certain executive officers and other key employees of the Company (“SERP Medical Plan”). The SERP Medical Plan’s accumulated projected benefit obligation at January 31, 2015February 3, 2018 was approximately $15$12 million.
The following initial and ultimate cost trend rate assumptions were used to determine the benefit obligations under the SERP Medical Plan:
|
|
|
|
|
|
|
|
|
|
|
|
|
| |||||||||||||||||||||||||||||
|
|
|
|
|
|
|
|
|
|
|
|
| ||||||||||||||||||||||||||||||
| Medical Trend Rate | Dental Trend Rate |
| Medical Trend Rate |
| Dental Trend Rate |
| ||||||||||||||||||||||||||||||||||||
| 2014 | 2013 | 2012 | 2014 | 2013 | 2012 |
| 2017 |
| 2016 |
| 2015 |
| 2017 |
| 2016 |
| 2015 |
| ||||||||||||||||||||||||
| Initial cost trend rate | 7.00 | % | 7.00 | % | 7.50 | % | 5.00 | % | 5.00 | % | 5.00 | % |
| 7.0 | % |
| 7.0 | % |
| 7.0 | % |
| 5.0 | % |
| 5.0 | % |
| 5.0 | % | ||||||||||||
| Ultimate cost trend rate | 5.00 | % | 5.00 | % | 5.00 | % | 5.00 | % | 5.00 | % | 5.00 | % |
| 5.0 | % |
| 5.0 | % |
| 5.0 | % |
| 5.0 | % |
| 5.0 | % |
| 5.0 | % | ||||||||||||
| Year that the ultimate cost trend rate is reached | 2019 | 2018 | 2018 | 2013 | 2013 | 2013 |
| 2025 |
| 2021 |
| 2021 |
| 2018 |
| 2017 |
| 2016 |
| |||||||||||||||||||||||
The following initial and ultimate cost trend rate assumptions were used to determine the net periodic cost under the SERP Medical Plan:
|
|
|
|
|
|
|
|
|
|
|
|
|
| |||||||||||||||||||||||||||||
|
|
|
|
|
|
|
|
|
|
|
|
| ||||||||||||||||||||||||||||||
| Medical Trend Rate | Dental Trend Rate |
| Medical Trend Rate |
| Dental Trend Rate |
| ||||||||||||||||||||||||||||||||||||
| 2014 | 2013 | 2012 | 2014 | 2013 | 2012 |
| 2017 |
| 2016 |
| 2015 |
| 2017 |
| 2016 |
| 2015 |
| ||||||||||||||||||||||||
| Initial cost trend rate | 7.00 | % | 7.50 | % | 8.00 | % | 5.00 | % | 5.00 | % | 5.50 | % |
| 7.0 | % |
| 7.0 | % |
| 7.0 | % |
| 5.0 | % |
| 5.0 | % |
| 5.0 | % | ||||||||||||
| Ultimate cost trend rate | 5.00 | % | 5.00 | % | 5.00 | % | 5.00 | % | 5.00 | % | 5.00 | % |
| 5.0 | % |
| 5.0 | % |
| 5.0 | % |
| 5.0 | % |
| 5.0 | % |
| 5.0 | % | ||||||||||||
| Year that the ultimate cost trend rate is reached | 2018 | 2018 | 2018 | 2013 | 2013 | 2013 |
| 2021 |
| 2021 |
| 2019 |
| 2017 |
| 2016 |
| 2015 |
| |||||||||||||||||||||||
A one percentage-point change in the assumed health care cost trend rates would have the following effects on the SERP Medical Plan:
|
|
|
|
|
|
|
|
|
|
|
|
|
|
|
| 1% Increase |
| 1% (Decrease) | ||
|
| ($ in millions) | ||||
Effect on total service and interest cost components |
| $ | — |
| $ | — |
Effect on accumulated postretirement benefit obligation |
|
| 3 |
|
| (2) |
| 1% Increase | 1% (Decrease) | |||||||
| (in millions) | ||||||||
| Effect on total service and interest cost components | $ | — | $ | — | ||||
| Effect on accumulated postretirement benefit obligation | 4 | (3 | ) | |||||
66
FOOT LOCKER, INC.
NOTES TO CONSOLIDATED FINANCIAL STATEMENTS
In 2014,2017, the mortality assumption used to value the Company’s U.S. pension obligations was updated to the modified RP-2017 mortality table with generational projection using modified MP-2017 for both males and females and terminated vested participants. The mortality assumption was updated during the current year as the Company’s actual experience more closely matched the RP-2017 table than the previous table. In 2016, the Company changed the mortality table used to calculate the present value of pension and postretirement plan liabilities, excluding the SERP Medical Plan. We previously used the RP 2000 mortality table projected with scale AA to 2019 for males and to 2013 for females. In 2014, we used the RP 2000RP-2000 mortality table with generational projection using scale AA for both males and females. We chosefemales to value its pension obligations. This table was also used to value the RP 2000 table because it resulted in the closest match to the Company’s actual experience.Canadian pension obligations for 2017. For the SERP Medical Plan, the mortality assumption used to value the 2017 obligation was updated to the RP 2014RPH-2017 table with generational projection using MP 2014.MP-2017, while in the prior year the obligation was valued using the RPH-2016 table with generational projection using MP-2016.
Plan Assets
During 2014, the target composition of the Company’s U.S. qualified pension plan assets was 58 percent fixed-income securities, 38 percent equity, and 4 percent real estate investment trust. The Company may alter the targets from time to time depending on market conditions and the funding requirements of the pension plan. This current asset allocation is expected to limit volatility with regard to the funded status of the plan, but will result in higher pension expense due to the lower long-term rate of return associated with fixed-income securities. Due to market conditions and other factors, actual asset allocations may vary from the target allocation outlined above.
The Company believes that plan assets are invested in a prudent manner with an objective of providing a total return that, over the long term, provides sufficient assets to fund benefit obligations, taking into account the Company’s expected contributions and the level of risk deemed appropriate.
FOOT LOCKER, INC.
NOTES TO CONSOLIDATED FINANCIAL STATEMENTS
20. Retirement Plans and Other Benefits – (continued)
The Company’s investment strategy seeks to utilize asset classes with differing rates of return, volatility, and correlation in order to reduce risk by providing diversification relative to equities. Diversification within asset classes is also utilized to ensure that there are no significant concentrations of risk in plan assets and to reduce the effect that the return on any single investment may have on the entire portfolio.
The target composition of the Company’s Canadian qualified pension plan assets is 95 percent fixed-income securities and 5 percent equity.equities. The Company believes that plan assets are invested in a prudent manner with the same overall objective and investment strategy as noted abovebelow for the U.S. pension plan. The bond portfolio is comprised of government and corporate bonds chosen to match the duration of the pension plan’s benefit payment obligations. This current asset allocation will limit future volatility with regard to the funded status of the plan.
The target composition of the Company’s U.S. qualified pension plan assets is 60 percent fixed-income securities, 36.5 percent equities, and 3.5 percent real estate. The Company may alter the asset allocation targets from time to time depending on market conditions and the funding requirements of the pension plan. This current asset allocation has resultedand is expected to limit volatility with regard to the funded status of the plan, but may result in higher pension expense due to the lower long-term rate of return associated with fixed-income securities. Due to market conditions and other factors, actual asset allocations may vary from the target allocation outlined above.
The Company believes plan assets relatedare invested in a prudent manner with an objective of providing a total return that, over the long term, provides sufficient assets to fund benefit obligations, taking into account the Runners Point Group pension plans were not significant.Company’s expected contributions and the level of funding risk deemed appropriate. The Company’s investment strategy seeks to diversify assets among classes of investments with differing rates of return, volatility, and correlation in order to reduce funding risk. Diversification within asset classes is also utilized to ensure that there are no significant concentrations of risk in plan assets and to reduce the effect that the return on any single investment may have on the entire portfolio.
Valuation of Investments
Significant portions of plan assets are invested in commingled trust funds. These funds are valued at the net asset value of units held by the plan at year end. Stocks traded on U.S. and Canadian security exchanges are valued at closing market prices on the measurement date.
The fair values of the Company’s U.S. pension plan assets at January 31, 2015 and February 1, 2014 were as follows:
| Level 1 | Level 2 | Level 3 | 2014 Total | 2013 Total* | ||||||||||||||||
| (in millions) | ||||||||||||||||||||
| Cash and cash equivalents | $ | — | $ | 1 | $ | — | $ | 1 | $ | — | ||||||||||
| Equity securities: | ||||||||||||||||||||
| U.S. large-cap(1) | — | 102 | — | 102 | 101 | |||||||||||||||
| U.S. mid-cap(1) | — | 31 | — | 31 | 30 | |||||||||||||||
| International(2) | — | 71 | — | 71 | 67 | |||||||||||||||
| Corporate stock(3) | 21 | — | — | 21 | 15 | |||||||||||||||
| Fixed-income securities: | ||||||||||||||||||||
| Long duration corporate and government bonds(4) | — | 254 | — | 254 | 236 | |||||||||||||||
| Intermediate duration corporate and government bonds(5) | — | 110 | — | 110 | 105 | |||||||||||||||
| Other types of investments: | ||||||||||||||||||||
| Real estate securities(6) | — | 20 | — | 20 | 20 | |||||||||||||||
| Insurance contracts | — | 1 | — | 1 | 1 | |||||||||||||||
| Other(7) | — | 2 | — | 2 | — | |||||||||||||||
| Total assets at fair value | $ | 21 | $ | 592 | $ | — | $ | 613 | $ | 575 | ||||||||||
FOOT LOCKER, INC.
NOTES TO CONSOLIDATED FINANCIAL STATEMENTS
20. Retirement Plans and Other Benefits – (continued)
No Level 3 assets were held by the U.S. pension plan during 2014 and 2013.
The fair values of the Company’s Canadian pension plan assets at February 3, 2018 and January 31, 2015 and February 1, 201428, 2017 were as follows:
|
|
|
|
|
|
|
|
|
|
|
|
|
|
|
| Level 1 |
| Level 2 |
| Level 3 |
| 2017 Total |
| 2016 Total* | |||||
| ($ in millions) | |||||||||||||
Cash and cash equivalents | $ | — |
| $ | 1 |
| $ | — |
| $ | 1 |
| $ | 1 |
Equity securities: |
|
|
|
|
|
|
|
|
|
|
|
|
|
|
Canadian and international (1) |
| 4 |
|
| — |
|
| — |
|
| 4 |
|
| 3 |
Fixed-income securities: |
|
|
|
|
|
|
|
|
|
|
|
|
|
|
Cash matched bonds (2) |
| — |
|
| 53 |
|
| — |
|
| 53 |
|
| 54 |
Total assets at fair value | $ | 4 |
| $ | 54 |
| $ | — |
| $ | 58 |
| $ | 58 |
*Each category of plan assets is classified within the same level of the fair value hierarchy for 2017 and 2016.
| Level 1 | Level 2 | Level 3 | 2014 Total | 2013 Total* | ||||||||||||||||
| (in millions) | ||||||||||||||||||||
| Cash and cash equivalents | $ | — | $ | 3 | $ | — | $ | 3 | $ | — | ||||||||||
| Equity securities: | ||||||||||||||||||||
| Canadian and international(1) | 5 | — | — | 5 | 5 | |||||||||||||||
| Fixed-income securities: | ||||||||||||||||||||
| Cash matched bonds(2) | — | 65 | — | 65 | 70 | |||||||||||||||
| Total assets at fair value | $ | 5 | $ | 68 | $ | — | $ | 73 | $ | 75 | ||||||||||
(1) |
This category comprises one mutual fund that invests primarily in a diverse portfolio of Canadian securities. |
(2) | This category consists of fixed-income securities, including strips and coupons, issued or guaranteed by the Government of Canada, provinces or municipalities of Canada including their agencies and crown corporations, as well as other governmental bonds and corporate bonds. |
No Level 3 assets were held by the Canadian pension plan during 20142017 and 2013.2016.
During 2014,
67
FOOT LOCKER, INC.
NOTES TO CONSOLIDATED FINANCIAL STATEMENTS
The fair values of the Company’s U.S. pension plan assets at February 3, 2018 and January 28, 2017 were as follows:
|
|
|
|
|
|
|
|
|
|
|
|
|
|
|
|
|
|
|
|
|
|
|
|
|
|
|
|
|
|
| Level 1 |
| Level 2 |
| Level 3 |
| 2017 Total |
| 2016 Total* | |||||
|
| ($ in millions) | ||||||||||||
Cash and cash equivalents | $ | — |
| $ | 4 |
| $ | — |
| $ | 4 |
| $ | 4 |
Equity securities: |
|
|
|
|
|
|
|
|
|
|
|
|
|
|
U.S. large-cap (1) |
| — |
|
| 115 |
|
| — |
|
| 115 |
|
| 103 |
U.S. mid-cap (1) |
| — |
|
| 34 |
|
| — |
|
| 34 |
|
| 31 |
International (2) |
| — |
|
| 78 |
|
| — |
|
| 78 |
|
| 70 |
Corporate stock (3) |
| 19 |
|
| — |
|
| — |
|
| 19 |
|
| 27 |
Fixed-income securities: |
|
|
|
|
|
|
|
|
|
|
|
|
|
|
Long duration corporate and government bonds (4) |
| — |
|
| 254 |
|
| — |
|
| 254 |
|
| 231 |
Intermediate duration corporate and government bonds (5) |
| — |
|
| 113 |
|
| — |
|
| 113 |
|
| 103 |
Other types of investments: |
|
|
|
|
|
|
|
|
|
|
|
|
|
|
Real estate securities (6) |
| — |
|
| 21 |
|
| — |
|
| 21 |
|
| 19 |
Insurance contracts |
| — |
|
| 1 |
|
| — |
|
| 1 |
|
| 1 |
Total assets at fair value | $ | 19 |
| $ | 620 | — | $ | — |
| $ | 639 |
| $ | 589 |
*Each category of plan assets is classified within the same level of the fair value hierarchy for 2017 and 2016.
(1) | These categories consist of various managed funds that invest primarily in common stocks, as well as other equity securities and a combination of other funds. |
(2) | This category comprises three managed funds that invest primarily in international common stocks, as well as other equity securities and a combination of other funds. |
(3) | This category consists of the Company’s common stock. |
(4) | This category consists of various fixed-income funds that invest primarily in long-term bonds, as well as a combination of other funds, that together are designed to exceed the performance of related long-term market indices. |
(5) | This category consists of two fixed-income funds that invest primarily in intermediate duration bonds, as well as a combination of other funds, that together are designed to exceed the performance of related indices. |
(6) | This category consists of one fund that invests in global real estate securities. |
No Level 3 assets were held by the U.S. pension plan during 2017 and 2016.
The Company made contributionsa contribution of $6$25 million to its CanadianU.S. qualified pension plan. The Company continuously evaluates the amount and timing of any future contributions. The Company currently does not expect to contribute to its U.S. or Canadian qualified plans in 2015. Additional contributions will depend on the plan asset performance and other factors.during 2017. During 2014,2017, the Company also paid $3$4 million in pension benefits related to its non-qualified pension plans.
The Company continually evaluates the amount and timing of any potential contributions. Actual contributions are dependent on several factors; however the Company anticipates making a $128 million contribution during 2018 in connection with the expected U.S. pension plan reformation. See Note 22, Legal Proceedings, for further information.
Estimated future benefit payments (excluding any amounts related to the expected U.S. pension plan reformation) for each of the next five years and the five years thereafter are as follows:
|
|
|
|
|
|
|
|
|
|
|
|
|
|
|
| Pension |
| Postretirement | ||
|
| Benefits |
| Benefits | ||
|
| ($ in millions) | ||||
2018 |
| $ | 66 |
| $ | 1 |
2019 |
|
| 54 |
|
| 1 |
2020 |
|
| 53 |
|
| 1 |
2021 |
|
| 52 |
|
| 1 |
2022 |
|
| 51 |
|
| 1 |
2023–2027 |
|
| 236 |
|
| 2 |
| Pension Benefits | Postretirement Benefits | |||||||
| (in millions) | ||||||||
| 2015 | $ | 66 | $ | 1 | ||||
| 2016 | 55 | 1 | ||||||
| 2017 | 53 | 1 | ||||||
| 2018 | 52 | 1 | ||||||
| 2019 | 53 | 1 | ||||||
| 2020 – 2024 | 232 | 5 | ||||||
68
FOOT LOCKER, INC.
NOTES TO CONSOLIDATED FINANCIAL STATEMENTS
20. Retirement Plans and Other Benefits – (continued)
Savings Plans
The Company has two qualified savings plans, a 401(k) Planplan that is available to employees whose primary place of employment is the U.S., and an 1165(e) Plananother plan that is available to employees whose primary place of employment is in Puerto Rico. BothPrior to January 1, 2018, both plans limitlimited participation to employees who havehad attained at least the age of twenty-one and have completed one year of service consisting of at least 1,000 hours. Effective January 1, 2018, eligible associates may contribute to the plans following 28 days of employment and are eligible for Company matching contributions upon completion of one year of service consisting of at least 1,000 hours. As of January 1, 2015,2018, the savings plans allow eligible employees to contribute up to 40 percent of their compensation on a pre-tax basis, subject to a maximum of $18,000$18,500 for the U.S. plan and $15,000$15,000 for the Puerto Rico plan of their compensation on a pre-tax basis.plan. The Company’s matching contribution is an amount equal toCompany matches 25 percent of employees’ pre-tax contributions on up to 25 percent of the first 4 percent of the employees’ compensation (subject to certain limitations). This matching contribution isMatching contributions made before January1,2016 were made with Company stock, and suchsubsequent to this date matching contributions were made in cash. Such matching contributions are vested incrementally over the first 5 years of participation for both plans. The charge to operations for the Company’s matching contribution was $3 million for alleach of the years presented.
21. Share-Based Compensation
Stock Awards
Under the Company’s 2007 Stock Incentive Plan (the “2007 Stock Plan”), stock options, restricted stock, restricted stock units, stock appreciation rights, or other stock-based awards may be granted to officers and other employees of the Company, including its subsidiaries and operating divisions worldwide. Nonemployee directors are also eligible to receive awardsstock options under this plan.plan, although none are outstanding as of February 3, 2018. Options for employees become exercisable in substantially equal annual installments over a three-year period, beginning with the first anniversary of the date of grant of the option, unless a shorter or longer duration is established at the time of the option grant. Options for nonemployee directors become exercisable one year from the date of grant. The options terminate up to ten years from the date of grant. On May21, 2014, the 2007 Stock Plan was amended to increase the number of shares of the Company’s common stock reserved for all awards to 14 million shares. As of February 3, 2018, there were 10,760,270 shares available for issuance under this plan.
Employees Stock Purchase Plan
In 2013,
Under the Company adopted theCompany’s 2013 Foot Locker Employees Stock Purchase Plan (“2013 ESPP”), whose terms are substantially the same as the 2003 Employees Stock Purchase Plan (“2003 ESPP”). No further shares may be issued under the 2003 ESPP. Under the 2013 ESPP participating employees are able to contribute up to 10 percent of their annual compensation, not to exceed $25,000 in any plan year, through payroll deductions to acquire shares of the Company’s common stock at 85 percent of the lower market price on one of two specified dates in each plan year. UnderOf the 2013 ESPP, 3,000,000 shares of common stock authorized under this plan, there were 2,523,865 shares available for purchase beginning June 2014,as of which 958February 3, 2018. During 2017 and 2016, participating employees purchased 160,859109,790 shares in 2014.and 80,992 shares, respectively.
Share-Based Compensation Expense
Total compensation expense included in SG&A and the associated tax benefits recognized related to the Company’s share-based compensation plans were as follows:
|
|
|
|
|
|
|
|
|
|
|
|
|
|
|
|
|
|
| 2017 |
| 2016 |
| 2015 | |||
| ($ in millions) | |||||||
Options and shares purchased under the ESPP | $ | 9 |
| $ | 10 |
| $ | 11 |
Restricted stock and restricted stock units |
| 6 |
|
| 12 |
|
| 11 |
Total share-based compensation expense | $ | 15 |
| $ | 22 |
| $ | 22 |
|
|
|
|
|
|
|
|
|
Tax benefit recognized | $ | 4 |
| $ | 6 |
| $ | 8 |
| 2014 | 2013 | 2012 | ||||||||||
| (in millions) | ||||||||||||
| Options and shares purchased under the employee stock purchase plan | $ | 13 | $ | 12 | $ | 10 | ||||||
| Restricted stock and units | 11 | 13 | 10 | |||||||||
| Total share-based compensation expense | $ | 24 | $ | 25 | $ | 20 | ||||||
| Tax benefit | $ | 7 | $ | 8 | $ | 6 | ||||||
| Tax deductions in excess of the cumulative compensation cost | $ | 12 | $ | 9 | $ | 11 | ||||||
69
FOOT LOCKER, INC.
NOTES TO CONSOLIDATED FINANCIAL STATEMENTS
21. Share-Based Compensation – (continued)
Valuation Model and Assumptions
The Company uses a Black-Scholes option-pricing model is used to estimate the fair value of share-based awards. The Black-Scholes option-pricing model incorporates various and highly subjective assumptions, including expected term and expected volatility.
The Company estimates the expected term of share-based awards granted using the Company’s historical exercise and post-vesting employment termination patterns, which it believes are representative of future behavior. The expected term for the employee stock purchase plan valuation is based on the length of each purchase period as measured at the beginning of the offering period, which is one year.
The Company estimates the expected volatility of its common stock at the grant date using a weighted-average of the Company’s historical volatility and implied volatility from traded options on the Company’s common stock. The Company believes that thethis combination of historical volatility and implied volatility provides a better estimate of future stock price volatility.
The risk-free interest rate assumption is determined using the Federal Reserve nominal rates for U.S. Treasury zero-coupon bonds with maturities similar to those of the expected term of the award being valued. The expected dividend yield is derived from the Company’s historical experience.
The
As of Q1 2017, in connection with the adoption of ASU 2016-09, we have made the accounting policy election to discontinue estimating forfeitures and will account for forfeitures as they occur. Prior to 2017, the Company recordsrecorded share-based compensation expense only for those awards expected to vest using an estimated forfeiture rate based on its historical pre-vesting forfeiture data. The Company estimates pre-vesting option forfeitures at the time of grant and periodically revises those estimates in subsequent periods if actual forfeitures differ from those estimates.
The following table shows the Company’s assumptions used to compute the share-based compensation expense:
|
|
|
|
|
|
|
|
|
|
|
|
|
|
|
|
|
|
|
|
|
|
|
|
|
|
|
|
|
|
|
|
|
|
|
|
|
|
|
| Stock Option Plans |
| Stock Purchase Plan | ||||||||||||||
|
| 2017 |
|
| 2016 |
|
| 2015 |
|
| 2017 |
|
| 2016 |
|
| 2015 |
|
Weighted-average risk free rate of interest |
| 2.1 | % |
| 1.4 | % |
| 1.5 | % |
| 1.0 | % |
| 0.5 | % |
| 0.2 | % |
Expected volatility |
| 25 | % |
| 30 | % |
| 30 | % |
| 30 | % |
| 27 | % |
| 25 | % |
Weighted-average expected award life (in years) |
| 5.4 |
|
| 5.7 |
|
| 6.0 |
|
| 1.0 |
|
| 1.0 |
|
| 1.0 |
|
Dividend yield |
| 1.9 | % |
| 1.7 | % |
| 1.6 | % |
| 2.0 | % |
| 1.8 | % |
| 1.6 | % |
Weighted-average fair value | $ | 14.74 |
| $ | 15.71 |
| $ | 16.07 |
| $ | 10.96 |
| $ | 13.33 |
| $ | 10.47 |
|
| Stock Option Plans | Stock Purchase Plan | |||||||||||||||||||||||
| 2014 | 2013 | 2012 | 2014 | 2013 | 2012 | |||||||||||||||||||
| Weighted-average risk free rate of interest | 2.07 | % | 1.02 | % | 1.49 | % | 0.14 | % | 0.17 | % | 0.22 | % | ||||||||||||
| Expected volatility | 39 | % | 42 | % | 43 | % | 24 | % | 40 | % | 38 | % | ||||||||||||
| Weighted-average expected award life (in years) | 6.1 | 6.0 | 5.5 | 1.0 | 1.0 | 1.0 | ||||||||||||||||||
| Dividend yield | 1.9 | % | 2.3 | % | 2.3 | % | 2.0 | % | 2.3 | % | 2.5 | % | ||||||||||||
| Weighted-average fair value | $ | 15.30 | $ | 10.98 | $ | 10.13 | $ | 7.35 | $ | 5.79 | $ | 6.11 | ||||||||||||
FOOT LOCKER, INC.
NOTES TO CONSOLIDATED FINANCIAL STATEMENTS
21. Share-Based Compensation – (continued)
The information set forth in the following table covers options granted under the Company’s stock option plans:
| 2014 | 2013 | 2012 | ||||||||||||||||||||||
| Number of Shares | Weighted- Average Exercise Price | Number of Shares | Weighted- Average Exercise Price | Number of Shares | Weighted- Average Exercise Price | |||||||||||||||||||
| (in thousands, except prices per share) | ||||||||||||||||||||||||
| Options outstanding at beginning of year | 5,668 | $ | 22.66 | 5,907 | $ | 19.93 | 7,227 | $ | 18.44 | |||||||||||||||
| Granted | 849 | $ | 46.20 | 1,154 | $ | 34.25 | 940 | $ | 30.96 | |||||||||||||||
| Exercised | (810 | ) | $ | 21.74 | (1,328 | ) | $ | 20.26 | (2,213 | ) | $ | 19.67 | ||||||||||||
| Expired or cancelled | (138 | ) | $ | 42.55 | (65 | ) | $ | 29.55 | (47 | ) | $ | 23.74 | ||||||||||||
| Options outstanding at end of year | 5,569 | $ | 25.89 | 5,668 | $ | 22.66 | 5,907 | $ | 19.93 | |||||||||||||||
| Options exercisable at end of year | 3,759 | $ | 19.74 | 3,495 | $ | 18.02 | 3,593 | $ | 17.83 | |||||||||||||||
| Options vested and expected to vest | 5,546 | $ | 25.82 | 5,558 | $ | 22.45 | 5,804 | $ | 19.82 | |||||||||||||||
| Options available for future grant at end of year | 13,911 | 3,267 | 5,518 | |||||||||||||||||||||
|
|
|
|
|
|
|
|
|
|
|
|
|
|
|
|
|
| Weighted- |
|
| Weighted- | ||
|
|
| Number |
|
| Average |
|
| Average | ||
|
|
| of |
|
| Remaining |
|
| Exercise | ||
|
|
| Shares |
|
| Contractual Life |
|
| Price | ||
|
|
| (in thousands) |
|
| (in years) |
|
| (per share) | ||
Options outstanding at January 28, 2017 |
|
| 2,806 |
|
|
|
|
|
| $ | 42.61 |
Granted |
|
| 547 |
|
|
|
|
|
|
| 69.58 |
Exercised |
|
| (593) |
|
|
|
|
|
|
| 21.35 |
Expired or cancelled |
|
| (21) |
|
|
|
|
|
|
| 61.50 |
Options outstanding at February 3, 2018 |
|
| 2,739 |
|
|
| 6.5 |
|
| $ | 52.45 |
Options exercisable at February 3, 2018 |
|
| 1,699 |
|
|
| 5.2 |
|
| $ | 43.85 |
70
FOOT LOCKER, INC.
NOTES TO CONSOLIDATED FINANCIAL STATEMENTS
The total fair value of options vested during 2017, 2016, and 2015 was $8 million, $9 million, and $15 million, respectively.
During the year ended February 3, 2018, the Company received $13 million in cash from option exercises and recognized a related tax benefit of $8 million. The total intrinsic value of options exercised (the difference between the market price of the Company’s common stock on the exercise date and the price paid by the optionee to exercise the option) is presented below:
|
|
|
|
|
|
|
|
|
|
|
|
|
|
|
|
|
|
| 2017 |
| 2016 |
| 2015 | |||
| ($ in millions) | |||||||
Exercised | $ | 22 |
| $ | 56 |
| $ | 99 |
| 2014 | 2013 | 2012 | ||||||||||
| (in millions) | ||||||||||||
| Exercised | $ | 22 | $ | 21 | $ | 29 | ||||||
The aggregate intrinsic value for stock options outstanding, and those outstanding and exercisable and vested and expected to vest (the difference between the Company’s closing stock price on the last trading day of the period and the exercise price of the options, multiplied by the number of in-the-money stock options) is presented below:
2017 | ||
($ in millions) | ||
Outstanding | $ | 17 |
Outstanding and exercisable | $ | 17 |
| 2014 | 2013 | 2012 | ||||||||||
| (in millions) | ||||||||||||
| Outstanding | $ | 152 | $ | 90 | $ | 86 | ||||||
| Outstanding and exercisable | $ | 126 | $ | 72 | $ | 60 | ||||||
| Vested and expected to vest | $ | 152 | $ | 90 | $ | 86 | ||||||
As of January 31, 2015,February 3, 2018, there was $7$5 million of total unrecognized compensation cost net of estimated forfeitures, related to nonvested stock options, which is expected to be recognized over a remaining weighted-average period of 1.351.5 years.
The Company received $17 million in cash from option exercises for the year ended January 31, 2015. The tax benefit realized from option exercises was $8 million, $7 million, and $11 million for 2014, 2013, and 2012, respectively.
FOOT LOCKER, INC.
NOTES TO CONSOLIDATED FINANCIAL STATEMENTS
21. Share-Based Compensation – (continued)
The following table summarizes information about stock options outstanding and exercisable at January 31, 2015:February 3, 2018:
| Options Outstanding | Options Exercisable | |||||||||||||||||||||||
| Range of Exercise Prices | Number Outstanding | Weighted- Average Remaining Contractual Life | Weighted- Average Exercise Price | Number Exercisable | Weighted- Average Exercise Price | |||||||||||||||||||
| (in thousands, except prices per share and contractual life) | ||||||||||||||||||||||||
| $9.85 to $15.10 | 1,466 | 4.63 | $ | 12.39 | 1,466 | $ | 12.39 | |||||||||||||||||
| $18.80 to $24.76 | 1,453 | 5.03 | $ | 20.10 | 1,453 | $ | 20.10 | |||||||||||||||||
| $25.19 to $34.27 | 1,896 | 7.45 | $ | 32.70 | 828 | $ | 31.82 | |||||||||||||||||
| $34.42 to $56.35 | 754 | 9.15 | $ | 46.15 | 12 | $ | 40.51 | |||||||||||||||||
| 5,569 | 6.31 | $ | 25.89 | 3,759 | $ | 19.74 | ||||||||||||||||||
|
|
|
|
|
|
|
|
|
|
|
|
|
|
|
|
|
|
|
|
|
|
|
|
|
|
|
| Options Outstanding |
| Options Exercisable | ||||||||
|
|
|
| Weighted- |
|
|
|
|
|
|
|
|
|
|
|
| Average |
|
| Weighted- |
|
|
|
| Weighted- |
|
|
|
| Remaining |
|
| Average |
|
|
|
| Average |
Range of Exercise |
| Number |
| Contractual |
|
| Exercise |
| Number |
|
| Exercise |
Prices |
| Outstanding |
| Life |
|
| Price |
| Exercisable |
|
| Price |
|
| (in thousands, except prices per share and contractual life) | ||||||||||
$9.85 to $24.75 |
| 312 |
| 2.6 |
| $ | 17.40 |
| 312 |
| $ | 17.40 |
$30.92 to $45.75 |
| 762 |
| 5.2 |
|
| 38.46 |
| 722 |
|
| 38.64 |
$48.55 to $62.11 |
| 703 |
| 6.6 |
|
| 61.04 |
| 499 |
|
| 61.08 |
$63.79 to $73.21 |
| 962 |
| 8.6 |
|
| 68.60 |
| 166 |
|
| 64.35 |
|
| 2,739 |
| 6.5 |
| $ | 52.45 |
| 1,699 |
| $ | 43.85 |
Restricted Stock and Restricted Stock Units
Restricted shares of the Company’s common stock and restricted stock units (“RSU”) may be awarded to certain officers and key employees of the Company. AwardsAdditionally, RSU awards are made to executives outside ofemployees in connection with the United StatesCompany’ long-term incentive program and to nonemployee directors are made in the form of restricted stock units.directors. Each restricted stock unitRSU represents the right to receive one share of the Company’s common stock provided that the performance and vesting conditions are satisfied. In 2014, 2013,2017, 2016, and 2012,2015 there were 755,936, 1,027,542,360,782, 648,558, and 1,254,876 restricted stock units588,308 RSU awards outstanding, respectively.
71
FOOT LOCKER, INC.
NOTES TO CONSOLIDATED FINANCIAL STATEMENTS
Generally, awards fully vest after the passage of time, typically three years. However, restricted stock unit grantsRSU awards made in connection with the Company’s long-term incentive program vestare earned after the attainment of certain performance metrics and vest after the passage of time. Restricted stock is considered outstanding at the time of grant and the holders have voting rights. Dividends are paid to holders of restricted stock that vest with the passage of time; fortime. With regard to performance-based restricted stock, dividends will be accumulated and paid after the performance criteria are met. No dividends are paid or accumulated on restricted stock units.
RSU awards.Compensation expense is recognized using the fair market value aton the date of grant and is amortized over the vesting period, provided the recipient continues to be employed by the Company.
Restricted sharestock and unitRSU activity is summarized as follows:
| 2014 | 2013 | 2012 | ||||||||||||||||||||||
| Number of Shares | Wtg. Avg. Grant Date Fair Value per share | Number of Shares | Wtg. Avg. Grant Date Fair Value per share | Number of Shares | Wtg. Avg. Grant Date Fair Value per share | |||||||||||||||||||
| (in thousands, except prices per share) | ||||||||||||||||||||||||
| Nonvested at beginning of year | 1,369 | $ | 27.20 | 1,564 | $ | 19.50 | 2,068 | $ | 14.52 | |||||||||||||||
| Granted | 360 | $ | 46.48 | 469 | $ | 35.03 | 278 | $ | 30.89 | |||||||||||||||
| Vested | (649 | ) | $ | 20.84 | (649 | ) | $ | 14.50 | (782 | ) | $ | 10.37 | ||||||||||||
| Expired or cancelled | (42 | ) | $ | 24.69 | (15 | ) | $ | 18.30 | — | $ | — | |||||||||||||
| Nonvested at end of year | 1,038 | $ | 37.96 | 1,369 | $ | 27.20 | 1,564 | $ | 19.50 | |||||||||||||||
| Aggregate value (in millions) | $ | 39 | $ | 37 | $ | 30 | ||||||||||||||||||
| Wtg. Avg. remaining contractual life (in years) | 1.12 | 0.89 | 0.84 | |||||||||||||||||||||
|
|
|
|
|
|
|
|
|
|
|
|
|
|
|
|
|
|
|
| Weighted-Average |
|
|
|
|
| Number |
| Remaining |
| Weighted-Average | |
|
| of |
| Contractual |
| Grant Date | |
|
| Shares |
| Life |
| Fair Value | |
|
| (in thousands) |
| (in years) |
|
| (per share) |
Nonvested at January 28, 2017 |
| 798 |
|
|
| $ | 56.91 |
Granted |
| 329 |
|
|
|
| 63.68 |
Vested |
| (305) |
|
|
|
| 49.97 |
Expired or cancelled |
| (448) |
|
|
|
| 64.75 |
Nonvested at February 3, 2018 |
| 374 |
| 1.3 |
| $ | 59.15 |
Aggregate value ($ in millions) | $ | 22 |
|
|
|
|
|
FOOT LOCKER, INC.
NOTES TO CONSOLIDATED FINANCIAL STATEMENTS
21. Share-Based Compensation – (continued)
The total fair value of awards for which restrictions lapsed was $14$15 million, $9 million, and $8$10 million for 2014, 2013,2017, 2016, and 2012,2015, respectively. At January 31, 2015,February 3, 2018, there was $12$8 million of total unrecognized compensation cost net of estimated forfeitures, related to nonvested restricted stock and RSU awards.
22. Legal Proceedings
Legal proceedings pending against the Company or its consolidated subsidiaries consist of ordinary, routine litigation, including administrative proceedings, incidental to the business of the Company or businesses that have been sold or disposed of by the Company in past years. These legal proceedings include commercial, intellectual property, customer, environmental, and employment-related claims.
Certain of Additionally, the Company’s subsidiaries are defendants in a number of lawsuits filed in state and federal courts containing various class action allegations under federal or state wage and hour laws, including allegations concerning unpaid overtime, meal and rest breaks, and uniforms.
The Company is a defendant in one such casea purported Fair Credit Reporting Act class action in which plaintiff alleges that theCalifornia and a purported meal break class action in California. The Company permitted unpaid off-the-clock hours in violation of the Fair Labor Standards Act and state labor laws. The case,Pereira v. Foot Locker, was filed in the U.S. District Court for the Eastern District of Pennsylvania in 2007. In his complaint, in addition to unpaid wage and overtime allegations, plaintiff seeks compensatory and punitive damages, injunctive relief, and attorneys’ fees and costs. In 2009, the Court conditionally certified a nationwide collective action. During the course of 2010, notices were sent to approximately 81,888 current and former employeescertain officers of the Company offering them the opportunity to participateare defendants in the class action, and approximately 5,027 have opted in.
The Company is a defendant in additional purported wage and hoursecurities law class actions that assert claims similar to those asserted inPereira and seek similar remedies. With the exception ofHill v. Foot Locker filed in state court in Illinois,Kissinger v. Foot Locker filed in state court of California, andCortes v. Foot Locker filed in federal court in New York, all of these actions were consolidated by the United States Judicial Panel on Multidistrict Litigation withPereiraunder the captionIn re Foot Locker, Inc. Fair Labor Standards Act and Wage and Hour Litigation.InHill v. Foot Locker, in May 2011, the court granted plaintiffs’ motion for certification of an opt-out class covering certain Illinois employees only. The Company and plaintiffs have entered into a proposed settlement agreement to resolve the consolidated cases, Hill andCortes,that is subject to court approval. The court recently granted preliminary approval of the proposed settlement agreement.York.
The Company and the Company’s U.S. retirement plan are defendants in a purported class action (Osberg v. Foot Locker Inc. et ano., filed in the U.S. District Court for the Southern District of New York) in which the plaintiff alleges that, in connection with the 1996 conversion of the retirement plan to a defined benefit plan with a cash balance formula, the Company and the retirement plan failed to properly advise plan participants of the “wear-away” effect of the conversion. Plaintiff’s current claims arewere for breach of fiduciary duty under the Employee Retirement Income Security Act of 1974, as amended, and violation of the statutory provisions governing the content of the Summary Plan Description. The districtIn February 2018, the Company’s Petition for Writ of Certiorari with the U.S. Supreme Court was denied. Accordingly, the Company must reform the pension plan consistent with the trial court’s judgment, and will be working with plaintiffs’ counsel and the court issued rulings certifyingon the class.specific steps needed to implement the judgment. The Company sought leavehas estimated that the cost of plan reformation is $278 million as of February 3, 2018 and this amount will continue to appealincrease with interest until paid, as required by the class certification rulingsprovisions of the required plan reformation. The previous amount accrued was $150 million. Accordingly, during the fourth quarter of 2017, the Company recorded an additional charge of $128 million, bringing the cumulative amount accrued for this matter to $278million. The Company is currently formulating the actions and steps necessary to reform the plan and has determined that it will make a $128 million contribution during 2018 to the U.S. Courtpension trust to fund a portion of Appeals forthis obligation. Also during the Second Circuit, but these applications were denied. Trial is scheduled for June 22, 2015.fourth quarter of 2017, the Company established a qualified settlement fund in the amount of $150 million, which will also be used to fund future pension contributions that may be required as a result of the plan reformation and plaintiffs’ legal fees.
72
FOOT LOCKER, INC.
NOTES TO CONSOLIDATED FINANCIAL STATEMENTS
Management does not believe that the outcome of any such legal proceedings pending against the Company or its consolidated subsidiaries, includingIn re Foot Locker, Inc. Fair Labor Standards Act and Wage and Hour Litigation,Hill, Cortes, Kissinger,and Osberg, as described above, would have a material adverse effect on the Company’s consolidated financial position, liquidity, or results of operations, taken as a whole.whole, based upon current knowledge and taking into consideration current accruals. Litigation is inherently unpredictable, and judgments could be rendered or settlements entered into that could adversely affect the Company’s operating results or cash flows in a particular period.
FOOT LOCKER, INC.
NOTES TO CONSOLIDATED FINANCIAL STATEMENTS
23. Quarterly Results (Unaudited)
| 1st Q | 2nd Q | 3rd Q | 4th Q | Year | ||||||||||||||||
| (in millions, except per share amounts) | ||||||||||||||||||||
| Sales | ||||||||||||||||||||
| 2014 | 1,868 | 1,641 | 1,731 | 1,911 | $ | 7,151 | ||||||||||||||
| 2013 | 1,638 | 1,454 | 1,622 | 1,791 | $ | 6,505 | ||||||||||||||
| Gross margin(1) | ||||||||||||||||||||
| 2014 | 646 | 525 | 574 | 629 | $ | 2,374 | ||||||||||||||
| 2013 | 561 | 453 | 537 | 582 | $ | 2,133 | ||||||||||||||
| Operating profit(2) | ||||||||||||||||||||
| 2014 | 254 | 144 | 187 | 220 | $ | 805 | ||||||||||||||
| 2013 | 215 | 106 | 162 | 181 | $ | 664 | ||||||||||||||
| Net income | ||||||||||||||||||||
| 2014 | 162 | 92 | 120 | 146 | $ | 520 | ||||||||||||||
| 2013 | 138 | 66 | 104 | 121 | $ | 429 | ||||||||||||||
| Basic earnings per share: | ||||||||||||||||||||
| 2014 | 1.12 | 0.63 | 0.84 | 1.03 | $ | 3.61 | ||||||||||||||
| 2013 | 0.92 | 0.44 | 0.70 | 0.83 | $ | 2.89 | ||||||||||||||
| Diluted earnings per share: | ||||||||||||||||||||
| 2014 | 1.10 | 0.63 | 0.82 | 1.01 | $ | 3.56 | ||||||||||||||
| 2013 | 0.90 | 0.44 | 0.70 | 0.81 | $ | 2.85 | ||||||||||||||
|
|
|
|
|
|
|
|
|
|
|
|
|
|
|
|
|
|
|
|
|
|
|
|
|
| 1st Quarter |
| 2nd Quarter |
| 3rd Quarter |
| 4th Quarter (1) |
| Fiscal Year | |
|
|
| |||||||||
Sales |
|
|
|
|
|
|
|
|
|
|
|
2017 |
| 2,001 |
| 1,701 |
| 1,870 |
| 2,210 |
| $ | 7,782 |
2016 |
| 1,987 |
| 1,780 |
| 1,886 |
| 2,113 |
| $ | 7,766 |
Gross margin (2) |
|
|
|
|
|
|
|
|
|
|
|
2017 |
| 680 |
| 503 |
| 580 |
| 693 |
| $ | 2,456 |
2016 |
| 696 |
| 587 |
| 640 |
| 713 |
| $ | 2,636 |
Operating profit (3) |
|
|
|
|
|
|
|
|
|
|
|
2017 |
| 268 |
| 72 |
| 155 |
| 76 |
| $ | 571 |
2016 |
| 296 |
| 198 |
| 228 |
| 278 |
| $ | 1,000 |
Net income/(loss) (4), (5), (6), (7) |
|
|
|
|
|
|
|
|
|
|
|
2017 |
| 180 |
| 51 |
| 102 |
| (49) |
| $ | 284 |
2016 |
| 191 |
| 127 |
| 157 |
| 189 |
| $ | 664 |
Basic earnings per share (8) |
|
|
|
|
|
|
|
|
|
|
|
2017 |
| 1.37 |
| 0.39 |
| 0.81 |
| (0.40) |
| $ | 2.23 |
2016 |
| 1.40 |
| 0.94 |
| 1.18 |
| 1.43 |
| $ | 4.95 |
Diluted earnings per share (8) |
|
|
|
|
|
|
|
|
|
|
|
2017 |
| 1.36 |
| 0.39 |
| 0.81 |
| (0.40) |
| $ | 2.22 |
2016 |
| 1.39 |
| 0.94 |
| 1.17 |
| 1.42 |
| $ | 4.91 |
(1) | The fourth quarter of 2017 represents the 14 weeks ended February 3, 2018. |
(2) | Gross margin represents sales less cost of sales. Cost of sales includes: the cost of merchandise, freight, distribution costs including related depreciation expense, shipping and handling, occupancy and buyers’ compensation. Occupancy costs include rent, common area maintenance charges, real estate taxes, general maintenance, and utilities. |
(3) | Operating profit represents income before income taxes, interest (income)/expense, net, and non-operating income. | |
(4) | During the second and fourth quarters of 2017, the Company recorded pre-tax charges of $50 million and $128 million, respectively, related to its U.S. retirement plan litigation. See Note 22, Legal Proceedings for further information. | |
(5) | During the third quarter of 2017, the Company recorded a pre-tax charge of $13 million associated with the reorganization and the reduction in staff taken to improve efficiency. See Note 3, Litigation and Other Charges for further information. | |
(6) | During the fourth quarter of 2017 and the third quarter of 2016, the Company recorded pre-tax non-cash impairment charges totaling $20million and $6 million, respectively. See Note 3, Litigation and Other Charges for further information. | |
(7) | During the fourth quarter of 2017, the Company recorded a provisional $99 million tax liability for the mandatory deemed repatriation of foreign sourced net earnings and a corresponding change in our permanent reinvestment assertion under ASC 740-30. See Note 17, Income Taxes for further information. | |
(8) | Quarterly income per share amounts do not total to the annual amount due to changes in weighted-average shares outstanding during the year. Additionally, stock options and other potentially dilutive common shares were excluded from the computation of diluted earnings per common share for the quarter ended February 3, 2018 as the Company reported a net loss. | |
73
Item 9. Changes in and Disagreements with Accountants on Accounting and Financial Disclosure
There were no disagreements between the Company and its independent registered public accounting firm on matters of accounting principles or practices.
Item 9A. Controls and Procedures
(a) | Evaluation of Disclosure Controls and Procedures. |
The Company’s management performed an evaluation under the supervision and with the participation of the Company’s Chief Executive Officer (“CEO”) and Chief Financial Officer (“CFO”), and completed an evaluation of the effectiveness of the design and operation of the Company’s disclosure controls and procedures (as that term is defined in Rules 13a-15(e) and 15d-15(e) under the Securities Exchange Act of 1934, as amended (the “Exchange Act”)) as of January 31, 2015.
The Company’s management performed an evaluation, under the supervision and with the participation of the Company’s Chief Executive Officer (“CEO”) and Chief Financial Officer (“CFO”), of the effectiveness of the design and operation of the Company’s disclosure controls and procedures (as that term is defined in Rules 13a-15(e) and 15d-15(e) under the Securities Exchange Act of 1934, as amended (the “Exchange Act”)) as of February 3, 2018. Based on that evaluation, the Company’s CEO and CFO concluded that the Company’s disclosure controls and procedures were effective to ensure that information relating to the Company that is required to be disclosed in the reports that we file or submit under the Exchange Act is recorded, processed, summarized, and reported within the time periods specified in the SEC rules and forms, and is accumulated and communicated to management, including the CEO and CFO, as appropriate to allow timely decisions regarding required disclosure.
(b) | Management’s Annual Report on Internal Control over Financial Reporting. | ||
The Company’s management is responsible for establishing and maintaining adequate internal control over financial reporting (as that term is defined in Exchange Act Rules 13a-15(f) and 15d-15(f)). To evaluate the effectiveness of the Company’s internal control over financial reporting, the Company uses the framework in Internal Control-Integrated Framework (2013) issued by the Committee of Sponsoring Organizations of the Treadway Commission (the “2013 COSO Framework”). Using the 2013 COSO Framework, the Company’s management, including the CEO and CFO, evaluated the Company’s internal control over financial reporting and concluded that the Company’s internal control over financial reporting was effective as of January 31, 2015.
The Company’s management is responsible for establishing and maintaining adequate internal control over financial reporting (as that term is defined in Exchange Act Rules 13a-15(f) and 15d-15(f)). To evaluate the effectiveness of the Company’s internal control over financial reporting, the Company uses the framework in Internal Control-Integrated Framework (2013) issued by the Committee of Sponsoring Organizations of the Treadway Commission (the “2013 COSO Framework”). Using the 2013 COSO Framework, the Company’s management, including the CEO and CFO, evaluated the Company’s internal control over financial reporting and concluded that the Company’s internal control over financial reporting was effective as of February 3, 2018. KPMG LLP, the independent registered public accounting firm that audits the Company’s consolidated financial statements included in this annual report, has issued an attestation report on the Company’s effectiveness of internal control over financial reporting, which is included in Item 9A(d).
(c) | Changes in Internal Control over Financial Reporting. | ||||
During the Company’s last fiscal quarter there were no changes in internal control over financial reporting that materially affected, or are reasonably likely to materially affect, the Company’s internal control over financial reporting.
(d) | Report of Independent Registered Public Accounting Firm on Internal Control Over Financial Reporting- the report appears on the following page. | ||||
REPORT OF INDEPENDENT REGISTERED PUBLIC ACCOUNTING FIRM
The Board of Directors and StockholdersShareholders of
Foot Locker, Inc.:
Opinion on Internal Control Over Financial Reporting
We have audited Foot Locker, Inc.’s and subsidiaries (the “Company”) internal control over financial reporting as of January 31, 2015,February 3, 2018, based on criteria established in Internal Control —– Integrated Framework(2013) issued by the Committee of Sponsoring Organizations of the Treadway Commission (COSO). Foot Locker, Inc.’sCommission. In our opinion, the Company maintained, in all material respects, effective internal control over financial reporting as of February 3, 2018, based on criteria established in Internal Control – Integrated Framework (2013) issued by the Committee of Sponsoring Organizations of the Treadway Commission.
We also have audited, in accordance with the standards of the Public Company Accounting Oversight Board (United States) (PCAOB), the consolidated balance sheets of the Company as of February 3, 2018 and January 28, 2017, the related consolidated statements of operations, comprehensive income, stockholders’ equity, and cash flows for each of the years in the three-year period ended February 3, 2018, and the related notes (collectively, the “consolidated financial statements”), and our report dated March 29, 2018 expressed an unqualified opinion on those consolidated financial statements.
Basis for Opinion
The Company’s management is responsible for maintaining effective internal control over financial reporting and for its assessment of the effectiveness of internal control over financial reporting, included in the accompanying Management’s Annual Report on Internal Control over Financial Reporting (Item 9A(b)).Reporting. Our responsibility is to express an opinion on the Company’s internal control over financial reporting based on our audit. We are a public accounting firm registered with the PCAOB and are required to be independent with respect to the Company in accordance with the U.S. federal securities laws and the applicable rules and regulations of the Securities and Exchange Commission and the PCAOB.
We conducted our audit in accordance with the standards of the Public Company Accounting Oversight Board (United States).PCAOB. Those standards require that we plan and perform the audit to obtain reasonable assurance about whether effective internal control over financial reporting was maintained in all material respects. Our audit of internal control over financial reporting included obtaining an understanding of internal control over financial reporting, assessing the risk that a material weakness exists, and testing and evaluating the design and operating effectiveness of internal control based on the assessed risk. Our audit also included performing such other procedures as we considered necessary in the circumstances. We believe that our audit provides a reasonable basis for our opinion.
Definition and Limitations of Internal Control Over Financial Reporting
A company’s internal control over financial reporting is a process designed to provide reasonable assurance regarding the reliability of financial reporting and the preparation of financial statements for external purposes in accordance with generally accepted accounting principles. A company’s internal control over financial reporting includes those policies and procedures that (1) pertain to the maintenance of records that, in reasonable detail, accurately and fairly reflect the transactions and dispositions of the assets of the company; (2) provide reasonable assurance that transactions are recorded as necessary to permit preparation of financial statements in accordance with generally accepted accounting principles, and that receipts and expenditures of the company are being made only in accordance with authorizations of management and directors of the company; and (3) provide reasonable assurance regarding prevention or timely detection of unauthorized acquisition, use, or disposition of the company’s assets that could have a material effect on the financial statements.
Because of its inherent limitations, internal control over financial reporting may not prevent or detect misstatements. Also, projections of any evaluation of effectiveness to future periods are subject to the risk that controls may become inadequate because of changes in conditions, or that the degree of compliance with the policies or procedures may deteriorate.
In our opinion, Foot Locker, Inc. maintained, in all material respects, effective internal control over financial reporting as of January 31, 2015, based on the criteria established inInternal Control — Integrated Framework (2013) issued by the Committee of Sponsoring Organizations of the Treadway Commission.
We also have audited, in accordance with the standards of the Public Company Accounting Oversight Board (United States), the consolidated balance sheets of Foot Locker, Inc. and subsidiaries as of January 31, 2015 and February 1, 2014, and the related consolidated statements of operations, comprehensive income, shareholders’ equity, and cash flows for each of the years in the three-year period ended January 31, 2015, and our report dated March 30, 2015, expressed an unqualified opinion on these consolidated financial statements.
/s/ KPMG LLP
New York, New York
March 30, 201529, 2018
75
None.
PART III
Item 10. Directors, Executive Officers and Corporate Governance
(a) | Directors of the Company |
Information relative to directors of the Company is set forth under the section captioned “Proposal 1-Election
Information relative to directors of the Company will be set forth under the section captioned “Proposal 1: Election of Directors” in the Proxy Statement and is incorporated herein by reference.
(b) | Executive Officers of the Company | ||
Information with respect to executive officers of the Company is set forth immediately following Item 4
Information with respect to executive officers of the Company will be set forth in Item 4A in Part I.
(c) | Information with respect to compliance with Section 16(a) of the Securities Exchange Act of 1934 | ||
(d) | Information on our audit committee and the audit committee financial expert | ||
(e) | Information about the Code of Business Conduct governing our employees, including our Chief Executive Officer, Chief Financial Officer, Chief Accounting Officer, and the Board of Directors, | ||
Item 11. Executive Compensation
Information set forth in the Proxy Statement beginning with the section captioned “Directors“Directors’ Compensation and Benefits” through and including the section captioned “Pension Benefits” is incorporated herein by reference, and information set forth in the Proxy Statement under the heading “Compensation and Management Resources Committee Interlocks and Insider Participation” is incorporated herein by reference.
Item 12. Security Ownership of Certain Beneficial Owners and Management and Related Stockholder Matters
Information set forth in the Proxy Statement under the sections captioned “Equity Compensation Plan Information” and “Beneficial Ownership of the Company’s Stock” is incorporated herein by reference.
Item 13. Certain Relationships and Related Transactions, and Director Independence
Information set forth in the Proxy Statement under the section captioned “Related Person Transactions” and under the section captioned “Directors’ Independence” is incorporated herein by reference.
Item 14. Principal Accounting Fees and Services
Information about the principal accounting fees and services is set forth under the section captioned “Audit“Proposal 3: Ratification of the Appointment of Independent Registered Public Accounting Firm — Audit and Non-Audit Fees” in the Proxy Statement and is incorporated herein by reference. Information about the Audit Committee’s pre-approval policies and procedures is set forth in the section captioned “Audit“Proposal 3: Ratification of the Appointment of Independent Registered Public Accounting Firm — Audit Committee Pre-Approval Policies and Procedures” in the Proxy Statement and is incorporated herein by reference.
PART IV
Item 15. Exhibits and Financial Statement Schedules
(a)(1) and (2) Financial Statements
The list of financial statements required by this item is set forth in Item 8. “Consolidated Financial Statements and Supplementary Data.” All other schedules specified under Regulation S-X have been omitted because they are not applicable, because they are not required, or because the information required is included in the financial statements or notes thereto.
(a)(3) and (c) Exhibits
An index of the exhibits which are required by this item and which are included or incorporated herein by reference in this report appears on pages 7779 through 79.81.
77
TABLE OF CONTENTSSIGNATURES
SIGNATURES
Pursuant to the requirements of Section 13 or 15(d) of the Securities Exchange Act of 1934, the Company has duly caused this report to be signed on its behalf by the undersigned, thereunto duly authorized.
FOOT LOCKER, INC. | |||||
By: | | ||||
Richard A. Johnson Chairman of the Board, President and Chief Executive Officer | |||||
Date: March | |||||
Pursuant to the requirements of the Securities Exchange Act of 1934, this report has been signed below on March 30, 2015,29, 2018, by the following persons on behalf of the Company and in the capacities indicated.
/s/ RICHARD A. JOHNSON | /s/ LAUREN B. PETERS | |
Richard A. Johnson | Lauren B. Peters | |
Chairman of the Board, President and | Executive Vice President and | |
Chief Executive Officer | Chief Financial Officer | |
/s/ GIOVANNA CIPRIANO | /s/ STEVEN OAKLAND | |
Giovanna Cipriano | Steven Oakland | |
Senior Vice President and Chief Accounting Officer | Director | |
/s/ MAXINE CLARK | /s/ ULICE PAYNE, JR. | |
Maxine Clark | Ulice Payne, Jr. | |
Director | Director | |
/s/ ALAN D. FELDMAN | /s/ CHERYL NIDO TURPIN | |
Alan D. Feldman | Cheryl Nido Turpin | |
Director | Director | |
/s/ JAROBIN GILBERT, JR | /s/ KIMBERLY K. UNDERHILL | |
Jarobin Gilbert, Jr. | Kimberly K. Underhill | |
Director | Director | |
/s/ GUILLERMO G. MARMOL | /s/ DONA D. YOUNG | |
Guillermo G. Marmol | Dona D. Young | |
Director | Lead Director | |
/s/ MATTHEW M. MCKENNA | ||
Matthew M. McKenna | ||
Director | | |
| | |
| ||
FOOT LOCKER, INC.
INDEX OF EXHIBITS
Exhibit No. | Description | |
3(i)(a) | Certificate of Incorporation of the Registrant, as filed by the Department of State of the State of New York on April 7, 1989 (incorporated herein by reference to Exhibit 3(i)(a) to the Quarterly Report on Form 10-Q for the quarterly period ended July 26, 1997 filed on September 4, 1997 (the “July 26, 1997 Form 10-Q”)). | |
3(i)(b) | Certificates of Amendment of the Certificate of Incorporation of the Registrant, as filed by the Department of State of the State of New York on (a) July 20, 1989, (b) July 24, 1990, (c) July 9, 1997 (incorporated herein by reference to Exhibit 3(i)(b) to the July 26, 1997 Form 10-Q), (d) June 11, 1998 (incorporated herein by reference to Exhibit 4.2(a) to the Registration Statement on Form S-8 (Registration No. 333-62425) (the “1998 Form S-8”)), (e) November 1, 2001 (incorporated herein by reference to Exhibit 4.2 to the Registration Statement on Form S-8 (Registration No. 333-74688) (the “2001 Form S-8”)), and (f) May 28, 2014 (incorporated herein by reference to Exhibit 3.1 to the Current Report on Form 8-K dated May 21, 2014 filed on May 28, 2014). | |
3(ii) | ||
4.1 | The rights of holders of the Registrant’s equity securities are defined in the Registrant’s Certificate of Incorporation, as amended (incorporated herein by reference to (a) Exhibits 3(i)(a) and 3(i)(b) to the July 26, 1997 Form 10-Q, Exhibit 4.2(a) to the 1998 Form S-8, and Exhibit 4.2 to the 2001 Form | |
4.2 | Indenture, dated as of October 10, 1991 (incorporated herein by reference to Exhibit 4.1 to the Registration Statement on Form S-3 (Registration No. 33-43334)). | |
4.3 | Form of 8-1/2% Debentures due 2022 (incorporated herein by reference to Exhibit 4 to the Current Report on Form 8-K dated January 16, 1992). | |
10.1 | ||
10.2† | ||
10.3† | ||
10.4† | ||
10.5† | ||
10.6† | Executive Supplemental Retirement Plan (incorporated herein by reference to Exhibit 10(d) to the Registration Statement on Form 8-B filed on August 7, 1989 (Registration No. 1-10299) (the “8-B Registration Statement”)). | |
10.7† | Amendment to the Executive Supplemental Retirement Plan (incorporated herein by reference to Exhibit 10(c)(i) to the | |
10.8† | Amendment to the Executive Supplemental Retirement Plan (incorporated herein by reference to Exhibit 10(d)(ii) to the Annual Report on Form 10-K for the fiscal year ended January 27, 1996 filed on April 26, 1996). | |
10.9† | ||
10.10† |
79
Exhibit No. | Description | |
10.11† |
10.12† | ||
Foot Locker Directors’ Retirement Plan, as amended | ||
10.13† | Amendments to the Foot Locker Directors’ Retirement Plan (incorporated herein by reference to Exhibit 10(c) to the Quarterly Report on Form | |
10.14† | ||
10.15† | ||
10.16† | ||
10.17† | ||
10.18† | ||
10.19† | ||
10.20† | ||
10.21† | ||
10.22† | ||
10.23† | ||
10.24† | ||
10.25† | ||
10.26 | Form of indemnification agreement, as amended (incorporated herein by reference to Exhibit 10(g) to the 8-B Registration Statement). | |
10.27 | ||
10.28 | Trust Agreement dated as of November 12, 1987 (“Trust Agreement”), between F.W. Woolworth Co. and The Bank of New York, as amended and assumed by the Registrant (incorporated herein by reference to Exhibit 10(j) to the 8-B Registration Statement). | |
10.29 | ||
10.30† | ||
10.31† | ||
80
Exhibit No. | Description | |
10.32† | ||
12* | ||
21* | ||
23* | ||
31.1* | ||
31.2* | ||
32** | ||
101.INS* | XBRL Instance Document. | |
101.SCH* | XBRL Taxonomy Extension Schema. | |
101.CAL* | XBRL Taxonomy Extension Calculation Linkbase. | |
101.DEF* | XBRL Taxonomy Extension Definition Linkbase. | |
101.LAB* | XBRL Taxonomy Extension Label Linkbase. | |
101.PRE* | XBRL Taxonomy Extension Presentation Linkbase. |
†Management contract or compensatory plan or arrangement.
*Filed herewith.
**Furnished herewith
81
79