UNITED STATES
SECURITIES AND EXCHANGE COMMISSION
Washington, D.C. 20549
FORM 10-K
ANNUAL REPORT PURSUANT TO SECTION 13 OR 15(d) OF THE SECURITIES EXCHANGE ACT OF 1934
For the fiscal year ended December 31, 20152016
Commission file number: 001-13337
STONERIDGE, INC.
(Exact name of registrant as specified in its charter)
| Ohio | 34-1598949 | ||||
| (State or other jurisdiction of | (I.R.S. Employer | ||||
| incorporation or organization) | Identification No.) |
| 39675 MacKenzie Drive Suite 400, Novi, Michigan | 48377 | ||||
| (Address of principal executive offices) | (Zip Code) |
| Registrant’s telephone number, including area code |
Securities registered pursuant to Section 12(b) of the Act:
| Title of each class | Name of each exchange on which registered | |
| Common Shares, without par value | New York Stock Exchange |
Securities registered pursuant to section 12(g) of the Act:None
Indicate by check mark if the registrant is a well-known seasoned issuer, as defined in Rule 405 of the Securities Act.
o¨ Yesx No
Indicate by check mark if the registrant is not required to file reports pursuant to Section 13 or Section 15(d) of the Act.
o¨ Yesx No
Indicate by check mark whether the registrant (1) has filed all reports required to be filed by Section 13 or 15(d) of the Securities Exchange Act of 1934 during the preceding 12 months (or for such shorter period that the registrant was required to file such reports), and (2) has been subject to such filing requirements for the past 90 days.
x Yeso¨ No
Indicate by check mark whether the registrant has submitted electronically and posted on its corporate Website, if any, every Interactive Data File required to be submitted and posted pursuant to Rule 405 of Regulation S-T (§(§ 232.405 of this chapter) during the preceding 12 months (or for such shorter period that the registrant was required to submit and post such files).
x Yeso¨ No
Indicate by check mark if disclosure of delinquent filers pursuant to Item 405 of Regulation S-K (§(§ 229.405 of this chapter) is not contained herein, and will not be contained, to the best of registrant’s knowledge, in definitive proxy or information statements incorporated by reference in Part III of this Form 10-K or any amendment to this Form 10-K.o
¨
Indicate by check mark whether the registrant is a large accelerated filer, an accelerated filer, a non-accelerated filer, or a smaller reporting company. See definition of “large accelerated filer,” “accelerated filer,” and “smaller reporting company” in Rule 12b-2 of the Exchange Act. (Check one):
| Large accelerated filer | Accelerated filerx | Non-accelerated filer | Smaller reporting company |
| (Do not check if a smaller reporting company) | |||
Indicate by check mark whether the registrant is a shell company (as defined in Rule 12b-2 of the Act).
¨ Yesx No
As of June 30, 2015,2016, the aggregate market value of the registrant’s Common Shares held by non-affiliates of the registrant was approximately $310.1$395.7 million. The closing price of the Common Shares on June 30, 20152016 as reported on the New York Stock Exchange was $11.71$14.94 per share. As of June 30, 2015,2016, the number of Common Shares outstanding was 27,913,194.27,842,883.
The number of Common Shares outstanding as of February 29, 201624, 2017 was 27,786,978.27,870,944.
DOCUMENTS INCORPORATED BY REFERENCE
Definitive Proxy Statement for the Annual Meeting of Shareholders to be held on May 10, 2016,9, 2017, into Part III, Items 10, 11, 12, 13 and 14.
INDEX
i
Forward-Looking Statements
Portions of this report on Form 10-K contain “forward-looking statements” under the Private Securities Litigation Reform Act of 1995. These statements appear in a number of places in this report and may include statements regarding the intent, belief or current expectations of the Company, with respect to, among other things, our (i) future product and facility expansion, (ii) acquisition strategy, (iii) investments and new product development, (iv) growth opportunities related to awarded business and (v) operationoperational expectations. Forward-looking statements may be identified by the words “will,” “may,” “should,” “designed to,” “believes,” “plans,” “projects,” “intends,” “expects,” “estimates,” “anticipates,” “continue,” and similar words and expressions. The forward-looking statements are subject to risks and uncertainties that could cause actual events or results to differ materially from those expressed in or implied by the statements. Important factors that could cause actual results to differ materially from those in the forward-looking statements include, among other factors:
| · | the reduced purchases, loss or bankruptcy of a major customer; |
| · | the costs and timing of facility closures, business realignment, or similar actions; |
| · | a significant change in automotive, commercial, motorcycle, off-highway or agricultural vehicle production; |
| · | competitive market conditions and resulting effects on sales and pricing; |
| · | the impact on changes in foreign currency exchange rates on sales, costs and results, particularly the Brazilian real, euro, Argentinian peso, Mexican peso and Swedish krona; |
| · | our ability to achieve cost reductions that offset or exceed customer-mandated selling price reductions; |
| · | a significant change in general economic conditions in any of the various countries in which we operate; |
| · | labor disruptions at our facilities or at any of our significant customers or suppliers; |
| · | the ability of our suppliers to supply us with parts and components at competitive prices on a timely basis; |
| · | the amount of our indebtedness and the restrictive covenants contained in the agreements governing our indebtedness, including our revolving credit facility; |
| · | customer acceptance of new products; |
| · | capital availability or costs, including changes in interest rates or market perceptions; |
| · | the failure to achieve the successful integration of any acquired company or business; and |
| · | the items described in Part I, Item IA (“Risk Factors”). |
In addition, the forward-looking statements contained herein represent our estimates only as of the date of this filing and should not be relied upon as representing our estimates as of any subsequent date. While we may elect to update these forward-looking statements at some point in the future, we specifically disclaim any obligation to do so, whether to reflect actual results, changes in assumptions, changes in other factors affecting such forward-looking statements or otherwise.
ii
Overview
Founded in 1965, Stoneridge, Inc. (the “Company”) is a global designer and manufacturer of highly engineered electrical and electronic components, modules and systems for the automotive, commercial, motorcycle, off-highway and agricultural vehicle markets. Our products and systems are critical elements in the management of mechanical and electrical systems to improve overall vehicle performance, convenience and monitoring in areas such as emissions control, fuel efficiency, safety, security and infotainment. Our extensive footprint encompasses 2725 locations in 12 countries and enables us to supply global and regional automotive, commercial, motorcycle, off-highway and agricultural vehicle manufacturers around the world.markets.
Our custom-engineered products and systems are used to activate equipment and accessories, monitor and display vehicle performance and control, distribute electrical power and signals and provide vehicle security and convenience. Our product offerings consist of (i) sensors, (ii) application-specific actuators, switches and valves (iii) vehicle and driver information systems, (iv) vehicle management electronics, (v) power and switch distribution modules and telematics, (vi) security alarms and vehicle tracking devices and monitoring services and (vii) convenience accessories. We supply the majority of our products, predominantly on a sole-source basis, to many of the world’s leading commercial vehicle and automotive original equipment manufacturers (“OEMs”), agricultural manufacturers and select non-vehicle OEMs, as well as certain commercial vehicle and automotive tier one suppliers. Our customers are increasingly utilizing electronic technology to comply with more stringent regulations (particularly emissions and safety) and to meet end-user demand for improved vehicle performance and greater convenience. As a result, per-vehicle electronic content has been increasing. Our technology and our partnership-oriented approach to product design and development enables us to develop next-generation products.
Segments and Products
We conduct our business in three reportable business segments which are the same as our operating segments: Control Devices, Electronics and PST.
Control Devices.Our Control Devices segment designs and manufactures products that monitor, measure or activate specific functions within a vehicle. This segment includes product lines such as sensors, switches, valves and actuators. Sensor products are employed in major vehicle systems such as the emissions, safety, powertrain, braking, climate control, steering and suspension systems. Switches transmit signals that activate specific functions. Our switch technology is principally used in two capacities, user-activated and hidden. User-activated switches are used by a vehicle’s operator or passengers to manually activate, rear defrosters and other accessories. Hidden switches are not typically visible to vehicle operators or passengers and are engaged to activate or deactivate selected functions as part of normal vehicle operations, such as brake lights. In addition, our Control Devices segment designs and manufactures actuator products that enable OEMs to deploy power functions in a vehicle and can be designed to integrate switching and control functions including our shift by wire product. We sell these products principally to the automotive market as well asmarket. To a lesser exent, we sell these products to the commercial vehicle and agricultural markets.
Electronics.Our Electronics segment designs and manufactures electronic instrument clusters, electronic control units and driver information systems. These products collect, store and display vehicle information such as speed, pressure, maintenance data, trip information, operator performance, temperature, distance traveled and driver messages related to vehicle performance. In addition, power distribution modules and systems regulate, coordinate, monitor and direct the operation of the electrical system within a vehicle. These products use state-of-the-art hardware, software and multiplexing technology and are sold principally to the commercial vehicle market.market or through both the OEM and aftermarket channels.
PST.OurPST segment, in which we have a 74% controlling interest, primarily serves the South American market and specializes in the design, manufacture and sale of in-vehicle audio and video devices, electronic vehicle security alarms, convenience accessories, vehicle tracking devices and monitoring services primarily for the automotive and motorcycle markets. This segment includes product lines such as alarms, convenience applications, vehicle monitoring and tracking devices and infotainment systems. These products improve the performance, safety and convenience features of our customers’ vehicles. PST sells its products through the aftermarket distribution channel, to factory authorized dealer installers, also referred to as original equipment services, direct to OEMs and through mass merchandisers.
The following table sets forth for the periods indicated, the percentage of net sales attributable to our reportable segments and product categories of each for the years ended December 31:
| Segment | Product Category | 2015 | 2014 | 2013 | ||||||||||
| Control Devices | Sensors, switches, valves and actuators | 52 | % | 47 | % | 44 | % | |||||||
| Electronics | Electronic instrument clusters, electronic control units and driver information systems | 33 | % | 32 | % | 29 | % | |||||||
| PST | Security alarms, vehicle tracking devices and monitoring services and convenience accessories | 15 | % | 21 | % | 27 | % | |||||||
| 1 |
| Segment | Product Category | 2016 | 2015 | 2014 | ||||||||||
| Control Devices | Sensors, switches, valves and actuators | 59 | % | 52 | % | 47 | % | |||||||
| Electronics | Electronic instrument clusters, electronic control units and driver information systems | 29 | 33 | 32 | ||||||||||
| PST | Security alarms, vehicle tracking devices and monitoring services and convenience accessories | 12 | 15 | 21 | ||||||||||
Our products and systems are sold to numerous OEM and tier one supplier customers, as well as aftermarket distributors and mass merchandisers, for use on many different vehicle platforms. We supply multiple parts to many of our principal OEM and tier one customers under requirements contracts for a particular vehicle model. These contracts range in duration from one year to the production life of the model, which commonly extends for three to seven years.
The following table sets forth for the periods indicated, the percentage of net sales derived from our principal end markets for the years ended December 31:
| Principal End Markets | 2015 | 2014 | 2013 | 2016 | 2015 | 2014 | ||||||||||||||||||
| Automotive | 42 | % | 37 | % | 35 | % | 50 | % | 42 | % | 37 | % | ||||||||||||
| Commercial vehicle | 37 | 36 | 33 | 33 | 37 | 36 | ||||||||||||||||||
| Aftermarket distributors and mass merchandisers | 15 | 21 | 27 | 12 | 15 | 21 | ||||||||||||||||||
| Agricultural and other | 6 | 6 | 5 | 5 | 6 | 6 | ||||||||||||||||||
For further information related to our reportable segments and financial information about geographic areas, see Note 1213 to the consolidated financial statements.
Sale of Wiring Business
We sold substantially all of the assets and liabilities of our Wiring business on August 1, 2014. As a result, the Wiring business has been classified as discontinued operations for all periods presented in the Company’s financial statements, herein, and therefore has been excluded from continuing operations, segment results and other information herein for all periods presented. The Wiring business designed and manufactured wiring harness products and assembled instruments panels for sale principally to the commercial, agricultural and off-highway vehicle markets.
Production Materials
The principal production materials used in the Company’s manufacturing process for our reportable segments include:are molded plastic components and resins, copper, precious metals and certain electrical components such as printed circuit boards, semiconductors, microprocessors, memory devices, resistors, capacitors, fuses, relays and infotainment devices. We purchase suchproduction materials pursuant to both annual contract and spot purchasing methods. Such materials are available from multiple sources, but we generally establish collaborative relationships with a qualified supplier for each of our key production materials in order to lower costs and enhance service and quality. As global demand for our production materials increases, we may have difficulties obtaining adequate production materials from our suppliers to satisfy our customers. Any extended period of time for which we cannot obtain adequate production material or which we experience an increase in the price of production material couldwould materially affect our results of operations and financial condition.
| 2 |
Patents, Trademarks and Intellectual Property
We maintain and have pending various U.S. and foreign patents, trademarks and other rights to intellectual property relating to the reportable segments of our business, which we believe are appropriate to protect the Company's interests in existing products, new inventions, manufacturing processes and product developments. We do not believe any single patent is material to our business, nor would the expiration or invalidity of any patent have a material adverse effect on our business or ability to compete. We are not currently engaged in litigation related to material infringement claims other than one matter related to our Electronics segment which we believe is without merit. See additional details of the alleged patent infringement in Note 10 to the consolidated financial statements.
Industry Cyclicality and Seasonality
The markets for products in each of our reportable segments have been cyclical. Because these products are used principally in the production of vehicles for the automotive, commercial, motorcycle, off-highway and agricultural vehicle markets, revenues and therefore results of operations, are significantly dependent on the general state of the economy and other factors, like the impact of environmental regulations on our customers, which affect these markets. A significant decline in automotive, commercial, motorcycle, off-highway and agricultural vehicle production of our principal customers could adversely impact the Company. Also, our PST business is significantly dependent on the overall state of the Brazilian economy. Our Electronics and Control Devices segments are typically not affected by seasonality, however the demand for our PST segment consumer products is typically higher in the second half of the year, the fourth quarter in particular.
Customers
We have several customers which account for a significant percentage of our sales. The loss of any significant portion of our sales to these customers, or the loss of a significant customer, would have a material adverse impact on our financial condition and results of operations. We supply numerous different products to each of our principal customers. Contracts with several of our customers provide for supplying their requirements for a particular model, rather than for manufacturing a specific quantity of products. Such contracts range from one year to the life of the model, which is generally three to seven years. These contracts are subject to potential renegotiation from time to time, which may affect product pricing and generally may be terminated by our customers at any time. Therefore, the loss of a contract for a major model or a significant decrease in demand for certain key models or group of related models sold by any of our major customers couldwould have a material adverse impact on the Company. We may also enter into contracts to supply parts,products, the introduction of which may then be delayed or cancelled. We also compete to supply products for successor models, and are therefore subject to the risk that the customer will not select the Company to produce products on any such model, which could have a material adverse impact on our financial condition and results of operations. In addition, we sell products to other customers that are ultimately sold to our principal customers.
Because ofDue to the competitive nature of the markets we serve, we face pricing pressures from our customers in the ordinary course of business. In response to these pricing pressures we have been able to effectively manage our production costs by the combination of lowering certain costs and limiting the increase of others, the net impact of which has not been material. However, if we are unable to effectively manage production costs in the future to mitigate future pricing pressures, our results of operations would be adversely affected.
The following table presents our principal customers, as a percentage of net sales:
| Years ended December 31 | 2015 | 2014 | 2013 | 2016 | 2015 | 2014 | ||||||||||||||||||
| Ford Motor Company | 14 | % | 11 | % | 10 | % | 17 | % | 14 | % | 11 | % | ||||||||||||
| General Motors Company | 7 | 5 | 5 | |||||||||||||||||||||
| Scania Group | 7 | 8 | 8 | 6 | 7 | 8 | ||||||||||||||||||
| Daimler | 6 | 6 | 6 | 6 | 6 | 6 | ||||||||||||||||||
| Volvo | 6 | 5 | 4 | 6 | 6 | 5 | ||||||||||||||||||
| General Motors Company | 5 | 5 | 6 | |||||||||||||||||||||
| Other | 62 | 65 | 66 | 58 | 62 | 65 | ||||||||||||||||||
| 3 |
Backlog
Our productsA substantial amount of the new business we are produced from readily available materialsawarded by OEMs is granted well in advance of a program launch. These awards typically extend through the life of the given program. This backlog of new business does not represent firm orders, but instead estimated remaining projected volume under these programs over the following five years. Production scheduling and have adelivery for these orders could be changed or canceled by the customer on relatively short manufacturing cycle; therefore our products are not on backlog status. Each of our production facilities maintains its own inventoriesnotice. Backlog was $3.0 billion and production schedules. Production capacity is adequate to handle current requirements$2.7 billion at December 31, 2016 and can be expanded to handle increased growth if needed.2015, respectively.
Competition
The markets for our products in our reportable segments are highly competitive. We compete based on technological innovation, price, quality, performance, service and delivery. We compete for new business both at the beginning of the development of new models and upon the redesign of existing models for OEM customers. New model development generally begins two to five years before the marketing of such models to the public. Once a supplier has been selected to provide parts for a new program, an OEM customer will usually continue to purchase those parts from the selected supplier for the life of the program, although not necessarily for any model redesigns. We compete for aftermarket and mass merchandiser sales based on price, product functionality, quality and service.
Our diversity in products creates a wide range of competitors, which vary depending on both market and geographic location. We compete based on strong customer relations and a fast and flexible organization that develops technically effective solutions at or below target price. We compete against the following primary competitors:companies:
Control Devices.Our primary competitors include Bosch, Continental AG, Delphi Automotive PLC, Denso Corporation, Electricfil, Hella KGaA Hueck & Co., Methode Electronics, Inc., NTK Technologies, Inc., TE Connectivity Ltd. and Sensata.
Electronics.Our primary competitors include Actia Group, Bosch, Continental AG, Delphi Automotive PLC, Dongfeng Electronics Technology Co., Ltd., Hella KGaA Hueck & Co., Magneti Marelli S.p.A. and Yazaki Corporation.
PST.Our primary competitors include Ceabs, Cerruns,Autotrac, Clarion, Continental AG, Delphi Automotive PLC, FKS, Ituran, JVC/Kenwood Corporation,Kostal and Hinor, Lennox, M. Magneti Marelli S.p.A., Maxtrack, MultiLaser, Quantum, Olimpus,Olympus, Pioneer Corporation, MichelinQuantum, Sascar, Suntech, Taramps and Sascar.Tury.
Product Development
Our research and development efforts for our reportable segments are largely product design and development oriented and consist primarily of applying known technologies to customer requests. We work closely with our customers to solve customer requests using innovative approaches. The majority of our development expenses are related to customer-sponsored programs where we are involved in designing custom-engineered solutions for specific applications or for next generation technology. To further our vehicle platform penetration, we have also developed collaborative relationships with the design and engineering departments of key customers. These collaborative efforts have resulted in the development of new and complimentary products and the enhancement of existing products.
While our engineering and product development departments are organized by market, our segments interact and collaborate on new products. The product development operations are complimented by technology groups in Canton, Massachusetts; Lexington, Ohio; Stockholm, Sweden; Pune, India; Manaus, Brazil; São Paulo, Brazil; and Shanghai, China.
We use efficient and quality oriented work processes to address our customers’ high standards. Our product development technical resources include a full complement of computer-aided design and engineering (“CAD/CAE”) software systems, including (i) virtual three-dimensional modeling, (ii) functional simulation and analysis capabilities and (iii) data links for rapid prototyping. These systems enable us to expedite product design and the manufacturing process to shorten the development time and ultimately time to market.
| 4 |
We have further strengthened our electrical engineering competencies through investment in equipment such as (i) automotive electro-magnetic compliance test chambers, (ii) programmable automotive and commercial vehicle transient generators, (iii) circuit simulators and (iv) other environmental test equipment. Additional investment in 3-D printing product machining equipment has allowed us to fabricate new product samples in a fraction of the time required historically. Our product development and validation efforts are supported by full service, on-site test labs at most manufacturing facilities, thus enabling cross-functional engineering teams to optimize the product, process and system performance before tooling initiation.
We have invested, and will continue to invest heavily in technology to develop new products for our customers. Product development costs incurred in connection with the development of new products and manufacturing methods, to the extent not recoverable from the customer, are expensed as incurred. Such costs amounted to approximately $40.2 million, $38.8 million and $41.6 million for 2016, 2015 and $40.4 million for 2015, 2014, and 2013, respectively, or 6.0%5.8%, 6.3%6.0% and 6.1%6.3% of net sales for these periods.
We will continue to prioritize investment spending toward the design and development of new products over sustaining existing product programs for specific customers, which allows us to sell our products to multiple customers. The typical product development process takes three to five years to show tangible results. As part of our effort to evaluate our investment spending, we review our current product portfolio and adjust our spending to either accelerate or eliminate our investment in these products based on our position in the market and the potential of the market and product.
Environmental and Other Regulations
Our operations are subject to various federal, state, local and foreign laws and regulations governing, among other things, emissions to air, discharge to water and the generation, handling, storage, transportation, treatment and disposal of waste and other materials. We believe that our business, operations and facilities have been and are being operated in compliance, in all material respects, with applicable environmental and health and safety laws and regulations, many of which provide for substantial fines and criminal sanctions for violations.
Employees
As of December 31, 2015,2016, we had approximately 4,1004,200 employees, approximately 62%69% of whom were located outside the United States. Although we have no collective bargaining agreements covering U.S. employees, a significant number of employees located in Brazil, Estonia, Mexico, Sweden, and the United Kingdom either (i) are represented by a union and are covered by a collective bargaining agreement, or (ii) are covered by works council or other employment arrangements required by law. We believe that relations with our employees are good.
Equity Investments and Joint Ventures
We make equity investments and form joint ventures in various global markets in order to achieve several strategic objectives including (i) diversifying our business by expanding in high-growth regions, (ii) employing complementary design processes, growth technologies and intellectual capital, and (iii) realizing cost savings from combined sourcing.
We have a 49% noncontrolling equity interest in India, Minda Stoneridge Instruments Ltd. (“Minda”) for the years ending December 31, 2016, 2015, 2014 and 2013.2014. Based in India, Minda manufactures electromechanical/electronic instrumentation equipment and sensors primarily for the automotive, motorcycle and commercial vehicle markets. We leverage our investment in Minda by sharing our knowledge and expertise in electrical components and systems and expanding Minda’s product offering through the joint development of our products designed for the market in India.
We also have a 74% controlling interest in PST Eletrônica Ltda. (“PST”), which is a consolidated subsidiary, for the years ending December 31, 2015, 2014 and 2013. PST was previously a joint venture in Brazil. We made our initial investment in PST in October 1997 acquiring a 50% interest and subsequently acquired an additional 24% interest on December 31, 2011. Prior to the acquisition of the additional interest on December 31, 2011 , PST was accounted for using the equity method of accounting.
| 5 |
Executive Officers of the Company
Each executive officer of the Company serves the Board of Directors at its pleasure. The Board of Directors appoints corporate officers annually. The following table sets forth the names, ages, and positions of the executive officers for reporting purposes under the Securities and Exchange Act of 1934, as amended, of the Company are as follows:Company:
| Name | Age | Position | ||
| Jonathan B. DeGaynor | President, Chief Executive Officer and Director | |||
| 69 | Executive Vice President | |||
| Anthony L. Moore | 53 | Vice President of Operations | ||
| Thomas A. Beaver | Vice President of the Company and President of Global Sales | |||
| Michael D. Sloan | Vice President of the Company and President of the Control Devices Division | |||
| Peter Kruk | 48 | President of the Electronics Division | ||
| Sergio de Cerqueira Leite | 53 | Director President of PST Eletrônica Ltda. | ||
| Alisa A. Nagle | 49 | Chief Human Resources Officer | ||
| Robert J. Hartman Jr. | 50 | Chief Accounting Officer |
Jonathan B. DeGaynor, President, Chief Executive Officer and Director.Mr. DeGaynor was appointed as President and Chief Executive Officer in March 2015. He has served as a director since May 2015. Prior to joining Stoneridge, Mr. DeGaynor served as the Vice President ofStrategic Planning and Innovation of Guardian Industries Corp., (“Guardian”), from October 2014 until March 2015. Mr. DeGaynor served as Vice President ofBusiness Development, Managing Director Asia for SRG Global, Inc., a Guardian company from 2008 through September 2014. Mr. DeGaynor served as Chief Operating Officer, International for Autocam Corporation from 2005 to 2008. Prior to that, Mr. DeGaynor held positions of increasing responsibility with Delphi Corporation from 1993 to 2005.
Robert R. Krakowiak, Chief Financial Officer and Treasurer.Mr.Krakowiak was appointed as Chief Financial Officer and Treasurer in August 2016. Prior to joining Stoneridge, Mr. Krakowiak, served as Vice President, Treasurer and Investor Relations at Visteon Corporation from 2012 until August 2016. Prior to that, Mr. Krakowiak held the following positions at Owens Corning: from 2009 until 2012, Vice President of Finance (Composite Solutions Business); from 2008 until 2009, Vice President–Corporate Financial Planning and Analysis; from 2006 until 2008, Vice President and Controller (Roofing and Asphalt); and from 2005 until 2006, Assistant Treasurer.
George E. Strickler, Executive Vice President,President.In August 2016, Mr. Strickler relinquished his position of Chief Financial Officer and Treasurer.Treasurer but remained Executive Vice President supporting the Company’s growth initiatives. Mr. Strickler has served as Executive Vice President and Chief Financial Officer since joining the Company infrom January 2006.2006 to August 2016. Mr. Strickler was appointed Treasurer of the Company in February 2007. Prior to his employment with the Company, Mr. Strickler served as Executive Vice President and Chief Financial Officer for Republic Engineered Products, Inc. (“Republic”), from February 2004 to January 2006. Mr. Strickler also currently serves as a director, Board member and Chairman of the Nominating and Governance CommitteesBoard of TCP International Holdings Ltd., a manufacturer and distributor of energy efficient lighting technologies.
Richard P. Adante,Anthony L. Moore, Vice President of Operations.Mr. Adante has servedMoore was appointed as Vice President of Operations sincein May 2011. From November 2009 until his appointment at2016. Prior to joining Stoneridge, Mr. Adante was consulting through his personal consulting firm, RMA Management Consultants. From July 2006 to November 2009, Mr. Adantehe served as theGlobal Vice President of Hawthorn Manufacturing, now knownIntegrated Supply Chain and Operations at Ingersoll Rand, Compressed Air Systems from October 2015. Prior to that, Mr. Moore served as Crowne Group.Chief Product Development and Supply Chain Officer at Remington Outdoor Company from May 2012 to September 2015. Before that, Mr. Moore was employed at Cooper Industries, Inc. where he held several leadership positions in the areas of supply chain, operations, and engineering from 2008.
Thomas A. Beaver, Vice President of the Company and President of Global Sales.Mr. Beaver has served as Vice President of the Company and President of Global Sales since May 2012. Prior to that,Mr. Beaverserved as Vice President of the Company and Vice President of Global Sales and Systems Engineering from January 2005 to May 2012. From January 2000 to January 2005, Mr. Beaver served as Vice President of Stoneridge Sales and Marketing.
Sergio de Cerqueira Leite, DirectorMichael D. Sloan, Vice President of PST Eletrônica Ltda.the Company and President of the Control Devices Division. Mr. Leite is a founding partnerSloan has served as President of PST. He has held the DirectorControl Devices Division since July 2009 and Vice President positionof the Company since 1997.December 2009. Prior to that, Mr. Sloan served as Vice President and General Manager of Stoneridge Hi-Stat from February 2004 to July 2009.
| 6 |
Peter Kruk, President of the Electronics Division.Mr. Kruk has served as President of the Electronics Division since August 2012. Mr. Kruk joined the Company in October 2009 as the Managing Director of Stoneridge Electronics – Europe. Prior to that, he served as President of HEXPOL Wheels and Managing Director of Stellana AB from 2007 to 2009.
Sergio de Cerqueira Leite, Director President of PST Eletrônica Ltda.Mr. Leite is a founding partner of PST. He has held the Director President position since 1997.
Alisa A. Nagle, Chief Human Resources Officer.Ms. Nagle has served as Chief Human Resources Officer since joining the Company in November 2015. From 2007 until her employment with the Company, Ms. Nagle served as Vice President of Human Resources – Global Aftermarket and Original Equipment Groups and Global Central Functions at Johnson Controls, Inc.
Michael D. Sloan, Vice PresidentRobert J Hartman Jr., Chief Accounting Officer. Mr. Hartman was appointed as Chief Accounting Officer and to the role of the Company and President of the Control Devices Division.principal accounting officer in July 2016. Prior to that, Mr. Sloan hasHartman served as President of the Control Devices Division since July 2009 and Vice PresidentCorporate Controller of the Company since December 2009. Prior2006 and prior to that Mr. Sloan served as Vice President and General ManagerStoneridge’s Director of Stoneridge Hi-StatInternal Audit from February 2004 to July 2009.2003.
Available Information
We make available, free of charge through our website (www.stoneridge.com), our Annual Report on Form 10-K (“Annual Report”), Quarterly Reports on Form 10-Q, Current Reports on Form 8-K, all amendments to those reports, and other filings with the U.S. Securities and Exchange Commission (“SEC”), as soon as reasonably practicable after they are filed with the SEC. Our Corporate Governance Guidelines, Code of Business Conduct and Ethics, Code of Ethics for Senior Financial Officers, Whistleblower Policy and Procedures and the charters of the Board of Director’s Audit, Compensation and Nominating and Corporate Governance Committees are posted on our website as well. Copies of these documents will be available to any shareholder upon request. Requests should be directed in writing to Investor Relations at Stoneridge, Inc., 9400 East Market Street, Warren, Ohio 44484.39675 MacKenzie Drive, Suite 400, Novi, Michigan 48377.
The SEC maintains a website (www.sec.gov) that contains reports, proxy and information statements, and other information regarding issuers that file electronically with the SEC, including the Company. The public may also read and copy any materials we file with the SEC at the SEC’s Public Reference Room at 100 F. Street, NE, Washington, DC 20549. The public may obtain information on the operation of the Public Reference Room by calling the SEC at 1-800-SEC-0330.
Our business is cyclical and a downturn in the automotive, commercial, motorcycle, off-highway and agricultural vehicle markets as well as overall economic conditions could reduce the sales and profitability of our business.
The demand for products in our Control Devices and Electronics segments are largely dependent on the domestic and foreign production of automotive, commercial, motorcycle, off-highway and agricultural vehicles. The markets for our products have been cyclical, because new vehicle demand is dependent on, among other things, consumer spending and is tied closely to the overall strength of the economy. Because the majority of our products are used principally in the production of vehicles for the automotive, commercial, motorcycle, off-highway and agricultural vehicle markets, our net sales, and therefore our results of operations, are significantly dependent on the general state of the economy and other factors which affect these markets. A decline in commercial, automotive, agricultural, motorcycle and off-highway vehicle production, or a material decline in market share by our significant customers, could adversely affect our results of operations and financial condition. Also, the demand for our PST segment products are significantly dependent on the general state of the Brazilian economy and automotive market.
In 2015,2016, approximately 85%88% of our net sales were derived from automotive, commercial, motorcycle, off-highway and agricultural vehicle markets while approximately 15%12% were derived from aftermarket distributors, mass merchandisers and monitoring services markets.
| 7 |
We have foreign currency translation and transaction risks that may materially adversely affect our operating results, financial condition and liquidity.
The financial position and results of operations of our international subsidiaries are initially recorded in various foreign currencies and then translated into U.S. dollars at the applicable exchange rate for inclusion in our consolidated financial statements. The strengthening of the U.S. dollar against these foreign currencies ordinarily has a negative effect on our reported sales and operating margin (and conversely, the weakening of the U.S. dollar against these foreign currencies has a positive impact). The volatility of currency exchange rates may materially adversely affect our operating results, including foreign currency forward contracts. To mitigate a portion of our exposure to fluctuations in foreign currency exchange rates we use derivative financial instruments, including foreign currency contracts, to reduce the effect of such fluctuations on foreign currency denominated intercompany transactions, inventory purchases and other foreign currency exposures.
We are subject to risks related to our international operations.
Approximately 43%38% of our net sales in 20152016 were derived from sales outside of North America. At December 31, 2015,2016, significant concentrations of net assets outside of North America included $51.3$55.7 million in South America and $71.4$79.0 million in Europe and Other. Non-current assets outside of North America accounted for approximately 55%51% of our non-current assets as of December 31, 2015.2016. International sales and operations are subject to significant risks, including, among others:
| · | political and economic instability; |
| · | restrictive trade policies; |
| · | economic conditions in local markets; |
| · | currency exchange controls; |
| · | labor unrest; |
| · | difficulty in obtaining distribution support and potentially adverse tax consequences; and |
| · | the imposition of product tariffs and the burden of complying with a wide variety of international and U.S. export |
We may not realize sales represented by awarded business.
We base our growth projections, in part, on business awards made by our customers. These business awards generally renew annually during a program life cycle. Failure of actual production orders from our customers to approximate these business awards could have a material adverse effect on our business, financial condition or results of operations.
The prices that we can charge some of our customers are predetermined and we bear the risk of costs in excess of our estimates, in addition to the risk of adverse effects resulting from general customer demands for cost reductions and quality improvements.
Our supply agreements with some of our customers require us to provide our products at predetermined prices. In some cases, these prices decline over the course of the contract and may require us to meet certain productivity and cost reduction targets. In addition, our customers may require us to share productivity savings in excess of our cost reduction targets. The costs that we incur in fulfilling these contracts may vary substantially from our initial estimates. Unanticipated cost increases or the inability to meet certain cost reduction targets may occur as a result of several factors, including increases in the costs of labor, components or materials. In some cases, we are permitted to pass on to our customers the cost increases associated with specific materials. However, cost overruns that we cannot pass on to our customers could adversely affect our business, financial condition or results of operations.
| 8 |
OEM customers have exerted and continue to exert considerable pressure on component suppliers to reduce costs, improve quality and provide additional design and engineering capabilities and continue to demand and receive price reductions and measurable increases in quality through their use of competitive selection processes, rating programs and various other arrangements. We may be unable to generate sufficient production cost savings in the future to offset required price reductions. Additionally, OEMs have generally required component suppliers to provide more design engineering input at earlier stages of the product development process, the costs of which have, in some cases, been absorbed by the suppliers. Future price reductions, increased quality standards and additional engineering capabilities required by OEMs may reduce our profitability and have a material adverse effect on our business, financial condition or results of operations.
Our business is very competitive and increased competition could reduce our sales and profitability.
The markets for our products are highly competitive. We compete based on technological innovation, price, quality, performance, service and delivery. Many of our competitors are more diversified and have greater financial and other resources than we do. In addition, with respect to certain products, some of our competitors are divisions of our OEM customers. We cannot assure that our business will not be adversely affected by competition or that we will be able to maintain our profitability if the competitive environment changes.
The loss or insolvency of any of our principal customers would adversely affect our future results.
We are dependent on several principal customers for a significant percentage of our net sales. In 2015,2016, our top threefive customers were Ford Motor Company, General Motors, Scania Group, Daimler and DaimlerVolvo which comprised 14%17%, 7%, 6%, 6% and 6% of our net sales, respectively. In 2015,2016, our top ten customers accounted for 54%55% of our net sales. The loss of any significant portion of our sales to these customers would have a material adverse effect on our results of operations and financial condition. The contracts we have entered into with many of our customers provide for supplying the customers’ requirements for a particular model, rather than for manufacturing a specific quantity of products. Such contracts range from one year to the life of the model, which is generally three to seven years.model. These contracts are subject to renegotiation, which may affect product pricing and generally may be terminated by our customers at any time. Therefore, the loss of a contract for a major model or a significant decrease in demand for certain key models or any group of related models sold by any of our major customers could have a material adverse effect on our results of operations and financial condition by reducing cash flows and our ability to spread costs over a larger revenue base. We also compete to supply products for successor models and are subject to the risk that the customer will not select us to produce products on any such model, which could have a material adverse impact on our business, financial condition or results of operations. In addition, we have significant receivable balances related to these customers and other major customers that would be at risk in the event of their bankruptcy.
Consolidation amongThe discontinuation of, loss of business or lack of commercial success, with respect to a particular vehicle parts customersmodel for which the Company is a significant supplier could reduce the Company’s sales and suppliers could make it more difficult for us to compete successfully.harm its profitability.
Although the Company has purchase orders from many of its customers, these purchase orders generally provide for the supply of a customer’s annual requirements for a particular vehicle model and assembly plant, or in some cases, for the supply of a customer’s requirements for the life of a particular vehicle model, rather than for the purchase of a specific quantity of products. In addition, it is possible that customers could elect to manufacture components internally that are currently produced by outside suppliers, such as the Company. The discontinuation of, the loss of business with respect to or a lack of commercial success of a particular vehicle part supply industry has undergonemodel for which the Company is a significant consolidation as OEM customers have sought to lower costs, improve qualitysupplier, could reduce the Company’s sales and increasingly purchase complete systems and modules rather than separate components. As a result ofharm the cost focus of these major customers, we have been, and expect to continue to be, required to reduce prices. Because of these competitive pressures, we cannot assure you that we will be able to increase or maintain gross margins on product sales to our customers. The trend toward consolidation among vehicle parts suppliers is resulting in fewer, larger suppliers who benefit from purchasing and distribution economies of scale. If we cannot achieve cost savings and operational improvements sufficient to allow us to compete successfully in the future with these larger, consolidated companies, our business, financial condition or results of operations could be adversely affected.
We rely on independent dealers and distributors to sell certain products in the aftermarket sales channel and a disruption to this channel would harm our business.
Because we sell certain products such as security accessories and driver information products to independent dealers and distributors, we are subject to many risks, including risks related to their inventory levels and support for our products. If dealers and distributors do not maintain sufficient inventory levels to meet customer demand, our sales could be negatively impacted.
Our dealer network also sells products offered by our competitors. If our competitors offer our dealers more favorable terms, those dealers may de-emphasize or decline to carry our products. In the future, we may not be able to retain or attract a sufficient number of qualified dealers and distributors. If we are unable to maintain successful relationships with dealers and distributors, or to expand our distribution channels, our business will suffer.Company’s profitability.
We are dependent on the availability and price of raw materials and other supplies.
We require substantial amounts of raw materials and other supplies, and substantially all such materials we require are purchased from outside sources. The availability and prices of raw materials and other supplies may be subject to curtailment or change due to, among other things, new laws or regulations, suppliers’ allocations to other purchasers and interruptions in production by suppliers, weather emergencies, natural disasters, commercial disputes, acts of terrorism or war, changes in exchange rates and worldwide price levels. If demand for raw materials increases, we may have difficulties obtaining adequate raw materials and other supplies from our suppliers to satisfy our customers. At times, we have experienced difficulty obtaining adequate supplies of semiconductors and memory chips for our Control Devices, Electronics and PST segments. In addition, there have been challenges at times in obtaining timely supply of nylon and resins for our Control Devices segment and audio component parts for our PST segment. If we cannot obtain adequate raw materials and other supplies, or if we experience an increase in the price of raw materials and other supplies, our business, financial condition or results of operations could be materially adversely affected.
We use a variety of commodities, including copper, zinc, resins and certain other commodities. Increasing commodity costs could have a negative impact on our results. We have sought at times to alleviate the effect of increasing costs by selectively hedging a portion of our exposure. The inability to effectively hedge them may have a material adverse effect on our business, financial condition or results of operations.
| 9 |
We rely on independent dealers and distributors to sell certain products in the aftermarket sales channel and a disruption to this channel would harm our business.
Because we sell certain products such as security accessories and driver information products to independent dealers and distributors, we are subject to many risks, including risks related to their inventory levels and support for our products. If dealers and distributors do not maintain sufficient inventory levels to meet customer demand, our sales could be negatively impacted.
Our dealer network also sells products offered by our competitors. If our competitors offer our dealers more favorable terms, those dealers may de-emphasize or decline to carry our products. In the future, we may not be able to retain or attract a sufficient number of qualified dealers and distributors. If we are unable to maintain successful relationships with dealers and distributors, or to expand our distribution channels, our business will suffer.
We must implement and sustain a competitive technological advantage in producing our products to compete effectively.
Our products are subject to changing technology, which could place us at a competitive disadvantage relative to alternative products introduced by competitors. Our success will depend on our ability to continue to meet customers’ changing specifications with respect to technological innovation, price, quality, performance, service and delivery by implementing and sustaining competitive technological advances. Our business may, therefore, require significant recurring additional capital expenditures and investment in product development and manufacturing and management information systems. We cannot assure that we will be able to achieve the technological advances or introduce new products that may be necessary to remain competitive. Our inability to continuously improve existing products, to develop new products and to achieve technological advances could have a material adverse effect on our business, financial condition or results of operations.
PST’s Global Positioning Systems (“GPS”) products depend upon satellites maintained by the United States Department of Defense. If a significant number of these satellites become inoperable, unavailable or are not replaced, or if the policies of the United States government for the use of the GPS without charge are changed, our business will suffer.
The GPS is a satellite-based navigation and positioning system consisting of a constellation of orbiting satellites. The satellites and their ground control and monitoring stations are maintained and operated by the United States Department of Defense. The Department of Defense does not currently charge users for access to the satellite signals. These satellites and their ground support systems are complex electronic systems subject to electronic and mechanical failures and possible sabotage.
If a significant number of satellites were to become inoperable, unavailable or are not replaced, it would impair the current utility of our GPS products and the growth of market opportunities. In addition, there can be no assurance that the U.S. government will remain committed to the operation and maintenance of GPS satellites over a long period, or that the policies of the U.S. government that provide for the use of the GPS without charge and without accuracy degradation will remain unchanged. Because of the increasing commercial applications of the GPS, other U.S. government agencies may become involved in the administration or the regulation of the use of GPS signals. Any of the foregoing factors could affect the willingness of buyers of our products to select GPS-based products instead of products based on competing technologies, which could adversely affect our operational revenues, financial condition and our financial condition.results of operation.
We may incur material product liability costs.
We may be subject to product liability claims in the event that the failure of any of our products results in personal injury or death and we cannot assure that we will not experience material product liability losses in the future. We cannot assure that our product liability insurance will be adequate for liabilities ultimately incurred or that it will continue to be available on terms acceptable to us. In addition, if any of our products prove to be defective, we may be required to participate in government-imposed or customer OEM-instituted recalls involving such products. A successful claim brought against us that exceeds available insurance coverage or a requirement to participate in any product recall could have a material adverse effect on our business, financial condition or results of operations.
| 10 |
Increased or unexpected product warranty claims could adversely affect us.
We typically provide our customers a warranty covering workmanship, and in some cases materials, on products we manufacture. Our warranty generally provides that products will be free from defects and adhere to customer specifications. If a product fails to comply with the warranty, we may be obligated or compelled, at our expense, to correct any defect by repairing or replacing the defective product. We maintain warranty reserves in an amount based on historical trends of units sold and payment amounts, combined with our current understanding of the status of existing claims. To estimate the warranty reserves, we must forecast the resolution of existing claims, as well as expected future claims on products previously sold. The amounts estimated to be due and payable could differ materially from what we may ultimately be required to pay. An increase in the rate of warranty claims or the occurrence of unexpected warranty claims could have a material adverse effect on our customer relations, and our financial condition or results of operations. Our customers are increasingly seeking to hold suppliers responsible for product warranties, which could negatively impact our exposure to these costs.
If we fail to protect our intellectual property rights or maintain our rights to use licensed intellectual property or are found liable for infringing the rights of others, our business could be adversely affected.
Our intellectual property, including our patents, trademarks, copyrights, trade secrets and license agreements, are important in the operation of our businesses, and we rely on the patent, trademark, copyright and trade secret laws of the United States and other countries, as well as nondisclosure agreements, to protect our intellectual property rights. We may not, however, be able to prevent third parties from infringing, misappropriating or otherwise violating our intellectual property, breaching any nondisclosure agreements with us, or independently developing technology that is similar or superior to ours and not covered by our intellectual property. Any of the foregoing could reduce any competitive advantage we have developed, cause us to lose sales or otherwise harm our business. We cannot assure that any intellectual property will provide us with any competitive advantage or will not be challenged, rejected, cancelled, invalidated or declared unenforceable. In the case of pending patent applications, we may not be successful in securing issued patents, or securing patents that provide us with a competitive advantage for our businesses. In addition, our competitors may design products around our patents that avoid infringement and violation of our intellectual property rights.
We cannot be certain that we have rights to use all intellectual property used in the conduct of our businesses or that we have complied with the terms of agreements by which we acquire such rights, which could expose us to infringement, misappropriation or other claims alleging violations of third party intellectual property rights. Third parties have asserted and may assert or prosecute infringement claims against us in connection with the services and products that we offer, and we may or may not be able to successfully defend these claims. Litigation, either to enforce our intellectual property rights or to defend against claims regarding intellectual property rights of others, could result in substantial costs and a diversion of our resources. Any such claims and resulting litigation could require us to enter into licensing agreements (if available on acceptable terms or at all), pay damages and cease making or selling certain products and could result in a loss of our intellectual property protection. Moreover, we may need to redesign some of our products to avoid future infringement liability. We also may be required to indemnify customers or other third parties at significant expense in connection with such claims and actions. Any of the foregoing could have a material adverse effect on our business, financial condition or results of operations.
10
| 11 |
Our debt obligations could limit our flexibility in managing our business and expose us to risks.
As of December 31, 2015,2016, there was $100.0$67.0 million in borrowings outstanding on our revolving credit facility (the “Credit Facility”). In addition, we are permitted under our Credit Facility to incur additional debt, subject to specified limitations. Our leverage and the terms of our indebtedness may have important consequences including the following:
| · | we may have difficulty satisfying our obligations with respect to our indebtedness, and if we fail to comply with these requirements, an event of default could result; |
| · | we may be required to dedicate a substantial portion of our cash flow from operations to required payments on indebtedness, thereby reducing the availability of cash flow for working capital, capital expenditures and other general corporate activities; |
| · | covenants relating to our debt may limit our ability to obtain additional financing for working capital, capital expenditures and other general corporate activities; |
| · | covenants relating to our debt may limit our flexibility in planning for, or reacting to, changes in our business and the industry in which we operate; |
| · | we may be placed at a competitive disadvantage against any less leveraged |
These and other consequences of our leverage and the terms of our indebtedness could have a material adverse effect on our business, financial condition or results of operations.
Covenants in our Credit Facility may limit our ability to pursue our business strategies.
Our Credit Facility limits our ability to, among other things:
| · | incur additional debt and guarantees; |
| · | pay dividends and repurchase our shares; |
| · | make other restricted payments, including investments; |
| · | create liens; |
| · | sell or otherwise dispose of assets, including capital shares of subsidiaries; |
| · | enter into agreements that restrict dividends from subsidiaries; |
| · | consolidate, merge or sell or otherwise dispose of all or substantially all of our assets; and |
| · | substantially change the nature of our business. |
The agreement governing our Credit Facility requires us to maintain a maximum leverage ratio of 3.00 to 1.00, and a minimum interest coverage ratio of 3.50 to 1.00 and places a maximum annual limit on capital expenditures. Our ability to comply with these covenants as well as the restrictivenegative covenants under the terms of our indebtedness, may be affected by events beyond our control.
A breach of any of the restrictivenegative covenants under our indebtedness or our inability to comply with the leverage and interest ratio requirements in the Credit Facility could result in a default. If a default occurs, the lenders under the Credit Facility could elect to declare all outstanding borrowings, together with accrued interest and other fees, to be immediately due and payable and terminate any commitments they have to provide further borrowings, and the Credit Facility lenders could pursue foreclosure and other remedies against us and our assets.
11
| 12 |
We have limited or no redundancy for certain of our manufacturing facilities, and therefore damage or disruption to those facilities could interrupt our operations, increase our costs of doing business and impair our ability to deliver our products on a timely basis.
If certain of our existing production facilities become incapable of manufacturing products for any reason, we may be unable to meet production requirements, we may lose revenue and we may not be able to maintain our relationships with our customers. Without operation of certain existing production facilities, we may be limited in our ability to deliver products until we restore the manufacturing capability at the particular facility, find an alternative manufacturing facility or arrange an alternative source of supply. Although we carry business interruption insurance to cover lost revenue and profits in an amount we consider adequate, this insurance does not cover all possible situations.situations and may be insufficient. Also, our business interruption insurance would not compensate us for the loss of opportunity and potential adverse impact on relations with our existing customers resulting from our inability to produce products for them.
A failure of our information technology (IT) networks and systems, or the inability to successfully implement upgrades to our enterprise resource planning (ERP) systems, could adversely impact our business and operations.
We rely upon information technology networks and systems to process, transmit and store electronic information, and to manage or support a variety of business processes and/or activities. The secure operation of these information technology networks and systems and the proper processing and maintenance of this information are critical to our business operations. Despite the implementation of security measures, our IT systems are at risk to damages from computer viruses, unauthorized access, cyber-attack and other similar disruptions. The occurrence of any of these events could compromise our networks, and the information stored there could be accessed, publicly disclosed or lost. Any such access, disclosure, loss of information or disruption of our operations could cause significant damage to our reputation, affect our relationships with our customers, suppliers and employees, lead to claims against the company and ultimately harm our business. We may be required to incur significant costs to protect against damage caused by these disruptions or security breaches in the future.
Also, we continually expand and update our IT networks and systems in response to the changing needs of our business and periodically upgrade our ERP systems. Should our networks or systems not be implemented successfully, or if the systems do not perform in a satisfactory manner once implementation is complete, our business and operations could be disrupted and our results of operations could be adversely affected, including our ability to report accurate and timely financial results.
We may experience increased costs and other disruptions to our business associated with labor relations.
As of December 31, 2015, we had approximately 4,100 employees, approximately 62% of whom were located outside the United States. Although we have no collective bargaining agreements covering U.S. employees, a significant number of employees located in Brazil, Estonia, Mexico, Sweden and the United Kingdom either (i) are represented by a union and are covered by a collective bargaining agreement or (ii) are covered by works council or other employment arrangements required by law. We cannot assure you that other employees will not be represented by a labor organization in the future or that any of our facilities will not experience a work stoppage or other labor disruption. Any work stoppage or other labor disruption involving our employees, employees of our customers (many of which customers have employees who are represented by unions), or employees of our suppliers could have a material adverse effect on our business, financial condition or results of operations by disrupting our ability to manufacture our products or reducing the demand for our products.
Compliance with environmental and other governmental regulations could be costly and require us to make significant expenditures.
Our operations are subject to various federal, state, local and foreign laws and regulations governing, among other things:
| · | the discharge of pollutants into the air and water; |
| · | the generation, handling, storage, transportation, treatment, and disposal of waste and other materials; |
| · | the cleanup of contaminated properties; and |
| · | the health and safety of our employees. |
Our business, operations and facilities are subject to environmental and health and safety laws and regulations, many of which provide for substantial fines for violations. The operation of our manufacturing facilities entails risks and we cannot assure you that we will not incur material costs or liabilities in connection with these operations. In addition, potentially significant expenditures could be required in order to comply with evolving environmental, health and safety laws, regulations or requirements that may be adopted or imposed in the future. Changes in environmental, health and safety laws, regulations and requirements or other governmental regulations could increase our cost of doing business or adversely affect the demand for our products.
| 13 |
We also may be required to investigate or clean up contamination resulting from past or current uses of our properties. At our former Sarasota, Florida facility, for example, groundwater and soil contamination caused by operations before we acquired the facility is in the process of being remediated. The costs of such remediation could have a material adverse effect on our business, financial condition or results of operations. Although no other environmental matters have been identified, other matters involving environmental contamination may also have a material adverse effect on our business, financial condition or results of operations.
Our annual effective tax rate could be volatile and materially change as a result of changes in the mix of earnings and other factors including changes in the recognition and/or reversalrelease of valuation allowances.allowances against deferred tax assets.
Our overall effective tax rate is computed by dividing our total tax expense (benefit) by our total earnings (loss) before tax. However, tax expense and benefits are not recognized on a global basis, but rather on a jurisdictional or legal entity basis. Losses in certain jurisdictions may not provide a current financial statement tax benefit as a result of the need to maintain a valuation allowance against the associated deferred tax asset. Also, management periodically evaluates the realizability of our deferred tax assets which may result in the recognition and/or reversalrelease of valuation allowances. As a result, changes in the mix of earnings between jurisdictions and changes in the recognition and/or reversalrelease of valuation allowances, among other factors, could have a significant effect on our overall effective tax rate.
The impact of potential changes in tax and trade policies in the United States and the potential corresponding actions by other countries in which we do business could adversely affect our financial performance.
The U.S. government has recently proposed comprehensive tax and trade reform. These proposals are designed to encourage increased production in the United States and include a border tax on imports, an increase in customs duties and the renegotiation of U.S. trade agreements. Reflective of the automotive industry, our vehicle parts manufacturing facilities in the United States and Mexico are highly dependent on trade within the North American Free Trade Agreement (“NAFTA”) region. Our facility in Mexico represents a critical component of our supply chain and that of our customers. We have significant imports into the United States, and the imposition of a border tax or an increase in customs duties with respect to these imports could negatively impact our financial performance. If such taxes or customs duties are implemented, it also may cause our trading partners to take actions with respect to U.S. imports or U.S. investment activities in their respective countries. Any potential changes in tax and trade policies in the United States and the potential corresponding actions by other countries in which we do business could adversely affect our financial performance.
We may not be able to successfully integrate acquisitions into our business or may otherwise be unable to benefit from pursuing acquisitions.
Failure to successfully identify, complete and/or integrate acquisitions could have a material adverse effect on us. A portion of our growth in sales and earnings has been generated from acquisitions and subsequent improvements in the performance of the businesses acquired. We expect to continue a strategy of selectively identifying and acquiring businesses with complementary products. We cannot assure you that any business acquired by us will be successfully integrated with our operations or prove to be profitable. We could incur substantial indebtedness in connection with our acquisition strategy, which could significantly increase our interest expense. Covenant restrictions relating to such indebtedness could restrict our ability to pay dividends, fund capital expenditures and consummate additional acquisitions.
We anticipate that acquisitions could occur in foreign markets in which we do not currently operate. As a result, the process of integrating acquired operations into our existing operations may result in unforeseen operating difficulties and may require significant financial resources that would otherwise be available for the ongoing development or expansion of existing operations. Any failure to successfully integrate such acquisitions could have a material adverse effect on our business, financial condition or results of operations.
Item 1B. Unresolved Staff Comments.
None.
| 14 |
TheAt December 31, 2016, the Company and its joint venture currently ownowned or lease 11leased 10 manufacturing facilities, that are in use, which together contain approximately 1.0 million square feet of manufacturing space. Of these manufacturing facilities, four are used by our Control Devices reportable segment, three are used by our Electronics reportable segment, three areone is used by our PST reportable segment and one istwo are used by our joint venture, Minda. The following table provides information regarding our facilities:
| Owned/ | Square | |||||||
| Location | Leased | Use | Footage | |||||
| Control Devices | ||||||||
| Lexington, Ohio | Owned | Manufacturing/Division Office | 219,612 | |||||
| Juarez, Mexico(A) | Owned | Manufacturing | 189,327 | |||||
| Canton, Massachusetts | Owned | Manufacturing | 132,560 | |||||
| Suzhou, China(A) | Leased | |||||||
| El Paso, Texas(A) | Leased | Warehouse | 57,000 | |||||
| Lexington, Ohio | Leased | Warehouse | 15,000 | |||||
| Lexington, Ohio | Leased | Warehouse | 2,700 | |||||
| Electronics | ||||||||
| Tallinn, Estonia(B) | Leased | Manufacturing | 85,911 | |||||
| Orebro, Sweden | Leased | Manufacturing | 77,472 | |||||
| Stockholm, Sweden | Leased | Engineering Office/Division Office | 39,600 | |||||
| Dundee, Scotland | Leased | Manufacturing/Sales Office/Engineering Office | 34,605 | |||||
| Bayonne, France | Leased | Sales Office/Warehouse | 9,655 | |||||
| Lomersheim, Germany | Leased | Sales Office/Warehouse | 5,597 | |||||
| Shanghai, China(B) | Leased | Sales Office | 5,034 | |||||
| Madrid, Spain | Leased | Sales Office/Warehouse | 1,545 | |||||
| PST | ||||||||
| Manaus, Brazil | Owned | Manufacturing | 102,247 | |||||
| São Paulo, Brazil | Owned | 45,467 | ||||||
| São Paulo, Brazil | Leased | Sales Office | 9,246 | |||||
| Buenos Aires, Argentina | Leased | Sales Office | 5,798 | |||||
| Corporate and Other | ||||||||
| Novi, Michigan | Leased | |||||||
| Headquarters | ||||||||
| Warren, Ohio | Leased | Data Center | 3,020 | |||||
| Stuttgart, Germany | Leased | Sales Office/Engineering Office | 1,000 | |||||
| Seoul, South Korea | Leased | Sales Office | 330 | |||||
| Joint Venture | ||||||||
| Pune, India | Owned | Manufacturing/Engineering Office/Sales Office | 80,000 | |||||
| Chennai, India | Leased | Manufacturing | 25,629 | |||||
(A) This facility is also used in the Electronics reportable segment.
(B) This facility is also used in the Control Devices reportable segment.
| 15 |
We are involved in certain legal actions and claims primarily arising in the ordinary course of business. Although it is not possible to predict with certainty the outcome of these matters, we do not believe that any of the litigation in which we are currently engaged, either individually or in the aggregate, will have a material adverse effect on our business, consolidated financial position or results of operations. We are subject to a tax assessment in Brazil related to value added taxes on vehicle tracking and monitoring services for which the likelihood of loss is not probable although it may take years to resolve. In addition, we are subject to litigation regarding patent infringement. We are also subject to the risk of exposure to product liability claims in the event that the failure of any of our products causes personal injury or death to users of our products as well as product warranty and recall claims. There can be no assurance that we will not experience any material losses related to product liability, warranty or recall claims. In addition, if any of our products prove to be defective, we may be required to participate in a government-imposed or customer OEM-instituted recall involving such products. See additional details of these matters in Note 10 to the consolidated financial statements.
Item 4. Mine Safety Disclosure.
Not Applicable.
Item 5. Market for Registrant’s Common Equity, Related Stockholder Matters and Issuer Purchases of Equity Securities.
Our shares are listed on the New York Stock Exchange (“NYSE”) under the symbol “SRI.” As of February 29, 2016,24, 2017, we had 27,786,97827,870,944 Common Shares, without par value, outstanding which were owned by approximately 250200 registered holders, including Common Shares held in the names of brokers and banks (so-called “street name” holdings) who are record holders with approximately 2,600 beneficial owners.
Since the Company’s initial public offering in 1997, we have not paid or declared dividends, which are restricted under the Credit Facility. We may only pay cash dividends on our Common Shares of up to $7.0 million annually if immediately prior to and immediately after the payment is made, no event of default under our Credit Facility shall have occurred. We currently intend to utilizeuse cash flows from our earnings for acquisitions, working capital, capital expenditures, general corporate purposes and reduction in outstanding indebtedness. Accordingly, we do not expect to pay cash dividends for the foreseeable future.
High and low sales prices for our Common Shares for each quarter ended during 20152016 and 20142015 are as follows:
| Quarter Ended | High | Low | |||||||||||||||||
| Quarter Ended | High | Low | |||||||||||||||||
| 2016 | |||||||||||||||||||
| March 31 | $ | 15.17 | $ | 10.51 | |||||||||||||||
| June 30 | $ | 16.99 | $ | 13.57 | |||||||||||||||
| September 30 | $ | 19.20 | $ | 14.84 | |||||||||||||||
| December 31 | $ | 18.62 | $ | 13.42 | |||||||||||||||
| 2015 | March 31 | $ | 13.26 | $ | 10.83 | ||||||||||||||
| June 30 | $ | 13.23 | $ | 11.18 | |||||||||||||||
| September 30 | $ | 13.12 | $ | 10.18 | |||||||||||||||
| December 31 | $ | 15.74 | $ | 11.70 | |||||||||||||||
| 2014 | March 31 | $ | 12.83 | $ | 9.49 | ||||||||||||||
| June 30 | $ | 11.62 | $ | 8.68 | |||||||||||||||
| September 30 | $ | 13.07 | $ | 10.40 | |||||||||||||||
| December 31 | $ | 13.40 | $ | 10.46 | |||||||||||||||
| March 31 | $ | 13.26 | $ | 10.83 | |||||||||||||||
| June 30 | $ | 13.23 | $ | 11.18 | |||||||||||||||
| September 30 | $ | 13.12 | $ | 10.18 | |||||||||||||||
| December 31 | $ | 15.74 | $ | 11.70 | |||||||||||||||
There were no repurchases of Common Shares made by us during the years ended December 31, 20152016 or 2014,2015, other than the repurchase of Common Shares of 241,537126,539 and 74,410,241,537, respectively, to satisfy employee tax withholdings associated with the vesting of restricted Common Shares.
| 16 |
Performance Graph
Set forth below is a line graph comparing the cumulative total return of a hypothetical investment in our Common Shares with the cumulative total return of hypothetical investments in the Morningstar Auto Parts Industry Group Index and the NYSE Composite Index based on the respective market price of each investment as of December 31, 2010, 2011, 2012, 2013, 2014, 2015, and 20152016 assuming in each case an initial investment of $100 on December 31, 2010,2011, and reinvestment of dividends.
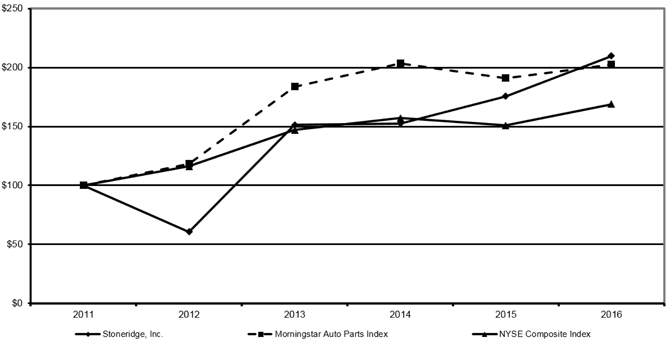
| 2010 | 2011 | 2012 | 2013 | 2014 | 2015 | 2011 | 2012 | 2013 | 2014 | 2015 | 2016 | |||||||||||||||||||||||||||||||||||||
| Stoneridge, Inc. | $ | 100 | $ | 53 | $ | 32 | $ | 81 | $ | 81 | $ | 94 | $ | 100 | $ | 61 | $ | 151 | $ | 153 | $ | 176 | $ | 210 | ||||||||||||||||||||||||
| Morningstar Auto Parts Index | $ | 100 | $ | 86 | $ | 101 | $ | 157 | $ | 174 | $ | 163 | $ | 100 | $ | 118 | $ | 184 | $ | 204 | $ | 191 | $ | 202 | ||||||||||||||||||||||||
| NYSE Composite Index | $ | 100 | $ | 96 | $ | 112 | $ | 142 | $ | 151 | $ | 145 | $ | 100 | $ | 116 | $ | 147 | $ | 157 | $ | 151 | $ | 169 | ||||||||||||||||||||||||
For information on “Related Stockholder Matters” required by Item 201(d) of Regulation S-K, refer to Item 12 of this report.
| 17 |
Item 6. Selected Financial Data.
The following table sets forth selected historical financial data and should be read in conjunction with the consolidated financial statements and notes related thereto and other financial information included elsewhere herein. The selected historical data was derived from our consolidated financial statements.
| Years ended December 31 | 2015 | 2014 | 2013 | 2012 | 2011 (E) | |||||||||||||||
| (in thousands, except per share data) | ||||||||||||||||||||
| Statement of Operations Data: | ||||||||||||||||||||
| Net sales: | ||||||||||||||||||||
| Control Devices | $ | 333,010 | $ | 306,658 | $ | 291,145 | $ | 267,860 | $ | 259,316 | ||||||||||
| Electronics | 216,544 | 214,141 | 189,809 | 164,196 | 180,508 | |||||||||||||||
| PST | 95,258 | 139,780 | 178,532 | 180,410 | - | |||||||||||||||
| Total net sales | $ | 644,812 | $ | 660,579 | $ | 659,486 | $ | 612,466 | $ | 439,824 | ||||||||||
| Gross profit | $ | 176,978 | $ | 190,874 | $ | 205,955 | $ | 185,267 | $ | 121,289 | ||||||||||
| Operating income (loss) | ||||||||||||||||||||
| Control Devices | $ | 44,690 | $ | 35,387 | $ | 32,331 | $ | 20,945 | $ | 22,851 | ||||||||||
| Electronics | 13,784 | 17,444 | 20,732 | 15,851 | 21,304 | |||||||||||||||
| PST - consolidated (C) (E) | (7,542 | ) | (59,587 | ) | 7,211 | 583 | - | |||||||||||||
| Unallocated Corporate | (23,117 | ) | (19,067 | ) | (17,871 | ) | (17,474 | ) | (20,620 | ) | ||||||||||
| Total operating income (loss) | $ | 27,815 | $ | (25,823 | ) | $ | 42,403 | $ | 19,905 | $ | 23,535 | |||||||||
| Equity in earnings of investees (E) | $ | 608 | $ | 815 | $ | 476 | $ | 760 | $ | 10,034 | ||||||||||
| Income (loss) before income taxes from continuing operations | $ | 20,230 | $ | (53,060 | ) | $ | 23,326 | $ | (3,810 | ) | $ | 80,663 | ||||||||
| Income (loss) from continuing operations (A) (C) (D) (E) | $ | 20,777 | $ | (51,204 | ) | $ | 20,529 | $ | (3,777 | ) | $ | 55,349 | ||||||||
| Income (loss) from discontinued operations (B) | (210 | ) | (9,387 | ) | (4,021 | ) | 7,525 | (9,812 | ) | |||||||||||
| Net income (loss) | 20,567 | (60,591 | ) | 16,508 | 3,748 | 45,537 | ||||||||||||||
| Net income (loss) attributable to noncontrolling interest (A) (C) | (2,207 | ) | (13,483 | ) | 1,377 | (1,613 | ) | (3,820 | ) | |||||||||||
| Net income (loss) attributable to Stoneridge, Inc. | $ | 22,774 | $ | (47,108 | ) | $ | 15,131 | $ | 5,361 | $ | 49,357 | |||||||||
| Basic earnings (loss) per share from continuing operations attributable to Stoneridge, Inc. | $ | 0.84 | $ | (1.40 | ) | $ | 0.72 | $ | (0.08 | ) | $ | 2.45 | ||||||||
| Diluted earnings (loss) per share from continuing operations attributable to Stoneridge, Inc. | $ | 0.82 | $ | (1.40 | ) | $ | 0.70 | $ | (0.08 | ) | $ | 2.40 | ||||||||
| Basic earnings (loss) per share attributable to discontinued operations | $ | (0.01 | ) | $ | (0.35 | ) | $ | (0.15 | ) | $ | 0.28 | $ | (0.41 | ) | ||||||
| Diluted earnings (loss) per share attributable to discontinued operations | $ | (0.01 | ) | $ | (0.35 | ) | $ | (0.14 | ) | $ | 0.28 | $ | (0.40 | ) | ||||||
| Basic earnings (loss) per share attributable to Stoneridge, Inc. | $ | 0.83 | $ | (1.75 | ) | $ | 0.57 | $ | 0.20 | $ | 2.04 | |||||||||
| Diluted earnings (loss) per share attributable to Stoneridge, Inc. | $ | 0.81 | $ | (1.75 | ) | $ | 0.56 | $ | 0.20 | $ | 2.00 | |||||||||
| Other Continuing Operations Data: | ||||||||||||||||||||
| Design and development | $ | 38,792 | $ | 41,609 | $ | 40,372 | $ | 38,945 | $ | 29,115 | ||||||||||
| Capital expenditures | $ | 28,735 | $ | 23,516 | $ | 21,576 | $ | 22,909 | $ | 16,550 | ||||||||||
| Depreciation and amortization (F) | $ | 22,274 | $ | 27,105 | $ | 29,286 | $ | 29,405 | $ | 14,643 | ||||||||||
| Balance Sheet Data (as of December 31): | ||||||||||||||||||||
| Working capital | $ | 123,859 | $ | 125,197 | $ | 215,880 | $ | 157,585 | $ | 131,534 | ||||||||||
| Total assets | $ | 364,252 | $ | 398,751 | $ | 588,322 | $ | 592,691 | $ | 695,495 | ||||||||||
| Long-term debt, net of current portion | $ | 104,458 | $ | 110,651 | $ | 185,045 | $ | 181,311 | $ | 183,711 | ||||||||||
| Shareholders' equity | $ | 106,429 | $ | 113,806 | $ | 188,534 | $ | 193,834 | $ | 180,639 | ||||||||||
| Years ended December 31 | 2016 | 2015 | 2014 | 2013 | 2012 | |||||||||||||||
| (in thousands, except per share data) | ||||||||||||||||||||
| Statement of Operations Data: | ||||||||||||||||||||
| Net sales: | ||||||||||||||||||||
| Control Devices | $ | 408,132 | $ | 333,010 | $ | 306,658 | $ | 291,145 | $ | 267,860 | ||||||||||
| Electronics | 205,256 | 216,544 | 214,141 | 189,809 | 164,196 | |||||||||||||||
| PST | 82,589 | 95,258 | 139,780 | 178,532 | 180,410 | |||||||||||||||
| Total net sales | $ | 695,977 | $ | 644,812 | $ | 660,579 | $ | 659,486 | $ | 612,466 | ||||||||||
| Gross profit | $ | 195,439 | $ | 176,978 | $ | 190,874 | $ | 205,955 | $ | 185,267 | ||||||||||
| Operating income (loss) | ||||||||||||||||||||
| Control Devices | $ | 61,815 | $ | 44,690 | $ | 35,387 | $ | 32,331 | $ | 20,945 | ||||||||||
| Electronics | 14,798 | 13,784 | 17,444 | 20,732 | 15,851 | |||||||||||||||
| PST (C) | (3,462 | ) | (7,542 | ) | (59,587 | ) | 7,211 | 583 | ||||||||||||
| Unallocated Corporate (F) | (29,069 | ) | (23,117 | ) | (19,067 | ) | (17,871 | ) | (17,474 | ) | ||||||||||
| Total operating income (loss) | $ | 44,082 | $ | 27,815 | $ | (25,823 | ) | $ | 42,403 | $ | 19,905 | |||||||||
| Equity in earnings of investees | $ | 1,233 | $ | 608 | $ | 815 | $ | 476 | $ | 760 | ||||||||||
| Income (loss) before income taxes from continuing operations | $ | 39,185 | $ | 20,230 | $ | (53,060 | ) | $ | 23,326 | $ | (3,810 | ) | ||||||||
| Income (loss) from continuing operations(A) (B) (C) (D) | $ | 75,574 | $ | 20,777 | $ | (51,204 | ) | $ | 20,529 | $ | (3,777 | ) | ||||||||
| Income (loss) from discontinued operations(E) | - | (210 | ) | (9,387 | ) | (4,021 | ) | 7,525 | ||||||||||||
| Net income (loss) | 75,574 | 20,567 | (60,591 | ) | 16,508 | 3,748 | ||||||||||||||
| Net income (loss) attributable to noncontrolling interest(A)(B)(C)(D) | (1,887 | ) | (2,207 | ) | (13,483 | ) | 1,377 | (1,613 | ) | |||||||||||
| Net income (loss) attributable to Stoneridge, Inc. | $ | 77,461 | $ | 22,774 | $ | (47,108 | ) | $ | 15,131 | $ | 5,361 | |||||||||
| Basic earnings (loss) per share from continuing operations attributable to Stoneridge, Inc. | $ | 2.79 | $ | 0.84 | $ | (1.40 | ) | $ | 0.72 | $ | (0.08 | ) | ||||||||
| Diluted earnings (loss) per share from continuing operations attributable to Stoneridge, Inc. | $ | 2.74 | $ | 0.82 | $ | (1.40 | ) | $ | 0.70 | $ | (0.08 | ) | ||||||||
| Basic earnings (loss) per share attributable to discontinued operations | $ | - | $ | (0.01 | ) | $ | (0.35 | ) | $ | (0.15 | ) | $ | 0.28 | |||||||
| Diluted earnings (loss) per share attributable to discontinued operations | $ | - | $ | (0.01 | ) | $ | (0.35 | ) | $ | (0.14 | ) | $ | 0.28 | |||||||
| Basic earnings (loss) per share attributable to Stoneridge, Inc. | $ | 2.79 | $ | 0.83 | $ | (1.75 | ) | $ | 0.57 | $ | 0.20 | |||||||||
| Diluted earnings (loss) per share attributable to Stoneridge, Inc. | $ | 2.74 | $ | 0.81 | $ | (1.75 | ) | $ | 0.56 | $ | 0.20 | |||||||||
| Other Continuing Operations Data: | ||||||||||||||||||||
| Design and development | $ | 40,212 | $ | 38,792 | $ | 41,609 | $ | 40,372 | $ | 38,945 | ||||||||||
| Capital expenditures | $ | 24,476 | $ | 28,735 | $ | 23,516 | $ | 21,576 | $ | 22,909 | ||||||||||
| Depreciation and amortization(G) | $ | 23,258 | $ | 22,274 | $ | 27,105 | $ | 29,286 | $ | 29,405 | ||||||||||
| Balance Sheet Data (as of December 31): | ||||||||||||||||||||
| Working capital(C) | $ | 128,184 | $ | 123,859 | $ | 125,197 | $ | 215,880 | $ | 157,585 | ||||||||||
| Total assets(C) | $ | 394,529 | $ | 364,252 | $ | 398,751 | $ | 588,322 | $ | 592,691 | ||||||||||
| Long-term debt, net of current portion | $ | 75,060 | $ | 104,458 | $ | 110,651 | $ | 185,045 | $ | 181,311 | ||||||||||
| Shareholders' equity(D) | $ | 192,077 | $ | 106,429 | $ | 113,806 | $ | 188,534 | $ | 193,834 | ||||||||||
| 18 |
| (A) | The Company recorded the release of a valuation allowance associated with its U.S. federal, certain state and foreign deferred tax assets of $49.6 million for the year ended December 31, 2016. |
| (B) | The Company recorded a full valuation allowance on PST’s net deferred tax assets of $1,237 for the year ended December 31, 2015 of which $322 was attributable to noncontrolling interest. |
| (C) | The Company recorded a goodwill impairment of $51,458 related to PST during the year ended December 31, 2014 of which $11,304 was attributable to noncontrolling interest. |
| (D) | The Company recorded a loss on extinguishment of debt of $10,607 related to the redemption of the 9.5% senior notes during the year ended December 31, 2014. |
| (E) | The |
| (F) | Unallocated corporate expenses include, among other items, accounting, finance, legal, information technology costs as well as share-based compensation. |
| (G) | These amounts represent depreciation and amortization on fixed and certain finite-lived intangible assets. |
| 19 |
Item 7. Management’s Discussion and Analysis of Financial Condition and Results of Operations.
The following discussion and analysis should be read in conjunction with the consolidated financial statements and notes related thereto and other financial information included elsewhere herein.
Segments
We are primarily organized by products produced and markets served. Under this structure, our operations have been reported using the following segments:
Control Devices. This segment includes results of operations that manufacture sensors, switches, valves and actuators.
Electronics. This segment includes results of operations from the production of electronic instrument clusters, electronic control units and driver information systems.
PST. This segment includes results of operations that design and manufacture electronic vehicle alarms, convenience accessories, vehicle tracking devices and monitoring services and in-vehicle audio and video devices.
We sold substantially all of the assets and liabilities of our Wiring business on August 1, 2014. As a result, the Wiring business has been classified as discontinued operations for all periods presented in the Company’s financial statements herein, and therefore has been excluded from both continuing operations, segment results and other information herein for all periods presented. The Wiring business designed and manufactured wiring harness products and assembled instruments panels for sale principally to the commercial, agricultural and off-highway vehicle markets.
Overview
The Company had income from continuing operations attributable to Stoneridge, Inc. of $23.0$77.5 million, or $0.82 per diluted share and a loss from discontinued operations attributable to Stoneridge, Inc. of $(0.2) million, or $(0.01) per diluted share resulting in net income attributable to Stoneridge, Inc. of $22.8 million, or $0.81$2.74 per diluted share for the year ended December 31, 2015.2016.
Income from continuing operations attributable to Stoneridge. Inc. in 20152016 increased by $60.7$54.5 million, or $2.22$1.92 per diluted share, from lossincome from continuing operations of $(37.7)$23.0 million, or $(1.40) per diluted share for the year ended December 31, 2014 primarily due to the 2014 goodwill impairment of $40.2 million (which is net of $11.3 million attributable to noncontrolling interest) related to our PST segment and loss on extinguishment of debt of $10.6 million, which had an aggregate negative impact of $50.8 million, or $1.89 per share attributable to Stoneridge, Inc.
Excluding the impact of the PST goodwill impairment and loss on debt extinguishment, our income from continuing operations increased during 2015 by $9.9 million, or $0.33 per diluted share, primarily due to lower interest expense of $10.5 million as a result of the debt refinancing which occurred in the late third and early fourth quarters of 2014. While our gross profit decreased by $13.9 million primarily due to an unfavorable foreign currency translation as well as higher material costs in our Electronics and PST segments, it was substantially offset by a decrease in our selling, general and administrative costs of $13.3 million primarily due to foreign currency translation related to our PST and Electronics segments.
Net sales in 2015 decreased by $15.8 million, or 2.4%, primarily due to lower sales at our PST segment which were partially offset by higher sales in our Control Devices segment during 2015 compared to 2014. PST segment sales declined primarily due to an unfavorable foreign currency translation while our Control Devices segment sales increased primarily due to higher North American automotive market sales. Electronics segment net sales increased slightly due to sales volume growth which was substantially offset by unfavorable foreign currency translation.
Loss from discontinued operations related to the Wiring business was $(0.2) million, or $(0.01)$0.82 per diluted share, for the year ended December 31, 2015 a $9.2 million, or $0.34 per diluted share decrease from loss from discontinued operations of $(9.4) million, or $(0.35) per diluted share for 2014. The decrease was primarily due to the after-tax loss on disposalrelease of the Wiring businessvaluation allowance on our U.S. federal, certain state and foreign deferred tax assets of $8.6$49.6 million, or $1.75 per diluted share attributable to Stoneridge Inc.
Excluding the release of the tax valuation allowance, our income from continuing operations increased during 2016 by $4.9 million, or $0.17 per diluted share, primarily due to a gross profit increase of $18.5 million primarily due to higher sales in 2014.our Control Devices segment and improved gross margin due to lower material costs in our Electronics and PST segments, which was partially offset by higher U.S. income tax expense as a result of the valuation allowance release.
Net sales in 2016 increased by $51.2 million, or 7.9%, primarily due to higher sales at our Control Devices segment which were partially offset by lower sales in our Electronics and PST segments compared to 2015. Our Control Devices segment sales increased primarily due to new product sales and growth in our North American automotive market. Electronics segment net sales decreased due to lower sales volume of our North America commercial vehicle products and an unfavorable foreign currency translation, which were partially offset by an increase in European commercial vehicle product volume. PST sales decreased due to lower product sales volume as a result of continued weakness in the Brazilian economy and automotive market and an unfavorable foreign currency translation.
At December 31, 20152016 and 2014,2015, we had cash and cash equivalents of $50.4 million and $54.4 million, respectively. Cash and $43.0 million, respectively. The increasecash equivalents decreased during 2015 was2016 primarily due to improvedhigher working capital, capital expenditures and earnings.repayment of debt, which was partially offset by net income. At December 31, 20152016 and 20142015 we had $67.0 million and $100.0 million, respectively in borrowings outstanding on our $300.0 million Credit Facility.
| 20 |
Outlook
We expect improved financial performance in 2016 compared to 2015 because of new product launches and functional cost improvements.
We expect to have significant sales growth in our North American automotive vehicle market in 20162017 related to newrecent product launches including our shift by wire product by our Control Devices segment. Also,segment despite that the North American automotive vehicle market production is expected to increasedecrease by $0.2 million units to 18.217.6 million units in 2016 (an increase from the 17.5 million units produced in 2015), which we expect to have a favorable effect on our Control Devices segment.2017.
The North American commercial vehicle market improveddeclined in 2015, but is expected2016 and we expect it to decline slightly in 2016 while2017. We expect the European commercial vehicle market in 2016 is forecasted2017 to remain at approximately the same level with 2015.2016.
Our PST segment revenues and operating performance continue to be adversely impacted by weakness of the Brazilian economy and automotive market and was negatively impacted by unfavorable foreign currency translation. In January 2016,2017, the International Monetary Fund (IMF) lowered its forecasts forforecasted the Brazil gross domestic product to decline 3.5%grow 0.2% in 20162017 and 0.0%1.5% in 2017.2018. Based on the weakness in PST’s sales and operating performance during 20152016 and lowermodest forecasted growth of the Brazilian economy in 2016,2017, PST’s sales and earnings growth expectations continue to be moderated for 2016.2017. As there is significant uncertainty regarding the timing and magnitude of a recovery in the Brazilian economy and automotive market, PST continues to evaluate the need to further realign its cost structure to mitigate the effect on earnings of possible continued weakened product demand and unfavorable foreign currency exchange rates.
We regularly evaluate the performance of our businesses and their cost structures, including personnel, and make necessary changes thereto in order to optimize our results. We also evaluate the required skill sets of our personnel and periodically make strategic changes. As a consequence of these actions, we incur severance related costs which we refer to as business realignment charges.
As the Company no longer has a valuation allowance against its U.S. federal, certain state and foreign deferred tax assets, its effective tax rate is expected to increase in 2017. However, actual cash taxes paid as a percentage of income in 2017 are expected to be consistent with 2016.
A significant portion of our sales are outside of the United States. These sales are generated by our non-U.S. based operations, and therefore, movements in foreign currency exchange rates can have a significant effect on our results of operations, which are presented in U.S. dollars. A significant portion of our raw materials purchased by our Electronics and PST segments are denominated in U.S. dollars, and therefore movements in foreign currency exchange rates can also have a significant effect on our results of operations. While the U.S. dollar strengthened significantly against the Swedish krona, euro and Brazilian real in 2015 increasing our material costs and reducing our reported results, we expect thatand the U.S. dollar will continue to strengthenweakened against these currencies but at a moderated pace in 2016.2016 favorably impacting our material costs and reported results.
Because of the competitive nature of the markets we serve, we face pricing pressures from our customers in the ordinary course of business. In response to these pricing pressures we have been able to effectively manage our production costs by the combination of lowering certain costs and limiting the increase of others, the net impact of which to date has not been material. However, if we are unable to effectively manage production costs in the future to mitigate future pricing pressures, our results of operations would be adversely affected.
In March 2016, we announced the relocation of our corporate headquarters from Warren, Ohio to Novi, Michigan, which occurred primarily during the fourth quarter of 2016. The new headquarters has expanded our presence in the Detroit metropolitan area and improved access to key customers, decision makers and influencers in the automotive and commercial vehicle markets that we serve. In connection with the relocation, the Company is eligible for a Michigan Business Development Program grant of up to $1.4 million based upon the number of new jobs created in Michigan, along with talent services and training support from Oakland County Michigan Works!.
On January 31, 2017, Stoneridge B.V., an indirect wholly-owned subsidiary of Stoneridge, Inc., entered into an agreement to acquire Wide-Angle Management B.V. and Exploitatiemaatschappij Berghaaf B.V. (“Orlaco”).The aggregate consideration for the Orlaco acquisition was €74.9 million ($79.7 million), which included customary estimated adjustments to the purchase price. The Company paid €67.4 million ($71.7 million) in cash, and €7.5 million ($8.0 million) to hold in an escrow account to secure the payment obligations of the seller under the terms of the purchase agreement. The purchase price is subject to certain customary adjustments set forth in the purchase agreement. The Company expects to transfer the escrow amount promptly following the completion of the escrow period. The Company may also be required pay up to an additional €7.5 million in cash as earnout consideration if certain performance targets are achieved during the first two years. In order to fund for the Orlaco acquisition, the Company borrowed $81.0 million under its Credit Facility.
| 21 |
Year Ended December 31, 20152016 Compared To Year Ended December 31, 20142015
Consolidated statements of operations as a percentage of net sales are presented in the following table (in thousands):
| Dollar | ||||||||||||||||||||
| increase / | ||||||||||||||||||||
| Years ended December 31 | 2015 | 2014 | (decrease) | |||||||||||||||||
| Net sales | $ | 644,812 | 100.0 | % | $ | 660,579 | 100.0 | % | $ | (15,767 | ) | |||||||||
| Costs and expenses: | ||||||||||||||||||||
| Cost of goods sold | 467,834 | 72.6 | 469,705 | 71.1 | (1,871 | ) | ||||||||||||||
| Selling, general and administrative | 110,371 | 17.1 | 123,630 | 18.7 | (13,259 | ) | ||||||||||||||
| Design and development | 38,792 | 6.0 | 41,609 | 6.3 | (2,817 | ) | ||||||||||||||
| Goodwill impairment | - | - | 51,458 | 7.8 | (51,458 | ) | ||||||||||||||
| Operating income (loss) | 27,815 | 4.3 | (25,823 | ) | (3.9 | ) | 53,638 | |||||||||||||
| Interest expense, net | 6,365 | 1.0 | 16,880 | 2.6 | (10,515 | ) | ||||||||||||||
| Equity in earnings of investee | (608 | ) | (0.1 | ) | (815 | ) | (0.1 | ) | 207 | |||||||||||
| Loss on early extinguishment of debt | - | - | 10,607 | 1.6 | (10,607 | ) | ||||||||||||||
| Other expense, net | 1,828 | 0.3 | 565 | 0.1 | 1,263 | |||||||||||||||
| Income (loss) before income taxes from continuing operations | 20,230 | 3.1 | (53,060 | ) | (8.1 | ) | 73,290 | |||||||||||||
| Income tax benefit from continuing operations | (547 | ) | (0.1 | ) | (1,856 | ) | (0.3 | ) | 1,309 | |||||||||||
| Income (loss) from continuing operations | 20,777 | 3.2 | (51,204 | ) | (7.8 | ) | 71,981 | |||||||||||||
| Discontinued operations: | ||||||||||||||||||||
| Loss from discontinued operations, net of tax | - | - | (811 | ) | (0.1 | ) | 811 | |||||||||||||
| Loss on disposal, net of tax | (210 | ) | - | (8,576 | ) | (1.3 | ) | 8,366 | ||||||||||||
| Loss from discontinued operations | (210 | ) | - | (9,387 | ) | (1.4 | ) | 9,177 | ||||||||||||
| Net income (loss) | 20,567 | 3.2 | (60,591 | ) | (9.2 | ) | 81,158 | |||||||||||||
| Net loss attributable to noncontrolling interest | (2,207 | ) | (0.3 | ) | (13,483 | ) | (2.0 | ) | 11,276 | |||||||||||
| Net income (loss) attributable to Stoneridge, Inc. | $ | 22,774 | 3.5 | % | $ | (47,108 | ) | (7.2 | )% | $ | 69,882 | |||||||||
| Dollar | ||||||||||||||||||||
| increase / | ||||||||||||||||||||
| Years ended December 31 | 2016 | 2015 | (decrease) | |||||||||||||||||
| Net sales | $ | 695,977 | 100.0 | % | $ | 644,812 | 100.0 | % | $ | 51,165 | ||||||||||
| Costs and expenses: | ||||||||||||||||||||
| Cost of goods sold | 500,538 | 71.9 | 467,834 | 72.6 | 32,704 | |||||||||||||||
| Selling, general and administrative | 111,145 | 16.0 | 110,371 | 17.1 | 774 | |||||||||||||||
| Design and development | 40,212 | 5.8 | 38,792 | 6.0 | 1,420 | |||||||||||||||
| Operating income | 44,082 | 6.3 | 27,815 | 4.3 | 16,267 | |||||||||||||||
| Interest expense, net | 6,277 | 0.9 | 6,365 | 1.0 | (88 | ) | ||||||||||||||
| Equity in earnings of investee | (1,233 | ) | (0.2 | ) | (608 | ) | (0.1 | ) | (625 | ) | ||||||||||
| Other expense (income), net | (147 | ) | - | 1,828 | 0.3 | (1,975 | ) | |||||||||||||
| Income before income taxes from continuing operations | 39,185 | 5.6 | 20,230 | 3.1 | 18,955 | |||||||||||||||
| Income tax benefit from continuing operations | (36,389 | ) | (5.2 | ) | (547 | ) | (0.1 | ) | (35,842 | ) | ||||||||||
| Income from continuing operations | 75,574 | 10.8 | 20,777 | 3.2 | 54,797 | |||||||||||||||
| Loss from discontinued operations | - | - | (210 | ) | - | 210 | ||||||||||||||
| Net income | 75,574 | 10.8 | 20,567 | 3.2 | 55,007 | |||||||||||||||
| Net loss attributable to noncontrolling interest | (1,887 | ) | (0.3 | ) | (2,207 | ) | (0.3 | ) | 320 | |||||||||||
| Net income attributable to Stoneridge, Inc. | $ | 77,461 | 11.1 | % | $ | 22,774 | 3.5 | % | $ | 54,687 | ||||||||||
| 22 |
Net Sales. Net sales for our reportable segments, excluding inter-segment sales are summarized in the following table (in thousands):
| Dollar | Percent | |||||||||||||||||||||||
| increase / | increase / | |||||||||||||||||||||||
| Years ended December 31 | 2016 | 2015 | (decrease) | (decrease) | ||||||||||||||||||||
| Control Devices | $ | 408,132 | 58.6 | % | $ | 333,010 | 51.6 | % | $ | 75,122 | 22.6 | % | ||||||||||||
| Electronics | 205,256 | 29.5 | 216,544 | 33.6 | (11,288 | ) | (5.2 | )% | ||||||||||||||||
| PST | 82,589 | 11.9 | 95,258 | 14.8 | (12,669 | ) | (13.3 | )% | ||||||||||||||||
| Total net sales | $ | 695,977 | 100.0 | % | $ | 644,812 | 100.1 | % | $ | 51,165 | 7.9 | % | ||||||||||||
Our Control Devices segment net sales increased primarily as a result of new product sales and growth in the North American automotive market of $77.7 million and new program sales and increased volumes in our China automotive market of $4.5 million, which were partially offset by a decrease in the agricultural and other markets and the North American commercial vehicle market of $4.8 million and $2.3 million, respectively.
Our Electronics segment net sales decreased primarily as a result of a decrease in sales volume in our North American commercial vehicle products of $11.9 million, an unfavorable foreign currency translation of $4.8 million, and a decrease in sales of our European off-highway vehicle products of $0.8 million, which were partially offset by an increase in sales of European commercial vehicle products of $7.2 million.
Our PST segment net sales decreased primarily due to lower product volume resulting from continued weakness in the Brazilian economy and automotive market and an unfavorable foreign currency translation which reduced sales by $4.0 million, or 4.2%, which were partially offset by an increase in monitoring service sales volume.
Net sales by geographic location are summarized in the following table (in thousands):
| Dollar | Percent | |||||||||||||||||||||||
| increase / | increase / | |||||||||||||||||||||||
| Years ended December 31 | 2016 | 2015 | (decrease) | (decrease) | ||||||||||||||||||||
| North America | $ | 428,046 | 61.5 | % | $ | 369,032 | 57.2 | % | $ | 59,014 | 16.0 | % | ||||||||||||
| South America | 82,589 | 11.9 | 95,258 | 14.8 | (12,669 | ) | (13.3 | )% | ||||||||||||||||
| Europe and Other | 185,342 | 26.6 | 180,522 | 28.0 | 4,820 | 2.7 | % | |||||||||||||||||
| Total net sales | $ | 695,977 | 100.0 | % | $ | 644,812 | 100.0 | % | $ | 51,165 | 7.9 | % | ||||||||||||
The increase in North American net sales was primarily attributable to increased sales of our North American Control Devices automotive products of $77.7 million, which was partially offset by decreased volume in the North American commercial vehicle market of $11.9 million and decreased sales in the agricultural and various other markets of $4.8 million. The decrease in net sales in South America was primarily due to lower product sales volume as a result of continued weakness in the Brazilian economy and automotive market as well as the impact of an unfavorable foreign currency translation. The increase in net sales in Europe and Other was primarily due to an increase in sales volume of our European commercial vehicle products of $7.2 million and new program sales and increased sales volume in our Chinese automotive market of $4.5 million, which were partially offset by an unfavorable foreign currency translation of $4.8 million.
| 23 |
Cost of Goods Sold and Gross Margin. Cost of goods sold increased by 7.0% primarily related to an increase in sales in our Control Devices segment. Our gross margin improved by 0.7% to 28.1% in 2016 compared to 27.4% in 2015. Our material cost as a percentage of net sales increased by 0.1% to 51.5% in 2016 compared to 51.4% in 2015 while aggregated labor and overhead costs as a percentage of sales decreased by 0.8% due to increased sales and a change in product mix in our Control Devices segment. The lower material costs in our Electronics and PST segments due to a favorable change in foreign currency exchange rates were more than offset by higher direct material costs as a percentage of sales in our Control Devices segment resulting from a change in mix of products sold.
Our Control Devices segment gross margin decreased despite increased sales volume due to higher warranty related costs and an unfavorable change in mix of products sold.
Our Electronics segment gross margin increased primarily due to lower material costs resulting from a favorable movement in foreign currency exchange rates.
Our PST segment gross margin improved as a result of lower material costs resulting from a favorable movement in foreign currency exchange rates, which was substantially offset by lower sales volume and a $0.2 million increase in business realignment charges. PST business realignment charges were $0.4 million and $0.2 million for 2016 and 2015, respectively.
Selling, General and Administrative (“SG&A”). SG&A expenses increased by $0.8 million compared to 2015 as lower costs in our PST, Control Devices and Electronics segments were more than offset by higher costs in our unallocated corporate segment. SG&A costs in our unallocated corporate segment increased as a result of headquarter relocation costs of $1.8 million, higher wages, incentive-based compensation, higher consulting, professional, and legal fees of which a significant portion related to mergers and acquisitions (“M&A”) activity, which were partially offset by lower business realignment charges of $0.3 million. SG&A costs in our PST and Electronics segments decreased due to foreign currency translation resulting from movement in foreign currency exchange rates. PST SG&A costs also decreased due to lower employee costs as a result of business realignment actions, lower selling related expenses and professional fees and movement in foreign currency exchange rates, which were partially offset by a $0.6 million increase in business realignment costs. SG&A business realignment charges were $1.1 million and $0.5 million for 2016 and 2015, respectively.
Design and Development (“D&D”).D&D costs increased by $1.4 million primarily due to an $0.8 million increase in business realignment costs in our Electronics segment and an increase in product development costs in our Control Devices and Electronics segments. The increase in D&D costs in our Control Devices and Electronics segments were partially offset by lower employee costs as a result of business realignment actions, lower product design costs and movement in foreign currency exchange rates in our PST segment. D&D business realignment charges were $1.1 million and $0.3 million in 2016 and 2015, respectively.
Operating Income (Loss). Operating income (loss) is summarized in the following table by reportable segment (in thousands):
| Dollar | Percent | |||||||||||||||
| increase / | increase / | |||||||||||||||
| Years ended December 31 | 2016 | 2015 | (decrease) | (decrease) | ||||||||||||
| Control Devices | $ | 61,815 | $ | 44,690 | $ | 17,125 | 38.3 | % | ||||||||
| Electronics | 14,798 | 13,784 | 1,014 | 7.4 | % | |||||||||||
| PST | (3,462 | ) | (7,542 | ) | 4,080 | 54.1 | % | |||||||||
| Unallocated corporate | (29,069 | ) | (23,117 | ) | (5,952 | ) | (25.7 | )% | ||||||||
| Operating income | $ | 44,082 | $ | 27,815 | $ | 16,267 | 58.5 | % | ||||||||
Our Control Devices segment operating income increased primarily as a result of an increase in sales volume and lower SG&A costs, which were partially offset by higher warranty and D&D costs.
Our Electronics segment operating income increased despite lower sales volume due to a higher gross profit as material costs decreased as a result of a favorable change in foreign currency exchange rates and lower SG&A costs, which were partially offset by higher D&D costs primarily related to business realignment.
| 24 |
PST’s operating performance improved due to lower material costs resulting from a favorable change in foreign currency exchange rates compared to the prior year, lower SG&A and D&D employee costs as a result of the business realignment actions and movement in foreign currency exchange rates, which were partially offset by higher business realignment charges of $1.0 million.
Our unallocated corporate operating loss increased primarily as a result of higher wages, incentive-based compensation, headquarter relocation costs of $1.8 million and higher consulting, professional, and legal fees of which a significant portion related to M&A activity. These were partially offset by lower share-based compensation expense as 2015 included $2.2 million of expense for the acceleration of the vesting associated with the retirement of our former President and CEO while 2016 had $0.5 million of expense related to the modification of the retirement notice provisions of certain awards.
Operating income (loss) by geographic location are summarized in the following table (in thousands):
| Dollar | Percent | |||||||||||||||
| increase / | increase / | |||||||||||||||
| Years ended December 31 | 2016 | 2015 | (decrease) | (decrease) | ||||||||||||
| North America | $ | 34,220 | $ | 24,620 | $ | 9,600 | 39.0 | % | ||||||||
| South America | (3,462 | ) | (7,542 | ) | 4,080 | (54.1 | )% | |||||||||
| Europe and Other | 13,324 | 10,737 | 2,587 | 24.1 | % | |||||||||||
| Operating income | $ | 44,082 | $ | 27,815 | $ | 16,267 | 58.5 | % | ||||||||
Our North American operating results improved primarily due to increased sales in the North American automotive market which was partially offset by higher SG&A expenses in our unallocated corporate segment and higher warranty and D&D costs in our Control Devices segment. The improved performance in South America was primarily due to lower SG&A and D&D costs resulting from business realignment actions, which were partially offset by lower gross profit resulting a result of lower product sales volume and a $1.0 million increase in business realignment charges. Our results in Europe and Other improved as higher D&D costs primarily related to higher business realignment charges were more than offset by higher gross profit from lower material costs and SG&A expenses.
Interest Expense, net.Interest expense, net decreased by $0.1 million compared to the prior year primarily due to a lower average debt balance outstanding at Corporate and PST, which was offset by a higher weighted-average interest rate related to PST.
Equity in Earnings of Investee.Equity earnings for Minda increased primarily due to lower income tax expense as well as higher sales and operating income, which were partially offset by an unfavorable change in foreign currency translation.
Other Expense (Income), net. We record certain foreign currency transaction and forward currency hedge contract gains and losses as a component of other expense (income), net in the consolidated statement of operations. Other expense (income), net improved by $1.9 million due to an increase in net gains.
Income Tax Expense (Benefit) from continuing operations.We recognized an income tax benefit of $(36.4) million and $(0.5) million from continuing operations for federal, state and foreign income tax for 2016 and 2015, respectively. The effective tax rate decreased to (92.8)% in 2016 from (2.7)% in 2015. The increase in tax benefit and decrease in the effective rate for the year ended December 31, 2016 compared to the same period for 2015 was predominantly due to the impact of releasing the U.S. federal, certain state and foreign valuation allowances that were previously recorded against certain of our deferred tax assets.
| 25 |
Year Ended December 31, 2015 Compared To Year Ended December 31, 2014
Consolidated statements of operations as a percentage of net sales are presented in the following table (in thousands):
| Dollar | ||||||||||||||||||||
| increase / | ||||||||||||||||||||
| Years ended December 31 | 2015 | 2014 | (decrease) | |||||||||||||||||
| Net sales | $ | 644,812 | 100.0 | % | $ | 660,579 | 100.0 | % | $ | (15,767 | ) | |||||||||
| Costs and expenses: | ||||||||||||||||||||
| Cost of goods sold | 467,834 | 72.6 | 469,705 | 71.1 | (1,871 | ) | ||||||||||||||
| Selling, general and administrative | 110,371 | 17.1 | 123,630 | 18.7 | (13,259 | ) | ||||||||||||||
| Design and development | 38,792 | 6.0 | 41,609 | 6.3 | (2,817 | ) | ||||||||||||||
| Goodwill impairment | - | - | 51,458 | 7.8 | (51,458 | ) | ||||||||||||||
| Operating income (loss) | 27,815 | 4.3 | (25,823 | ) | (3.9 | ) | 53,638 | |||||||||||||
| Interest expense, net | 6,365 | 1.0 | 16,880 | 2.6 | (10,515 | ) | ||||||||||||||
| Equity in earnings of investee | (608 | ) | (0.1 | ) | (815 | ) | (0.1 | ) | 207 | |||||||||||
| Loss on early extinguishment of debt | - | - | 10,607 | 1.6 | (10,607 | ) | ||||||||||||||
| Other expense, net | 1,828 | 0.3 | 565 | 0.1 | 1,263 | |||||||||||||||
| Income (loss) before income taxes from continuing operations | 20,230 | 3.1 | (53,060 | ) | (8.1 | ) | 73,290 | |||||||||||||
| Income tax benefit from continuing operations | (547 | ) | (0.1 | ) | (1,856 | ) | (0.3 | ) | 1,309 | |||||||||||
| Income (loss) from continuing operations | 20,777 | 3.2 | (51,204 | ) | (7.8 | ) | 71,981 | |||||||||||||
| Discontinued operations: | ||||||||||||||||||||
| Loss from discontinued operations, net of tax | - | - | (811 | ) | (0.1 | ) | 811 | |||||||||||||
| Loss on disposal, net of tax | (210 | ) | - | (8,576 | ) | (1.3 | ) | 8,366 | ||||||||||||
| Loss from discontinued operations | (210 | ) | - | (9,387 | ) | (1.4 | ) | 9,177 | ||||||||||||
| Net income (loss) | 20,567 | 3.2 | (60,591 | ) | (9.2 | ) | 81,158 | |||||||||||||
| Net loss attributable to noncontrolling interest | (2,207 | ) | (0.3 | ) | (13,483 | ) | (2.0 | ) | 11,276 | |||||||||||
| Net income (loss) attributable to Stoneridge, Inc. | $ | 22,774 | 3.5 | % | $ | (47,108 | ) | (7.2 | )% | $ | 69,882 | |||||||||
Net Sales. Net sales for our reportable segments, excluding inter-segment sales are summarized in the following table (in thousands):
| Dollar | Percent | |||||||||||||||||||||||
| increase / | increase / | |||||||||||||||||||||||
| Years ended December 31 | 2015 | 2014 | (decrease) | (decrease) | ||||||||||||||||||||
| Control Devices | $ | 333,010 | 51.6 | % | $ | 306,658 | 46.4 | % | $ | 26,352 | 8.6 | % | ||||||||||||
| Electronics | 216,544 | 33.6 | 214,141 | 32.4 | 2,403 | 1.1 | % | |||||||||||||||||
| PST | 95,258 | 14.8 | 139,780 | 21.2 | (44,522 | ) | (31.9 | )% | ||||||||||||||||
| Total net sales | $ | 644,812 | 100.0 | % | $ | 660,579 | 100.0 | % | $ | (15,767 | ) | (2.4 | )% | |||||||||||
| 26 |
Our Control Devices segment net sales increased primarily due to new product sales and growth in the North American automotive market and new program sales in our China automotive market of $22.8 million and $4.1 million, respectively, as well as slightly higher volume in our commercial vehicle market during 2015. These were offset by a decrease in agricultural sales volume of $1.0 million.
Our Electronics segment net sales increased primarily due to an increase in sales volume of our European commercial vehicle products of $16.9 million as well as an increase in sales of our North American commercial vehicle products of $16.6 million (from higher volume related to an increase in post-disposition sales to the Wiring business acquired by Motherson of $15.0 million), which were substantially offset by an unfavorable foreign currency translation of $28.8 million, or 13.5%, and European commercial vehicle contractual price reductions of $2.4 million.
Our PST segment net sales decreased primarily due to an unfavorable foreign currency translation which reduced sales by $38.1 million, or 27.3%, and lower product volume. Also, PST’s audio/car alarm sales volume declined due to further weakening of the Brazilian economy and automotive market while monitoring service sales volume increased.
Net sales by geographic location are summarized in the following table (in thousands):
| Dollar | Percent | |||||||||||||||||||||||
| increase / | increase / | |||||||||||||||||||||||
| Years ended December 31 | 2015 | 2014 | (decrease) | (decrease) | ||||||||||||||||||||
| North America | $ | 369,032 | 57.2 | % | $ | 330,516 | 50.0 | % | $ | 38,516 | 11.7 | % | ||||||||||||
| South America | 95,258 | 14.8 | 139,780 | 21.2 | (44,522 | ) | (31.9 | )% | ||||||||||||||||
| Europe and Other | 180,522 | 28.0 | 190,283 | 28.8 | (9,761 | ) | (5.1 | )% | ||||||||||||||||
| Total net sales | $ | 644,812 | 100.0 | % | $ | 660,579 | 100.0 | % | $ | (15,767 | ) | (2.4 | )% | |||||||||||
The increase in North American net sales was primarily attributable to increased sales in our North American Control Devices’ automotive and Electronics’ commercial vehicle markets of $22.8 million and $16.6 million, respectively, which were partially offset by decreased agricultural volume of $1.0 million. The decrease in net sales in South America was primarily due to the impact of an unfavorable foreign currency translation and was also negatively impacted by lower product sales volume as a result of the weakened economic conditions in Brazil. Our decrease in net sales in Europe and Other was primarily due to an unfavorable foreign currency translation, which was substantially offset by increased sales of European commercial vehicle and Chinese automotive market products of $16.9 million and $4.1 million, respectively.
Cost of Goods Sold and Gross Margin. Cost of goods sold decreased by 0.4% primarily due to foreign currency translation resulting from changes in exchange rates between the functional currency of our Electronics and PST segments compared to the U.S. dollar. Offsetting the decline from foreign currency translation, cost of goods was negatively impacted by higher material costs resulting from significantly more unfavorable changes in foreign exchange rates compared to the prior year. Our material cost as a percentage of net sales increased to 51.2% for 2015 compared to 49.2% for 2014. As a result, our gross margin decreased by 1.5% to 27.4% for 2015 compared to 28.9% for 2014. The higher material costs were due to unfavorable movement in foreign currency exchange rates in our Electronics segment, which were partially offset by lower material costs in our Control Devices segment. The Company purchases the majority of its materials under contracts denominated in U.S. dollars. As such, the strengthening of the U.S. dollar against the Swedish krona, euro and Brazilian real throughout 2015 increased the material costs in our Electronics and PST segments.
Our Control Devices segment gross margin increased due to increased sales volume, lower material costs, a favorable mix of products sold and product redesign, which were partially offset by higher warranty costs principally related to one product and higher profit sharing.
Our Electronics segment gross margin decreased primarily due to higher material costs resulting from an unfavorable movement in foreign currency exchange rates, the impact of which was moderated by our foreign currency hedges.
| 27 |
Our PST segment gross margin remained flat as higher material costs resulting from an unfavorable change in foreign currency exchange rates were offset by a favorable sales mix, prices increases, product redesign, new supplier sourcing and lower business realignment charges. PST business realignment charges decreased to $0.2 million for 2015 from $0.9 million for 2014.
Selling, General and Administrative (“SG&A”).Administrative. SG&A expenses decreased by $13.3 million compared to 2014 as lower costs in our PST and Electronics segments were partially offset by higher costs in our unallocated corporate and Control Devices segments. SG&A costs in our PST and Electronics segments decreased primarily due to foreign currency translation resulting from movement in foreign currency exchange rates. SG&A costs in our unallocated corporate segment increased due to higher incentive-based compensation, higher recruitment, business realignment charges of $0.3 million and higher share-based compensation of $2.2 million in connection with the accelerated vesting associated with the retirement of our former President and CEO in June 2015, which were partially offset by lower professional fees. SG&A costs in our Control Devices segment increased primarily due to higher legal fees related to product litigation and an increase in incentive-based compensation. SG&A business realignment charges related to our Electronics, PST and unallocated corporate segments were $0.5 million for 2015 compared to $0.5 million related to PST for 2014.
Design and Development (“D&D”).Development.D&D costs decreased by $2.8 million primarily due to foreign currency translation resulting from movement in foreign currency exchange rates in our PST and Electronics segments which was offset by a slight increase in product development costs in our Control Devices segment. D&D business realignment charges related to our Electronics and PST segments were $0.3 million for 2015 compared to $0.2 million related to PST for 2014.
Goodwill Impairment. A goodwill impairment of $51.5 million was recorded for the year ended December 31, 2014 related to our PST segment. The impairment was due to the weakening of both the Brazilian economy and automotive market resulting in lower projected revenue and earnings growth. This non-cash impairment is more fully described in Note 2 to our consolidated financial statements.
Operating Income (Loss). Operating income (loss) is summarized in the following table by reportable segment (in thousands):
| Dollar | Percent | |||||||||||||||
| increase / | increase / | |||||||||||||||
| Years ended December 31 | 2015 | 2014 | (decrease) | (decrease) | ||||||||||||
| Control Devices | $ | 44,690 | $ | 35,387 | $ | 9,303 | 26.3 | % | ||||||||
| Electronics | 13,784 | 17,444 | (3,660 | ) | (21.0 | )% | ||||||||||
| PST | (7,542 | ) | (59,587 | ) | 52,045 | 87.3 | % | |||||||||
| Unallocated corporate | (23,117 | ) | (19,067 | ) | (4,050 | ) | (21.2 | )% | ||||||||
| Operating income (loss) | $ | 27,815 | $ | (25,823 | ) | $ | 53,638 | NM | ||||||||
NM – not meaningful
Our Control Devices segment operating income increased primarily due to an increase in sales volume, lower material costs, a favorable mix of products sold and product redesign, which were partially offset by higher warranty, SG&A and D&D costs.
Our Electronics segment operating income decreased due to a lower gross profit as material costs increased as a result of an unfavorable change in foreign currency exchange rates and $0.3 million of business realignment charges incurred in the current year, which were partially offset by lower SG&A and D&D costs resulting from movement in foreign currency exchange rates.
Our PST segment operating performance improved as 2014 results included a goodwill impairment charge of $51.5 million that was recorded in 2014. Excluding the goodwill impairment, PST’s operating performance improved by $0.5 million due to lower business realignment charges of $1.2 million, which were $0.4 million and $1.6 million for 2015 and 2014, respectively, as price increases, significant material cost reductions achieved from product redesign and new supplier sourcing were more than offset by significantly higher material costs resulting from more unfavorable changes in foreign currency exchange rates compared to the prior year.
| 28 |
Our unallocated corporate operating loss increased primarily due to higher share-based compensation primarily as a result of the acceleration of the vesting associated with the June 2015 retirement of our President and CEO of $2.2 million, higher incentive-based compensation, higher recruitment costs and business realignment charges of $0.3 million during 2015, which were partially offset by lower professional fees.
Operating income (loss) by geographic location are summarized in the following table (in thousands):
| Dollar | Percent | |||||||||||||||
| increase / | increase / | |||||||||||||||
| Years ended December 31 | 2015 | 2014 | (decrease) | (decrease) | ||||||||||||
| North America | $ | 24,620 | $ | 22,779 | $ | 1,841 | 8.1 | % | ||||||||
| South America | (7,542 | ) | (59,587 | ) | 52,045 | (87.3 | )% | |||||||||
| Europe and Other | 10,737 | 10,985 | (248 | ) | (2.3 | )% | ||||||||||
| Operating income (loss) | $ | 27,815 | $ | (25,823 | ) | $ | 53,638 | NM | ||||||||
Our North American operating results increased due to higher sales in the North American automotive and commercial vehicle markets, lower material costs and a favorable change in product mix, which was substantially offset by higher incentive-based and share-based compensation expense. The improved performance in South America was primarily due to the goodwill impairment charge of $51.5 million taken in 2014. Our results in Europe and Other declined slightly as higher material costs and an unfavorable movement in foreign currency exchange rates related to our Electronics segment were offset by higher sales and gross profit in our China automotive market.
Interest Expense, net.Interest expense, net decreased by $10.5 million compared to the prior year primarily due to a lower average debt balance outstanding and a lower weighted-average interest rate. We redeemed our $175.0 million 9.5% senior notes in September and October 2014 using borrowings of $100.0 million on our Credit Facility (which bore annual interest for 2015 of approximately 3.0%), proceeds from the sale of the Wiring business and existing cash.
Equity in Earnings of Investee.Equity earnings for Minda decreased to $0.6 million in 2015 from $0.8 million in 2014. While sales increased slightly over the prior year, the increase was more than offset by higher operating and financing costs and was negatively impacted by an unfavorable change in foreign currency translation.
Loss on Early Extinguishment of Debt. The Company recognized debt extinguishment loss of $10.6 million during 2014 due to the redemption of our senior notes and modification of our Credit Facility. The specific components of the debt extinguishment loss are described in Note 4 to our consolidated financial statements.
Other Expense, net. We record certain foreign currency transaction and forward currency hedge contract gains and losses as a component of other expense, net in the consolidated statement of operations. Other expense, net increased by $1.3 million to $1.8 million for 2015 from $0.6 million for 2014 due to increased volatility in certain foreign exchange rates in the current period. Also, the unfavorable foreign currency losses in 2014 were partially offset by a gain of $0.4 million on the termination of the interest rate swap.
Income Tax Benefit from Continuing Operations.continuing operations. We recognized an income tax benefit of $(0.5) million and $(1.9) million for federal, state and foreign income taxes for 2015 and 2014, respectively. We continue to assert that it is more-likely-than-notmore likely than not that our U.S. and certain foreign deferred tax assets will not be realized, and as such we provide a valuation allowance offsetting those deferred tax assets. The decrease in tax benefit for the year ended December 31, 2015 compared to the same period for 2014 was predominantly due to the impact of recording a valuation allowance against PST’s deferred tax assets. The increase in the effective tax rate to (2.7)% in 2015 from (3.5)% in 2014 was primarily due to providing a valuation allowance in 2015 with respect to the deferred tax assets of PST. The impact on the effective rate due to the PST valuation allowance was offset by the impact of the improvement in the performance of our U.S. operations, which do not attract tax due to the full valuation allowance, and the prior year impact of the nondeductible goodwill impairment in 2014 that did not impact the effective tax rate for 2015.
23
| 29 |
Year Ended December 31, 2014 Compared To Year Ended December 31, 2013Liquidity and Capital Resources
Consolidated statementsSummary of operations as a percentage of net sales are presented inCash Flows for the following tableyears ended December 31, 2016 and 2015 (in thousands):
| Dollar | ||||||||||||||||||||
| increase / | ||||||||||||||||||||
| Years ended December 31 | 2014 | 2013 | (decrease) | |||||||||||||||||
| Net sales | $ | 660,579 | 100.0 | % | $ | 659,486 | 100.0 | % | $ | 1,093 | ||||||||||
| Costs and expenses: | ||||||||||||||||||||
| Cost of goods sold | 469,705 | 71.1 | 453,531 | 68.8 | 16,174 | |||||||||||||||
| Selling, general and administrative | 123,630 | 18.7 | 123,180 | 18.7 | 450 | |||||||||||||||
| Design and development | 41,609 | 6.3 | 40,372 | 6.1 | 1,237 | |||||||||||||||
| Goodwill impairment | 51,458 | 7.8 | - | - | 51,458 | |||||||||||||||
| Operating income (loss) | (25,823 | ) | (3.9 | ) | 42,403 | 6.4 | (68,226 | ) | ||||||||||||
| Interest expense, net | 16,880 | 2.6 | 18,096 | 2.7 | (1,216 | ) | ||||||||||||||
| Equity in earnings of investee | (815 | ) | (0.1 | ) | (476 | ) | (0.1 | ) | (339 | ) | ||||||||||
| Loss on early extinguishment of debt | 10,607 | 1.6 | - | - | 10,607 | |||||||||||||||
| Other expense, net | 565 | 0.1 | 1,457 | 0.3 | (892 | ) | ||||||||||||||
| Income (loss) before income taxes from continuing operations | (53,060 | ) | (8.1 | ) | 23,326 | 3.5 | (76,386 | ) | ||||||||||||
| Income tax expense (benefit) from continuing operations | (1,856 | ) | (0.3 | ) | 2,797 | 0.4 | (4,653 | ) | ||||||||||||
| Income (loss) from continuing operations | (51,204 | ) | (7.8 | ) | 20,529 | 3.1 | (71,733 | ) | ||||||||||||
| Discontinued operations: | ||||||||||||||||||||
| Loss from discontinued operations, net of tax | (811 | ) | (0.1 | ) | (4,021 | ) | (0.6 | ) | 3,210 | |||||||||||
| Loss on disposal, net of tax | (8,576 | ) | (1.3 | ) | - | - | (8,576 | ) | ||||||||||||
| Loss from discontinued operations | (9,387 | ) | (1.4 | ) | (4,021 | ) | (0.6 | ) | (5,366 | ) | ||||||||||
| Net income (loss) | (60,591 | ) | (9.2 | ) | 16,508 | 2.5 | (77,099 | ) | ||||||||||||
| Net income (loss) attributable to noncontrolling interest | (13,483 | ) | (2.0 | ) | 1,377 | 0.2 | (14,860 | ) | ||||||||||||
| Net income (loss) attributable to Stoneridge, Inc. | $ | (47,108 | ) | (7.2 | )% | $ | 15,131 | 2.3 | % | $ | (62,239 | ) | ||||||||
Net Sales. Net sales for our reportable segments, excluding inter-segment sales are summarized in the following table (in thousands):
| Dollar | Percent | |||||||||||||||||||||||
| increase / | increase / | |||||||||||||||||||||||
| Years ended December 31 | 2014 | 2013 | (decrease) | (decrease) | ||||||||||||||||||||
| Control Devices | $ | 306,658 | 46.4 | % | $ | 291,145 | 44.1 | % | $ | 15,513 | 5.3 | % | ||||||||||||
| Electronics | 214,141 | 32.4 | 189,809 | 28.8 | 24,332 | 12.8 | % | |||||||||||||||||
| PST | 139,780 | 21.2 | 178,532 | 27.1 | (38,752 | ) | (21.7 | )% | ||||||||||||||||
| Total net sales | $ | 660,579 | 100.0 | % | $ | 659,486 | 100.0 | % | $ | 1,093 | 0.2 | % | ||||||||||||
Our Control Devices segment net sales increased due to higher volume primarily in our North American automotive and commercial vehicle markets of $13.6 million and $2.7 million, respectively, during 2014 when compared to 2013.
| Dollar | ||||||||||||
| increase / | ||||||||||||
| Years ended December 31, (in thousands) | 2016 | 2015 | (decrease) | |||||||||
| Net cash provided by (used for): | ||||||||||||
| Operating activities | $ | 65,277 | $ | 54,805 | $ | 10,472 | ||||||
| Investing activities | (23,824 | ) | (30,370 | ) | 6,546 | |||||||
| Financing activities | (43,371 | ) | (11,019 | ) | (32,352 | ) | ||||||
| Effect of exchange rate changes on cash and cash equivalents | (2,054 | ) | (2,076 | ) | 22 | |||||||
| Net change in cash and cash equivalents | $ | (3,972 | ) | $ | 11,340 | $ | (15,312 | ) | ||||
Our Electronics segment net sales increased primarily due to higher sales of our European and North American commercial vehicle products each ofCash provided by operating activities, which increased by $15.6 million. This was a result of higher volume including post-disposition sales toincludes cash flows from the Wiring business acquired by Motherson of $12.2 million and new product sales for 2014 when compared to 2013. These increases were partially offset by an unfavorable changediscontinued operations in foreign currency translation which reduced sales by approximately $7.0 million, or 4.0%.
Our PST segment net sales decreased during 2014 compared to the same period in 2013 due to lower product volume in its OEM, audio and aftermarket channels resulting from weakness in the Brazilian economy and automotive market as well as an unfavorable change in foreign currency translation which reduced sales by approximately $12.7 million, or 7.1%.
Net sales by geographic location are summarized in the following table (in thousands):
| Dollar | Percent | |||||||||||||||||||||||
| increase / | increase / | |||||||||||||||||||||||
| Years ended December 31 | 2014 | 2013 | (decrease) | (decrease) | ||||||||||||||||||||
| North America | $ | 330,516 | 50.0 | % | $ | 301,592 | 45.7 | % | $ | 28,924 | 9.6 | % | ||||||||||||
| South America | 139,780 | 21.2 | 178,532 | 27.1 | (38,752 | ) | (21.7 | )% | ||||||||||||||||
| Europe and Other | 190,283 | 28.8 | 179,362 | 27.2 | 10,921 | 6.1 | % | |||||||||||||||||
| Total net sales | $ | 660,579 | 100.0 | % | $ | 659,486 | 100.0 | % | $ | 1,093 | 0.2 | % | ||||||||||||
The increase in North American net sales was 2015, increasedprimarily attributable to increased sales volume in our North American commercial vehicle and automotive markets of $18.3 million and $13.6 million, respectively. Our decrease in net sales in South America was primarily due to lower PST product sales volume and the negative impact of unfavorable foreign currency translation. Our increase in net sales in Europe and Other was primarily due to increased sales of European commercial vehicle market products of $15.6 million, partially offset by an unfavorable change in foreign currency translation.
Cost of Goods Sold and Gross Margin. Cost of goods sold increased by 3.6% primarily due to higher material costs. Our material cost as a percentage of net sales increased to 49.2% for 2014 compared to 46.7% for 2013. As a result, our gross margin declined to 28.9% for 2014 compared to 31.2% for 2013. Material costs increased and gross margin declined primarily due to an unfavorable change in foreign currency exchange rates and an unfavorable mix of products sold in our Electronics and PST segments.
Our Control Devices segment gross margin increased slightly due to the benefit of increased sales volume and labor efficiencies.
Our Electronics segment gross margin declined despite an increase in sales due to higher material costs resulting from an unfavorable change in certain foreign currency exchange rates and an unfavorable change in mix of products sold.
Our PST segment gross margin declined due to lower sales volume, higher material costs due to an unfavorable change in foreign currency exchange rates and an unfavorable change in mix of products sold as well as an increase in labor costs which included $0.9 million in business realignment costs.
Selling, General and Administrative. SG&A expenses increased by $0.5 million for 2014 compared to 2013 due to higher wages and other employee benefits which included business realignment costs in our PST segment of $0.5 million, and higher performance-based compensation, product liability and intellectual property defense costs, which were partially offset by lower SG&A costs in our PST segment as a result of lower sales commissions, foreign currency translation and the implementation of cost savings measures.
Design and Development.D&D costs increased by $1.2 million due to higher product development costs in our Controls Devices segment and lower cost reimbursements in our Electronics segment, which were partially offset by lower product development costs in our PST segment.
Goodwill Impairment. A goodwill impairment of $51.5 million was recorded for the year ended December 31, 2014 related to our PST segment. The impairment was due to lower future sales and earnings growth projections resulting from significant weakening of the Brazilian economy and automotive market. This non-cash impairment is more fully described in Note 2 to our consolidated financial statements.
Operating Income (Loss). Operating income (loss) is summarized in the following table by reportable segment (in thousands):
| Dollar | Percent | |||||||||||||||
| increase / | increase / | |||||||||||||||
| Years ended December 31 | 2014 | 2013 | (decrease) | (decrease) | ||||||||||||
| Control Devices | $ | 35,387 | $ | 32,331 | $ | 3,056 | 9.5 | % | ||||||||
| Electronics | 17,444 | 20,732 | (3,288 | ) | (15.9 | )% | ||||||||||
| PST | (59,587 | ) | 7,211 | (66,798 | ) | NM | ||||||||||
| Unallocated corporate | (19,067 | ) | (17,871 | ) | (1,196 | ) | (6.7 | )% | ||||||||
| Operating income (loss) | $ | (25,823 | ) | $ | 42,403 | $ | (68,226 | ) | (160.9 | )% | ||||||
NM – not meaningful
Our Control Devices segment operating income increased due to an increase in sales volume and labor efficiencies,net income which werewas partially offset by higher designworking capital. Our receivable terms and development, SG&A personnel and product liability defense costs.collections rates have remained consistent between periods presented.
Our Electronics segment operating income decreased despite higher sales due to higher material costs resulting from an unfavorable change in certain foreign exchange rates and an unfavorable change in mix of products sold. Also, operating income decreased as a result of higher design and development, SG&A personnel and intellectual property defense costs.
Our PST segment operating performanceNet cash used for investing activities decreased due to a goodwill impairment charge of $51.5 million, lower sales volume, higher material costs due to an unfavorable change in foreign currency exchange rates and mix of products sold as well as increased labor costs including business realignment costs of $1.6 million, which were partially offset by lower other sales, general and administrative costs and design and development costs resulting from cost reduction measures implemented.
Unallocated corporate operating loss increased primarily due to higher performance-based compensation.
Operating income (loss) by geographic location are summarizedcapital expenditures in the following table (in thousands):
| Dollar | Percent | |||||||||||||||||||||||
| increase / | increase / | |||||||||||||||||||||||
| Years ended December 31 | 2014 | 2013 | (decrease) | (decrease) | ||||||||||||||||||||
| North America | $ | 22,779 | (88.3 | )% | $ | 18,538 | 43.7 | % | $ | 4,241 | 22.9 | % | ||||||||||||
| South America | (59,587 | ) | 230.8 | 7,211 | 17.0 | (66,798 | ) | NM | ||||||||||||||||
| Europe and Other | 10,985 | (42.5 | ) | 16,654 | 39.3 | (5,669 | ) | (34.0 | )% | |||||||||||||||
| Operating income (loss) | $ | (25,823 | ) | 100.0 | % | $ | 42,403 | 100.0 | % | $ | (68,226 | ) | (160.9 | )% | ||||||||||
Our North American operating results increased primarily as a result of increased sales in the North American commercial vehicle and automotive markets. The decrease in profitability in South America was primarily due to a PST goodwill impairment charge, lower sales volume, an unfavorable change in mix of products sold, increased labor costs and an unfavorable impact of foreign exchange rates. Our results in Europe and Othercurrent period. Also, there were negatively affected by higher material costs from an unfavorable change in foreign currency exchange rates and an unfavorable mix of product sales and higher SG&A expenses substantially all of whichpayments related to our Electronics segment.
Interest Expense, net.Interest expense, net decreased by $1.2 million, or 6.7% during 2014 when compared to 2013 primarily due to a lower average debt balance outstanding and a lower weighted-average interest rate. We redeemed our $175.0 million 9.5% senior notes in September and October 2014 using borrowings of $100.0 million on our Credit Facility (which bore annual interest of approximately 1.7% in the fourth quarter of 2014), proceeds from the sale of the Wiring business and existing cash.of $1.2 million in 2015, which did not recur in 2016.
Equity in Earnings of Investee.Equity earningsNet cash used for Mindafinancing activities increased to $0.8 million from $0.5 million in 2013 primarily due to higher sales, which were partially offset by unfavorable changes in foreign currency translation.
Loss on Early Extinguishment of Debt. The Company recognized debt extinguishment loss of $10.6 million during 2014 due to the redemption of our senior notes and modificationunplanned partial repayment of our Credit Facility. The specific componentsFacility of the debt extinguishment loss are described in Note 4 to our consolidated financial statements.
Other Expense, net. Other expense, net was $0.6 million for 2014 compared to $1.5 million for 2013. We record certain foreign currency transaction and forward currency hedge contract gains and losses as a component of other expense, net on the consolidated statement of operations. Our results for 2014 and 2013 were unfavorably affected by approximately $1.2 million and $2.1 million, respectively, due to the volatility in certain foreign exchange rates. The majority of the unfavorable foreign currency loss for 2014 relates to the currency fluctuation of the Argentinian peso compared to the Brazilian real in our PST segment. The unfavorable foreign currency losses were partially offset by the gain of $0.4 million in 2014 on the termination of our interest rate swap and income of $0.6 million received in 2013 by our PST segment associated with deposits at a financial institution.
Income Tax Expense (Benefit) from Continuing Operations. We recognized income tax expense (benefit) of $(1.9) million and $2.8 million for federal, state and foreign income taxes for 2014 and 2013, respectively. We continue to assert that it is more-likely-than-not that our U.S. and certain foreign deferred tax assets will not be realized, and therefore we provide a valuation allowance offsetting those deferred tax assets. The decrease in tax expense for 2014 compared to 2013 was predominantly due to the tax benefit recognized on the loss incurred by PST, as adjusted for the non-tax deductible goodwill impairment charge. The decrease in the tax expense was partially offset by a discrete tax item related to our foreign operations recorded during the current period. The decrease in the effective tax rate for 2014 to (3.5)% compared to 2013 of 12.0% was due to the 2014 recognition of a tax benefit on the PST operating loss which was offset by the impact of the non-tax deductible PST goodwill impairment charge and the discrete tax item discussed above.
Liquidity and Capital Resources$33.0 million.
Summary of Cash Flows for the years ended December 31, 2015 and 2014 (in thousands):
| Dollar | Dollar | |||||||||||||||||||||||
| increase / | increase / | |||||||||||||||||||||||
| Years ended December 31 | 2015 | 2014 | (decrease) | |||||||||||||||||||||
| Years ended December 31, (in thousands) | 2015 | 2014 | (decrease) | |||||||||||||||||||||
| Net cash provided by (used for): | ||||||||||||||||||||||||
| Operating activities | $ | 54,805 | $ | 19,815 | $ | 34,990 | $ | 54,805 | $ | 19,815 | $ | 34,990 | ||||||||||||
| Investing activities | (30,370 | ) | 45,720 | (76,090 | ) | (30,370 | ) | 45,720 | (76,090 | ) | ||||||||||||||
| Financing activities | (11,019 | ) | (82,058 | ) | 71,039 | (11,019 | ) | (82,058 | ) | 71,039 | ||||||||||||||
| Effect of exchange rate changes on cash and cash equivalents | (2,076 | ) | (3,281 | ) | 1,205 | (2,076 | ) | (3,281 | ) | 1,205 | ||||||||||||||
| Net change in cash and cash equivalents | $ | 11,340 | $ | (19,804 | ) | $ | 31,144 | $ | 11,340 | $ | (19,804 | ) | $ | 31,144 | ||||||||||
Cash provided by operating activities, which includes cash flows from the Wiring discontinued operations, increased primarily due to lower working capital required as a result of the sale of the Wiring business in August 2014 of $28.5 million and an increase in net income excluding the impacts of the non-cash PST goodwill impairment, loss on extinguishment of debt and the loss on sale of the Wiring business in 2014 of $10.5 million. Our receivable terms and collections rates have remained consistent between periods presented.
Net cash used for investing activities increased due to higher capital expenditures of $4.0 million primarily to support the launch of new products as well as a repayment of excess proceeds received from Motherson of $1.2 million based on the resolution of the working capital and other adjustments associated with the sale of the Wiring business. Also, $71.4 million in cash was received from the sale of the Wiring business in 2014.
Net cash used for financing activities decreased primarily due to the fact that in 2015 we had net debt repayments of $8.0 million and repurchases of Common Shares to satisfy tax withholdings of $2.9 million while in 2014 we repurchased $175.0 million of our outstanding senior notes including a redemption premium totaling $183.0 million partially by borrowing $100.0 million on our Credit Facility.
| 30 |
Summary of Cash Flows for the years ended December 31, 2014 and 2013 (in thousands):
| Dollar | ||||||||||||
| increase / | ||||||||||||
| Years ended December 31 | 2014 | 2013 | (decrease) | |||||||||
| Net cash provided by (used for): | ||||||||||||
| Operating activities | $ | 19,815 | $ | 43,684 | $ | (23,869 | ) | |||||
| Investing activities | 45,720 | (25,237 | ) | 70,957 | ||||||||
| Financing activities | (82,058 | ) | (503 | ) | (81,555 | ) | ||||||
| Effect of exchange rate changes on cash and cash equivalents | (3,281 | ) | 326 | (3,607 | ) | |||||||
| Net change in cash and cash equivalents | $ | (19,804 | ) | $ | 18,270 | $ | (38,074 | ) | ||||
The decrease in cash provided by operating activities for the year ended December 31, 2014 compared to the year ended December 31, 2013 was primarily due to higher working capital levels as well as a $6.5 million decrease in net income excluding the impacts of the non-cash PST goodwill impairment and losses on the sale of the Wiring business and early extinguishment of debt. Our receivable terms and collections rates have remained consistent between periods presented.
The increase in net cash provided by investing activities for 2014 was due to $71.4 million in cash received from the sale of the Wiring business, which was partially offset by a $0.6 million increase in capital expenditures.
The increase in net cash used for financing activities for 2014 was due to the redemption of our senior notes including redemption premium totaling $183.0 million, which was partially offset by net borrowings on our Credit Facility and other debt of $100.0 million and $4.5 million, respectively.
Summary of Future Cash Flows
The following table summarizes our future cash outflows resulting from financial contracts and commitments, as of December 31, 20152016 (in thousands):
| Less than | After | Less than | After | |||||||||||||||||||||||||||||||||||||
| Total | 1 year | 2-3 years | 4-5 years | 5 years | Total | 1 year | 2-3 years | 4-5 years | 5 years | |||||||||||||||||||||||||||||||
| Credit Facility | $ | 100,000 | $ | - | $ | - | $ | 100,000 | $ | - | $ | 67,000 | $ | - | $ | - | $ | 67,000 | $ | - | ||||||||||||||||||||
| Debt | 18,363 | 13,905 | 2,859 | 1,296 | 303 | 16,686 | 8,626 | 6,907 | 1,153 | - | ||||||||||||||||||||||||||||||
| Operating leases | 21,151 | 4,436 | 7,012 | 4,822 | 4,881 | 23,378 | 5,042 | 7,278 | 4,882 | 6,176 | ||||||||||||||||||||||||||||||
| Total contractual obligations | $ | 139,514 | $ | 18,341 | $ | 9,871 | $ | 106,118 | $ | 5,184 | $ | 107,064 | $ | 13,668 | $ | 14,185 | $ | 73,035 | $ | 6,176 | ||||||||||||||||||||
Management will continue to focus on minimizingefficiently managing its weighted-average cost of capital and believes that cash flows from operations and the availability of funds from our Credit Facility will provideprovides sufficient liquidity to meet our future growth and operating needs.
As outlined in Note 4 to our consolidated financial statements, our Credit Facility permits borrowing up to a maximum level of $300.0 million which includes an accordion feature which allows the Company to increase the availability by up to $80.0 million upon the satisfaction of certain conditions. This variable rate facility provides us with lower borrowing rates than the 9.5% senior notes redeemed in 2014 and provides the flexibility to refinance other outstanding debt or finance acquisitions through September 2019.2021. The Credit Facility contains certain financial covenants that require the Company to maintain less than a maximum leverage ratio and more than a minimum interest coverage ratio. The Credit Facility also contains affirmative and negative covenants and events of default that are customary for credit arrangements of this type including covenants which place restrictions and/or limitations on the Company’s ability to borrow money, make capital expenditures and pay dividends. The Credit Facility had an outstanding balance of $100.0$67.0 million at December 31, 2015.2016. The Company has outstanding letters of credit of $3.4 million. The Company was in compliance with all covenants at December 31, 2015.2016. The covenants included in our Credit Facility to date have not and are not expected to limit our financing flexibility.
PST maintains several short-term obligations and long-term loans used for working capital purposes. At December 31, 2015,2016, there was $18.0$16.5 million outstanding on the PST term loans. The PST loans at December 31, 20152016 mature as follows: $13.5 million in 2016, $1.9$8.5 million in 2017, $1.0$4.3 million in 2018, and$2.6 million in 2019, and $0.3$0.6 million in 2020, and $0.5 million in 2021.
The Company's wholly owned subsidiary located in Stockholm, Sweden, has an overdraft credit line which allows overdrafts on the subsidiary's bank account up to a maximum level of 20.0 million Swedish krona, or $2.4$2.2 million, at December 31, 2015.2016. At December 31, 2015,2016, there were no overdrafts on the bank account.
Although the Company's debt and Credit Facility contain various covenants, the violation of which would limit or preclude their use or accelerate the maturity, the Company has not experienced and does not expect these covenants to restrict our financing flexibility. The Company has been and expects to continue to remain in compliance with these covenants during the term of the debt and credit facilities.
Our future results could also be adversely affected by unfavorable foreign currency exchange rates. We have significant foreign denominated transaction exposure in certain countries, especially in Brazil, Argentina, Mexico, Sweden, Estonia and China. We have entered into foreign currency forward contracts to reduce our exposure related to certain foreign currency fluctuations. See Note 9 to the consolidated financial statements for additional details. Our future results could also be unfavorably affected by increased commodity prices as commodity fluctuations impact the cost of our raw material purchases.
At December 31, 2015,2016, we had cash and cash equivalents of approximately $54.4$50.4 million, of which $27.9$15.9 million was held in the United States and $26.5$34.5 million was held in foreign locations. While certain cash and cash equivalents held in foreign locations can be repatriated through the repayment of intercompany loans without creating additional income tax expense, the remainder is considered to be indefinitely invested. The increasedecrease from $43.0$54.4 million at December 31, 20142015 was primarily due to an improvement in workingthe repayments of the Credit Facility, capital expenditures and earnings for the year ended December 31, 2015.repurchase of common shares to satisfy employee tax withholding obligations which was offset by cash flows from operations.
Commitments and Contingencies
See Note 10 to the consolidated financial statements for disclosures of the Company’s commitments and contingencies.
Seasonality
Our Control Devices and Electronics segments are not typically materially affected by seasonality, however the demand for our PST segment consumer products is typically higher in the second half of the year, the fourth quarter in particular.
| 31 |
Inflation and International Presence
GivenBy operating internationally, we are affected by foreign currency exchange rates and the economic conditions of certain countries. Furthermore, given the current economic climate and recent fluctuations in certain commodity prices, we believe that an increase in such items could significantly affect our profitability. Furthermore, by operating internationally, we are affected by foreign currency exchange rates and the economic conditions of certain countries. See Note 9 to the consolidated financial statements for additional details on the Company’s commodity price and foreign currency exchange rate risks.
Off-balance Sheet Arrangements
At December 31, 2015,2016, wedo not have any off-balance sheet arrangements that have, or are, in the opinion of management, reasonably likely to have, a current or future material effect on our financial condition or results of operations.
Critical Accounting Policies and Estimates
The preparation of financial statements in conformity with U.S. Generally Accepted Accounting Principles (“GAAP”) requires management to make estimates and assumptions that affect the reported amounts of assets and liabilities and the disclosure of contingent liabilities at the date of the consolidated financial statements, and the reported amounts of revenues and expenses during the reporting period.
On an ongoing basis, we evaluate estimates and assumptions used in our consolidated financial statements. We base our estimates on historical experience and on various other factors that we believe to be reasonable under the circumstances, the results of which form the basis for making judgments about the carrying values of assets and liabilities that are not readily apparent from other sources. Actual results could differ from these estimates.
Our critical accounting policies, those most important to the financial presentation and those that are the most complex, subjective or require significant judgment, are as follows.
RevenueRecognition and Sales Commitments.We recognize revenues from the sale of products, net of actual and estimated returns of products sold based on historical authorized returns, at the point of passage of title, which is either at the time of shipment or upon customer receipt based on the terms of the sale. We often enter into agreements with our customers at the beginning of a given vehicle’s expected production life. Once such agreements are entered into, it is our obligation to fulfill the customers’ purchasing requirements for the entire production life of the vehicle. These agreements are subject to potential renegotiation from time to time, which may affect product pricing. In certain limited instances, we may be committed under existing agreements to supply products to our customers at selling prices which are not sufficient to cover the direct cost to produce such products. In such situations, we recognize losses immediately. These agreements generally may also be terminated by our customers at any time.
On an ongoing basis, we receive blanket purchase orders from our customers, which include pricing terms. Purchase orders do not always specify quantities. We recognize revenue based on the pricing terms included in our purchase orders as our products are shipped to our customers. In certain instances, we may be asked to provide our customers with annual cost reductions as part of certain agreements. In addition, we have ongoing adjustments to our pricing arrangements with our customers based on the related content, the cost of our products and other commercial factors. Such pricing adjustments are recognized as they are negotiated with our customers.
Warranties.Our warranty liability is established based on our best estimate of the amounts necessary to settle existing and future claims on products sold as of the balance sheet dates. This estimate is based on historical trends of units sold and payment amounts, combined with our current understanding of the status of existing claims. To estimate the warranty liability, we are required to forecast the resolution of existing claims as well as expected future claims on products previously sold. Although we believe that our warranty liability is adequate and that the judgment applied is appropriate, such amounts estimated to be due and payable could differ materially from what will actually transpire in the future. Our customers are increasingly seeking to hold suppliers responsible for product warranties, which could negatively impact our exposure to these costs.
| 32 |
Allowance for Doubtful Accounts. We have concentrations of sales and trade receivable balances with key customers. Therefore, it is critical that we evaluate the collectability of accounts receivable based on a combination of factors. In circumstances where we are aware of a specific customer’s inability to meet their financial obligations, a specific allowance for doubtful accounts is recorded against amounts due to reduce the net recognized receivable to the amount we reasonably believe will be collected. In addition, we review historical trends for collectability in determining an estimate for our allowance for doubtful accounts. If economic circumstances change substantially, estimates of the recoverability of amounts due to the Company could be reduced by a material amount. We do not have collateral requirements with our customers.
Contingencies. We are subject to legal proceedings and claims, including product liability claims, commercial or contractual disputes, environmental enforcement actions and other claims that arise in the normal course of business. We routinely assess the likelihood of any adverse judgments or outcomes to these matters, as well as ranges of probable losses, by consulting with internal personnel principally involved with such matters and with our outside legal counsel handling such matters.
We have accrued for estimated losses when it is probable that a liability or loss has been incurred and the amount can be reasonably estimated. Contingencies by their nature relate to uncertainties that require the exercise of judgment both in assessing whether or not a liability or loss has been incurred and estimating that amount of probable loss. The liabilities may change in the future due to new developments or changes in circumstances. The inherent uncertainty related to the outcome of these matters can result in amounts materially different from any provisions made with respect to their resolution.
Inventory Valuation.Inventories are valued at the lower of cost or market using the FIFO method for our Electronics and Control Devices segments and average cost method for our PST segment. Where appropriate, standard cost systems are utilized for purposes of determining cost and the standards are adjusted as necessary to approximate actual costs. Estimates of the lower of cost or marketnet realizable value of inventory are determined based upon current economic conditions, historical sales quantities and patterns and, in some cases, the specific risk of loss on specifically identified inventories.We adjust our excess and obsolescence reserve at least on a quarterly basis. Excess inventories are quantities of items that exceed anticipated sales or usage for a reasonable period.
Long-Lived and Finite-Lived Assets.We review the carrying value of our long-lived assets and finite-lived intangible assets for impairment when events or circumstances indicate that their carrying value may not be recoverable. Factors that we consider important that could trigger our testing of the related asset groups for an impairment include current period operating or cash flow losses combined with a history of operating or cash flow losses, a projection or forecast that demonstrates continuing losses, significant adverse changes in the business climate within a particular business or current expectations that a long-lived asset will be sold or otherwise disposed of significantly before the end of its estimated useful life. To test for impairment, the estimated undiscounted cash flows expected to be generated from the use and disposal of the asset or asset group is compared to its carrying value. An asset group is established by identifying the lowest level of cash flows generated by the group of assets that are largely independent of cash flows of other assets. If cash flows cannot be separately and independently identified for a single asset, we will determine whether an impairment has occurred for the group of assets for which we can identify projected cash flows. If these undiscounted cash flows are less than their respective carrying values, an impairment charge would be recognized to the extent that the carrying values exceed estimated fair values. The estimation of undiscounted cash flows and fair value requires us to make assumptions regarding future operating results. The results of the impairment testing are dependent on these estimates which require judgment. The occurrence of certain events, including changes in economic and competitive conditions, could impact cash flows eventually realized and management’s ability to accurately assess whether an asset is impaired.
Due to lower actual and forecasted financial results from weakness in the Brazilian economy and automotive market, the Company performed an evaluation of PST’s long-lived assets in the fourth quarter of 2015 and 2014, and concluded that there was no impairment resulting from the decrease in forecasted undiscounted future cash flows.
Share-Based Compensation.The estimate for our share-based compensation expense involves a number of assumptions. We believe each assumption used in the valuation is reasonable because it takes into account the experience of the plan and reasonable expectations associated with performance and market based conditions. We estimate volatility and forfeitures based on historical data, future expectations and the expected term of the share-based compensation awards. The assumptions, however, involve inherent uncertainties. As a result, if other assumptions had been used, share-based compensation expense could have varied.
| 33 |
Income Taxes.Deferred income taxes are provided for temporary differences between amountsthe amount of assets and liabilities for financial reporting purposes and the basis of such assets and liabilities as measured by tax laws and regulations. Our deferred tax assets include, among other items, net operating loss carryforwards and tax credits that can be used to offset taxable income in future periods and reduce income taxes payable in those future periods. Our U.S. federal net operating losses, if unused, begin to expire in 2026,2030, the state net operating losses expire at various times and the foreign net operating losses expire at various times or have indefinite expiration dates. Our U.S. federal general business credits, if unused, begin to expire in 2021, and the state and foreign tax credits expire at various times.
Accounting standards require that deferred tax assets be reduced by a valuation allowance if, based on all available evidence, it is considered more likely than not that some portion or all of the recorded deferred tax assets will not be realized in future periods. This assessment requires significant judgment, and in making this evaluation, the Company considers available positive and negative evidence, including the potential to carryback net operating losses and credits, the future reversalrelease of certain taxable temporary differences, actual and forecasted results, and tax planning strategies that are both prudent and feasible. Risk factors include U.S. and BrazilBrazilian economic conditions that affect the U.S. and BrazilBrazilian automotive and commercial vehicle markets of which the Company has significant operations.
Reversal of a previously recognized valuation allowance would result in the recognition of certain deferred tax assets and a decrease to income tax expense for the period the reversal is recorded. However, the exact timing and amount of the valuation allowance release are subject to change on the basis of the level of profitability that we are able to actually achieve.
During the fourth quarter of 2008, the Company concluded that it was more-likely-than-not that we would not realize our U.S. deferred tax assets. As a result we provided a full valuation allowance, net of certain future reversing taxable temporary differences, with respect to our U.S. deferred tax assets. We will continue to maintain a full valuation allowance on our U.S. deferred tax assets until there is sufficient positive evidence to support the reversal of all or some portion of these allowances. However, as a result of the sale of the Wiring business and debt refinancing during the second half of 2014 and anticipated future earnings, we believe that there may be a reasonable possibility that sufficient positive evidence could develop within the next 12 months that may allow us to reach a conclusion that some or all of the valuation allowance on our U.S. deferred tax assets will no longer be needed.
During the fourth quarter of 2015, the Company concluded that it was more-likely-than-not that we would not realize our PST segment deferred tax assets. As a result we provided a full valuation allowance, net of certain future reversing taxable temporary differences, with respect to PST’s deferred tax assets. We will continue to maintain a full valuation allowance on PST’s deferred tax assets until there is sufficient evidence to support the reversal of all or some portion of them.
We consider the financial reporting basis in excess of tax basis, which includes unremitted earnings, of certain non-U.S. subsidiaries to be indefinitely invested outside the United States on the basis of estimates that future domestic cash generation will be sufficient to meet future domestic cash needs and our specific plans for investment in those non-U.S. subsidiaries. Therefore, we have not recorded a deferred tax liability. Specifically with respect to unremitted earnings and the impact of those earnings on the amount of the financial reporting basis in excess of tax basis, if in the future we cannot support that the earnings are indefinitely invested outside the United States, we would need to adjust our income tax provision in the period that we determineddetermine that the earnings will no longer be indefinitely invested outside the United States (see Note 5).
Recently Issued Accounting Standards Not Yet Adopted
In January 2017, the Financial Accounting Standards Board ("FASB") issued Accounting Standards Update ("ASU") 2017-04, "Simplifying the Test for Goodwill Impairment." It eliminates Step 2 from the goodwill impairment test and an entity should recognize an impairment charge for the amount by which the carrying amount of goodwill exceeds the reporting unit's fair value, not to exceed the carrying amount of goodwill. This guidance is effective for annual and any interim impairment tests in fiscal years beginning after December 15, 2019. The Company does not expect this standard to have any impact on its consolidated financial statements.
In January 2017, the FASB also issued ASU 2017-01, "Clarifying the Definition of a Business. It revises the definition of a business and provides a framework to evaluate when an input and a substantive process are present in an acquisition to be considered a business. This guidance is effective for annual periods beginning after December 15, 2017. The Company expects to adopt this standard as of January 1, 2018, which is not expected to have any impact on its consolidated financial statements.
In August 2016, the FASB issued ASU 2016-15, “Statement of Cash Flows - Classification of Certain Cash Receipts and Cash Payments (Topic 230)” which provides guidance on the presentation and classification of certain cash receipts and cash payments in the statement of cash flows in order to reduce diversity in practice. The ASU is effective for interim and annual periods beginning after December 15, 2017 with early adoption permitted. The Company is currently evaluating the impact of adopting this standard on its consolidated financial statements.
| 34 |
In March 2016, the FASB issued ASU 2016-09, “Compensation - Stock Compensation (Topic 718)” which is intended to simplify several aspects of the accounting for share-based payment award transactions including how excess tax benefits should be classified in the Company’s consolidated financial statements. The new standard simplifies the treatment of share based payment transactions by recognizing the impact of excess tax benefits or deficiencies related to exercised or vested awards in income tax expense in the period of exercise or vesting. The new standard also modifies the diluted earnings per share calculation using the treasury stock method by eliminating the excess tax benefits or deficiencies from the calculation. These changes will be recognized prospectively. The new standard also permits companies to recognize forfeitures as they occur as an alternative to utilizing estimated forfeitures rates which has been the required practice. The presentation of excess tax benefits in the statement of consolidated cash flows is also modified to be included with other income tax cash flows as an operating activity. The change can be adopted using a prospective or retrospective transition method. The new standard clarifies that cash paid by an employer when directly withholding shares for tax withholding purposes should be presented as a financing activity in the statement of consolidated cash flows and should be applied retrospectively. The new accounting standard will be effective for fiscal years beginning after December 15, 2016, including interim periods within that year. The Company had unrecognized tax benefits related to share-based payment awards of $1.7 million as of December 31, 2016. Upon adoption, this amount will be recorded to other long-term assets with a corresponding increase to retained earnings associated with the cumulative effect of the accounting change.
In February 2016, the Financial Accounting Standards Board (“FASB”)FASB issued Accounting Standards Update (“ASU”)ASU 2016 – 02, “Leases (Topic 842)”, which will require that a lessee recognize assets and liabilities on the balance sheet for all leases with a lease term of more than twelve months, with the result being the recognition of a right of use asset and a lease liability. The amendment is effective for fiscal years, and interim periods within those fiscal years, beginning after December 15, 2018. The Company expects to adopt this standard as of January 1, 2019. The Company is currently evaluating the impact of adopting this standard on its consolidated financial statements, which will require right of use assets and lease liabilities be recorded in the consolidated balance sheet for operating leases.
In November 2015, the FASB issued ASU 2015 – 17, “Income Taxes (Topic 740),” which simplifies the presentation of deferred income taxes. Currently entities are required to separate deferred income tax liabilities and assets into current and noncurrent amounts in the balance sheet on a jurisdiction by jurisdiction basis. ASU 2015-17 requires that all deferred income taxes be classified as noncurrent in the balance sheet. The requirement to apply the jurisdiction by jurisdiction approach will still be required. The amendment is effective for fiscal years beginning after December 15, 2016 including interim periods within those fiscal years and may be applied either prospectively or retrospectively with early adoption permitted. The Company is currently evaluating the impact of adopting this standard on its consolidated financial statements.
In September 2015, the FASB issued ASU 2015 – 16, “Business Combinations,” which simplifies the accounting for measurement-period adjustments related to business combinations. ASU 2015-16 requires that an acquirer recognize adjustments to provisional amounts that are identified during the measurement period in the reporting period in which the adjustment amounts are determined. The amendments in the ASU require that the acquirer record, in the same period’s financial statements, the effect on earnings of changes in depreciation, amortization, or other income effects, if any, as a result of the change to the provisional amounts, calculated as if the accounting had been completed at the acquisition date. The amendment is effective for fiscal years beginning after December 15, 2015, including interim periods within those fiscal years and is to be applied prospectively to adjustments to provisional amounts that occur after the effective date of this ASU with earlier application permitted for financial statements that have not been issued. The Company will adopt this standard as of January 1, 2016, which is not expected to have a material impact on the Company’s consolidated financial statements or disclosures.
In July 2015, the FASB issued ASU 2015 – 11 “Simplifying the Measurement of Inventory” which requires that inventory be measured at the lower of cost or net realizable value. Prior to the issuance of the new guidance, inventory was measured at the lower of cost or market. Replacing the concept of market with the single measurement of net realizable value is intended to reduce cost and complexity. The new accounting standard is effective for fiscal years beginning after December 15, 2016. The Company expects towill adopt this standard as of January 1, 2017, which is not expected to have a material impact on the Company’s consolidated financial statements or disclosures.
In May 2014, the FASB issued ASU 2014-09 “Revenue from Contracts with Customers,” which is the new comprehensive revenue recognition standard that will supersede existing revenue recognition guidance under U.S. GAAP. The standard's core principle is that a company will recognize revenue when it transfers promised goods or services to a customer in an amount that reflects the consideration to which the company expects to be entitled in exchange for those goods or services. To achieve this principle, an entity identifies the contract with a customer, identifies the separate performance obligations in the contract, determines the transaction price, allocates the transaction price to the separate performance obligations and recognizes revenue when each separate performance obligation is satisfied. This ASU allows for both retrospective and prospective methods of adoption. In July 2015, the FASB approved a one-year deferral of the effective date of the standard. As such, theThe new standard will becomeis effective for annual and interim periods beginning after December 15, 2017 with early adoption on the original effective date permitted. The Company is currently evaluating the impact of adopting this standard on its consolidated financial statements.statements, and anticipate testing our new controls and processes designed to comply with the standard in 2017 to permit the Company’s adoption on January 1, 2018. The Company anticipates changes to revenue recognition of pre-production activities such as customer funded tooling and engineering design and development cost recoveries, including the potential recording of these as revenue.
32
Recently Adopted Accounting Standards
In AprilSeptember 2015, the FASB issued ASU 2015-03, “Simplifying the Presentation of Debt Issuance Costs,2015 – 16, “Business Combinations,” which amendssimplifies the current presentation of certain debt issuance costsaccounting for measurement-period adjustments related to business combinations. ASU 2015-16 requires that an acquirer recognize adjustments to provisional amounts that are identified during the measurement period in the balance sheet. ASU 2015-03 requires that debt issuance costs related to a recognized debt liability be presentedreporting period in which the adjustment amounts are determined. The amendments in the balance sheetASU require that the acquirer record, in the same period’s financial statements, the effect on earnings of changes in depreciation, amortization, or other income effects, if any, as a direct deduction fromresult of the carrying amountchange to the provisional amounts, calculated as if the accounting had been completed at the acquisition date. The Company adopted this standard as of that debt liability, consistent with debt discounts, instead of as an asset.January 1, 2016, and was applied prospectively. The recognition and measurement of debt issuance costs are not affected by the amendments in this ASU. The guidance in ASU 2015-03adoption did not address the presentation or subsequent measurement of debt issuance costs related to line of credit arrangements. Given the absence of authoritative guidance, in June 2015 the FASB issued ASU 2015-15, “Presentation and Subsequent Measurement of Debt Issuance Costs Associated with Line-of-Credit Arrangements,” which states that the SEC will not object to an entity deferring and presenting debt issuance costs related to revolving credit arrangements as an asset and subsequently amortizing them. These amendments are to be applied retrospectively and are effective for public companies for fiscal years, and for interim periods within those fiscal years, beginning after December 15, 2015, with early adoption permitted. As permitted by the ASU, the Company adopted these standards in the third quarter of 2015, which had nohave a material impact on the Company’s consolidated financial statements.statements or disclosures.
| 35 |
In November 2015, the FASB issued ASU 2015 – 17, “Income Taxes (Topic 740),” which simplifies the presentation of deferred income taxes. Under previous guidance, entities were required to separate deferred income tax liabilities and assets into current and noncurrent amounts in the balance sheet on a jurisdiction by jurisdiction basis. ASU 2015-17 requires that all deferred income taxes be classified as noncurrent in the balance sheet. The Company has elected to continue to presentadopted this standard in 2016 and applied it prospectively. As such, all deferred financing costs related to its Credit Facility, which had balances of $1,428tax asset and $1,767liabilities have been classified as non-current in the balance sheet at December 31, 2015 and 2014, respectively, within long-term assets in the Company’s consolidated balance sheets.2016.
Item 7A. Quantitative and Qualitative Disclosures About Market Risk.
Interest Rates
We are exposed to interest rate risk primarily from the effects of changes in interest rates. At December 31, 2015,2016, approximately 89.5%86.5% of our outstanding debt was floating-rate and 10.5%13.5% was fixed-rate. We estimate that a 1.0% change in the interest costs of our floating-rate debt outstanding as of December 31, 20152016 would change interest expense on an annual basis by approximately $1.0$0.7 million.
Currency Exchange Rates
In addition to the United States, we have significant operations in Europe, South America and Mexico. As a result we are subject to translation risk because of the transactions of our foreign operations are in local currency (particularly the Brazilian real, Mexican peso, euro, Swedish krona and Argentinian peso) and must be translated into U.S. dollars. As currency exchange rates fluctuate, the translation of our consolidated statements of operations into U.S. dollars affects the comparability of revenues, expenses, operating income (loss), net income (loss) and earnings (loss) per share between years.
We use derivative financial instruments, including foreign currency forward contracts, to mitigate our exposure to fluctuations in foreign currency exchange rates by reducing the effect of such fluctuations on foreign currency denominated intercompany transactions, inventory purchases and other foreign currency exposures.
As discussed in detail in Note 9 to our consolidated financial statements, we have enteredenter into foreign currency forward contracts the purpose of which is to reduce exposure related to the Company’s euro-denominated receivables as well as to reduce exposure to future Mexican peso-denominated purchases and U.S. dollar purchases by our non-U.S. dollar functional currency European business units. These foreign currency contracts outstanding at December 31, 2016 expire throughout 2016.2017. We estimate that a 10.0% unidirectional change in currency exchange rates would result in a change in fair value at December 31, 20152016 by approximately $2.4$0.7 million. It is important to note that the change in fair value of the foreign currency forward contacts would be partially offset by changes in the underlying exposures being hedged.
We estimate that a 10.0% unidirectional change in currency exchange rates relative to the U.S.U.S dollar would have changed our income before income taxes for the year ended December 31, 20152016 by approximately $2.3$0.3 million.
Commodity Price Risk
The competitive marketplace in which we operate may limit our ability to recover increased costs through higher prices. As such, we are subject to market risk with respect to commodity price fluctuations principally related to our purchases of purchase of copper, zinc, resins and certain other commodities through a combination of fixed price agreements, staggered short-term contract maturities and commercial negotiations with our suppliers and customers. In the future, if we believe that the terms of a fixed price agreement become beneficial to us, we will enter into another such instrument. We may also consider pursuing alternative commodities or alternative suppliers to mitigate this risk over a period of time. The volatility in certain commodity costs negatively affected our operating results.
| 36 |
Item 8. Financial Statements and Supplementary Data.
INDEX TO CONSOLIDATED FINANCIAL STATEMENTS
AND FINANCIAL STATEMENT SCHEDULE
| 37 |
REPORT OF INDEPENDENT REGISTERED PUBLIC ACCOUNTING FIRM
The Board of Directors and Shareholders of
Stoneridge, Inc. and Subsidiaries
We have audited the accompanying consolidated balance sheets of Stoneridge, Inc. and Subsidiaries as of December 31, 20152016 and 2014,2015, and the related consolidated statements of operations, comprehensive loss,income (loss), cash flows and shareholders' equity for each of the three years in the period ended December 31, 2015.2016. Our audits also included the financial statement schedule included in Item 15(a)(2). These financial statements and schedule are the responsibility of the Company's management. Our responsibility is to express an opinion on these financial statements and schedule based on our audits.
We conducted our audits in accordance with the standards of the Public Company Accounting Oversight Board (United States). Those standards require that we plan and perform the audit to obtain reasonable assurance about whether the financial statements are free of material misstatement. An audit includes examining, on a test basis, evidence supporting the amounts and disclosures in the financial statements. An audit also includes assessing the accounting principles used and significant estimates made by management, as well as evaluating the overall financial statement presentation. We believe that our audits provide a reasonable basis for our opinion.
In our opinion, the financial statements referred to above present fairly, in all material respects, the consolidated financial position of Stoneridge, Inc. and Subsidiaries at December 31, 20152016 and 2014,2015, and the consolidated results of their operations and their cash flows for each of the three years in the period ended December 31, 2015,2016, in conformity with U.S. generally accepted accounting principles. Also, in our opinion, the related financial statement schedule, when considered in relation to the basic financial statements taken as a whole, presents fairly in all material respects the information set forth therein.
We also have audited, in accordance with the standards of the Public Company Accounting Oversight Board (United States), Stoneridge, Inc. and Subsidiaries’ internal control over financial reporting as of December 31, 2015,2016, based on criteria established in Internal Control-Integrated Framework issued by the Committee of Sponsoring Organizations of the Treadway Commission (2013 framework) and our report dated March 14, 20162, 2017 expressed an unqualified opinion thereon.
/s/ Ernst & Young LLP
Cleveland, OhioDetroit, Michigan
March 14, 20162, 2017
35
| 38 |
| December 31, | December 31, | |||||||
| (in thousands) | 2016 | 2015 | ||||||
| ASSETS | ||||||||
| Current assets: | ||||||||
| Cash and cash equivalents | $ | 50,389 | $ | 54,361 | ||||
| Accounts receivable, less reserves of $1,630 and $1,066, respectively | 113,225 | 94,937 | ||||||
| Inventories, net | 60,117 | 61,009 | ||||||
| Prepaid expenses and other current assets | 17,162 | 21,602 | ||||||
| Total current assets | 240,893 | 231,909 | ||||||
| Long-term assets: | ||||||||
| Property, plant and equipment, net | 91,500 | 85,264 | ||||||
| Intangible assets, net and goodwill | 40,191 | 36,699 | ||||||
| Investments and other long-term assets, net | 21,945 | 10,380 | ||||||
| Total long-term assets | 153,636 | 132,343 | ||||||
| Total assets | $ | 394,529 | $ | 364,252 | ||||
| LIABILITIES AND SHAREHOLDERS' EQUITY | ||||||||
| Current liabilities: | ||||||||
| Current portion of debt | $ | 8,626 | $ | 13,905 | ||||
| Accounts payable | 62,594 | 55,225 | ||||||
| Accrued expenses and other current liabilities | 41,489 | 38,920 | ||||||
| Total current liabilities | 112,709 | 108,050 | ||||||
| Long-term liabilities: | ||||||||
| Revolving credit facility | 67,000 | 100,000 | ||||||
| Long-term debt, net | 8,060 | 4,458 | ||||||
| Deferred income taxes | 9,760 | 41,332 | ||||||
| Other long-term liabilities | 4,923 | 3,983 | ||||||
| Total long-term liabilities | 89,743 | 149,773 | ||||||
| Shareholders' equity: | ||||||||
| Preferred Shares, without par value, 5,000 shares authorized, none issued | - | - | ||||||
| Common Shares, without par value, 60,000 shares authorized, 28,966 and 28,907 shares issued and 27,850 and 27,912 shares outstanding at December 31, 2016 and 2015, respectively, with no stated value | - | - | ||||||
| Additional paid-in capital | 206,504 | 199,254 | ||||||
| Common Shares held in treasury, 1,116 and 995 shares at December 31, 2016 and 2015, respectively, at cost | (5,632 | ) | (4,208 | ) | ||||
| Retained earnings (accumulated deficit) | 45,356 | (32,105 | ) | |||||
| Accumulated other comprehensive loss | (67,913 | ) | (69,822 | ) | ||||
| Total Stoneridge, Inc. shareholders' equity | 178,315 | 93,119 | ||||||
| Noncontrolling interest | 13,762 | 13,310 | ||||||
| Total shareholders' equity | 192,077 | 106,429 | ||||||
| Total liabilities and shareholders' equity | $ | 394,529 | $ | 364,252 | ||||
The accompanying notes are an integral part of these consolidated financial statements.
| 39 |
CONSOLIDATED STATEMENTS OF OPERATIONS
| Years ended December 31, (in thousands, except per share data) | 2015 | 2014 | 2013 | 2016 | 2015 | 2014 | ||||||||||||||||||
| Net sales | $ | 644,812 | $ | 660,579 | $ | 659,486 | $ | 695,977 | $ | 644,812 | $ | 660,579 | ||||||||||||
| Costs and expenses: | ||||||||||||||||||||||||
| Cost of goods sold | 467,834 | 469,705 | 453,531 | 500,538 | 467,834 | 469,705 | ||||||||||||||||||
| Selling, general and administrative | 110,371 | 123,630 | 123,180 | 111,145 | 110,371 | 123,630 | ||||||||||||||||||
| Design and development | 38,792 | 41,609 | 40,372 | 40,212 | 38,792 | 41,609 | ||||||||||||||||||
| Goodwill impairment | - | 51,458 | - | - | - | 51,458 | ||||||||||||||||||
| Operating income (loss) | 27,815 | (25,823 | ) | 42,403 | 44,082 | 27,815 | (25,823 | ) | ||||||||||||||||
| Interest expense, net | 6,365 | 16,880 | 18,096 | 6,277 | 6,365 | 16,880 | ||||||||||||||||||
| Equity in earnings of investee | (608 | ) | (815 | ) | (476 | ) | (1,233 | ) | (608 | ) | (815 | ) | ||||||||||||
| Loss on early extinguishment of debt | - | 10,607 | - | - | - | 10,607 | ||||||||||||||||||
| Other expense, net | 1,828 | 565 | 1,457 | |||||||||||||||||||||
| Other expense (income), net | (147 | ) | 1,828 | 565 | ||||||||||||||||||||
| Income (loss) before income taxes from continuing operations | 20,230 | (53,060 | ) | 23,326 | 39,185 | 20,230 | (53,060 | ) | ||||||||||||||||
| Income tax expense (benefit) from continuing operations | (547 | ) | (1,856 | ) | 2,797 | |||||||||||||||||||
| Income tax benefit from continuing operations | (36,389 | ) | (547 | ) | (1,856 | ) | ||||||||||||||||||
| Income (loss) from continuing operations | 20,777 | (51,204 | ) | 20,529 | 75,574 | 20,777 | (51,204 | ) | ||||||||||||||||
| Discontinued operations: | ||||||||||||||||||||||||
| Loss from discontinued operations, net of tax | - | (811 | ) | (4,021 | ) | - | - | (811 | ) | |||||||||||||||
| Loss on disposal, net of tax | (210 | ) | (8,576 | ) | - | - | (210 | ) | (8,576 | ) | ||||||||||||||
| Loss from discontinued operations | (210 | ) | (9,387 | ) | (4,021 | ) | - | (210 | ) | (9,387 | ) | |||||||||||||
| Net income (loss) | 20,567 | (60,591 | ) | 16,508 | 75,574 | 20,567 | (60,591 | ) | ||||||||||||||||
| Net income (loss) attributable to noncontrolling interest | (2,207 | ) | (13,483 | ) | 1,377 | |||||||||||||||||||
| Net loss attributable to noncontrolling interest | (1,887 | ) | (2,207 | ) | (13,483 | ) | ||||||||||||||||||
| Net income (loss) attributable to Stoneridge, Inc. | $ | 22,774 | $ | (47,108 | ) | $ | 15,131 | $ | 77,461 | $ | 22,774 | $ | (47,108 | ) | ||||||||||
| Earnings (loss) per share from continuing operations | ||||||||||||||||||||||||
| attributable to Stoneridge, Inc.: | ||||||||||||||||||||||||
| Earnings (loss) per share from continuing operations attributable to Stoneridge, Inc.: | ||||||||||||||||||||||||
| Basic | $ | 0.84 | $ | (1.40 | ) | $ | 0.72 | $ | 2.79 | $ | 0.84 | $ | (1.40 | ) | ||||||||||
| Diluted | $ | 0.82 | $ | (1.40 | ) | $ | 0.70 | $ | 2.74 | $ | 0.82 | $ | (1.40 | ) | ||||||||||
| Loss per share attributable to discontinued operations: | ||||||||||||||||||||||||
| Basic | $ | (0.01 | ) | $ | (0.35 | ) | $ | (0.15 | ) | $ | 0.00 | $ | (0.01 | ) | $ | (0.35 | ) | |||||||
| Diluted | $ | (0.01 | ) | $ | (0.35 | ) | $ | (0.14 | ) | $ | 0.00 | $ | (0.01 | ) | $ | (0.35 | ) | |||||||
| Earnings (loss) per share attributable to Stoneridge, Inc.: | ||||||||||||||||||||||||
| Basic | $ | 0.83 | $ | (1.75 | ) | $ | 0.57 | $ | 2.79 | $ | 0.83 | $ | (1.75 | ) | ||||||||||
| Diluted | $ | 0.81 | $ | (1.75 | ) | $ | 0.56 | $ | 2.74 | $ | 0.81 | $ | (1.75 | ) | ||||||||||
| Weighted-average shares outstanding: | ||||||||||||||||||||||||
| Basic | 27,338 | 26,924 | 26,671 | 27,764 | 27,338 | 26,924 | ||||||||||||||||||
| Diluted | 27,959 | 26,924 | 27,193 | 28,309 | 27,959 | 26,924 | ||||||||||||||||||
The accompanying notes are an integral part of these consolidated financial statements.
| 40 |
CONSOLIDATED STATEMENTS OF COMPREHENSIVE LOSSINCOME (LOSS)
| Years ended December 31 (in thousands) | 2015 | 2014 | 2013 | |||||||||||||||||||||
| Years ended December 31, (in thousands) | 2016 | 2015 | 2014 | |||||||||||||||||||||
| Net income (loss) | $ | 20,567 | $ | (60,591 | ) | $ | 16,508 | $ | 75,574 | $ | 20,567 | $ | (60,591 | ) | ||||||||||
| Less: Income (loss) attributable to noncontrolling interest | (2,207 | ) | (13,483 | ) | 1,377 | |||||||||||||||||||
| Less: Net loss attributable to noncontrolling interest | (1,887 | ) | (2,207 | ) | (13,483 | ) | ||||||||||||||||||
| Net income (loss) attributable to Stoneridge, Inc. | 22,774 | (47,108 | ) | 15,131 | 77,461 | 22,774 | (47,108 | ) | ||||||||||||||||
| Other comprehensive income (loss), net of tax attributable to Stoneridge, Inc.: | ||||||||||||||||||||||||
| Foreign currency translation | (24,693 | ) | (15,268 | ) | (17,925 | ) | 2,401 | (24,693 | ) | (15,268 | ) | |||||||||||||
| Benefit plan liability | (45 | ) | 141 | - | (84 | ) | (45 | ) | 141 | |||||||||||||||
| Unrealized gain (loss) on derivatives | 389 | 112 | (2,251 | ) | (408 | ) | 389 | 112 | ||||||||||||||||
| Other comprehensive loss, net of tax attributable to Stoneridge, Inc. | (24,349 | ) | (15,015 | ) | (20,176 | ) | ||||||||||||||||||
| Other comprehensive income (loss), net of tax attributable to Stoneridge, Inc. | 1,909 | (24,349 | ) | (15,015 | ) | |||||||||||||||||||
| Comprehensive loss attributable to Stoneridge, Inc. | $ | (1,575 | ) | $ | (62,123 | ) | $ | (5,045 | ) | |||||||||||||||
| Comprehensive income (loss) attributable to Stoneridge, Inc. | $ | 79,370 | $ | (1,575 | ) | $ | (62,123 | ) | ||||||||||||||||
The Company has combined comprehensive lossincome (loss) from continuing operations and comprehensive loss from discontinued operations herein.
The accompanying notes are an integral part of these consolidated financial statements.
38
| 41 |
CONSOLIDATED STATEMENTS OF CASH FLOWS
| Years ended December 31 (in thousands) | 2015 | 2014 | 2013 | |||||||||||||||||||||
| Years ended December 31, (in thousands) | 2016 | 2015 | 2014 | |||||||||||||||||||||
| OPERATING ACTIVITIES: | ||||||||||||||||||||||||
| Net income (loss) | $ | 20,567 | $ | (60,591 | ) | $ | 16,508 | $ | 75,574 | $ | 20,567 | $ | (60,591 | ) | ||||||||||
| Adjustments to reconcile net income (loss) to net cash provided by operating activities: | ||||||||||||||||||||||||
| Depreciation | 18,964 | 24,372 | 28,989 | 19,998 | 18,964 | 24,372 | ||||||||||||||||||
| Amortization, including accretion of debt discount | 3,833 | 5,709 | 6,236 | |||||||||||||||||||||
| Amortization, including accretion of deferred financing costs | 3,615 | 3,833 | 5,709 | |||||||||||||||||||||
| Deferred income taxes | (2,165 | ) | (3,238 | ) | (3,081 | ) | (38,747 | ) | (2,165 | ) | (3,238 | ) | ||||||||||||
| Earnings of equity method investee | (608 | ) | (815 | ) | (476 | ) | (1,233 | ) | (608 | ) | (815 | ) | ||||||||||||
| Loss on sale of fixed assets | 74 | 110 | 189 | 48 | 74 | 110 | ||||||||||||||||||
| Share-based compensation expense | 7,224 | 5,406 | 4,974 | 6,134 | 7,224 | 5,406 | ||||||||||||||||||
| Tax benefits related to share-based compensation expense | (977 | ) | - | - | ||||||||||||||||||||
| Goodwill impairment | - | 51,458 | - | - | - | 51,458 | ||||||||||||||||||
| Loss on disposal of Wiring business | 210 | 8,576 | - | 210 | 8,576 | |||||||||||||||||||
| Loss on early extinguishment of debt | - | 10,607 | - | - | - | 10,607 | ||||||||||||||||||
| Changes in operating assets and liabilities, net of effect of business acquisition: | ||||||||||||||||||||||||
| Changes in operating assets and liabilities: | ||||||||||||||||||||||||
| Accounts receivable, net | (489 | ) | (19,400 | ) | 4,122 | (18,694 | ) | (489 | ) | (19,400 | ) | |||||||||||||
| Inventories, net | (4,340 | ) | 3,161 | (23,646 | ) | 4,519 | (4,340 | ) | 3,161 | |||||||||||||||
| Prepaid expenses and other assets | (295 | ) | (1,306 | ) | (2,585 | ) | 2,652 | (295 | ) | (1,306 | ) | |||||||||||||
| Accounts payable | 6,577 | 524 | 9,485 | 10,980 | 6,577 | 524 | ||||||||||||||||||
| Accrued expenses and other liabilities | 5,253 | (4,758 | ) | 2,969 | 1,408 | 5,253 | (4,758 | ) | ||||||||||||||||
| Net cash provided by operating activities | 54,805 | 19,815 | 43,684 | 65,277 | 54,805 | 19,815 | ||||||||||||||||||
| INVESTING ACTIVITIES: | ||||||||||||||||||||||||
| Capital expenditures | (28,735 | ) | (24,754 | ) | (25,344 | ) | (24,476 | ) | (28,735 | ) | (24,754 | ) | ||||||||||||
| Proceeds from sale of fixed assets | 64 | 110 | 107 | 652 | 64 | 110 | ||||||||||||||||||
| Proceeds from (payments related to) sale of Wiring business | (1,230 | ) | 71,386 | - | ||||||||||||||||||||
| Payments related to sale of Wiring business | - | (1,230 | ) | 71,386 | ||||||||||||||||||||
| Business acquisition | (469 | ) | (1,022 | ) | - | - | (469 | ) | (1,022 | ) | ||||||||||||||
| Net cash provided by (used for) investing activities | (30,370 | ) | 45,720 | (25,237 | ) | (23,824 | ) | (30,370 | ) | 45,720 | ||||||||||||||
| FINANCING ACTIVITIES: | ||||||||||||||||||||||||
| Revolving credit facility borrowings | - | 100,000 | - | - | - | 100,000 | ||||||||||||||||||
| Revolving credit facility payments | - | - | (1,160 | ) | (33,000 | ) | - | - | ||||||||||||||||
| Extinguishment of senior notes | - | (175,000 | ) | - | - | - | (175,000 | ) | ||||||||||||||||
| Premium related to early extinguishment of senior notes | - | (8,006 | ) | - | - | - | (8,006 | ) | ||||||||||||||||
| Proceeds from issuance of debt | 22,540 | 30,072 | 25,555 | 16,223 | 22,540 | 30,072 | ||||||||||||||||||
| Repayments of debt | (30,586 | ) | (25,610 | ) | (24,382 | ) | (25,748 | ) | (30,586 | ) | (25,610 | ) | ||||||||||||
| Noncontrolling interest shareholder distribution | - | (1,083 | ) | - | - | - | (1,083 | ) | ||||||||||||||||
| Other financing costs | (49 | ) | (1,666 | ) | - | (399 | ) | (49 | ) | (1,666 | ) | |||||||||||||
| Repurchase of Common Shares to satisfy employee tax withholding | (2,924 | ) | (765 | ) | (516 | ) | (1,424 | ) | (2,924 | ) | (765 | ) | ||||||||||||
| Tax benefits related to share-based compensation expense | 977 | - | - | |||||||||||||||||||||
| Net cash used for financing activities | (11,019 | ) | (82,058 | ) | (503 | ) | (43,371 | ) | (11,019 | ) | (82,058 | ) | ||||||||||||
| Effect of exchange rate changes on cash and cash equivalents | (2,076 | ) | (3,281 | ) | 326 | (2,054 | ) | (2,076 | ) | (3,281 | ) | |||||||||||||
| Net change in cash and cash equivalents | 11,340 | (19,804 | ) | 18,270 | (3,972 | ) | 11,340 | (19,804 | ) | |||||||||||||||
| Cash and cash equivalents at beginning of period | 43,021 | 62,825 | 44,555 | 54,361 | 43,021 | 62,825 | ||||||||||||||||||
| Cash and cash equivalents at end of period | $ | 54,361 | $ | 43,021 | $ | 62,825 | $ | 50,389 | $ | 54,361 | $ | 43,021 | ||||||||||||
| Supplemental disclosure of cash flow information: | ||||||||||||||||||||||||
| Cash paid for interest | $ | 6,092 | $ | 20,464 | $ | 18,634 | $ | 5,786 | $ | 6,092 | $ | 20,464 | ||||||||||||
| Cash paid for income taxes, net | $ | 2,494 | $ | 3,054 | $ | 6,426 | $ | 3,386 | $ | 2,494 | $ | 3,054 | ||||||||||||
| Supplemental disclosure of non-cash operating and financing activities: | ||||||||||||||||||||||||
| Change in fair value of interest rate swap | $ | - | $ | (793 | ) | $ | (1,419 | ) | $ | - | $ | - | $ | (793 | ) | |||||||||
| Bank payment of vendor payables under short-term debt obligations | $ | 5,323 | $ | 4,758 | $ | - | $ | 3,764 | $ | 5,323 | $ | 4,758 | ||||||||||||
The Company has combined cash flows from continuing operations and cash flows from discontinued operations within the operating, investing and financing categories.
The accompanying notes are an integral part of these consolidated financial statements.
| 42 |
CONSOLIDATED STATEMENTS OF SHAREHOLDERS' EQUITY
| (in thousands) | Number of Common Shares outstanding | Number of treasury shares | Additional paid-in capital | Common Shares held in treasury | Retained earnings (accumulated deficit) | Accumulated other comprehensive loss | Noncontrolling interest | Total shareholders' equity | ||||||||||||||||||||||||
| BALANCE, JANUARY 1, 2014 | 28,483 | 320 | 187,742 | (519 | ) | (7,771 | ) | (30,458 | ) | 39,540 | 188,534 | |||||||||||||||||||||
| Net loss | - | - | - | - | (47,108 | ) | - | (13,483 | ) | (60,591 | ) | |||||||||||||||||||||
| Benefit plan liability adjustments, net | - | - | - | - | - | 141 | - | 141 | ||||||||||||||||||||||||
| Unrealized gain on derivatives, net | - | - | - | - | - | 112 | - | 112 | ||||||||||||||||||||||||
| Currency translation adjustments | - | - | - | - | - | (15,268 | ) | (3,507 | ) | (18,775 | ) | |||||||||||||||||||||
| Issuance of restricted Common Shares | 50 | - | - | - | - | - | - | - | ||||||||||||||||||||||||
| Forfeited restricted Common Shares | (238 | ) | 238 | - | - | - | - | - | - | |||||||||||||||||||||||
| Repurchased Common Shares for treasury | (74 | ) | 74 | - | (765 | ) | - | - | - | (765 | ) | |||||||||||||||||||||
| Share-based compensation | - | - | 5,150 | - | - | - | - | 5,150 | ||||||||||||||||||||||||
| BALANCE, DECEMBER 31, 2014 | 28,221 | 632 | 192,892 | (1,284 | ) | (54,879 | ) | (45,473 | ) | 22,550 | 113,806 | |||||||||||||||||||||
| Net income (loss) | - | - | - | - | 22,774 | - | (2,207 | ) | 20,567 | |||||||||||||||||||||||
| Benefit plan liability adjustments, net | - | - | - | - | - | (45 | ) | - | (45 | ) | ||||||||||||||||||||||
| Unrealized gain on derivatives, net | - | - | - | - | - | 389 | - | 389 | ||||||||||||||||||||||||
| Currency translation adjustments | - | - | - | - | - | (24,693 | ) | (7,033 | ) | (31,726 | ) | |||||||||||||||||||||
| Issuance of restricted Common Shares | 172 | (118 | ) | - | - | - | - | - | - | |||||||||||||||||||||||
| Forfeited restricted Common Shares | (239 | ) | 239 | - | - | - | - | - | - | |||||||||||||||||||||||
| Repurchased Common Shares for treasury | (242 | ) | 242 | - | (2,924 | ) | - | - | - | (2,924 | ) | |||||||||||||||||||||
| Share-based compensation | - | - | 6,362 | - | - | - | - | 6,362 | ||||||||||||||||||||||||
| BALANCE, DECEMBER 31, 2015 | 27,912 | 995 | 199,254 | (4,208 | ) | (32,105 | ) | (69,822 | ) | 13,310 | 106,429 | |||||||||||||||||||||
| Net income (loss) | - | - | - | - | 77,461 | - | (1,887 | ) | 75,574 | |||||||||||||||||||||||
| Benefit plan liability adjustments, net | - | - | - | - | - | (84 | ) | - | (84 | ) | ||||||||||||||||||||||
| Unrealized loss on derivatives, net | - | - | - | - | - | (408 | ) | - | (408 | ) | ||||||||||||||||||||||
| Currency translation adjustments | - | - | - | - | - | 2,401 | 2,339 | 4,740 | ||||||||||||||||||||||||
| Issuance of restricted Common Shares | 67 | (8 | ) | - | - | - | - | - | - | |||||||||||||||||||||||
| Forfeited restricted Common Shares | (3 | ) | 3 | - | - | - | - | - | - | |||||||||||||||||||||||
| Repurchased Common Shares for treasury | (126 | ) | 126 | - | (1,424 | ) | - | - | - | (1,424 | ) | |||||||||||||||||||||
| Tax benefit from share based compensation transactions | - | - | 977 | - | - | - | - | 977 | ||||||||||||||||||||||||
| Share-based compensation | - | - | 6,273 | - | - | - | - | 6,274 | ||||||||||||||||||||||||
| BALANCE, DECEMBER 31, 2016 | 27,850 | 1,116 | $ | 206,504 | $ | (5,632 | ) | $ | 45,356 | $ | (67,913 | ) | $ | 13,762 | $ | 192,077 | ||||||||||||||||
The accompanying notes are an integral part of these consolidated financial statements.
| 43 |
NOTES TO CONSOLIDATED FINANCIAL STATEMENTS
(in thousands, except share and per share data, unless otherwise indicated)
1. Organization and Nature of Business
Stoneridge, Inc. and its subsidiaries are global designers and manufacturers of highly engineered electrical and electronic components, modules and systems for the automotive, commercial, motorcycle, off-highway and agricultural vehicle markets.
2. Summary of Significant Accounting Policies
Basis of Presentation
The accompanying consolidated financial statements include the accounts of Stoneridge, Inc. and its wholly-owned and majority-owned subsidiaries (collectively, the “Company”). Intercompany transactions and balances have been eliminated in consolidation. The Company analyzes its ownership interests in accordance with Accounting Standards Codification (“ASC”) Topic 810 (Consolidations)“Consolidations (Topic 810)” to determine whether they are VIE’sa variable interest entity and, if so, whether the Company is the primary beneficiary.
The Company’s investment in Minda Stoneridge Instruments Ltd. (“Minda”) for the years ended December 31, 2016, 2015 and 2014 and 2013 washas been determined to be an unconsolidated entity, and therefore wasis accounted for under the equity method of accounting based on our 49% ownership.
The Company had a 74% controlling interest in PST Eletrônica Ltda. (“PST”) for the years ended December 31, 2016, 2015 and 2014 and 2013 which wasis accounted for a consolidated subsidiary.
The Company sold substantially all of the assets and liabilities of its Wiring business on August 1, 2014. As a result, the Wiring business has been classified as discontinued operations for all periods presented in the Company’s financial statements herein, and therefore has been excluded from both continuing operations and segment results for all periods presented. The Wiring business designed and manufactured wiring harness products and assembled instruments panels for sale principally to the commercial, agricultural and off-highway vehicle markets.
Accounting Estimates
The preparation of financial statements in conformity with U.S. Generally Accepted Accounting Principles (“GAAP”) requires management to make estimates and assumptions that affect the reported amounts of assets and liabilities, including certain self-insured risks and liabilities, disclosure of contingent assets and liabilities at the date of the consolidated financial statements and the reported amounts of revenues and expenses during the reporting period. Because actual results could differ from those estimates, the Company revises its estimates and assumptions as new information becomes available.
Cash and Cash Equivalents
The Company’s cash and cash equivalents are actively traded money market funds with short-term investments in marketable securities, primarily U.S. government securities. Cash and cash equivalents are stated at cost, which approximates fair value, due to the highly liquid nature and short-term duration of the underlying securities.securities with original maturities of 90 days or less.
Accounts Receivable and Concentration of Credit Risk
Revenues are principally generated from the automotive, commercial, motorcycle, off-highway and agricultural vehicle markets. The Company’s largest customers wereare Ford Motor Company, General Motors Company and Scania Group, primarily related to the Control Devices and Electronics reportable segments respectively, and accounted for the following percentages of consolidated net sales for the years ended December 31, 2016, 2015 2014 and 2013:2014:
| 2015 | 2014 | 2013 | 2016 | 2015 | 2014 | |||||||||||||||||||
| Ford Motor Company | 14 | % | 11 | % | 10 | % | 17 | % | 14 | % | 11 | % | ||||||||||||
| General Motors Company | 7 | % | 5 | % | 5 | % | ||||||||||||||||||
| Scania Group | 7 | % | 8 | % | 8 | % | 6 | % | 7 | % | 8 | % | ||||||||||||
Accounts receivable are recorded at the invoice price, net of an estimate of allowance for doubtful accounts and other reserves.
| 44 |
NOTES TO CONSOLIDATED FINANCIAL STATEMENTS
(in thousands, except share and per share data, unless otherwise indicated)
Allowance for Doubtful Accounts
The Company evaluates the collectability of accounts receivable based on a combination of factors. In circumstances where the Company is aware of a specific customer’s inability to meet its financial obligations, a specific allowance for doubtful accounts is recorded against amounts due to reduce the net recognized receivable to the amount the Company reasonably believes will be collected. Additionally, the Company reviews historical trends for collectability in determining an estimate for its allowance for doubtful accounts. If economic circumstances change substantially, estimates of the recoverability of amounts due to the Company could be reduced by a material amount. The Company does not have collateral requirements with its customers.
Sales of Accounts Receivable
The Company’s PST segment sells selected accounts receivable on a full recourse basis to an unrelated financial institution in Brazil. PST accounts for these transactions as sales of accounts receivable. As such, in accordance with ASC 860, “Transfers and Servicing”, the sales of accounts receivable are reflected as a reduction of accounts receivable in the consolidated balance sheets and the loss on sale is recorded within interest expense, net in the consolidated statements of operations while the proceeds received from the sale are included in the cash flows from operating activities in the consolidated statements of cash flows.
During 2016 PST sold $15,297 (53,886 Brazilian real) of accounts receivable at a loss of $459 (1,615 Brazilian real), which represents the implicit interest on the transaction, and received proceeds of $14,838 (52,271 Brazilian real).PST had a remaining credit exposure of $1,067 (3,476 Brazilian real) at December 31, 2016 related to the receivables sold for which payment from the customer was not yet due.
During 2015 PST sold $6,401 (24,994 Brazilian real) of accounts receivable at a loss of $156 (540 Brazilian real), which represents the implicit interest on the transaction, and received proceeds of $6,245 (24,454 Brazilian real). PST has a remaining credit exposure of $2,657 (10,376 Brazilian real) at December 31, 2015 related to the receivables sold for which payment from the customer was not yet due.
Inventories
Inventories are valued at the lower of cost (using either the first-in, first-out (“FIFO”) or average cost methods) or market. The Company evaluates and adjusts as necessary its excess and obsolescence reserve on a quarterly basis. Excess inventories are quantities of items that exceed anticipated sales or usage for a reasonable period. The Company has guidelines for calculating provisions for excess inventories based on the number of months of inventories on hand compared to anticipated sales or usage. Management uses its judgment to forecast sales or usage and to determine what constitutes a reasonable period. Inventory cost includes material, labor and overhead. Inventories consist of the following:
| As of December 31 | 2015 | 2014 | 2016 | 2015 | ||||||||||||
| Raw materials | $ | 36,021 | $ | 41,767 | $ | 35,665 | $ | 36,021 | ||||||||
| Work-in-progress | 7,162 | 8,779 | 7,483 | 7,162 | ||||||||||||
| Finished goods | 17,826 | 20,707 | 16,969 | 17,826 | ||||||||||||
| Total inventories, net | $ | 61,009 | $ | 71,253 | $ | 60,117 | $ | 61,009 | ||||||||
Inventory valued using the FIFO method was $35,378$37,765 and $34,636$35,378 at December 31, 20152016 and 2014,2015, respectively. Inventory valued using the average cost method was $25,631$22,352 and $36,617$25,631 at December 31, 20152016 and 2014,2015, respectively.
| 45 |
NOTES TO CONSOLIDATED FINANCIAL STATEMENTS
(in thousands, except share and per share data, unless otherwise indicated)
Pre-production Costs Related to Long-term Supply Arrangements
Engineering, research and development and other design and development costs for products sold on long-term supply arrangements are expensed as incurred unless the Company has a contractual guarantee for reimbursement from the customer. Costs for molds, dies and other tools used to make products sold on long-term supply arrangements for which the Company either has title to the assets or has the noncancelable right to use the assets during the term of the supply arrangement are capitalized in property, plant and equipment and amortized to cost of sales over the shorter of the term of the arrangement or over the estimated useful lives of the assets, typically three to five years. Costs for molds, dies and other tools used to make products sold on long-term supply arrangements for which the Company has a contractual guarantee to a lump sum reimbursement from the customer are capitalized either as a component of prepaid expenses and other current assets or an investment and other long term asset within the consolidated balance sheets. Capitalized pre-production costs were $9,405$6,859 and $10,067$9,405 at December 31, 2016 and 2015, respectively. At December 31, 2016 and 2014, respectively.
NOTES TO CONSOLIDATED FINANCIAL STATEMENTS
(in thousands, except share2015, $6,446 and per share data, unless otherwise indicated)$9,405 were recorded as a component of prepaid expenses and other current assets on the consolidated balance sheets while the remaining amounts were recorded as a component of investments and other long term assets.
Discontinued Operations
Wiring Business
On May 26, 2014, the Company entered into an asset purchase agreement to sell substantially all of the assets and liabilities of the former Wiring segment to Motherson Sumi Systems Ltd., an India-based manufacturer of diversified products for the global automotive industry and a limited company incorporated under the laws of the Republic of India, and MSSL (GB) LIMITED, a limited company incorporated under the laws of the United Kingdom (collectively, “Motherson”), for $65,700 in cash and the assumption of certain related liabilities of the Wiring business.
On August 1, 2014, the Company completed the sale of substantially all of the assets and liabilities of its Wiring business to Motherson for $71,386 in cash that consisted of the stated purchase price and estimated working capital on the closing date. The final purchase price was subject to post-closing working capital and other adjustments. Upon the final resolution of the working capital and other adjustments in the second quarter of 2015, the Company returned $1,230 in cash to Motherson.
The Company recorded a loss on disposal, net of tax of $8,576 for the year ended December 31, 2014 which included the recognition of previously deferred foreign currency translation of $2,734, income tax on the sale of Wiring’s Mexican businesses of $1,621 and transaction costs of $1,384.
The Company also entered into short-term transition services agreements with Motherson substantially all of which concluded in the second quarter of 2015 associated with information systems, accounting, administrative, occupancy and support services as well as contract manufacturing and production support in Estonia.
The Company had post-disposition sales to the Wiring business acquired by Motherson of $19,766, $26,952 and $12,230 for the years ended December 31, 2016, 2015, and 2014, respectively. The Company had post-disposition purchases from the Wiring business acquired by Motherson of $425, $689 and $269 for the years ended December 31, 2016, 2015 and 2014, respectively. The amounts related to 2014 cover the period from August through December 2014 asbecause the sale of the Wiring business occurred on August 1, 2014.
| 46 |
NOTES TO CONSOLIDATED FINANCIAL STATEMENTS
(in thousands, except share and per share data, unless otherwise indicated)
The following tables display summarized activity in our consolidated statements of operations for discontinued operations during the years ended December 31, 2015 2014 and 2013,2014, related to the Wiring business. There were no discontinued operations for the year ended December 31, 2016.
| Years ended December 31 | 2015 | 2014(A) | 2013 | |||||||||
| Net sales | $ | - | $ | 167,434 | $ | 288,344 | ||||||
| Cost of goods sold(C) | - | 154,787 | 268,278 | |||||||||
| Selling, general and administrative(C) | - | 12,697 | 22,765 | |||||||||
| Interest expense, net | - | 69 | 250 | |||||||||
| Other expense, net | - | (58 | ) | (357 | ) | |||||||
| Loss from operations of discontinued operations before income taxes(C) (D) | - | (61 | ) | (2,592 | ) | |||||||
| Income tax expense on discontinued operations | - | (750 | ) | (1,429 | ) | |||||||
| Loss from discontinued operations, net of tax | - | (811 | ) | (4,021 | ) | |||||||
| Loss on disposal(B) | (241 | ) | (6,955 | ) | - | |||||||
| Income tax expense on gain (loss) on disposal(E) | 31 | (1,621 | ) | - | ||||||||
| Loss on disposal, net of tax | (210 | ) | (8,576 | ) | - | |||||||
| Loss from discontinued operations | $ | (210 | ) | $ | (9,387 | ) | $ | (4,021 | ) | |||
NOTES TO CONSOLIDATED FINANCIAL STATEMENTS
(in thousands, except share and per share data, unless otherwise indicated)
| Years ended December 31 | 2015 | 2014(A) | ||||||
| Net sales | $ | - | $ | 167,434 | ||||
| Cost of goods sold(C) | - | 154,787 | ||||||
| Selling, general and administrative(C) | - | 12,697 | ||||||
| Interest expense, net | - | 69 | ||||||
| Other expense (income), net | - | (58 | ) | |||||
| Loss from operations of discontinued operations before income taxes (C) | - | (61 | ) | |||||
| Income tax expense on discontinued operations | - | (750 | ) | |||||
| Loss from discontinued operations, net of tax | - | (811 | ) | |||||
| Loss on disposal(B) | $ | (241 | ) | $ | (6,955 | ) | ||
| Income tax expense on gain (loss) on disposal(D) | 31 | (1,621 | ) | |||||
| Loss on disposal, net of tax | (210 | ) | (8,576 | ) | ||||
| Loss from discontinued operations | $ | (210 | ) | $ | (9,387 | ) | ||
| (A) | The operations of the Wiring business were presented only for the seven months ended July 31, 2014 |
| (B) | Included in loss on disposal for the years ended December 31, 2015 and 2014 were transaction costs of $223 and $1,384, respectively. The loss on disposal also includes a working capital and other adjustments of $18 for the year ended December 31, 2015. In addition, the loss on disposal included $2,734 in previously deferred foreign currency translation for the year ended December 31, 2014. |
| (C) | The assets and liabilities of the Wiring business were reclassified as held for sale effective May 26, 2014. Accordingly,depreciation and amortization for the related Wiring assets were not recorded after that date. |
| (D) |
| Gains and losses from foreign currency remeasurement related to income taxes were included as a component of income tax (expense) benefit. |
| Years ended December 31 | 2014 | 2013 | 2014 | ||||||||||
| Depreciation and amortization | $ | 2,111 | $ | 4,978 | $ | 2,111 | |||||||
| Capital expenditures | 1,238 | 3,768 | 1,238 | ||||||||||
Predisposition intercompany sales to the Wiring business were $17,448 and $25,353 for the periodsseven month period ended July 31, 2014 and December 31, 2013, respectively.2014. Predisposition intercompany purchases from the Wiring business were $4,025 and $7,593 for the periodsseven month period ended July 31, 20142014.
| 47 |
NOTES TO CONSOLIDATED FINANCIAL STATEMENTS
(in thousands, except share and December 31, 2013, respectively.per share data, unless otherwise indicated)
Property, Plant and Equipment
Property, plant and equipment are recorded at cost and consist of the following:
| As of December 31 | 2015 | 2014 | ||||||
| Land and land improvements | $ | 3,538 | $ | 4,036 | ||||
| Buildings and improvements | 32,904 | 34,517 | ||||||
| Machinery and equipment | 160,721 | 154,204 | ||||||
| Office furniture and fixtures | 6,541 | 6,247 | ||||||
| Tooling | 68,101 | 67,135 | ||||||
| Information technology | 24,035 | 22,132 | ||||||
| Vehicles | 422 | 65 | ||||||
| Leasehold improvements | 2,581 | 2,207 | ||||||
| Construction in progress | 23,914 | 16,933 | ||||||
| Total property, plant, and equipment | 322,757 | 307,476 | ||||||
| Less: accumulated depreciation | (237,493 | ) | (222,165 | ) | ||||
| Property, plant and equipment, net | $ | 85,264 | $ | 85,311 | ||||
NOTES TO CONSOLIDATED FINANCIAL STATEMENTS
(in thousands, except share and per share data, unless otherwise indicated)
| As of December 31 | 2016 | 2015 | ||||||
| Land and land improvements | $ | 3,376 | $ | 3,538 | ||||
| Buildings and improvements | 32,271 | 32,904 | ||||||
| Machinery and equipment | 180,944 | 160,721 | ||||||
| Office furniture and fixtures | 6,813 | 6,541 | ||||||
| Tooling | 67,261 | 68,101 | ||||||
| Information technology | 23,632 | 24,035 | ||||||
| Vehicles | 398 | 422 | ||||||
| Leasehold improvements | 2,583 | 2,581 | ||||||
| Construction in progress | 16,854 | 23,914 | ||||||
| Total property, plant, and equipment | 334,132 | 322,757 | ||||||
| Less: accumulated depreciation | (242,632 | ) | (237,493 | ) | ||||
| Property, plant and equipment, net | $ | 91,500 | $ | 85,264 | ||||
Depreciation is provided using the straight-line method over the estimated useful lives of the assets. Depreciation expense for the years ended December 31, 2016, 2015 and 2014 was $19,998, $18,964 and 2013 was $18,829, $22,299, and $24,099, respectively. Depreciable lives within each property classification are as follows:
| Buildings and improvements | 10-40 years | ||
| Machinery and equipment | 3-10 years | ||
| Office furniture and fixtures | 3-10 years | ||
| Tooling | 2-5 years | ||
| Information technology | 3-5 years | ||
| Vehicles | 3-5 years | ||
| Leasehold improvements | shorter of lease term or 3-10 years |
Maintenance and repair expenditures that are not considered improvements and do not extend the useful life of the property, plant and equipment are charged to expense as incurred. Expenditures for improvements and major renewals are capitalized. When assets are retired or otherwise disposed of, the related cost and accumulated depreciation are removed from the accounts, and any gain or loss on the disposition is recorded in the consolidated statements of operations as a component of selling, general and administrative expenses.
| 48 |
NOTES TO CONSOLIDATED FINANCIAL STATEMENTS
(in thousands, except share and per share data, unless otherwise indicated)
Impairment of Long-Lived or Finite-Lived Assets
The Company reviews the carrying value of its long-lived assets and finite-lived intangible assets for impairment when events or circumstances indicate that their carrying value may not be recoverable. Factors the Company considers important that could trigger testing of the related asset groups for an impairment include current period operating or cash flow losses combined with a history of operating or cash flow losses, a projection or forecast that demonstrates continuing losses, significant adverse changes in the business climate within a particular business or current expectations that a long-lived asset will be sold or otherwise disposed of significantly before the end of its estimated useful life. To test for impairment, the estimated undiscounted cash flows expected to be generated from the use and disposal of the asset or asset group is compared to its carrying value. An asset group is established by identifying the lowest level of cash flows generated by the group of assets that are largely independent of cash flows of other assets. If cash flows cannot be separately and independently identified for a single asset, we will determine whether an impairment has occurred for the group of assets for which we can identify projected cash flows. If these undiscounted cash flows are less than their respective carrying values, an impairment charge would be recognized to the extent that the carrying values exceed estimated fair values. The estimation of undiscounted cash flows and fair value requires us to make assumptions regarding future operating results over the life of the asset or the life of the primary asset in the asset group. The results of the impairment testing are dependent on these estimates which require judgment. The occurrence of certain events, including changes in economic and competitive conditions, could impact cash flows eventually realized and management’s ability to accurately assess whether an asset is impaired.
Due to the lower actual and forecasted financial results from weakness in the Brazilian economy and automotive market, the Company performed an evaluation of PST’s long-lived assets in 2015 and 2014,2016, and concluded that the carrying amount of the asset group was recoverable as the undiscounted cash flows of the asset group exceeded its carrying amount.
There we no material impairment charges recorded for long-lived or finite-lived intangible assets in 2015, 2014 or 2013.
Goodwill and Other Intangible Assets
Goodwill
The total purchase price associated with acquisitions is allocated to the acquisition date fair values of identifiable assets acquired and liabilities assumed with the excess purchase price assigned to goodwill. Goodwill is subject to an annual assessment for impairment (or more frequently if impairment indicators arise) by applying a fair value-based test.
The Company recorded goodwill related to the acquisition of controlling interest in PST in 2011, all of which was deemed to be impaired in 2014. The remaining goodwill balance at December 31, 20152016 and 20142015 relates to the acquisition of two European aftermarket distributors, which is included within the Electronics segment.
The carrying amount of goodwill related to our Electronics segment decreased by $50 for the year ended December 31, 2016 to $931 due to foreign currency translation. The carrying amount of goodwill related to our Electronics segment decreased by $97 for the year ended December 31, 2015 to $981 due to foreign currency translation.
NOTES TO CONSOLIDATED FINANCIAL STATEMENTS
(in thousands, except share and per share data, unless otherwise indicated)
Goodwill and changes in the carrying amount of goodwill by segment for the year then ended December 31, 2014 was as follows:
| Control | ||||||||||||||||||||||||||||
| Electronics | Devices | PST | Total | Electronics | PST | Total | ||||||||||||||||||||||
| Balance at January 1, 2014 | $ | 604 | $ | - | $ | 53,744 | $ | 54,348 | $ | 604 | $ | 53,744 | $ | 54,348 | ||||||||||||||
| Acquisition of aftermarket business | 664 | - | - | 664 | 664 | - | 664 | |||||||||||||||||||||
| Goodwill impairment | - | (51,458 | ) | (51,458 | ) | - | (51,458 | ) | (51,458 | ) | ||||||||||||||||||
| Currency translation | (190 | ) | - | (2,286 | ) | (2,476 | ) | (190 | ) | (2,286 | ) | (2,476 | ) | |||||||||||||||
| Balance at December 31, 2014 | $ | 1,078 | - | $ | - | $ | 1,078 | $ | 1,078 | $ | - | $ | 1,078 | |||||||||||||||
The Company’s cumulative goodwill impairment loss since inception was $300,083 at December 31, 20152016 and 2014, respectively.2015. In addition to PST’s 2014 goodwill impairment, the cumulative goodwill impairment loss includes the goodwill impairment recorded by the Company’s Control Devices segment in 2008 and 2004.
| 49 |
NOTES TO CONSOLIDATED FINANCIAL STATEMENTS
(in thousands, except share and per share data, unless otherwise indicated)
PST Goodwill Impairment Assessments
The Company conducted its annual goodwill impairment test for its majority owned subsidiary, PST Eletrônica Ltda. (“PST”) on October 1, 2013 without a need to expand the impairment test to “step two” of ASC 350 as PST’s calculated fair value exceeded its carrying value by approximately 10% and no indicators of impairment were identified as disclosed in the Company’s 2013 Form 10-K.
During the second quarter of 2014, however, indicators of potential impairment required the Company to conduct an interim impairment test.test for its majority owned subsidiary, PST. Those indicators included a decline in recent operating results and lower growth expectations primarily due to the weakening of the Brazilian economy and automotive market. In accordance with ASC 350, the Company completed “step one” of the impairment analysis and concluded that, as of June 30, 2014, the fair value of the PST reportable segment was below its carrying value, including goodwill. As a result, “step two” of the impairment test was initiated in accordance with ASC 350. The Company recorded its best estimate of $29,300 as a non-cash goodwill impairment charge (of which $6,436 was attributable to noncontrolling interest) as of June 30, 2014. Based on the Company’s completed “step two” analysis in the third quarter of 2014, the final goodwill impairment as of June 30, 2014 was $23,498 (of which $5,162 was attributable to noncontrolling interest). As such, the Company recorded an adjustment to reduce the goodwill impairment by $5,802 (of which $1,274 was attributable to noncontrolling interest) as of September 30, 2014.
In the fourth quarter of 2014, the Company conducted its annual goodwill impairment test for PST and completed “step one” of the impairment test concluding that as of October 1, 2014 the fair value of the PST reportable segment was less than its carrying value, including goodwill. PST’s fair value decreased further due to significantly lower sales and earnings growth expectations which were a result of lower forecasted growth in the Brazilian economy and automotive market and a forecasted decline in currency exchange rates thereby increasing PST’s material costs. Based on the completed “step two” analysis, a goodwill impairment charge of $27,960 (of which $6,142 was attributable to noncontrolling interest) was recorded in the fourth quarter of 2014 which represented all of the remaining PST goodwill. The aggregate goodwill impairment for the year ended December 31, 2014 was $51,458 (of which $11,304 was attributable to noncontrolling interest).
The fair value measurement of the reporting unit under the “step one” analysis and the “step two” analysis (a non-recurring fair value measure) in their entirety are classified as Level 3 inputs. The estimates and assumptions underlying the fair value calculations used in the Company's impairment test are uncertain by their nature and can vary significantly from actual results. Factors that management must estimate include, but are not limited to, industry and market conditions, sales volume and pricing, raw material costs, capital expenditures, working capital changes, cost of capital, debt-equity mix and tax rates. The estimates and assumptions that most significantly affect the fair value calculation are sales volume and the associated cash flow assumptions, market growth and weighted average cost of capital. The estimates and assumptions used in the estimate of fair value are consistent with those the Company uses in its internal planning.
The “step two” of the PST goodwill impairment test utilized the following methodologies in determining fair value. Buildings and machinery were valued at an estimated replacement cost for an asset of comparable age and condition. PST finite lived identified intangible assets are customer relationships, tradenames and technology. Customer relationships were valued using an excess earnings method, using various inputs such as the estimated customer attrition rate, future earnings forecast, the amount of contributory asset charges, and a discount rate. Tradenames and technology intangibles are valued using a relief from royalty method, which is based upon comparable market royalty rates for tradenames of similar value. Other working capital items are generally recorded at carrying value, unless there were known conditions that would impact the ultimate settlement amount of a particular item.
46
| 50 |
NOTES TO CONSOLIDATED FINANCIAL STATEMENTS
(in thousands, except share and per share data, unless otherwise indicated)
Other Intangible Assets
Other intangible assets, net at December 31, 20152016 and 20142015 consisted of the following:
| Acquisition | Accumulated | |||||||||||
| As of December 31, 2016 | cost | amortization | Net | |||||||||
| Customer lists | $ | 27,476 | $ | (9,138 | ) | $ | 18,338 | |||||
| Tradenames | 18,116 | (4,558 | ) | 13,558 | ||||||||
| Technology | 10,862 | (3,498 | ) | 7,364 | ||||||||
| Other | 41 | (41 | ) | - | ||||||||
| Total | $ | 56,495 | $ | (17,235 | ) | $ | 39,260 | |||||
| Acquisition | Accumulated | |||||||||||
| As of December 31, 2015 | cost | amortization | Net | |||||||||
| Customer lists | $ | 23,003 | $ | (6,101 | ) | $ | 16,902 | |||||
| Tradenames | 15,129 | (3,043 | ) | 12,086 | ||||||||
| Technology | 9,066 | (2,336 | ) | 6,730 | ||||||||
| Other | 34 | (34 | ) | - | ||||||||
| Total | $ | 47,232 | $ | (11,514 | ) | $ | 35,718 | |||||
| Acquisition | Accumulated | |||||||||||
| As of December 31, 2014 | cost | amortization | Net | |||||||||
| Customer lists | $ | 33,686 | $ | (6,687 | ) | $ | 26,999 | |||||
| Tradenames | 22,224 | (3,338 | ) | 18,886 | ||||||||
| Technology | 13,327 | (2,575 | ) | 10,752 | ||||||||
| Other | 50 | (50 | ) | - | ||||||||
| Total | $ | 69,287 | $ | (12,650 | ) | $ | 56,637 | |||||
Other intangible assets, net at December 31, 20152016 include customer lists, tradenames and technology of $16,602, $12,067$18,083, $13,554 and $6,730,$7,364, respectively, related to the PST segment with the remaining amounts related to the Electronics segment.
The Company recognized $3,259, $3,445 $4,784 and $5,187$4,784 of amortization expense in 2016, 2015 2014 and 2013,2014, respectively. Amortization expense is included as a component of selling, general and administrative on the consolidated statements of operations. Annual amortization expense for intangible assets is estimated to be approximately $3,000$3,200 for the years 20162017 through 2021. The weighted-average remaining amortization period is approximately 1312 years.
Accrued Expenses and Other Current Liabilities
Accrued expenses and other current liabilities consist of the following:
| As of December 31 | 2015 | 2014 | 2016 | 2015 | ||||||||||||
| Compensation related liabilities | $ | 17,878 | $ | 17,431 | $ | 16,329 | $ | 17,878 | ||||||||
| Product warranty and recall obligations | 4,446 | 6,397 | 6,727 | 4,446 | ||||||||||||
| Other(A) | 16,596 | 18,238 | 18,433 | 16,596 | ||||||||||||
| Total accrued expenses and other current liabilities | $ | 38,920 | $ | 42,066 | $ | 41,489 | $ | 38,920 | ||||||||
| (A) | “Other” is comprised of miscellaneous accruals, none of which individually contributed a significant portion of the total. |
(A) “Other” is comprised of miscellaneous accruals, none of which individually contributed a significant portion of the total.
Income Taxes
The Company accounts for income taxes using the liability method. Deferred income taxes reflect the tax consequences on future years of differences between the tax basis of assets and liabilities and their financial reporting amounts. Future tax benefits are recognized to the extent that realization of such benefits is more likely than not to occur. The effect of a change in tax rates on deferred tax assets and liabilities is recognized in the period that includes the enactment date.
| 51 |
NOTES TO CONSOLIDATED FINANCIAL STATEMENTS
(in thousands, except share and per share data, unless otherwise indicated)
Deferred tax assets are recognized to the extent that these assets are more-likely-than-notmore likely than not to be realized (See Note 5). In making such a determination, the Company considers all available positive and negative evidence, including future reversalsrelease of existing taxable temporary differences, projected future taxable income, tax planning strategies, and results of recent operations. ReversalRelease of some or all of a valuation allowance would result in the recognition of certain deferred tax assets and a decrease to income tax expense for the period the reversalrelease is recorded.
The Company's policy is to provide for uncertain tax positions and the related interest and penalties based upon management's assessment of whether a tax benefit is more-likely-than-notmore likely than not to be sustained upon examination by tax authorities. At December 31, 2015, the Company believes it has appropriately accounted for any unrecognized tax benefits (see Note 5). To the extent the Company prevails in matters for which a liability for an unrecognized tax benefit is established or is required to pay amounts in excess of the liability, the Company's effective tax rate in a given financial statement period may be affected.
Currency Translation
The financial statements of foreign subsidiaries, where the local currency is the functional currency, are translated into U.S. dollars using exchange rates in effect at the period end for assets and liabilities and average exchange rates during each reporting period for the results of operations. Adjustments resulting from translation of financial statements are reflected as a component of accumulated other comprehensive loss in the Company’s consolidated balance sheets.
Foreign currency transactions are remeasured into the functional currency using translation rates in effect at the time of the transaction with the resulting adjustments included on the consolidated statements of operations within other expense, net. These foreign currency transaction (gains) losses, including the impact of hedging activities, were $(268), $1,693 $1,212 and $2,109$1,212 for the years ended December 31, 2016, 2015 2014 and 2013,2014, respectively.
Revenue Recognition and Sales Commitments
The Company recognizes revenues from the sale of products, net of actual and estimated returns, at the point of passage of title, which is either at the time of shipment or upon customer receipt based upon the terms of the sale. The Company recognizes monitoring service revenues as the services are provided to customers. The Company collects certain taxes and fees on behalf of government agencies and remits such collections on a periodic basis. The taxes are collected from customers but are not included in net sales. Estimated returns are based on historical authorized returns. The Company often enters into agreements with its customers at the beginning of a given vehicle’s expected production life. Once such agreements are entered into, it is the Company’s obligation to fulfill the customers’ purchasing requirements for the entire production life of the vehicle. These agreements are subject to potential renegotiation from time to time, which may affect product pricing.
Shipping and Handling Costs
Shipping and handling costs are included in cost of goods sold on the consolidated statements of operations.
Product Warranty and Recall Reserves
Amounts accrued for product warranty and recall claims are established based on the Company's best estimate of the amounts necessary to settle existing and future claims on products sold as of the balance sheet dates. These accruals are based on several factors including past experience, production changes, industry developments and various other considerations including insurance coverage. The Company can provide no assurances that it will not experience material claims or that it will not incur significant costs to defend or settle such claims beyond the amounts accrued or beyond what the Company may recover from its suppliers. The current portion of the product warranty and recall reserve is included as a component of accrued expenses and other current liabilities on the consolidated balance sheets. Product warranty and recall includes $1,973$2,617 and $1,204$1,973 of a long-term liability at December 31, 20152016 and 2014,2015, respectively, which is included as a component of other long-term liabilities on the consolidated balance sheets.
| 52 |
NOTES TO CONSOLIDATED FINANCIAL STATEMENTS
(in thousands, except share and per share data, unless otherwise indicated)
The following provides a reconciliation of changes in the product warranty and recall reserve:
| Years ended December 31 | 2015 | 2014 | 2016 | 2015 | ||||||||||||
| Product warranty and recall at beginning of period | $ | 7,601 | $ | 6,414 | $ | 6,419 | $ | 7,601 | ||||||||
| Accruals for products shipped during period | 4,609 | 4,484 | 4,999 | 4,609 | ||||||||||||
| Aggregate changes in pre-existing liabilities due to claim developments | (156 | ) | 692 | (116 | ) | (156 | ) | |||||||||
| Settlements made during the period | (5,635 | ) | (3,989 | ) | (1,958 | ) | (5,635 | ) | ||||||||
| Product warranty and recall at end of period | $ | 6,419 | $ | 7,601 | $ | 9,344 | $ | 6,419 | ||||||||
Design and Development Costs
Expenses associated with the development of new products, and changes to existing products are charged to expense as incurred, and are included in the Company’s consolidated statements of operations as a separate component of costs and expenses. These product development costs amounted to $40,212, $38,792 $41,609 and $40,372$41,609 for the years ended December 31, 2016, 2015 2014 and 2013,2014, respectively, or 6.0%5.8%, 6.3%6.0% and 6.1%6.3% of net sales for these respective periods.
Research and Development Activities
The Company’s Electronics segment entersand Control Devices segments enter into research and development contracts with certain customers, which generally provide for reimbursement of costs. The Company incurred and was reimbursed for contracted research and development costs of $12,764, $9,659 $12,319 and $16,982$12,319 for the years ended December 31, 2016, 2015 2014 and 2013,2014, respectively.
Share-Based Compensation
At December 31, 2015,2016, the Company had two types of share-based compensation plans: (1) Long-Term Incentive Plan as amended, for employees and (2) the Amended Directors’ Restricted Shares Plan, for non-employee directors. The Long-Term Incentive Plan is made up of the Long-Term Incentive Plan that was approved by the Company's shareholders on September 30, 1997, which expired on June 30, 2007, and the Amended and Restated Long-Term Incentive Plan, as amended, which expired on April 24, 2016 and the 2016 Long-Term Incentive Plan that was approved by shareholders on May 17, 2010,10, 2016, and expires on April 24, 2016.May 10, 2026.
Total compensation expense recognized as a component of selling, general and administrative expense on the consolidated statements of operations for share-based compensation arrangements was $6,134, including $545 related to the modification of the retirement notice provisions of certain awards, $7,224, including $2,225 from the accelerated vesting in connection with the retirement of the Company’s former President and Chief Executive Officer, $5,406 and $4,974$5,406 for the years ended December 31, 2016, 2015 2014 and 2013,2014, respectively. Of these amounts, $(117), $828 $243 and $155$243 for the years ended December 31, 2016, 2015 2014 and 2013,2014, respectively, were related to the Long-Term Cash Incentive Plan “Phantom Shares” discussed in Note 8. There was no share-based compensation expense capitalized in inventory during 2016, 2015 2014 or 2013.2014.
Financial Instruments and Derivative Financial Instruments
Financial instruments, including derivative financial instruments, held by the Company include cash and cash equivalents, accounts receivable, accounts payable, long-term debt, an interest rate swap, fixed price commodity contracts and foreign currency forward contracts. The carrying value of cash and cash equivalents, accounts receivable and accounts payable is considered to be representative of fair value because of the short maturity of these instruments. See Note 9 for fair value disclosures of the Company’s financial instruments.
Common Shares Held in Treasury
The Company accounts for Common Shares held in treasury under the cost method (applied on a FIFO basis) and includes such shares as a reduction of total shareholders’ equity.
| 53 |
NOTES TO CONSOLIDATED FINANCIAL STATEMENTS
(in thousands, except share and per share data, unless otherwise indicated)
Earnings (Loss) Per Share
Basic earnings (loss) per share was computed by dividing net income attributable to Stoneridge Inc. by the weighted-average number of Common Shares outstanding for each respective period. Diluted earnings (loss) per share was calculated by dividing net income (loss) attributable to Stoneridge, Inc. by the weighted-average of all potentially dilutive Common Shares that were outstanding during the periods presented. However, for all periods in which the Company recognized a net loss from continuing operations, the Company did not recognize the effect of the potential dilutive securities as their inclusion would have been anti-dilutive.
NOTES TO CONSOLIDATED FINANCIAL STATEMENTS
(in thousands, except share and per share data, unless otherwise indicated)
Actual weighted-average Common Shares outstanding used in calculating basic and diluted net income (loss) per share were as follows:
| Years ended December 31 | 2015 | 2014 | 2013 | |||||||||
| Basic weighted-average shares outstanding | 27,337,954 | 26,923,809 | 26,670,501 | |||||||||
| Effect of dilutive securities | 621,208 | - | 522,984 | |||||||||
| Diluted weighted-average shares outstanding | 27,959,162 | 26,923,809 | 27,193,485 | |||||||||
| Years ended December 31 | 2016 | 2015 | 2014 | |||||||||
| Basic weighted-average Common Shares outstanding | 27,763,990 | 27,337,954 | 26,923,809 | |||||||||
| Effect of dilutive shares | 544,932 | 621,208 | - | |||||||||
| Diluted weighted-average Common Shares outstanding | 28,308,922 | 27,959,162 | 26,923,809 | |||||||||
There were no outstanding options at December 31, 20150, 134,250 and 2014. Options to purchase 20,000 Common Shares at a price of $15.73 per share were outstanding at December 31, 2013 but were not included in the computation of diluted earnings per share because their respective exercise prices were greater than the average closing market price of Company Common Shares and the effect would be anti-dilutive.
There were 134,250, 466,650 and 663,750 performance-based restricted Common Shares outstanding at December 31, 2016, 2015 2014 and 2013,2014, respectively. There were also 843,140, 573,885 and 374,400 performance-based right to receive Common Shares outstanding at December 31, 2016, 2015 and 2014. These performance-based restricted and right to receive Common Shares are included in the computation of diluted earnings per share based on the number of Common Shares that would be issuable if the end of the year were the end of the contingency period. Restricted and right to receive Common Shares were not included in the computation of diluted earnings per share for the year ended December 31, 2014 as the Company had a net loss from continuing operations that year, and as such they would behave been anti-dilutive.
Deferred Finance Costs
Deferred financeFinancing Costs, net
Deferred financing costs are amortized over the life of the related financial instrument using the straight-line method, which approximates the effective interest method. The 2.5% discount to the initial purchasers of the Company’s senior notes was accreted using the effective interest rate of 10.0% through October 18, 2014, the date the senior notes were redeemed. During 2014, the Company redeemed the senior notes resulting in the acceleration of the remaining deferred financing costs of $597 which were included in loss on early extinguishment of debt in the statement of operations in 2014. Deferred finance cost amortization and debt discount accretion for the years ended December 31, 2016, 2015 and 2014 was $355, $388 and 2013 was $388, $850, and $908, respectively, and is included as a component of interest expense, net in the consolidated statements of operations. As permitted by the ASU, the Company has elected to continue to present deferred financing costs related to the Credit Facility within long-term assets in the Company’s consolidated balance sheets. Deferred financing costs, net, were $1,471 and $1,428, as of December 31, 2016 and 2015, and 2014, deferred financing costs, net, all of which are associated with the revolving credit facility, were $1,428 and $1,767, respectively, and were included in the consolidated balance sheets as a component of investments and other long-term assets, net.respectively.
| 54 |
NOTES TO CONSOLIDATED FINANCIAL STATEMENTS
(in thousands, except share and per share data, unless otherwise indicated)
Changes in Accumulated Other Comprehensive Loss by Component
Changes in accumulated other comprehensive loss for the years ended December 31, 20152016 and 20142015 were as follows:
| Foreign | Unrealized | Benefit | Foreign | Unrealized | Benefit | |||||||||||||||||||||||||||
| currency | gain (loss) | plan | currency | gain (loss) | plan | |||||||||||||||||||||||||||
| translation | on derivatives | liability | Total | translation | on derivatives | liability | Total | |||||||||||||||||||||||||
| Balance at January 1, 2016 | $ | (70,296 | ) | $ | 390 | $ | 84 | $ | (69,822 | ) | ||||||||||||||||||||||
| Other comprehensive income (loss) before reclassifications | 2,401 | (572 | ) | - | 1,829 | |||||||||||||||||||||||||||
| Amounts reclassified from accumulated other comprehensive loss | - | 164 | (84 | ) | 80 | |||||||||||||||||||||||||||
| Net other comprehensive income (loss), net of tax | 2,401 | (408 | ) | (84 | ) | 1,909 | ||||||||||||||||||||||||||
| Balance at December 31, 2016 | $ | (67,895 | ) | $ | (18 | ) | $ | - | $ | (67,913 | ) | |||||||||||||||||||||
| Balance at January 1, 2015 | $ | (45,603 | ) | $ | 1 | $ | 129 | $ | (45,473 | ) | $ | (45,603 | ) | $ | 1 | $ | 129 | $ | (45,473 | ) | ||||||||||||
| Other comprehensive loss before reclassifications | (24,693 | ) | (671 | ) | (45 | ) | (25,409 | ) | (24,693 | ) | (671 | ) | (45 | ) | (25,409 | ) | ||||||||||||||||
| Amounts reclassified from accumulated other comprehensive loss | - | 1,060 | - | 1,060 | - | 1,060 | - | 1,060 | ||||||||||||||||||||||||
| Net other comprehensive income (loss), net of tax | (24,693 | ) | 389 | (45 | ) | (24,349 | ) | (24,693 | ) | 389 | (45 | ) | (24,349 | ) | ||||||||||||||||||
| Balance at December 31, 2015 | $ | (70,296 | ) | $ | 390 | $ | 84 | $ | (69,822 | ) | $ | (70,296 | ) | $ | 390 | $ | 84 | $ | (69,822 | ) | ||||||||||||
| Balance at January 1, 2014 | $ | (30,335 | ) | $ | (111 | ) | $ | (12 | ) | $ | (30,458 | ) | ||||||||||||||||||||
| Other comprehensive loss before reclassifications | (18,002 | ) | (454 | ) | - | (18,456 | ) | |||||||||||||||||||||||||
| Amounts reclassified from accumulated other comprehensive loss | 2,734 | 566 | 141 | 3,441 | ||||||||||||||||||||||||||||
| Net other comprehensive income (loss), net of tax | (15,268 | ) | 112 | 141 | (15,015 | ) | ||||||||||||||||||||||||||
| Balance at December 31, 2014 | $ | (45,603 | ) | $ | 1 | $ | 129 | $ | (45,473 | ) | ||||||||||||||||||||||
Recently Issued Accounting Standards Not Yet Adopted as of December 31, 20152016
In January 2017, the Financial Accounting Standards Board ("FASB") issued Accounting Standards Update ("ASU") 2017-04, "Simplifying the Test for Goodwill Impairment." It eliminates Step 2 from the goodwill impairment test and an entity should recognize an impairment charge for the amount by which the carrying amount of goodwill exceeds the reporting unit's fair value, not to exceed the carrying amount of goodwill. This guidance is effective for annual and any interim impairment tests in fiscal years beginning after December 15, 2019. The Company does not expect this standard to have any impact on its consolidated financial statements.
In January 2017, the FASB also issued ASU 2017-01, "Clarifying the Definition of a Business. It revises the definition of a business and provides a framework to evaluate when an input and a substantive process are present in an acquisition to be considered a business. This guidance is effective for annual periods beginning after December 15, 2017. The Company expects to adopt this standard as of January 1, 2018, which is not expected to have any impact on its consolidated financial statements.
In August 2016, the FASB issued ASU 2016-15, “Statement of Cash Flows - Classification of Certain Cash Receipts and Cash Payments (Topic 230)” which provides guidance on the presentation and classification of certain cash receipts and cash payments in the statement of cash flows in order to reduce diversity in practice. The ASU is effective for interim and annual periods beginning after December 15, 2017 with early adoption permitted. The Company is currently evaluating the impact of adopting this standard on its consolidated financial statements.
| 55 |
NOTES TO CONSOLIDATED FINANCIAL STATEMENTS
(in thousands, except share and per share data, unless otherwise indicated)
In March 2016, the FASB issued Accounting Standards Update ASU 2016-09, “Compensation - Stock Compensation (Topic 718)” which is intended to simplify several aspects of the accounting for share-based payment award transactions including how excess tax benefits should be classified in the Company’s consolidated financial statements. The new standard simplifies the treatment of share based payment transactions by recognizing the impact of excess tax benefits or deficiencies related to exercised or vested awards in income tax expense in the period of exercise or vesting. The new standard also modifies the diluted earnings per share calculation using the treasury stock method by eliminating the excess tax benefits or deficiencies from the calculation. These changes will be recognized prospectively. The new standard also permits companies to recognize forfeitures as they occur as an alternative to utilizing estimated forfeitures rates which has been the required practice. The presentation of excess tax benefits in the statement of consolidated cash flows is also modified to be included with other income tax cash flows as an operating activity. The change can be adopted using a prospective or retrospective transition method. The new standard clarifies that cash paid by an employer when directly withholding shares for tax withholding purposes should be presented as a financing activity in the statement of consolidated cash flows and should be applied retrospectively. The new accounting standard will be effective for fiscal years beginning after December 15, 2016, including interim periods within that year. The Company had unrecognized tax benefits related to share-based payment awards of $1,700 as of December 31, 2016. Upon adoption, this amount will be recorded to other long-term assets with a corresponding increase to retained earnings associated with the cumulative effect of the accounting change.
In February 2016, the Financial Accounting Standards Board (“FASB”)FASB issued Accounting Standards Update (“ASU”)ASU 2016 – 02, “Leases (Topic 842)”, which will require that a lessee recognize assets and liabilities on the balance sheet for all leases with a lease term of more than twelve months, with the result being the recognition of a right of use asset and a lease liability. The amendment is effective for fiscal years, and interim periods within those fiscal years, beginning after December 15, 2018. The Company expects to adopt this standard as of January 1, 2019. The Company is currently evaluating the impact of adopting this standard on its consolidated financial statements, which will require right of use assets and lease liabilities be recorded in the consolidated balance sheet for operating leases.
In November 2015, the FASB issued ASU 2015 – 17, “Income Taxes (Topic 740),” which simplifies the presentation of deferred income taxes. Currently entities are required to separate deferred income tax liabilities and assets into current and noncurrent amounts in the balance sheet. ASU 2015-17 requires that all deferred income taxes be classified as noncurrent in the balance sheet. The amendment is effective for fiscal years beginning after December 15, 2016 including interim periods within those fiscal years and may be applied either prospectively or retrospectively with early adoption permitted. The Company is currently evaluating the impact of adopting this standard on its consolidated financial statements.
In September 2015, the FASB issued ASU 2015 – 16, “Business Combinations,” which simplifies the accounting for measurement-period adjustments related to business combinations. ASU 2015-16 requires that an acquirer recognize adjustments to provisional amounts that are identified during the measurement period in the reporting period in which the adjustment amounts are determined. The amendments in the ASU require that the acquirer record, in the same period’s financial statements, the effect on earnings of changes in depreciation, amortization, or other income effects, if any, as a result of the change to the provisional amounts, calculated as if the accounting had been completed at the acquisition date. The amendment is effective for fiscal years beginning after December 15, 2015, including interim periods within those fiscal years and is to be applied prospectively to adjustments to provisional amounts that occur after the effective date of this ASU with earlier application permitted for financial statements that have not been issued. The Company will adopt this standard as of January 1, 2016, which is not expected to have a material impact on the Company’s consolidated financial statements or disclosures.
In July 2015, the FASB issued ASU 2015-11 “Simplifying the Measurement of Inventory” which requires that inventory be measured at the lower of cost or net realizable value. Prior to the issuance of the new guidance, inventory was measured at the lower of cost or market. Replacing the concept of market with the single measurement of net realizable value is intended to reduce cost and complexity. The new accounting standard is effective for fiscal years beginning after December 15, 2016. The Company expects towill adopt this standard as of January 1, 2017, which is not expected to have a material impact on the Company’s consolidated financial statements or disclosures.
NOTES TO CONSOLIDATED FINANCIAL STATEMENTS
(in thousands, except share and per share data, unless otherwise indicated)
In May 2014, the FASB issued ASU 2014-09 “Revenue from Contracts with Customers,” which is the new comprehensive revenue recognition standard that will supersede existing revenue recognition guidance under U.S. GAAP. The standard's core principle is that a company will recognize revenue when it transfers promised goods or services to a customer in an amount that reflects the consideration to which the company expects to be entitled in exchange for those goods or services. To achieve this principle, an entity identifies the contract with a customer, identifies the separate performance obligations in the contract, determines the transaction price, allocates the transaction price to the separate performance obligations and recognizes revenue when each separate performance obligation is satisfied. This ASU allows for both retrospective and prospective methods of adoption. In July 2015, the FASB approved a one-year deferral of the effective date of the standard. As such, the new standard will become effective for annual and interim periods beginning after December 15, 2017 with early adoption on the original effective date permitted. The Company is currently evaluating the impact of adopting this standard on its consolidated financial statements.statements, and anticipate testing our new controls and processes designed to comply with the standard in 2017 to permit the Company’s adoption on January 1, 2018. The Company anticipates changes to revenue recognition of pre-production activities such as customer funded tooling and engineering design and development cost recoveries, including the potential recording of these as revenue.
Recently Adopted Accounting Standards
In AprilSeptember 2015, the FASB issued ASU 2015-03, “Simplifying the Presentation of Debt Issuance Costs,2015-16, “Business Combinations,” which amendssimplifies the current presentation of certain debt issuance costsaccounting for measurement-period adjustments related to business combinations. ASU 2015-16 requires that an acquirer recognize adjustments to provisional amounts that are identified during the measurement period in the balance sheet. ASU 2015-03 requires that debt issuance costs related to a recognized debt liability be presentedreporting period in which the adjustment amounts are determined. The amendments in the balance sheetASU require that the acquirer record, in the same period’s financial statements, the effect on earnings of changes in depreciation, amortization, or other income effects, if any, as a direct deduction fromresult of the carrying amountchange to the provisional amounts, calculated as if the accounting had been completed at the acquisition date. The Company adopted this standard as of that debt liability, consistent with debt discounts, instead of as an asset.January 1, 2016, and was applied prospectively. The recognition and measurement of debt issuance costs are not affected by the amendments in this ASU. The guidance in ASU 2015-03adoption did not address the presentation or subsequent measurement of debt issuance costs related to line of credit arrangements. Given the absence of authoritative guidance, in June 2015 the FASB issued ASU 2015-15, “Presentation and Subsequent Measurement of Debt Issuance Costs Associated with Line-of-Credit Arrangements,” which states that the SEC will not object to an entity deferring and presenting debt issuance costs related to revolving credit arrangements as an asset and subsequently amortizing them. These amendments are to be applied retrospectively and are effective for public companies for fiscal years, and for interim periods within those fiscal years, beginning after December 15, 2015, with early adoption permitted. As permitted by the ASU, the Company adopted these standards in the third quarter of 2015, which had nohave a material impact on the Company’s consolidated financial statements.statements or disclosures.
| 56 |
NOTES TO CONSOLIDATED FINANCIAL STATEMENTS
(in thousands, except share and per share data, unless otherwise indicated)
In November 2015, the FASB issued ASU 2015-17, “Income Taxes (Topic 740),” which simplifies the presentation of deferred income taxes. Under previous guidance, entities were required to separate deferred income tax liabilities and assets into current and noncurrent amounts in the balance sheet on a jurisdiction by jurisdiction basis. ASU 2015-17 requires that all deferred income taxes be classified as noncurrent in the balance sheet. The Company has elected to continue to presentadopted this standard in 2016 and applied it prospectively. As such, all deferred financing costs related to its revolving credit facility, which had balances of $1,428tax assets and $1,767liabilities have been classified as non-current in the balance sheet at December 31, 20152016. See Note 5 for additional information regarding deferred tax assets and 2014, respectively, within long-term assets in the Company’s consolidated balance sheets.liabilities.
3. Investments
Minda Stoneridge Instruments Ltd.
The Company has a 49% interest in Minda, a company based in India that manufactures electronics, instrumentation equipment and sensors for the motorcycle and commercial vehicle markets. The investment is accounted for under the equity method of accounting. The Company’s investment in Minda, recorded as a component of investments and other long-term assets, net on the consolidated balance sheets, was $6,929$7,952 and $6,653$6,929 as of December 31, 20152016 and 2014,2015, respectively. Equity in earnings of Minda included in the consolidated statements of operations waswere $1,233, $608 $815 and $476$815 for the years ended December 31, 2016, 2015 2014 and 2013,2014, respectively.
PST Eletrônica Ltda.
The Company has a 74% controlling interest in PST for the years ended December 31, 2016, 2015 2014 and 2013.2014. Noncontrolling interest in PST increased by $452 to $13,762 at December 31, 2016 due to a proportionate share of its net loss of $1,887 for the year ended December 31, 2016 and a favorable change in foreign currency translation of $2,339. Noncontrolling interest in PST decreased by $9,240 to $13,310 at December 31, 2015 due to a proportionate share of its net loss of $2,207 for the year ended December 31, 2015 and an unfavorable change in foreign currency translation of $7,033. Noncontrolling interest in PST decreased by $16,990 to $22,550$22,540 at December 31, 2014 due to a proportionate share of its net loss of $13,483 including goodwill impairment for the year ended December 31, 2014 and an unfavorable change in foreign currency translation of $3,507. Noncontrolling interest in PST decreased by $4,541 for the year ended December 31, 2013 due to an unfavorable change in foreign currency translation of $5,706 and a dividend of $212 partially offset by a proportionate share of its net income of $1,377.
NOTES TO CONSOLIDATED FINANCIAL STATEMENTS
(in thousands, except share and per share data, unless otherwise indicated)
Comprehensive lossgain (loss) related to PST noncontrolling interest was $9,240, $16,990$452, $(9,240) and $4,329$(16,990) for the years ended December 31, 2016, 2015 2014 and 2013,2014, respectively.
PST has dividends payable declared in previous years to noncontrolling interest of $10,842 Brazilian real ($2,777)3,327) and $10,842 Brazilian real ($4,082)2,777) at December 31, 20152016 and 2014,2015, respectively.
4. Debt
| Interest rates at | Interest rates at | |||||||||||||||||||||||||||||
| December 31, | December 31, | December 31, | December 31, | December 31, | December 31, | |||||||||||||||||||||||||
| 2015 | 2014 | 2015 | Maturity | 2016 | 2015 | 2016 | Maturity | |||||||||||||||||||||||
| Revolving Credit Facility | ||||||||||||||||||||||||||||||
| Credit facility | $ | 100,000 | $ | 100,000 | 1.86 | % | September 2019 | $ | 67,000 | $ | 100,000 | 2.00 | % | September 2021 | ||||||||||||||||
| Debt | ||||||||||||||||||||||||||||||
| PST short-term obligations | 11,556 | 11,249 | 5.5% - 19.31 | % | 2016 | 5,097 | 11,556 | 4.27% - 20.33 | % | 2017 | ||||||||||||||||||||
| PST long-term notes | 6,428 | 16,770 | 6.17% - 8.0 | % | 2016 - 2021 | 11,452 | 6,428 | 7.5% - 19.00 | % | 2017 - 2021 | ||||||||||||||||||||
| Suzhou note | - | 1,450 | N/A | April 2015 | ||||||||||||||||||||||||||
| Other | 379 | 837 | 137 | 379 | ||||||||||||||||||||||||||
| Total debt | 18,363 | 30,306 | 16,686 | 18,363 | ||||||||||||||||||||||||||
| Less: current portion | (13,905 | ) | (19,655 | ) | (8,626 | ) | (13,905 | ) | ||||||||||||||||||||||
| Total long-term debt, net | $ | 4,458 | $ | 10,651 | $ | 8,060 | $ | 4,458 | ||||||||||||||||||||||
| 57 |
NOTES TO CONSOLIDATED FINANCIAL STATEMENTS
(in thousands, except share and per share data, unless otherwise indicated)
Revolving Credit Facility
On November 2, 2007, the Company entered into an asset-based credit facility which permitted borrowing up to a maximum level of $100,000. The Company entered into an Amended and Restated Credit and Security Agreement and a Second Amended and Restated Credit and Security Agreement on September 20, 2010 and December 1, 2011, respectively.
On September 12, 2014, the Company entered into a Third Amended and Restated Credit Agreement (the “Amended“Credit Agreement” or “Credit Facility”). The Amended Agreement provides for a $300,000 revolving credit facility, which replaced the Company’s existing $100,000 asset-based credit facility and includes a letter of credit subfacility, swing line subfacility and multicurrency subfacility. The Amended Agreement also has an accordion feature which allows the Company to increase the availability by up to $80,000 upon the satisfaction of certain conditions. The Amended Agreement extended the termination date to September 12, 2019 from December 1, 2016. In 2014, the Company capitalized $1,666 of deferred financing costs and recognized a $100 loss on extinguishment of previously recorded deferred financing costs associated with amending the AmendedCredit Agreement. On March 26, 2015, the Company entered into Amendment No. 1 (the “Amendment”) toof the Amended AgreementCredit Amendment which amended the definition of Consolidated EBITDA to allow for the add back of cash premiums and other non-cash charges related to the amendment and restatement of the AmendedCredit Agreement and the early extinguishment of the Company’s 9.5% Senior Notes totaling $10,507 both of which occurred in second half of 2014. Consolidated EBITDA is used in computing the Company’s leverage ratio and interest coverage ratio which are covenants within the Amended Agreement. On February 23, 2016, the Company entered into Amendment No. 2 toof the Amended AgreementCredit Facility which amended and waived any default or potential defaults with respect to the pledging as collateral additional shares issued by a wholly owned subsidiary and newly issued shares associated with the formation of a new subsidiary. On August 12, 2016, the Company entered into Amendment No. 3 of the Credit Agreement which extended of the expiration date of the Credit Agreement by two years to September 12, 2021, increased the borrowing sub-limit for the Company’s foreign subsidiaries by $30,000 to $80,000, increased the basket of permitted loans and investments in foreign subsidiaries by $5,000 to $30,000, and provided additional flexibility to the Company for certain permitted corporate transactions involving its foreign subsidiaries as defined in the Agreement. As a result of Amendment No. 3, the Company capitalized deferred financing costs of $399, which will be amortized over the remaining term of the Credit Facility.
Borrowings under the Amended AgreementCredit Facility will bear interest at either the Base Rate, as defined, or the LIBOR Rate, at the Company’s option, plus the applicable margin as set forth in the Amended Agreement.Credit Facility. The Company is also subject to a commitment fee ranging from 0.20% to 0.35% based on the Company’s leverage ratio. The agreement governing our Credit Facility requires the Company to maintain a maximum leverage ratio of 3.00 to 1.00, and a minimum interest coverage ratio of 3.50 to 1.00 and places a maximum annual limit on capital expenditures. The Amended AgreementCredit Facility also contains other affirmative and negative covenants and events of default that are customary for credit arrangements of this type including covenants which place restrictions and/or limitations on the Company’s ability to borrow money, make capital expenditures and pay dividends. Borrowings outstanding on the Credit Facility at both December 31, 2016 and 2015 were $67,000 and 2014 were $100,000.$100,000 respectively. The Company has outstanding letters of credit of $3,399 at December 31, 2016.
The Company was in compliance with all Credit Facility covenants at December 31, 20152016 and 2014.
NOTES TO CONSOLIDATED FINANCIAL STATEMENTS
(in thousands, except share and per share data, unless otherwise indicated)
2015.
Debt
On October 4, 2010, the Company issued $175,000 of senior notes which bore interest at an annual rate of 9.5% and had a maturity of October 15, 2017. On September 2, 2014, the Company redeemed $17,500 or 10.0%, of its senior notes at a price of 103.0% of the principal amount. As a result of the redemption, the Company recognized a loss on extinguishment of debt of $820 in the third quarter of 2014, which included a premium of $525 and the acceleration of both the associated deferred financing costs and original issue discount totaling $295.
On October 15, 2014, the Company redeemed the remaining $157,500 of its senior notes at a price of 104.75% of the principal amount discharging the corresponding senior notes indenture. As a result of the redemption, the Company recognized a loss on extinguishment of debt of $9,687 in the fourth quarter of 2014, which included a premium of $7,481 and the acceleration of the remaining deferred financing costs of $535, original issue discount of $2,019 and de-designation date unrecognized gain on the interest rate swap of $348. The senior notes were redeemed using funds from borrowing $100,000 under the Credit Facility, proceeds from the sale of the Wiring business and existing cash.
| 58 |
NOTES TO CONSOLIDATED FINANCIAL STATEMENTS
(in thousands, except share and per share data, unless otherwise indicated)
PST maintains several short-term obligations and long-term notes used for working capital purposes which have fixed interest rates. The weighted-average interest rates of short-term and long-term debt of PST at December 31, 20152016 were 16.1%10.3% and 7.3%14.1%, respectively. Depending on the specific note, interest is payable either monthly or annually. Principal payments on PST debt at December 31, 20152016 are as follows: $13,526 in 2016, $1,873$8,489 in 2017, $986$4,303 in 2018, $965$2,604 in 2019, $331$611 in 2020, and $303$542 in 2021.
OnFor the period of February 25, 2014 to April 2015, the Company's wholly-owned subsidiary located in Suzhou, China entered into aheld term loan for 9,000 Chinese yuan which maturedloans in August 2014. On October 17, 2014, the subsidiary entered into a new term loan foramount of 9,000 Chinese yuan (the "Suzhou note") which matured in April 2015. The U.S. dollar equivalent outstanding loan balance was $1,450 at December 31, 2014 which was included on the consolidated balance sheet as a component of current portion of long-term debt.. Interest was payable quarterly at 120.0% of the one-year lending rate published by The People's Bank of China.
The Company's wholly-owned subsidiary located in Stockholm, Sweden, has an overdraft credit line which allows overdrafts on the subsidiary's bank account up to a maximum level of 20,000 Swedish krona, or $2,369$2,196 and $2,562,$2,369, at December 31, 20152016 and 2014,2015, respectively. At December 31, 20152016 and 2014,2015, there was no balance outstanding on this bank account.
The Company was in compliance with all debt covenants at December 31, 20152016 and 2014.2015.
At December 31, 2015,2016, the future maturities of debt were as follows:
| Year ended December 31 | ||||
| 2016 | $ | 13,905 | ||
| 2017 | 1,873 | |||
| 2018 | 986 | |||
| 2019 | 100,965 | |||
| 2020 | 331 | |||
| Thereafter | 303 | |||
| Total | $ | 118,363 | ||
NOTES TO CONSOLIDATED FINANCIAL STATEMENTS
(in thousands, except share and per share data, unless otherwise indicated)
| Year ended December 31 | ||||
| 2017 | $ | 8,626 | ||
| 2018 | 4,303 | |||
| 2019 | 2,604 | |||
| 2020 | 611 | |||
| 2021 | 67,542 | |||
| Total | $ | 83,686 | ||
5. Income Taxes
The income tax expense (benefit) included in the accompanying consolidated statement of operations represents federal, state and foreign income taxes. The components of income (loss) before income taxes and the expense (benefit)provision for income taxes consist of the following:
| Years ended December 31 | 2015 | 2014 | 2013 | 2016 | 2015 | 2014 | ||||||||||||||||||
| Income (loss) before income taxes: | ||||||||||||||||||||||||
| Domestic | $ | 22,959 | $ | 1,635 | $ | 5,771 | $ | 35,088 | $ | 22,959 | $ | 1,635 | ||||||||||||
| Foreign | (2,729 | ) | (54,695 | ) | 17,555 | 4,097 | (2,729 | ) | (54,695 | ) | ||||||||||||||
| Total income (loss) before income taxes | $ | 20,230 | $ | (53,060 | ) | $ | 23,326 | $ | 39,185 | $ | 20,230 | $ | (53,060 | ) | ||||||||||
| Provision for income taxes: | ||||||||||||||||||||||||
| Current: | ||||||||||||||||||||||||
| Federal | $ | 386 | $ | - | $ | - | $ | 760 | $ | 386 | $ | - | ||||||||||||
| State and foreign | 1,232 | 1,382 | 5,878 | 2,575 | 1,232 | 1,382 | ||||||||||||||||||
| Total current expense | 1,618 | 1,382 | 5,878 | 3,335 | 1,618 | 1,382 | ||||||||||||||||||
| Deferred: | ||||||||||||||||||||||||
| Federal | - | - | - | (37,828 | ) | - | - | |||||||||||||||||
| State and foreign | (2,165 | ) | (3,238 | ) | (3,081 | ) | (1,896 | ) | (2,165 | ) | (3,238 | ) | ||||||||||||
| Total deferred benefit | (2,165 | ) | (3,238 | ) | (3,081 | ) | (39,724 | ) | (2,165 | ) | (3,238 | ) | ||||||||||||
| Total income tax expense (benefit) | $ | (547 | ) | $ | (1,856 | ) | $ | 2,797 | ||||||||||||||||
| Total income tax benefit | $ | (36,389 | ) | $ | (547 | ) | $ | (1,856 | ) | |||||||||||||||
| 59 |
NOTES TO CONSOLIDATED FINANCIAL STATEMENTS
(in thousands, except share and per share data, unless otherwise indicated)
A reconciliation of the Company’s effective income tax rate to the statutory federal tax rate is as follows:
| Years ended December 31 | 2015 | 2014 | 2013 | 2016 | 2015 | 2014 | ||||||||||||||||||
| Statutory U.S. federal income tax rate | 35.0 | % | (35.0 | )% | 35.0 | % | 35.0 | % | 35.0 | % | (35.0 | )% | ||||||||||||
| State income taxes, net of federal tax benefit | 0.2 | - | 2.4 | 1.9 | 0.2 | - | ||||||||||||||||||
| Tax credits | (2.8 | ) | (1.3 | ) | (3.5 | ) | (0.8 | ) | (2.8 | ) | (1.3 | ) | ||||||||||||
| Foreign tax rate differential | (3.3 | ) | 0.2 | (9.5 | ) | (4.7 | ) | (3.3 | ) | 0.2 | ||||||||||||||
| Reduction (increase) of income tax accruals | (0.5 | ) | 0.2 | (1.1 | ) | 0.1 | (0.5 | ) | 0.2 | |||||||||||||||
| Tax on foreign dividends, net of foreign tax credits | - | (0.1 | ) | (8.1 | ) | - | - | (0.1 | ) | |||||||||||||||
| Reduction of deferred taxes | 5.5 | - | 0.6 | |||||||||||||||||||||
| Reduction (increase) of deferred taxes | (1.3 | ) | 5.5 | - | ||||||||||||||||||||
| Valuation allowances | (36.0 | ) | (2.1 | ) | (6.2 | ) | (121.6 | ) | (36.0 | ) | (2.1 | ) | ||||||||||||
| Loss of domestic flow-through entity not attributable to Stoneridge, Inc. | - | 33.9 | - | - | - | 33.9 | ||||||||||||||||||
| Non-deductible compensation | (1.5 | ) | 1.0 | 3.0 | - | (1.5 | ) | 1.0 | ||||||||||||||||
| Other | 0.7 | (0.3 | ) | (0.6 | ) | (1.4 | ) | 0.7 | (0.3 | ) | ||||||||||||||
| Effective income tax rate | (2.7 | )% | (3.5 | )% | 12.0 | % | (92.8 | )% | (2.7 | )% | (3.5 | )% | ||||||||||||
The Company recognized income tax expense (benefit) of $(36,389) or (92.8)%, $(547) or (2.7)%, and $(1,856) or (3.5)% and $2,797 or 12.0% of income (loss) before income taxes for federal, state and foreign income taxes for the years ended December 31, 2016, 2015 and 2014, respectively. The increase in tax benefit for the year ended December 31, 2016 compared to the same period for 2015 was predominantly due to the release of the U.S. federal, certain state and 2013, respectively.foreign valuation allowances that were previously recorded against certain deferred tax assets. The decrease in tax benefit for the year ended December 31, 2015 compared to the same period for 2014 was predominantly due to the impact of recording a valuation allowance against the PSTPST’s Brazilian deferred tax assets. Theassets.The increase in the effective tax rate to (2.7)% in 2015 from (3.5)% in 2014 was primarily due to providing a valuation allowance in 2015 with respect to the Brazilian deferred tax assets ofrelated to PST. The impact on the effective tax rate due to the PST valuation allowance was offset by the impact of the improvement in the performance of the U.S. operations, which do not attract tax due to the full valuation allowance, and the prior year impact of the nondeductible goodwill impairment in 2014 that did not impact the effective tax rate for 2015.
NOTES TO CONSOLIDATED FINANCIAL STATEMENTS
(in thousands, except share and per share data, unless otherwise indicated)
The Company has not recorded deferred income taxes on the undistributed earnings of its foreign subsidiaries because of management’s intent and ability to indefinitely reinvest such earnings. At December 31, 20152016 the aggregate undistributed earnings of our foreign subsidiaries amounted to $37,648.$44,898. The Company may be subject to U.S. income taxes and foreign withholding taxes if these earnings were distributed. It is not practicable to estimate the amount of taxes, if any, that may be payable on these earnings as that estimate depends upon circumstances that would exist at the time a remittance occurs.
| 60 |
NOTES TO CONSOLIDATED FINANCIAL STATEMENTS
(in thousands, except share and per share data, unless otherwise indicated)
Significant components of the Company’s deferred tax assets and liabilities were as follows:
| As of December 31 | 2015 | 2014 | 2016 | 2015 | ||||||||||||
| Deferred tax assets: | ||||||||||||||||
| Inventories | $ | 2,108 | $ | 2,009 | $ | 2,156 | $ | 2,108 | ||||||||
| Employee compensation and benefits | 3,902 | 3,675 | 4,785 | 3,902 | ||||||||||||
| Insurance | 281 | 387 | 245 | 281 | ||||||||||||
| Depreciation and amortization | 1,297 | 1,013 | 1,310 | 1,297 | ||||||||||||
| Net operating loss carryforwards | 39,846 | 48,166 | 28,952 | 39,846 | ||||||||||||
| General business credit carryforwards | 12,990 | 12,697 | 14,135 | 12,990 | ||||||||||||
| Other reserves | 5,643 | 7,493 | 7,609 | 5,643 | ||||||||||||
| Gross deferred tax assets | 66,067 | 75,440 | 59,192 | 66,067 | ||||||||||||
| Less: Valuation allowance | (59,391 | ) | (67,907 | ) | (11,125 | ) | (59,391 | ) | ||||||||
| Deferred tax assets less valuation allowance | 6,676 | 7,533 | 48,067 | 6,676 | ||||||||||||
| Deferred tax liabilities: | ||||||||||||||||
| Depreciation and amortization | (13,282 | ) | (20,910 | ) | (14,911 | ) | (13,282 | ) | ||||||||
| Basis difference - equity investee | (31,016 | ) | (31,016 | ) | (31,016 | ) | (31,016 | ) | ||||||||
| Other | (1,074 | ) | (976 | ) | (1,358 | ) | (1,074 | ) | ||||||||
| Gross deferred tax liabilities | (45,372 | ) | (52,902 | ) | (47,285 | ) | (45,372 | ) | ||||||||
| Net deferred tax liability | $ | (38,696 | ) | $ | (45,369 | ) | ||||||||||
| Net deferred tax asset (liability) | $ | 782 | $ | (38,696 | ) | |||||||||||
The balance sheet classification of our net deferred tax asset is shown below:
| Years ended December 31 | 2016 | 2015 | ||||||
| Current deferred income tax assets | - | 1,239 | ||||||
| Current deferred income tax liabilities | - | (39 | ) | |||||
| Long-term deferred income tax assets | 10,542 | 1,436 | ||||||
| Long-term deferred income tax liabilities | (9,760 | ) | (41,332 | ) | ||||
| Net deferred tax asset | $ | 782 | $ | (38,696 | ) | |||
The Company adopted ASU 2015-17 in 2016. As such, all deferred tax assets and liabilities are classified as long-term at December 31, 2016.
Based on the Company’s review of both positive and negative evidence regarding the continuation of the tax valuation allowance at December 31, 2015 and 2014, a valuation allowance the U.S. federal, certain state and foreign deferred tax assets continued to be recorded based upon the conclusion that it was more likely than not they would not be realized before they expired.
| 61 |
NOTES TO CONSOLIDATED FINANCIAL STATEMENTS
(in thousands, except share and per share data, unless otherwise indicated)
The financial results for the U.S. operation improved significantly in 2016 due to the earnings growth of Control Devices segment as well as a significant reduction in interest expense as a result of the Company’s refinancing activities in the fall of 2014. The U.S. operation is in a three year cumulative income position at December 31, 2016. Based on the available positive and negative evidence and the weight accorded to that evidence at December 31, 2016, the Company has determined that the significant positive evidence outweighed the negative evidence. Therefore, the Company has concluded that it is more likely than not that the U.S. federal deferred tax assets will be realized (including those that carry expiration dates) and accordingly will no longer provide a valuation allowance against its domestic deferred tax assets. In addition, the Company concluded that it is more likely than not that the certain state and foreign, deferred tax assets will be realized, and as such the previously provided valuation allowances were released. The total U.S. valuation allowance remaining represents the amount of tax benefit related to certain state and certain foreign net operating losses, credits and other deferred tax assets that are not expected to be realized at December 31, 2016.
Based on a review of objective positive and negative evidence at December 31, 20152016 and 2014, the Company continued to conclude that it is more-likely-than-not that the U.S. federal, and certain state and foreign, deferred tax assets will not be realized before they expire, and as such, a valuation allowance continued to be recorded. During the fourth quarter of 2015, the Company concluded that it was more-likely-than-notmore likely than not that the deferred tax assets of PST willwould not be realized. As a result the Company provided a full valuation allowance, net of certain future reversing taxable temporary differences, with respect to PST’s deferred tax assets. The total valuation allowance at December 31, 2015 represents the amount of tax benefit related to U.S. federal, state and foreignPST’s net operating losses, credits and other deferred tax assets that are not recognized at December 31, 2015 and 2014.expected to be realized.
The Company has net operating loss carry forwards of $89,800, $28,031$53,064, $41,222 and $29,721$35,849 for U.S. federal, state and foreign tax jurisdictions, respectively. The U.S. federal net operating losses, if unused, begin to expire in 2026, the state net operating losses expire at various times and the foreign net operating losses expire at various times or have indefinite expiration dates. The Company has general business and foreign tax credit carry forwards of $14,003, $1,602$15,254, $1,530 and $1,404$1,510 for U.S. federal, state and foreign jurisdictions respectively. The U.S. federal general business credits, if unused, begin to expire in 2021, and the state and foreign tax credits expire at various times.
The Company is required to provide a deferred tax liability corresponding to the difference between the financial reporting basis (which was remeasured to fair value upon the acquisition of an additional 24% of PST in 2011) and the tax basis in the previously held 50% ownership interest in PST (the “outside” basis difference). This outside basis difference will generally remain fixed until (1) dividends from the subsidiary exceed the parent’s share of earnings subsequent to the date it became a subsidiary or (2) there is a transaction that affects the Company’s ownership of PST.
NOTES TO CONSOLIDATED FINANCIAL STATEMENTS
(in thousands, except share and per share data, unless otherwise indicated)
The following is a reconciliation of the Company’s total gross unrecognized tax benefits:
| 2015 | 2014 | 2013 | 2016 | 2015 | 2014 | |||||||||||||||||||
| Balance as of January 1 | $ | 3,888 | $ | 3,624 | $ | 3,416 | $ | 4,304 | $ | 3,888 | $ | 3,624 | ||||||||||||
| Tax positions related to the current year: | ||||||||||||||||||||||||
| Additions | 201 | 217 | 217 | 208 | 201 | 217 | ||||||||||||||||||
| Tax positions related to the prior years: | ||||||||||||||||||||||||
| Additions | 523 | 168 | 216 | - | 523 | 168 | ||||||||||||||||||
| Reductions | - | - | (71 | ) | (61 | ) | - | - | ||||||||||||||||
| Expirations of statutes of limitation | (308 | ) | (121 | ) | (154 | ) | (612 | ) | (308 | ) | (121 | ) | ||||||||||||
| Balance as of December 31 | $ | 4,304 | $ | 3,888 | $ | 3,624 | $ | 3,839 | $ | 4,304 | $ | 3,888 | ||||||||||||
At December 31, 20152016, the Company has classified $290$146 as a noncurrent liability and $3,993$3,731 as a reduction to non-current deferred income tax assets. The amount of unrecognized tax benefits is not expected to change significantly during the next 12 months. Management is currently unaware of issues under review that could result in a significant change or a material deviation in this estimate.
If the Company’s tax positions are sustained by the taxing authorities in favor of the Company, the amount that would affect the Company’s effective tax rate is approximately $4,280$3,821 and $3,851$4,280 at December 31, 2016 and 2015, respectively.
| 62 |
NOTES TO CONSOLIDATED FINANCIAL STATEMENTS
(in thousands, except share and 2014, respectively.per share data, unless otherwise indicated)
The Company has elected to classifyclassifies interest expense and, if applicable, penalties which could be assessed related to unrecognized tax benefits as a component of income tax expense (benefit). For the years ended December 31, 2016, 2015 2014 and 2013,2014, the Company recognized approximately $(90)$(59), $(411)$(90) and $(82)$(411) of gross interest and penalties, respectively, within income tax expense (benefit).respectively. The Company has accrued approximately $123$64 and $213$123 for the payment of interest and penalties at December 31, 20152016 and 2014,2015, respectively.
The Company conducts business globally and, as a result, files income tax returns in the U.S. federal jurisdiction and various state and foreign jurisdictions. In the normal course of business the Company is subject to examination by taxing authorities throughout the world. The following table summarizes the open tax years for each important jurisdiction:
| Jurisdiction | Open Tax Years | ||
| U.S. Federal | 2013-2016 | ||
| Brazil | 2011-2016 | ||
| China | 2013-2016 | ||
| France | 2012-2016 | ||
| Mexico | 2012-2016 | ||
| Spain | 2012-2016 | ||
| Sweden | 2011-2016 | ||
| United Kingdom | 2012-2016 | ||
6. Operating Lease Commitments
The Company leases equipment, vehicles and buildings from third parties under operating lease agreements. For the years ended December 31, 2016, 2015 2014 and 2013,2014, lease expense totaled $5,290, $5,532 and $5,836, and $5,842, respectively.
NOTES TO CONSOLIDATED FINANCIAL STATEMENTS
(in thousands, except share and per share data, unless otherwise indicated)
Future minimum operating lease commitments as of December 31, 20152016 were as follows:
| Year ended December 31 | |||||||||
| 2016 | $ | 4,436 | |||||||
| 2017 | 3,834 | $ | 5,042 | ||||||
| 2018 | 3,178 | 3,922 | |||||||
| 2019 | 2,725 | 3,356 | |||||||
| 2020 | 2,097 | 2,584 | |||||||
| 2021 | 2,298 | ||||||||
| Thereafter | 4,881 | 6,176 | |||||||
| Total | $ | 21,151 | $ | 23,378 | |||||
7. Share-Based Compensation Plans
In April 2006, the Company’s shareholders approved the Amended and Restated Long-Term Incentive Plan (the "2006 Plan") and reserved 1,500,000 Common Shares of which the maximum number of Common Shares which may be issued subject to incentive stock options is 500,000. In May 2010, shareholders approved an amendment to the 2006 Plan to increase the number of shares by 1,500,000 to 3,000,000, and in May 2013, shareholders approved ananother amendment to this plan to increase the number of shares by 1,500,000 to 4,500,000. As the 2006 Plan expired in May 2016, there were no shares available for grant at December 31, 2016. As of December 31, 2016, there are 1,358,504 shares granted subject to future vesting of which 583,404 shares were time-based and 785,100 were performance-based.
| 63 |
NOTES TO CONSOLIDATED FINANCIAL STATEMENTS
(in thousands, except share and per share data, unless otherwise indicated)
In May 2016, the Company’s shareholders approved the 2016 Long-Term Incentive Plan (the "2016 Plan") and reserved 1,800,000 Common Shares of which the maximum number of Common Shares which may be issued. Under the 20062016 Plan, as of December 31, 2015,2016, the Company has granted 4,567,995 restricted Common Shares and right to receive Common Shares,68,673 share units, of which 2,683,86028,633 were time-based with cliff vesting using the straight-line method and 1,884,13540,040 were performance-based. Based on forfeitures of restricted Common Shares and right to receive Common Shares of 1,299,440, which return to the pool of shares available for grant, thereThere are 1,231,4451,731,327 shares available to be granted under the 2016 Plan at December 31, 2015. Restricted Common Shares awarded under the Incentive Plan entitle the shareholder to all the rights of Common Share ownership except that the shares may not be sold, transferred, pledged, exchanged, or otherwise disposed of during the vesting period.
In 2010 and 2013, pursuant to the 2006 Plan, the Company granted time-based restricted Common Share and market-based restricted Common Share awards. The time-based restricted Common Share awards cliff vest three years after the date of grant. The performance-based restricted Common Share awards vest and are no longer subject to forfeiture upon the recipient remaining an employee of the Company for three years from the date of grant and upon the Company attaining certain targets of performance measured against a peer group’s performance in terms of total return to shareholders.2016.
In 2011 and 2012, pursuant to the 2006 Plan, the Company granted time-based, market-based and performance-based restricted Common Share awards. The time-based restricted Common Share awards cliff vest three years after the date of grant. The performance-based restricted Common Share awards vest and are no longer subject to forfeiture upon the recipient remaining an employee of the Company for three years from the date of grant and, for one half of the annual awards, upon the Company attaining certain targets of performance measured against a peer group’s performance in terms of total shareholder return and, for the remaining half of the annual awards, upon achieving certain annual net income per share targets established by the Company during the performance period of the award.
In 2014,2013, pursuant to the 2006 Plan, the Company granted time-based restricted Common Share and market-based restricted Common Share awards. The time-based restricted Common Share awards cliff vest three years after the date of grant. The performance-based restricted Common Share awards vest and are no longer subject to forfeiture upon the recipient remaining an employee of the Company for three years from the date of grant and upon the Company attaining certain targets of performance measured against a peer group’s performance in terms of total return to shareholders.
In 2014, 2015 and 2016 pursuant to the 2006 Plan, the Company granted time-based and performance-based share units and performance shares.units. The time-based share units cliff vest three years after the date of grant. The performance sharesbased share units vest and are no longer subject to forfeiture upon the recipient remaining an employee of the Company for three years from the date of grant and, for 20.0%a portion of the annual awards, upon the Company attaining certain targets of performance measured against a peer group’s three year performance in terms of total shareholder return and, for the remaining 80.0%portion of the annual awards, upon achieving certain annual net incomeearnings per share targets established by the Company during the performance period of the award.
In 2015, pursuant to the 2006 Plan, the Company granted time-based share units and performance shares. The time-based share units cliff vest three years after the dateallocation of grant. The performance shares vest and are no longer subject to forfeiture upon the recipient remaining an employee of the Company for three years from the date of grant and, for 36.0% of the annual awards, upon the Company attaining certain targets of performance measured against a peer group’s performance in terms ofbetween total shareholder return and earnings per share were as follows for the remaining 64.0% of the annual awards, upon achieving certain annual net income per share targets established by the Company during the performance period of the award.years ended December 31:
NOTES TO CONSOLIDATED FINANCIAL STATEMENTS
(in thousands, except share and per share data, unless otherwise indicated)
| 2016 | 2015 | 2014 | ||||||||||
| Total shareholder return | 55 | % | 36 | % | 20 | % | ||||||
| Earnings per share | 45 | % | 64 | % | 80 | % | ||||||
In April 2005, the Company adopted the Directors’ Restricted Shares Plan (the “Director Share Plan”) and reserved 500,000 Common Shares for issuance under the Director Share Plan. In May 2013, shareholders approved an amendment to the Director Share Plan to increase the number of shares for issuance by 200,000 to 700,000. Under the Director Share Plan, the Company has cumulatively issued 530,195580,609 restricted Common Shares. As such, there are 169,805119,391 restricted Common Shares available to be issued at December 31, 2015.2016. Shares issued annually under the Director Share Plan vest one year after the date of grant.
Options
There were no options granted during the years ended December 31, 2015, 2014 and 2013. There were no options outstanding at December 31, 2015 or 2014 while options to purchase 20,000 Common Shares at a price of $15.73 were outstanding at December 31, 2013 which expired in 2014. There were no options exercised during the years ended December 31, 2015, 2014 and 2013.
Restricted Shares
The fair value of the non-vested time-based restricted Common Share awards was calculated using the market value of the Common Shares on the date of issuance. The weighted-average grant-date fair value of time-based restricted Common Shares granted during the years ended December 31, 2016, 2015 and 2014 was $13.52, $11.41 and 2013 was $11.41, $11.54, and $6.13, respectively.
The fair value of the non-vested performance-based restricted Common Share awards with a performance condition requiring the Company to obtain certain earnings per share targets was estimated using the market value of the shares on the date of grant. The fair value of non-vested performance-based restricted Common Share awards with a market condition requiring the Company to obtain a total shareholder return target relative to a group of peer companies was estimated using a Monte Carlo valuation model taking into consideration the probability of achievement using multiple simulations. The awards that use earnings per share as the performance target are expensed beginning when it is probable that the Company will meet the underlying performance condition.
| 64 |
NOTES TO CONSOLIDATED FINANCIAL STATEMENTS
(in thousands, except share and per share data, unless otherwise indicated)
A summary of the status of the Company’s non-vested restricted Common Shares and right to receive Common Sharesshare units as of December 31, 20152016 and the changes during the year then ended, are presented below:
| Time-based awards | Performance-based awards | Time-based awards | Performance-based awards | |||||||||||||||||||||||||||||
| Weighted- | Weighted- | Weighted- | Weighted- | |||||||||||||||||||||||||||||
| Common | average grant- | Common | average grant- | Common | average grant- | Common | average grant- | |||||||||||||||||||||||||
| Shares | date fair value | Shares | date fair value | Shares | date fair value | Shares | date fair value | |||||||||||||||||||||||||
| Non-vested as of December 31, 2014 | 1,087,020 | $ | 8.69 | 841,050 | $ | 10.33 | ||||||||||||||||||||||||||
| Non-vested as of December 31, 2015 | 731,241 | $ | 9.45 | 712,485 | $ | 10.70 | ||||||||||||||||||||||||||
| Granted | 278,451 | $ | 11.41 | 335,835 | $ | 11.21 | 250,227 | $ | 13.52 | 269,255 | $ | 13.66 | ||||||||||||||||||||
| Vested | (615,322 | ) | $ | 8.96 | (126,642 | ) | $ | 10.74 | (339,963 | ) | $ | 7.07 | (131,033 | ) | $ | 7.58 | ||||||||||||||||
| Forfeited | (18,908 | ) | $ | 10.78 | (337,758 | ) | $ | 10.26 | (29,468 | ) | $ | 11.82 | (25,567 | ) | $ | 11.30 | ||||||||||||||||
| Non-vested as of December 31, 2015 | 731,241 | $ | 9.45 | 712,485 | $ | 10.70 | ||||||||||||||||||||||||||
| Non-vested as of December 31, 2016 | 612,037 | $ | 12.32 | 825,140 | $ | 12.14 | ||||||||||||||||||||||||||
As of December 31, 2015,2016, total unrecognized compensation cost related to non-vested time-based restricted Common Share and right to receive Common Share awardsshare units granted was $2,557.$2,850. That cost is expected to be recognized over a weighted-average period of 1.161.19 years. For the years ended December 31, 2016, 2015 2014 and 2013,2014, the total fair value of restricted Common Share and right to receive Common Share awards vested was $5,394, $9,101 $3,509 and $2,177,$3,509, respectively.
As of December 31, 2015,2016, total unrecognized compensation cost related to non-vested performance-based restricted Common Share and right to receive Common Share awardsshare units granted was $2,018$3,069 for shares probable to vest. That cost is expected to be recognized over a weighted-average period of 1.501.29 years dependent upon the achievement of performance conditions. As noted above, the Company has issued and outstanding performance-based restricted Common Share awards that use different performance targets (total shareholder return and earnings per share).
There was no actualThe tax benefit realized for the tax deductions from the vesting of restricted Common Shares and option exercises of the share-based payment arrangements was $977, $0 and $0 for the years ended December 31, 2016, 2015 2014 and 2013.
NOTES TO CONSOLIDATED FINANCIAL STATEMENTS
(in thousands, except share and per share data, unless otherwise indicated)2014.
8. Employee Benefit Plans
The Company has certain defined contribution profit sharing and 401(k) plans covering substantially all of its employees in the United States and United Kingdom.Europe. The Company provides matching contributions to the Company’s 401(k) plan. Company contributions are generally discretionary. For the years ended December 31, 2016, 2015 2014 and 2013,2014, expenses related to these plans amounted to $1,601, $1,487 $1,280 and $1,173,$1,280, respectively.
The Company previously sponsored a post retirement benefit plan covering certain retirees. There was no remaining liability recorded as of December 31, 2016.
Long-Term Cash Incentive Plan
In March 2009, the Company adopted the Stoneridge, Inc. Long-Term Cash Incentive Plan (the “LTCIP”) and granted awards to certain officers and key employees. Awards under the LTCIP provided recipients with the right to receive cash three years from the date of grant depending on the Company’s actual earnings per share performance for the defined performance period. If the participant voluntarily terminated employment or was discharged for cause, as defined in the LTCIP, the award would be forfeited. In May 2009, the LTCIP was approved by the Company’s shareholders.
| 65 |
NOTES TO CONSOLIDATED FINANCIAL STATEMENTS
(in thousands, except share and per share data, unless otherwise indicated)
The Company granted Phantom Share awards under the LTCIP in 2013 that vestvested in February 2016 dependingand were paid in March 2016 based on the Company’s actual earnings per share performance for each fiscal year of 2013, 2014 and 2015 within the performance period.2015. As of December 31, 2016 and 2015, the Company has recorded a liability of $0 and $808 for the performance based awards granted under the LTCIP which was included on the consolidated balance sheet as a component of accrued expenses and other current liabilities. As of December 31, 2014, the Company recorded a liability of $245 for the awards granted under the LTCIP which was included on the consolidated balance sheet as a component of other long-term liabilities. There were no performance based awards granted under the LTCIP during the years ended December 31, 2016, 2015 or 2014.
9. Financial Instruments and Fair Value Measurements
Financial Instruments
A financial instrument is cash or a contract that imposes an obligation to deliver, or conveys a right to receive cash or another financial instrument. The carrying values of cash and cash equivalents, accounts receivable and accounts payable are considered to be representative of fair value because of the short maturity of these instruments.
Derivative Instruments and Hedging Activities
On December 31, 2015,2016, the Company had open foreign currency forward contracts which are used solely for hedging and not for speculative purposes. Management believes that its use of these instruments to reduce risk is in the Company’s best interest. The counterparties to these financial instruments are financial institutions with investment grade credit ratings.
Foreign Currency Exchange Rate Risk
The Company conducts business internationally and therefore is exposed to foreign currency exchange rate risk. The Company uses derivative financial instruments as cash flow and fair value hedges to manage its exposure to fluctuations in foreign currency exchange rates by reducing the effect of such fluctuations on foreign currency denominated intercompany transactions, inventory purchases and other foreign currency exposures. The currencies hedged by the Company during 2016, 2015 2014 and 20132014 include the euro and Mexican peso. In addition, the Company hedged the U.S. dollar against the Swedish krona and euro on behalf of its European subsidiaries in 2016, 2015, and 2014.
These forward contracts were executed to hedge forecasted transactions and were accounted for as cash flow hedges. As such, the effective portion of the unrealized gain or loss was deferred and reported in the Company’s consolidated balance sheets as a component of accumulated other comprehensive loss. The cash flow hedges were highly effective. The effectiveness of the transactions has been and will be measured on an ongoing basis using regression analysis and forecasted future purchases of the currency.
In certain instances, the foreign currency forward contracts do not qualify for hedge accounting or are not designated as hedges, and therefore are marked to market with gains and losses recognized in the Company’s consolidated statements of operations as a component of other expense (income), net.
NOTES TO CONSOLIDATED FINANCIAL STATEMENTS
(in thousands, except share and per share data, unless otherwise indicated)
The Company’s foreign currency forward contracts are designed to offset some of the gains and losses realized on the underlying foreign currency denominated transactions as follows:
Euro-denominated Foreign Currency Forward Contracts
At December 31, 20152016 and 2014,2015, the Company held a foreign currency forward contract with an underlying notional amount of $1,647$1,601 and $3,523,$1,647, respectively, to reduce the exposure related to the Company’s euro-denominated intercompany loans. This contract expiresexpired in March 2016.January 2017. The euro-denominated foreign currency forward contract was not designated as a hedging instrument. For the yearyears ended December 31, 2016, 2015, and 2014, the Company recognized a gain of $57, $336 and $1,205, respectively, in the consolidated statements of operations as a component of other expense, net related to the euro-denominated contract. The Company recognized a gain of $1,205 and a loss of $638 related to foreign currency forward contracts for the years ended December 31, 2014 and 2013, respectively.
U.S. dollar-denominated Foreign Currency Forward Contracts – Cash Flow Hedge
The Company entered into on behalf of one of its European Electronics subsidiaries whose functional currency is the Swedish krona, U.S. dollar-denominated currency contracts with a notional amount at December 31, 2015 of $10,007 which expireexpired ratably on a monthly basis from January 2016 through December 2016, compared to $11,718 at2016. There were no contracts entered into as of December 31, 2014.2016.
| 66 |
NOTES TO CONSOLIDATED FINANCIAL STATEMENTS
(in thousands, except share and per share data, unless otherwise indicated)
The Company entered into on behalf of one of its European Electronics subsidiaries whose functional currency is the euro, U.S. dollar-denominated currency contracts with a notional amount at December 31, 2015 of $2,421 which expireexpired ratably on a monthly basis from January 2016 through December 2016, compared to $4,266 at2016. There were no contracts entered into as of December 31, 2014.2016.
The Company evaluated the effectiveness of the U.S. dollar-denominated foreign currency forward contracts held as of December 31, 2015 and 2014during 2016 and concluded that the hedges were effective.
Mexican peso-denominated Foreign Currency Forward Contracts – Cash Flow Hedge
The Company holds Mexican peso-denominated foreign currency contracts with notional amounts at December 31, 20152016 of $9,780$5,699 which expire ratably on a monthly basis from January 20162017 through December 2016,2017, compared to $10,282$9,780 at December 31, 2014.2015.
The Company evaluated the effectiveness of the Mexican peso-denominated foreign currency forward contracts held as of June 30, 2014. As a result of the sale of the Wiring business, the Company forecasted that it would purchase Mexican pesos to fulfill only two of the five hedge contracts for the period October 2014 through December 2014. As the purchase of Mexican pesos related to three of the five hedge contracts was not probable, these three contracts attributed to the Wiring business were de-designated as of June 30, 2014, and the associated unrecognized $320 gain at that date was reclassified from accumulated other comprehensive loss and recorded in discontinued operations in the Company’s consolidated statements of operations in the quarter and year of de-designation. On August 4, 2014, the three de-designated hedges were terminated and settled resulting in a nominal gain.
The Company evaluated the effectiveness of the Mexican peso-denominated foreign currency forward contracts held as of December 31, 2016 and 2015, and 2014the years then ended, and concluded that the hedges were effective.
Commodity Price Risk - Cash Flow Hedge
To mitigate the risk of future price volatility and, consequently, fluctuations in gross margins, the Company entered into fixed price commodity contracts with a financial institution to fix the cost of a portion of the Company’s copper purchases. Copper is a raw material used in a number of the Company’s products.
The Company did not have any fixed price commodity contracts at December 31, 2016 and 2015 compared to an aggregate notional amount of 317 pounds at December 31, 2014.
NOTES TO CONSOLIDATED FINANCIAL STATEMENTS
(in thousands, except share and per share data, unless otherwise indicated)
The unrealized gain or loss for the effective portion of the hedges were deferred and reported in the Company’s consolidated balance sheets as a component of accumulated other comprehensive loss while the ineffective portion, if any, was reported in the consolidated statements of operations. The effectiveness of the transactions is measured on an ongoing basis using regression analysis and forecasted future copper purchases.
The Company evaluated the effectiveness of the copper fixed price commodity contracts as of June 30, 2014. As a result of the sale of the Wiring business, the Company forecasted that it would not purchase the quantities of copper to fulfill the two contracts for the period August 2014 through March 2015. As the purchase of copper quantities related to these contracts was not probable, the contracts primarily associated with the Wiring segment not expected to be fulfilled were de-designated at June 30, 2014, and the associated unrecognized $77 gain at that date was reclassified from accumulated other comprehensive loss and recorded in discontinued operations in the Company’s consolidated statements of operations in the quarter and year of de-designation.
Interest Rate Risk - Fair Value Hedge
The Company had a fixed-to-floating interest rate swap agreement (the “Swap”) with a notional amount of $45,000 to hedge its exposure to fair value fluctuations on a portion of its senior notes. The Swap was designated as a fair value hedge of the fixed interest rate obligation under the Company’s $175,000 9.5% senior notes due October 15, 2017.notes. The critical terms of the Swap were aligned with the terms of the senior notes including maturity of October 15, 2017, resultingwhich resulted in no hedge ineffectiveness. The unrealized gain or loss for the effective portion of the hedge was deferred and reported in the Company’s consolidated balance sheets as an asset or liability, as applicable, with the offset to the carrying value of the senior notes.
| 67 |
NOTES TO CONSOLIDATED FINANCIAL STATEMENTS
(in thousands, except share and per share data, unless otherwise indicated)
Under the Swap, the Company paid a variable interest rate equal to the six-month London Interbank Offered Rate (“LIBOR”) plus 7.2% and it received a fixed interest rate of 9.5%. The Swap required semi-annual settlements on April 15 and October 15. The difference between amounts received and paid under the Swap was recognized as a component of interest expense, net in the consolidated statements of operations.
In connection with the Company’s notice of redemption issued on September 15, 2014 to redeem all remaining outstanding senior notes, the interest rate fair value hedge was de-designated on that date. On October 23, 2014, the Company terminated the interest rate swap resulting in a gain of $371 recorded in other expense, net in the consolidated statement of operations in the fourth quarter of 2014.
The Swap reduced interest expense by $641 and $810 for the yearsyear ended December 31, 2014 and 2013, respectively.2014.
The notional amounts and fair values of derivative instruments in the consolidated balance sheets were as follows:
| Prepaid expenses | ||||||||||||||||||||||||
| and other current assets / | Accrued expenses and | |||||||||||||||||||||||
| Notional amounts (A) | other long-term assets | other current liabilities | ||||||||||||||||||||||
| December 31, | December 31, | December 31, | ||||||||||||||||||||||
| 2015 | 2014 | 2015 | 2014 | 2015 | 2014 | |||||||||||||||||||
| Derivatives designated as hedging instruments | ||||||||||||||||||||||||
| Cash Flow Hedges: | ||||||||||||||||||||||||
| Forward currency contracts | $ | 22,208 | $ | 26,266 | $ | 474 | $ | 479 | $ | 84 | $ | 478 | ||||||||||||
| Derivatives not designated as hedging instruments | ||||||||||||||||||||||||
| Forward currency contracts | $ | 1,647 | $ | 3,523 | $ | - | $ | - | $ | 9 | $ | 13 | ||||||||||||
| Fixed price commodity contracts | - | 317 | - | - | - | $ | 69 | |||||||||||||||||
| Notional | Prepaid expenses | Accrued expenses and | ||||||||||||||||||||||
| amounts(A) | and other current assets | other current liabilities | ||||||||||||||||||||||
| December 31, | December 31, | December 31, | ||||||||||||||||||||||
| 2016 | 2015 | 2016 | 2015 | 2016 | 2015 | |||||||||||||||||||
| Derivatives designated as hedging instruments: | ||||||||||||||||||||||||
| Cash flow hedges: | ||||||||||||||||||||||||
| Forward currency contracts | $ | 5,699 | $ | 22,208 | $ | - | $ | 474 | $ | 28 | $ | 84 | ||||||||||||
| Derivatives not designated as hedging instruments: | ||||||||||||||||||||||||
| Forward currency contracts | $ | 1,601 | $ | 1,647 | $ | - | $ | - | $ | 3 | $ | 9 | ||||||||||||
| (A) | Notional amounts represent the gross contract / notional amount of the derivatives outstanding. |
NOTES TO CONSOLIDATED FINANCIAL STATEMENTS
(in thousands, except share and per share data, unless otherwise indicated)
AmountsGross amounts recorded for the cash flow hedges in other comprehensive loss in shareholders’ equity and in net income (loss) for the years ended December 31 were as follows:
| Gain (loss) reclassified from | Loss recorded | Loss reclassified from | ||||||||||||||||||||||||||||||||||||||||||||||
| Gain (loss) recorded in | other comprehensive loss | in other comprehensive | other comprehensive income | |||||||||||||||||||||||||||||||||||||||||||||
| other comprehensive loss | into net income (loss) | income (loss) | (loss) into net income (loss) | |||||||||||||||||||||||||||||||||||||||||||||
| 2015 | 2014 | 2013 | 2015 | 2014 | 2013 | 2016 | 2015 | 2014 | 2016 | 2015 | 2014 | |||||||||||||||||||||||||||||||||||||
| Derivatives designated as cash flow hedges: | ||||||||||||||||||||||||||||||||||||||||||||||||
| Forward currency contracts | $ | (671 | ) | $ | (46 | ) | $ | 683 | $ | (1,060 | ) | $ | (310 | ) | $ | 2,746 | $ | (582 | ) | $ | (671 | ) | (46 | ) | $ | (164 | ) | $ | (1,060 | ) | (310 | ) | ||||||||||||||||
| Fixed price commodity contracts | - | (408 | ) | (1,008 | ) | - | (256 | ) | (820 | ) | - | - | (408 | ) | - | - | (256 | ) | ||||||||||||||||||||||||||||||
| Total derivatives designated as cash flow hedges | $ | (671 | ) | $ | (454 | ) | $ | (325 | ) | $ | (1,060 | ) | $ | (566 | ) | $ | 1,926 | $ | (582 | ) | $ | (671 | ) | (454 | ) | $ | (164 | ) | $ | (1,060 | ) | (566 | ) | |||||||||||||||
Gains and losses reclassified from comprehensive loss into net income (loss) were recognized in cost of goods sold in the Company’s consolidated statements of operations.
The net deferred gainloss of $390$28 on the cash flow hedge derivatives will be reclassified from other comprehensive loss to the consolidated statements of operations in 2016.2017. The Company has measured the ineffectiveness of the forward currency and commodity contracts and any amounts recognized in the consolidated financial statements were immaterial for the years ended December 31, 2016, 2015 2014 and 2013.
Fair Value Measurements
The following table presents our assets and liabilities that are measured at fair value on a recurring basis and are categorized using the fair value hierarchy. The fair value hierarchy has three levels based on the reliability of the inputs used to determine fair value.
| December 31, | December 31, | |||||||||||||||||||
| 2015 | 2014 | |||||||||||||||||||
| Fair value estimated using | ||||||||||||||||||||
| Fair value | Level 1 inputs(A) | Level 2 inputs(B) | Level 3 inputs(C) | Fair value | ||||||||||||||||
| Financial assets carried at fair value: | ||||||||||||||||||||
| Forward currency contracts | $ | 474 | $ | - | $ | 474 | $ | - | $ | 479 | ||||||||||
| Total financial assets carried at fair value | $ | 474 | $ | - | $ | 474 | $ | - | $ | 479 | ||||||||||
| Financial liabilities carried at fair value: | ||||||||||||||||||||
| Forward currency contracts | $ | - | $ | - | $ | - | $ | - | $ | 491 | ||||||||||
| Fixed price commodity contracts | 93 | - | 93 | - | 69 | |||||||||||||||
| Total financial liabilities carried at fair value | $ | 93 | $ | - | $ | 93 | $ | - | $ | 560 | ||||||||||
| 68 |
NOTES TO CONSOLIDATED FINANCIAL STATEMENTS
(in thousands, except share and per share data, unless otherwise indicated)
Fair Value Measurements
The Company’s assets and liabilities are measured at fair value on a recurring basis and are categorized using the three levels of the fair value hierarchy based on the reliability of the inputs used. Fair values estimated using Level 1 inputs consist of quoted prices in active markets for identical assets or liabilities that the Company has the ability to access at the measurement date. Fair values estimated using Level 2 inputs, other than quoted prices, are observable for the asset or liability, either directly or indirectly and include among other things, quoted prices for similar assets or liabilities in markets that are active or inactive as well as inputs other than quoted prices that are observable. For forward currency contracts, inputs include foreign currency exchange rates. Fair values estimated using Level 3 inputs consist of significant unobservable inputs.
The Company did not have any financial assets or liabilities fair valued using Level 1 or Level 3 inputs at December 31, 2016 or 2015. The fair value of financial assets using Level 2 inputs related to forward currency contracts were $0 and $474 at December 31, 2016 and 2015, respectively. The fair value of financial liabilities using Level 2 inputs related to forward currency contracts were $31 and $93 at December 31, 2016 and 2015, respectively.
The Company recorded a non-recurring fair value adjustment of $51,458 related to the PST goodwill during the year ended December 31, 2014. The Company utilized Level 3 inputs to estimate the fair value adjustment for nonfinancial assets. For additional information, see the discussion of Goodwill and Other Intangible Assets in Note 2. No non-recurring fair value adjustments were required for nonfinancial assets for the yearyears ended December 31, 2016 and 2015.
10. Commitments and Contingencies
In the ordinary course of business, the Company is subject to a broad range of claims and legal proceedings that relate to contractual allegations, product liability, tax audits, patent infringement, employment-related matters and environmental matters. The Company establishes accruals for matters which it believes that losses are probable and can be reasonably estimable. Although it is not possible to predict with certainty the outcome of these matters, the Company is of the opinion that the ultimate resolution of these matters will not have a material adverse effect on its consolidated results of operations or financial position.
As a result of environmental studies performed at the Company’s former facility located in Sarasota, Florida, the Company became aware of soil and groundwater contamination at this site. The Company engaged an environmental engineering consultant to assess the level of contamination and to develop a remediation and monitoring plan for the site. Soil remediation at the site was completed during the year ended December 31, 2010. As the remedial action plan has been approved by the Florida Department of Environmental Protection, ground water remediation began in the fourth quarter of 2015. During the years ended December 31, 2015, 2014 and 2013, environmental remediation costs incurred were immaterial. At December 31, 20152016 and 2014,2015, the Company had accrued an undiscounted liability of $532$446 and $876,$532, respectively, related to future remediation. At December 31, 2016 and 2015, $370 and 2014, $469, and $813, respectively, were recorded as a component of accrued expenses and other current liabilities on the consolidated balance sheets while the remaining amounts were recorded as a component of other long-term liabilities. A majority of the costs associated with the recorded liability are being incurred during the groundwater remediation, with the balance relating to monitoring costs to be incurred over multiple years. The recorded liability is based on assumptions in the remedial action plan. Although the Company sold the Sarasota facility in December 2011, the liability to remediate the site contamination remains the responsibility of the Company. Due to the ongoing site remediation, the closing terms of the sale agreement included a requirement for the Company to maintain a $2,000 letter of credit for the benefit of the buyer.
| 69 |
NOTES TO CONSOLIDATED FINANCIAL STATEMENTS
(in thousands, except share and per share data, unless otherwise indicated)
The Company has a legal proceeding,Verde v. Stoneridge, Inc. et al., currently pending in the United States District Court for the Eastern District of Texas, Cause No. 6:14-cv-00225- KNM. The plaintiff filed this putative class action against the Company and others on March 26, 2014. Plaintiff alleges that the Company was involved in the vertical chain of manufacture, distribution, and sale of a control device (“CD”) that was incorporated into a Dodge Ram truck purchased by Plaintiff in 2006. Plaintiff alleges that the Company breached express warranties and indemnification provisions by supplying a defective CD that was not capable of performing its intended function. The putative class consists of all Texas residents who own manual transmission Chrysler vehicles model years 1994–1997–2007 equipped with the subject CD. Plaintiff seeks recovery of economic loss damages incurred by him and the putative class members associated with inspecting and replacing the allegedly defective CD, as well as attorneys’ fees and costs. Plaintiff filed his motion for class certification seeking to certify a class of Texas residents who own or lease certain automobiles sold by Chrysler from 1998–1997–2007. Plaintiff alleges this putative class would include approximately 120,000 people. In the motion for class certification, the Plaintiff states that damages are no more than $1 per person. A hearing on Plaintiff’s motion for class certification was held on November 16, 2015, and2015. On April 8, 2016, the Magistrate Judge granted the Company’s motion for partial summary judgment dismissing the Plaintiff’s indemnification claim; that ruling was later adopted by the United States District CourtCourt. On November 7, 2016, the Magistrate Judge issued a Report and Recommendation Concerning Class certification, in which she recommended denying Plaintiff’s motion for class certification. Plaintiff filed an objection to the Report and Recommendation and motion for reconsideration concerning class certification. The Magistrate’s Report and Recommendation, and plaintiff’s objection and motion for reconsideration are currently before the court pending a ruling from the District Judge. The Company believes the likelihood of loss is not probable or reasonably estimable, and therefore no liability has not yet ruled on class certificationbeen recorded for these claims at December 31, 2015. Similarly,2016.
Royal v. Stoneridge, Inc. et al. is another legal proceeding currently pending in the United States District Court for the Western District of Oklahoma, Cause No. 5:14-cv-01410-F. Plaintiffs filed this putative class action against the Company, Stoneridge Control Devices, Inc., and others on December 19, 2014. Plaintiff alleges that the Company was involved in the vertical chain of manufacture, distribution, and sale of a CD that was incorporated into Dodge Ram trucks purchased by Plaintiff between 1999 and 2006. Plaintiffs allege that the Company and Stoneridge Control Devices, Inc. breached various express and implied warranties, including the implied warranty of merchantability. Plaintiffs also seek indemnity from the Company and Stoneridge Control Devices, Inc. The putative class consists of all owners of vehicles equipped with the subject CD, which includes various Dodge Ram trucks and other manual transmission vehicles manufactured from 1997–2007, which Plaintiffs allege is more than one million vehicles. Plaintiffs seeks recovery of economic loss damages associated with inspecting and replacing the allegedly defective CD, diminished value of the subject CDs and the trucks in which they were installed, and attorneys’ fees and costs. The amount of compensatory or other damages sought by Plaintiffs and the putative class members is unknown. The Company is vigorously defending itself against these allegations, and has and will continue to challenge the claims as well as class action certification. The Company believes the likelihood of loss is not probable or reasonably estimable, and therefore no liability has been recorded for these claims at December 31, 2015.
NOTES TO CONSOLIDATED FINANCIAL STATEMENTS
(in thousands, except share and per share data, unless otherwise indicated)2016.
In September 2013, two legal proceedings were initiated by Actia Automotive (“Actia”) in a French court (the tribunal de grande instance de Paris) alleging infringement of its patents by the Company’s Electronics segment. The euro (“€”) and U.S. dollar equivalent (“$”) that Actia iswas seeking has been €7,000 ($7,600)7,400) for each claim for injunctive relief and monetary damages resulting from such alleged infringement. The Company believesbelieved that its products did not infringe on any of the patents claimed by Actia, and the claims arewere without merit. The Company is vigorously defendingdefended itself against these allegations, and it has challenged certain Actia patents in the European Patent Office. There have been no significant changes to the facts and circumstances related to this claim during the year ended December 31, 2015 except that inIn September 2015, the French court ruled in favor of the Company on one claim, which is subject to appeal by Actia. TheHowever, on July 28, 2016 the Company believesreached a settlement with Actia with regard to both claims. Under the likelihoodsettlement agreement the Company agreed to forego a payment by Actia of loss is€50 ($56) that had been ordered by the French Court and Actia agreed (i) not probable betweento appeal the French court’s ruling against it on the first claim and (ii) to dismiss its defensesinfringement claims against the Company with respect to the second claim. Under the settlement Actia agreed not to enforce any of the patents in question against the Company, or the Company’s successors and challenges to Actia’s patents.assigns. As such,a result this matter has been settled and no liability has been recorded for these claims.claims at December 31, 2016.
On May 24, 2013, the State Revenue Services of São Paulo issued a tax deficiency notice against PST claiming that the vehicle tracking and monitoring services it provides should be classified as communication services, and therefore subject to the State Value Added Tax – ICMS. The State Revenue Services assessment imposed the 25.0% ICMS tax on all revenues of PST related to the vehicle tracking and monitoring services during the period from January 2009 through December 2010. The Brazilian real (“R$”) and U.S. dollar equivalent (“$”) of the aggregate tax assessment is approximately R$92,500 ($23,700)28,400) which is comprised of Value Added Tax – ICMS of R$13,200 ($3,400)4,100), interest of R$11,400 ($2,900)3,500) and penalties of R$67,900 ($17,400)20,800).
| 70 |
NOTES TO CONSOLIDATED FINANCIAL STATEMENTS
(in thousands, except share and per share data, unless otherwise indicated)
The Company believes that the vehicle tracking and monitoring services are non-communication services, as defined under Brazilian tax law, subject to the municipal ISS tax, not communication services subject to state ICMS tax as claimed by the State Revenue Services of São Paulo. PST has, and will continue to collect the municipal ISS tax on the vehicle tracking and monitoring services in compliance with Brazilian tax law and will defend its tax position. PST has received a legal opinion that the merits of the case are favorable to PST, determining among other things that the imposition on the subsidiary of the State ICMS by the State Revenue Services of São Paulo is not in accordance with the Brazilian tax code. Management believes, based on the legal opinion of the Company’s Brazilian legal counsel and the results of the Brazil Administrative Court's ruling in favor of another vehicle tracking and monitoring company related to the tax deficiency notice it received, the likelihood of loss is not probable although it may take years to resolve. As a result of the above, as of December 31, 20152016 and 2014,2015, no accrual has been recorded with respect to this tax assessment. An unfavorable judgment on this issue for the years assessed and for subsequent years could result in significant costs to PST and adversely affect its results of operations. There have been no significant changes to the facts and circumstances related to this notice for the year ended December 31, 2015.2016.
In addition, PST has civil, labor and other non-income tax contingencies for which the likelihood of loss is deemed to be reasonably possible, but not probable, by the Company’s legal advisors in Brazil. As a result, no provision has been recorded with respect to these contingencies, which amounted to R$31,800 ($9,800) and R$25,400 ($6,500) and R$37,200 ($14,000) at December, 20152016 and 2014,2015, respectively. An unfavorable outcome on these contingencies could result in significant cost to PST and adversely affect its results of operations.
11. Headquarter Relocation
During the fourth quarter of 2016, the Company relocated its corporate headquarters from Warren, Ohio to Novi, Michigan and consolidated its other corporate functions into one location. As a result, the Company incurred relocation costs, which included employee retention, relocation, severance, recruiting, duplicate wages and professional fees, of $1,769 for the year then ended December 31, 2016.
During 2016, the Company entered into a long-term lease agreement for its new corporate headquarters. The Company establishes assets and liabilities for the estimated construction costs incurred under build-to-suit lease arrangements to the extent the Company was involved in the construction of structural improvements or takes construction risk prior to the commencement of a lease. As of September 30, 2016, the Company recorded a non-cash build-to-suit lease asset under construction of $4,322 (within Prepaid and other currents assets) and a corresponding obligation (within accrued expenses and other current liabilities) in the consolidated balance sheet. On October 31, 2016 the construction was completed. Based on the Company’s evaluation of the lease, sale and leaseback accounting treatment was deemed to be appropriate and as such the Company removed the build-to-suit lease asset and corresponding obligation. Also, the incremental cost of the tenant improvements incurred and paid by the Lessor of $1,104 were capitalized as a right of use asset and corresponding liability as of October 31, 2016. The right of use asset and corresponding liability will be amortized on a straight line basis to rent expense over the 10 lease year term.
12. Restructuring and Business Realignment
On October 29, 2007, the Company announced a restructuring initiative to improve manufacturing efficiency and cost position by ceasing manufacturing operations at its Mitcheldean, United Kingdom (Electronics reportable segment) location. In 2010, the Company continued restructuring initiatives within the Electronics reportable segment and recorded amounts related to its terminated property lease in Mitcheldean, United Kingdom. During the third quarter of 2012, the Company finalized a settlement agreement to modify the terms of and the obligation associated with the property consistent with previous estimates.
In connection with the Electronics segment restructuring initiative, the Company recorded lease related restructuring charges during the years ended December 31, 2016, 2015 and 2014 of $59, $183 and 2013 of $183, $494, and $469, respectively, as part of selling, general and administrative expense. At December 31, 20152016 and 2014,2015, the only remaining restructuring related accrual relates to the terminated property lease in Mitcheldean, United Kingdom, for which the Company has accrued $458$273 and $733,$458, respectively, on the consolidated balance sheets of which $313$0 and $402,$313, respectively, is a component of other long-term liabilities.
| 71 |
NOTES TO CONSOLIDATED FINANCIAL STATEMENTS
(in thousands, except share and per share data, unless otherwise indicated)
The expenses for the restructuring activities that relate to the Electronics reportable segment include the following:
| 2015 | 2014 | 2013 | 2016 | 2015 | 2014 | |||||||||||||||||||
| Accrued balance at January 1 | $ | 733 | $ | 780 | $ | 765 | $ | 458 | $ | 733 | $ | 780 | ||||||||||||
| Charge to expense | 183 | 494 | 469 | 59 | 183 | 494 | ||||||||||||||||||
| Foreign currency translation | 3 | (45 | ) | 24 | (69 | ) | 3 | (45 | ) | |||||||||||||||
| Cash payments | (461 | ) | (496 | ) | (478 | ) | ||||||||||||||||||
| Cash payments, net | (175 | ) | (461 | ) | (496 | ) | ||||||||||||||||||
| Accrued balance at December 31 | $ | 458 | $ | 733 | $ | 780 | $ | 273 | $ | 458 | $ | 733 | ||||||||||||
The Company regularly evaluates the performance of its businesses and cost structures, including personnel, and makes necessary changes thereto in order to optimize its results. The Company also evaluates the required skill sets of its personnel and periodically makes strategic changes. As a consequence of these actions, the Company incurs severance related costs which are referred to as business realignment charges.
The Electronics segment incurred business realignment charges of $317 for the year ended December 31, 2015, of which $215 was recorded in design and development (“D&D”) costs and $102 in selling, general and administrative (“SG&A”) expenses. The unallocated corporate segment incurred business realignment charges of $309 for the year ended December 31, 2015, all of which was recorded in SG&A expenses. There were no business realignment charges related to the Electronics or unallocated corporate segments during the years ended December 31, 2014 or 2013.
In response to a change in customer demand, the PST segment incurred and paid business realignment charges of $403 for the years ended December 31, 2015, of which $172 was recorded in cost of goods sold, $117 in SG&A expenses and $114 in D&D costs. Business realignment charges by reportable segment were $1,578 for the year ended December 31, 2014, of which $847 was recorded in cost of goods sold, $559 in SG&A expenses and $172 in D&D costs. There were no businessas follows:
| Years ended December 31 | 2016 | 2015 | 2014 | |||||||||
| Electronics(A) | $ | 1,180 | $ | 317 | $ | - | ||||||
| PST(B) | 1,437 | 403 | 1,578 | |||||||||
| Unallocated Corporate(C) | - | 309 | - | |||||||||
| Total business realignment charges | $ | 2,617 | $ | 1,029 | $ | 1,578 | ||||||
| (A) | Severance costs for the year ended December 31, 2016 related to selling, general and administrative (“SG&A”) and design and development (“D&D”) were $196 and $984, respectively. Severance costs for the year ended December 31, 2015 related to SG&A and D&D were $102 and $215, respectively. |
| (B) | Severance costs for the year ended December 31, 2016 related to cost of goods sold (“COGS”), SG&A and D&D were $437, $884 and $116, respectively. Severance costs for the year ended December 31, 2015 related to COGS, SG&A and D&D were $172, $117 and $114, respectively. Severance costs for year ended December 31, 2014 related to COGS, SG&A and D&D were $847, $559 and $172, respectively. |
| (C) | Severance costs for the year then ended December 31, 2015 related to SG&A were $309. |
Business realignment charges related to the PST segment during the year ended December 31, 2013.classified by statement of operations line item were as follows:
| Years ended December 31 | 2016 | 2015 | 2014 | |||||||||
| Cost of goods sold | $ | 437 | $ | 172 | $ | 847 | ||||||
| Selling, general and administrative | 1,080 | 528 | 559 | |||||||||
| Design and development | 1,100 | 329 | 172 | |||||||||
| Total business realignment charges | $ | 2,617 | $ | 1,029 | $ | 1,578 | ||||||
There were no significant restructuring or business realignment expenses related to the Control Devices reportable segment during the years ended December 31, 2016, 2015 2014 or 2013.2014.
| 72 |
NOTES TO CONSOLIDATED FINANCIAL STATEMENTS
(in thousands, except share and per share data, unless otherwise indicated)
12.13. Segment Reporting
Operating segments are defined as components of an enterprise that are evaluated regularly by the Company's chief operating decision maker in deciding how to allocate resources and in assessing performance. The Company's chief operating decision maker is the chief executive officer.
During the third quarter of 2014 the Company sold its Wiring business segment, which designed and manufactured wiring harness products and assembled instrument panels for sale principally to the commercial, agricultural and off-highway vehicle markets. As such, for all periods presented the Company reported this business as discontinued operations in the Company’s consolidated financial statements and therefore excluded it from the segment disclosures herein. See Note 2 for additional details.
The Company has three reportable segments, Control Devices, Electronics and PST, which also represent its operating segments. The Control Devices reportable segment produces sensors, switches, valves and actuators. The Electronics reportable segment produces electronic instrument clusters, electronic control units and driver information systems. The PST reportable segment designs and manufactures electronic vehicle security alarms, convenience accessories, vehicle tracking devices and monitoring services and in-vehicle audio and video devices.
The accounting policies of the Company’s reportable segments are the same as those described in Note 2. The Company’s management evaluates the performance of its reportable segments based primarily on revenues from external customers, capital expenditures and operating income. Inter-segment sales are accounted for on terms similar to those to third parties and are eliminated upon consolidation.
The financial information presented below is for our three reportable operating segments and includes adjustments for unallocated corporate costs and intercompany eliminations, where applicable. Such costs and eliminations do not meet the requirements for being classified as an operating segment. Corporate costs include various support functions, such as information technology, corporate finance, legal, executive administration and human resources.
| 73 |
NOTES TO CONSOLIDATED FINANCIAL STATEMENTS
(in thousands, except share and per share data, unless otherwise indicated)
A summary of financial information by reportable segment is as follows:
| Years ended December 31 | 2015 | 2014 | 2013 | 2016 | 2015 | 2014 | ||||||||||||||||||
| Net Sales: | ||||||||||||||||||||||||
| Control Devices | $ | 333,010 | $ | 306,658 | $ | 291,145 | $ | 408,132 | $ | 333,010 | $ | 306,658 | ||||||||||||
| Inter-segment sales | 2,055 | 3,080 | 2,875 | 1,826 | 2,055 | 3,080 | ||||||||||||||||||
| Control Devices net sales | 335,065 | 309,738 | 294,020 | 409,958 | 335,065 | 309,738 | ||||||||||||||||||
| Electronics | 216,544 | 214,141 | 189,809 | 205,256 | 216,544 | 214,141 | ||||||||||||||||||
| Inter-segment sales | 22,904 | 35,163 | 41,137 | 33,361 | 22,904 | 35,163 | ||||||||||||||||||
| Electronics net sales | 239,448 | 249,304 | 230,946 | 238,617 | 239,448 | 249,304 | ||||||||||||||||||
| PST | 95,258 | 139,780 | 178,532 | 82,589 | 95,258 | 139,780 | ||||||||||||||||||
| Inter-segment sales | - | - | - | - | - | - | ||||||||||||||||||
| PST net sales | 95,258 | 139,780 | 178,532 | 82,589 | 95,258 | 139,780 | ||||||||||||||||||
| Eliminations | (24,959 | ) | (38,243 | ) | (44,012 | ) | (35,187 | ) | (24,959 | ) | (38,243 | ) | ||||||||||||
| Total net sales | $ | 644,812 | $ | 660,579 | $ | 659,486 | $ | 695,977 | $ | 644,812 | $ | 660,579 | ||||||||||||
| Operating Income (Loss): | ||||||||||||||||||||||||
| Control Devices | $ | 44,690 | $ | 35,387 | $ | 32,331 | $ | 61,815 | $ | 44,690 | $ | 35,387 | ||||||||||||
| Electronics | 13,784 | 17,444 | 20,732 | 14,798 | 13,784 | 17,444 | ||||||||||||||||||
| PST (A) | (7,542 | ) | (59,587 | ) | 7,211 | |||||||||||||||||||
| PST | (3,462 | ) | (7,542 | ) | (59,587 | ) | ||||||||||||||||||
| Unallocated Corporate | (23,117 | ) | (19,067 | ) | (17,871 | ) | (29,069 | ) | (23,117 | ) | (19,067 | ) | ||||||||||||
| Total operating income (loss) | $ | 27,815 | $ | (25,823 | ) | $ | 42,403 | $ | 44,082 | $ | 27,815 | $ | (25,823 | ) | ||||||||||
| Depreciation and Amortization: | ||||||||||||||||||||||||
| Control Devices | $ | 9,125 | $ | 9,545 | $ | 9,877 | $ | 10,276 | $ | 9,260 | $ | 9,545 | ||||||||||||
| Electronics | 3,666 | 4,432 | 4,800 | 3,971 | 3,666 | 4,432 | ||||||||||||||||||
| PST | 9,272 | 12,998 | 14,426 | 8,559 | 9,272 | 12,998 | ||||||||||||||||||
| Corporate | 211 | 130 | 183 | |||||||||||||||||||||
| Unallocated Corporate | 452 | 211 | 130 | |||||||||||||||||||||
| Total depreciation and amortization | $ | 22,274 | $ | 27,105 | $ | 29,286 | $ | 23,258 | $ | 22,409 | $ | 27,105 | ||||||||||||
| Interest Expense, net: | ||||||||||||||||||||||||
| Control Devices | $ | 326 | $ | 303 | $ | 182 | $ | 226 | $ | 326 | $ | 303 | ||||||||||||
| Electronics | 161 | 695 | 760 | 142 | 161 | 695 | ||||||||||||||||||
| PST | 2,957 | 2,764 | 1,174 | 3,396 | 2,957 | 2,764 | ||||||||||||||||||
| Corporate | 2,921 | 13,118 | 15,980 | |||||||||||||||||||||
| Unallocated Corporate | 2,513 | 2,921 | 13,118 | |||||||||||||||||||||
| Total interest expense, net | $ | 6,365 | $ | 16,880 | $ | 18,096 | $ | 6,277 | $ | 6,365 | $ | 16,880 | ||||||||||||
| Capital Expenditures: | ||||||||||||||||||||||||
| Control Devices | $ | 15,094 | $ | 13,658 | $ | 9,906 | $ | 13,261 | $ | 15,094 | $ | 13,658 | ||||||||||||
| Electronics | 6,538 | 3,541 | 4,667 | 5,665 | 6,538 | 3,541 | ||||||||||||||||||
| PST | 5,889 | 6,161 | 6,663 | 3,213 | 5,889 | 6,161 | ||||||||||||||||||
| Corporate | 1,214 | 156 | 340 | |||||||||||||||||||||
| Unallocated Corporate(C) | 2,337 | 1,214 | 156 | |||||||||||||||||||||
| Total capital expenditures | $ | 28,735 | $ | 23,516 | $ | 21,576 | $ | 24,476 | $ | 28,735 | $ | 23,516 | ||||||||||||
| 74 |
NOTES TO CONSOLIDATED FINANCIAL STATEMENTS
(in thousands, except share and per share data, unless otherwise indicated)
| December 31, | December 31, | December 31, | December 31, | |||||||||||||
| 2015 | 2014 | 2016 | 2015 | |||||||||||||
| Total Assets: | ||||||||||||||||
| Control Devices | $ | 127,649 | $ | 115,703 | $ | 150,623 | $ | 127,649 | ||||||||
| Electronics | 97,443 | 95,140 | 99,964 | 97,443 | ||||||||||||
| PST | 100,143 | 159,980 | 107,405 | 100,143 | ||||||||||||
| Corporate | 288,806 | 279,013 | 287,031 | 288,806 | ||||||||||||
| Eliminations | (249,789 | ) | (251,085 | ) | (250,494 | ) | (249,789 | ) | ||||||||
| Total assets | $ | 364,252 | $ | 398,751 | $ | 394,529 | $ | 364,252 | ||||||||
| (A) |
| Unallocated Corporate expenses include, among other items, accounting, finance, legal, information technology costs as well as share-based compensation. |
| These amounts represent depreciation and amortization on property, plant and equipment and certain intangible assets. |
| Corporate assets consist primarily of cash, intercompany loan receivables, capital expenditures for the new headquarter building, equity investments and investments in subsidiaries. |
The following table presents net sales and long-term assets for the geographic areas in which the Company operates:
| Years ended December 31 | 2015 | 2014 | 2013 | |||||||||||||||||||||
| 2016 | 2015 | 2014 | ||||||||||||||||||||||
| Net Sales: | ||||||||||||||||||||||||
| North America | $ | 369,032 | $ | 330,516 | $ | 301,592 | $ | 428,046 | $ | 369,032 | $ | 330,516 | ||||||||||||
| South America | 95,258 | 139,780 | 178,532 | 82,589 | 95,258 | 139,780 | ||||||||||||||||||
| Europe and Other | 180,522 | 190,283 | 179,362 | 185,342 | 180,522 | 190,283 | ||||||||||||||||||
| Total net sales | $ | 644,812 | $ | 660,579 | $ | 659,486 | $ | 695,977 | $ | 644,812 | $ | 660,579 | ||||||||||||
| As of December 31 | 2015 | 2014 | ||||||||||||||
| December 31, | December 31, | |||||||||||||||
| 2016 | 2015 | |||||||||||||||
| Long-term Assets: | ||||||||||||||||
| North America | $ | 60,099 | $ | 53,406 | $ | 73,835 | $ | 60,099 | ||||||||
| South America | 56,943 | 85,433 | 63,497 | 56,943 | ||||||||||||
| Europe and Other | 15,301 | 14,401 | 16,304 | 15,301 | ||||||||||||
| Total long-term assets | $ | 132,343 | $ | 153,240 | $ | 153,636 | $ | 132,343 | ||||||||
| 75 |
NOTES TO CONSOLIDATED FINANCIAL STATEMENTS
(in thousands, except share and per share data, unless otherwise indicated)
13.14. Unaudited Quarterly Financial Data
The following is a summary of quarterly results of operations:
| Quarter ended | ||||||||||||||||
| 2015 | December 31 | September 30 | June 30 | March 31 | ||||||||||||
| Net sales | $ | 154,641 | $ | 162,057 | $ | 165,289 | $ | 162,825 | ||||||||
| Gross profit | 42,239 | 45,145 | 45,946 | 43,648 | ||||||||||||
| Operating income | 8,327 | 8,947 | 7,415 | 3,126 | ||||||||||||
| Income tax expense (benefit) from continuing operations | (345 | ) | 32 | (381 | ) | 147 | ||||||||||
| Income from continuing operations | 4,935 | 7,411 | 6,328 | 2,103 | ||||||||||||
| Income (loss) from discontinued operations (D) | 16 | (113 | ) | 55 | (168 | ) | ||||||||||
| Net income | 4,951 | 7,298 | 6,383 | 1,935 | ||||||||||||
| Net loss attributable to noncontrolling interests | (1,133 | ) | (69 | ) | (596 | ) | (409 | ) | ||||||||
| Net income attributable to Stoneridge, Inc. | $ | 6,084 | $ | 7,367 | $ | 6,979 | $ | 2,344 | ||||||||
| Earnings per share from continuing operations attributable to Stoneridge, Inc.: | ||||||||||||||||
| Basic (A) | $ | 0.22 | $ | 0.27 | $ | 0.26 | $ | 0.10 | ||||||||
| Diluted (A) | $ | 0.22 | $ | 0.27 | $ | 0.25 | $ | 0.09 | ||||||||
| Earnings (loss) per share attributable to discontinued operations: | ||||||||||||||||
| Basic (A) | $ | 0.00 | $ | (0.01 | ) | $ | 0.00 | $ | (0.01 | ) | ||||||
| Diluted (A) | $ | 0.00 | $ | (0.01 | ) | $ | 0.00 | $ | (0.01 | ) | ||||||
| Earnings per share attributable to Stoneridge, Inc.: | ||||||||||||||||
| Basic (A) | $ | 0.22 | $ | 0.26 | $ | 0.26 | $ | 0.09 | ||||||||
| Diluted (A) | $ | 0.22 | $ | 0.26 | $ | 0.25 | $ | 0.08 | ||||||||
| Quarter ended | ||||||||||||||||
| 2016 | December 31 | September 30 | June 30 | March 31 | ||||||||||||
| Net sales | $ | 172,612 | $ | 173,846 | $ | 186,903 | $ | 162,616 | ||||||||
| Gross profit | 47,779 | 49,748 | 52,751 | 45,161 | ||||||||||||
| Operating income | 10,170 | 11,780 | 13,626 | 8,506 | ||||||||||||
| Income tax expense (benefit) from continuing operations(B) | (39,503 | ) | 919 | 1,350 | 845 | |||||||||||
| Income from continuing operations | 48,489 | 9,981 | 10,995 | 6,109 | ||||||||||||
| Net income | 48,489 | 9,981 | 10,995 | 6,109 | ||||||||||||
| Net income (loss) attributable to noncontrolling interests | 122 | (303 | ) | (576 | ) | (1,130 | ) | |||||||||
| Net income attributable to Stoneridge, Inc. | 48,367 | 10,284 | 11,571 | 7,239 | ||||||||||||
| Earnings per share from continuing operations attributable to Stoneridge, Inc.: | ||||||||||||||||
| Basic(A) | $ | 1.74 | $ | 0.37 | $ | 0.42 | $ | 0.26 | ||||||||
| Diluted(A) | $ | 1.70 | $ | 0.36 | $ | 0.41 | $ | 0.26 | ||||||||
| Earnings per share attributable to Stoneridge, Inc.: | ||||||||||||||||
| Basic(A) | $ | 1.74 | $ | 0.37 | $ | 0.42 | $ | 0.26 | ||||||||
| Diluted(A) | $ | 1.70 | $ | 0.36 | $ | 0.41 | $ | 0.26 | ||||||||
| Quarter ended | ||||||||||||||||
| 2014 | December 31 | September 30 | June 30 | March 31 | ||||||||||||
| Net sales | $ | 166,811 | $ | 170,338 | $ | 162,099 | $ | 161,331 | ||||||||
| Gross profit | 44,901 | 49,550 | 48,285 | 48,138 | ||||||||||||
| Operating income (loss) (B) | (22,795 | ) | 13,759 | (23,221 | ) | 6,434 | ||||||||||
| Income tax expense (benefit) from continuing operations | (1,066 | ) | (1,174 | ) | 90 | 294 | ||||||||||
| Income (loss) from continuing operations (C) | (31,306 | ) | 9,138 | (28,569 | ) | (467 | ) | |||||||||
| Income (loss) from discontinued operations (D) | (1,692 | ) | (8,108 | ) | (544 | ) | 957 | |||||||||
| Net income (loss) (B) (C) | (32,998 | ) | 1,030 | (29,113 | ) | 490 | ||||||||||
| Net income (loss) attributable to noncontrolling interests (B) | (6,444 | ) | 1,160 | (7,221 | ) | (978 | ) | |||||||||
| Net income (loss) attributable to Stoneridge, Inc. (B) (C) | $ | (26,554 | ) | $ | (130 | ) | $ | (21,892 | ) | $ | 1,468 | |||||
| Earnings (loss) per share from continuing operations attributable to Stoneridge, Inc.: | ||||||||||||||||
| Basic (A) | $ | (0.92 | ) | $ | 0.30 | $ | (0.79 | ) | $ | 0.02 | ||||||
| Diluted (A) | $ | (0.92 | ) | $ | 0.29 | $ | (0.79 | ) | $ | 0.02 | ||||||
| Earnings (loss) per share attributable to discontinued operations: | ||||||||||||||||
| Basic (A) | $ | (0.07 | ) | $ | (0.30 | ) | $ | (0.02 | ) | $ | 0.03 | |||||
| Diluted (A) | $ | (0.07 | ) | $ | (0.29 | ) | $ | (0.02 | ) | $ | 0.03 | |||||
| Earnings (loss) per share attributable to Stoneridge, Inc.: | ||||||||||||||||
| Basic (A) | $ | (0.99 | ) | $ | 0.00 | $ | (0.81 | ) | $ | 0.05 | ||||||
| Diluted (A) | $ | (0.99 | ) | $ | 0.00 | $ | (0.81 | ) | $ | 0.05 | ||||||
| Quarter ended | ||||||||||||||||
| 2015 | December 31 | September 30 | June 30 | March 31 | ||||||||||||
| Net sales | $ | 154,641 | $ | 162,057 | $ | 165,289 | $ | 162,825 | ||||||||
| Gross profit | 42,239 | 45,145 | 45,946 | 43,648 | ||||||||||||
| Operating income | 8,327 | 8,947 | 7,415 | 3,126 | ||||||||||||
| Income tax expense (benefit) from continuing operations | (345 | ) | 32 | (381 | ) | 147 | ||||||||||
| Income from continuing operations | 4,935 | 7,411 | 6,328 | 2,103 | ||||||||||||
| Income (loss) from discontinued operations (C) | 16 | (113 | ) | 55 | (168 | ) | ||||||||||
| Net income | 4,951 | 7,298 | 6,383 | 1,935 | ||||||||||||
| Net loss attributable to noncontrolling interests | (1,133 | ) | (69 | ) | (596 | ) | (409 | ) | ||||||||
| Net income attributable to Stoneridge, Inc. | 6,084 | 7,367 | 6,979 | 2,344 | ||||||||||||
| Earnings per share from continuing operations attributable to Stoneridge, Inc.: | ||||||||||||||||
| Basic(A) | $ | 0.22 | $ | 0.27 | $ | 0.26 | $ | 0.10 | ||||||||
| Diluted(A) | $ | 0.22 | $ | 0.27 | $ | 0.25 | $ | 0.09 | ||||||||
| Earnings (loss) per share attributable to discontinued operations: | ||||||||||||||||
| Basic(A) | $ | 0.00 | $ | (0.01 | ) | $ | 0.00 | $ | (0.01 | ) | ||||||
| Diluted(A) | $ | 0.00 | $ | (0.01 | ) | $ | 0.00 | $ | (0.01 | ) | ||||||
| Earnings per share attributable to Stoneridge, Inc.: | ||||||||||||||||
| Basic(A) | $ | 0.22 | $ | 0.26 | $ | 0.26 | $ | 0.09 | ||||||||
| Diluted(A) | $ | 0.22 | $ | 0.26 | $ | 0.25 | $ | 0.08 | ||||||||
| 76 |
NOTES TO CONSOLIDATED FINANCIAL STATEMENTS
(in thousands, except share and per share data, unless otherwise indicated)
| (A) | Earnings per share for the year may not equal the sum of the four historical quarters earnings per share due to changes in weighted-average basic and diluted shares outstanding. |
| (B) |
| (C) |
| A gain (loss) on disposal of the Wiring business was recorded |
15. Subsequent Events
Orlaco Acquisition
On January 31, 2017, Stoneridge B.V., an indirect wholly-owned subsidiary of Stoneridge, Inc., entered into an agreement to acquire all of Wide-Angle Management B.V. and Exploitatiemaatschappij Berghaaf B.V. (“Orlaco”). Orlaco designs, manufactures and sells a wide variety of innovative camera-based vision systems, monitors and related products primarily to the heavy off-road machinery, commercial on-road vehicle, lifting crane and warehousing and logistics industries. Since July 2015, Stoneridge and Orlaco have jointly developed the MirrorEye mirror replacement system, which is the industry-leading solution to improve the safety and fuel economy of commercial vehicles. The MirrorEye system integrates Orlaco’s camera technology and Stoneridge’s driver information capabilities as well as the combined software capabilities of both companies. The acquisition of Orlaco enhances Stoneridge’s global technical capabilities in vision systems and facilitates entry into new markets.
The aggregate consideration for the Orlaco acquisition was €74,939 ($79,675), which included customary estimated adjustments to the purchase price. The Company paid €67,439 ($71,701) in cash, and €7,500 ($7,974) to hold in an escrow account to secure the payment obligations of the seller under the terms of the purchase agreement. The purchase price is subject to certain customary adjustments set forth in the purchase agreement. The Company expects to transfer the escrow amount promptly following the completion of the escrow period. The Company may also be required pay up to an additional €7.5 million in cash as earnout consideration if certain targets are achieved during the first two years. In order to fund the Orlaco acquisition, the Company borrowed $81.0 million under its Credit Facility.
Consent and Amendment No. 4 to Third Amended and Restated Credit Agreement
On January 30, 2017, the Company entered into a Consent and Amendment No. 4 (“Amendment No. 4”) to the Credit Facility. Amendment No. 4 amended certain definitions, schedules and exhibits of the Credit Agreement, consented to the Dutch reorganization, and consented to the Orlaco acquisition.
| 77 |
NOTES TO CONSOLIDATED FINANCIAL STATEMENTS
(in thousands, except share and per share data, unless otherwise indicated)
SCHEDULE II - VALUATION AND QUALIFYING ACCOUNTS
(in thousands)
The following schedules provide the activity for accounts receivable reserves and valuation allowance for deferred tax assets from continuing operations for the years ended December 31, 2016, 2015 2014 and 2013:2014:
| Balance at | Charged to | Balance at | Charged to | |||||||||||||||||||||||||||||
| beginning of | costs and | Balance at | beginning of | costs and | Balance at | |||||||||||||||||||||||||||
| period | expenses | Write-offs | end of period | period | expenses | Write-offs | end of period | |||||||||||||||||||||||||
| Accounts receivable reserves: | ||||||||||||||||||||||||||||||||
| Year ended December 31, 2013 | $ | 2,176 | $ | 1,655 | $ | (1,206 | ) | $ | 2,625 | |||||||||||||||||||||||
| Year ended December 31, 2014 | 2,625 | 619 | (1,227 | ) | 2,017 | $ | 2,625 | $ | 619 | $ | (1,227 | ) | $ | 2,017 | ||||||||||||||||||
| Year ended December 31, 2015 | 2,017 | 395 | (1,346 | ) | 1,066 | 2,017 | 395 | (1,346 | ) | 1,066 | ||||||||||||||||||||||
| Year ended December 31, 2016 | 1,066 | 1,604 | (1,040 | ) | 1,630 | |||||||||||||||||||||||||||
| Exchange | Exchange | |||||||||||||||||||||||||||||||
| Net additions | rate | Net additions | rate | |||||||||||||||||||||||||||||
| Balance at | charged to | fluctuations | Balance at | charged to | fluctuations | |||||||||||||||||||||||||||
| beginning of | income | and other | Balance at | beginning of | income | and other | Balance at | |||||||||||||||||||||||||
| period | (expense) | items | end of period | period | (expense) | items | end of period | |||||||||||||||||||||||||
| Valuation allowance for deferred tax assets: | ||||||||||||||||||||||||||||||||
| Year ended December 31, 2013 | $ | 71,790 | $ | 453 | $ | (416 | ) | $ | 71,827 | |||||||||||||||||||||||
| Year ended December 31, 2014 | 71,827 | (2,786 | ) | (1,134 | ) | 67,907 | $ | 71,827 | $ | (2,786 | ) | $ | (1,134 | ) | $ | 67,907 | ||||||||||||||||
| Year ended December 31, 2015 | 67,907 | (7,957 | ) | (559 | ) | 59,391 | 67,907 | (7,957 | ) | (559 | ) | 59,391 | ||||||||||||||||||||
| Year ended December 31, 2016 | 59,391 | (47,659 | )(A) | (607 | ) | 11,125 | ||||||||||||||||||||||||||
| (A) | The Company recorded the release of a valuation allowance associated with its U.S. federal, certain state and foreign deferred tax assets of $49.6 million. |
70
| 78 |
Item 9. Changes In and Disagreements With Accountants On Accounting and Financial Disclosure.
There have been no disagreements between the management of the Company and its Independent Registered Public Accounting Firm on any matter of accounting principles or practices of financial statement disclosures, or auditing scope or procedure.
Item 9A. Controls and Procedures.
Evaluation of Disclosure Controls and Procedures
As of December 31, 2015,2016, an evaluation was performed under the supervision and with the participation of the Company’s management, including the principal executive officer (“PEO”) and principal financial officer (“PFO”), of the effectiveness of the design and operation of the Company’s disclosure controls and procedures as defined in Rule 13a-15(e) and Rule 15d-15(e) of the Securities Exchange Act of 1934, as amended. Based on that evaluation, the Company’s PEO and PFO, concluded that the Company’s disclosure controls and procedures were effective as of December 31, 2015.2016.
Management’s Report on Internal Control Over Financial Reporting
Our management is responsible for establishing and maintaining adequate internal control over financial reporting, as such term is defined in Exchange Act Rules 13a-15(f) and 15d-15(f). In evaluating the Company’s internal control over financial reporting, management has adopted the framework inInternal Control-Integrated Framework issued by the Committee of Sponsoring Organizations of the Treadway Commission (2013 Framework). Under the supervision and with the participation of our management, including the PEO and PFO, we conducted an evaluation of the effectiveness of our internal control over financial reporting, as of December 31, 2015.2016. Based on our evaluation under the framework in Internal Control-Integrated Framework(2013 Framework), our management has concluded that our internal control over financial reporting was effective as of December 31, 2015.2016.
Because of inherent limitations, internal control over financial reporting may not prevent or detect misstatements. Also, projections of any evaluation of effectiveness to future periods are subject to the risk that controls may become inadequate because of changes in conditions, or that the degree of compliance with the policies or procedures may deteriorate.
The effectiveness of the Company’s internal control over financial reporting as of December 31, 20152016 has been audited by Ernst & Young LLP, an independent registered public accounting firm, as stated in their report which appears herein.
Changes in Internal Control Over Financial Reporting
There were no changes to our internal controls over financial reporting during the quarter ended December 31, 20152016 that has materially or is reasonably likely to materially affect internal control over financial reporting.
| 79 |
REPORT OF INDEPENDENT REGISTERED PUBLIC ACCOUNTING FIRM
The Board of Directors and Shareholders of
Stoneridge, Inc. and Subsidiaries
We have audited Stoneridge, Inc. and Subsidiaries’ internal control over financial reporting as of December 31, 2015,2016, based on criteria established in Internal Control—Integrated Framework issued by the Committee of Sponsoring Organizations of the Treadway Commission (2013 framework) (the COSO criteria). Stoneridge, Inc. and Subsidiaries’ management is responsible for maintaining effective internal control over financial reporting, and for its assessment of the effectiveness of internal control over financial reporting included in the accompanying Management’s Report on Internal Control over Financial Reporting. Our responsibility is to express an opinion on the company’s internal control over financial reporting based on our audit.
We conducted our audit in accordance with the standards of the Public Company Accounting Oversight Board (United States). Those standards require that we plan and perform the audit to obtain reasonable assurance about whether effective internal control over financial reporting was maintained in all material respects. Our audit included obtaining an understanding of internal control over financial reporting, assessing the risk that a material weakness exists, testing and evaluating the design and operating effectiveness of internal control based on the assessed risk, and performing such other procedures as we considered necessary in the circumstances. We believe that our audit provides a reasonable basis for our opinion.
A company’s internal control over financial reporting is a process designed to provide reasonable assurance regarding the reliability of financial reporting and the preparation of financial statements for external purposes in accordance with generally accepted accounting principles. A company’s internal control over financial reporting includes those policies and procedures that (1) pertain to the maintenance of records that, in reasonable detail, accurately and fairly reflect the transactions and dispositions of the assets of the company; (2) provide reasonable assurance that transactions are recorded as necessary to permit preparation of financial statements in accordance with generally accepted accounting principles, and that receipts and expenditures of the company are being made only in accordance with authorizations of management and directors of the company; and (3) provide reasonable assurance regarding prevention or timely detection of unauthorized acquisition, use, or disposition of the company’s assets that could have a material effect on the financial statements.
Because of its inherent limitations, internal control over financial reporting may not prevent or detect misstatements. Also, projections of any evaluation of effectiveness to future periods are subject to the risk that controls may become inadequate because of changes in conditions, or that the degree of compliance with the policies or procedures may deteriorate.
In our opinion, Stoneridge, Inc. and Subsidiaries maintained, in all material respects, effective internal control over financial reporting as of December 31, 2015,2016, based on the COSO criteria.
We also have audited, in accordance with the standards of the Public Company Accounting Oversight Board (United States), the consolidated balance sheets of Stoneridge, Inc. and Subsidiaries as of December 31, 20152016 and 2014,2015, and the related consolidated statements of operations, comprehensive loss,income (loss), cash flows and shareholders' equity for each of the three years in the period ended December 31, 20152016 of Stoneridge, Inc. and Subsidiaries and our report dated March 14, 20162, 2017 expressed an unqualified opinion thereon.
/s/ Ernst & Young LLP
Cleveland, OhioDetroit, Michigan
March 14, 20162, 2017
| 80 |
None.
Item 10. Directors, Executive Officers and Corporate Governance.
The information required by this Item 10 regarding our directors is incorporated by reference to the information under the sections and subsectionssections entitled, “Proposal One: Election of Directors,” “Nominating and Corporate Governance Committee,” “Audit Committee,” “Section 16(a) Beneficial Ownership Reporting Compliance” and “Corporate Governance Guidelines”Governance” contained in the Company's Proxy Statement in connection with its Annual Meeting of Shareholders to be held on May 10, 2016.9, 2017. The information required by this Item 10 regarding our executive officers appears as a Supplementary Item following Item 1 under Part I hereof.
Item 11. Executive Compensation.
The information required by this Item 11 is incorporated by reference to the information under the sections and subsections “Compensation Committee,” “Compensation Committee Interlocks and Insider Participation,” “Compensation Committee Report” and “Executive Compensation” contained in the Company's Proxy Statement in connection with its Annual Meeting of Shareholders to be held on May 10, 2016.9, 2017.
Item 12. Security Ownership of Certain Beneficial Owners and Management and Related Stockholder Matters.
The information required by this Item 12 (other than the information required by Item 201(d) of Regulation S-K which is set forth below) is incorporated by reference to the information under the heading “Security Ownership of Certain Beneficial Owners and Management” contained in the Company's Proxy Statement in connection with its Annual Meeting of Shareholders to be held on May 10, 2016.9, 2017.
In May 2010, we adopted an Amended Directors’ Restricted Share Plan and an Amended and Restated Long-Term Incentive Plan, as amended. In May 2013, we adopted an Amended Directors’ Restricted Shares Plan and an Amended and Restated Long-Term Incentive Plan, as amended, to increase the number of shares available for issuance under the plans. In May 2016, we adopted the 2016 Long-Term Incentive Plan. Our shareholders approved each plan. Equity compensation plan information as of December 31, 20152016 is as follows:
| Number of securities remaining available for future issuance under equity compensation plans (A) | ||||
| Equity compensation plans approved by shareholders | ||||
| Equity compensation plans not approved by shareholders | - | |||
| (A) | Excludes |
73
| 81 |
Item 13. Certain Relationships and Related Transactions, and Director Independence.
The information required by this Item 13 is incorporated by reference to the information under the sections and subsections “Transactions with Related Persons” and “Director Independence” contained in the Company's Proxy Statement in connection with its Annual Meeting of Shareholders to be held on May 10, 2016.9, 2017.
Item 14. Principal Accounting Fees and Services.
The information required by this Item 14 is incorporated by reference to the information under the sections and subsections “Service Fees Paid to Independent Registered Accounting Firm” and “Pre-Approval Policy” contained in the Company's Proxy Statement in connection with its Annual Meeting of Shareholders to be held on May 10, 2016.9, 2017.
Item 15. Exhibits, Financial Statement Schedules.
| (a) | The following documents are filed as part of this Form 10-K. |
| Page in Form 10-K | ||
| (1) | Consolidated Financial Statements: | |
| Report of Independent Registered Public Accounting Firm | ||
| Consolidated Balance Sheets as of December 31, | ||
| Consolidated Statements of Operations for the Years Ended December 31, 2016, 2015 | ||
| Consolidated Statements of Comprehensive | ||
| Consolidated Statements of Cash Flows for the Years Ended December 31, 2016, 2015 | ||
| Consolidated Statements of Shareholders' Equity for the Years Ended December 31, 2016, 2015 | ||
| Notes to Consolidated Financial Statements | ||
| (2) | Financial Statement Schedule: | |
| Schedule II– Valuation and Qualifying Accounts | ||
| (3) | Exhibits: | |
| See the list of exhibits on the Index to Exhibits following the signature page. |
| (b) | The exhibits listed on the Index to Exhibits are filed as part of or incorporated by reference into this report. |
| (c) | Additional Financial Statement Schedules. |
None.
| 82 |
Pursuant to the requirements of the Section 13 or 15(d) of the Securities Exchange Act of 1934, the registrant has duly caused this report to be signed on its behalf by the undersigned, thereunto duly authorized.
STONERIDGE, INC.
| Date: March 2, 2017 | |
| (Principal Financial |
Pursuant to the requirements of the Securities Exchange Act of 1934, this report has been signed below by the following persons on behalf of the registrant and in the capacities and on the dates indicated.
| Date: March | /s/ JONATHAN B. DEGAYNOR |
Jonathan B. DeGaynor | |
| President, Chief Executive Officer and Director | |
| (Principal Executive Officer) | |
| Date: March | /s/ |
| (Principal Financial | |
| Date: March 2, 2017 | /s/ ROBERT J. HARTMAN JR. |
| Robert J. Hartman Jr. | |
| Chief Accounting Officer | |
| (Principal Accounting Officer) | |
| Date: March | /s/ WILLIAM M. LASKY |
William M. Lasky | |
| Chairman of the Board of Directors | |
| Date: March | /s/ JEFFREY P. DRAIME |
Jeffrey P. Draime | |
| Director | |
| Date: March | /s/ DOUGLAS C. JACOBS |
Douglas C. Jacobs | |
| Director | |
| Date: March | /s/ IRA C. KAPLAN |
Ira C. Kaplan | |
| Director | |
| Date: March | /s/ KIM KORTH |
Kim Korth | |
| Director | |
| Date: March | /s/ GEORGE S. MAYES, JR. |
George S. Mayes, Jr. | |
| Director |
| Date: March | /s/ PAUL J. SCHLATHER |
Paul J. Schlather | |
| Director |
| 83 |
INDEX TO EXHIBITS
| Exhibit Number | Exhibit | |
| 2.1 | Asset Purchase Agreement, dated August 1, 2014, between Stoneridge, Inc. and Motherson Sumi Systems Ltd. (incorporated by reference to Exhibit 2.1 to the Company's Quarterly Report on Form 10-Q for the quarter ended June 30, 2014). | |
| 2.2 | Amendedment No. 1 to the Asset Purchase Agreement, July 31, 2014, between Stoneridge, Inc. and Motherson Sumi Systems Ltd. (incorporated by reference to Exhibit 2.2 to the Company's Quarterly Report on Form 10-Q for the quarter ended June 30, 2014). | |
| 2.3 | Share Sale and Purchase Agreement, dated as of January 31, 2017, by and among Stoneridge B.V., Stoneridge, Inc., Wide-Angle Management B.V., Exploitatiemaatschappij Berghaaf B.V., and Henrie G. van Beusekom (incorporated by reference to Exhibit 2.1 to the Company's Current Report on Form 8-K filed on February 1, 2017)*. | |
| 3.1 | Second Amended and Restated Articles of Incorporation of the Company (incorporated by reference to the Company’s Quarterly Report on Form 10-Q for the quarter ended March 31, 1999). | |
| 3.2 | Amended and Restated Code of Regulations of the Company (incorporated by reference to Exhibit 3.1 to the Company’s Quarterly Report on Form 10-Q for the quarter ended June 30, 2007). | |
| 4.1 | Common Share Certificate (incorporated by reference to Exhibit 4.1 to the Company’s Annual Report on Form 10-K for the year ended December 31, 1997). | |
| 10.1 | Form of 2006 Directors’ Restricted Shares Plan Grant Agreement (incorporated by reference to Exhibit 99.4 to the Company’s Current Report on Form 8-K filed on July 26, 2006)*. | |
| 10.2 | Amended Annual Incentive Plan (incorporated by reference to Exhibit 99.1 to the Company’s Current Report on Form 8-K filed on May 12, 2011)*. | |
| 10.3 | ||
| 10.4 | Stoneridge, Inc. Long-Term Cash Incentive Plan (incorporated by reference to Exhibit 10.3 to the Company’s Quarterly Report on Form 10-Q for the quarter ended June 30, 2009)*. | |
| 10.5 | Stoneridge, Inc. Officers’ and Key Employees’ Severance Plan (incorporated by reference to Exhibit 99.1 to the Company’s Current Report on Form 8-K filed on October 9, 2009)*. | |
| 10.6 | Stoneridge, Inc. Form of Indemnification Agreement between the Company and employees identified on the exhibit (incorporated by reference to Exhibit 10.31 to the Company’s Annual Report on Form 10-K for the year ended December 31, 2009). | |
| 10.7 | Stoneridge, Inc. Amended and Restated Long-Term Incentive Plan – Form of 2010 Restricted Shares Grant Agreement (incorporated by reference to Exhibit 10.1 to the Company’s Quarterly Report on Form 10-Q for the quarter ended March 31, 2010)*. | |
| 10.8 | Stoneridge, Inc. Long-Term Cash Incentive Plan – Form of 2010 Phantom Share Grant Agreement (incorporated by reference to Exhibit 10.2 to the Company’s Quarterly Report on Form 10-Q for the quarter ended March 31, 2010)*. | |
| 10.9 | Amended and Restated Long-Term Incentive Plan, as amended (incorporated by reference to Exhibit 4.3 of the Company’s Registration Statement on Form S-8 filed with the SEC on August 5, 2013 (No. 333-172002) |
| 84 |
| Exhibit Number | Exhibit | |
| 10.10 | Amended Directors’ Restricted Share Plan (incorporated by reference to Exhibit 4.4 of the Company’s Registration Statement on Form S-8 filed with the SEC on August 5, 2013 (No. 333-172002))*. | |
| 10.11 | First Amendment to the Stoneridge, Inc. Amended and Restated Long-Term Incentive Plan, as amended (incorporated by reference to Exhibit 99.1 to the Company's Current Report on Form 8-K filed on May 8, 2013)*. | |
| 10.12 | Stoneridge, Inc. Amended and Restated Long-Term Incentive Plan - 2014 Performance Shares Agreement (incorporated by reference to Exhibit 10.1 to the Company's Quarterly Report on Form 10-Q for the quarter ended March 31, 2014)*. | |
| 10.13 | Stoneridge, Inc. 2016 Long-Term Incentive Plan (incorporated by reference to Exhibit 99.2 to the Company’s Current Report on Form 8-K filed on May 12, 2016)*. | |
| 10.14 | First Amendment to the Stoneridge, Inc. Amended Directors' Restricted Shares Plan (incorporated by reference to Exhibit 99.2 to the Company's Current Report on Form 8-K filed on May 8, 2013)*. | |
| Amended and Restated Change in Control Agreement (incorporated by reference to Exhibit 10.1 to the Company's Current Report on Form 8-K filed on December 21, 2011)*. | ||
| 10.16 | ||
| Agreement Upon Retirement, dated March 16, 2015, between the Company and John C. Corey (incorporated by reference to Exhibit 10.1 to the Company's Current Report on Form 8-K filed on March 19, 2015)*. | ||
| Employment Agreement, dated March 16, 2015, between the Company and Jonathan B. DeGaynor (incorporated by reference to Exhibit 10.2 to the Company's Current Report on Form 8-K filed on March 19, 2015)*. | ||
| Indemnification Agreement between the Company and Jonathan B. DeGaynor (incorporated by reference to Exhibit 10.3 to the Company's Current Report on Form 8-K filed on March 19, 2015). | ||
| 10.19 | Third Amended and Restated Credit Agreement by and among Stoneridge, Inc. and certain of its subsidiaries as borrowers and its lenders, dated September 12, 2014 (incorporated by reference to Exhibit 10.1 to the Company's Current Report on Form 8-K filed on September 15, 2014). | |
| 10.20 | Amendment No. 1 to Third Amended and Restated Credit Agreement (incorporated by reference to Exhibit 10.1 to the Company's Current Report on Form 8-K filed on March 31, 2015). | |
| 10.21 | Amendment No. 2 to Third Amended and Restated Credit Agreement (incorporated by reference to Exhibit 10.1 to the Company's Current Report on Form 8-K filed on February 24, 2016). | |
| 10.22 | Amendment No. 3 to Third Amended and Restated Credit Agreement (incorporated by reference to Exhibit 10.1 to the Company's Current Report on Form 8-K filed on August 17, 2015). | |
| 10.23 | Consent and Amendment No. 4 to Third Amended and Restated Credit Agreement (incorporated by reference to Exhibit 10.1 to the Company's Current Report on Form 8-K filed on February 1, 2017). |
| 85 |
| Exhibit Number | Exhibit | |
| 14.1 | Code of Ethics for Senior Financial Officers (incorporated by reference to Exhibit 14.1 to the Company’s Annual Report on Form 10-K for the year ended December 31, 2003). | |
| 21.1 | Principal Subsidiaries and Affiliates of the Company, filed herewith. | |
| 23.1 | Consent of Independent Registered Public Accounting Firm, filed herewith. |
| 31.1 | Chief Executive Officer certification pursuant to Section 302 of the Sarbanes-Oxley Act of 2002, filed herewith. | |
| 31.2 | Chief Financial Officer certification pursuant to Section 302 of the Sarbanes-Oxley Act of 2002, filed herewith. | |
| 32.1 | Chief Executive Officer certification pursuant to 18 U.S.C. Section 1350, as adopted pursuant to Section 906 of the Sarbanes-Oxley Act of 2002, filed herewith. | |
| 32.2 | Chief Financial Officer certification pursuant to 18 U.S.C. Section 1350, as adopted pursuant to Section 906 of the Sarbanes-Oxley Act of 2002, filed herewith. | |
| 101.INS | XBRL Instance Document | |
| 101.SCH | XBRL Schema Document | |
| 101.CAL | XBRL Calculation Linkbase Document | |
| 101.DEF | XBRL Definition Linkbase Document | |
| 101.LAB | XBRL Labels Linkbase Document | |
| 101.PRE | XBRL Presentation Linkbase Document | |
| * - Reflects management contract or compensatory plan or arrangement required to be filed as an exhibit pursuant to Item 15(b) of this Annual Report on Form 10-K. |
| 86 |