UNITED STATES
SECURITIES AND EXCHANGE COMMISSION
Washington, D.C. 20549
FORM 10-K
x ANNUAL REPORT PURSUANT TO SECTION 13 OR 15(d) OF THE SECURITIES EXCHANGE ACT OF 1934
For the fiscal year ended December 31, 20162020
Commission File Number: 000-54191
SINO AGRO FOOD, INC.
(Exact Name of Registrant as Specified in its Charter)
| Nevada | 33-1219070 |
| (State or Other Jurisdiction | (IRS Employer Identification Number) |
Room 3801,3520, Block A, China Shine Plaza
No. 9 Lin He Xi Road
Tianhe District, Guangzhou City, P.R.C. 510610
(Address of principal executive offices, including zip code)
Registrant’s Telephone Number, including area code:(860) 20 22057860(+86)-20-22116293
Copies to:
Marc Ross, Esq.
Henry Nisser, Esq.
Sichenzia Ross Ference Kesner LLP
61 Broadway, 32ndFloor
New York, New York 10006
Telephone: (212) 930-9700
Securities registered pursuant to Section 12(b) of the Exchange Act: None
Securities registered pursuant to Section 12(g) of the Exchange Act: Common Stock, $0.001 par value per share
Indicate by check mark if the registrant is a well-known seasoned issuer, as defined in Rule 405 of the Securities Act. Yeso¨ Nox
Indicate by check mark if the registrant is not required to file reports pursuant to Section 13 or Section 15(d) of the Act. Yeso Nox
Indicate by check mark whether the registrant (1) has filed all reports required to be filed by Section 13 or 15(d) of the Securities Exchange Act of 1934 during the preceding 12 months (or for such shorter period that the registrant was required to file such reports), and (2) has been subject to such filing requirements for the past 90 days. Yesx Noo
Indicate by check mark whether the registrant has submitted electronically and posted on its corporate Web site, if any, every Interactive Data File required to be submitted and posted pursuant to Rule 405 of Regulation S-T (§ 232.405 of this chapter) during the preceding 12 months (or for such shorter period that the registrant was required to submit and post such files). Yesx Noo
Indicate by check mark if disclosure of delinquent filers pursuant to Item 405 of Regulation S-K (§229.405 of this chapter) is not contained herein, and will not be contained, to the best of the registrant’s knowledge, in definitive proxy or information statements incorporated by reference in Part III of this Form 10-Kannual report or any amendment to this Form 10-K.annual report. x
Indicate by check mark whether the registrant is a large accelerated filer, an accelerated filer, a non-accelerated filer, or a smaller reporting company. See the definitions of “large accelerated filer,” “accelerated“accelerated filer” and “smaller reporting company” in Rule 12b-2 of the Exchange Act.
| Large Accelerated Filer¨ | Accelerated Filer |
| Non-Accelerated Filero | Smaller Reporting Company |
| Emerging growth company x |
IndicateIf an emerging growth company, indicate by check mark whetherif the registrant is a shell company (as defined in Rule 12b-2has elected not to use the extended transition period for complying with any new or revised financial accounting standards provided pursuant to Section 13(a) of the Exchange Act). YesAct. o Nox¨
The aggregate market value of the voting stock held by non-affiliates of the issuer on June 30, 2016,16th 2021, based upon the $5.50$0.086 per share closing price of such stock on that date, was approximately $99,313,445.in round figure of $5,118,413.00.
There were 22,726,85960,356,776 shares of our common stock issued and outstanding as of December 31, 2016.consisting 59,516,423 free trading shares and 840,353
Documents incorporated by reference: None
FORWARD-LOOKING STATEMENTS
This Annual Report on Form 10-K (the “Annual Report”) contains forward-looking“forward-looking statements,” within the meaning of Section 27A of the Private Securities Litigation Reform Act of 1933,1995 and Section 21E of the Securities Exchange Act of 1934, as amended. These statements relate to future events or our future financial performance. We have attempted to identifyamended (the “Exchange Act”). The Company intends such forward-looking statements to be covered by the safe harbor provisions for forward-looking statements contained in Section 21E of the Exchange Act. Forward-looking statements can be identified by the use of forward-looking terminology, including “anticipates,such as “estimates,” “projects,” “plans,” “believes,” “expects,” “can,” “continue,” “could,” “estimates,” “expects,“anticipates,” “intends,” “may,” “plans,” “potential,” “predict,” “should” or “will” or the negative of these termsthereof or other comparable terminology.variations thereon, or by discussions of strategy that involve risks and uncertainties These statements reflect management’s current beliefs and are only predictions;based on information now available to it. Accordingly, these statements are subject to certain risks, uncertainties and other factors maycontingencies that could cause ourthe Company’s actual results, levels of activity, performance or achievements to be materially different from any future results, levels or activity, performance or achievements expressed or implied by these forward-looking statements. Although we believe that the expectations reflected in the forward-looking statements are reasonable, we cannot guarantee future results, levels of activity, performance or achievements. Our expectations are as of the date this Annual Report is filed,2017 and we do not intend to update any of the forward-looking statements after the date this Annual Report is filed to confirm these statements to actual results, unless required by law.
This Annual Report also contains estimates and other statistical data made by independent parties and by us relating to market size and growth and other industry data. This data involves a number of assumptions and limitations, and you are cautioned not to give undue weight to such estimates. We have not independently verified the statistical and other industry data generated by independent parties and contained in this Annual Report and, accordingly, we cannot guarantee their accuracy or completeness, though we do generally believe the data to be reliable. In addition, projections, assumptions and estimates of our future performance and the future performance of the industries in which we operate are necessarily subject to a high degree of uncertainty and risk due to a variety of factors, including those described in “Risk Factors” and elsewhere in this Annual Report. These and other factors could cause resultsbeyond to differ materially from those expressed in, or implied by, such statements. Such statements, include, but are not limited to, statements contained in this Annual Report relating to the estimates madeCompany’s business, financial performance, business strategy, recently announced transactions and capital outlook. Important factors that could cause actual results to differ materially from those in the forward-looking statements include: a continued decline in general economic conditions nationally and internationally; decreased demand for our products and services; market acceptance of our products; the impact of any litigation or infringement actions brought against us; competition from other providers and products; the inability to raise capital to fund continuing operations; changes in government regulation; the ability to complete customer transactions, and other factors relating to our industry, our operations and results of operations and any businesses that may be acquired by us. Should one or more of these risks or uncertainties materialize, or should the underlying assumptions prove incorrect, actual results may differ significantly from those anticipated, believed, estimated, expected, intended or planned. The Company has been severely impacted by the independent parties andeffects of COVID-19 “Pandemic 2020”, which effects continue to this day as such presently the Company do not have the ability to control the exact timing of progresses in moving forward of its business plans tangibly except best effort basis. Readers of this Annual Report should not place undue reliance on any forward-looking statements. Except as required by us.federal securities laws, the Company undertakes no obligation to update or revise these forward-looking statements to reflect new events or uncertainties.
You should read the following discussion and analysis of the financial condition and results of operations of the Company together with the financial statements and the related notes presented herein.
PART I
In this Annual Report, unless the context requires otherwise, references to the “Company,” “Sino Agro,” “SIAF,” “we,” “our company” and “us” refer to Sino Agro Food, Inc., a Nevada corporation together with its subsidiaries.
Part 1 Business
Back Ground:
Sino Agro Food, Inc.
SIAF is an agriculture technology and natural food holding company with principal operations in the People’s Republic of China. The Company acquires and maintains equity stakes in a cohesive portfolio of companies that SIAF forms according to its core mission to produce, distribute, market and sell natural, sustainable protein food and produce, primarily seafood and cattle, to the rapidly growing middle class in China. SIAF provides financial oversight and strategic direction for each company, and for the interoperation between companies, stressing vertical integration between the levels of the Company’s subsidiary food chain. The Company owns or licenses patents, proprietary methods, and other intellectual properties in its areas of expertise. SIAF provides technology consulting and services to joint venture partners to construct and operate food businesses, primarily producing wholesale fish and cattle. Further joint ventures market and distribute the wholesale products as part of an overall “farm to plate” concept and business strategy.
Revenues by division were as follows (in millions of U.S. dollars):
| Division (on Sales of Goods) | 2015 | 2016 | ||||||
| Fisheries (CA) | $ | 85.4 | $ | 61.4 | ||||
| Organic Fertilizer (HSA & SJAP) | 164.6 | 155.2 | ||||||
| Cattle (MEIJI) | 35.3 | 29.8 | ||||||
| Plantation (JHST) | 13.7 | 13.3 | ||||||
| Corporate, Marketing & Trading (SIAF) | 37.9 | 72.4 | ||||||
| Total Revenues derived on sales of goods | $ | 336.9 | $ | 332.1 | ||||
| Division (on consulting & services) | 2015 | 2016 | ||||||
| CA (Fishery related developments) | $ | 88.5 | $ | 72.2 | ||||
| MEIJI (Cattle farm developments) | 0 | 0 | ||||||
| SIAF (Other developments) | 3.8 | 0 | ||||||
| Total Revenues derived on consulting & services | $ | 92.3 | $ | 72.2 | ||||
History
The Company which was formerly known as Volcanic Gold, Inc. and A Power Agro Agriculture Development, Inc., was incorporated on October 1, 1974 in the State of Nevada. The Company was formerly engaged in the mining and exploration business but ceased the mining and exploring business in 2005. On 24 August 2007, the Company entered into a merger and acquisition agreement with CA, a Belize corporation and its subsidiaries CS and CH. Effective of the same date, CA completed a reverse merger transaction with the Company.
For two years after its introduction in China, the Company operated in the dairy segment, but sold the dairy business in December of 2009 and began to implement its five year plan to develop its vertically integrated business operations consisting of (i) cattle fattening and production of beef products and (ii) cultivation of fish and prawn and related products. The Company now operates as an engineering, technology and consulting company specializing in building and operating agriculture and aquaculture farms in China.
Our principal executive office is located at Room 3801, 38th Floor, Block A, China Shine Plaza, No. 9 Lin He Xi Road, Tianhe District, Guangzhou City, Guangdong Province, PRC, 510610.
The table below provides an overview of key events in the development of the business of the Company.
Through December 31, 2016 on all of its development projects, the Company(SIAF) has been contracted as turnkey contractor to the owners and developers of the C&S Project Companies and acted as the master engineer, pioneering the construction and building of farms, from raw land into fully operational facilities. The Company completes the construction and building of infrastructure including staff quarters, offices, processing facilities, storage, and all related production facilities. The Company’s management teams are responsible for developing all business activities into effective and efficient operations. From October 5, 2016, onward, Tri-way has assumed the role as developer of aquaculture projects in Chinaestablished since 2007 with CA contracted to provide turnkey contracted services for those projects.
In just a few years, Sino Agro Food has matured into a company dedicated to the agriculture and aquaculture industry in China. The Company currently maintains operation of its HU Plantation (see description in section 4.10 below) as well as its services in engineering consulting, specializing in the development of two major products, namely meat derived from the rearing of beef cattle and seafood derived from the growth of fish, prawns, eel and other marine species.
Background
After successfully developing many aquaculture fishery farms, cattle farms and related business operations (along with sales and marketing of produce and products) in Australia and Malaysia since 1998, SIAF’s management team introduced its business activities in China in 2006. agriculture industry producing food produces and products (as primary producer) using modern technologies introduced and transferred mainly from Australia. SIAF became a SEC fully reporting company since 2010. The Company is an engineering and consulting company that specializes in building and operating agriculture and aquaculture farms.
To accomplish this, we use our expertise and know how in specific agriculture and aquaculture technologies. Our “A Power Re-circulating Aquaculture System,” sometimes referred to herein as APRAS, is a patented and proven technology for indoor fish farming. We have developed modern techniques and technologies to grow, feed and house both fish and cattle. These are engineered into the designs of, and the management systems for, indoor and outdoor fishery and cattle farms. Our experience managing crops, and employing technologies, including hydroponic, to work within climate and growing conditions optimizes production of organic, green and natural agricultural produce.
In all of our developments we have acted as the master engineer, pioneering the construction and building of farms, from raw land into fully operational facilities. We complete the construction and building of infrastructure including staff quarters, offices, processing facilities, storage, and all related production facilities. Our management teams are responsible for developing all business activities into effective and efficient operations.
In just a few years, SIAF has matured into a company dedicated to the agriculture and aquaculture industry in China. We currently maintain operation of our HU Plantation as well as our services in engineering consulting, specializing in the development of two major products, namely meat derived from the rearing of beef cattle and seafood derived from the growth of fish, prawns, eel and other marine species.
Revenues are generated from activities that we divide into five stand-alone business divisions or units: (1) Fishery, (2) Cattle & Beef, (3) Organic Fertilizer, (4) HU Plantation, and (5) Marketing and Trading. This fifth and newest division, “Marketing and Trading,” represents our strongest push to vertically integrate the Company’s operations, furthering the Company’s overall “farm to plate” concept.
Corporate Acquisitions
On September 5, 2007, we acquired two businesses in the People’s Republic of China (“PRC”):
(a) Tri-Way Industries Ltd., Hong Kong (“TRW”) (formerly known as Tri-way Industries Limited), a company incorporated in Hong Kong; and
(b) Macau EIJI Co. Ltd., Macau (“MEIJI”) (formerly known as Macau Eiji Company Limited), a company incorporated in Macau, and the owner of 75% equity interest in Enping City Juntang Town Hang Sing Tai Agriculture Co. Ltd. (“HST”), a PRC corporate Sino Foreign joint venture.
On November 27, 2007, MEIJI and HST established a corporate Sino Foreign joint venture, Jiangmen City Heng Sheng Tai Agriculture Development Co. Ltd, China (“JHST”) (formerly known as Jiang Men City Heng Sheng Tai Agriculture Development Co. Ltd.), a company incorporated in the PRC with MEIJI owning a 75% interest and HST owning a 25% interest. HST was dissolved in 2010.
In September 2009, we formed a 100% owned subsidiary in Macau, A Power Agriculture Development (Macau) Ltd., China (“APWAM”) (formerly known as A Power Agro Agriculture Development (Macau) Limited). APWAM presently owns 45% of a corporate Sino Foreign joint venture, Qinghai Sanjiang A Power Agriculture Co. Ltd. (“SJAP”). SJAP is engaged in the business of manufacturing bioorganic fertilizer, livestock feed and development of other agriculture projects in the County of Huangyuan, in the vicinity of the Xining City, Qinghai Province, PRC.
On February 28, 2011, TRW applied to form a corporate joint venture, Enping City A Power Prawn Culture Development Co. Ltd., China (“EBAPCD”) (formerly known as Enping City Bi Tao A Power Fishery Development Co., Limited), which is incorporated in the PRC. TRW initially owned a 25% equity interest in EBAPFD. On November 17, 2011, TRW formed Jiangmen City A Power Fishery Development Co. Ltd, China (“JFD”) (formerly known as Jiang Men City A Power Fishery Development Co., Limited) in which it acquired a 25% equity interest, while withdrawing its 25% equity interest in EBAPFD. As of December 31, 2011, we had invested $1,258,607 in JFD. JFD operates an indoor fish farm. On January 1, 2012, we acquired an additional 25% equity interest in JFD for total cash consideration of $1,662,365. On April 1, 2012, we acquired an additional 25% equity interest in JFD for the amount of $1,702,580. We presently own a 75% equity interest in JFD and control its board of directors. As of September 30, 2012, we had consolidated the assets and operations of JFD.
On April 15, 2011, MEIJI applied to form Enping City A Power Beef Cattle Farm 2 Co. Ltd., China (“EAPBCF”) (formerly known as Enping City A Power Cattle Farm Co., Limited), all of which we would indirectly own a 25% equity interest in as of November 17, 2011. On September 13, 2012 MEIJI formed Jiangmen City Hang Mei Cattle Farm Development Co. Ltd., a company incorporated in the PRC (“JHMC”) (formerly known as Jiang Men City Hang Mei Cattle Farm Development Co., Limited) in which it owns 75% equity interest with an investment of $3,636,326, while withdrawing its 25% equity interest in ECF. As of September 30, 2012, we had consolidated the assets and operations of JHMC.
Cross-Listing on the Merkur Market
On January 13, 2016, securities representing beneficial interests in the shares of common stock of the Company, referred to as VPS Shares, began to be traded on the Oslo Børs’ Merkur Market under the symbol “SIAF-ME.” The Company’s common shares continued to trade on the OTCQB under the symbol “SIAF.”
The Merkur Market is a multilateral trading facility operated by Oslo Børs ASA. The Merkur Market is subject to the rules in the Norwegian Securities Trading Act and the Securities Trading Regulations that apply to such marketplaces. These rules apply to companies admitted to trading on the Merkur Market, as do the marketplace’s own rules, which are less comprehensive than the rules and regulations that apply to companies listed on Oslo Børs and Oslo Axess. The Merkur Market is not a regulated market, and is therefore not subject to the Norwegian Stock Exchange Act or to the Stock Exchange Regulations. Investors should take this into account when making investment decisions.
Uplisting to the OTC QX Premier
On January 19, 2016, the Company’s shares of common stock began to be traded on the OTCQX® Best Market in the U.S. under its existing ticker symbol “SIAF.” The Company upgraded to OTCQX Premier from the OTCQB®Venture Market.
The OTCQX® Market is the top tier of the U.S. over-the-counter markets operated by OTC Markets Group Inc. It is reserved for established investor-focused companies meeting high financial and governance standards, and sponsored by professional third party advisors. SIAF has qualified to trade on OTCQX U.S. Premier, for which eligibility standards are higher still. For comparison, as of December 31, 2015, there were 942 companies traded on the OTCQB, 425 companies traded on the OTCQX and 98 companies traded on OTCQX U.S. Premier, of which only 17 are non-bank companies.
With OTCQX admission, OTC Markets Group’s Blue Sky Monitoring Service provides the Company with a customized daily audit of its compliance status in all 50 states. Blue Sky compliance is mandatory for broker-dealers and registered investment advisors to solicit or recommend a security to investors.
U.S. investors can find current financial disclosure and Real-Time Level 2 quotes for the Company onwww.otcmarkets.com.
Emerging Growth Company
We are an “emerging growth company,” as defined in the Jumpstart Our Business Startups Act of 2012. We will remain an emerging growth company until the earlier of (1) the last day of the fiscal year (a) in which we have total annual gross revenue of at least $1.0 billion or (b) in which we are deemed to be a large accelerated filer, which means the market value of our common stock that is held by non-affiliates exceeded $700.0 million as of the prior June 30, and (2) the date on which we have issued more than $1.0 billion in non-convertible debt during the prior three-year period. We refer to the Jumpstart Our Business Startups Act of 2012 herein as the “JOBS Act” and references herein to “emerging growth company” shall have the meaning associated with it in the JOBS Act.
As an emerging growth company, we may take advantage of specified reduced disclosure and other requirements that are otherwise applicable generally to public companies. These provisions include:
We have taken advantage of some of these reduced burdens, and thus the information we provide stockholders may be different from what you might receive from other public companies in which you hold shares.
In addition, Section 107 of the JOBS Act also provides that an emerging growth company can take advantage of the extended transition period provided in Section 7(a)(2)(B) of the Securities Act for complying with new or revised accounting standards. In other words, an emerging growth company can delay the adoption of certain accounting standards until those standards would otherwise apply to private companies. However, we are choosing to “opt out” of such extended transition period, and as a result, we will comply with new or revised accounting standards on the relevant dates on which adoption of such standards is required for non-emerging growth companies. Section 107 of the JOBS Act provides that our decision to opt out of the extended transition period for complying with new or revised accounting standards is irrevocable.
Reverse Split
On November 10, 2014, the board of directors of Sino Agro Food, Inc. approved an amendment to our Articles of Incorporation to effectuate a reverse stock split (the “Reverse Split”) of our common stock, par value $.001 per share, affecting both the authorized and issued and outstanding number of such shares by a ratio of 1 for 9.9. The Reverse Split became effective in the State of Nevada on December 16, 2014. The Market Effective Date of the Reverse Split was December 16, 2014, having been approved by the Financial Industry Regulatory Authority, Inc. (“FINRA”) on December 15, 2014. As a result of the Reverse Split, each 9.9 shares of common stock authorized as well as each such share issued and outstanding prior to the Reverse Split has been converted into 1 share of common stock, and all options, warrants, and any other similar instruments convertible into, or exchangeable or exercisable for, shares of common stock have been proportionally adjusted. All references to common stock have been retroactively restated.
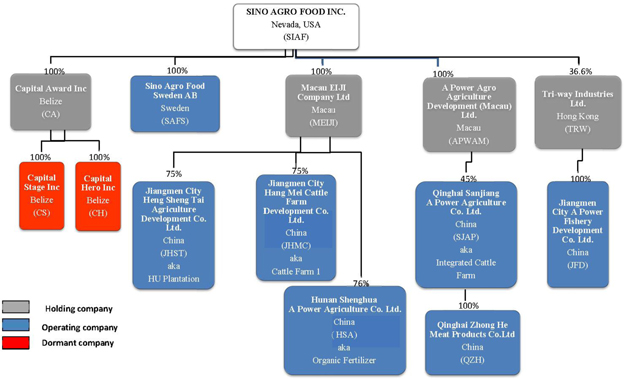
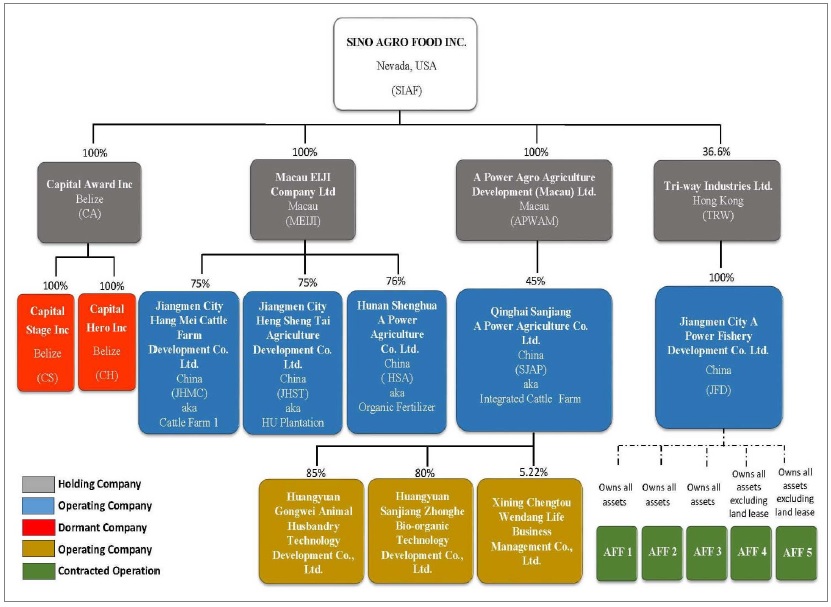
Legal structure
The Company is primarily a holding company whose operations are carried out through its subsidiaries.
The following table sets out information about the entities in which the Company, as of the date of this Annual Report, holds (directly or indirectly) more than 10 percent of the outstanding capital and votes.
The table below sets out a brief description of the companies within the Company as well as the Company’s respective holdings within such companies and their domiciles.
| ||||||
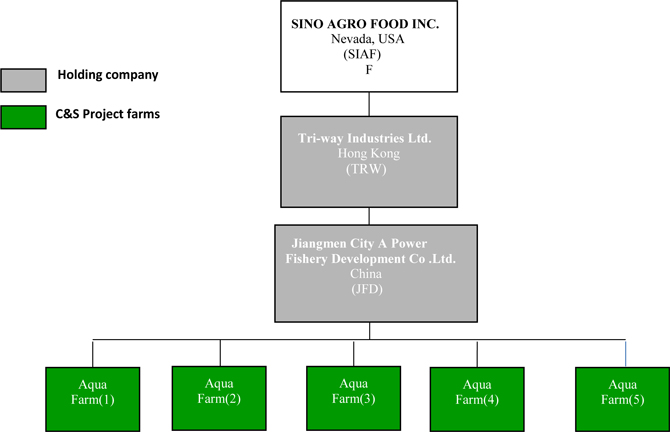
In addition to the legal entities included in the chart and table above, the Company is providing technology know-how with consulting service and turnkey contracting services (“C&S”) to various Chinese owned Project Companies (“C&S Project Company”) which mainly are private companies formed in China with Chinese citizens acting as legal representatives. Sino Agro Food does not have any ownership in these C&S Project Companies. However, in consideration of the Company’s right to protect its technology and know-how granted to the C&S Project Companies, the Company has an option to acquire equity stakes in the future SFJVC at an agreed value equivalent to the project’s development cost. The chart below sets out the various C&S Project Companies in which the Company is currently involved. The maximum equity stake which may be obtained in any C&S Project Company is 75%.
In addition, regarding the investment agreement between QZH and QQI, (i) QQI enjoyed 6% annual interest on its capital contribution, but not any profit distribution; (ii) investment period was 3 years, and (iii) SJAP shared 100% (2015: 100%) on profit or loss after 6% interest payment to QQI and enjoyed 100% (2015: 100%) voting rights of QZH’s board and stockholders meetings.
C&S Project Company
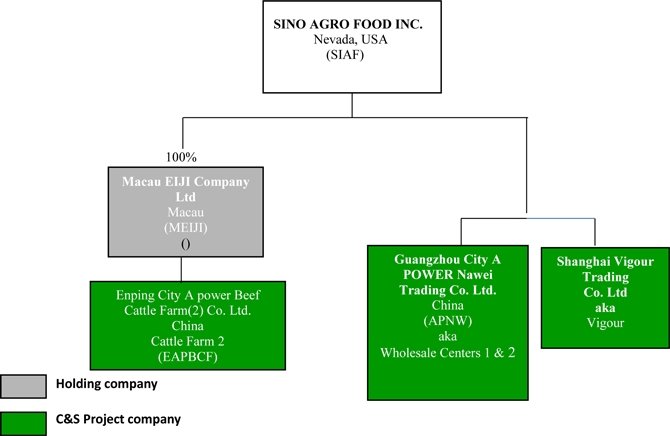
Triway’s Farms
|
|
Business model
The Company works with Chinese investors to form operating companies, in which Sino Agro Food retains the option to acquire equity interest. After a certain period of time and successful operating results, the Company and the Chinese investor may form a Sino Foreign Joint Venture Company (“SFJVC”). Prior to the formal naming, registration, and incorporation of an anticipated SFJVC, the Company prepays a deposit toward the consideration of its future SFJVC stake as a percentage of the assets of the fully developed farm. Upon conversion, the prepayments become equity capital.
The Company oversees financing and provides interoperating strategies, encouraging vertically integrated growth. China has problems with quality assurance in primary production, distribution and poor origin traceability, as well as low food quality. This has created a market where consumers will eventually pay significant price premiums for “BAP (Best Aquaculture Practice) Certified” seafood with brands guaranteeing quality and consistency.
A vertically integrated operation in a fragmented and poorly regulated environment such as in China is the strategy that will yield the most success for the Company. Our presence in retailing and wholesale markets generates market power and provides potential for both margin maintenance and expansion.
Integration into fertilizer and feed production for rearing of beef cattle together with breeding of prawn brood stock help decrease primary production operational risks as well as helping to offset price fluctuations that sometimes occur in raw product input prices.
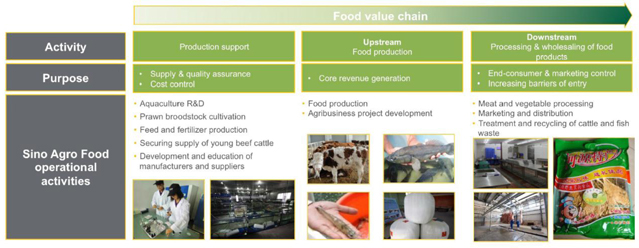
Sino Agro Food uses expertise and know-how in specific agriculture and aquaculture technologies. The Company’s “A Power Re-circulating Aquaculture System” (the “APRAS”) is a proven recirculating aquaculture system (“RAS”) technology for indoor fish farming. Sino Agro Food has developed modern techniques and technologies to grow, feed and house both fish and cattle. These are engineered into the designs of, and the management systems for, indoor and outdoor fishery and cattle farms. Today Sino Agro Food is the world’s largest operator of RAS aquaculture for prawns. In all developments Sino Agro Food acts as the master engineer, pioneering the construction and building of farms, from raw land into fully operational facilities. Sino Agro Food builds the infrastructure including staff quarters, offices, processing facilities, storage, and all related production facilities; then, manages developing of all business activities into effective and efficient operations. Sino Agro Food’s largest customer represents a Company of thirty separate live seafood wholesalers at the Guangzhou wholesale markets.
The Company holds licenses for fertilizer formulas, enzyme patents, and for indoor fish farm techniques, including a “master license” in China for “A Power Technology” (“APT”), a modular land-based fish growing system and technology utilizing RAS.
Sino Agro Food partners with Chinese investors in food projects as a turnkey project manager
The Company engages in projects as a technological and engineering expert, partnering with local and regional investors in food related projects. Sino Agro Food generally has exclusive marketing, sales and distribution rights for each project company. For example, MEIJI purchases all marketable cattle from Cattle farm 2 and distributes them to wholesale markets. Up until September 30, 2016, prior to SIAF becoming an investment associate of Tri-way (i.e. post-carve-out), CA had been purchasing all seafood produced by the fishery farms and also supplied the fishery farms with fingerling, baby or adult fish or prawns and stock feed. Thus, while CA is no longer involved in any sales, marketing and supplies of fishery goods being operated by Tri-way, it will continue to carry out its current contracts with other entities, as well as developing other business ties that are interested in utilizing its services.
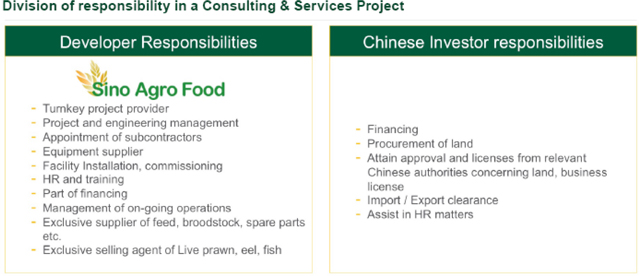
Generally, Sino Agro Food exercises an option to acquire a majority equity stake in the project company once development of the operating company has matured and successful operating results are demonstrated. Prior to acquisition, Sino Agro Food prepays a deposit toward the acquisition consideration of the project company. Upon acquisition and conversion into a SFJVC, the pre-payments together with a cash consideration become equity capital, with Sino Agro Food becoming a major shareholder.
Acquired project companies are operated and managed by the management team and the Chinese investor, and overseen by Sino Agro Food.

Land ownership in China
In China, nearly all land is owned by the Central Government or local village collectives, which grant “usufructuary” rights (i.e., the right to use and enjoy the derived benefits for a period of time) in the form of land use rights. This is similar to “leasehold” land rights in the United States. Corporate entities and individuals may own the property (buildings) erected on Government land. Land use rights may be transferred, but since they are based on agricultural contracts, and cannot be changed arbitrarily to non-agricultural purposes.
Business overview
Introduction
Sino Agro Food is an agriculture technology and natural food holding company with principal operations in China participating in the ongoing transformation of China’s fragmented agrarian sector into a modern food production industry using sustainable and profitable methods. Sino Agro Food focuses on seafood and beef production with integrated wholesale distribution. The Company acquires and maintains equity stakes in a cohesive portfolio of companies that Sino Agro Food forms per its core mission to produce, distribute, market and sell natural, sustainable protein food and produce, primarily seafood and cattle, to the rapidly growing middle class in China.
Sino Agro Food employs a strategy of vertical integration from primary production through processing, distribution and marketing of high quality, organic food products in the food value chain. China’s fast growing middle class is creating rapidly rising demand for gourmet and high-quality protein food. The Company’s core products are live prawns, live finfish, whole beef cattle and packaged beef meat.
The Company’s operations and strategy are executed through severala number of subsidiaries located in China, and the Company contributes financial oversight and strategic direction to otherwise independent management teams which employ the Company’s intellectual property and proprietary methods within aquaculture, beef cattle rearingmethods.
The Company has been severely impacted by the effects of COVID-19 “Pandemic 2020”, which effects continue to this day as such presently the Company is no longer a fully reporting company and productionhas dropped from quoting on OTCQX to OTC Pink sheet from September 2020 onward due primarily to the Company’s auditors, which are located in Hong Kong, have been unable to do on-site inspections of organic fertilizer.the Company’s operations in China due to COVID-19 restrictions to complete the audit of 2019 and 2020. So Basically SIAF is delinquent in its Form 10-Ks for fiscal year end 2019 and 2020, Form 10-Qs for periods ended March 31, 2020, June 30, 2020, September 30, 2020, and March 31, 2021. It will need to amend and restate filings going back to December 31, 2019 to be able to apply to become a fully reporting company.
The aggregate market value of the voting stock held by non-affiliates of the issuer on June 16th 2021, based upon the $0.086 per share closing price of such stock on that date, was in round figure of $5,118,413.00.
There were 60,356,776 shares of our common stock issued and outstanding consisting 59,516,423 free trading shares and 840,353 restricted shares as at June 16th 2021.
Sino Agro Food has enjoyed strong growth sinceIn Fiscal year ended 31.12.2020 the Company’s strategy is to manage and operate its businesses under three (3) business divisions or units on a standalone basis and to generate revenues and incomes from the consolidated results of operations as follows:
Business (1): The Fishery Division is operating under Capital Award Inc. (CA), a fully owned subsidiary of the Company, initiated itswith major activity in providing engineering consulting and services and technology, fishery developments global (excluding China) and agriculture developments global.
Business (2): The Corporate and Other Division is operation under the corporation’s business activitiesoperational teams consisting staff members from CA as well as from SIAF’s Guangzhou office, with major activity in trading (importing) of agriculture food commodities and frozen food products that are marketed and sold in China in 2006. Duringand the fiscal(exporting from China) of agricultural plants and equipment to South Africa.
Business (3): The Leasing and Sub-contracting Division of the following operations:
(a). The fertilizer manufacturing and piggery operation of HSA (Hunan Shenghua A Power Agriculture Development Co. Ltd.)
(b). The plantation operation of JHST (Jiangmen City Heng Sheng Tai Agriculture Development Co., Ltd)
(C). The cattle (Asian Yellow Cattle) of MEIJI (Macau Eiji Company Limited) and JHMC (Jiangmen City Hang Mei Cattle Farm Development Co., Ltd.)
In Fiscal year of 2016,ended 31.12.2020 the Company’s consolidated revenues amountedstrategy is to USD 343 million. The four principal factors that have enabled the growth are:derive from investment incomes generated from two (2) investees’ unconsolidated results of operations as follows:
(i). Cattle, Beef, Fertilizer & Livestock’ and Feed operations of SJAP
(ii). Fishery Development (China) and operations of TWL (or Twi-way) (Tri-way Industries Limited HK)
Please find our company’s legal structure chart listed below;
A summary of each business division and operations is described below:
| · |
Capital Award generates revenues from providing engineering consulting services as turnkey contractors to owners and developers of fishery and agriculture projects that are being designed and engineered into turnkey contracts by Capital Award globally (excluding China) using its A Power Module Technology Systems (“APM”) for fishery projects’ developments and using other agricultural technologies, knowhow and patents expanded from the development of SJAP for agriculture development projects globally as follows:
Sino Agro Food provides consulting
(A). Engineering and servicesTechnology Services; via Consulting and Service Contracts (“CSC’s”) for the development, construction, and supply of plant and equipment, and management of fishery (and prawn or shrimp) farms and related business operations. From January 2020 up to several private Chinesethe date of this annual report CA has not been able to do any fishery project or fishery project development due to the effects of the Pandemic COVID-19 as such, there was no revenue generated from January 2020 to May 31st 2021. However, the Company and CA have been exploring other possible business opportunities during the period and SIAF became the joint venture partner of the China Africa Joint Chamber of Commerce and Industries (CAJCCI) which is a non-profit organization established in November 2016 by the China and Africa Governments to plan and to implement agriculture projects and related developments in Africa through development fund of US$60 Billion every three years provided by and granted by the China Government to Africa Nations in Agriculture industry projects and developments etc. In March 2021, development project papers in (i). Development of Trading of exporting dried cassavas to China and exporting of plant and equipment from China to Madagascar and developments of cassavas plantations and related value added processing and drying of cassavas on 100,000 acres of land in Madagascar and (ii). Development of goat farms and related value added processing in Madagascar were submitted to CAJCCI and Government of Madagascar; by early May 2021, both CAJCCI and the Government of Madagascar gave consents to both projects such that we have obtained official invitation to go to Madagascar to initiate the Projects subjecting to the Pandemic COVID-19 situation and conditions will be improved and controlled, we shall have our team members (including various professionals and professionals from CAJCCI) to assist our current Madagascar management teams of two members in Madagascar to start up the Projects.
(B). Seafood Sales from CA’s projected farms; became a discontinued segment of operations from October 5, 2016 when Tri-way was disposed to other third party companiesparties in term Tri-way was reclassified as an unconsolidated equity investee on same date.
| l | Corporate & Others Division refers to the trading segment of business operations of the Group named internally under corporate division of Sino Agro Food, Inc., including import/export business and consulting and service operations provided to projects that are not included in the above categories, and not limited to corporate affairs. Over the years up until end of fiscal year 2019 the corporate division imported mainly live seafood from South Africa countries, Vietnam, Thailand, Russian and other nearby countries and frozen beef from Australia and South America countries; however it is due to the interruptions and adverse impacts caused by the Pandemic COVID-19 made it impossible and unprofitable to continue the imports of live seafood, and the poor political relationship between China and Australia in 2020 induced high risks on the imports of Australian beef. The Corporate’s trading division based on standalone figures ended up with a loss of over $1.6 million as at 31.12 2020. However, over the years the Company has built up a strong base of connections and customers in China that provides an unique opportunity to the Company to develop an additional Trading Platform aiming to generate additional revenues, profits and most importantly positive cash flows, so from July 2020 onward, the corporate division started to explore the opportunities of importing some of the China markets’ niche products and managed to start to import from March 2021, frozen chicken (that China imports millions of metric tons annually) and pork products (that China has been in shortage since the pandemic of European Swine Diseases occurred in 2018 disrupted the domestic supply of pork estimated until year 2026), from Brazil, USA, Argentina and other South America countries and (ii). Dried agriculture products (i.e. Dried Cassavas that has vast industrial and consumable food processing applications, that China has an annual short fall of over 4 million MT; peanuts, cashew-nuts, Soybeans that China imports multiples of millions of MT annually, etc.) from South Africa Countries (i.e. Madagascar, Ghana, Nigeria and Cote D’lovire etc.) and Brazil. Although in so far the Company achieved minimal financial impacts, (please refer to a standalone Q1 2021 income statement of the Trading division attached in the later Chapter named Subsequent events). During months of venturing into this trading activity, we experienced many teething problems and obstacles especially with the supplies of the said commodities affected mainly by the said Pandemic situations causing much stringent and constant changes of importation regulations requiring much tougher importation and cargoes release conditions and procedures, précised timely and orderly documentary presentation with the China custom authority and extremely tight controls domestically disorientated all arrangements with domestic cold storages and logistic operations etc. resulting in inconstancy of the supplies and untimely deliveries etc. Disregarding all of these difficult consequences and hardship, the Company feels that persistence, tolerance and with time, the trading division will prevailed leading the Company into a positive cash path targeting encourage performances to show starting from the early quarter 1 of fiscal year 2022. ’ |
Leasing and subcontracting Division:
Over the years, there has been significant capital expenditures (CPE) and working capital (WC) required for and employed on the developments, expansion and operations of the minor operational activities that we managed to construct and operate primary production facilities for fish, prawnfund while our two core businesses (in the Cattle and beef cattle,of SJAP and the Fishery of CA) were generating sufficient cash flows and incomes, however after the collapse of the SJAP’s business from 2016 and the poor performances of the Mega farms from 2017 (“Crises”) for reasons mentioned in the earlier chapters and the previous Ks and Qs reports, the Company is no longer in the position to support and to finance the growth of these minor operational businesses in the way as wellthey were before the Crises, therefore in order that capital spending could be kept within an affordable level, the Company decided to lease and sub-contract the following operations to their respective operational managements from 1st October 2019 as wholesale marketingsuch there are no sales revenue and distribution centers. As part of its consulting and service agreements, Sino Agro Food has the option to acquireincome derived from these operations to expand Sino Agro Food’s proprietary productionbut leasing and wholesaling capacity.sub-contracting revenues and incomes thereon.
| l | The operation of Hunan Shenghua A Power Agriculture Co. Ltd. (“HSA”) is in manufacturing and sales of organic fertilizer. From 1st October 2019 the Company contracted out its manufacturing and sales of organic fertilizer to its operational management; as such income of HSA is derived mainly from said management contract. Historically, HSA was developed to enhance more sales and profits of SJAP’s fertilizer due to the availability of a direct cargo train service between Xining and Hunan having a station within close proximity to HSA’s operation site and Hunan is a strong agricultural province producing big quantity of rice, tobaccos, tea and multiple varieties of produces that requires large quantity of fertilizer (especially in organic fertilizer due to the Government’s direction to phase out the application of chemical fertilizer in China). During the period of developing HSA’s business it was discovered that Hunan is big in aquaculture having many and large areas in natural fresh water lakes where aquaculture of fresh water fish is a dominated industry, as such HSA developed a water soluble organic fertilizer specially applied for and by the lake fishery farms to provide nutrients to the water plants and micro-organism for the sea animals etc. Although it was an excellent product but aging receivables were always a big problems to HSA with the fishery operators, the constant up-keeps and replacements of new production plants & equipment and the forever requirement of expending working areas and buildings to keep up with the productivity and the long (i.e. over 60 days) period of fermentation of raw materials required huge capital funds (both in CPE and WC) that the Company was not able to supply consistently and that was why HSA hasn’t reached its ultimate potential of becoming a multiple millions MT per year producer. However HSA has a block of leased hilly land of 450 Chinese Mu, in which HSA developed 50 Mu originally for a cattle station that was changed into a piggery (with the capacity to hold 4,000 pigs at a time and producing 10,000 heads of pigs per year) in 2017 after the collapse of the local cattle industry. It was necessary to cut half of the hill in the said 50 Mu to get enough leveled land to build the said piggery, then it was discovered that the 450 Mu land consisting many fine sand hills. From 2018 onward the China Government stopped most of the sand mining operations in the country so all of a sudden fine construction sand became a valuable commodity with 2019’s averaged prices (of RMB245 / cubic meter or m3) jumped more than 12 times of 2017’s averaged prices. As such HSA is sitting on a block of valuable property. But sand mining is restricted by the China Government Regulation so it is impossible to obtain any sand mining permits. By September of 2020 the Company strategically designed a business plan for HSA to expand its piggery to produce 200,000 head of pigs per annual using and developing the whole of said 450 Mu that will be financed ultimately by the fine sand recovered from said development’s leveling activities. In this aspect, the related Project’s business plan (including all feasibility, viability and environmental studies) have been prepared with approaches and dialogues have been made with a number of China owned entities aiming to attract enough investors to finance the Project as soon as possible. Although currently the Pandemic effects hinder many businesses’ decisions making it difficult to predict any tangible schedule for this Hunan Project, however, our management team members are working diligently on it hoping that soon a clearer road will be opened to allow them to pick up momentum on the Project. |
Revenues are generated from activities that are divided into five stand-alone business divisions:
| l | Plantation Division refers to the operations of Jiangmen City Heng Sheng Tai Agriculture Development Co. Ltd. (“JHST”) in the HU Plantation business where dragon fruit flowers (dried and fresh), crops of vegetables and immortal vegetables (dried) are sold to wholesale and retail markets. JHST’s financial statements are consolidated into the financial statements of Macau EIJI Company Ltd. (“MEIJI”) as one entity. From 1st October 2019 the Company contracted out its plantation operation to its operational management; as such income of JHST is derived mainly from said management contract. Over the years, the Company has tried many means to increase the performances of the plantation (of 1,250 Chinese Mu) but failed due mainly to the plantation is situated in an area subjecting to heavy rainfalls yearly that induced root diseases to the dragon fruit plants stopping the yield of flowers. 1,250 Mu plantation is too small for growing of other selective fruit plants except for the growing of cash crops (i.e. seasonal vegetables etc.), however growing of cash crops is labor intensive, so with the forever increases of labor and operation costs in China and the seasonal unpredictable sales prices of cash crops, managements of the Company has yet to find a suitable solution for JHST but keep on trying hoping that eventually a perfect solution will surface to revitalize JHST. In the meantime leasing and contracting JHST ‘s operation to its existing operational management will limit the Company’s financing exposure in both CPE and WC requirements from JHST. |
| l | Cattle Farm Division refers to the operations of Cattle Farm 1 under Jiangmen City Hang Mei Cattle Farm Development Co. Ltd (“JHMC”) where cattle are sold live to third party livestock wholesalers who sell them mainly to Guangzhou and Beijing livestock wholesale markets. The financial statements of JHMC are consolidated into MEIJI as one entity along with MEIJI’s operation in the consulting and service for development of other cattle farms (e.g., Cattle Farm 2) or related projects. From 1st October 2019 the Company contracted out its cattle operation to its operational management; as such incomes of JHMC are derived mainly from said management contract. JHMC’s business strategy in 2018 of changing into fattening of the Asian Yellow Cattle instead of the fattening of conventional breed of cattle (i.e. Angus and Simantals etc.) proven to be a good strategic change increasing revenues and incomes each year ever since. However this cattle operation is too small (with. Cattle Farm 1 and 2 operate on 500 Chinese Mu) coupling with the increasing of land and development costs making it extremely difficult for the Company to finance its expansion plan at the moment as such by leasing and contracting JHMC’s cattle operation to its existing operational management will provide the Company with a small but steady incomes each year and will limit capital funding to JHMC until such time the Company is in a better financial position to consider JHMC’s expansion plan. |
| 2. | The Investees |
SJAP: Qinghai Sanjiang A Power Agriculture Co., Ltd
TWL (or Tri-way) Tri-way Industries Limited: lA fully integrated live fish, shrimps and seafood business from 2010 starting operation with one small in door and on land farm in Enping District Enping City and by 2015 the Company developed and started operations of 4 small to medium sized indoor as well as open land farms in Enping districts Enping City and Zhongzhen Districts Zhingzhen City that we called Aqua-Fish Farm (or AFF) 1, 2, 3a and 3 b producing and marketing over 5,000 (Metric Tons, MT) of live fish, shrimps and seafood per annual under its developed brood stock stations, nursery farms, grow-out farms, R & D stations, wholesale centers, restaurants and marketing net-works etc. and providing aquaculture engineering services to and activating trading relationship with 8 corporative farmers and their related farms. Apart from AFF 1 that the Corporation had 75% equity interest whereas the rest of the aqua-farms (AF2, 3a and 3b) were operated by different China incorporated entities (in accordance with the China Company regulation that operational companies must be registered in the districts where their core-operation are based) and owned by unrelated third parties consisting of various farm developers, suppliers, core farms’ operators, workers and farms’ investors etc. Whereby the Corporation has an executive marketing and sales Contract with all AFFS to market, purchase and sales all of their respective productions derived into one of the Corporation’s main sources of incomes. At the same time in 2015, the Corporation accepted the Zhongshan Government’s invitation to developed aquaculture fish and shrimps farms in a block of leased land measuring over 3,700 Chinese Mu (equivalent to about 650 acres) that was leased from a company owned by the Zhongshen Government whereas the land lease agreement was executed and secured by a newly formed company incorporated at Zhongshen City namely Zhongshen City A Power Agriculture Development Limited Co. (ZSAPADL); whereas the ZSAPADL is the operational company of the Zhongshen Project and owned by a local company and a Hong Kong Company (that are ultimately owned by various third parties consisting of investors, developers and farm operators etc) and SIAF’s fully owned subsidiary CA is its development’s turnkey contractor, engineering services provider, sole marketing and sales agent with the option to purchase and to sell its developed farms’ productions. In the land lease agreement, the land was allocated gradually ZSAPADL as and when respective earlier lease holds to other farmers are expired such that there was a total of 1,350 Chinese Mu (equivalent to about 225 acres) available for Phase (1) of the Project’s developments as of year 2015, however during 2018 and 2019, 250 Chinese Mu were given back to the local Government by ZSAPADL for the constructions of highways and a Wet-Land Project involving part of the Project land netting about 1,100 Chinese acres (or the equivalent of less than 200 acres of the Project land available for project developments currently). This particular project’s developments are planned over 10 years in multiple phases and subsequent stages etc. with construction to start in 2015 and operation incomes to be generated from sometimes in 2017 aiming annual production over 100,000 MT by end of year 2025. By the mid-year 2017, we completed almost 85% of the development of two indoor APRAS farms (APM farms) each measuring 9,000 m2 totaling to 18,000m2 of building areas on a block of land of 60 Chinese Mu (equivalent to 10 acres) and 165 open APRAS dams (ODRAS) on about 990 Chinese Mu (equivalent to about 165 acres) of land (Phase 1 stage 1 development) that we called the “Mega Farm” or Aqua-farm 4 & 5 (AFF 4 & 5). In 2016 The Company’s carve-out of Tri-way resulting in categorization of Tri-way as an Investor in Associate from a subsidiary status. As such, the Company’s fully owned subsidiary namely, Capital Award Inc. a company incorporated in Belize City, Belize (CA), retained its main business activity in the sector of technology and engineering consulting To complete the transformation of Tri-way From October 5th 2016 we brought out the remaining 25% equity interest in “Jiangmen City A Power Fishery Development |
Aquaculture division
9
CA has enteredWe announced our (good will) intension with the approval of Tri-way’s management of distributing 18.3% of Tri-way equity interest (about half of SAIF’s holding) from our 36.6% equity interest to our shareholders and completed several CSC’s (i.e.prepared a F1 for filing to SEC accordingly sometimes in 2018 . However complication of USA taxation was one of the Fish Farmmajor issues that have not been resolved and at that time period Mr. Dan Ritchey was our CFO responsible for the said distribution of Tri-way shares but he passed away on December 1st 2018 as such we were searching for JFD,a new CFO and consequently, Mr. Solomon Lee (I) serves as the Prawn Farm 1Company’s interim CFO that enhanced the delay in processing said distribution of Tri-way shares to SIAF’s shareholders. Also 2019 was a traumatic year for EBAPCDthe Corporation having lost the services of our most brilliant CFO, our long time independent directors namely Mr. Nils Erik Sandberg and Mr. Anthony Soh who have been serving our Corporation since 2010, the recruitment and reappointment of new directors and audit committee members in Mr. Colanukuduru Ravindran and Mr. Muson Cheung, the reorganization of the Corporation’s other segmental operations; The Corporation’s common stocks were delisted from the Merkur Market (OSLO) from September 10th 2019, On September 30th 2019, the Company contracted out the following businesses’ operations to the existing management of the corresponding operations: (i). SJAP’s integrated cattle activity to Mr. Zhao Y L, the legal representative and MD of SJAP, (ii). HSA’s manufacturing of fertilizer to Mr. Lee Ping the existing manager of HSA and (iii). JHST’s plantation operation and MEIJI’s cattle operations to Mr. Fang Zhi Jun, the existing manager of both operations, On September 30th 2019, Mr. Solomon Lee resigned as the Chairman of SJAP resulting in categorization of SJAP as an Investor in Associate from a subsidiary status, the preparation of S1 and S4 for the IPO exercise of 2 million G Series Preferred Shares of the Corporation to be listed on the OTCQX Market and the Fish Farm 2 for Gao Aquaculture with developmentDerivative Complaint of Heng Ren and construction work stillCo. etc. that involved lots of extra costs in progresstime, money and human resources of the Corporation such that it was not practically possible to carry out said distribution of Tri-way shares in 2019. Year 2020 is another disaster year for the PrawnCorporation due to the COVID-19 Pandemic incurring losses in excessive of $100 million (which is an earlier estimate subjecting to final derivation of the segmental accounting departments)
Similarly Tri-way experienced extremely poor operational performances from its Mega Farm (AFF 4 & 5) and its incomes in 2017 to 2019 were generated mainly from the operations of AFF 1, 2 at Xin Hui District, 3a & 3b and other sub-contracted farms:
In fact, the operation of the Mega Farms (AF4 and AF5 and the Prawn Farm 3ODRAS dams) had a poor start and Prawn Farm 4 at San Jiao Town Zhongshan for ZSAPP.
Priorperformed badly in 2017 and by the first half of 2018 and the end of 2018, their operations (under their operation company ZSAPADL) incurred debts over $4.5 million and $4 million respectively, due primarily to September 30, 2016, CA was the sole marketing,i). Unsuccessful management coordination resulting in low productivity and sales and distribution agentof products, (ii). Over spending on capital expenditure on Phase (1) Stage (1) of the APRAS fisheryMega Farm Project which exceeded the original budget of $50 million by more than 60%, as a result, it limited available cash-flow to support the needs of working capital that affected the overall production and prawn farms. CA had purchasedsales leading to, there were not enough funds to complete some of the supporting facilities needed by the APM farms (i.e., the external filtration systems, lighting, electrical wiring, external drainages for waste water and connection and fitting for the supply of fresh water etc.), supporting external water dams and waste water treatment dams, the heating facility and part of the internal filtration systems that made it difficult for the farms to carry out their production efficiently, (iii). The production operation of the Mega Farms started prematurely before all marketablethe completion of their construction & development works, (iv) The two APM farms are the biggest indoor farms that we have ever built, and we didn't have enough experienced personnel to support their operation, (v). Guangzhou experienced a very hot summary in 2017 that killed and retarded many stocks in the open dams (ODRAS dams) and one of the big typhoons during August 2017 caused flooding that washed away hundreds of tons of fish and prawn fromprawns in the farms, and then sold them to wholesale markets. CA also suppliedopen dams that would have been ready for harvest in September & October of 2017. Also, the farms with fingerlings, baby or adult fish or prawns, andextremely strong Typhoon in September 2018 caused power stoppage that killed hundreds of tons of stock feed. CA generated revenue from the sale of seafood bought from farms that either had been Company subsidiaries or C&S Project Companies.including some valuable brood stock.
However, since then, Tri-way has acquired all of CA’s C&S relationships with its project farms (i.e. PF1, PF2, PF3 and PF4) and SIAF has reduced its controlling interest in Triway to 36.6%, such that Tri-way, the subsidiary, is categorized as an “investment in associate” holding of SIAF, constituted by SIAF’s deemed disposal of equity interest in the subsidiary.
Integrated Cattle Farm division (SJAP)
Operated by SJAP, the Integrated Cattle Farm division is the business unit of Sino Agro Food active in beef cattle rearing and value added processing of domestic and imported beef meat. Revenue for fiscal year ended December 31, 2016 was USD 134.6 million or 49.7 percentAugust 2019, efforts of the Company’s total salesCompany and Tri-way trying to revitalize Aqua-farm 4 and 5 failed due primarily to the lack of goods revenuecapital funding to continue to support farms’ developments and the necessity in adding new talents into the existing management teams to carry out the revitalization works, the Company and Tri-way finally decided to cease operation of USD 270.8Aqua-farm 4 and 5 during September 2019. Again the COVID-19 Pandemic of 2020 is a complete write-off for AFF 1, 2,and 3 as well as to Tri-way’s sub-contracted farms incurring losses over $77 million infor the same period. Gross profit for SJAP inyear (subjecting to final figures of their respective accounting departments) due completely to the fiscal year ended December 31, 2016 was USD 33.7 million, or 56.9% percentimpacts of the Company’s total gross profit in salespandemic causing all farms to stop work for over 7 months without sufficient workers, feed, supplementary, medications, transportation and maintenances etc. to keep the live stocks going and they all died during the period calculating to multiple million pieces (equivalent to multiple of goodsthousand metric tons). It will cost over $80 million and a minimum of USD 59.2 million intwo years to replace said live stocks. As such Tri-way’s current operations are concentrating on rebuilding of brood stocks, the same period.production of fingerling and nursery stocks and repairing the damages etc. It is anticipating that under current conditions, the Triway’s fishery operation recovery will be a tall order and will take a long period before recovery.
10
WithinThis section discusses the beef cattle farm division,industry in which the Company appliesoperates. Certain of the information in this section relating to market environment, market developments, growth rates, market trends, industry trends, competition and similar information are estimates based on data compiled by professional organizations, consultants and analysts, in addition to market data from other external and publicly available sources.
Economic outlook in China
China’s economy is at present second only to that of the United States. Due to the impact of the COVID19 pandemic, China's GDP growth was only 2.3%, the slowest pace in more than four decades. Growth has slowed significantly following the COVID19 outbreak in early 2020. Based on the World Bank’s classification, China has had a co-operative farming model creatingremarkable period of rapid growth shifting from a centrally planned to a market based economy. Today, China is an intermediary supply pipelineupper middle-income country that has complex needs for all kinds of consumer goods, including food.
Agriculture in China
Agriculture is a vital industry in China, employing over 300 million farmers. China ranks first in worldwide farm output, primarily producing rice, wheat, potatoes, tomato, sorghum, peanuts, tea, millet, barley, cotton, oilseed and soybeans and also the largest consumer of many agricultural products, such as pork, rice and soybeans. Although accounting for only 10 percent of arable land worldwide, it produces food for 20 percent of the world's population. While China generally has been successful in meeting its rapidly rising demand for food and grains by increasing domestic production, it has emerged as a leading global importer of several agricultural commodities, including cotton, soybeans, vegetable oils, and animal hides. As its domestic agricultural production has grown, China has also become the largest exporter in global markets for several horticultural products, including mandarin oranges, apples, apple juice, garlic and other vegetables.
China’s increasingly important position in global agricultural markets followed decades of gradual growth in domestic food production and consumption. After the introduction of market-based reforms in 1978 that included the elimination of the collective production system and relaxation of government direction over certain farmer production and marketing decisions, Chinese agricultural output grew significantly. Between 1978 and 2008, China almost doubled its production of grains (rice, wheat and corn) and quadrupled its production of meats; the production of fruit and milk was about 30 times greater in 2008 than in 1978. During these three decades, population growth of about 1 percent annually, coupled with annual per capita income growth of eight percent, fueled a large increase in demand for more and higher-value agricultural products, especially by China’s large and growing middle class. China’s rapid growth in food consumption was largely met by domestic production growth, enabling it to ramp upremain self-sufficient in most major commodities. However, China is also now the world's largest agricultural importer, surpassing both the European Union (EU) and the United States in 2019 with imports totaling $133.1 billion.
China’s support for agriculture
China’s government support for agriculture is low compared to that of developed countries, such as the United States and European Union, but in line with that of other rapidly growing economies, according to USITC. As measured by the OECD’s PSE1, the amount of support provided to Chinese farmers was low (and sometimes negative) during the 1990’s, but gradually rose during the period 2008-2010. Compared with other countries at a similar level of development, including Brazil, Mexico, Russia, and South Africa, China’s support for farmers falls in the middle of the range. China’s PSE reflects changes in the central government’s policy priorities from grain self-sufficiency and low consumer prices toward a stronger focus on raising farm household incomes, according to USITC. Government support to China’s agricultural sector indicates that Chinese policymakers are placing a renewed emphasis on the rural economy. Indirect support, in the form of general services, is very high relative to similar support programs in other countries, due largely to investments in agricultural infrastructure. General services include modern research and extension services, food safety agencies, and agricultural price information services, most of which provide benefits to producers and consumers throughout the economy. Compared with direct payments to farmers, general services support is less production-distorting to the sector.
Agricultural consumption
China is a major global consumer of agricultural products. It consumes one-third of the world’s rice, one-fourth of all corn, and half of all pork and cotton, and it is the largest consumer of oilseeds and most edible oils. The traditional Chinese diet centers around staple foods (mainly grains and starches), which account for nearly half of the daily caloric intake. Average Chinese per capita consumption recently stabilized at approximately 3,000 calories per day, one of the highest levels among Asian countries.
Chinese food consumption is influenced by factors such as population size and demographics, income, food prices, and general preferences. Per capita income growth and urbanization are the two factors most responsible for altering recent consumption patterns in China. Rising income translates into higher per capita food consumption, while increasing urbanization is driving diversification of food choices because of greater availability and choice offered through increasingly diverse sales outlets.
Chinese consumers generally fall into one of three categories: rural consumers; urban low-income consumers; or urban high-income consumers. Although urban high-income consumers can afford to buy more and better-quality food, the ubiquity of food outlets in cities means that nearly every urban resident, regardless of income, has available an increasingly diverse food selection. Compared to rural diets, urban diets contain less grain and more non-staple items, including processed and convenience foods. Rural migrants to cities tend to adopt the urban diet.
Expenditure on food
Food is the largest class of household expenditure for all Chinese income groups; even housing takes a smaller share of average household income, according to USITC. As income rises, the absolute amount of food expenditure increases, although the share of income spent on food falls. Urban residents spend substantially more on food than their rural counterparts, according to USITC. Higher incomes lead to an increase in both the quantity and quality of food demanded. However, while demand for higher quantities of food appears to level off in the top income households, demand for higher-quality foods continues to rise with income.
The market for aquatic products and aquaculture in China
The information in this section regarding aquatic and aquaculture, including graphs, is taken from the USDA’s GAIN Report Number: CH12073 per 12/28/2012 unless otherwise stated.2
1OECD: PSE is defined as the estimated monetary value of transfers from consumers and taxpayers to farmers, expressed as a percentage of gross farm receipts (defined as the value of total farm production at lower marginalfarmgate prices), plus budgetary support.
2Definition of terms: China’s definition of aquatic products includes both cultured (farm-raised) and wild caught products; aquatic products include fish, shrimp/prawn/crab, shellfish, algae, and other. Aquatic catch production is total volume of both fresh and seawater wild caught aquatic products; Aquaculture production is the total volume of both fresh and seawater cultured (farmed) aquatic products. This report will use Chinese terminology to maintain consistency between Chinese statistics and product categories. Total aquatic trade statistics below do not include fishmeal.
Total Aquatic Products Production
China has the world’s largest aquatic production and its market share of the world’s fish production has risen from 7 percent in 1961 to 37 percent by 2012. China alone accounted for 62.5 percent of the aquaculture production in the world by volume in 2015. Aquaculture represents more than 71.9 percent of the total fish production in China. Total 2015 aquatic production in China increased 4.38 percent to reach 47.9 million tons, compared to the 45.8 million tons in 2014, per the FAO.
Fish production accounts for 59 percent of the total aquatic production, followed by shellfish and crustaceans at 22.6 percent and 10 percent, respectively. Fish production is, according to the USDA, expected to continue its upward growth trend to reach 34.5 million tons in 2012, up from 33 million tons in 2011 and 31.3 million tons in 2010.
In 2011, Shandong, Guangdong, Fujian and Zhejiang provinces profited from favorable coastal locations and abundant freshwater resources/facilities to rank as the top four aquatic production areas. In terms of freshwater cultured production, Hubei, Guangdong, and Jiangsu provinces are the largest producers.
According to @2020 undercurrent news, China’s seafood imports increased by 39% to $15bn in 2018. China has the largest aquaculture industry in the world, accounting for approximately two-thirds of total cultivated aquatic products worldwide. In 2020, output of the Marin culture segment in China is estimated to total 22.3 million tons, up 4.7% from 2019.
The market for meat in China
China is by far the world’s largest producer and consumer of meat which includes pork, poultry and beef. Historically, this situation did not have a large impact on the rest of the world, as China, for the most part, maintained self-sufficiency in meat. However, since 2007 the situation has changed dramatically. China has gradually turned into a net importer of meats. In 2019, China consumed around 28% of the global meat supply.
World meat production was 340 million tons in 2017.3 Global trade in meat is projected to be 20% higher in 2027, representing a slowing down of meat trade growth to an annual average of 1.5% compared to 2.9% during the previous decade.4 Meat imports into Asia account for 56% of global trade, and poultry will constitute more than half of this additional import demand. China’s meat production reached 86.60 million tons in 2018, where total meat production in the United States amounted to 47.06 million tons in 2018.
With strong economic growth and the improvement of living standards, the demand for beef in China is rising.5 China’s animal feed market is projected to grow at a CAGR of over 16% till 2019.6
3Review of Recirculation Aquaculture System Technologies and their Commercial Application, Stirling Aquaculture, Institute of Aquaculture.
4 Food Outlook, FAO, November 2018
5 Research Report on Beef Import in China, 2019-2023
6 China Animal Feed Market Forecast and Opportunities, 2019
There are several other specific market drivers which underpin the increase in demand for red meat. One driver is the improved living standard in China which stimulates the growth of beef markets since beef often sells at a much higher price and traditionally has been more expensive than what most people can afford. Another is the fact that Chinese people’s dietary structure is becoming more diversified and reasonable, bringing larger amount of beef consumption since beef has nutritional benefits. Lastly, a gradual lowering of import taxes is likely to support sufficient supply of cattle.
Feed grain prices are projected to remain low during 2018-2027. The year 2017 was affected by numerous outbreaks of Avian Influenza (AI) around the world which resulted in a slower increase in world output. China, the second largest producer after the United States, was particularly affected by several outbreaks over the last years. Thus, China can expect a return to historical trend growth in poultry production from 2018 onwards. Globally, the share of meat output traded is expected to remain constant at around 10%, with most of the increase in volume coming from poultry meat. The projected production growth in developing countries remains insufficient to satisfy demand grown, particularly in Asia and Africa. As a result, import demand is expected to remain strong.7
Market drivers
The improvement of living standard stimulates the growth of beef markets:
Traditionally, Chinese people eat pork and chicken to satisfy their desire for meat. This is largely due to the much higher price of beef which goes beyond normal people’s affordable level. With the improvement of living standards, Chinese people have begun the upgrade of their consumption of meat, and began to eat more beef.
Chinese people’s dietary structure becomes more diversified and reasonable, bringing larger amount of beef consumption:
At present, Chinese people are changing their diet patterns to higher and richer nutrition. From a nutritional perspective, beef not only contains high unsaturated fatty acids and high protein, it also has low fat and lots of nutrition, which makes it perfect for the healthy diet. Thus, in the future, beef is expected to replace some parts of the market shares in pork, chicken and other meats.8
The market for fertilizer in China
Sales of fertilizers are expected to be supported by healthy expansion of agricultural activities as the amount of sown areas continues to grow and rural income levels rise. Farmers will continue to register steadily increasing incomes, the result of growing crop prices and government subsidies designed to supplement their revenues and reduce their material costs. Subsidies aimed directly at cutting the cost of fertilizers is expected to its operations.encourage additional use. In addition, rising crop prices have encouraged farmers to invest in fertilizers to further boost crop yields. Advances will also be driven by increases in the acreage of sown land dedicated to growing cash crops. However, increasing demand for organic food and improved understanding of the correct application of fertilizers is expected to prevent demand from rising at a faster pace.
7 Meat - OECD-FAO Agricultural Outlook 2018-2027
8 Frost & Sullivan: China’s beef market has great growth potential
In value terms, fertilizer demand is expected to grow from over $195 billion in 2016 to over $245 billion in 2020.9 Faster value growth will be driven by strong demand for higher value multi-nutrient fertilizers. In addition, advances will be supported by continued growth in fertilizer prices as the cost of natural gas, oil, coal, and other raw materials continues to increase.
Demand for fertilizer nutrients in China is projected to grow 4.4 percent annually through 2015 to 98.1 million metric tons. Nutrient demand will be stimulated by increasing use of higher nutrient level products as income levels grow in rural areas in China. In addition, government efforts to promote multi-nutrient fertilizers will also support gains in fertilizer nutrient demand. Accounting for more than three-fourths of total fertilizer demand in 2010, single-nutrient fertilizers will remain the larger product type through 2015, despite a relatively low growth rate of 2.1 percent per year. Sales of single nutrient fertilizers will continue to be supported by their relatively low prices.
The cattle grown bysize, growth and composition of fertilizer demand in the Company are primarily Simmental, Charolais,six regions that make up China vary considerably. The Central-South and Angus. In general, local farmers buy 12Central-East will remain the two largest regional fertilizer markets. Due to 15 month old cattlethe comparatively high income levels in the Central-South and Central-East ¨¨which enable residents to afford more expensive food items ¨ demand for cash crops such as fruits and vegetables will rise in these regions, which in turn will fuel demand for fertilizer. Sales in the Northeast and Northwest regions will outpace the average through 2015, benefiting from the Company’s cattle agents,Great Western Development Strategy, the Northeast Revitalization Policy, and increasing income levels for farmers.10
In 2006, the Company commitscentral government started a program intended to repurchasingpartially compensate farmers for price increases in fuel, fertilizer and other agricultural inputs. In the cattle between 21case of fertilizers, government support is part of several separate programs targeting fertilizer producers, with cost reductions being passed along to farmers purchasing the input.
Fish production accounts for 59 percent of the total aquatic production, followed by shellfish and crustaceans at 22.6 percent and 10 percent, respectively. Fish production is, according to the USDA, expected to continue its upward growth trend to reach 34.5 million tons in 2012, up from 33 million tons in 2011 and 31.3 million tons in 2010.
In 2011, Shandong, Guangdong, Fujian and Zhejiang provinces profited from favorable coastal locations and abundant freshwater resources/facilities to rank as the top four aquatic production areas. In terms of freshwater cultured production, Hubei, Guangdong, and Jiangsu provinces are the largest producers.
According to @2019 undercurrent news, China’s seafood imports increased by 44% to $12bn in 2018. In the twelve months to 24 months old.
SJAP now has twelve cattle houses, with its smaller buildings housing a minimumthe end of 200 head and larger cattle houses accommodating upDecember 2018, China imported CNY 787bn worth of seafood, according to 350 head.
Within the Chinese agriculture market, small farmers lack commercial scale and expertise and therefore benefit from a strategic alliance. The Company works with the local government, soliciting their help to introduce and initiate a farmers’ co-operative, such as in the Huangyuan County, Xining City. This concept of strategic alliance with smallholder farmers under a co-operative farming model was originated and has been based on the following key characteristics and value enablers:
The key features of the co-operative farming model are set out in the illustration below:
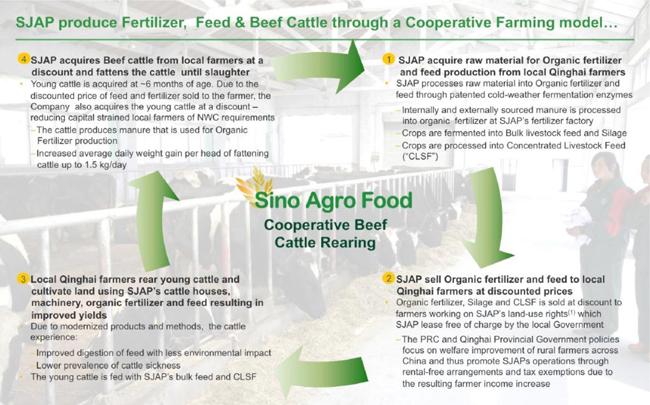
As of the date of this report, SJAP has established 22 farmer co-operatives that have the capacity to fatten up to 20,000 head of cattle per year based on a 3-month turn-around program. The cost of rearing cattle is expected to be lower as a result of concentrating efforts on manufacturing and/or selling livestock feed. The regional farmers are contracted to grow crops and pasture for the Company using the Company’s land that has been provided lease-free by the local Government or by using their own land, the Company’s equipment operated by its workers for planting and harvesting, and the Company’s supervision and associated services, as well as seed and organic fertilizer. These items are provided to them on credit, which are then charged against their account when the Company purchases the crops and pasture grass from them in return. Regional farmers also raise cattle for the Company using its bulk and concentrated livestock feed under the same credit terms and conditions described above. That is, when the Company purchases the mature cattle from the regional farmers, their accounts are charged for the feed against the amount paid.
The Company prepares its agricultural wastes into bioorganic fertilizer.1 Also the livestock feed2 is prepared into bioorganic livestock feed. Bioorganic fertilizer and the bio-organic livestock feed is sold to farmers that work on the Company’s land-use rights, which is owned by the government and leased with a subsidy or rent free, due to the many benefits for the community. Fertilizer and livestock feed are prepared based on the Company’s patented enzyme. The use of the enzyme is synergistic, as the production of fertilizer and livestock feed is permissible all 12 months of the year, which is a competitive advantage.customs data.
The farmers usemarket for meat in China
China is by far the bioorganic fertilizerworld’s largest producer and consumer of meat which includes pork, poultry and beef. Historically, this situation did not have a large impact on the soilrest of the world, as China, for the most part, maintained self-sufficiency in meat. However, since 2007 the situation has changed dramatically. China has gradually turned into a net importer of meats.
World meat production was 323 million tons in 2017.11 Global trade in meat is projected to be 20% higher in 2027, representing a slowing down of meat trade growth to an annual average of 1.5% compared to 2.9% during the previous decade.12 Meat imports into Asia account for 56% of global trade, and poultry will constitute more than half of this additional import demand. China’s meat production reached 86.60 million tons in 2018, where total meat production in the United States amounted to 47.06 million tons in 2018.
9 Fertilizer Market Global Report 2017, Business Research Company
10 Fertilizers in China, Industry Study with Forecasts for 2015 & 2020, Freedonia Group; June 2012
11 Review of Recirculation Aquaculture System Technologies and their Commercial Application, Stirling Aquaculture, Institute of Aquaculture.
12 Food Outlook, FAO, November 2018
With strong economic growth and the improvement of living standards, the demand for beef in China is rising.13 China’s animal feed market is projected to grow at a CAGR of over 16% till 2019.14
There are several other specific market drivers which underpin the increase in demand for red meat. One driver is the improved living standard in China which stimulates the growth of beef markets since beef often sells at a much higher price and traditionally has been more expensive than what most people can afford. Another is the fact that Chinese people’s dietary structure is becoming more diversified and reasonable, bringing larger amount of beef consumption since beef has nutritional benefits. Lastly, a gradual lowering of import taxes is likely to support sufficient supply of cattle.
Feed grain prices are projected to remain low during 2018-2027. The year 2017 was affected by numerous outbreaks of Avian Influenza (AI) around the world which resulted in a slower increase in world output. China, the second largest producer after the United States, was particularly affected by several outbreaks over the last years. Thus, China can expect a return to historical trend growth in poultry production from 2018 onwards. Globally, the share of meat output traded is expected to remain constant at around 10%, with most of the increase in volume coming from poultry meat. The projected production growth in developing countries remains insufficient to satisfy demand grown, particularly in Asia and Africa. As a result, import demand is expected to remain strong.15
Market drivers
The improvement of living standard stimulates the growth of beef markets:
Traditionally, Chinese people eat pork and chicken to satisfy their desire for meat. This is largely due to the cows together withmuch higher price of beef which goes beyond normal people’s affordable level. With the livestock feed. Government tests show:improvement of living standards, Chinese people have begun the upgrade of their consumption of meat, and began to eat more beef.
Chinese people’s dietary structure becomes more diversified and reasonable, bringing larger amount of beef consumption:
Through an acquired patent,3At present, Chinese people are changing their diet patterns to higher and richer nutrition. From a nutritional perspective, beef not only contains high unsaturated fatty acids and high protein, it also has low fat and lots of nutrition, which makes it perfect for the fat content of a 15 month-old cattle can be decreased from 15 kghealthy diet. Thus, in the future, beef is expected to 5 kg, which improves the qualityreplace some parts of the meatmarket shares in pork, chicken and its yield. The inventor of the patent is now an equity partner in SJAP.other meats.16
On February 28, 2013, SJAP completed its development
13 Research Report on Beef Import in China, 2019-2023
14 China Animal Feed Market Forecast and Opportunities, 2019
15 Meat - OECD-FAO Agricultural Outlook 2018-2027
16 Frost & Sullivan: China’s beef market has great growth potential
The market for fertilizer in China
Sales of the Concentrated Livestock Feed (“CLF”) manufacturing factory, and started the production and salesfertilizers are expected to be supported by healthy expansion of CLF. This CLF complements SJAP’s bulk livestock feed to provide the local cattle and sheep farming industry with a completed feed formula that can cater to the rearing of cattle and sheep at various growing cycles (e.g., specially formulated mixes with efficient nutrients for dairy cows and sheep, weaning, fattening and mature cattle and sheep). The advantage of the formulated feed combination is that the cattle and sheep growers will realize cost savings in production knowing preciselyagricultural activities as the amount of concentrated feed thatsown areas continues to grow and rural income levels rise. Farmers will continue to register steadily increasing incomes, the result of growing crop prices and government subsidies designed to supplement their revenues and reduce their material costs. Subsidies aimed directly at cutting the cost of fertilizers is expected to encourage additional use. In addition, rising crop prices have encouraged farmers to invest in fertilizers to further boost crop yields. Advances will also be neededdriven by their livestock, thus avoiding wasted excess concentrated feed dueincreases in the acreage of sown land dedicated to over feeding, which results in worthless excess fat in mature animals. In this respect, the Chinese central government has placed an order with SJAP to reserve up to 5,000 MT of CLF annually as partgrowing cash crops. However, increasing demand for organic food and improved understanding of the country’s annual reserve emergency livestock feed inventory. Thus, since March 2013 onward, SJAP has generated additional revenue generatedcorrect application of fertilizers is expected to prevent demand from the sales of CLF.
SJAP sells its organic fertilizer and bulk livestock feed mainly to its cooperative and regional farmers in addition to using it to rear its own grown cattle, but because its geographic location is so far away from other major provinces there are high costs associated with selling its fertilizer, bulk livestock feed and live cattle other than to local purchasers. Conversely, equivalent imports from other provinces must be purchasedrising at a higher cost, providing SJAP with a competitive edge. Furthermore, Qinghai Province is a region rearing millions of cattle and sheep per year, providing an ample market for SJAP’s fertilizer and livestock feed. faster pace.
In value terms, fertilizer demand is expected to grow from over $195 billion in 2016 to over $245 billion in 2020.17 Faster value growth will be driven by strong demand for higher value multi-nutrient fertilizers. In addition, advances will be supported by continued growth in fertilizer prices as the longer term,cost of natural gas, oil, coal, and other raw materials continues to increase.
Demand for fertilizer nutrients in China is projected to grow 4.4 percent annually through 2015 to 98.1 million metric tons. Nutrient demand will be stimulated by increasing use of higher nutrient level products as income levels grow in rural areas in China. In addition, government efforts to promote multi-nutrient fertilizers will also support gains in fertilizer nutrient demand. Accounting for more than three-fourths of total fertilizer demand in 2010, single-nutrient fertilizers will remain the Company believes that wholesale prices of SJAP’s livestock feed will maintainlarger product type through 2015, despite a steadyrelatively low growth rate of 5%2.1 percent per year. Sales of single nutrient fertilizers will continue to 10% per annum influenced mainlybe supported by rising labor cost of the country.
In 2014 the Company initiated operations in slaughter and deboning services to farmers at its abattoir and deboning facilities. SJAP received a business permit from the Chinese authorities on April 17, 2013, and construction commenced on April 21, 2013 on the abattoir, deboning factory, and related packaging facility. Since it is rare and difficult to obtain a permit for an abattoir facility in China, having this facility is expected to become a very valuable asset for the Company. To date, SJAP’s abattoir, deboning factory and packaging facilities are fully operational.their relatively low prices.
BeforeThe size, growth and composition of fertilizer demand in the abattoirsix regions that make up China vary considerably. The Central-South and related facilities were operational,Central-East will remain the Company sold mostly live cattletwo largest regional fertilizer markets. Due to orthe comparatively high income levels in the Central-South and Central-East ¨¨which enable residents to afford more expensive food items ¨ demand for cash crops such as fruits and vegetables will rise in these regions, which in turn will fuel demand for fertilizer. Sales in the Northeast and Northwest regions will outpace the average through various cattle wholesalers to existing wholesale2015, benefiting from the Great Western Development Strategy, the Northeast Revitalization Policy, and distribution markets that did not require much marketing efforts and networking.increasing income levels for farmers.18
117Through the environmental friendly “Bacterial and Bio-organic Fertilizer Manufacturing Technology”Market Global Report 2017, Business Research Company
218Consists of raw material consisting of crop wastes as well as locally grown and available wild wheat plus wild wheat sterns, wild peas Fertilizers in China, Industry Study with sterns and leaves, and selective pastures grown in the wild. These raw materials will be finely cut and put through a number of aging and fermentation processes by adopting a technology and method called “Stock Feed Manufacturing Technology,” duly licensed by TRW, a 100 percent owned subsidiary of the Company, and catalyzed by the enzyme developed by SJAP. Thereafter, the end materials will be packed and sealed in airtight and weatherproof packaging readyForecasts for storage.
3T1 Enzyme Technology (T1), Patent number ZL2005 10063039.9.2015 & 2020, Freedonia Group; June 2012
17
In China, beef is customarily distributed through various tiers of established wholesalers and distributors that source their beef from various slaughter and deboning houses located across many districts in China. Most of these wholesalers sell multiple types of frozen or freshly chilled meats (including pork and poultry, etc.), and some slaughterhouses specialize in and solely supply beef. These wholesalers and distributors supply beef to regional supermarket chain stores, retailing wet and frozen food markets, the catering industry, etc. Therefore, after having established its own slaughterhouse and deboning factory, SJAP is expected to automatically become the primary supplier of beef. As such, many existing wholesalers and distributors will source their beef supplies directly from the Company. With the current ever increasing demands of quality beef meats due to the increase of middle class consumers, the Government’s enforcement of food safety regulation, and of anti-smuggling and illegal imports of beef, the right opportunity exists for SJAP to market its high-quality beef product. Therefore, the Company is confident it will successfully sell its beef meats in domestic markets. Also, a portion was exported to South Asian countries (i.e., Malaysia, Singapore, Hong Kong, Middle East countries and Thailand etc.) in 2014, as the Local Government encourages the Company to do.
In this respect, SJAP’s overall cattle division (excluding QZH) achieved sales revenue of USD45.46 million in 2016 compared to 2015’s USD86.97 million (representing a negative growth rate of 47.7%) and gross profit dropped to USD14.91 million from 2015’s USD18.25 million (representing a drop of 18.3%).
The impact of China governmental change of policy during the 2nd quarter of 2015 relaxing the restriction on beef imports from eleven countries (e.g., New Zealand, Brazil, Australia, etc.), continued to affect the local cattle and beef industry throughout 2016, such that the local cattle industry has not been able to map out any firm direction under the current volatile pricing environment. At the same time, e-commerce has also affected sales through the traditional marketing outlets, requiring new marketing approaches, which consequently has absorbed some of the capital previously earmarked for capital projects under construction.
Throughout 2016, the Company’s beef operations had begun implementing certain business plans aimed at minimizing the adverse impact from those items mentioned, namely:
a. Quality of labor available in the Value Added Processed goods industry is readily available at a competitive cost.
b. Land and construction cost in Xining are still cheap when compared to other major cities in China, providing a lower cost to capital expenditures.
c. Abundance of raw materials because of imports having helped reduce the overall cost of these items.
d. Transportation costs to deliver value added products remain at affordable levels.
e. Consistent food safety and quality can be maintained within a controlled environment.
f. There exists sufficient demand for value added beef products in China as well as offshore markets that can be targeted through e-commerce websites, supermarket chains, distribution networks, etc. resulting in capturing a healthy return on investment.
SJAP is in the process of readying itself for an IPO, and in the interim withholding incurring additional CapEx until an equity raise provides the capital necessary to implement its overall plan. With most work detail now completed on the Tri-way carve-out, more time will be made available to accelerate the completion of the SJAP carve-out going forward.
Even though no assurance regarding timeline and success in attaining a listing can be made now, updates regarding this exercise will be made available on a periodic basis as they occur.
4Organic Fertilizer (HSA) division.
The business division Cattle Farms, or MEIJI, refers to SIAF’s cattle rearing operations in Jiangmen, Guangdong Province. Revenue for fiscal year ended December 31, 2016 was USD 29.8 million, or 11.0 percent, of the Company’s total sales of goods revenue of USD 270.8 million in the same period. Gross profit for the Cattle Farm (MEIJI) division for the 12 months ended December 31, 2016 was USD 1.5 million, or 2.5% percent of the Company’s total gross profit on sales of goods of USD 59.2 million in the same period.
The operation in Linli District, Hunan Province, is run by HSA, a 76% owned Chinese subsidiary. HSA conducts the following business activities, both of which are in the development stage:
By January 2013, the first organic fertilizer production plant was established and started its production of organic fertilizer. On March 5, 2013, HSA secured the rights to use an enzyme developed by a Hong Kong company some twenty years ago, that has been utilized by global manufacturers of organic fertilizer. The advantage of this enzyme is that when it is applied to the organic fertilizer it can convert part of the organic raw materials into potash and phosphate without having to add in chemically formulated potash and phosphate, such that the Company’s end fertilizer can be qualified as pure organic fertilizer made with 100% natural organic raw materials. With this pure organic fertilizer, HSA is able to fully explore the potential market for fish in farm lakes and thereby to attempt to align itself with the government’s policy of encouraging lake fish farmers to use pure organic fertilizer instead of chemical fertilizers. In addition, cost savings from avoiding the use of chemical potash and phosphate will, in management’s belief, result in a better profit margin for the Company. Sales of pure organic fertilizer commenced at the end of Q1 2013.
HSA produced 50,000 MT of organic fertilizer and organic mixed fertilizer in 2016. The main hardship related to selling fertilizer is the requirement to provide longer credit terms (sometimes up to 180 days) to the Company’s end buyers because these end users normally can afford to pay for them only after they sell their products. Therefore, the Company must assess creditworthiness of its prospective customers, and only consider the farmers who can be deemed creditworthy, and who follow the Company’s requirements for planting their fields and harvesting crops each year.
Development of HSA in Linli District, Hunan Province, follows SJAP’s business model. HSA is situated in a much better growing environment than SJAP, a farming rich province in central China. Thus, HSA benefits from cheaper logistics costs, proximity to large markets, and a more favorable climate (milder winters and longer summers versus SJAP’s long bitterly cold winters and short summers). However, financial support from the Government is more difficult to obtain in the Hunan Province because more entities share the Government’s support provisions.
HSA endures both higher development costs and longer time to construct its facilities when compared to SJAP, whose property had 40 older (yet salvageable) buildings, which it has renovated to meet its needs.
Hunan Province is one of the biggest primary producing provinces of China with over four million primary producers that grow rice, tea, tobacco, grapes, citrus, cotton, seedlings, sunflowers, herb plants and many varieties of cash crops. Hunan also has a long-standing history in lake aquaculture producing millions of tons of fish and other seafood annually.
Construction work to develop HSA’s cattle station that began in March 2012 was completed in 2016 containing a 2,000-head capacity cattle farm built and ready for operation. The Company cultivated 75 acres of its land, situated below the fertilizer factory, and planted crops and pasture, such that bulk stock feed will be harvested by June 2017.
The Company’s plan for HSA is to process cattle waste from its own cattle farm to be used as raw materials for the manufacturing of fertilizer, thus there will be substantial saving in its cost of fertilizer manufacturing (estimated at over USD2.5 million per year based on current sales), and with such cost of saving, HSA will be able to self-finance the development of its Yellow Cattle Program designed to eventually produce the Yellow Cattle into one of the top quality beef cattle in Asia, aiming to reach meat quality on par with Japanese Wagyu Cattle.
Therefore, the Company’s plan is to merge Cattle Farms (1) & (2) with HSA sometime in 2017, at the latest, such that CF (1) & CF (2) will become breeding stations supplying yearlings for HSA to grow into full grown cattle (up to 3 years old) that will be sold in the Chinese market. The Yellow Cattle is very similar in body size and weight and quality to the Japanese Wagyu cattle and has distinct meat texture, flavor and quality that are in high demand in China. In this respect, HSA’s cattle development is very different compared to SJAP’s cattle business since HSA’s business is aimed at developing a brand of cattle strictly of Chinese origin, whereas SJAP’s cattle business is a fully integrated model as primary producer, value added processor, canning operator, stock-feed producer, as well as, marketer and distributor of imported beef and other commercially recognized breeds of cattle.
Cattle farms (MEIJI) division
The business division Cattle Farms, or MEIJI, refers to SIAF’s cattle rearing operations in Jiangmen, Guangdong Province. Revenue for fiscal year ended December 31, 2016 was USD 29.8 million, or 11.0 percent, of the Company’s total sales of goods revenue of USD 270.8 million in the same period. Gross profit for the Cattle Farm (MEIJI) division for the 12 months ended December 31, 2016 was USD 1.5 million, or 2.5% percent of the Company’s total gross profit on sales of goods of USD 59.2 million in the same period.
Currently there are two operations in this segment, Cattle Farm 1 and Cattle Farm 2.
Cattle Farm 1: Cattle Farm 1 was built as a demonstration farm to show that cattle can be raised in a semi-tropical climate using the Company’s semi-grazing and housing method. Using the Company’s semi-free growing management system, the cattle can graze in the field during the early morning and kept indoors and out of the sun during the hot summer days. This method has proven reliable, with the growth rate of the cattle measuring slightly higher than the cattle at SJAP (i.e., averaging around 0.28 kg per day per cattle more).
Cattle Farm 2:Cattle Farm 2 is a beef cattle farm situated in Guangdong Province, Guangzhou City. Cattle Farm 2 is operated by a private company formed in China with Chinese citizens acting as its legal representative as required by Chinese law. Cattle Farm 2 is complementary to Cattle Farm 1, having an additional 76 acres of land suitable for growing the Company’s type of pasture (a cross between elephant grass and yellow grass) that has a very high yield rate of over 35 MT per 1/6 acre per year, and containing an average of over 9 percent protein that is very suitable for consumption by cattle. Between the two farms, under normal seasons, they have a capacity to produce up to 30,000 MT of pasture/year collectively that is capable to feed up to 5,000 head of cattle/year based on the consumption rate on average of 6 MT/head.
MEIJI is the marketing and distribution agent for all cattle farms that are and will be developed by MEIJI using its “Semi-free growing” management systems and aromatic-feed programs and systems to grow beef cattle.
Like CA in its business model, MEIJI purchases fully-grown cattle from Cattle Farm 1 and sells them to the cattle wholesalers. MEIJI also buys young cattle from other farmers and sells the young stock to Cattle Farm 1. All cattle farms developed by MEIJI will utilize its “semi-free growing” management system and aromatic-feed programs and systems to raise beef cattle.
Yellow Cattle (Beef meat) is traditionally a high-end market in China, as it is mainly sold in higher end markets. This situation is rapidly changing, though, owing to urbanization and rising incomes, the rising demand for such quality beef, such that we foresee that eventually, locally grown and produced high quality beef from local breeds like the Yellow Cattle will establish its “Brand” and in turn premium prices in China similar to how many locally bred Japanese Cattle found their market niches in Japan.
Plantation division
The business division Plantation refers to SIAF’s produce production situated at Enping City, Guangdong Province. Revenue for 12 months ended December 31, 2016 was USD 13.3 million or 5 percent of the Company’s total sales of goods revenue of USD 270.8 million in the same period. Gross profit for the plantation division for the 12 months ended December 31, 2016 was USD 1.54 million, or 2.6% percent of the Company’s total gross profit for sales of goods of USD 59.2 million in the same period.
JHST is an SFJVC that is 75 percent owned by SIAF. Situated at Enping City, Guangdong Province, it is consolidated as a subsidiary, and is the owner and operator of a Plantation where mainly Hylocereus Undatus, or Dragon Fruit, and cash crop vegetables, are grown.
Hylocereus Undatus is a cactus commonly referred to as dragon fruit. JHST conducts two main operations: (i) growth and sales of flowers that are consumed as vegetables in China, and (ii) drying and value added processing and sales of HU flower products (used in health-related soups and teas). JHST cultivates 187 acres of Hylocereus Undatus in the Guangdong Province.
HU cacti take three years to reach maturity, though they will flower a little even in their first year, and can produce for as long as twenty years. JHST began planting in late 2007, and by 2015 all of the plants are mature (averaging over four years). HU blooms for a very short period, sometimes only one night, and flowers must be 20 to 25 cm long when picked before they turn from green to white. HU is a delicate crop and the harvest season runs from July through October.
Fresh flowers are sold to regional wholesale and retail markets due to their short shelf life. Some are dried and packed; these flowers are sold to a few major wholesalers, who distribute them to wholesale and retail markets and exporttraders through the winter andspring months (from October to June) in Guangdong Province. HU is a seasonal revenue product; more than half of JHST’s revenues are recognized in the third quarter. No sales are made in the first quarter.
The Company originally expected that by 2014, dried and pickled flowers would make up 96 percent of the division’s flower income as produce is diverted away from delicate fresh flowers. In 2013, the Company planted a special selenium-rich Chinese herb (called XueYingZi, or “Immortal Vegetable” in China and Snowsakurako in Japan) among the HU plants hoping to prolong the shelf life of the fresh flowers from 2-3 days up to 12-14 days and increasing the sales of fresh flowers. This experimentation had not produced the desired outcome; thus, the Company instead has processed up to 80 percent of HU as dried flowers from 2013, onward. The Company’s organic Immortal Vegetable plants have properties that some believe induce good health. The Company has processed these into small gift packs - selling them as organic vegetables with leaves for tea and stems for soup. Laboratory test results show that each kilo of fresh Immortal Vegetables contains 0.58 gram of selenium, which adds value to their sales. In December 2013, the Company started trials to plant other cash crops in between the HU plants with the aim of improving revenue covering all seasons. As of the 2015 season there were 70 Mu designated for growing immortal vegetables on the plantation, however, due to poor market sales, was reduced to 10 Mu and instead replaced with the growing of cash-crop vegetables (i.e. varieties such as eggplant, lady fingers, chili plants and some highly popular Chinese vegetables, etc.) on over 500 Mu of property.
HU flowers are in greater demand than supply can meet for several reasons; (i) In Guangdong Province, HU plants can only be grown commercially along certain districts; there were over 40,000 acres of HU Plantation in 2005, but due to the growth of industrialization and modernization, acreage is now less than 4,000 acres, and (ii) farm laborers are getting harder to find. With the increase of cost of wages and salaries, the rapid rise of the land cost and the increase cost of farm developments, it is extremely difficult to start up a large HU plantation. For these reasons the Company anticipates that prices of dried HU flowers will enjoy a steady rise at an average rate of 8 to 12 percent per year, which has been the trend since 2009. However, the biggest risk to yield is weather, as substantially wet rainy seasons can limit the yield of any harvest.
Marketing & Trading Division
Revenue for 12 months ended December 31, 2016 was USD 13.3 million or 5 percent of the Company’s total sales of goods revenue of USD 270.8 million in the same period. Gross profit for the plantation division for the 12 months ended December 31, 2016 was USD 1.54 million, or 2.6% percent of the Company’s total gross profit for sales of goods of USD 59.2 million in the same period.
The Company distributes imported meat and seafood through two completed and operational facilities from which it has acted as turnkey project developer to construct and manage these operations:
In 2013, the Company also constructed a trading complex (the “Trading Center”) for the Import and Export at another building adjacent to Wholesale Centers 1 and 2. The Trading Center has imported frozen and fresh chilled and live seafood (i.e., cuttlefish, squid, prawns, salmon, crabs and eels) from Malaysia, Thailand, Russia and Madagascar and other local coastal fishing towns. The seafood was sold to Wholesale Center 1, which distributed and sold it into various reputable food chain outlets, wholesale market stores and supermarket chains in the Guangzhou City, Shanghai City as well as in the southern coastal towns of the Guangdong Province.
Primarily, the Company distributes meat imported from Australia and seafood from other countries through these operations
Project Development DivisionMaterial Agreements
The project developments (or Technology engineering consulting and services) work are carried out by CA on aquaculture related projects and by SIAF on non-aquaculture projects:
Introduction
The Project Development division earns revenue by providing turnkey project management and engineering services today mainly within aquaculture. Project development revenue for 12 months ended December 31, 2016 was USD 72.2 million or 21.1 percent of the Company’s total revenue of USD 342.9 million in the same period. Gross profit for project development for the 12 months ended December 31, 2016 was USD 23.7 million or 28% percent of the Company’s total gross profit of USD 84 million in the same period. All project development activity for the year was carried out through Capital Award for the aquaculture division.
Historical events:
Historical Information and status of CA’s consulting and engineering service are shown in the table below:
| Number | Year | Name | Stage of completion | |||
| 1 | 2010 | Fish Farm 1 (JFD) | Completed and acquired by SIAF | |||
| 2 | 2011 | Fish Farm 2 | Under expansion by owner | |||
| 3 | 2011 | Cattle Farm 1 (JHMC) | Completed and acquired by SIAF | |||
| 4 | 2011 | Prawn Farm 1 (EBAPCD) | Completed with hydroponic farm to go | |||
| 5 | 2011 | Prawn Farm 2 (ZSAPP) | Under expansion by owner | |||
| 6 | 2012 | Cattle Farm 2 (EAPBCF) | Completed | |||
| 7 | 2012 | Wholesale Center 1 - Guangzhou (APNW) | Completed | |||
| 8 | 2012 | Central kitchen, distribution network, signature restaurants | Completed | |||
| 9 | 2013 | Zhongshan New Prawn Project (ZSNP) | Under construction | |||
| 10 | 2014 | Wholesale Center 2 - Shanghai (APNW) | Completed |
Together with its subsidiaries, the Company essentially constitutes an engineering company providing services in engineering consultancy, supervision and management on the development of agriculture and food based projects in China. These include the construction of farms (or other facilities) as well as the development of business operations of related projects that are apply and use the Company’s principal technologies, including the following:
CA’s standard principal terms and conditions for its Aquaculture project development consulting and service contracts are outlined below:
The Company’s services are comprehensively supportive with vertically integrated operational activities to provide service for the construction of and the business development of the projects to joint ventures. Consulting services include research and development on mature and young animals, supply of foundation animals (baby calves, fingerling and breeding stocks etc.), supplying designed and configured plants and equipment to the marketing and sales of the product.
Aquaculture Project Development
Engineering consulting and services provide a comprehensive range of services in the field of aquaculture. These include research and development, brood stock supply, nurturing of fish fingerlings and prawn post-larvae as well as growing of fish and prawns, engineering designs and planning of farms and associated operations, technology and related implementation, supervision, training and conducting trials, management of farm operation and construction, supply of plants and equipment, training of maintenance and operational services, sales, transportation and marketing of fish and prawns, as well as financing. The Company’s management team and staff in Guangzhou conduct the engineering and consulting work. Sino Agro Food directs the scope of work so that building subcontractors deliver projects efficiently and cost effectively. Using locally manufactured equipment, parts and components customized to the Company’s proprietary designs and engineering specifications, production costs for machinery and facilities are far lower compared to foreign aquaculture systems. The Company believes that it delivered the first indoor re-circulated aquaculture prawn farm in Asia.
From October 5, 2016, onward:
CA has granted to Tri-way a Technology Master License for China, such that starting from October 5, 2016, all future fishery project development in China using APM-RAS or ODRAS will be developed by Tri-way. CA has been hired by Tri-way as the Company’s turnkey contractor to provide consultation respective of Tri-way’s operations.
CA’s aim, in addition to providing quality service to Tri-way in China, is expecting to expand its reach to introduce and help implement its APM-RAS and ODRAS plant and equipment and services, worldwide.
Other Project Development
The Company has also, acting as a turnkey project developer, built 8 restaurants with central kitchen and bakery facilities in the greater Guangzhou area.
Intellectual Property Rights
The Company and its business are, to some extent, dependent on patents, licenses and other intellectual property rights. As of the date of this Annual Report, the Company holds intellectual property for fertilizer formulas, livestock feed fermenting formulas and indoor fish farm techniques. These include an enzyme technology master license registered under a Chinese patent for the manufacturing of livestock feed and bioorganic fertilizer, and an aromatic-feed formula technology to produce aromatic cattle, and a bacterial cellulose technology license.
On 12 November 2008, Tri-way Industries Limited entered a Sales and Purchase of Technology Master License Agreement with the inventor of a patent, Mr Shan Dezhang, concerning the sale and purchase of the master licence rights of a patent registered in China under the name of “Zhi Wu Jei Gan Si Liao Chan Ye Hua Ji Qi Zhi Bei Fang Fa”, with patent number ZL200510063039.9. The patent relates to methods of processing plant straw into animal fodder and industrialisation of product of plant straw fodder. Under the agreement, Tri-way Industries Limited is licenced to use and to licence others to use the secrets, copyrights processes and other intellectual property rights associated with the patent in any territories in the world free from all encumbrances with all rights to the patented intellectual property and related brand and label as provided under the laws of China. The total purchase price of the patent was USD 8,000,000, to be paid in several installments. As Tri-way Industries Limited is not a Chinese company, relevant Chinese authorities must under applicable Chinese law, approve the assignment. The patent assignment has not been registered. Consequently, under Chinese law, the patent shall not take priority over the interests of third parties who are in good faith.
On 15 May 2009, Tri-way Industries Limited (as licensor) entered into a sub-licence agreement with Qinghai Sanjiang A Power Agriculture Co. Ltd (as licensee) concerning the sub-licensing of the above-mentioned patent (ZL200510063039.9). The licence period is 50 years, and the annual licence fee is stipulated at USD 450,000. However, as effective patent protection for the patent is 20 years, the excess part of the term is void under Chinese law. The contracting parties of the aforesaid sub-licence agreement have never performed the terms of the said agreement and no payment has ever been made by the licensee to the licensor. The parties have no intention to perform the sub-licence agreement, and the contracting parties have terminated the said agreement accordingly.
Rights to this technology have been transferred to HSA by SIAF after SIAF obtained this, as well as other assets, in exchange for assumed liabilities of Tri-way because of the carve-out.
On 20 June 2011, SJAP entered an agreement with Guangzhou City Garwor Trading Company Limited, pursuant to which Guangzhou City Garwor Trading Company Limited transferred its trademarks with registration numbers, 3713869 and 3713868, as well as a microbial patent with patent number ZL200610033295.8. The total transfer fee for the trademarks and the patent was RMB 12 million and the transfer fee for the technology secrets was RMB 1 million. Per the said agreement, the transfer fees shall be paid by the interest generated from the utilization of the patent. Moreover, the said agreement stipulates that any new technology improvements of the invention shall belong to both parties, and that any resulting profits shall be shared equally. Guangzhou City Garwor Trading Company Limited is a shareholder in the transferee and therefore a related party. An evaluation report was not filed with the transaction. Although this is not a formal requirement under Chinese law and the contract is valid, this may lead to the contract being challenged in the future based on unfairness. Moreover, as the transferor, Guangzhou City Garwor Trading Company Limited, is not the owner of the trademark, the said agreement is void under Chinese law and SJAP has therefore not obtained ownership of the trademarks. This may be corrected if SJAP enters into an agreement with the trademark owner. If SJAP uses the trademark without prior consent of the trademark owner, this would constitute trademark infringement. However, SJAP is intending to write off said trademark, and does not intend to use the trademark in question.
Loans and contractual obligations
Short-term financial debt
|
|
|
Long-term financial debt
|
|
|
|
| ||||||
|
|
Agricultural Development Bank of China Credit Facilities:
On the October 23, 2015, the Company’s subsidiary SJAP entered three agreements regarding credit facilities with the Agricultural Development Bank of China, Huangyuan County Branch. The agreements grant SJAP a credit of RMB 35 million, RMB 20 million and RMB 35 million, respectively, at an interest rate of 6.40 percent. The agreements are valid for 12 and 60 months after the date of each agreement. The credit facilities are personally guaranteed by Mr. Zhao Yilin, the general manager and legal representative of SJAP who has given personal guarantees for the repayment of the loan sums of RMB 25 million and RMB 15 million plus interest and charges payable under the loan agreements. Land use rights and building ownership rights with net carrying amount of USD 471,048 also secure the credit facilities. Agreements between SJAP and the Agricultural Development Bank of China regarding credit facilities have been entered into on a yearly basis during the last three years. As of December, 2016 SJAP repaid all loan facilities to Agriculture Development Bank of China and entered a long term long facility (for loan amount of RMB 40,000,000 over a period of 10 years) from China Development Bank on December 16, 2016.
Negotiable Convertible Promissory Note (NCP Notes)
On August 29, 2015, TRW issued negotiable promissory notes to three fund companies and one individual for $3,450,000 with SIAF acting as guarantor for repayment.
Since SIAF has assumed all accrued liabilities of Tri-way in exchange for equity holdings in the company, two NCP Notes were transferred to SIAF on September 30, 2016 amounting to $1,013,397.00 payable on or before 31.03.2017 (includes principal and accrued interest to 31.03.2017), and the other amounting to $669,129.00 (principal) at 5% interest, repayable on or before July 31, 2017.
EuroChina Capital Convertible Note:
On August 29, 2014 the Company completed the closing of a private placement financing transaction with an accredited investor, Euro China Capital AB (“ECAB”), which purchased a 10.5% convertible note (the “Note”) in the aggregate principal amount of up to USD 33,300,000. The Company received a total advance of USD 25 million. The Note carries an original issue discount of 25%.
Interest on the Note shall accrue on the outstanding principal balance of the Note from August 29, 2014. Interest shall be payable quarterly on the last day of each of March, June, September and December commencing September 30, 2014 provided, however, that the Noteholder may elect to require the Company to issue to the Noteholder a promissory note in lieu of cash in satisfaction of any interest due and payable at such time. Any interest payment note shall be subject to the same terms as the Note. The Note has a maturity date of February 28, 2020.
The Note is convertible, at the discretion of the Noteholder, into shares of the Company’s common stock (i) at any time following an event of default, or (ii) for a period of thirty (30) calendar days following October 1, 2015 and each anniversary thereof, at an initial conversion price per share of USD 9.90, subject to adjustment for stock splits, reverse stock splits, stock dividends and other similar transactions and subject to the terms of the Note. As long as the Note is outstanding, the Noteholder shall have a right of first refusal, exercisable for thirty (30) calendar days after notice to the Noteholder, to make loans to the Company and its subsidiaries or to purchase securities proposed to be offered and sold by the Company or its subsidiaries. The Company is required to promptly give the Noteholder written notice of such proposed transaction.
��
The Note agreement contains regular provisions requiring timely repayment of principal and accrued interest, payment of default interest in the event of default, default and optional conversion and does not contain specific financial covenants. To the Company’s knowledge, the Company is in material compliance with the terms of the Note.
Moreover, the Note provides that upon the satisfaction of the Payee Conditions (defined as the date upon which the Noteholder shall have advanced a principal total amount of at least USD 33,300,000 and has delivered to the Company a notification notifying the Company that the Noteholder has formed a bondholders committee consisting of two to four persons), the Company shall not hire a new Chief Financial Officer (or any other person that performs the functions typically performed by a Chief Financial Officer) without the prior written consent of the Noteholder.
Except as otherwise approved by the Noteholder in an aggregate amount not to exceed USD 5,500,000 of indebtedness and other payables currently owed to vendors and lenders, the Company is prohibited from entering into any agreement with any vendor or lender that involves the issuance of any equity securities as payment for any amounts owed to such vendor or lender or actually issue any such equity securities to such vendor or lender as payment for any such amounts (“Debt settlements”) from and after the date of the Note.
Upon the Noteholder’s request, the Company is required to use its best efforts to promptly have the Note listed through Euroclear on any exchange on which the Noteholder may request, maintain such listing of the Note and register the Note with the United States Securities and Exchange Commission (the “SEC”).
Loan agreements
All the loan agreements set out above under the heading “Borrowings, loans receivables and contractual obligations” in the tables above contain regular provisions requiring timely repayment of principal amount and accrued interest, payment of default interest in the event of default, and contain no specific financial covenants. To the Company’s knowledge, the Company is currently in compliance with the loan agreements.
There are no provisions in the Company’s bank borrowings and long term debts that would accelerate repayment of debt as a result of a change in credit ratings or a material adverse change in the Company’s business. Under certain agreements, the Company has the option to retire debt prior to maturity, either at par or at a premium over par.
Under the terms of the loan agreements with Agricultural Development Bank of China, proposed changes in the shareholding of SJAP requires 30-days prior written notice and prior approval from the Agricultural Development Bank of China. However, this will not be triggered by indirect changes or changes in the shareholding of the Company.
Material Agreements
Joint Venture Agreements
The Company has two types of SFJVCs established under Chinese law:
| · | Contractual Joint Ventures (“CJV”); and |
| · | Equity Joint Ventures (“EJV”). |
Of the five Chinese joint venture project companies which are CJVs or EJVs, four are CJVs (JFD, JHMC, JHST and SJAP) and one is an EJV (HSA).419
The main difference between an EJV and a CJV is that in a CJV, the obligation of capital contribution shall be determined by the contractual parties themselves. The proportions of capital contribution do not have to be fixed between the Chinese and foreign parties. Profit distribution and risk sharing ratio shall also be determined by the contracting parties themselves which do not have to be the same proportions as the parties’ capital contribution or shareholding therein. The capital contributing parties may specify their profit and risk sharing ratio only and may or may not specify their shareholdings in the CJV. One party may make capital contribution by way of non-monetary assets such as rights in lands, factories and machineries etc. while the other party may make capital contribution by way of cash.
In an EJV, the shareholders contribute capital and operate business jointly, and share profits, risks and losses in proportion to their equity contributions. Foreign investor’s capital contribution shall not be less than 25 percent of the total registered capital.
The Company engages in projects based on consulting and service agreements (as described under “Consulting and Services agreements”Agreements” below), whereby Sino Agro Foodthe Company can choose whether the cooperation shall continue under a consulting and service agreement or be acquired by Sino Agro Food.the Company.
Consulting and Services Agreement (through September 30, 2016)
Consulting and service (“C&S”) agreements are important for the operation of Sino Agro Food’sthe Company’s subsidiaries and partners. Only the Sino Agro FoodCompany’s subsidiaries SJAP and HSA do not and have not operated under C&S agreements.
19According to the official documents of the Company’s Chinese subsidiary JHMC, the registered capital of such subsidiary is USD 2 million that was paid in full by year ended 31 December 2014. As of the date of this Annual Report, MEIJI, a subsidiary of the Company, has contributed USD 400,000 of the subscribed capital, whereas USD 1.6 million of the subscribed capital has not been paid. Moreover, according to the official documents of the Company’s Chinese subsidiary HSA, the registered capital of such subsidiary is USD 2.5 million and shall be paid in full no later than 18 July 2013. As of the date of this Annual Report, MEIJI, a subsidiary of the Company, has contributed USD 865,000 of the subscribed capital, whereas USD 234,500 of the subscribed capital has not been paid by the Chinese owner. The aforementioned deadlines can be re-arranged by all the promoters. If no new deadline is agreed upon, failure by MEIJI to make full payment may lead to the other promoters making full payment of the capital contribution on MEIJI’s behalf and requesting MEIJI to compensate for their payment and losses.
Initially, agriculture and aquaculture investors invite Sino Agro Foodthe Company to act as a developer and project manager of an agribusiness or food-related project. If the management of Sino Agro Foodthe Company sees the proposal as interesting, Sino Agro Foodthe Company carries out an in-depth study of the target company including legal due diligence, business plan, budget and projected financial information. Sino Agro FoodThe Company makes the decision through a resolution of the Board of Directors. If Sino Agro Foodthe Company determines to proceed, the Chinese investor forms a private Chinese company dedicated to the project and the parties sign a C&S agreement.
Sino Agro FoodThe Company acts as the project manager providing turnkey services to the Chinese developer of the project, meaning that Sino Agro Foodthe Company builds the project using Sino Agro Food’sits technology, systems, know-how, and management expertise and systems. As such, Sino Agro Food’sthe Company’s expenditure in the project includes Sino Agro Food’sthe Company’s own administration and operational expenses provided for and incurred in the project (charged and recorded under Sino Agro Food’sthe Company’s general and administrative operation expenses), which are billed to the Chinese developer. All other development expenditures (inclusive of Sino Agro Food’sthe Company’s subcontractors’ and sub-suppliers’ costs and Sino Agro Food’sthe Company’s marked up profits) are billed to the Chinese developer who will pay accordingly.
When the project companyC&S Project Company initiates production Sino Agro Foodthe Company acts as the sole marketer of food products and as the supplier for the C&S Project Company under the terms and conditions of the C&S agreement. Sino Agro FoodThe Company acts as the selling supplier and buying wholesaler to the company supplying items such as feed, young cattle, and RAS technological components and buys mature prawns, sleepy cod, eels and live cattle. Sino Agro FoodThe Company earns a gross profit of between 10-15 percent10-15% based on the C&S Project Company’s revenue on this exclusivity.
The C&S Project Company will remain wholly-owned by the Chinese developer until Sino Agro Food exercisethe Company exercises the acquisition option and subsequently converts the company into an SFJVC where the Chinese investor remains as a minority shareholder. The acquisition price is normally determined in accordance with the book value of the Chinese company as of the acquisition date. Consideration will normally consist partly of cash and partly of project loans owed by the Chinese investor, which offset and decrease the purchase proceeds in the corresponding amount. Generally, the agreements that Sino Agro Foodthe Company has entered into governing the formation of the unincorporated companies into SFJVCs do not regulate the maturity date for the formation of SFJVC. The date for the formation of the SFJVC is generally left to the discretion of the Company, based on the development and profitability of the relevant project.
4According to the official documents of Sino Agro Food’s Chinese subsidiary JHMC, the registered capital of such subsidiary is USD 2 million that was paid in full by year ended 31 December 2014. As of the date of this Annual Report, MEIJI, a subsidiary of Sino Agro Food, has contributed USD 400,000 of the subscribed capital, whereas USD 1.6 million of the subscribed capital has not been paid. Moreover, according to the official documents of Sino Agro Food’s Chinese subsidiary HSA, the registered capital of such subsidiary is USD 2.5 million and shall be paid in full no later than 18 July 2013. As of the date of this Annual Report, MEIJI, a subsidiary of Sino Agro Food, has contributed USD 865,000 of the subscribed capital, whereas USD 234,500 of the subscribed capital has not been paid by the Chinese owner. The aforementioned deadlines can be re-arranged by all the promoters. If no new deadline is agreed upon, failure by MEIJI to make full payment may lead to the other promoters making full payment of the capital contribution on MEIJI’s behalf and requesting MEIJI to compensate for their payment and losses.
As of the date of this Annual Report, Sino Agro FoodCompany has entered into ten C&S agreements. A portion of the C&S agreements contain an acquisition premium clause, in which the accumulated C&S project development fees billed by Sino Agro Foodthe Company will be paid in addition to the equity book value at the time of acquisition. In the event that either of the investors decides to sell all or part of its equity in the SFJVC to any third party, a portion of the agreements require the selling investor to obtain prior consent of the other investor before such sale and to grant the right of first refusal to the other investor on the like terms for the intended sale.
As of October 5,1, 2016, when Tri-way became the developer and operator of all fishery C&S Projects formerly under SIAF, CA’s new role is one of turnkey operator appointed by and working on behalf of Tri-way.
Land leases
Private ownership of land is not permitted in China. Therefore, Sino Agro Foodthe Company leases land that is either collectively owned land or state owned land, through land use rights. Corporate entities and individuals may own the property (buildings) erected on the land.
Land use rights may be transferred, but they are based on agricultural contracts and cannot be changed arbitrarily to non-agricultural purposes. The lease term varies from 27 to 60 years. There are certain uncertainties (e.g., lease term may not exceed 30 years and all transfers have not yet been registered correctly) in respect of certain leased land due to the fact that not all requirements have been fulfilled or not yet registered. However, the Company believes it is protected against these uncertainties through its agreements with the relevant local Chinese partners and relevant registration processes have been initiated. The Company’s subsidiary HSA has acquired land use rights for state owned land located in OuChi Village, FengHuo Town, LinLi County, Hunan Province. However, HSA has not obtained a land use right certificate for such land, which therefore, for the time being, cannot be lawfully mortgaged or transferred. Moreover, the Company’s subsidiary CA has entered into a Rural Land Management Rights Sub-Sales Agreement for the acquisition of the contractual operating and use rights of 202 mu of collective owned land located in Da San Dui Wei You Nan Village, Shenwan Town, Zhongshan City for a period of 30 years. However, the transfer procedures for the land in question have not been completed. CA is not an enterprise registered in mainland China and therefore, according to Chinese law, cannot acquire the contractual operating and use rights of collective owned land. The Company is currently negotiating with Beijing Hengxintianyi Investment Guarantee Co. Ltd. to designate a subsidiary of the Company in China for the purpose of entering into a new Rural Land Management Rights Sub-Sales Agreement.
Currently, the Company has leased the following lots of land:
| Owner | Location | Hectares | Date Acquired | Tenure | Cost, USD | Monthly amortization | Nature of ownership | Zoning type | ||||||||
| HSA | Ouchi Village, Fenghuo Town, Linli County | 12.92 | 5 April 2011 | 43 | 242,703 | 470 | Lease | Agriculture | ||||||||
| HSA | Ouchi Village, Fenghuo Town, Linli County | 3.34 | 24 May 2011 | 40 | 376,489 | 789 | Land use right | Industrial | ||||||||
| JHST or HU Plantation | Yane Village, Liangxi Town, Enping City | 3.33 | 10 Aug 2007 | 60 | 1,064,501 | 1,478 | Management right | Agriculture | ||||||||
| JHST or HU Plantation | Nandu Village of Yane Village, Liangxi Town, Enping City | 11.24 | 14 March 2007 | 60 | 1,037,273 | 1,441 | Management right | Agriculture | ||||||||
| JHST or HU Plantation | Nandu Village of Yane | 24.57 | 14 March 2007 | 60 | 2,267,363 | 3,149 | Management right | Agriculture | ||||||||
| JHST or HU Plantation | Village, Liangxi Town, Enping City | 22.13 | 12 Sept 2007 | 60 | 2,041,949 | 2,836 | Management right | Agriculture | ||||||||
| JHST or HU Plantation | Jishilu Village of Dawan Village, Juntang Town, Enping City | 11.66 | 12 Sept 2007 | 60 | 960,416 | 1,334 | Management right | Agriculture | ||||||||
| JHST or HU Plantation | Liankai Village of Niujiang Town, Enping | 12.89 | 1 Jan 2008 | 60 | 821,445 | 1,141 | Management right | Agriculture | ||||||||
| JHST or HU Plantation | Nandu Village of Yane Village, Liangxi Town, Enping City | 16.67 | 1 Nov 2011 | 26 | 5,716,764 | 18,323 | Management right | Agriculture | ||||||||
| JHST or HU Plantation | Shangchong Village of Yane Village, Liangxi Town, Enping City | 4.57 | 1 Nov 2011 | 26 | 1,466,393 | 5,020 | Management right | Agriculture | ||||||||
| JHMC or Cattle Farm 1 | Xiaoban Village of Yane Village, Liangxi Town, Enping City | 16.67 | 1 April 2011 | 20 | 5,082,136 | 21,176 | Management right | Agriculture | ||||||||
| SJAP | Chengguan Town of Huangyuan County, Xining City, Qinghai Province | 8.54 | 1 Nov 2011 | 40 | 527,234 | 1,098 | Land use right & building ownership | Commercial | ||||||||
| JHST or HU Plantation | Niu Jiang Town, Liangxi Town, Enping City | 2.54 | 4 March 2013 | 10 | 489,904 | 4,083 | Management right (lease) | Agriculture |
License Rights
Through the past 10 years (from 2007 to present) the Company has improved and modified the Recirculating Aquaculture System (RAS)(“RAS”) originally pioneered in Germany into a unique system designed for indoor systems referred to as A Power Module (“APM indoor”indoor”) and an outdoor module called open dam RAS (“ODRAS”ODRAS”). We provide two types of licenses under this technology namely, a Developer License permitting a fishery project license to utilize the technology in its design of the APM–APM indoor or ODRAS farms, and an Operator license permitting the use of APM-indoor or ODRAS technology at their respective farms. Each license is granted a 50-year term per assigned module unit for a one-time fee of $50,000 per license, that is a $50,000 fee for rights to the Developer license and a $50,000 fee for rights to the Operator license for 50 years per developed module.
On November 12, November 2008, the Company’s subsidiary TRW entered into an agreement with the inventor of a patent, Mr. Shan Dezhang, concerning the sale and purchase of the master license rights of a patent registered in China with patent number ZL200510063039.9.
On May 15, May 2009, TRWTri-way (as licensor) entered into a sub-license agreement with SJAP (as licensee) concerning the sub-licensing of the above-mentioned patent (ZL200510063039.9). For further information on the aforementioned agreements, please refer to the section entitled “Intellectual Property Rights” above.
Carve-outs
The Company has announced that it has begun the first of three or four contemplated divestitures. The Company is currently exploring various opportunities for reorganizing or restructuring some of its current assets into new companies by means of mergers and / or acquisitions with the aim to establish higher independent fair market values for said companies (or respective related assets) by either listing each of said companies on a suitable stock exchange or selling them in a receptive market (or to a receptive buyer). The first carve-out (Tri-way) is comprised of aquaculture operations. The new company holds one single share class and shall conform to corporate governance standards assigned by the Hong Kong Securities and Futures Commission as well as the potential Stock Exchange targeted for its listing. The Company’s aquaculture operations, namely the C&S Project farms are as follows:
Establishing the proposed new company would in management’s view expedite several strategic objectives:
Because of the carve-out, Tri-way, as of October 5, 2016, is now categorized under SIAF as an investor in associate status from its original categorization as a SIAF subsidiary. Prior to the carve-out, Tri-way had assumed 100% holdings in JFD (previously, a 75% owned subsidiary) on August 16, 2016. Subsequently, Tri-way has merged / acquired in exchange for equity, all C&S farm projects and their respective assets.
Industry Overview
This section discusses the industry in which the Company operates. Certain of the information in this section relating to market environment, market developments, growth rates, market trends, industry trends, competition and similar information are estimates based on data compiled by professional organizations, consultants and analysts, in addition to market data from other external and publicly available sources.
Economic outlook in China
China’s economy is at present second only to that of the United States, having overtaken Japan’s role as number two in 2010.5The OECD expects that China’s real GDP will grow by 6.9 percent in 2016.6The IMF expects that China will be the world’s largest economy in 2017 with 18.3 percent of the world economy. The strong growth in China has delivered major improvements in living standards and poverty has been reduced dramatically.7Based on the World Bank’s classification, China recently graduated from lower to upper middle-income status. A growing emphasis on improving access to health and education as well as high investment in infrastructure have helped spread the benefits of growth nationally including in rural areas, where incomes have enjoyed consistently strong gains.
Agriculture in China
China is the world’s largest agricultural economy. It is the leading producer of many agricultural commodities such as pork, horticultural products, rice and cotton and also the largest consumer of many agricultural products, such as pork, rice and soybeans. While China generally has been successful in meeting its rapidly rising demand for food and grains by increasing domestic production, it has emerged as a leading global importer of several agricultural commodities, including cotton, soybeans, vegetable oils, and animal hides. As its domestic agricultural production, has grown, China has also become the largest exporter in global markets for several horticultural products, including mandarin oranges, apples, apple juice, garlic and other vegetables.
China’s increasingly important position in global agricultural markets followed decades of gradual growth in domestic food production and consumption. After the introduction of market-based reforms in 1978 that included the elimination of the collective production system and relaxation of government direction over certain farmer production and marketing decisions, Chinese agricultural output grew significantly. Between 1978 and 2008, China almost doubled its production of grains (rice, wheat and corn) and quadrupled its production of meats; the production of fruit and milk was about 30 times greater in 2008 than in 1978. During these three decades, population growth of about 1 percent annually, coupled with annual per capita income growth of 8 percent, fueled a significant increase in demand for more and higher-value agricultural products, especially by China’s large and growing middle class. China’s rapid growth in food consumption was largely met by domestic production growth, enabling it to remain self-sufficient in most major commodities.
About 40 percent of China’s population of 1.3 billion is employed in the agricultural sector, and agriculture contributes about 11 percent to China’s GDP.8
China’s support for agriculture
China’s government support for agriculture is low compared to that of developed countries, such as the United States and European Union, but in line with that of other rapidly growing economies, according to USITC. As measured by the OECD’s PSE9, the amount of support provided to Chinese farmers was low (and sometimes negative) during the 1990’s, but gradually rose during the period 2008-2010. Compared with other countries at a similar level of development, including Brazil, Mexico, Russia, and South Africa, China’s support for farmers falls in the middle of the range. China’s PSE reflects changes in the central government’s policy priorities from grain self-sufficiency and low consumer prices toward a stronger focus on raising farm household incomes, according to USITC. Government support to China’s agricultural sector indicates that Chinese policymakers are placing a renewed emphasis on the rural economy. Indirect support, in the form of general services, is very high relative to similar support programs in other countries, due largely to investments in agricultural infrastructure. General services include modern research and extension services, food safety agencies, and agricultural price information services, most of which provide benefits to producers and consumers throughout the economy. Compared with direct payments to farmers, general services support is less production-distorting to the sector.
5The World Bank: China 2030, Building a Modern, Harmonious, and Creative Society (pages 3, 376-377), 2013
6OECD Economic Outlook No. 92 (database)/OECD economic surveys: China 2013
7The World Bank; China 2030, Building a Modern, Harmonious, and Creative Society, 2013 (pages 3, 376-377)
8USITC: China’s Agricultural Trade: Competitive Conditions and Effects on U.S. Exports, March 2011 pages 1-1 and 1-8
9OECD: PSE is defined as the estimated monetary value of transfers from consumers and taxpayers to farmers, expressed as a percentage of gross farm receipts (defined as the value of total farm production at farmgate prices), plus budgetary support.
Agricultural consumption
China is a major global consumer of agricultural products. It consumes one-third of the world’s rice, one-fourth of all corn, and half of all pork and cotton, and it is the largest consumer of oilseeds and most edible oils. The traditional Chinese diet centers around staple foods (mainly grains and starches), which account for nearly half of the daily caloric intake. Average Chinese per capita consumption recently stabilized at approximately 3,000 calories per day, one of the highest levels among Asian countries.
Chinese food consumption is influenced by factors such as population size and demographics, income, food prices, and general preferences. Per capita income growth and urbanization are the two factors most responsible for altering recent consumption patterns in China. Rising income translates into higher per capita food consumption, while increasing urbanization is driving diversification of food choices because of greater availability and choice offered through increasingly diverse sales outlets.
Chinese consumers generally fall into one of three categories: rural consumers; urban low-income consumers; or urban high-income consumers. Although urban high-income consumers can afford to buy more and better-quality food, the ubiquity of food outlets in cities means that nearly every urban resident, regardless of income, has available an increasingly diverse food selection. Compared to rural diets, urban diets contain less grain and more non-staple items, including processed and convenience foods. Rural migrants to cities tend to adopt the urban diet.
Expenditure on food
Food is the largest class of household expenditure for all Chinese income groups; even housing takes a smaller share of average household income, according to USITC. As income rises, the absolute amount of food expenditure increases, although the share of income spent on food falls. Urban residents spend substantially more on food than their rural counterparts, according to USITC. Higher incomes lead to an increase in both the quantity and quality of food demanded. However, while demand for higher quantities of food appears to level off in the top income households, demand for higher-quality foods continues to rise with income.
Spending on food consumed outside the home is on the rise. In 2003, about 18 percent of urban household food expenditures and over 11 percent of rural household food expenditures were made outside the home. In 2008, the average per capita annual expenditure on dining out was USD 127 among urban residents, up 26 percent from a year earlier. Per capita expenditures on food consumed away from home vary among regions, with Shanghai spending the most (USD 300) and Tibet the least (USD 84). Most such expenditures are made in restaurants, both independent establishments and fast-food chains. Although consumption away from the household is increasing, most foods are still eaten at home. The exception is meat, with about half of all meat consumed outside the home.
Food preferences
Along with more varied consumption, higher incomes are leading to changing food preferences, including the demand for better quality and safer foods. Food preferences determine where urban Chinese purchase their foods, whether it be at local “wet markets”, urban supermarkets, or restaurants. Chinese value the diversity in food products that different shopping outlets offer. In the future, analysts predict that further income growth and urbanization will continue to increase demand for a variety of higher quality foods, according to USITC.
Like that of other countries at similar stages of development, the traditional Chinese diet comprises mostly grains and other starches. Consumption of non-staple, higher-value foods such as meat, dairy, fruits, vegetables, and processed food has grown significantly in the past three decades; 30 percent of the food currently consumed in China has been processed in some way, according to USITC.
China’s per capita expenditures for animal proteins for 2008 averaged USD 184, up from USD 137 in the previous year. The Chinese consume about four times as much pork as poultry, the second most popular animal protein. Pork consumption has been encouraged by improved cold storage distribution, as the product can be transported greater distances to reach more customers. Pork consumption levels are also high due to government support programs, including purchasing pork for reserves and occasionally subsidizing pork purchases for low-income consumers.
The market for aquatic products and aquaculture in China
The information in this section regarding aquatic and aquaculture, including graphs, is taken from the USDA’s GAIN Report Number: CH12073 per 12/28/2012 unless otherwise stated.10
10Definition of terms: China’s definition of aquatic products includes both cultured (farm-raised) and wild caught products; aquatic products include fish, shrimp/prawn/crab, shellfish, algae, and other. Aquatic catch production is total volume of both fresh and seawater wild caught aquatic products; Aquaculture production is the total volume of both fresh and seawater cultured (farmed) aquatic products. This report will use Chinese terminology to maintain consistency between Chinese statistics and product categories. Total aquatic trade statistics below do not include fishmeal.
Total Aquatic Products Production
China has the world’s largest aquatic production and its market share of the world’s fish production has risen from 7 percent in 1961 to 37 percent by 2012. China alone accounted for 62.3 percent of the aquaculture production in the world by volume in 2012. Aquaculture represents more than 70 percent of the total fish production in China. Total 2012 aquatic production in China increased 7.5 percent to reach 58.9 million tons, compared to the 54.8 million tons in 2011, per the FAO.11
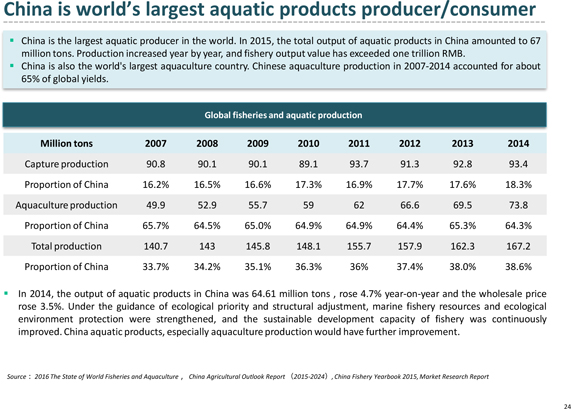
11Food Outlook, October 2014, FAO
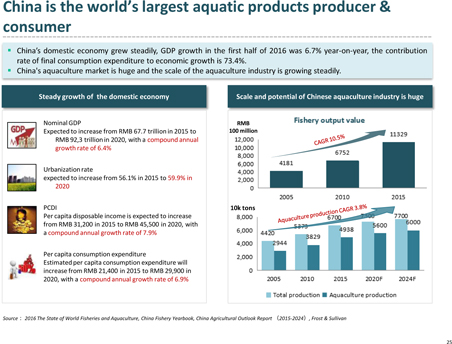
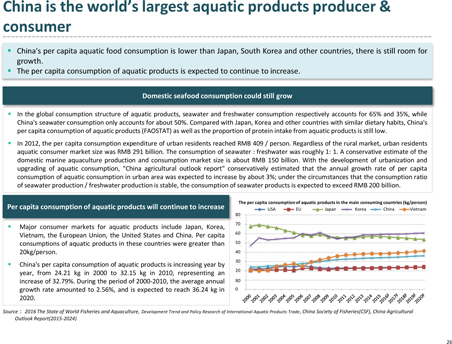
Fish production accounts for 59 percent of the total aquatic production, followed by shellfish and crustaceans at 22.6 percent and 10 percent, respectively. Fish production is, per the USDA, expected to continue its upward growth trend to reach 34.5 million tons in 2012, up from 33 million tons in 2011 and 31.3 million tons in 2010.
In 2011, Shandong, Guangdong, Fujian and Zhejiang provinces profited from favorable coastal locations and abundant freshwater resources/facilities to rank as the top four aquatic production areas. In terms of freshwater cultured production, Hubei, Guangdong, and Jiangsu provinces are the largest producers.
Aquaculture
China remains the world largest aquaculture producer with total cultured aquatic production accounting for about 70 percent of the world total in recent years. Total aquaculture production is increasing steadily and world aquaculture reached 90.4 million tons, with 66.6 million tons of food fish and 23.8 million tons of aquatic algae in 2012. Unconfirmed numbers state that world food fish aquaculture production rose 5.8 percent to 70.5 million tons in 2013. China alone accounted for 43.5 million tons of food fish and 13.5 of aquatic algae in 2013. China has had a CAGR of 5.5 percent in aquaculture production from the year 2000 through 2012.
Total aquatic products in China amounted to 59.1 million tons, where seawater aquatic products represented 30.3 million tons or 51.34 percent and freshwater aquatic products amounted to 28,743,000 tons or 48.66 percent of the total production. Fish is the most produced product and accounts for almost 61 percent of the total production, followed by shrimp, prawn and crab and shellfish. The majority of the production is in the region Shandong, Guangdong, Fujian, Zhejiang and Jiangsu. These five regions represented more than 55 percent of the total production of aquatic products in China. All regions are located nearby water and fish and other aquatic products is a common source of protein for the inhabitants in these regions.12
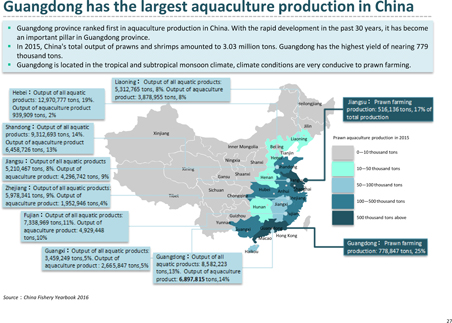
Aquatic consumption
As China’s processing and distribution systems become more developed and consumers rising affluence increases, their interest in a more diversified and nutritious diet, seafood consumption is on the increase. According to the National Statistics Bureau, the per capita consumption of aquatic products was 14.62 kg per urban dweller and 5.36 kg per rural inhabitant in 2011. Per capita consumption is expected to increase steadily, with strong growth potential in the rural sector.
The per capita consumption of aquatic products is highest in coastal regions, for example in Shanghai and Guangdong, (where aquatic products have been a traditional source of protein) and locations with relatively high disposable income.
Per the National Bureau of Statistics of China the overall price level of aquatic products increased 3.9 percent in July 2014 compared to the same month in 2013.13
Exports and imports
China is by far the largest exporter of aquatic products in the world, with total exports amounting to USD 19.6 billion in 2013 compared to Norway that is the second largest exporter in the world with exports amounting to USD 10.4 billion.
12China Statistical Yearbook 2013
13Consumer Prices for July 2014, National Bureau of Statistics of China.
China has now become the third largest importer of aquatic products, behind only the United States and Japan. Total import of aquatic products in 2013 amounted to USD 8.0 billion. The increase in the import levels in China is mainly a result of outsourcing. China’s processors import raw material from all major regions, including South and North America and Europe, for re-processing and re-export. However, this growth also reflects China’s surging domestic demand of species not available from local sources.
Recirculating Aquaculture Systems
Recirculating aquaculture systems (“RAS”) is a technology that enables the same water to be reused within the same tank, and operates through filtering this water, at a high frequency, making it an efficient and environmentally friendly method to operate water tanks. The advantages of RAS include improved productivity, lower labor requirements and lower mortality rate of the animals. Historically, the Chinese population are used to fresh aquatic products and prefer locally produced food if they can be assured of food quality and safety. Studies show that consumers overall are willing to pay an average premium of 3.9 percent for Closed Containment Aquaculture (“CCA”) compared to conventional farming methods such as sea water farming.14
The market for meat in China
China is by far the world’s largest producer and consumer of meat which includes pork, poultry and beef. Historically, this situation did not have a large impact on the rest of the world, as China, for the most part, maintained self-sufficiency in meat. However, since 2007 the situation has changed dramatically. China has gradually turned into a net importer of meats.
World meat production was around 308.5 million tons in 2013.15 China’s meat production reached 86.05 million tons in 2013. China’s total meat production was more than double of any other country in the world, where total meat production in the United States amounted to 42.80 million tons in 2013.
With strong economic growth, China’s urbanization has occurred at a faster pace than commonly expected. By the end of 2011, the urban population for the first time exceeded the rural population, reaching 51.3 percent of the total population. If rural migrants working in urban areas are included, the population working and living in urban areas accounted for about 70 percent of the total population. Urbanization and rising purchasing power has led to a dietary pattern change switching from the consumption of traditional food grain products to an increase in consumption of meat.16 The change in consumer preferences, meaning higher priced red meat representing a major part of Chinese consumers’ main protein source, partly derives from the perception that consumption of red meat is equal to higher status than consumption of poultry or pork.17
There are several other specific market drivers which underpin the increase in demand for red meat. One driver is the improved living standard in China which stimulates the growth of beef markets since beef often sells at a much higher price and traditionally has been more expensive than what most people can afford. Another is the fact that Chinese people’s dietary structure is becoming more diversified and reasonable, bringing larger amount of beef consumption since beef has nutritional benefits. Lastly, a gradual lowering of import taxes is likely to support sufficient supply of cattle.
The strong rise in feed grain prices in the past five years is now moving substantially through the market chain and is being reflected in higher meat prices except for poultry where adjustments have been made. On the contrary, world meat consumption continues to grow at one of the highest rates among major agricultural commodities. Thus, developing countries can expect an increase in meat imports despite strong meat prices, driven by population and income growth with high elasticity of demand. Equally so, strong prices will result in sustained export earnings, which will encourage large meat exporting countries to invest in international meat markets. When breaking the expected increase of demand down by region it is evident that the Asia and Pacific region is projected to stand for the largest increase in demand by far.18
Market drivers
The improvement of living standard stimulates the growth of beef markets:
Traditionally, Chinese people eat pork and chicken to satisfy their desire for meat. This is largely due to the much higher price of beef which goes beyond normal people’s affordable level. With the improvement of living standards, Chinese people have begun the upgrade of their consumption of meat, and began to eat more beef.
Chinese people’s dietary structure becomes more diversified and reasonable, bringing larger amount of beef consumption:
14Review of Recirculation Aquaculture System Technologies and their Commercial Application, Stirling Aquaculture, Institute of Aquaculture.
15Food Outlook Global Market Analysis, FAO, October 2014
16China’s growing appetite for meats: Implications for World meat trade. A Multi-Client Study, April 2012
17China and Hong Kong: Food Opportunities for Maine, Maine International Trade Center, March 2012
18Meat - OECD-FAO Agricultural Outlook 2012-2021
At present, Chinese people are changing their diet patterns to higher and richer nutrition. From a nutritional perspective, beef not only contains high unsaturated fatty acids and high protein, it also has low fat and lots of nutrition, which makes it perfect for the healthy diet. Thus, in the future, beef is expected to replace some parts of the market shares in pork, chicken and other meats.19
The market for fertilizer in China
Sales of fertilizers are expected to be supported by healthy expansion of agricultural activities as the amount of sown areas continues to grow and rural income levels rise. Farmers will continue to register steadily increasing incomes, the result of growing crop prices and government subsidies designed to supplement their revenues and reduce their material costs. Subsidies aimed directly at cutting the cost of fertilizers is expected to encourage additional use. In addition, rising crop prices have encouraged farmers to invest in fertilizers to further boost crop yields. Advances will also be driven by increases in the acreage of sown land dedicated to growing cash crops. However, increasing demand for organic food and improved understanding of the correct application of fertilizers is expected to prevent demand from rising at a faster pace.
In value terms, fertilizer demand is expected to grow 6.0 percent per year to RMB 548 billion, outpacing gains in volume terms. Faster value growth will be driven by strong demand for higher value multi-nutrient fertilizers. In addition, advances will be supported by continued growth in fertilizer prices as the cost of natural gas, oil, coal, and other raw materials continues to increase.
Demand for fertilizer nutrients in China is projected to grow 4.4 percent annually through 2015 to 98.1 million metric tons. Nutrient demand will be stimulated by increasing use of higher nutrient level products as income levels grow in rural areas in China. In addition, government efforts to promote multi-nutrient fertilizers will also support gains in fertilizer nutrient demand. Accounting for more than three-fourths of total fertilizer demand in 2010, single-nutrient fertilizers will remain the larger product type through 2015, despite a relatively low growth rate of 2.1 percent per year. Sales of single nutrient fertilizers will continue to be supported by their relatively low prices.
The size, growth and composition of fertilizer demand in the six regions that make up China vary considerably. The Central-South and Central-East will remain the two largest regional fertilizer markets. Due to the comparatively high income levels in the Central-South and Central-East-which enable residents to afford more expensive food items- demand for cash crops such as fruits and vegetables will rise in these regions, which in turn will fuel demand for fertilizer. Sales in the Northeast and Northwest regions will outpace the average through 2015, benefiting from the Great Western Development Strategy, the Northeast Revitalization Policy, and increasing income levels for farmers.20
In 2006, the central government started a program intended to partially compensate farmers for price increases in fuel, fertilizer and other agricultural inputs. In the case of fertilizers, government support is part of several separate programs targeting fertilizer producers, with cost reductions being passed along to farmers purchasing the input. By 2009, fuel and fertilizer subsidies totaled USD 10.5 billion.21
Market for fruits and vegetables in China
The information in this section regarding the market for fruit in China is taken from the International Trade Center report “Overview of the markets for selected tropical fruits and vegetables in China” unless otherwise stated.
China is the biggest producer of fruit in the world, with a total of approximately 10,734,259 hectares of fruit planting area and a fruit output of approximately 192,202,000 tons as of 2008, according to the National Bureau of Statistics of the PRC. The per capita annual fruit consumption in China as of 2008 amounted 149 kilograms per capita, well above the global average of 69.09 kilograms per capita, according to FAO. In 2009, China exported 5,255,000 tons of fruit, an 8.5 percent year-on-year increase compared to the previous year, equivalent to a value USD 3.83 billion according to China Customs. The Chinese import of fruit in 2009 amounted to 2,309,000 tons, valued to USD 1.63 billion, a 37.0 percent increase year-on-year compared to 2008. This led to a fruit trade surplus of USD 2.2 billion, approximately a 27.6 percent decrease compared to 2008 according the Ministry of Agriculture of the PRC.
The global tropical fruit output, where the dragon fruit (Hylocereus Undatus) is included, reached roughly 82,700,000 tons in 2008 according to FAO. The output was led by mango, followed by pineapple, guava and avocado. According to the Ministry of Agriculture of the PRC, tropical fruit accounted for approximately 25 percent of the total fruit planting area in China in 2009, equivalent to roughly 2,500,000 hectares providing a total output of more than 20,000,000 tons. The research adds that an additional 17,500,000 hectares spread over China is suitable for planting tropical fruits.
The most commonly consumed tropical fruits in China are pineapple, mango, banana, litchi, coconut, longan and cashew. However, demand for, e.g., mangosteen, star fruit, durian and dragon fruit is quickly growing among the population in the first and second tier cities. The China Fruit Marketing Association estimates that the consumption of tropical fruits accounts for roughly 10 percent of all the fruit in China, equivalent to approximately 19,000,000 tons. Analysts estimate that about 80 percent of the tropical fruit in China is consumed fresh, contrary to canned or processed fruit.
19Frost & Sullivan: China’s beef market has great growth potential
20Fertilizers in China, Industry Study with Forecasts for 2015 & 2020, Freedonia Group; June 2012
22USITC: China’s Agricultural Trade: Competitive Conditions and Effects on U.S. Exports, March 2011
Consumer trends
Consumers in the northern and central parts of China generally prefer more sweet tasting fruit, preferably tropical fruits. In the southern regions of China however, the population consumes a broader range of fruits. Overall in China, consumers have started to consume more fruit with distinctive smells, for example durian and jackfruit. During recent years there has been a significant increase in consumption of more expensive fruit, such as durian, mangosteen and jackfruit thanks to the increasing standard of living of the population as well as the increased availability of such imported fruits.
The most commonly consumed imported fruits in China include kiwi, durian, mangosteen, grapes, cherries and dragon fruit. Generally, the Chinese population prefers to consume fresh fruit; so when domestic, fresh fruit is available during summer, consumption of the fresher and cheaper domestic fruit increases. In winter, when domestic products cannot be harvested or sold, the import of fruits, and especially tropical fruits, increases immensely.
Organic fruits are mostly sold domestically in China and have become increasingly popular in the market; however, the supply is still relatively small and the price is still more expensive (approximately RMB 1-2 more expensive per kg).
GOVERNMENT REGULATION
Regulation of M&A and Overseas Listings
On August 8, 2006, six PRC regulatory agencies, including the Ministry of Commerce (the “MOFCOM”), the State Assets Supervision and Administration Commission, the State Administration of Taxation (“SAT”), the State Administration of Industry and Commerce (the “SAIC”), the China Securities Regulatory Commission (“CSRC”), and the State Administration of Foreign Exchange (the “SAFE”), jointly issued the Regulations on Mergers and Acquisitions of Domestic Enterprises by Foreign Investors (the “M&A RuleRules”), which became effective on September 8, 2006 and was amended on June 22, 2009. The M&A Rule includesRules include provisions that purport to require that an offshore special purpose vehicle formed for purposes of the overseas listing of equity interests in PRC companies and controlled directly or indirectly by PRC companies or individuals obtain the approval of the CSRC prior to the listing and trading of such special purpose vehicle’s securities on an overseas stock exchange.
On September 21, 2006, the CSRC published on its official Website procedures regarding its approval of overseas listings by special purpose vehicles. The CSRC approval procedures require the filing of a number of documents with the CSRC. The application of this new PRC regulation remains unclear, with no consensus currently existing among leading PRC law firms regarding the scope of the applicability of the CSRC approval requirement.
The M&A Rules also establish procedures and requirements that could make some acquisitions of Chinese companies by foreign investors more time-consuming and complex, including requirements in some instances that the MOFCOM be notified in advance of any change-of-control transaction in which a foreign investor takes control of a Chinese domestic enterprise.
In February 2011, the General Office of the State Council promulgated a Notice on Establishing the Security Review System for Mergers and Acquisitions of Domestic Enterprises by Foreign Investors (“Circular 6”), which established a security review system for mergers and acquisitions of domestic enterprises by foreign investors. Under Circular 6, a security review is required for mergers and acquisitions by foreign investors having “national defense and security” concerns and mergers and acquisitions by which foreign investors may acquire “de facto control” of domestic enterprises with “national security” concerns. In August 2011, the MOFCOM promulgated the Rules on Implementation of Security Review System (the “MOFCOM Security Review Rules”), to replace the Interim Provisions of the Ministry of Commerce on Matters Relating to the Implementation of the Security Review System for Mergers and Acquisitions of Domestic Enterprises by Foreign Investors promulgated by the MOFCOM in March 2011. The MOFCOM Security Review Rules, which came into effect on September 1, 2011, provide that the MOFCOM will look into the substance and actual impact of a transaction and prohibit foreign investors from bypassing the security review requirement by structuring transactions through proxies, trusts, indirect investments, leases, loans, control through contractual arrangements or offshore transactions.
On October 23, 2019, the SAFE issued the Notice of the State Administration of Foreign Exchange to Further the Facilitation of Cross-border Trade and Investment, which cancelled restrictions on the use by foreign-invested companies that are not investment companies of their capital funds for equity investments.
Regulation of Foreign Currency Exchange and Dividend Distribution
The principal regulations governing foreign currency exchange in China are the Foreign Exchange Administration Regulations (the “FX Regulations”), which were last amended in August 2008. Under the FX Regulations, the RMB is freely convertible for current account items, including the distribution of dividends, interest payments, trade and service-related foreign exchange transactions, but not for capital account items, such as direct investments, loans, repatriation of investments and investments in securities outside of China, unless the prior approval of the SAFE is obtained and prior registration with the SAFE is made. On August 29, 2008, the SAFE issued a notice, Circular 142,, regulating the conversion by a foreign-invested company of foreign currency into RMB by restricting how the converted RMB may be used. Circular 142 requires that the registered capital of a foreign-invested company settled in RMB converted from foreign currencies may only be used for purposes within the business scope approved by the applicable governmental authority and may not be used for equity investments within the PRC. In addition, the SAFE increased its oversight of the flow and use of the registered capital of a foreign-invested company settled in RMB converted from foreign currencies. The use of such RMB capital may not be changed without the SAFE’s approval, and may not in any case be used to repay RMB loans if the proceeds of such loans have not been used. Violations of Circular 142 will result in severe penalties, such as heavy fines. As a result, Circular 142 may significantly limit our ability to transfer cash or other assets from Sino Agro Food, Inc.The Company and/or our other non-PRC subsidiaries into our subsidiaries in the PRC, which may adversely affect our business expansion and we may not be able to convert the net proceeds into RMB to invest in or acquire any other PRC companies, or establish other variable interest entities (“VIEs”) in the PRC.
Dividends paid by a PRC subsidiary to its overseas shareholder are deemed income of the shareholder and are taxable in the PRC. Pursuant to the Administration Rules of the Settlement, Sale and Payment of Foreign Exchange (1996), foreign-invested enterprises in the PRC may purchase or remit foreign currency, subject to a cap approved by the SAFE, for settlement of current account transactions without the approval of the SAFE. Foreign currency transactions under the capital account are still subject to limitations and require approvals from, or registration with, the SAFE and other relevant PRC governmental authorities.
In October 2005, the SAFE promulgated the Relevant Issues Concerning Foreign Exchange Control on Domestic Residents’ Corporate Financing and Roundtrip Investment through Offshore Special Purpose Vehicles (“Circular 75”). Under Circular 75, which was issued by SAFE effective November 1, 2005, prior registration with the local SAFE branch is required for PRC residents to establish or to control an offshore company for the purposes of financing that offshore company with assets or equity interests in an onshore enterprise located in the PRC. An amendment to the registration or filing with the local SAFE branch by such PRC resident is also required for the injection of equity interests or assets of an onshore enterprise in the offshore company or overseas funds raised by such offshore company, or any other material change involving a change in the capital of the offshore company. Moreover, Circular 75 applies retroactively. As a result, PRC residents who, prior to November 1, 2005, had established or acquired control of offshore companies that had made onshore investments in the PRC prior to were required to complete the relevant registration procedures with the local SAFE branch by March 31, 2006.
Since May 2007, the SAFE has issued a series of guidance to its local branches with respect to the operational process for the SAFE registration under Circular 75. The guidance provides more specific and stringent supervision of the registration required by Circular 75. For example, the guidance imposes obligations on onshore subsidiaries of an offshore entity to make true and accurate statements to the local SAFE authorities regarding any shareholder or beneficial owner of the offshore entity who is a PRC citizen or resident. Untrue statements by the onshore subsidiaries will lead to potential liability for the subsidiaries and, in some instances, for their legal representatives and other related individuals.
Under the relevant rules, failure to comply with the registration procedures set forth in Circular 75 may result in restrictions being imposed on the foreign exchange activities of the relevant onshore company, including increases in its registered capital, payment of dividends and other distributions to its offshore parent or affiliate and capital inflows from the offshore entity, and may also subject relevant PRC residents to penalties under PRC foreign exchange administration regulations. PRC residents who control our company from time to time are required to register with the SAFE in connection with their investments in us.
On December 25, 2006, the People’s Bank of China (the “PBOC”) issued the Administration Measures on Individual Foreign Exchange Control and related Implementation Rules were issued by the SAFE on January 5, 2007. Both became effective on February 1, 2007. Under these regulations, all foreign exchange transactions involving an employee share incentive plan, share option plan, or similar plan participated in by onshore individuals may be conducted only with approval from the SAFE or its authorized branch. Under the Notice of Issues Related to the Foreign Exchange Administration for Domestic Individuals Participating in Stock Incentive Plan of Overseas Listed Company (“Offshore Share Incentives Rules”), which was issued by the SAFE on February 15, 2012, PRC citizens who are granted share options, restricted share units or restricted shares by an overseas publicly listed company are required to register with the SAFE or its authorized branch and to comply with a series of other requirements. If we, or the PRC employees of ours who hold options, restricted share units or restricted shares fail to comply with these registration or other procedural requirements, we, and/or such employees may be subject to fines and other legal sanctions.
The principal regulations governing distribution of dividends of foreign holding companies include the Foreign Investment Enterprise Law (1986), which was amended in October 2000, and the Administrative Rules under the Foreign Investment Enterprise Law (2001). Under these regulations, foreign investment enterprises in China may pay dividends only out of their accumulated profits, if any, determined in accordance with PRC accounting standards and regulations. In addition, foreign investment enterprises in China are required to allocate at least 10% of their accumulated profits each year, if any, to fund certain reserve funds unless these reserves have reached 50% of the registered capital of the enterprises. These reserves are not distributable as cash dividends.
Laws and Regulations Related to Employment and Labor Protection
On June 29, 2007, the National People’s Congress promulgated the Employment Contract Law of PRC (“Employment Contract Law”), which became effective as of January 1, 2008, and was amended on December 28, 2012. The Employment Contract Law requires employers to provide written contracts to their employees, restricts the use of temporary workers and aims to give employees long-term job security.
Pursuant to the Employment Contract Law, employment contracts lawfully concluded prior to the implementation of the Employment Contract Law and continuing as of the date of its implementation shall continue to be performed. Where an employment relationship was established prior to the implementation of the Employment Contract Law but no written employment contract was concluded, a contract must be concluded within one month after its implementation.
On September 18, 2008, the State Council promulgated the Implementing Regulations for the PRC Employment Contract Law which came into effect immediately. These regulations interpret and supplement the provisions of the Employment Contract Law.Law.
As of December 31, 2015,2020, we had entered written employment contracts with three of our employees.
Income Tax
On March 16, 2007, the National People’s Congress approved and promulgated the Enterprise Income Tax Law (the “EIT Law”). On December 6, 2007, the State Council approved the Implementing Rules. Both the EIT Law and its Implementing Rules became effective on January 1, 2008. Under the EIT Law and the Implementing Rules, which superseded the previous Income Tax Law, the enterprise income tax rate for both domestic companies and foreign invested enterprises is unified at 25%. On December 26, 2007, the State Council promulgated the Circular on Implementation of Enterprise Tax Transition Preferential Policy, or the Preferential Policy Circular. The EIT Law, its Implementing Rules and the Preferential Policy Circular provide a five-year transitional period for certain entities that had enjoyed a favorable income tax rate of less than 25% under the previous Income Tax Law and were established before March 16, 2007, during which period the applicable enterprises income tax rate shall gradually increase to 25%.
On April 14, 2008, the Administration Measures for Recognition of High and New Technology Enterprises, or the Recognition Measures, were jointly promulgated by the Ministry of Science and Technology, the Ministry of Finance, and the SAT, which sets out the standards and process for granting the high and new technology enterprises status. According to the EIT Law and its Implementing Rules as well as the Recognition Measures, enterprises which have been granted the high and new technology enterprises status shall enjoy a favorable income tax rate of 15%. The new EIT Law and its Implementation Rules also provide that “software enterprises” enjoy a two-year income tax exemption starting from the first profit making year, followed by a reduced tax rate of 12.5% for the subsequent three years.
The EIT Law also provides that an enterprise established under the laws of a foreign country or region but whose “de facto management body” is in the PRC be treated as a resident enterprise for PRC tax purposes and consequently be subject to the PRC income tax at the rate of 25% for its global income. The Implementing Rules merely defines the location of the “de facto management body” as “the place where the exercising, in substance, of the overall management and control of the production and business operation, personnel, accounting, properties, etc., of a non-PRC company is located.” The SAT issued the Circular regarding the Determination of Chinese-Controlled Offshore Incorporated Enterprises as PRC Tax Resident Enterprises on the Basis of De Facto Management Bodies, or Circular 82, on April 22, 2009. Circular 82 provides certain specific criteria for determining whether the “de facto management body” of a Chinese-controlled offshore-incorporated enterprise is located in China. The SAT issued the Bulletin regarding the Administrative Measures on the Income Tax of Chinese-Controlled Offshore Incorporated Resident Enterprises (Interim) on July 27, 2011, which became effective on September 1, 2011, providing more guidance on the implementation of Circular 82. This bulletin clarifies matters including resident status determination, post-determination administration and competent tax authorities. Although both Circular 82 and the bulletin only apply to offshore enterprises controlled by PRC enterprises, not companies like us, the determining criteria set forth in Circular 82 and the bulletin may reflect the SAT’s general position on how the “de facto management body” test should be applied in determining the tax resident status of offshore enterprises, regardless of whether they are controlled by PRC enterprises or individuals. Based on a review of surrounding facts and circumstances, the Company does not believe that it is likely that its operations outside of the PRC should be considered a resident enterprise for PRC tax purposes. However, due to limited guidance and implementation history of the EIT Law, should the Company be treated as a resident enterprise for PRC tax purposes, the Company will be subject to PRC tax on worldwide income at a uniform tax rate of 25% retroactive to January 1, 2008.
The EIT Law also imposes a withholding income tax of 10% on dividends distributed by a Foreign Invested Enterprise (an “FIE”) to its immediate holding company outside of China if such immediate holding company is considered a non-resident enterprise without any establishment or place within China or if the received dividends have no connection with the establishment or place of such immediate holding company within China, unless such immediate holding company’s jurisdiction of incorporation has a tax treaty with China that provides for a different withholding arrangement. Such withholding income tax was exempted under the previous law. The State of Nevada, where the Company is incorporated, does not have such tax treaty with China. The SAT further promulgated a circular, or Circular 601, on October 27, 2009, which provides that the tax treaty benefits will be denied to “conduit” or shell companies without business substance and that a beneficial ownership analysis will be used based on a “substance-over-form” principle to determine whether to grant the tax treaty benefits. Most our subsidiaries in China are directly held by our non-Chinese subsidiaries. If we are regarded as a non-resident enterprise and our non-Chinese subsidiaries are regarded as resident enterprises, then our non-Chinese subsidiaries may be required to pay a 10% withholding tax on any dividends payable to us. If our non-Chinese subsidiaries are regarded as non-resident enterprises, then our PRC subsidiaries may be required to pay a 5% withholding tax for any dividends payable to our non-Chinese subsidiaries, however, it is still unclear at this stage whether Circular 601 applies to dividends from our PRC subsidiaries paid to our non-Chinese subsidiaries, and if our non-Chinese subsidiaries were not considered as “beneficial owners” of any dividends from their PRC subsidiaries, whether the dividends payable to our non-Chinese subsidiaries would be subject to withholding tax at a rate of 10%.
The EIT Law and its Implementation Rules have tried to scrutinize transactions between related parties. Pursuant to the EIT Law and its Implementation Rules, the tax authorities may impose mandatory adjustment on tax due to the extent a related party transaction is not in line with arm’s-length principle or was entered with a purpose to reduce, avoid or delay the payment of tax. On January 8, 2009, the SAT issued the Implementation Measures for Special Tax Adjustments (Trial), which clarifies the definition of “related party” and sets forth the tax-filing disclosure and documentation requirements, the selection and application of transfer pricing methods, and transfer pricing investigation and assessment procedures.
On December 10, 2009, the SAT issued a circular on Strengthening the Administration of Enterprise Income Tax Collection on Income Derived from Equity Transfer by Non-resident Enterprise, or Circular 698. Pursuant to Circular 698, non-resident enterprises should declare any direct transfer of equity interest of PRC resident enterprises and pay taxes in accordance with the EIT Law and relevant laws and regulations. For an indirect transfer, if the effective tax rate for the transferor (a non-PRC-resident enterprise) is lower than 12.5% under the law of the jurisdiction of the direct transferred target, the transferor is required to submit relevant transaction materials to PRC tax authorities for review. If such indirect transfer is determined by PRC tax authorities to be a transaction without any reasonable business purpose other than for tax avoidance, the gains derived from such transfer will be subject to PRC income tax.
On February 3, 2015, the SAT issued a Public Notice [2015] No. 7, or Public Notice 7, to supersede existing provisions in relation to the Indirect Transfer as set forth in Circular 698, while the other provisions of Circular 698 remain in force. Public Notice 7 introduces a new tax regime that is significantly different from that under Circular 698. Public Notice extends its tax jurisdiction to capture not only Indirect Transfer as set forth under Circular 698 but also transactions involving transfer of immovable property in China and assets held under the establishment and place in China of a foreign company through the offshore transfer of a foreign intermediate holding company. Public Notice 7 also addresses the transfer of the equity interest in a foreign intermediate holding company widely. In addition, Public Notice 7 provides clearer criteria than Circular 698 on how to assess reasonable commercial purposes and introduces safe harbor scenarios applicable to internal group restructurings. However, it also brings challenges to both the foreign transferor and transferee of the Indirect Transfer as they have to make self-assessment on whether the transaction should be subject to PRC tax and to file or withhold the PRC tax accordingly.
The PRC tax authorities have the discretion under SAT Circular 59, Circular 698 and Public Notice 7 to make adjustments to the above, aftertaxable capital gains based on the EIT Law and its Implementing Rules were promulgated,difference between the SAT released several regulations to stipulate more details for carrying out the EIT Law and its Implementing Rules. These regulations include:
operations.
| RISK FACTORS. |
Investing in our common stock involves a high degree of risk. You should carefully consider each of the following risks and all other information in this Annual Report before deciding to invest in our common stock. If any of these risks actually occur, our business, financial condition, results of operations, and our future growth prospects would suffer. Under these circumstances, the share price and value of our common stock could decline and you could lose all or part of your investment. The risks and uncertainties described in this Annual Report are the only material risks and uncertainties that we presently know to be facing our company.
This Annual Report contains forward-looking statements. Forward-looking statements anticipate future events or future financial performance. This Annual Report also contains market data related to our business and industry. This market data includes projections that are based on a number of assumptions. If these assumptions turn out to be incorrect, actual results may differ from projections based on them. As a result, our markets may not grow at the rates projected by these data, or at all. The failure of these markets to grow at these projected rates may have a material adverse effect on our business, results of operations, financial condition and the market price of our common stock.
25
Currently, we conduct our business operations in the People’s Republic of China. As China’s economy and its laws, regulations and policies may and do differ from those found in the West, and change continually, we face certain risks that are summarized in this section.
Risks Related to Our Company
TheSubsequent to the Tri-way carve-out, the number of direct major customers associated with SIAF subsidiaries has resulted in increasing dependence on a few major customers.been reduced.
AfterSubsequent to the Tri-way carve-out, the number of direct major customers associated with SIAF subsidiaries has been reduced, with the concentration of major customers now handled through the SJAP and SIAF/CA’s import/export trading division (the “Corporate Division”) via its main distribution agent, Shanghai VigorVirgo Trading Co. Ltd. (“Vigor”Virgo”), such that a loss of business with VigorVirgo will have an adverse effect on SIAF’s Corporate Division operational performance. The Corporate Division accounted for 52.77%8.2% of consolidated revenues during the fiscal year ended December 31, 2016.2018.
We may be unable to maintain an effective system of internal control over financial reporting, and as a result we may be unable to accurately report our financial results.
Our reporting obligations as a public company place a significant strain on our management, operational and financial resources and systems. If we fail to maintain an effective system of internal control over financial reporting, we could experience delays or inaccuracies in reporting our financial information, or non-compliance with SEC reporting and other regulatory requirements. This could subject us to regulatory scrutiny and result in a loss of public confidence in our management, which could, among other things, cause our stock price to drop.
Because we will require additional financing to expand our vertically integrated operations according to our business plan and growth strategy, our failure to obtain necessary financing will impair our growth strategy; in addition, the risks of vertical integration are significant.
As of December 31, 2016,2018, we had net working capital of $297,338,248,$175,208,848, including cash and cash equivalents of $2,576,058.$4,950,799. Our capital requirements to accomplish our planned vertically integrated development and growth plan of our business are significant.
In most developed countries, risks of agriculture operations are shared to a certain degree by different sectors in the industry. For example:
| · | Research and development are often initiated and supported by government departments; |
| · | Primary producers are mainly concerned with the growing risks of the produce; |
| · | Marketing companies assume the risks of marketing the produce; |
| · | Trading houses sell the produce and assume the credit risks of the sales; and |
| · | Logistics companies assume the risks of transporting the produce. |
However, as a vertically integrated operator, we must assume all the above-mentioned risks. China is a developing country; compared to other developed nations, its agriculture industry is not modern. Thus, management believes that it is essential for us to develop our business operation in a vertically integrated manner so that we can achieve reasonable profit margins for our products. We believe that the multiple layers of profits generated through vertical integration may compensate to some degree for the variety of risks that we face through the multiple operations; however, the overall risks are much greater. At the same time, our five-yearfive year plan for vertically integrated developments is not fully completed, and the remaining developments may require significant capital expenditures and management resources. Failure to implement these vertically integrated developments could hurt our ability to manage our growth and our financial position.
To accomplish the objectives discussed above and to execute our business strategy, we need access to capital on appropriate terms. We currently have no commitments with any third party to obtain such additional financing and we cannot assure you that we will be able to obtain the requisite additional financing on any terms and, if we canare able to raise additional funds, it may be necessary for us to sell our securities at a price which is at a significant discount from the market price and on other terms which may be disadvantageous to us. AboutIn connection with any such financing, we may be required to provide registration rights to the investors and pay damages to the investors ifin the event that the registration statement is not filed or declared effective by specified dates. The price and terms of any financing which would be available to us could result in both the issuance of a significant number of shares and significant downward pressure on our stock price. We cannot assure you that our business objectives, particularly over the longer term, will be met on a timely basis, if at all. Consequently, we may be unable to meet fixed obligations and expenses that will be generated in the operation of our business, whether as presently in existence or as proposed. Any failure to obtain requisite financing on acceptable terms could have material and adverse effect on our business, financial condition and future prospects.
No assurance of successful expansion of operations.
Our significant increase in the scope and the scale of our operations, including the hiring of additional personnel, has resulted in significantly higher operating expenses. We anticipate that our operating expenses will continue to increase. Expansion of our operations may also make significant demands on our management, finances and other resources. Our ability to manage the anticipated future growth, should it occur, will depend upon a significant expansion of our accounting and other internal management systems and the implementation and subsequent improvement of a variety of systems, procedures and controls. We cannot assure that significant problems in these areas will not occur. Failure to expand these areas and implement and improve such systems, procedures and controls in an efficient manner at a pace consistent with our business could have a material adverse effect on our business, financial condition and results of operations. We cannot assure that attempts to expand our marketing, sales, manufacturing and customer support efforts will succeed or generate additional sales or profits in any future period. As a result of the expansion of our operations and the anticipated increase in our operating expenses, along with the difficulty in forecasting revenue levels, we expect to continue to experience significant fluctuations in its results of operations.
We may be unable to successfully expand our production capacity, which could result in material delays, quality issues, increased costs and loss of business opportunities, which may negatively impact our product margins and profitability.
Part of our future growth strategy is to increase our production capacity to meet increasing demand for our goods. Assuming we obtain sufficient funding to increase our production capacity, any projects to increase such capacity may not be constructed on the anticipated timetable or within budget. We may also experience quality control issues as we implement any production upgrades. Any material delay in completing these projects, or any substantial cost increases or quality issues aboutin connection with these projects could materially delay our ability to bring our products to market and adversely affect our business, reduce our revenue, income and available cash, all of which could harm our financial condition.
Our business and operations are growing rapidly. If we fail to effectively manage our growth, our business and operating results could be harmed.
We have experienced, and may continue to experience, rapid growth in our operations. This has placed, and may continue to place, significant demands on our management, operational and financial infrastructure. If we do not manage our growth effectively, the quality of our products and services could suffer, which could negatively affect our operating results. To effectively manage our growth, we must continue to improve our operational, financial and management controls and reporting systems and procedures. These systems improvements may require significant capital expenditures and management resources. Failure to implement these improvements could hurt our ability to manage our growth and our financial position.
If the Chinese government were to change its presently favorable policy toward the agriculture industry, we would no longer enjoy our present tax-related privileges, which would materially and adversely impact our sales performance, margins, and net profit and our costs structure.
As producers active in the agriculture industry, our subsidiaries are presently exempt from income tax and enjoy various incentive grants and subsidies given by the Chinese government. If the Chinese government were to change its presently favorable policy toward the agriculture industry, we would no longer enjoy our present tax-related privileges, which would materially and adversely impact our sales performance, margins, and net profit and our costs structure. We have experienced, and may continue to experience, quick changes of policies by the Chinese government. If we do not effectively and efficiently manage our growth on time due to lack of capital, we could suffer adversely from the consequences of any such policy changes.
Our intellectual property rights are valuable, and any inability to adequately protect, or uncertainty regarding validity, enforceability or scope of them could undermine our competitive position and reduce the value of our products, services and brand, and litigation to protect our intellectual property rights may be costly.
We attempt to strengthen and differentiate our product portfolio by developing new and innovative products and product improvements. As a result, our patents, trademarks, trade secrets, copyrights and other intellectual property rights are important assets to us. Various events outside of our control pose a threat to our intellectual property rights as well as to our products and services. For example, effective intellectual property protection may not be available in China and other countries in which our products are sold. Also, although we have registered our trademark in China, our efforts to protect our proprietary rights may not be sufficient or effective. Any significant impairment of our intellectual property rights could harm our business or our ability to compete and hurt our results of operation. Also, protecting our intellectual property rights is costly and time consuming. Policing unauthorized use of our proprietary technology can be difficult and expensive. Litigation might be necessary to protect our intellectual property rights. But due to the relative unpredictability of the Chinese legal system and potential difficulties to enforce a court’s judgment in China, there is no guarantee that litigation would result in a favorable outcome. Furthermore, any such litigation may be costly and may divert our management’s attention from our core business. An adverse determination in any lawsuit involving our intellectual property is likely to jeopardize our business prospects and reputation. Although we are not aware of any of such litigation, we have no insurance coverage against the litigation costs so we would be forced to bear all litigation costs if we cannot recover them from other parties. All foregoing factors could harm our business, financial condition, and results of operations. Any unauthorized use of our intellectual property could make it more expensive for us to do business and harm our operating results.
We may be exposed to infringement or misappropriation claims by third parties, which, if determined against us, could adversely affect our business and subject us to significant liability to third parties.
Our success mainly depends on our ability to use and develop our technology and product designs without infringing upon the intellectual property rights of third parties. We may be subject to litigation involving claims of patent infringement or violations of other intellectual property rights of third parties. Holders of patents and other intellectual property rights potentially relevant to our product offerings may be unknown to us, which may make it difficult for us to acquire a license on commercially acceptable terms. There may also be technologies licensed to us and that we rely upon that are subject to infringement or other corresponding allegations or claims by third parties which may damage our ability to rely on such technologies. In addition, although we endeavor to ensure that companies that work with us possess appropriate intellectual property rights or licenses, we cannot fully avoid the risks of intellectual property rights infringement created by suppliers of components used in our products or by companies we work with in cooperative research and development activities. Our current or potential competitors may have obtained or may obtain patents that will prevent, limit or interfere with our ability to make, use or sell our products. The defense of intellectual property claims, including patent infringement suits, and related legal and administrative proceedings can be both costly and time consuming, and may significantly divert the efforts and resources of our technical personnel and management. These factors could effectively prevent us from pursuing some or all of our business operations and result in our customers or potential customers deferring, canceling or limiting their purchase or use of our products, which may have a material adverse effect on our business, financial condition and results of operations.
We rely on highly skilled personnel and the continuing efforts of our executive officers and, if we are unable to retain, motivate or hire qualified personnel, our business may be severely disrupted.
Our performance largely depends on the talents, knowledge, skills, know-how and efforts of highly skilled individuals and in particular, the expertise held by our chief executive officer, Solomon Lee. His absence, were it to occur, could impact development and implementation of our projects and businesses. Our future success depends on our continuing ability to identify, hire, develop, motivate and retain highly skilled personnel for all areas of our organization. Our continued ability to compete effectively depends on our ability to attract new technology developers and to retain and motivate our existing contractors. If one or more of our executive officers are unable or unwilling to continue in their present positions, we may not be able to replace them readily, if at all. Therefore, our business may be severely disrupted, and we may incur additional expenses to recruit and retain new officers. In addition, if any of our executives joins a competitor or forms a competing company, we may lose some customers.
Our financial and operating performance may be adversely affected by epidemics, adverse weather conditions, natural disasters and other catastrophes.
Our financial and operating performance may be affected adversely by epidemics, bad weather conditions, natural disasters and other catastrophes. For example,Our HU plantation and Mega Farm is situated in early 2003, several economiesEnping district and Zhongshan district which are subject to flooding, especially during the typhoon season (from July through September); for examples we lost many live fish and prawns grown in Asia, including China, were affectedour open dam area of 450 Mu at the Zhongshan Mage Farm due to flooding in 2017 and again the same farm lost most of its fish breed stocks due to power stoppage caused by the outbreaktyphoon; meanwhile, at Enping’s HU Plantation we lost all the winter cash crops planted during August 2018 and 50 Mu of severe acute respiratory syndrome, or SARS. In May-June 2003, many businesses in China were closed by the PRC government, to prevent transmissionnursery herbal tea plants and 200 Mu of SARS. Our business could be materially and adversely affected by the effects of H1N1 flu (swine flu), avian flu, SARS, or other epidemics or outbreaks. In April 2009, an outbreak of H1N1 flu first occurred in Mexico and quickly spread to other countries, including the U.S. and China. In the last decade, China has suffered health epidemics related to such outbreaks. Any prolonged occurrence or recurrence of H1N1 flu (swine flu), avian flu, SARS or other adverse public health developments in China may have a material adverse effect on our business and operations. These health epidemics could result in severe travel restrictions and closures that would restrict our ability to ship our products. Potential outbreaks could also lead to temporary closure of our manufacturing facilities, our suppliers’ facilities and/or our end-user customers’ facilities, leading to reduced production, delayed or cancelled orders, and decrease in demand for our products. Any future health epidemic or outbreaks that could disrupt our operations and/or restrict our shipping abilities may have a material adverse effect on our business and results of operations.passion fruit tree planted during Q2 2018.
We do not expect to encounter any epidemics in our aquaculture fishery farms in districts of the Guangdong Province or cattle farms in Huangyuan District of the Qinghai Province. However in the event of epidemics, we expect that our marine animals and our cattle will be quarantined until such time as a sanitary certificate for clean bill of health is obtained, before any of our products will be sold. In an extreme situation where our products would fail to obtain the sanitary certificate, they will be destroyed subject to the direction of the Inspection Authorities of the Agriculture Department of China. There is compensation granted by the Chinese government for the destruction of our products but only for a fraction of our cost of production; as such the Company will bear virtually all losses under such circumstances.
Furthermore, the 2008 Sichuan earthquake also had a negative impact on many businesses in that region. Losses caused by epidemics, adverse weather conditions, natural disasters and other catastrophes, including SARS, avian flu, swine flu, earthquakes or typhoons, will adversely affect our operations.
If we make any acquisitions, they may disrupt or have a negative impact on our business.
Although we have no present plans for any specific acquisitions, ifin the event that we make acquisitions, we could have difficulty integrating the acquired companies’ personnel and operations with our own. In addition, the key personnel of the acquired business may not be willing to work for us. We cannot predict the effect expansion may have on our core business. Regardless of whether we are successful in acquiring,making an acquisition, the negotiations could disrupt our ongoing business, distract our management and employees and increase our expenses. In addition to the risks described above, acquisitions are accompanied by severala number of inherent risks, including, without limitation, the following:
| · | difficulty of integrating acquired products, services or operations; | |
| · | potential disruption of the ongoing businesses and distraction of our management and the management of acquired companies; |
| · | difficulty of incorporating acquired rights or products into our existing business; |
| · | difficulties in disposing of the excess or idle facilities of an acquired company or business and expenses in maintaining such facilities; |
| · | difficulties in maintaining uniform standards, controls, procedures and policies; |
| · | potential impairment of relationships with employees and customers |
| · | potential inability or failure to achieve additional sales and enhance our customer base through cross-marketing of the products to new and existing customers; |
| · | effect of any government regulations which relate to the business acquired; |
| · | potential unknown liabilities associated with acquired businesses or product lines, or the need to spend significant amounts to retool, reposition or modify the marketing and sales of acquired products or the defense of any litigation, whether or not successful, resulting from actions of the acquired company prior to our acquisition. |
Our business could be severely impaired if and to the extent that we are unable to succeed in addressing any of these risks or other problems encountered in connection with these acquisitions, many of which cannot be presently identified, these risks and problems could disrupt our ongoing business, distract our management and employees, increase our expenses and adversely affect our results of operations.
We face significant competition, including changes in pricing.
The markets for our products are both competitive and price sensitive. Many competitors have significant financial, operations, sales and marketing resources, plus experience in research and development, and compete with us by offering lower prices. Competitors could develop new technologies that compete with our products to achieve a lower unit price. If a competitor develops lower cost superior technology or cost-effective alternatives to our products and services, our business could be seriously harmed.
The markets for some of our products are also subject to specific competitive risks because these markets are highly price competitive. Our competitors have competed in the past by lowering prices on certain products. If they do so again, we may be forced to respond by lowering our prices. This would reduce sales revenues and increase losses. Failure to anticipate and respond to price competition may also impact sales and aggravate losses.
Many of our competitors are larger and have greater financial and other resources than we do.
Our products compete and will compete with similar if not identical products produced by our competitors. These competitive products could be marketed by well-established, successful companies that possess greater financial, marketing, distribution personnel, and other resources than we do. Using said resources, these companies can implement extensive advertising and promotional campaigns, both generally and in response to specific marketing efforts by competitors. They can introduce new products to new markets more rapidly. In certain instances, competitors with greater financial resources may be able to enter a market in direct competition with us, offering attractive marketing tools to encourage the sale of products that compete with our products or present cost features that consumers may find attractive.
Risks Related to our Industry
Our agricultural assets are situated in three provinces in China and crop disease, severe weather, natural disasters and other conditions affecting the environment, including the effects of climate change, could result in substantial losses and weaken our financial condition.
Our agricultural operations are situated in Qinghai Province, Hunan and Guangdong Province. Qinghai Province in particular is subject to occasional periods of drought. Crops require water in different quantities at different times during the growth cycle. The limited water resource at any given point can adversely impact production. In Qinghai our cropping and pasture land presently comprises over 5,000 acres, an area too big and too costly to afford drip irrigation systems for our crops. In Hunan, the district of Linli where we have over 300 acres of crop and pasture land may from time to time be subject to flooding that could affect our agriculture production. In Enping, Guangdong, our HU Plants are very susceptible to dry and wet seasonal variation that could also affect our agriculture production.
Crop disease, severe weather conditions, such as floods, droughts, windstorms and hurricanes, and natural disasters, may adversely affect our supply of one or more products, reduce our sales volumes, increase our unit production costs or prevent or impair our ability to ship products as planned. Since a significant portion of our costs are fixed and contracted in advance of each operating year, volume declines due to production interruptions or other factors could result in increases in unit production costs, which could result in substantial losses and weaken our financial condition. We may experience crop disease, insect infestation, severe weather and other adverse environmental conditions from time to time.
Severe weather conditions may occur with higher frequency or may be less predictable in the future becausedue to the effects of climate change.
An occurrence of such an event might result in material disruptions to our operations, to the operations of our customers or suppliers, resulting in a decline in the agriculture industry. There can be no assurance that our facilities or products will not be affected by any such occurrence in the future, which occurrence may lead to adverse conditions to our operations and financial results.
Prices of agricultural products are subject to supply and demand, a market condition which is not predictable.
Because our agricultural products are commodities, we are not able to predict with certainty what price we will receive for our products. Additionally, the growth cycle of such products in many instances dictates when such products must be marketed to achieve the maximum profitability. Excessive supplies tend to cause severe price competition and lower prices throughout the industry affected. Conversely, shortages may drive the prices higher. Shortages often result from adverse growing conditions which can reduce the availability of the agricultural products affected. Since multiple variables can affect supply and demand, we cannot accurately predict or control from year to year what prices, either favorable or unfavorable, it will receive from the market.
In addition, general public perceptions regarding the quality, safety or health risks associated with particular food products could reduce demand and prices for some of our products. To the extent that consumer preferences evolve away from products that we produce for health or other reasons, and we are unable to modify our products or to develop products that satisfy new consumer preferences, there will be a decreased demand for our products. However, even if market prices are unfavorable, some of our agricultural products which are ready to be, or have been, harvested must be brought to market promptly. A decrease in the selling price received for our products due to the factors described above could have a material adverse effect on our business, results of operations and financial condition.
We could realize losses and suffer liquidity problems due to declines in sales prices for our agriculture products.
Sales prices for agricultural products are difficult to predict. It is possible that sales prices for our products will decline in the future, and sales prices for other agricultural products may also decline. In recent years, there has been increasing consolidation among food retailers, wholesalers and distributors. A significant portion of our costs is fixed, so that fluctuations in the sales prices have an immediate impact on our profitability. Our profitability is also affected by our production costs, which may increase due to factors beyond our control.
We are subject to the risk of product contamination and product liability claims.
The sales of our products may involve the risk of injury to consumers. Such injuries may result from tampering by unauthorized personnel, product contamination or spoilage, including the presence of foreign objects, substances, chemicals, or residues introduced during the growing, packing, storage, handling or transportation phases. While we are subject to governmental inspection and regulations and believe our facilities comply in all material respects with all applicable laws and regulations, including internal product safety policies, we cannot be sure that consumption of our products will not cause a health-related illness in the future or that we will not be subject to claims or lawsuits relating to such matters. Even if a product liability claim is unsuccessful, the negative publicity surrounding any assertion that our products caused illness or injury could adversely affect our reputation with existing and potential customers and our brand image. We do not maintain product liability insurance.
We may not be successful in the implementation of our new technologies and new products, and our new products may not be widely accepted.
Our new technologies such as our drip irrigation system for precision agriculture or the introduction, testing and promotion of new agricultural varieties, must be able to adapt to local conditions. The term “drip irrigation” refers to a system whereby the exact amount of water is supplied to the plants’ roots at the correct moment. On the one hand, there exists the failure risk due to not being suitable for the local environment and market conditions; on the other hand, there are risks of loss of competitive advantages due to the rising of producing similar products enterprises and other enterprises that follow to produce the similar products.
We are a holding company whose subsidiaries are given certain degree of independence and our failure to integrate our subsidiaries may adversely affect our financial condition.
PerAccording to the specific characteristics of agricultural production in China, we have given our subsidiary companies and their farms a certain degree of independency in decision-making. On one hand, this independency increases the sense of ownership at all levels, on the other hand it has also increased the difficulty of the integration of operation and management, which has resulted in increased difficulty of management integration. In the event we are not able to successfully manage our subsidiaries this will result in operating difficulties and have a negative impact on our business.
One or more distributors could engage in activities that harm our brand and our business.
Our products are sold primarily through distributors, who are responsible for ensuring that our products have the appropriate licenses to be sold to farmers in their provinces, and are stored at the correct temperature to ensure freshness and meet shelf life terms. If distributors do not obtain the appropriate licenses, their sales of our products in those provinces may be illegal, and we may be subject to government sanctions, including confiscation of illegal revenues and a fine of between two and three times the amount of such illegal revenues. Unlicensed sales in a province may also cause a delay for our other distributors in receiving a license from the authorities for their provinces, which could further adversely impact our sales. In addition, distributors may sell our products under another brand licensed in a particular province if our product is not licensed there. If our products are sold under another brand, the purchasers will not be aware of our brand name, and we will be unable to cross-market other seed varieties or other products as effectively to these purchasers. Moreover, our ability to provide appropriate customer service to these purchasers will be negatively affected, and we may be unable to develop our local knowledge of the needs of these purchasers and their environment. Furthermore, if any of our distributors sell inferior seeds produced by other companies under our brand name, our brand and reputation could be harmed, which could make marketing of our branded seeds more difficult. As of the date of this Annual Report, we are not aware of the occurrence of any of the potential violations by our distributors described above.
The PRC agricultural market is highly competitive and our growth and results of operations may be adversely affected if we are unable to compete effectively.
The agricultural market in China is highly fragmented, largely regional and highly competitive, and we expect competition to increase and intensify within the sector. We face significant competition in our lines of business. Many of our competitors have greater financial, research and development and other resources than we have. Competition may also develop from consolidation within our industry in China or the privatization of producers that are currently operated by local governments in China. Our competitors may be better positioned to take advantage of industry consolidation and acquisition opportunities than we are. The reform and restructuring of state-owned equity in enterprises involved primarily in producing sectors will likely lead to the reallocation of market share in the agriculture industry, and our competitors may increase their market share by participating in the restructuring of state-owned agriculture companies. Such privatization would likely result in increased numbers of market participants with more efficient and commercially viable business models. As competition intensifies, our margins may be compressed by more competitive pricing and we may lose our market share and experience a reduction in our revenues and profit.
We may not possess all of the licenses required to operate our business, or we may fail to maintain the licenses we currently hold. This could subject us to fines and other penalties, which could materially adversely affect our results of operations.
We are required to hold a variety of permits and licenses to conduct business in China. We may not possess all of the permits and licenses required for each of our business segments. In addition, the approvals, permits or licenses required by governmental agencies may change without substantial advance notice, and we could fail to obtain the approvals, permits or licenses required to expand our business. If we fail to obtain or to maintain such permits or licenses, or if renewals are granted with onerous conditions, we could be subject to fines and other penalties and be limited in the number or the quality of the products that we could offer. Thus,As a result, our business, results of operations and financial condition could be materially and adversely affected.
Risks Related to Doing Business in China
Under PRC law, we are required to obtain and retain permits and business licenses, and our failure to do so would adversely impact our ability to conduct business in China.
We hold various permits, business licenses, and approvals authorizing our operations and activities, which are subject to periodic review and reassessment by the Chinese authorities. Standards of compliance necessary to pass such reviews change from time to time and differ from jurisdiction to jurisdiction, leading to a degree of uncertainty. If renewals, or new permits, business licenses or approvals required byin connection with existing or new facility activity,facilities or activities, are not granted or are delayed, or if existing permits, business licenses or approvals are revoked or substantially modified, we may not be able to continue to operate our facilities which would have a material adverse effect on our operations. If new standards are applied to renewals or new applications, it could prove costly for us to meet these new standards.
The PRC economic cycle may negatively impact our operating results.
We believe that the rapid growth of the PRC economy before 2008 generally led to higher levels of inflation. We believe that the PRC economy has more recently experienced a decrease in its growth rate. We believe that severala number of factors have contributed to this deceleration, including appreciation of the RMB, the currency of China, which has adversely affected China’s exports. In addition, we believe the deceleration has been exacerbated by the recent global crisis in the financial services and credit markets, which has resulted in significant volatility and dislocation in the global capital markets. It is uncertain how long the global crisis in the financial services and credit markets will continue and the significance of the adverse impact it may have on the global economy in general or the Chinese economy in particular. Slowing economic growth in China could result in weakening growth and demand for our products, which could reduce our revenues and income. In the event of a recovery in the PRC, renewed high growth levels may again lead to inflation. The government’s attempts to control inflation may adversely affect the business climate and growth of private enterprise. In addition, our profitability may be adversely affected if prices for our products rise at a rate that is insufficient to compensate for the rise in inflation.
Currency fluctuations and restrictions on currency exchange may adversely affect our business, including limiting our ability to convert Chinese Renminbi (RMB) into foreign currencies and, if the RMB were to decline in value, reducing our revenue in U.S. dollar terms.
The exchange rate of the RMB is currently managed by the Chinese government. On July 21, 2005, the People’s Bank of China, with the authorization of the State Council of the PRC, announced that the RMB exchange rate would no longer be pegged to the U.S. Dollar and would float based on market supply and demand regardingwith reference to a basket of currencies. PerAccording to public reports, the governor of the People’s Bank has stated that the basket is composed mainly of the U.S. Dollar, the European Union Euro, the Japanese Yen and the South Korean Won. Also considered, but playing smaller roles, are the currencies of Singapore, the United Kingdom, Malaysia, Russia, Australia, Canada and Thailand. The weight of each currency within the basket has not been announced.
The initial adjustment of the RMB exchange rate was an approximate 2% revaluation from an exchange rate of 8.28 RMB per U.S. Dollar to 8.11 RMB per U.S. Dollar. The People’s Bank announced that the daily trading price of the U.S. Dollar against the RMB in the inter-bank foreign exchange market would float within a band of 0.3% around the central parity published by the People’s Bank, while trading prices of non-U.S. Dollar currencies against the RMB would be allowed to move within a certain band announced by the People’s Bank. The People’s Bank has stated that it will adjustmake adjustments of the RMB exchange rate band when necessary peraccording to market developments as well as the economic and financial situation. In a later announcement published on May 18, 2007, the band was extended to 0.5%. Since July 2008, the RMB has traded at 6.83 RMB per U.S. Dollar. Recent reports indicate an upward revaluation in the value of the RMB against the U.S. Dollar may be allowed. The People’s Bank announced on June 19, 2010 its intention to allow the RMB to move more freely against the basket of currencies, which increases the possibility of sharp fluctuations in the value of the RMB soonin the near future and thus the unpredictability associated with the RMB exchange rate.
However the RMB in 2018 is very sensitive to and influenced by its political situation with USA illustrated by its multiple changes in depreciation and appreciation against the US$ during the past year.
Despite this change in its exchange rate regime, the Chinese government continues to manage the valuation of the RMB. The value of our common stock will be indirectly affected by the foreign exchange rate between the U.S. dollar and the RMB. Appreciation or depreciation in the value of the RMB relative to the U.S. dollar would affect our financial results reported in U.S. dollar terms without giving effect to any underlying change in our business or results of operations. Fluctuations in the exchange rate will also affect the relative value of any dividend we issue that will be exchanged into U.S. dollars, as well as earnings from, and the value of, any U.S. dollar-denominated investments we make in the future.
The income statements of our operations are translated into U.S. dollars at the average exchange rates in each applicable period. To the extent the U.S. dollar strengthens against foreign currencies, the translation of these foreign currencies denominated transactions results in reduced revenue, operating expenses and net income for our international operations. Similarly, to the extent the U.S. dollar weakens against foreign currencies, the translation of these foreign currency denominated transactions results in increased revenue, operating expenses and net income for our international operations. We are also exposed to foreign exchange rate fluctuations as we convert the financial statements of our foreign subsidiaries into U.S. dollars in consolidation. If there is a change in foreign currency exchange rates, the conversion of the foreign subsidiaries’ financial statements into U.S. dollars will lead to a translation gain or loss, which is recorded as a component of other comprehensive income. In addition, we have certain assets and liabilities that are denominated in currencies other than the relevant entity’s functional currency. Changes in the functional currency value of these assets and liabilities create fluctuations that will lead to a transaction gain or loss.
Very limited hedging transactions are available in China to reduce our exposure to exchange rate fluctuations. To date, we have not entered into any hedging transactions. While we may enter into hedging transactions in the future, the availability and effectiveness of these transactions may be limited, and we may not be able to successfully hedge our exposure. In addition, our foreign currency exchange losses may be magnified by PRC exchange control regulations that restrict our ability to convert RMB into foreign currencies.
Uncertainties with respect to the PRC legal system could adversely affect us and we may have limited legal recourse under PRC law if disputes arise under our contracts with third parties.
Since 1979, we believe PRC legislation and regulations have significantly enhanced protections afforded to various forms of foreign investments in China. However, China has not developed a fully integrated legal system and recently enacted laws and regulations may not sufficiently cover all aspects of economic activities in China. BecauseIn particular, because these laws and regulations are relatively new, the interpretation and enforcement of these laws and regulations involve uncertainties. In addition, the PRC legal system is based in part on government policies and internal rules (some of which are not published on a timely basis or at all) that may have a retroactive effect. As a result, sometimes we may not be aware of our violation of these policies and rules until sometime after violation.
The Chinese government has enacted laws and regulations dealing with matters such as corporate organization and governance, foreign investment, commerce, taxation and trade. However, their experience in implementing, interpreting and enforcing these laws and regulations is limited, and our ability to enforce commercial claims or to resolve commercial disputes is unpredictable. The resolution of these matters may be subject to the exercise of considerable discretion by agencies of the Chinese government, and forces unrelated to the legal merits of a particular matter or dispute may influence their determination. Any rights we may have to specific performance, or to seek an injunction under PRC law, in either of these cases, are severely limited, and without a means of recourse by virtue of the Chinese legal system, we may be unable to prevent these situations from occurring. The occurrence of any such events could have a material adverse effect on our business, financial condition and results of operations.
Under the PRC EIT Law, we may be classified as a “resident enterprise” of the PRC. Such classification could result in tax consequences to the Company or our non-PRC resident shareholders.
On March 16, 2007, the National People’s Congress approved and promulgated a new tax law, the PRC Enterprise Income Tax Law, or “EIT Law,” which took effect on January 1, 2008. Under the EIT Law, enterprises are classified as resident enterprises and non-resident enterprises. An enterprise established outside of China with “de facto management bodies” within China is considered a “resident enterprise,” meaning that it can be treated in a manner likesimilar to a Chinese enterprise for enterprise income tax purposes. The implementing rules of the EIT Law define “de facto management bodies” as a managing body that in practice exercises “substantial and overall management and control over the production and operations, personnel, accounting, and properties” of the enterprise; however, it remains unclear whether the PRC tax authorities would deem our managing body as being located within China. Due to the short history of the EIT Law and lack of applicable legal precedents, the PRC tax authorities determine the PRC tax resident treatment of a foreign company on a case-by-case basis.
If the PRC tax authorities determine that we are a “resident enterprise” for PRC enterprise income tax purposes, a number of PRC tax consequences could follow. First, we could be subject to the enterprise income tax at a rate of 25 percent on our worldwide taxable income, as well as PRC enterprise income tax reporting obligations. Second, under the EIT Law and its implementing rules, dividends paid between “qualified resident enterprises” are exempt from enterprise income tax. Thus,As a result, if we are treated as a PRC “qualified resident enterprise,” all dividends paid from our Chinese subsidiaries to us would be exempt from PRC tax.
Finally, the new “resident enterprise” classification could result in a situation in which a 10% PRC tax is imposed on dividends we pay to our non-PRC stockholders that are not PRC tax “resident enterprises” and gains derived by hem from transferring our common stock, if such income is considered PRC-sourced income by the relevant PRC authorities. In such event, we may be required to withhold a 10% PRC tax on any dividends paid to non-PRC resident stockholders. Our non-PRC resident stockholders also may be responsible for paying PRC tax at a rate of 10% on any gain realized from the sale or transfer of our common stock in certain circumstances. We would not, however, have an obligation to withhold PRC tax with respect to such gain.
Moreover, the SAT released Circular Guoshuihan No. 698 (“Circular 698”) on December 15, 2009 that reinforces the taxation of non-listed equity transfers by non-resident enterprises through overseas holding vehicles. Circular 698 addresses indirect share transfers as well as other issues. Circular 698 is retroactively effective from January 1, 2008. According to Circular 698, where a foreigner (non-PRC resident) who indirectly holds shares in a PRC resident enterprise through a non-PRC offshore holding company indirectly transfers equity interests in a PRC resident enterprise by selling the shares of the offshore holding company, and the latter is located in a country or jurisdiction where the effective tax burden is less than 12.5 percent or where the offshore income of his, her, or its residents is not taxable, the foreign investor is required to provide the PRC tax authority in charge of that PRC resident enterprise with certain relevant information within 30 days of the transfer. The tax authorities in charge will evaluate the offshore transaction for tax purposes. In the event that the tax authorities determine that such transfer is abusing forms of business organization and a reasonable commercial purpose for the offshore holding company other than the avoidance of PRC income tax liability is lacking, the PRC tax authorities will be able to re-assess the nature of the equity transfer under the doctrine of substance over form. A reasonable commercial purpose may be established when the overall international (including U.S.) offshore structure is set up to comply with the requirements of supervising authorities of international (including U.S.) capital markets. If the SAT’s challenge of a transfer is successful, it may deny the existence of the offshore holding company that is used for tax planning purposes and subject the seller to PRC tax on the capital gain from such transfer. Since Circular 698 has a relatively short history, there is uncertainty as to its application. We (or a foreign investor) may become at risk of being taxed under Circular 698 and may be required to expend valuable resources to comply with Circular 698 or to establish that we (or such foreign investor) should not be taxed under Circular 698, which could have a material adverse effect on our financial condition and results of operations (or such foreign investor’s investment in us).
If any such PRC taxes apply, a non-PRC resident stockholder may be entitled to a reduced rate of PRC taxes under an applicable income tax treaty and/or a foreign tax credit against such stockholder’s domestic income tax liability (subject to applicable conditions and limitations). Prospective investors are encouraged to consult with their own tax advisors regarding the applicability of any such taxes, the effects of any applicable income tax treaties, and any available foreign tax credits.
Failure to comply with PRC regulations relating to the establishment of offshore special purpose companies by PRC residents may materially adversely affect us.
In October 2005, the SAFE issued the Notice on Relevant Issues in the Foreign Exchange Control over Financing and Return Investment Through Special Purpose Companies by Residents inside China, generally referred to as Circular 75. The policy announced in this notice required PRC residents to register with the relevant SAFE branch before establishing or acquiring control over an offshore special purpose company, or SPV, for the purpose of engaging in an equity financing outside of China on the strength of domestic PRC assets originally held by those residents. Failure to comply with the requirements of Circular 75 and any of its internal implementing guidelines as applied by SAFE in accordance with Notice 106 may result in fines and other penalties under PRC laws for evasion of applicable foreign exchange restrictions. Any such failure could also result in the SPV’s affiliates being impeded or prevented from distributing their profits and the proceeds from any reduction in capital, share transfer or liquidation to the SPV, or from engaging in other transfers of funds into or out of China.
We requested our shareholders who are PRC residents to make the necessary applications, filings and amendments as required under Circular 75 and other related rules. We attempt to comply, and attempt to ensure that our shareholders who are subject to these rules comply, with the relevant requirements. However, we cannot provide any assurances that our shareholders who are PRC residents will comply with our request to make any applicable registrations, and nor can we provide any assurances that our shareholders who are PRC residents will be able to obtain such applicable registration or comply with other requirements required by Circular 75 or other related rules or that, if challenged by government agencies, the structure of our organization fully complies with all applicable registrations or approvals required by Circular 75. Moreover, because of uncertainty over how Circular 75 will be interpreted and implemented, and how or whether SAFE will apply it to us, we cannot predict how it will affect our business operations or future strategies. Failure by such PRC resident shareholders or future PRC resident shareholders to comply with Circular 75 or other related rules, if SAFE requires it, could subject these PRC resident shareholders to fines or legal sanctions, restrict our overseas or cross-border investment activities, limit our subsidiaries’ ability to make distributions or pay dividends, or affect our ownership structure, which could adversely affect our business and prospects.
Adverse changes in political and economic policies of the Chinese government could have a material adverse effect on the overall economic growth of China, which could reduce the demand for our products and materially and adversely affect our competitive position.
Our business, financial condition, results of operations and prospects are affected significantly by economic, political and legal developments in China. The Chinese economy differs from the economies of most developed countries in many respects, including:
| · | the amount of government involvement; |
| · | the level of development; |
| · | the growth rate; |
| · | the control of foreign exchange; and |
| · | the allocation of resources. |
While the Chinese economy has grown significantly in the past 20 years, we believe the growth has been uneven, both geographically and among various sectors of the economy. The Chinese government has implemented various measures to encourage economic growth and guide the allocation of resources. We believe some measures benefit the overall Chinese economy, but may also have a negative effect on us. For example, our financial condition and results of operations may be adversely affected by government control over capital investments or changes in tax regulations that are applicable to us.
The Chinese economy has been transitioning from a planned economy to a more market-oriented economy. Although in recent years the Chinese government has implemented measures emphasizing the utilization of market forces for economic reform, the reduction of state ownership of productive assets and the establishment of sound corporate governance in business enterprises, a substantial portion of the productive assets in China is still owned by the Chinese government. The Chinese government also exercises significant control over Chinese economic growth through the allocation of resources, controlling payment of foreign currency-denominated obligations, setting monetary policy and providing preferential treatment to particular industries or companies.
Contract drafting, interpretation and enforcement in China involve significant uncertainty.
We have entered into numerous contracts governed by PRC law, many of which are material to our business. As compared with contracts in the United States, contracts governed by PRC law tend to contain less detail and to not be as comprehensive in defining contracting parties’ rights and obligations. As a result, contracts in China are more vulnerable to disputes and legal challenges. In addition, contract interpretation and enforcement in China is not as developed as in the United States, and the result of any contract dispute is subject to significant uncertainties. Therefore, we cannot assure you that we will not be subject to disputes under our material contracts, and if such disputes arise, we cannot assure you that we will prevail.
The application of PRC regulations relating to the overseas listing of PRC domestic companies is uncertain, and we may be subject to penalties for failing to request approval of the PRC authorities prior to listing our shares in the U.S.
As mentioned above, on August 8, 2006, six PRC government agencies, i.e., MOFCOM, the SAIC, the CSRC, SAFE, the State-Owned Assets Supervision and Administration Commission (“SASAC”) and SAT, jointly issued the Regulations on Mergers and Acquisitions of Domestic Enterprises by Foreign Investors (the “New M&A Rules,”), which became effective on September 8, 2006. The New M&A Rules purport, among other things, to require offshore “special purpose vehicles” that are (1) formed for the purpose of overseas listing of the equity interests of PRC companies via acquisition and (2) are controlled directly or indirectly by PRC companies and/or PRC individuals, to obtain the approval of the CSRC prior to the listing and trading of their securities on overseas stock exchanges. On September 21, 2006, pursuant to the New M&A Rules and other PRC Laws, the CSRC published on its official website relevant guidance with respect to the listing and trading of PRC domestic enterprises’ securities on overseas stock exchanges (the “Related Clarifications”“Related Clarifications”), including a list of application materials regarding the listing on overseas stock exchanges by special purpose vehicles. We were and are not required to obtain the approval of CSRC under the new M&A Rules aboutin connection with this transaction because we were and are not a special purpose vehicle formed or controlled by PRC individuals.
However, there are substantial uncertainties regarding the interpretation, application and enforcement of these rules, and CSRC has yet to promulgate any written provisions or formally to declare or state whether the overseas listing of a PRC-related company structured likesimilar to ours is subject to the approval of CSRC. Any violation of these rules could result in fines and other penalties on our operations in China, restrictions or limitations on remitting dividends outside of China, and other forms of sanctions that may cause a material and adverse effect to our business, operations and financial conditions.
The New M&A Rules also established additional procedures and requirements that are expected to make merger and acquisition activities by foreign investors more time-consuming and complex, including requirements in some instances that the MOFCOM be notified in advance of any change-of-control transaction in which a foreign investor takes control of a PRC domestic enterprise that owns well-known trademarks or China’s traditional brands. We may grow our business in part by acquiring other businesses. Complying with the requirements of the New M&A Rules in completing this type of transaction could be time-consuming, and any required approval processes, including CSRC approval, may delay or inhibit our ability to complete such transactions, which could affect our ability to expand our business or maintain our market share.
We may face regulatory uncertainties that could restrict our ability to issue equity compensation to our directors and employees and other parties who are PRC citizens or residents under PRC law. The grant of stock options under any incentive plan that we adopt in the future would require registration with SAFE.
On April 6, 2007, SAFE issued the “Operating Procedures for Administration of Domestic Individuals Participating in the Employee Stock Ownership Plan or Stock Option Plan of An Overseas Listed Company,” also known as “Circular 78”. It is not clear whether Circular 78 covers all forms of equity compensation plans or only those that provide for the grant of stock options. For any equity compensation plan which is so covered and is adopted by a non-PRC listed company after April 6, 2007, Circular 78 requires all participants who are PRC citizens to register with, and obtain the approval of, SAFE prior to their participation in any such plan. In addition, Circular 78 also requires PRC citizens to register with SAFE and make the necessary applications and filings if they participate in an overseas listed company’s covered equity compensation plan prior to April 6, 2007. As of the date of this filing, we have not adopted any incentive plans, but may do so in the future. Any such plan may grant equity compensation, including, but not limited to, stock options, to our PRC employees and/or directors. The grant of any equity compensation under such a plan to a PRC citizen, however, may under Circular 78 require the PRC citizen to register with and obtain approval of SAFE. We believe that the registration and approval requirements contemplated in Circular 78 will be burdensome and time consuming. If it is determined that our such a plan, or any equity compensation grant under such a plan, is subject to Circular 78, failure to comply with such provisions of Circular 78 may subject us and any recipients thereof to fines and legal sanctions and prevent us from being able to grant equity compensation to our PRC employees and/or directors. In that case, our ability to compensate our employees and directors through equity compensation would be hindered and/or prevented.
Capital outflow policies in the PRC may hamper our ability to remit income to the United States.
The PRC has adopted currency and capital transfer regulations. These regulations may require that we comply with complex regulations for the movement of capital and as a result we may not be able to remit all income earned and proceeds received in connection with our operations or from the sale of our operating subsidiary to the U.S. or to our stockholders.
Our operations and assets in the PRC are subject to significant political and economic uncertainties.
Government policies are subject to rapid change and the government of the PRC may adopt policies that have the effect of hindering private economic activity and greater economic decentralization. There is no assurance that the government of China will not significantly alter its policies from time to time without notice in a manner with reduces or eliminates any benefits from its present policies of economic reform. In addition, a substantial portion of productive assets in China remains government-owned. For instance, all lands are state or rural collective economic organizations owned and leased to business entities or individuals through governmental grants of the land use rights. The grant process is typically based on government policies at the time of the grant, which could be lengthy and complex. This process may adversely affect our business. The government of China also exercises significant control over China’s economic growth through the allocation of resources, controlling payment of foreign currency and providing preferential treatment to particular industries or companies. Uncertainties may arise as a result of changing governmental policies and measures. In addition, changes in laws and regulations, or their interpretation, or the imposition of confiscatory taxation, restrictions on currency conversion, imports and sources of supply, devaluations of currency, the nationalization or other expropriation of private enterprises, as well as adverse changes in the political, economic or social conditions in China, could have a material adverse effect on our business, results of operations and financial condition.
Our use of the allocated land may be subject to challenges in the future.
All land use rights that we own are land use rights relating to allocated land. The local governmental authorities have granted such land use rights to us for free use or at a discounted levy rate given our contribution to the development of the local economy. However, pursuant to the Catalogue on Allocated Land issued by the Ministry of Land Resources of the PRC (the “Catalogue”), the land use rights for allocated land may only be granted to those specific projects which followare in compliance with the Catalogue, subject to the approval of the competent governmental authorities. We, as a privately owned agricultural producer, may not be qualified to be granted such land use rights for allocated land peraccording to the Catalogue. Consequently, our use of such land may be subject to challenge in the future, and the legal consequences could include the confiscation of such land by the governmental authorities or a demand that we pay a market price for purchasing the land use rights for such land and converting the allocated land use right to a granted land use right.
Because Chinese law governs almost all of our material agreements, we may not be able to enforce our legal rights within China or elsewhere, which could result in a significant loss of business, business opportunities, or capital.
Chinese law governs almost all of our material agreements. We cannot assure you that we will be able to enforce any of our material agreements or that remedies will be available outside of China. The system of laws and the enforcement of existing laws in China may not be as certain in implementation and interpretation as in the United States. Our inability to enforce or obtain a remedy under any of our current or future agreements could result in a significant loss of business, business opportunities or capital. It will be extremely difficult to acquire jurisdiction and enforce liabilities against our officers, directors and assets based in China.
Substantially all of our assets will be located in the PRC and all of our officers and our present directors reside outside of the United States. Thus,As a result, it may not be possible for United States investors to enforce their legal rights, to effect service of process upon our directors or officers or to enforce judgments of United States courts predicated upon civil liabilities and criminal penalties of our directors and officers under federal securities laws. Moreover, we have been advised that China does not have treaties providing for the reciprocal recognition and enforcement of judgments of courts with the United States. Further, it is unclear if extradition treaties now in effect between the United States and China would permit effective enforcement of criminal penalties of the federal securities laws.
We do not have insurance coverage.
We currently do not purchase property insurance for our properties, including raw materials, semi-manufactured goods, manufactured goods, buildings and machinery equipment, livestock, and we currently do not carry any product liability or other similar insurance, nor do we have business liability or business disruption insurance coverage for our operations in the PR. There is no insurance covering risks incurred through seasonal variation consequences. In this respect, we as an engineering based company have qualified personnel and staffs to manage and to limited the happenings of these relevant risk factors; however there is no guarantee that accidents will not happen, and if they happen, the consequences may have a material adverse effect on our business, financial condition and results of operations.
Because our cash and cash equivalent are held in banks that do not provide capital guarantee insurance, the failure of any bank in which we deposit our funds could affect our ability to continue in business.
Banks and other financial institutions in the PRC do not provide insurance for funds held on deposit. A significant portion of our assets are in the form of cash deposited with banks in the PRC, and in the event of bank failure, we may not have access to, or may lose entirely, our funds on deposit. Depending upon the amount of cash we maintain in a bank that fails, our inability to have access to such cash deposits could impair our operations, and, if we are not able to access funds to pay our suppliers, employees and other creditors, we may be unable to continue in business.
Failure to comply with the United States Foreign Corrupt Practices Act could subject us to penalties and other adverse consequences.
We are subject to the United States Foreign Corrupt Practices Act, which generally prohibits United States companies from engaging in bribery or other prohibited payments to foreign officials for the purpose of obtaining or retaining business. Foreign companies, including some that may compete with us, are not subject to these prohibitions. Corruption, extortion, bribery, pay-offs, theft and other fraudulent practices occur from time to time in the PRC. We cannot assure you that our employees or other agents will not engage in such conduct for which we might be held responsible. If our employees or agents are found to have engaged in such practices, we could suffer severe penalties and other consequences that may have a material adverse effect on our business, financial condition and results of operations.
Labor laws in the PRC may adversely affect our results of operations.
On June 29, 2007, the PRC government promulgated a new labor law, namely, the Labor Contract Law of the PRC, or the New Labor Contract Law, which became effective on January 1, 2008. The New Labor Contract Law imposes greater liabilities on employers and significantly affects the cost of an employer’s decision to reduce its workforce. Further, it requires that certain terminations be based upon seniority and not merit. In the event we decide to significantly change or decrease our workforce, the New Labor Contract Law could adversely affect our ability to effect such changes in a manner that is most advantageous to our business or in a timely and cost-effective manner, thus materially and adversely affecting our financial condition and results of operations.
Your ability to bring an action against us or against our directors and officers, or to enforce a judgment against us or them, will be limited because we conduct substantially all of our operations in the PRC and because the majority of our directors and officers reside outside of the United States.
We are a Nevada holding company and substantially all of our assets are located outside of the United States. Substantially all current operations are conducted in the PRC. In addition, all but one of our directors and officers are nationals and residents of countries other than the United States. Substantial portions of the assets of these persons are located outside the United States. Thus, it may be difficult to effect service of process within the United States upon these persons. It may also be difficult to enforce in U.S. courts judgments on the civil liability provisions of the U.S. federal securities laws against us and our officers and directors, none of whom are residents in the United States and the substantial majority of whose assets are located outside of the United States. It is also uncertain whether the courts of the PRC would recognize or enforce judgments of U.S. courts. Our PRC legal counsel has advised us that the recognition and enforcement of foreign judgments are provided for under the PRC Civil Procedures Law. Courts in the PRC may recognize and enforce foreign judgments in accordance with the requirements of the PRC Civil Procedures Law based on treaties between the PRC and the country where the judgment is made or on reciprocity between jurisdictions. The PRC does not have any treaties or other arrangements that provide for the reciprocal recognition and enforcement of foreign judgments with the United States. In addition, according to the PRC Civil Procedures Law, courts in the PRC will not enforce a foreign judgment against us or our directors and officers if they decide that the judgment violates basic principles of PRC law or national sovereignty, security or the public interest. It is uncertain whether a PRC court would enforce a judgment rendered by a court in the United States.
41
Risks Related to Ownership of our Common Stock
Volatility in our common stock price may subject us to securities litigation.
Stock markets, in general, have experienced in recent months, and continue to experience, significant price and volume volatility, and the market price of our common stock may continue to be subject to similar market fluctuations unrelated to our operating performance or prospects. This increased volatility, coupled with depressed economic conditions, could continue to have a depressing effect on the market price of our common stock. The following factors, many of which are beyond our control, may influence our stock price:
| · | the status of our growth strategy including the building of our new production line with any proceeds we may be able to raise in the future; |
| · | announcements of technological or competitive developments; |
| · | regulatory developments in the PRC affecting us, our customers or our competitors; |
| · | announcements regarding patent or other intellectual property litigation or the issuance of patents to us or our competitors or updates with respect to the enforceability of patents or other intellectual property rights generally in the PRC or internationally; |
| · | actual or anticipated fluctuations in our quarterly operating results; |
| · | changes in financial estimates by securities research analysts; |
| · | changes in the economic performance or market valuations of our competitors; |
| · | additions or departures of our executive officers; |
| · | release or expiration of lock-up or other transfer restrictions on our outstanding common stock; and |
| · | sales or perceived sales of additional shares of our common stock. |
In addition, the securities markets have, from time to time, experienced significant price and volume fluctuations that are not related to the operating performance of particular companies. Any of these factors could result in large and sudden changes in the volume and trading price of our common stock and could cause our stockholders to incur substantial losses. In the past, following periods of volatility in the market price of a company’s securities, stockholders have often instituted securities class action litigation against that company. If we were involved in a class action suit or other securities litigation, it would divert the attention of our senior management, require us to incur significant expense and, whether or not adversely determined, have a material adverse effect on our business, financial condition, results of operations and prospects.
One of our directors and officers controls a majority of our common stock and his interests may not align with the interests of our other stockholders.
Solomon Lee, our chairman, chief executive officer and president, controls our company and beneficially holds more thanowns in excess of 50.1% of the voting rights vested our issued and outstanding common stock. This significant concentration of share ownership may adversely affect the trading price of our common stock because investors often perceive a disadvantage in owning shares in a company with one or several controlling stockholders. Furthermore, our directors and officers, as a Company, canhave the ability to significantly influence or control the outcome of all matters requiring stockholder approval, including the election of directors and approval of significant corporate transactions, such as mergers, consolidations or the sale of substantially all of our assets. This concentration of ownership may have the effect of delaying or preventing a change in control of our company that could deprive our stockholders of an opportunity to receive a premium for their shares as part of a sale of our company and might reduce the price of our common stock. In addition, without the consent of Mr. Lee, we could be prevented from entering into transactions that could be beneficial to us. Mr. Lee may cause us to take actions that are opposed by other stockholders as his interests may differ from those of other stockholders.
Future issuances of capital stock may depress the trading price of our common stock.
Any issuance of shares of our common stock (or common stock equivalents) after the date hereof could dilute the interests of our existing stockholders and could substantially decrease the trading price of our common stock. We may issue additional shares of our common stock in the future for severala number of reasons, including financing our operations and business strategy (including aboutin connection with acquisitions, strategic collaborations or other transactions).
Sales of a substantial number of shares of our common stock in the public market could depress the market price of our common stock, and impair our ability to raise capital through the sale of additional equity securities. We cannot predict the effect that future sales of our common stock or other equity-related securities would have on the market price of our common stock.
We believe that the price of our shares in the OTC QX markets is adversely affected by the current stigma associated with Chinese companies quoted or listed publicly in the United States.
Although we managed to maintain our liquidity to a certain degree, our share price has suffered. Many Chinese companies suffer from this stigma, which tends to affect both market prices and liquidity, and our company is no exception. Reasons with varying degrees of legitimacy explain this stigma, including but not limited to: (i) investors’ experience of losses suffered duringin the course of investing in other Chinese companies, (ii) the difficulty some Chinese companies have had in preparing auditable financial statements, and (iii) the difficulty in enforcing US judgments in foreign courts generally. TheseAll of these have contributed to a negative perception by some US investors regarding all Chinese companies publicly traded on US markets. Regardless of the reasons for this perception, if it continues over a sustained period of time our market prices may continue to trade below net tangible asset value per share. This would increase risk that our shareholders could lose the funds they invested in our company. It could also impact our ability to maintain our growth plan on schedule, which would adversely affect our business and financial condition.
The issuance of any of our equity securities pursuant any equity compensation plan we may adopt may dilute the value of existing stockholders and may affect the market price of our stock.
In the future, we may issue to our officers, directors, employees and/or other people’spersons equity based compensation under any equity compensation plan we may adopt to provide motivation and compensation to our officers, employees and key independent consultants. The award of any such incentives could result in an immediate and potentially substantial dilution to our existing stockholders and could result in a decline in the value of our stock price. The exercise of these options and the sale of the underlying shares of common stock and the sale of stock issued pursuant to stock grants may have an adverse effect upon the price of our stock. In addition, if the holders of outstanding convertible securities convert such securities into common stock, you will suffer further dilution.
The requirements of being a public company may strain our resources, divert management’s attention and affect our ability to attract and retain qualified board members.
We are a public company and subject to the reporting requirements of the Securities Exchange Act of 1934, as amended, and the Sarbanes-Oxley Act of 2002. The Exchange Act requires, among other things, that we file annual, quarterly and current reports with respect to our business and financial condition. The Sarbanes-Oxley Act requires, among other things, that we maintain effective disclosure controls and procedures and internal controls for financial reporting. For example, Section 404 of the Sarbanes-Oxley Act requires that our management report on the effectiveness of our internal controls structure and procedures for financial reporting. Section 404 compliance may divert internal resources and will take a significant amount of time and effort to complete. If we fail to maintain compliance under Section 404, or if in the future management determines that our internal control over financial reporting are not effective as defined under Section 404, we could be subject to sanctions or investigations by the NASDAQ Stock Market should we in the future be listed on this market, the SEC, or other regulatory authorities. Furthermore, investor perceptions of our company may suffer, and this could cause a decline in the market price of our common stock. Any failure of our internal controls could have a material adverse effect on our stated results of operations and harm our reputation. If we are unable to implement these changes effectively or efficiently, it could harm our operations, financial reporting or financial results and could result in an adverse opinion on internal controls from our independent auditors. We may need to hire severala number of additional employees with public accounting and disclosure experience in order to meet our ongoing obligations as a public company, particularly if we become fully subject to Section 404 and its auditor attestation requirements, which will increase costs. Our management team and other personnel will need to devote a substantial amount of time to new compliance initiatives and to meeting the obligations that are associated with being a public company, which may divert attention from other business concerns, which could have a material adverse effect on our business, financial condition and results of operations.
Our shares of common stock may be thinly traded, so you may be unable to sell at or near ask prices or at all.
We cannot predict the extent to which an active public market for our common stock will develop or be sustained. Our common stock is currently traded on the OTC QX where the shares have historically been thinly traded, meaning that the number of persons interested in purchasing our common stock at or near bid prices at any given time may be relatively small or non-existent.
This situation may be attributable to a number of factors, including the fact that we are a small company that is relatively unknown to stock analysts, stock brokers, institutional investors and others in the investment community who generate or influence sales volume, and that even if we came to the attention of such persons, they tend to be risk averse and would be reluctant to follow an unproven company such as ours or purchase or recommend the purchase of our shares until such time as we have become more seasoned and viable. Therefore,As a consequence, there may be periods of several days, weeks or months when trading activity in our shares is minimal or non-existent, as compared to a seasoned issuer which has a large and steady volume of trading activity that will generally support continuous sales without an adverse effect on share price. We cannot assure you that a broader or more active public trading market for our common stock will develop or be sustained, or that current trading levels will be sustained or not diminish.
We may become involved in securities class action litigation that could divert management’s attention and harm our business.
The stock market in general, and the shares of early stage companies in particular, have experienced extreme price and volume fluctuations. These fluctuations have often been unrelated or disproportionate to the operating performance of the companies involved. If these fluctuations occur in the future, the market price of our shares could fall regardless of our operating performance. In the past, following periods of volatility in the market price of a particular company’s securities, securities class action litigation has often been brought against that company. If the market price or volume of our shares suffers extreme fluctuations, then we may become involved in this type of litigation, which would be expensive and divert management’s attention and resources from managing our business.
As a public company, we may also from time to time make forward-looking statements about future operating results and provide some financial guidance to the public markets. Our management has limited experience as a management team in a public company and as a result projections may not be made timely or set at expected performance levels and could materially affect the price of our shares. Any failure to meet published forward-looking statements that adversely affect the stock price could result in losses to investors, stockholder lawsuits or other litigation, sanctions or restrictions issued by the SEC.
44
Securities analysts may elect not to report on our common stock or may issue negative reports that adversely affect the stock price.
At this time, to our knowledge no securities analysts provide research coverage of our common stock, and securities analysts may not elect not to provide such coverage in the future. It may remain difficult for our company, with its small market capitalization, to attract independent financial analysts that will cover our common stock. If securities analysts do not cover our common stock, the lack of research coverage may adversely affect the stock’s actual and potential market price. The trading market for our common stock may be affected in part by the research and reports that industry or financial analysts publish about our business. If one or more analysts elect to cover our company and then downgrade the stock, the stock price would likely decline rapidly. If one or more of these analysts cease coverage of our company, we could lose visibility in the market, which, in turn, could cause our stock price to decline. This could have a negative effect on the market price of our common stock.
None
| PROPERTIES |
We use the following properties:
Summary of Our Land Assets
| Item | Owner | Location | Acres | Date Acquired | Tenure | Expiry dates | Nature of ownership | Nature of project | Owner | Location | Acres | Date Acquired | Tenure | Expiry dates | Nature of ownership | Nature of project | ||||||||||||||||
| Hunan Lot 1 | HSA | Ouchi Village, Fenghuo Town, Linli County | 31.92 | 4/5/2011 | 43 | 4/4/2054 | Lease | Fertilizer production | HSA | Ouchi Village, Fenghuo Town, Linli County | 31.92 | 4/5/2011 | 43 | 3/31/2054 | Lease | Fertilizer production | ||||||||||||||||
| Hunan Lot 2 | HSA | Ouchi Village, Fenghuo Town, Linli County | 247.05 | 7/1/2011 | 60 | 6/30/2071 | Management Right | Pasture growing | HSA | Ouchi Village, Fenghuo Town, Linli County | 247.05 | 7/18/2011 | 60 | 7/17/2071 | Management Right | Pasture growing | ||||||||||||||||
| Hunan Lot 3 | HSA | Ouchi Village, Fenghuo Town, Linli County | 8.24 | 5/24/2011 | 40 | 5/23/2051 | Land Use Rights | Fertilizer production | HSA | Ouchi Village, Fenghuo Town, Linli County | 8.24 | 5/24/2011 | 40 | 5/23/2051 | Land Use Rights | Fertilizer production | ||||||||||||||||
| Hunan Lot 4 | HSA | Ouchi Village, Fenghuo Town, Linli County | 24.71 | 6/1/2018 | 50 | 5/31/2068 | Lease | Cattle fattening | ||||||||||||||||||||||||
| Guangdong Lot 1 | JHST | Yane Village, Liangxi Town, Enping City | 8.23 | 8/10/2007 | 60 | 8/9/2067 | Management Right | HU Plantation | JHST | Yane Village, Liangxi Town, Enping City | 8.23 | 8/10/2007 | 60 | 9/8/2067 | Management Right | HU Plantation | ||||||||||||||||
| Guangdong Lot 2 | JHST | Nandu Village of Yane Village, Liangxi Town, Enping City | 27.78 | 3/14/2007 | 60 | 3/13/2067 | Management Right | HU Plantation | JHST | Nandu Village of Yane Village, Liangxi Town, Enping City | 27.78 | 3/14/2007 | 60 | 4/15/2067 | Management Right | HU Plantation | ||||||||||||||||
| Guangdong Lot 3 | JHST | Nandu Village of Yane Village, Liangxi Town, Enping City | 60.72 | 3/14/2007 | 60 | 3/13/2067 | Management Right | HU Plantation | JHST | Nandu Village of Yane Village, Liangxi Town, Enping City | 60.72 | 4/18/2007 | 60 | 4/17/2067 | Management Right | HU Plantation | ||||||||||||||||
| Guangdong Lot 4 | JHST | Nandu Village of Yane Village, Liangxi Town, Enping City | 54.68 | 9/12/2007 | 60 | 9/11/2067 | Management Right | HU Plantation | JHST | Nandu Village of Yane Village, Liangxi Town, Enping City | 54.68 | 9/12/2007 | 60 | 9/11/2067 | Management Right | HU Plantation | ||||||||||||||||
| Guangdong Lot 5 | JHST | Jishilu Village of Dawan Village, Juntang Town, Enping City | 28.82 | 9/12/2007 | 60 | 9/11/2067 | Management Right | HU Plantation | JHST | Jishilu Village of Dawan Village, Juntang Town, Enping City | 28.82 | 9/12/2007 | 60 | 9/11/2067 | Management Right | HU Plantation | ||||||||||||||||
| Guangdong Lot 6 | JHST | Liankai Village of Niujiang Town, Enping City | 31.84 | 1/1/2008 | 60 | 12/31/2068 | Management Right | Fish Farm | JHST | Liankai Village of Niujiang Town, Enping City | 31.84 | 1/1/2008 | 60 | 1/1/2068 | Management Right | HU Plantation | ||||||||||||||||
| Guangdong Lot 7 | JHST | Nandu Village of Yane Village, Liangxi Town, Enping City | 41.18 | 1/1/2011 | 26 | 12/31/2037 | Management Right | HU Plantation | JHST | Nandu Village of Yane Village, Liangxi Town, Enping City | 41.18 | 1/1/2011 | 26 | 12/31/2037 | Management Right | HU Plantation | ||||||||||||||||
| Guangdong Lot 8 | JHST | Shangchong Village of Yane Village, Liangxi Town, Enping City | 11.28 | 1/1/2011 | 26 | 12/31/2037 | Management Right | HU Plantation | JHST | Shangchong Village of Yane Village, Liangxi Town, Enping City | 11.28 | 1/1/2011 | 26 | 12/31/2037 | Management Right | HU Plantation | ||||||||||||||||
| Guangdong Lot 9 | MEIJI | Xiaoban Village of Yane Village, Liangxi Town, Enping City | 27.02 | 4/1/2011 | 20 | 3/31/2031 | Management Right | Cattle Farm | MEIJI | Xiaoban Village of Yane Village, Liangxi Town, Enping City | 41.18 | 4/1/2011 | 20 | 3/31/2031 | Management Right | Cattle Farm | ||||||||||||||||
| Qinghai Lot 1 | SJAP | No. 498, Bei Da Road, Chengguan Town of Huangyuan County, Xining City, Qinghai Province | 21.09 | 11/1/2011 | 40 | 10/30/2051 | Land Use Right & Building ownership | Cattle farm, fertilizer and livestock feed production | SJAP | No. 498, Bei Da Road, Chengguan Town of Huangyuan County, Xining City, Qinghai Province | 21.07 | 11/1/2011 | 40 | 10/30/2051 | Land Use Right & Building ownership | Cattle farm, fertilizer and livestock feed production | ||||||||||||||||
| Guangdong Lot 10 | JHST | Niu Jiang Town, Liangxi Town, Enping City | 6.26 | 3/4/2013 | 10 | 3/3/2023 | Management Right (lease) | Processing factory | JHST | Niu Jiang Town, Liangxi Town, Enping City | 6.27 | 4/1/2013 | 10 | 3/31/2023 | Management Right | Processing factory | ||||||||||||||||
| Guangdong lot 11 | CA | Da San Dui Wei ,You Nan Village, Conghua District of Guangzhou City | 33.27 | 10/28/2014 | 30 | 10/27/2044 | Management Right | Agriculture | ||||||||||||||||||||||||
45
We do not own any of the land mentioned in the table above; as suchabove
Land ownership in China
In China, nearly all land is owned by the natureCentral Government or local village collectives, which grant “usufructuary” rights (i.e., the right to use and enjoy the derived benefits for a period of time) in the form of land “ownership”use rights. This is further clarified as follows:similar to “leasehold” land rights in the United States. Corporate entities and individuals may own the property (buildings) erected on Government land. Land use rights may be transferred, but they are based on agricultural contracts, and cannot be changed arbitrarily to non-agricultural purposes.
In general, the Government owns all land. In urban areas, the land is owned directly by the central Government. In rural and suburban areas, the local village collectives, usually through the villagers’ collective economic organization, or the village committees, own the agricultural land. Uncultivated land in mountain and other remote areas is also Government-owned. Corporate entities and individuals may own the enhancements (buildings, fences, and other structures) erected on Government land.
As such, any transferrable rights to the land are in the form of usufructuary rights (i.e., the right to use and enjoy the benefits derived therefrom for a period)period of time).
There are several types of usufructuary rights. These include the right to land contractual management (granted by local village collectives for agriculture land), the right to use of construction land (state land in urban areas), etc. The right to land contractual management allows a party the rights to possess, utilize, and obtain profits from agricultural land. This right is transferrable, but this land use right is based on agricultural household contracts and cannot be changed arbitrarily to non-agricultural purposes.
A usufructuary right properly granted in accordance with the laws may be transferred, leased, or mortgaged in accordance with the laws and the terms of the land-grant contract.
1. A lease confers on the recipient the same right to use and enjoy the benefits, except for the right to own the building erected by the recipient and the right to transfer. In case of government acquisition of the land, the compensation paid by the government for the building will go to the lessor, unless the lease agreement states otherwise. The Agreement for the 109.79MU land of HSA is stated to be a lease agreement but the terms therein seem to suggest that HSA is being granted a Management Right.
2 & 3. Land Use Rights and Management Rights confer the same right to use and enjoy the benefits. “Land Use Right” is one granted by the State and usually used in the context of urban land, whereas local village collectives grant “Management Rights” and the term usually applies to rural land.
4. The term Land Use Right relates to the right to use the land and enjoy the benefits derived there from, whereas Building Ownership Right relates to the right to ownership of the building erected on the land concerned. SJAP was granted a Land Use Right by the State for the land (state-owned land), and a Building Ownership Right for the buildings erected thereon.
As producers active in the agriculture industry, our subsidiaries are presently exempt from income tax and enjoy various incentive grants and subsidies given by the China Government. If the Chinese government were to change its presently favorable policy toward the agriculture industry, we would no longer enjoy our present tax-related privileges, which would materially and adversely impact our sales performance, margins, and net profit and our costs structure. We have experienced, and may continue to experience, quick changes of policies by the Chinese government. If we do not effectively and efficiently manage our growth on time due to lack of capital, we could suffer adversely from the consequences of any such policy changes.
SIAF’s Company of Companies - Rented Premises Profiles
| 7. | SIAF’s Company of Companies - Rented Premises Profiles |
| Company | Location | Usage | Landlord | Tenure | |||||
| Sino Agro Food, Inc. | Room No. 9, Linhexi Rd., Tianhe District, Guangzhou City | Head Office | Guangzhou Shine Real Property Development Limited Company | July 9, 2016 to July 8, 2018
| |||||
| Jiangmen City Heng Sheng Tai Agriculture Development Co. Ltd. | Unit | Office | Enping City Jiangzhou Water Engineering Management Dept. | April 1, | |||||
| 2019 | |||||||||
| LEGAL PROCEEDINGS |
In the ordinary course of business, we may be involved in legal proceedings from time to time. As of the date hereof, except as set forth herein, there are no known legal proceedings against the Company. No governmental agency has instituted proceedings, served, or threatened the Company with any complaints.
On March 26, 2019, a shareholder derivative complaint was filed in the United States District Court for the Southern District of New York against the Company, as well as four of its current directors, styled Heng Ren Silk Road Investments LLC, Heng Ren Investments LP, derivatively on behalf of Sino Agro Food Inc. v. Sino Agro Food Inc., Lee Yip Kun Solomon, Tan PoayTeik, Chen BorHann, Lim Chang Soh, and Sino Agro Food Inc., as the nominal defendant (Case No.: 1:19-cv-02680) (the “Complaint”).
Not applicable.The Complaint alleges violations of securities laws and state law, breaches of fiduciary duties (including gross mismanagement of the Company) by the individual defendants, a material default of its obligations under a commercial loan agreement, misleading and false statements (including material omissions) by the individual defendants, and unauthorized issuance of new shares of Common Stock to pay debts that, in the view of the plaintiffs, has diluted shareholder ownership and oppressed shareholders of the Company (the litigated claims). The Company and the individual defendants believe that these claims are without merit and intend to vigorously defend against the Complaint. Based on the Company’s assessment of the facts underlying the claims, the uncertainty of litigation, and the preliminary stage of the case, the Company cannot estimate the reasonably possible loss or range of loss that may result from this action. However, an unfavorable outcome may have a material adverse effect on our business, financial condition and results of operations.
On July 23, 2020, the Court issued an Order (the “Order”) preliminarily approving settlement, authorizing notice and scheduling the settlement hearing for the Complaint. Under the terms of the Order, among other things, within 10 calendar days of the Order (i) the Company shall provide notice of the Settlement by filing with the SEC a Form 8-K, which shall include as exhibits (A) the Notice of Proposed Settlement of Shareholder Derivative Litigation (the “Notice”) and (B) the Settlement, (ii) counsel for the Plaintiffs shall file the Notice via a national wire service and (iii) the Company shall make available on its corporate website the Form 8-K and exhibits for the time period set forth in the Order. In addition, the Order scheduled a settlement hearing for October 13, 2020 to consider whether to grant final approval to the Settlement.The Settlement contains no admission of wrongdoing. The Company has always maintained and continues to believe that it did not engage in any wrongdoing or otherwise commit any violation of federal or state securities laws or other laws.
PART IIOn October 13th 2020, the Court granted the final approval to the Settlement of Shareholder Derivative Litigation and dismissed the Shareholder Derivative Litigation with prejudice. The Court found that the terms of the settlement are fair, reasonable and adequate as to each of the parties, and hereby approved the Settlement in all respects and as of October 13th 2020 SIAF, Lee Solomon Yip Kun, Tan PoayTeil, Chen Bor Hann and Lim Chang Sohhave, fully, finally and forever released, relinquished, discharged and dismissed with prejudice from the litigated claims.
| COMMON EQUITY AND RELATED STOCKHOLDER MATTERS |
On July 24, 2007, our Common Stock began to be quoted on the Pink OTC Markets under the symbol “SIAF.PK.” Commencing January 5, 2012, our common stock has been quoted on the OTC QB under the symbol of “SIAF” and is presently quoted on the OTC QX Premier. The following table lists the closing sale price for our Common Stock as reported by The NASDAQ Stock Market for each quarter within the last two completed fiscal years.
| Year 2015 | High | Low | ||||||
| First Quarter | $ | 11.13 | $ | 8.2 | ||||
| Second Quarter | $ | 16.82 | $ | 10.55 | ||||
| Third Quarter | $ | 13.83 | $ | 9.55 | ||||
| Fourth Quarter | $ | 10.2 | $ | 7.8 | ||||
| Year 2016 | High | Low | ||||||
| First Quarter | $ | 11.4 | $ | 7.56 | ||||
| Second Quarter | $ | 8.05 | $ | 4.34 | ||||
| Third Quarter | $ | 5.85 | $ | 4.51 | ||||
| Fourth Quarter | $ | 4.88 | $ | 3.42 | ||||
| First Quarter of 2017 through March 10, 2017 | $ | 4.22 | $ | 2.72 | ||||
The closing price of our common stock on the OTC QX on March 10, 2017 was $3.45 per share.
Holders
As the date of December 31, 2016,this report 21.06.2021, an aggregate of 22,726,85960,352,942 shares of our common stock were issued and outstanding and were owned by 1,582 holders with approximately 114116 active holders of record.
| Year Ended December 31, | ||||||||||||||||||||
| 2016 | 2015 | 2014 | 2013 | 2012 | ||||||||||||||||
| $ | $ | $ | $ | $ | ||||||||||||||||
| Income Data: | ||||||||||||||||||||
| Total revenues | 404,348,515 | 429,053,484 | 404,334,373 | 261,425,813 | 138,613,639 | |||||||||||||||
| Income from continuing operations | 342,945,752 | 343,649,468 | 404,334,373 | 261,425,813 | 138,613,639 | |||||||||||||||
| Balance Sheet Data: | ||||||||||||||||||||
| Total investments | 139,854,216 | 769,941 | 817,127 | - | - | |||||||||||||||
| Total assets | 765,661,147 | 639,574,193 | 532,686,889 | 367,514,931 | 243,098,978 | |||||||||||||||
| Debt and junior subordinated | 8,649,272 | 6,020,942 | 6,716,784 | 4,280,794 | 3,356,933 | |||||||||||||||
| debt securities | 22,428,017 | 35,770,707 | 15,803,928 | 1,725,000 | 0 | |||||||||||||||
| Stockholders' equity | 703,938,053 | 569,935,121 | 462,227,658 | 331,598,370 | 217,090,742 | |||||||||||||||
| Per Share Data: | ||||||||||||||||||||
| Cash dividends declared per common share | 0 | 0 | 0 | 0 | 0.099 | |||||||||||||||
| Basic income (loss) per common share from continuing operations | 2.09 | 2.81 | 5.81 | 6.14 | 6.93 | |||||||||||||||
| Diluted income (loss) per common share from continuing operations | 1.93 | 2.72 | 5.56 | 5.76 | 6.24 | |||||||||||||||
| Book value per common share | 33.46 | 31.68 | 29.17 | 27.42 | 2.65 | |||||||||||||||
| 21,040,065 | 17,988,619 | 15,847,496 | 12,093,973 | 82,016,910 | ||||||||||||||||
Recent Sales
During the period covered by this Annual Report, we issued an aggregate of 0 (nil) shares of our common stock; and in fiscal year 2019 we issued an aggregate of 77,443 shares of our common stock to certain Chinese persons who perform services to us. The shares were issued pursuant to the exemption from registration under the Securities Act provided by its Regulation S.
PART 2; MANAGEMENT’S DISCUSSION AND ANALYSIS OF FINANCIAL CONDITION AND RESULTS OF OPERATIONS
| 1. | Consolidated revenues are generated from business activities as follows: |
1.1. The Organic fertilizer of HAS
This Annual Report contains “forward-looking statements,” within the meaningFrom 1st October 2019, HSA leased its fertilizer operation to Mr. Lee Ping (the head of the Private Securities Litigation Reform Actexisting management team) as such HSA’s revenues are derived from leasing contracts thereon.
So from 1st October 2021, there is no more sales revenue generated from HSA but leasing and contracting revenue of 1995 and Section 21E$5,455,188.00 representing 55% of the Securities Exchange Actgroup’s revenue of 1934, as amended (the “Exchange Act”). The Company intends such forward-looking statements$9,892.398.00 and gross profit of $1,476,855.00 compares to be covered by the safe harbor provisionsgroup’s total gross profit of -132,061.87 for forward-looking statements contained in Section 21Efiscal year ended 31.12.2020: whereas revenue for fiscal year ended December 31, 2019 was USD 15.58 million or 11.48 percent of the Exchange Act. Forward-looking statements can be identified using forward-looking terminology, such as “estimates,” “projects,” “plans,” “believes,” “expects,” “anticipates,” “intends,”Company’s total sales of goods revenue of USD 135.6 million in the same period. Gross profit for same division in the fiscal year ended December 31, 2019 was USD2.3million or the negative thereof or other variations thereon, or by discussions11.1% of strategy that involve risks and uncertainties These statements reflect management’s current beliefs and are based on information now available to it. Accordingly, these statements are subject to certain risks, uncertainties and contingencies that could cause the Company’s actual results, performance or achievementstotal gross profit in 2016 and beyond to differ materially from those expressed in, or implied by, such statements. Such statements, include, but are not limited to, statements contained in this Annual Report relating to the Company’s business, financial performance, business strategy, recently announced transactions and capital outlook. Important factors that could cause actual results to differ materially from thosesales of goods of USD 20.60 million in the forward-looking statements include: a continued decline in general economic conditions nationally and internationally; decreased demand for our products and services; market acceptancesame period.
| 1.2 | Cattle farms (MEIJI) & (JHMC) |
From 1st October 2019, MEIJI leased its Cattle farms’ operation to Mr. Fan Xin June (the head of our products; the impact of any litigation or infringement actions brought against us; competitionexisting management team) as such MEIJI’s revenues are derived from other providers and products; the inability to raise capital to fund continuing operations; changes in government regulation; the ability to complete customer transactions, and other factors relating to our industry, our operations and results of operations and any businesses that may be acquired by us. Should one or more of these risks or uncertainties materialize, or should the underlying assumptions prove incorrect, actual results may differ significantly from those anticipated, believed, estimated, expected, intended or planned. Readers of this Annual Report should not place undue reliance on any forward-looking statements. Except as required by federal securities laws, the Company undertakes no obligation to update or revise these forward-looking statements to reflect new events or uncertainties.leasing contracts thereon.
You should read the following discussionSo from 1st October 2021, there is no more sales revenue generated from MEIJI but leasing and analysiscontracting revenue of $1,984,784 representing 20% of the financial conditiongroup total revenue of 9,892,398.00 and resultsgross profit of operations$819,416.00 compares to the group’s total gross profit of -132,061.87 for fiscal year ended 31.12.2020: whereas revenue for fiscal year ended December 31, 2019 was $36.19 million, or 26.69%, of the Company’s total sales of goods revenue of USD 135.60million in the same period. Gross profit for the Cattle Farm (MEIJI) division for the 12 months ended December 31, 2019 was $6.9 million, or 33.5% percent of the Company’s total gross profit on sales of goods of $20.60 million in the same period.
| 1.3 | Plantation of (JHST) |
From 1st October 2019, JHST leased its Cattle farms’ operation to Mr. Fan Xin June (the head of the existing management team) as such MEIJI’s revenues are derived from leasing contracts thereon.
So from 1st October 2021, there is no more sales revenue generated from JHST but leasing and contracting revenue of $2,452,426.00 representing 24.78% of the group total revenue of 9,892,398.00 and gross profit of $528,110.00 compares to the group’s total gross profit of -132,061.87 for fiscal year ended 31.12.2020: whereas revenue for 12 months ended December 31, 2019 was $4.59 million or 22.28% of the Company’s total sales of goods revenue of $135.6 million in the same period. Gross profit for the plantation division for the 12 months ended December 31, 2019 was $0.88 million, or 4.27% percent of the Company’s total gross profit for sales of goods of $20.60 million in the same period.
| 1.4 | Marketing & Trading operation of The Corporate Sector |
There was no sales revenues generated due to the adversity induced from the Pandemic of COVID-19 in fiscal year 2020 incurring a loss of $88,639,486 for fiscal year ended 31.12.2020 whereas sales revenue for 12 months ended December 31, 2019 was $66.23 million or 48.8% of the Company’s total sales of goods revenue of $135.6 million in the same period. Gross profit for the plantation division for the 12 months ended December 31, 2019was 7.36 million, or 35.72% of the Company’s total gross profit for sales of goods $20.60 million in the same period.
| 1.5 | Project Development of (CA) |
The project developments (or Technology engineering consulting and services) works are carried out by CA on aquaculture related projects and by SIAF and MEIJI on non-aquaculture and agriculture projects:
There was no sales revenues generated due to the adversity induced from the Pandemic of COVID-19 in fiscal year 2020 incurring a loss of $46,246,083.00 for fiscal year ended 31.12.2020 whereas project development revenue for the12 months ended December 31 2019 was $1.72 million or 1.26% of the Company’s total revenue of $135.06 million and gross profit for project development for the same period was $0.13 million or 0.6% of the Company’s total gross profit of $20.6 million
| 1.6 | The unconsolidated Investment incomes from investees |
The Company presently has investments in two associates that their financials are not being consolidated into the Company’s consolidated financials;
| a. | Investment in SJAP |
From 1st October 2021, there is no more sales revenue generated from SJAP but from investment of an investee of the Company, together withas such in 2020 our earning in investment in SJAP is $ 88,112.00 for fiscal year ended 31.12.2020; whereas Revenue for fiscal year ended December 31, 2019 was USD 11.29 million or 8.3 percent of the financial statementsCompany’s total sales of goods revenue of USD 135.60 million in the same period. Gross profit for same division in the fiscal year ended December 31,2019 was at USD3.02 million, or 14.66% of the Company’s total gross profit in sales of goods of USD 20.60 million in the same period.
b. Investment in Tri-way
From 1st October 2016 the carve-off of Tri-way mentioned in earlier 10Ks and 10Qs reports that the related notes presented herein.Company is holding 36.6 % equity interest in Tri-way. Our share of losses on the investment of Tri-way is $28,277,658.00 for fiscal year ended 31.12.2020.
Description and interpretation and clarification of business category on the consolidated results of the operations
The Company’s strategy is to manage and operate its businesses under five (5) business divisions or units on a standalone basis, namely:
A summary of each business division and operations is described below:
Businesses Division:
Capital Award generates revenues from providing engineering consulting services as turnkey contractors to owners and developers of fishery projects that are being designed and engineered into turnkey contracts by Capital Award in China using its A Power Module Technology Systems (“APM”) as follows:
(A). Engineering and Technology Services; via Consulting and Service Contracts (“CSC’s”) for the development, construction, and supply of plant and equipment, and management of fishery (and prawn or shrimp) farms and related business operations. From January 2020 up to the date of this annual report CA has not been able to do any fishery project or fishery project development due to the effects of the Pandemic COVID-19 as such, there was no revenue generated from January 2020 to May 31st 2021. However, the Company and CA have been exploring other possible business opportunities during the period and SIAF became the joint venture partner of the China Africa Joint Chamber of Commerce and Industries (CAJCCI) which is a non-profit organization established in November 2016 by the China and Africa Governments to plan and to implement agriculture projects and related developments in Africa through development fund of US$60 Billion every three years provided by and granted by the China Government to Africa Nations in Agriculture industry projects and developments etc. In March 2021, development project papers in (i). Development of Trading of exporting dried cassavas to China and exporting of plant and equipment from China to Madagascar and developments of cassavas plantations and related value added processing and drying of cassavas on 100,000 acres of land in Madagascar and (ii). Development of goat farms and related value added processing in Madagascar were submitted to CAJCCI and Government of Madagascar; by early May 2021, both CAJCCI and the Government of Madagascar gave consents to both projects such that we have obtained official invitation to go to Madagascar to initiate the Projects subjecting to the Pandemic COVID-19 situation and conditions will be improved and controlled, we shall have our team members (including various professionals and professionals from CAJCCI) to assist our current Madagascar management teams of two members in Madagascar to start up the Projects.
(B). Seafood Sales from CA’s projected farms (discontinuedfarms; became a discontinued segment of operations beginningfrom October 5, 2016; further information regarding this transition is delineated2016 when Tri-way was disposed to other third parties in term Tri-way was reclassified as an unconsolidated equity investee on same date.
| l | Corporate & Others Division refers to the trading segment of business operations of the Group named internally under corporate division of Sino Agro Food, Inc., including import/export business and consulting and service operations provided to projects that are not included in the above categories, and not limited to corporate affairs. Over the years up until end of fiscal year 2019 the corporate division imported mainly live seafood from South Africa countries, Vietnam, Thailand, Russian and other nearby countries and frozen beef from Australia and South America countries; however it is due to the interruptions and adverse impacts caused by the Pandemic COVID-19 made it impossible and unprofitable to continue the imports of live seafood, and the poor political relationship between China and Australia in 2020 induced high risks on the imports of Australian beef. The Corporate’s trading division based on standalone figures ended up with a loss of over $1.6 million as at 31.12 2020. However, over the years the Company has built up a strong base of connections and customers in China that provides an unique opportunity to the Company to develop an additional Trading Platform aiming to generate additional revenues, profits and most importantly positive cash flows, so from July 2020 onward, the corporate division started to explore the opportunities of importing some of the China markets’ niche products and managed to start to import from March 2021, frozen chicken (that China imports millions of metric tons annually) and pork products (that China has been in shortage since the pandemic of European Swine Diseases occurred in 2018 disrupted the domestic supply of pork estimated until year 2026), from Brazil, USA, Argentina and other South America countries and (ii). Dried agriculture products (i.e. Dried Cassavas that has vast industrial and consumable food processing applications, that China has an annual short fall of over 4 million MT; peanuts, cashew-nuts, Soybeans that China imports multiples of millions of MT annually, etc.) from South Africa Countries (i.e. Madagascar, Ghana, Nigeria and Cote D’lovire etc.) and Brazil. Although in so far the Company achieved minimal financial impacts, (please refer to a standalone Q1 2021 income statement of the Trading division attached in the later Chapter named Subsequent events). During months of venturing into this trading activity, we experienced many teething problems and obstacles especially with the supplies of the said commodities affected mainly by the said Pandemic situations causing much stringent and constant changes of importation regulations requiring much tougher importation and cargoes release conditions and procedures, précised timely and orderly documentary presentation with the China custom authority and extremely tight controls domestically disorientated all arrangements with domestic cold storages and logistic operations etc. resulting in inconstancy of the supplies and untimely deliveries etc. Disregarding all of these difficult consequences and hardship, the Company feels that persistence, tolerance and with time, the trading division will prevailed leading the Company into a positive cash rich path targeting encourage performances to show starting from the early quarter 1 of fiscal year 2022. ’ |
Leasing and other sectionssubcontracting of operations:
Over the years, there has been significant capital expenditures (CPE) and working capital (WC) required for and employed on the developments, expansion and operations of the annual report)
Through September 30,minor operational activities that we managed to fund while our two core businesses (in the Cattle and beef of SJAP and the Fishery of CA) were generating sufficient cash flows and incomes, however after the collapse of the SJAP’s business from 2016 Capital Award generatedand the poor performances of the Mega farms from 2017 (“Crises”) for reasons mentioned in the earlier chapters and the previous Ks and Qs reports, the Company is no longer in the position to support and to finance the growth of these minor operational businesses in the way as they were before the Crises, therefore in order that capital spending could be kept within an affordable level, the Company decided to lease and sub-contract the following operations to their respective operational managements from 1st October 2019 as such there are no sales revenue from the following:
(1). Sales to JFD (“Fish Farm 1” or “FF1”), which is a Sino Foreign Joint Venture Company (“SFJVC”), and salesincome derived from seafood sold by JFD (currently, only the JFD subsidiary is a SFJVC), being consolidated into our wholly owned Hong Kong subsidiary Tri-way Industries Ltd. (“TRW”) as one entity.
FF1 generates sales from its production of (a) its in-door APM farm with 16 APM production unitsthese operations but leasing and (b) its open dam farms producing fishsub-contracting revenues and prawns from 310 Mu (52 acres) of land leased from Zhongshan A Power Prawn Culture Farms Development Co. Ltd. (“ZSAPP,” “Prawn Farm 2” or “PF2”).
(2). Sales to and sales derived from seafood from the unincorporated companies, including Enping City A Power Prawn Culture Development Co. Ltd. (“EBAPCD,” “Prawn Farm 1” or “PF1”) and ZSAPP, are accounted for independently as follows:
CA and PF1: (a) CA purchases prawn and/or fish fingerling and feed stocks from third party suppliers and resells them to PF1 at variable small or no profit margins and (b) CA purchases matured prawns and fish from PF1 and sells to third parties (wholesale markets)incomes thereon.
| The operation of Hunan Shenghua A Power Agriculture Co. Ltd. (“HSA”) is in manufacturing and sales of organic fertilizer. From 1st October 2019 the Company contracted out its manufacturing and sales of organic fertilizer to its operational management; as such income of HSA is derived mainly from said management contract. Historically, HSA was developed to enhance more sales and profits of SJAP’s fertilizer due to the availability of a direct cargo train service between Xining and Hunan having a station within close proximity to HSA’s operation site and Hunan is a strong agricultural province producing big quantity of rice, tobaccos, tea and multiple varieties of produces that requires large quantity of fertilizer (especially in organic fertilizer due to the Government’s direction to phase out the application of chemical fertilizer in China). During the period of developing HSA’s business it was discovered that Hunan is big in aquaculture having many and large areas in natural fresh water lakes where aquaculture of fresh water fish is a dominated industry, as such HSA developed a water soluble fertilizer specially applied for and by the lake fishery farms to provide nutrients to the water plants and micro-organism for the sea animals etc. Although it was an excellent product but aging receivables were always a big problems to HSA with the fishery operators, the constant up-keeps and replacements of new production plants & equipment and the forever requirement of expending working areas and buildings to keep up with the productivity and the long (i.e. over 60 days) period of fermentation of raw materials required huge capital funds (both in CPE and WC) that the Company was not able to supply consistently and that was why HSA hasn’t reached its ultimate potential of becoming a multiple millions of MT per year producer. However HSA has a block of leased hilly land of 450 Chinese Mu, in which HSA developed 50 Mu originally for a cattle station that was changed into a piggery (with the capacity to hold 4,000 pigs at a time and producing 10,000 heads of pigs per year) in 2017 after the collapse of the local cattle industry. It was necessary to cut half of the hill in the said 50 Mu to get enough land leveled to build the said piggery, then it was discovered that the 450 Mu land consisting many fine sand hills. From 2018 onward the China Government stopped most of the sand mining operations in the country so all of a sudden fine construction sand became a valuable commodity with 2019’s averaged prices (of RMB245 / cubic meter or m3) jumped more than 12 times of 2017’s averaged prices. As such HSA is sitting on a block of valuable property. But sand mining is restricted by the China Government Regulation so it is impossible to obtain any sand mining permits. By September of 2020 the Company strategically designed a business plan for HSA to expand its piggery to produce 200,000 head of pigs per annual using and developing the whole of said 450 Mu that will be financed ultimately by the fine sand recovered from said development’s leveling activities. In this aspect, the related Project’s business plan (including all feasibility, viability and environmental studies) have been prepared with approaches and dialogues have been made with a number of China owned entities aiming to attract enough investors to finance the Project as soon as possible. Although currently the Pandemic effects hinder many businesses’ decisions making it difficult to predict any tangible schedule for this Hunan Project, however, our management team members are working diligently on it hoping that soon a clearer road will be opened to allow them to pick up momentum on the Project. |
PF1 generates sales from its production of (a) its indoor APM farm with 4 APM production units in 2014 and 16 APM production units from Q3 2015 and (b) its open dam farms producing fish and prawns from a 290 Mu (or 48 acres) of land leased from PF2.
CA and PF2: (a) CA earns commission from the sale of prawn fingerlings that are sold by PF2 to third parties, and in this respect PF2 produces its own prawn fingerlings as compared to CA’s purchasing them from PF2 and reselling them to PF1 or FF1, as described above, and (b) CA purchases matured prawns and fish from PF2 and sells to third parties (wholesale markets).
PF2 has 6 indoor APM production units producing mainly prawn fingerling and an open dam farms situated on about 400 Mu (about 66 acres) producing prawns and fish.
| l | Plantation Division refers to the operations of Jiangmen City Heng Sheng Tai Agriculture Development Co. Ltd. (“JHST”) in the HU Plantation business where dragon fruit flowers (dried and fresh), crops of vegetables and immortal vegetables (dried) are sold to wholesale and retail markets. JHST’s financial statements are consolidated into the financial statements of Macau EIJI Company Ltd. (“MEIJI”) as one entity. From 1st October 2019 the Company contracted out its plantation operation to its operational management; as such income of JHST is derived mainly from said management contract. Over the years, the Company has tried many means to increase the performances of the plantation (of 1,250 Chinese Mu) but failed due mainly to the plantation is situated in an area subjecting to heavy rainfalls yearly that induced root diseases to the dragon fruit plants stopping the yield of flowers. 1,250 Mu plantation is too small for growing of other selective fruit plants except for the growing of cash crops (i.e. seasonal vegetables etc.), however growing of cash crops is labor intensive, so with the forever increases of labor and operation costs in China and the seasonal unpredictable sales prices of cash crops, managements of the Company has yet to find a suitable solution for JHST but keep on trying hoping that eventually a perfect solution will surface to revitalize JHST. In the meantime leasing and contracting JHST ‘s operation to its existing operational management will limit the Company’s financing exposure in both CPE and WC requirements from JHST. |
Investments in investees:
SJAP: Up until 1st October 2019, cattle and beef divisional operation of our partially owned subsidiary Qinghai Sanjiang A Power Agriculture Co., Ltd. (“SJAP”) in manufacturing and sales of organic fertilizer, bulk livestock feed, concentrated livestock feed, and the sales of live cattle inclusive of: (a) cattle that are not being slaughtered in our own slaughter house operated by Qinghai Zhong He Meat Products Co., Limited (“QZH”) are sold live to third party livestock wholesalers, and (b) cattle that are sold to QZH and slaughtered and deboned and packed by QZH; and the sales of meats deboned and packed by QZH that are sold to various meat distributors, wholesalers and super market chains and our own retail butcher stores. QZH is a fully owned subsidiary of SJAP; as such, the financial statements of these three companies (SJAP, QZH and HSA) are consolidated into our wholly owned subsidiary, A Power Agro Agriculture Development (Macau) Limited (“APWAM”), as one entity. SJAP and QZH are both variable interest entities over which we exercise significant control. As of December 30, 2017, QZH was derecognized as variable interest entity and its operating profit and/or loss no longer accretive to the Company’s 41.25% holding in SJAP, a variable interest entity. More details related to QZH’s discontinuance of operations is delineated throughout other sections of this report. In November 2015 the China Government announced a Macro Economic Policy to allow the imports of cattle and beef from many developing and developed countries that impacted adversely and directly to its local cattle and beef industry, all of a sudden the local cattle and beef industry was transformed from a protected industry to a non-protected industry, as such SJAP was on a decline financially since 2016 that took SJAP 3 full years to stop the bleeding capped the losses totaling to S$ 12 million as shown in SIAF’s 10K 31.12 2019 report. On September 30th 2019, Mr. Solomon Lee resigned as the Chairman of SJAP resulting in categorization of SJAP as an Investor in Associate from a subsidiary status, and SJAP contracted out its business operations to its existing operational management, as such it is not a variable interest entity and SJAP was reclassified as an unconsolidated equity investee and SJAP’s cattle and beef operation is discontinued on same date.
However in 2020 it is due to the adverse impacts of the COVID-19 Pandemic, SJAP again suffered badly with further losses of $1.28 million that was saved by a Government Grant of $1.48 million netting profit of $200,000 for 2020. It is because SJAP became an investee of SIAF since 01102019 such that its 2020 financial is not detailed in SIAF’s 10K 2020 financial report but under Chapter of Subsequent events of SIAF’s 10K 2020 a separated information memorandum attached showing SJAP’s 2020 Income Statements. Before the Pandemic COVID-19 events in 2019, a revitalization plan was developed between the company SIAF, SJAP and the Xining Government aiming to rebuild, turn and reorganize SJAP into one of the biggest cattle and beef operating complexes of the Country. The business and development plan of the Project is summarized as follows: (i). The local Government of Huangyuan district Xining (where SJAP’s core operations are located), agreed in principle to grant an additional 450 Chinese Mu zoned commercial land to SJAP such that together with SJAP’s existing land bank of 415 Chinese Mu zoned commercial and industrial land amounting to a total of 865 Chinese Mu of land collectively for the said project’s developments, (ii). The Project is to develop multiple wholesaling and retailing centers and outlets, cold storages and warehouses facilities, logistics and distribution and servicing establishments, abattoirs and value added processing factories and facilities, e-commerce centers and other supporting community services etc. to cater for 4 million heads of locally breed (long hair wild cattle) grown annually in the Huangyuan county and Xining Districts, (iii). The Project is to be developed in multiple phases for completion in 5 years with cash flows and revenues to be generated from Phase (2) of the development starting from the beginning of year 3, and its equity structure is planned to be shared between the China Central and local Government owned entities, SJAP and a number of Public Companies listed on the China Stock Exchange, (iv). Financing of the Project is planned to be shared between the possible future development grants and incentives provided by the Central and local Governments, the shareholders of the Project Company and SJAP’s assets and operations etc. and the final exit plan is to list SJAP in the Main Board of China Stock Exchange sometimes within the development period of 5 years. It is a huge project creating many businesses opportunities for the up-stream and down-stream industries and associated activities, tens of thousands of employment opportunities and social impacts etc., involving multiple of tens of billion dollars in capital expenditure and generating multiple of hundreds of billion dollars per year in various sales and servicing revenues and incomes etc. as such the drafting of its comprehensive business and related development plan is still in progress and on-going after it has been interrupted, changed, amended and reproduced a number of times due to the change of situations and conditions impacted and up-sets caused by the Pandemic COVID-19 and in reality there have been a number of progresses making positive steps (i.e. most of the relevant government departments, investor, potential up-stream and down-stream participators, heads of many labor unions and society committees, potential construction contractors and core materials suppliers etc. of the Project were introduced to the Project and consenting with the Project’s overall aim and directions and their involvements in the Project, the allocation of Project land is progressing having constant dialogues between SJAP and the Government’s land department, progresses have been made with a number of banking channels, property sales and marketing advisors, progress on the study of environmental impacts and various related viability and feasibility studies etc. All concerned parties are hoping for the right economics conditions and timing to surface after and when the said pandemic will be controlled to allow the Project to accelerate with good momentum.
TWL: Up until 5th October 2016, our divisional fishery production and sales operation was with our fully owned subsidiary Tri-way Industries Limited (TWL or Tri-way, a private company incorporated in Hong Kong ) and our 75% owned subsidiary Jiangman Fishery Development Co. Ltd. (JFD, a limited liability company incorporated in China) operating one indoor APM farm in Enping District, Enping City. On 5th October 2016 we carve out Tri-way that became an unconsolidated investee of the Company resulted with the Company owning 36.6% equity interest in Tri-way derived from (i) 23.89% as a result of retained interest in Tri-way, and (ii) 12.71% acquired in exchange for outstanding debt owed to the Company at the time. An independent appraisal was obtained to determine fair value, and this appraisal resulted in a one-time (deemed) gain of USD 56.9 million for SIAF. In reference to the press release dated January 17, 2017, wherein the Company had indicated that legal due diligence had been completed in relation to the carve-out of its aquaculture operations, the announcement that legal due diligence had been performed had been released in conjunction with what had been the main announcement, which was SIAF wishing to convey to its shareholders that JFD had been officially registered as a Wholly Foreign Owned Enterprise of Tri-way, making it legally eligible for SIAF shareholders to now own shares of Tri-way, directly. Many information related to Tri-way (The unconsolidated investee of the Company) were reported and / or recapped in respective 10K and 10Q since 2016 onward to this 2020 10K report.
Somehow, the extremely poor operational performances of its Mega Farm (AFF 4 & 5) and its incomes in 2017 to 2019 were generated mainly from the operations of AFF 1, 2 , 3a & 3b and other sub-contracted farms. Coupling the said poor performances of the Mega farm, impacts of the COVID-19 Pandemic of 2020 caused a complete write-off for AFF 1, 2,and 3 as well as to Tri-way’s sub-contracted farms incurring losses over $77 million for the fiscal year of 2020 causing all farms to stop work for over 7 months without sufficient workers, feed, supplementary, medications, transportation and maintenances etc. to keep the live stocks going and they all died during the period calculating to multiple million pieces (equivalent to multiple of thousand metric tons). It is estimated that it will cost over $80 million in Capital Expenditures and Working Capital and two years to replace said live stocks and to bring the fishery operation of the said Aqua-farms back to the revenue and income generated in fiscal year 2019. Currently Tri-way is in a very poor financial situation as such it is not practically possible for Tri-way to revitalize and to rebuild its operations in a hurry but to reduce its operations and to concentrate its efforts on rebuilding of brood stocks, the production of fingerling and nursery stocks and repairing the damages etc. It is anticipating that under current conditions, Tri-way will take a long period to recovery. However what had happened to Tri-way doesn’t mean the end of the road for Tri-way, because (i) China is the world biggest aquaculture producer and aqua-products consumers, therefore our APRAS technology and its in-door APM farms and ODRAS dams are the niche of the aquaculture industry of China and many other developing countries of the world, our aqua-farms have proven track records of performances and sustainable viability and the quality live seafood produced by our aqua-farms have already established market niches in the China markets etc. and (ii) Tri-way has been working closely with the Company on business plans since July 2020 based on improving revenues, profits and in turn cash flows strategically to lead Tri-way into its recovery path as soon as possible. Although it is difficult to materialize any prediction or plan under the current environment affected by the Pandemic COVID-19, however managements of Tri-way are trying relentlessly and continuously to overcome all obstacles encountered so far and beyond aiming to recover within the shortest time possible.
| 2. | CONSOLIDATED RESULTS OF OPERATIONS |
CONSOLIDATED RESULTS OF OPERATIONS2.1.
Part A. Audited Income Statements of Consolidated Results of Operations for the fiscal year ended December 31, 201,2020, compared to the fiscal year ended December 31, 2014 and2019.
A (1) Income Statements (audited)
| In $ | ||||||||||||||||
| Continuing operations | Audited 2016 | Audited 2015 | Audited 2014 | Difference 2016 to 2015 | ||||||||||||
| Revenue | 342,945,752 | 343,649,468 | 298,558,486 | -703,716 | ||||||||||||
| Consulting, services, commission and management fee | 72,156,993 | 92,266,930 | 81,680,292 | -20,109,937 | ||||||||||||
| Sale of goods | 270,788,759 | 251,382,538 | 216,878,194 | 19,406,221 | ||||||||||||
| Cost of goods sold and services | 259,008,979 | 250,737,235 | 198,070,496 | 8,271,744 | ||||||||||||
| Consulting, services, commission and management fee | 47,415,205 | 57,046,350 | 44,241,900 | -9,631,145 | ||||||||||||
| Sale of goods | 211,593,774 | 193,690,885 | 153,828,596 | 17,902,889 | ||||||||||||
| Gross Profit | 83,936,773 | 92,912,233 | 100,487,990 | -8,975,460 | ||||||||||||
| Consulting, services, commission and management fee | 24,741,788 | 35,220,580 | 37,438,392 | -10,478,792 | ||||||||||||
| Sale of goods | 59,194,985 | 57,691,653 | 63,049,598 | 1,503,332 | ||||||||||||
| Other income (expenses) | -1,905,040 | -762,922 | 490,887 | -1,142,118 | ||||||||||||
| General and administrative expenses | -17,196,962 | -17,744,322 | -15,003,317 | 547,360 | ||||||||||||
| Net income | 64,834,771 | 74,404,989 | 85,975,560 | -9,570,218 | ||||||||||||
| EBITDA | 143,229,822 | 100,846,665 | 119,641,879 | 42,383,157 | ||||||||||||
| Depreciation and amortization (D&A) | 5,757,857 | 4,817,351 | 4,667,388 | 940,506 | ||||||||||||
| EBIT | 137,471,965 | 96,029,314 | 114,974,491 | 41,442,651 | ||||||||||||
| Net Interest | -4,010,699 | -4,270,322 | -761,299 | 259,623 | ||||||||||||
| Tax | 1,130 | - | - | 1,130 | ||||||||||||
| Net income (loss) from continuing operations | 64,833,641 | 74,404,989 | 85,975,560 | -10,428,652 | ||||||||||||
| Less: Net income (loss) attributable to the non - controlling interest | -20,852,875 | -23,804,038 | -19,691,934 | 2,130,190 | ||||||||||||
| Net income from continuing operations attributable to the Sino Agro Food, Inc. and subsidiaries | 43,980,766 | 50,600,951 | 66,283,626 | -6,620,185 | ||||||||||||
| Discontinuing operations | - | |||||||||||||||
| Net income/(loss) from discontinued operations | 14,869,216 | 17,354,003 | 28,237,632 | -2,484,787 | ||||||||||||
| Net gain from disposal of subsidiaries, TRW and JFD Add: Net income attributable to the non - controlling interest | 56,947,005 | -1,599,424 | -2,456,648 | 56,947,005 | ||||||||||||
| Net income of discontinued operations attributable to the Sino Agro Food, Inc. and subsidiaries | 70,995,248 | 15,754,579 | 25,780,984 | 55,240,669 | ||||||||||||
| Net income attributable to the Sino Agro Food, Inc. and subsidiaries | 114,976,014 | 66,355,530 | 92,064,610 | 48,620,484 | ||||||||||||
| Weighted average number of shares outstanding | ||||||||||||||||
| - Basic | 21,041,065 | 17,988,619 | 15,847,496 | 3,052,446 | ||||||||||||
| - Diluted | 23,194,083 | 18,576,241 | 16,554,566 | 4,617,842 | ||||||||||||
| Earnings (loss) per share attributable to Sino Agro Food, Inc. and subsidiaries common stockholders: | ||||||||||||||||
| From continuing and discontinued operations | ||||||||||||||||
| Basic | 5.46 | 3.69 | 5.81 | 1.77 | ||||||||||||
| Diluted | 5.00 | 3.60 | 5.56 | 1.40 | ||||||||||||
| From continuing operations | ||||||||||||||||
| Basic | 2.09 | 2.81 | 4.18 | 0.71 | ||||||||||||
| Diluted | 1.93 | 2.75 | 4.00 | 0.48 | ||||||||||||
| 2020 | 2019 | |||||||
| Revenue | ||||||||
| - Sale of goods | $ | - | $ | 133,879,067 | ||||
| -Leasing & contracting income | 9,892,398 | - | ||||||
| - Consulting and service income from development contracts | - | 1,719,247 | ||||||
| 9,892,398 | 135,598,314 | |||||||
| Cost of goods sold | (113,401,961 | ) | ||||||
| Cost of Leasing & contracting | (2,324,751 | ) | ||||||
| Cost of services | 0 | (1,590,017 | ) | |||||
| Gross profit | 7,567,647 | 20,606,336 | ||||||
| General and administrative expenses | -5,954,010 | -13,451,761 | ||||||
| Net income from operations | 1,613,637 | 7,154,575 | ||||||
| Other income (expenses) | ||||||||
| Government grant | - | 739,283 | ||||||
| Sharee of income from unconsolidated equity investee | -28,189,546 | 7,537,498 | ||||||
| Impairment losses | -104,492,817 | -3,834,658 | ||||||
| Other income | - | |||||||
| Non-operating expenses | - | -22,598,607 | ||||||
| Interest expense | - | -403,668 | ||||||
| Net income (expenses) | -132,682,363 | -18,560,152 | ||||||
| Net income before income taxes | -131,068,725 | -11,405,577 | ||||||
| Provision for income taxes | ||||||||
| Net income | (131,068,725 | ) | (11,405,577 | ) | ||||
| Less: Net (income) loss attributable to non - controlling interest | (992,462 | ) | 1,063,310 | |||||
| Net income attributable to Sino Agro Food Inc. and subsidiaries | (132,061,187 | ) | (10,342,267 | ) | ||||
| Other comprehensive income (loss) - Foreign currency translation gain (loss) | (435,121 | ) | 3,416,381 | |||||
| Comprehensive income | (132,496,308 | ) | (6,925,886 | ) | ||||
| Less: Other comprehensive (income) loss attributable to non - controlling interest | 159,934 | 915,590 | ||||||
| Comprehensive income attributable to the Sino Agro Food, Inc. and subsidiaries | (132,336,374 | ) | $ | (6,010,296 | ) | |||
| Earnings per share attributable to the Sino Agro Food, Inc. and subsidiaries common stockholders: | ||||||||
| Basic | (2.24 | ) | $ | (0.21 | ) | |||
| Diluted | (2.24 | ) | $ | (0.21 | ) | |||
| Weighted average number of shares outstanding: | ||||||||
| Basic | 58,951,700 | 49,963,607 | ||||||
| Diluted | 58,951,700 | 49,963,607 | ||||||
Comparative overview of FY2016 and FY2015FY2020 based on results as illustrated in Table A(1), above:
Notes to Table A.1’s 1, 2 & 3:In 2019 t
(A): Information of Note (1, 2 & 3) Sales, cost of sales and gross profit and analysis:
Thehe Company’s revenues were generated from (A) Sale of Goods and (B) Consulting and Services provided in project and business developments covering technology transfers, engineering, construction, supervision, training, management and technology licensing fees etc. whereas in 2020 the Company’s revenues were derived from Leasing and Contracting contracts without any sales revenue shown in below table.
Table (A.2). below showsreflects segmental break-down figures of Sales of goods sold,Goods Sold, Cost of Goods Sold, and related Gross ProfitsProfit for the twelve months ended December 31, 20162019 and of the revenues, cost and related gross profit of the Leasing and Contracting for the twelve months ended December 31, 2015 and 2014.2020.
| In US$ | Leasing and contracting | Sales of goods sold | Cost of Leasing and Contracting | Cost of goods sold | Gross profit of Leasing & Contracting | Sales of Goods' Gross profit | ||||||||||||||||||||
| 2020 | 2019 | 2020 | 2019 | 2020 | 2019 | |||||||||||||||||||||
| SJAP | Sales of live cattle | Discontinued operation | 3,752,843 | Discontinued operation | 3,527,690 | Discontinued operation | 225,153 | |||||||||||||||||||
| Sales of feed stock | - | |||||||||||||||||||||||||
| Bulk Livestock feed | 746,232 | 333,275 | 412,957 | |||||||||||||||||||||||
| Concentrate livestock feed | 4,864,755 | 2,713,600 | 2,151,155 | |||||||||||||||||||||||
| Sales of fertilizer | 1,922,323 | 1,688,240 | 234,083 | |||||||||||||||||||||||
| SJAP Total | 11,286,153 | 8,262,804 | 3,023,349 | |||||||||||||||||||||||
| HSA | Sales of Organic fertilizer | - | 2,597,088 | 2,154,282 | 442,806 | |||||||||||||||||||||
| Sales of Organic Mixed Fertilizer | - | 4,746,144 | 2,854,337 | 1,891,807 | ||||||||||||||||||||||
| Sales of Raw material | - | 6,986,988 | 8,262,841 | -1,275,853 | ||||||||||||||||||||||
| Leasing income | 5,455,188 | 1,253,823 | - | - | 5,455,188 | 1,253,823 | ||||||||||||||||||||
| HSA Total | 5,455,188 | 15,584,043 | - | 13,271,460 | 5,455,188 | 2,312,583 | ||||||||||||||||||||
| SJAP's& HSA/Organic fertilizer total | 5,455,188 | 26,870,196 | - | 21,534,264 | 5,455,188 | 5,335,932 | ||||||||||||||||||||
| JHST | Rental income | - | 615,784 | - | 439,747 | - | 176,037 | |||||||||||||||||||
| Sales of Raw material | - | 1,135,371 | - | 1,135,371 | - | - | ||||||||||||||||||||
| Sales of Dried HU Flowers | - | - | - | - | - | - | ||||||||||||||||||||
| Sales of Dried Immortal vegetables | - | 101,892 | - | 87,336 | - | 14,556 | ||||||||||||||||||||
| Sales of Vegetable products | - | 2,732,556 | - | 2,055,771 | - | 676,785 | ||||||||||||||||||||
| Leasing income | 2,452,426 | - | 1,751,341 | - | 701,085 | - | ||||||||||||||||||||
| JHST/Plantation Total | 2,452,426 | 4,585,603 | 1,751,341 | 3,718,225 | 701,085 | 867,378 | ||||||||||||||||||||
| MEIJI | - | |||||||||||||||||||||||||
| Sale of Live cattle (Aromatic) | - | 34,062,396 | - | 27,519,186 | - | 6,543,210 | ||||||||||||||||||||
| Sales of Raw material | - | 1,630,277 | - | 1,621,621 | - | 8,656 | ||||||||||||||||||||
| Leasing income | 1,984,784 | 498,362 | 573,410 | 143,979 | 1,411,374 | 354,383 | ||||||||||||||||||||
| MEIJI / Cattle farm Total | 1,984,784 | 36,191,035 | 573,410 | 29,284,786 | 1,411,374 | 6,906,249 | ||||||||||||||||||||
| SIAF | - | |||||||||||||||||||||||||
| Sales of goods through trading/import/export activities | - | |||||||||||||||||||||||||
| on seafood | - | 29,362,140 | - | 26,099,679 | - | 3,262,461 | ||||||||||||||||||||
| on imported beef and mutton | - | 36,870,093 | - | 32,765,007 | - | 4,105,086 | ||||||||||||||||||||
| SIAF/ Others & Corporate total | - | 66,232,233 | - | 58,864,686 | - | 7,367,547 | ||||||||||||||||||||
| Group Total | 9,892,398 | 133,879,067 | 2,324,751 | 113,401,961 | 7,567,647 | 20,477,106 | ||||||||||||||||||||
| In US$ | Sales of goods | Cost of Goods sold | Sales of Goods' Gross profit | |||||||||||||||||||||||||||||||||||
| 2016 | 2015 | 2014 | 2016 | 2015 | 2014 | 2016 | 2015 | 2014 | ||||||||||||||||||||||||||||||
| SJAP | Sales of live cattle | 20,089,907 | 64,918,069 | 63,133,245 | 17,030,573 | 55,772,479 | 46,871,370 | 3,059,334 | 9,145,590 | 16,261,875 | ||||||||||||||||||||||||||||
| Sales of feedstock | - | - | - | - | - | - | - | - | - | |||||||||||||||||||||||||||||
| Bulk Livestock feed | 6,651,262 | 6,785,204 | 6,248,211 | 2,850,779 | 3,235,364 | 3,131,565 | 3,800,483 | 3,549,840 | 3,116,646 | |||||||||||||||||||||||||||||
| Concentrate livestock feed | 16,011,795 | 12,080,945 | 13,351,295 | 8,904,363 | 7,488,318 | 8,265,121 | 7,107,432 | 4,592,627 | 5,086,174 | |||||||||||||||||||||||||||||
| Sales of fertilizer | 2,709,146 | 3,189,501 | 6,094,794 | 1,767,857 | 2,223,727 | 3,603,090 | 941,289 | 965,774 | 2,491,704 | |||||||||||||||||||||||||||||
| SJAP Total | 45,462,110 | 86,973,719 | 88,827,545 | 30,553,572 | 68,719,888 | 61,871,146 | 14,908,538 | 18,253,831 | 26,956,399 | |||||||||||||||||||||||||||||
| * QZH's (Slaughter & Deboning operation) | 495,991 | 995,975 | 548,856 | 214,879 | 490,064 | 291,501 | 281,112 | 505,911 | 257,355 | |||||||||||||||||||||||||||||
| ** QZH's (Deboning operation) | - | - | - | - | - | - | - | - | - | |||||||||||||||||||||||||||||
| on cattle & Lamb locally supplied | 12,048,559 | 12,172,816 | 7,760,595 | 9,392,673 | 9,051,354 | 5,442,396 | 2,655,886 | 3,121,462 | 2,318,199 | |||||||||||||||||||||||||||||
| on imported beef and mutton | 76,578,140 | 38,995,916 | 4,899,336 | 60,675,940 | 27,637,248 | 3,619,235 | 15,902,200 | 11,358,670 | 1,280,101 | |||||||||||||||||||||||||||||
| Sales of live cattle | - | 5,459,216 | - | - | 5,370,045 | - | - | 89,171 | - | |||||||||||||||||||||||||||||
| QZH Total | 89,122,690 | 57,623,925 | 13,208,787 | 70,283,492 | 42,548,711 | 9,353,132 | 18,839,198 | 15,075,214 | 3,855,655 | |||||||||||||||||||||||||||||
| HSA | Sales of Organic fertilizer | 3,699,377 | 3,593,603 | 3,782,970 | 2,937,669 | 2,633,850 | 2,521,994 | 761,709 | 959,753 | 1,260,976 | ||||||||||||||||||||||||||||
| Sales of Organic Mixed Fertilizer | 16,919,357 | 16,373,780 | 16,222,209 | 9,521,702 | 8,876,794 | 8,739,488 | 7,397,655 | 7,496,986 | 7,482,721 | |||||||||||||||||||||||||||||
| HSA Total | 20,618,734 | 19,967,383 | 20,005,179 | 12,459,371 | 11,510,644 | 11,261,482 | 8,159,364 | 8,456,739 | 8,743,697 | |||||||||||||||||||||||||||||
| SJAP's & HS.A./Organic fertilizer total | 155,203,534 | 164,565,027 | 122,041,511 | 113,296,435 | 122,779,243 | 82,485,760 | 41,907,099 | 41,785,784 | 39,555,751 | |||||||||||||||||||||||||||||
| JHST | Sales of Fresh HU Flowers | 958,063 | 1,162,572 | 600,407 | 379,711 | 391,405.00 | 196,497 | 578,352 | 771,167 | 403,910 | ||||||||||||||||||||||||||||
| Sales of Dried HU Flowers | 7,209,334 | 10,018,496 | 6,431,959 | 2,817,325 | 3,085,194 | 1,786,159 | 4,392,009 | 6,933,302 | 4,645,800 | |||||||||||||||||||||||||||||
| Sales of Dried Immortal vegetables | 1,673,511 | 2,305,980 | 4,053,909 | 787,989 | 796,269 | 1,352,201 | 885,522 | 1,509,711 | 2,701,708 | |||||||||||||||||||||||||||||
| Sales of Vegetable products | 3,477,674 | 187,846 | - | 2,289,881 | 110,097 | - | 1,187,793 | 77,749 | - | |||||||||||||||||||||||||||||
| JHST/Plantation Total | 13,318,582 | 13,674,894 | 11,086,275 | 6,274,906 | 4,382,965 | 3,334,857 | 7,043,676 | 9,291,929 | 7,751,418 | |||||||||||||||||||||||||||||
| MEIJI | - | - | - | - | - | - | - | - | - | |||||||||||||||||||||||||||||
| Sale of Live cattle (Aromatic) | 29,837,560 | 35,272,834 | 32,891,161 | 28,299,710 | 33,403,353 | 31,151,084 | 1,537,850 | 1,869,481 | 1,740,077 | |||||||||||||||||||||||||||||
| MEIJI / Cattle farm Total | 29,837,560 | 35,272,834 | 32,891,161 | 28,299,710 | 33,403,353 | 31,151,084 | 1,537,850 | 1,869,481 | 1,740,077 | |||||||||||||||||||||||||||||
| SIAF | - | - | - | - | - | - | - | - | - | |||||||||||||||||||||||||||||
| Sales of goods through trading/import/export activities | - | - | - | - | - | - | - | - | - | |||||||||||||||||||||||||||||
| on seafood | 28,844,210 | 14,405,488 | 47,499,225 | 25,217,223 | 12,804,878 | 35,157,911 | 3,626,988 | 1,600,610 | 12,341,314 | |||||||||||||||||||||||||||||
| on imported beef and mutton | 43,584,873 | 23,464,295 | 3,360,022 | 38,505,500 | 20,320,446 | 1,698,984 | 5,079,372 | 3,143,849 | 1,661,038 | |||||||||||||||||||||||||||||
| SIAF/ Others & Corporate total | 72,429,083 | 37,869,783 | 50,859,247 | 63,722,723 | 33,125,324 | 36,856,895 | 8,706,360 | 4,744,459 | 14,002,352 | |||||||||||||||||||||||||||||
| - | - | - | - | - | - | - | - | - | ||||||||||||||||||||||||||||||
| Group Total | 270,788,759 | 251,382,538 | 216,878,194 | 211,593,774 | 193,690,885 | 153,828,596 | 59,194,985 | 57,691,653 | 63,049,598 | |||||||||||||||||||||||||||||
| - | - | - | - | |||||||||||||||||||||||||||||||||||
The Company’s revenues generated from sale of goods increased by $19,406,221 or 8% from $251,382,538 for the year ended December 31, 2015 to $270,788,759 for the year ended December 31, 2016. The increase was primarily due to the increase of revenues from the SIAF/Other and Corporate sector (from $37.9 million in 2015 to $72.4 million in 2016), collectively.
The Company’s cost of goods sold increased by $17,902,889 or 9% from $193,690,882 for the year ended December 31, 2015 to $211,593,774 for the year ended December 31, 2016. The increase was primarily due to the increase in cost of goods sold from the SIAF/Other and Corporate sector.
Gross profit of the Company generated from goods sold increased by $1,503,332 or 3% from $57,691,653 for the year ended December 31, 2015 to $59,194,985 for the year ended December 31, 2016. The marginal increase was primarily due to the increase of SIAF’s corporate seafood import sector increase of $4.0 million in gross profit (from 2015’s $4.7 million to 2016’s $8.7 million) offset by the other sectors as follows:
| In US$ | Sales of goods | Cost of Goods sold | Sales of Goods' Gross profit | |||||||||||||||||||||||||||||||||||
| 2016 | 2015 | 2014 | 2016 | 2015 | 2014 | 2016 | 2015 | 2014 | ||||||||||||||||||||||||||||||
| SJAP | Sales of live cattle | 20,089,907 | 64,918,069 | 63,133,245 | 17,030,573 | 55,772,479 | 46,871,370 | 3,059,334 | 9,145,590 | 16,261,875 | ||||||||||||||||||||||||||||
| Sales of feedstock | - | - | - | - | - | - | - | - | - | |||||||||||||||||||||||||||||
| Bulk Livestock feed | 6,651,262 | 6,785,204 | 6,248,211 | 2,850,779 | 3,235,364 | 3,131,565 | 3,800,483 | 3,549,840 | 3,116,646 | |||||||||||||||||||||||||||||
| Concentrate livestock feed | 16,011,795 | 12,080,945 | 13,351,295 | 8,904,363 | 7,488,318 | 8,265,121 | 7,107,432 | 4,592,627 | 5,086,174 | |||||||||||||||||||||||||||||
| Sales of fertilizer | 2,709,146 | 3,189,501 | 6,094,794 | 1,767,857 | 2,223,727 | 3,603,090 | 941,289 | 965,774 | 2,491,704 | |||||||||||||||||||||||||||||
| SJAP Cattle section Total | 45,462,110 | 86,973,719 | 88,827,545 | 30,553,572 | 68,719,888 | 61,871,146 | 14,908,538 | 18,253,831 | 26,956,399 | |||||||||||||||||||||||||||||
| % of increase (+) or decrease (-) | -48 | % | -2 | % | 43 | % | -56 | % | 11 | % | 61 | % | -18 | % | -32 | % | 13 | % | ||||||||||||||||||||
| * QZH's (Slaughter & Deboning operation) | 495,991 | 995,975 | 548,856 | 214,879 | 490,064 | 291,501 | 281,112 | 505,911 | 257,355 | |||||||||||||||||||||||||||||
| ** QZH's (Deboning operation) | - | - | - | - | - | - | - | - | - | |||||||||||||||||||||||||||||
| on cattle & Lamb locally supplied | 12,048,559 | 12,172,816 | 7,760,595 | 9,392,673 | 9,051,354 | 5,442,396 | 2,655,886 | 3,121,462 | 2,318,199 | |||||||||||||||||||||||||||||
| on imported beef and mutton | 76,578,140 | 38,995,916 | 4,899,336 | 60,675,940 | 27,637,248 | 3,619,235 | 15,902,200 | 11,358,670 | 1,280,101 | |||||||||||||||||||||||||||||
| Sales of live cattle | - | 5,459,216 | - | - | 5,370,045 | - | - | 89,171 | - | |||||||||||||||||||||||||||||
| QZH (beef section)'s Total | 89,122,690 | 57,623,925 | 13,208,787 | 70,283,492 | 42,548,711 | 9,353,132 | 18,839,198 | 15,075,214 | 3,855,655 | |||||||||||||||||||||||||||||
| % of increase (+) or decrease (-) | 55 | % | 336 | % | 65 | % | 355 | % | 25 | % | 291 | % | ||||||||||||||||||||||||||
| HSA | Sales of Organic fertilizer | 3,699,377 | 3,593,603 | 3,782,970 | 2,937,669 | 2,633,850 | 2,521,994 | 761,709 | 959,753 | 1,260,976 | ||||||||||||||||||||||||||||
| Sales of Organic Mixed Fertilizer | 16,919,357 | 16,373,780 | 16,222,209 | 9,521,702 | 8,876,794 | 8,739,488 | 7,397,655 | 7,496,986 | 7,482,721 | |||||||||||||||||||||||||||||
| HSA Total | 20,618,734 | 19,967,383 | 20,005,179 | 12,459,371 | 11,510,644 | 11,261,482 | 8,159,364 | 8,456,739 | 8,743,697 | |||||||||||||||||||||||||||||
| % of increase (+) or decrease (-) | 3 | % | 0 | % | 74 | % | 8 | % | 2 | % | 60 | % | -4 | % | -3 | % | 96 | % | ||||||||||||||||||||
| SJAP's & HS.A./Beef and Organic fertilizer total | 155,203,534 | 164,565,027 | 122,041,511 | 113,296,435 | 122,779,243 | 82,485,760 | 41,907,099 | 41,785,784 | 39,555,751 | |||||||||||||||||||||||||||||
| % of increase (+) or decrease (-) | -6 | % | 35 | % | 66 | % | -8 | % | 49 | % | 81 | % | 0 | % | 6 | % | 40 | % | ||||||||||||||||||||
Revenue from the sector of beef and organic fertilizer decreased by $9,361,493 or 6% from $164,565,027 for the year ended December 31, 2015 to $155,203,534 for the year ended December 31, 2016. The decrease was primarily due to the decrease in sales by SJAP’s sale of live cattle from $64.9 million in 2015 to $20.1 million in 2016.
Cost of goods sold from beef and organic fertilizer decreased by $9,482,808 or 8% from $122,779,243 for the year ended December 31, 2015 to $113,296,435 for the year ended December 31, 2016. The decrease was primarily due to the decrease of cost of production in SJAP’s live cattle sector.
Gross profit from the beef and organic fertilizer sector increased by $121,315 or 0% from $41,785,784 for the year ended December 31, 2015 to $41,907,099 for the year ended December 31, 2016. The increase was primarily due to the increase of QZH’s increase of gross profit from slaughter and deboning and import operations from 2015’s $11.4 million to 2016’s $15.9 million.
Table below shows the itemized sales of goods and related cost of sales in quantity and unit price for the year ended December 31, 2016 and the years, 2015 and 2014 of the beef and organic fertilizer divisions.
Description of items
| Cattle Operation | 2016 | 2015 | 2014 | Difference 2016/2015 | ||||||||||||||||
| SJAP | Production and Sales of live cattle | Heads | 8,333 | 20,441 | 18,585 | -12,108 | ||||||||||||||
| Average Unit sales price | US$/head | 2,411 | 3,176 | 3,397 | -765 | |||||||||||||||
| Unit cost prices | US$/head | 2,044 | 2,728 | 2,522 | -685 | |||||||||||||||
| Production and sales of feedstock | - | |||||||||||||||||||
| Bulk Livestock feed | MT | 35,518 | 39,040 | 37,390 | -3,522 | |||||||||||||||
| Average Unit sales price | US$/MT | 187 | 174 | 167 | 13 | |||||||||||||||
| Unit cost prices | US$/MT | 80 | 83 | 84 | -3 | |||||||||||||||
| Concentrated livestock feed | MT | 36,073 | 28,584 | 32,191 | 7,489 | |||||||||||||||
| Average Unit sales price | US$/MT | 444 | 423 | 415 | 21 | |||||||||||||||
| Unit cost prices | US$/MT | 247 | 262 | 257 | -15 | |||||||||||||||
| Production and sales of fertilizer | MT | 16,702 | 18,503 | 33,673 | -1,801 | |||||||||||||||
| Average Unit sales price | US$/MT | 162 | 172 | 181 | -10 | |||||||||||||||
| Unit cost prices | US$/MT | 106 | 120 | 107 | -14 | |||||||||||||||
| * QZH (Slaughter & De-boning operation) | ||||||||||||||||||||
| Slaughter operation | ||||||||||||||||||||
| Slaughter of cattle | Heads | 1,270 | 2,700 | 1,400 | -1,430 | |||||||||||||||
| Service fee | US$/Head | 10 | 8 | 8 | 2 | |||||||||||||||
| Sales of associated products | Pieces | 1,270 | 2,730 | 1,554 | -1,460 | |||||||||||||||
| Average Unit sales price | US$/Piece | 380 | 357 | 346 | 24 | |||||||||||||||
| Unit cost prices | US$/Piece | 169 | 180 | 188 | -10 | |||||||||||||||
| De-boning & Packaging activities | ||||||||||||||||||||
| From Cattle supplied locally | ||||||||||||||||||||
| De-boned Meats | MT | 1,371 | 1,356 | 575 | 15 | |||||||||||||||
| Average Unit sales price | US$/MT | 8,788 | 8,978 | 13,497 | -190 | |||||||||||||||
| Unit cost prices | US$/MT | 6,851 | 6,676 | 9,465 | 175 | |||||||||||||||
| From imported beef | MT | 8,914 | 4,544 | 289 | 4,370 | |||||||||||||||
| Average Unit sales price | US$/MT | 8,591 | 8,582 | 9,460 | 9 | |||||||||||||||
| Unit cost prices | US$/MT | 6,807 | 6,082 | 6,892 | 725 | |||||||||||||||
| From imported lamb | MT | 261 | ||||||||||||||||||
| Average of sales price | US$/MT | 8,297 | ||||||||||||||||||
| Average of cost prices | US$/MT | 6,235 | ||||||||||||||||||
| Production and Sales of live cattle | Heads | 2,266 | ||||||||||||||||||
| Average Unit sales price | US$/head | 2,409 | ||||||||||||||||||
| Unit cost prices | US$/head | 2,370 | ||||||||||||||||||
The average sale price of live cattle fell by $765/head primarily due to lower market prices, averaging RMB20/Kg (live weight) compared to the average of RMB24/Kg in same period of 2015 reflecting a drop of 16 % on average live weight prices of local cattle.
The decrease of bulk livestock feed sales of 3,522MT in 2016 compared to 2015 reflects seasonal variation that occurs when local farms have abundant supply of crop-feed for their cattle herds requiring less supply supplemented by SJAP.
| Description of items | 2016 | 2015 | 2014 | Difference | ||||||||||||||
| 2016/2015 | ||||||||||||||||||
| HSA | Fertilizer operation | - | ||||||||||||||||
| Organic Fertilizer | MT | 14,896 | 13,037 | 14,128 | 1,859 | |||||||||||||
| Average Unit sales price | $/MT | 238 | 262 | 260 | -25 | |||||||||||||
| Unit cost price | $/MT | 192 | 197 | 176 | -5 | |||||||||||||
| Organic Mixed Fertilizer | MT | 40,398 | 36,232 | 35,868 | 4,166 | |||||||||||||
| Average Unit sales price | $/MT | 419 | 452 | 452 | -33 | |||||||||||||
| Unit cost price | $/MT | 236 | 245 | 244 | -9 | |||||||||||||
| Retailing packed fertilizer (for super market sales) | MT | 229 | 180 | 120 | 49 | |||||||||||||
| Average Unit sales price | $/MT | 692 | 952 | 928 | -260 | |||||||||||||
| Unit cost price | $/MT | 361 | 364 | 346 | -3 | |||||||||||||
Overall sales in 2016 of organic mixed fertilizer (“OMF”) increased by 4,166MT and organic fertilizer increased by 1,859MT compared to 2015, however falling sale prices (i.e. organic fertilizer at $238 / MT in 2016 from $262 / MT in 2015 and organic mixed fertilizer at $419 / MT in 2016 from $452 / MT in 2015) reflects increased market competition in the region.
| In US$ | Sales of goods | Cost of Goods sold | Sales of Goods' Gross profit | |||||||||||||||||||||||||||||||||||
| 2016 | 2015 | 2014 | 2016 | 2015 | 2014 | 2016 | 2015 | 2014 | ||||||||||||||||||||||||||||||
| JHST | Sales of Fresh HU Flowers | 958,063 | 1,162,572 | 600,407 | 379,711.00 | 391,405 | 196,497 | 578,352 | �� | 771,167 | 403,910 | |||||||||||||||||||||||||||
| % of increases (+) or decreases (-) | -18 | % | 94 | % | -73 | % | -3 | % | 99 | % | -70 | % | -25 | % | 91 | % | -74 | % | ||||||||||||||||||||
| Sales of Dried HU Flowers | 7,209,334 | 10,018,496 | 6,431,959 | 2,817,325 | 3,085,194 | 1,786,159 | 4,392,009 | 6,933,302 | 4,645,800 | |||||||||||||||||||||||||||||
| % of increases (+) or decreases (-) | -28 | % | 56 | % | -66 | % | -9 | % | 73 | % | -80 | % | -37 | % | 49 | % | -53 | % | ||||||||||||||||||||
| Sales of Dried Immortal vegetables | 1,673,511 | 2,305,980 | 4,053,909 | 787,989 | 796,269 | 1,352,201 | 885,522 | 1,509,711 | 2,701,708 | |||||||||||||||||||||||||||||
| % of increases (+) or decreases (-) | -27 | % | -43 | % | 177 | % | -1 | % | -41 | % | 188 | % | -41 | % | -44 | % | 172 | % | ||||||||||||||||||||
| Sales of Vegetable products | 3,477,674 | 187,846 | - | 2,289,881 | 110,097 | - | 1,187,793 | 77,749 | - | |||||||||||||||||||||||||||||
| % of increases (+) or decreases (-) | 1751 | % | 1980 | % | 1428 | % | ||||||||||||||||||||||||||||||||
| JHST/Plantation Total | 13,318,582 | 13,674,894 | 11,086,275 | 6,274,906 | 4,382,965 | 3,334,857 | 7,043,676 | 9,291,929 | 7,751,418 | |||||||||||||||||||||||||||||
| % of increases (+) or decreases (-) | -3 | % | 23 | % | -51 | % | 43 | % | 31 | % | -67 | % | -24 | % | 20 | % | -39 | % | ||||||||||||||||||||
Revenue from our plantation decreased by $356,312 or 3% from $13,674,894 for the year ended December 31, 2015 to $13,318,582 for the year ended December 31, 2016, however, under closer analysis:
Cost of goods sold from the plantation increased by $1,891,941 or 43% from $4,382,965 for the year ended December 31, 2015 to $6,274,906 for the year ended December 31, 2016. The increase was primarily due to the cost in cultivating and maintaining larger acreage with higher associated labor costs, etc.
Gross profit from our plantation decreased by $2,248,253 from $9,291,929 for the year 2015 to $7,043,676 for the year 2016.
| Description of items | 2016 | 2015 | 2014 | Difference | ||||||||||||||||
| JHST | Plantation of HU Flowers and Immortal vegetables | 2016/2015 | ||||||||||||||||||
| Fresh HU Flowers | Pieces | 6,163,100 | 6,500,000 | 4,002,710 | -336,900 | |||||||||||||||
| Average Unit sales price | $/Pieces | 0.16 | 0.18 | 0.15 | -0.02 | |||||||||||||||
| Unit cost price | $/Pieces | 0.06 | 0.06 | 0.05 | 0.00 | |||||||||||||||
| Dried HU Flowers | MT | 584 | 628 | 465 | -44 | |||||||||||||||
| Average Unit sales price | $/MT | 12,345 | 15,966 | 13,832 | -3,621 | |||||||||||||||
| Unit cost price | $/MT | 4,824 | 4,917 | 3,841 | -92 | |||||||||||||||
| Dried Immortal vegetables | MT | 23 | 27 | 50 | -4 | |||||||||||||||
| Average Unit sales price | $/MT | 72,761 | 87,018 | 81,078 | -14,257 | |||||||||||||||
| Unit cost price | $/MT | 34,260 | 30,048 | 27,044 | 4,213 | |||||||||||||||
| Other Value added products | Pieces | 4,551 | 151 | - | 4,400 | |||||||||||||||
| Average Unit sales price | $/Pieces | 764 | 1,242 | - | -477 | |||||||||||||||
| Unit cost prices | $/Pieces | 503 | 728 | - | -225 | |||||||||||||||
3. Cattle Farm Divisionrefers to the operations of Cattle Farm 1 under Jiangmen City Hang Mei Cattle Farm Development Co. Ltd (“JHMC”) where cattle are sold live to third party livestock wholesalers who are selling them mainly in Guangzhou and Beijing livestock wholesale markets. The financial statements of JHMC are consolidated into MEIJI as one entity along with MEIJI’s operation in the consulting and service for development of other cattle farms, such as Cattle Farm 2, or related projects.
| In US$ | Sales of goods | Cost of Goods sold | Sales of Goods' Gross profit | |||||||||||||||||||||||||||||||||||
| 2016 | 2015 | 2014 | 2016 | 2015 | 2014 | 2016 | 2015 | 2014 | ||||||||||||||||||||||||||||||
| MEIJI | Sale of Live cattle (Aromatic) from own farm & from trading | 29,837,560 | 35,272,834 | 32,891,161 | 28,299,710 | 33,403,353 | 31,151,084 | 1,537,850 | 1,869,481 | 1,740,077 | ||||||||||||||||||||||||||||
| MEIJI / Cattle farm Total | 29,837,560 | 35,272,834 | 32,891,161 | 28,299,710 | 33,403,353 | 31,151,084 | 1,537,850 | 1,869,481 | 1,740,077 | |||||||||||||||||||||||||||||
| % of increases (+) & decreases (-) | -15 | % | 7 | % | 86 | % | -15 | % | 7 | % | 137 | % | -18 | % | 7 | % | -61 | % | ||||||||||||||||||||
Revenue from the cattle farm decreased by $5,435,274 or 15% from $35,272,834 for the year ended December 31, 2015 to $29,837,560 for the year ended December 31, 2016. The decrease was primarily due to the overall depressed situation of the domestic cattle industry such that CF1’s current operations plan is to be conservative as it works through the current market forces of the industry.
Cost of goods sold from the cattle farm decreased by $5,103,643 or 15% from $33,403,353 for the year ended December 31, 2015 to $28,299,710 for the year ended December 31, 2016.
Gross profit from cattle decreased by $331,631 from $1,869,481 for the year 2015 to $1,537,850 for the year ended December 31, 2016.
| Description of items | 2016 | 2015 | 2014 | Difference | ||||||||||||||
| 2016 to 2015 | ||||||||||||||||||
| MEIJI | Production and trading on sale of Live cattle Head | 15,977 | 14,947 | 7,842 | 1,030 | |||||||||||||
| Average Unit sales price $/head | 1,868 | 2,360 | 4,194 | -492 | ||||||||||||||
| Unit cost prices $/head | 1,771 | 2,235 | 3,972 | -464 | ||||||||||||||
| In US$ | Sales of goods | Cost of Goods sold | Sales of Goods' Gross profit | |||||||||||||||||||||||||||||||||||
| 2016 | 2015 | 2014 | 2016 | 2015 | 2014 | 2016 | 2015 | 2014 | ||||||||||||||||||||||||||||||
| SIAF | Sales of goods through trading/import/export activities | |||||||||||||||||||||||||||||||||||||
| on seafood (via imports) | 28,844,210 | 14,405,488 | 47,499,225 | 25,217,223 | 12,804,878 | 35,157,911 | 3,626,988 | 1,600,610 | 12,341,314 | |||||||||||||||||||||||||||||
| % of increases (+) and decreases (-) | 100 | % | -70 | % | 115 | % | 97 | % | -64 | % | 83 | % | 127 | % | -87 | % | 328 | % | ||||||||||||||||||||
| on imported beef mainly | 43,584,873 | 23,464,295 | 3,360,022 | 38,505,500 | 20,320,446 | 1,698,984 | 5,079,372 | 3,143,849 | 1,661,038 | |||||||||||||||||||||||||||||
| % of increases (+) and decreases (-) | 86 | % | 598 | % | 89 | % | 1096 | % | 62 | % | 89 | % | ||||||||||||||||||||||||||
| SIAF/ Others & Corporate total | 72,429,083 | 37,869,783 | 50,859,247 | 63,722,723 | 33,125,324 | 36,856,895 | 8,706,360 | 4,744,459 | 14,002,352 | |||||||||||||||||||||||||||||
| % of increases (+) and decreases (-) | 91 | % | -26 | % | 131 | % | 92 | % | -10 | % | 92 | % | 84 | % | -66 | % | 385 | % | ||||||||||||||||||||
Revenue from the corporate increased by $34,559,300 or 91% from $37,869,783 for the year ended December 31, 2015 to $72,429,083 for the year ended December 31, 2016. The increase was primarily due to increasing sources of supplies from other countries (i.e., Canada, USA and South America, as opposed to solely from Madagascar in the past). At the same time, it is also primarily due to the increase of upper-grade varieties of meat products available from more countries than just from Australia, as in the past, which lent to an increase in sales of imported beef from 2015’s $23.5 million to 2016’s $43.6 million, representing an increase of over $20.1 million or 86%.
Cost of goods sold from corporate increased by $30,597,399 or 92% from $33,125,324 for the year ended December 31, 2015 to $63,722,723 for the year ended December 31, 2016. The increase was primarily due the corresponding increase of sales.
Gross profit from the corporate increased by $3,961,901 or 84% from $4,744,459 for the year ended December 31, 2015 to $8,706,360 for the year ended December 31, 2016. The increase was primarily due to corresponding increase of sales.
| Description of items | 2016 | 2015 | 2014 | Difference | ||||||||||||||
| SIAF | Seafood trading from imports | - | ||||||||||||||||
| Mixed seafood | MT | 1,158 | 810 | 3,152 | 348 | |||||||||||||
| Average of sales price | $/MT | 24,904 | 17,785 | 15,070 | 7,119 | |||||||||||||
| Average of cost prices | $/MT | 21,772 | 15,808 | 11,154 | 5,964 | |||||||||||||
| Beef & Lamb trading from imports | MT | 4,344 | 2,556 | 590 | 1,787 | |||||||||||||
| Average of sales price | $/MT | 10,034 | 9,179 | 5,695 | 855 | |||||||||||||
| Average of cost price | $/MT | 8,865 | 7,949 | 2,880 | 915 | |||||||||||||
Notes to Table A (1) Note (1.1, 2.1 and 3.1)
Table (A.5) below shows the revenue, cost of services and gross profit generated from Consulting,consulting, services, commission and management fees for years 2016, 20152020 and 2014.2019.
| Service revenues (Consulting and Services) | ||||||||||||||||||||||||||||||
| 2016 | 2015 | 2014 | Difference | Description of work | 2020 | 2019 | Difference | |||||||||||||||||||||||
| CA | 72,156,993 | 88,480,956 | 76,750,308 | -13,323,963 | Work in progress on PF(1), FF(2), PF(3) and Zhongshen New Prawn Project up to October 5, 2016.. | |||||||||||||||||||||||||
| SIAF | - | 3,785,974 | 4,929,984 | -3,785,974 | ||||||||||||||||||||||||||
| Revenue CA | - | 1,719,247 | (1,719,247 | ) | ||||||||||||||||||||||||||
| Group Total Revenues | 72,156,993 | 92,266,930 | 81,680,292 | -20,109,937 | - | 1,719,247 | (1,719,247 | ) | ||||||||||||||||||||||
| Cost of service | - | |||||||||||||||||||||||||||||
| CA | 47,415,205 | 55,641,537 | 39,387,359 | -8,226,332 | - | 1,590,017 | (1,590,017 | ) | ||||||||||||||||||||||
| SIAF | 1,404,813 | 4,854,541 | -1,404,813 | |||||||||||||||||||||||||||
| Group Total Cost of sales | 47,415,205 | 57,046,350 | 44,241,900 | -9,631,145 | - | 1,590,017 | (1,590,017 | ) | ||||||||||||||||||||||
| Gross Profit | ||||||||||||||||||||||||||||||
| CA | 24,741,788 | 32,839,419 | 37,362,949 | -8,097,631 | - | 129,230 | (129,230 | ) | ||||||||||||||||||||||
| SIAF | 2,381,161 | 75,443 | -2,381,161 | |||||||||||||||||||||||||||
| Group Total Gross Profit | 24,741,788 | 35,220,580 | 37,438,392 | -10,478,792 | - | 129,230 | (129,230 | ) | ||||||||||||||||||||||
Revenues (consulting, service, commission and management fee):
Revenues decreased by $20,109,937$1,719,247 or 21.8%100% from $92,266,930$1,719,247 for the year ended December 31, 2015 to $72,156,993 for the year ended December 31, 2016.
CA (Fishery): Revenue from fishery decreased by $16,323,963 or 18.4% from $88,480,956 for the year ended December 31, 2015 to $72,156,993 for the year ended December 31, 2016.
SIAF (Corporate): Revenue from corporate decreased by $3,785,974 from $3,785,974 for the year ended December 31, 20152019 to $0 for the year ended December 31, 2016. The reason for the decrease is due to the reduced pace of work in progress for the construction of restaurant related work during 2016.
Cost of services (consulting, service, commission and management fee)
Cost of services for consulting, service, commission and management fee decreased by $9,631,145 or 17% from $57,046,350 for the year ended December 31, 2015 to $47,415,205 for the year ended December 31, 2016.2020. The decrease was primarily due to the cost of sale ofeffects caused by the Master License being inconsequential.Pandemic COVID-19.:
2.1.1 Note to General and Administrative and interest Expenses:
CA (Fishery): Cost of services from fishery
General and administrative (including depreciation and amortization) and interest expenses (including in Other income/(expenses) decreased by $8,226,332$7,901,419 or 15%57% from $55,641,537$13,855,429 for the year ended December 31, 20152019 to $47,415,205$5,954,010 for the year ended December 31, 2016.2020. The decrease was primarilymainly due to the coststoppage of saleoperations of many divisions caused by the Master License as inconsequential.effects of Pandemic COVID-19 and the leasing and contracting of operations in MEIJI, HSA, and APWA and the termination of over 300 divisional workers also due to the adverse effects caused by the said pandemic.
SIAF (Corporate)Table (i): Cost of services from corporate decreased by $1,404,813 from $1,404,813 for the year ended December 31, 2015 to $0 for the year ended December 31, 2016. The reason for the decrease is because of no restaurant work being carried out in 2016.
Gross profit (consulting, service, commission and management fee)
Gross profit of consulting, service, commission and management fees decreased by $10,478,792 or 30%, from $35,220,580 for the year ended December 31, 2015 to $24,741,788 for the year ended December 31, 2016.
CA (Fishery): Gross profit from fishery decreased by $8,097,631 or 25% from $32,839,419 for the year ended December 31, 2015 to $24,741,788 for the year ended December 31, 2016.
| Category | 2020 | 2019 | Difference | |||||||||
| Office and corporate expenses | 74,270 | 3,296,862 | (3,222,592 | ) | ||||||||
| Wages and salaries | 728,944 | 1,661,121 | (932,177 | ) | ||||||||
| Traveling and related lodging | - | 24,219 | (24,219 | ) | ||||||||
| Motor vehicles expenses and local transportation | - | 38,243 | (38,243 | ) | ||||||||
| Entertainments and meals | 18,462 | 45,672 | (27,210 | ) | ||||||||
| Others and miscellaneous | 2,907,603 | (2,907,603 | ) | |||||||||
| Depreciation and amortization | 5,132,334 | 5,478,041 | (345,707 | ) | ||||||||
| Sub-total | 5,954,010 | 13,451,761 | (7,497,751 | ) | ||||||||
| Interest expense | - | 403,668 | (403,668 | ) | ||||||||
| Total | 5,954,010 | 13,855,429 | (7,901,419 | ) | ||||||||
SIAF (Corporate)2.1.2. : Gross profit from corporate decreased by $2,381,161 from $2,381,161 for the year ended December 31, 2015 to $0 for the year ended December 31, 2016. The reason for the decrease was due to no work being carried out in 2016.
Note (4) to Table A 1 Other Income:depreciation and amortization:
Other Income registered a loss of $1,905,040 in 2016 (Government grant $1,787,636 & Other income $318,023 – Interest expense $4,010,699) representing a decrease of $1,142,118 from 2015’s -$762,922.
Note (5) to Table A 1 General and Administrative Expenses and Interest Expenses:
General and administrative and interest expenses (including depreciation and amortization) decreased by $806,364 or 4% from $22,014,025 for the year ended December 31, 2015 to $21,207,661 for the year ended December 31, 2016. The decrease was seen in all sectors, including but not limited to office and corporate expenses of $3,174,888 from $8,148,940 for the year ended December 31, 2015 to $4,974,052 for the year ended December 31, 2016, and the decrease in others and miscellaneous of $1,105,875 from $3,309,361 for the year ended December 31, 2015 to $2,294,767 for the year ended December 31, 2016 as shown in the table below:
Table (to Note 5)
Note (5) to Table A 1 General and Administrative Expenses and Interest Expenses:
| Category | 2016 | 2015 | Difference | |||||||||
| $ | $ | $ | ||||||||||
| Office and corporate expenses | 4,974,052 | 8,148,940 | -3,174,888 | |||||||||
| Wages and salaries | 5,380,534 | 2,330,627 | 3,049,907 | |||||||||
| Traveling and related lodging | 175,848 | 170,060 | 5,788 | |||||||||
| Motor vehicles expenses and local transportation | 178,090 | 209,355 | -31,265 | |||||||||
| Entertainments and meals | 652,904 | 175,337 | 477,567 | |||||||||
| Others and miscellaneous | 2,294,767 | 3,400,642 | -1,105,875 | |||||||||
| Depreciation and amortization | 3,540,766 | 3,309,361 | 231,405 | |||||||||
| Sub-total | 17,196,962 | 17,744,322 | -547,360 | |||||||||
| Interest expense | 4,010,699 | 4,269,703 | -259,004 | |||||||||
| Total | 21,207,661 | 22,014,025 | -806,364 | |||||||||
Note (6) to Table A 1 Depreciation and Amortization:
Depreciation and amortization increased by $1,040,506 or 22% to $5,857,857 for the year ended December 31, 2016 from $4,817,351 for the year ended December 31, 2015. The increase was primarily due to the increase of depreciation by $1,275,102 to $4,141,629 for the year ended December 31, 2016 from depreciation of $2,866,527 for the year ended December 31, 2015, and the decrease of amortization by $234,596 to $1,716,228 for the year ended December 31, 2016 from amortization of $1,950,824 for the year ended December 31, 2015.
In this respect, total depreciation and amortization amounted to $5,857,857$7,798,001 for the year ended December 31, 2016,2020, out of which amount $3,540,766$5,132,334 was reported under general and administration expenses and $2,317,091$2,665,667 was reported under cost of goods sold; whereas total depreciation and amortization was at $4,817,351amounted to $7,311,242 for the year ended December 31, 2015 and2019, out of which amount $3,309,361$5,478,041 was reported under Generalgeneral and Administrationadministration expenses and $1,507,990$1,833,201 was reported under cost of goods sold.
2.1.3. Note (7) to Table A 1 Non-controlling interest:
Table (F) below shows the derivation of non-controlling interest
| Jiangmen City | Qinghai Sanjiang | |||||||||||||||
| Jiangmen City Heng | Hang Mei Cattle | Hunan Shenghua | A Power | |||||||||||||
| Sheng Tai Agriculture | Farm | A Power | Agriculture Co | |||||||||||||
| Development Co. | Development Co. | Agriculture Co., | Ltd (China) | |||||||||||||
| Ltd.(China) | Ltd.(China) | Limited (China) | Total | |||||||||||||
| Name of China subsidiaries | ||||||||||||||||
| Effective shareholding | 75 | % | 75 | % | 76 | % | ||||||||||
| Abbreviated names | (JHST) | (JHMC) | (HSA) | |||||||||||||
| Net income (loss) of the P.R.C. subsidiaries for the year in $ | 701,086 | 1,411,373 | 1,934,781 | 4,047,240 | ||||||||||||
| % of profit sharing of non-controlling interest | 25 | % | 25 | % | 24 | % | ||||||||||
| Non-controlling interest's shares of Net incomes in $ | 175,272 | 352,843 | 464,347 | 992,462 | ||||||||||||
| Names of intermediate holding company subsidiaries | Capital Award Inc. (Belize) | Total | ||||||||||||||||||||||||
| Abbreviated names | CA | |||||||||||||||||||||||||
| % of profit sharing on below subsidiaries (in China) | NA | 75 | % | 75 | % | 76 | % | 45 | % | |||||||||||||||||
| Name of China subsidiaries | None | Jiangmen City Heng Sheng Tai Agriculture Development Co. Ltd.(China) | Jiangmen City Hang Mei Cattle Farm Development Co. Ltd.(China) | Hunan Shenghua A Power Agriculture Co., Limited (China) | Qinghai Sanjiang A Power Agriculture Co Ltd (China) | Qing Hai Zhong He Meat product Co. Ltd (China) | ||||||||||||||||||||
| Abbreviated names | (JHST) | (JHMC) | (HSA) | (SJAP) | (QZH) | |||||||||||||||||||||
| Net income of the P.R.C. subsidiaries for the period ended 31. Dec. 2016 in $ | 4,677,044 | 2,246,975 | 4,917,681 | 14,092,993 | 18,528,147 | |||||||||||||||||||||
| % of profit sharing of non-controlling interest | 25 | % | 25 | % | 24 | % | 55 | % | 55 | % | ||||||||||||||||
| Non-controlling interest's shares of Net incomes in $ | 1,169,261 | 561,744 | 1,180,243 | 7,751,146 | 10,190,481 | 20,852,875 |
The Net IncomeLoss attributed to non-controlling interest is $20,852,875$992,462 shared by (JHST, JHMC HSA, SJAP and QZH, collectively)HSA for the year ended December 31, 20162020 as shown in Table (F) above.
| 2.2. | Part B. MD &A on Audited Consolidated Balance Sheet as of the year 2020compared to year 2019 (fiscal year) |
| Consolidated Balance sheets | December 31,2020 | December 31,2019 | Changes | Note | ||||||||||||
| ASSETS | ||||||||||||||||
| Current assets | ||||||||||||||||
| Cash and cash equivalents | 188,846 | 183,638 | 5,208 | 8 | ||||||||||||
| Inventories | - | 0 | 0 | 9 | ||||||||||||
| Costs and estimated earnings in excess of billings on uncompleted contracts | 0 | 250,828 | -250,828.00 | |||||||||||||
| Deposits and prepaid expenses | 13,141,301 | 12,738,217 | 403,084 | 10.1 | ||||||||||||
| Accounts receivable | 32,658,330 | 98,528,589 | (65,870,259 | ) | 11 | |||||||||||
| Other receivables | 82,083,391 | 95,565,376 | (13,481,985 | ) | 15 | |||||||||||
| Total current assets | 128,071,869 | 207,266,648 | (79,194,779 | ) | ||||||||||||
| Property and equipment | ||||||||||||||||
| Property and equipment, net of accumulated depreciation | 97,879,543 | 103,064,238 | (5,184,695 | ) | 12 | |||||||||||
| Construction in progress | 0 | 0 | 13 | |||||||||||||
| Land use rights, net of accumulated amortization | 52,482,217 | 47,855,024 | 4,627,193 | 14 | ||||||||||||
| Total property and equipment | 150,361,760 | 150,919,262 | (557,502 | ) | ||||||||||||
| Other assets | ||||||||||||||||
| Goodwill | 724,940 | 724,940 | - | |||||||||||||
| Proprietary technologies, net of accumulated amortization | 6,562,933 | 10,245,658 | (3,682,725 | ) | ||||||||||||
| Investment in unconsolidated equity investee | 232,100,046 | 249,344,711 | (17,244,665 | ) | ||||||||||||
| Temporary deposit paid to entities for investments in future Sino Joint Venture companies | - | 34,900,349 | (34,900,349 | ) | 10.2 | |||||||||||
| Total other assets | 239,387,919 | 295,215,658 | (55,827,739 | ) | ||||||||||||
| Total assets | 517,821,548 | 653,403,825 | (135,582,277) | |||||||||||||
| Current liabilities | ||||||||||||||||
| Accounts payable and accrued expenses | 2,665,149 | 2,590,637 | 74,512 | |||||||||||||
| Billings in excess of costs and estimated earnings on uncompleted contracts | 0 | 5,386,711 | (5,386,711 | ) | ||||||||||||
| Due to a director | 1,985,040 | 1,163,364 | 821,676 | |||||||||||||
| Other payables | 36,542,468 | 35,362,580 | 1,179,888 | 16A | ||||||||||||
| Total current liabilities | 41,192,658 | 44,503,292 | (3,310,634 | ) | 16 | |||||||||||
| Non-current liabilities | ||||||||||||||||
| Other payables | - | 7,151,762 | (7,151,762 | ) | ||||||||||||
| Total non-current liabilities | - | 7,151,762 | (7,151,762 | ) | ||||||||||||
| Stockholders’ equity | ||||||||||||||||
| Common stock | 59,963 | 49,976 | 9,987 | |||||||||||||
| Additional paid-in capital | 135,664,235 | 133,575,810 | 2,088,425 | |||||||||||||
| Retained earnings | 316,408,390 | 447,406,267 | (130,997,877 | ) | ||||||||||||
| Accumulated other comprehensive income | (54,997,545 | ) | (14,747,757 | ) | (40,249,788 | ) | ||||||||||
| Treasury stock | (1,250,000 | ) | (1,250,000 | ) | - | |||||||||||
| Total SIAF Inc. and subsidiaries' equity | 395,885,043 | 565,034,296 | (169,149,254 | ) | ||||||||||||
| Non-controlling interest | 80,743,848 | 36,712,218 | 44,031,630 | |||||||||||||
| Total stockholders' equity | 476,628,891 | 601,746,514 | (125,117,623 | ) | ||||||||||||
| Total liabilities and stockholders' equity | 517,821,548 | 653,401,568 | (135,580,020 | ) | ||||||||||||
2.2.1 Note (8) to Table A 1 Earnings per share (EPS):Cash and Cash Equivalents
Earnings per share from continuingCash and discontinued cash equivalents increased by $1.77 (basic) and $1.40 (diluted) per share$2,951 from EPS of $3.69 (basic) and $3.60 (diluted) year 2015$185,895 to EPS of $5.46 (basic) and $5.00 (diluted) for year 2016. Earnings per share from continuing decreased by $0.72 (basic) and $0.82 (diluted) per share from EPS of $2.81 (basic) and $2.75 (diluted) year 2015 to EPS of $2.09 (basic) and $1.93 (diluted) for year 2016. The reason for the increase is primarily due to the deemed gain from the divestment of Tri-way calculated as follows:
| Amounts shown incorporate audited adjustments: | HK$ | HK$ | US$ equivalent | |||||||||||||
| Fair value of interest retained in Tri-way | ||||||||||||||||
| (US$340,594,377 x 23.89%) | 630,601,974 | 81,367,997 | ||||||||||||||
| Less: | ||||||||||||||||
| Amount recognized prior to divestment of Tri-way | ||||||||||||||||
| Net asset of Tri-way | 251,946,656 | 32,509,246 | ||||||||||||||
| Non-controlling interest at divestment | -62,683,968 | 8,088,254 | ||||||||||||||
| Controlled group assets divested | 189,262,688 | 24,420,992 | ||||||||||||||
| Gain on disposal (including master licensing fees) | 441,339,286 | 56,947,005 | ||||||||||||||
| Net controlled group assets disposed | ||||||||||||||||
| ($27,872,348 x 76.11%) | -144,047,832 | -18,586,817 | ||||||||||||||
| Gain on revaluation of retained interest | ||||||||||||||||
| Fair value of interest retained in Tri-way | 630,601,974 | 81,367,997 | ||||||||||||||
| Portion of divested assets retained in Tri-way | ||||||||||||||||
| ($27,872,348 x 23.89%) | -45,214,856 | -5,834,175 | ||||||||||||||
| Gain on disposal (including master licensing fees) | 441,339,286 | 56,947,005 | ||||||||||||||
On August 15, 2016, an agreement had been executed by and$188,846 between TRW and its JFD business partners to acquire their 25% equity holding (i.e. non-controlled interest) in JFD, a Sino Foreign Joint Venture Company, having resulted in TRW having secured a 100% equity interest in JFD as of October 5, 2016. Upon TRW’s acquisition of 4 additional prawn farms’ assets, namely Aquafarms 1 through 4, at fair value of US$215.94 million from respective third parties, the consideration paid to SIAF/CA for both their holdings in the merged aquaculture entities and/or master licensing fees (US$81.37 million) and repayment to SIAF for its assumption of TRW liabilities/obligations (US$43.29 million), the total sum of these arrangements (US$340.53) is scheduled for settlement on or before April 30, 2017 (this date has been from amended from March 31, 2017 in consideration of the regulatory timetable). The settlement will transpire through the issuance of 99,990,000 TRW common shares at fair value of $3.41 per share. SIAF’s equity position in TRW now stands at 23.89% (or, US$124.66 million), effective on October 5, 2016. Because of its disposition of control in TRW, the Company’s categorization of its holdings in TRW has been reclassified from subsidiary to investments in unconsolidated equity investees as of October 5, 2016, and constitutes a deemed disposal of the subsidiary. The deemed gain on disposal of $56,947,005 was recorded in the consolidated statement of profit and loss account of the Company for the year ended December 31, 2016.2019 and 2020.
The full interest held in TRW by SIAF is US$139,133,443 compared to US$24,420,992 at the time when SIAF held 100% of Tri-way prior to its partial divestiture.
Part B. MD &A on Consolidated Balance Sheet as of the year 2016 compared to year 2015 (fiscal year)2.2.2.
| Consolidated Balance sheets | December 31, 2016 | December 31, 2015 | Changes | Note | ||||||||||
| $ | $ | |||||||||||||
| ASSETS | ||||||||||||||
| Current assets | ||||||||||||||
| Cash and cash equivalents | 2,576,058 | 7,229,197 | (4,653,139 | ) | B | |||||||||
| Inventories | 62,592,272 | 62,848,707 | (256,435 | ) | 9 | |||||||||
| Costs and estimated earnings in excess of billings on uncompleted contracts | 740,984 | 1,306,885 | (565,901 | ) | ||||||||||
| Deposits and prepaid expenses | 84,845,966 | 83,811,929 | 1,034,037 | 10 | ||||||||||
| Accounts receivable | 122,912,086 | 135,674,418 | (12,762,332 | ) | 11 | |||||||||
| Other receivables | 47,120,800 | 59,780,587 | (12,659,787 | ) | ||||||||||
| Total current assets | 320,788,166 | 350,651,723 | (29,863,557 | ) | ||||||||||
| Property and equipment | ||||||||||||||
| Property and equipment, net of accumulated depreciation | 189,727,227 | 104,259,079 | 85,468,148 | 12 | ||||||||||
| Construction in progress | 35,157,213 | 72,788,769 | (37,631,556 | ) | 13 | |||||||||
| Land use rights, net of accumulated amortization | 53,673,690 | 58,485,675 | (4,811,985 | ) | 14 | |||||||||
| Total property and equipment | 278,558,130 | 235,533,523 | 43,024,607 | |||||||||||
| Other assets | ||||||||||||||
| Goodwill | 724,940 | 724,940 | 0 | |||||||||||
| Proprietary technologies, net of accumulated amortization | 10,090,697 | 10,784,358 | (693,661 | ) | 15 | |||||||||
| Investment in unconsolidated equity investee | 139,133,443 | -139,133,443 | ||||||||||||
| Long term investment | 720,773 | 769,941 | (49,168 | ) | ||||||||||
| Temporary deposit paid to entities for investments in future Sino Joint Venture companies | 15,644,998 | 41,109,708 | (25,464,710 | ) | ||||||||||
| Total other assets | 166,314,851 | 53,388,947 | 112,925,904 | |||||||||||
| Total assets | 765,661,147 | 639,574,193 | 126,086,954 | |||||||||||
| Current liabilities | 0 | 16 | ||||||||||||
| Accounts payable and accrued expenses | 8,789,324 | 9,345,559 | (556,235 | ) | ||||||||||
| Billings in excess of costs and estimated earnings on uncompleted contracts | 2,630,752 | 8,700,706 | (6,069,954 | ) | ||||||||||
| Due to a director | 2,070,390 | 211,247 | 1,859,143 | |||||||||||
| Other payables | 5,962,092 | 4,792,579 | 1,169,513 | 16C | ||||||||||
| Borrowings-Short term bank loan | 2,883,090 | 4,466,040 | (1,582,950 | ) | ||||||||||
| Negotiable promissory notes | 1,113,140 | 865,968 | 247,172 | |||||||||||
| Income tax payable | 1,130 | 1,130 | ||||||||||||
| Total current liabilities | 23,449,918 | 28,382,099 | (4,932,181 | ) | ||||||||||
| Non-current liabilities | ||||||||||||||
| Other payables | 11,192,117 | 4,797,332 | 6,394,785 | 16C | ||||||||||
| Borrowing-Long term debt | 5,766,182 | 1,554,902 | 4,211,280 | |||||||||||
| Convertible note payable | 21,314,877 | 34,904,739 | (13,589,862 | ) | 16D | |||||||||
| Total non-current liabilities | 38,273,176 | 41,256,973 | (2,983,797 | ) | ||||||||||
| Stockholders’ equity | ||||||||||||||
| Preferred stock | ||||||||||||||
| Series A preferred stock | ||||||||||||||
| Series B convertible preferred stock | ||||||||||||||
| Common stock | 22,727 | 20,134 | 2,593 | |||||||||||
| Additional paid-in capital | 155,741,280 | 142,882,173 | 12,859,107 | |||||||||||
| Retained earnings | 454,592,652 | 339,616,638 | 114,876,014 | |||||||||||
| Accumulated other comprehensive income | (4,335,355 | ) | 1,427,638 | (5,762,993 | ) | |||||||||
| Treasury stock | (1,250,000 | ) | (1,250,000 | ) | 0 | |||||||||
| Total SIAF Inc. and subsidiaries' equity | 604,771,304 | 482,696,583 | 122,074,721 | |||||||||||
| Non-controlling interest | 99,166,749 | 87,238,538 | 11,928,211 | |||||||||||
| Total stockholders' equity | 703,938,053 | 569,935,121 | 134,002,932 | |||||||||||
| Total liabilities and stockholders' equity | 765,661,147 | 639,574,193 | 126,086,954 | |||||||||||
Note (B) Cash and Cash Equivalents
The change in cash and cash equivalent of $(4,653,139) derived from cash and cash equivalent of $2,576,058 and $7,229,197 as of December 31, 2016, and December 31, 2015, respectively.
Note (9) Break down on Inventories:
| 2016 | 2015 | Difference | 2020 | 2019 | Difference | |||||||||||||||||||
| $ | $ | $ | $ | $ | $ | |||||||||||||||||||
| Sleepy cod, prawns, eels and marble goble | 481,509 | 4,053,459 | -3,571,950 | |||||||||||||||||||||
| Bread grass | 2,115,815 | 1,207,260 | 908,555 | - | - | - | ||||||||||||||||||
| Beef cattle | 6,814,132 | 5,026,404 | 1,787,728 | - | - | - | ||||||||||||||||||
| Organic fertilizer | 15,901,153 | 10,815,983 | 5,085,170 | - | - | - | ||||||||||||||||||
| Forage for cattle and consumables | 6,536,517 | 10,328,365 | -3,791,848 | - | - | - | ||||||||||||||||||
| Raw materials for bread grass and organic fertilizer | 15,829,424 | 15,440,348 | 389,076 | - | - | - | ||||||||||||||||||
| Beef and mutton | 13,217,456 | 14,593,458 | -1,376,002 | |||||||||||||||||||||
| Immature seeds | 1,696,266 | 1,383,431 | 312,835 | - | ||||||||||||||||||||
| - | - | - | ||||||||||||||||||||||
| 62,592,272 | 62,848,707 | -256,435 | ||||||||||||||||||||||
2.2.3. Note (10) Breakdown of Deposits and Prepaid Expenses:
| 2020 | 2019 | Difference | ||||||||||
| $ | $ | $ | ||||||||||
| Deposits for | ||||||||||||
| - purchases of equipment | 2,037,425 | (2,037,425 | ) | |||||||||
| - acquisition of land use rights | - | 0 | ||||||||||
| - inventories purchases | 13,141,301 | 1,059,543 | 12,081,758 | |||||||||
| - construction in progress | - | 0 | ||||||||||
| - issue of shares as collateral | 24,402,175 | (24,402,175 | ) | |||||||||
| Shares issued for employee compensation and overseas professional and bond interest | - | - | ||||||||||
| Others | 2,631,797 | (2,631,797 | ) | |||||||||
| 13,141,301 | 30,130,940 | (16,989,639 | ) | |||||||||
2.2.4.Note (10.1)(11): Aging and breakdown of Accounts receivable:
| 2016 | 2015 | Difference | ||||||||||
| $ | $ | $ | ||||||||||
| Deposits for | ||||||||||||
| - purchase of equipment | 5,555,471 | 4,963,245 | 592,226 | |||||||||
| - acquisition of land use rights | 3,373,110 | 3,373,110 | 0 | |||||||||
| - inventory purchases | 13,729,305 | 19,948,867 | (6,219,562 | ) | ||||||||
| - aquaculture contracts | 2,261,538 | 4,340,741 | (2,079,203 | ) | ||||||||
| - consulting service providers and others | 8,150,000 | 9,197,796 | (1,047,796 | ) | ||||||||
| - construction in progress | 13,719,339 | 20,243,172 | (6,523,833 | ) | ||||||||
| - Shares Collateral | 26,493,841 | 11,281,100 | 15,212,741 | |||||||||
| Prepayments - debts discounts and others | 5,007,015 | 9,919,126 | (4,912,111 | ) | ||||||||
| Shares issued for employee compensation and overseas professional and bond interest | 3,982,812 | 544,772 | 3,438,040 | |||||||||
| Others | 2,573,535 | 2,573,535 | ||||||||||
| 84,845,966 | 83,811,929 | 1,034,037 | ||||||||||
Note (10.1) Breakdown of Deposit for- acquisition of Land Use Right:
As of December 31, 2016, $3,373,110 was on deposit paid for the acquisition of a Land Use Right (“LUR”) derived from the following transactions:
$3,182,180 (or RMB20,000,000) was full payment made on June 6, 2012 for a LUR by HSA comprising a block of land measuring 150 Mu (or 25 acres of prime agriculture land) located at Linli District of Hunan Province within 10 Km of HSA’s complex. The process of application to register the said LUR is in progress, and, as such, this payment is recorded as Deposit and Prepaid Expenses pending final authority estimated to be granted within 2015 as the new local ordinances on agriculture land delayed the processing of our application. Due to the delay in approving the LUR of the said block of land, HSA has revised and supplemented the contract of said land by a leasing agreement until such time said official approval will be granted, and, in the interim, the deposit and pre-payment on said land would be treated as a rent-to-own lease arrangement providing pre-payment toward said land once approval is granted.
$190,930 (or RMB1,200,000) was paid by SJAP as deposit for the acquisition of an LUR on a block of land measuring 15 Mu (or 2.475 acres) located at Huangyuan district next to SJAP’s complex on October 15, 2012. The process of rezoning this piece of land to residential (at present, agriculture) continues, and once completed will be transferred from the Local Government (Huangyuan County) to SJAP to build new staff quarters.
Note (10.2) Information of “Temporary deposit and pre-payments for investments in future assets and in future Sino Foreign Joint Venture companies” (TD&PSFJVC):
| Under account of Subsidiary | Segment of | Project name | Estimated total Asset value | Estimated time of Acquisition | Current status of Project | Deposit & prepayments made as of December 31, 2016 | Land Bank or Built Up area | % equivalent to equity paid | ||||||||||||||
| $ | $ | m2 | ||||||||||||||||||||
| SIAF | Corporate | Trade Center | 3.5 million | own development | 30% completed | 4,086,941 | 5,000 | 31 | % | |||||||||||||
| Seafood Center | 2 out of 4 phases | 1,032,914 | ||||||||||||||||||||
| CA | Fishery | Fish Farm (1) | 26.22 Million | 2016 | completed | 6,000,000 | 23,100 | 23 | % | |||||||||||||
| MEIJI | Cattle | Cattle Farm (2) | 15.88 Million | 2014 | 100% completed | 5,558,057 | 230,300 | 35 | % | |||||||||||||
| 15,644,998 | ||||||||||||||||||||||
| 2020 | ||||||||||||||||||||||||
| Accounts | over 120 days and | |||||||||||||||||||||||
| receivable | 0-30 days | 31-90 days | 91-120 days | less than 1 year | Over 1 year | |||||||||||||||||||
| $ | ||||||||||||||||||||||||
| Engineering consulting service (CA) | ||||||||||||||||||||||||
| Sales of imported seafood (SIAF) | 3,447,374 | 3,447,374 | ||||||||||||||||||||||
| Sales of Cattle and Beef Meats (MEIJI) | ||||||||||||||||||||||||
| Sales of HU Flowers (Fresh & Dried) (JHST) | 7,985,064 | 2,595,359 | 5,389,705 | |||||||||||||||||||||
| Sales of Cattle and Beef Meats (JHMC) | 6,566,194 | 2,100,461 | 4,465,733 | |||||||||||||||||||||
| Sales Fertilizer from (HSA) | 14,659,698 | 5,773,129 | 8,886,569 | |||||||||||||||||||||
| Total | 32,658,330 | 4,695,820 | 10,238,862 | 5,389,705 | 12,333,943 | - | ||||||||||||||||||
| % of total receivables | 100 | % | 14 | % | 31 | % | 17 | % | 38 | % | 0 | % | ||||||||||||
| ¨ | ||||
| the over 120-day balance. |
Note (11): Breakdown of Accounts receivable:2.2.5.
| 2016 | ||||||||||||||||||||
| Accounts receivable | 0-30 days | 31-90 days | 91-120 days | over 120 days and less than 1 year | ||||||||||||||||
| $ | $ | $ | $ | $ | ||||||||||||||||
| Consulting and Service totaling | ||||||||||||||||||||
| CA | 39,878,704 | 13,691,741 | 2,080,054 | 14,703,514 | 9,403,395 | |||||||||||||||
| Sales of Live Fish, eels and prawns (from Farms) (CA) | 15,461,632 | 2,823,203 | - | 10,932,829 | 1,705,600 | |||||||||||||||
| Sales of imported seafood (SIAF) | 9,436,517 | 916,757 | 7,212,875 | - | 1,306,885 | |||||||||||||||
| Sales of Cattle and Beef Meats (from Enping Farm) (MEIJI) | 2,512,635 | - | 2,512,635 | - | - | |||||||||||||||
| Sales of HU Flowers (Fresh & Dried) (JHST) | 6,394,987 | 350,766 | 790,672 | 447,329 | 4,806,220 | |||||||||||||||
| Sales Fertilizer, Bulk Stock feed and Cattle by (SJAP) | 13,959,420 | 2,399,531 | 4,759,060 | 2,651,753 | 4,149,076 | |||||||||||||||
| Sales Fertilizer from (HSA) | 6,034,139 | 1,681,417 | 3,292,732 | 564,585 | 495,405 | |||||||||||||||
| Sales of Beef (QZH) | 29,234,052 | 6,687,213 | 9,257,860 | 9,919,837 | 3,369,142 | |||||||||||||||
| Total | 122,912,086 | 28,550,628 | 29,905,888 | 39,219,847 | 25,235,723 | |||||||||||||||
| % of total receivables | 23 | % | 24 | % | 32 | % | 21 | % | ||||||||||||
| % of total sales | 28 | % | ||||||||||||||||||
Information on Concentration of credit risk of account receivables:
Major customer’s revenues / our total revenues:
We have 4 major long-term customers (referring to Customer A, B, C and D mentioned in the Financial Statements of this Annual Report), who have accounted for 47.17% of our consolidated revenues for the year ended December 31, 2016 as shown in the table below:
| Twelve months ended December 31, 2016 | ||||||||
| % of total revenue | Customer's Total Revenue | |||||||
| Customer A | 17.63 | % | 76,578,139 | |||||
| Customer B | 10.45 | % | 45,394,220 | |||||
| Customer C | 10.18 | % | 44,208,890 | |||||
| Customer D | 8.91 | % | 38,720,557 | |||||
| 47.17 | % | 204,901,806 | ||||||
Customer A is Shanghai Vigor Trading Co. Ltd. (Vigor) who sells much of the imported beef and seafood as well as locally produced seafood. During 2016, the Company sold $76,578,139 of goods to Vigor representing 18.94% of our total sales of goods revenue of $404,348,515.
Customer B is one of our main agents, namely Mr. Xian Zhiming (Zhongshan new prawn farm) who we agreed to extend trading terms between 120 days to 180 days in the interim until such time as they are able to secure bridge financing.
Customer C is Tri-way Industries through our divestment when Triway became our “Investment of Associate.” However, the amount of $44.2 million shown above will be fully paid when Triway will have issued shares to offset said amount targeting within March or April 2017.
Customer D is Cattle Wholesale, represented by Mr. Zhen Runchi, who buys our fattened cattle to sell them in the Guangdong and Beijing cattle markets and at the same time supplies to us with young cattle. The fiscal year 2016, transactions through Mr. Zhen Runchi generated 9.58% of our total consolidated revenue (equivalent to $38,720,557 out of our total revenue of $404,348,515).
Major customer’s account receivables:
These 4 major long-term customers (referred to as Customer A, B, C and D above & mentioned in the Financial Statements of this Annual Report), constitute accounts receivable in the aggregate amount of $60,303,931, which is equivalent to 14% of our consolidated revenues ($429,053,484) for the year 2016 as shown in the table below:
| 2016 | 31-Dec-16 | Total | ||||||||
| Total consolidated revenue | % of total Accounts receivables | Accounts receivables | ||||||||
| Customer A | 19.61 | % | $24,106,909 | |||||||
| Customer B | 18.11 | % | 22,262,073 | |||||||
| Customer C | 12.83 | % | 15,771,795 | |||||||
| Customer D | 7.52 | % | 9,245,353 | |||||||
| 58.07 | % | $71,386,131 | ||||||||
| $ | 404,348,515 | |||||||||
| % to total consolidated revenue | 17.65% | |||||||||
Note (12) Property and equipment, (P&E) net of accumulation depreciation:
| 2016 | ||||||||||||
| 2020 | 2019 | |||||||||||
| Plant and machinery | $ | 6,022,686 | 9,712,446 | $ | 9,652,132 | |||||||
| Structure and leasehold improvements | 163,414,025 | 91,547,512 | 90,615,323 | |||||||||
| Mature seeds and herbage cultivation | 28,781,286 | 17,612,200 | 17,752,012 | |||||||||
| Furniture and equipment | 827,356 | 3,367,887 | 2,613,172 | |||||||||
| Motor vehicles | 926,511 | 3,332,541 | 3,241,556 | |||||||||
| 199,971,864 | 125,572,586 | 123,874,195 | ||||||||||
| Less: Accumulated depreciation | -10,244,637 | 27,693,043 | 20,809,957 | |||||||||
| Net carrying amount | $ | 189,727,227 | 97,879,543 | $ | 103,064,238 | |||||||
2.2.6. Note (13) Construction in progress (CIP):
| 2020 | ||||
| Construction in progress | 0 | |||
| - Office, warehouse and organic fertilizer plant in HSA | $ | 0 | ||
| - Oven room, road for production of dried flowers | 0 | |||
| - Organic fertilizer and bread grass production plant and office building | 0 | |||
| - Rangeland for beef cattle and office building | 0 | |||
| - Fish pond and breeding factory | 0 | |||
| $ | 0 | |||
2.2.7. Note (14): Land Use Rights, net of accumulated amortization:
| Item | Owner | Location | Acres | Date Acquired | Tenure | Expiry dates | Cost $ | Monthly amortization $ | 2016.12.31 Balance $ | Nature of ownership | Nature of project | Owner | Location | Acres | Date Acquired | Tenure | Expiry dates | Cost $ | Monthly amortization $ | 2020.12.31 Balance$ | Nature of ownership | Nature of project | ||||||||||||||||||||||||||||||||
| Hunan lot1 | HS.A | Ouchi Village, Fenghuo Town, Linli County | 31.92 | 4/5/2011 | 43 | 4/4/2054 | 242,703 | 470 | 210,248 | Lease | Fertilizer production | |||||||||||||||||||||||||||||||||||||||||||
| Hunan lot2 | HS.A | Ouchi Village, Fenghuo Town, Linli County | 247.05 | 7/1/2011 | 60 | 6/30/2071 | 36,666,141 | 50,925 | 33,305,078 | Management Right | Pasture growing | |||||||||||||||||||||||||||||||||||||||||||
| Hunan lot3 | HS.A | Ouchi Village, Fenghuo Town, Linli County | 8.24 | 5/24/2011 | 40 | 5/23/2051 | 378,489 | 789 | 324,870 | Land Use Rights | Fertilizer production | |||||||||||||||||||||||||||||||||||||||||||
| Hunan lot 1 | HS.A | Ouchi Village, Fenghuo Town, Linli County | 31.92 | 4/5/2011 | 43 | 4/4/2054 | 242,703 | 470 | 187,671 | Lease | Fertilizer production | |||||||||||||||||||||||||||||||||||||||||||
| Hunan lot 2 | HS.A | Ouchi Village, Fenghuo Town, Linli County | 247.05 | 7/1/2011 | 60 | 6/30/2071 | 36,666,141 | 50,925 | 30,860,669 | Management Right | Pasture growing | |||||||||||||||||||||||||||||||||||||||||||
| Hunan lot 3 | HS.A | Ouchi Village, Fenghuo Town, Linli County | 8.24 | 5/24/2011 | 40 | 5/23/2051 | 378,489 | 789 | 287,021 | Land Use Rights | Fertilizer production | |||||||||||||||||||||||||||||||||||||||||||
| Hunan lot 4 | HS.A | Ouchi Village, Fenghuo Town, Linli County | 24.71 | 6/1/2018 | 50 | 5/31/2068 | 3,021,148 | 5,035 | 2,865,055 | Lease | Pasture growing | |||||||||||||||||||||||||||||||||||||||||||
| Guangdong lot 1 | JHST | Yane Village, Liangxi Town, Enping City | 8.23 | 8/10/2007 | 60 | 8/9/2067 | 1,064,501 | 1,478 | 897,433 | Management Right | HU Plantation | JHST | Yane Village, Liangxi Town, Enping City | 8.23 | 8/10/2007 | 60 | 8/9/2067 | 1,064,501 | 1,478 | 826,467 | Management Right | HU Plantation | ||||||||||||||||||||||||||||||||
| Guangdong lot 2 | JHST | Nandu Village of Yane Village, Liangxi Town, Enping City | 27.78 | 3/14/2007 | 60 | 3/13/2067 | 1,037,273 | 1,441 | 867,276 | Management Right | HU Plantation | JHST | Nandu Village of Yane Village, Liangxi Town, Enping City | 27.78 | 3/14/2007 | 60 | 3/13/2067 | 1,037,273 | 1,441 | 798,124 | Management Right | HU Plantation | ||||||||||||||||||||||||||||||||
| Guangdong lot 3 | JHST | Nandu Village of Yane Village, Liangxi Town, Enping City | 60.72 | 3/14/2007 | 60 | 3/13/2067 | 2,267,363 | 3,149 | 1,895,768 | Management Right | HU Plantation | JHST | Nandu Village of Yane Village, Liangxi Town, Enping City | 60.72 | 3/14/2007 | 60 | 3/13/2067 | 2,267,363 | 3,149 | 1,744,610 | Management Right | HU Plantation | ||||||||||||||||||||||||||||||||
| Guangdong lot 4 | JHST | Nandu Village of Yane Village, Liangxi Town, Enping City | 54.68 | 9/12/2007 | 60 | 9/11/2067 | 2,041,949 | 2,836 | 1,724,313 | Management Right | HU Plantation | JHST | Nandu Village of Yane Village, Liangxi Town, Enping City | 54.68 | 9/12/2007 | 60 | 9/11/2067 | 2,041,949 | 2,836 | 1,588,183 | Management Right | HU Plantation | ||||||||||||||||||||||||||||||||
| Guangdong lot 5 | JHST | Jishilu Village of Dawan Village,Juntang Town, Enping City | 28.82 | 9/12/2007 | 60 | 9/11/2067 | 960,416 | 1,334 | 811,018 | Management Right | HU Plantation | JHST | Jishilu Village of Dawan Village,Juntang Town, Enping City | 28.82 | 9/12/2007 | 60 | 9/11/2067 | 960,416 | 1,334 | 746,990 | Management Right | HU Plantation | ||||||||||||||||||||||||||||||||
| Guangdong lot 6 | JHST | Liankai Village of Niujiang Town, Enping City | 31.84 | 1/1/2008 | 60 | 12/31/2068 | 821,445 | 1,141 | 698,228 | Management Right | Fish Farm | JHST | Liankai Village of Niujiang Town, Enping City | 31.84 | 1/1/2008 | 60 | 12/31/2068 | 821,445 | 1,141 | 643,465 | Management Right | Fish Farm | ||||||||||||||||||||||||||||||||
| Guangdong lot 7 | JHST | Nandu Village of Yane Village, Liangxi Town, Enping City | 41.18 | 1/1/2011 | 26 | 12/31/2037 | 5,716,764 | 18,323 | 4,397,511 | Management Right | HU Plantation | JHST | Nandu Village of Yane Village, Liangxi Town, Enping City | 41.18 | 1/1/2011 | 26 | 12/31/2037 | 5,716,764 | 18,323 | 3,518,009 | Management Right | HU Plantation | ||||||||||||||||||||||||||||||||
| Guangdong lot 8 | JHST | Shangchong Village of Yane Village, Liangxi Town, Enping City | 11.28 | 1/1/2011 | 26 | 12/31/2037 | 1,566,393 | 5,020 | 1,204,918 | Management Right | HU Plantation | JHST | Shangchong Village of Yane Village, Liangxi Town, Enping City | 11.28 | 1/1/2011 | 26 | 12/31/2037 | 1,566,393 | 5,020 | 963,934 | Management Right | HU Plantation | ||||||||||||||||||||||||||||||||
| Guangdong lot 9 | MEIJI | Xiaoban Village of Yane Village, Liangxi Town, Enping City | 41.18 | 4/1/2011 | 20 | 3/31/2031 | 5,082,136 | 21,176 | 3,621,022 | Management Right | Cattle Farm | MEIJI | Xiaoban Village of Yane Village, Liangxi Town, Enping City | 41.18 | 4/1/2011 | 20 | 3/31/2031 | 5,082,136 | 21,176 | 2,604,595 | Management Right | Cattle Farm | ||||||||||||||||||||||||||||||||
| Qinghai lot 1 | SJAP | No. 498, Bei Da Road, Chengguan Town of Huangyuan County,Xining City, Qinghai Province | 21.09 | 11/1/2011 | 40 | 10/30/2051 | 527,234 | 1,098 | 459,133 | Land Use Right & Building ownership | Cattle farm, fertilizer and livestock feed production | SJAP | No. 498, Bei Da Road, Chengguan Town of Huangyuan County,Xining City, Qinghai Province | 21.09 | 11/1/2011 | 40 | 10/30/2051 | 527,234 | 1,098 | 406,410 | Land Use Right & Building ownership | Cattle farm, fertilizer and livestock feed production | ||||||||||||||||||||||||||||||||
| Guangdong lot 10 | JHST | Niu Jiang Town, Liangxi Town, Enping City | 6.26 | 3/4/2013 | 10 | 3/3/2023 | 489,904 | 4,083 | 302,107 | Management Right | Processing factory | JHST | Niu Jiang Town, Liangxi Town, Enping City | 6.27 | 3/4/2013 | 10 | 3/3/2023 | 489,904 | 4,083 | 106,146 | Management Right | Processing factory | ||||||||||||||||||||||||||||||||
| Guangdong lot 11 | CA | Da San Dui Wei ,You Nan Village, Conghua District of Guangzhou City | 33.28 | 10/28/2014 | 30 | 10/27/2044 | 4,453,665 | 12,371 | 4,119,640 | Management Right | Agriculture | CA | Da San Dui Wei ,You Nan Village, Conghua District of Guangzhou City | 33.28 | 10/28/2014 | 30 | 10/27/2044 | 4,453,665 | 12,371 | 3,525,818 | Management Right | Agriculture | ||||||||||||||||||||||||||||||||
| JHST | Land improvement cost incurred | 12/1/2013 | 3,914,275 | 6,155 | 3,686,558 | JHST | Land improvement cost incurred | 12/1/2013 | 3,914,275 | 6,155 | 3,391,141 | Management Right | HU Plantation | |||||||||||||||||||||||||||||||||||||||||
| Exchange difference | -4,930,244 | -4,851,431 | Exchange difference | -7,951,392 | -2,582,091 | |||||||||||||||||||||||||||||||||||||||||||||||||
| 678 | 62,300,409 | 136,824 | 52,482,217 | |||||||||||||||||||||||||||||||||||||||||||||||||||
| 654 | 62,300,409 | 131,789 | 53,673,690 | |||||||||||||||||||||||||||||||||||||||||||||||||||
2.2.8. Note (15) Other Receivables
| 2020 | Note | |||||
| Advanced to employees | $ | |||||
| Advanced to suppliers | 2,028,907 | 15A | ||||
| Advanced to customers | 15B | |||||
| Advanced to SJAP | 76,404,954 | 15C | ||||
| Others | 3,649,530 | |||||
| $ | 82,083,391 | |||||
2.2.9. Note (16) Current Liabilities:
Note 15.A & B: Breakdown of Advances to Suppliers ($9.4 million):
15.A. A portion of this consists of molds, parts and components necessary to manufacture and fit-out various types of filters in the APM systems requiring suppliers (manufacturers) to carry additional inventory. This inventory is billed to the Company at such times when the components are called to manufacture the APM filtration systems. Until then, the Company provides advances to the supplier to manufacture the components and hold in inventory on the Company’s behalf until the components are called and billed to the Company, i.e. offsetting the amount invoiced with the proceeds received in advance.
15. B. At SJAP it is a common practice to make cash advances to our cooperative growers (presently standing at 2200 members) who are our suppliers, to carry them through respective growing periods (for cropping or pasturing or cattle growing purposes) before final harvests of produce or sale of their cattle. On average, it works out at less than $8,850 per member based on the total of $19.5 million, however part of that amount has been offset by RMB1,000 / head of cattle / year given to the growers as a grant by the Government amounting to over US$4.165 million placed with SJAP holding on trust for and on behalf of the growers that in the management’s opinion is a normal season to season process deemed fair and equitable. In this respect, as the said average increases it means that the average cooperative farmer is increasing his productivity (whether in the growing of crops or cattle), and in simple terms, would indicate that SJAP’s revenue is also increasing.
Note (16) Current Liabilities:
| Note | ||||||
| Current liabilities | ||||||
| Accounts payable and | ||||||
| Billings in excess of | ||||||
| Due to a director | ||||||
| Other payables | ||||||
Note (16C)(16A): Analysis of other payables (current liabilities):
As of December 31, 2019, we have other payables totaling $42,514,342, comprised of the following:
(1). Straight note payable of $29,367,999 represents a 10.5% Convertible Note in the aggregate principal amount of up to $33,300,000 issued on August 29, 2014. On July 18, 2018, the Company and the note holder entered into a restructuring agreement regarding the settlement of the Note as follows:
| (i) | 50% in cash settlement of $15,589,000 to be paid in monthly installments. |
| (ii) | The other 50% balance of $15,589,000 to be settled by the issuance of 5,196,333 common shares of the Company and 400,000 shares of Tri-way Industries Limited. |
As of the date of this report, the Company has paid $4 million with $11,589,000 remaining owed on the $15,589,000 balance.
February 3, 2019 the said repayment of $4 million was readjusted to $3.69 million.
We filed an 8-K on December 12, 2019 to state that we received a notice of default (the “Notice”) from ECAB on December 12, 2018 contending that a new Note was in default because (i) SIAF had not made repayments on the new Note in the manner prescribed by its terms, and (ii) of certain Payables:other unspecified events of default. While ECAB stated in the Notice that it has not elected to accelerate the right to repayment of the entire principal amount, including accrued but unpaid interest on the ECAB Note, it reserves the right to do so.
Prior to receipt of the Notice from ECAB, the Company was attempting to reach a negotiated settlement with ECAB. Notwithstanding receipt of the Notice, the Company hopes to continue to work with ECAB to settle its obligations under the ECAB Note. The Company intends to vigorously defend its position should a mutually amicable resolution prove unattainable.
Subsequently, Note 1 would be matured on February 28, 2020 the Company intends to offer the settlement of the note to the accredited investors based on the following understanding, terms and conditions:
(i). The earlier understanding of the restructured indebtedness is to be carried as follows: (a) SIAF issues 5,196,333 shares of its common stock and transfer 400,000 shares of TRW to the note holder; and (b) SIAF is to pay the revised promissory note in the principal amount of $15,589,000 to the note holder.
(ii). It is the Company’s intension for the said 5,196,333 shares of its common stocks to be converted into the G Series Preferred Stocks at conversion ratio of the offer of the Initial Public Offer stated in the registration statement filed with SEC targeting on or before June 30, 2021.
(iii). There were 500,050 Common Shares of the Company loaned to the said accredited investor on (Date: July 22, 2014) valued at US$18.10 / share as security for the accredited investors to secure their investors to invest on the Bond prior to the completion of a registration statement filed with SEC on June 2014 to allow the official issuing of additional common stocks to ECAB’s BOND investors, and that ECAB would return back the loaned stocks back to the Company upon the time the said accredited investor invested the balance of the Note 1 proceed of (US$ 13,362,550) needed to complete the disbursement of the total loan proceed of US$25,000,000 on or before (Date: February 28th 2015). However the said investor sold the said loaned 500,050 common stocks of the Company in between the period (Date: February to March 2015) and invested part or the full sum from the sales proceeds of said 500,050 common stock of the Company (of US$10,500,000) back to the Company as part of the Note 1’s disbursement to the Company making total disbursement sum of US$22,137,450.00 being advanced to the Company on or before 30th June 2015, and in turn, the investor did not return the said 500,050 common stocks of the Company to the Company and didn’t help the Company to complete the said registration statement by not giving the Company the Debenture Agreement requested by SEC and needed to complete said registration statement with SEC.
(iv). In order that the principal amount of $15,589,000 of the cash settlement sum mentioned above may be settled amicably between the accredited investor and the Company, the sales proceeds (of US$13,362,550.00) from the sales of the 500,050 shares loaned in good faith to ECAB must be taken into consideration and be deduced from the said principal amount before this bond arrangements can be settled.
(2). As of the date of this report we have other payables due to various third parties totaling $8,932,314.60, comprising the following:
(i). A loan was granted by a friendly third party on October 12, 2017 for $6 million that was recorded at later date by a loan agreement executed on February 18, 2019 for $6,301,480 (inclusive of an additional loan of $301,480 granted by the same third party on February 2, 2019. This loan is to be re-paid in 3 tranches inclusive of accrued interest calculated to time of repayments comprising Tranche (1) for $2,300,000, Tranche (2) for $2,350,000 and Tranche (3) for $2,746,702 on August 31, 2019, October 30, 2019 and December 31, 2019, respectively, for total repayment amount of $7,346,702 which was not paid as at December 31st 2019 and at December 31st 2020 incurring accrued interest of $773,584 and $812,028.60 for year 2019 and 2020 respectively making total loan repayments inclusive accrued interest calculated to $8,932,314.60 as at December 31st 2020.
(ii). A number of friendly third parties granted various advances and extended debts to the Company during the past years, and as at the date of this report the total loan and debts recorded under other payables of the Company’s account amounting to $9,345,811 collectively that in general do not have fixed terms of repayments and interest. However it was due to the hardship caused by the Covid-19 Pandemic 2020 to the Company, the said friendly third parties agreed to write off the debt of $9,345,811 by accepting other friendly Triway members’ offers to compensate them with Tri-way shares from their own holdings (Settlement arrangement). Therefore as at December 31st 2020 the Company has no more debt due to the said friendly third parties and a promise note from one of the friendly third party for an amount of $1,757,858.30 due to the Company for receiving extra Tri-way shares under the Settlement arrangement.
The Table below shows the other payables as at December 31st 2020:
| Other Payables | 2019 | 2020 | ||||||
| The friendly third parties | 4,707,949.56 | - | ||||||
| ECAB | 29,367,999.00 | 29,367,999.00 | ||||||
| Garrett | 8,120,286.00 | 8,932,314.60 | ||||||
| One of the friendly third party | - | -1,757,858.00 | ||||||
| Other payables as at 31.12.2020 | 42,196,234.56 | 36,542,455.60 | ||||||
Note (16B): Analysis of Convertible Note (“CB Notes”) Payable) in Other payables (current liabilities):
As of the date of this Annual Report there are various CB Notes amounting to $0.
As of December 31, 2016, we have2019 there is $7,151,762 in CB Notes remaining outstanding collectively and out of which $2,130,000 is secured by 2,666,735 shares due for redemption and the return of collateralized shares on September 23, 2019; the balance of $1,173,000 are CB Notes due to 5 holders that will be settled either by cash or shares at prevailing market prices or a combination thereof during 2019 that was extended to September 23 2021 under corresponding addendums dated September 20th 2019. As of 31st December 2020 this CB Note of $7,151,762 was contrasted off with (i) the collateralized 2,666,735 shares for $2,130,000 and (ii) $5,021,762 in other payables totaling $17,514,209, comprisedreceivables of the following:
ForCompany. Therefore as of 31st December 2020 the fiscal year ended December 31, 2016, we issued promissory notesvarious CB Note are amounting to $10,428,044 to unrelated third parties for advances granted by third parties collectively to the Company (and/or to its subsidiaries) that are personally guaranteed by a director, repayable within two years on interest-free terms. Promissory notes could be repaid either in cash, shares of the Company, or in combination, thereof. If shares are utilized to settle debt amounts, both parties will determine the respective share conversion rates at the time of settlement. During fiscal year 2015 we redeemed $0 of promissory notes by issuing shares for advances granted by third parties in fiscal year 2015 and from the early months of 2014, providing a balance of $11,192,117 in promissory notes still due and outstanding as of December 31, 2016.
A grant of $716,565 was received from the Chinese government to SJAP for the development of a certain project; however if SJAP proves to be unable to complete the project, it will have to repay the grant to the Government. As of December 31, 2016, as the project is not yet completed, the grant is recorded as other payable.
Also in fiscal year 2016, there were other advances given by other unrelated third parties collectively to our subsidiaries with no fixed term of repayment at interest free terms that may or may not have any promissory note or agreement, but rather a verbal understanding. These advances amount to $5,248,527 unpaid and outstanding as at December 31, 2016.
Part F. Pro forma on records of historical performances reflecting the Company’s “Free Cash Flow “derivation: (Inclusive of SIAF and subsidiaries in segments containing Non-GAAP derivation)$0.
| 2013 | 2014 | 2015 | 2016 | Total | ||||||||||||||||
| Continuing and discontinued operations | ||||||||||||||||||||
| Sale of goods | 209 | 217 | 251 | 271 | 948 | |||||||||||||||
| Consulting income | 52 | 82 | 92 | 72 | 293 | |||||||||||||||
| Cost of goods sold | 139 | 154 | 194 | 212 | 699 | |||||||||||||||
| Cost of service | 21 | 44 | 57 | 47 | 169 | |||||||||||||||
| EBITDA | 98 | 119 | 101 | 143 | 461 | |||||||||||||||
| - | ||||||||||||||||||||
| Depreciation & amortization | 3 | 5 | 5 | 6 | 18 | |||||||||||||||
| - | ||||||||||||||||||||
| Net income attributable to SIAF & subsidiaries (continuing operations, only) | 74 | 66 | 50 | 43 | 233 | |||||||||||||||
| - | ||||||||||||||||||||
| Non - controlling interest | 20 | 20 | 24 | 21 | 85 | |||||||||||||||
| Net Incomes of the group | 94 | 86 | 74 | 64 | 318 | |||||||||||||||
| Total Assets | 357 | 513 | 640 | 766 | ||||||||||||||||
| Current assets | 147 | 282 | 350 | 321 | ||||||||||||||||
| Total liabilities | 38 | 72 | 70 | 62 | ||||||||||||||||
| Current liabilities | 31 | 52 | 28 | 23 | ||||||||||||||||
| Capital employed | 326 | 461 | 611 | 742 | - | |||||||||||||||
| Total stockholders equity | 319 | 441 | 570 | 704 | ||||||||||||||||
| Internal transaction adjustment | 0 | -0 | -0 | - | ||||||||||||||||
| Total stockholders equity (adjustment) | 319 | 440 | 570 | 704 | ||||||||||||||||
| ROCE | 29 | % | 25 | % | 16 | % | 18 | % | ||||||||||||
| CapEx (Total) | 66 | 35 | 55 | 58 | 214 | |||||||||||||||
| 1. property and equipment | 7 | 4 | 5 | 3 | 19 | |||||||||||||||
| 2. construction in progress | 51 | 27 | 50 | 55 | 183 | |||||||||||||||
| 3. land use right | 4 | 4 | - | - | 8 | |||||||||||||||
| 4. proprietary technologies | 4 | - | - | - | 4 | |||||||||||||||
| Working Capital | 116 | 230 | 322 | 297 | ||||||||||||||||
| 1. cash and cash equivalents | 1 | 3 | 7 | 3 | ||||||||||||||||
| 2. inventories | 8 | 46 | 63 | 63 | ||||||||||||||||
| 3. deposits and prepaid expenses | 51 | 76 | 84 | 85 | ||||||||||||||||
| 4. account receivable | 82 | 105 | 136 | 123 | ||||||||||||||||
| 5. other receivables | 5 | 52 | 60 | 47 | ||||||||||||||||
| 6. account payables and accrued expenses | -11 | -22 | -9 | -9 | ||||||||||||||||
| 7. short term loan | -4 | -4 | -4 | -3 | ||||||||||||||||
| 8. other payables | -16 | -26 | -15 | -12 | ||||||||||||||||
| Total increase of wc | 5 | 114 | 92 | -25 | 186 | |||||||||||||||
| Total capex and increase of wc | 71 | 149 | 147 | 33 | 400 | |||||||||||||||
| Free Cash Flow (FCF) | -52 | 63 | 1 | 29 | 41 | |||||||||||||||
| Net Debt | -5 | -20 | -41 | -30 | ||||||||||||||||
2.2.10. Income Taxes
The Company was incorporated in the State of Nevada, in the United States of America. The Company has no trading operations in United States of America and no US corporate tax has been provided for in the consolidated financial statements of the Company.
2.2.11. Undistributed Earnings of Foreign Subsidiaries
The Company intends to use the remaining accumulated and future earnings of foreign subsidiaries to expand operations outside the United States of America and, accordingly, undistributed earnings of foreign subsidiaries are considered to be indefinitely reinvested outside the United States and no provision for U.S. Federal and State income tax or applicable dividend distribution tax has been provided thereon.
The Company appointed US tax professionals to assist in filing incomefiled USA tax returns for the years ended December 31, 2016 in compliance with US Treasury Internal Revenue Code and we filed our 2015 Tax returns with the Internal Revenue Service (“IRS”) in 2016.all previous year inclusive year 2016 to 2020.
As of December 31, 2015,2018, the Company reviewed its tax position with the assistance of US tax professionals and believed that there would be no taxes and no penalties assessed by the IRS in the United States of America.
No EIT has been provided in the financial statements of SIAF, CA, JHST, JHMC, JFD, HSA, QZH and SJAP since they are exempt from EIT for the twelve months ended December 31, 20162020 and 20152019 as they are within the agriculture, dairy and fishery sectors.
CA, CS and CH are international business companies incorporated in Belize, and are exempt from corporate tax in Belize.
No Hong Kong profits tax has been provided in the consolidated financial statements, since TRW did not earn any assessable profits arising in Hong Kong for the twelve months ended December 31, 2016 and 2015.2020.
No Macau corporate income tax has been provided in the consolidated financial statements, since APWAM and MEIJI did not earn any assessable profits in Macau for the twelve months ended December 31, 2016, 20152020 and 2014.2019.
SwedenSwedish corporate income tax has been provided in the consolidated financial statements for SAFS at $1,130$1,684 for the twelve months ended December 31, 20162020 and $0 for 2015, and for the period from November 12, 2014 (date of registration) to December 31, 2014, tax incurred was $0.2019.
No deferred tax assets and liabilities are payable as of December 31, 2016,2019 and December 31, 20152018 since there was no difference between the financial statements carrying amounts, and the tax basis of assets and liabilities using enacted tax rates in effect for the period in which the differences are expected to reverse.
2.2.12. Off Balance Sheet Arrangements:
None.
2.2.13. Liquidity and Capital Resources
As of December 31 2016,2020, unrestricted cash and cash equivalents amounted to $2,576,058$188,846 (see notes to the consolidated financial statements), and our net working capital as of December 31, 2016,2019 was $297,338,248.$185,595.
| Contractual Obligations | Less than 1 year | 1-3 years | 3-5 years | More than 5 years | Total | |||||||||||||||
| Short Term Debts | 2,883,090 | 2,883,090 | ||||||||||||||||||
| Bonds payable | 21,314,877 | 21,314,877 | ||||||||||||||||||
| Long Term Debts | - | 5,766,182 | 5,766,182 | |||||||||||||||||
| Debt Loan | 4,797,532 | 4,797,532 | ||||||||||||||||||
| Negotiable Promissory notes | 1,113,140 | 1,113,140 | ||||||||||||||||||
Cash provided by operating activities amounted to $56,019,415$8,554,505 for the twelve months ended December 31, 2016.2020. This compared with cash provided by operating activities totaled $44,619,333$6,786,632 for the twelve months ended December 31, 2015.2019. The increase in cash used inprovided by operations primarily resulted fromis mainly due to the increase of account receivable to $12,762,332in Other receivables from $3(67,257,850) for the twelve months ended December 31, 2016 from $(31,171,347)2019 to that of $13,481,986 for the twelve months ended December 31, 2015.
2020.
Cash used in investing activities totaled $56,190,154$0 for the twelve months ended December 31, 2016.2020. This compares with cash used in investing activities totaling $54,148,427$(11,506,614) for the twelve months ended December 31, 2015.2019. The increase in cash flows used in investing activities primarily resulted from the increase in payment for construction of $54,913,543in progress from $11.1million for the twelve months ended December 31, 2016 from $49,532,0302019 to that of $0 million for the twelve months ended December 31, 2015.
2020.
Cash provided by financing activities totaled $2,628,330$(0 for the twelve months December 31, 20162020 compared with cash used in financing activities totaling $8,895,517$(73,741) for the twelve months ended December 31, 2015. The decrease in cash provided by financing activities is mainly due to net proceeds from convertible bonds payable of $0 for the twelve months ended December 31, 2016 from $12,867,550 for the twelve months ended December 31, 2015.2019.
CRITICAL ACCOUNTING POLICIES
| 3. | CRITICAL ACCOUNTING POLICIES |
BASIS OF PRESENTATION
The audited consolidated financial statements for the twelve months ended December 31, 20152019 are prepared in accordance with generally accepted accounting principles in the United States of America (“US GAAP”GAAP”).
REVERSE STOCK SPLIT
Reverse stock split and new conversion rate of Series B preferred stock to share of common stock
On December 16, 2014, the Company implemented a 9.9-for-1 reverse stock split. On December 17, 2014, the Company implemented new conversion rate of 9.9 for 1 share of common stock. All share information contained within this report, including consolidated balance sheets, consolidated statements of income and other comprehensive income, and footnotes have been retroactively adjusted for the effects of reverse stock split and new conversion rate of Series B preferred stock to share of common stock.
As the par value per share of our common stock remained unchanged at $0.001 per share, a total of $75 was reclassified from common stock to additional paid-in capital. All references to shares of common stock and per share data for all periods presented in the accompanying financial statements and notes thereto have been adjusted to reflect the reverse stock split on a retroactive basis.
BASIS OF CONSOLIDATION
The consolidated financial statements include the financial statements of SIAF, its subsidiaries Capital Award, CS, CH, TRW, MEIJI, JHST, JFD, JHMC, HSA, APWAM, SAFS and its variable interest entities SJAP and QZH. All material inter-company transactions and balances have been eliminated in consolidation. The results of companies acquired or disposed of during the year are included in the consolidated Financial Statements from the effective date of acquisition.
BUSINESS COMBINATIONS
The Company adopted the accounting pronouncements relating to business combinations (primarily contained in ASC Topic 805 “Business Combinations”), including assets acquired and liabilities assumed arising from contingencies. These pronouncements established principles and requirements for how the acquirer of a business recognizes and measures in its financial statements the identifiable assets acquired, the liabilities assumed, and any non-controlling interest in the acquire as well as provides guidance for recognizing and measuring the goodwill acquired in the business combination and determines what information to disclose to enable users of the financial statements to evaluate the nature and financial effects of the business combination. In addition, these pronouncements eliminate the distinction between contractual and non-contractual contingencies, including the initial recognition and measurement criteria and require an acquirer to develop a systematic and rational basis for subsequently measuring and accounting for acquired contingencies depending on their nature. Our adoption of these pronouncements will have an impact on the manner in which we account for any future acquisitions.
NON - CONTROLLING INTEREST IN CONSOLIDATED FINANCIAL STATEMENTS
The Company adopted the accounting pronouncement on non-controlling interests in consolidated financial statements, which establishes accounting and reporting standards for the non-controlling interest in a subsidiary and for the deconsolidation of a subsidiary. This guidance is primarily contained in ASC Topic “Consolidation”. It clarifies that a non-controlling interest in a subsidiary is an ownership interest in the consolidated financial statements. The adoption of this standard has not had material impact on our consolidated financial statements.
78
USE OF ESTIMATES
The preparation of consolidated financial statements in conformity with accounting principles generally accepted in the United States requires management to make assumptions and estimates that affect the reported amounts of assets and liabilities and disclosure of contingent assets and liabilities at the dates of the consolidated financial statements and the reported amounts of revenues and expenses during the reporting periods covered thereby. Actual results could differ from these estimates. Judgments and estimates of uncertainties are required in applying the Company’s accounting policies in certain areas. The following are some of the areas requiring significant judgments and estimates: determinations of the useful lives of assets, estimates of allowances for doubtful accounts, cash flow and valuation assumptions in performing asset impairment tests of long-lived assets, estimates of the reliability of deferred tax assets and inventory reserves.
REVENUE RECOGNITION
The Company’s revenue recognition policies are in compliance with ASC 605. Sales revenue is recognized when all of the following have occurred: (i) persuasive evidence of an arrangement exists, (ii) delivery has occurred or services have been rendered, (iii) the price is fixed or determinable, and (iv) the ability to collect is reasonably assured. These criteria are generally satisfied at the time of shipment when risk of loss and title passes to the customer. Service revenue is recognized when services have been rendered to a buyer by reference to the stage of completion. License fee income is recognized on the accrual basis in accordance with the underlying agreements.
Government grants are recognized upon (i) the Company has substantially accomplished what we must be done pursuant to the terms of the policies and terms of the grant that are established by the local government; and (ii) the Company receives notification from the local government that the Company has satisfied all of the requirements to receive the government grants; and or (iii) the amounts are received.
Multiple-Element Arrangements
To qualify as a separate unit of accounting under ASC 605-25 “605-25“Multiple Element Arrangements”, the delivered item must have value to the customer on a standalone basis. The significant deliverables under the Company’s multiple-element arrangements are consulting and service under development contract, commission and management service.
Revenues from the Company's fishery development services contract are performed under fixed-price contracts. Revenues under long-term contracts are accounted for under the percentage-of-completion method of accounting in accordance with the Financial Accounting Standards Board (“FASB ”)”) Accounting Standards Codification (“ASC”) Topic 605,Revenue Recognition (“ASC 605”). Under the percentage-of-completion method, the Company estimates profit as the difference between total estimated revenue and total estimated cost of a contract and recognized that profit over the contract term. The percentage of costs incurred determines the amount of revenue to be recognized. Payment terms are generally defined by the installation contract and as a result may not match the timing of the costs incurred by the Company and the related recognition of revenue. Such differences are recorded as either costs or estimated earnings in excess of billings on uncompleted contracts or billings in excess of costs and estimated earnings on uncompleted contracts.
The Company determines a customer’s credit worthiness at the time an order is accepted. Sudden and unexpected changes in a customer’s financial condition could put recoverability at risk.
The percentage of completion method requires the ability to estimate several factors, including the ability of the customer to meet its obligations under the contract, including the payment of amounts when due. If the Company determines that collectability is not assured, we will defer revenue recognition and use methods of accounting for the contract such as the completed contract method until such time as the Company determines that collectability is reasonably assured or through the completion of the project.
For fixed-price contracts, the Company uses the ratio of costs incurred to date on the contract (excluding uninstalled direct materials) to management's estimate of the contract's total costs, to determine the percentage of completion on each contract. This method is used as management considers expended costs to be the best available measure of progression of these contracts. Contract costs included all direct material, subcontract and labor costs and those indirect costs related to contract performance, such as supplies, tool repairs and depreciation. The Company accounts for maintenance and repair services under the guidance of ASC 605 as the services provided relate to construction work. Contract costs incurred to date and expected total contract costs are continuously monitored during the term of the contract. Changes in job performance, job conditions, and estimated profitability arising from contract penalty, change orders and final contract settlements may result in revisions to the estimated profitability during the contract. These changes, which include contracts with estimated costs in excess of estimated revenues, are recognized as contract costs in the period in which the revisions are determined. Profit incentives are included in revenues when their realization is reasonably assured. At the point the Company anticipates a loss on a contract, the Company estimates the ultimate loss through completion and recognizes that loss in the period in which the possible loss was identified.
The Company does not provide warranties to customers on a basis customary to the industry; however, the customers can claim warranty directly from product manufacturers for defects in equipment or products. Historically, the Company has experienced no warranty claims.
The Company’s fishery development consultancy services revenues are recognized when the relevant services are rendered, and are subject to a Chinese business tax at a rate of 0% of the gross fishery development contract service income approved by the Chinese local government.
COST OF GOODS SOLD AND SERVICES
| 4. | COST OF GOODS SOLD AND SERVICES |
Cost of goods sold consists primarily of direct purchase cost of merchandise goods, and related levies. Cost of services consists primarily of direct cost and indirect cost incurred to date for development contracts and provision for anticipated losses on development contracts.
SHIPPING AND HANDLING
Shipping and handling costs related to cost of goods sold are included in general and administrative expenses, which totaled $20,160, $31,311$0 and $23,010$156,103 for the years ended December 31, 2016, 20152020 and 2014,2019, respectively.
ADVERTISING
Advertising costs are included in general and administrative expenses, which totaled $2,621,537, $2,795,633$0, and $2,379,831$956,056 for the years ended December 31, 2016, 20152020 and 2014,2019, respectively.
RESEARCH AND DEVELOPMENT EXPENSES
Research and development expenses are included in general and administrative expenses, which totaled $0, $549,020$0 and $786,261$855,167 for the years ended December 31, 2016, 20152020 and 2014, respectively.2019, respectively.
CASH AND CASH EQUIVALENTS
The Company considers all highly liquid securities with original maturities of three months or less when acquired to be cash equivalents. Cash and cash equivalents kept with financial institutions in the People’s Republic of China (“PRC”) are not insured or otherwise protected. Should any of those institutions holding the Company’s cash become insolvent, or the Company is unable to withdraw funds for any reason, the Company could lose the cash on deposit on that institution.
ACCOUNTS RECEIVABLE
The Company maintains reserves for potential credit losses on accounts receivable. Management reviews the composition of accounts receivable and analyzes historical bad debts, customer concentrations, customer credit worthiness, current economic trends and changes in customer payment patterns to evaluate the adequacy of these reserves. Terms of the sales vary. Reserves are recorded primarily on a specific identification basis.
The standard credit period of the Company’s most of customers is three months. Any amount that has an extended settlement date of over one year is classified as a long-termlong term receivable. Management evaluates the collectability of the receivables at least quarterly. There were no bad debts written off for the twelve months ended December 31, 2016 or December 31, 2015.
INVENTORIES
Inventories are valued at the lower of cost (determined on a weighted average basis) and net realizable value. Costs incurred in bringing each product to its location and conditions are accounted for as follows:
Net realizable value is the estimated selling price in the ordinary course of business, less estimated costs of completion and the estimated costs necessary to make the sale.
PROPERTY AND EQUIPMENT
Property and equipment are stated at cost less accumulated depreciation and any accumulated impairment losses. Such costs include the cost of replacing parts that are eligible for capitalization when the cost of replacing the parts is incurred. The assets’ residual values, useful lives and depreciation methods are reviewed, and adjusted if appropriate, at the end of each year.
Depreciation is calculated on a straight-line basis over the estimated useful life of the assets.
| Milk cows | 10 years | |
| Plant and machinery | 5 - 10 years | |
| Structure and leasehold improvements | 10 - | |
| Mature seed and herbage cultivation | 20 years | |
| Furniture, fixtures and equipment | 2.5 - 10 years | |
| Motor vehicles |
| 4 - 10 years |
An item of property and equipment is removed from the accounts upon disposal or when no future economic benefits are expected to arise from the continued use of the asset. Any gain or loss arising on disposal of the asset (calculated as the difference between the net disposal proceeds and the carrying amount of the item) is included in the consolidated statements of income in the period the item is disposed.
GOODWILL
Goodwill is an asset representing the fair economic benefits arising from other assets acquired in a business combination that are not individually identified and separately recognized. Goodwill is tested for impairment on an annual basis at the end of the company’s fiscal year, or when impairment indicators arise. The Company uses a fair-value-based approach to test for impairment at the level of each reporting unit. The Company directly acquired MEIJI, which is engaged in Hu Plantation. As a result of this acquisition, the Company recorded goodwill in the amount of $724,940. This goodwill represents the fair value of the assets acquired in these acquisitions over the cost of the assets acquired.
PROPRIETARY TECHNOLOGIES
The Company has determined that technological feasibility is established at the time a working model of products is completed. Master license of stock feed manufacturing technology was acquired and the costs of acquisition were capitalized as proprietary technologies when technological feasibility had been established. Proprietary technologies are intangible assets of finite lives. Proprietary technologies are amortized using the straight-line method over their estimated lives of 25 years.
An aromatic cattle-feeding formula was acquired and the costs of acquisition are capitalized as proprietary technologies when technological feasibility has been established. Cost of acquisition on aromatic cattle-feeding formula is amortized using the straight-line method over its estimated life of 2520 years.
The cost of sleepy cod breeding technology license is capitalized as proprietary technologies when technological feasibility has been established. Cost of granting sleepy cod breeding technology license is amortized using the straight-line method over its entitled life of 25 years.
Bacterial cellulose technology license and related trademark are capitalized as proprietary technologies when technological feasibility has been established. Cost of license and related trademark is amortized using the straight-line method over its estimated life of 20 years.
Management evaluates the recoverability of proprietary technologies on an annual basis of the end of the company’s fiscal year, or when impairment indicators arise. As required by ASC Topic 350 “Intangible - Goodwill and Other”, the Company uses a fair-value-based approach to test for impairment.
CONSTRUCTION IN PROGRESS
Construction in progress represents direct costs of construction as well as acquisition and design fees incurred. Capitalization of these costs ceases and the construction in progress is transferred to property and equipment when substantially all the activities necessary to prepare the assets for their intended use are completed. No depreciation is provided until construction is completed and the asset is ready for its intended use.
LAND USE RIGHTS
Land use rights represent acquisition of land use right rights of agriculture land from farmers and are amortized on the straight line basis over the respective lease periods. The lease period of agriculture land is in the range from 10 years to 60 years. Land use rights purchase prices were determined in accordance with the PRC Government’s minimum lease payments of agriculture land and mutually agreed between the company and the vendors. No independent professional appraiser performed a valuation of land use rights at the balance sheet dates.
81
CORPORATE JOINT VENTURE
A corporation formed, owned, and operated by two or more businesses (ventures) as a separate and discrete business or project (venture) for their mutual benefit is considered to be a corporate joint venture. Investee entities, in which the company can exercise significant influence, but not control, are accounted for under the equity method of accounting. Under the equity method of accounting, the company’s share of the earnings or losses of these companies is included in net income.
A loss in value of an investment that is other than a temporary decline is recognized as a charge to operations. Evidence of a loss in value might include, but would not necessarily be limited to absence of an ability to recover the carrying amount of the investment or inability of the investee to sustain an earnings capacity that would justify the carrying amount of the investment.
VARIABLE INTEREST ENTITY
An entity (investee) in which the investor has obtained less than a majority-owned interest, according to the Financial Accounting Standards Board (FASB). A variable interest entity (VIE) is subject to consolidation if a VIE is an entity meeting one of the following three criteria as elaborated in ASC Topic 810-10,Consolidation.
(a) the equity-at-risk is not sufficient to support the entity's activities;
(b) as a group, the equity-at-risk holders cannot control the entity; or
(c) the economics do not coincide with the voting interests.
If a firm is the primary beneficiary of a VIE, the holdings must be disclosed on the balance sheet. The primary beneficiary is defined as the person or company with the majority of variable interests.
TREASURY STOCK
Treasury stock consists of a Company’s own stock which has been issued, but is subsequently reacquired by the Company. Treasury stock does not reduce the number of shares issued but does reduce the number of shares outstanding. These shares are not eligible to receive cash dividends. Accounting for excesses and deficiencies on treasury stock transactions is governed by ASC 505-30-30.
State laws and federal agencies closely regulate transactions involving a company’s own capital stock, so the purchase of outstanding shares and converting them into treasury shares must have a legitimate purpose. Some of the most common reasons for purchasing outstanding shares are as follows:
(i) to meet additional stock needs for various reasons, including newly implemented stock option plans, the issuance stock for convertible bonds or convertible preferred stock, or a stock dividend;
(ii) to eliminate the ownerships interests of a stockholder;
(iii) to increase the market price of the stock that returns capital to shareholders; and
(iv) to potentially increase earnings per share of the stock by decreasing the shares outstanding on the same earnings.
The Company has adopted the cost method of accounting for treasury stock shares. The purchase of outstanding shares is treated as a temporary reduction in shareholders’ equity in view of the expectation to reissue the shares instead of retiring them. When the Company reissues the treasury shares, the temporary account is eliminated. The cost of treasury stock shares reacquired is charged to a contra account, in this case a contra equity account that reduces the stockholder equity balance.
INCOME TAXES
The Company accounts for income taxes under the provisions of ASC 740 “Accounting for Income Taxes.” Under ASC 740, deferred tax assets and liabilities are determined based on the difference between the financial statement carrying amounts and the tax bases of assets and liabilities using enacted tax rates in effect in the years in which the differences are expected to reverse.
The provision for income tax is based on the results for the year as adjusted for items, which are non-assessable or disallowed. It is calculated using tax rates that have been enacted or substantively enacted at the balance sheet date. Deferred taxes area accounted for using the balance sheet liability method in respect of temporary differences arising from differences between the carrying amount of assets and liabilities in the financial statements and the corresponding tax basis used in the computation of assessable tax profit. In principle, deferred tax liabilities are recognized for all taxable temporary differences, and deferred tax assets are recognized to the extent that it is probable that taxable profit will be available against which deductible temporary differences can be utilized.
Deferred income taxes are calculated at the tax rates that are expected to apply to the period when the asset is realized or the liability is settled. Deferred tax is charged or credited in the income statement, except when it relates to items credited or charged directly to equity, in which case the deferred tax is also adjusted in the equity accounts. Deferred tax assets and liabilities are offset when they relate to income taxes levied by the same taxation authority and the Company intends to settle its current tax assets and liabilities on a net basis. ASC 740 also prescribes a more-likely-than-not threshold for financial statement recognition and measurement of a tax position taken, or expected to be taken, in a tax return. ASC 740 also provides guidance related to, among other things, classification, accounting for interest and penalties associated with tax positions, and disclosure requirements. Any interest and penalties accrued related to unrecognized tax benefits will be recorded in tax expense.
POLITICAL AND BUSINESS RISK
| 5. | POLITICAL AND BUSINESS RISK |
The Company's operations are carried out in the PRC Accordingly, the Company's business, financial condition and results of operations may be influenced by the political, economic and legal environment in the PRC, and by the general state of the PRC's economy. The Company's operations in the PRC are subject to specific considerations and significant risks not typically associated with companies in North America and Western Europe. The Company's results may be adversely affected by changes in governmental policies with respect to laws and regulations, anti-inflationary measures, currency conversion and remittance abroad, and rates and methods of taxation, among other things.
IMPAIRMENT OF LONG-LIVED ASSETS AND INTANGIBLE ASSETS
In accordance with ASC 360, “Property, Plant and Equipment”, long-lived assets to be held and used are analyzed for impairment whenever events or changes in circumstances indicate that the related carrying amounts may not be recoverable. The Company reviews the carrying amount of its long-lived assets, including intangibles, for impairment, at the end of each fiscal year. An asset is considered impaired when estimated future cash flows are less than the carrying amount of the asset. In the event the carrying amount of such asset is considered not recoverable, the asset is adjusted to its fair value. Fair value is generally determined based on discounted future cash flow. As of December 31, 2015, 2014 and 2013, the Company determined no impairment losses were necessary.
EARNINGS PER SHARE
As prescribed in ASC Topic 260 “Earning per Share,” Basic Earnings per Share (“EPS”) is computed by dividing net income available to common stockholders by the weighted average number of common stock shares outstanding during the year. Diluted EPS is computed by dividing net income available to common stockholders by the weighted-average number of common stock shares outstanding during the year plus potential dilutive instruments such as stock options and warrants. The effect of stock options on diluted EPS is determined through the application of the treasury stock method, whereby proceeds received by the Company based on assumed exercises are hypothetically used to repurchase the Company’s common stock at the average market price during the period.
For the years ended December 31, 2016, 2015,2020 and 2014,2019, basic (loss)/earnings per share attributable to Sino Agro Food, Inc. and subsidiaries common stockholders for continuing and discontinued operations amounted to $5.46, $3.69$(2.24) and $5.81,$(0.21), respectively. For the years ended December 31, 2016, 20152020 and 2014,2019, diluted (loss)/earnings per share attributable to Sino Agro Food, Inc. and its subsidiaries’ common stockholders for continuing and discontinued operations amounted to $5.00, $3.60$(2.24) and $5.56, respectively.
For the years ended December 31, 2016, 2015, and 2014, basic earnings per share attributable to Sino Agro Food, Inc. and subsidiaries common stockholders for continuing operations amounted to $2.09, $2.81 and $4.18, respectively. For the years ended December 31, 2016, 2015 and 2014, diluted earnings per share attributable to Sino Agro Food, Inc. and its subsidiaries’ common stockholders for continuing operations amounted to $1.93, $2.75 and $4.00,$(0.21), respectively.
FOREIGN CURRENCY TRANSLATION
The reporting currency of the Company is the U.S. dollars. The functional currency of the Company is the Chinese Renminbi (RMB). For those entities whose functional currency is other than the U.S. dollars, all assets and liabilities are translated into U.S. dollars at the exchange rate on the balance sheet date; shareholder equity is translated at historical rates and items in the statements of income and of cash flows are translated at the average rate for the period.
Because cash flows are translated based on the weighted average translation rate, amounts related to assets and liabilities reported in the statements of cash flows will not necessarily agree with changes in the corresponding balances in the balance sheets. Translation adjustments resulting from this process are included in accumulated other comprehensive income in the consolidated statements of equity.
83
For the fiscal year ended December 31, 20162020
Translation gains and losses that arise from exchange rate fluctuations on transactions denominated in a currency other than the functional currency are included in the statements of income and comprehensive income as incurred. The balance sheet amounts with the exception of equity as of December 31 2016,2020 and December 31, 20152019 were translated at RMB6.94RMB6.52 to $1.00 and RMB6.49RMB6.98 to $1.00, respectively. The average translation rates applied to the consolidated statements of income and comprehensive income and of cash flows for the years ended December 31, 20162020 and December 31 20152019 were RMB6.64RMB6.90 to $1.00 and RMB6.23RMB6.87 to $1.00, respectively.
For the fiscal year ended December 31, 20152019
Translation gains and losses that arise from exchange rate fluctuations on transactions denominated in a currency other than the functional currency are included in the statements of income and comprehensive income as incurred. The balance sheet amounts except forwith the exception of equity as of December 31 20152019 and December 31, 20142018 were translated at RMB6.49RMB6.98 to $1.00 and RMB6.12RMB6.86 to $1.00, respectively. The average translation rates applied to the consolidated statements of income and comprehensive income and of cash flows for the years ended December 31, 20152019 and December 31 20142018 were RMB6.23RMB6.87 to $1.00 and RMB6.14RMB6.61 to $1.00, respectively.
ACCUMULATED OTHER COMPREHENSIVE INCOME
ASC Topic 220 “Comprehensive Income” establishes standards for reporting and displaying comprehensive income and its components in financial statements. Comprehensive income is defined as the change in stockholders’ equity of a business enterprise during a period from transactions and other events and circumstances from non-owner sources. The comprehensive income for all periods presented includes both the reported net income and net change in cumulative translation adjustments.
RETIREMENT BENEFIT COSTS
PRC state managed retirement benefit programs are defined contribution plans and the payments to the plans are charged as expenses when employees have rendered service entitling them to the contribution.
STOCK-BASED COMPENSATION
The Company adopts both ASC Topic 718, “Compensation - Stock Compensation” and ASC Topic 505-50,”Equity-Based Payments to Non-Employees” using the fair value method in which an entity issues its equity instruments to acquire goods and services from employees and non-employees. Stock compensation for stock granted to non-employees has been determined in accordance with this accounting standard and the accounting standard regarding accounting for equity instruments that are issued to other than employees for acquiring, or in conjunction with selling goods or services, as the fair value of the consideration received or the fair value of equity instruments issued, whichever is more reliably measured. This accounting standard allows the “simplified” method to determine the term of employee options when other information is not available. Under ASC Topic 718 and ASC Topic 505-50, stock compensation expenses is measured at the grant date on the value of the option or restricted stock and is recognized as expenses, less expected forfeitures, over the requisite service period, which is generally the vesting period.
FAIR VALUE OF FINANCIAL INSTRUMENTS
The Company follows paragraph 825-10-50-10 of the FASB Accounting Standards Codification for disclosures about fair value of its financial instruments and paragraph 820-10-35-37 of the FASB Accounting Standards Codification (“Paragraph 820-10-35-37”) to measure the fair value of its financial instruments. Paragraph 820-10-35-37 establishes a framework for measuring fair value in accounting principles generally accepted in the United States of America (U.S. GAAP), and expands disclosures about fair value measurements. To increase consistency and comparability in fair value measurements and related disclosures, Paragraph 820-10-35-37 establishes a fair value hierarchy, which prioritizes the inputs to valuation techniques used to measure fair value into three (3) broad levels. The fair value hierarchy gives the highest priority to quoted prices (unadjusted) in active markets for identical assets or liabilities and the lowest priority to unobservable inputs. The three (3) levels of fair value hierarchy defined by Paragraph 820-10-35-37 are described below:
NEW ACCOUNTING PRONOUNCEMENTS
The Company does not expect any recent accounting pronouncements to have a material effect on the Company’s financial position, results of operations, or cash flows.
In February 2013, the FASB issued guidance on disclosure requirements for items reclassified out of Accumulated Other Comprehensive Income (“AOCI”). This new guidance requires entities to present (either on the face of the income statements or in the notes) the effects on the line items of the income statement for amounts reclassified out of AOCI. The new guidance was effective for us beginning July 1, 2013. Other than requiring additional disclosures, there is no material impact on the Company’s consolidated financial statements upon adoption.
In March 2013, the FASB issued guidance on a parent’s accounting for the cumulative translation adjustment upon derecognition of a subsidiary or group of assets within a foreign entity. This new guidance requires that the parent releases any related cumulative translation adjustment into net income only if the sale or transfer results in the complete or substantially complete liquidation of the foreign entity in which the subsidiary or group of assets had resided. The new guidance was effective for us beginning July 1, 2014. There is no material impact on the Company’s consolidated financial statements upon adoption.
In July 2013, the FASB issued ASU 2013-11, "Presentation of an Unrecognized Tax Benefit When a Net Operating Loss Carry forward, a Similar Tax Loss, or a Tax Credit Carry forward Exists". These amendments provide that an unrecognized tax benefit, or a portion thereof, should be presented in the financial statements as a reduction to a deferred tax asset for a net operating loss carry forward, a similar tax loss, or a tax credit carry forward, except to the extent that a net operating loss carry forward, a similar tax loss, or a tax credit carry forward is not available at the reporting date to settle any additional income taxes that would result from disallowance of a tax position, or the tax law does not require the entity to use, and the entity does not intend to use, the deferred tax asset for such purpose, then the unrecognized tax benefit should be presented as a liability. For public entities, the amendments are effective for fiscal years, and interim periods within those years, beginning after December 15, 2013. The adoption of ASU 2013-11 is not expected to have a material impact on the Company's consolidated financial statements.
In April 2014, the FASB issued ASU 2014-08, “Reporting Discontinued Operations and Disclosures of Disposals of Components of an Entity,” which provides a narrower definition of discontinued operations than under existing U.S. GAAP. ASU 2014-08 requires that only a disposal of a component of an entity, or a group of components of an entity, that represents a strategic shift that has, or will have, a major effect on the reporting entity’s operations and financial results should be reported in the consolidated financial statements as discontinued operations. ASU 2014-08 also provides guidance on the consolidated financial statement presentations and disclosures of discontinued operations. The new guidance is effective prospectively for the Company to all new disposals of components and new classification as held for sale beginning April 1, 2015. The Company is evaluating the effects, if any, of the adoption of this guidance will have on the Company’s consolidated financial position, results of operations or cash flows.
In May 2014, the Financial Accounting Standards Board issued guidance related to revenue from contracts with customers. Under this guidance, revenue is recognized when promised goods or services are transferred to customers in an amount that reflects the consideration that is expected to be received for those goods or services. The updated standard will replace most existing revenue recognition guidance under GAAP when it becomes effective and permits the use of either the retrospective or cumulative effect transition method. Early adoption is not permitted. The updated standard will be effective for us in the first quarter of 2017. We have not yet selected a transition method and we are currently evaluating the effect that the updated standard will have on the Company’s consolidated financial statements and related disclosures.
In June 2014, the FASB issued ASU 2014-10, “Development Stage Entities (Topic 915): Elimination of Certain Financial Reporting Requirements, Including an Amendment to Variable Interest Entities Guidance in Topic 810, Consolidation”. The guidance eliminates the definition of a development stage entity thereby removing the incremental financial reporting requirements from U.S. GAAP for development stage entities, primarily presentation of inception to date financial information. The provisions of the amendments are effective for annual reporting periods beginning after December 15, 2014, and the interim periods therein. However, early adoption is permitted. Accordingly, the Company adopted this standard as of July 31, 2014.
In August 2014, the FASB issued ASU No. 2014-15, "Disclosure of Uncertainties about an Entity's Ability to Continue as a Going Concern." ASU 2014-15 will explicitly require management to assess an entity's ability to continue as a going concern, and to provide related footnote disclosure in certain circumstances. This pronouncement is effective for fiscal years, and interim periods within those years, beginning after December 15, 2016, and early adoption is permitted. Management is currently evaluating the impact of this pronouncement on the Company’s consolidated financial statements.
In November 2014, FASB issued ASU No. 2014-17, (Business Combinations (Topic 805): Pushdown Accounting (a consensus of the FASB Emerging Issues Task Force.) The amendments in this update provide an acquired entity with an option to apply pushdown accounting in its separate financial statements upon occurrence of an event in which an acquirer obtains control of the acquired entity. The adoption of ASU 2014-17 did not have a material impact on the Company’s consolidated financial statements.
In January 2015, FASB issued ASU No. 2015-01, Income Statement—Extraordinary and Unusual Items (Subtopic 225-20): Simplifying Income Statement Presentation by Eliminating the Concept of Extraordinary Items. This Update eliminates from GAAP the concept of extraordinary items. The amendments in this Update are effective for fiscal years, and interim periods within those fiscal years, beginning after December 15, 2015. A reporting entity may apply the amendments prospectively. A reporting entity also may apply the amendments retrospectively to all prior periods presented in the financial statements. Early adoption is permitted if the guidance is applied from the beginning of the fiscal year of adoption. The Company does not expect the adoption of ASU 2015-01 to have material impact on the Company’s consolidated financial statements.
In April 2015, the Financial Accounting Standards Board (“FASB”) issued Accounting Standards Update (“ASU”) No. 2015-03, which simplifies presentation of debt issuance costs. The amendments in this update require that debt issuance costs related to a recognized debt liability be presented in the balance sheet as a direct deduction from the carrying amount of that debt liability, consistent with debt discounts. ASU No. 2015-03 will be effective for fiscal years beginning after December 15, 2015, with early adoption permitted. The adoption of ASU 2015-03 did not have a material impact on the Company’s consolidated financial statements.
In November 2015, the FASB issued Accounting Standards Update No. 2015-17,Income Taxes (Topic 740): Balance Sheet Classification of Deferred Taxes (ASU 2015-17), which simplifies the presentation of deferred income taxes by requiring deferred tax assets and liabilities be classified as noncurrent on the balance sheet. The updated standard is effective for us beginning on January 1, 2017 with early application permitted as of the beginning of any interim or annual reporting period. The adoption of ASU 2015-17 did not have a material impact on the Company’s consolidated financial statements.
In February 2016, the Financial Accounting Standards Board (FASB) issued Accounting Standards Update No. 2014-09, Revenue from Contracts with Customers (Topic 606) (ASU 2014-09), which amends the existing accounting standards for revenue recognition. In August 2015, the FASB issued ASU No. 2015-14, Revenue from Contracts with Customers (Topic 606): Deferral of the Effective Date, which delays the effective date of ASU 2014-09 by one year. The FASB also agreed to allow entities to choose to adopt the standard as of the original effective date. In March 2016, the FASB issued Accounting Standards Update No. 2016-08, Revenue from Contracts with Customers (Topic 606): Principal versus Agent Considerations (Reporting Revenue Gross versus Net) (ASU 2016-08) which clarifies the implementation guidance on principal versus agent considerations. The guidance includes indicators to assist an entity in determining whether it controls a specified good or service before it is transferred to the customers. The new standard further requires new disclosures about contracts with customers, including the significant judgments the company has made when applying the guidance. We will adopt the new standard effective January 1, 2018, using the modified retrospective transition method. We finalized our analysis and the adoption of this guidance will not have a material impact on our consolidated financial statements.
In February 2016, the FASB issued Accounting Standards Update No. 2016-02,Leases (Topic 842) (ASU 2016-02), which generally requires companies to recognize operating and financing lease liabilities and corresponding right-of-use assets on the balance sheet. This guidance will be effective for us in the first quarter of 2019 on a modified retrospective basis and early adoption is permitted. We will adopt the new standard effective January 1, 2019. We have selected a lease accounting system and we are stillin the process of implementing such system as well as evaluating the use of the optional practical expedients. While we continue to evaluate the effect thatof adopting this guidance will have on our consolidated financial statements and related disclosures.
In March 2016, the FASB issued Accounting Standards Update No. 2016-08,Revenue from Contracts with Customers (Topic 606): Principal versus Agent Considerations (Reporting Revenue Gross versus Net)(ASU 2016-08) which clarifies the implementation guidance on principal versus agent considerations. The guidance includes indicators to assist an entitydisclosures, we expect our operating leases, as disclosed in determining whether it controls a specified good or service before it is transferredNote 9 - Commitments and Contingencies, will be subject to the customers. This guidancenew standard. We will be effective for us in the first quarter of 2018, with the option to adopt it in the first quarter of 2017. We are still evaluating the effect that this guidance will haverecognize right-of-use assets and operating lease liabilities on our consolidated financial statementsbalance sheets upon adoption, which will increase our total assets and related disclosures.liabilities.
In March 2016, the FASB issued Accounting Standards Update No. 2016-09,Compensation-Stock Compensation (Topic 718): Improvement to Employee Share-based Payment Accounting(ASU 2016-09) to simplify the accounting for share-based payment transactions, including the income tax consequences, an option to recognize gross share-based compensation expense with actual forfeitures recognized as they occur, as well as certain classifications on the statement of cash flows. This guidance will be effective for us in the first quarter of 2017, and early adoption is permitted. We are still evaluating the effect that this guidance will have on our consolidated financial statements and related disclosures.
In October 2016, the FASB issued Accounting Standards Update No. 2016-16, Income Taxes (Topic 740): Intra-Entity Transfers Other than Inventory (ASU 2016-16), which requires companies to recognize the income-tax consequences of an intra-entity transfer of an asset other than inventory. This guidanceinventory when the transfer occurs, rather than when the asset has been sold to an outside party. We will be effective for us in the first quarter of 2018, with the option to adopt it in the first quarter of 2017. We currently anticipate adopting the new standard effective January 1, 2018, using the modified retrospective transition approach through a cumulative-effect adjustment to retained earnings as of the effective date. A cumulative-effect adjustment will capture the write-off of income tax consequences deferred from past intra-entity transfers involving assets other than inventory, new deferred tax assets, and other liabilities for amounts not currently recognized under U.S. GAAP. Based on transactions up to December 31, 2017, we do not expect the standardadoption of this guidance to have a material impact on our consolidated financial statements.
In November 2016, the FASB issued Accounting Standards Update No. 2016-18, Statement of Cash Flows (Topic 230): Restricted Cash (ASU(ASU 2016-18), which requires companies to include amounts generally described as restricted cash and restricted cash equivalents in cash and cash equivalents when reconciling beginning-of-period and end-of-period total amounts shown on the statement of cash flows. We will adopt the new standard effective January 1, 2018, using the retrospective transition approach for all periods presented. We do not expect the adoption of this guidance to have a material impact on our consolidated financial statements.
In January 2017, the FASB issued Accounting Standards Update No. 2017-01, Business Combinations (Topic 805): Clarifying the Definition of a Business (ASU 2017-01), which revises the definition of a business and provides new guidance in evaluating when a set of transferred assets and activities is a business. We will adopt the new standard effective January 1, 2018, on a prospective basis and do not expect the standard to have a material impact on our consolidated financial statements.
In January 2017, the FASB issued Accounting Standards Update No. 2017-04, Intangibles - Goodwill and Other (Topic 350): Simplifying the Test for Goodwill Impairment (ASU 2017-04), which eliminates step two from the goodwill impairment test. Under ASU 2017-04, an entity should recognize an impairment charge for the amount by which the carrying amount of a reporting unit exceeds its fair value up to the amount of goodwill allocated to that reporting unit. This guidance will be effective for us in the first quarter of 20182020 on a prospective basis, and early adoption is permitted. We are still evaluating the effect that this guidance will have on our consolidated financial statements and related disclosure
Other accounting standards that have been issued or proposed by FASB that do not require adoption until a future date are not expectedexpect the standard to have a material impact on the Company’sour consolidated financial statements upon adoption.statements.
Although there are several other new accounting pronouncements issued or proposed by the FASB, which the Company has adopted or will adopt, as applicable, the Company does not believe any of these accounting pronouncements has had or will have a material impact on its consolidated financial position, operating results or statements of cash flows.
| GOVERNMENT REGULATION |
Market riskRegulation of M&A and Overseas Listings
On August 8, 2006, six PRC regulatory agencies, including the Ministry of Commerce (the “MOFCOM”), the State Assets Supervision and Administration Commission, the State Administration of Taxation (“SAT”), the State Administration of Industry and Commerce (the “SAIC”), the China Securities Regulatory Commission (“CSRC”), and the State Administration of Foreign Exchange (the “SAFE”), jointly issued the Regulations on Mergers and Acquisitions of Domestic Enterprises by Foreign Investors (the “M&A Rules”), which became effective on September 8, 2006 and was amended on June 22, 2009. The M&A Rules include provisions that purport to require that an offshore special purpose vehicle formed for purposes of the overseas listing of equity interests in PRC companies and controlled directly or indirectly by PRC companies or individuals obtain the approval of the CSRC prior to the listing and trading of such special purpose vehicle’s securities on an overseas stock exchange.
On September 21, 2006, the CSRC published on its official Website procedures regarding its approval of overseas listings by special purpose vehicles. The CSRC approval procedures require the filing of a number of documents with the CSRC. The application of this new PRC regulation remains unclear, with no consensus currently existing among leading PRC law firms regarding the scope of the applicability of the CSRC approval requirement.
The M&A Rules also establish procedures and requirements that could make some acquisitions of Chinese companies by foreign investors more time-consuming and complex, including requirements in some instances that the MOFCOM be notified in advance of any change-of-control transaction in which a foreign investor takes control of a Chinese domestic enterprise.
In February 2011, the General Office of the State Council promulgated a Notice on Establishing the Security Review System for Mergers and Acquisitions of Domestic Enterprises by Foreign Investors (“Circular 6”), which established a security review system for mergers and acquisitions of domestic enterprises by foreign investors. Under Circular 6, a security review is required for mergers and acquisitions by foreign investors having “national defense and security” concerns and mergers and acquisitions by which foreign investors may acquire “de facto control” of domestic enterprises with “national security” concerns. In August 2011, the riskMOFCOM promulgated the Rules on Implementation of lossSecurity Review System (the “MOFCOM Security Review Rules”), to future earnings,replace the Interim Provisions of the Ministry of Commerce on Matters Relating to fair valuesthe Implementation of the Security Review System for Mergers and Acquisitions of Domestic Enterprises by Foreign Investors promulgated by the MOFCOM in March 2011. The MOFCOM Security Review Rules, which came into effect on September 1, 2011, provide that the MOFCOM will look into the substance and actual impact of a transaction and prohibit foreign investors from bypassing the security review requirement by structuring transactions through proxies, trusts, indirect investments, leases, loans, control through contractual arrangements or offshore transactions.
Regulation of Foreign Currency Exchange and Dividend Distribution
The principal regulations governing foreign currency exchange in China are the Foreign Exchange Administration Regulations (the “FX Regulations”), which were last amended in August 2008. Under the FX Regulations, the RMB is freely convertible for current account items, including the distribution of dividends, interest payments, trade and service-related foreign exchange transactions, but not for capital account items, such as direct investments, loans, repatriation of investments and investments in securities outside of China, unless the prior approval of the SAFE is obtained and prior registration with the SAFE is made. On August 29, 2008, the SAFE issued a notice, Circular 142, regulating the conversion by a foreign-invested company of foreign currency into RMB by restricting how the converted RMB may be used. Circular 142 requires that the registered capital of a foreign-invested company settled in RMB converted from foreign currencies may only be used for purposes within the business scope approved by the applicable governmental authority and may not be used for equity investments within the PRC. In addition, the SAFE increased its oversight of the flow and use of the registered capital of a foreign-invested company settled in RMB converted from foreign currencies. The use of such RMB capital may not be changed without the SAFE’s approval, and may not in any case be used to futurerepay RMB loans if the proceeds of such loans have not been used. Violations of Circular 142 will result in severe penalties, such as heavy fines. As a result, Circular 142 may significantly limit our ability to transfer cash flows that may resultor other assets from changesThe Company and/or our other non-PRC subsidiaries into our subsidiaries in the price of a financial instrument. The value of a financial instrument may change as a result of changes in interest rates, exchange rates, commodity prices, equity prices and other market changes.
Foreign Currency Risk
Currency fluctuations and restrictions on currency exchangePRC, which may adversely affect our business including limiting our abilityexpansion and we may not be able to convert Chinese Renminbi (RMB)the net proceeds into RMB to invest in or acquire any other PRC companies, or establish other variable interest entities (“VIEs”) in the PRC.
Dividends paid by a PRC subsidiary to its overseas shareholder are deemed income of the shareholder and are taxable in the PRC. Pursuant to the Administration Rules of the Settlement, Sale and Payment of Foreign Exchange (1996), foreign-invested enterprises in the PRC may purchase or remit foreign currenciescurrency, subject to a cap approved by the SAFE, for settlement of current account transactions without the approval of the SAFE. Foreign currency transactions under the capital account are still subject to limitations and ifrequire approvals from, or registration with, the RMBSAFE and other relevant PRC governmental authorities.
In October 2005, the SAFE promulgated the Relevant Issues Concerning Foreign Exchange Control on Domestic Residents’ Corporate Financing and Roundtrip Investment through Offshore Special Purpose Vehicles (“Circular 75”). Under Circular 75, which was issued by SAFE effective November 1, 2005, prior registration with the local SAFE branch is required for PRC residents to establish or to control an offshore company for the purposes of financing that offshore company with assets or equity interests in an onshore enterprise located in the PRC. An amendment to the registration or filing with the local SAFE branch by such PRC resident is also required for the injection of equity interests or assets of an onshore enterprise in the offshore company or overseas funds raised by such offshore company, or any other material change involving a change in the capital of the offshore company. Moreover, Circular 75 applies retroactively. As a result, PRC residents who, prior to November 1, 2005, had established or acquired control of offshore companies that had made onshore investments in the PRC prior to were required to declinecomplete the relevant registration procedures with the local SAFE branch by March 31, 2006.
Since May 2007, the SAFE has issued a series of guidance to its local branches with respect to the operational process for the SAFE registration under Circular 75. The guidance provides more specific and stringent supervision of the registration required by Circular 75. For example, the guidance imposes obligations on onshore subsidiaries of an offshore entity to make true and accurate statements to the local SAFE authorities regarding any shareholder or beneficial owner of the offshore entity who is a PRC citizen or resident. Untrue statements by the onshore subsidiaries will lead to potential liability for the subsidiaries and, in value, reducingsome instances, for their legal representatives and other related individuals.
Under the relevant rules, failure to comply with the registration procedures set forth in Circular 75 may result in restrictions being imposed on the foreign exchange activities of the relevant onshore company, including increases in its registered capital, payment of dividends and other distributions to its offshore parent or affiliate and capital inflows from the offshore entity, and may also subject relevant PRC residents to penalties under PRC foreign exchange administration regulations. PRC residents who control our revenuecompany from time to time are required to register with the SAFE in U.S. dollar terms.connection with their investments in us.
On December 25, 2006, the People’s Bank of China (the “PBOC”) issued the Administration Measures on Individual Foreign Exchange Control and related Implementation Rules were issued by the SAFE on January 5, 2007. Both became effective on February 1, 2007. Under these regulations, all foreign exchange transactions involving an employee share incentive plan, share option plan, or similar plan participated in by onshore individuals may be conducted only with approval from the SAFE or its authorized branch. Under the Notice of Issues Related to the Foreign Exchange Administration for Domestic Individuals Participating in Stock Incentive Plan of Overseas Listed Company (“Offshore Share Incentives Rules”), which was issued by the SAFE on February 15, 2012, PRC citizens who are granted share options, restricted share units or restricted shares by an overseas publicly listed company are required to register with the SAFE or its authorized branch and to comply with a series of other requirements. If we, or the PRC employees of ours who hold options, restricted share units or restricted shares fail to comply with these registration or other procedural requirements, we, and/or such employees may be subject to fines and other legal sanctions.
The Chinese government currently managesprincipal regulations governing distribution of dividends of foreign holding companies include the exchangeForeign Investment Enterprise Law (1986), which was amended in October 2000, and the Administrative Rules under the Foreign Investment Enterprise Law (2001). Under these regulations, foreign investment enterprises in China may pay dividends only out of their accumulated profits, if any, determined in accordance with PRC accounting standards and regulations. In addition, foreign investment enterprises in China are required to allocate at least 10% of their accumulated profits each year, if any, to fund certain reserve funds unless these reserves have reached 50% of the registered capital of the enterprises. These reserves are not distributable as cash dividends.
Laws and Regulations Related to Employment and Labor Protection
On June 29, 2007, the National People’s Congress promulgated the Employment Contract Law of PRC (“Employment Contract Law”), which became effective as of January 1, 2008, and was amended on December 28, 2012. The Employment Contract Law requires employers to provide written contracts to their employees, restricts the use of temporary workers and aims to give employees long-term job security.
Pursuant to the Employment Contract Law, employment contracts lawfully concluded prior to the implementation of the Employment Contract Law and continuing as of the date of its implementation shall continue to be performed. Where an employment relationship was established prior to the implementation of the Employment Contract Law but no written employment contract was concluded, a contract must be concluded within one month after its implementation.
On September 18, 2008, the State Council promulgated the Implementing Regulations for the PRC Employment Contract Law which came into effect immediately. These regulations interpret and supplement the provisions of the Employment Contract Law.
As of December 31, 2015, we had entered written employment contracts with three of our employees.
Income Tax
On March 16, 2007, the National People’s Congress approved and promulgated the Enterprise Income Tax Law (the “EIT Law”). On December 6, 2007, the State Council approved the Implementing Rules. Both the EIT Law and its Implementing Rules became effective on January 1, 2008. Under the EIT Law and the Implementing Rules, which superseded the previous Income Tax Law, the enterprise income tax rate for both domestic companies and foreign invested enterprises is unified at 25%. On December 26, 2007, the State Council promulgated the Circular on Implementation of Enterprise Tax Transition Preferential Policy, or the Preferential Policy Circular. The EIT Law, its Implementing Rules and the Preferential Policy Circular provide a five-year transitional period for certain entities that had enjoyed a favorable income tax rate of less than 25% under the RMB. The valueprevious Income Tax Law and were established before March 16, 2007, during which period the applicable enterprises income tax rate shall gradually increase to 25%.
On April 14, 2008, the Administration Measures for Recognition of our common stock is indirectly affectedHigh and New Technology Enterprises, or the Recognition Measures, were jointly promulgated by the foreign exchange rate betweenMinistry of Science and Technology, the U.S. dollarMinistry of Finance, and the RMB. Appreciation or depreciation inSAT, which sets out the value ofstandards and process for granting the RMB relativehigh and new technology enterprises status. According to the U.S. dollar does affect our financial results reported in U.S. dollar terms without giving effect to any underlying change in our business or resultsEIT Law and its Implementing Rules as well as the Recognition Measures, enterprises which have been granted the high and new technology enterprises status shall enjoy a favorable income tax rate of operations.15%. The new EIT Law and its Implementation Rules also provide that “software enterprises” enjoy a two-year income tax exemption starting from the first profit making year, followed by a reduced tax rate of 12.5% for the subsequent three years.
Translation gains and lossesThe EIT Law also provides that arise from exchange rate fluctuations on transactions denominated inan enterprise established under the laws of a currency other than the functional currency are included in the statements of income and comprehensive income as incurred. The average translation rates applied to the consolidated statements of income and comprehensive income and of cash flows for the years ended December 31, 2013 through 2016 were RMB6.19, RMB6.14, RMB6.23 and RMB6.64, respectively.
Depository Insurance Risk
Cash and cash equivalents are held for working capital purposes and consist primarily of bank deposits. We do not enter into investments for tradingforeign country or speculative purposes.
Banks and other financial institutionsregion but whose “de facto management body” is in the PRC do not provide insurancebe treated as a resident enterprise for funds held on deposit. A portion of our assets are in the form of cash deposited with banks inPRC tax purposes and consequently be subject to the PRC income tax at the rate of 25% for its global income. The Implementing Rules merely defines the location of the “de facto management body” as “the place where the exercising, in substance, of the overall management and control of the production and business operation, personnel, accounting, properties, etc., of a non-PRC company is located.” The SAT issued the Circular regarding the Determination of Chinese-Controlled Offshore Incorporated Enterprises as PRC Tax Resident Enterprises on the Basis of De Facto Management Bodies, or Circular 82, on April 22, 2009. Circular 82 provides certain specific criteria for determining whether the “de facto management body” of a Chinese-controlled offshore-incorporated enterprise is located in China. The SAT issued the eventBulletin regarding the Administrative Measures on the Income Tax of bank failure, weChinese-Controlled Offshore Incorporated Resident Enterprises (Interim) on July 27, 2011, which became effective on September 1, 2011, providing more guidance on the implementation of Circular 82. This bulletin clarifies matters including resident status determination, post-determination administration and competent tax authorities. Although both Circular 82 and the bulletin only apply to offshore enterprises controlled by PRC enterprises, not companies like us, the determining criteria set forth in Circular 82 and the bulletin may reflect the SAT’s general position on how the “de facto management body” test should be applied in determining the tax resident status of offshore enterprises, regardless of whether they are controlled by PRC enterprises or individuals. Based on a review of surrounding facts and circumstances, the Company does not believe that it is likely that its operations outside of the PRC should be considered a resident enterprise for PRC tax purposes. However, due to limited guidance and implementation history of the EIT Law, should the Company be treated as a resident enterprise for PRC tax purposes, the Company will be subject to PRC tax on worldwide income at a uniform tax rate of 25% retroactive to January 1, 2008.
The EIT Law also imposes a withholding income tax of 10% on dividends distributed by a Foreign Invested Enterprise (an “FIE”) to its immediate holding company outside of China if such immediate holding company is considered a non-resident enterprise without any establishment or place within China or if the received dividends have no connection with the establishment or place of such immediate holding company within China, unless such immediate holding company’s jurisdiction of incorporation has a tax treaty with China that provides for a different withholding arrangement. Such withholding income tax was exempted under the previous law. The State of Nevada, where the Company is incorporated, does not have accesssuch tax treaty with China. The SAT further promulgated a circular, or Circular 601, on October 27, 2009, which provides that the tax treaty benefits will be denied to “conduit” or shell companies without business substance and that a beneficial ownership analysis will be used based on a “substance-over-form” principle to determine whether to grant the tax treaty benefits. Most our subsidiaries in China are directly held by our non-Chinese subsidiaries. If we are regarded as a non-resident enterprise and our non-Chinese subsidiaries are regarded as resident enterprises, then our non-Chinese subsidiaries may lose entirely, our funds on deposit. This exposure could result in our inability to immediately access fundsbe required to pay a 10% withholding tax on any dividends payable to us. If our suppliers, employees and/non-Chinese subsidiaries are regarded as non-resident enterprises, then our PRC subsidiaries may be required to pay a 5% withholding tax for any dividends payable to our non-Chinese subsidiaries, however, it is still unclear at this stage whether Circular 601 applies to dividends from our PRC subsidiaries paid to our non-Chinese subsidiaries, and if our non-Chinese subsidiaries were not considered as “beneficial owners” of any dividends from their PRC subsidiaries, whether the dividends payable to our non-Chinese subsidiaries would be subject to withholding tax at a rate of 10%.
The EIT Law and its Implementation Rules have tried to scrutinize transactions between related parties. Pursuant to the EIT Law and its Implementation Rules, the tax authorities may impose mandatory adjustment on tax due to the extent a related party transaction is not in line with arm’s-length principle or was entered with a purpose to reduce, avoid or delay the payment of tax. On January 8, 2009, the SAT issued the Implementation Measures for Special Tax Adjustments (Trial), which clarifies the definition of “related party” and sets forth the tax-filing disclosure and documentation requirements, the selection and application of transfer pricing methods, and transfer pricing investigation and assessment procedures.
On December 10, 2009, the SAT issued a circular on Strengthening the Administration of Enterprise Income Tax Collection on Income Derived from Equity Transfer by Non-resident Enterprise, or Circular 698. Pursuant to Circular 698, non-resident enterprises should declare any direct transfer of equity interest of PRC resident enterprises and pay taxes in accordance with the EIT Law and relevant laws and regulations. For an indirect transfer, if the effective tax rate for the transferor (a non-PRC-resident enterprise) is lower than 12.5% under the law of the jurisdiction of the direct transferred target, the transferor is required to submit relevant transaction materials to PRC tax authorities for review. If such indirect transfer is determined by PRC tax authorities to be a transaction without any reasonable business purpose other creditors.than for tax avoidance, the gains derived from such transfer will be subject to PRC income tax.
In addition to the above, after the EIT Law and its Implementing Rules were promulgated, the SAT released several regulations to stipulate more details for carrying out the EIT Law and its Implementing Rules. These regulations include:
• Notice of the State Administration of Taxation on the Issues Concerning the Administration of Enterprise Income Tax Deduction and Exemption (2008);
• Notice of the State Administration of Taxation on Strengthening the Withholding of Enterprise Income Tax on Non-resident Enterprises’ Interest Income Sourcing from China (2008);
• Notice of the State Administration of Taxation on Several Issues Concerning the Recognition of Incomes Subject to the Enterprise Income Tax (2008);
• Opinion of the State Administration of Taxation on Strengthening the Administration of Enterprise Income Tax (2008);
• Notice of the Ministry of Finance and State Administration of Taxation on Several Preferential Policies in Respect of Enterprise Income Tax (2008);
• Interim Measures for the Administration of Collection of Enterprise Income Tax on the Basis of Consolidation of Trans-regional Business Operations (2008);
• Several Issues Concerning the Enterprise Income Tax Treatment on Enterprise Reorganization (2009);
• Circular of the State Council on Printing and Distributing Policies for Further Encouraging the Development of the Software Industry and the Integrated Circuit Industry (2011); and
• Circular on Income Tax Policies for Further Encouraging the Development of Software Industry and Integrated Circuit Industry (2012).
10.OTHERS MATTERS AND THE ROAD AHEAD:
FORWARD-LOOKING STATEMENTS
The Company has been dedicating and continued to dedicate its best efforts to revitalize its business operations, businesses and corporate affairs based on tentative time schedules due to the uncertainties and changing circumstances caused by the Covid-19 Pandemic 2020 as such at present, the Company cannot guarantee or confirm any pre-announcements or predictions on any immature prospects or projects or jobs except to report all related performances in progress with the intension to achieve the objectives as soon as practicable.
Various business and corporate action plans are summarized and listed as follow:
| The business divisions: |
Introductions and summaries of business plans for the business divisions of the Company have been described in the earlier chapters of this annual report, however at present; the Company can’t guarantee or confirm their respective estimates and predictions.
| 2. | The Corporate affairs |
| 2.1. | Unaudited financial reporting: |
As of the date of this annual report, SIAF basically is already delinquent in its Form 10-Ks for fiscal year end 2019 and 2020, Form 10-Qs for periods ended March 31, 2020, June 30, 2020, September 30, 2020, and March 31, 2021. It will need to amend and restate filings going back to December 31, 2019. As such, based on legal advice, SAIF, rather than filing a delinquent and non-compliant Form 10-K, files a Form 8-K to make the unaudited and un-reviewed financial statements publicly available and that SIAF continues to file the 12b-25 as required.
On 21st June 2021 the Form 8 K of the 2020 annual report was filed.
Tentative time schedules for the filing of Form 8K for the following financial reports:
On or before 15th August 2021, the Company targets to file the Form 8K of the half yearly report 2021.
On or before 31st March 2022, the company targets to file the Form 8K of the annual report 2022.
| 2.2. | Audited financial reporting (restatements of financials) |
As it was reported earlier that the Company’s auditors, which are located in Hong Kong, have been unable to do on-site inspections of the Company’s operations in China due to COVID-19 restrictions preventing the completion of the 2019 and 2020 audited financials of the Company. The prolonged effects of the Covid-19 Pandemic continue to interrupt our existing HK auditors’ plans to come to China and the Company’s efforts in exploring the possibility of engaging alternative auditors have not been successful although there are discussions with some of them are still in progress due primarily to that most of the said alternative auditors are presently fully occupied and requiring longer time to understand and be familiar with the complexity of the Company’s financials.
However, the Company is hoping that the Covid-19 Pandemic 2020 will be controlled effectively sometimes within September 2021 due to the encouraging results of the vaccination programs in China, Hong Kong as well as globally. If so, tentatively the Company is targeting to file following reports as follows:
On or before 30th November 2021 --- “the Restatement of audited financials for fiscal year 2019 and 2020” to allow the Company to get back onto the OTCQB within December 2021.
On or before 31st December 2021 --- “the auditors’ reviewed quarterly financials (10 Q1, Q2and Q3 2021)”--- this will also mean that the Company will have caught up to date on all late fillings of financial reports.
On or before 15th May 2022 --- “the 10K 2021 audited financials” within the official required filing days of the 10K 2021 financial reports to allow the Company to get back onto OTCQX accordingly.
| 2.3. | The IPO exercise of the Company’s G series preferred shares: |
The contemplated offering of Series G Non-Convertible Cumulative Redeemable Perpetual Preferred shares (the “G Series”) is meant to reduce the Company’s outstanding shares, as the G Series shares are to be offered to the Company’s shareholders in exchange for the Company’s common stock as well as to be offered to any investors and shareholders targeting to raise US$40 million for the working capital needs of the Company. The Company has already filed Forms S-1 and S-4 with the SEC regarding the G Series and has received comments from the SEC on those filings. However, the Company has determined that, given the Company’s current condition, now is not an appropriate time to go forward with the G Series offering but if the Covid-19 Pandemic 2020 will be controlled effectively by September 2021, it will improve the opportunity and chances for the Company to reactivate the IPO exercise of the G series shares starting from December 2021.
| 2.4. | The distribution of Triway’s shares |
Execution of a share dividend distribution of 18.3 million Tri-way ordinary shares to shareholders of record, originally announced in 2018 and the Company has taken the following steps toward accomplishing the share distribution: it has prepared a draft Form F-1; engaged legal counsel to provide advice on the transaction; investigated the tax implications of the transaction; and evaluated the practicability of the transaction given the Company’s current financial condition.
Three main issues make it impracticable to execute the share distribution now. First, the Company understands that there are potential negative tax consequences that would arise from the transaction. Second, the Company estimates that it would cost nearly $200,000 to complete the transaction, including fees to consultants, the transfer agent, etc. Given the Company’s difficult financial condition, as explained above, the share distribution is simply not practicable at this time.
Third, the Company’s auditors, which are located in Hong Kong, have been unable to do on-site inspections of the Company’s operations in China due to COVID-19 restrictions. This fact also makes it difficult to complete this type of complex financial transaction. Additionally, SIAF explored the potential for issuing a smaller share dividend consisting of fewer than 18.3 million shares, but again determined that this was impracticable.
However, the Company remains committed to completing the share distribution and will do so as soon as practicable. Furthermore, if the Covid-19 Pandemic 2020 will be controlled effectively by September 2021 it will improve the possibility to continue the share dividend distribution of 18.3 million Tri-way ordinary shares to shareholders of record within January 2022.
| 2.5. | Income Statements of Investees |
The Table below shows the profit and loss of fiscal year 2020 of the Company’s investees:
| 1/12/2020 | SJAP | Tri-way | |||||||||||||||
| Items | RMB | US$ equivalent | HK$ | US$ equivalent | |||||||||||||
| 1 | Operating Revenue | 24,006,890 | 3,556,576 | - | - | ||||||||||||
| Minus: | Cost of operation | 16,805,106 | 2,489,645 | 534,466,761 | 69,141,884 | ||||||||||||
| Business tax and surcharges | 139 | 21 | - | - | |||||||||||||
| Selling expenses | 1,248,271 | 184,929 | - | - | |||||||||||||
| General expenses | 3,402,565 | 504,084 | 7,781,513 | 1,006,664 | |||||||||||||
| Financial expenses | 2,837,082 | 420,309 | - | - | |||||||||||||
| Impairment losses | - | - | - | - | |||||||||||||
| 2 | Operating profit | -286,274 | -42,411 | -542,248,274 | -70,148,548 | ||||||||||||
| Plus: | Non-operating income | 1,705,324 | 252,641 | - | - | ||||||||||||
| Minus: | Non-operating expenses | 68,000 | 10,074 | - | - | ||||||||||||
| Prior year profit or loss adjustment | - | - | - | - | |||||||||||||
| Comprehensive (loss) / income | - | - | -54,982,041 | -7,112,813 | |||||||||||||
| 3 | Total profit | 1,351,051 | 200,156 | -597,230,315 | -77,261,360 | ||||||||||||
| Minus: | Income tax expenses | - | - | - | - | ||||||||||||
| 4 | Net Profit | 1,351,051 | 200,156 | -597,230,315 | -77,261,360 | ||||||||||||
11.QUANTITATIVE AND QUALITATIVE DISCLOSURES ABOUT MARKET RISK
Not applicable
12.FINANCIAL STATEMENTS AND SUPPLEMENTARY DATA
The financial statements required by this item are located following the signature page of this Annual Report.
13.CHANGES IN AND DISAGREEMENTS WITH ACCOUNTANTS ON ACCOUNTING AND FINANCIAL DISCLOSURE
Not applicable.
14.CONTROLS AND PROCEDURES
Evaluation of Disclosure Controls and Procedures
We maintain “disclosure
Our Chief Executive Officer and Chief Financial Officer has evaluated the effectiveness of our disclosure controls and procedures” as (as such term is defined in RuleRules 13a-15(e) and 15d-15(e) under the Securities Exchange Act of 1934, (the “as amended, or the Exchange Act”), that are designed to ensure that information required to be disclosed in our Exchange Act reports is recorded, processed, summarized and reported within the time periods specified in the SEC’s rules and forms, and that such information is accumulated and communicated to our management, including our Chief Executive Officer (“CEO”) and Chief Financial Officer (“CFO”), as appropriate, to allow timely decisions regarding required disclosure. We conducted an evaluation (the “Evaluation”), under the supervision and with the participation of our CEO and our CFO, of the effectiveness of the design and operation of our disclosure controls and procedures (“Disclosure Controls”)Act) as of the end of the period covered by this report pursuant to Rule 13a-15 of the Exchange Act.report. Based on this Evaluation,that evaluation, our CEOChief Executive Officer and CFOChief Financial Officer, has concluded that our Disclosure Controlsdisclosure controls and procedures have improved but yet were not deemed effective at a reasonable assurance level as of the end of such period. This conclusion was based on the period covered by this report.
87
Changes in Internal Controls
We have also evaluated our internal control over financial reporting, and there has been no changematerial weakness identified in our internal control over financial reporting that occurred during the last fiscal quarterrelated, but which may or may not be entirely exclusive, to our accounting for disposal of fiscal year ended December 31, 2016 that has materially affected, or is reasonably likely to materially affect our internal control over financial reporting.assets resulting from discontinued operations, as described below.
Limitations on the Effectiveness of Controls
Our management, including our CEOChief Executive Officer and CFO,Chief Financial Officer does not expect that our Disclosure Controls and internal controls will prevent all errors and all fraud. A control system, no matter how well conceived and operated, can provide only reasonable, not absolute, assurance that the objectives of the control system are met. Further, the design of a control system must reflect the fact that there are resource constraints, and the benefits of controls must be considered relative to their costs. Because of the inherent limitations in all control systems, no evaluation of controls can provide absolute assurance that all control issues and instances of fraud, if any, within the Company have been detected. These inherent limitations include the realities that judgments in decision-making can be faulty, and that breakdowns can occur because of a simple error or mistake. Additionally, controls can be circumvented by the individual acts of some persons, by collusion of two or more people, or by management or board override of the control.
The design of any system of controls also is based in part upon certain assumptions about the likelihood of future events, and there can be no assurance that any design will succeed in achieving its stated goals under all potential future conditions; over time, controls may become inadequate because of changes in conditions, or the degree of compliance with the policies or procedures may deteriorate. Because of the inherent limitations in a cost-effective control system, misstatements due to error or fraud may occur and not be detected.
Management’s Report on Internal Control over Financial Reporting
Our management is responsible for establishing and maintaining adequate internal control over financial reporting as such term is(as defined in Exchange Act RuleRules 13a-15(f) and 15d-15(f)). The Company’sOur system of internal control over financial reporting is a process designed to provide reasonable assurance to our management and boardBoard of directorsDirectors regarding the reliabilitypreparation and fair presentation of financial reportingour consolidated and the preparation of thecombined financial statements for external purposes in accordance with accounting principles generally accepted in the United States of America.accounting principles.
Our internal control over financial reporting includes those policiesChief Executive Officer and procedures that (i) pertain to the maintenance of records that, in reasonable detail, accurately and fairly reflect the transactions and dispositions of the assets of the Company; (ii) provide reasonable assurance that transactions are recorded as necessary to permit preparation of financial statements in accordance with accounting principles generally accepted in the United States of America, and that receipts and expenditures of the Company are being made only in accordance with authorizations of management and directors of the Company; and (iii) provide reasonable assurance regarding prevention or timely detection of unauthorized acquisition, use, or disposition of the Company’s assets that could have a material effect on the financial statements.
Because of its inherent limitations, internal controls over financial reporting may not prevent or detect misstatements. All internal control systems, no matter how well designed, have inherent limitations, including the possibility of human error and the circumvention of overriding controls. Accordingly, even effective internal control over financial reporting can provide only reasonable assurance with respect to financial statement preparation. Also, projections of any evaluation of effectiveness to future periods are subject to the risk that controls may become inadequate because of changes in conditions, or that the degree of compliance with the policies or procedures may deteriorate.
Our managementChief Financial Officer assessed the effectiveness of our internal control over financial reporting as of December 31, 2016.2017 and December 31, 2018. In making this assessment, our managementhe used the criteria set forthframework included in Internal Control — Integrated 2013 Framework issued by the Committee of Sponsoring Organizations of the Treadway Commission (“COSO”) in Internal Control-Integrated Framework.Commission. Based on our assessment, we believeevaluation under the criteria set forth in Internal Control — Integrated 2013 Framework, our Chief Executive Officer and Chief Financial Officer concluded that, as of December 31, 2015, the Company’s2016, our internal control over financial reporting was effective.had not been effective due to the identification of a material weakness related, but which may or may not be entirely exclusive, to our controls over our accounting for disposal of assets related to discontinued operations. A material weakness is a deficiency, or combination of deficiencies, in internal control over financial reporting such that there is a reasonable possibility that a material misstatement of the company’s annual or interim financial statements will not be prevented or detected on a timely basis.
Remediation Efforts to Address Material Weakness
To remediate the material weakness in our internal control over financial reporting described above, that Company has initiated implementing new control procedures regarding our accounting for reporting discontinued operations and disclosures of disposal of asset components, specifically regarding ‘timely disclosure’ on matters related to Discontinued Operations. The changes to the control environment include, but are not limited to, the following:
•For future disposition of assets and / or discontinued operations, the Company has retained ECOVIS Financial Accounting specialists to augment internal resources utilized for due diligence and analysis of the technical accounting aspects of the transaction. Such resources will be retained by management at the direction of the audit committee.
•For future disposition of assets and / or discontinued operations, the Company will prepare an accounting memorandum for each disposal to address the guidance outlined in ASC 205-20 ‘Presentation of Financial Statements — Discontinued Operations’ as necessary, as well as further educate itself regarding matters of disposition / discontinued operations through related accounting literature, that will be reviewed by the Chief Financial Officer and presented to the audit committee.
•We recently appointed two new directors, both of whom will serve on the Audit Committee. We expect appointing these individuals will augment our ability to ameliorate any weaknesses in our internal control over financial reporting.
•Presently, Solomon Lee serves as both our Chief Executive Officer and our interim Chief Financial Officer due to the unfortunate passing of Daniel Ritchey, our former Chief Financial Officer, as reported in a Current Report on Form 8-K filed with the Commission on December 4, 2018. We are conducting a search for a suitable replacement for Mr. Ritchey but have not yet identified a candidate. We expect that appointing a new chief financial officer will augment our ability to ameliorate any weaknesses in our internal control over financial reporting.
These remediation initiatives are intended to enhance the Company’s timely disclosure by establishing a formal process and specific control activities regarding disposition of assets / discontinued operations. Management believes that these measures, currently being implemented, will remediate the deficiency identified. Other than as noted above, other changes may be implemented in the future to enhance and improve the Company’s ICFR measures to prevent this deficiency from recurring.
However, the material weakness will not be considered remediated until the applicable remedial controls operate for a sufficient period and the Chief Executive Officer and Chief Financial Officer, Independent Audit Committee, and Independent Auditor have concluded, through testing, that these controls are operating effectively.
Changes in Internal Control over Financial Reporting
Except as described above, there were no other deficiencies discovered in our internal control over financial reporting during the fourth quarter period ended December 31, 2016 and throughout all periods of FY2017 that have materially affected or are reasonably likely to materially affect our internal control over financial reporting.
Attestation Report of the Registered Public Accounting Firm
This annual report includes an attestation report of our independent registered public accounting firm regarding internal control over financial reporting.
15. OTHER INFORMATION
None.
16.PART IIIDIRECTORS, EXECUTIVE OFFICERS, AND CORPORATE GOVERNANCE
The Board of Directors elects our executive officers annually. A majority vote of the directors who are in office is required to fill vacancies. Each director shall be elected for the term of one year and until his successor is elected and qualified or until his earlier resignation or removal. Our directors and executive officers are as follows:
| Name | Age | Position | ||
| Lee Yip Kun Solomon | CEO, Interim CFO and Chairman of the Board | |||
| Chief Marketing Officer and Director | ||||
| Chen | Secretary and Director | |||
ColanukuduruRavindran Muson Cheung | 63 48 | Independent Director Independent Director | ||
ColanukuduruRavindran Muson Cheung Henry Sun | 63 48 48 | Independent Director | ||
Independent Director Independent Director |
Lee Yip Kun Solomon. Mr. Lee has been a Director and our Chief Executive Officer since August 2007. From March 2004 to date he has been Company Managing Director of Capital Award Inc. Since May, 1993, he has been the CEO of Irama Edaran Sdn.IramaEdaranSdn. Bhd. (Malaysia), a modern fishery developer. There was no formal relationship between Sino Agro Food and Irama Edaran.IramaEdaran. He received a B.A. Major in Accounting and Economics from Monash University, Australia in July 1972. As a member of the board, Mr. Solomon contributes his knowledge of our company and a deep understanding of all aspects of our business, products and markets, as well substantial experience developing corporate strategy, assessing emerging industry trends, and business operations.
Daniel Ritchey. Mr. Ritchey has been an Independent Director of the Company since February 1, 2014. Having worked in both the public and private sectors, Mr. Ritchey has deployed his years of experience into developing partnerships and venture capital relationships throughout the agriculture and natural resource industries. Coupled with an undergraduate degree from Muskingum College (1989) and an MBA from Ohio State University (1994), Mr. Ritchey has as President of The Business Advocate, Inc. developed 3 successful partnerships, namely DC Capital LLC; 3-D Ranch LLC; and 3-D Oil and Gas LLC, whose business operations are mainly concentrated in Ohio, and whose commercial property development also extends into the Washington DC area. Mr. Ritchey continues to serve as a lobbyist on both the State and Federal level, with a focus on issues and industries related to natural resources and the environment.
Tan Paoy TeikPaoyTeik. Mr. Tan has been a Director and our Chief Marketing Officer since August 2007. Since July, 2005, he has been Company Managing Director of Milux Corporation Bhd. (Malaysia), a manufacturer of home and gas appliances. He received an MBA from South Pacific University in 2005. Mr. Tan is currently the Managing Director of Milux Corporation Bhd; as such, he spends half of his working time with Milux and half with our company. As a member of the board, Mr. Tan contributes his knowledge of the company and a deep understanding of all aspects of our business, products and markets, as well substantial experience developing corporate strategy, assessing emerging industry trends, and business operations.
Chen Bor HannBorHann. Mr. Chen has been a Director and Secretary since August 2007. Since March, 2004, he has been Director and Business Development Manager of Capital Award Inc. From September 1995 to March 2004, he was Fishery Supervisor of Irama Edaran Sdn.IramaEdaranSdn. Bhd. (Malaysia). As a member of the board, Mr. Chen contributes his knowledge of the company and a deep understanding of all aspects of our business, products and markets, as well substantial experience developing corporate strategy, assessing emerging industry trends, and business operations.
Nils-Erik SandbergColanukuduruRavindran. Mr. SandbergRavindran has been an Independent Director of the Company since January 1, 2013. He brings international investment experienceserving as a director and skills in corporate governance, investor relations, and corporate finance with local knowledge of NASDAQ OMX Stockholm and Swedish Stock Exchange that will benefit the Company. He was appointed the Chairman of the Compensation Committee of the Company as of February 1, 2013. He is President of the Jordan Fund, a Swedish investment Company network since 1990. Mr. Sandberg also currently holds a position as an adviser for Gustavia Energyexecutive in a variety of industries including energy (e.g. oil & gas) and Commodities Fund, formerly known asinformation technology with 36 years of experience in strategy, finance, fundraising, and “techno commercial”, in the Stockpicker JF Commodity Energy Fund, since 2008.U.S., India and Singapore. From 2011 to 2015, Mr. Sandberg was the founder andRavindran served as the CEOChief Executive Officer of HydrocarbonTerrasoft, a software development and services company. Beginning in 2015 through the present, Mr. Ravindran has acted as the Director at Union King Corporation and Atlantic Resources, a company based out of Hong Kong that is involved in worldwide trading of garments, electronic household goods, seafood etc. IN addition, in 2016 he was appointed as Director of Tri-way Industries Ltd, an independent private limited company based in Hong Kong. Mr. Ravindran received a Bachelor’s degree in Chemical Technology from Annamalai University in Tamilnadu, India in 1978 and subsequently obtained a post graduate degree in Plastics as well as in International HCI AB,Trade from the Indian Institute of Foreign Trade.
Muson Cheung. Mr. Cheung’s high credential is including Doctor of Business and Administration and Master of Finance, over 10 years experiences as lecturer of tertiary educationresponsible for risk and security management and investment and he has more than 15 years of experiences in financial markets, wasthe pioneer of and is a publicly traded Swedish oil Company, from 1986 to 1993. Mr. Sandbergdirector in MC Financial Services Limited, and was the foundervise-president of Tiger Securities Asset Management Limited and holder of Security Broker License (Hong Kong Stock Exchange).
Henry Sun. Mr. Sun is currently the Founder and President of Reach China LLC, a cross-border consulting firm established in 2016 to help both American and Chinese companies with capital market introductions and international business development. From January 2011 to August 2016, Mr. Sun served as the CEOCFO of Grauten Oil AB,Highpower International, Inc., a publicly traded Swedish oillithium battery company from 1986listed on Nasdaq. From November 2009 to 1993.December 2010, Mr. SandbergSun was the CFO of Zoomlion Concrete Machinery Company, a directordivision of International Petroleum Corporation, predecessor of Lundin Oil, later Lundin Petroleum, which tradesZoomlion that was listed on both the NASDAQ-OMXShanghai and TSXHong Kong stock exchanges.
Koi Ming Yap (George). Mr. YapSun also held financial management and advisory roles with various public and private companies before he joined Zoomlion. Mr. Sun has been an Independent Director of the Company since January 1, 2013. He brings international investment banking,extensive experiences in financial reporting and planning, corporate finance, financial reporting, investment strategies, and international auditing experience and skills in corporate governance, investor relations, and corporate finance with knowledge of NASDAQ OMX Stockholm and the Swedish Stock Exchange that will benefit the Company. He was appointed the Chairman of the Audit Committee of the Company as of February 1, 2013. He is a practicing international chartered accountant with over 30 years standing and is a practicing member of The Institute of Chartered Accountants in England and Wales since 1984. His international experience has covered Australia-NZ, United Kingdom-, Europe, Malaysia, the ASEAN, China and Hong Kong. Mr. Yap has been the managing principal of K M Yap & Company, a sole proprietary firm of Chartered Accountancy in NSW, Sydney, since 1990. He has been managing director of Brenna Investments Pty Ltd. since 1998 and has held the position of Public Interest Director (non-executive) for the Federation of Investment Managers Malaysia, in Malaysia since 2010 (a position sanctioned by the Securities Commission of Malaysia). Mr. Yap specializes in strategic corporate finance solutions, business plans, registering listings on stock exchanges, international banking, financial management, risk management, financial reporting, auditing, financial management, investment management, and providing corporate finance solutions in terms of sourcing finance,capital raising, as well as cornerstone investors in IPOs, reverse mergers,managing relationships with investment bankers, auditors and takeovers, that are expected to benefitlawyers. Mr. Sun holds a Master of Business Administration degree from the Company.Thunderbird School of Global Management at Arizona State University, and a Bachelor of Engineering degree from Beijing University of Posts and Telecommunications.
89
Lim Chang Soh (Anthony). Mr. Soh was appointed as an Independent Director of the Company on February 5, 2014. He brings investment experience and skills in corporate governance, corporate finance, new business development and investment strategies with considerable knowledge in agriculture industry that will benefit the Company. Mr. Soh is a practicing lawyer with 20 years standing and a partner in the law firm, Edwin Lim Suren & Soh, in Kuala Lumpur, Malaysia. He served as Deputy Managing Director of Pontian United Plantations Berhad (“Pontian”), a Malaysian plantation company in the business of cultivating oil palm on 39,000 acres of land on a Company basis, and operating an oil mill, from the Year 2009 until October 31, 2013. Prior to his appointment as the Deputy Managing Director, Mr. Soh was appointed Director in Pontian in 2005, and subsequently promoted to the post of Executive Director from 2007. He holds an LL.B (Hons) degree from University of Hull, England. In his professional career, Mr. Soh specializes in mergers and takeovers and corporate re-structuring that are expected to benefit the Company.
Family Relationships
There are no family relationships among our officers or directors.
Involvement in Certain Legal Proceedings
None of the director(s) or executive officers of the Company: (i) has been involved as a general partner or executive officer of any business which has filed a bankruptcy petition; (ii) has been convicted in any criminal proceeding nor is subject to any pending criminal proceeding; (iii) has been subjected to any order, judgment or decree of any court permanently or temporarily enjoining, barring, suspending or otherwise limiting his involvement in any type of business, securities or banking activities; and (iv) has been found by a court, the United States Securities and Exchange Commission or the Commodities Futures Trading Commission to have violated a federal or state securities or commodities law.
Board Committees:
Audit Committee
Our Audit Committee currently consists of two directors: Messrs. Yap (chairman)Mr.Ravindran, Mr. Muson Cheung and Sandberg. Mr. Henry Sun.
Mr. Ritchey was a member of the Audit Committee until his appointment as the Company’s Acting Chief Financial Officer effective March 1, 2016. Mr. Yap resigned from our board of directors on August 15, 2017. Mr. Sandberg resigned from our board of directors on November 8, 2018. The Board has determined that:
The designation of Mr. Yap as an “audit committee financial expert” will not impose on him any duties, obligations or liability that are greater than those that are generally imposed on him as a member of our Audit Committee and our Board, and his designation as an “audit committee financial expert” will not affect the duties, obligations or liability of any other member of our Audit Committee or Board.
Compensation Committee
Our Compensation Committee currently consists of three directors: Messrs. Sandberg (chairman), Yap and Soh.Mr.Muson Cheung. The Board has determined that:
Compensation Committee Interlocks and Insider Participation
None of the members of our Compensation Committee is an officer or employee of our company. None of our executive officers currently serves, or in the past year has served, as a member of the board of directors or compensation committee of any entity that has one of more executive officers serving on our Board or Compensation Committee.
90
Code of Conduct
The Board has established a corporate Code of Conduct which qualifies as a “code of ethics” as defined by Item 406 of Regulation S-K of the Exchange Act. Among other matters, the Code of Conduct is designed to deter wrongdoing and to promote:
Waivers to the Code of Conduct may be granted only by the Board. In the event that the Board grants any waivers of the elements listed above to any of our officers, we expect to announce the waiver within four business days on a Current Report on Form 8-K.
The Code of Conduct applies to all of the Company’s employees, including our principal executive officer, the principal financial and accounting officer, and all employees who perform these functions. If we amend our Code of Conduct as it applies to the principal executive officer, principal financial officer, principal accounting officer or controller (or persons performing similar functions), we shall disclose such amendment through the filing of a Current Report on Form 8-K.
| 17. | EXECUTIVE COMPENSATION |
Summary Compensation Table
The table below summarizes all compensation awarded to, earned by, or paid to our Principal Executive Officer, our two most highly compensated executive officers other than our CEO who occupied such position at the end of our latest fiscal year and up to two additional executive officers who would have been included in the table below except for the fact that they were not executive officers at the end of our latest fiscal year, by us, or by any third party where the purpose of a transaction was to furnish compensation, for all services rendered in all capacities to us or our subsidiary for the latest fiscal year ended December 31, 2016.2017.
| Name and Principal Position | Year | Salary($) | Bonus ($) | Option Awards ($) | Non-equity incentive plan compensation | Nonqualified deferred compensation earnings ($) | All other compensation ($) | Total ($) | Year | Salary($) | Bonus ($) | Option Awards ($) | Non-equity incentive plan compensation | Nonqualified deferred compensation earnings ($) | All other compensation ($) | Total ($) | |||||||||||||||||||||||||||||||||||||||||||||
| Lee Yip Kun Solomon | 2016 | 336,000 | 0 | 0 | 0 | 0 | 0 | 336,000 | 2019 | 336,000 | 0 | 0 | 0 | 0 | 0 | 336,000 | |||||||||||||||||||||||||||||||||||||||||||||
| Chief Executive Officer | 2015 | 336,000 | 0 | 0 | 0 | 0 | 0 | 336,000 | 2029 | 336,000 | 0 | 0 | 0 | 0 | 0 | 336,000 | |||||||||||||||||||||||||||||||||||||||||||||
| Tan Paoy Teik | 2016 | 174,000 | 0 | 0 | 0 | 0 | 0 | 174,000 | |||||||||||||||||||||||||||||||||||||||||||||||||||||
| Tan PaoyTeik | 2018 | 174,000 | 0 | 0 | 0 | 0 | 0 | 174,000 | |||||||||||||||||||||||||||||||||||||||||||||||||||||
| Chief Marketing Officer | 2015 | 174,000 | 0 | 0 | 0 | 0 | 0 | 174,000 | 2020 | 174,000 | 0 | 0 | 0 | 0 | 0 | 174,000 | |||||||||||||||||||||||||||||||||||||||||||||
| Chen Bor Hann | 2016 | 60,000 | 0 | 0 | 0 | 0 | 0 | 60,000 | |||||||||||||||||||||||||||||||||||||||||||||||||||||
| Chen BorHann | 2019 | 60,000 | 0 | 0 | 0 | 0 | 0 | 60,000 | |||||||||||||||||||||||||||||||||||||||||||||||||||||
| Secretary | 2015 | 60,000 | 0 | 0 | 0 | 0 | 0 | 60,000 | 2020 | 60,000 | 0 | 0 | 0 | 0 | 0 | 60,000 | |||||||||||||||||||||||||||||||||||||||||||||
Summary Equity Awards or payments for remuneration
There has been no equity incentive award made to any of our executive officers as of our fiscal year ended December 31, 2016. However, there were 337,688, 174,8742019 and 60,301 shares paid to Solomon Lee, Tan Paoy Tan and Chen Bor Hann, respectively, on May 10, 2016 for services rendered (for 6 years that were accrued but not issued) during year 2007 to 2012 calculated at $5.97 / share.2020.
Employment Agreements
Lee Yip Kun Solomon. On December 29, 2014,2018, we renewed the three-year employment agreement effective and continuing as of January 1, 20162022 with Lee Yip Kun Solomon, our Chief Executive Officer and President (the “Lee Agreement”). Pursuant to the Lee Agreement, Mr. Lee is entitled to an annual base salary of $336,000 and to receive a certain number of our common stock per year calculated in accordance with a formula of (Number of shares (X) = $336,000 / $ / share ($share($Y) at time of settlement.settlement). Such shares have not been issued to Mr. Lee. Mr. Lee shall also be eligible for discretionary performance bonus payments; no such bonus has been paid. The Lee Agreement provides for Mr. Lee to be eligible to participate in any incentive compensation established by the Company; no such plan has been established. The Lee Agreement also includes confidentiality obligations to which Mr. Lee must adhere.
Tan Paoy TeikPaoyTeik. On December 29, 2014,2018, we renewed the three-year employment agreement effective and continuing as of January 1, 20162022 with Tan Paoy Teik,PaoyTeik, our Chief Marketing Officer (the “Tan Agreement”). Pursuant to the Tan Agreement, Mr. Tan is entitled to an annual base salary of $174,000 and to receive a certain number of our common stock per year calculated in accordance with a formula of (Number of shares (X)(T) = $174,000 / $ / share ($share($Y) at time of settlement.settlement). Such shares have not been issued to Mr. Tan. Mr. Tan shall also be eligible for discretionary performance bonus payments; no such bonus has been paid. The Tan Agreement provides for Mr. Tan to be eligible to participate in any incentive compensation established by the Company; no such plan has been established. The Tan Agreement also includes confidentiality obligations to which Mr. Tan must adhere.
91
Chen Bor HannBorHann. On December 29, 2014,2018, we renewed the three-year employment agreement effective and continuing as of January 1, 20162022 with Chen Bor Hann,BorHann, our Secretary (the “Hann Agreement”). Pursuant to the Hann Agreement, Mr. Hann is entitled to an annual base salary of $60,000 and to receive a certain number of our common stock per year calculated in accordance with a formula of (Number of shares (X)(W) = $60,000 / $ / share ($share($Y) at time of settlement.settlement). Such shares have not been issued to Mr. Hann. Mr. Hann shal1 also be eligible for discretionary performance bonus payments; no such bonus has been paid. The Hann Agreement provides for Mr. Hann to be eligible to participate in any incentive compensation established by the Company; no such plan has been established. The Hann Agreement also includes confidentiality obligations to which Mr. Hann must adhere.
General
At no time during the last fiscal year with respect to any person listed in the table above was there:
| • | any outstanding option or other equity-based award re-priced or otherwise materially modified (such as by extension of exercise periods, the change of vesting or forfeiture conditions, the change or elimination of applicable performance criteria, or the change of the bases upon which returns are determined; |
| • | any waiver or modification of any specified performance target, goal or condition to payout with respect to any amount included in non-stock incentive plan compensation or payouts; |
| • | any option or equity grant; |
| • | any non-equity incentive plan award made to a named executive officer |
| • | any nonqualified deferred compensation plans including nonqualified defined contribution plans; or |
| • | any payment for any item that should be included as All Other Compensation in a Summary Compensation Table. |
We have no compensation arrangements (such as fees for retainer, committee service, service as chairman of the board or a committee, and meeting attendance) with directors. Directors did not receive any compensation except for that received as executive officers as set forth above.
| 18. | SECURITY OWNERSHIP OF CERTAIN BENEFICIAL OWNERS AND MANAGEMENT AND RELATED STOCKHOLDER MATTERS |
The following table sets forth certain information concerning the number of shares of our common stock owned beneficially based on 22,726,85960,352,942 issued and outstanding shares of common stock as of December 31, 2016,2020 by: (i) each of our directors; (ii) each of our named executive officers; and (iii) each person or Company known by us to beneficially own more than 5% of our outstanding shares of common stock.
Beneficial ownership is determined in accordance with SEC rules and generally includes voting or investment power with respect to securities. Other than as described in the notes to the table, we believe that all persons named in the table have sole voting and investment power with respect to shares beneficially owned by them. All share ownership figures include shares issuable upon exercise of options or warrants exercisable within 60 days of the date of this Annual Report, which are deemed outstanding and beneficially owned by such person for purposes of computing his or her percentage ownership, but not for purposes of computing the percentage ownership of any other person.
Unless otherwise indicated, the address for each of the officers and directors is c/o Sino Agro Food, Inc., Room 3801, Block A, China Shine Plaza, No. 9 Lin He Xi Road, Tianhe District, Guangzhou City, P.R.C.
| Name and address | Shares of Common Stock | Percent of Common Stock | Shares of Series A Preferred Stock | Percent of Series A Preferred Stock |
Percent of Capital Stock (1) | |||||||||||||||
| Directors and Officers (2): | ||||||||||||||||||||
| Lee Yip Kun Solomon | 2,459,697 | 4.93 | % | 75 | 75 | % | 60.99 | % | ||||||||||||
| Tan PoayTeik | 220,000 | * | 20 | 20 | % | 16.09 | % | |||||||||||||
| Chen BorHann | 82,787 | * | 5 | 5 | % | 4.03 | % | |||||||||||||
| Anthony Soh | 14,887 | * | - - - | 0 | * | |||||||||||||||
| ColanukuduruRavindran | - - - | * | ||||||||||||||||||
| All Officers and Directors as a Company (5 persons) | 2,777,371 | 5.57 | % | 100 | 100 | % | 81.11 | % | ||||||||||||
| 5% or Greater Beneficial Owners | ||||||||||||||||||||
| Iliad Research & Trading, LP (3) | 4,736,292 | 8.67 | % | - - - | 0 | 1.86 | % | |||||||||||||
| Garrett R. D’Alessandro | 2,821,458 | 5.66 | % | - - - | 0 | 1.13 | % | |||||||||||||
| Name and Address | Shares of Common Stock | Percent of Common Stock | Shares of Series A Preferred Stock | Percent of Series A Preferred Stock | Percent of Capital Stock (1) | |||||||||||||||
| Directors and Officers: | ||||||||||||||||||||
| Lee Yip Kun Solomon | 2,459,697 | 10.82 | % | 75 | 75 | % | 62.02 | % | ||||||||||||
| Tan Poay Teik (Peter) | 220,000 | * | % | 20 | 20 | % | 16.19 | % | ||||||||||||
| Chen Bor Hann | 82,787 | * | % | 5 | 5 | % | 4.07 | % | ||||||||||||
| George Yap | 29,774 | * | % | — | 0 | * | ||||||||||||||
| Nils-Erik Sandberg (2) | 421,372 | 1.85 | % | — | 0 | * | ||||||||||||||
| Daniel Ritchey | 161,352 | * | % | — | 0 | * | ||||||||||||||
| Anthony Soh | 14,887 | * | % | — | 0 | * | ||||||||||||||
| All Officers and Directors as a Company (7 persons) | 3,389,869 | 14.91 | % | 100 | 100 | % | 82.98 | % | ||||||||||||
| 5% or Greater Beneficial Owners | ||||||||||||||||||||
| Nordnet Pensionsförsäkring AB (3) | 2,296,348 | 10.1 | % | — | 0 | 2.02 | % | |||||||||||||
| Forsakringsaktiebolaget Avanza Pension (4) | 2,778,385 | 12.23 | % | — | 0 | 2 | % | |||||||||||||
| City National Rochdale, LLC (5) | 1,181,934 | 5.2 | % | — | 0 | 1.04 | % | |||||||||||||
| Euro China Capital AB (6) | 3,663,512 | 16.12 | % | — | 0 | 3.22 | % | |||||||||||||
* Less than one percent
(1)Includes the voting power of the 100 shares of Series A Preferred Stock issued and outstanding, which in the aggregate carry the voting power of eighty percent (80%) of all votes entitled to be voted at any annual or special meeting of shareholders of our company or action by written consent of our shareholders. Each outstanding share of the Series A Preferred Stock shall represent its proportionate share of the 80%, which is allocated to the outstanding shares of Series A Preferred Stock.
(2) Includes 76,949 sharesThe address for each of common stock owned of record by Mr. Sandberg’s spousethe officers and 90,858 shares of common stock owned of record by Ängby Sportklubb,directors is c/o Sino Agro Food, Inc., Room 3801, Block A, China Shine Plaza, No. 9 Lin He Xi Road, Tianhe District, Guangzhou City, P.R.C.
(3)We believe, based on a not-for-profit organization of which Mr. SandbergSchedule 13G filed with the SEC on January 4, 2019, that the reporting person Iliad Management, LLC is the chairmanGeneral Partner of the boardreporting person Iliad. Iliad has rights, under a convertible promissory note, to own an aggregate number of directors. Mr. Sandberg disclaims any beneficial ownership of the shares of common stock held by Ängby Sportklubb.
(3) Carina Tovi is the Chief Executive Officer of Nordnet Pensionsförsäkring AB, whose address is Gustavlundvägen 141, P.O. Box 14095 SE-167 14, Bromma, Sweden.
(4) Annika Saramies is the Chief Executive Officer of Forsakringsaktiebolaget Avanza Pension, whose address is Box 1399, Stockholm, Sweden 11193.
(5) Michael Gozzillo is the Chief Compliance Officer of City National Rochdale, LLC, whose address is 570 Lexington Avenue, New York, NY 10022.
(6) Consists of a note convertible into 3,663,512 shares of our common stock. Fredrik Danielssonstock which, except for a contractual cap on the amount of outstanding shares that Iliad may own, would exceed such a cap. Iliad's current ownership in % of common stocks is 5.47% after the Managing Partnerequivalent of Euro China Capital AB, whose addressUS$200,000.00 in cash and / or shares for repayments during year 2019. Thus, the number of shares of our common stock beneficially owned by Iliad as of 31st December 2019, was 2,736,292 shares, which is Hovslagargatan 5, 114 11 Stockholm, Sweden.5.47% of the 49,963,607shares outstanding on December 31, 2019.
Equity Compensation Plan Information
The following table sets forth certain information as of December 31, 2016,2017, with respect to compensation plans under which the Company’s equity securities are authorized for issuance:
| (a) | (b) | (c) | ||||||||||||||||||||||
Number of securities to be issued upon exercise of outstanding options, warrants and rights | The weighted-average exercise price of outstanding options, warrants and rights | Number of securities remaining available for future issuance under equity compensation plans (excluding securities reflected in column (a)) | (a) | (b) | (c) | |||||||||||||||||||
Number of securities to be issued upon exercise of outstanding options, warrants and rights | The weighted-average exercise price of outstanding options, warrants and rights | Number of securities remaining available for future issuance under equity compensation plans (excluding securities reflected in column (a)) | ||||||||||||||||||||||
| Equity compensation | 1,000,000 | - | 1,000,000 | 1,000,000 | - | 1,000,000 | ||||||||||||||||||
| Plans approved by | ||||||||||||||||||||||||
| Security holders | ||||||||||||||||||||||||
| Equity compensation | None | - | - | None | - | None | ||||||||||||||||||
| Plans not approved | ||||||||||||||||||||||||
| By security holders | ||||||||||||||||||||||||
| Total | 1,000,000 | 1,000,000 | 1,000,000 | 1,000,000 | ||||||||||||||||||||
| 19. | CERTAIN RELATIONSHIPS AND RELATED TRANSACTIONS, AND DIRECTOR INDEPENDENCE |
On December 31, 2015,2019, the Company was indebted to Mr. Lee in the amount of $211,247,$1,165,621, and on December 31, 20162018 is indebted to Mr. Lee in the amount of $2,070,390.$2,046,499. The amounts are unsecured, interest free and have no fixed term of repayment.
| 20. | PRINCIPAL ACCOUNTING FEES AND SERVICES |
(1) Principal Audit Fees
The aggregate fees billed for each of the last two fiscal years for professional services rendered by the principal accountants ECOVIS David Yeung Hong Kong with respect to FYE 2015Zhen Hui CPA (“Ecovis”) and Anthony Kam & Associates Limited with respect to FYE 2014 (“AK&AZHCPA”), for our audit of annual financial statements and review of financial statements included in our quarterly reports or services that are normally provided by the accountant in connection with statutory and regulatory filings or engagements for those fiscal years were:
| Ecovis | 2016 | $ | XXXX | |||||
| Ecovis | 2015 | $ | 180,000 |
| NO AUDITOR (DUE TO COVID-19) | 2020 (Provision) | $ | 180,000 | |||
| NO AUDITOR (DUE TO COVID-19) | 2019 (Provision) | $ | 180,000 |
(2) Audit-Related Fees
The aggregate fees billed in each of the last two fiscal years for assurance and related services by the principal accountants that are reasonably related to the performance of the audit or review of our financial statements and are not reported in the preceding paragraph:
| Ecovis | 2016 | $ | XXXX | |||||
| Ecovis | 2015 | $ | 0 |
| NO AUDITOR (DUE TO COVID-19) | 2020 (provision) | $ | 24,000 | |||
| NO AUDITOR (DUE TO COVID-19) | 2019 (provision) | $ | 24,000 |
PART IV
| 21. | EXHIBITS, FINANCIAL STATEMENT SCHEDULES |
(A)Financial Statements
See index to Financial Statements on Page F-1
(B)Exhibits.
| Code of | ||
| 21 | List of subsidiaries. Incorporated herein by reference to the Registration Statement on Form S-1 filed on September 23, 2013 as Exhibit 21 thereto. | |
| 31.1 | Certification pursuant to Section 302 of the Sarbanes-Oxley Act* |
| 31.2 | ||
| Certification pursuant to Section 302 of the Sarbanes-Oxley Act* | ||
| 32.1 | Certification pursuant to 18 U.S.C. Section 1350, as adopted pursuant to Section 906 of the Sarbanes-Oxley Act of 2002** | |
| 101 .INS | XBRL Instance Document* | |
| 101.SCH | XBRL Taxonomy Extension Schema Document* | |
| 101.CAL | XBRL Taxonomy Calculation Linkbase Document* |
| 101.DEF | XBRL Taxonomy Extension Definition Linkbase Document* | |
| 101.LAB | XBRL Taxonomy Label Linkbase Document* | |
| 101.PRE | XBRL Taxonomy Presentation Linkbase Document* |
* Filed herewith
** Furnished herewith
99
| 22. | FORM 10–K SUMMARY. |
SIGNATURESNone.
SIGNATURES
Pursuant to the requirements of Section 13 or 15(d) of the Securities Exchange Act of 1934, the registrant has duly caused this report to be signed on its behalf by the undersigned thereunto duly authorized.
| SINO AGRO FOOD, INC. | ||
| By: | /s/ LEE YIP KUN SOLOMON | |
Lee Yip Kun Solomon Chief Executive Officer
| ||
and Interim Chief Financial Officer (Principal Executive Officer and Principal Financial Officer) |
Pursuant to the requirements of the Securities Exchange Act of 1934, this Report has been signed below by the following persons on behalf of the registrant and in the capacities and on the dates indicated.
| By: | /s/ LEE YIP KUN SOLOMON | |
Lee Yip Kun Solomon Chief Executive Officer (Principal Executive Officer and Principal Financial Officer) |
| By: | /s/ TAN POAY TEIK | |
Tan Poay Teik Chief Officer, Marketing |
| By: | /s/ CHEN BOR HANN | |
Chen Bor Hann Corporate Secretary |
| By: | /s/ | |
Director |
| By: | /s/ | |
Director |
June 21, 2021 | By: | /s/ |
|
Director |
SINO AGRO FOOD, INC. AND SUBSIDIARIES
CONSOLIDATED FINANCIAL STATEMENTS
SINO AGRO FOOD, INC. AND SUBSIDIARIESPart3 Financial report
INDEX TO CONSOLIDATED FINANCIAL STATEMENTS
![]()
14/F., San Toi Building, 137-139 Connaught Road Central, Hong Kong.
Tel : (852) 2581 7500
Fax : (852) 2581 7588
REPORT OF INDEPENDENT REGISTERED PUBLIC ACCOUNTING FIRM
ToThere is no report from any independent registered public accounting firm for this 2020 financial report due to the BoardCovid-19 events prevented our Hong Kong based auditor to be in China to do inspection at sites and verification of Directors and Stockholders ofour China operations.
Sino Agro Food, Inc.
(Incorporated in the State of Nevada, United States of America)The 2020 financials report is an un-audited financial report.
We have audited the accompanying consolidated balance sheets of Sino Agro Food, Inc. as of December 31, 2016 and 2015, and the related consolidated statements of income and other comprehensive income, stockholders' equity and cash flows for each of the three years in the period ended December 31, 2016. These financial statements are the responsibility of the Company's management. Our responsibility is to express an opinion on these financial statements based on our audits.
We conducted our audits in accordance with the standards of the Public Company Accounting Oversight Board (United States). Those standards require that we plan and perform the audit to obtain reasonable assurance about whether the financial statements are free of material misstatement. An audit includes examining, on a test basis, evidence supporting the amounts and disclosures in the financial statements. An audit also includes assessing the accounting principles used and significant estimates made by management, as well as evaluating the overall financial statement presentation. We believe that our audits provide a reasonable basis for our opinion.
In our opinion, the financial statements referred to above present fairly, in all material respects, the consolidated financial position of Sino Agro Food, Inc. December 31, 2016 and 2015, and the consolidated results of its operations and its cash flows for each of the three years in the period ended December 31, 2016, in conformity with U.S. generally accepted accounting principles.
We also have audited, in accordance with the standards of the Public Company Accounting Oversight Board (United States), Sino Agro Food, Inc.'s internal control over financial reporting as of December 31, 2016, based on criteria established in Internal Control – Integrated Framework issued by the Committee of Sponsoring Organizations of the Treadway Commission (2013 framework) and our report dated March 16, 2017 expressed an unqualified opinion thereon.
![]()
REPORT OF INDEPENDENT REGISTERED PUBLIC ACCOUNTING FIRM
To the Board of Directors and Stockholders of
Sino Agro Food, Inc.
(Incorporated in the State of Nevada, United States of America)
We have audited Sino Agro Food, Inc.’s internal control over financial reporting as of December 31, 2016, based on criteria established in Internal Control – Integrated Framework issued by the Committee of Sponsoring Organizations of the Treadway Commission (2013 framework) (the COSO criteria). Sino Agro Food, Inc.’s management is responsible for maintaining effective internal control over financial reporting, and for its assessment of the effectiveness of internal control over financial reporting included in the accompanying Management’s Annual Report on Internal Control Over Financial Reporting. Our responsibility is to express an opinion on the Company’s internal control over financial reporting based on our audit.
We conducted our audit in accordance with the standards of the Public Company Accounting Oversight Board (United States). Those standards require that we plan and perform the audit to obtain reasonable assurance about whether effective internal control over financial reporting was maintained in all material respects. Our audit included obtaining an understanding of internal control over financial reporting, assessing the risk that a material weakness exists, testing and evaluating the design and operating effectiveness of internal control based on the assessed risk, and performing such other procedures as we considered necessary in the circumstances. We believe that our audit provides a reasonable basis for our opinion.
A company’s internal control over financial reporting is a process designed to provide reasonable assurance regarding the reliability of financial reporting and the preparation of financial statements for external purposes in accordance with generally accepted accounting principles. A company’s internal control over financial reporting includes those policies and procedures that (1) pertain to the maintenance of records that, in reasonable detail, accurately and fairly reflect the transactions and dispositions of the assets of the company; (2) provide reasonable assurance that transactions are recorded as necessary to permit preparation of financial statements in accordance with generally accepted accounting principles, and that receipts and expenditures of the company are being made only in accordance with authorizations of management and directors of the company; and (3) provide reasonable assurance regarding prevention or timely detection of unauthorized acquisition, use, or disposition of the company’s assets that could have a material effect on the financial statements.
Because of its inherent limitations, internal control over financial reporting may not prevent or detect misstatements. Also, projections of any evaluation of effectiveness to future periods are subject to the risk that controls may become inadequate because of changes in conditions, or that the degree of compliance with the policies or procedures may deteriorate.
In our opinion, Sino Agro Food, Inc. maintained, in all material respects, effective internal control over financial reporting as of December 31, 2016, based on the COSO criteria.
We also have audited, in accordance with the standards of the Public Company Accounting Oversight Board (United States), the 2016 consolidated financial statements of Sino Agro Food, Inc. and our report dated March 16, 2017 expressed an unqualified opinion thereon.
| Note | 2016 | 2015 | December 31, | December 31, | ||||||||||||||||||
| (Restated) | Note | 2020 | 2019 | |||||||||||||||||||
| ASSETS | (Unaudited) | (Unaudited) | ||||||||||||||||||||
| Current assets | ||||||||||||||||||||||
| Cash and cash equivalents | 7 | $ | 2,576,058 | $ | 7,229,197 | 5 | $ | 188,846 | $ | 185,895 | ||||||||||||
| Inventories | 8 | 62,592,272 | 62,848,707 | 6 | - | - | ||||||||||||||||
| Costs and estimated earnings in excess of billings on uncompleted contracts | 22 | 740,984 | 1,306,885 | 18 | - | 250,828 | ||||||||||||||||
| Deposits and prepayments | 9 | 84,845,966 | 83,811,929 | 7 | 13,141,301 | 30,130,940 | ||||||||||||||||
| Accounts receivable, net of allowance for doubtful accounts | 10 | 122,912,086 | 135,674,418 | 8 | 32,658,330 | 98,528,589 | ||||||||||||||||
| Other receivables | 11 | 47,120,800 | 59,780,587 | 9 | 82,083,391 | 95,565,377 | ||||||||||||||||
| Total current assets | 320,788,166 | 350,651,723 | 128,071,869 | 224,661,629 | ||||||||||||||||||
| Plant and equipment | ||||||||||||||||||||||
| Non-current assets | ||||||||||||||||||||||
| Plant and equipment, net of accumulated depreciation | 12 | 189,727,227 | 95,238,410 | 10 | 97,879,543 | 103,064,238 | ||||||||||||||||
| Non-currents assets held for sale | 13 | - | 9,020,669 | |||||||||||||||||||
| Construction in progress | 14 | 35,157,213 | 72,788,769 | 11 | - | |||||||||||||||||
| Land use rights, net of accumulated amortization | 15 | 53,673,690 | 58,485,675 | 12 | 52,482,217 | 51,032,928 | ||||||||||||||||
| Total plant and equipment | 278,558,130 | 235,533,523 | ||||||||||||||||||||
| Total non-current assets | 150,361,760 | 154,097,166 | ||||||||||||||||||||
| Other assets | ||||||||||||||||||||||
| Goodwill | 16 | 724,940 | 724,940 | 13 | 724,940 | 724,940 | ||||||||||||||||
| Proprietary technologies, net of accumulated amortization | 17 | 10,090,697 | 10,784,358 | 14 | 6,562,933 | 7,067,753 | ||||||||||||||||
| Interests in unconsolidated investees | 18 | 139,133,443 | - | |||||||||||||||||||
| Long term investments | 19 | 720,773 | 769,941 | |||||||||||||||||||
| Interest in unconsolidated investees | 15 | 232,100,046 | 249,344,711 | |||||||||||||||||||
| Temporary deposits paid to entities for investments in Sino joint venture companies | 20 | 15,644,998 | 41,109,708 | 16 | 0 | 17,507,626 | ||||||||||||||||
| Total other assets | 166,314,851 | 53,388,947 | 239,387,919 | 274,645,030 | ||||||||||||||||||
| Total assets | $ | 765,661,147 | $ | 639,574,193 | $ | 517,821,548 | $ | 653,403,825 | ||||||||||||||
| LIABILITIES AND STOCKHOLDERS' EQUITY | ||||||||||||||||||||||
| LIABILITIES AND STOCKHOLDERS’ EQUITY | ||||||||||||||||||||||
| Current liabilities | ||||||||||||||||||||||
| Accounts payable and accrued expenses | $ | 8,789,324 | $ | 9,345,559 | $ | 2,665,149 | $ | 2,590,637 | ||||||||||||||
| Billings in excess of costs and estimated earnings on uncompleted contracts | 22 | 2,630,752 | 8,700,706 | 18 | 0 | 5,386,711 | ||||||||||||||||
| Due to a director | 2,070,390 | 211,247 | ||||||||||||||||||||
| Due to directors | 1,985,040 | 1,165,621 | ||||||||||||||||||||
| Other payables | 23 | 5,962,092 | 4,792,579 | 19 | 36,542,468 | 35,362,580 | ||||||||||||||||
| Borrowings - Short term bank loans | 24 | 2,883,090 | 4,466,040 | |||||||||||||||||||
| Negotiable promissory notes | 25 | 1,113,140 | 865,968 | |||||||||||||||||||
| Income tax payable | 1,130 | - | ||||||||||||||||||||
| Borrowings - Short term bank loan | 20 | - | ||||||||||||||||||||
| Derivative liability | 21 | - | ||||||||||||||||||||
| Convertible note payable | 21 | - | ||||||||||||||||||||
| 23,449,918 | 28,382,099 | 41,192,658 | 44,505,549 | |||||||||||||||||||
| Non-current liabilities | ||||||||||||||||||||||
| Other payables | 23 | 11,192,117 | 4,797,332 | 19 | - | 7,151,762 | ||||||||||||||||
| Borrowings - Long term debts and bank loan | 24 | 5,766,182 | 1,554,902 | 20 | - | |||||||||||||||||
| Convertible note payables | 26 | 21,314,877 | 34,904,739 | |||||||||||||||||||
| 38,273,176 | 41,256,973 | - | 7,151,762 | |||||||||||||||||||
| Commitments and contingencies | - | - | ||||||||||||||||||||
| Stockholders' equity | ||||||||||||||||||||||
| Preferred stock: $0.001 par value (10,000,000 shares authorized, 100 shares issued and outstanding as of December 31, 2016 and 2015, respectively) | ||||||||||||||||||||||
| Series A preferred stock: $0.001 par value (100 shares designated, 100 shares issued and outstanding as of December 31, 2016 and 2015, respectively) | 27 | - | - | |||||||||||||||||||
| Series B convertible preferred stock: $0.001 par value (10,000,000 shares designated, 0 shares issued and outstanding as of December 31, 2016 and 2015, respectively) | 27 | - | - | |||||||||||||||||||
| Series F Non-convertible preferred stock: $0.001 par value (1,000,000 shares designated, 0 shares issued and outstanding as of December 31, 2016 and 2015, respectively) | 27 | - | - | |||||||||||||||||||
| Common stock: $0.001 par value (27,000,000 shares authorized, 22,726,859 and 20,133,757 shares issued and outstanding as of December 31, 2016 and 2015, respectively) | 27 | 22,727 | 20,134 | |||||||||||||||||||
| Stockholders’ equity | ||||||||||||||||||||||
| Common stock: = $0.001 par value (59,963,332 and 51,576,085 shares issued and outstanding as of December 31, 2020 and December 31, 2019, respectively) | 22 | 59,963 | 51,576 | |||||||||||||||||||
| Additional paid - in capital | 155,741,280 | 142,882,173 | 135,664,235 | 133,575,810 | ||||||||||||||||||
| Retained earnings | 454,592,652 | 339,616,638 | 316,408,390 | 448,469,577 | ||||||||||||||||||
| Accumulated other comprehensive income | (4,335,355 | ) | 1,427,638 | -54,997,545 | -59,011,769 | |||||||||||||||||
| Treasury stock | 27 | (1,250,000 | ) | (1,250,000 | ) | -1,250,000 | -1,250,000 | |||||||||||||||
| Total Sino Agro Food, Inc. and subsidiaries stockholders' equity | 604,771,304 | 482,696,583 | ||||||||||||||||||||
| Total Sino Agro Food, Inc. and subsidiaries stockholders’ equity | 395,885,043 | 521,835,194 | ||||||||||||||||||||
| Non - controlling interest | 99,166,749 | 87,238,538 | 80,743,848 | 79,911,320 | ||||||||||||||||||
| Total stockholders' equity | 703,938,053 | 569,935,121 | ||||||||||||||||||||
| Total liabilities and stockholders' equity | $ | 765,661,147 | $ | 639,574,193 | ||||||||||||||||||
| Total stockholders’ equity | 476,628,891 | 601,746,514 | ||||||||||||||||||||
| Total liabilities and stockholders’ equity | $ | 517,821,548 | $ | 653,403,825 | ||||||||||||||||||
The accompanying notes are an integral part of these consolidated financial statements.
CONSOLIDATED STATEMENTS OF INCOME AND OTHER COMPREHENSIVE INCOME
| Note | 2016 | 2015 | 2014 | 2020 | 2019 | |||||||||||||||||
| (Restated) | (Restated) | |||||||||||||||||||||
| Continuing operations | ||||||||||||||||||||||
| Revenue | ||||||||||||||||||||||
| - Sale of goods | $ | 270,788,759 | $ | 251,382,538 | $ | 216,878,194 | $ | - | $ | 133,879,067 | ||||||||||||
| -Leasing & contracting income | 9,892,398 | - | ||||||||||||||||||||
| - Consulting and service income from development contracts | 71,107,794 | 90,374,144 | 80,112,541 | - | 1,719,247 | |||||||||||||||||
| - Commission income | 1,049,199 | 1,892,786 | 1,567,751 | |||||||||||||||||||
| 342,945,752 | 343,649,468 | 298,558,486 | 9,892,398 | 135,598,314 | ||||||||||||||||||
| Cost of goods sold | (211,593,774 | ) | (193,690,885 | ) | (153,828,596 | ) | (113,401,961 | ) | ||||||||||||||
| Cost of Leasing & contracting | (2,324,751 | ) | ||||||||||||||||||||
| Cost of services | (47,415,205 | ) | (57,046,350 | ) | (44,241,900 | ) | 0 | (1,590,017 | ) | |||||||||||||
| Gross profit | 83,936,773 | 92,192,233 | 100,487,990 | 7,567,647 | 20,606,336 | |||||||||||||||||
| General and administrative expenses | (17,196,962 | ) | (17,744,322 | ) | (15,003,317 | ) | -5,954,010 | -13,451,761 | ||||||||||||||
| Net income from operations | 66,739,811 | 75,167,911 | 85,484,673 | 1,613,637 | 7,154,575 | |||||||||||||||||
| Other income (expenses) | ||||||||||||||||||||||
| Other income (expenses) | ||||||||||||||||||||||
| Government grant | 1,787,636 | 2,891,482 | 537,787 | - | 739,283 | |||||||||||||||||
| Sharee of income from unconsolidated equity investee | -28,189,546 | 7,537,498 | ||||||||||||||||||||
| Impairment losses | -104,492,817 | -3,834,658 | ||||||||||||||||||||
| Other income | 318,023 | 483,299 | 443,575 | - | ||||||||||||||||||
| Gain on extinguishment of debts | 4 | - | 132,000 | 270,586 | ||||||||||||||||||
| Non-operating expenses | - | -22,598,607 | ||||||||||||||||||||
| Interest expense | (4,010,699 | ) | (4,269,703 | ) | (761,061 | ) | - | -403,668 | ||||||||||||||
| Net income (expenses) | (1,905,040 | ) | (762,922 | ) | 490,887 | -132,682,363 | -18,560,152 | |||||||||||||||
| Net income before income taxes | 64,834,771 | 74,404,989 | 85,975,560 | -131,068,725 | -11,405,577 | |||||||||||||||||
| Provision for income taxes | 5 | (1,130 | ) | - | - | |||||||||||||||||
| Net income from continuing operations | 64,833,641 | 74,404,989 | 85,975,560 | |||||||||||||||||||
| Net income | (131,068,725 | ) | (11,405,577 | ) | ||||||||||||||||||
| Less: Net (income) loss attributable to non - controlling interest | (20,852,875 | ) | (23,804,038 | ) | (19,691,934 | ) | (992,462 | ) | 1,063,310 | |||||||||||||
| Net income from continuing operations attributable to Sino Agro Food, Inc. and subsidiaries | 43,980,766 | 50,600,951 | 66,283,626 | |||||||||||||||||||
| Discontinued operations | ||||||||||||||||||||||
| Net income from discontinued operations | 6 | 14,869,216 | 17,354,003 | 28,237,632 | ||||||||||||||||||
| Net gain from disposal of subsidiaries, TRW and JFD | 6 | 56,947,005 | - | - | ||||||||||||||||||
| Less: Net (income) loss attributable to the non - controlling interest | 6 | (820,973 | ) | (1,599,424 | ) | (2,456,648 | ) | |||||||||||||||
| Net income of discontinued operations attributable to the Sino Agro Food, Inc. and subsidiaries | 70,995,248 | 15,754,579 | 25,780,984 | |||||||||||||||||||
| Net income attributable to the Sino Agro Food, Inc. and subsidiaries | 114,976,014 | 66,355,530 | 92,064,610 | |||||||||||||||||||
| Other comprehensive (loss) income - Foreign currency translation (loss) income | (7,576,607 | ) | (6,540,619 | ) | 291,215 | |||||||||||||||||
Net income attributable to Sino Agro Food Inc. and subsidiaries | (132,061,187 | ) | (10,342,267 | ) | ||||||||||||||||||
Other comprehensive income (loss) - Foreign currency translation gain (loss) | (435,121 | ) | 3,416,381 | |||||||||||||||||||
| Comprehensive income | 107,399,407 | 59,814,911 | 92,355,825 | (132,496,308 | ) | (6,925,886 | ) | |||||||||||||||
| Less: other comprehensive loss (income) attributable to non - controlling interest | 1,657,383 | 1,515,441 | (98,531 | ) | ||||||||||||||||||
| Comprehensive income attributable to Sino Agro Food, Inc. and subsidiaries | $ | 109,056,790 | $ | 61,330,352 | $ | 92,257,294 | ||||||||||||||||
Less: Other comprehensive (income) loss attributable to non - controlling interest | 159,934 | 915,590 | ||||||||||||||||||||
Comprehensive income attributable to the Sino Agro Food, Inc. and subsidiaries | (132,336,374 | ) | $ | (6,010,296 | ) | |||||||||||||||||
| Earnings per share attributable to Sino Agro Food, Inc. and subsidiaries common stockholders: | ||||||||||||||||||||||
| - from continuing and discontinued operations | ||||||||||||||||||||||
| Basic | 32 | $ | 5.46 | $ | 3.69 | $ | 5.81 | |||||||||||||||
| Diluted | 32 | $ | 5.00 | $ | 3.60 | $ | 5.56 | |||||||||||||||
| Earnings per share attributable to Sino Agro Food, Inc. and subsidiaries common stockholders: | ||||||||||||||||||||||
| - from continuing operations | ||||||||||||||||||||||
Earnings per share attributable to the Sino Agro Food, Inc. and subsidiaries common stockholders: | ||||||||||||||||||||||
| Basic | 32 | $ | 2.09 | $ | 2.81 | $ | 4.18 | (2.24 | ) | $ | (0.21 | ) | ||||||||||
| Diluted | 32 | $ | 1.93 | $ | 2.75 | $ | 4.00 | (2.24 | ) | $ | (0.21 | ) | ||||||||||
| Weighted average number of shares outstanding: | ||||||||||||||||||||||
| Basic | 32 | 21,041,065 | 17,988,619 | 15,847,496 | 58,951,700 | 49,963,607 | ||||||||||||||||
| Diluted | 32 | 23,194,083 | 18,576,241 | 16,554,566 | 58,951,700 | 49,963,607 | ||||||||||||||||
The accompanying notes are an integral part of these consolidated financial statements.
CONSOLIDATED STATEMENTS OF SHAREHOLDERS’ EQUITY
| Series B Convertible | Series F Non Convertible | |||||||||||||||||||||||||||||||
| Common stock | Series A Preferred stock | Preferred stock | Preferred stock | |||||||||||||||||||||||||||||
| Par value $0.001 | Par value $0.001 | Par value $0.001 | Par value $0.001 | |||||||||||||||||||||||||||||
| Number | Nominal | Number | Nominal | Number | Nominal | Number | Nominal | |||||||||||||||||||||||||
| of shares | Amount | of shares | Amount | of shares | Amount | of shares | Amount | |||||||||||||||||||||||||
| $ | $ | $ | $ | |||||||||||||||||||||||||||||
| Balance as of January 1, 2014 | 13,899,196 | 13,899 | 100 | - | 7,000,000 | 7,000 | - | - | ||||||||||||||||||||||||
| Issue of common stock | ||||||||||||||||||||||||||||||||
| - For settlement of debts | 2,734,625 | 2,733 | - | - | - | - | - | - | ||||||||||||||||||||||||
| - Employees' compensation | 530,576 | 531 | - | - | - | - | - | - | ||||||||||||||||||||||||
| Cancellation piecemeal adjustments | (1,681 | ) | (1 | ) | - | - | - | - | - | - | ||||||||||||||||||||||
| Amortize discount - Convertible notes | - | - | - | - | - | |||||||||||||||||||||||||||
| Net income for the year | ||||||||||||||||||||||||||||||||
| - Continuing operations | - | - | - | - | - | - | - | - | ||||||||||||||||||||||||
| - Discontinued operations | - | - | - | - | - | - | - | |||||||||||||||||||||||||
| Foreign currency translation difference | - | - | - | - | - | - | - | - | ||||||||||||||||||||||||
| Balance as of December 31, 2014 | 17,162,716 | 17,162 | 100 | - | 7,000,000 | 7,000 | - | - | ||||||||||||||||||||||||
| Issue of common stock | ||||||||||||||||||||||||||||||||
| - For settlement of debts | 100,000 | 100 | - | - | - | - | - | - | ||||||||||||||||||||||||
| - Employees' compensation | 47,787 | 48 | - | - | - | - | - | - | ||||||||||||||||||||||||
| - Series B convertible preferred stock converted | 707,070 | 707 | - | - | (7,000,000 | ) | (7,000 | ) | - | - | ||||||||||||||||||||||
| - As security for finance raised | 1,888,304 | 1,889 | ||||||||||||||||||||||||||||||
| Reverse split shares adjustments | 227,880 | 228 | - | - | - | - | - | - | ||||||||||||||||||||||||
| Amortize discount - Convertible notes | - | - | - | - | - | - | - | - | ||||||||||||||||||||||||
| Net income for the year | ||||||||||||||||||||||||||||||||
| - Continuing operations | - | - | - | - | - | - | - | - | ||||||||||||||||||||||||
| - Discontinued operations | - | - | - | - | - | - | - | - | ||||||||||||||||||||||||
| Capital contribution from non-controlling interest | - | - | - | - | - | - | - | - | ||||||||||||||||||||||||
| Foreign currency translation difference | - | - | - | - | - | - | - | - | ||||||||||||||||||||||||
| Balance as of December 31, 2015 | 20,133,757 | 20,134 | 100 | - | - | - | - | - | ||||||||||||||||||||||||
| Issue of common stock | ||||||||||||||||||||||||||||||||
| - Employees' and professional compensation | 1,331,855 | 1,332 | - | - | - | - | - | - | ||||||||||||||||||||||||
| - As security for finance raised | 2,461,247 | 2,461 | - | - | - | - | - | - | ||||||||||||||||||||||||
| Shares cancellation | (1,200,000 | ) | (1,200 | ) | - | - | - | - | - | - | ||||||||||||||||||||||
| Net income for the year | - | |||||||||||||||||||||||||||||||
| - Continuing operations | - | - | - | - | - | - | - | - | ||||||||||||||||||||||||
| - Discontinued operations | - | - | - | - | - | - | - | - | ||||||||||||||||||||||||
| Deemed disposal of subsidiaries | - | - | - | - | - | - | - | - | ||||||||||||||||||||||||
| Foreign currency translation difference | - | - | - | - | - | - | - | - | ||||||||||||||||||||||||
| Balance as of December 31, 2016 | 22,726,859 | 22,727 | 100 | - | - | - | - | - | ||||||||||||||||||||||||
| Series B Convertible | Series F Non Convertible | |||||||||||||||||||||||||||||||
| Common stock | Series A Preferred stock | Preferred stock | Preferred stock | |||||||||||||||||||||||||||||
| Par value $0.001 | Par value $0.001 | Par value $0.001 | Par value $0.001 | |||||||||||||||||||||||||||||
| Number of shares | Nominal Amount | Number of shares | Nominal Amount | Number of shares | Nominal Amount | Number of shares | Nominal Amount | |||||||||||||||||||||||||
| $ | $ | $ | $ | |||||||||||||||||||||||||||||
| Balance as of January 1, 2019 | 49,866,174 | 49,866 | 100 | - | - | - | - | - | ||||||||||||||||||||||||
| Issue of common stock | ||||||||||||||||||||||||||||||||
| - Employees’ and professional compensation | - | - | - | - | ||||||||||||||||||||||||||||
| - As security for finance raised | - | - | - | - | ||||||||||||||||||||||||||||
| Redemption of debts | 1,709,911 | 1,710 | - | |||||||||||||||||||||||||||||
| Foreign currency translation difference | - | - | - | - | ||||||||||||||||||||||||||||
| Balance as of December 31, 2019 | 51,576,085 | 51,576 | 100 | - | - | - | - | - | ||||||||||||||||||||||||
| Issue of common stock | ||||||||||||||||||||||||||||||||
| - Employees’ and professional compensation | - | - | - | - | ||||||||||||||||||||||||||||
| - As security for finance raised | - | - | - | - | ||||||||||||||||||||||||||||
| Redemption of debts | 8,387,247 | 8,387 | - | |||||||||||||||||||||||||||||
| Foreign currency translation difference | - | - | - | - | ||||||||||||||||||||||||||||
| Balance as of December 31, 2020 | 59,963,332 | 59,963 | 100 | - | - | - | - | - | ||||||||||||||||||||||||
| Treasury Number of shares | Stock Amount | Additional paid - in capital | Retained earnings | Accumulated other comprehensive income | Non - controlling interest | Total | ||||||||||||||||||||||
| $ | $ | $ | $ | $ | $ | |||||||||||||||||||||||
| Balance as of January 1, 2019 | -101,010 | -1,250,000 | 181,501,056 | 458,811,844 | -10,415,786 | 81,890,220 | 710,587,200 | |||||||||||||||||||||
| Issue of common stock | ||||||||||||||||||||||||||||
| - Employees’ compensation | - | - | 505,283 | - | - | - | 506,993 | |||||||||||||||||||||
| -Adjustment in Triway | -48,430,529 | -48,430,529 | ||||||||||||||||||||||||||
| - As security for finance raised | - | - | - | - | - | 0 | ||||||||||||||||||||||
| Net income for the year | -10,342,267 | -1,063,310 | -11,405,577 | |||||||||||||||||||||||||
| Foreign currency translation difference | - | - | - | - | -48,595,983 | -915,590 | -49,511,573 | |||||||||||||||||||||
| Balance as of December 31, 2019 | -101,010 | -1,250,000 | 133,575,810 | 448,469,577 | -59,011,769 | 79,911,320 | 601,746,514 | |||||||||||||||||||||
| Issue of common stock | ||||||||||||||||||||||||||||
| - Employees’ compensation | - | - | - | - | - | 0 | ||||||||||||||||||||||
| - As security for finance raised | - | - | - | - | - | 0 | ||||||||||||||||||||||
| Redemption of debts | 2,088,425 | 2,088,425 | ||||||||||||||||||||||||||
| Net income for the year | -132,061,187 | 992,462 | -131,068,725 | |||||||||||||||||||||||||
| Foreign currency translation difference | - | - | - | - | 4,014,224 | -159,934 | 3,854,290 | |||||||||||||||||||||
| Balance as of December 31, 2020 | -101,010 | -1,250,000 | 135,664,235 | 316,408,390 | -54,997,545 | 80,743,848 | 476,628,891 | |||||||||||||||||||||
The accompanying notes are an integral part of these consolidated financial statements.
SINO AGRO FOOD, INC. CONSOLIDATED STATEMENTS OF CASH FLOWS
| 2020 | 2019 | |||||||
| Cash flows from operating activities | ||||||||
| Net income (loss) for the year | $ | (131,068,725 | ) | (11,405,577 | ) | |||
| Adjustments to reconcile net income for the year to net cash from operations: | ||||||||
| Depreciation | 5,601,609 | 5,272,630 | ||||||
| Amortization | 2,196,392 | 2,038,612 | ||||||
| Gain on deemed disposal of subsidiaries | ||||||||
| Loss on disposal from a variable interest entity | ||||||||
| Share based compensation costs | - | 643,457 | ||||||
| Other amortized cost arising from convertible notes and others | ||||||||
| Share of unconsolidated equity investee | 28,189,546 | (7,537,498 | ) | |||||
| Changes in operating assets and liabilities: | ||||||||
| Decrease in inventories | - | 54,582,241 | ||||||
| (Increase) decrease in cost and estimated earnings in excess of billings on uncompleted contacts | 250,828 | - | ||||||
| Increase in deposits and prepaid expenses | 34,497,265 | 22,110,250 | ||||||
| (Decrease) increase in due to a director | 819,419 | (883,135 | ) | |||||
| Increase / (decrease) in accounts payable and accrued expenses | 74,512 | (5,689,721 | ) | |||||
| Increase in other payables | (5,971,874 | ) | (7,161,231 | ) | ||||
| Decrease (increase) in accounts receivable | 65,870,259 | 3,123,542 | ||||||
| (Decrease) increase in tax payable | - | |||||||
| Increase (decrease) in billings in excess of costs and estimated earnings on uncompleted contracts | (5,386,711 | ) | 38,418 | |||||
| Decrease in other receivables | 13,481,986 | (67,257,850 | ) | |||||
| Increase in interests in unconsolidated investees | - | 18,912,494 | ||||||
| Net cash provided by operating activities | 8,554,505 | 6,786,632 | ||||||
| Cash flows from investing activities | ||||||||
| Acquisition of plant, property and equipment | - | (351,204 | ) | |||||
| Payment for construction in progress | - | (11,155,410 | ) | |||||
| Proceed from disposal of a long term investee | - | |||||||
| Proceed from disposal of plant, property and equipment | - | - | ||||||
| Net cash used in investing activities | - | (11,506,614 | ) | |||||
| Cash flows from financing activities | ||||||||
| -Proceeds from convertible bond payable | - | - | ||||||
| Capital contribution from non-controlEng interest | - | - | ||||||
| Proceeds from short term debts | - | |||||||
| Long term debts repaid | - | (73,741 | ) | |||||
| Short term bank loan repaid | - | |||||||
| Net cash provided by financing activities | - | (73,741 | ) | |||||
| Effects on exchange rate changes on cash | (8,551,554 | ) | 28,819 | |||||
| (Decrease)/increase in cash and cash equivalents | 2,951 | (4,764,904 | ) | |||||
| Cash and cash equivalents, beginning of year | 185,895 | 4,950,799 | ||||||
| Cash and cash equivalents, end of year | $ | 188,846 | 185,895 | |||||
| Supplementary disclosures of cash flow inforniation: | ||||||||
| Cash paid for interest | $ | - | 388,306 | |||||
| Cash paid for income taxes | $ | - | - | |||||
| Non - cash transactions | ||||||||
| Common stock issued as security for finance raised | $ | - | - | |||||
| Common stock issued for services and compensation | $ | 2,096,812 | 32,973 | |||||
| Transfer construction in progress to property and equipment | $ | - | 12,885,923 | |||||
The accompanying notes are an integral part of these consolidated financial statements.
SINO AGRO FOOD, INC.
CONSOLIDATED STATEMENTS OF SHAREHOLDERS’ EQUITY
| Accumulated | ||||||||||||||||||||||||||||
| Treasury stock | Additional | other | Non - | |||||||||||||||||||||||||
| Number | paid - in | Retained | comprehensive | controlling | ||||||||||||||||||||||||
| of shares | Amount | capital | earnings | income | interest | Total | ||||||||||||||||||||||
| $ | $ | $ | $ | $ | $ | |||||||||||||||||||||||
| Balance as of January 1, 2014 | (101,010 | ) | (1,250,000 | ) | 105,037,379 | 181,196,498 | 6,260,131 | 40,333,463 | 331,598,370 | |||||||||||||||||||
| Issue of common stock | ||||||||||||||||||||||||||||
| - For settlement of debts | - | - | 12,733,054 | - | - | - | 12,735,787 | |||||||||||||||||||||
| - Employees' compensation | - | - | 3,318,913 | - | - | - | 3,319,444 | |||||||||||||||||||||
| Cancellation piecemeal adjustments | - | - | (15,950 | ) | - | - | - | (15,951 | ) | |||||||||||||||||||
| Amortize discount - Convertible notes | - | - | 85,600 | 85,600 | ||||||||||||||||||||||||
| Net income for the year | ||||||||||||||||||||||||||||
| -Continuing operations | - | - | - | 66,283,626 | - | 19,691,934 | 85,975,560 | |||||||||||||||||||||
| -Discontinued operations | - | - | - | 25,780,984 | - | 2,456,648 | 28,237,632 | |||||||||||||||||||||
| Foreign currency translation difference | - | - | - | - | 192,685 | 98,531 | 291,216 | |||||||||||||||||||||
| Balance as of December 31, 2014 | (101,010 | ) | (1,250,000 | ) | 121,158,996 | 273,261,108 | 6,452,816 | 62,580,576 | 462,227,658 | |||||||||||||||||||
| Issue of common stock | ||||||||||||||||||||||||||||
| - For settlement of debts | - | - | 867,900 | - | - | - | 868,000 | |||||||||||||||||||||
| - Employees' compensation | - | - | 726,315 | - | - | - | 726,363 | |||||||||||||||||||||
| - Series B convertible preferred stock converted | - | - | 6,293 | - | - | - | - | |||||||||||||||||||||
| - As security for finance raised | - | - | 17,275,876 | - | - | - | 17,277,765 | |||||||||||||||||||||
| Reverse split shares adjustments | - | - | 2,766,414 | - | - | - | 2,766,642 | |||||||||||||||||||||
| Amortize discount - Convertible notes | - | - | 80,379 | - | - | - | 80,379 | |||||||||||||||||||||
| Capital contribution from non-controlling interest | - | - | - | - | - | 769,941 | 769,941 | |||||||||||||||||||||
| Net income for the year | ||||||||||||||||||||||||||||
| -Continuing operations | - | - | - | 50,600,951 | - | 23,804,038 | 74,404,989 | |||||||||||||||||||||
| -Discontinued operations | - | - | - | 15,754,579 | - | 1,599,424 | 17,354,003 | |||||||||||||||||||||
| Foreign currency translation difference | - | - | - | - | (5,025,178 | ) | (1,515,441 | ) | (6,540,619 | ) | ||||||||||||||||||
| Balance as of December 31, 2015 | (101,010 | ) | (1,250,000 | ) | 142,882,173 | 339,616,638 | 1,427,638 | 87,238,538 | 569,935,121 | |||||||||||||||||||
| Issue of common stock | ||||||||||||||||||||||||||||
| - Employees' compensation | - | - | 7,964,293 | - | - | - | 7,965,625 | |||||||||||||||||||||
| - As security for finance raised | - | - | 10,713,614 | - | - | - | 10,716,075 | |||||||||||||||||||||
| Shares cancellation | - | - | (5,818,800 | ) | - | - | - | (5,820,000 | ) | |||||||||||||||||||
| Net income for the year | ||||||||||||||||||||||||||||
| -Continuing operations | - | - | - | 43,980,766 | - | 20,852,875 | 64,833,641 | |||||||||||||||||||||
| -Discontinued operations | - | - | - | 70,995,248 | 156,231 | 820,973 | 71,972,452 | |||||||||||||||||||||
| Deemed disposal of subsidiaries | - | - | - | - | - | (8,088,254 | ) | (8,088,254 | ) | |||||||||||||||||||
| Foreign currency translation difference | - | - | - | - | (5,919,224 | ) | (1,657,383 | ) | (7,576,607 | ) | ||||||||||||||||||
| Balance as of December 31, 2016 | (101,010 | ) | (1,250,000 | ) | 155,741,280 | 454,592,652 | (4,335,355 | ) | 99,166,749 | 703,938,053 | ||||||||||||||||||
The accompanying notes are an integral part of these consolidated financial statements.
CONSOLIDATED STATEMENTS OF CASH FLOWS
| 2016 | 2015 | 2014 | ||||||||||
| Cash flows from operating activities | ||||||||||||
| Net income for the year | ||||||||||||
| - Continuing operations | $ | 64,833,641 | $ | 74,404,989 | $ | 85,975,560 | ||||||
| - Discontinued operations | 71,816,221 | 17,354,003 | 28,237,632 | |||||||||
| Adjustments to reconcile net income for the year to net cash from operations: | ||||||||||||
| Depreciation | 4,141,629 | 2,866,527 | 2,457,131 | |||||||||
| Amortization | 1,716,228 | 1,950,824 | 2,210,257 | |||||||||
| Gain on deemed disposal of subsidiaries | (56,947,005 | ) | - | - | ||||||||
| Gain on extinguishment of debts | - | (132,000 | ) | (270,586 | ) | |||||||
| Share based compensation costs | 4,345,993 | 363,181 | 659,686 | |||||||||
| Other amortized cost arising from convertible notes and others | 2,589,503 | 5,451,612 | 906,682 | |||||||||
| Changes in operating assets and liabilities: | ||||||||||||
| Decrease increase in inventories | 256,435 | (16,880,714 | ) | (37,819,790 | ) | |||||||
| Decrease (increase) in cost and estimated earnings in excess of billings on uncompleted contacts | 565,901 | (1,306,885 | ) | 663,296 | ||||||||
| (Increase) decrease in deposits and prepaid expenses | (1,055,087 | ) | 4,651,244 | (23,320,658 | ) | |||||||
| (Decrease) increase in due to a director | (7,485,399 | ) | 3,005,115 | 3,488,291 | ||||||||
| (Decrease) increase in accounts payable and accrued expenses | (556,235 | ) | (12,793,276 | ) | 11,083,641 | |||||||
| Increase in other payables | 7,564,298 | 3,691,261 | 13,933,571 | |||||||||
| Decrease (increase) in accounts receivable | 12,762,332 | (31,171,347 | ) | (22,445,129 | ) | |||||||
| Increase in tax payable | 1,130 | - | - | |||||||||
| (Decrease) increase in billings in excess of costs and estimated earnings on uncompleted contracts | (6,069,954 | ) | 640,126 | 4,913,624 | ||||||||
| Increase in amount due from unconsolidated equity investee | (55,120,003 | ) | - | - | ||||||||
| Decrease (increase) in other receivables | 12,659,787 | (7,475,327 | ) | (48,522,489 | ) | |||||||
| Net cash provided by operating activities | 56,019,415 | 44,619,333 | 22,150,719 | |||||||||
| Cash flows from investing activities | ||||||||||||
| Purchases of property and equipment and non-current assets held for sale | (3,112,204 | ) | (4,616,397 | ) | (4,003,588 | ) | ||||||
| Payment for construction in progress | (54,913,543 | ) | (49,532,030 | ) | (26,693,530 | ) | ||||||
| Investments in unconsolidated equity investees | (1,152,640 | ) | - | - | ||||||||
| Net cash outflow from deemed disposal of subsidiaries | - | - | - | |||||||||
| Long term investments | - | - | (817,127 | ) | ||||||||
| Net cash used in investing activities | (59,178,387 | ) | (54,148,427 | ) | (31,514,245 | ) | ||||||
| Cash flows from financing activities | ||||||||||||
| Directors reimbursement for cash originally deposited in due to a director | ||||||||||||
| - Net proceeds from convertible bonds payable | - | 12,867,550 | - | |||||||||
| - Issue of negotiable instrument note | - | 3,854,550 | - | |||||||||
| - Negotiable instrument notes repaid | - | (3,040,000 | ) | - | ||||||||
| Net proceeds from bonds payable | - | - | 7,522,450 | |||||||||
| Bond payable repaid | - | (1,725,000 | ) | - | ||||||||
| Capital contribution from non-controlling interest | - | 769,941 | - | |||||||||
| Proceeds from short term debts | 2,883,090 | 3,849,707 | 4,100,377 | |||||||||
| Proceeds from long term debts | 5,766,182 | - | 2,436,193 | |||||||||
| Long term debts repaid | (2,171,235 | ) | (449,533 | ) | - | |||||||
| Short term bank loan repaid | (3,849,707 | ) | (4,085,635 | ) | (4,100,377 | ) | ||||||
| Payment for cancellation of piecemeal shares | - | - | (15,951 | ) | ||||||||
| Series F Non-convertible preferred stock redemption | - | (3,146,063 | ) | - | ||||||||
| Net cash provided by financing activities | 2,628,330 | 8,895,517 | 9,942,692 | |||||||||
| Effects on exchange rate changes on cash | (4,122,497 | ) | 4,831,327 | 1,125,007 | ||||||||
| (Decrease)/increase in cash and cash equivalents | (4,653,139 | ) | 4,197,750 | 1,704,173 | ||||||||
| Cash and cash equivalents, beginning of year | 7,229,197 | 3,031,447 | 1,327,274 | |||||||||
| Cash and cash equivalents, end of year | $ | 2,576,058 | $ | 7,229,197 | $ | 3,031,447 | ||||||
| Supplementary disclosures of cash flow information: | ||||||||||||
| Cash paid for interest | $ | 1,421,196 | $ | 1,068,710 | $ | 761,299 | ||||||
| Cash paid for income taxes | $ | - | $ | - | $ | - | ||||||
| Non - cash transactions | ||||||||||||
| Common stock issued for settlement of debts | $ | - | $ | 868,000 | $ | 12,735,789 | ||||||
| Common stock issued as security for finance raised | $ | 10,716,076 | - | - | ||||||||
| Common stock purchased for cancellation | $ | (5,820,000 | ) | $ | - | $ | - | |||||
| Common stock issued for services and compensation | $ | 7,965,625 | $ | 726,315 | $ | 3,319,444 | ||||||
| Transfer to land use rights from deposits and prepaid expenses | $ | - | $ | - | $ | 14,393,942 | ||||||
| Transfer construction in progress to property and equipment and non-current held for sale | $ | 88,237,779 | $ | 41,925,482 | $ | 4,453,665 | ||||||
| Transfer deposits and prepaid expenses to property and equipment and non-current assets held for sale | $ | 1,949,106 | $ | 46,194 | $ | 217,264 | ||||||
| Proceeds from convertible bond payable paid to director and applied to operating activities | $ | - | $ | - | $ | 4,110,000 | ||||||
| Transfer to proprietary technologies from deposits and prepaid expenses | $ | - | $ | 17,277,765 | $ | - | ||||||
| Reverse split adjustments | $ | - | $ | 2,766,642 | $ | - | ||||||
| Series B convertible preferred stock convertible into common stock | $ | - | $ | 7,000 | $ | - | ||||||
| Convertible bond adjustments | $ | 14,483,399 | $ | - | $ | - | ||||||
The accompanying notes are an integral part of these consolidated financial statements.
NOTES TO CONSOLIDATED FINANCIAL STATEMENTS
| 1. | CORPORATE INFORMATION |
Sino Agro Food, Inc. (the “Company” or “SIAF”) (formerly known as Volcanic Gold, Inc. and A Power Agro Agriculture Development, Inc.) was incorporated on October 1, 1974 in the State of Nevada, United States of America.
The Company was engaged in the mining and exploration business but ceased its mining and exploring business on October 14, 2005. On August 24, 2007, the Company entered into a Merger and Acquisition Agreement with Capital Award Inc., a Belize corporation (“CA”) and its subsidiaries Capital Stage Inc. (“CS”) and Capital Hero Inc. (“CH”). Effective the same date, CA completed a reverse merger transaction with SIAF. SIAF acquired all the outstanding common stock of CA from Capital Adventure, a shareholder of CA, for 3,232,323 shares of the Company’s common stock.
On August 24, 2007 the Company changed its name from Volcanic Gold, Inc. to A Power Agro Agriculture Development, Inc. On December 8, 2007, the Company changed its name to Sino Agro Food, Inc.
On September 5, 2007, the Company acquired three existing businesses in the People’s Republic of China (the ““P.R.C.”):
| (a) | Hang Yu Tai Investment Limited (“HYT”), a company incorporated in Macau, the owner of 78% equity interest in ZhongXingNongMu Ltd (“ZX”), a company incorporated in the P.R.C.; |
| (b) |
| (c) | Macau Eiji Company Limited (“MEIJI”), a company incorporated in Macau, the owner of 75% equity interest in Enping City Juntang Town Hang Sing Tai Agriculture Co. Ltd. (“HST”), a P.R.C. corporate Sino-Foreign joint venture. HST was dissolved in 2010. |
On November 27, 2007, MEIJI and HST established a corporate Sino - Foreign joint venture, Jiang Men City Heng Sheng Tai Agriculture Development Co. Ltd. (“JHST”), a company incorporated in the P.R.C. with MEIJI owning a 75% interest and HST owning a 25% interest.
On November 26, 2008, SIAF established Pretty Mountain Holdings Limited (“PMH”), a company incorporated in Hong Kong with an 80% equity interest. On May 25, 2009, PMH formed a corporate Sino-Foreign joint venture, Qinghai Sanjiang A Power Agriculture Co. Ltd. (“SJAP”SJAP”), incorporated in the P.R.C., of which PMH owns a 45% equity interest. At the time, the remaining 55% equity interest in SJAP was owned by the following entities:
SJAP is engaged in the business of manufacturing bio-organic fertilizer, livestock feed and development of other agriculture projects in the County of Huangyuan, in the vicinity of the Xining City, Qinghai Province, P.R.C.
In September 2009, the Company carried out an internal reorganization of its corporate structure and business, and formed a 100% owned subsidiary, A Power Agro Agriculture Development (Macau) Limited (“APWAM”), which was formed in Macau. APWAM then acquired PMH’s 45% equity interest in SJAP. By virtue of the acquisition, APWAM assumed all obligations and liabilities of PMH under the Sino Foreign Joint Venture Agreement. On May 7, 2010, Qinghai Sanjiang sold and transferred its equity interest in SJAP to Garwor. The State Administration for Industry and Commerce of Xining City Government of the PRC approved the sale and transfer. As a result, APWAM owned 45% of SJAP and Garwor owned the remaining 55%. This remains the case as of the date of this report (the “Report”).
On September 9, 2010, an application was submitted by the Company to the Companies Registry of Hong Kong for deregistration of PMH under Section 291AA of the Hong Kong Companies Ordinance. On January 28, 2011, PMH was dissolved.dissolved
On March 23, 2018, Qinghai Quanwang Investment Management Company Limited (“Quanwang”) acquired 8.3% equity interest in SJAP for total cash consideration of $459,137. As of December 31, 2019, APWAM owned 41.25% of SJAP, Garwor owned 50.45% and Quanwang owned the remaining 8.3%.
SINO AGRO FOOD, INC.
NOTES TO CONSOLIDATED FINANCIAL STATEMENTS
| 1. | CORPORATE INFORMATION (CONTINUED) |
On February 15, 2011 and March 29, 2011, the Company entered into an agreement and a memorandum of understanding (an “MOU”MOU”), respectively, to sell 100% equity interest in HYT group (including HYT and ZX) to Mr. Xin Ming Sun, a director of ZhongXingNong Nu Co., Ltd for $45,000,000, with effective date of January 1, 2011.
On February 28, 2011, the Company applied to form Enping City Bi Tao A Power Prawn Culture Development Co Limited (“EBAPCD”), and the Company would indirectly own a 25% equity interest in future Sino Joint Venture Company (pending approval).
On February 28, 2011, TRW applied to form a corporate joint venture, Enping City Bi Tao A Power Fishery Development Co., Limited (“EBAPFD”), incorporated in the PRC. TRW owned a 25% equity interest in EBAPFD. On November 17, 2011, TRW formed Jiang Men City A Power Fishery Development Co., Limited (“JFD”) in which it acquired a 25% equity interest, while withdrawing its 25% equity interest in EBAPFD. As of December 31, 2011, the Company had invested for total cash consideration of $1,258,607 in JFD. JFD operates an indoor fish farm. On January 1, 2012, the Company acquired an additional 25% equity interest in JFD for total cash consideration of $1,662,365. As of January 1, 2012, the Company had consolidated the assets and operations of JFD. On April 1, 2012, the Company acquired an additional 25% equity interest in JFD for the total cash consideration of $1,702,580. These acquisitions were at our option according the terms of the original development agreement. The Company owned a 75% equity interest in JFD, representing majority of voting rights and controls its board of directors. On August 15, 2016, anthe acquisition agreement had beenwas executed by and between TRW and its JFD business partners to acquire theirfor acquiring the other 25% equity holding (i.e. non-controlled interest) in JFD which was a Sino Foreign Joint Venture Company, having resulted inCo. that TRW having secured ahad 100% equity interest in JFD as ofwith effect on October 5, 2016. Upon TRW’s acquisitionthe acquisitions of 43 additional prawn farms’farms assets namely Aquafarms 1 through 4, at fair value of US$215.94$238.32 million from respective third parties and the consideration paid to SIAF/CA for both their holdings in the merged aquaculture entities and/or master licensing fees (US$81.37 million) and repayment to SIAF for its assumption of TRW liabilities/obligations (US$43.29 million), the total sum of these arrangements (US$340.53) is scheduled for settlement on or before April 30, 2017 (this date has been from amended from March 31, 2017 in consideration of the regulatory timetable). The settlement will transpire through the issuance of 99,990,000 TRW common sharestechnology license at fair value of $30 million from Capital Award, Inc. by JFD, and the consideration of the above acquisitions were planned to be settled by the new issue shares of 99,990,000 TRW shares at $3.41 per share.amounting to $340.53 million on or before March 31, 2018. As a result, SIAF’s equity positioninterest in TRW now stands atwas diluted from 100% to 23.89% (or, US$124.66 million),with effective on October 5, 2016. As a result of its dispositionThe above transactions leaded the Company loss of control over TRW group, the Company’s investments in TRW the Company’s categorization of its holdings in TRW has beenand JFD were reclassified from a subsidiary to investments in unconsolidated equity investees as of October 5, 2016, and constitutes2016. The dilution of the Company’s investments in TRW group constituted a deemed disposal of the subsidiary.subsidiaries. The deemed gain on disposal of $56,947,005 was recorded in net income from discontinued operations of the consolidated statementstatements of profitincome and loss accountother comprehensive income of the Company for the year ended 31 December 31, 2016. SIAFOn October 1, 2016, the Company took up all assets and all liabilities of TRW and JFD except plant and equipment - fish farm.
The Company converted the amount due from unconsolidated equity investee into equity interest during the fourth quarter of 2018, which resulted in equity interest in TRW from 23.89% to 36.60%
On April 15, 2011, MEIJI applied to form Enping City A Power Cattle Farm Co., Limited (“ECF”), all of which the Company would indirectly own a 25% equity interest on November 17, 2011. On January 1, 2012, the Company had invested $1,076,489 in ECF and the amount was settled in contra against accounts receivable due from ECF. On September 17, 2012 MEIJI formed Jiang Men City Hang Mei Cattle Farm Development Co., Limited (“JHMC”) and acquired additional 50% equity interest for the total cash consideration of $2,944,176 on September 30, 2012 while withdrawing its 25% equity interest in ECF. This acquisition was at our option according to the terms of the original development agreement. The Company presently owns 75% equity interest in JHMC, representing majority of voting right and controls its board of directors. As of September 30, 2012, the Company had consolidated the assets and operations of JHMC. Up toAs of December 31, 2016,2018, MEIJI further invested $400,000total investment in JHMC.JHMC was $4,385,101.
On July 18, 2011, the Company formed Hunan Shenghua A Power Agriculture Co., Limited (“HSA”), in which the Company owns a 26% equity interest, and SJAP owns a 50% equity interest with the Chinese partner owning the remaining 24%. On April 5, 2018, SJAP transfer all of its equity interest to MEIJI. As of December 31, 2016,2018, MEIJI and SJAP total investment in HSA were $857,808 and 629,344, respectively.was $1,651,774.
On November 12, 2013, the Company acquired a shell company, Goldcup9203 AB, incorporated in Sweden, in which the Company owns a 100% equity interest. Goldcup 9203 AB changed its name to Sino Agro Food Sweden AB (publ) (“SAFS”). During the year ended December 31, 2016, SAFS changed to a private company. As of December 31, 2016,2018, the Company invested $77,664 in SAFS. The Company delisted from Merkur Market on 10th September 2019, and subsequently by 31st December 2019 SAFS was dissolved.
SJAP formed Qinghai Zhong He Meat Products Co., Limited (“QZH”QZH”) , with SJAP would owning 100% equity interest. SJAP formed Qinghai Zhong He Meat Products Co., Limited (“QZH”), with SJAP would owning 100% equity interest. On October 25, 2015, both QZH and new stockholder, Qinghai Quanwang Investment Management Co., Ltd (“QQI”) contributed additional capital of $4,157,682 and $769,941, respectively. As a result, SJAP decreased its equity interest from 100% to 85% and QQI owned a 14% equity interest. In addition, according to investment agreement between QZH and QQI, (i) QQI only enjoy interest 6% annually on its capital contribution and did not enjoy profit distribution; (ii) investment period was 3 years only, and (iii) SJAP shared 100% on profit or loss after deduction 6% interest to QQI and enjoyed 100% voting rights of December 31, 2016, the SJAP’s total investmentQZH’s board and stockholders meetings. SJAP disposed its 85% equity interest in QZH for RMB2 (equivalent to $0) for cash and completed on December 30, 2018. As a result, QZH was $4,645,489.derecognized as variable interest entity of the company. On September 30th 2019, Mr. Solomon Lee resigned as the Chairman of SJAP resulting in categorization of SJAP as an Investor in Associate from a subsidiary status.
Up until September 30th 2019, revenues have been generated from activities that the Company divided into five stand-alone business divisions or units: (1) Fishery development (in consulting and services), (2) Cattle & Beef (fully integrated activity), (3) Organic Fertilizer, (4) HU Plantation, and (5) Marketing and Trading.
The fully integrated Cattle and Beef business was gradually being scaled down from year 2016 onward after the China Government relaxed its importation policies to allow many countries (i.e. Australia, NZ, Countries of South America and Canada etc.) to import beef into China affecting its domestic cattle rearing and beef industry. SJAP lost in excessive of US$30 million by year ended December 31st 2017 and by June 30th 2019, it reduced its large fully integrated activity into a small operation keeping and maintaining the production of fertilizer at less than 8,000 MT per year comparing to over 35,000 MT per year in 2015 and the production of concentrated live-stock feed at less than 3000 MT per year compares to over 15,000 MT in 2016 and fattening less than 1500 heads of live cattle at its own farm compares to 2015’s around 25,000 heads of live cattle reared and fattening by 20 corporative farms that consisted over 2,000 individual farmers collectively.
From 1st October 2019 onward, SJAP contracted the said small maintaining operation to its existing management.
The Company currently maintains operations of its services in engineering consulting and specializing in the development of agriculture and aquaculture projects whereas operations of its HU Plantation, Asian “Yellow cattle” demonstration farm, and HSA’s manufacturing of fertilizer were contracted out to their respective farm’s management since 30th September 2019.
The Company is now the investor in two Associates originated from subsidiary status namely SJAP and Tri-way; whereas Tri-way is in the aquaculture segment contracting out it’s aqua-farms’ operations (inclusive Aqua-farm 1, 2 and 3 & b) to respective farm’s managements and JFD, it’s fully owned subsidiary in China, has the sole right to market and distribute the said Aqua-farms’ productions by buying from and selling all fishery productions of the said contracted aqua-farms. Operation of Aqua-farm 4 and 5 of the Zhongshen Mega Farm Development ceased since September 30th 2019 failing the Company’s original ambition to become one of the biggest prawn producers in the world by year end of 2024.
Therefore from 1st October 2019 onward, Revenues of the Company are generated from (i). Incomes derived from CA’s Engineering Consulting and services, (ii). Incomes derived from the contractual agreements of JHST, MEIJI and HSA, (iii). CA’s (or the Corporate) marketing and Trading business and (iv). Incomes generated from its investments in SJAP and Tri-way.
The Company’s principal executive office is located at Room 3801,3520 Block A, China Shine Plaza, No. 9 Lin He Xi Road, Tianhe District, Guangzhou City, Guangdong Province, P.R.C., 510610.
The nature of the operations and principal activities of the Company and its subsidiaries are described in Note 2.2.
SINO AGRO FOOD, INC.
NOTES TO CONSOLIDATED FINANCIAL STATEMENTS
| 2. | SUMMARY OF SIGNIFICANT ACCOUNTING POLICIES |
| 2.1 | FISCAL YEAR |
The Company has adopted December 31 as its fiscal year end.
| 2.2 | REPORTING ENTITIES |
| Name of subsidiaries | Place of incorporation | Percentage of | Principal activities | |||
| Capital Award Inc. (“CA”) | Belize | 100% | Fishery development and holder of A-Power Technology master license. | |||
| Capital | Belize | 100% | Dormant Capital HeroInc. | |||
| Belize | 100% | Dormant | ||||
| Macau Eiji Company Limited (“MEIJI”) | Macau, P.R.C. | 100% | Investment holding, cattle farm development, beef cattle and beef trading | |||
| Sino Agro Food Sweden AB (“SAFS”). | Sweden | 100% (2019 : 100%) directly | Dormant: Dissolved 31st December | |||
| A Power Agro Agriculture Development (Macau) Limited (“APWAM”) | Macau, P.R.C. | 100% | Investment holding | |||
| Jiang Men City Heng Sheng Tai Agriculture Development Co. Ltd (“JHST”) | P.R.C. | 75% | HylocereusUndatus Plantation (“HU Plantation”). | |||
| Jiang Men City Hang Mei Cattle Farm Development Co., Limited (“JHMC”) | P.R.C. | 75% | Beef cattle cultivation | |||
| Hunan Shenghua A Power Agriculture Co., Limited (“HSA”) | P.R.C. | 76% | Manufacturing of organic fertilizer, livestock feed, and beef cattle and sheep cultivation, and plantation of crops and pastures |
| Name of associate (investee) | Place of incorporation | Percentage of interest* | ||||
| Principal activities | ||||||
| Qinghai Sanjiang A Power Agriculture Co., Ltd (“SJAP”) | P.R.C. | Manufacturing of organic fertilizer, livestock feed, and beef cattle | ||||
| Tri-way Industries Limited | Hong Kong, P.R.C. |
| ||||
|
* This represents stockholding percentage of total equity.
In addition, according to investment agreement between QZH and QQI, (i) QQI only enjoyed interest 6% annually on its capital contribution and did not enjoy any profit distribution; (ii) investment period was 3 years only, and (iii) SJAP shared 100% (2015: 100%) on profit or loss after deduction 6% interest to QQI and enjoyed 100% (2015: 100%) voting rights of QZH’s board and stockholders meetings.
SINO AGRO FOOD, INC.
NOTES TO CONSOLIDATED FINANCIAL STATEMENTS
| 2. | SUMMARY OF SIGNIFICANT ACCOUNTING POLICIES (CONTINUED) |
| 2.3 | BASIS OF PRESENTATION |
The consolidated financial statements are prepared in accordance with generally accepted accounting principles in the United States of America (“US GAAP”).
Reverse stock split and new conversion rate of Series B preferred stock to share of common stock on December 16, 2014, the Company implemented a 9.9-for-1 reverse stock split. On December 17, 2014, the Company implemented new conversion rate of 9.9 for 1 share of common stock. All share information contained within this report, including consolidated balance sheets, consolidated statements of income and other comprehensive income, and footnotes have been retroactively adjusted for the effects of reverse stock split and new conversion rate of Series B preferred stock to share of common stock.
| 2.4 | BASIS OF CONSOLIDATION |
The consolidated financial statements include the financial statements of the Company, its subsidiaries CA, CS, CH, TRW, MEIJI, JHST, JFD, JHMC, HSA, APWAM, SAFS and its variable interest entity SJAP and QZH.SJAP. All material inter-company transactions and balances have been eliminated in consolidation. TRD and JFD were derecognized as subsidiaries on October 5, 2016.
SIAF, CA, CS, CH, MEIJI, JHST, JHMC, HSA, APWAM, SAFS, SJAP and QZHSJAP are hereafter referred to as (the “Company”).
| 2.5 | BUSINESS COMBINATION |
The Company adopted the accounting pronouncements relating to business combination (primarily contained in ASC Topic 805 “Business Combinations”), including assets acquired and liabilities assumed on arising from contingencies. These pronouncements established principles and requirement for how the acquirer of a business recognizes and measures in its financial statements the identifiable assets acquired, the liabilities assumed, and any non-controlling interest in the acquisition as well as provides guidance for recognizing and measuring the goodwill acquired in the business combination and determines what information to disclose to enable users of the financial statements to evaluate the nature and financial effects of the business combination. In addition, these pronouncements eliminate the distinction between contractual and non-contractual contingencies, including the initial recognition and measurement criteria and require an acquirer to develop a systematic and rational basis for subsequently measuring and accounting for acquired contingencies depending on their nature. The Company’s adoption of these pronouncements will have an impact on the manner in which it accounts for any future acquisitions.
| 2.6 | NON - CONTROLLING INTEREST IN CONSOLIDATED FINANCIAL STATEMENTS |
The Company adopted the accounting pronouncement on non-controlling interests in consolidated financial statements, which establishes accounting and reporting standards for the non-controlling interest in a subsidiary and for the deconsolidation of a subsidiary. This guidance is primarily contained in ASC Topic “Consolidation.” It clarifies that a non-controlling interest in a subsidiary is an ownership interest in the consolidated financial statements. The adoption of this standard has not had material impact on the Company’s consolidated financial statements.
| 2.7 | USE OF ESTIMATES |
The preparation of consolidated financial statements in conformity with US GAAP requires management to make assumptions and estimates that affect the reported amounts of assets and liabilities and disclosure of contingent assets and liabilities at the dates of the consolidated financial statements and the reported amounts of revenues and expenses during the reporting periods covered thereby. Actual results could differ from these estimates. Judgments and estimates of uncertainties are required in applying the Company’s accounting policies in certain areas. The following are some of the areas requiring significant judgments and estimates: determinations of the useful lives of assets, estimates of allowances for doubtful accounts, cash flow and valuation assumptions in performing asset impairment tests of long-lived assets, estimates of the realization of deferred tax assets and inventory reserves.
SINO AGRO FOOD, INC.
NOTES TO CONSOLIDATED FINANCIAL STATEMENTS
| 2. | SUMMARY OF SIGNIFICANT ACCOUNTING POLICIES (CONTINUED) |
| 2.8 | REVENUE RECOGNITION |
The Company’sIn May 2014, the FASB issued Accounting Standard Update 2014-09, Revenue from Contracts with Customers (Topic 606), which replaces numerous requirements in U.S. GAAP, including industry specific requirements, and provides a single revenue recognition policies are in compliancemodel for recognizing revenue from contracts with ASC 605. Sales revenue is recognized when all of the following have occurred: (i) persuasive evidence of an arrangement exists, (ii) delivery has occurred or services have been rendered, (iii) the price is fixed or determinable, and (iv) the ability to collect is reasonably assured. These criteria are generally satisfied at the time of shipment when risk of loss and title passes to the customer.customers. The Company adopted this standard effective January 1, 2018.
Government grantsThe core principle of the new standard is that a company should recognize revenue to depict the transfer of promised goods or services to customers in an amount that reflects the consideration to which the company expects to be entitled in exchange for those goods or services. This requires companies to identify contractual performance obligations and determine whether revenue should be recognized at a point in time or over time, based on when control of goods and services transfers to a customer. The Company’s revenues generated mainly from trading of frozen food and sales of agricultural products are recognized when (i)at a point in time.
The ASU requires the Company has substantially accomplished what must be done pursuantuse of a new five-step model to the terms of the grant that are established by the local government; and (ii) the Company receives notificationrecognize revenue from the local governmentcustomer contracts. The five-step model requires that the Company has satisfied all(i) identify the contract with the customer, (ii) identify the performance obligations in the contract, (iii) determine the transaction price, including variable consideration to the extent that it is probable that a significant future reversal will not occur, (iv) allocate the transaction price to the respective performance obligations in the contract, and (v) recognize revenue when (or as) the Company satisfies the performance obligation. The application of the requirementsfive-step model to receive the government grants; and (iii)revenue streams compared to the amounts are received.prior guidance did not result in significant changes in the way the Company records its revenues.
Multiple-Element Arrangements
To qualify as a separate unit of accounting under ASC 605-25 “Multiple Element Arrangements”, the delivered item must have value to the customer on a standalone basis. The significant deliverables under the Company’s multiple-element arrangements are consulting and service under development contract, commission and management service.
Revenues from the Company’s consulting and services under development contracts are performed under fixed-price contracts. Revenues under long-term contracts are accounted for under the percentage-of-completion method of accounting in accordance with the Financial Accounting Standards Board (“FASB”) Accounting Standards Codification (“ASC”) Topic 605,Revenue Recognition(“ASC 605”). Under the percentage-of-completionpercentage-of- completion method, the Company estimates profit as the difference between total estimated revenue and total estimated cost of a contract and recognize that profit over the contract term. The percentage of costs incurred determines the amount of revenue to be recognized. Payment terms are generally defined by the installation contract and as a result may not match the timing of the costs incurred by the Company and the related recognition of revenue. Such differences are recorded as either costs or estimated earnings in excess of billings on uncompleted contracts or billings in excess of costs and estimated earnings on uncompleted contracts. The Company determines a customer’s credit worthiness at the time an order is accepted. Sudden and unexpected changes in a customer’s financial condition could put recoverability at risk.
The percentage of completion method requires the ability to estimate several factors, including the ability of the customer to meet its obligations under the contract, including the payment of amounts when due. If the Company determines that collectability is not assured, the Company will defer revenue recognition and use methods of accounting for the contract such as the completed contract method until such time as the Company determines that collectability is reasonably assured or through the completion of the project.
For fixed-price contracts, the Company uses the ratio of costs incurred to date on the contract to management’s estimate of the contract’s total costs, to determine the percentage of completion on each contract. This method is used as management considers expended costs to be the best available measure of progression of these contracts. Contract costs include all direct material, subcontract and labor costs and those indirect costs related to contract performance, such as supplies, tool repairs and depreciation. The Company accounts for maintenance and repair services under the guidance of ASC 605 as the services provided relate to construction work. Contract costs incurred to date and expected total contract costs are continuously monitored during the term of the contract. Changes in job performance, job conditions, and estimated profitability arising from contract penalty, change orders and final contract settlements may result in revisions to the estimated profit ability during the contract. These changes, which include contracts with estimated costs in excess of estimated revenues, are recognized as contract costs in the period in which the revisions are determined. Profit incentives are included in revenues when their realization is reasonably assured. At the point the Company anticipates a loss on a contract, the Company estimates the ultimate loss through completion and recognizes that loss in the period in which the loss was identified.
The Company does not provide warranties to customers on a basis customary to the industry, however, customers can claim warranty directly from product manufacturers for defects in equipment or products. Historically, the Company has experienced no warranty claims.
The Company provides various management services to its customers in the P.R.C. based on a negotiated fixed-price contract. The clients usually pay the fees when the services contract is signed and services are rendered. The Company recognizes these services-based revenues from contracts when (i) management services are rendered; (ii) clients recognize the completion of services; and (iii) collectability is reasonably assured. Fees received in advance are recorded as deferred revenue under current liabilities.
SINO AGRO FOOD, INC.
NOTES TO CONSOLIDATED FINANCIAL STATEMENTS
| 2. | SUMMARY OF SIGNIFICANT ACCOUNTING POLICIES (CONTINUED) |
| 2.9 | COST OF GOODS SOLD AND COST OF SERVICES |
Cost of goods sold consists primarily of direct purchase cost of merchandise goods, and related levies. Cost of services consist primarily direct cost and indirect cost incurred to date for development contracts and provision for anticipated losses for development contracts.
| 2.10 | SHIPPING AND HANDLING |
Shipping and handling costs related to cost of goods sold are included in general and administrative expenses, which totaled $20,160, $31,311$0 and $23,010$156,103 for the years ended December 31, 2016, 20152020 and 2014,2019, respectively.
| 2.11 | ADVERTISING |
Advertising costs are included in general and administrative expenses, which totaled $2,621,537, $2,795,633$0, and $2,379,831$956,056 for the years ended December 31, 2016, 20152020 and 2014,2019, respectively.
| 2.12 | RESEARCH AND DEVELOPMENT EXPENSES |
Research and development expenses are included in general and administrative expenses, which totaled $0, $549,020$0 and $786,261$855,167 for the years ended December 31, 2016, 20152020 and 2014,2019, respectively.
| 2.13 | FOREIGN CURRENCY TRANSLATION AND OTHER COMPREHENSIVE INCOME |
The reporting currency of the Company is the U.S. dollars. The functional currency of the Company is the Chinese Renminbi (RMB).
For those entities whose functional currency is other than the U.S. dollars, all assets and liabilities are translated into U.S. dollars at the exchange rate on the balance sheet date; shareholders’ equity is translated at historical rates and items in the statements of income and of cash flows are translated at the average rate for the period. Because cash flows are translated based on the average translation rate, amounts related to assets and liabilities reported in the statements of cash flows will not necessarily agree with changes in the corresponding balances in the balance sheets. Translation adjustments resulting from this process are included in accumulated other comprehensive income in the statements of shareholders’ equity. Transaction gains and losses that arise from exchange rate fluctuations on transactions denominated in a currency other than the functional currency are included in the statements of income and comprehensive income, as incurred.
Accumulated other comprehensive income in the consolidated statement of shareholders’ equity amounted to $(4,335,355)$ (54,997,545) as of December 31, 20162020 and $1,427,638$(59,011,769) as of December 31, 2015.2019. The balance sheet amounts with the exception of equity as of December 31, 20162020 and December 31, 20152019 were translated using an exchange rate of RMB 6.946.52 to $1.00 and RMB 6.496.98 to $1.00, respectively. The average translation rates applied to the statements of income and other comprehensive income and of cash flows for the years ended December 31, 2016, 20152020 and 20142019 were RMB 6.64 to $1.00, RMB 6.236.90 to $1.00 and RMB 6.14 to6.87to $1.00, respectively.
| 2.14 | CASH AND CASH EQUIVALENTS |
The Company considers all highly liquid securities with original maturities of three months or less when acquired to be cash equivalents. Cash and cash equivalents kept with financial institutions in the P.R.C. are not insured or otherwise protected. Should any of those institutions holding the Company’s cash become insolvent, or should the Company become unable to withdraw funds for any reason, the Company could lose the cash on deposit with that institution.
| 2.15 | ACCOUNTS RECEIVABLE |
The Company maintains reserves for potential credit losses on accounts receivable. Management reviews the composition of accounts receivable and analyzes historical bad debts, customer concentrations, customer credit worthiness, current economic trends and changes in customer payment patterns to evaluate the adequacy of these reserves. Reserves are recorded primarily on a specific identification basis.
The standard credit period for most of the Company’s clients is three months. The collection period over 1 year is classified as long-term accounts receivable. Management evaluates the collectability of the receivables at least quarterly. Provision for doubtful accounts as of December 31, 2016 and December 31, 2015 are $0.
SINO AGRO FOOD, INC.
NOTES TO CONSOLIDATED FINANCIAL STATEMENTS
| 2. | SUMMARY OF SIGNIFICANT ACCOUNTING POLICIES (CONTINUED) |
| 2.16 | INVENTORIES |
Inventories are valued at the lower of cost (determined on a weighted average basis) and net realizable value. Costs incurred in bringing each product to its location and conditions are accounted for as follows:
| (a) | raw materials - purchase cost on a weighted average basis; |
| (b) | manufactured finished goods and work-in-progress - cost of direct materials and labor and a proportion of manufacturing overhead based on normal operation capacity but excluding borrowing costs; and |
| (c) | retail and wholesale merchandise finished goods - purchase cost on a weighted average basis. |
Net realizable value is the estimated selling price in the ordinary course of business, less estimated costs for completion and the estimated costs necessary to make the sale.
| 2.17 | PLANT AND EQUIPMENT |
Plant and equipment are stated at cost less accumulated depreciation and any accumulated impairment losses. Such costs include the cost of replacing parts that are eligible for capitalization when the cost of replacing the parts is incurred. Similarly, when each major inspection is performed, its cost is recognized in the carrying amount of the plant and equipment as a replacement only if it is eligible for capitalization. The assets’ residual values, useful lives and depreciation methods are reviewed, and adjusted if appropriate, at each financial year end.
Depreciation is calculated on a straight-line basis over the estimated useful lives of the assets.
| Plant and machinery | 5 - 10 years | |||
| Structure and leasehold improvements | 10 - | |||
| Mature seeds and herbage cultivation | 20 years | |||
| Furniture and equipment | 2.5 - 10 years | |||
| Motor vehicles | 4 - 10 years |
An item of plant and equipment is removed from the accounts upon disposal or when no future economic benefits are expected to arise from the continued use of the asset. Any gain or loss arising on disposal of the asset (calculated as the difference between the net disposal proceeds and the carrying amount of the item) is included in the consolidated statements of income in the period the item is disposed.
| 2.18 | GOODWILL |
Goodwill is an asset representing the fair economic benefits arising from other assets acquired in a business combination that are not individually identified or separately recognized. Goodwill is tested for impairment on an annual basis at the end of the Company’s fiscal year, or when impairment indicators arise. The Company uses a fair-value-based approach to test for impairment at the level of each reporting unit. The Company directly acquired MEIJI, which is the holding company of JHST that operates the Hu Plantation. As a result of this acquisition, the Company recorded goodwill in the amount of $724,940. This goodwill represents the fair value of the assets acquired in these acquisitions over the cost of the assets acquired.
On October 29, 2014, the Company invested in Huangyuan County Rural Credit Union (“RCU”), Huangyuan County, Xining City, Qinghai Province, the P.R.C. RCU is engaged in the financing and crediting business to agricultural projects for local farmers. The Company has a 5% stake in RCU. The Company has no representative on the board of directors to oversee corporate operations. The Company accounts for its long term investment at cost.
SINO AGRO FOOD, INC.
NOTES TO CONSOLIDATED FINANCIAL STATEMENTS
FOR THE YEARS ENDED DECEMBER 31, 2015 AND 2014
| 2. | SUMMARY OF SIGNIFICANT ACCOUNTING POLICIES (CONTINUED) |
| PROPRIETARY TECHNOLOGIES |
A master license of stock feed manufacturing technology was acquired and the costs of acquisition are capitalized as proprietary technologies when technological feasibility has been established. Cost of acquisition of stock feed manufacturing technology master license is amortized using the straight-line method over its estimated life of 2025 years.
An aromatic cattle-feeding formula was acquired and the costs of acquisition are capitalized as proprietary technologies when technological feasibility has been established. Cost of acquisition on aromatic cattle-feeding formula is amortized using the straight-line method over its estimated life of 2520 years.
The cost of sleepy cods breeding technology license is capitalized as proprietary technologies when technological feasibility has been established. Cost of granting sleepy cods breeding technology license is amortized using the straight-line method over its estimated life of 25 years.
Bacterial cellulose technology license and related trade mark are capitalized as proprietary technologies when technological feasibility has been established. Cost of license and related trade mark is amortized using the straight-line method over its estimated life of 20 years.
The Company has determined that technological feasibility is established at the time a working model of products is completed. Proprietary technologies are intangible assets of finite lives. Management evaluates the recoverability of proprietary technologies on an annual basis at the end of the Company’s fiscal year, or when impairment indicators arise. As required by ASC Topic 350 “Intangible - Goodwill and Other”, the Company uses a fair-value-based approach to test for impairment.
| CONSTRUCTION IN PROGRESS |
Construction in progress represents direct costs of construction as well as acquisition and design fees incurred. Capitalization of these costs ceases and the construction in progress is transferred to property and equipment when substantially all the activities necessary to prepare the assets for their intended use are completed. No depreciation is provided until construction is completed and the asset is ready for its intended use.
| LAND USE RIGHTS |
Land use rights represent acquisition of rights to agricultural land from farmers and are amortized on the straight-line basis over their respective lease periods. The lease period of agricultural land is in the range from 10 to 60 years. Land use rights purchase prices were determined in accordance with the P.R.C. Government’s minimum lease payments on agricultural land and mutually agreed to terms between the Company and the vendors.
| EQUITY METHOD INVESTMENTS |
Investee entities, in which the company can exercise significant influence, but not control, are accounted for under the equity method of accounting. Under the equity method of accounting, the company’s share of the earnings or losses of these companies is included in net income. A loss in value of an investment that is other than a temporary decline is recognized as a charge to operations. Evidence of a loss in value might include, but would not necessarily be limited to absence of an ability to recover the carrying amount of the investment or inability of the investee to sustain an earnings capacity that would justify the carrying amount of the investment.
| CORPORATE JOINT VENTURE |
A corporation formed, owned, and operated by two or more businesses as a separate and discrete business or project (venture) for their mutual benefit is considered to be a corporate joint venture. Investee entities, in which the Company can exercise significant influence, but not control, are accounted for under the equity method of accounting. Under the equity method of accounting, the Company’s share of the earnings or losses of these companies is included in net income.
A loss in value of an investment that is other than a temporary decline is recognized as a charge to operations. Evidence of a loss in value might include, but would not necessarily be limited to, the absence of an ability to recover the carrying amount of the investment or inability of the investee to sustain an earnings capacity that would justify the carrying amount of the investment.
SINO AGRO FOOD, INC.
NOTES TO CONSOLIDATED FINANCIAL STATEMENTS
| 2. | SUMMARY OF SIGNIFICANT ACCOUNTING POLICIES (CONTINUED) |
| VARIABLE INTEREST ENTITY |
A variable interest entity (“VIE”) is an entity (investee) in which the investor has obtained less than a majority interest, according to the Financial Accounting Standards Board (FASB). A VIE is subject to consolidation if a VIE meets one of the following three criteria as elaborated in ASC Topic 810-10, Consolidation:
| (a) | equity-at-risk is not sufficient to support the entity’s activities; |
| (b) | as a group, the equity-at-risk holders cannot control the entity; or |
| (c) | the economics do not coincide with the voting interest. |
If a firm is the primary beneficiary of a VIE, the holdings must be disclosed on the balance sheet. The primary beneficiary is defined as the person or company with the majority of variable interests. A corporation formed, owned, and operated by two or more businesses (ventures) as a separate and discrete business or project (venture) for their mutual benefit is defined as a joint venture.
| TREASURY STOCK |
Treasury stock means shares of a corporation’s own stock that have been issued and subsequently reacquired by the corporation. Converting outstanding shares to treasury shares does not reduce the number of shares issued but does reduce the number of shares outstanding. These shares are not eligible to receive dividends. Accounting for excesses and deficiencies on treasury stock transactions is governed by ASC 505-30-30.
State laws and federal agencies closely regulate transactions involving a company’s own capital stock, so the purchase of outstanding shares must have a legitimate purpose. Some of the most common reasons for purchasing outstanding shares are as follows:
| (a) | to meet additional stock needs for various reasons, including newly implemented stock option plans, stock for convertible bonds or convertible preferred stock, or a stock dividend. |
| (b) | to make more shares available for acquisitions of other entities. |
The cost method of accounting for treasury shares has been adopted by the Company. The purchase of outstanding shares and thus converting them into treasury shares is treated as a temporary reduction in shareholders’ equity in view of the expectation to reissue the shares instead of retiring them. When the Company reissues the treasury shares, the temporary account is eliminated. The cost of acquiring outstanding shares for converting into treasury shares is charged to a contra account, in this case a contra equity account that reduces the stockholder equity balance.
The Company classifies non-current assets and disposal groups as held for sale if their carrying amounts will be recovered principally through a sale rather than through continuing use. Such non-current assets and disposal groups classified as held for sale are measured at the lower of their carrying amount and fair value less costs to sell. The criteria for held for sale classification is regarded as met only when the sale is highly probable and the asset or disposal group is available for immediate sale in its present condition. Property and equipment are not depreciated once classified as held for distribution. Assets and liabilities classified as held for sale are presented separately as current items in the consolidated balance sheets. A disposal group qualifies as discontinued operation if it is a component of an entity that either has been disposed of, or is classified as held for sale, and:
• represents a separate major line of business or geographical area of operations
• is part of a single co-ordinated plan to dispose of a separate major line of business or geographical area of operations, or
• is a subsidiary acquired exclusively with a view to resale
Discontinued operations are excluded from the results of continuing operations and are presented as a single amount as profit or loss after tax from discontinued operations in the consolidated statement of income and other comprehensive income.
SINO AGRO FOOD, INC.
NOTES TO CONSOLIDATED FINANCIAL STATEMENTS
| INCOME TAXES |
The Company accounts for income taxes under the provisions of ASC Topic 740 “Accounting for Income Taxes.” Under ASC Topic 740, deferred tax assets and liabilities are determined based on the difference between the financial statement carrying amounts and the tax bases of assets and liabilities using enacted tax rates in effect in the years in which the differences are expected to reverse.
The provision for income tax is based on the results for the year as adjusted for items, which are non-assessable or disallowed. It is calculated using tax rates that have been enacted or substantively enacted at the balance sheet date. Deferred tax is accounted for using the balance sheet liability method in respect of temporary differences arising from differences between the carrying amount of assets and liabilities in the financial statements and the corresponding tax basis used in the computation of assessable tax profit. In principle, deferred tax liabilities are recognized for all taxable temporary differences, and deferred tax assets are recognized to the extent that it is probable that taxable profit will be available against which deductible temporary differences can be utilized.
Deferred income taxes are calculated at the tax rates that are expected to apply to the period when the asset is realized or the liability is settled. Deferred tax is charged or credited in the income statement, except when it related to items credited or charged directly to equity, in which case the deferred tax is also dealt with in equity. Deferred tax assets and liabilities are offset when they relate to income taxes levied by the same taxation authority and the Company intends to settle its current tax assets and liabilities on a net basis.
ASC Topic 740 also prescribes a more-likely-than-not threshold for financial statement recognition and measurement of a tax position taken, or for one expected to be taken, in a tax return. ASC Topic 740 also provides guidance related to, among other things, classification, accounting for interest and penalties associated with tax positions, and disclosure requirements. Any interest and penalties accrued related to unrecognized tax benefits will be recorded as tax expense.
SINO AGRO FOOD, INC.
NOTES TO CONSOLIDATED FINANCIAL STATEMENTS
| 2. | SUMMARY OF SIGNIFICANT ACCOUNTING POLICIES (CONTINUED) |
| POLITICAL AND BUSINESS RISK |
The Company’s operations are carried out in the P.R.C. Accordingly, the political, economic and legal environment in the P.R.C. may influence the Company’s business, financial condition and results of operations by the general state of the P.R.C.’s economy. The Company’s operations in the P.R.C. are subject to specific considerations and significant risks not typically associated with companies in North America and Western Europe. The Company’s results may be adversely affected by changes in governmental policies with respect to laws and regulations, anti-inflationaryanti- inflationary measures, currency conversion and remittance abroad, and rates and methods of taxation, among other things.
| CONCENTRATION OF CREDIT RISK |
Cash includes cash at banks and demand deposits in accounts maintained with banks within the P.R.C. Total cash in these banks as of December 31, 20162019 and 20152018 amounted to $2,395,355$185,895 and $7,022,695,$4,950,799, respectively, none of which is covered by insurance. The Company has not experienced any losses in such accounts and believes it is not exposed to any risks to its cash in bank accounts.
The Company had 5 major customers (A, B, C, D and E) whose business individually represented the following percentages of the Company’s total revenue for the period indicated:
| 2016 | 2015 | 2014 | ||||||||||||||||||
| 2020 | 2019 | |||||||||||||||||||
| Customer A | 17.63 | % | - | % | - | % | 55.14 | % | 32.30 | % | ||||||||||
| Customer B | 10.45 | % | 15.25 | % | 14.24 | % | 24.79 | % | 25.17 | % | ||||||||||
| Customer C | 10.18 | % | - | % | - | % | 20.07 | % | 16.54 | % | ||||||||||
| Customer D | 8.91 | % | 11.09 | % | 6.65 | % | 6.08 | |||||||||||||
| Customer E | 7.07 | % | 12.41 | % | 25.73 | % | - | - | % | |||||||||||
| Customer F | - | % | 9.60 | % | 15.94 | % | 3.62 | % | ||||||||||||
| Customer G | - | % | 8.87 | % | 6.58 | % | ||||||||||||||
| 54.24 | % | 57.22 | % | 69.14 | % | 100 | % | 83.71 | % | |||||||||||
| Percentage of revenue | Amount | Percentage of revenue |
Amount | |||||||||||||||||
| Customer A | Organic Fertilizer and Bread Grass Division | 17.63 | % | $ | 76,578,139 | Organic fertilizer and Bread Grass Division | 55.14 | % | $ | 5,455,188 | ||||||||||
| Customer B | Fishery Development Division | 10.45 | % | $ | 45,394,220 | Cattle Farm Development and HU Plantation Division | 24.79 | % | $ | 2,452,426 | ||||||||||
| Customer C | Fishery Division | 10.18 | % | $ | 44,208,890 | Corporate Division | 20.07 | % | $ | 1,984,784 | ||||||||||
Accounts receivable are derived from revenue earned from customers located primarily in the P.R.C. The Company performs ongoing credit evaluations of customers and has not experienced any material losses to date.
The Company had 5 major customers whose accounts receivable balance individually represented the following percentages of the Company’s total accounts receivable:
| 2016 | 2015 | |||||||||||||||
| 2020 | 2019 | |||||||||||||||
| Customer A | 19.61 | % | 10.12 | % | 44.89 | % | 39.91 | % | ||||||||
| Customer B | 18.11 | % | - | % | 24.45 | % | 16.11 | % | ||||||||
| Customer C | 12.83 | % | - | % | 14.66 | % | 14.66 | % | ||||||||
| Customer D | 7.52 | % | - | % | 10.56 | % | 11.66 | % | ||||||||
| Customer D | 5.96 | % | 11.31 | % | ||||||||||||
| Customer E | - | % | 13.71 | % | 0.02 | % | 8.43 | % | ||||||||
| Customer F | - | % | 9.31 | % | - | % | ||||||||||
| Customer F | - | % | 8.45 | % | ||||||||||||
| 64.03 | % | 52.90 | % | 99.63 | % | 90.77 | % | |||||||||
As of December 31, 2016,2020, amounts due from customers A, B and C are $24,106,909, $22,262,073$14,659,698, $7,985,064 and $15,771,795,$6,438,460 respectively. The Company has not experienced any significant difficulty in collecting its accounts receivable in the past and is not aware of any financial difficulties of its major customers.
SINO AGRO FOOD, INC.
NOTES TO CONSOLIDATED FINANCIAL STATEMENTS
| 2. | SUMMARY OF SIGNIFICANT ACCOUNTING POLICIES (CONTINUED) |
| IMPAIRMENT OF LONG-LIVED ASSETS AND INTANGIBLE ASSETS |
In accordance with ASC Topic 360, “Property, Plant and Equipment,” long-lived assets to be held and used are analyzed for impairment whenever events or changes in circumstances indicate that the related carrying amounts may not be recoverable. The Company reviews the carrying amount of its long-lived assets, including intangibles, for impairment, during each reporting period. An asset is considered impaired when estimated future cash flows are less than the carrying amount of the asset. In the event the carrying amount of such asset is considered not recoverable, the asset is adjusted to its fair value. Fair value is generally determined based on discounted future cash flow. As of December 31, 20162019 and 2015,2018, the Company determined no impairment losses were necessary.
| EARNINGS PER SHARE |
As prescribed in ASC Topic 260 “Earnings per Share,” Basic Earnings per Share (“EPS”) is computed by dividing net income available to common stockholders by the weighted average number of common stock shares outstanding during the year. Diluted EPS is computed by dividing net income available to common stockholders by the weighted-average number of common stock shares outstanding during the year plus potential dilutive instruments such as stock options and warrants. The effect of stock options on diluted EPS is determined through the application of the treasury stock method, whereby proceeds received by the Company based on assumed exercises are hypothetically used to repurchase the Company’s common stock at the average market price during the period.
ASC 260-10-55 requires that stock dividends or stock splits be accounted for retroactively if the stock dividends or stock splits occur during the year, or retroactively if the stock dividends or stock splits occur after the end of the period but before the release of the financial statements, by considering it outstanding of the entirety of each period presented. Dilution is computed by applying the treasury stock method. Under this method, options and warrants are assumed to be exercised at the beginning of the period (or at the time of issuance, if later), and as if funds obtained thereby were used to purchase common stock at the average market price during the year.
For the years ended December 31, 2016, 2015,2020 and 2014,2019, basic earnings (loss) per share attributable to Sino Agro Food, Inc. and subsidiaries common stockholders for continuing and discontinued operations amounted to $5.46, $3.69$(2.24), and $5.81,$(0.21), respectively. For the years ended December 31, 2016, 20152019 and 2014,2018, diluted earnings (loss) per share attributable to Sino Agro Food, Inc. and its subsidiaries’ common stockholders for continuing and discontinued operations amounted to $5.00, $3.60$(2.24), and $5.56, respectively.
For the years ended December 31, 2016, 2015, and 2014, basic earnings per share attributable to Sino Agro Food, Inc. and subsidiaries common stockholders for continuing operations amounted to $2.09, $2.81 and $4.18, respectively. For the years ended December 31, 2016, 2015 and 2014, diluted earnings per share attributable to Sino Agro Food, Inc. and its subsidiaries’ common stockholders for continuing operations amounted to $1.93, $2.75 and $4.00,$(0.21), respectively.
| ACCUMULATED OTHER COMPREHENSIVE INCOME |
ASC Topic 220 “Comprehensive Income”Income” establishes standards for reporting and displaying comprehensive income and its components in financial statements. Comprehensive income is defined as the change in stockholders’ equity of a business enterprise during a period from transactions and other events and circumstances from non-owner sources. The comprehensive income for all periods presented includes both the reported net income and net change in cumulative translation adjustments.
| RETIREMENT BENEFIT COSTS |
P.R.C. state managed retirement benefit programs are defined contribution plans and the payments to the plans are charged as expenses when employees have rendered service entitling them to the contribution made by the employer.
| STOCK-BASED COMPENSATION |
The Company has adopted both ASC Topic 718, “Compensation - Stock Compensation” and ASC Topic 505-50, “Equity-Based Payments to Non - Employees” using the fair value method in which an entity issues its equity instruments to acquire goods and services from employees and non-employees.non- employees. Stock compensation for stock granted to non-employees has been determined in accordance with this accounting standard and the accounting standard regarding accounting for equity instruments that are issued to other than employees for acquiring, or in conjunction with selling goods or services, as the fair value of the consideration received or the fair value of equity instruments issued, whichever is more reliably measured. This accounting standard allows the “simplified” method to determine the term of employee options when other information is not available. Under ASC Topic 718 and ASC Topic 505-50, stock compensation expenses is measured at the grant date on the value of the option or restricted stock and is recognized as expenses, less expected forfeitures, over the requisite service period, which is generally the vesting period.
SINO AGRO FOOD, INC.
NOTES TO CONSOLIDATED FINANCIAL STATEMENTS
| 2. | SUMMARY OF SIGNIFICANT ACCOUNTING POLICIES (CONTINUED) |
| FAIR VALUE OF FINANCIAL INSTRUMENTS |
The Company follows paragraph 825-10-50-10 of the FASB Accounting Standards Codification for disclosures about fair value of its financial instruments and paragraph 820-10-35-37 of the FASB Accounting Standards Codification (“Paragraph 820-10-35-37”) to measure the fair value of its financial instruments. Paragraph 820-10-35-37 establishes a framework for measuring fair value under U.S. GAAP, and expands disclosures about fair value measurements. To increase consistency and comparability in fair value measurements and related disclosures, Paragraph 820-10-35-37820-10- 35-37 establishes a fair value hierarchy, which prioritizes the inputs to valuation techniques used to measure fair value into three (3) broad levels. The fair value hierarchy gives the highest priority to quoted prices (unadjusted) in active markets for identical assets or liabilities and the lowest priority to unobservable inputs. The three (3) levels of fair value hierarchy defined by Paragraph 820-10-35-37 are described below:
Level 1 Quoted market prices available in active markets for identical assets or liabilities as of the reporting date.
Level 2 Pricing inputs other than quoted prices in active markets included in Level 1, which are either directly or indirectly observable as of the reporting date.
Level 3 Pricing inputs that are generally observable inputs and not corroborated by market data.
Financial instruments consist principally of cash, accounts receivable, Deposits and prepayments, accounts payable and accrued expenses, other payables, due to a director and income tax payables. The carrying amounts of such financial instruments in the Company’s financial assets and liabilities, such as cash and accrued expenses,accompanying condensed consolidated balance sheet approximate their fair values becausedue to their relatively short-term nature. The Company’s long-term borrowing, promissory notes and convertible notes payable approximates the fair value of such instrument based upon management’s best estimate of interest rates that would be available to the Company for similar financial arrangement at December 31, 2019. It is management's opinion that the Company is not exposed to any significant currency or credit risks arising from these financial instruments.
The Company revalues its derivative liability at every reporting period and recognizes gains or losses in the consolidated statement of income and other comprehensive income that are attributable to the change in the fair value of the short maturity of these instruments.derivative liability. The Company does not have anyhas no other assets or liabilities measured at fair value on a recurring or a non-recurring basis, consequently, the Company did not have any fair value adjustments for assets and liabilities measured at fair value as of December 31, 2015 or December 31, 2014, nor gains or losses are reported in the statements of income and comprehensive income that are attributable to the change in unrealized gains or losses relating to those assets and liabilities still held at the reporting date for the fiscal years ended December 31, 2015, 2014 or 2013.basis.
The Company does not expect any recent accounting pronouncements to have a material effect onIn February 2016, the Company’s financial position, results of operations, or cash flows.
In January 2015, FASB issued ASU No. 2015-01,Income Statement—Extraordinary2016-02, Leases, which aims to make leasing activities more transparent and Unusual Items (Subtopic 225-20): Simplifying Income Statement Presentationcomparable and requires substantially all leases be recognized by Eliminating the Concept of Extraordinary Items.lessees on their balance sheet as a right-of-use asset and corresponding lease liability, including leases currently accounted for as operating leases. This Update eliminates from GAAP the concept of extraordinary items. The amendments in this Update areASU is effective for fiscal years,all interim and interimannual reporting periods within those fiscal years, beginning after December 15, 2015. A reporting entity may apply the amendments prospectively. A reporting entity also may apply the amendments retrospectively to all prior periods presented in the financial statements. Early2018, with early adoption is permitted provided that the guidance is applied from the beginning of the fiscal year of adoption.permitted. The Company does not expectis currently evaluating the impact that the adoption of ASU 2015-01 to2016-02 will have material impact on the Company’sits consolidated financial statements.statements and related disclosures.
In February 2015,June 2018, the FASB issued Accounting Standards Update ("ASU") No. 2015-02,ConsolidationASU 2018-07—Compensation—Stock Compensation (Topic 810)718): AmendmentsImprovements to the Consolidation Analysis.The new consolidation standard changes the way reporting enterprises evaluate whether (a) they should consolidate limited partnerships and similar entities, (b) fees paid to a decision maker or service provider are variable interests in a variable interest entity ("VIE"), and (c) variable interests in a VIE held by related parties of the reporting enterprise require the reporting enterprise to consolidate the VIE. The guidanceNonemployee Share-Based Payment Accounting. This ASU is effective for public business entities for annual and interim periods in fiscal years beginning after December 15, 2015. Early adoption2018, including interim periods within that fiscal year. The Company is allowed, including early adoption in an interim period. A reporting entity may apply a modified retrospective approach by recording a cumulative-effect adjustment to equity as ofcurrently evaluating the beginning ofimpact that the fiscal year of adoption or may apply the amendments retrospectively. The adoption of this ASU 2015-02 did notwill have a material impact on the Company’sits consolidated financial statements.statements and related disclosures.
In April 2015, the Financial Accounting Standards Board (“FASB”) issued Accounting Standards Update (“ASU”) No. 2015-03, which simplifies presentation of debt issuance costs. The amendments in this update require that debt issuance costs related to a recognized debt liability be presented in the balance sheet as a direct deduction from the carrying amount of that debt liability, consistent with debt discounts. ASU No. 2015-03 will be effective for fiscal years beginning after December 15, 2015, with early adoption permitted. The adoption of ASU 2015-03 did not have a material impact on the Company’s consolidated financial statements.
In November 2015, the FASB issued Accounting Standards Update No. 2015-17,Income Taxes (Topic 740): Balance Sheet Classification of Deferred Taxes (ASU 2015-17), which simplifies the presentation of deferred income taxes by requiring deferred tax assets and liabilities be classified as noncurrent on the balance sheet. The updated standard is effective for us beginning on January 1, 2017 with early application permitted as of the beginning of any interim or annual reporting period. The adoption of ASU 2015-17 did not have a material impact on the Company’s consolidated financial statements.
| RECLASSIFICATION |
Certain balances have been reclassified in the December 31, 2018 consolidated balance sheet and the consolidated statement of cash flows on a basis consistent with the financial statements as of and for the year ended December 31, 2019.
SINO AGRO FOOD, INC.
NOTES TO CONSOLIDATED FINANCIAL STATEMENTS
In February 2016, the Financial Accounting Standards Board (FASB) issued Accounting Standards Update No. 2016-02,Leases (Topic 842) (ASU 2016-02), which generally requires companies to recognize operating and financing lease liabilities and corresponding right-of-use assets on the balance sheet. This guidance will be effective for us in the first quarter of 2019 on a modified retrospective basis and early adoption is permitted. We are still evaluating the effect that this guidance will have on our consolidated financial statements and related disclosures.
In March 2016, the FASB issued Accounting Standards Update No. 2016-08,Revenue from Contracts with Customers (Topic 606): Principal versus Agent Considerations (Reporting Revenue Gross versus Net)(ASU 2016-08) which clarifies the implementation guidance on principal versus agent considerations. The guidance includes indicators to assist an entity in determining whether it controls a specified good or service before it is transferred to the customers. This guidance will be effective for us in the first quarter of 2018, with the option to adopt it in the first quarter of 2017. We are still evaluating the effect that this guidance will have on our consolidated financial statements and related disclosures.
In March 2016, the FASB issued Accounting Standards Update No. 2016-09,Compensation-Stock Compensation (Topic 718): Improvement to Employee Share-based Payment Accounting(ASU 2016-09) to simplify the accounting for share-based payment transactions, including the income tax consequences, an option to recognize gross share-based compensation expense with actual forfeitures recognized as they occur, as well as certain classifications on the statement of cash flows. This guidance will be effective for us in the first quarter of 2017, and early adoption is permitted. We are still evaluating the effect that this guidance will have on our consolidated financial statements and related disclosures.
In October 2016, the FASB issued Accounting Standards Update No. 2016-16, Income Taxes (Topic 740): Intra-Entity Transfers Other than Inventory (ASU 2016-16), which requires companies to recognize the income-tax consequences of an intra-entity transfer of an asset other than inventory. This guidance will be effective for us in the first quarter of 2018, with the option to adopt it in the first quarter of 2017. We currently anticipate adopting the new standard effective January 1, 2018, and do not expect the standard to have a material impact on our consolidated financial statements.
In November 2016, the FASB issued Accounting Standards Update No. 2016-18, Statement of Cash Flows (Topic 230): Restricted Cash (ASU 2016-18), which requires companies to include amounts generally described as restricted cash and restricted cash equivalents in cash and cash equivalents when reconciling beginning-of-period and end-of-period total amounts shown on the statement of cash flows. This guidance will be effective for us in the first quarter of 2018 and early adoption is permitted. We are still evaluating the effect that this guidance will have on our consolidated financial statements and related disclosure
Other accounting standards that have been issued or proposed by FASB that do not require adoption until a future date are not expected to have a material impact on the consolidated financial statements upon adoption.
SINO AGRO FOOD, INC.
NOTES TO CONSOLIDATED FINANCIAL STATEMENTS
| 3. | SEGMENT INFORMATION |
The Company establishes standards for reporting information about operating segments on a basis consistent with the Company’s internal organization structure as well as business segments and major customers in consolidated financial statements. The Company operates in five principal reportable segments: Fishery Development Division, HU Plantation Division, Organic Fertilizer and Bread Grass Division, Cattle Farm Development Division and Corporate and Others Division. On October 5, 2016, (i) Jiang Men City A Power Fishery Development Co., Limited (“JFD”) and Tri- Way Industries Limited (“TRW’), part of Fishery Division, were disposed from the Company; and (ii). Capital Award Inc. (“CA”), part of Fishery Development Division, ceased its income from sale of goods - fishery since December 31, 2016. As a result, Fishery Development Division – sale of goods was treated as Discontinued operations. No geographic information is required as all revenue and assets are located in the P.R.C.
| 2016 | ||||||||||||||||||||||||||||||||||||||||||||||||||||
| Continuing operation | Discontinued operation | |||||||||||||||||||||||||||||||||||||||||||||||||||
| Fishery | Organic Fertilizer | Cattle Farm | Fishery | 2020 | ||||||||||||||||||||||||||||||||||||||||||||||||
| Development | HU Plantation | and Bread Grass | Development | Corporate and | Development | Organic Fertilizer | ||||||||||||||||||||||||||||||||||||||||||||||
| Division(1) | Division (2) | Division (3) | Division (4) | others (5) | Division(1) | Total | Fishery Development | HU Plantation | and Bread Grass | Cattle Farm Development | Corporate and | |||||||||||||||||||||||||||||||||||||||||
| Division(1) | Division (2) | Division (3) | Division (4) | others (5) | Total | |||||||||||||||||||||||||||||||||||||||||||||||
| Revenue | $ | 72,156,993 | $ | 13,318,582 | $ | 155,203,534 | $ | 29,837,560 | $ | 72,429,083 | $ | 61,402,763 | $ | 404,348,515 | $ | 0 | 2,452,426 | 5,455,188 | 1,984,784 | 0 | $ | 9,892,398 | ||||||||||||||||||||||||||||||
| Net income (loss) | $ | 22,429,776 | $ | 3,507,783 | $ | 18,416,950 | $ | 2,905,449 | $ | (3,279,192 | ) | $ | 70,995,248 | $ | 114,976,014 | $ | (46,246,083 | ) | 528,110 | 1,476,855 | 819,416 | (88,639,486 | ) | $ | (132,061,187 | ) | ||||||||||||||||||||||||||
| Total assets | $ | 87,688,839 | $ | 47,051,841 | $ | 325,639,821 | $ | 52,267,765 | $ | 253,012,881 | $ | - | $ | 765,661,147 | $ | 133,897,842 | 47,355,810 | 103,086,572 | 33,741,633 | 199,739,691 | $ | 517,821,548 | ||||||||||||||||||||||||||||||
| 2015 | ||||||||||||||||||||||||||||||||||||||||||||||||||||
| Continuing | Discontinued | |||||||||||||||||||||||||||||||||||||||||||||||||||
| operation | operation | |||||||||||||||||||||||||||||||||||||||||||||||||||
| Fishery | Organic Fertilizer | Cattle Farm | Fishery | 2019 | ||||||||||||||||||||||||||||||||||||||||||||||||
| Development | HU Plantation | and Bread Grass | Development | Corporate and | Development | Organic Fertilizer | ||||||||||||||||||||||||||||||||||||||||||||||
| Division(1) | Division (2) | Division (3) | Division (4) | others (5) | Division(1) | Total | Fishery Development | HU Plantation | and Bread Grass | Cattle Farm Development | Corporate and | |||||||||||||||||||||||||||||||||||||||||
| Division(1) | Division (2) | Division (3) | Division (4) | others (5) | Total | |||||||||||||||||||||||||||||||||||||||||||||||
| Revenue | $ | 88,480,956 | $ | 13,674,894 | $ | 164,565,027 | $ | 35,272,834 | $ | 41,655,757 | $ | 85,404,016 | $ | 429,053,484 | $ | 1,719,247 | 4,585,603 | 26,870,196 | 36,191,035 | 66,232,233 | $ | 135,598,314 | ||||||||||||||||||||||||||||||
| Net income (loss) | $ | 31,066,248 | $ | 5,198,917 | $ | 16,669,323 | $ | 2,752,147 | $ | (5,085,684 | ) | $ | 15,754,579 | $ | 66,355,530 | $ | (15,636,840 | ) | (1,963,012 | ) | (3,630,581 | ) | (2,276,309 | ) | 13,164,475 | $ | (10,342,267 | ) | ||||||||||||||||||||||||
| Total assets | $ | 143,408,415 | $ | 54,867,488 | $ | 297,805,297 | $ | 48,258,274 | $ | 86,214,050 | $ | 9,020,669 | $ | 639,574,193 | $ | 62,172,772 | 47,355,810 | 103,086,572 | 84,962,290 | 355,826,381 | $ | 653,403,825 | ||||||||||||||||||||||||||||||
SINO AGRO FOOD, INC.
NOTES TO CONSOLIDATED FINANCIAL STATEMENTS
| 3. | SEGMENT INFORMATION (CONTINUED) |
| 2014 | ||||||||||||||||||||||||||||
| Continuing | Discontinued | |||||||||||||||||||||||||||
| operation | operation | |||||||||||||||||||||||||||
| Fishery | Organic Fertilizer | Cattle Farm | Fishery | |||||||||||||||||||||||||
| Development | HU Plantation | and Bread Grass | Development | Corporate and | Development | |||||||||||||||||||||||
| Division(1) | Division (2) | Division (3) | Division (4) | others (5) | Division(1) | Total | ||||||||||||||||||||||
| Revenue | $ | 76,750,308 | $ | 11,086,275 | $ | 122,041,511 | $ | 32,891,161 | $ | 55,789,231 | $ | 105,775,887 | $ | 404,334,373 | ||||||||||||||
| Net income (loss) | $ | 27,360,538 | $ | 3,852,659 | $ | 27,929,319 | $ | 2,916,940 | $ | 4,224,170 | $ | 25,780,984 | $ | 92,064,610 | ||||||||||||||
| Total assets | $ | 131,155,150 | $ | 53,220,509 | $ | 244,014,073 | $ | 47,753,495 | $ | 49,149,387 | $ | 7,394,275 | $ | 532,686,889 | ||||||||||||||
Note
| (1) | Operated by Capital Award, Inc. (“CA”) |
| (2) | Operated by Jiang Men City Heng Sheng Tai Agriculture Development Co., Limited (“JHST”). |
| (3) | Operated by Qinghai Sanjiang A Power Agriculture Co., Limited (“SJAP”), |
| (4) | Operated by Jiang Men City Hang Mei Cattle Farm Development Co. Limited (“JHMC”) and Macau Eiji Company Limited (“MEIJI”). |
| (5) | Operated by Sino Agro Food, Inc. (“SIAF”) and Sino Agro Food Sweden AB |
SINO AGRO FOOD, INC.
NOTES TO CONSOLIDATED FINANCIAL STATEMENTS
| SEGMENT INFORMATION (CONTINUED) |
Further analysis of revenue:-
| 2020 | |||||||||||||||||
Fishery Development Division | HU Plantation Division | Organic Fertilizer and Bread Grass Division | Cattle Farm Development Division | Corporate and others | Total | ||||||||||||
| Name of entity Capital Award, Inc. (CA) | - | ||||||||||||||||
| Jiang Men City Heng Sheng Tai Agriculture Development Co. Ltd ("JHST") | 2,452,426 | 2,452,426 | |||||||||||||||
| Qinghai Sanjiang A Power Agriculture Co., Ltd ("SJAP") | - | ||||||||||||||||
| Hunan Shenghua A Power Agriculture Co., Limited ("HSA") | 5,455,188 | 5,455,188 | |||||||||||||||
| Macau Eiji Company Limited ("MEIJI") | 1,984,784 | 1,984,784 | |||||||||||||||
| Sino Agro Food, Inc. ("SIAF") | - | - | |||||||||||||||
| Consulting and service income for development contracts Capital Award, Inc. (CA”) | - | ||||||||||||||||
| - | 2,452,426 | 5,455,188 | 1,984,784 | 0 | 9,892,398 | ||||||||||||
Further analysis of revenue:-
| 2019 | |||||||||||||||||
| Fishery Development Division | HU Plantation Division | Organic Fertilizer and Bread Grass Division | Cattle Farm Development Division | Corporate and others | Total | ||||||||||||
| Name of entity Sale of goods Capital Award, Inc. (CA) | - | ||||||||||||||||
| Jiang Men City Heng Sheng Tai Agriculture Development Co. Ltd ("JHST") | 4,585,603 | 4,585,603 | |||||||||||||||
| Qinghai Sanjiang A Power Agriculture Co., Ltd ("SJAP") | 11,286,153 | 11,286,153 | |||||||||||||||
| Hunan Shenghua A Power Agriculture Co., Limited ("HSA") | 15,584,043 | 15,584,043 | |||||||||||||||
| Macau Eiji Company Limited ("MEIJI") | 36,191,035 | 36,191,035 | |||||||||||||||
| Sino Agro Food, Inc. ("SIAF") | 66,232,233 | 66,232,233 | |||||||||||||||
| Consulting and service income for development contracts Capital Award, Inc. (CA”) | 1,719,247 | ||||||||||||||||
| - | |||||||||||||||||
| 1,719,247 | 4,585,603 | 26,870,196 | 36,191,035 | 66,232,233 | 135,598,314 | ||||||||||||
SINO AGRO FOOD, INC.
NOTES TO CONSOLIDATED FINANCIAL STATEMENTS
| 3. | SEGMENT INFORMATION |
Further analysis of cost
| 2020 | ||||||||||||||||||||||||
| Organic | ||||||||||||||||||||||||
| Fertilizer | ||||||||||||||||||||||||
| Fishery | HU | and Bread | Cattle Farm | |||||||||||||||||||||
| Development | Plantation | Grass | Development | Corporate | ||||||||||||||||||||
| Division | Division | Division | Division | others | Total | |||||||||||||||||||
| Name of entity Capital Award, Inc. (CA) | - | - | ||||||||||||||||||||||
| Jiang Men City Heng Sheng Tai Agriculture | 1,751,340 | 1,751,340 | ||||||||||||||||||||||
| Qinghai Sanjiang A Power Agriculture Co., Ltd | ||||||||||||||||||||||||
| Hunan Shenghua A Power Agriculture Co., Limited | - | - | ||||||||||||||||||||||
| Macau Eiji Company Limited ("MEIJI") | 573,410 | 573,410 | ||||||||||||||||||||||
| Sino Agro Food, Inc. (SIAF) | - | - | ||||||||||||||||||||||
| Consulting and service income for development | - | |||||||||||||||||||||||
| - | 1,751,340 | - | 573,410 | - | 2,324,751 | |||||||||||||||||||
Further analysis of revenue:-cost
| 2016 | ||||||||||||||||||||||||||||
| Continuing | Discontinued | |||||||||||||||||||||||||||
| operations | operations | |||||||||||||||||||||||||||
| Organic | ||||||||||||||||||||||||||||
| Fishery | Fertilizer and | Cattle Farm | Fishery | |||||||||||||||||||||||||
| Development | HU Plantation | Bread Grass | Development | Corporate and | Development | |||||||||||||||||||||||
| Division (1) | Division (2) | Division (3) | Division (4) | others (6) | Division (1) | Total | ||||||||||||||||||||||
Name of entity Sale of goods Capital Award, Inc. (“CA”) | $ | - | $ | - | $ | - | $ | - | $ | - | $ | 61,402,763 | $ | 61,402,763 | ||||||||||||||
| Jiang Men City Heng Sheng Tai Agriculture Development Co., Limited (“JHST”) | - | 13,318,582 | - | - | - | - | 13,318,582 | |||||||||||||||||||||
| Hunan Shenghua A Power Agriculture Co., Limited (“HSA”) | - | - | 20,618,734 | - | - | - | 20,618,734 | |||||||||||||||||||||
| Qinghai Sanjiang A Power Agriculture Co., Limited (“SJAP”) | - | - | 45,462,110 | - | - | - | 45,462,110 | |||||||||||||||||||||
| Qinghai Zhong He Meat Products Co., Limited (“QZH”) | - | - | 89,122,690 | - | - | - | 89,122,690 | |||||||||||||||||||||
| Macau Eiji Company Limited (“MEIJI”) | - | - | - | 29,837,560 | - | - | 29,837,560 | |||||||||||||||||||||
| Sino Agro Food, Inc. (“SIAF”) | - | - | - | - | 72,429,083 | - | 72,429,083 | |||||||||||||||||||||
| Consulting and service income for development contracts Capital Award, Inc. (“CA”) | 71,107,794 | - | - | - | - | - | 71,107,794 | |||||||||||||||||||||
| Sino Agro Food, Inc. (“SIAF”) | - | - | - | - | - | - | - | |||||||||||||||||||||
| Commission and management fee Capital Award, Inc. (“CA”) | 1,049,199 | - | - | - | - | - | 1,049,199 | |||||||||||||||||||||
| $ | 72,156,993 | $ | 13,318,582 | $ | 155,203,534 | $ | 29,837,560 | $ | 72,429,083 | $ | 61,402,763 | $ | 404,348,515 | |||||||||||||||
| 2019 | ||||||||||||||||||||||||
| Fishery Development Division | HU Plantation Division | Organic Fertilizer and Bread Grass Division | Cattle Farm Development Division | Corporate and others | Total | |||||||||||||||||||
| Name of entity Sale of goods | ||||||||||||||||||||||||
| Jiang Men City Heng Sheng Tai Agriculture Development Co. Ltd ("JHST") | 3,718,225 | 3,718,225 | ||||||||||||||||||||||
| Qinghai Sanjiang A Power Agriculture Co., Ltd ("SJAP") | 8,262,804 | 8,262,804 | ||||||||||||||||||||||
| Hunan Shenghua A Power Agriculture Co., Limited ("HSA") | 13,271,460 | 13,271,460 | ||||||||||||||||||||||
| Macau Eiji Company Limited ("MEIJI") | 29,284,786 | 29,284,786 | ||||||||||||||||||||||
| Sino Agro Food, Inc. (SIAF) | 58,864,686 | 58,864,686 | ||||||||||||||||||||||
| Consulting and service income for development contracts Capital Award, Inc. (“CA”) | 1,590,017 | |||||||||||||||||||||||
| 1,590,017 | 3,718,225 | 21,534,264 | 29,284,786 | 58,864,686 | 113,401,961 | |||||||||||||||||||
SINO AGRO FOOD, INC.
NOTES TO CONSOLIDATED FINANCIAL STATEMENTS
Further analysis of revenue:-
| 2015 | ||||||||||||||||||||||||||||
| Continuing | Discontinued | |||||||||||||||||||||||||||
| operations | operations | |||||||||||||||||||||||||||
| Organic | ||||||||||||||||||||||||||||
| Fishery | Fertilizer and | Cattle Farm | Fishery | |||||||||||||||||||||||||
| Development | HU Plantation | Bread Grass | Development | Corporate and | Development | |||||||||||||||||||||||
| Division (1) | Division (2) | Division (3) | Division (4) | others (6) | Division (1) | Total | ||||||||||||||||||||||
| Name of entity Sale of goods Capital Award, Inc. (“CA”) | $ | - | $ | - | $ | - | $ | - | $ | - | $ | 85,404,016 | $ | 85,404,016 | ||||||||||||||
| Jiang Men City Heng Sheng Tai Agriculture Development Co., Limited (“JHST”) | - | 13,674,894 | - | - | - | - | $ | 13,674,894 | ||||||||||||||||||||
| Hunan Shenghua A Power Agriculture Co., Limited (“HSA”) | - | - | 19,967,383 | - | - | - | 19,967,383 | |||||||||||||||||||||
| Qinghai Sanjiang A Power Agriculture Co., Limited (“SJAP”) | - | - | 86,973,719 | - | - | - | 86,973,719 | |||||||||||||||||||||
| Qinghai Zhong He Meat Products Co., Limited (“QZH”) | - | - | 57,623,925 | - | - | - | 57,623,925 | |||||||||||||||||||||
| Macau Eiji Company Limited (“MEIJI”) | - | - | - | 35,272,834 | - | - | 35,272,834 | |||||||||||||||||||||
| Sino Agro Food, Inc. (“SIAF”) | - | - | - | - | 37,869,783 | - | 37,869,783 | |||||||||||||||||||||
| Consulting and service income for development contracts Capital Award, Inc. (“CA”) | 86,588,170 | - | - | - | - | - | 86,588,170 | |||||||||||||||||||||
| Sino Agro Food, Inc. (“SIAF”) | - | - | - | - | 3,785,974 | - | 3,785,974 | |||||||||||||||||||||
| Commission and management fee Capital Award, Inc. (“CA”) | 1,892,786 | - | - | - | - | - | 1,892,786 | |||||||||||||||||||||
| $ | 88,480,956 | $ | 13,674,894 | $ | 164,565,027 | $ | 35,272,834 | $ | 41,655,757 | $ | 85,404,016 | $ | 429,053,484 | |||||||||||||||
SINO AGRO FOOD, INC.
NOTES TO CONSOLIDATED FINANCIAL STATEMENTS
Further analysis of revenue (Continued):-
| 2014 | ||||||||||||||||||||||||||||
| Continuing operations | Discontinued operations | |||||||||||||||||||||||||||
| Fishery Development Division (1) | HU Plantation Division (2) | Organic Fertilizer and Bread Grass Division (3) | Cattle Farm Development Division (4) | Corporate and others (6) | Fishery Development Division | Total | ||||||||||||||||||||||
| Name of entity Sale of goods Capital Award, Inc. (“CA”) | $ | - | $ | - | $ | - | $ | - | $ | - | $ | 105,775,887 | $ | 105,775,887 | ||||||||||||||
| Jiang Men City Heng Sheng Tai Agriculture Development Co., Limited (“JHST”) | - | 11,086,275 | - | - | - | - | 11,086,275 | |||||||||||||||||||||
| Hunan Shenghua A Power Agriculture Co., Limited (“HSA”) | - | - | 20,005,179 | - | - | - | 20,005,179 | |||||||||||||||||||||
| Qinghai Sanjiang A Power Agriculture Co., Limited (“SJAP”) | - | - | 88,827,545 | - | - | - | 88,827,545 | |||||||||||||||||||||
| Qinghai Zhong He Meat Products Co., Limited (“QZH”) | - | - | 13,208,787 | - | - | - | 13,208,787 | |||||||||||||||||||||
| Macau Eiji Company Limited (“MEIJI”) | - | - | - | 32,891,161 | - | - | 32,891,161 | |||||||||||||||||||||
| Sino Agro Food, Inc. (“SIAF”) | - | - | - | - | 50,859,247 | - | 50,859,247 | |||||||||||||||||||||
| Consulting and service income for development contracts Capital Award, Inc. (“CA”) | 75,182,557 | - | - | - | - | - | 75,182,557 | |||||||||||||||||||||
| Sino Agro Food, Inc. (“SIAF”) | - | - | - | - | 4,929,984 | - | 4,929,984 | |||||||||||||||||||||
| Commission and management fee Capital Award, Inc. (“CA”) | 1,567,751 | - | - | - | - | - | 1,567,751 | |||||||||||||||||||||
| $ | 76,750,308 | $ | 11,086,275 | $ | 122,041,511 | $ | 32,891,161 | $ | 55,789,231 | 105,775,887 | $ | 404,334,373 | ||||||||||||||||
SINO AGRO FOOD, INC.
NOTES TO CONSOLIDATED FINANCIAL STATEMENTS
Further analysis of cost of goods sold and cost of services:-
COST OF GOODS SOLD
| 2016 | ||||||||||||||||||||||||||||
| Continuing | Discontinued | |||||||||||||||||||||||||||
| operations | operations | |||||||||||||||||||||||||||
| Organic | ||||||||||||||||||||||||||||
| Fishery | HU | Fertilizer and | Cattle Farm | Corporate | Fishery | |||||||||||||||||||||||
| Development | Plantation | Bread Grass | Development | and others | Development | |||||||||||||||||||||||
| Division (1) | Division (2) | Division (3) | Division (4) | (5) | Division (1) | Total | ||||||||||||||||||||||
| Name of entity Sale of goods Capital Award, Inc. (“CA”) | $ | - | $ | - | $ | - | $ | - | $ | - | $ | 45,742,523 | $ | 45,742,523 | ||||||||||||||
| Jiang Men City Heng Sheng Tai Agriculture Development Co., Limited (“JHST”) | - | 6,274,906 | - | - | - | - | 6,274,906 | |||||||||||||||||||||
| Hunan Shenghua A Power Agriculture Co., Limited (“HSA”) | - | - | 12,459,371 | - | - | - | 12,459,371 | |||||||||||||||||||||
| Qinghai Sanjiang A Power Agriculture Co., Limited (“SJAP”) | - | - | 30,553,572 | - | - | - | 30,553,572 | |||||||||||||||||||||
| Qinghai Zhong He Meat Products Co., Limited (“QZH”) | - | - | 70,283,492 | - | - | - | 70,283,492 | |||||||||||||||||||||
| Macau Eiji Company Limited (“MEIJI”) | - | - | - | 28,299,710 | - | - | 28,299,710 | |||||||||||||||||||||
| Sino Agro Food, Inc. (“SIAF”) | - | - | - | - | 63,722,723 | - | 63,722,723 | |||||||||||||||||||||
| $ | - | $ | 6,274,906 | $ | 113,296,435 | $ | 28,299,710 | $ | 63,722,723 | $ | 45,742,523 | $ | 257,336,297 | |||||||||||||||
COST OF SERVICES
| 2016 | ||||||||||||||||||||||||||||
| Continuing | Discontinued | |||||||||||||||||||||||||||
| operation | operation | |||||||||||||||||||||||||||
| Organic | ||||||||||||||||||||||||||||
| Fishery | Fertilizer and | Cattle Farm | Corporate | Fishery | ||||||||||||||||||||||||
| Development | HU Plantation | Bread Grass | Development | and others | Development | |||||||||||||||||||||||
| Division (1) | Division (2) | Division (3) | Division (4) | (5) | Division (1) | Total | ||||||||||||||||||||||
| Name of entity | ||||||||||||||||||||||||||||
| Consulting and service income for development contracts | ||||||||||||||||||||||||||||
| Capital Award, Inc. (“CA”) | $ | 47,415,205 | $ | - | $ | - | $ | - | $ | - | $ | - | $ | 47,415,205 | ||||||||||||||
| Sino Agro Food, Inc. (“SIAF”) | - | - | - | - | - | - | - | |||||||||||||||||||||
| $ | 47,415,205 | $ | - | $ | - | $ | - | $ | - | $ | - | $ | 47,415,205 | |||||||||||||||
SINO AGRO FOOD, INC.
NOTES TO CONSOLIDATED FINANCIAL STATEMENTS
Further analysis of cost of goods sold and cost of services (Continued):-
COST OF GOODS SOLD
| 2015 | ||||||||||||||||||||||||||||
| Continuing operations | Discontinued operations | |||||||||||||||||||||||||||
| Fishery Development Division (1) | HU Plantation Division (2) | Organic Fertilizer and Bread Grass Division (3) | Cattle Farm Development Division (4) | Corporate and others (5) | Fishery Development Division (1) | Total | ||||||||||||||||||||||
| Name of entity Sale of goods Capital Award, Inc. (“CA”) | $ | - | $ | - | $ | - | $ | - | $ | - | $ | 67,152,999 | $ | 67,152,999 | ||||||||||||||
| Jiang Men City Heng Sheng Tai Agriculture Development Co., Limited (“JHST”) | - | 4,382,965 | $ | - | - | - | - | 4,382,965 | ||||||||||||||||||||
| Hunan Shenghua A Power Agriculture Co., Limited (“HSA”) | - | - | 11,510,644 | - | - | 11,510,644 | ||||||||||||||||||||||
| Qinghai Sanjiang A Power Agriculture Co., Limited (“SJAP”) | - | - | 68,719,888 | - | - | 68,719,888 | ||||||||||||||||||||||
| Qinghai Zhong He Meat Products Co., Limited (“QZH”) | - | - | 42,548,711 | - | - | 42,548,711 | ||||||||||||||||||||||
| Macau Eiji Company Limited (“MEIJI”) | - | - | - | 33,403,353 | - | 33,403,353 | ||||||||||||||||||||||
| Sino Agro Food, Inc. (“SIAF”) | - | - | - | - | 33,125,324 | 33,125,324 | ||||||||||||||||||||||
| $ | - | $ | 4,382,965 | $ | 122,779,243 | $ | 33,403,353 | $ | 33,125,324 | $ | 67,152,999 | $ | 260,843,884 | |||||||||||||||
COST OF SERVICES
| 2015 | ||||||||||||||||||||||||||||
| Continuing operations | Discontinued operations | |||||||||||||||||||||||||||
| Fishery Development Division (1) | HU Plantation Division (2) | Organic Fertilizer and Bread Grass Division (3) | Cattle Farm Development Division (4) | Corporate and others (5) | Fishery Development Division (1) | Total | ||||||||||||||||||||||
| Name of entity Consulting and service income for development contracts | ||||||||||||||||||||||||||||
| Capital Award, Inc. (“CA”) | $ | 55,641,537 | $ | - | $ | - | $ | - | $ | - | $ | - | $ | 55,641,537 | ||||||||||||||
| Sino Agro Food, Inc. (“SIAF”) | - | - | - | - | 1,404,813 | - | 1,404,813 | |||||||||||||||||||||
| $ | 55,641,537 | $ | - | $ | - | $ | - | $ | 1,404,813 | $ | - | $ | 57,046,350 | |||||||||||||||
SINO AGRO FOOD, INC.
NOTES TO CONSOLIDATED FINANCIAL STATEMENTS
Further analysis of cost of goods sold and cost of services (Continued):-
COST OF GOODS SOLD
| 2014 | ||||||||||||||||||||||||||||
| Continuing operations | Discontinued operations | |||||||||||||||||||||||||||
| Fishery Development Division (1) | HU Plantation Division(2) | Organic Fertilizer and Bread Grass Division (3) | Cattle Farm Development Division (4) | Corporate and others (6) | Fishery Development Division (1) | Total | ||||||||||||||||||||||
| Name of entity Sale of goods Capital Award, Inc. (“CA”) | $ | - | $ | - | $ | - | $ | - | $ | - | $ | 76,925,056 | $ | 76,925,056 | ||||||||||||||
| Jiang Men City Heng Sheng Tai Agriculture Development Co., Limited (“JHST”) | - | 3,334,857 | - | - | - | 3,334,857 | ||||||||||||||||||||||
| Hunan Shenghua A Power Agriculture Co., Limited (“HSA”) | - | - | 11,261,482 | - | - | 11,261,482 | ||||||||||||||||||||||
| Qinghai Sanjiang A Power Agriculture Co., Limited (“SJAP”) | - | - | 61,871,146 | - | - | - | 61,871,146 | |||||||||||||||||||||
| Qinghai Zhong He Meat Products Co., Limited (“QZH”) | - | - | 9,353,132 | - | - | - | 9,353,132 | |||||||||||||||||||||
| Macau Eiji Company Limited (“MEIJI”) | - | - | - | 31,151,084 | - | - | 31,151,084 | |||||||||||||||||||||
| Sino Agro Food, Inc. (“SIAF”) | - | - | - | - | 36,856,895 | - | 36,856,895 | |||||||||||||||||||||
| $ | - | $ | 3,334,857 | $ | 82,485,760 | $ | 31,151,084 | $ | 36,856,895 | $ | 76,925,056 | $ | 230,753,652 | |||||||||||||||
COST OF SERVICES
| 2014 | ||||||||||||||||||||||||||||
| Continuing operations | Discontinued operations | |||||||||||||||||||||||||||
| Fishery Development Division (1) | HU Plantation Division (2) | Organic Fertilizer and Bread Grass Division (3) | Cattle Farm Development Division (4) | Corporate and others (6) | Fishery Development Division (1) | Total | ||||||||||||||||||||||
| Name of entity Consulting and service income for development contracts | ||||||||||||||||||||||||||||
| Capital Award, Inc. (“CA”) | $ | 39,387,359 | $ | - | $ | - | $ | - | $ | - | $ | - | $ | 39,387,359 | ||||||||||||||
| Sino Agro Food, Inc. (“SIAF”) | - | - | - | - | 4,854,541 | - | 4,854,541 | |||||||||||||||||||||
| $ | 39,387,359 | $ | - | $ | - | $ | - | $ | 4,854,541 | $ | - | $ | 44,241,900 | |||||||||||||||
SINO AGRO FOOD, INC.
NOTES TO CONSOLIDATED FINANCIAL STATEMENTS
The Company executed several agreements with third parties to settle debts by issuance of the Company’s common stock. The shares issued by the Company were valued at the trading price of the stock on the date the shares were issued. Any excess of the fair value of the shares over the carrying cost of the debt has been reported as a gain on the extinguishment of debts of $0, $132,000 and $270,586 has been credited to consolidated statements of income as other income for the years ended December 31, 2016, 2015 and 2014, respectively.
| 2016 | 2015 | 2014 | ||||||||||
| Total amounts of debts to be settled | $ | - | $ | 1,000,000 | $ | 13,006,375 | ||||||
| Less: Aggregate market fair value of 0 (2015: 100,000) (2014: 2,734,626) shares of common stock in exchange of the above debts for debts extinguishment | - | (868,000 | ) | (12,735,789 | ) | |||||||
| Gain on extinguishment of debts | $ | - | $ | 132,000 | $ | 270,586 | ||||||
| 5. | INCOME TAXES |
United States of America
The Company was incorporated in the State of Nevada, in the United States of America. The Company has no trading operations in United States of America and no U.S. corporate tax has been provided for in the consolidated financial statements of the Company.
Undistributed Earnings of Foreign Subsidiaries
The Company intends to use the remaining accumulated and future earnings of foreign subsidiaries to expand operations outside the United States and accordingly, undistributed earnings of foreign subsidiaries are considered to be indefinitely reinvested outside the United States and no provision for
U.S. Federal and State income tax or applicable dividend distribution tax has been provided thereon.
The Company appointed US tax professionals to assist in filing income tax returns for the years ended December 31, 2016 in compliance with US Treasury Internal Revenue Code and we filed our 2015 Tax returns with the Internal Revenue Service (“IRS”) in 2016.
As of December 31, 2016,2020, the Company reviewed its tax position with the assistance US tax professionals and believed that there would be no taxes and no penalties assessed by the IRS in the United States of America.
SINO AGRO FOOD, INC.
NOTES TO CONSOLIDATED FINANCIAL STATEMENTS
| 5. | INCOME TAXES (CONTINUED) |
China
Beginning January 1, 2008, the newThe Enterprise Income Tax (“EIT”) law replaced the existing laws for Domestic Enterprises (“DE’s”DE’s ”)and Foreign Invested Enterprises (“FIE’s”). The new standard EIT rate of 25% replaced the 33% rate currently applicable to both DE’s and FIE’s. The Company is currently evaluating the impact that the new EIT will have on its financial condition. Beginning January 1, 2008, China unified the corporate income tax rule on foreign invested enterprises and domestic enterprises. The unified corporate income tax rate is 25%.
Under new tax legislation in China beginning in January 2008, the agriculture, dairy and fishery sectors are exempt from enterprise income taxes.
No EIT has been provided in the financial statements of SIAF, CA, JHST, JHMC, HSA, SJAP and QZHSJAP since they are exempt from EIT for the years ended December 31, 2016, 20152019 and 20142018 as they are within the agriculture, and cattle sectors.
No EIT has been provided in the financial statements of JFDQZH since they are exempt from EIT for the period ended SeptemberDecember 30, 20162018 (date of de-recognition JFDde- recognition QZH as subsidiary) and for the year ended December 31, 2015 and 2014 as they areit is within the fisherycattle sectors.
Belize
CA, CS and CH are international business companies incorporated in Belize, and are exempt from corporate tax in Belize.
Hong Kong
No Hong Kong profits tax has been provided in the consolidated financial statements of TRW, since these entities did not earn any assessable profits arising in Hong Kong for the period ended September 30, 2016 (date of de-recognition TRW as subsidiary) and for the years ended December 31, 2015 and 2014.
Macau
No Macau Corporate income tax has been provided in the consolidated financial statements of APWAM and MEIJI since these entities did not earn any assessable profits for the years ended December 31, 2016, 20152019 and 2014.2018.
Sweden
Sweden Corporate income tax has been provided at 22% on reported profit for the year ended December 31, 20162019 and 2018 in the consolidated financial statements of SAFS. No Sweden Corporate income tax has been provided in the consolidated financial statements of SAFS since SAFS incurred a tax loss for the years ended December 31, 2015 and 2014.
No deferred tax assets and liabilities are of December 31, 20162019 and 20152018 since there was no difference between the financial statements carrying amounts and the tax bases of assets and liabilities using enacted tax rates in effect in the period in which the differences are expected to reverse.
Provision for income taxes is as follows:
| 2016 | 2015 | 2014 | ||||||||||||||||||
| 2020 | 2019 | |||||||||||||||||||
| SIAF | $ | - | $ | - | $ | - | $ | - | $ | - | ||||||||||
| SAFS | 1,130 | - | - | |||||||||||||||||
| TRW | - | - | - | |||||||||||||||||
| CA, CH and CS | ||||||||||||||||||||
| MEIJI and APWAM | - | - | - | |||||||||||||||||
| JHST, JFD, JHMC, SJAP, QZH and HSA | - | - | - | |||||||||||||||||
| JHST, JHMC, SJAP, QZH and HSA | ||||||||||||||||||||
| $ | 1,130 | $ | - | $ | - | $ | ||||||||||||||
The Company did not recognize any interest or penalties related to unrecognized tax benefits in the years ended December 31, 2016, 20152020 and 2014.2019. The Company had no uncertain positions that would necessitate recording of tax related liability. The Company is subject to examination by the respective tax authorities.
SINO AGRO FOOD, INC.
NOTES TO CONSOLIDATED FINANCIAL STATEMENTS
| 6. | NET |
Historical no longer applicable
On August 15, 2016, an agreement had been executed by and between TRW and its JFD business partners to acquire their 25% equity holding (i.e. non-controlled interest) in JFD, a Sino Foreign Joint Venture Company, having resulted in TRW having secured a 100% equity interest in JFD as of October 5, 2016. Upon TRW’s acquisition of 4 additional prawn farms’ assets, namely Aquafarms 1 through 4, at fair value of US$215.94 million from respective third parties, the consideration paid to SIAF/CA for both their holdings in the merged aquaculture entities and/or master licensing fees (US$81.37 million) and repayment to SIAF for its assumption of TRW liabilities/obligations (US$43.29 million), the total sum of these arrangements (US$340.53) is scheduled for settlement on or before April 30, 2017 (this date has been from amended from March 31, 2017 in consideration of the regulatory timetable). The settlement will transpire through the issuance of 99,990,000 TRW common shares at fair value of $3.41 per share. SIAF’s equity position in TRW now stands at 23.89% (or, US$124.66 million), effective on October 5, 2016. As a result of its disposition of control in TRW, the Company’s categorization of its holdings in TRW has been reclassified from subsidiary to investments in unconsolidated equity investees as of October 5, 2016, and constitutes a deemed disposal of the subsidiary. The deemed gain on disposal of $56,947,005 was recorded in the consolidated statement of profit and loss account of the Company for the year ended December 31, 2016. On October 1, 2016, SIAF took all assets and liabilities of TRW and JFD except plant and equipment - fish farm.
On October 5, 2016, (i) Tri-way Industries Ltd. (“TRW”) and its subsidiary Jiang Men City A Power Fishery Development Co., Limited (“JFD”), part of Fishery Division, were separated from the Company; and (ii) Capital Award Inc. (“CA”), part of Fishery Development Division, ceased its income from sale of their respective goods. The post-tax result of the Fishery Development Division has been disclosed as a discontinued operation in the consolidated statements of income and comprehensive income. Loss of control over TRW and JFD were not subject to business tax of PRC and income tax of PRC and Hong Kong.
| (a) | Net income from discontinued operations | ||||||||||||
| 2016 | 2015 | 2014 | |||||||||||
| Revenue | |||||||||||||
| -Sale of goods | $ | 61,402,763 | $ | 85,404,016 | $ | 105,775,887 | |||||||
| Cost of sales | (45,742,523 | ) | (67,152,999 | ) | (76,925,056 | ) | |||||||
| Gross profit | 15,660,240 | 18,251,017 | 28,850,831 | ||||||||||
| General and administrative expenses | (791,347 | ) | (896,395 | ) | (612,961 | ) | |||||||
| Net income from operations | 14,868,893 | 17,354,622 | 28,237,870 | ||||||||||
| Interest income/(expenses) | 323 | (619 | ) | (238 | ) | ||||||||
| Income before tax from discontinued operations | 14,869,216 | 17,354,003 | 28,237,632 | ||||||||||
| Net gain from deemed disposal of subsidiaries, TRW and JFD | 56,947,005 | - | - | ||||||||||
| Net income before taxes | 71,816,221 | 17,354,003 | 28,237,632 | ||||||||||
| Provision for income taxes | - | - | - | ||||||||||
| Net income from discontinued operations | 71,816,221 | 17,354,003 | 28,237,632 | ||||||||||
| Less: Net income attributable to the non-controlling interest | (820,973 | ) | (1,599,424 | ) | (2,456,648 | ) | |||||||
| Net income from discontinued operations attributable to Sino Agro Food, Inc. and subsidiaries | $ | 70,995,248 | $ | 15,754,579 | $ | 25,780,984 | |||||||
| (b) | Net gain from deemed disposal of subsidiaries due to loss of control over TRW and JFD | ||||||||
| Fair value of interest retained in subsidiaries, TRW and JFD | $ | 81,367,997 | |||||||
| Less Amounts recognized prior to disposal | |||||||||
| Net assets of Tri-Way Industries Limited group | $ | 32,353,015 | |||||||
| Less: Non-controlling interest at disposal | (8,088,254 | ) | 24,264,761 | ||||||
| 57,103,236 | |||||||||
| Cumulative exchange loss in respect of net assets of subsidiaries reclassified from other comprehensive income | (156,231 | ) | |||||||
| Net gain from deemed disposal of subsidiaries, TRW and JFD | $ | 56,947,005 | |||||||
| (c) | Consideration received from deemed disposal of subsidiaries due to loss of control over TRW and JFD | $ | - | ||||||
SINO AGRO FOOD, INC.
NOTES TO CONSOLIDATED FINANCIAL STATEMENTS
| ASSETS | ||||
| Current assets | ||||
| Amount due from SIAF | 23,971,907 | |||
| Total current assets | 23,971,907 | |||
| Non-current assets held for sale | ||||
| - Plant and equipment | 8,381,108 | |||
| Total non-current assets held for sale | 8,381,108 | |||
| Total assets | $ | 32,353,015 | ||
| Net assets of subsidiaries, TRW and JFD as of October 5, 2016 disposed of | $ | 32,353,015 |
As of October 1, 2016, the Company took up all assets and liabilities of TRW and JFD except plant and equipment - fish farm and the net amount is $23,971,907.
| 2016 | 2015 | 2014 | ||||||||||
| Cash flows from operating activities | ||||||||||||
| Net income for the year | $ | 71,816,221 | $ | 17,354,003 | $ | 28,237,632 | ||||||
| Adjustments to reconcile net loss to net cash from operations: | ||||||||||||
| Gain on deemed disposal of subsidiaries | (56,947,005 | ) | - | - | ||||||||
| Changes in operating assets and liabilities: | (8,140,484 | ) | (11,219,136 | ) | (27,299,147 | ) | ||||||
| Net cash provided by operating activities | 6,728,732 | 6,134,867 | 938,485 | |||||||||
| Cash flows from investing activities | ||||||||||||
| Payment for construction in progress | (11,388,334 | ) | - | - | ||||||||
| Acquisition of property, plant and equipment | (324 | ) | (1,629,846 | ) | (848,573 | ) | ||||||
| Net cash used in investing activities | (11,388,658 | ) | (1,629,846 | ) | (848,573 | ) | ||||||
| Increase in cash and cash equivalents | (4,659,926 | ) | 4,505,021 | 89,912 | ||||||||
| Cash and cash equivalents, beginning of period/ year | 4,659,926 | 154,905 | 64,993 | |||||||||
| Cash and cash equivalents, end of period/ year | $ | - | $ | 4,659,926 | $ | 154,905 | ||||||
| Supplementary of disclosures of cash flow information | ||||||||||||
| Cash paid for interest | $ | - | $ | 619 | $ | 238 | ||||||
| Cash paid for income taxes | $ | - | $ | - | - | |||||||
| Non-cash transactions | ||||||||||||
| -Disposal proceeds receivable of sale of subsidiaries, TRW and JFD | - | - | - | |||||||||
| 7. | CASH AND CASH EQUIVALENTS |
| 2016 | 2015 | |||||||
| Cash and bank balances | $ | 2,576,058 | $ | 7,229,197 | ||||
| 2020 | 2019 | |||||||
| Cash and bank balances | $ | 188,846 | $ | 185,895 | ||||
SINO AGRO FOOD, INC.
NOTES TO CONSOLIDATED FINANCIAL STATEMENTS
| 8. | INVENTORIES |
As of December 31, 2016,2020, inventories are as follows:
| 2016 | 2015 | 2020 | 2019 | ||||||||||
| Sleepy cods, prawns, eels and marble goby | $ | 481,509 | $ | 4,053,458 | |||||||||
| Beef and mutton | 13,217,456 | 14,593,458 | |||||||||||
| Bread grass | 2,115,815 | 1,207,260 | $ | ||||||||||
| Beef cattle | 6,814,132 | 7,336,228 | |||||||||||
| Organic fertilizer | 15,901,153 | 10,815,983 | |||||||||||
| Forage for cattle and consumable | 6,536,517 | 8,018,541 | |||||||||||
| Raw materials for bread grass and organic fertilizer | 15,829,424 | 15,440,348 | |||||||||||
| Immature seeds | 1,696,266 | 1,383,431 | |||||||||||
| $ | 62,592,272 | $ | 62,848,707 | - | $ | - | |||||||
| 9. | DEPOSITS AND PREPAYMENTS |
| 2016 | 2015 | |||||||||||||||
| 2020 | 2019 | |||||||||||||||
| Deposits for | ||||||||||||||||
| - purchases of equipment | $ | 5,555,471 | $ | 4,963,245 | - | $ | 2,037,425 | |||||||||
| - acquisition of land use rights | 3,373,110 | 3,373,110 | - | - | ||||||||||||
| - inventories purchases | 13,729,305 | 19,948,867 | 13,141,301 | 1,059,543 | ||||||||||||
| - aquaculture contracts | 2,261,538 | 4,340,741 | ||||||||||||||
| - consulting service providers and others | 8,150,000 | 9,197,796 | ||||||||||||||
| - construction in progress | 13,719,339 | 20,243,172 | - | - | ||||||||||||
| - issue of shares as collateral | 26,493,841 | 11,281,100 | - | 24,402,175 | ||||||||||||
| Prepayments - debts discounts and others | 5,007,015 | 9,919,126 | ||||||||||||||
| Shares issued for employee compensation and overseas professional and bond interest | 3,982,812 | 544,772 | - | - | ||||||||||||
| Others | 2,573,535 | - | - | 2,631,797 | ||||||||||||
| $ | 84,845,966 | $ | 83,811,929 | 13,141,301 | $ | 30,130,940 | ||||||||||
| 10. | ACCOUNTS RECEIVABLE |
The Company has performed an analysis on all of its accounts receivable and determined that all amounts are collectible by the Company. As such, allAll accounts receivable are reflected as a current asset and no allowance for bad debt has been recorded as of December 31, 20162020 and 2015. Bad debts written off for the years ended December 31, 2016, 2015 and 2014 are $0.2019, respectively.
Aging analysis of accounts receivable is as follows:
| 2016 | 2015 | |||||||||||||||
| 2020 | 2019 | |||||||||||||||
| 0 - 30 days | $ | 28,550,628 | $ | 49,190,282 | 4,695,820 | $ | 9,746,096 | |||||||||
| 31 - 90 days | 29,905,888 | 29,280,990 | 10,238,862 | 40,452,553 | ||||||||||||
| 91 - 120 days | 39,219,847 | 19,838,792 | 5,389,705 | 3,938,695 | ||||||||||||
| over 120 days and less than 1 year | 25,235,723 | 37,364,354 | 12,333,943 | 5,777,425 | ||||||||||||
| over 1 year | - | - | - | 38,613,820 | ||||||||||||
| $ | 122,912,086 | $ | 135,674,418 | 32,658,330 | $ | 98,528,589 | ||||||||||
SINO AGRO FOOD, INC.
NOTES TO CONSOLIDATED FINANCIAL STATEMENTS
| 11. | OTHER RECEIVABLES |
| 2016 | 2015 | |||||||||||||||
| 2020 | 2019 | |||||||||||||||
| Advanced to employees | $ | 260,007 | $ | 169,369 | $ | $ | 255,174 | |||||||||
| Advanced to suppliers | 9,428,841 | 8,052,235 | 2,028,907 | 2,543,541 | ||||||||||||
| Advanced to customers | 19,469,256 | 20,696,433 | 14,131,956 | |||||||||||||
| Advanced to developers | 13.400,128 | 28,000,000 | - | - | ||||||||||||
| Advanced to SJAP | 76,404,954 | 76,404,954 | ||||||||||||||
| Others | 4,562,568 | - | 3,649,530 | 2,229,752 | ||||||||||||
| Advanced to convertible bond holder | - | 2,862,550 | ||||||||||||||
| $ | 47,120,800 | $ | 59,780,587 | $ | 82,083,391 | $ | 95,565,377 | |||||||||
Advanced to employees, suppliers, customers and developers are unsecured, interest free and with no fixed terms of repayment.
The Company entered loan agreements with suppliers, customers and developers to assist them to procure project loans.
| 12. | PLANT AND EQUIPMENT |
| 2016 | 2015 | |||||||||||||||
| (Restated) | 2020 | 2019 | ||||||||||||||
| Plant and machinery | $ | 6,022,686 | $ | 5,889,915 | $ | 9,712,446 | $ | 9,652,132 | ||||||||
| Structure and leasehold improvements | 163,414,025 | 80,772,440 | 91,547,512 | 90,615,323 | ||||||||||||
| Mature seeds and herbage cultivation | 28,781,286 | 14,122,937 | 17,612,200 | 17,752,012 | ||||||||||||
| Furniture and equipment | 827,356 | 128,639 | 3,367,887 | 2,613,172 | ||||||||||||
| Motor vehicles | 926,511 | 790,434 | 3,332,541 | 3,241,556 | ||||||||||||
| 199,971,864 | 101,704,365 | 125,572,586 | 123,874,195 | |||||||||||||
| Less: Accumulated depreciation | (10,244,637 | ) | (6,465,955 | ) | 27,693,043 | 20,809,957 | ||||||||||
| Net carrying amount | $ | 189,727,227 | $ | 95,238,410 | $ | 97,879,543 | $ | 103,064,238 | ||||||||
Depreciation expenses were $4,141,629, $2,866,527 and $2,457,131$5,601, 609, $5, 272, 630 for the years ended December 31, 2016, 20152020, and 2014, respectively.
On August 15, 2016, an agreement had been executed by and between TRW and its JFD business partners to acquire their 25% equity holding (i.e. non-controlled interest) in JFD, a Sino Foreign Joint Venture Company, having resulted in TRW having secured a 100% equity interest in JFD as of October 5, 2016. Upon TRW’s acquisition of 4 additional prawn farms’ assets, namely Aquafarms 1 through 4, at fair value of US$215.94 million from respective third parties, the consideration paid to SIAF/CA for both their holdings in the merged aquaculture entities and/or master licensing fees (US$81.37 million) and repayment to SIAF for its assumption of TRW liabilities/obligations (US$43.29 million), the total sum of these arrangements (US$340.53) is scheduled for settlement on or before April 30, 2017 (this date has been from amended from March 31, 2017 in consideration of the regulatory timetable). The settlement will transpire through the issuance of 99,990,000 TRW common shares at fair value of $3.41 per share. SIAF’s equity position in TRW now stands at 23.89% (or, US$124.66 million), effective on October 5, 2016. As a result of its disposition of control in TRW, the Company’s categorization of its holdings in TRW has been reclassified from subsidiary to investments in unconsolidated equity investees as of October 5, 2016, and constitutes a deemed disposal of the subsidiary. The deemed gain on disposal of $56,947,005 was recorded in the consolidated statement of profit and loss account of the Company for the year ended December 31, 2016. SIAF took up all assets and liabilities of TRW and JFD except plant and equipment - fish farm. As a result, property and equipment of TRW and JFD was reclassified as non-current assets held for sale.
| 2016 | 2015 | |||||||
| Structure and leasehold improvements | $ | - | $ | 8,763,294 | ||||
| Furniture and equipment | - | 257,375 | ||||||
| Net carrying amount | $ | - | $ | 9,020,669 | ||||
| 2016 | 2015 | |||||||
| Construction in progress | ||||||||
| - Office, warehouse and organic fertilizer plant in HSA | $ | 4,474,428 | $ | 26,158,968 | ||||
| - Oven room, road for production of dried flowers | 3,603,863 | 3,079,766 | ||||||
| - Organic fertilizer and bread grass production plant and office building | 622,036 | 11,746,949 | ||||||
| - Rangeland for beef cattle and office building | 8,674,515 | 26,463,249 | ||||||
| - Fish pond | 17,782,371 | 5,339,837 | ||||||
| $ | 35,157,213 | $ | 72,788,769 | |||||
Private ownership of agricultural land is not permitted in the P.R.C. Instead, the Company has leased seven lots of land. The cost of the first lot of land use rights acquired in 2007 in Guangdong Province, the P.R.C. was $6,408,289 and consists of 180.26 acres with the lease expiring in 2067. The cost of the second lot of land use rights acquired in 2008 in Guangdong Province, the P.R.C. was $764,128, which consists of 31.84 acres with the lease expiring in 2068. The cost of the third lot of land use rights acquired in 2011 was $12,040,571, which consists of 84.5 acres in Guangdong Province, the P.R.C. with the lease expires in 2037. The cost of the fourth lot of land use rights acquired in 2011 was $35,405,750 which consisted of 287.27 acres in the Hunan Province, the P.R.C. and the leases expire in 2051, 2054 and 2071. The cost of the fifth lot of land use rights acquired in 2012 was $528,240 which consisted of 21.09 acres in Qinghai Province, the P.R.C. and the lease expires in 2051. The cost of the sixth lot of land use rights acquired in 2013 was $489,904 which consisted of 6.26 acres in Guangdong Province, the P.R.C. and the lease expires in 2023. The cost of the seventh lot of land use rights acquired in 2014 was $4,453,665 which consisted of 33.28 acres in Guangdong Province, the P.R.C. and the lease expires in 2044.2019, respectively
SINO AGRO FOOD, INC.
NOTES TO CONSOLIDATED FINANCIAL STATEMENTS
| CONSTRUCTION IN PROGRESS |
| 2020 | 2019 | |||||||
| Construction in progress | ||||||||
| - Office, warehouse and organic fertilizer plant in HSA | $ | - | $ | - | ||||
| - Oven room, road for production of dried flowers | - | - | - | |||||
| - Organic fertilizer and bread grass production plant and office building | - | - | ||||||
| - Rangeland for beef cattle and office building | - | - | ||||||
| - Fish pond and breeding factory | - | - | ||||||
| $ | - | $ | - |
SINO AGRO FOOD, INC.
NOTES TO CONSOLIDATED FINANCIAL STATEMENTS
| 14. | LAND USE RIGHTS |
| 2016 | 2015 | |||||||
| Cost | $ | 62,341,829 | $ | 65,961,071 | ||||
| Less: Accumulated amortization | (8,668,139 | ) | (7,475,396 | ) | ||||
| Net carrying amount | $ | 53,673,690 | $ | 58,485,675 | ||||
| Amount | ||||
| Balance @1.1.2014 | $ | 69,428,143 | ||
| Exchange difference | (3,467,072 | ) | ||
| Balance @12.31.2015 | $ | 65,961,071 | ||
| Exchange difference | (3,619,242 | ) | ||
| Balance @12.31.2016 | $ | 62,341,829 | ||
| 2020 | 2019 | |||||||
| Cost | $ | 68,293,896 | $ | 64,392,689 | ||||
| Less: Accumulated amortization | (15,811,679 | ) | (13,359,761 | ) | ||||
| Net carrying amount | $ | 52,482,217 | $ | 51,032,928 | ||||
Land use rights are amortized on the straight-line basis over their respective lease periods. The lease period of agriculture land is 3010 to 60 years. Amortization of land use rights were $1,151,323, $1,369,455$1,710,043 and $1,619,155$1,553,073 for the years ended December 31, 2016, 20152020 and 2014,2019, respectively. No impairment of land use right has been identified for the years ended December 31, 2020 and 2019.
| GOODWILL |
Goodwill represents the fair value of the assets acquired the acquisitions over the cost of the assets acquired. It is stated at cost less accumulated impairment losses. Management tests goodwill for impairment on an annual basis or when impairment indicators arise. In these instances, the Company recognizes an impairment loss when it is probable that the estimated cash flows are less than the carrying value of the assets. To date, no such impairment loss has been recorded.
| 2016 | 2015 | |||||||||||||||
| 2020 | 2019 | |||||||||||||||
| Goodwill from acquisition | $ | 724,940 | $ | 724,940 | $ | 729,940 | $ | 724,940 | ||||||||
| Less: Accumulated impairment losses | - | - | - | - | ||||||||||||
| Net carrying amount | $ | 724,940 | $ | 724,940 | $ | 724,940 | $ | 724,940 | ||||||||
| PROPRIETARY TECHNOLOGIES |
By an agreement dated November 12, 2008, TRW acquired an enzyme technology master license, registered under a Chinese patent, for the manufacturing of livestock feed and bioorganic fertilizer and its related labels for $8,000,000. On October1, 2015, the Company took up such assets at $5,473,720. On October 5, 2016, TRW and JFD were derecognized as subsidiaries.
| 2020 | 2019 | |||||||
| Cost | 9,246,623 | $ | 9,232,228 | |||||
| Less: Accumulated amortization | (2,683,690) | (2,164,475 | ) | |||||
| Net carrying amount | 6,562,933 | $ | 7,067,753 | |||||
On March 6, 2012, MEIJI acquired an aromatic-feed formula technology for the production of aromatic cattle for $1,500,000. On October 1, 2013, SIAF was granted a license to exploit sleepy cods breeding technology to grow out of sleepy cods for $2,270,000 for 50 years. SJAP booked bacterial cellulose technology license and related trademark for $2,119,075 and amortized expenditures for 20 years starting from January 1, 2014.
| 2016 | 2015 | |||||||
| Cost | $ | 11,108,131 | $ | 13,771,527 | ||||
| Less: Accumulated amortization | (1,017,434 | ) | (2,987,169 | ) | ||||
| Net carrying amount | $ | 10,090,697 | $ | 10,784,358 | ||||
Amortization of proprietary technologies was $564,905, $581,369$486,348 and $591,102$485,539 for the years ended December 31, 2016, 20152020 and 2014,2019 respectively. No impairments of proprietary technologies have been identified for the years ended December 31, 2016, 20152020 and 2014.2019
On February 28, 2011, TRW applied to form a corporate joint venture, Enping City Bi Tao A Power Fishery Development Co., Limited (“EBAPFD”), incorporated in the PRC. TRW owned a 25% equity interest in EBAPFD. On November 17, 2011, TRW formed Jiang Men City A Power Fishery Development Co., Limited (“JFD”) in which it acquired a 25% equity interest, while withdrawing its 25% equity interest in EBAPFD. As of December 31, 2011, the Company had invested for total cash consideration of $1,258,607 in JFD. JFD operates an indoor fish farm. On January 1, 2012, the Company acquired an additional 25% equity interest in JFD for total cash consideration of $1,662,365. As of January 1, 2012, the Company had consolidated the assets and operations of JFD. On April 1, 2012, the Company acquired an additional 25% equity interest in JFD for the total cash consideration of $1,702,580. These acquisitions were at our option according the terms of the original development agreement. The Company owned a 75% equity interest in JFD, representing majority of voting rights and controls its board of directors.
On August 15, 2016, an agreement had been executed by and between TRW and its JFD business partners to acquire their 25% equity holding (i.e. non-controlled interest) in JFD, a Sino Foreign Joint Venture Company, having resulted in TRW having secured a 100% equity interest in JFD as of October 5, 2016. Upon TRW’s acquisition of 4 additional prawn farms’ assets, namely Aquafarms 1 through 4, at fair value of US$215.94 million from respective third parties, the consideration paid to SIAF/CA for both their holdings in the merged aquaculture entities and/or master licensing fees (US$81.37 million) and repayment to SIAF for its assumption of TRW liabilities/obligations (US$43.29 million), the total sum of these arrangements (US$340.53) is scheduled for settlement on or before April 30, 2017 (this date has been from amended from March 31, 2017 in consideration of the regulatory timetable). The settlement will transpire through the issuance of 99,990,000 TRW common shares at fair value of $3.41 per share. SIAF’s equity position in TRW now stands at 23.89% (or, US$124.66 million), effective on October 5, 2016. As a result of its disposition of control in TRW, the Company’s categorization of its holdings in TRW has been reclassified from subsidiary to investments in unconsolidated equity investees as of October 5, 2016, and constitutes a deemed disposal of the subsidiary. The deemed gain on disposal of $56,947,005 was recorded in the consolidated statement of profit and loss account of the Company for the year ended December 31, 2016. On October 1, 2016, SIAF took up all assets and liabilities of TRW and JFD except plant and equipment - fish farm.
On May 6, 2016, SJAP invested in 30% equity interest in Guangzhou Horan Taita Information Technology Co., Limited (“HTIT”), a company incorporated in P.R.C. for $150,806.
| 2016 | 2015 | |||||||
| Investments at cost | ||||||||
| - TRW | $ | 83,869,286 | $ | - | ||||
| - HITT | 144,154 | - | ||||||
| Amount due from a consolidated equity investee - TRW | 55,120,003 | - | ||||||
| Share of post-acquisition profits | - | - | ||||||
| $ | 139,133,443 | $ | - | |||||
SINO AGRO FOOD, INC.
NOTES TO CONSOLIDATED FINANCIAL STATEMENTS
| 2016 | 2015 | |||||||
| Investment in Huangyuan County Rural Credit Union | $ | 720,773 | $ | 769,941 | ||||
| Less: Accumulated impairment losses | - | - | ||||||
| $ | 720,773 | $ | 769,941 | |||||
| 2020 | 2019 | |||||||
| Investments at cost | $ | $ | ||||||
| - TRW | 149,720,418 | 149,720,418 | ||||||
| - SJAP | 40,211,202 | 40,211,202 | ||||||
| Cattle farm 2 | 20,078,441 | |||||||
| Amount due from a consolidated equity investee | 22,089,985 | 59,413,091 | ||||||
| 232,100,046 | $ | 249,344,711 | ||||||
SINO AGRO FOOD, INC.
NOTES TO CONSOLIDATED FINANCIAL STATEMENTS
| TEMPORARY DEPOSITS PAID TO ENTITIES FOR EQUITY INVESTMENTS IN FUTURE SINO JOINT VENTURE COMPANIES |
| Intended | ||||||||||||||||||||||
| unincorporated | Projects | |||||||||||||||||||||
| Intended unincorporated | Projects | |||||||||||||||||||||
| Investee | Engaged | 2016 | 2015 | Engaged | 2020 | 2019 | ||||||||||||||||
| A | Trade center | * | $ | 4,086,941 | $ | 4,086,941 | ||||||||||||||||
| A | Seafood center | - | 1,032,914 | Trade center | - | $ | *12,000,000 | |||||||||||||||
| B | Fish Farm 2 GaoQiqiang Aquaculture | * | 6,000,000 | 6,000,000 | Fish and prawn Farm 2 GaoQiqiang Aquaculture | * | * | |||||||||||||||
| C | Prawn farm 1 | - | 14,554,578 | Cattle farm 2 | - | *5,507,626 | ||||||||||||||||
| D | Prawn farm 2 | - | 9,877,218 | |||||||||||||||||||
| E | Cattle farm 2 | * | 5,558,057 | 5,558,057 | ||||||||||||||||||
| $ | 15,644,998 | $ | 41,109,708 | $ | - | $ | 17,507,626 | |||||||||||||||
The Company made temporary deposits paid to entities for equity investments in future Sino Joint Venture companies (“SJVCs”) engaged in projects development of trade and seafood centers, fish, prawns and cattle farms. Such temporary deposits represented as deposits of the respective consideration required for the purchase of equity stakes of respective future SJVCs. The amounts were classified as temporary because legal procedures of formation of SJVCs have not yet been completed. As of December 31, 2016, the percentages of equity stakes of A (trade and seafood centers), B (fish farm 2 GaoQiqiang Aquaculture Farm) and E (cattle farm 2) are 31%, 23% and 35% respectively. During the year ended December 31, 2016, the Company withdrew its investments in seafood center and prawn farm1 and prawn farm 2.
| VARIABLE INTEREST ENTITY TO AN INVESTOR IN ASSOCIATE |
On September 28, 2009, APWAM acquired the PMH’s 45% equity interest in the Sino-Foreign joint venture company, Qinghai Sanjiang A Power Agriculture Co. Limited (“SJAP”), which was incorporated in the P.R.C. As of December 31, 2016,2020, the Company has invested $2,251,359 in this joint venture. SJAP is engaged in its business of the manufacturing of organic fertilizer, livestock feed, and beef cattle and plantation of crops and pastures.
Continuous assessmentOn September 30th 2020, Mr. Solomon Lee resigned as the Chairman of the VIE relationship with SJAP
The Company may also have resulting in categorization of SJAP as an Investor in Associate from a controlling financial interest in an entity through an arrangement that does not involve voting interests, such as a VIE. The Company evaluates entities deemed to be VIE’s using a risk and reward model to determine whether to consolidate. A VIE is an entity (1) that has total equity at risk that is not sufficient to finance its activities without additional subordinated financial support from other entities, (2) where the group of equity holders does not have the power to direct the activities of the entity that most significantly impact the entity’s economic performance, or the obligation to absorb the entity’s expected losses or the right to receive the entity’s expected residual returns, or both, or (3) where the voting rights of some investors are not proportional to their obligations to absorb the expected losses of the entity, their rights to receive the expected residual returns of the entity, or both, and substantially all of the entity’s activities either involve or are conducted on behalf of an investor that has disproportionately fewer voting rights.subsidiary status.
SINO AGRO FOOD, INC.
NOTES TO CONSOLIDATED FINANCIAL STATEMENTS
| 21. |
The Company also quantitatively and qualitatively examined if SJAP is considered a VIE. Qualitative analyses considered the extent to which the nature of its variable interest exposed the Company to losses. For quantitative analyses, the Company also used internal cash flow models to determine if SJAP was a VIE and, if so, whether the Company was the primary beneficiary. The projection of these cash flows and probabilities thereof requires significant managerial judgment because of the inherent limitations that relate to the use of historical data for the projection of future events. On December 31, 2016, the Company evaluated the above VIE testing results and concluded that the Company is the primary beneficiary of SJAP’s expected losses or residual returns and that SJAP qualifies as a VIE of the Company. As result, the Company has consolidated SJAP as a VIE.
The reasons for the changes are as follows:
• Originally, the board of directors of SJAP consisted of 7 members; 3 appointees from Qinghai Sanjiang (one stockholder), 1 from Garwor (one stockholder), and 3 from the Company, such that the Company did not have majority interest represented on the board of directors of SJAP.
• On May 7, 2010, Qinghai Sanjiang sold and transferred its equity interest in SJAP to Garwor. The State Administration for Industry and Commerce of Xining City Government of the P.R.C. approved the sale and transfer.
Consequently Garwor and the Company agreed that the new board of directors of SJAP would consist of 3 members; 1 appointee from Garwor and 2 appointees from the Company, such that the Company now had a majority interest in the board of directors of SJAP. Also, and in accordance with the Company’s Sino Joint Venture Agreement, the Company’s management appointed the chief financial officer of SJAP. As a result, the financial statements of SJAP were included in the consolidated financial statements of the Company.
Continuous assessment of the VIE relationship with QZH
The Company may also have a controlling financial interest in an entity through an arrangement that does not involve voting interests, such as a VIE. The Company evaluates entities deemed to be VIE’s using a risk and reward model to determine whether to consolidate. A VIE is an entity (1) that has total equity at risk that is not sufficient to finance its activities without additional subordinated financial support from other entities, (2) where the group of equity holders does not have the power to direct the activities of the entity that most significantly impact the entity’s economic performance, or the obligation to absorb the entity’s expected losses or the right to receive the entity’s expected residual returns, or both, or (3) where the voting rights of some investors are not proportional to their obligations to absorb the expected losses of the entity, their rights to receive the expected residual returns of the entity, or both, and substantially all of the entity’s activities either involve or are conducted on behalf of an investor that has disproportionately fewer voting rights.
The Company also quantitatively and qualitatively examined if QZH is considered a VIE. Qualitative analyses considered the extent to which the nature of its variable interest exposed the Company to losses. For quantitative analyses, the Company also used internal cash flow models to determine if QZH was a VIE and, if so, whether the Company was the primary beneficiary. The projection of these cash flows and probabilities thereof requires significant managerial judgment because of the inherent limitations that relate to the use of historical data for the projection of future events. On December 31, 2016, the Company evaluated the above VIE testing results and concluded that the Company is the primary beneficiary of QZH’s expected losses or residual returns and that QZH qualifies as a VIE of the Company. As result, the Company has consolidated QZH as a VIE.
SJAP is sole stockholder of QZH and SJAP appointed sole director of QZH. Consequently, the Company indirectly control directorship of QZH, such that the Company now had a majority interest in the directorship of QZH. Also, and in accordance with the Company’s Sino Joint Venture Agreement, the Company’s management appointed the chief financial officer of QZH. As a result, the financial statements of QZH were included in the consolidated financial statements of the Company.
SINO AGRO FOOD, INC.
NOTES TO CONSOLIDATED FINANCIAL STATEMENTS
| CONSTRUCTION CONTRACT |
| (i) | Costs and estimated earnings in excess of billings on uncompleted contracts |
| 2016 | 2015 | |||||||||||||||
| 2020 | 2019 | |||||||||||||||
| Costs | $ | 7,288,360 | $ | 6,487,032 | - | $ | 6,186,261 | |||||||||
| Estimated earnings | 5,846,890 | 10,995,534 | - | 4,777,300 | ||||||||||||
| Less: Billings | (12,394,266 | ) | (16,175,681 | ) | - | (10,712,733 | ) | |||||||||
| Costs and estimated earnings in excess of billings on uncompleted contracts | $ | 740,984 | $ | 1,306,885 | - | $ | 250,828 | |||||||||
| (ii) | Billings in excess of costs and estimated earnings on uncompleted contracts |
| 2016 | 2015 | |||||||||||||||
| 2020 | 2019 | |||||||||||||||
| Billings | $ | 24,115,354 | $ | 146,830,043 | - | $ | 49,175,412 | |||||||||
| Less: Costs | (13,907,143 | ) | (85,092,860 | ) | - | (30,098,638 | ) | |||||||||
| Estimated earnings | (7,577,459 | ) | (53,036,477 | ) | - | (13,690,063 | ) | |||||||||
| Billing in excess of costs and estimated earnings on uncompleted contracts | $ | 2,630,752 | $ | 8,700,706 | - | $ | 5,386,711 | |||||||||
| 2016 | 2015 | |||||||
| Billings | $ | 36,509,620 | $ | 163,005,724 | ||||
| Less: Costs | (21,195,503 | ) | (91,579,892 | ) | ||||
| Estimated earnings | (13,424,349 | ) | (64,032,011 | ) | ||||
| Billing in excess of costs and estimated earnings on uncompleted contracts | $ | 1,889,768 | $ | 7,393,821 | ||||
| OTHER PAYABLES |
| 2016 | 2015 | |||||||||||||||
| 2020 | 2019 | |||||||||||||||
| Due to third parties | $ | 451,195 | $ | 312,782 | 9,271,281 | $ | 5,994,581 | |||||||||
| Due to debts loan | 4,797,332 | 4,797,332 | ||||||||||||||
| Straight note payable (note 23(i)) | 29,367,999 | 29,367,999 | ||||||||||||||
| Promissory notes issued to third parties | 11,192,117 | 2,200,000 | - | 7,151,762 | ||||||||||||
| Due to local government | 713,565 | 2,279,797 | - | - | ||||||||||||
| $ | 17,154,209 | $ | 9,589,911 | 38,639,280 | $ | 42,514,342 | ||||||||||
| Less: Amount classified as non-current liabilities | ||||||||||||||||
| Promissory notes issued to third parties | (11,192,117 | ) | - | (7,151,762 | ) | |||||||||||
| Due to debts loan | - | (4,797,332 | ) | |||||||||||||
| Amount classified as current liabilities | $ | 5,962,092 | $ | 4,792,579 | 38,639,280 | $ | 35,362,580 | |||||||||
Due to third parties are unsecured, interest free and have no fixed terms of repayment.
During the year ended December 31, 2015, the Company issued 753,304 shares of common stock ranging from $6.96 to $8.91 as collateral to secure debts loan of $4,797,332 from third party. The shares issued by the Company were valued at the trading price of the stock on the date the shares were issued.
| Due to third parties are unsecured, interest free and have no fixed terms of repayment. |
SINO AGRO FOOD, INC.
NOTES TO CONSOLIDATED FINANCIAL STATEMENTS
| BORROWINGS |
There are no provisions in the Company’s bank borrowings and long term debts that would accelerate repayment of debt as a result of a change in credit ratings or a material adverse change in the Company’s business. Under certain agreements, the Company has the option to retire debt prior to maturity, either at par or at a premium over par.
| Name of lender | Interest rate | Term | 2020 | 2019 | ||||||||||
| China Development Bank Qinghai Province, the P.R.C. | 5.2835 | % | November 29, 2019 - November 28, 2019 | - | ||||||||||
| China Development Bank Qinghai Province, the P.R.C. | 5.2835 | % | December 14, 2019 - December 13, 2019 | - | ||||||||||
| China Development Bank Qinghai Province, the P.R.C | 4.7306 | % | December 27, 2019 - December 27, 2020 | |||||||||||
| Add: current portion of a long term bank loan | ||||||||||||||
| Short term bank loans | ||||||||||||||
| China Development Bank Qinghai Province, the P.R.C. | 5.39 | % | December 16, 2016 - December 15, 2026 | |||||||||||
| Less: current portion of long term bank loan | 0 | 0 | ) | |||||||||||
| Long term bank loans | $ | 0 | $ | 0 | ||||||||||
Short
On November 29, 2019 and December 14, 2019, the Company obtained two 1-year short term bank loans of RMB20 million (approximately $3.06million) and RMB10 million (approximately $1.53million) respectively from China Development Bank for the period from November 29, 2019 to November 28, 2019 and December 14, 2019 to December 13, 2019 respectively, bearing fixed interest at 5.2835% per annum. Both loans were guaranteed by Xining City SME Guarantee Corporation and have been repaid on November 28, 2019 and December 13, 2019, respectively.
| Name of lender | Interest rate | Term | 2016 | 2015 | ||||||||||
| Agricultural Development Bank of China Huangyuan County Branch, Xining City, Qinghai Province, the P.R.C. | 6.4 | % | January 3, 2014 - December 17, 2018 | $ | - | $ | 616,333 | ^*# | ||||||
| Da Tong National Development Rural Bank Limited | ||||||||||||||
| Da Tong County, Xining City, Qinghai Province, the P.R.C. | 10 | % | July 14 ,2016 - May 28, 2017 | 2,883,090 | ^+@ | - | ||||||||
| Agricultural Development Bank of China | ||||||||||||||
| Huangyuan County Branch, | ||||||||||||||
| Xining City, Qinghai Province, the P.R.C. | 4.785 | % | October 28, 2015 - October 27, 2016 | - | 3,849,707 | ^* | ||||||||
| $ | 2,883,090 | $ | 4,466,040 | |||||||||||
On December 16, 2016, the Company obtained a 10-year long term loan of RMB40million (approximately $6.05million) from China Development Bank for the period from December 16, 2016 to December 15, 2026, bearing an annual interest rate at 110% of the benchmark rate of PBOC on the date of the loan agreement and will be adjusted in line with any adjustment of the benchmark rate which is 5.39% (2019: 5.39%). The loan was guaranteed by Mr. Zhao Yilin and Ms. Song Haixian, Mr. Zhao Yilin’s wife. The loan was also secured by land use right with net carrying amount of $397,269 as of December 31, 2020 (2019: 429,982) and a batch of plant, machinery and equipment with net carrying amount of $5,326,385 (2019: 5,954,915). On December 14, 2019, RMB500,000 (approximately $75,563) was repaid to the bank. According to the loan agreement, RMB1,500,000 (approximately $218,563) was schedule to be repaid by November 20, 2020 in two partial repayments.
LongOn December 27, 2019, the Company obtained a 1-year short term debts and bank loan of RMB30 million (approximately $4.37 million) from China Development Bank for the period from December 27, 2019 to December 27, 2020, bearing fixed interest at 4.7306% per annum. This loan was guaranteed by Xining City SME Guarantee Corporation.
| Name of lender | Interest rate | Term | 2016 | 2015 | ||||||||||
| GanGuo Village Committee | ||||||||||||||
| Bo Huang Town | ||||||||||||||
| Huangyuan County, | ||||||||||||||
| Xining City, Qinghai Province, the P.R.C. | 12.22 | % | June 2012 - June 2017 | $ | - | $ | 169,387 | |||||||
| China Development Bank | December 9, 2016 - | |||||||||||||
| Beijing City, the P.R,C. | 5.39 | % | December 15, 2026 | 5,766,182 | ^*# | - | ||||||||
| Agricultural Development Bank of China | ||||||||||||||
| Huangyuan County Branch, | ||||||||||||||
| Xining City, Qinghai Province, the P.R.C. | 6.4 | % | January 3, 2014 - December 17, 2018 | - | 2,001,848 | ^*# | ||||||||
| Less: The current portion reclassified as short term debts | - | (616,333 | ) | |||||||||||
| $ | 5,766,182 | $ | 1,554,902 | |||||||||||
The above note agreements contained regular provisions requiring timely repayment of principals and accrued interests, payment of default interest in the event of default, and without specific financial covenants. Management of the Company believes the Company is in material compliance with the terms of the loan agreements.
SINO AGRO FOOD, INC.
NOTES TO CONSOLIDATED FINANCIAL STATEMENTS
On August 29, 2015, TRW issued negotiable promissory notes to three fund companies and one individual for $3,450,000 and the company acted as guarantor for repayment. As of October 1, 2016, the Company entered assignment agreement with TRW to take up liabilities of negotiable promissory notes.
| 2016 | 2015 | |||||||
| Negotiable promissory notes | $ | 1,113,140 | $ | 865,968 | ||||
SINO AGRO FOOD, INC.
NOTES TO CONSOLIDATED FINANCIAL STATEMENTS
| CONVERTIBLE NOTE PAYABLES |
On August 29, 2014, the Company completed the closing of a private placement financing transaction with an accredited investor, which purchased a 10.5% Convertible Note (the “Note”) in the aggregate principal amount of up to $33,300,000. The Company received the total advance of $11,632,450. The Company shall offer investor a discount equal to 25% of the amount of the principal advanced by the investor.
| (i) | On August 29, 2014, the Company completed the closing of a private placement financing transaction with an accredited investor, which purchased a 10.5% Convertible Note (the “Note 1”) in the aggregate principal amount of up to $33,300,000. The Company received the total advance of $11,632,450. The Company shall offer investor a discount equal to 25% of the amount of the principal advanced by the investor. |
Interest on the note shall accrue on the outstanding principal balance of this Note from August 29, 2014. Interest shall be payable quarterly on the last day of each of March, June, September and December commencing September 30, 2014 provided, however, that note holder may elect to require the Company to issue to the note holder a promissory note in lieu of cash in satisfaction of any interest due and payable at such time. Any interest payment note shall be subject to the same terms as the note. The note has a maturity date of February 28, 2020.
The note is convertible, at the discretion of the note holder, into shares of the Company’s common stock (i) at any time following an Event of Default, or (ii) for a period of thirty (30) calendar days following October 31, 2015 and each anniversary thereof, at an initial conversion price per share of $1.00, subject to adjustment for stock splits, reverse stock splits, stock dividends and other similar transactions and subject to the terms of the note. As long as the note is outstanding, the investor shall have a right of first refusal, exercisable for thirty (30) calendar days after notice to the note holder, to purchase securities proposed to be offered and sold by the Company.
| 2016 | 2015 | |||||||
| 10.50% convertible note of maturity date February 28, 2020 | $ | 21,314,877 | $ | 34,904,739 | ||||
The Company calculatedand the fair valuenote holder entered into a restructuring agreement regarding the settlement of the convertibleNote 1. Both parties have agreed to restructure the indebtedness represented by Note 1 as follows: (a) SIAF issues 5,196,333 shares of its common stock and transfer 400,000 shares of TRW to the note holder; and (b) SIAF executes a new promissory note in the beneficial conversion feature utilizingprincipal amount of $15,589,000 to the Discounted Cash Flows model at the datenote holder to be paid in installments over a period of time. However, both parties remain open to negotiate an all-cash settlement of the issuance of convertible note. The relative fair values were allocated to the liability and equity components of the debt. Accordingly, a discount was created on the debt and this discount will be amortized to interest expense over the life of the debt. Debt premium of $0, $24,475 and $5,188 were amortized for the years ended December 31, 2016, 2015 and 2014, respectively.Note 1.
As of December 31, 2016, there was $18,183,267(2015: 32,666,666) principal outstanding and accrued interest in2020, as a result, the amount outstanding under Note 1 was reclassified as other payables – straight note payable of $3,131,610 (2015: $2,238,073) that was owed under$29,367,999 (see Note 21) and a loss on restructuring of $6,225,204 which representing the termsnon-amortized part of the discount upon the issuing of the convertible note. bond incurred during the year.
Subsequently, Note 1 matured on February 28, 2020, the Company intends to offer the settlement of the note to the accredited investors based on the following understanding, terms and conditions:
(i). The earlier understanding of the restructured indebtedness is to be carried as follows: (a) SIAF issues 5,196,333 shares of its common stock and transfer 400,000 shares of TRW to the note holder; and (b) SIAF is to pay the revised promissory note in the principal amount of $15,589,000 to the note holder.
(ii). It is the Company’s intension for the said 5,196,333 shares of its common stocks to be converted into the G Series Preferred Stocks at conversion ratio of the offer of the Initial Public Offer stated in the registration statement filed with SEC targeting on or before June 30, 2021.
(iii). There were 500,050 Common Shares of the Company loaned to the said accredited investor on (Date: July 22, 2014) valued at US$18.10 / share as security for the accredited investors to secure their investors to invest on the Bond prior to the completion of a registration statement filed with SEC on June 2014 to allow the official issuing of additional common stocks to ECAB’s BOND investors, and that ECAB would return back the loaned stocks back to the Company upon the time the said accredited investor invested the balance of the Note 1 proceed of (US$ 13,362,550) needed to complete the disbursement of the total loan proceed of US$25,000,000 on or before (Date: February 28th 2015). However the said investor sold the said loaned 500,050 common stocks of the Company in between the period (Date: February to March 2015) and invested part or the full sum from the sales proceeds of said 500,050 common stock of the Company (of US$10,500,000) back to the Company as part of the Note 1’s disbursement to the Company making total disbursement sum of US$22,137,450.00 being advanced to the Company on or before 30th June 2015, and in turn, the investor did not return the said 500,050 common stocks of the Company to the Company and didn’t help the Company to complete the said registration statement by not giving the Company the Debenture Agreement needed to complete said registration statement with the SEC.
(iv). In order that the principal amount of $15,589,000 of the cash settlement sum mentioned above may be settled amicably between the accredited investor and the Company, the sales proceeds (of US$13,362,550.00) from the sales of the 500,050 shares loaned in good faith to ECAB must be taken into consideration and be deduced from the said principal amount before this bond arrangements can be settled.
| (ii) | On October 20, 2019, the Company issued another Convertible Note (the "Note 2") with a principal amount of $4,000,000 due on February 28, 2019. The note holder had the option to convert all or any part of the outstanding note into the common stock of the Company (the "Primary Optional Conversion") or TRW (the "Secondary Optional Conversion") at any time for a period of eight months from the note's maturity date. The conversion price for Primary Optional Conversion is lesser of $1.5 per share or at 65% of the market share price of the Company. While the conversion price for Secondary Optional Conversion is $3.41 per share subject to equitable adjustment for stock split, stock dividend or right offerings. |
Under the agreement, the Company shall pay the note holder 120,000 common shares of SIAF or 32,000 common shares of TRW as an origination fee. The note bears a flat interest payment which shall be settled by 200,000 common shares of SIAF or 55,000 common shares of TRW. As of December 31, 2020, no settlement for both origination fee and interest payment. The supplemental agreement to the Bond Subscription Agreement with the Subscriber to extend the Bond Issue by a year to December 31, 2020 was signed. All other terms and conditions of the Bond Subscription Agreement and the Conditions continue in full force and effect.
The fair value of the conversion option was approximately $211,320, the Company discounted the note and created a derivative liability, which will be evaluated each quarter and adjusted for any change in value. For the year ended December 31, 2020 and 2019, the Company recognized the amortization of the discount of approximately $nil and $106,297, respectively.
The Company estimated the fair value of the derivative liabilities using the Binomial Option Pricing Model and the following key assumptions during 2019
| 2020 | ||||
| Expected dividends | - | |||
| Expected term (years) | 0.34 | |||
| Volatility | 52.09% - 54.32% | |||
| Risk-free rate | 1.65% - 1.9% | |||
The following table sets forth, by level within the fair value hierarchy, the Company’s financial liabilities that were accounted for at fair value as of December 31, 2020 and 2019
| Level 1 | Level 2 | Level 3 | Total | |||||||||
| $ | $ | $ | $ | |||||||||
| LIABILITIES: | ||||||||||||
| Derivative liabilities as of December 31, 2019 | - | - | 0 | 0 | ||||||||
| Derivative liabilities as of December 31, 2020 | - | - | 2,100 | 2,100 |
The following table represents the change in the fair value of the derivative liabilities during the year ended December 31, 2020
| $ | ||||
| Fair value of derivative liabilities as of December 31, 2019 | 2,100 | |||
| Change in fair value of derivative liabilities | - | |||
| Fair value of derivative liabilities as of December 31, 2020 | 0 | |||
The above note agreement contained regular provisions requiring timely repayment of principals and accrued interests, payment of default interest in the event of default, default and optional conversion and without specific financial covenants. Management of the Company believes the Company is in material compliance with the terms of the convertible note agreement.
The Company calculated professional service compensation of $1,500,000 in respect of convertible note issue, and recognized $0, $1,500,000 and $0 for the years ended December 31, 2016, 2015 and 2014. As of December 31, 2016, the deferred compensation balance was $0.
SINO AGRO FOOD, INC.
NOTES TO CONSOLIDATED FINANCIAL STATEMENTS
| SHAREHOLDERS’ EQUITY |
The Group’s share capital as of December 31, 20162020 and 20152019 shown on the consolidated balance sheet represents the aggregate nominal value of the share capital of the Company as of that date.
On March 22, 2010,Common Stock:
During the year ended December 31, 2019, the Company designated 100(i) issued 535,598 shares of Series A preferredcommon stock valued to employees and directors at a par value per share of $0.001. As of the same date, 100 shares of Series A preferred stock were issued atranging from $1 to $1.56 per share for cash in the amount$576,170 for employee compensation; (ii) issued 16,032,262 shares of $100.common stock valued to professionals and contractors ranging from $ 0.55 to $1.00 per share for $9,723,720 for service compensation; and (iii) issued 3,935,439 shares of common stock valued at $ 0.30 to $0.50 per share for 1,478,029 for settlement of debts.
The Series A preferred stock:During the year ended December 31, 2020, the Company (i) issued 6,511,081 shares of common stock at US$0.25 per share in quarter (1) for US$1,596,370 for settlement of debts and (ii) issued 1,876,166 shares of common stocks at US$0.25 per shares for US$469,041 for settlement of debts and there was no further issuance of shares of common stock since thus total issuance of shares of common stocks for the year ended December 2020 is 8,387,247 shares for US$2,065,411.
The Company has designated 10059,963,332 and 51,576,085 shares of Series A preferredcommon stock with 100 shares issued and outstanding as of December 31, 20162020 and 2015,2019, respectively.
SINO AGRO FOOD, INC.
NOTES TO CONSOLIDATED FINANCIAL STATEMENTS
The Series B convertible preferred stock:
On March 22, 2010, the Company designated 7,000,000 shares of Series B convertible preferred stock at a par value per share of $0.001. The Series B convertible preferred stock is redeemable, the stockholders are not entitled to receive any dividend and voting rights but rank senior over common stockholders on liquidation, and can convert to common stock on a one for one basis at any time. On June 26, 2010, 7,000,000 shares of common stock were surrendered for cancellation and the Company issued 7,000,000 shares of Series B convertible preferred stock at $9.90 per share. Pursuant to share exchange agreement made as of December 22, 2012, between the Company and a stockholder, Capital Adventure Inc., a holder of 3,000,000 shares of common shares, with the consent of Board of Directors, to exchange for 3,000,000 shares of Series B convertible preferred stock on a one-for-one basis. As of December 23, 2012, 3,000,000 shares of Series B convertible preferred stock were issued to Capital Adventure Inc., for the exchange of its holding of 3,000,000 shares of common stocks. As of December 31, 2012, 3,000,000 shares of common stocks were still not returned to the Company. On March 27, 2013, 3,000,000 Series B convertible preferred stock were cancelled. On December 17, 2014, the Company approved an amendment to certificate designation in respect of Series B preferred stock. Pursuant to the above new amendment, each holder of Series B preferred stock shall have the rights, at any time or from time to time, to convert each 9.9 shares of Series B preferred to one fully paid and non assessable share of common stock of par value $0.001 per share. On June 15, 2015, Series B preferred stockholder exercised at the above conversion ratio to convert 7,000,000 shares of Series B preferred stock to 707,070 shares of common stock.
There were 0 shares of Series B convertible preferred stock issued and outstanding as of December 31, 2016 and 2015, respectively.
The Series F Non-Convertible Preferred Stock:
On August 22, 2012, the Company’s Board of Directors declared that the Company’s stockholders were entitled to receive one share of restricted Series F Non-convertible Preferred Stock for every 100 shares of Common Stock owned by the stockholders as of September 28, 2012, with lesser or greater amounts being rounded up to the nearest 100 shares of Common Stock for purpose of the computing the dividend. The holders of record of shares of Series F Non-Convertible Preferred Stock shall be entitled to a coupon payment directly from the Company at the redemption rate of $3.40 per share and be payable on May 30, 2014. However, the Company was unable to issue the Series F Non-convertible Preferred Stock as originally contemplated. Consequently, The Company’s transfer agent was instructed to note in its record date rather than actual issue the Preferred F shares. On June 14, 2014, the Company announced the delay in payment of the coupon until May 30, 2015. The company reserved the excess over the nominal amount of the Series F Non-convertible Preferred Stock of $3,124,737 as Series F Non-convertible Preferred Stock redemption payable. As of May 30, 2015, payment on the F series shares has been made, and respective shares cancelled, accordingly.
As a result, total issued and outstanding of Series F Non-Convertible Preferred Stock as of December 31, 2016 and 2015 are 0 shares and grand total issued and outstanding preferred stock as of December 31, 2016 and 2015 are 100 shares.
SINO AGRO FOOD, INC.
NOTES TO CONSOLIDATED FINANCIAL STATEMENTS
Common Stock:
On November 10, 2014, the Company approved an amendment to the Corporation’s Articles of Incorporation to effectuate a reverse stock split (the “Reverse Split”) of the Corporation’s common stock, par value $0.001 per share (the “Common Stock”) affecting both the authorized and issued and outstanding number of such shares by a ratio of 9.9 for 1. The Reverse Split became effective in the State of Nevada on December 16, 2014. Subsequent to the December 31, 2014, the Board of directors and the holders of a majority of the voting power of our stockholders of the company have approved an amendment to articles of incorporation to increase its authorized shares of Common Stock from 17,171,716 to 22,727,272.
During the year ended December 31, 2014, the Company issued (i) 2,734,625 shares of common stock for $13,006,373 at values ranging from $3.96 to $10.40 per share to settle debts due to third parties. The Company executed several agreements with third parties to settle debts by issuance of the Company’s common stock. The shares issued by the Company were valued at the trading price of the stock on the date the shares were issued. Any excess of the fair value of the shares over the carrying cost of the debt has been reported as a gain on the extinguishment of debts of $270,586 and $1,318,947 has been credited to consolidated statements of income as other income for the year ended December 31, 2014 and 2013, respectively; (ii) 130,568 shares of common stock valued to employees at fair value of $4.26 per share for $555,827 for employee compensation. The fair value of the common stock issued was determined by using the trading price of the Company’s common stock on the date of issuance of $4.26 per share; (iii) 400,008 shares of common stock valued to professionals at fair value ranging from $3.96 to $7.43 per share for $2,763,618 for service compensation. The fair value of the common stock issued was determined by using the trading price of the Company’s common stock on the date of issuance ranging from $3.96 to $9.90 per share; and (iv) 1,681 piecemeal shares of common stock valued at fair value of $9.49 per share amounting to $15,951 for cancellation. The fair value of the common stock issued was determined by using the trading price of the Company’s common stock on the date of cancellation of $9.49 per share.
During the year ended December 31, 2015, the Company issued (i) 100,000 shares of common stock for $868,000 at $8.68 per share to settle debts due to third parties. The Company executed several agreements with third parties to raise debts loan by issuance of the Company’s common stock. The shares issued by the Company were valued at the trading price of the stock on the date the shares were issued. Any excess of the fair value of the shares over the carrying cost of the debt has been reported as a gain on the extinguishment of debts of 132,000 and $270,586 has been credited to consolidated statements of income as other income for the year ended December 31, 2015 and 2014, respectively; (ii) 753,304 shares of common stock ranging from $6.96 to $8.91 amounting to as collateral to secure debts loan of $4,797,332, and the shares issued by the Company were valued at the trading price of the stock on the date the shares were issued; (ii) 1,135,000 shares of common stock ranging from $8.75 to $12.50 as collateral to secure trade finance facility amounting to the extent of $7,600,000, and the shares issued by the Company were valued at the trading price of the stock on the date the shares were issued and such shares returned to treasury stock after the contract period of three years (iii) 153,392 shares at $11.13 per share and 75,002 shares at $14.20 per share were issued for reverse split adjustments; (iv) 47,787 shares of common stock valued to employees and directors at fair value of $15.20 per share for $726,315 for employee compensation; 7,000,000 shares of Series B preferred stock were converted into 707,070 shares under terms of issue; (v) cancelled 514 shares for $10.97 per share for reverse splits adjustments..
During the year ended December 31, 2016, the Company (i) issued 1,199,068 shares of common stock valued to employees and directors at fair value of $5.98 per share for $7,169,823 for employee compensation; (ii) issued 132,787 shares of common stock valued to professionals at fair value of $5.98 per share for $794,066 for service compensation; (iii) issued 2,461,247 shares of common stock ranging from $6.96 to $8.91 amounting to $5,765,476 as collateral to secure debts loan of $4,797,332, and the shares issued by the Company were valued at the trading price of the stock on the date the shares were issued; and the shares issued by the Company were valued at the trading price of the stock on the date the shares were issued; and purchased 1,200,000 shares of common stock of $4.85 amounting to $5,820,000 for cancellation.
The Board of directors and the holders of a majority of the voting power of our stockholders of the company have approved an amendment to articles of incorporation to increase its authorized shares of Common Stock from 22,727,273 to 27,000,000 and the amendment was filed on December 28, 2016.
The Company has 22,726,859 and 20,133,757 shares of common stock issued and outstanding as of December 31, 2016 and 2015, respectively.
SINO AGRO FOOD, INC.
NOTES TO CONSOLIDATED FINANCIAL STATEMENTS
| OBLIGATION UNDER OPERATING LEASES |
The Company leases (i) 2,178 square feet of agriculture space used for offices for a monthly rent of $634$812 in Enping City, Guangdong Province, P.R.C., its lease expiring on March 31, 2019;2021; and (ii) 5,0812,695 square feet of office space in Guangzhou City, Guangdong Province, P.R.C. for a monthly rent of $12,733,$3,034 , its lease expiring on July 8, 2018; and (iii) 1,555 square feet of staff quarters in Linli District, Hunan Province, P.R.C. for a monthly rent of $226, its lease expiring on May 1, 2018.2022.
Lease expenses were $174,429, $179,201$46,128 and $159,300$41,121 for the years ended December 31, 2016, 20152020 and 2014,2019, respectively.
The future minimum lease payments as of December 31, 2016,2020, are as follows:
| Year ending December 31, 2017 | $ | 47,250 | ||
| Year ending December 31, 2018 | 257,449 | |||
| $ | 304,699 |
| Within 1 year | $ | 46,152 | ||
| 2 to 5 years | 33,418 | |||
| Over 5 years | - | |||
| $ | 79,570 |
SINO AGRO FOOD, INC.
NOTES TO CONSOLIDATED FINANCIAL STATEMENTS
| STOCK BASED COMPENSATION |
On December 15, 2014,June 30, 2019, the Company issued professionals aemployees total of 80,739117,000 shares of common stock valued at fair value of range from $9.90$3.45 per share for services rendered to the Company. The fair values of the common stock issued were determined by using the trading price of the Company’s common stock on the date of issuance of $9.90$3.45 per share.
The Company calculated stock based compensation of $3,419,752 and recognized $659,686 for the year ended On December 31,, 2014. As of December 31, 2014, the deferred compensation balance for staff was $2,760,066 and the deferred compensation balances of (i) $510,066; (ii) $750,000, (iii) $1,500,000 was to be amortized over 6, 9 and 12 months beginning on January 1, 2015.
On May 6, 2015, 2019, the Company issued directors and employees a total of 47,787500,800 shares of common stock valued at fair value of $15.20$1 per share for services rendered to the Company. The fair values of the common stock issued were determined by using the trading price of the Company’s common stock on the date of issuance of $15.20$3.45 per share.
The Company calculated stock based compensation of 3,486,428 and recognized $3,123,247 for the year ended On December 31, 2015. As of December 31, 2015, the deferred compensation balance for staff was $363,181 and the deferred compensation balance of $363,181 was to be amortized over 6 months beginning on January 1, 2016.
On May 10, 2016,2019, the Company issued directors and employees a total of 1,199,0681,050,502 shares of common stock valued at fair value of $5.98$1 per share for services rendered to the Company. The fair values of the common stock issued were determined by using the trading price of the Company’s common stock on the date of issuance of $5.98 per share. On the same date, the Company issued professionals a total of 132,787 shares of common stock valued at fair value of $5.98 per share for services rendered to the Company. The fair values of the common stock issued were determined by using the trading price of the Company’s common stock on the date of issuance of $5.98$1 per share.
The Company calculated stock based compensation of $7,965,624 and recognized $4,345,993 for the year ended December 31, 2016. As of December 31, 2016,2020, the deferred compensation balance for staff was $3,982,813$0 and the deferred compensation balance of $3,982,813 was$2,101,825 were to be amortized over 6 months and 1 year, respectively beginning on January 1, 2017.2020.
SINO AGRO FOOD, INC.
NOTES TO CONSOLIDATED FINANCIAL STATEMENTS
| CONTINGENCIES |
On March 26, 2020, a shareholder derivative complaint was filed in the United States District Court for the Southern District of New York against the Company, as well as four of its current directors. The Complaint alleges violations of securities law and state law, breaches of fiduciary duties (including gross mismanagement of the Company) by the individual defendants, a material default of its obligations under a commercial loan agreement, misleading and false statements (including material omissions) by the individual defendants, and unauthorized issuance of new shares of Common Stock to pay debts that, in the view of the plantiffs, has diluted shareholder ownership and oppressed shareholders of the Company. The Company and the individual defendants believe that these claims are without merit and intend to vigorously defend against the Complaint.
On July 23rd 2020 the settlement agreement between the plaintiffs and the Company to settle the shareholder derivate complaint was preliminary approved and final approval was granted on October 13th 2021 as such the case was closed on October 13th 2020 officially.
On September 22, 2015, the Company entered into a trade facility agreement with two independent third parties. Pursuant to the agreement, the Company provides collateral in the form of Company's common shares to a PRC based lender (the "Lender") and the Lender agrees to provide a revolving trade facility loan up to $20,000,000 to a PRC based borrower. The arrangement was commenced on February 15, 2016 and will be expired on September 15, 2020.
As of December 31, 2016 and 2015,2020, the Company did not have any pending claims, charges, or litigationhas issued aggregate 5,708,312 common shares as collateral and the trade facility line reduced to $13 million that was settled and written off with the consent of the Lender on the understanding that it expects would have a material adverse effect on its consolidated balance sheets, consolidated statementsis due to the impacts of income and other comprehensive income or consolidated statements of cash flows.
As ofthe Covid-19 the borrower is no longer requiring the revolving trade facility. Therefore as at December 31 2016st 2020 the Company entered into loan and pledge agreement with a Shanghai, P.R.C. based lender (the “lender”) The lender has various trading facilities and has agreedno more contingent liability regarding to allowthis trade facility to the Company or its nominee to use parts of trading facilities up to an amount of $20 million (2015: $20 million) to be used in tranches and revolved up to a period of three years, of which $13,982,640 (2015: $7,478,375) was utilized.Lender.
| RELATED PARTY TRANSACTIONS |
In addition to the transactions and balances as disclosed elsewhere in these consolidated financial statements, during the years ended December 31, 2016, 20152020 and 2014,2019, the Company had the following significant related party transactions:-
| Name of related party | Nature of transactions | |
| Mr. Solomon Yip Kun Lee, Chairman | ||
| Included in due to |
| Tri-Way Industries Limited (“TRW”) Unconsolidated equity investee | Included in interest in unconsolidated equity investee, due from Tri-Way Industries Limited is $170,150,427 and $209,133,510 as of December 31, 2020 and December 31, 2019, respectively. The amounts are unsecured, interest free and have no fixed terms of repayment. | |
| SJAP | Included in interest in unconsolidated equity investee, due from SJAP Limited is $41,871,178 and $40,211,202 as of December 31, 2020 and December 31, 2019, respectively. The amounts are unsecured, interest free and have no fixed terms of repayment. | |
SINO AGRO FOOD, INC.
NOTES TO CONSOLIDATED FINANCIAL STATEMENTS
| EARNINGS PER SHARE |
Basic earnings per share is computed by dividing net income attributable to common shareholders by the weighted average number of common shares outstanding during the year. Diluted earnings per share reflects the potential dilution of securities by including other potential common stock, including convertible preferred stock, stock options and warrants, in the weighted average number of common shares outstanding for the year, if dilutive. The numerators and denominators used in the computations of basic and dilutive earnings per share are presented in the following table:
| 2016 | 2015 (Restated) | 2014 (Restated) | ||||||||||
| BASIC | ||||||||||||
| Numerator for basic earnings per share attributable to the Company’s common stockholders: | ||||||||||||
| Net income used in computing basic earnings per share -continuing and discontinued operations | $ | 114,976,014 | $ | 66,355,530 | $ | 92,064,610 | ||||||
| Net income used in computing basic earnings per share -continuing operations | $ | 43,980,766 | $ | 50,600,951 | $ | 66,283,626 | ||||||
| Basic earnings per share - continuing and discontinued operations | $ | 5.46 | $ | 3.69 | $ | 5.81 | ||||||
| Basic earnings per share - continuing operations | $ | 2.09 | $ | 2.81 | $ | 4.18 | ||||||
| Basic weighted average shares outstanding | 21,041,065 | 17,988,619 | 15,847,496 | |||||||||
| 2020 | 2019 | |||||||
| BASIC | ||||||||
| Numerator for basic earnings per share attributable to the Company’s common stockholders: | ||||||||
| Net income used in computing basic earnings per share | (132,061,187 | ) | $ | (10,342,267 | ) | |||
| Basic earnings per share | (2.24 | ) | $ | (0.21 | ) | |||
| Basic weighted average shares outstanding | 58,951,700 | 49,963,607 | ||||||
| 2016 | 2015 (Restated) | 2014 (Restated) | 2020 | 2019 | ||||||||||||||||
| DILUTED | ||||||||||||||||||||
| Numerator for basic earnings per share attributable to the Company’s common stockholders: | ||||||||||||||||||||
| Net income used in computing basic earnings per share - continuing and discontinued operations | $ | 114,976,014 | $ | 66,355,530 | $ | 92,064,610 | ||||||||||||||
| Convertible note interest | 893,537 | 571,667 | - | |||||||||||||||||
| Net income used in computing diluted earnings per share | $ | 115,869,551 | $ | 66,927,197 | $ | 92,064,610 | (132,061,187 | ) | $ | (10,342,267 | ) | |||||||||
| Diluted earnings per share - continuing and discontinued operations | $ | 5.00 | $ | 3.60 | $ | 5.56 | ||||||||||||||
| Diluted earnings per share | (2.24 | ) | $ | (0.21 | ) | |||||||||||||||
| Diluted weighted average shares outstanding | 58,951,700 | 49,963,607 | ||||||||||||||||||
| 2016 | 2015 | 2014 | ||||||||||
| Numerator for basic earnings per share attributable to the Company’s common stockholders: | ||||||||||||
| Net income used in computing basic earnings per share - continuing operations | $ | 43,980,766 | $ | 50,600,951 | $ | 66,283,626 | ||||||
| Convertible mote interest | 893,537 | 571,667 | - | |||||||||
| Net income used in computing diluted earnings per share | $ | 44,874,303 | $ | 51,172,618 | $ | 66,283,626 | ||||||
| Diluted earnings per share – continuing operations | $ | 1.93 | $ | 2.75 | $ | 4.00 | ||||||
| Basic weighted average shares outstanding | 21,041,065 | 17,988,619 | 15,847,496 | �� | ||||||||
| Add: weight average of common stock converted from Series B Convertible preferred shares outstanding | - | - | 707,070 | |||||||||
| weight average of common stock convertible from convertible note payables | 2,153,018 | 587,622 | - | |||||||||
| Diluted weighted average shares outstanding | 23,194,083 | 18,576,241 | 16,554,566 | |||||||||
For the years ended December 31, 2014 and 2013, full dilution effect of convertible note of $15,803,928 (.2013: $0), was not taken into account for calculation of the diluted earnings per share because convertible note holder is restricted to exercise shares before October 1, 2015 under terms of convertible note agreement.
For the years ended December 31, 2016 and 2015, full dilution effect of convertible note of $21,314, 877 (2015: $35,413,573) was taken into account for calculation of the diluted earnings per share because convertible note holder can exercise the right to convert to common stock by giving 1 month notice after October 1, 2015 under terms of convertible note agreement.
For the years ended December 31, 2016, full dilution effect of negotiable promissory notes of $1,113,140 was not taken into account for calculation of the diluted earnings per share because the Company scheduled to repay it on March 2017.