If foreclosure is effected, the property is sold at a public auction in which we may participate as a bidder. If we are the successful bidder, we include the acquired real estate property in our real estate owned (“OREO”) account until it is sold. These assets are initially recorded at fair value net of estimated selling costs. To the extent there is a subsequent decline in fair value, that amount is charged to operating expense. At December 31, 2017,2019, we had OREO totaling $7.6$6.2 million.
Special Products and Services
To complement our array of loans, we also provide the following special products and services to our commercial customers:
Cash Management Services
Cash Management services are offered that enable the Bank’s business customers to maximize the efficiency of their cash management. Specific products offered in our Cash Management services program include the following:
| ● | Investment/sweep accounts |
| ● | Wire Transfer services |
| ● | Employer Services/Payroll processing services |
| ● | Zero balance accounts |
| ● | Night depository services |
| ● | Lockbox services |
| ● | Depository transfers |
| ● | Merchant services (third party) |
| ● | ACH originations |
| ● | Business debit cards |
| ● | Controlled disbursement accounts |
| ● | SONA 24/7 (Check 21 processing) |
| ● | Sonabank asset based lending (SABL) |
| ● | Mobiliti, a mobile banking application for personal and business accounts |
Some of the products listed above are described in-depth below.
| ● | SONA 24/7/Check 21: SONA 24/7 is ideal for landlords, property managers, medical professionals, and any other businesses that accept checks. SONA 24/7 allows customers of Sonabank to have total control over how, when, and where their checks will be deposited. SONA 24/7 uses the Check Truncation technology outlined by the “Check Clearing for the 21st Century Act”, passed in October 2004 (“Check 21”). With Check Truncation, paper checks can be converted to electronic images and processed between participating banks, vastly speeding up the check clearing process. SONA In-House passes on the benefits of Check Truncation directly to Sonabank’s business customers. |
| ● | Lockbox Services: Sonabank will open a lockbox, retrieve and scan incoming checks, and deposit them directly into the customer’s account. The images of the checks will then be available to view online. This makes bookkeeping for the customer fast and easy, and because Sonabank is checking the lockbox daily, funds will often be available sooner. Big businesses have been using lockboxes for decades as a cash management tool. Sonabank makes this service cost effective for all small and medium sized businesses as well. |
| ● | Employer Services: Sonabank will provide its business clients with software that allows them to generate ACH payroll transactions to their employees’ accounts. |
11
| ● | SABL: Asset Based Lending is a form of “collateral-based” lending. It is a combination of secured lending and short-term business lending. It is a specialized form of financing that allows a bank’s commercial customers to pledge their working assets, typically accounts receivable and, to a lesser extent, inventory, as collateral to secure financing. Asset Based Lending borrowers are typically in the service, manufacturing or distribution fields. |
SABL is an Asset Based Lending software system built by Sonabank that allows the Bank to monitor the collateral of its commercial borrowers who have pledged their working assets (accounts receivables and other qualifying assets such as inventory) as collateral. SABL has the ability to track other offsets (liabilities, e.g. other loans the customer has with the Bank) to the line of credit. SABL serves to provide the more stringent controls and supervision that this type of lending requires.
One control that is typical of Asset Based Lending is that the commercial borrower is required to have its customers remit invoice payments to a bank controlled lockbox. The bank retrieves these payments and the bank applies them directly to any outstanding balance on the line. SABL allows for this and can combine that service with remote capture (Check 21) if warranted.
Most Asset Based Lending systems are manual processes or software that certifies the borrowing base periodically. These certifications are usually provided in the form of manually created borrowing bases backed up with field exams. SABL provides a real time capability to analyze and adjust borrowing availability based on the levels of collateral at the moment.
SABL also offers an automated collateral upload, taking receivable information directly from the clients accounting system. SABL also offers discretionary borrowings and pay offs, allowing clients to borrow on or pay down their line at their discretion, as long as they are compliant with the SABL system. Lastly, SABL offers superior reporting, offering reports to bank officers that provide all thecertain information they need to monitor risk. Customized reports can also be built for clients.
| ● | Mobiliti: Sona Mobile is perfect for customers on the go, as it is available on a large variety of devices and networks. Sona Mobile offers easy access to account balances, transactions and internal transfers. Mobile Deposit allows customers to save time by eliminating the need to visit a branch. The customer can deposit a check through Sona Mobile by using their certified device (up to $2,500). |
Sona Business Mobile can help business customers manage their finances faster than ever. Customers have access to their information via a wide range of devices and networks. The shared user credentials and security settings between online and mobile banking make access more efficient for the business customer. Sona Business Mobile offers standard online banking features, along with enhanced features such as ACH & Wire transfer processing, including granting approvals to users to complete those processes. Mobile deposit is a time saving tool that allows business customers to deposit checks through Sona Business Mobile from their certified device (up to $5,000).
| ● | Other Consumer/Retail Products and Services. Other products and services that are offered by the Bank are primarily directed toward the individual customer and include the following: |
| ● | Debit cards |
| ● | ATM services |
| ● | Travelers Checks |
| ● | Notary service in some branches |
| ● | Wire transfers |
| ● | Online banking with bill payment services |
| ● | Credit Cards |
| ● | Kasasa - rewards program |
12
Competition
The banking business is highly competitive, and our profitability depends principally on our ability to compete in the market areas in which our banking operations are located. We experience substantial competition in attracting and retaining savings deposits and in lending funds. The primary factors we encounter in competing for savings deposits are convenient office locations and rates offered. Direct competition for savings deposits comes from other commercial bank and thrift institutions, money market mutual funds and corporate and government securities which may offer more attractive rates than insured depository institutions are willing to pay. The primary factors we encounter in competing for loans include, among others, interest rate and loan origination fees and the range of services offered. Competition for origination of loans normally comes from other commercial banks, thrift institutions, mortgage bankers, mortgage brokers, insurance companies and insurancefintech or digital lending companies. We have been able to compete effectively with other financial institutions by:
| ● | emphasizing customer service and technology; |
| ● | establishing long-term customer relationships and building customer loyalty; and |
| ● | providing products and services designed to address the specific needs of our customers. |
Employees
At December 31, 2017,2019, we had 393350 full-time equivalent employees. Management of Southern National and Sonabank considers its relations with its employees to be good. Neither Southern National nor Sonabank are a party to any collective bargaining agreement.
SUPERVISION AND REGULATION
Bank holding companies and banks are extensively regulated under federal and state law. This discussion is a summary and is qualified in its entirety by reference to the particular statutory and regulatory provisions described below, and is not intended to be an exhaustive description of the statutes or regulations applicable to Southern National or the Bank. The business of Southern National and the Bank areis subject to extensive regulation and supervision under federal and state banking laws and other federal and state laws and regulations,law, including primary oversight by the Board of Governors of the Federal Reserve System (“Federal Reserve”) and secondary oversight by the Virginia Bureau of Financial Institutions (“VBFI”), a regulatory division of the Virginia State Corporation Commission, and possibly other authorities. In general, legislative changes and regulations are intended for the protection of the customers and depositors of the Bank and not for the protection of Southern National or its shareholders. Set forth below are brief descriptions of selectedCommission.
Changes in laws and regulations may alter the structure, regulation and competitive relationships of financial institutions. In addition, bank regulatory agencies may issue enforcement actions, policy statements, interpretive letters and similar written guidance applicable to Southern National andus or the Bank. These descriptions are not intended toIt cannot be a comprehensive description of allpredicted whether and in what form new laws and regulations, or interpretations thereof, may be adopted or the extent to which the business of Southern National and the Bank are subject or tomay be complete descriptions of the laws and regulations discussed. The descriptions of statutory and regulatory provisions are qualified in their entirety by reference to the particular statutes and regulations.
Violations of laws and regulations, or other unsafe and unsound practices, may result in regulatory agencies imposing fines or penalties, cease and desist orders, or taking other enforcement actions. Under certain circumstances, these agencies may enforce these remedies directly against officers, directors, employees and other parties participating in the affairs of a bank or bank holding company. Underfederaland statelawsand regulationspertainingtothesafetyand soundnessofinsureddepositoryinstitutions, federal and statebankingregulatorshave theauthoritytocompelorrestrictcertain actionsonourpart ifthey determinethat wehaveinsufficientcapitalorotherresources,orareotherwiseoperatinginamanner thatmaybedeemedtobeinconsistentwithsafeandsoundbankingpractices.Underthisauthority,ourbankregulatorscanrequire usoroursubsidiariestoenterintoinformalorformalsupervisoryagreements,includingboardresolutions,memorandaof understanding, written agreements and consent or cease and desist orders, pursuant to which we would be required to take identified corrective actions to address cited concerns and to refrain from taking certain actions.
Ifwebecomesubjecttoand areunabletocomplywiththetermsofany futureregulatoryactionsordirectives,supervisory agreements,ororders,thenwecouldbecomesubjecttoadditional,heightenedsupervisoryactionsandorders,possiblyincluding consentorders,promptcorrectiveactionrestrictionsand/orotherregulatoryactions,includingprohibitions onthepaymentof dividendsonourcommonstockandpreferredstock.Ifourregulatorsweretotakesuch
13
additionalsupervisoryactions,thenwe could,amongotherthings,becomesubjecttosignificant restrictions onourabilitytodevelopanynewbusiness,aswellas restrictionsonourexistingbusiness,andwecouldbe requiredto raiseadditionalcapital,disposeofcertainassetsandliabilities withinaprescribedperiodoftime,orboth.Thetermsofanysuchsupervisoryactioncouldhaveamaterialnegativeeffectonour business,reputation,operatingflexibility,financialcondition,andthevalueofourcommonstockandpreferredstock.
Supervision, regulation, and examination of Southern National, the Bank, and their business.
Bank Holding Company Act of 1956.
Southern National is subject to extensive supervision and regulation by the Federal Reserve System pursuant to the Bank Holding Company Act of 1956, as amended (“BHCA”(the “Bank Holding Company Act”), we. We are subjectrequired to file with the Federal Reserve periodic examinationreports and such other information as the Federal Reserve may request. Ongoing supervision is provided through regular examinations by the Federal Reserve Board (“FRB”) and requiredother means that allow the regulators to file periodic reports regarding ourgauge management’s ability to identify, assess and control risk in all areas of operations in a safe and any additional information thatsound manner and to ensure compliance with laws and regulations. In addition to regulation by the FRB may require. Our activities at theFederal Reserve as a bank holding company, levelSouthern National is subject to supervision and regulation by the VBFI under the banking and general business corporation laws of the Commonwealth of Virginia.
Activity Limitations. Southern National is registered with the Federal Reserve as a bank holding company. Bank holding companies generally are limited to:
Source of Strength Obligations. A bank holding company is required to act as a source of financial and managerial strength to its subsidiary bank. The term “source of financial strength” means the ability of a company, such as us, that directly or indirectly owns or controls an insured depository institution, such as the Bank, to provide financial assistance to such insured depository institution in the future.
Acquisitions. The Bank Holding Company Act requires every bank holding company to obtain the prior approval of the FRB before: (i) acquiring substantially all the assetsFederal Reserve or waiver of any bank; (ii) acquiring direct or indirectsuch prior approval before it (1) acquires ownership or control of any voting shares of any bank if, after such acquisition, it wouldsuch bank holding company will own or control more than 5%five percent (5%) of the voting
14
shares of such bank, (unless it already owns(2) acquires all of the assets of a bank, or controls the majority of such shares); or (iii) merging or consolidating(3) merges with anotherany other bank holding company. In approving bank acquisitions by bank holding companies, the FRB is required to consider,reviewing a proposed covered acquisition, among other things,factors, the Federal Reserve considers (1) the financial and managerial resources and future prospects of the bank holding company andcompanies involved, including pro forma capital ratios; (2) the banks concerned,risk to the stability of the United States banking or financial system; (3) the convenience and needs of the communities to be served, including performance under the CRA; and various competitive factors.
Change in Control. Federal law restricts the amount of voting stock of a bank holding company or a bank that a person (including an entity) may acquire without the prior approval of banking regulators. Under the federal Change in Bank Control Act and the regulations thereunder, a person or group must give advance notice to anyand obtain approval from the Federal Reserve before acquiring control of its subsidiary banks are subordinate in right of payment to deposits and to certain other indebtedness of such subsidiary banks. As discussed below, aany bank holding company, in certain circumstances, could be required to guarantee the capital plan of an undercapitalized banking subsidiary.
Virginia Law.
Certain state corporation laws may have an anti-takeover affect. Virginia law restricts transactions between a Virginia corporation and its affiliates and potential acquirers. The following discussion summarizes the two Virginia statutes that may discourage an attempt to acquire control of Southern National.Virginia Code Sections 13.1-725 – 727.1 govern “Affiliated Transactions.” These provisions, with several exceptions discussed below, require approval by the holders of at least two-thirds of the remaining voting shares of material acquisition transactions between a Virginia corporation and any holder of more than 10% of any class of its outstanding voting shares. Affiliated Transactions include mergers, share exchanges, material dispositions of corporate assets not in the ordinary course of business, any dissolution of the corporation proposed by or on behalf of an interested shareholder, or any reclassification, including a reverse stock split, recapitalization, or merger of the corporation with its subsidiaries which increases the percentage of voting shares owned beneficially by any 10% shareholder by more than 5%.
These provisions were designed to deter certain takeovers of Virginia corporations. In addition, the statute provides that, by affirmative vote of a majority of the voting shares other than shares owned by any 10% shareholder, a corporation can adopt an amendment to its articles of incorporation or bylaws providing that the Affiliated Transactions provisions shall not apply to the corporation. Southern National “opted out” of the Affiliated Transactions provisions when it incorporated.
Virginia law also provides that shares acquired in a transaction that would cause the acquiring person’s voting strength to meet or exceed any of the three thresholds (20%, 331∕ 1/3% or 50%) have no voting rights for those shares exceeding that threshold, unless granted by a majority vote of shares not owned by the acquiring person. This provision empowers an acquiring person to require the Virginia corporation to hold a special meeting of shareholders to consider the matter within 50 days of the request. Southern National also “opted out” of this provision at the time of its incorporation.
Governance and Financial Reporting Obligations. We are required to comply with various corporate governance and financial reporting requirements under the Sarbanes-Oxley Act of 2002, as well as rules and regulations adopted by the SEC, the Public Company Accounting Oversight Board, and NASDAQ. In particular, we are required to include management and independent registered public accounting firm reports on internal controls as part of our Annual
15
Report on Form 10-K in order to comply with Section 404 of the Sarbanes-Oxley Act. We have evaluated our controls, including compliance with the SEC rules on internal controls, and have and expect to continue to spend significant amounts of time and money on compliance with these rules. Our failure to comply with these internal control rules may materially adversely affect our reputation, ability to obtain the necessary certifications to financial statements, and the values of our securities.
Corporate Governance. The Dodd-Frank Act addresses many investor protections, corporate governance, and executive compensation matters that will affect most U.S. publicly traded companies. The Dodd-Frank Act (1) grants shareholders of U.S. publicly traded companies an advisory vote on executive compensation; (2) enhances independence requirements for Compensation Committee members; and (3) requires companies listed on national securities exchanges to adopt incentive-based compensation claw-back policies for executive officers.
Incentive Compensation. The Dodd-Frank Act required the banking agencies and the SEC to establish joint rules or guidelines for financial institutions with more than $1.0 billion in assets, such as Southern National and the Bank, which prohibit incentive compensation arrangements that the agencies determine to encourage inappropriate risks by the institution. The banking agencies issued proposed rules in 2011 and previously issued guidance on sound incentive compensation policies. In 2016, the Federal Reserve Monetary Policy.also proposed rules that would, depending upon the assets of the institution, directly regulate incentive compensation arrangements and would require enhanced oversight and recordkeeping. As of December 31, 2019, these rules have not been implemented. We and Sonabank have undertaken efforts to ensure that our incentive compensation plans do not encourage inappropriate risks, consistent with three key principles—that incentive compensation arrangements should appropriately balance risk and financial rewards, be compatible with effective controls and risk management, and be supported by strong corporate governance.
Shareholder Say-On-Pay Votes. The Dodd-Frank Act requires public companies to take shareholders’ votes on proposals addressing compensation (known as say-on-pay), the frequency of a say-on-pay vote, and the golden parachutes available to executives in connection with change-in-control transactions. Public companies must give shareholders the opportunity to vote on the compensation at least every three years and the opportunity to vote on frequency at least every six years, indicating whether the say-on-pay vote should be held annually, biennially, or triennially.
Anti-tying rules. A bank holding company and its subsidiaries are prohibited from engaging in certain tying arrangements in connection with extensions of credit, leases or sales of property, or furnishing of services.
Capital Requirements
The Bank is required under federal law to maintain certain minimum capital levels based on ratios of capital to total assets and capital to risk-weighted assets. The required capital ratios are minimums, and the federal banking agencies may determine that a banking organization, based on its size, complexity or risk profile, must maintain a higher level of capital in order to operate in a safe and sound manner. Risks such as concentration of credit risks and the risk arising from non-traditional activities, as well as the institution’s exposure to a decline in the economic value of its capital due to changes in interest rates, and an institution’s ability to manage those risks are important factors that are to be taken into account by the federal banking agencies in assessing an institution’s overall capital adequacy. The following is a brief description of the relevant provisions of these capital rules and their potential impact on our capital levels.
The Bank is subject to the following risk-based capital ratios: a common equity Tier 1 ("CET1") risk-based capital ratio, a Tier 1 risk-based capital ratio, which includes CET1 and additional Tier 1 capital, and a total capital ratio, which includes Tier 1 and Tier 2 capital. CET1 is primarily comprised of the sum of common stock instruments and related surplus net of treasury stock, retained earnings, and certain qualifying minority interests, less certain adjustments and deductions, including with respect to goodwill, intangible assets, mortgage servicing assets and deferred tax assets subject to temporary timing differences. Additional Tier 1 capital is primarily comprised of noncumulative perpetual preferred stock, tier 1 minority interests and grandfathered trust preferred securities. Tier 2 capital consists of instruments disqualified from Tier 1 capital, including qualifying subordinated debt, other preferred stock and certain hybrid capital instruments, and a limited amount of loan loss reserves up to a maximum of 1.25% of risk-weighted assets, subject to certain eligibility criteria. The capital rules also define the risk-weights assigned to assets and off-
16
balance sheet items to determine the risk-weighted asset components of the risk-based capital rules, including, for example, certain “high volatility” commercial real estate, past due assets, structured securities and equity holdings.
The leverage capital ratio, which serves as a minimum capital standard, is the ratio of Tier 1 capital to quarterly average assets net of goodwill, certain other intangible assets, and certain required deduction items. The required minimum leverage ratio for all banks is 4%.
In addition, effective January 1, 2019, the capital rules require a capital conservation buffer of CET1 of 2.5% above each of the minimum capital ratio requirements (CET1, Tier 1, and total risk-based capital), which is designed to absorb losses during periods of economic stress. These buffer requirements must be met for a bank to be able to pay dividends, engage in share buybacks or make discretionary bonus payments to executive management without restriction.
Failure to be well-capitalized or to meet minimum capital requirements could result in certain mandatory and possible additional discretionary actions by regulators that, if undertaken, could have an adverse material effect on our operations or financial condition. Failure to meet minimum capital requirements could also result in restrictions on the Bank’s ability to pay dividends or otherwise distribute capital or to receive regulatory approval of applications or other restrictions on its growth.
The Federal Deposit Insurance Corporation Improvement Act of 1991 (“FDICIA”), among other things, requires the federal bank regulatory agencies to take “prompt corrective action” regarding depository institutions that do not meet minimum capital requirements. FDICIA establishes five regulatory capital tiers: “well capitalized”, “adequately capitalized”, “undercapitalized”, “significantly undercapitalized”, and “critically undercapitalized”. A depository institution’s capital tier will depend upon how its capital levels compare to various relevant capital measures and certain other factors, as established by regulation. FDICIA generally prohibits a depository institution from making any capital distribution (including payment of a dividend) or paying any management fee to its holding company if the depository institution would thereafter be undercapitalized. The FDICIA imposes progressively more restrictive restraints on operations, management and capital distributions, depending on the category in which an institution is classified. Undercapitalizeddepositoryinstitutionsaresubjecttorestrictionsonborrowing fromtheFederalReserveSystem.Inaddition,undercapitalizeddepositoryinstitutionsmaynotacceptbrokereddepositsabsent awaiverfromtheFDIC,aresubjecttogrowthlimitations andarerequiredtosubmitcapitalrestoration plansforregulatory approval.Adepositoryinstitution'sholdingcompanymustguaranteeanyrequiredcapitalrestorationplan,uptoanamountequal tothelesserof5percentofthedepositoryinstitution'sassetsatthetimeitbecomesundercapitalizedortheamountofthecapital deficiency when theinstitution failstocomplywiththeplan. Federalbankingagenciesmaynotacceptacapitalplanwithout determining,amongotherthings,thattheplanisbasedonrealisticassumptionsandislikelytosucceedinrestoringthedepository institution'scapital.If a depository institution fails to submit an acceptable plan, it is treated as if it is significantly undercapitalized. All of the federal bank regulatory agencies have adopted regulations establishing relevant capital measures and relevant capital levels for federally insured depository institutions. The Bank was well capitalized at December 31, 2019, and brokered deposits are not restricted.
To be well-capitalized, the Bank must maintain at least the following capital ratios:
| ● | 6.5% CET1 to risk-weighted assets; |
| ● | 8.0% Tier 1 capital to risk-weighted assets; |
| ● | 10.0% Total capital to risk-weighted assets; and |
| ● | 5.0% leverage ratio. |
The Bank’s regulatory capital ratios were above the applicable well-capitalized standards and met the then-applicable capital conservation buffer. Based on current estimates, we believe that the Bank will continue to exceed all applicable well-capitalized regulatory capital requirements and the capital conservation buffer in 2020.
The Economic Growth, Regulatory Relief, and Consumer Protection Act (the “Economic Growth Act”) signed into law in May 2018 scaled back certain requirements of the Dodd-Frank Act and provided other regulatory relief. Among the provisions of the Economic Growth Act was a requirement that the Federal Reserve raise the asset threshold for those bank holding companies subject to the Federal Reserve’s Small Bank Holding Company Policy Statement (“Policy
17
Statement”) to $3.0 billion. As a result, as of the effective date of that change in 2018, Southern National was no longer required to comply with the risk-based capital rules applicable to the Bank as described above. The Federal Reserve may however, require smaller bank holding companies subject to the Policy Statement to maintain certain minimum capital levels, depending upon general economic conditions and a bank holding company’s particular condition, risk profile and growth plans.
On December 21, 2018, federal banking agencies issued a joint final rule to revise their regulatory capital rules to (i) address the upcoming implementation of the CECL accounting standard under GAAP; (ii) provide an optional three-year phase-in period for the day-one adverse regulatory capital effects that banking organizations are expected to experience upon adopting CECL; and (iii) require the use of CECL in stress tests beginning with the 2020 capital planning and stress testing cycle for certain banking organizations. In June 2016, the FASB issued ASU 2016-13, which introduced CECL as the methodology to replace the current “incurred loss” methodology for financial assets measured at amortized cost, and changed the approaches for recognizing and recording credit losses on available-for-sale debt securities and purchased credit impaired financial assets. Under the incurred loss methodology, credit losses are recognized only when the losses are probable or have been incurred; under CECL, companies are required to recognize the full amount of expected credit losses for the lifetime of the financial assets, based on historical experience, current conditions and reasonable and supportable forecasts. This change will result in earlier recognition of credit losses that the Company deems expected but not yet probable. For SEC reporting companies that do not meet the definition of a smaller reporting company and with December 31 calendar year ends, such as the Company, CECL became effective January 1, 2020.
Payment of Dividends
Southern National is a legal entity separate and distinct from the Bank and other subsidiaries. Its primary source of cash, other than securities offerings, is dividends from the Bank. Under the Federal Deposit Insurance Act, no dividends may be paid by an insured bank if the bank is in arrears in the payment of any insurance assessment due to the FDIC. The payment of dividends by the Bank may also be affected by other regulatory requirements and policies, such as the maintenance of adequate capital. If, in the opinion of the applicable regulatory authority, a bank under its jurisdiction is engaged in, or is about to engage in, an unsafe or unsound practice (which, depending on the financial condition of the bank, could include the payment of dividends), such authority may require, after notice and hearing, that such bank cease and desist from such practice. The Federal Reserve has formal and informal policies which provide that insured banks should generally pay dividends only out of current operating earnings.
Under a Federal Reserve policy adopted in 2009, the board of directors of a bank holding company must consider certain factors to ensure that its dividend level is prudent relative to maintaining a strong financial position, and is not based on overly optimistic earnings scenarios, such as potential events that could affect its ability to pay, while still maintaining a strong financial position. As a general matter, the Federal Reserve has indicated that the board of directors of a bank holding company should consult with the Federal Reserve and eliminate, defer or significantly reduce the bank holding company’s dividends if:
| ● | its net income available to shareholders for the past four quarters, net of dividends previously paid during that period, is not sufficient to fully fund the dividends; |
| ● | its prospective rate of earnings retention is not consistent with its capital needs and overall current and prospective financial condition; or |
| ● | it will not meet, or is in danger of not meeting, its minimum regulatory capital adequacy ratios. |
Bank Regulation
The operation of the Bank is subject to state and federal statutes applicable to state banks and the regulations of the Federal Reserve, the FDIC and the Consumer Financial Protection Bureau (“CFPB”). The operations of the Bank may also be subject to applicable Office of the Comptroller of the Currency (“OCC”) regulation to the extent state banks are granted parity with national banks. Such statutes and regulations relate to, among other things, required reserves, investments, loans, mergers and consolidations, issuances of securities, payments of dividends, establishment of branches, consumer protection and other aspects of the Bank’s operations. Violations of laws and regulations, or other unsafe and unsound practices, may result in these agencies imposing fines or penalties, cease and desist orders, or taking
18
other enforcement actions. Under certain circumstances, these agencies may enforce these remedies directly against officers, directors, employees and other parties participating in the affairs of a bank or bank holding company.
Safety and Soundness. The Federal Deposit Insurance Act requires the federal prudential bank regulatory agencies, such as the Federal Reserve, to prescribe, by regulation or guideline, operational and managerial standards for all insured depository institutions relating to: (1) internal controls; (2) information systems and audit systems; (3) loan documentation; (4) credit underwriting; (5) interest rate risk exposure; and (6) asset quality. The agencies also must prescribe standards for asset quality, earnings, and stock valuation, as well as standards for compensation, fees and benefits. The federal banking agencies have adopted regulations and Interagency Guidelines Establishing Standards for Safety and Soundness to implement these required standards. These guidelines set forth the safety and soundness standards used to identify and address problems at insured depository institutions before capital becomes impaired. Under the regulations, if a regulator determines that a bank fails to meet any standards prescribed by the guidelines, the regulator may require the bank to submit an acceptable plan to achieve compliance, consistent with deadlines for the submission and review of such safety and soundness compliance plans.
Examinations. The Bank is subject to regulation, reporting, and periodic examinations by the Federal Reserve and the VBFI. These regulatory authorities routinely examine the Bank’s reserves, loan and investment quality, consumer compliance, management policies, procedures and practices and other aspects of operations. The Federal Reserve has adopted the Federal Financial Institutions Examination Council’s (“FFIEC”) rating system and assigns each financial institution a confidential composite rating based on an evaluation and rating of six essential components of an institution’s financial condition and operations, including Capital Adequacy, Asset Quality, Management, Earnings, Liquidity and Sensitivity to Market Risk, as well as the quality of risk management practices.
Consumer Protection. The Dodd-Frank Act established the CFPB, an independent regulatory authority housed within the Federal Reserve having centralized authority, including examination and enforcement authority, for consumer protection in the banking industry. The CFPB has rule writing, examination, and enforcement authority with regard to the Bank’s (and the Company’s) compliance with a wide array of consumer financial protection laws, including the Truth in Lending Act, the Real Estate Settlement Procedures Act, the Truth in Savings Act, the Electronic Funds Transfer Act, the Equal Credit Opportunity Act, the Home Mortgage Disclosure Act, the S.A.F.E. Mortgage Licensing Act, the Fair Credit Reporting Act (except Sections 615(e) and 628), the Fair Debt Collection Practices Act, and the Gramm-Leach-Bliley Act (sections 502 through 509 relating to privacy), among others. The CFPB has broad authority to enforce a prohibition on unfair, deceptive, or abusive acts and practices. In addition, the Dodd-Frank Act permits states to adopt consumer protection laws and regulations that are stricter than those regulations promulgated by the CFPB, and state attorneys general are permitted to enforce consumer protection rules adopted by the CFPB against certain institutions.
Deposit Insurance Assessments. The Deposit Insurance Fund (“DIF”) of the FDIC insures the deposits of the Bank generally up to a maximum of $250,000 per depositor, per insured bank, for each account ownership category. The FDIC charges insured depository institutions quarterly premiums to maintain the DIF. Deposit insurance assessments are based on average total consolidated assets minus its average tangible equity, and take into account certain risk-based financial ratios and other factors. The assessment rate schedule can change from time to time, at the discretion of the FDIC, subject to certain limits. In addition, in 2019 the Bank was subject to quarterly assessments by the FDIC to pay interest on Financing Corporation ("FICO") bonds, ending in the first quarter of 2019.
Insurance of deposits may be terminated by the FDIC upon a finding that an institution has engaged in unsafe or unsound practices, is in an unsafe or unsound condition to continue operations or has violated any applicable law, regulation, rule, order or condition imposed by a bank’s federal regulatory agency. In addition, the Federal Deposit Insurance Act provides that, in the event of the liquidation or other resolution of an insured depository institution, the claims of depositors of the institution, including the claims of the FDIC as subrogee of insured depositors, and certain claims for administrative expenses of the FDIC as a receiver, will have priority over other general unsecured claims against the institution, including those of the parent bank holding company.
19
Insider Transactions. In addition to regulating capital, the Federal Reserve has broad authority to prevent the development or continuance of unsafe or unsound banking practices. Pursuant to this authority, the Federal Reserve has adopted regulations that restrict preferential loans and loan amounts to “affiliates” and “insiders” of banks, require banks to keep information on loans to major shareholders and executive officers and bar certain director and officer interlocks between financial institutions.
Reserves. The Bank is subject to Federal Reserve regulations that require the Bank to maintain reserves against transaction accounts (primarily checking accounts). These reserve requirements are subject to annual adjustment by the Federal Reserve.
Anti-Money Laundering. Under the Uniting and Strengthening America by Providing Appropriate Tools Required to Intercept and Obstruct Terrorism (“USA PATRIOT”) Act of 2001, financial institutions are subject to prohibitions against specified financial transactions and account relationships as well as enhanced due diligence and “know your customer” standards in their dealings with foreign financial institutions and foreign customers. The USA PATRIOT Act requires financial institutions to establish anti-money laundering programs with minimum standards that include:
| ● | the development of internal policies, procedures, and controls; |
| ● | the designation of a compliance officer; |
| ● | an ongoing employee training program; and |
| ● | an independent audit function to test the programs. |
Bank regulators routinely examine institutions for compliance with these anti-money laundering obligations and recently have been active in imposing “cease and desist” and other regulatory orders and money penalty sanctions against institutions found to be in violation of these requirements. In addition, the Financial Crimes Enforcement Network has adopted new regulations that became effective on May 11, 2018, that require, subject to certain exclusions and exemptions, covered financial institutions to identify and verify the identity of beneficial owners of legal entity customers.
Economic Sanctions. The Office of Foreign Assets Control (“OFAC”) is responsible for helping to ensure that U.S. entities do not engage in transactions with certain prohibited parties, as defined by various Executive Orders and acts of Congress. OFAC publishes, and routinely updates, lists of names of persons and organizations suspected of aiding, harboring or engaging in terrorist acts, including the Specially Designated Nationals and Blocked Persons List. If we find a name on any transaction, account or wire transfer that is on an OFAC list, we must undertake certain specified activities, which could include blocking or freezing the account or transaction requested, and we must notify the appropriate authorities.
Concentrations in Lending. During 2006, the federal bank regulatory agencies released guidance on “Concentrations in Commercial Real Estate Lending” (the “Guidance”) and advised financial institutions of the risks posed by CRE lending concentrations. The Guidance requires that appropriate processes be in place to identify, monitor and control risks associated with real estate lending concentrations. Higher allowances for loan losses and capital levels may also be required. The Guidance is triggered when CRE loan concentrations exceed either:
| ● | Total reported loans for construction, land development, and other land of 100% or more of a bank’s total risk based capital; or |
| ● | Total reported loans secured by multifamily and nonfarm nonresidential properties and loans for construction, land development, and other land of 300% or more of a bank’s total risk based capital. |
The Guidance also applies when a bank has a sharp increase in CRE loans or has significant concentrations of CRE secured by a particular property type. The Guidance also applies when a bank has a sharp increase in CRE loans or has significant concentrations of CRE secured by a particular property type.
Community Reinvestment Act. The Bank is subject to the provisions of the CRA, which imposes a continuing and affirmative obligation, consistent with their safe and sound operation, to help meet the credit needs of entire communities where the bank accepts deposits, including low- and moderate-income neighborhoods. The Federal Reserve’s assessment of
20
the Bank’s CRA record is made available to the public. Further, a less than satisfactory CRA rating will slow, if not preclude, expansion of banking activities and prevent a company from becoming or remaining a financial holding company. Federal CRA regulations require, among other things, that evidence of discrimination against applicants on a prohibited basis, and illegal or abusive lending practices be considered in the CRA evaluation. The Bank has a rating of “Satisfactory” in its most recent CRA evaluation.
Consumer Regulation. Activities of the Bank are subject to a variety of statutes and regulations designed to protect consumers. These laws and regulations include, among numerous other things, provisions that:
| ● | limit the interest and other charges collected or contracted for by the Bank, including rules respecting the terms of credit cards and of debit card overdrafts; |
| ● | govern the Bank’s disclosures of credit terms to consumer borrowers; |
| ● | require the Bank to provide information to enable the public and public officials to determine whether it is fulfilling its obligation to help meet the housing needs of the community it serves; |
| ● | prohibit the Bank from discriminating on the basis of race, creed or other prohibited factors when it makes decisions to extend credit; |
| ● | govern the manner in which the Bank may collect consumer debts; and |
| ● | prohibit unfair, deceptive or abusive acts or practices in the provision of consumer financial products and services. |
Mortgage Rules. Pursuant to rules adopted by the CFPB, banks that make residential mortgage loans are required to make a good faith determination that a borrower has the ability to repay a mortgage loan prior to extending such credit, require that certain mortgage loans contain escrow payments, obtain new appraisals under certain circumstances, comply with integrated mortgage disclosure rules, and follow specific rules regarding the compensation of loan originators and the servicing of residential mortgage loans.
Transactions with affiliates. There are various restrictions that limit the ability of the Bank to finance, pay dividends or otherwise supply funds to the Company or other affiliates. In addition, banks are subject to certain restrictions under Section 23A and B of the Federal Reserve Act on certain transactions, including any extension of credit to its bank holding company or any of its other affiliates, on investments in the securities thereof, and on the taking of such securities as collateral for loans to any borrower.
Privacy and Cybersecurity. The Bank is subject to federal and state banking regulations that limit its ability to disclose non-public information about consumers to non-affiliated third parties. These limitations require us to periodically disclose our privacy policies to consumers and allow consumers to prevent disclosure of certain personal information to a non-affiliated third party under certain circumstances. Consumers also have the option to direct banks and other financial institutions not to share information about transactions and experiences with affiliated companies for the purpose of marketing products or services. Banking institutions are required to implement a comprehensive information security program that includes administrative, technical, and physical safeguards to ensure the security and confidentiality of customer records and information. These security and privacy policies and procedures for the protection of confidential and personal information are in effect across our lines of business. Furthermore, the federal banking regulators regularly issue guidance regarding cybersecurity intended to enhance cyber risk management. A financial institution is expected to implement multiple lines of defense against cyber attacks and ensure that their risk management procedures address the risk posed by potential cyber threats. A financial institution is further expected to maintain procedures to effectively respond to a cyber attack and resume operations following any such attack. The Company has adopted and implemented policies and procedures to comply with these privacy, information security, and cybersecurity requirements.
Audit Reports. Insured institutions with total assets of $500 million or more must submit annual audit reports prepared by independent auditors to federal and state regulators. In some instances, the audit report of the institution’s holding company can be used to satisfy this requirement. Independent auditors must receive examination reports, supervisory agreements and reports of enforcement actions. For insured institutions with total assets of $1.0 billion or more, financial statements prepared in accordance with U.S. GAAP, management’s certifications concerning responsibility for the financial statements, internal controls and compliance with legal requirements designated by the FDIC, and an attestation by the independent auditor regarding the statements of management relating to the internal controls must be submitted.
21
For insured institutions with total assets of more than $3.0 billion, independent auditors may be required to review quarterly financial statements. The FDICIA requires that institutions with total assets of $1.0 billion or more have independent audit committees, consisting of outside directors only. The committees of insured institutions with total assets of $3.0 billion or more must include members with experience in banking or financial management, must have access to outside counsel, and must not include representatives of large customers.
The foregoing is only a brief summary of certain statutes, rules, and regulations that may affect Southern National and the Bank. Numerous other statutes and regulations also will have an impact on the operations of Southern National and the Bank. Supervision, regulation and examination of banks by the regulatory agencies are intended primarily for the protection of depositors, not shareholders.
Item 1A. Risk Factors
An investment in our common stock involves risks. The following is a description of the material risks and uncertainties that Southern National believes affect its business and should be considered before making an investment in our common stock. Additional risks and uncertainties that we are unaware of, or that we currently deem immaterial, also may become important factors that affect us and our business. If any of the risks described in this Annual Report on Form 10-K were to actually occur, our financial condition, results of operations and cash flows could be materially and adversely affected. If this were to happen, the value of our common stock could decline significantly and you could lose part or all of your investment.
General market conditions and economic trends could have a material adverse effect on our business, financial condition and results of operations.
The state of the economy and various economic factors, including inflation, recession, unemployment, interest rates, declining oil prices and the level of U.S. debt, as well as governmental action and uncertainty resulting from U.S. and global political trends, may directly or indirectly, have a destabilizing effect on our financial condition and results of operations. An unfavorable or uncertain national or regional political or economic environment could drive losses beyond those which are provided for in our allowance for loan losses and result in the following consequences:
| ● | increases in loan delinquencies; |
| ● | increases in nonperforming assets and foreclosures; |
| ● | decreases in demand for our products and services, which could adversely affect our liquidity position; and |
| ● | decreases in the value of the collateral securing our loans, especially real estate, which could reduce customers’ borrowing power. |
Any of the foregoing could adversely affect our financial condition and results of operations. While economic conditions in the Commonwealth of Virginia and the U.S. are stable, there can be no assurance that the economy will remain stable.
The Bank is also directly affected by government monetary and fiscal policy and by regulatory measures affecting the banking industry and the economy in general. The actions of the FRBFederal Reserve Bank (“FRB”) as the nation’s central bank can directly affect the money supply and, in general, affect the lending activities of banks by increasing or decreasing the cost and availability of funds. An important function of the FRB is to regulate the national supply of bank credit. Among the instruments of monetary policy used by the FRB to implement this objective are open market operations in United States government securities, changes in the discount rate on member bank borrowings and changes in reserve requirements against bank deposits. These means are used in varying combinations to influence overall growth of bank loans, investments and deposits, and interest rates charged on loans or paid on deposits. The monetary policies of the FRB have had a significant effect on the operating results of commercial banks in the past and are expected to continue to do so in the future; however, the effects of the various FRB policies on our future business and earnings cannot be predicted.
22
Liquidity risk could impair our ability to fund operations and jeopardize our financial condition, results of operations and cash flows.
Liquidity is essential to our business. Our ability to implement our business strategy will depend on our ability to obtain funding for loan originations, working capital, possible acquisitions and other general corporate purposes. An inability to raise funds through deposits, borrowings, securities sold under agreements to repurchase, the sale of loans and other sources could have a substantial negative effect on our liquidity. We do not anticipate that our retail and commercial deposits will be sufficient to meet our funding needs in the foreseeable future. We therefore rely on deposits obtained through intermediaries, FHLB advances, and other wholesale funding sources to obtain the funds necessary to implement our growth strategy.
Our access to funding sources in amounts adequate to finance our activities or on terms which are acceptable to us could be impaired by factors that affect us specifically or the financial services industry or economy in general, including a decrease in the level of our business activity as a result of a downturn in the markets in which our loans are concentrated or adverse regulatory action against us. Our ability to borrow could also be impaired by factors that are not specific to us, such as a disruption in the financial markets or negative views and expectations about the prospects for the financial services industry. To the extent we are not successful in obtaining such funding, we will be unable to implement our strategy as planned which could have a material adverse effect on our financial condition, results of operations and cash flows.
Our information systems may experience an interruption or breach in security.
We rely heavily on communications and information systems provided both internally and externally to conduct our business. Any failure, interruption or breach in security of these systems (such as a spike in transaction volume, a cyber-attack or other unforeseen events) could result in failures or disruptions in our customer relationship management, general ledger, deposit, loan and other systems. While we have policies and procedures and service level agreements designed to prevent or limit the effect of the failure, interruption or security breach of our information systems, there can be no assurance that any such failures, interruptions or security breaches will not occur or, if they do occur, that they will be adequately addressed. While we maintain an insurance policy which we believe provides sufficient coverage at a manageable expense for an institution of our size and scope with similar technological systems, we cannot assure shareholders that this policy would be sufficient to cover all related financial losses and damages should we experience any one or more of our or a third party’s systems failing or experiencing a cyber-attack. The occurrence of any failures, interruptions or security breaches of our information systems could damage our reputation, result in a loss of customer business, subject us to additional regulatory scrutiny, or expose us to civil litigation and possible financial liability, including remediation costs and increased protection costs, any of which could have a material adverse effect on our financial condition and results of operations.
We face significant cyber and data security risk that could result in the disclosure of confidential information, adversely affect our business or reputation and expose us to significant liabilities.
As a financial institution, we are under threat of loss due to hacking and cyber-attacks. This risk has increased in recent years, and continues to increase, as we continue to expand customer capabilities to utilize internet and other remote channels to transact business. Two of the most significant cyber-attack risks that we face are e-fraud and loss of sensitive customer data. Loss from e-fraud occurs when cybercriminals breach and extract funds directly from customer or our accounts. The attempts to breach sensitive customer data, such as account numbers and social security numbers, are less frequent but would present significant reputational, legal and/or regulatory costs to us if successful. Our risk and exposure to these matters remains heightened because of the evolving nature and complexity of these threats from cybercriminals and hackers, our plans to continue to provide internet banking and mobile banking channels, and our plans to develop additional remote connectivity solutions to serve our customers. While we have not experienced any material losses relating to cyber-attacks or other information security breaches since 2017, we have been subject of hacking and cyber-attack and there can be no assurance that we will not suffer additional losses in the future.
The occurrence of any cyber-attack or information security breach could result in material adverse consequences to us including damage to our reputation and the loss of customers. We also could face litigation or additional regulatory
23
scrutiny. Litigation or regulatory actions in turn could lead to significant liability or other sanctions, including fines and penalties or reimbursement of customers adversely affected by security breach. Even if we do not suffer any material adverse consequences as a result of other future events, successful attacks or systems failures at the Bank or at other financial institutions could lead to a general loss of customer confidence in financial institutions including the Bank.
Our ability to mitigate the adverse consequences of occurrences is in part dependent on the quality of our information security procedures and contracts and our ability to anticipate the timing and nature of any such event that occurs. In recent years, we have incurred significant expense towards improving the reliability of our systems and their security from attack. Nonetheless, there remains the risk that we may be materially harmed by cyber-attack and information security breach or others in the future. Methods used to attack information systems change frequently (with generally increasing sophistication), often are not recognized until launched against a target, may be supported by foreign governments or other well-financed entities, and may originate from less regulated and remote areas around the world. As a result, we may be unable to address these methods in advance of attacks, including by implementing adequate preventive measures. If such an attack or breach does occur, we might not be able to fix it timely or adequately. To the extent that such an attack or breach relates to products or services provided by others, we seek to engage in due diligence and monitoring to limit the risk. In addition, as the regulatory environment related to information security, data collection and use, and privacy becomes increasingly rigorous, with new and constantly changing requirements applicable to our business, compliance with those requirements could also result in additional costs.
We must respond to rapid technological changes and these changes may be more difficult or expensive than anticipated.
If competitors introduce new products and services embodying new technologies, or if new industry standards and practices emerge, our existing product and service offerings, technology and systems may become obsolete. Further, if we fail to adopt or develop new technologies or to adapt our products and services to emerging industry standards, we may lose current and future customers, which could have a material adverse effect on our business, financial condition and results of operations. The financial services industry is changing rapidly and in order to remain competitive, we must continue to enhance and improve the functionality and features of our products, services and technologies. These changes may be more difficult or expensive than we anticipate.
If our nonperforming assets increase, our earnings will suffer.
At December 31, 2019, our non-covered nonperforming assets (which consist of non-covered nonaccrual loans, loans past due 90 days and accruing and OREO) totaled $15.1 million, or 0.69% of total non-covered loans and OREO, which is an increase of $3.3 million, or 30.0%, compared with non-covered nonperforming assets of $11.8 million, or 0.54% of total non-covered loans and OREO at December 31, 2018. At December 31, 2017, our non-covered nonperforming assets were $24.5 million, or 1.20% of total non-covered loans and OREO.
Although economic and market conditions are stable, and our non-covered nonperforming assets as a percentage of total non-covered loans and OREO has improved, we may incur losses if there is a continued increase in non-covered nonperforming assets in the future. Our nonperforming assets adversely affect our net income in various ways. We do not record interest income on nonaccrual loans or OREO, thereby adversely affecting our net interest income, and increasing loan administration costs. When we take collateral in foreclosures and similar proceedings, we are required to mark the related loan to the then fair value of the collateral, which may ultimately result in a loss. We must reserve for probable losses, which is established through a current period charge to the provision for loan losses as well as from time to time, as appropriate, a write down of the value of properties in our OREO portfolio to reflect changing market values. Additionally, there are legal fees associated with the resolution of problem assets as well as carrying costs such as taxes, insurance and maintenance related to our OREO. Further, the resolution of nonperforming assets requires the active involvement of management, which can distract them from more profitable activity. Finally, an increase in the level of nonperforming assets increases our regulatory risk profile. There can be no assurance that we will not experience future increases in nonperforming assets.
24
A significant amount of our loans are secured by real estate and any declines in real estate values in our primary markets could be detrimental to our financial condition and results of operations.
Real estate lending (including commercial, construction, land development, and residential loans) is a large portion of our loan portfolio, constituting $1.94 billion, or approximately 88.7% of our total loan portfolio, as of December 31, 2019. Although residential and commercial real estate values are strong in our market area, such values may not remain elevated. If loans that are collateralized by real estate become troubled during a time when market conditions are declining or have declined, then we may not be able to realize the full value of the collateral that we anticipated at the time of originating the loan, which could require us to increase our provision for loan losses and adversely affect our financial condition and results of operations.
As of December 31, 2019, $713.8 million, or approximately 32.7% of our total loans, were secured by single-family residential real estate. This includes $604.8 million in residential 1-4 family loans and $109.0 million in home equity lines of credit. Total single-family residential real estate loans covered under the FDIC loss sharing agreement amount to $13.5 million as of December 31, 2019. If housing markets in our market areas do not remain strong or deteriorate, we may experience an increase in nonperforming loans, provision for loan losses and charge-offs.
If the value of real estate in our market areas were to decline materially, a significant portion of our loan portfolio could become under-collateralized, which could have a material adverse effect on our asset quality, capital structure and profitability.
As of December 31, 2019, a significant portion of our loan portfolio was comprised of loans secured by commercial real estate. In the majority of these loans, real estate was the primary collateral component. In some cases we take real estate as security for a loan even when it is not the primary component of collateral. The real estate collateral that provides the primary or an alternate source of repayment in the event of default may deteriorate in value during the term of the loan as a result of changes in economic conditions, fluctuations in interest rates and the availability of loans to potential purchasers, changes in tax and other laws and acts of nature. If we are required to liquidate the collateral securing a loan to satisfy the debt during a period of reduced real estate values, our earnings and capital could be adversely affected. We are subject to increased lending risks in the form of loan defaults as a result of the high concentration of real estate lending in our loan portfolio. A weak real estate market in our primary market areas could have an adverse effect on the demand for new loans, the ability of borrowers to repay outstanding loans, the value of real estate and other collateral securing the loans and the value of real estate owned by us. If real estate values decline, it is also more likely that we would be required to increase our allowance for loan losses, which could adversely affect our financial condition and results of operations.
A new accounting standard will result in a significant change in how we recognize credit losses and may have a material impact on our financial condition or results of operations.
In June 2016, the Financial Accounting Standards Board (“FASB”) issued Accounting Standards Update (“ASU”) 2016-13, Financial Instruments-Credit Losses (Topic 326), Measurement of Credit Losses on Financial Instruments, which -replaces the current “incurred loss” model for recognizing credit losses with an “expected loss” model referred to as the Current Expected Credit Loss (“CECL”) model. Under the CECL model, we will be required to present certain financial assets carried at amortized cost, such as loans held for investment and held-to-maturity debt securities, at the net amount expected to be collected. The measurement of expected credit losses is to be based on information about past events, including historical experience, current conditions, and reasonable and supportable forecasts that affect the collectability of the reported amount. This measurement will take place at the time the financial asset is first added to the balance sheet and periodically thereafter. This differs significantly from the “incurred loss” model required under current U.S. GAAP, which delays recognition until it is probable a loss has been incurred. Accordingly, we expect that the adoption of the CECL model will materially affect how we determine our allowance for loan losses and could require us to significantly increase our allowance. Moreover, the CECL model may create more volatility in the level of our allowance for loan losses. If we are required to materially increase our level of allowance for loan losses for any reason, such increase could adversely affect our business, financial condition and results of operations.
25
For SEC reporting companies that do not meet the definition of a smaller reporting company and with December 31 calendar year ends, such as Southern National, CECL became effective January 1, 2020. On December 21, 2018, the federal banking agencies issued a joint final rule to revise their regulatory capital rules to (i) address the upcoming implementation of the CECL accounting standard under GAAP; (ii) provide an optional three-year phase-in period for the day-one adverse regulatory capital effects that banking organizations are expected to experience upon adopting CECL; and (iii) require the use of CECL in stress tests beginning with the 2020 capital planning and stress testing cycle for certain banking organizations. We plan to elect the federal banking agencies’ rule providing for an optional three-year phase-in period for the day-one adverse regulatory capital effects upon adopting the standard. We are currently evaluating the impact the CECL model will have on our accounting, but we expect to recognize a one-time cumulative-effect adjustment to our allowance for loan losses as of January 1, 2020, consistent with regulatory expectations set forth in interagency guidance issued at the end of 2016. We currently expect the adoption of this ASU will result in an increase of approximately $10.0 million to $15.0 million in our allowance for loan losses, including transfers of non-accretable discount on purchased credit-impaired loans. We do not expect this ASU to have a material impact on our investment securities portfolio at implementation.
Failure to maintain an effective system of disclosure controls and procedures could have a material adverse effect on our business, results of operations and financial condition and could impact the price of our common stock.
Failure to maintain an effective internal control environment could result in us not being able to accurately report our financial results, prevent or detect fraud, or provide timely and reliable financial information pursuant to our reporting obligations, which could have a material adverse effect on our business, financial condition, and results of operations. Further, it could cause our investors to lose confidence in the financial information we report, which could affect the trading price of our common stock.
Management regularly reviews and updates our disclosure controls and procedures, including our internal control over financial reporting. Any system of controls, however well designed and operated, is based in part on certain assumptions and can provide only reasonable, not absolute, assurances that the objectives of the system are met. Any failure or circumvention of our controls and procedures or failure to comply with regulations related to controls and procedures could have a material adverse effect on our business, results of operations and financial condition.
If our allowance for loan losses is not adequate to cover actual loan losses, our earnings will decrease.
As a lender, we are exposed to the risk that our borrowers may not repay their loans according to the terms of these loans, and the collateral securing the payment of these loans may be insufficient to ensure repayment. We make various assumptions and judgments about the collectability of our loan portfolio, including the creditworthiness of the borrowers and the value of the real estate and other assets serving as collateral for the repayment of many of our loans. We maintain an allowance for loan losses to cover any probable inherent loan losses in the loan portfolio. In determining the size of the allowance, we rely on a periodic analysis of our loan portfolio, our historical loss experience and our evaluation of general economic conditions. If our assumptions prove to be incorrect or if we experience significant loan losses, our current allowance may not be sufficient to cover actual loan losses and adjustments may be necessary to allow for different economic conditions or adverse developments in our loan portfolio. A material addition to the allowance for loan losses could cause our earnings to decrease. Due to the relatively unseasoned nature of our loan portfolio, we may experience an increase in delinquencies and losses as these loans continue to mature.
In addition, federal regulators periodically review our allowance for loan losses and may require us to increase our provision for loan losses or recognize further charge-offs, based on judgments different than those of our management. Any significant increase in our allowance for loan losses or charge-offs required by these regulatory agencies could have a material adverse effect on our results of operations and financial condition.
Our business is subject to interest rate risk and variations in interest rates may negatively affect our financial performance.
The majority of our assets and liabilities are monetary in nature and subject us to significant risk from changes in interest rates. Fluctuations in interest rates are not predictable or controllable. Like most financial institutions, changes in interest
26
rates can impact our net interest income as well as the valuation of our assets and liabilities, which is the difference between interest earned from interest-earning assets, such as loans and investment securities, and interest paid on interest-bearing liabilities, such as deposits and borrowings. We expect that we will periodically experience “gaps” in the interest rate sensitivities of our assets and liabilities, meaning that either our interest-bearing liabilities will be more sensitive to changes in market interest rates than our interest-earning assets, or vice versa. In either event, if market interest rates should move contrary to our position, this “gap” will negatively impact our earnings. Many factors impact interest rates, including governmental monetary policies, inflation, recession, changes in unemployment, the money supply, and international disorder and instability in domestic and foreign financial markets.
Based on our analysis of the interest rate sensitivity of our assets, an increase in the general level of interest rates may negatively affect the market value of the portfolio equity, but will positively affect our net interest income since most of our assets have floating rates of interest that adjust fairly quickly to changes in market rates of interest. Additionally, an increase in interest rates may, among other things, reduce the demand for loans and our ability to originate loans. A decrease in the general level of interest rates may affect us through, among other things, increased prepayments on our loan and mortgage-backed securities portfolios and increased competition for deposits. Accordingly, changes in the level of market interest rates affect our net yield on interest-earning assets, loan origination volume, loan and mortgage-backed securities portfolios, and our overall results. Although our asset liability management strategy is designed to control our risk from changes in market interest rates, it may not be able to prevent changes in interest rates from having a material adverse effect on our results of operations and financial condition.
We are dependent on key personnel and the loss of one or more of those key personnel could impair our relationship with our customers and adversely affect our business.
Many community banks attract customers based on the personal relationships that the banks’ officers and customers establish with each other and the confidence that the customers have in the officers. We significantly depend on the continued service and performance of our key management personnel. We also believe our management team’s depth and breadth of experience in the banking industry is integral to executing our business plan. The loss of the services of members of our senior management team or other key employees or the inability to attract additional qualified personnel as needed could have a material adverse effect on our business.
Our profitability depends significantly on local economic conditions in the areas where our operations and loans are concentrated.
We operate in a mixed market environment with influences from both rural and urban areas. Our profitability depends on the general economic conditions in our market areas of Northern Virginia, Maryland, Washington, D.C., Charlottesville and Clifton Forge (Alleghany County), Front Royal, New Market, Northern Neck, Middle Peninsula, Richmond, Hampton Roads and the surrounding areas. Unlike larger banks that are more geographically diversified, we provide banking and financial services to clients primarily in these market areas. As of December 31, 2019, substantially all of our commercial real estate, real estate construction and residential real estate loans were made to borrowers in our market area. The local economic conditions in this area have a significant impact on our commercial, real estate and construction and consumer loans, the ability of the borrowers to repay these loans and the value of the collateral securing these loans. In addition, if the population or income growth in these market areas slows, stops or declines, income levels, deposits and housing starts could be adversely affected and could result in the curtailment of our expansion, growth and profitability.
Additionally, political conditions could impact our earnings. For example, political debate over the budget, taxes and the potential for reduced government spending may adversely impact the economy, and more specifically local economic conditions given the concentration of Federal workers and government contractors in our market. Acts or threats of war, terrorism, an outbreak of hostilities or other international or domestic calamities, or other factors beyond our control could impact these local economic conditions and could negatively affect the financial results of our banking operations.
27
We rely on third-party vendors to provide key components of our business infrastructure.
Third-party vendors provide key components of our business operations such as data processing, recording and monitoring transactions, online banking interfaces and services, Internet connections and network access. We have selected these third-party vendors carefully and have conducted the due diligence consistent with regulatory guidance and best practices. While we have ongoing programs to review third-party vendors and assess risk, we do not control their actions. Any problems caused by these third parties, including those resulting from disruptions in communication services provided by a vendor, failure of a vendor to handle current or higher volumes, cyber-attacks and security breaches at a vendor, failure of a vendor to provide services for any reason or poor performance of services, could adversely affect our ability to deliver products and services to our customers and otherwise conduct our business. Financial or operational difficulties of a third-party vendor could also hurt our operations if those difficulties interfere with the vendor’s ability to serve us. Furthermore, our vendors could also be sources of operational and information security risk to us, including from breakdowns or failures of their own systems or capacity constraints. Replacing these third-party vendors could also create significant delay and expense. Accordingly, use of such third parties creates an unavoidable inherent risk to our business operations.
Declines in asset values may result in impairment charges and adversely affect the value of our investment securities, financial performance and capital.
We maintain an investment securities portfolio that includes, but is not limited to, collateralized mortgage obligations, agency mortgage-backed securities and pooled trust preferred securities. The market
Our pooled trust preferred securities are particularly vulnerable to the performance of the issuer of the subordinated debentures that are collateral for the trust preferred securities. Deterioration of these trust preferred securities can occur because of defaults by the issuer of the collateral or because of deferrals of dividend payments on the securities. Numerous financial institutions have failed subsequent to their issuance of trust preferred securities, and their parent bank holding companies have filed for bankruptcy, which has led to defaults in the subordinated debentures that collateralize the trust preferred securities. Further, increased regulatory pressure has been placed on financial institutions to maintain capital ratios above the required minimum to be well-capitalized, which often results in restrictions on dividends, and leads to deferrals of dividend payments on the trust preferred securities. More specifically, the FRB has stated that a bank holding company should eliminate, defer or significantly reduce dividends if (i) its net income available to shareholders for the past four quarters, net of dividends paid, is not sufficient to fully fund the dividends, (ii) its prospective rate of earnings retention is not consistent with its capital needs or (iii) it is in danger of not meeting its minimum regulatory capital adequacy ratios. In addition, although interest deferrals are permitted under the terms of the instruments governing the trust preferred securities, such deferrals are typically limited to 20 consecutive quarterly periods. As a result, many financial institutions that commenced deferral periods in 2009 are no longer permitted to defer interest payments, which could result in increased defaults on trust preferred securities. Additional defaults in the underlying collateral or deferrals of dividend payments for these securities could lead to additional charges on these securities and/or other-than-temporary impairment charges on other trust preferred securities we own. Finally, proposed or future changes in the regulatory treatment of both issuers and holders of trust preferred securities could have a negative impact on the value of the pooled trust preferred securities held in our portfolio.
28
We are subject to risks related to our concentration of construction and land development and commercial real estate loans.
As of December 31, 2017,2019, we had $198.0$150.8 million of construction and land development loans. Construction and land development loans are subject to risks during the construction phase that are not present in standard residential real estate and commercial real estate loans. These risks include:
| ● | the viability of the contractor; |
| ● | the contractor’s ability to successfully complete the project, to meet deadlines and time schedules and to stay within cost estimates; and |
| ● | concentrations of such loans with a single contractor and its affiliates. |
Real estate construction and land development loans may involve the disbursement of substantial funds with repayment dependent, in part, on the success of the ultimate project rather than the ability of a borrower or guarantor to repay the loan and also present risks of default in the event of declines in property values or volatility in the real estate market during the construction phase. Our practice, in the majority of instances, is to secure the personal guaranty of individuals in support of our real estate construction and land development loans which provides us with an additional source of repayment. As of December 31, 2017,2019, we had $10.0 million ofdid not have any nonperforming construction and land development loans and $3.2had $2.9 million of assets that have been foreclosed. If one or more of our larger borrowers were to default on their construction and land development loans, and we did not have alternative sources of repayment through personal guarantees or other sources, or if any of the aforementioned risks were to occur, we could incur significant losses.
As of December 31, 2017,2019, we had $936.5 million$1.07 billion of commercial real estate loans, including multi-family residential loans and loans secured by farmland, none of which is covered by the FDIC loss sharing agreement. Commercial real estate lending typically involves higher loan principal amounts and the repayment is dependent, in large part, on sufficient income from the properties securing the loan to cover operating expenses and debt service.
In addition, the Dodd-Frank Act contains provisions that may impact the Bank’s business by reducing the amount of our commercial real estate lending and increasing the cost of borrowing, including rules relating to risk retention of securitized assets. Section 941 of the Dodd-Frank Act requires,and its implementing rules require, among other things, that a loan originator or a securitizer of asset-backed securities retain a percentage of the credit risk of securitized assets. The banking agencies have jointly issued a final rule to implement these requirements, which became effective on December 24, 2015 for residential mortgage-backed securitizations and became effective on December 24, 2016 for classes of asset-backed securities other than residential mortgage-backed securitizations. BanksIn addition, with higher levels of commercial real estate loans are expected to implement improved underwriting, internal controls, risk management policies and portfolio stress testing, as well as higher levels of allowances for loan losses and capital levels as a result of commercial real estate lending growth and exposures. The Bank’s commercial real estate loans are below the thresholds identified as significant by the regulatory guidance. If there is deterioration in our commercial real estate portfolio or if regulatory authorities conclude that we have not implemented appropriate risk management policies and practices, it could adversely affect our business and result in a requirement of increased capital levels, and such capital may not be available at that time.
We are subject to credit quality risks and our credit policies may not be sufficient to avoid losses.
We are subject to the risk of losses resulting from the failure of borrowers, guarantors and related parties to pay interest and principal amounts on their loans. Although we maintain credit policies and credit
Our business strategy includes strategic growth, and our financial condition and results of operations could be negatively affected if we fail to grow or fail to manage our growth effectively.
We completed the merger with EVBS on June 23, 2017, the acquisition of PGFSB on August 1, 2014, the acquisition of the HarVest Bank of Maryland on April 27, 2012, the acquisition of the Midlothian
29
We intend to continue pursuing a growth strategy for our business. Our prospects must be considered in light of the risks, expenses and difficulties frequently encountered by growing companies such as the continuing need for infrastructure and personnel, the time and costs inherent in integrating a series of different operations and the ongoing expense of acquiring and staffing new banks or branches. We may not be able to expand our presence in our existing markets or successfully enter new markets and any expansion could adversely affect our results of operations. Failure to manage our growth effectively could have a material adverse effect on our business, future prospects, financial condition or results of operations, and could adversely affect our ability to successfully implement our business strategy. Our ability to grow successfully will depend on a variety of factors, including the continued availability of desirable business opportunities, the competitive responses from other financial institutions in our market areas and our ability to manage our growth. There
Although there can be no assurance of success or the availability of branch or bank acquisitions in the future.
We may not be able to successfully integrate the business of EVBS and we may failour acquisitions or to realize all of the anticipated benefits of them.
A successful integration of each acquired bank with ours will depend substantially on our ability to successfully consolidate operations, corporate cultures, systems and procedures and to eliminate redundancies and costs. While we have substantial experience in successfully integrating institutions we have acquired, we may encounter difficulties during integration, such as:
| ● | the loss of key employees; |
| ● | the disruption of operations and businesses; |
| ● | loan and deposit attrition, customer loss and revenue loss; |
| ● | possible inconsistencies in standards, control procedures and policies; |
| ● | unexpected issues with expected branch closures; and/or |
| ● | unexpected issues with costs, operations, personnel, technology and credit; |
all of which could divert resources from regular banking operations. Additionally, general market and economic conditions or governmental actions affecting the acquisition of EVBS.
Further, we acquire banks with the expectation that these mergers will result in various benefits including, among other things, benefits relating to fully integrateenhanced revenues, a strengthened market position for the business of EVBS into our existing operations are greater than anticipated, or we are not able to achievecombined company, cross selling opportunities, technology, cost savings and operating efficiencies. Achieving the anticipated benefits of these mergers is subject to a number of uncertainties, including whether we integrate these institutions in an efficient and effective manner, and general competitive factors in the acquisition, including cost savings and other synergies, our business could be negatively affected. In addition, it is possible that we could lose key employees from EVBS’s legacy operations, and that fully integrating EVBS’s legacy operationsmarketplace. Failure to achieve these anticipated benefits could result in loss of customers,a reduction in the disruptionprice of our ongoing businesses or inconsistenciesshares as well as in standards, controls, procedures and policies that adversely affect our ability to maintain relationships with customers and employees or to achieve the anticipated benefits of the acquisition. Integration efforts also may divert management attention and resources, which could adversely affect our ability to service our existing business and generate new business, which in turn could adversely affect our business and financial results.
Future growth or operating results may require us to raise additional capital, but that capital may not be available, be available on unfavorable terms or may be dilutive.
Sonabank is required by the FRB to maintain adequate levels of capital to support our operations. In the event that our future operating results erode capital, if the Bank is required to maintain capital in excess of well-capitalized standards,
30
or if we elect to expand through loan growth or acquisitions, we may be required to raise additional capital. Our ability to raise capital will depend on conditions in the capital markets, which are outside our control, and on our financial performance. Accordingly, we cannot be assured of our ability to raise capital on favorable terms when needed, or at all. If we cannot raise additional capital when needed, we will be subject to increased regulatory supervision and the imposition of restrictions on our growth and business. These outcomes could negatively impact our ability to operate or
Our stock price can be volatile.
Stock price volatility may make it more difficult for you to resell your common stock when you want and at prices you find attractive. Our stock price can fluctuate significantly in response to a variety of factors including, among other things:
| ● | actual or anticipated variations in quarterly results of operations; |
| ● | recommendations by securities analysts; |
| ● | operating and stock price performance of other companies that investors deem comparable to us; |
| ● | news reports relating to trends, concerns and other issues in the financial services industry; |
| ● | perceptions in the marketplace regarding us and/or our competitors; |
| ● | new technology used, or services offered, by competitors; |
| ● | significant acquisitions or business combinations, strategic partnerships, joint ventures or capital commitments by or involving us or our competitors; |
| ● | failure to integrate acquisitions or realize anticipated benefits from acquisitions; |
| ● | changes in government regulations; and |
| ● | geopolitical conditions such as acts or threats of terrorism, military conflicts or pandemics. |
General market fluctuations, industry factors and general economic and political conditions and events, such as economic slowdowns or recessions, interest rate changes or credit loss trends, could also cause our stock price to decrease regardless of operating results.
The small to medium-sized businesses we lend to may have fewer resources to weather a downturn in the economy, which may impair a borrower’s ability to repay a loan to us that could materially harm our operating results.
We make loans to professional firms and privately owned businesses that are considered to be small to medium-sized businesses. Small to medium-sized businesses frequently have smaller market shares than their competition, may be more vulnerable to economic downturns, often need substantial additional capital to expand or compete and may experience substantial volatility in operating results, any of which may impair a borrower’s ability to repay a loan. In addition, the success of a small and medium-sized business often depends on the management talents and efforts of one or two persons or a small group of persons, and the death, disability or resignation of one or more of these persons could have a material adverse impact on the business and its ability to repay our loan. Economic downturns in our target markets could cause us to incur substantial loan losses that could materially harm our operating results.
We are heavily regulated by federal and state agencies; changes in laws and regulations or failures to comply with such laws and regulations may adversely affect our operations and our financial results.
We and the Bank are subject to extensive regulation, supervision and examination by federal and state banking authorities. Any change in applicable regulations or federal or state legislation could have a substantial impact on us and the Bank, and our respective operations. Additional legislation and regulations may be enacted or adopted in the future
31
that could significantly affect our powers, authority and operations or the powers, authority and operations of the Bank, which could have a material adverse effect on our financial condition and results of operations.
Further, bank regulatory authorities have the authority to bring enforcement actions against banks and their holding companies for unsafe or unsound practices in the conduct of their businesses or for violations of any law, rule or regulation, any condition imposed in writing by the appropriate bank regulatory agency or any written agreement with the agency. Possible enforcement actions against us could include the issuance of a cease-and-desist order that could be judicially enforced, the imposition of civil monetary penalties, the issuance of directives to increase capital or enter into a strategic transaction, whether by merger or otherwise, with a third party, the appointment of a conservator or receiver, the termination of insurance on deposits, the issuance of removal and prohibition orders against institution-affiliated parties, and the enforcement of such actions through injunctions or restraining orders. The exercise of this regulatory discretion and power may have a negative impact on us.
As a regulated entity, Sonabank must maintain certain required levels of regulatory capital that may limit our operations and potential growth.
As further described above under Supervision and Regulation—Capital Requirements, the Bank is subject to various regulatory capital requirements administered by the FRB.
Failure to meet minimum capital requirements can initiate certain mandatory, and possibly additional, discretionary actions by regulators that, if undertaken, could have a direct material effect on the Bank’s and our consolidated financial statements. Under capital adequacy guidelines and the regulatory framework for prompt corrective action, the Bank must meet specific capital guidelines that involve quantitative measures of the Bank’s assets, liabilities and certain off-balance sheet commitments as calculated under these regulations.
As of December 31, 2019, the Bank exceeded the amounts required to be well capitalized with respect to all four required capital ratios. As of December 31, 2019, the Bank’s leverage, CET1 risk-based capital, Tier 1 risk-based capital and Total risk-based capital ratios were 12.07%, 14.81%, 14.81% and 15.29%, respectively.
Many factors affect the calculation of the Bank’s risk-based assets and its ability to maintain the level of capital required to achieve acceptable capital ratios. For example, changes in risk weightings of assets relative to capital and other factors may combine to increase the amount of risk-weighted assets in the Tier 1 risk-based capital ratio and the Total risk-based capital ratio. Any increases in its risk-weighted assets will require a corresponding increase in its capital to maintain the applicable ratios. In addition, recognized loan losses in excess of amounts reserved for such losses, loan impairments, impairment losses on investment securities and other factors will decrease the Bank’s capital, thereby reducing the level of the applicable ratios.
The Bank’s failure to remain well capitalized for bank regulatory purposes could affect customer confidence, our ability to grow, our costs of funds and FDIC insurance costs, our ability to pay dividends on our capital stock, our ability to make acquisitions, and on our business, results of operations and financial condition. Under FRB rules, if the Bank ceases to be a well capitalized institution for bank regulatory purposes, the interest rates that it pays on deposits and its ability to accept, renew or rollover brokered deposits may be restricted. As of December 31, 2019, we had $114.1 million of brokered deposits, which represented 5.4% of our total deposits.
We may not be able to successfully compete with others for business.
The metropolitan statistical areas in which we operate are considered highly attractive from an economic and demographic viewpoint, and are highly competitive banking markets. We compete for loans, deposits and investment dollars with numerous regional and national banks, online divisions of out-of-market banks and other community banking institutions, as well as other kinds of financial institutions and enterprises, such as securities firms, insurance companies, savings associations, credit unions, mortgage brokers and private lenders. Many competitors have substantially greater resources than us, and operate under less stringent regulatory environments and may accordingly have greater flexibility in competing for business. Over time, certain sectors of the financial services industry have become more concentrated, as institutions involved in a broad range of financial services have been acquired by other
32
firms. These developments could result in our competitors gaining greater capital and other resources, or being able to offer a broader range of products and services with more geographic range. The differences in resources and regulations may make it harder for us to compete profitably, reduce the rates that we can earn on loans and investments, increase the rates we must offer on deposits and other funds and adversely affect our overall financial condition and earnings.
We are subject to transaction risk, which could adversely affect our business, financial condition and results of operations.
We, like all businesses, are subject to transaction risk, which is the risk of loss resulting from human error, fraud or unauthorized transactions due to inadequate or failed internal processes and systems, and external events that are wholly or partially beyond our control (including, for example, computer viruses or electrical or telecommunications outages). Transaction risk also encompasses compliance risk, which is the risk of loss from violations of, or noncompliance with, laws, rules, regulations, prescribed practices or ethical standards. Although we seek to mitigate transaction risk through a system of internal controls, there can be no assurance that we will not suffer losses from transaction risks in the future that may be material in amount. Any losses resulting from transaction risk could take the form of explicit charges, increased operational costs, litigation costs, harm to reputation or forgone opportunities, any and all of which could have a material adverse effect on business, financial condition and results of operations.
The soundness of other financial institutions could adversely affect us.
Financial institutions are interrelated as a result of trading, clearing, counterparty and other relationships. We have exposure to many different industries and counterparties, and we routinely execute transactions with a variety of counterparties in the financial services industry. Many of these transactions expose us to credit risk in the event of default of our counterparty or client. In addition, our credit risk may be exacerbated if the collateral we hold cannot be sold at prices that are sufficient for us to recover the full amount of our exposure. Any such losses could materially and adversely affect our financial condition and results of operations.
If the goodwill that we record in connection with business acquisitions becomes impaired, it could have a negative impact on our profitability.
Goodwill represents the amount of acquisition cost over the fair value of net assets we acquire in the purchase of another entity. We review goodwill for impairment at least annually, or more frequently if events or changes in circumstances indicate the carrying value of the asset might be impaired. Examples of those events or circumstances include the following:
| ● | significant adverse changes in business climate; |
| ● | significant changes in credit quality; |
| ● | significant unanticipated loss of customers; |
| ● | significant loss of deposits or loans; or |
| ● | significant reductions in profitability. |
As of December 31, 2019, our goodwill totaled $101.9 million and is primarily related to the 2017 acquisition of EVBS, which increased goodwill by $91.5 million. While we have recorded no such impairment charges since we initially recorded the goodwill, there can be no assurance that our future evaluations of goodwill will not result in findings of impairment and related write-downs, which may have a material adverse effect on our financial condition and results of operations.
Changes to government guaranteed loan programs could affect our SBA business.
The Bank relies on originating government guaranteed loans, in particular those guaranteed by the SBA. As of December 31, 2019, the Bank had $70.6 million of SBA loans, $45.1 million of which were guaranteed and $25.5 million were non-guaranteed. We can provide no assurance that the Bank will be able to continue originating these loans or that it will be able to sell the loans in the secondary market if market conditions are favorable.
33
SBA lending is a federal government created and administered program. As such, legislative and regulatory developments can affect the availability and funding of the program. This dependence on legislative funding and regulatory restrictions from time to time causes limitations and uncertainties with regard to the continued funding of such loans, with a resulting potential adverse financial impact on our business. Currently, the maximum limit on individual 7(a) loans which the SBA will permit is $5.0 million. Any reduction in this level could adversely affect the volume of our business. The periodic uncertainty of the SBA program relative to availability, amounts of funding and the waiver of associated fees creates greater risk for our business than do more stable aspects of our business.
The federal government presently guarantees up to 85% of the principal amount of loans up to $150,000, 75% for loans greater than $150,000 and up to 90% of the principal amount for certain programs under the 7(a) program. SBA Express loans can be guaranteed by the federal government up to 50%. We can provide no assurance that the federal government will maintain the SBA program, or if it does, that such guaranteed portion will remain at its current funding level. Furthermore, it is possible that the Bank could lose its preferred lender status which, subject to certain limitations, allows it to approve and fund SBA loans without the necessity of having the loan approved in advance by the SBA. It is also possible the federal government could reduce the amount of loans which it guarantees. In addition, we are dependent on the expertise of our personnel who make SBA loans in order to continue to originate and service SBA loans. If we are unable to retain qualified employees in the future, our income from the origination of SBA loans could be substantially reduced.
We depend on the accuracy and completeness of information from customers and counterparties.
In deciding whether to extend credit or enter into other transactions, we rely on information furnished by or on behalf of customers and counterparties, including financial statements, credit reports and other financial information. We also rely on representations of those customers, counterparties or other third parties, such as independent auditors, as to the accuracy and completeness of that information. Reliance on inaccurate or misleading financial statements, credit reports or other financial information could have a material adverse impact on our business, financial condition and results of operations.
Changes in U.S. tax laws and other laws and regulations could have unforeseen effects on our financial condition and results of operations.
Corporate tax rates affect our profitability and capital levels. The U.S. corporate tax code may be further reformed by the U.S. Congress and additional guidance may be issued by the U.S. Department of the Treasury relevant to the Tax Cuts and Jobs Act (Tax Act) enacted during 2017. Any adverse amendments to the Tax Act or other related legislation could have an adverse impact on our financial condition and results of operations.
As a result of the limitation on the deductibility of business interest included in the Tax Cuts and Jobs Act, we may have the right to redeem our currently outstanding subordinated debt.
On January 20, 2017, we issued $27.0 million in aggregate principal amount of 5.875% Fixed-to-Floating Rate Subordinated Notes due January 31, 2027 (the “SNBV Senior Subordinated Notes”). The SNBV Senior Subordinated Notes are generally not redeemable by us until January 20, 2022. However, we are permitted to redeem these notes earlier upon the occurrence of a “tax event”, which is generally defined as a material risk that the interest paid on the Company Notes would not be deductible by us, in whole or in part, for federal income tax purposes. Provisions of the Tax Cuts and Jobs Act impose a limit on the amount of business interest which is deductible, capping that interest deduction at the sum of (i) the taxpayer’s business interest income for the tax year plus (ii) 30% of the taxpayer’s adjusted taxable income for the tax year. As a consequence, in the event the interest payments on the Company Notes exceed the total amount of permitted deductible business interest under the Tax Cuts and Jobs Act, such occurrence could constitute a “tax event” under the Company Notes due to the limitation on the deductibility of our interest payments on the Company Notes and thus permit us to redeem the SNBV Senior Subordinated Notes prior to 2022.
34
An investment in our common stock is not an insured deposit.
Our common stock is not a bank deposit and, therefore, is not insured against loss by the FDIC, any other deposit insurance fund or by any other public or private entity. Investment in our common stock is inherently risky for the reasons described in this “Risk Factors” section and elsewhere in this report and is subject to the same market forces that affect the price of common stock in any company. As a result, if you acquire our common stock, you may lose some or all of your investment.
We may issue a new series of preferred stock or debt securities, which would be senior to our common stock and may cause the market price of our common stock to decline.
We have issued $27.0 million in aggregate principal amount of 5.875% Fixed-to-Floating Rate Subordinated Notes due January 31, 2027. In the future, we may increase our capital resources by making additional offerings of debt or equity securities, which may include senior or additional subordinated notes, classes of preferred shares and/or common shares. Holders of our common stock are not entitled to preemptive rights or other protections against dilution. Preferred shares and debt, if issued, have a preference on liquidating distributions or a preference on dividend or interest payments that could limit our ability to make a distribution to the holders of our common stock. Future issuances and sales of parity preferred stock, or the perception that such issuances and sales could occur, may also cause prevailing market price for our common stock to decline and may adversely affect our ability to raise additional capital in the financial markets at times and prices favorable to us. Further issuances of our common stock could be dilutive to holders of our common stock.
We may be adversely impacted by the transition from LIBOR as a reference rate.
In July 2017, the Financial Conduct Authority (the authority that regulates LIBOR) announced it intends to stop compelling banks to submit rates for the calculation of LIBOR after 2021. The Alternative Reference Rates Committee (“ARRC”) has proposed that the Secured Overnight Financing Rate (“SOFR”) is subjectthe rate that represents best practice as the alternative to interest rate riskUSD-LIBOR for use in derivatives and variations inother financial contracts that are currently indexed to USD-LIBOR. ARRC has proposed a paced market transition plan to SOFR from USD-LIBOR and organizations are currently considering industry wide and company-specific transition plans as it relates to derivatives and cash markets exposed to USD-LIBOR. We have contracts that are indexed to USD-LIBORand are currently evaluating what the ultimate impact of the transition from LIBOR will be and address related risks.
If LIBOR ceases to exist or if the methods of calculating LIBOR change from current methods for any reason, interest rates may negatively affecton our floating rate obligations, loans, deposits and other financial performance.
A portion of our variable rate loans are tied to LIBOR. While many of these loans contain “fallback” provisions providing for alternative rate calculations in the interest rate sensitivitiesevent LIBOR is unavailable, not all of our assetsloans contain these “fallback” provisions and liabilities, meaning that either our interest-bearing liabilities will be more sensitiveexisting “fallback” provisions may not adequately address the actual changes to changes in market interest rates than our interest-earning assets,LIBOR or vice versa. In either event, if market interest rates should move contrary to our position, this “gap” will negatively impact our earnings. Many factors impact interest rates, including governmental monetary policies, inflation, recession, changes in unemployment, the money supply, and international disorder and instability in domestic and foreign financial markets.
The properties that we own and our foreclosed real estate assets could subject us to environmental risks and associated costs.
There is a risk that hazardous substances or wastes, contaminants, pollutants or other environmentally restricted substances could be discovered on our properties or our foreclosed assets (particularly in the case of real estate loans). In this event, we might be required to remove the substances from the affected properties or to engage in abatement procedures at our sole cost and expense. Besides being liable under applicable federal and state statutes for our own
35
conduct, we may also be held liable under certain circumstances for actions of borrowers or other third parties on property that collateralizes one or more of our loans or on property that we own. Potential environmental liability could include the cost of remediation and also damages for any injuries caused to third-parties. We cannot assure you that the cost of removal or abatement would not substantially exceed the value of the affected properties or the loans secured by those properties, that we would have adequate remedies against prior owners or other responsible parties or that we would be able to resell the affected properties either prior to or following completion of any such removal or abatement procedures. Any environmental damages on a property would substantially reduce the value of such property as collateral and, as a result, we may suffer a loss upon collection of the loan.
The smallimplementation of other new lines of business or new products and services may subject us to medium-sized businessesadditional risk.
We continuously evaluate our service offerings and may implement new lines of business or offer new products and services within existing lines of business in the future. There are substantial risks and uncertainties associated with these efforts. In developing and marketing new lines of business and/or new products and services, we lendundergo a new product process to may have fewerassess the risks of the initiative, and invest significant time and resources to weatherbuild internal controls, policies and procedures to mitigate those risks, including hiring experienced management to oversee the implementation of the initiative. Initial timetables for the introduction and development of new lines of business and/or new products or services may not be achieved and price and profitability targets may not prove feasible. External factors, such as compliance with regulations, competitive alternatives, and shifting market preferences, may also impact the successful implementation of a downturn innew line of business and/or a new product or service. Furthermore, any new line of business and/or new product or service could require the economy, which may impairestablishment of new key and other controls and have a borrower’s ability to repay a loan to us that could materially harmsignificant impact on our operating results.
Consumers may decide not to use banks to complete their financial transactions.
Technology and other changes are allowing parties to complete financial transactions that historically have involved banks through alternative methods. For example, consumers can now maintain funds that would have historically been held as bank deposits in brokerage accounts or mutual funds. Consumers can also complete transactions such as paying bills and/or transferring funds directly without the assistance of banks. The process of eliminating banks as intermediaries could result in the loss of fee income, as well as the loss of customer deposits and the related income generated from those deposits. The loss of these revenue streams and the lower cost deposits as a source of funds could have a material adverse effect on our financial condition and results of operations.
Further, clients may choose to conduct business with other market participants who engage in business or offer products in areas we deem speculative or risky, such as cryptocurrencies. Increased competition may negatively affect our earnings by creating pressure to lower prices or credit standards on our products and services requiring additional investment to improve the quality and delivery of our technology and/or reducing our market share, or affecting the willingness of our clients to do business with us.
In addition, the widespread adoption of new technologies, including internet services, cryptocurrencies and payment systems, could require substantial expenditures to modify or adapt our existing products and services as we grow and develop our internet banking and mobile banking channel strategies in addition to remote connectivity solutions. We might not be successful in developing or introducing new products and services, integrating new products or services into our existing offerings, responding or adapting to changes in consumer behavior, preferences, spending, investing
36
and/or saving habits, achieving market acceptance of our products and services, reducing costs in response to pressures to deliver products and services at lower prices or sufficiently developing and maintaining loyal customers.
Provisions of our articles of incorporation and bylaws, as well as state and federal banking regulations, could delay or prevent a takeover of us by a third party.
Our articles of incorporation and bylaws could delay, defer or prevent a third party from acquiring us, despite the possible benefit to our shareholders, or otherwise adversely affect the price of our common stock.
Any individual, acting alone or with other individuals, who are seeking to acquire, directly or indirectly, 10.0% or more of our outstanding common stock must comply with the Change in Bank Control Act, which requires prior notice to the FRB for any acquisition. Additionally, any entitybank holding company that wants to acquire
Employee misconduct could expose us to additional costs, including increased compliance costs. Other changessignificant legal liability and reputational harm.
We are vulnerable to statutes, regulations,reputational harm because we operate in an industry in which integrity and the confidence of our customers are of critical importance. Our employees could engage in fraudulent, illegal, wrongful or suspicious activities, and/or activities resulting in consumer harm that adversely affects our customers and/or our business. The precautions we take to detect and prevent such misconduct may not always be effective and regulatory policies sanctions and/or supervisory guidance, including changes in their interpretation or implementation, may affect us in substantial ways that we cannot predict. These changes also may require us to invest significant management attention and resources to make any necessary changespenalties, serious harm to our operationsreputation, financial condition, customer relationships and ability to attract new customers. In addition, improper use or disclosure of confidential information by our employees, even if inadvertent, could result in orderserious harm to comply, and could therefore also materially adversely affect our business,reputation, financial condition and results of operations.
We currently intend to pay dividends on our common stock; however, our future ability to pay dividends is subject to restrictions.
We declared the first cash dividend on our common stock in February 2012, and each quarter thereafter through 2017. We also declared a special dividend in the fourth quarters of 2014 and 2015.2019. There are a number of restrictions on our ability to pay dividends. It is the policy of the FRB that bank holding companies should pay cash dividends on common stock only out of income available over the past year and only if prospective earnings retention is consistent with the organization’s expected future needs and financial condition. The policy provides that bank holding companies should not maintain a level of cash dividends that undermines the bank holding company’s ability to serve as a source of strength to its banking subsidiaries.
Our principal source of funds to pay dividends on our common stock is cash dividends that we receive from the Bank. The payment of dividends by the Bank to us is subject to certain restrictions imposed by federal banking laws, regulations and authorities. The federal banking statutes prohibit federally insured banks from making any capital distributions (including a dividend payment) if, after making the distribution, the institution would be “under capitalized”"under capitalized" as defined by statute. In addition, the relevant federal regulatory agencies have authority to prohibit an insured bank from engaging in an unsafe or unsound practice, as determined by the agency, in conducting an activity. The payment of dividends could be deemed to constitute such an unsafe or unsound practice, depending on the financial condition of the Bank. Regulatory authorities could impose administratively stricter limitations on the ability of the Bank to pay dividends to us if such limits were deemed appropriate to preserve certain capital adequacy requirements.
37
The trading volume in our common stock is less than that of other larger financial services companies.
Although our common stock is listed for trading on the NASDAQ Global Market, the trading volume is low, and you are not assured liquidity with respect to transactions in our common stock. A public trading market having the desired characteristics of depth, liquidity and orderliness depends on the presence in the marketplace of willing buyers and sellers of our common stock at any given time. This presence depends on the individual decisions of investors and general economic and market conditions over which we have no control. Given the lower trading volume of our common stock, significant sales of our common stock, or the expectation of these sales, could cause our stock price to fall.
Severe weather, natural disasters, climate change, acts of war or terrorism, health emergencies or pandemics and other adverse external events could significantly impact our business.
Severe weather, natural disasters, climate change, acts of war or terrorism, health emergencies or pandemics and other adverse external events could have a significant impact on our ability to conduct business. Such events could affect the
Southern National does not have any unresolved staff comments from the SEC to report for the year ended December 31, 2017.
Southern National’s principal office is located at 6830 Old Dominion Drive, McLean, Virginia. Southern National and Sonabank also have executive offices located at 1002 Wisconsin Avenue, N.W., Washington, DC and 10900 Nuckols Road, Suite 325, Glen Allen, Virginia. Including these main locations, our bank owns 29 properties and leases 25 properties, all of which are used as branch locations or for housing operational units in Maryland and Virginia. At December 31, 2017,2019, Sonabank had 38forty-five full-service branches. Thirty-eight full-service retail branches are in Virginia, located in Ashland, Burgess, Callao, Central Garage, Charlottesville, Chester, Clifton Forge, Colonial Heights, Courtland, Deltaville, Fairfax, Front Royal, Gloucester, Gloucester Point, Hampton, Hartfield, Haymarket, Heathsville, Kilmarnock, Leesburg, McLean, Mechanicsville (2), Middleburg, Midlothian, New Market, Newport News, Quinton, Reston, Richmond, South Riding, Surry, Tappahannock (2), Urbanna, Warrenton, Waverly, and Williamsburg, and seven full-service retail branches in Maryland. Impacting the number of Sonabank’s full-service retail branches in 2017 was the acquisition of EVBS resulting in 24 additional full-service retail branches at the time of the merger. As part of an overall
Southern National believes its facilities are in good operating condition, are suitable and adequate for its operational needs and are adequately insured.
| Location | | | Date Opened or Acquired | | | Owned or Leased | | | Deposits (in thousands) | | |||
| Full Service Branch Offices: | | | | | | | | | | | | | |
| 511 Main Street Clifton Forge, Virginia 24442 | | | December 2005 | | | Owned | | | | $ | 41,606 | | |
| 1770 Timberwood Boulevard Charlottesville, Virginia 22911 | | | April 2005 | | | Leased | | | | | 30,499 | | |
| 6830 Old Dominion Drive McLean, Virginia 22101 | | | December 2006 | | | Leased | | | | | 61,090 | | |
| 11527 Sunrise Valley Drive Reston, Virginia 20191 | | | December 2006 | | | Leased | | | | | 28,291 | | |
| 10855 Fairfax Boulevard Fairfax, Virginia 22030 | | | December 2006 | | | Leased | | | | | 40,364 | | |
| 1 East Market Street Leesburg, Virginia 20176 | | | April 2008 | | | Leased | | | | | 46,347 | | |
| 11 Main Street Warrenton, Virginia 20186 | | | September 2009 | | | Leased | | | | $ | 47,349 | | |
| 11200 Rockville Pike Rockville, Maryland 20852 | | | December 2009 | | | Leased | | | | | 80,126 | | |
| 1 South Front Royal Avenue Front Royal, Virginia 22630 | | | December 2009 | | | Owned | | | | | 36,174 | | |
| 9484 Congress Street New Market, Virginia 22844 | | | December 2009 | | | Owned | | | | | 40,647 | | |
| 43086 Peacock Market Plaza South Riding, Virginia 20152 | | | December 2009 | | | Leased | | | | | 18,632 | | |
| 10 West Washington Street Middleburg, Virginia 20117 | | | May 2011 | | | Leased | | | | | 17,597 | | |
| 13804 Hull Street Road Midlothian, Virginia 23112 | | | October 2011 | | | Owned | | | | | 28,856 | | |
| 9707 Medical Center Drive, Suite 150 Rockville, Maryland 20850 | | | April 2012 | | | Leased | | | | | 40,231 | | |
| Location | | | Date Opened or Acquired | | | Owned or Leased | | | Deposits (in thousands) | | |||
| 6719 Leaberry Way Haymarket, Virginia 20169 | | | August 2012 | | | Leased | | | | | 10,640 | | |
| 7700 Wisconsin Avenue Bethesda, Maryland 22101 | | | October 2012 | | | Leased | | | | | 27,740 | | |
| 4009 Old Town Road Huntingtown, Maryland 20639 | | | August 2014 | | | Leased | | | | | 15,154 | | |
| 137 E. Chesapeake Beach Road Owings, Maryland 20736 | | | August 2014 | | | Owned | | | | | 13,489 | | |
| 14804 Pratt Street Upper Marlboro, Maryland 20772 | | | August 2014 | | | Owned | | | | | 59,690 | | |
| 14118 Brandywine Road Brandywine, Maryland 20613 | | | August 2014 | | | Owned | | | | | 13,777 | | |
| 307 Church Lane(1) Tappahannock, Virginia 22560 | | | June 2017 | | | Owned | | | | | 43,103 | | |
| 1665 Tappahannock Boulevard Tappahannock, Virginia 22560 | | | June 2017 | | | Owned | | | | | 22,468 | | |
| 11290 General Puller Highway Hartfield, Virginia 23071 | | | June 2017 | | | Leased | | | | | 43,492 | | |
| 291 Virginia Street Urbanna, Virginia 23175 | | | June 2017 | | | Owned | | | | | 33,953 | | |
| 16273 General Puller Highway Deltaville, Virginia 23043 | | | June 2017 | | | Leased | | | | | 21,623 | | |
| 7132 George Washington Memorial Highway Gloucester, Virginia 23061 | | | June 2017 | | | Owned | | | | | 35,776 | | |
| 1953 George Washington Memorial Highway Gloucester Point, Virginia 23062 | | | June 2017 | | | Owned | | | | $ | 29,057 | | |
| 20 Commerce Lane King William, Virginia 23086 | | | June 2017 | | | Owned | | | | | 54,049 | | |
| 22241 Main Steet Courtland, Virginia 23837 | | | June 2017 | | | Owned | | | | | 31,354 | | |
| 176 Colonial Trail, East Surry, Virginia 23883 | | | June 2017 | | | Owned | | | | | 24,697 | | |
| 209 West Main Street Waverly, Virginia 23890 | | | June 2017 | | | Owned | | | | | 40,083 | | |
| 2599 New Kent Highway Quinton, Virginia 23141 | | | June 2017 | | | Owned | | | | | 23,726 | | |
| 3012 Boulevard Colonial Heights, Virginia 23834 | | | June 2017 | | | Owned | | | | | 83,606 | | |
| 8821 West Broad Street Richmond, Virginia 23294 | | | June 2017 | | | Leased | | | | | 43,530 | | |
| Location | | | Date Opened or Acquired | | | Owned or Leased | | | Deposits (in thousands) | | |||
| 9706 Atlee Commons Drive Ashland, Virginia 23005 | | | June 2017 | | | Owned | | | | | N/A | | |
| 9718 Atlee Commons Drive Ashland, Virginia 23005 | | | June 2017 | | | Owned | | | | | N/A | | |
| Executive Offices: | | | | | | | | | |||||
| 1002 Wisconsin Avenue, N.W. Washington, D.C. 20007 | | | April 2005 | | | Leased | | | | | N/A | | |
| 10900 Nuckols Road, Suite 325(2)(3) Glen Allen, Virginia 23060 | | | June 2017 | | | Leased | | | | $ | 162,864 | | |
Item 3. Legal Proceedings
Southern National and Sonabank may,are from time to time be a party, as both plaintiff and defendant, to various legalclaims and proceedings arising in the ordinary course of business. There are nothe Bank’s business, including administrative and/or legal proceedings that may include employment-related claims, as well as claims of lender liability, breach of contract, and other proceedings pending,similar lending-related claims. While the ultimate resolution of these matters cannot be determined at this time, the Bank’s management presently believes that such matters, individually and in the aggregate, will not have a material adverse effect on the Bank’s financial condition or to management’s knowledge, threatened, against Southern National or Sonabank asresults of December 31, 2017.operations.
38
PART II
Common Stock Market Prices
Southern National’s common stock is traded on the Nasdaq Global Market under the symbol “SONA”. Our common stock began trading on the Nasdaq Capital Market in November 2006, and the exchange listing was upgraded to the Nasdaq Global Market at the open of trading on December 18, 2007.
| | | | Market Values | | | Dividends Declared | | ||||||||||||||||||||||||||||||
| | | | 2017 | | | 2016 | | | 2017 | | | 2016 | | ||||||||||||||||||||||||
| | | | High | | | Low | | | High | | | Low | | | | | | | | | | | | | | ||||||||||||
| First Quarter | | | | $ | 17.50 | | | | | $ | 15.51 | | | | | $ | 13.40 | | | | | $ | 11.92 | | | | | $ | 0.08 | | | | | $ | 0.08 | | |
| Second Quarter | | | | | 18.48 | | | | | | 15.99 | | | | | | 12.77 | | | | | | 11.60 | | | | | | 0.08 | | | | | | 0.08 | | |
| Third Quarter | | | | | 18.00 | | | | | | 15.26 | | | | | | 13.59 | | | | | | 11.95 | | | | | | 0.08 | | | | | | 0.08 | | |
| Fourth Quarter | | | | | 17.49 | | | | | | 15.12 | | | | | | 16.78 | | | | | | 12.74 | | | | | | 0.08 | | | | | | 0.08 | | |
Recent Sales of Unregistered Securities
None.
Securities Authorized for Issuance under Equity Compensation Plans
As of December 31, 2017,2019, Southern National had outstanding stock options granted under the 2010 Stock Awards and Incentive Plan (the “2010 Plan”) and the 2017 Equity Compensation Plan (the “2017 Plan”), which were approved by its shareholders. The following table provides information as of December 31, 20172019 regarding Southern National’s equity compensation plans under which our equity securities are authorized for issuance:
| Plan category | | | Number of securities to be issued upon exercise of outstanding options, warrants and rights A | | | Weighted average exercise price of outstanding options, warrants and rights B | | | Number of securities remaining available for future issuance under equity compensation plans (excluding securities reflected in column A) C | | |||||||||
| Equity compensation plans approved by security holders | | | | | 714,967 | | | | | $ | 9.83 | | | | | | 724,641 | | |
| Equity compensation plans not approved by security holders | | | | | — | | | | | | — | | | | | | — | | |
| Total | | | | | 714,967 | | | | | $ | 9.83 | | | | | | 724,641 | | |
| | |||||||||||||||||||
| | | | | | | |
| | | | | | Number of securities | |
| | | | | | | remaining available for |
| | | | | | | future issuance under |
| | Number of securities | | Weighted average | | equity compensation plans | |
| | to be issued upon exercise | | exercise price of | | (excluding securities reflected | |
| | of outstanding options | | | outstanding options | | in column A) |
Plan category |
| A |
| B |
| C | |
Equity compensation plans approved by security holders |
| 555,750 | | $ | 10.02 |
| 643,600 |
Equity compensation plans not approved by security holders |
| — | |
| — |
| — |
Total |
| 555,750 | | $ | 10.02 |
| 643,600 |
Issuer Purchases of Equity Securities
None.
Performance Graph
The following chart compares the cumulative total shareholder return on Southern National common stock during the five years ended December 31, 2017,2019, with the cumulative total return of the Russell 2000 Index and the SNL Bank and Thrift Index for the same period. Dividend reinvestment has been assumed. This comparison assumes $100 invested on December 31, 20122014 in Southern National common stock, the Russell 2000 Index and the SNL Bank and Thrift Index.
39
The historical stock price performance for Southern National common stock shown on the graph below is not necessarily indicative of future stock performance.
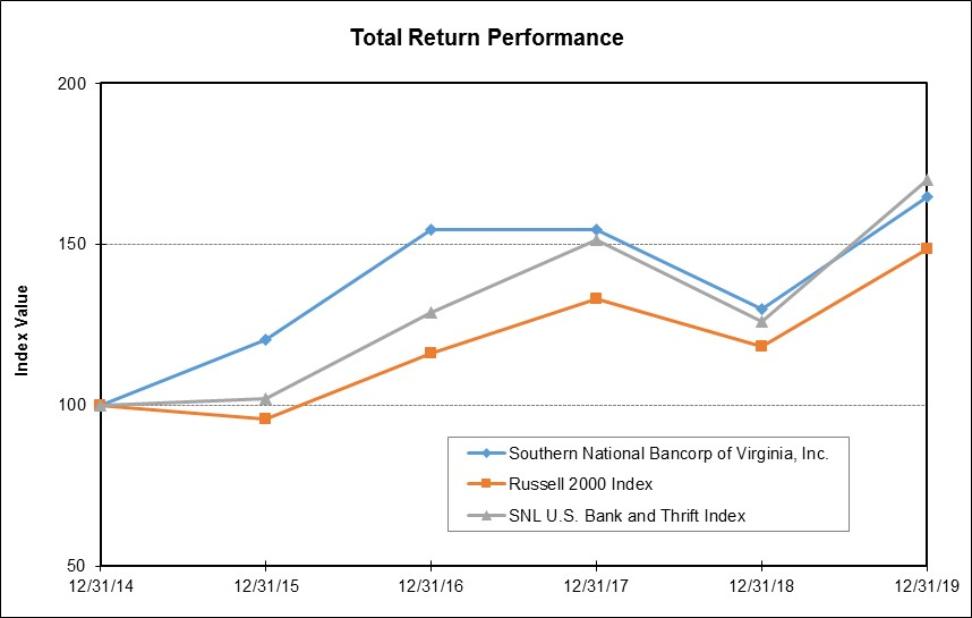
| | | | | | | | | | | | |
|
| 2014 |
| 2015 |
| 2016 |
| 2017 |
| 2018 |
| 2019 |
Southern National Bancorp of Virginia, Inc. |
| 100.00 |
| 120.45 |
| 154.54 |
| 154.57 |
| 129.98 |
| 164.58 |
Russell 2000 Index |
| 100.00 |
| 95.59 |
| 115.95 |
| 132.94 |
| 118.30 |
| 148.49 |
SNL Bank and Thrift Index |
| 100.00 |
| 102.02 |
| 128.80 |
| 151.45 |
| 125.81 |
| 170.04 |

40
| | | | 2012 | | | 2013 | | | 2014 | | | 2015 | | | 2016 | | | 2017 | | ||||||||||||||||||
| Southern National Bancorp of Virginia, Inc. | | | | | 100.00 | | | | | | 126.22 | | | | | | 150.84 | | | | | | 181.68 | | | | | | 233.10 | | | | | | 233.15 | | |
| Russell 2000 Index | | | | | 100.00 | | | | | | 138.82 | | | | | | 145.62 | | | | | | 139.19 | | | | | | 168.85 | | | | | | 193.58 | | |
| SNL Bank and Thrift Index | | | | | 100.00 | | | | | | 136.92 | | | | | | 152.85 | | | | | | 155.94 | | | | | | 196.86 | | | | | | 231.49 | | |
Item 6. Selected Financial Data
The following table sets forth selected financial data for Southern National as of and for the years ended December 31, 2019, 2018, 2017, 2016 2015, 2014 and 2013:2015:
| | | | | | | | | | | | | | | | |
|
| 2019 |
| 2018 |
| 2017 |
| 2016 |
| 2015 |
| |||||
| | (in thousands, except per share amounts) |
| |||||||||||||
Results of Operations: | | | | | | | | | | | | | | | | |
Interest income | | $ | 120,524 | | $ | 118,907 | | $ | 83,570 | | $ | 48,947 | | $ | 43,701 | |
Interest expense | |
| 36,924 | |
| 27,841 | |
| 15,653 | |
| 8,633 | |
| 7,077 | |
Net interest income | |
| 83,600 | |
| 91,066 | |
| 67,917 | |
| 40,314 | |
| 36,624 | |
Provision for loan losses | |
| 350 | |
| 4,200 | |
| 8,625 | |
| 4,912 | |
| 3,171 | |
Net interest income after provision for loan losses | |
| 83,250 | |
| 86,866 | |
| 59,292 | |
| 35,402 | |
| 33,453 | |
Noninterest income | |
| 12,586 | |
| 10,199 | |
| 5,429 | |
| 2,820 | |
| 3,781 | |
Noninterest expenses | |
| 56,592 | |
| 53,760 | |
| 49,149 | |
| 22,815 | |
| 23,278 | |
Income before income taxes | |
| 39,244 | |
| 43,305 | |
| 15,572 | |
| 15,407 | |
| 13,956 | |
Income tax expense | |
| 6,077 | |
| 9,614 | |
| 13,147 | |
| 5,095 | |
| 4,667 | |
Net income | | $ | 33,167 | | $ | 33,691 | | $ | 2,425 | | $ | 10,312 | | $ | 9,289 | |
| | | | | | | | | | | | | | | | |
Per Share Data: | |
|
| |
|
| |
|
| |
|
| |
|
| |
Earnings per share - Basic | | $ | 1.38 | | $ | 1.40 | | $ | 0.13 | | $ | 0.84 | | $ | 0.76 | |
Earnings per share - Diluted | | $ | 1.36 | | $ | 1.39 | | $ | 0.13 | | $ | 0.83 | | $ | 0.75 | |
Cash dividends paid per share | | $ | 0.36 | | $ | 0.32 | | $ | 0.32 | | $ | 0.32 | | $ | 0.52 | |
Book value per share | | $ | 15.60 | | $ | 14.48 | | $ | 13.48 | | $ | 10.30 | | $ | 9.78 | |
Dividend payout ratio | |
| 26.09 | % |
| 22.86 | % |
| 246.15 | % |
| 38.10 | % |
| 68.42 | % |
Weighted average shares outstanding - Basic | |
| 24,050,037 | |
| 24,012,437 | |
| 18,390,810 | |
| 12,251,804 | |
| 12,224,494 | |
Weighted average shares outstanding - Diluted | |
| 24,325,182 | |
| 24,272,617 | |
| 18,671,392 | |
| 12,426,783 | |
| 12,330,431 | |
Shares issued and outstanding at end of period | |
| 24,181,534 | |
| 24,052,253 | |
| 23,936,453 | |
| 12,263,643 | |
| 12,234,443 | |
| |
| | | | | | | | | | | | | | |
Selected Performance Ratios and Other Data: | |
|
| |
|
| |
|
| |
|
| |
|
| |
Return on average assets | |
| 1.22 | % |
| 1.25 | % |
| 0.13 | % |
| 0.95 | % |
| 0.95 | % |
Return on average equity | |
| 9.13 | % |
| 9.99 | % |
| 1.02 | % |
| 8.37 | % |
| 7.87 | % |
Yield on earning assets | |
| 4.88 | % |
| 4.86 | % |
| 4.76 | % |
| 4.84 | % |
| 4.85 | % |
Cost of funds | |
| 1.58 | % |
| 1.19 | % |
| 0.94 | % |
| 0.91 | % |
| 0.91 | % |
Net interest margin | |
| 3.39 | % |
| 3.72 | % |
| 3.87 | % |
| 3.99 | % |
| 4.07 | % |
Net charge-offs to average loans | |
| 0.11 | % |
| 0.06 | % |
| 0.51 | % |
| 0.53 | % |
| 0.28 | % |
Allowance for loan losses to total non-covered loans | |
| 0.47 | % |
| 0.57 | % |
| 0.46 | % |
| 0.95 | % |
| 1.06 | % |
Stockholders' equity to total assets | |
| 13.86 | % |
| 12.89 | % |
| 12.35 | % |
| 11.06 | % |
| 11.55 | % |
| | | | | | | | | | | | | | | | |
Financial Condition: | |
|
| |
|
| |
|
| |
|
| |
|
| |
Total assets | | $ | 2,722,170 | | $ | 2,701,295 | | $ | 2,614,252 | | $ | 1,142,443 | | $ | 1,036,107 | |
Total loans | |
| 2,186,047 | |
| 2,178,824 | |
| 2,062,328 | |
| 930,415 | |
| 829,425 | |
Total deposits | |
| 2,124,718 | |
| 2,097,600 | |
| 1,865,156 | |
| 912,982 | |
| 825,294 | |
Stockholders' equity | |
| 377,241 | |
| 348,290 | |
| 322,772 | |
| 126,344 | |
| 119,636 | |
| (1) |
| | | | 2017 | | | 2016 | | | 2015 | | | 2014 | | | 2013 | | |||||||||||||||
| | | | (in thousands, except per share amounts) | | |||||||||||||||||||||||||||
| Results of Operations: | | | | | | | | | | | | | | | | | | | | | | | | | | | | | | | |
| Interest income | | | | $ | 83,570 | | | | | $ | 48,947 | | | | | $ | 43,701 | | | | | $ | 38,091 | | | | | $ | 35,116 | | |
| Interest expense | | | | | 15,653 | | | | | | 8,633 | | | | | | 7,077 | | | | | | 4,673 | | | | | | 4,668 | | |
| Net interest income | | | | | 67,917 | | | | | | 40,314 | | | | | | 36,624 | | | | | | 33,418 | | | | | | 30,448 | | |
| Provision for loan losses | | | | | 8,625 | | | | | | 4,912 | | | | | | 3,171 | | | | | | 3,444 | | | | | | 3,615 | | |
| Net interest income after provision for loan losses | | | | | 59,292 | | | | | | 35,402 | | | | | | 33,453 | | | | | | 29,974 | | | | | | 26,833 | | |
| Noninterest income | | | | | 5,429 | | | | | | 2,820 | | | | | | 3,781 | | | | | | 2,364 | | | | | | 1,753 | | |
| Noninterest expenses | | | | | 49,149 | | | | | | 22,815 | | | | | | 23,278 | | | | | | 21,101 | | | | | | 19,292 | | |
| Income before income taxes | | | | | 15,572 | | | | | | 15,407 | | | | | | 13,956 | | | | | | 11,237 | | | | | | 9,294 | | |
| Income tax expense | | | | | 13,147 | | | | | | 5,095 | | | | | | 4,667 | | | | | | 3,754 | | | | | | 3,036 | | |
| Net income | | | | $ | 2,425 | | | | | $ | 10,312 | | | | | $ | 9,289 | | | | | $ | 7,483 | | | | | $ | 6,258 | | |
| Per Share Data: | | | | | | | | | | | | | | | | | | | | | | | | | | | | | | | |
| Earnings per share – Basic | | | | $ | 0.13 | | | | | $ | 0.84 | | | | | $ | 0.76 | | | | | $ | 0.63 | | | | | $ | 0.54 | | |
| Earnings per share – Diluted | | | | $ | 0.13 | | | | | $ | 0.83 | | | | | $ | 0.75 | | | | | $ | 0.63 | | | | | $ | 0.54 | | |
| Cash dividends paid per share | | | | $ | 0.32 | | | | | $ | 0.32 | | | | | $ | 0.52 | | | | | $ | 0.60 | | | | | $ | 0.25 | | |
| Book value per share | | | | $ | 13.48 | | | | | $ | 10.30 | | | | | $ | 9.78 | | | | | $ | 9.33 | | | | | $ | 9.20 | | |
Tangible book value per share(1) | | | | $ | 8.86 | | | | | $ | 9.37 | | | | | $ | 8.83 | | | | | $ | 8.36 | | | | | $ | 8.34 | | |
| Dividend payout ratio | | | | | 246.15% | | | | | | 38.10% | | | | | | 68.42% | | | | | | 95.24% | | | | | | 46.30% | | |
| Weighted average shares outstanding – Basic | | | | | 18,390,810 | | | | | | 12,251,804 | | | | | | 12,224,494 | | | | | | 11,846,126 | | | | | | 11,590,333 | | |
| Weighted average shares outstanding – Diluted | | | | | 18,671,392 | | | | | | 12,426,783 | | | | | | 12,330,431 | | | | | | 11,927,083 | | | | | | 11,627,445 | | |
| Shares outstanding at end of period | | | | | 23,936,453 | | | | | | 12,263,643 | | | | | | 12,234,443 | | | | | | 12,216,669 | | | | | | 11,590,612 | | |
| Selected Performance Ratios and Other Data: | | | | | | | | | | | | | | | | | | | | | | | | | | | | | | | |
| Return on average assets | | | | | 0.13% | | | | | | 0.95% | | | | | | 0.95% | | | | | | 0.94% | | | | | | 0.89% | | |
| Return on average equity | | | | | 1.02% | | | | | | 8.37% | | | | | | 7.87% | | | | | | 6.76% | | | | | | 5.95% | | |
| Yield on earning assets | | | | | 4.76% | | | | | | 4.84% | | | | | | 4.85% | | | | | | 5.24% | | | | | | 5.48% | | |
| Cost of funds | | | | | 0.94% | | | | | | 0.91% | | | | | | 0.91% | | | | | | 0.75% | | | | | | 0.85% | | |
| Net interest margin | | | | | 3.87% | | | | | | 3.99% | | | | | | 4.07% | | | | | | 4.60% | | | | | | 4.75% | | |
Efficiency ratio(2) | | | | | 54.20% | | | | | | 51.50% | | | | | | 57.64% | | | | | | 60.45% | | | | | | 60.78% | | |
| Net charge-offs to average loans | | | | | 0.51% | | | | | | 0.53% | | | | | | 0.28% | | | | | | 0.51% | | | | | | 0.69% | | |
| Allowance for loan losses to total non-covered loans | | | | | 0.46% | | | | | | 0.95% | | | | | | 1.06% | | | | | | 1.11% | | | | | | 1.42% | | |
| Stockholders’ equity to total assets | | | | | 12.35% | | | | | | 11.06% | | | | | | 11.55% | | | | | | 12.43% | | | | | | 14.89% | | |
| Financial Condition: | | | | | | | | | | | | | | | | | | | | | | | | | | | | | | | |
| Total assets | | | | $ | 2,614,252 | | | | | $ | 1,142,443 | | | | | $ | 1,036,107 | | | | | $ | 916,645 | | | | | $ | 716,185 | | |
| Total loans, net of deferred fees | | | | | 2,062,328 | | | | | | 930,415 | | | | | | 829,425 | | | | | | 703,472 | | | | | | 546,058 | | |
| Total deposits | | | | | 1,865,156 | | | | | | 912,982 | | | | | | 825,294 | | | | | | 742,425 | | | | | | 540,359 | | |
| Stockholders’ equity | | | | | 322,772 | | | | | | 126,344 | | | | | | 119,636 | | | | | | 113,979 | | | | | | 106,614 | | |
41
Item 7. Management’s Discussion and Analysis of Financial Condition and Results of Operations
Management’s discussion and analysis is presented to aid the reader in understanding and evaluating the financial condition and results of operations of Southern National. This discussion and analysis should be read with the consolidated financial statements, the footnotes thereto, and the other financial data included in this report.
CRITICAL ACCOUNTING POLICIES
Our accounting policies are in accordance with U.S. GAAP and with general practices within the banking industry. Management makes a number of estimates and assumptions relating to reported amounts of assets and liabilities and the disclosure of contingent assets and liabilities at the date of the consolidated financial statements and the reported amounts of revenues and expenses during periods presented. Different assumptions in the application of these methods or policies could result in material changes in our financial statements. As such, the following policies are considered “critical accounting policies” for us.
Allowance for Loan and Lease Losses (“ALLL”)
The allowance for loan and lease losses is a valuation allowance for probable incurred credit losses. Loan losses are charged against the allowance when management believes the collection of the principal is unlikely. Recoveries of amounts previously charged-off are credited to the allowance. Management’s determination of the adequacy of the allowance is based on a three year historical average net loss experience for each portfolio segment, except consumer loans that are tracked on a two year basis, adjusted for current industry and economic conditions (referred to as “current factors”) and estimates of their effect on loan collectability. While management uses available information to estimate losses on loans, future additions to the allowance may be necessary based on changes in economic conditions, particularly those affecting real estate values.
The allowance consists of specific and general components. The specific component relates to loans that are individually classified as impaired. The general component provides for estimated losses in unimpaired loans and is based on historical loss experience adjusted for current factors.
A loan is considered impaired when, based on current information and events, it is probable that Southern National will be unable to collect the scheduled payments of principal or interest when due according to the terms of the loan documentation. Factors considered by management in determining impairment include payment status, collateral value, and the probability of collecting scheduled principal and interest payments when due, among other considerations. Loans that experience insignificant payment delays and payment shortfalls generally are not classified as impaired. Management determines the significance of payment delays and payment shortfalls on a case-by-case basis, taking into consideration all of the circumstances surrounding the loan and the borrower, including the length of the delay, the reasons for the delay, the borrower’s prior payment record, and the amount of the shortfall in relation to the principal and interest owed. Impairment is measured on a loan-by-loan basis for commercial and construction loans by either the present value of expected future cash flows discounted at the loan’s effective interest rate, the loan’s observable market price, or the fair value of the collateral if the loan is collateral dependent. Individual consumer and residential loans are evaluated for impairment based on the aforementioned criteria as well as regulatory guidelines.
The general component covers non-impaired loans and is based on historical loss experience adjusted for current factors. The historical loss experience is determined by portfolio segment and is based on the actual net loss history experienced by Southern National over the most recent three years. This actual loss experience is adjusted for current factors based on the risks present for each portfolio segment. These current factors include consideration of the following: levels of and trends in delinquencies and impaired loans; levels of and trends in charge-offs and recoveries; trends in volume and terms of loans; effects of any changes in risk selection and underwriting standards; other changes in lending policies, procedures, and practices; experience, ability, and depth of lending management and other relevant staff; national and local economic trends and conditions; industry conditions; and effects of changes in credit concentrations. The following portfolio segments have been identified: owner occupied commercial real estate, non-owner occupied commercial real estate, construction and land development, commercial loans, residential 1-4 family, multi-family residential, loans secured by farmland, HELOC and consumer. While underwriting
42
the Bank estimates the effect of internal factors on future net loss experience to be negligible. Management’s estimate of the effect of current external economic environmental conditions on future net loss experience is significant in all loan segments and particularly on loans secured by real estate including single family 1-4, non-owner occupied commercial real estate and construction and land development loans. These factors include excess inventory, generally less demand driven in part by fewer qualified borrowers and buyers. These considerations have played a significant role in management’s estimate of the adequacy of the allowance for loan and lease losses.
Accounting for the FDIC Indemnification Asset and Acquired Loans
Southern National acquired loan portfolios through its acquisitions of EVBS in 2017, GAB in 2009, HarVest Bank of Maryland in 2012, and PGFSB in 2014.2014 and EVBS in 2017. The single family residential loans acquired in the GAB transaction are referred to as “covered loans” because of loss protection provided by the FDIC pursuant to a loss sharing agreement which expiresexpired in December 2019. The loss sharing agreement with the FDIC related to non-single family (commercial) loans expired in December 2014. The loans acquired in the EVBS, HarVest Bank of Maryland, and PGFSB transactions are not covered by an FDIC loss sharing agreement.
Loans acquired with evidence of credit deterioration since inception and for which it is probable that all contractual payments will not be received are accounted for under Accounting Standards Codification (“ASC”) Topic 310-30, Loans and Debt Securities Acquired with Deteriorated Credit Quality (“(“ASC 310-30”). These loans are recorded at fair value at the time of acquisition, with no carryover of the related allowance for loan losses. Fair value of acquired loans is determined using a discounted cash flow methodology based on assumptions about the amount and timing of principal and interest payments, principal prepayments and principal defaults and losses, and current market rates. In recording the acquisition date fair values of acquired impaired loans, management calculates a non-accretable difference (the credit component of the purchased loans) and an accretable difference (the yield component of the purchased loans).
Over the life of the acquired loans, we continue to estimate cash flows expected to be collected on pools of loans sharing common risk characteristics, which are treated in the aggregate when applying various valuation techniques. We evaluate at each balance sheet date whether the present value of our pools of loans determined using the effective interest rates has decreased significantly and if so, recognize a provision for loan losses in our consolidated statement of income. For any significant increases in cash flows expected to be collected, we adjust the amount of accretable yield recognized on a prospective basis over the pool’s remaining life.
These cash flow evaluations are inherently subjective as they require management to make estimates about expected cash flows, market conditions and other future events that are highly subjective in nature and subject to change. Changes in these factors, as well as changing economic conditions will likely impact the carrying value of these acquired loans.
Business Combinations, Goodwill and Other Intangible Assets
Southern National accounts for all business combinations under the purchase method of accounting. Tangible and intangible assets and liabilities of the acquired entity are recorded at fair value. The determination of fair values is based on valuations using management’s assumptions of future growth rates, future attrition, discount rates, multiples of earnings or other relevant factors. Changes in these factors, as well as downturns in economic or business conditions, could have a significant adverse impact on the carrying values of goodwill or intangible assets and could result in impairment losses affecting our financials as a whole and our banking subsidiary in which the goodwill or intangibles resides.
Intangible assets with finite useful lives represent the future benefit associated with the acquisition of the core deposits and are amortized over their estimated useful lives utilizing a method that approximates the expected attrition of the deposits. Under FASB ASC 350, Intangibles —– Goodwill and Other, goodwill with an indefinite life is not amortized, but rather tested annually for impairment. Southern National evaluates goodwill for impairment each year as of September 30. Goodwill totaled $100.6$101.9 million at December 31, 2017.2019. There was no impairment recorded for the years ended December 31, 2017, 20162019, 2018 and 2015.2017.
43
Other-Than-Temporary-Impairment (“OTTI”) of Investment Securities
Management evaluates investment securities for OTTI on at least a quarterly basis, and more frequently when economic or market conditions warrant such an evaluation. For investment securities in an unrealized loss position, management considers the extent and duration of the unrealized loss, and the financial condition and near-term prospects of the issuer. Management also assesses whether it intends to sell, or it is more likely than not that it will be required to sell, an investment security in an unrealized loss position before recovery of its amortized cost basis. If either of the criteria regarding intent or requirement to sell is met, the entire difference between amortized cost and fair value is recognized as impairment through earnings. For debt investment securities that do not meet the aforementioned criteria, the amount of impairment is split into two components as follows: 1) OTTI related to credit loss, which must be recognized in the income statement and 2) OTTI related to other factors, which is recognized in other comprehensive income. The credit loss is defined as the difference between the present value of the cash flows expected to be collected and the amortized cost basis. For equity investment securities, the entire amount of impairment is recognized through earnings.
In order to determine OTTI for purchased beneficial interests that, on the purchase date, were not highly rated, Southern National compares the present value of the remaining cash flows as estimated at the preceding evaluation date to the current expected remaining cash flows. OTTI is deemed to have occurred if there has been an adverse change in the remaining expected future cash flows.
Other Real Estate Owned (“OREO”)
Real estate acquired through, or in lieu of, loan foreclosure are held for sale and are initially recorded at the fair value of the collateral at the date of foreclosure based on estimates, including some obtained from third parties, less estimated costs to sell, establishing a new cost basis. Subsequent to foreclosure, valuations are periodically performed by management, and the assets are carried at the lower of cost or fair value, less estimated costs to sell. Significant property improvements that enhance the salability of the property are capitalized to the extent that the carrying value does not exceed the estimated realizable value. Legal fees, maintenance and other direct costs of foreclosed properties are expensed as incurred.
Due to the judgment involved in estimating fair value of the properties, accounting for OREO is regarded as a critical accounting policy. Estimates of value of OREO properties at the date of foreclosure are typically based on real estate appraisals performed by independent appraisers. These values are generally updated as appraisals become available.
Valuation of Deferred Tax Asset
The provision for income taxes reflects the tax effects of the transactions reported in the consolidated financial statements, including taxes currently due as well as changes in deferred taxes. Deferred tax assets and liabilities represent estimates of the future tax return consequences of temporary differences between carrying amounts and tax bases of assets and liabilities. Deferred tax assets and liabilities are computed by using currently enacted income tax rates and applying those rates to the periods in which the deferred tax assets or liabilities are expected to be realized or settled. As changes in tax laws or rates are enacted, deferred tax assets and liabilities are adjusted through the provision for income taxes. As of December 31, 20172019 and 2016,2018, management concluded that it is more likely than not that Southern National will generate sufficient taxable income to fully utilize our deferred tax assets.
OVERVIEW
Southern National is a corporation that was formed on July 28, 2004 under the laws of the Commonwealth of Virginia and is the holding company for Sonabank, a Virginia state-chartered bank which commenced operations on April 14, 2005. Sonabank provides a range of financial services to individuals and small and medium sized businesses.
On June 23, 2017, SNBV completed its merger with EVBS and the merger of EVBS’s wholly-owned subsidiary, EVB, with and into SNBV’s wholly-owned subsidiary, Sonabank (see Note 2 — Business Combinations).Sonabank. This combination has brought together two banking companies with complementary business lines, creating one of the premier banking institutions headquartered in the
44
Commonwealth of Virginia. EVBS was the holding company for EVB, a Virginia state-chartered bank which traced its beginnings to 1910.
Southern National acquired PGFSB in a cash and stock transaction on August 1, 2014. PGFSB was founded in 1931 and was headquartered in Upper Marlboro, which is the County Seat of Prince George’s County, Maryland. PGFSB had four offices in Maryland, including a main office in Upper Marlboro and three branch offices in Dunkirk, Brandywine and Huntingtown.
We completed the acquisition of the HarVest Bank of Maryland on April 27, 2012 the Midlothian branch in Richmond, Virginia on October 1, 2011 and the acquisition and assumption of certain assets and liabilities of GAB from the FDIC on December 4, 2009. As part of the GAB acquisition, the Bank and the FDIC entered into a loss sharing agreement (the “loss sharing agreement”) on approximately $143.4 million (cost basis) of GAB’s assets. The Bank will share inshared the losses on the loans and foreclosed loan collateral with the FDIC as specified in the loss sharing agreement; we refer to these assets collectively as “covered assets.”
At December 31, 2017,2019, Sonabank had thirty-eightforty-five full-service branches. Thirty-eight full-service retail branches are in Virginia, located in the counties of Chesterfield (2), Essex (2), Fairfax (Reston, McLean and Fairfax), Gloucester (2), Hanover (3), King William, Lancaster, Middlesex (3), New Kent, Northumberland (3), Southampton, Surry, Sussex, and inAshland, Burgess, Callao, Central Garage, Charlottesville, Chester, Clifton Forge, Colonial Heights, Courtland, Deltaville, Fairfax, Front Royal, Gloucester, Gloucester Point, Hampton, Hartfield, Haymarket, Heathsville, Kilmarnock, Leesburg, McLean, Mechanicsville (2), Middleburg, Midlothian, New Market, Newport News, Quinton, Reston, Richmond, South Riding, Surry, Tappahannock (2), Urbanna, Warrenton, Waverly, and Williamsburg, and seven full-service retail branches in Maryland, located in Bethesda, Brandywine, Huntingtown, Owings, Rockville, Shady Grove, Bethesda,and Upper Marlboro, Brandywine, OwingsMarlboro. We have administrative offices in Warrenton and Huntingtown.
While we offer a wide range of commercial banking services, we focus on making loans secured primarily by commercial real estate and other types of secured and unsecured commercial loans to small and medium-sized businesses in a number of industries, as well as loans to individuals for a variety of purposes. We are a leading SBA lender among Virginia community banks. We also invest in real estate-related investment securities, including collateralized mortgage obligations and agency mortgage backed securities. Our principal sources of funds for loans and investing in securities are deposits and, to a lesser extent, borrowings. We offer a broad range of deposit products, including checking (“NOW”), savings, money market accounts and certificates of deposit. We actively pursue business relationships by utilizing the business contacts of our senior management, other bank officers and our directors, thereby capitalizing on our knowledge of our local market areas.
RESULTS OF OPERATIONS
Net Income
Net income for the year ended December 31, 20172019 was $2.4$33.2 million, compared to $10.3$33.7 million for the year ended December 31, 2016 and $9.3 million for2018.
The decrease in net income during the year ended December 31, 2015.2019 compared to the year ended December 31, 2018 was primarily driven by a nonrecurring other loss of $2.5 million and related legal expense of $397 thousand, net of taxes. The decrease was partially offset by an income tax benefit in the second quarter of 2019 due to the formal assessment and rebooking of $1.2 million deferred tax asset stemming from a $5.5 million acquired net operating loss carryforward.
Net income increased $31.3 million during the year ended December 31, 2018 compared to the year ended December 31, 2017. Southern National’s results for the year ended December 31, 2017 were significantly2018 was impacted by $4.5 million of acquired loan discount accretion on loans acquired in the acquisitions of EVBS, Greater Atlantic Bank, HarVest and Prince George Federal Savings Bank. For the year ended December 31, 2018, other noninterest income benefited from $2.5 million of recoveries of legacy investment securities and loans charged off by EVBS before Southern National merged with EVBS during the late second quarter of 2017. Net income was also impacted by the inclusionreduced statutory federal tax rate applicable to the Company from 34% to 21% due to the enactment of a provisionalthe Tax Cuts and Jobs Act of 2017, which became effective on December 22, 2017. We recognized an additional income tax expense totaling $7.2 million in additional estimated income tax expense2017 from the revaluation of its net deferred tax asset (“DTA”) as a result of the reduction in the corporate income tax rate going forward under the recently enacted Tax Cuts and Jobs Act. Due to the new law being enacted on December 22, 2017, this revaluation of the DTA was accounted for in the fourth quarter of 2017 through adjustments to Income Tax Expense on the Consolidated Statements of Income. Southern National’s DTA position is attributable primarily to the net operating losses acquired in the merger with EVBS and the timing difference created by the allowance for loan losses, which will be deductible at the lower U.S. corporate income tax rate beginning in 2018, as opposed to the higher rates in effect through December 31, 2017. Although directly affecting its current period results, Southern National expects that its earnings beginning in 2018 will benefit from the lower U.S. corporate income tax rate going forward which will result in a reduction of income tax expense. Southern National’s results forrate. For the year ended December 31, 2017 were also directly impacted by2018, there was no material net tax expense resulting from a finalization of the merger with EVBS including expenses related to the mergercalculations in 2018.
45
Net Interest Income
Our operating results depend primarily on our net interest income, which is the difference between interest and dividend income on interest-earning assets such as loans and investments, and interest expense on interest-bearing liabilities such as deposits and borrowings.
Net interest income was $83.6 million during the year ended December 31, 2019, compared to $91.0 million during the year ended December 31, 2018, which was a direct result of the rising interest rate environment during 2018, competition for deposits and a decreasing rate environment during the second half of 2019. Southern National’s net interest margin was 3.39% during the year ended December 31, 2019 compared to 3.72% during the year ended December 31, 2018. The yield on average interest-earning assets increased 2 basis points to 4.88% during the year ended December 31, 2019 when comparing to the 4.86% yield on average interest-earning assets during 2018. The cost of average interest-bearing liabilities increased 45 basis points to 1.84% during the year ended December 31, 2019 when comparing to the 1.39% cost on average interest-bearing liabilities during 2018. The accretion of the discount on loans acquired in the acquisitions of EVBS, Greater Atlantic Bank, HarVest and Prince Georges Federal Savings Bank contributed $3.9 million and $4.5 million to net interest income in the years ended December 31, 2019 and 2018, respectively. The decrease in accretion was due to the slowdown in the volume of acquired loan prepayments and payoffs. Average loans during the year ended December 31, 2019 were $2.16 billion compared to $2.14 billion during 2018.
Net interest income was $91.0 million during the year ended December 31, 2018, compared to $67.9 million during the year ended December 31, 2017, compared to $40.3 million during the prior year.2017. Average loans during the year ended December 31, 20172018 were $1.53$2.14 billion compared to $889.6 million$1.53 billion during 2016,2017, with the increase mostly attributable to the acquisition of EVBS in June of 2017. Southern National’s net interest margin was 3.72% during the year ended December 31, 2018 compared to 3.87% during the year ended December 31, 2017 compared2017. The yield on average interest-earning assets increased 10 basis points to 3.99%4.86% during the year ended December 31, 2016. The yield on average interest-earning assets decreased 8 basis points to 4.76% during the year ended December 31, 20172018 when comparing to the 4.84%4.76% yield on average interest-earning assets during 2016.2017. The cost of average interest-bearing liabilities increased 831 basis points to 1.08%1.39% during the year ended December 31, 20172018 when comparing to the 1.00%1.08% cost on average interest-bearing liabilities during 2016.2017. The loan discount accretion on our acquisitions were $4.5 million and $3.8 million in the yearyears ended December 31, 2018 and 2017, compared to $2.1 million in 2016.respectively.
46
The following table details average balances of interest-earning assets and interest-bearing liabilities, the amount of interest earned/paid on such assets and liabilities, and the yield/rate for the periods indicated:
| | | | | | | | | | | | | | | | | | | | | | | | | |
| | Average Balance Sheets and Net Interest |
| ||||||||||||||||||||||
| | Analysis For the Year Ended |
| ||||||||||||||||||||||
| | 2019 | | 2018 | | 2017 | | ||||||||||||||||||
| | | | | Interest | | | | | | | Interest | | | | | | Interest | | |
| ||||
| | Average | | Income/ | | Yield/ | | Average | | Income/ | | Yield/ | | Average | | Income/ | | Yield/ |
| ||||||
|
| Balance |
| Expense |
| Rate |
| Balance |
| Expense |
| Rate |
| Balance |
| Expense |
| Rate |
| ||||||
| | (Dollar amounts in thousands) |
| ||||||||||||||||||||||
Assets | | | | | | | | | | | | | | | | | | | | | | | | |
|
Interest-earning assets: | | |
| | |
| |
| | |
| | |
| |
| | |
| | |
| |
|
|
Loans, net of deferred fees (1) (2) | | $ | 2,159,681 | | $ | 112,181 | | 5.19 | % | $ | 2,138,845 | | $ | 110,213 | | 5.15 | % | $ | 1,528,081 | | $ | 77,764 | | 5.09 | % |
Investment securities | | | 241,800 | | | 6,224 | | 2.57 | % | | 247,182 | | | 6,386 | | 2.58 | % | | 182,464 | | | 4,569 | | 2.50 | % |
Other earning assets | | | 66,582 | | | 2,119 | | 3.18 | % | | 59,594 | | | 2,308 | | 3.87 | % | | 44,546 | | | 1,237 | | 2.78 | % |
Total earning assets | | | 2,468,063 | | | 120,524 | | 4.88 | % | | 2,445,621 | | | 118,907 | | 4.86 | % | | 1,755,091 | | | 83,570 | | 4.76 | % |
Allowance for loan losses | | | (11,852) | | | | | | | | (11,292) | | | | |
| | | (9,831) | | |
| |
|
|
Total non-earning assets | | | 264,265 | | | | | | | | 260,348 | | | | |
| | | 177,357 | | |
| |
|
|
Total assets | | $ | 2,720,475 | | | | | | | $ | 2,694,677 | | | | |
| | $ | 1,922,617 | | |
| |
|
|
| | | | | | | | | | | | | | | | | | | | | | | | |
|
Liabilities and stockholders' equity | | |
| | |
| |
| | |
| | |
| |
| | |
| | |
| |
|
|
Interest-bearing liabilities: | | |
| | |
| |
| | |
| | |
| |
| | |
| | |
| |
|
|
NOW and other demand accounts | | $ | 360,254 | | $ | 2,989 | | 0.83 | % | $ | 324,797 | | $ | 1,478 | | 0.46 | % | $ | 192,789 | | $ | 704 | | 0.36 | % |
Money market accounts | | | 439,097 | | | 7,745 | | 1.76 | % | | 328,142 | | | 3,060 | | 0.93 | % | | 256,746 | | | 1,582 | | 0.62 | % |
Savings accounts | | | 145,855 | | | 461 | | 0.32 | % | | 159,865 | | | 512 | | 0.32 | % | | 112,868 | | | 442 | | 0.39 | % |
Time deposits | | | 868,420 | | | 19,407 | | 2.23 | % | | 808,718 | | | 13,185 | | 1.63 | % | | 668,566 | | | 8,265 | | 1.24 | % |
Total interest-bearing deposits | | | 1,813,626 | | | 30,602 | | 1.69 | % | | 1,621,521 | | | 18,235 | | 1.12 | % | | 1,230,969 | | | 10,993 | | 0.89 | % |
Borrowings | | | 188,647 | | | 6,322 | | 3.35 | % | | 380,822 | | | 9,606 | | 2.52 | % | | 218,581 | | | 4,660 | | 2.13 | % |
Total interest-bearing liabilities | | | 2,002,273 | | | 36,924 | | 1.84 | % | | 2,002,343 | | | 27,841 | | 1.39 | % | | 1,449,550 | | | 15,653 | | 1.08 | % |
Noninterest-bearing liabilities: | | |
| | |
| |
| | |
| | |
| |
| | |
| | |
| |
|
|
Demand deposits | | | 332,924 | | | | | | | | 336,380 | | |
| |
| | | 219,107 | | |
| |
|
|
Other liabilities | | | 22,115 | | | | | | | | 18,646 | | |
| |
| | | 15,694 | | |
| |
|
|
Total liabilities | | | 2,357,312 | | | | | | | | 2,357,370 | | |
| |
| | | 1,684,351 | | |
| |
|
|
Stockholders' equity | | | 363,163 | | | | | | | | 337,307 | | |
| |
| | | 238,266 | | |
| |
|
|
Total liabilities and stockholders' equity | | $ | 2,720,475 | | | | | | | $ | 2,694,677 | | |
| |
| | $ | 1,922,617 | | |
| |
|
|
Net interest income | | | | | $ | 83,600 | | | | |
| | $ | 91,066 | |
| | |
| | $ | 67,917 | |
|
|
Interest rate spread | | | | | | | | 3.04 | % | |
| | |
| | 3.47 | % | |
| | |
| | 3.68 | % |
Net interest margin | | | | | | | | 3.39 | % | |
| | |
| | 3.72 | % | |
| | |
| | 3.87 | % |
| (1) | Includes loan fees in both interest income and the calculation of the yield on loans. |
| (2) | Calculations include non-accruing loans in average loan amounts outstanding. |
47
| | | | 2017 | | | 2016 | | | 2015 | | |||||||||||||||||||||||||||||||||||||||||||||
| | | | Average Balance | | | Interest Income/ Expense | | | Yield/ Rate | | | Average Balance | | | Interest Income/ Expense | | | Yield/ Rate | | | Average Balance | | | Interest Income/ Expense | | | Yield/ Rate | | |||||||||||||||||||||||||||
| | | | (Dollar amounts in thousands) | | |||||||||||||||||||||||||||||||||||||||||||||||||||
| Assets | | | | | | | | | | | | | | | | | | | | | | | | | | | | | | | | | | | | | | | | | | | | | | | | | | | | | | | |
| Interest-earning assets: | | | | | | | | | | | | | | | | | | | | | | | | | | | | | | | | | | | | | | | | | | | | | | | | | | | | | | | |
Loans, net of deferred fees(1)(2) | | | | $ | 1,528,081 | | | | | $ | 77,764 | | | | | | 5.09% | | | | | $ | 889,600 | | | | | $ | 45,348 | | | | | | 5.10% | | | | | $ | 761,550 | | | | | $ | 40,104 | | | | | | 5.27% | | |
| Investment securities | | | | | 182,464 | | | | | | 4,569 | | | | | | 2.50% | | | | | | 96,836 | | | | | | 2,955 | | | | | | 3.05% | | | | | | 97,580 | | | | | | 2,806 | | | | | | 2.88% | | |
| Other earning assets | | | | | 44,546 | | | | | | 1,237 | | | | | | 2.78% | | | | | | 24,208 | | | | | | 644 | | | | | | 2.66% | | | | | | 41,245 | | | | | | 791 | | | | | | 1.92% | | |
| Total earning assets | | | | | 1,755,091 | | | | | | 83,570 | | | | | | 4.76% | | | | | | 1,010,644 | | | | | | 48,947 | | | | | | 4.84% | | | | | | 900,375 | | | | | | 43,701 | | | | | | 4.85% | | |
| Allowance for loan losses | | | | | (9,831) | | | | | | | | | | | | | | | | | | (8,634) | | | | | | | | | | | | | | | | | | (8,139) | | | | | | | | | | | | | | |
| Intangible assets | | | | | 61,969 | | | | | | | | | | | | | | | | | | 11,499 | | | | | | | | | | | | | | | | | | 11,991 | | | | | | | | | | | | | | |
| Other non-earning assets | | | | | 115,388 | | | | | | | | | | | | | | | | | | 66,850 | | | | | | | | | | | | | | | | | | 70,800 | | | | | | | | | | | | | | |
| Total assets | | | | $ | 1,922,617 | | | | | | | | | | | | | | | | | $ | 1,080,359 | | | | | | | | | | | | | | | | | $ | 975,027 | | | | | | | | | | | | | | |
| Liabilities and stockholders’ equity | | | | | | | | | | | | | | | | | | | | | | | | | | | | | | | | | | | | | | | | | | | | | | | | | | | | | | | |
| Interest-bearing liabilities: | | | | | | | | | | | | | | | | | | | | | | | | | | | | | | | | | | | | | | | | | | | | | | | | | | | | | | | |
| NOW and other demand accounts | | | | $ | 192,789 | | | | | | 704 | | | | | | 0.36% | | | | | $ | 36,470 | | | | | | 60 | | | | | | 0.16% | | | | | $ | 24,306 | | | | | | 25 | | | | | | 0.10% | | |
| Money market accounts | | | | | 256,746 | | | | | | 1,582 | | | | | | 0.62% | | | | | | 127,121 | | | | | | 453 | | | | | | 0.36% | | | | | | 138,559 | | | | | | 483 | | | | | | 0.35% | | |
| Savings accounts | | | | | 112,868 | | | | | | 442 | | | | | | 0.39% | | | | | | 51,670 | | | | | | 333 | | | | | | 0.64% | | | | | | 44,661 | | | | | | 282 | | | | | | 0.63% | | |
| Time deposits | | | | | 668,566 | | | | | | 8,265 | | | | | | 1.24% | | | | | | 579,157 | | | | | | 7,255 | | | | | | 1.25% | | | | | | 509,900 | | | | | | 5,643 | | | | | | 1.11% | | |
| Total interest-bearing deposits | | | | | 1,230,969 | | | | | | 10,993 | | | | | | 0.89% | | | | | | 794,418 | | | | | | 8,101 | | | | | | 1.02% | | | | | | 717,426 | | | | | | 6,433 | | | | | | 0.90% | | |
| Borrowings | | | | | 218,581 | | | | | | 4,660 | | | | | | 2.13% | | | | | | 66,230 | | | | | | 532 | | | | | | 0.80% | | | | | | 58,358 | | | | | | 644 | | | | | | 1.10% | | |
| Total interest-bearing liabilities | | | | | 1,449,550 | | | | | | 15,653 | | | | | | 1.08% | | | | | | 860,648 | | | | | | 8,633 | | | | | | 1.00% | | | | | | 775,784 | | | | | | 7,077 | | | | | | 0.91% | | |
| Noninterest-bearing liabilities: | | | | | | | | | | | | | | | | | | | | | | | | | | | | | | | | | | | | | | | | | | | | | | | | | | | | | | | |
| Demand deposits | | | | | 219,107 | | | | | | | | | | | | | | | | | | 88,413 | | | | | | | | | | | | | | | | | | 75,129 | | | | | | | | | | | | | | |
| Other liabilities | | | | | 15,694 | | | | | | | | | | | | | | | | | | 8,140 | | | | | | | | | | | | | | | | | | 6,120 | | | | | | | | | | | | | | |
| Total liabilities | | | | | 1,684,351 | | | | | | | | | | | | | | | | | | 957,201 | | | | | | | | | | | | | | | | | | 857,033 | | | | | | | | | | | | | | |
| Stockholders’ equity | | | | | 238,266 | | | | | | | | | | | | | | | | | | 123,158 | | | | | | | | | | | | | | | | | | 117,994 | | | | | | | | | | | | | | |
| Total liabilities and stockholders’ equity | | | | $ | 1,922,617 | | | | | | | | | | | | | | | | | $ | 1,080,359 | | | | | | | | | | | | | | | | | $ | 975,027 | | | | | | | | | | | | | | |
| Net interest income | | | | | | | | | | $ | 67,917 | | | | | | | | | | | | | | | | | $ | 40,314 | | | | | | | | | | | | | | | | | $ | 36,624 | | | | | | | | |
| Interest rate spread | | | | | | | | | | | | | | | | | 3.68% | | | | | | | | | | | | | | | | | | 3.84% | | | | | | | | | | | | | | | | | | 3.94% | | |
| Net interest margin | | | | | | | | | | | | | | | | | 3.87% | | | | | | | | | | | | | | | | | | 3.99% | | | | | | | | | | | | | | | | | | 4.07% | | |
The following table summarizes changes in net interest income attributable to changes in the volume of interest-earning assets and interest-bearing liabilities compared to changes in interest rates. The change in interest, due to both rate and volume, has been proportionately allocated between rate and volume.
| | | | Year Ended December 31, 2017 vs. 2016 | | | Year Ended December 31, 2016 vs. 2015 | | ||||||||||||||||||||||||||||||
| | | | Increase (Decrease) Due to Change in: | | | Increase (Decrease) Due to Change in: | | ||||||||||||||||||||||||||||||
| | | | Volume | | | Rate | | | Net Change | | | Volume | | | Rate | | | Net Change | | ||||||||||||||||||
| | | | (in thousands) | | |||||||||||||||||||||||||||||||||
| Interest-earning assets: | | | | | | | | | | | | | | | | | | | | | | | | | | | | | | | | | | | | | |
| Loans, net of deferred fees | | | | $ | 32,505 | | | | | $ | (89) | | | | | $ | 32,416 | | | | | $ | 6,477 | | | | | $ | (1,233) | | | | | $ | 5,244 | | |
| Investment securities | | | | | 2,267 | | | | | | (653) | | | | | | 1,614 | | | | | | (21) | | | | | | 170 | | | | | | 149 | | |
| Other earning assets | | | | | 563 | | | | | | 30 | | | | | | 593 | | | | | | 596 | | | | | | (743) | | | | | | (147) | | |
| Total interest-earning assets | | | | | 35,335 | | | | | | (712) | | | | | | 34,623 | | | | | | 7,052 | | | | | | (1,806) | | | | | | 5,246 | | |
| Interest-bearing liabilities: | | | | | | | | | | | | | | | | | | | | | | | | | | | | | | | | | | | | | |
| NOW and other demand accounts | | | | | 500 | | | | | | 144 | | | | | | 644 | | | | | | 16 | | | | | | 19 | | | | | | 35 | | |
| Money market accounts | | | | | 659 | | | | | | 470 | | | | | | 1,129 | | | | | | (41) | | | | | | 11 | | | | | | (30) | | |
| Savings accounts | | | | | 163 | | | | | | (54) | | | | | | 109 | | | | | | 45 | | | | | | 6 | | | | | | 51 | | |
| Time deposits | | | | | 1,067 | | | | | | (57) | | | | | | 1,010 | | | | | | 818 | | | | | | 794 | | | | | | 1,612 | | |
| Total interest-bearing deposits | | | | | 2,389 | | | | | | 503 | | | | | | 2,892 | | | | | | 838 | | | | | | 830 | | | | | | 1,668 | | |
| Borrowings | | | | | 2,397 | | | | | | 1,731 | | | | | | 4,128 | | | | | | 110 | | | | | | (222) | | | | | | (112) | | |
| Total interest-bearing liabilities | | | | | 4,786 | | | | | | 2,234 | | | | | | 7,020 | | | | | | 948 | | | | | | 608 | | | | | | 1,556 | | |
| Change in net interest income | | | | $ | 30,549 | | | | | $ | (2,946) | | | | | $ | 27,603 | | | | | $ | 6,104 | | | | | $ | (2,414) | | | | | $ | 3,690 | | |
| | |||||||||||||||||||||||||||||||||||||
| | | | | | | | | | | | | | | | | | |
| | Year Ended | | Year Ended | ||||||||||||||
| | December 31, 2019 vs. 2018 | | December 31, 2018 vs. 2017 | ||||||||||||||
| | Increase (Decrease) | | Increase (Decrease) | ||||||||||||||
| | Due to Change in: | | Due to Change in: | ||||||||||||||
| | | | | | | | Net | | | | | | | | Net | ||
|
| Volume |
| Rate |
| Change |
| Volume |
| Rate |
| Change | ||||||
| | (in thousands) | ||||||||||||||||
Interest-earning assets: |
| |
|
| |
|
| |
|
| |
|
| |
|
| |
|
Loans, net of deferred fees | | $ | 1,172 | | $ | 796 | | $ | 1,968 | | $ | 31,476 | | $ | 973 | | $ | 32,449 |
Investment securities | |
| (129) | |
| (33) | |
| (162) | |
| 1,669 | |
| 148 | |
| 1,817 |
Other earning assets | |
| 365 | |
| (553) | |
| (188) | |
| 496 | |
| 575 | |
| 1,071 |
| | | | | | | | | | | | | | | | | | |
Total interest-earning assets | |
| 1,408 | |
| 210 | |
| 1,618 | |
| 33,641 | |
| 1,696 | |
| 35,337 |
| | | | | | | | | | | | | | | | | | |
Interest-bearing liabilities: | |
| | |
|
| |
|
| |
|
| |
|
| |
|
|
NOW and other demand accounts | |
| 176 | |
| 1,335 | |
| 1,511 | |
| 556 | |
| 218 | |
| 775 |
Money market accounts | |
| 1,304 | |
| 3,380 | |
| 4,684 | |
| 532 | |
| 946 | |
| 1,478 |
Savings accounts | |
| (50) | |
| — | |
| (50) | |
| 124 | |
| (54) | |
| 70 |
Time deposits | |
| 1,074 | |
| 5,148 | |
| 6,222 | |
| 1,982 | |
| 2,938 | |
| 4,920 |
Total interest-bearing deposits | |
| 2,504 | |
| 9,863 | |
| 12,367 | |
| 3,194 | |
| 4,048 | |
| 7,243 |
Borrowings | |
| (9,391) | |
| 6,108 | |
| (3,283) | |
| 3,962 | |
| 984 | |
| 4,946 |
Total interest-bearing liabilities | |
| (6,887) | |
| 15,971 | |
| 9,084 | |
| 7,156 | |
| 5,032 | |
| 12,189 |
| | | | | | | | | | | | | | | | | | |
Change in net interest income | | $ | 8,295 | | $ | (15,761) | | $ | (7,466) | | $ | 26,485 | | $ | (3,337) | | $ | 23,148 |
Provision for Loan Losses
The provision for loan losses is a current charge to earnings made in order to increase or decrease the allowance for loan losses to a level for inherent probable losses in the loan portfolio based on an evaluation of the loan portfolio, current economic conditions, changes in the nature and volume of lending, historical loan experience and other known internal and external factors affecting loan collectability. Our loan loss allowance is calculated by segmenting the loan portfolio by loan type and applying risk factors to each segment. The risk factors are determined by considering historical loss data, peer data, as well as applying management’s judgment.
The provision for loan losses for the years ended December 31, 2019, 2018 and 2017 2016 and 2015 was $8.6 million, $4.9$350 thousand, $4.2 million and $3.2$8.6 million, respectively. We had charge-offs totaling $3.3 million during 2019, $3.1 million during 2018 and $8.8 million during 2017, $5.0 million during 2016, and $2.7 million during 2015.2017. There were recoveries totaling $906 thousand during 2019, $1.8 million during 2018 and $991 thousand during 2017, $239 thousand during 20162017. The provision for loan losses decreased $3.9 million for the year ended December 31, 2019 compared to the year ended December 31, 2018 due to improved credit quality, lower loan volume, lower delinquencies and $526 thousand during 2015.favorable loss history in 2019. The primary driver of the elevated provision for loan losses and the increaseddecreased level of charge-offsrecoveries during the year ended December 31, 2017,2019, as compared to 2016,2018, was the $7.1$1.3 million in charge-offs takenrecoveries on commercial loans in 2018 that were related to the deteriorating financial condition of one long-time borrower of the Bank, a government contractor, who is experiencing cash flow problems. Management is closely monitoring this situation.
The Financial Condition Section of Management’s Discussion and Analysis provides information on our loan portfolio, past due loans, nonperforming assets and the allowance for loan losses.
48
Noninterest Income
The following tables present the major categories of noninterest income for the years ended December 31, 2017, 20162019, 2018 and 20152017 (in thousands):
| | | | 2017 | | | 2016 | | | Change | | |||||||||
| Account maintenance and deposit service fees | | | | $ | 3,564 | | | | | $ | 896 | | | | | $ | 2,668 | | |
| Income from bank-owned life insurance | | | | | 929 | | | | | | 700 | | | | | | 229 | | |
| Equity (loss) income from mortgage affiliate | | | | | (345) | | | | | | 1,109 | | | | | | (1,454) | | |
| Gain on sales of investment securities | | | | | 255 | | | | | | — | | | | | | 255 | | |
| Other | | | | | 1,026 | | | | | | 115 | | | | | | 911 | | |
| Total noninterest income | | | | $ | 5,429 | | | | | $ | 2,820 | | | | | $ | 2,609 | | |
| | |||||||||||||||||||
| | | | 2016 | | | 2015 | | | Change | ||||||||
| Account maintenance and deposit service fees | | | | $ | 896 | | | | | $ | 953 | | | | | $ | (57) |
| Income from bank-owned life insurance | | | | | 700 | | | | | | 636 | | | | | | 64 |
| Equity income from mortgage affiliate | | | | | 1,109 | | | | | | 1,459 | | | | | | (350) |
| Net gain on other assets | | | | | — | | | | | | 7 | | | | | | (7) |
| Gain on sales of investment securities | | | | | — | | | | | | 520 | | | | | | (520) |
| Other | | | | | 115 | | | | | | 206 | | | | | | (91) |
| Total noninterest income | | | | $ | 2,820 | | | | | $ | 3,781 | | | | | $ | (961) |
| | |||||||||||||||||
| | | | | | | | | |
(dollars in thousands) |
| 2019 |
| 2018 |
| Change | |||
Account maintenance and deposit service fees | | $ | 7,159 | | $ | 5,959 |
| $ | 1,200 |
Income from bank-owned life insurance | |
| 1,699 | |
| 1,983 |
| | (284) |
Equity income (loss) from mortgage affiliate | |
| 1,191 | |
| (894) |
| | 2,085 |
Recoveries related to acquired charged-off loans and investment securities | | | 1,537 | | | 2,610 | | | (1,073) |
Other | |
| 1,000 | |
| 541 |
| | 459 |
Total noninterest income | | $ | 12,586 | | $ | 10,199 |
| $ | 2,387 |
| | | | | | | | | |
(dollars in thousands) |
| 2018 |
| 2017 |
| Change | |||
Account maintenance and deposit service fees | | $ | 5,959 | | $ | 3,564 |
| $ | 2,395 |
Income from bank-owned life insurance | |
| 1,983 | |
| 929 |
| | 1,054 |
Equity loss from mortgage affiliate | |
| (894) | |
| (345) |
| | (549) |
Gain on sales of investment securities | |
| — | |
| 255 |
| | (255) |
Recoveries related to acquired charged-off loans and investment securities | | | 2,610 | | | 757 | | | 1,853 |
Other | |
| 541 | |
| 269 |
| | 272 |
Total noninterest income | | $ | 10,199 | | $ | 5,429 |
| $ | 4,770 |
Noninterest income increased 24% to $5.4$12.6 million in the year ended December 31, 20172019 from $2.8$10.2 million in 2016.2018. The $2.4 million increase was primarily driven by an increase of $1.2 million increase in account maintenance and deposit fees and $2.1 million increase in equity income from mortgage affiliate, partially offset by $1.1 million decrease in recoveries related to acquired charged-off loans and investment securities. Income improved on account maintenance and deposit services fee in the current year compared to the prior year. Income from the investment in STM totaled $1.2 million during the year ended December 31, 2019 compared to a loss of $894 thousand during the year ended December 31, 2018. The increase was primarily driven by strengthened management and operational improvements within STM. For the year ended December 31, 2019, recoveries related to acquired charged-off loans and investment securities was $1.5 million compared to $2.6 million for the year ended December 31, 2018. Other noninterest income benefitted from a $337 thousand gain on sale of the last remaining fixed asset premises held for sale during 2019.
Noninterest income increased 89% to $10.2 million in the year ended December 31, 2018 from $5.4 million in 2017. The increase was mainly due to the $2.7$2.4 million increase in account maintenance and deposit service fees primarily driven by the increasedadditional fees charged on the retail deposits acquired in the merger with EVBS. The increase in noninterest income was also driven by $1.9 million of higher income from recoveries of premerger charged off loans and securities by EVBS. Income from bank-owned life insurance (BOLI), which totaled $929 thousand$1.9 million for the year ended December 31, 2017,2018, increased $229 thousand$1.0 million when compared to 2016, primarily2017. The increase was driven by additional$350 thousand of BOLI income earnedrecognized from death benefit payouts in 2018, income from the increasepurchase of an additional $12.0 million in bank-owned life insurance policies acquiredBOLI in the merger2018 as well as increases in BOLI associated with EVBS. Southern National also recognized increases of $255 thousand and $911 thousand on gains on sales of investment securities and in other noninterest income, respectively. The main driver of the $911 thousand increase in other noninterest income was recoveries of $757 thousand from acquired loan and investment security balances from the EVBS acquisition. These loan and investment security balances were fully charged-off by EVBS prior to its acquisition by Southern National.merger. Partially offsetting these increases was a $1.5 million decline$549 thousand increase in incomelosses from the investment in STM, which resulted in a loss of $345 thousand for the year ended December 31, 2017. The decline in income from the investment in STM is mainly attributable to the overall decrease in STM’s revenue due to a lower volumerising interest rates and operational changes within STM.
49
Noninterest Expense
The following tables present the major categories of noninterest expense for the years ended December 31, 2017, 20162019, 2018 and 20152017 (in thousands):
| | | | 2017 | | | 2016 | | | Change | | |||||||||
| Salaries and benefits | | | | $ | 20,285 | | | | | $ | 11,675 | | | | | $ | 8,610 | | |
| Occupancy expenses | | | | | 4,809 | | | | | | 3,155 | | | | | | 1,654 | | |
| Furniture and equipment expenses | | | | | 2,228 | | | | | | 975 | | | | | | 1,253 | | |
| Amortization of core deposit intangible | | | | | 845 | | | | | | 219 | | | | | | 626 | | |
| Virginia franchise tax expense | | | | | 969 | | | | | | 387 | | | | | | 582 | | |
| FDIC assessment | | | | | 802 | | | | | | 543 | | | | | | 259 | | |
| Data processing expense | | | | | 1,140 | | | | | | 744 | | | | | | 396 | | |
| Telephone and communication expense | | | | | 1,422 | | | | | | 745 | | | | | | 677 | | |
| Amortization of FDIC indemnification asset | | | | | 712 | | | | | | 793 | | | | | | (81) | | |
| Net loss on other real estate owned | | | | | 520 | | | | | | 174 | | | | | | 346 | | |
| Merger expenses | | | | | 9,426 | | | | | | 429 | | | | | | 8,997 | | |
| Other operating expenses | | | | | 5,991 | | | | | | 2,976 | | | | | | 3,015 | | |
| Total noninterest expenses | | | | $ | 49,149 | | | | | $ | 22,815 | | | | | $ | 26,334 | | |
| | |||||||||||||||||||
| | | | 2016 | | | 2015 | | | Change | ||||||||
| Salaries and benefits | | | | $ | 11,675 | | | | | $ | 11,860 | | | | | $ | (185) |
| Occupancy expenses | | | | | 3,155 | | | | | | 3,269 | | | | | | (114) |
| Furniture and equipment expenses | | | | | 975 | | | | | | 815 | | | | | | 160 |
| Amortization of core deposit intangible | | | | | 219 | | | | | | 261 | | | | | | (42) |
| Virginia franchise tax expense | | | | | 387 | | | | | | 352 | | | | | | 35 |
| FDIC assessment | | | | | 543 | | | | | | 664 | | | | | | (121) |
| Data processing expense | | | | | 744 | | | | | | 668 | | | | | | 76 |
| Telephone and communication expense | | | | | 745 | | | | | | 786 | | | | | | (41) |
| Amortization of FDIC indemnification asset | | | | | 793 | | | | | | 630 | | | | | | 163 |
| Net loss on other real estate owned | | | | | 174 | | | | | | 291 | | | | | | (117) |
| Merger expenses | | | | | 429 | | | | | | — | | | | | | 429 |
| Other operating expenses | | | | | 2,976 | | | | | | 3,682 | | | | | | (706) |
| Total noninterest expenses | | | | $ | 22,815 | | | | | $ | 23,278 | | | | | $ | (463) |
| | |||||||||||||||||
| | | | | | | | | |
(dollars in thousands) |
| 2019 |
| 2018 |
| Change | |||
Salaries and benefits | | $ | 26,261 | | $ | 27,706 | | $ | (1,445) |
Occupancy expenses | |
| 6,204 | |
| 6,628 | |
| (424) |
Furniture and equipment expenses | |
| 2,719 | |
| 2,795 | |
| (76) |
Amortization of core deposit intangible | |
| 1,418 | |
| 1,445 | |
| (27) |
Virginia franchise tax expense | |
| 2,251 | |
| 1,839 | |
| 412 |
Data processing expense | |
| 2,381 | |
| 1,885 | |
| 496 |
Telephone and communication expense | |
| 1,615 | |
| 2,035 | |
| (420) |
Net (gain) loss on other real estate owned | |
| (38) | |
| 360 | |
| (398) |
Professional fees | |
| 3,612 | |
| 1,644 | |
| 1,968 |
Other operating expenses | |
| 10,169 | |
| 7,423 | |
| 2,746 |
Total noninterest expenses | | $ | 56,592 | | $ | 53,760 | | $ | 2,832 |
| | | | | | | | | |
(dollars in thousands) |
| 2018 |
| 2017 |
| Change | |||
Salaries and benefits | | $ | 27,706 | | $ | 20,285 | | $ | 7,421 |
Occupancy expenses | |
| 6,628 | |
| 4,809 | |
| 1,819 |
Furniture and equipment expenses | |
| 2,795 | |
| 2,228 | |
| 567 |
Amortization of core deposit intangible | |
| 1,445 | |
| 845 | |
| 600 |
Virginia franchise tax expense | |
| 1,839 | |
| 969 | |
| 870 |
Data processing expense | |
| 1,885 | |
| 1,140 | |
| 745 |
Telephone and communication expense | |
| 2,035 | |
| 1,422 | |
| 613 |
Net loss on other real estate owned | |
| 360 | |
| 520 | |
| (160) |
Professional fees | |
| 1,644 | |
| 1,798 | |
| (154) |
Merger expenses | | | — | | | 9,426 | | | (9,426) |
Other operating expenses | |
| 7,423 | |
| 5,707 | |
| 1,716 |
Total noninterest expenses | | $ | 53,760 | | $ | 49,149 | | $ | 4,611 |
Noninterest expenses were $56.6 million during the year ended December 31, 2019, compared to $53.7 million during the year ended December 31, 2018. The year-over-year increase of 5.3% in noninterest expenses was primarily due to an increase in other operating expenses driven by a nonrecurring loss of $3.2 million with related legal expense of $502 thousand during the first quarter of 2019. Professional fees increased $2.0 million for the year ended December 31, 2019, when compared to the year ended December 21, 2018 mainly due to costs incurred as part of our implementation efforts for the 2020 adoption of the Current Expected Credit Losses (“CECL”) accounting standard, enhancements to our compliance and Bank Secrecy Act programs, and general legal expense for corporate matters in 2019. Employee compensation and benefits expense totaled $26.3 million and $27.7 million for the year ended December 31, 2019 and 2018, respectively. The decrease was due to a reduction in staffing in 2019.
Noninterest expenses were $53.7 million during the year ended December 31, 2018, compared to $49.1 million during the year ended December 31, 2017, compared to $22.8 million during the year ended December 31, 2016.2017. The year-over-year increase of 115.4%9.4% in noninterest expenses was mainly driven by the additional acquisition and post-acquisition expenses associated with the EVBS merger on June 23, 2017. Salariesincreased salaries and benefits increased $8.6of $7.4 million in 2017 when2018 compared to 2016. Additional2017 due to additional staff added in the EVBS acquisition was the main factor in the increase. Southern National anticipates salaries and benefits expense to normalize starting in the first quarter of 2018 as the last of the merger-related full-time equivalent employee (“FTE”) reductions took place in the fourth quarter of 2017.acquisition. Occupancy expenses and furniture and equipment expenses increased $1.7$1.8 million and $1.3 million,$567 thousand, respectively, year-over-year to $4.8$6.6 million and $2.2$2.8 million, respectively, for the year ended December 31, 2017.2018 primarily associated with the EVBS merger. The main factor in the $1.7 million and $1.3 million year-over-year increases in occupancy expenses and furniture and equipment expenses, respectively, was the addednoninterest expenses associated with the EVBS merger which are in linewere in-line with management's pre-merger expectations. Other operating expenses increased $1.2 million for the year ended December 31, 2018, when compared to the year ended December 31, 2017. Merger expenses associated with the EVBS acquisition increased $9.0 million towas $9.4 million for the year ended December 31, 2017, compared to the $429 thousandwhich did not recur during 2018.
50
| | | | For the Year Ended | | |||||||||
| | | | December 31, 2017 | | | December 31, 2016 | | ||||||
| | | | (dollars in thousands) | | |||||||||
Salaries and benefits(1) | | | | $ | 4,927 | | | | | $ | — | | |
| Consulting and investment banking fees | | | | | 2,234 | | | | | | 250 | | |
Data processing(2) | | | | | 609 | | | | | | — | | |
| Legal fees | | | | | 637 | | | | | | 161 | | |
| Occupancy expenses | | | | | 628 | | | | | | — | | |
| Filing fees | | | | | 165 | | | | | | 18 | | |
| Appraisals | | | | | 95 | | | | | | — | | |
| Lodging, travel and meals | | | | | 33 | | | | | | — | | |
| Training | | | | | 17 | | | | | | — | | |
| Other | | | | | 81 | | | | | | — | | |
| Total merger expenses | | | | $ | 9,426 | | | | | $ | 429 | | |
| | |||||||||||||
FINANCIAL CONDITION
Balance Sheet Overview
Total assets were $2.61$2.72 billion as of December 31, 2017, compared to $1.142019 and $2.70 billion as of December 31, 2016. The $1.472018. Total loans increased 0.3%, from $2.18 billion increase in total assets from the end of 2016at December 31, 2018 to the end of 2017 was$2.19 billion at December 31, 2019, primarily due to the $1.37loan growth of $262.5 million during 2019, partially offset by unanticipated large loan payoffs or paydowns of $98.2 million in 2019. Total deposits were $2.12 billion in assets acquired, inclusive of fair value adjustments, in the merger with EVBS on June 23, 2017.
Loans
Total loans, net of deferred fees were $2.06$2.19 billion and $930.4 million$2.18 billion at December 31, 20172019 and 2016,2018, respectively. The $1.13 billion$7.2 million increase in total loans, net of deferred fees during 2017 was mainly2019 has primarily been the result of loan growth, partially offset by unanticipated pay downs or payoffs of loans two million and greater in size during the year. New loans originated in 2019 totaled $262.5 million. Loans two million and greater in size, that have been paid off or paid down in 2019, included $52.3 million due to the $1.03 billionsale of the customer’s property, $24.1 million in loans inclusive of fair value adjustments, acquiredthat refinanced elsewhere for unacceptable rate or structure, $13.7 million were projects that transitioned to government financing, and $8.1 million was due to cyclical fluctuation in credit line activity. Additionally, in the merger with EVBS on June 23, 2017. The loans acquired in the merger with EVBS totaled $942.8 million at December 31, 2017. Loan growth during the year ended December 31, 2017 was offset by the salefirst quarter of approximately $29.02019, $33.9 million of EVB’s classifiedcommercial loans were reclassified into loans secured by real estate, upon review and residential TDR loans during the third quartervalidation of 2017 as well as net charge-offs of $7.8 million.
As of December 31, 20172019 and 2016,2018, substantially all of our loans were to customers located in Virginia and Maryland. We are not dependent on any single customer or group of customers whose insolvency would have a material adverse effect on operations.
The following table summarizes the composition of our loans, net of unearned income, at December 31 for the years indicated:indicated (in thousands):
| | | | | | | | | | | | | | | | | | | | | | | | | | |
| | 2019 | | 2018 | | 2017 | | 2016 | | 2015 | | |||||||||||||||
|
| Amount |
| Percent |
| Amount |
| Percent |
| Amount |
| Percent |
| Amount |
| Percent |
| Amount |
| Percent |
| |||||
Loans secured by real estate: |
| |
|
|
|
| |
|
|
|
| |
|
|
|
| |
|
|
|
| |
| | | |
Commercial real estate - owner occupied | | $ | 414,479 |
| 19.0 | % | $ | 407,031 |
| 18.7 | % | $ | 401,847 |
| 19.5 | % | $ | 154,807 |
| 16.6 | % | $ | 141,521 |
| 17.0 | % |
Commercial real estate - non-owner occupied | |
| 559,195 |
| 25.6 | % |
| 540,698 |
| 24.8 | % |
| 440,700 |
| 21.4 | % |
| 279,634 |
| 29.9 | % |
| 256,513 |
| 30.8 | % |
Secured by farmland | |
| 17,622 |
| 0.8 | % |
| 20,966 |
| 1.0 | % |
| 23,038 |
| 1.1 | % |
| 541 |
| 0.1 | % |
| 578 |
| 0.1 | % |
Construction and land development | |
| 150,750 |
| 6.9 | % |
| 146,654 |
| 6.7 | % |
| 197,972 |
| 9.6 | % |
| 91,067 |
| 9.8 | % |
| 67,832 |
| 8.2 | % |
Residential 1-4 family (1) | |
| 604,777 |
| 27.7 | % |
| 565,083 |
| 25.9 | % |
| 483,006 |
| 23.4 | % |
| 230,810 |
| 24.8 | % |
| 178,071 |
| 21.4 | % |
Multi- family residential | |
| 82,055 |
| 3.8 | % |
| 82,516 |
| 3.8 | % |
| 70,892 |
| 3.4 | % |
| 30,021 |
| 3.2 | % |
| 25,501 |
| 3.1 | % |
Home equity lines of credit (1) | |
| 109,006 |
| 5.0 | % |
| 128,225 |
| 5.9 | % |
| 152,829 |
| 7.4 | % |
| 29,203 |
| 3.1 | % |
| 35,177 |
| 4.2 | % |
Total real estate loans | |
| 1,937,884 |
| 88.7 | % |
| 1,891,173 |
| 86.8 | % |
| 1,770,284 |
| 85.8 | % |
| 816,083 |
| 87.5 | % |
| 705,193 |
| 84.8 | % |
| | | | | | | | | | | | | | | | | | | | | | | | | | |
Commercial loans | |
| 221,447 |
| 10.1 | % |
| 255,441 |
| 11.7 | % |
| 253,258 |
| 12.3 | % |
| 115,365 |
| 12.4 | % |
| 124,985 |
| 15.0 | % |
Consumer loans | |
| 26,304 |
| 1.2 | % |
| 32,347 |
| 1.5 | % |
| 39,374 |
| 1.9 | % |
| 856 |
| 0.1 | % |
| 1,366 |
| 0.2 | % |
Gross loans | |
| 2,185,635 |
| 100 | % |
| 2,178,961 |
| 100 | % |
| 2,062,916 |
| 100 | % |
| 932,304 |
| 100 | % |
| 831,544 |
| 100 | % |
| | | | | | | | | | | | | | | | | | | | | | | | | | |
Plus (less) deferred costs (fees) on loans | |
| 412 |
| | |
| (137) |
|
| |
| (588) |
|
| |
| (1,889) |
|
| |
| (2,119) |
|
| |
Loans, net of deferred fees | | $ | 2,186,047 |
| | | $ | 2,178,824 |
|
| | $ | 2,062,328 |
|
| | $ | 930,415 |
|
| | $ | 829,425 |
|
| |
| | | | | | | | | | | | | | | | | | | | | | | | | | |
Covered loans included above in residential 1-4 family and home equity lines of credit (1) | | $ | 13,527 |
| | | $ | 18,252 |
|
| | $ | 23,339 |
|
| | $ | 28,180 |
|
| | $ | 34,373 |
|
| |
| (1) | Includes loans acquired in the GAB transaction covered under an FDIC loss-share agreement which expired on December 31, 2019. |
| | | | 2017 | | | 2016 | | | 2015 | | | 2014 | | | 2013 | | |||||||||||||||||||||||||||||||||||||||||||||
| | | | Amount | | | Percent | | | Amount | | | Percent | | | Amount | | | Percent | | | Amount | | | Percent | | | Amount | | | Percent | | ||||||||||||||||||||||||||||||
| Loans secured by real estate: | | | | | | | | | | | | | | | | | | | | | | | | | | | | | | | | | | | | | | | | | | | | | | | | | | | | | | | | | | | | | |
| Commercial real estate – owner occupied | | | | $ | 401,847 | | | | | | 19.5% | | | | | $ | 154,807 | | | | | | 16.6% | | | | | $ | 141,521 | | | | | | 17.0% | | | | | $ | 136,597 | | | | | | 19.4% | | | | | $ | 107,828 | | | | | | 19.7% | | |
| Commercial real estate – non-owner occupied | | | | | 440,700 | | | | | | 21.4% | | | | | | 279,634 | | | | | | 29.9% | | | | | | 256,513 | | | | | | 30.8% | | | | | | 200,517 | | | | | | 28.4% | | | | | | 155,837 | | | | | | 28.5% | | |
| Secured by farmland | | | | | 23,038 | | | | | | 1.1% | | | | | | 541 | | | | | | 0.1% | | | | | | 578 | | | | | | 0.1% | | | | | | 612 | | | | | | 0.1% | | | | | | 608 | | | | | | 0.1% | | |
| Construction and land development | | | | | 197,972 | | | | | | 9.6% | | | | | | 91,067 | | | | | | 9.8% | | | | | | 67,832 | | | | | | 8.2% | | | | | | 57,938 | | | | | | 8.2% | | | | | | 39,069 | | | | | | 7.1% | | |
Residential 1-4 family(1) | | | | | 483,006 | | | | | | 23.4% | | | | | | 230,810 | | | | | | 24.8% | | | | | | 178,071 | | | | | | 21.4% | | | | | | 138,070 | | | | | | 19.6% | | | | | | 83,113 | | | | | | 15.2% | | |
| Multi-family residential | | | | | 70,892 | | | | | | 3.4% | | | | | | 30,021 | | | | | | 3.2% | | | | | | 25,501 | | | | | | 3.1% | | | | | | 21,832 | | | | | | 3.1% | | | | | | 22,081 | | | | | | 4.0% | | |
Home equity lines of credit(1) | | | | | 152,829 | | | | | | 7.4% | | | | | | 29,203 | | | | | | 3.1% | | | | | | 35,177 | | | | | | 4.2% | | | | | | 33,409 | | | | | | 4.7% | | | | | | 32,200 | | | | | | 5.9% | | |
| Total real estate loans | | | | | 1,770,284 | | | | | | 85.8% | | | | | | 816,083 | | | | | | 87.5% | | | | | | 705,193 | | | | | | 84.8% | | | | | | 588,975 | | | | | | 83.5% | | | | | | 440,736 | | | | | | 80.5% | | |
| Commercial loans | | | | | 253,258 | | | | | | 12.3% | | | | | | 115,365 | | | | | | 12.4% | | | | | | 124,985 | | | | | | 15.0% | | | | | | 114,714 | | | | | | 16.3% | | | | | | 105,381 | | | | | | 19.2% | | |
| Consumer loans | | | | | 39,374 | | | | | | 1.9% | | | | | | 856 | | | | | | 0.1% | | | | | | 1,366 | | | | | | 0.2% | | | | | | 1,564 | | | | | | 0.2% | | | | | | 1,389 | | | | | | 0.3% | | |
| Gross loans | | | | | 2,062,916 | | | | | | 100.0% | | | | | | 932,304 | | | | | | 100.0% | | | | | | 831,544 | | | | | | 100.0% | | | | | | 705,253 | | | | | | 100.0% | | | | | | 547,506 | | | | | | 100.0% | | |
| Less deferred fees on loans | | | | | (588) | | | | | | | | | | | | (1,889) | | | | | | | | | | | | (2,119) | | | | | | | | | | | | (1,781) | | | | | | | | | | | | (1,448) | | | | | | | | |
| Loans, net of deferred fees | | | | $ | 2,062,328 | | | | | | | | | | | $ | 930,415 | | | | | | | | | | | $ | 829,425 | | | | | | | | | | | $ | 703,472 | | | | | | | | | | | $ | 546,058 | | | | | | | | |
Covered loans included above in residential 1-4 family and home equity lines of credit(1) | | | | $ | 23,339 | | | | | | | | | | | $ | 28,180 | | | | | | | | | | | $ | 34,373 | | | | | | | | | | | $ | 38,496 | | | | | | | | | | | $ | 51,701 | | | | | | | | |
51
The following table sets forth the contractual maturity ranges of the commercial and construction and land development and commercial loan portfolios and the amount of those loans with fixed and floating interest rates in each maturity range as of December 31, 20172019 (in thousands):
| | | | | | | | | | After 1 Year Through 5 Years | | | After 5 Years | | | |||||||||||||||||||||||
| | | | One Year or Less | | | Fixed Rate | | | Floating Rate | | | Fixed Rate | | | Floating Rate | | | Total | | ||||||||||||||||||
| Construction and land development | | | | $ | 171,623 | | | | | $ | 14,355 | | | | | $ | 10,952 | | | | | $ | 442 | | | | | $ | 600 | | | | | $ | 197,972 | | |
| Commercial | | | | | 164,328 | | | | | | 64,604 | | | | | | 9,689 | | | | | | 12,538 | | | | | | 2,099 | | | | | | 253,258 | | |
| Total | | | | $ | 335,951 | | | | | $ | 78,959 | | | | | $ | 20,641 | | | | | $ | 12,980 | | | | | $ | 2,699 | | | | | $ | 451,230 | | |
| | |||||||||||||||||||||||||||||||||||||
| | | | | | | | | | | | | | | | | | |
| | | | | After 1 Year | | | | | | | | |
| ||||
| | | | | Through 5 Years | | After 5 Years | | |
| ||||||||
| | One Year | | Fixed | | Floating | | Fixed | | Floating | | |
| |||||
|
| or Less |
| Rate |
| Rate |
| Rate |
| Rate |
| Total | ||||||
Construction and land development | | $ | 99,185 | | $ | 25,654 | | $ | 11,057 | | $ | 5,103 | | $ | 9,751 | | $ | 150,750 |
Commercial | |
| 110,189 | |
| 54,492 | |
| 14,407 | |
| 6,890 | |
| 35,469 | |
| 221,447 |
Total | | $ | 209,374 | | $ | 80,146 | | $ | 25,464 | | $ | 11,993 | | $ | 45,220 | | $ | 372,197 |
Asset Quality; Past Due Loans and Nonperforming Assets
Asset quality remained high during 2019. We will generally place a loan on nonaccrual status when it becomes 90 days past due. Loans will also be placed on nonaccrual status in cases where we are uncertain whether the borrower can satisfy the contractual terms of the loan agreement. Cash payments received while a loan is categorized as nonaccrual will be recorded as a reduction of principal as long as doubt exists as to future collections.
We maintain appraisals on loans secured by real estate, particularly those categorized as nonperforming loans and potential problem loans. In instances where appraisals reflect reduced collateral values, we make an evaluation of the borrower’s overall financial condition to determine the need, if any, for impairment or write-down to their fair values. If foreclosure occurs, we record OREO at the lower of our recorded investment in the loan or fair value less our estimated costs to sell.
Our loss and delinquency experience on our loan portfolio has been limited by a number of factors, including our underwriting standards and the relatively short period of time since the loans were originated. Whether our loss and delinquency experience in the area of our portfolio will increase significantly depends upon the value of the real estate securing loans and economic factors such as the overall economy of the region.
The following table presents a comparison of non-covered nonperforming assets as of December 31, for the years indicated (in thousands):
| | | | 2017 | | | 2016 | | | 2015 | | | 2014 | | | 2013 | | |||||||||||||||
| Nonaccrual loans | | | | $ | 16,931 | | | | | $ | 3,795 | | | | | $ | 4,173 | | | | | $ | 5,652 | | | | | $ | 7,814 | | |
| Loans past due 90 days and accruing interest | | | | | — | | | | | | — | | | | | | — | | | | | | — | | | | | | — | | |
| Total nonperforming loans | | | | | 16,931 | | | | | | 3,795 | | | | | | 4,173 | | | | | | 5,652 | | | | | | 7,814 | | |
| Other real estate owned | | | | | 7,577 | | | | | | 8,617 | | | | | | 10,096 | | | | | | 13,051 | | | | | | 9,579 | | |
| Total nonperforming assets | | | | $ | 24,508 | | | | | $ | 12,412 | | | | | $ | 14,269 | | | | | $ | 18,703 | | | | | $ | 17,393 | | |
| Troubled debt restructurings | | | | $ | 672 | | | | | $ | 688 | | | | | $ | 699 | | | | | $ | — | | | | | $ | 5,933 | | |
| SBA guaranteed amounts included in nonaccrual loans | | | | $ | 4,664 | | | | | $ | 2,173 | | | | | $ | 3,541 | | | | | $ | 4,664 | | | | | $ | 1,852 | | |
| Allowance for loan losses to nonperforming loans | | | | | 55.50% | | | | | | 226.88% | | | | | | 201.80% | | | | | | 130.80% | | | | | | 90.08% | | |
| Allowance for loan losses to total non-covered loans | | | | | 0.46% | | | | | | 0.95% | | | | | | 1.06% | | | | | | 1.11% | | | | | | 1.42% | | |
| Nonperforming assets to total non-covered assets | | | | | 0.95% | | | | | | 1.11% | | | | | | 1.42% | | | | | | 2.13% | | | | | | 2.63% | | |
| Nonperforming assets excluding SBA guaranteed loans to total non-covered assets | | | | | 0.77% | | | | | | 0.92% | | | | | | 1.07% | | | | | | 1.60% | | | | | | 2.35% | | |
| Nonperforming assets to total non-covered loans and OREO | | | | | 1.20% | | | | | | 1.36% | | | | | | 1.77% | | | | | | 2.76% | | | | | | 3.45% | | |
| Nonperforming assets excluding SBA guaranteed loans to total non-covered loans and OREO | | | | | 0.97% | | | | | | 1.12% | | | | | | 1.33% | | | | | | 2.07% | | | | | | 3.08% | | |
| | | | | | | | | | | | | | | | |
| | 2019 |
| 2018 |
| 2017 |
| 2016 |
| 2015 | | |||||
Nonaccrual loans | | $ | 8,900 | | $ | 6,709 | | $ | 16,931 | | $ | 3,795 | | $ | 4,173 | |
Loans past due 90 days and accruing interest | |
| — | |
| — | |
| — | |
| — | |
| — | |
Total nonperforming loans | |
| 8,900 | |
| 6,709 | |
| 16,931 | |
| 3,795 | |
| 4,173 | |
Other real estate owned | |
| 6,224 | |
| 5,077 | |
| 7,577 | |
| 8,617 | |
| 10,096 | |
Total non-covered nonperforming assets | | $ | 15,124 | | $ | 11,786 | | $ | 24,508 | | $ | 12,412 | | $ | 14,269 | |
| | | | | | | | | | | | | | | | |
Troubled debt restructurings | | $ | 697 | | $ | 692 | | $ | 672 | | $ | 688 | | $ | 699 | |
SBA guaranteed amounts included in nonaccrual loans | | $ | 4,129 | | $ | 3,391 | | $ | 4,664 | | $ | 2,173 | | $ | 3,541 | |
| | | | | | | | | | | | | | | | |
Allowance for loan losses to nonperforming loans | |
| 115.30 | % |
| 207.63 | % |
| 55.50 | % |
| 226.88 | % |
| 201.80 | % |
Allowance for loan losses to total non-covered loans | |
| 0.47 | % |
| 0.57 | % |
| 0.46 | % |
| 0.95 | % |
| 1.06 | % |
Nonperforming assets excluding SBA guaranteed loans to total non-covered assets | |
| 0.41 | % |
| 0.28 | % |
| 0.77 | % |
| 0.92 | % |
| 1.07 | % |
Covered nonperforming assets are not included in the table above because the carrying value includes a component for credit losses (the nonaccretable yield).
OREO at December 31, 2019 was $6.2 million compared to $5.1 million at December 31, 2018. Increase in OREO was driven by foreclosure of three small commercial properties and one residential property in 2019.
52
Non-covered nonaccrual loans were $16.9$4.8 million (including $4.7(excluding $4.1 million of loans fully covered by SBA guarantees) at December 31, 20172019 compared to $3.8$3.3 million (including $2.2(excluding $3.4 million of loans fully covered by SBA guarantees) at December 31, 2016. Included in the $16.9 million of non-covered nonaccrual loans at December 31, 2017 is a $10.0 million loan extended to a commercial construction real estate company which is secured by commercial real estate properties with appraised values of approximately $14 million. The unguaranteed portions of the nonperforming SBA loans have been charged-off.2018. The ratio of non-covered nonperforming assets (excluding the SBA guaranteed loans) to total non-covered assets decreased from 0.92% at the end of 2016 to 0.77%0.28% at December 31, 2017.
At December 31, 2017,2019, our total substandard loans (covered and non-covered) totaled $22.4$10.5 million. Included in the total substandard loans were SBA guarantees of $5.0$0.3 million and covered loans of $1.1$0.9 million. Special mention loans totaled $17.4$12.2 million at December 31, 2017.
As of December 31, 2019, we had three TDR loans, totaling $697 thousand. One loan was modified as a TDR during each of the years ending December 31, 20172019 and 2016, there were no loans modified in troubled debt restructurings (“TDRs”).2018. One TDR which had been modified in 2013 defaulted during the second quarter ofin 2015. This loan, in the amount of $672$645 thousand, was 30 — 59 days delinquent as of June 30, 2015, but was current as of December 31, 2017.
It is the Bank’s practice to concurrently charge off collateral-dependent loans at the time loan impairment is recognized. Charge-offsWe had $245 thousand charge-offs on loans individually evaluated for impairment as of December 31, 2017 totaled approximately $5.4 million.
We identify potential problem loans based on loan portfolio credit quality. We define our potential problem loans as our non-covered classified/criticized loans less total non-covered nonperforming loans noted above. At December 31, 20172019 and 2018, our potential problem loans totaled $5.5 million.
Allowance for Loan and Lease Losses
We are very focused on the asset quality of our loan portfolio, both before and after the loan is made. We have established underwriting standards that we believe are effective in maintaining high credit quality in our loan portfolio. We have experienced loan officers who take personal responsibility for the loans they underwrite, a standing credit committee that reviews each loan application carefully, and a requirement that loans over 20% of our legal lending limit$6,000,000 must be approved by all five executive members of our standing credit committee and loans over $10,000,000 must be approved by the full board of directors or two outside directors.
Our allowance for loan and lease losses is established through charges to earnings in the form of a provision for loan losses. Management evaluates the allowance at least quarterly. In addition, on a quarterly basis our board of directors reviews our loan portfolio, evaluates credit quality, reviews the loan loss provision and the allowance for loan and lease losses and makes changes as may be required. In evaluating the allowance, management and the board of directors consider the growth, composition and industry diversification of the loan portfolio, historical loan loss experience, current delinquency levels and all other known factors affecting loan collectability.
The allowance for loan and lease losses represents management’s estimate of an amount appropriate to provide for probable incurred losses in the loan portfolio in the normal course of business. This estimate is based on average historical losses within the various loan types that compose our portfolio as well as an estimate of the effect that other known factors such as the economic environment within our market area will have on net losses. The allowance is also subject to regulatory examinations and determination by the regulatory agencies as to the appropriate level of the allowance.
Our loan review program is conductedadministrated by the Executive CreditChief Risk Officer and an independent third-party consultant who reportreports results directly to the Audit Committee of the Board of Directors. In accordance with theThe Bank’s credit policy in 2017,specifies that “Internal Loan review is responsible for performing a full scope review and written report of loans with a total dollar commitment amount equal to 30% of commercial loans outstanding at the previous year-end including Construction and Development, Nonfarm Nonresidential (CRE) and Commercial and Industrial loans.” In 2019, internal loan review performed loan reviews on loans and commitments totaling 45%25.3% of thethis loan portfolio outstanding as of December 31, 2016, excluding consumer and residential 1-4 family loans, was reviewed by the independent third-party consultant, and another 30%2018. External loan review is responsible for reviewing 50% of the same portfolio was reviewed internally.at previous year end. An independent third party consultant performed loan reviews on 59.1% of this portfolio. In 20182019, internal and external loan reviews were performed on 84.4% of the specified portfolio of loans. In 2020 we plan to have the independent third-party consultant review loans and commitments totaling at least 50% of the loan portfolio outstanding as of December 31, 2017, excluding consumer and residential 1-4 family loans,2019, and another 30% reviewed internally. Loan reviews totaling at least 80% of the specified commercial loan portfolio outstanding at December 31, 2019 will be reviewed internally.
53
performed. The purpose of loan review by a third-party is to validate management’s assessment of risk of the individual loans in the portfolio and to determine whether the loan was approved, underwritten and is being monitored in accordance with the Bank’s credit policy and regulatory guidance. Management’s risk assessment of individual loans takes into consideration among other factors, the estimated value of the underlying collateral, the borrower’s ability to repay, the borrower’s payment history and current payment status.
The following table sets forth the allowance for loan losses allocated by loan category and the percent of loans in each category to total loans at the dates indicated (in thousands):
| | | | | | | | | | | | | | | | | | | | | | | | | | |
| | As of December 31, |
| |||||||||||||||||||||||
| | 2019 | | 2018 | | 2017 | | 2016 | | 2015 |
| |||||||||||||||
| | | | | Percent of | | | | | Percent of | | | | | Percent of | | | | | Percent of | | | | | Percent of |
|
| | Allowance | | Loans by | | Allowance | | Loans by | | Allowance | | Loans by | | Allowance | | Loans by | | Allowance | | Loans by |
| |||||
| | for Loan | | Category to | | for Loan | | Category to | | for Loan | | Category to | | for Loan | | Category to | | for Loan | | Category to |
| |||||
|
| Losses |
| Total Loans |
| Losses |
| Total Loans |
| Losses |
| Total Loans |
| Losses |
| Total Loans |
| Losses |
| Total Loans |
| |||||
Commercial real estate (1) | | $ | 2,530 | | 49.1 | % | $ | 2,471 | | 48.2 | % | $ | 2,011 | | 45.4 | % | $ | 2,389 | | 49.8 | % | $ | 2,407 | | 51.0 | % |
Construction and land development | | | 683 | | 6.9 | % | | 821 | | 6.7 | % | | 692 | | 9.6 | % | | 752 | | 9.8 | % | | 865 | | 8.2 | % |
Residential 1-4 family (2) | | | 1,266 | | 32.7 | % | | 1,106 | | 31.8 | % | | 1,586 | | 30.8 | % | | 1,279 | | 27.9 | % | | 1,408 | | 25.6 | % |
Commercial loans | | | 4,518 | | 10.1 | % | | 6,497 | | 11.7 | % | | 4,496 | | 12.3 | % | | 3,366 | | 12.4 | % | | 3,041 | | 15.0 | % |
Consumer loans | | | 190 | | 1.2 | % | | 224 | | 1.5 | % | | 612 | | 1.9 | % | | 78 | | 0.1 | % | | 48 | | 0.2 | % |
Total | | | 9,187 | | 100.0 | % | | 11,119 | | 100.0 | % | | 9,397 | | 100.0 | % | | 7,864 | | 100.0 | % | | 7,769 | | 100.0 | % |
Allowance for acquired loan losses | | | 900 | | | | | 600 | | | | | — | | | | | — | | | | | — | | | |
Total allocated allowance | | | 10,087 | | | | | 11,719 | | | | | 9,397 | | | | | 7,864 | | | | | 7,769 | | | |
Unallocated allowance | | | 174 | |
| | | 564 | |
| | | — | |
| | | 746 | |
| | | 652 | |
|
|
Total | | $ | 10,261 | |
| | $ | 12,283 | |
| | $ | 9,397 | |
| | $ | 8,610 | |
| | $ | 8,421 | |
|
|
| (1) | Includes owner and non-owner occupied loans, loans secured by farmland and multi-family residential loans. |
| (2) | Includes home equity lines of credit. |
| | | | As of December 31, | | |||||||||||||||||||||||||||||||||||||||||||||||||||||||||
| | | | 2017 | | | 2016 | | | 2015 | | | 2014 | | | 2013 | | |||||||||||||||||||||||||||||||||||||||||||||
| | | | Allowance for Loan Losses | | | Percent of Loans by Category to Total Loans | | | Allowance for Loan Losses | | | Percent of Loans by Category to Total Loans | | | Allowance for Loan Losses | | | Percent of Loans by Category to Total Loans | | | Allowance for Loan Losses | | | Percent of Loans by Category to Total Loans | | | Allowance for Loan Losses | | | Percent of Loans by Category to Total Loans | | ||||||||||||||||||||||||||||||
Commercial real estate(1) | | | | $ | 2,011 | | | | | | 45.4% | | | | | $ | 2,389 | | | | | | 49.8% | | | | | $ | 2,407 | | | | | | 51.0% | | | | | $ | 1,978 | | | | | | 51.0% | | | | | $ | 1,844 | | | | | | 52.3% | | |
| Construction and land development | | | | | 692 | | | | | | 9.6% | | | | | | 752 | | | | | | 9.8% | | | | | | 865 | | | | | | 8.2% | | | | | | 1,644 | | | | | | 8.2% | | | | | | 1,068 | | | | | | 7.1% | | |
Residential 1-4 family(2) | | | | | 1,586 | | | | | | 30.8% | | | | | | 1,279 | | | | | | 27.9% | | | | | | 1,408 | | | | | | 25.6% | | | | | | 1,339 | | | | | | 24.3% | | | | | | 1,302 | | | | | | 21.1% | | |
| Commercial loans | | | | | 4,496 | | | | | | 12.3% | | | | | | 3,366 | | | | | | 12.4% | | | | | | 3,041 | | | | | | 15.0% | | | | | | 2,063 | | | | | | 16.3% | | | | | | 2,797 | | | | | | 19.2% | | |
| Consumer loans | | | | | 612 | | | | | | 1.9% | | | | | | 78 | | | | | | 0.1% | | | | | | 48 | | | | | | 0.2% | | | | | | 53 | | | | | | 0.2% | | | | | | 60 | | | | | | 0.3% | | |
| Total allocated allowance | | | | | 9,397 | | | | | | 100.0% | | | | | | 7,864 | | | | | | 100.0% | | | | | | 7,769 | | | | | | 100.0% | | | | | | 7,077 | | | | | | 100.0% | | | | | | 7,071 | | | | | | 100.0% | | |
| Unallocated allowance | | | | | — | | | | | | | | | | | | 746 | | | | | | | | | | | | 652 | | | | | | | | | | | | 337 | | | | | | | | | | | | 19 | | | | | | | | |
| Total | | | | $ | 9,397 | | | | | | | | | | | $ | 8,610 | | | | | | | | | | | $ | 8,421 | | | | | | | | | | | $ | 7,414 | | | | | | | | | | | $ | 7,090 | | | | | | | | |
| | |||||||||||||||||||||||||||||||||||||||||||||||||||||||||||||
54
The following table presents an analysis of the allowance for loan losses for the periods indicated (in thousands):
| | | | For the Years Ended December 31, | | |||||||||||||||||||||||||||
| | | | 2017 | | | 2016 | | | 2015 | | | 2014 | | | 2013 | | |||||||||||||||
| Balance, beginning of period | | | | $ | 8,610 | | | | | $ | 8,421 | | | | | $ | 7,414 | | | | | $ | 7,090 | | | | | $ | 7,066 | | |
| Provision charged to operations | | | | | 8,625 | | | | | | 4,912 | | | | | | 3,171 | | | | | | 3,444 | | | | | | 3,615 | | |
| Recoveries credited to allowance: | | | | | | | | | | | | | | | | | | | | | | | | | | | | | | | |
Real estate – commercial(1) | | | | | 431 | | | | | | 8 | | | | | | 36 | | | | | | 33 | | | | | | 159 | | |
| Real estate – construction, land and other | | | | | 1 | | | | | | 121 | | | | | | 139 | | | | | | 4 | | | | | | 7 | | |
Real estate – residential 1-4 family(2) | | | | | 17 | | | | | | 10 | | | | | | 242 | | | | | | 21 | | | | | | 129 | | |
| Commercial | | | | | 538 | | | | | | 96 | | | | | | 91 | | | | | | 89 | | | | | | 169 | | |
| Consumer | | | | | 4 | | | | | | 4 | | | | | | 1 | | | | | | 3 | | | | | | — | | |
| Total recoveries | | | | | 991 | | | | | | 239 | | | | | | 509 | | | | | | 150 | | | | | | 464 | | |
| Total | | | | | 18,226 | | | | | | 13,572 | | | | | | 11,094 | | | | | | 10,684 | | | | | | 11,145 | | |
| Loans charged off: | | | | | | | | | | | | | | | | | | | | | | | | | | | | | | | |
Real estate – commercial(1) | | | | | 100 | | | | | | 799 | | | | | | 1,067 | | | | | | 573 | | | | | | 199 | | |
| Real estate – construction, land and other | | | | | — | | | | | | 449 | | | | | | — | | | | | | 250 | | | | | | 650 | | |
Real estate – residential 1-4 family(2) | | | | | 369 | | | | | | 22 | | | | | | 413 | | | | | | 449 | | | | | | 776 | | |
| Commercial | | | | | 8,250 | | | | | | 3,370 | | | | | | 1,174 | | | | | | 1,998 | | | | | | 2,286 | | |
| Consumer | | | | | 110 | | | | | | 322 | | | | | | 19 | | | | | | — | | | | | | 144 | | |
| Total loans charged-off | | | | | 8,829 | | | | | | 4,962 | | | | | | 2,673 | | | | | | 3,270 | | | | | | 4,055 | | |
| Net charge-offs | | | | | 7,838 | | | | | | 4,723 | | | | | | 2,164 | | | | | | 3,120 | | | | | | 3,591 | | |
| Balance, end of period | | | | $ | 9,397 | | | | | $ | 8,610 | | | | | $ | 8,421 | | | | | $ | 7,414 | | | | | $ | 7,090 | | |
| Net charge-offs to average loans, net of unearned income | | | | | 0.51% | | | | | | 0.53% | | | | | | 0.28% | | | | | | 0.51% | | | | | | 0.69% | | |
| | | | | | | | | | | | | | | | |
| | For the Years Ended December 31, | | |||||||||||||
|
| 2019 |
| 2018 |
| 2017 |
| 2016 |
| 2015 | | |||||
Balance, beginning of period | | $ | 12,283 | | $ | 9,397 | | $ | 8,610 | | $ | 8,421 | | $ | 7,414 | |
Provision charged to operations: | | | | | | | | | | | | | | | | |
Provision for non-purchased loans | |
| 50 | |
| 3,600 | |
| 8,625 | |
| 4,912 | |
| 3,171 | |
Provision for purchase credit impaired loans | | | 300 | | | 600 | | | — | | | — | | | — | |
Total provisions | | | 350 | | | 4,200 | | | 8,625 | | | 4,912 | | | 3,171 | |
Recoveries credited to allowance: | |
| | |
|
| |
|
| |
|
|
|
|
| |
Real estate - commercial (1) | |
| 213 | |
| 15 | |
| 431 | |
| 8 | |
| 36 | |
Real estate - construction, land and other | |
| — | |
| — | |
| 1 | |
| 121 | |
| 139 | |
Real estate - residential 1-4 family (2) | |
| 306 | |
| 125 | |
| 17 | |
| 10 | |
| 242 | |
Commercial | |
| 351 | |
| 1,626 | |
| 538 | |
| 96 | |
| 91 | |
Consumer | |
| 36 | |
| 18 | |
| 4 | |
| 4 | |
| 1 | |
Total recoveries | |
| 906 | |
| 1,784 | |
| 991 | |
| 239 |
|
| 509 | |
Loans charged off: | |
|
| |
|
| |
|
| |
|
|
|
|
| |
Real estate - commercial (1) | |
| 1,645 | |
| 400 | |
| 100 | |
| 799 | |
| 1,067 | |
Real estate - construction, land and other | |
| — | |
| — | |
| — | |
| 449 | |
| — | |
Real estate - residential 1-4 family (2) | |
| 742 | |
| 842 | |
| 369 | |
| 22 | |
| 413 | |
Commercial | |
| 622 | |
| 1,566 | |
| 8,250 | |
| 3,370 | |
| 1,174 | |
Consumer | |
| 269 | |
| 290 | |
| 110 | |
| 322 | |
| 19 | |
Total loans charged-off | |
| 3,278 | |
| 3,098 | |
| 8,829 | |
| 4,962 |
|
| 2,673 | |
Net charge-offs | |
| 2,372 | |
| 1,314 | |
| 7,838 | |
| 4,723 | |
| 2,164 | |
Balance, end of period | | $ | 10,261 | | $ | 12,283 | | $ | 9,397 | | $ | 8,610 |
| $ | 8,421 | |
| | | | | | | | | | | | | | | | |
Net charge-offs to average loans, net of unearned income | |
| 0.11 | % |
| 0.06 | % |
| 0.51 | % |
| 0.53 | % |
| 0.28 | % |
| (1) | Includes owner and non-owner occupied loans, loans secured by farmland and multi-family residential loans. |
| (2) | Includes home equity lines of credit. |
In 2017,2019, we had loan charge-offs totaling $8.8 million. The primary driver of the increase in loan charge-offs during the year ended December 31, 2017 as$3.3 million, compared to the same period of 2016 was $7.1$3.1 million of charge-offs taken on loans that were related to the deteriorating financial condition of one long-time borrower of the Bank, a government contractor, who is experiencing cash flow problems.
We believe that the allowance for loan losses at December 31, 20172019 is sufficient to absorb probable incurred credit losses in our loan portfolio based on our assessment of all known factors affecting the collectability of our loan portfolio. Our assessment involves uncertainty and judgment; therefore, the adequacy of the allowance for loan losses cannot be determined with precision and may be subject to change in future periods. In addition, bank regulatory authorities, as part of their periodic examination, may require additional charges to the provision for loan losses in future periods if the results of their reviews warrant additions to the allowance for loan losses.
Investment Securities
Our investment securities portfolio provides us with required liquidity and investment securities to pledge as collateral to secure public deposits, certain other deposits, a line of credit for advances from the FHLB of Atlanta, and repurchase agreements.
Our investment securities portfolio is managed by our executive vice chairman and our treasurer, both of whom have significant experience in this area, with the concurrence of our Asset/Liability Committee. In addition to our executive vice chairman (who is the chairman of the Asset/Liability Committee) and our treasurer,Controller, this committee is comprised of outside directors and other senior officers of the Bank, including but not limited to our executive chairman, our president and chief executive officer and our chief financial officer. Investment management is performed in accordance with our investment policy, which is approved annually by the Asset/Liability Committee and the Board of Directors. Our
55
investment policy addresses our investment strategies, approval process, approved securities dealers and authorized investments. Our investment policy authorizes us to invest in:
| ● | Government National Mortgage Association (“GNMA”), Federal National Mortgage Association (“FNMA”) and the Federal Home Loan Mortgage Corporation (“FHLMC”) mortgage-backed securities (“MBS”) |
| ● | Collateralized mortgage obligations |
| ● | U.S. Treasury securities |
| ● | SBA guaranteed loan pools |
| ● | Agency securities |
| ● | Obligations of states and political subdivisions |
| ● | Pooled trust preferred securities comprised of a minimum of 80% bank collateral with an investment grade rating or a minimum of 60% bank collateral with a AAA rating at purchase |
| ● | Other corporate debt securities rated Aa3/AA- or better at purchase |
MBS are securities that have been developed by pooling a number of real estate mortgages and which are principally issued by agency/government-sponsored entities (“GSEs”) such as the GNMA, FNMA and FHLMC. These securities are deemed to have high credit ratings, and minimum regular monthly cash flows of principal and interest are guaranteed by the issuing agencies.
Unlike U.S. Treasury and U.S. government agency securities, which have a lump sum payment at maturity, MBS provide cash flows from regular principal and interest payments and principal prepayments throughout the lives of the securities. MBS which are purchased at a premium will generally suffer decreasing net yields as interest rates drop because homeowners tend to refinance their mortgages. Thus, the premium paid must be amortized over a shorter period. Conversely, MBS purchased at a discount will obtain higher net yields in a decreasing interest rate environment. As interest rates rise, the opposite will
Collateralized mortgage obligations (“CMOs”) are bonds that are backed by pools of mortgages. The pools can be GNMA, FNMA or FHLMC pools or they can be private-label pools. The CMOs are designed so that the mortgage collateral will generate a cash flow sufficient to provide for the timely repayment of the bonds. The mortgage collateral pool can be structured to accommodate various desired bond repayment schedules, provided that the collateral cash flow is adequate to meet scheduled bond payments. This is accomplished by dividing the bonds into classes to which payments on the underlying mortgage pools are allocated. The bond’s cash flow, for example, can be dedicated to one class of bondholders at a time, thereby increasing call protection to bondholders. In private-label CMOs, losses on underlying mortgages are directed to the most junior of all classes and then to the classes above in order of increasing seniority, which means that the senior classes have enough credit protection to be given the highest credit rating by the rating agencies.
Obligations of states and political subdivisions (municipal securities) are purchased with consideration of the current tax position of the Bank. In-state (Virginia) municipal bonds will be favored when they present better relative value than comparable out-of-state municipal bonds. Both taxable and tax-exempt municipal bonds may be purchased, but only after careful assessment of the market risk of the security. Appropriate credit evaluation must be performed prior to purchasing municipal bonds.
Southern National’s corporate bonds consist of pooled trust preferred securities issued by banks, thrifts and insurance companies as well as senior subordinated notes issued by banks. The collateral pools of these trust preferred securities must be at least 80% banks or thrifts, if the rating at the time of purchase is A3/A- or better. If the rating is Aaa/AAA, the collateral pool must be at least 60% banks or thrifts. These securities generally have a long term (25 years or more), allow early redemption by the issuers, make periodic variable interest payments and mature at face value. Trust preferred securities allow the deferral of interest payments for up to five years.
56
We classify our investment securities as either held to maturity or available for sale. Debt investment securities that Southern National has the positive intent and ability to hold to maturity are classified as held to maturity and carried at amortized cost. Investment securities classified as available for sale are those debt and equity securities that may be sold in response to changes in interest rates, liquidity needs or other similar factors. Investment securities available for sale are carried at fair value, with unrealized gains or losses net of deferred taxes, included in accumulated other comprehensive income (loss) in stockholders’ equity. Investment securities totaling $98.9$72.5 million were in the held to maturity portfolio at December 31, 2017,2019, compared to $85.3$92.4 million at December 31, 2016.2018. Investment securities totaling $160.7$164.8 million were in the available for sale portfolio at December 31, 2017,2019, compared to $3.9$143.4 million at December 31, 2016. The $156.82018. During 2019, $45.1 million increase in available for sale investment securities was mainly driven by the $162.9and $15.3 million, respectively, of available for sale investment securities acquired in the EVBS acquistion.
As of December 31, 2017,2019, we owned pooled trust preferred investment securities as follows (in thousands):
| | | | | | | | | | | | | | | | | | | | | | | | |
| | | | | | | | | | | | | | | | | | | | | % of | | Previously | |
| | | | | | | | | | | | | | | | | | | | | Current | | Recognized | |
| | | | | | | | | | | | | | | | | | | | | Defaults and | | Cumulative | |
| | | | Ratings | | | | | | | | | | | | Estimated | | Deferrals to | | Other | ||||
| | Tranche | | When Purchased | | Current Ratings | | Par | | Book | | Fair | | Total | | Comprehensive | ||||||||
Security |
| Level |
| Moody's |
| Fitch |
| Moody's |
| Fitch |
| Value |
| Value |
| Value |
| Collateral |
| Loss (1) | ||||
| | | | | | | | | | | | (in thousands) | | | | | | |||||||
Held to Maturity | |
| |
| |
| |
| |
| | |
| | |
| | |
| |
| | |
|
ALESCO VII A1B | | Senior | | Aaa | | AAA | | Aa1 | | AA | | $ | 2,019 | | $ | 1,882 | | $ | 1,982 | | 17 | % | $ | 219 |
MMCF III B | | Senior Sub | | A3 | | A- | | Ba1 | | WD | | | 57 | | | 56 | | | 53 | | 45 | % | | 4 |
| | | | | | | | | |
| | $ | 2,076 | | $ | 1,938 | | $ | 2,035 | |
| | $ | 223 |
| | | | | | | | | | | | | | | | | | | | | | | |
|
| | | |
| |
| |
| |
| | |
| | |
| | |
| |
| | | Cumulative OTTI |
Available for Sale | | | |
| |
| |
| |
| | |
| | |
| | |
| |
| | Related to | |
Other Than Temporarily Impaired: | | | |
| |
| |
| |
| | |
| | |
| | |
| |
| | Credit Loss (2) | |
TPREF FUNDING II | | Mezzanine | | A1 | | A- | | Caa3 | | WD | | $ | 1,500 | | $ | 1,040 | | $ | 795 | | 32 | % | $ | 400 |
ALESCO V C1 | | Mezzanine | | A2 | | A | | Caa1 | | C | | | 2,150 | | | 1,490 | | | 1,773 | | 15 | % | | 660 |
| | | | | | | | | |
| | $ | 3,650 | | $ | 2,530 | | $ | 2,568 | |
| | $ | 1,060 |
| | | | | | | | | | | | | | | | | | | | | | | |
|
Total | | | | | | | |
| | | | $ | 5,726 | | $ | 4,468 | | $ | 4,603 | |
| | |
|
| (1) | Pre-tax, and represents unrealized losses at date of transfer from available for sale to held to maturity, net of accretion |
| (2) | Pre-tax |
| Security | | | Tranche Level | | | Ratings When Purchased | | | Current Ratings | | | Par Value | | | Book Value | | | Estimated Fair Value | | | % of Current Defaults and Deferrals to Total Collateral | | | Previously Recognized Cumulative Other Comprehensive Loss(1) | | |||||||||||||||||||||
| | Moody’s | | | Fitch | | | Moody’s | | | Fitch | | |||||||||||||||||||||||||||||||||||
| Held to Maturity | | | | | | | | | | | | | | | | | | | | | | | | | | | | | | | | | | | | | | | | | | | | | | |
| ALESCO VII A1B | | | Senior | | | Aaa | | | AAA | | | Aa2 | | | A | | | | $ | 3,192 | | | | | $ | 2,948 | | | | | $ | 3,113 | | | | | | 18% | | | | | $ | 226 | | |
| MMCF III B | | | Senior Sub | | | A3 | | | A- | | | Ba1 | | | BBB | | | | | 261 | | | | | | 257 | | | | | | 240 | | | | | | 32% | | | | | | 4 | | |
| | | | | | | | | | | | | | | | | | | | $ | 3,453 | | | | | $ | 3,205 | | | | | $ | 3,353 | | | | | | | | | | | $ | 230 | | |
| Available for Sale Other Than Temporarily Impaired: | | | | | | Cumulative OTTI Related to Credit Loss(2) | | |||||||||||||||||||||||||||||||||||||||
| TPREF FUNDING II | | | Mezzanine | | | A1 | | | A- | | | Caa3 | | | C | | | | $ | 1,500 | | | | | $ | 1,099 | | | | | $ | 915 | | | | | | 29% | | | | | $ | 400 | | |
| ALESCO V C1 | | | Mezzanine | | | A2 | | | A | | | Caa1 | | | C | | | | | 2,150 | | | | | | 1,491 | | | | | | 1,473 | | | | | | 14% | | | | | | 660 | | |
| | | | | | | | | | | | | | | | | | | | $ | 3,650 | | | | | $ | 2,590 | | | | | $ | 2,388 | | | | | | | | | | | $ | 1,060 | | |
| Total | | | | | | | | | | | | | | | | | | | $ | 7,103 | | | | | $ | 5,795 | | | | | $ | 5,741 | | | | | | | | | | | | | | |
| | ||||||||||||||||||||||||||||||||||||||||||||||
Each of these investment securities has been evaluated for other than temporary impairment (“OTTI”). In performing a detailed cash flow analysis of each investment security, Sonabank works with independent third parties to estimate expected cash flows and assist with the evaluation of OTTI. The cash flow analyses performed included the following assumptions:
| ● | 0.5% of the remaining performing collateral will default or defer per annum. |
| ● | Recoveries of 9% with a two-year lag on all defaults and deferrals. |
| ● | No prepayments for 10 years and then 1% per annum for the remaining life of the investment security. |
| ● | Our investment securities have been modeled using the above assumptions by independent third parties using the forward LIBOR curve to discount projected cash flows to present values. |
We recognized no OTTI charges during 2017, 20162019 or 2015, respectively.
Investment securities in our portfolio as of December 31, 20172019 were as follows:
| ● | residential government-sponsored collateralized mortgage obligations in the amount of $39.8 million; |
| ● | agency residential government-sponsored mortgage-backed securities in the amount of $71.9 million; |
| ● | corporate bonds in the amount of $2.0 million; |
| ● | commercial mortgage-backed securities in the amount of $27.7 million; |
| ● | SBA loan pool securities in the amount of $14.4 million; |
57
| ● | callable agency securities in the amount of $44.2 million; |
| ● | trust preferred securities in the amount of $4.5 million, $1.9 million of which is Alesco VII A1B which is rated Aaa (Moody’s); and |
| ● | municipal bonds in the amount of $32.7 million (fair value of $32.8 million) with a taxable equivalent yield of 2.9% and ratings as follows: |
| | | | | | | | |
Moody's | | Amount | | Standard & Poor's | | Amount | ||
Rating |
| (in thousands) |
| Rating |
| (in thousands) | ||
Aaa | | $ | 6,530 |
| AAA | | $ | 6,100 |
Aa1 | |
| 6,611 |
| AA+ | |
| 6,637 |
Aa2 | |
| 3,908 |
| AA | |
| 9,799 |
Aa3 | |
| 696 |
| AA- | |
| 1,816 |
A1 | |
| 2,344 |
| A+ | |
| 1,008 |
A2 | |
| 1,511 |
| A | |
| 840 |
Baa1 | |
| 1,013 |
| BBB+ | |
| 1,013 |
NA | |
| 10,204 |
| NA | |
| 5,604 |
Total | | $ | 32,817 |
| Total | | $ | 32,817 |
| | Moody’s Rating | | | Amount (in thousands) | | | Standard & Poor’s Rating | | | Amount (in thousands) | |
| | Aaa | | | $5,355 | | | AAA | | | $6,518 | |
| | Aa1 | | | 12,559 | | | AA+ | | | 7,279 | |
| | Aa2 | | | 4,496 | | | AA | | | 14,587 | |
| | Aa3 | | | 1,905 | | | AA- | | | 1,809 | |
| | A1 | | | 1,924 | | | A+ | | | 1,065 | |
| | A2 | | | 1,572 | | | A | | | 855 | |
| | Baa1 | | | 1,049 | | | BBB+ | | | 1,049 | |
| | N/A | | | 12,810 | | | N/A | | | 8,508 | |
| | | | | $41,670 | | | | | | $41,670 | |
| | |||||||||||
For additional information regarding investment securities refer to “Item 8. Financial Statements and Supplementary Data, Note 3 — Investment2-Investment Securities.”
The following table sets forth a summary of the investment securities portfolio as of the dates indicated. Available for sale investment securities are reported at fair value, and held to maturity investment securities are reported at amortized cost (in thousands).
| | | | | | | | | |
| | December 31, | |||||||
|
| 2019 |
| 2018 |
| 2017 | |||
Available for sale securities: |
| |
|
| |
|
| |
|
Residential government-sponsored mortgage-backed securities | | $ | 48,979 | | $ | 27,302 | | $ | 30,864 |
Obligations of states and political subdivisions | |
| 17,582 | |
| 18,055 | |
| 18,727 |
Corporate securities | |
| 2,012 | |
| 2,008 | |
| 2,015 |
Trust preferred securities | |
| 2,568 | |
| 2,641 | |
| 2,388 |
Residential government-sponsored collateralized mortgage obligations | |
| 36,689 | |
| 43,057 | |
| 50,766 |
Government-sponsored agency securities | |
| 14,822 | |
| 3,125 | |
| 3,226 |
Agency commercial mortgage-backed securities | |
| 27,731 | |
| 27,304 | |
| 27,898 |
SBA pool securities | |
| 14,437 | |
| 19,885 | |
| 24,789 |
Total | | $ | 164,820 | | $ | 143,377 | | $ | 160,673 |
| | | | | | | | | |
Held to maturity investment securities: | |
|
| |
|
| |
|
|
Residential government-sponsored mortgage-backed securities | | $ | 22,925 | | $ | 9,699 | | $ | 11,500 |
Obligations of states and political subdivisions | |
| 15,071 | |
| 21,496 | |
| 22,830 |
Trust preferred securities | |
| 1,938 | |
| 2,610 | |
| 3,205 |
Residential government-sponsored collateralized mortgage obligations | |
| 3,128 | |
| 6,001 | |
| 8,727 |
Government-sponsored agency securities | |
| 29,386 | |
| 52,656 | |
| 52,650 |
Total | | $ | 72,448 | | $ | 92,462 | | $ | 98,912 |
| | | | December 31, | | |||||||||||||||
| | | | 2017 | | | 2016 | | | 2015 | | |||||||||
| Available for sale invesment securities: | | | | | | | | | | | | | | | | | | | |
| Residential government-sponsored mortgage-backed securities | | | | $ | 30,864 | | | | | $ | — | | | | | $ | — | | |
| Obligations of states and political subdivisions | | | | | 18,727 | | | | | | 2,259 | | | | | | 2,312 | | |
| Corporate securities | | | | | 2,015 | | | | | | — | | | | | | — | | |
| Trust preferred securities | | | | | 2,388 | | | | | | 1,659 | | | | | | 1,897 | | |
| Residential government-sponsored collateralized mortgage obligations | | | | | 50,766 | | | | | | — | | | | | | — | | |
| Government-sponsored agency securities | | | | | 3,226 | | | | | | — | | | | | | — | | |
| Agency commercial mortgage-backed securities | | | | | 27,898 | | | | | | — | | | | | | — | | |
| SBA pool securities | | | | | 24,789 | | | | | | — | | | | | | — | | |
| Total | | | | $ | 160,673 | | | | | $ | 3,918 | | | | | $ | 4,209 | | |
| Held to maturity investment securities: | | | | | | | | | | | | | | | | | | | |
| Residential government-sponsored mortgage-backed securities | | | | $ | 11,500 | | | | | $ | 18,594 | | | | | $ | 20,751 | | |
| Obligations of states and political subdivisions | | | | | 22,830 | | | | | | 12,706 | | | | | | 12,794 | | |
| Trust preferred securities | | | | | 3,205 | | | | | | 3,654 | | | | | | 4,352 | | |
| Residential government-sponsored collateralized mortgage obligations | | | | | 8,727 | | | | | | 2,371 | | | | | | 2,946 | | |
| Government-sponsored agency securities | | | | | 52,650 | | | | | | 47,975 | | | | | | 55,937 | | |
| Total | | | | $ | 98,912 | | | | | $ | 85,300 | | | | | $ | 96,780 | | |
| | |||||||||||||||||||
58
The following table sets forth the amortized cost, fair value, and weighted average yield of our investment securities by contractual maturity at December 31, 2017.2019. Expected maturities may differ from contractual maturities because borrowers may have the right to call or prepay obligations with or without call or prepayment penalties (in thousands).
| | | | | | | | | |
| | Investment Securities Available for Sale |
| ||||||
| | | | |
| | | Weighted |
|
| | Amortized | | | | | Average |
| |
|
| Cost |
| Fair Value |
| Yield |
| ||
Obligations of states and political subdivisions |
| |
|
| |
|
|
| |
Due after one year through five years | | $ | 827 | | $ | 840 |
| 3.14 | % |
Due after five years through ten years | |
| 5,048 | |
| 5,163 |
| 3.06 | % |
Due after ten years | |
| 11,166 | |
| 11,579 |
| 2.71 | % |
| |
| 17,041 | |
| 17,582 |
| 2.83 | % |
Trust preferred securities | |
|
| |
|
|
|
| |
Due after ten years | |
| 2,530 | |
| 2,568 |
| 7.97 | % |
Corporate securities | |
|
| |
| |
|
| |
Due after five years through ten years | |
| 2,004 | |
| 2,012 |
| 6.13 | % |
Government-sponsored agency securities | |
|
| |
|
|
|
| |
Due after one year through five years | |
| 1,500 | |
| 1,518 |
| 2.00 | % |
Due after five years through ten years | | | 5,350 | | | 5,372 | | 3.17 | % |
Due after ten years | |
| 7,973 | |
| 7,932 |
| 2.84 | % |
| |
| 14,823 | |
| 14,822 |
| 2.87 | % |
Residential government-sponsored mortgage-backed securities | |
|
| |
|
|
|
| |
Due after one year through five years | |
| 6,708 | |
| 6,813 |
| 2.45 | % |
Due after five years through ten years | |
| 2,947 | |
| 2,972 |
| 2.27 | % |
Due after ten years | |
| 38,885 | |
| 39,194 |
| 2.42 | % |
| |
| 48,540 | |
| 48,979 |
| 2.42 | % |
Residential government-sponsored collateralized mortgage obligations | |
|
| |
|
|
|
| |
Due after five years through ten years | |
| 8,565 | |
| 8,621 |
| 2.41 | % |
Due after ten years | |
| 27,946 | |
| 28,068 |
| 2.25 | % |
| |
| 36,511 | |
| 36,689 |
| 2.29 | % |
Agency commercial mortgage-backed securities | |
|
| |
|
|
|
| |
Due after one year through five years | |
| 25,542 | |
| 25,671 |
| 2.16 | % |
Due after five years through ten years | |
| 2,015 | |
| 2,060 |
| 2.59 | % |
| |
| 27,557 | |
| 27,731 |
| 2.19 | % |
SBA pool securities | |
|
| |
|
|
|
| |
Due after one year through five years | | | 134 | | | 133 | | 3.99 | % |
Due after five years through ten years | |
| 5,124 | |
| 5,126 |
| 3.31 | % |
Due after ten years | |
| 9,364 | |
| 9,178 |
| 3.84 | % |
| |
| 14,622 | |
| 14,437 |
| 3.65 | % |
| | $ | 163,628 | | $ | 164,820 |
| 2.68 | % |
| | | | | | | | | |
| | Investment Securities Held to Maturity |
| ||||||
| | | | |
| | | Weighted |
|
| | Amortized | | | | | Average |
| |
|
| Cost |
| Fair Value |
| Yield |
| ||
Obligations of states and political subdivisions | |
|
| |
|
|
|
| |
Due after one year through five years | | $ | 2,731 | | $ | 2,804 |
| 2.12 | % |
Due after five years through ten years | |
| 2,241 | |
| 2,289 |
| 2.78 | % |
Due after ten years | |
| 10,099 | |
| 10,142 |
| 3.37 | % |
| |
| 15,071 | |
| 15,235 |
| 3.05 | % |
Trust preferred securities | |
|
| |
|
|
|
| |
Due after ten years | |
| 1,938 | |
| 2,035 |
| 3.32 | % |
Government-sponsored agency securities | |
|
| |
|
|
|
| |
Due after five years through ten years | |
| 10,000 | |
| 9,985 |
| 2.50 | % |
Due after ten years | |
| 19,386 | |
| 19,347 |
| 2.83 | % |
| |
| 29,386 | |
| 29,332 |
| 2.72 | % |
Residential government-sponsored mortgage-backed securities | |
|
| |
|
|
| | |
Due after five years through ten years | |
| 2,129 | |
| 2,137 |
| 2.07 | % |
Due after ten years | |
| 20,796 | |
| 20,798 |
| 2.52 | % |
| |
| 22,925 | |
| 22,935 |
| 2.47 | % |
Residential government-sponsored collateralized mortgage obligations | |
|
| |
|
|
|
| |
Due after five years through ten years | |
| 390 | |
| 390 |
| 2.07 | % |
Due after ten years | |
| 2,738 | |
| 2,739 |
| 2.20 | % |
| |
| 3,128 | |
| 3,129 |
| 2.47 | % |
| | $ | 72,448 | | $ | 72,666 |
| 2.70 | % |
| | | | Investment Securities Available for Sale | | |||||||||||||||
| | | | Amortized Cost | | | Fair Value | | | Weighted Average Yield | | |||||||||
| Obligations of states and political subdivisions | | | | | | | | | | | | | | | | | | | |
| Due after one year through five years | | | | $ | 1,932 | | | | | $ | 1,911 | | | | | | 1.96% | | |
| Due after five years through ten years | | | | | 3,373 | | | | | | 3,409 | | | | | | 2.78% | | |
| Due after ten years | | | | | 13,276 | | | | | | 13,407 | | | | | | 2.75% | | |
| | | | | | 18,581 | | | | | | 18,727 | | | | | | 2.67% | | |
| Trust preferred securities | | | | | | | | | | | | | | | | | | | |
| Due after ten years | | | | | 2,590 | | | | | | 2,388 | | | | | | 6.45% | | |
| Corporate securities | | | | | | | | | | | | | | | | | | | |
| Due after five years through ten years | | | | | 2,013 | | | | | | 2,015 | | | | | | 6.12% | | |
| Government-sponsored agency securities | | | | | | | | | | | | | | | | | | | |
| Due after five years through ten years | | | | | 1,500 | | | | | | 1,501 | | | | | | 2.00% | | |
| Due after ten years | | | | | 1,747 | | | | | | 1,725 | | | | | | 3.26% | | |
| | | | | | 3,247 | | | | | | 3,226 | | | | | | 2.67% | | |
| Residential government-sponsored mortgage-backed securities | | | | | | | | | | | | | | | | | | | |
| Due within a year | | | | | 1 | | | | | | 1 | | | | | | 0.97% | | |
| Due after one year through five years | | | | | 1,964 | | | | | | 1,961 | | | | | | 2.07% | | |
| Due after five years through ten years | | | | | 9,086 | | | | | | 8,984 | | | | | | 2.42% | | |
| Due after ten years | | | | | 20,094 | | | | | | 19,918 | | | | | | 2.20% | | |
| | | | | | 31,145 | | | | | | 30,864 | | | | | | 2.26% | | |
| Residential government-sponsored collateralized mortgage obligations | | | | | | | | | | | | | | | | | | | |
| Due after five years through ten years | | | | | 2,962 | | | | | | 2,922 | | | | | | 2.50% | | |
| Due after ten years | | | | | 48,559 | | | | | | 47,844 | | | | | | 2.32% | | |
| | | | | | 51,521 | | | | | | 50,766 | | | | | | 2.33% | | |
| Agency commerical mortgage-backed securities | | | | | | | | | | | | | | | | | | | |
| Due after one year through five years | | | | | 14,316 | | | | | | 14,134 | | | | | | 2.04% | | |
| Due after five years through ten years | | | | | 13,947 | | | | | | 13,764 | | | | | | 2.35% | | |
| | | | | | 28,263 | | | | | | 27,898 | | | | | | 2.19% | | |
| SBA pool securities | | | | | | | | | | | | | | | | | | | |
| Due after five years through ten years | | | | | 3,118 | | | | | | 3,100 | | | | | | 2.61% | | |
| Due after ten years | | | | | 21,711 | | | | | | 21,689 | | | | | | 3.04% | | |
| | | | | | 24,829 | | | | | | 24,789 | | | | | | 2.98% | | |
| | | | | $ | 162,189 | | | | | $ | 160,673 | | | | | | 2.56% | | |
| | |||||||||||||||||||
59
| | | | Investment Securities Held to Maturity | | |||||||||||||||
| | | | Amortized Cost | | | Fair Value | | | Weighted Average Yield | | |||||||||
| Obligations of states and political subdivisions | | | | | | | | | | | | | | | | | | | |
| Due after one year through five years | | | | $ | 1,895 | | | | | $ | 1,892 | | | | | | 1.87% | | |
| Due after five years through ten years | | | | | 8,044 | | | | | | 8,091 | | | | | | 2.12% | | |
| Due after ten years | | | | | 12,891 | | | | | | 12,960 | | | | | | 3.10% | | |
| | | | | | 22,830 | | | | | | 22,943 | | | | | | 2.65% | | |
| Trust preferred securities | | | | | | | | | | | | | | | | | | | |
| Due after ten years | | | | | 3,205 | | | | | | 3,353 | | | | | | 2.55% | | |
| Government-sponsored agency securities | | | | | | | | | | | | | | | | | | | |
| Due after five years through ten years | | | | | 14,989 | | | | | | 14,525 | | | | | | 2.54% | | |
| Due after ten years | | | | | 37,661 | | | | | | 36,702 | | | | | | 3.03% | | |
| | | | | | 52,650 | | | | | | 51,227 | | | | | | 2.89% | | |
| Residential government-sponsored mortgage-backed securities | | | | | | | | | | | | | | | | | | | |
| Due after five years through ten years | | | | | 3,435 | | | | | | 3,409 | | | | | | 2.06% | | |
| Due after ten years | | | | | 8,065 | | | | | | 8,037 | | | | | | 2.51% | | |
| | | | | | 11,500 | | | | | | 11,446 | | | | | | 2.37% | | |
| Residential government-sponsored collateralized mortgage obligations | | | | | | | | | | | | | | | | | | | |
| Due after ten years | | | | | 8,727 | | | | | | 8,628 | | | | | | 1.88% | | |
| | | | | $ | 98,912 | | | | | $ | 97,597 | | | | | | 2.68% | | |
| | |||||||||||||||||||
Deposits and Other Borrowings
The market for deposits is competitive. We offer a line of traditional deposit products that currently include noninterest-bearing and interest-bearing checking (or NOW accounts), commercial checking, money market accounts, savings accounts and certificates of deposit. We compete for deposits through our banking branches with competitive pricing, advertising and online banking. We use deposits as a principal source of funding for our lending, purchasing of investment securities and for other business purposes.
Total deposits increased 1.3% to $1.87$2.12 billion at December 31, 20172019 from $913.0 million as of$2.09 billion at December 31, 2016. The merger with EVBS on June 23, 2017 contributed $1.15 billion in deposits.2018. Noninterest-bearing demand deposits increased from a year-end 20162018 level of $88.8$320.0 million to $319.2$339.2 million as of December 31, 2017. Savings accounts increased2019. Time deposits decreased from $52.8$925.4 million to $161.9$783.0 million and time deposits increasedsavings accounts decreased from $605.6 million$151.0 to $699.1$144.5 million over the same period. As of December 31, 2017,2019, we had brokered certificates of deposit in the amount of $109.8$114.1 million and brokered money market deposits of $17.0$24.4 million. At December 31, 2016,2018, we had brokered certificates of deposit in the amount of $66.5 million,$254.6, and we had brokered money market deposits of $14.2$16.9 million.
The following table sets forth the average balance and average rate paid on each of the deposit categories for the years ended December 31, 2017, 20162019, 2018 and 2015:
| | | | 2017 | | | 2016 | | | 2015 | | |||||||||||||||||||||||||||
| | | | Average Balance | | | Average Rate | | | Average Balance | | | Average Rate | | | Average Balance | | | Average Rate | | ||||||||||||||||||
| | | | (in thousands) | | |||||||||||||||||||||||||||||||||
| Noninterest-bearing demand deposits | | | | $ | 219,107 | | | | | | | | | | | $ | 88,413 | | | | | | | | | | | $ | 75,129 | | | | | | | | |
| Interest-bearing deposits: | | | | | | | | | | | | | | | | | | | | | | | | | | | | | | | | | | | | | |
| Savings accounts | | | | | 112,868 | | | | | | 0.39% | | | | | | 51,670 | | | | | | 0.64% | | | | | | 44,661 | | | | | | 0.63% | | |
| Money market accounts | | | | | 256,746 | | | | | | 0.62% | | | | | | 127,121 | | | | | | 0.36% | | | | | | 138,559 | | | | | | 0.35% | | |
| NOW and other demand accounts | | | | | 192,789 | | | | | | 0.36% | | | | | | 36,470 | | | | | | 0.16% | | | | | | 24,306 | | | | | | 0.10% | | |
| Time deposits | | | | | 668,566 | | | | | | 1.24% | | | | | | 579,157 | | | | | | 1.25% | | | | | | 509,900 | | | | | | 1.11% | | |
| Total interest-bearing deposits | | | | | 1,230,969 | | | | | | 0.89% | | | | | | 794,418 | | | | | | 1.02% | | | | | | 717,426 | | | | | | 0.90% | | |
| Total deposits | | | | $ | 1,450,076 | | | | | | | | | | | $ | 882,831 | | | | | | | | | | | $ | 792,555 | | | | | | | | |
| | |||||||||||||||||||||||||||||||||||||
| | | | | | | | | | | | | | | | |
| | 2019 | | 2018 | | 2017 |
| |||||||||
|
| Average |
| Average |
| Average |
| Average |
| Average |
| Average |
| |||
| | Balance | | Rate | | Balance | | Rate | | Balance | | Rate |
| |||
| | (in thousands) |
| |||||||||||||
Noninterest-bearing demand deposits | | $ | 332,924 |
|
| | $ | 336,380 |
|
| | $ | 219,107 |
|
| |
Interest-bearing deposits: | |
|
|
|
| |
|
|
|
| |
|
|
|
| |
Savings accounts | |
| 145,855 |
| 0.32 | % |
| 159,865 |
| 0.32 | % |
| 112,868 |
| 0.39 | % |
Money market accounts | |
| 439,097 |
| 1.76 | % |
| 328,142 |
| 0.93 | % |
| 256,746 |
| 0.62 | % |
NOW and other demand accounts | |
| 360,254 |
| 0.83 | % |
| 324,797 |
| 0.46 | % |
| 192,789 |
| 0.36 | % |
Time deposits | |
| 868,420 |
| 2.23 | % |
| 808,718 |
| 1.63 | % |
| 668,566 |
| 1.24 | % |
Total interest-bearing deposits | |
| 1,813,626 |
| 1.69 | % |
| 1,621,521 |
| 1.12 | % |
| 1,230,969 |
| 0.89 | % |
Total deposits | | $ | 2,146,550 |
|
| | $ | 1,957,902 |
|
| | $ | 1,450,076 |
|
| |
The variety of deposit accounts we offer allows us to be competitive in obtaining funds and in responding to the threat of disintermediation (the flow of funds away from depository institutions such as banking institutions into direct investment vehicles such as government and corporate securities). Our ability to attract and maintain deposits, and the effect of such retention on our cost of funds, has been, and will continue to be, significantly affected by the general economy and market rates of interest.
The following table sets forth the maturities of certificates of deposit of $250$100 thousand and over as of December 31, 20172019 (in thousands):
| | Within 3 Months | | | 3 to 6 Months | | | 6 to 12 Months | | | Over 12 Months | | | Total | |
| | $26,041 | | | $23,576 | | | $28,589 | | | $92,807 | | | $171,013 | |
| | | | | | | | | | | | | |
Within |
| 3 to 6 |
| 6 to 12 |
| Over 12 |
|
| | ||||
3 Months | | Months | | Months | | Months | | Total | |||||
$ | 98,038 | | $ | 95,562 | | $ | 135,869 | | $ | 166,467 | | $ | 495,936 |
We use borrowed funds to support our liquidity needs and to temporarily satisfy our funding needs from increased loan demand and for other shorter term purposes. We are a member of the FHLB and are authorized to obtain advances from the FHLB from time to time as needed. The FHLB has a credit program for members with different maturities and interest rates, which may be fixed or variable. We are required to collateralize our borrowings from the FHLB with our FHLB stock and other collateral acceptable to the FHLB. At December 31, 20172019 and 2016,2018, total FHLB borrowings were $335.6$121.6 million and $95.0$163.3 million, respectively. At December 31, 2017,2019, we had $314.2$554.3 million of unused and available FHLB lines of credit.
Other short-term borrowings can consist of FHLB overnight advances, other FHLB advances maturing within one year, federal funds purchased and securities sold under agreements to repurchase (“repo”) that mature within one year, which
60
are secured transactions with customers. During the second quarter of 2016, we discontinued offering repo accounts. However, repoRepo accounts totaling $7.6 million were assumed on June 23, 2017 in the merger with EVBS. During the third quarter of 2017 we determined that we will continue to offerThe balance in repo accounts and the balance at December 31, 20172019 and 2018 was $15.5 million.
Other short-term borrowings consist of the following (in thousands):
| | | | December 31, | | |||||||||||||||
| | | | 2017 | | | 2016 | | | 2015 | | |||||||||
| FHLB overnight advances | | | | $ | 56,860 | | | | | $ | 50,000 | | | | | $ | 49,000 | | |
| Other short-term FHLB advances maturing 6/27/2018 | | | | | 10,000 | | | | | | — | | | | | | — | | |
| Other short-term FHLB advances maturing 6/20/2018 | | | | | 27,200 | | | | | | — | | | | | | — | | |
| Other short-term FHLB advances maturing 6/14/2018 | | | | | 10,000 | | | | | | — | | | | | | — | | |
| Other short-term FHLB advances maturing 6/13/2018 | | | | | 80,640 | | | | | | — | | | | | | — | | |
| Other short-term FHLB advances maturing 6/12/2018 | | | | | 10,000 | | | | | | — | | | | | | — | | |
| Other short-term FHLB advances maturing 3/28/2018 | | | | | 30,000 | | | | | | — | | | | | | — | | |
| Other short-term FHLB advances maturing 3/14/2018 | | | | | 80,640 | | | | | | — | | | | | | — | | |
| Other short-term FHLB advances maturing 3/13/2018 | | | | | 30,275 | | | | | | — | | | | | | — | | |
| Other short-term FHLB advances maturing 3/27/2017 | | | | | — | | | | | | 10,000 | | | | | | — | | |
| Other short-term FHLB advances maturing 5/4/2017 | | | | | — | | | | | | 10,000 | | | | | | — | | |
| Other short-term FHLB advances maturing 6/5/2017 | | | | | — | | | | | | 10,000 | | | | | | — | | |
| Other short-term FHLB advances maturing 6/19/2017 | | | | | — | | | | | | 5,000 | | | | | | — | | |
| Other short-term FHLB advances maturing 12/15/2017 | | | | | — | | | | | | 10,000 | | | | | | — | | |
| Other short-term FHLB advances maturing 11/4/2016 | | | | | — | | | | | | — | | | | | | 10,000 | | |
| Securities sold under agreements to repurchase | | | | | 15,468 | | | | | | — | | | | | | 10,381 | | |
| Total | | | | $ | 351,083 | | | | | $ | 95,000 | | | | | $ | 69,381 | | |
| Weighted average interest rate at year end | | | | | 1.50% | | | | | | 0.86% | | | | | | 0.51% | | |
| For the periods ended December 31, 2017, 2016 and 2015: | | | | | | | | | | | | | | | | | | | |
| Average outstanding balance | | | | $ | 177,983 | | | | | $ | 66,864 | | | | | $ | 34,673 | | |
| Average interest rate during the year | | | | | 1.24% | | | | | | 0.74% | | | | | | 0.76% | | |
| Maximum month-end outstanding balance | | | | $ | 351,083 | | | | | $ | 95,000 | | | | | $ | 69,381 | | |
| | | | | | | | | | |
| | December 31, |
| |||||||
|
| 2019 |
| 2018 |
| 2017 |
| |||
FHLB overnight advances | | $ | 81,000 | | $ | 5,500 | | $ | 56,860 | |
Other short-term FHLB advances maturing 3/10/2020 | | | 40,640 | | | — | | | — | |
Other short-term FHLB advances maturing 6/27/2019 | | | — | | | 40,000 | | | — | |
Other short-term FHLB advances maturing 6/18/2019 | | | — | | | 27,200 | | | — | |
Other short-term FHLB advances maturing 6/12/2019 | | | — | | | 10,000 | | | — | |
Other short-term FHLB advances maturing 6/11/2019 | | | — | | | 80,640 | | | — | |
Other short-term FHLB advances maturing 6/27/2018 | |
| — | |
| — | |
| 10,000 | |
Other short-term FHLB advances maturing 6/20/2018 | |
| — | |
| — | |
| 27,200 | |
Other short-term FHLB advances maturing 6/14/2018 | |
| — | |
| — | |
| 10,000 | |
Other short-term FHLB advances maturing 6/13/2018 | |
| — | |
| — | |
| 80,640 | |
Other short-term FHLB advances maturing 6/12/2018 | |
| — | |
| — | |
| 10,000 | |
Other short-term FHLB advances maturing 3/28/2018 | |
| — | |
| — | |
| 30,000 | |
Other short-term FHLB advances maturing 3/14/2018 | |
| — | |
| — | |
| 80,640 | |
Other short-term FHLB advances maturing 3/13/2018 | |
| — | |
| — | |
| 30,275 | |
Total FHLB advances | | | 121,640 | | | 163,340 | | | 335,615 | |
Securities sold under agreements to repurchase | |
| 12,883 | |
| 18,721 | |
| 15,468 | |
Total | | $ | 134,523 | | $ | 182,061 | | $ | 351,083 | |
| | | | | | | | | | |
Weighted average interest rate at year end | |
| 1.75 | % |
| 2.68 | % |
| 1.50 | % |
| | | | | | | | | | |
For the periods ended December 31, 2019, 2018 and 2017: | |
|
| |
|
| |
|
| |
Average outstanding balance | | $ | 125,340 | | $ | 324,155 | | $ | 177,983 | |
Average interest rate during the year | |
| 2.30 | % |
| 1.91 | % |
| 1.24 | % |
| | | | | | | | | | |
Maximum month-end outstanding balance | | $ | 174,739 | | $ | 411,511 | | $ | 351,083 | |
Junior Subordinated Debt and Senior Subordinated Notes
On January 20, 2017, Southern National completed the sale of $27.0 million of its fixed-to-floating rate Subordinated Notes due 2027 (the “SNBV Senior Subordinated Notes”). The SNBV Senior Subordinated Notes will initially bear interest at 5.875% per annum until January 31, 2022; thereafter, the SNBV Senior Subordinated Notes will be payable at an annual floating rate equal to three-month LIBOR plus a spread of 3.95% until maturity or early redemption. At December 31, 2017,2019, all of the SNBV Senior Subordinated Notes qualified as Tier 2 capital. At December 31, 2017,2019, the remaining unamortized debt issuance costs related to the SNBV Senior Subordinated Notes totaled $854$666 thousand. Southern National injected $22.0 million of the proceeds into the Bank as capital to support its continued growth. The remaining amount of the proceeds are being used for general corporate purposes.
In connection with our merger with EVBS, Southern Nationalthe Company assumed $10.3 million (fair value adjustment of $801 thousand) of trust preferred securities that were issued on September 17, 2003 and placed through the Trust in a pooled underwriting totaling approximately $650 million. The trust issuer has invested the total proceeds from the sale of the trust preferred securities in Floating Rate Junior Subordinated Deferrable Interest Debentures (“Junior Subordinated Debt”) issued by EVBS. The trust preferred securities pay cumulative cash distributions quarterly at a variable rate per annum, reset quarterly, equal to the 3-month LIBOR plus 2.95%. As of December 31, 2017 and 2016,2019, the interest rate was 4.55% and 3.94%, respectively.4.85%. The dividends paid to holders of the trust preferred securities, which are recorded as interest expense, are deductible for income tax purposes. The trust preferred securities have a mandatory redemption date
61
The trust preferred securities may be included in Tier 1 capital for regulatory capital adequacy determination purposes up to 25% of Tier 1 capital after its inclusion. At December 31, 2017,2019, all of the trust preferred securities qualified as Tier 1 capital.
Subject to certain exceptions and limitations, Southern National is permitted to elect from time to time to defer regularly scheduled interest payments on its outstanding Junior Subordinated Debt relating to its trust preferred securities. If Southern National defers interest payments on the Junior Subordinated Debt for more than 20 consecutive quarters, Southern National would be in default under the governing agreements for such notes and the amount due under such agreements would be immediately due and payable.
Also in connection with our merger with EVBS, Southern Nationalthe Company assumed the Senior Subordinated Note Purchase Agreement previously entered into by EVBS on April 22, 2015 with certain institutional accredited investors pursuant to which EVBS sold $20.0 million (fair value adjustment of $1.9 million) in aggregate principal amount of its 6.50% Fixed-to-Floating Rate Subordinated Notes due 2025 (the “EVBS Senior Subordinated Notes”) to the investors at a price equal to 100% of the aggregate principal amount of the EVBS Senior Subordinated Notes. The EVBS Senior Subordinated Notes bear interest at an annual rate of 6.50%, payable semi-annually in arrears on May 1 and November 1 of each year ending on May 1, 2020. From and including May 1, 2020 to, but excluding, the maturity date, the EVBS Senior Subordinated Notes will bear interest at an annual rate, reset quarterly, equal to LIBOR determined on the determination date of the applicable interest period plus 502 basis points, payable quarterly in arrears on February 1, May 1, August 1 and November 1 of each year, beginning on August 1, 2020. Southern National may, at its option, redeem, in whole or in part, the EVBS Senior Subordinated Notes as early as May 1, 2020, and any partial redemption would be made pro rata among all of the holders. At December 31, 20172019 all of the EVBS Senior Subordinated Notes qualified as Tier 2 capital.
Interest Rate Sensitivity and Market Risk
We are engaged primarily in the business of investing funds obtained from deposits and borrowings into interest-earning loans and investments. Consequently, our earnings depend to a significant extent on our net interest income, which is the difference between the interest income on loans and other investments and the interest expense on deposits and borrowings. To the extent that our interest-bearing liabilities do not reprice or mature at the same time as our interest-earning assets, we are subject to interest rate risk and corresponding fluctuations in net interest income. We have employed asset/liability management policies that seek to manage our net interest income, without having to incur unacceptable levels of credit or investment risk.
We use simulation modeling to manage our interest rate risk, and we review quarterly interest sensitivity reports prepared for us by FTN Financial using the Sendero ALM Analysis System.sensitivity. This approach uses a model which generates estimates of the change in our economic value of equity (“EVE”) over a range of interest rate scenarios. EVE is the present value of expected cash flows from assets, liabilities and off-balance sheet contracts using assumptions about estimated loan prepayment rates, reinvestment rates and deposit decay rates.
The following tables are based on an analysis prepared by FTN Financial setting forth an analysis of our interest rate risk as measured by the estimated change in EVE resulting from instantaneous and sustained parallel shifts in the yield curve (plus 400 basis points or minus 200100 basis points, measured in 100 basis point increments) as of December 31, 20172019 and 2016.2018. All changes are within our Asset/Liability Risk Management Policy guidelines except for the change resulting from the 200100 basis point decrease in interest rates at December 31, 2017.2019 and 2018.
| | | | | | | | | | | | | |
| | Sensitivity of Economic Value of Equity |
| ||||||||||
| | As of December 31, 2019 |
| ||||||||||
| | | | | | | | | | Economic Value of |
| ||
| | Economic Value of Equity | | Equity as a % of |
| ||||||||
Change in Interest Rates | | | | | $ Change | | % Change | | Total | | Equity |
| |
in Basis Points (Rate Shock) |
| Amount |
| From Base |
| From Base |
| Assets |
| Book Value |
| ||
| | (dollar amounts in thousands) |
| ||||||||||
Up 400 | | $ | 323,871 | | $ | (45,102) |
| (12.22) | % | 11.90 | % | 85.85 | % |
Up 300 | |
| 336,822 | |
| (32,151) |
| (8.71) | % | 12.37 | % | 89.29 | % |
Up 200 | |
| 349,192 | |
| (19,781) |
| (5.36) | % | 12.83 | % | 92.56 | % |
Up 100 | |
| 363,935 | |
| (5,038) |
| (1.37) | % | 13.37 | % | 96.47 | % |
Base | |
| 368,973 | |
| — |
| — | % | 13.55 | % | 97.81 | % |
Down 100 | |
| 353,371 | |
| (15,602) |
| (4.23) | % | 12.98 | % | 93.67 | % |
| | | | Sensitivity of Economic Value of Equity As of December 31, 2017 | | |||||||||||||||||||||||||||
| Change in Interest Rates in Basis Points (Rate Shock) | | | Economic Value of Equity | | | Economic Value of Equity as a % of | | ||||||||||||||||||||||||
| | Amount | | | $ Change From Base | | | % Change From Base | | | Total Assets | | | Equity Book Value | | |||||||||||||||||
| | | | (dollar amounts in thousands) | | |||||||||||||||||||||||||||
| Up 400 | | | | $ | 509,991 | | | | | $ | 48,765 | | | | | | 10.57% | | | | | | 19.51% | | | | | | 158.00% | | |
| Up 300 | | | | | 505,504 | | | | | | 44,278 | | | | | | 9.60% | | | | | | 19.34% | | | | | | 156.61% | | |
| Up 200 | | | | | 497,373 | | | | | | 36,147 | | | | | | 7.84% | | | | | | 19.03% | | | | | | 154.09% | | |
| Up 100 | | | | | 485,450 | | | | | | 24,224 | | | | | | 5.25% | | | | | | 18.57% | | | | | | 150.40% | | |
| Base | | | | | 461,226 | | | | | | — | | | | | | 0.00% | | | | | | 17.64% | | | | | | 142.90% | | |
| Down 100 | | | | | 399,221 | | | | | | (62,005) | | | | | | -13.44% | | | | | | 15.27% | | | | | | 123.69% | | |
| Down 200 | | | | | 324,959 | | | | | | (136,267) | | | | | | -29.54% | | | | | | 12.43% | | | | | | 100.68% | | |
| | | | | | | | | | | | | | | | | | | | | | | | | | | | | | | | |
| | | | Sensitivity of Economic Value of Equity As of December 31, 2016 | | |||||||||||||||||||||||||||
| Change in Interest Rates in Basis Points (Rate Shock) | | | Economic Value of Equity | | | Economic Value of Equity as a % of | | ||||||||||||||||||||||||
| | Amount | | | $ Change From Base | | | % Change From Base | | | Total Assets | | | Equity Book Value | | |||||||||||||||||
| | | | (dollar amounts in thousands) | | |||||||||||||||||||||||||||
| Up 400 | | | | $ | 116,120 | | | | | $ | (37,494) | | | | | | 24.41% | | | | | | 10.16% | | | | | | 91.91% | | |
| Up 300 | | | | | 123,778 | | | | | | (29,836) | | | | | | -19.42% | | | | | | 10.83% | | | | | | 97.97% | | |
| Up 200 | | | | | 132,243 | | | | | | (21,371) | | | | | | -13.91% | | | | | | 11.58% | | | | | | 104.67% | | |
| Up 100 | | | | | 141,858 | | | | | | (11,756) | | | | | | -7.65% | | | | | | 12.42% | | | | | | 112.28% | | |
| Base | | | | | 153,614 | | | | | | — | | | | | | 0.00% | | | | | | 13.45% | | | | | | 121.58% | | |
| Down 100 | | | | | 136,456 | | | | | | (17,158) | | | | | | -11.17% | | | | | | 11.94% | | | | | | 108.00% | | |
| Down 200 | | | | | 129,485 | | | | | | (24,129) | | | | | | -15.71% | | | | | | 11.33% | | | | | | 102.49% | | |
62
| | | | | | | | | | | | | |
| | Sensitivity of Economic Value of Equity |
| ||||||||||
| | As of December 31, 2018 |
| ||||||||||
| | | | | | | | | | Economic Value of |
| ||
| | Economic Value of Equity | | Equity as a % of |
| ||||||||
Change in Interest Rates | | | | | $ Change | | % Change | | Total | | Equity |
| |
in Basis Points (Rate Shock) |
| Amount |
| From Base |
| From Base |
| Assets |
| Book Value |
| ||
| | (dollar amounts in thousands) |
| ||||||||||
Up 400 | | $ | 338,853 | | $ | (33,298) |
| (8.95) | % | 12.54 | % | 97.03 | % |
Up 300 | |
| 347,409 | |
| (24,742) |
| (6.65) | % | 12.85 | % | 99.48 | % |
Up 200 | |
| 356,429 | |
| (15,722) |
| (4.22) | % | 13.19 | % | 102.07 | % |
Up 100 | |
| 362,312 | |
| (9,839) |
| (2.64) | % | 13.40 | % | 103.75 | % |
Base | |
| 372,151 | |
| — |
| 0.00 | % | 13.77 | % | 106.57 | % |
Down 100 | |
| 341,397 | |
| (30,754) |
| (8.26) | % | 12.63 | % | 97.76 | % |
Our interest rate sensitivity is also monitored by management through the use of a model run by FTN Financial that generates estimates of the change in the net interest income (“NII”) over a range of interest rate scenarios. NII depends upon the relative amounts of interest-earning assets and interest-bearing liabilities and the interest rates earned or paid on them. In this regard, the model assumes that the composition of our interest sensitive assets and liabilities existing at December 31, 20172019 and 20162018 remains constant over the period being measured and also assumes that a particular change in interest rates is reflected uniformly across the yield curve regardless of the duration to maturity or repricing of specific assets and liabilities. All changes are within our ALM Policy guidelines.
| | | | Sensitivity of Net Interest Income As of December 31, 2017 | | |||||||||||||||||||||
| Change in Interest Rates in Basis Points (Rate Shock) | | | Adjusted Net Interest Income | | | Net Interest Margin | | ||||||||||||||||||
| | Amount | | | $ Change From Base | | | Percent | | | % Change From Base | | ||||||||||||||
| | | | (dollar amounts in thousands) | | |||||||||||||||||||||
| Up 400 | | | | $ | 97,308 | | | | | $ | 10,749 | | | | | | 4.06% | | | | | | 0.41% | | |
| Up 300 | | | | | 94,909 | | | | | | 8,350 | | | | | | 3.97% | | | | | | 0.32% | | |
| Up 200 | | | | | 92,404 | | | | | | 5,845 | | | | | | 3.87% | | | | | | 0.22% | | |
| Up 100 | | | | | 89,684 | | | | | | 3,125 | | | | | | 3.77% | | | | | | 0.12% | | |
| Base | | | | | 86,559 | | | | | | — | | | | | | 3.65% | | | | | | 0.00% | | |
| Down 100 | | | | | 86,688 | | | | | | 129 | | | | | | 3.65% | | | | | | 0.00% | | |
| Down 200 | | | | | 86,868 | | | | | | 309 | | | | | | 3.66% | | | | | | 0.01% | | |
| | | | Sensitivity of Net Interest Income As of December 31, 2016 | | |||||||||||||||||||||
| Change in Interest Rates in Basis Points (Rate Shock) | | | Adjusted Net Interest Income | | | Net Interest Margin | | ||||||||||||||||||
| | Amount | | | $ Change From Base | | | Percent | | | % Change From Base | | ||||||||||||||
| | | | (dollar amounts in thousands) | | |||||||||||||||||||||
| Up 400 | | | | $ | 41,484 | | | | | $ | 3,759 | | | | | | 3.87% | | | | | | 0.43% | | |
| Up 300 | | | | | 41,172 | | | | | | 3,447 | | | | | | 3.75% | | | | | | 0.31% | | |
| Up 200 | | | | | 39,898 | | | | | | 2,173 | | | | | | 3.64% | | | | | | 0.20% | | |
| Up 100 | | | | | 38,688 | | | | | | 963 | | | | | | 3.53% | | | | | | 0.09% | | |
| Base | | | | | 37,725 | | | | | | — | | | | | | 3.44% | | | | | | 0.00% | | |
| Down 100 | | | | | 37,961 | | | | | | 236 | | | | | | 3.46% | | | | | | 0.02% | | |
| Down 200 | | | | | 37,473 | | | | | | (252) | | | | | | 3.42% | | | | | | -0.02% | | |
| | | | | | | | | | | |
| | Sensitivity of Net Interest Income |
| ||||||||
| | As of December 31, 2019 |
| ||||||||
| | Adjusted Net Interest Income | | Net Interest Margin |
| ||||||
Change in Interest Rates | | | | | $ Change | | | | % Change | | |
in Basis Points (Rate Shock) |
| Amount |
| From Base |
| Percent |
| From Base |
| ||
| | (dollar amounts in thousands) |
| ||||||||
Up 400 | | $ | 74,096 | | $ | (8,158) |
| 3.00 | % | (0.33) | % |
Up 300 | |
| 76,355 | |
| (5,899) |
| 3.09 | % | (0.24) | % |
Up 200 | |
| 78,458 | |
| (3,796) |
| 3.18 | % | (0.15) | % |
Up 100 | |
| 80,649 | |
| (1,605) |
| 3.27 | % | (0.07) | % |
Base | |
| 82,254 | |
| — |
| 3.33 | % | — | % |
Down 100 | |
| 81,273 | |
| (981) |
| 3.29 | % | (0.04) | % |
| | | | | | | | | | | |
| | Sensitivity of Net Interest Income |
| ||||||||
| | As of December 31, 2018 |
| ||||||||
| | Adjusted Net Interest Income | | Net Interest Margin |
| ||||||
Change in Interest Rates | | | | | $ Change | |
| | % Change |
| |
in Basis Points (Rate Shock) |
| Amount |
| From Base |
| Percent |
| From Base |
| ||
| | (dollar amounts in thousands) |
| ||||||||
Up 400 | | $ | 101,121 | | $ | 9,785 |
| 4.05 | % | 0.35 | % |
Up 300 | |
| 97,784 | |
| 6,448 |
| 3.97 | % | 0.23 | % |
Up 200 | |
| 96,305 | |
| 4,969 |
| 3.88 | % | 0.16 | % |
Up 100 | |
| 93,719 | |
| 2,383 |
| 3.78 | % | 0.07 | % |
Base | |
| 91,336 | |
| — |
| 3.70 | % | — | % |
Down 100 | |
| 91,719 | |
| 383 |
| 3.72 | % | 0.04 | % |
Certain shortcomings are inherent in the methodology used in the above interest rate risk measurements. Modeling changes in EVE requires the making of certain assumptions that may or may not reflect the manner in which actual yields and costs respond to changes in market interest rates. Accordingly, although the EVE tables and NII tables provide an indication of our interest rate risk exposure at a particular point in time, such measurements are not intended to, and do not, provide a precise forecast of the effect of changes in market interest rates on our net worth and NII. Sensitivity of EVE and NII are modeled using different assumptions and approaches. In the low interest rate environment that currently exists, limitations on downward adjustments for interest rates, particularly as they apply to deposits, can and do result in anomalies in scenarios that are unlikely to occur due to the current low interest rate environment.
Liquidity and Funds Management
The objective of our liquidity management is to assure the ability to meet our financial obligations. These obligations include the payment of deposits on demand or at maturity, the repayment of borrowings at maturity and the ability to
63
fund commitments and other new business opportunities. We obtain funding from a variety of sources, including customer deposit accounts, customer certificates of deposit and payments on our loans and investments. Historically, our level of core deposits has been insufficient to fully fund our lending activities. As a result, we have sought funding from additional sources, including institutional certificates of deposit and the sale of available for sale investment securities. In addition, we maintain lines of credit with the FHLB of Atlanta, federal funds lines of credit with three correspondent banks and utilize securities sold under agreements to repurchase and reverse repurchase agreement borrowings from approved securities dealers. For additional information about borrowings and anticipated principal repayments refer to the discussion about Contractual Obligations below and “Item 8. Financial Statements and Supplementary Data, Note 10 —– Securities Sold Under Agreements To Repurchase And Other Short-Term Borrowings and Note 11 —– Junior Subordinated Debt and Senior Subordinated Notes.”
We prepare a cash flow forecast for one year with the first three months prepared on a weekly30, 60 and 90 day basis along with a one and on a monthly basis thereafter.two year basis. The projections incorporate expected cash flows on loans, investment securities, and deposits based on data used to prepare our interest rate risk analyses. To estimate loan growth, over the one year period, the projection incorporates the scheduled loan closings in the Loan Pipeline Report along with other management estimates.
We recently purchasedhave liquidity risk software with which we can monitor our liquidity risk at a point in time and prepare cash flow and funds availability projections over a two year period. The projections can be run using a base case and several stress levels.
During the year ended December 31, 2017,2019, we funded our financial obligations with deposits and borrowings from the FHLB of Atlanta, and the issuance of the SNBV Senior Subordinated Notes in January 2017.Atlanta. At December 31, 2017,2019, we had $361.7$324.8 million of unfunded lines of credit and undisbursed construction loan funds. The amount of certificate of deposit accounts maturing in 20182020 is $402.2$554.2 million as of December 31, 2017.2019. Management anticipates that funding requirements for these commitments can be met from the normal sources of funds.
As of December 31, 2017,2019, Southern National was not aware of any other known trends, events or uncertainties that have or are reasonably likely to have a material impact on our liquidity. As of December 31, 2017,2019, Southern National has no material commitments or long-term debt for capital expenditures.
Capital Resources
Capital management consists of providing equity to support both current and future operations. We and the Bank are subject to risk-based capital adequacy requirements imposed by the FRB and the Bank is subject to capital adequacy requirements imposed by the FDIC. The FRB and the FDIC have adopted risk-based capital requirements for assessing bank holding company and member bank capital adequacy. These standards define capital and establish minimum capital requirements in relation to assets and off-balance sheet exposure, adjusted for credit risk. The risk-based capital standards currently in effect are designed to make regulatory capital requirements more sensitive to differences in risk profiles among bank holding companies and banks, to account for off-balance sheet exposure and to minimize disincentives for holding liquid assets. Assets and off-balance sheet items are assigned to broad risk categories, each with appropriate relative risk weights. The resulting capital ratios represent capital as a percentage of total risk-weighted assets and off-balance sheet items.
See “Item 1. Business, Supervision and Regulation — Regulation—Capital Adequacy Requirements.”
The following table provides a comparison of our leverage and risk-weighted capital ratios and the leverage and risk-weighted capital ratios of Southern National and the BankSonabank at the periods indicated to the minimum and well-capitalized required regulatory standards:
| | | | Minimum Required for Capital Adequacy Purposes(1) | | | To Be Categorized as Well Capitalized(2) | | | Actual Ratio at December 31, | | |||
| | 2017 | | | 2016 | | ||||||||
| Southern National | | | | | | | | | | | | | |
| Common equity tier 1 capital ratio | | | 4.50% | | | n/a | | | 10.53% | | | 12.69% | |
| Tier 1 risk-based capital ratio | | | 6.00% | | | n/a | | | 10.98% | | | 12.69% | |
| Total risk-based capital ratio | | | 8.00% | | | n/a | | | 13.80% | | | 13.63% | |
| Leverage ratio | | | 4.00% | | | n/a | | | 8.82% | | | 10.56% | |
| Sonabank | | | | | | | | | | | | | |
| Common equity tier 1 capital ratio | | | 4.50% | | | 6.50% | | | 12.79% | | | 12.55% | |
| Tier 1 risk-based capital ratio | | | 6.00% | | | 8.00% | | | 12.79% | | | 12.55% | |
| Total risk-based capital ratio | | | 8.00% | | | 10.00% | | | 13.26% | | | 13.49% | |
| Leverage ratio | | | 4.00% | | | 5.00% | | | 10.26% | | | 10.45% | |
| | | | | | | | | |
| | Minimum | | | | | | |
|
| | Required for | | | | | | |
|
| | Capital | | | | Actual Ratio at |
| ||
| | Adequacy | | To Be Categorized | | December 31, |
| ||
|
| Purposes (1) |
| as Well Capitalized (2) |
| 2019 |
| 2018 |
|
Sonabank |
| |
| | | |
| | |
Common equity tier 1 capital ratio |
| 4.50 | % | 6.50 | % | 14.81 | % | 13.64 | % |
Tier 1 risk-based capital ratio |
| 6.00 | % | 8.00 | % | 14.81 | % | 13.64 | % |
Total risk-based capital ratio |
| 8.00 | % | 10.00 | % | 15.29 | % | 14.22 | % |
Leverage ratio |
| 4.00 | % | 5.00 | % | 12.07 | % | 11.03 | % |
| (1) | Once fully phased-in on January 1, 2019, the Basel III capital rules included a capital conservation buffer of 2.5% that is added on top of each of the minimum risk-based capital ratios noted above. Implementation began on January 1, 2016 at the 0.625% level and increased each subsequent January 1, until it reached 2.5% on January 1, 2019. |
64
| (2) | Prompt corrective action provisions are not applicable at the bank holding company level. |
Impact of Inflation and Changing Prices
The financial statements and related financial data presented in this Annual Report on Form 10-K concerning Southern National have been prepared in accordance with U.S. GAAP, which require the measurement of financial position and operating results in terms of historical dollars, without considering changes in the relative purchasing power of money over time due to inflation. The primary impact of inflation on our operations is reflected in increased operating costs. Unlike most industrial companies, substantially all of the assets and liabilities of a financial institution are monetary in nature. As a result, changes in interest rates have a more significant impact on our performance than do the effects of changes in the general rate of inflation and changes in prices. Interest rates do not necessarily move in the same direction or in the same magnitude as the prices of goods and services. Many factors impact interest rates, including the FRB, inflation, recession, changes in unemployment, the money supply, and international disorder and instability in domestic and foreign financial markets. Like most financial institutions, changes in interest rates can impact our net interest income which is the difference between interest earned from interest-earning assets, such as loans and investment securities, and interest paid on interest-bearing liabilities, such as deposits and borrowings, as well as the valuation of our assets and liabilities.
Our interest rate risk management is the responsibility of the Bank’s Asset/Liability Management Committee (the “Asset/Liability Committee”). The Asset/Liability Committee has established policies and limits for management to monitor, measure and coordinate our sources, uses and pricing of funds. The Asset/Liability Committee makes reports to the board of directors on a quarterly basis.
Seasonality and Cycles
We do not consider our commercial banking business to be seasonal.
Contractual Obligations
The following table reflects the contractual maturities of our term liabilities as of December 31, 2017.2019. The amounts shown do not reflect contractual interest, early withdrawal or prepayment assumptions.
| | | | Contractual Obligations | | |||||||||||||||||||||||||||
| | | | Less Than One Year | | | One to Three Years | | | Three to Five Years | | | More Than Five Years | | | Total | | |||||||||||||||
| | | | (in thousands) | | |||||||||||||||||||||||||||
Certificates of deposit(1) | | | | $ | 402,078 | | | | | $ | 239,833 | | | | | $ | 57,147 | | | | | $ | — | | | | | $ | 699,058 | | |
| Repurchase agreements | | | | | 15,468 | | | | | | — | | | | | | — | | | | | | — | | | | | | 15,468 | | |
| FHLB advances-short term | | | | | 335,615 | | | | | | — | | | | | | — | | | | | | — | | | | | | 335,615 | | |
| Junior subordinated debt | | | | | — | | | | | | — | | | | | | — | | | | | | 10,310 | | | | | | 10,310 | | |
| Senior subordinated notes | | | | | — | | | | | | — | | | | | | — | | | | | | 47,000 | | | | | | 47,000 | | |
| Operating leases | | | | | 2,554 | | | | | | 3,975 | | | | | | 2,176 | | | | | | 3,141 | | | | | | 11,846 | | |
| Total | | | | $ | 755,715 | | | | | $ | 243,808 | | | | | $ | 59,323 | | | | | $ | 60,451 | | | | | $ | 1,119,297 | | |
| | |||||||||||||||||||||||||||||||
| | | | | | | | | | | | | | | |
| | Contractual Obligations | |||||||||||||
| | Less Than | | One to | | Three to | | More Than | | | | ||||
|
| One Year |
| Three Years |
| Five Years |
| Five Years |
| Total | |||||
| | (in thousands) | |||||||||||||
Certificates of deposit (1) | | $ | 554,168 | | $ | 208,186 | | $ | 20,686 | | $ | — | | $ | 783,040 |
Repurchase agreements | |
| 12,883 | |
| — | |
| — | |
| — | |
| 12,883 |
FHLB advances-short term | |
| 121,640 | |
| — | |
| — | |
| — | |
| 121,640 |
Junior subordinated debt | |
| — | |
| — | |
| — | |
| 10,310 | |
| 10,310 |
Senior subordinated notes | |
| — | |
| — | |
| — | |
| 47,000 | |
| 47,000 |
Operating leases | |
| 2,386 | |
| 3,139 | |
| 2,067 | |
| 1,654 | |
| 9,246 |
Total | | $ | 691,077 | | $ | 211,325 | | $ | 22,753 | | $ | 58,964 | | $ | 984,119 |
| (1) | Certificates of deposit give customers rights to early withdrawal. Early withdrawals may be subject to penalties. The penalty amount depends on the remaining time to maturity at the time of early withdrawal. |
Off-Balance Sheet Arrangements
Southern National is a party to financial instruments with off-balance sheet risk in the normal course of business to meet the financing needs of its customers. These financial instruments include commitments to extend credit, standby letters of credit and guarantees of credit card accounts sold by EVBS premerger. These instruments involve elements of credit and funding risk in excess of the amount recognized in the consolidated balance sheet. Letters of credit are written conditional commitments issued by Southern National to guarantee the performance of a customer to a third party. The
65
credit risk involved in issuing letters of credit is essentially the same as that involved in extending loans to customers. We had letters of credit outstanding totaling $15.2$17.7 million and $6.4$19.2 million as of December 31, 20172019 and 2016,2018, respectively.
Our exposure to credit loss in the event of nonperformance by the other party to the financial instruments for commitments to extend credit and letters of credit is based on the contractual amount of these instruments. We use the same credit policies in making commitments and conditional obligations as we do for on-balance sheet instruments. Unless noted otherwise, we do not require collateral or other security to support financial instruments with credit risk.
Commitments to extend credit are agreements to lend to a customer as long as there is no violation of any condition established in the contract. Commitments are made predominately for adjustable rate loans, and generally have fixed expiration dates of up to three months or other termination clauses and usually require payment of a fee. Since many of the commitments may expire without being completely drawn upon, the total commitment amounts do not necessarily represent future cash requirements. We evaluate each customer’s creditworthiness on a case-by-case basis.
At December 31, 20172019 and 2016,2018, we had unfunded lines of credit and undisbursed construction loan funds totaling $361.7$324.8 million and $135.8$339.2 million, respectively. Virtually all of our unfunded lines of credit and undisbursed construction loan funds are variable rate.
Premerger, EVBS sold its credit card portfolio. With that sale, EVBS guaranteed the credit card accounts of certain customers to the bank that issues the cards. In connection with the merger with EVBS, Southern National now is the guarantor. The fair value of guarantees of credit card accounts previously sold is based on the estimated cost to settle the obligations with the counterparty and are not considered significant as of December 31, 2017.
This information is incorporated herein by reference from “Item 7. Management’s Discussion and Analysis of Financial Condition and Results of Operations” of this Annual Report on Form 10-K.
Item 8.
66


REPORT OF INDEPENDENT REGISTERED PUBLIC ACCOUNTING FIRM
To the Stockholders and Board of Directors of
Southern National Bancorp of Virginia, Inc.
Opinion on the Consolidated Financial Statements
We have audited the accompanying consolidated balance sheets of Southern National Bancorp of Virginia, Inc. and Subsidiaries (the “Company”"Company") as of December 31, 20172019 and 2016,2018, the related consolidated statements of income and comprehensive income, changes in stockholders’ equity, and cash flows, for each of the three years in the period ended December 31, 2017,2019, and the related notes (collectively referred to as the “financial statements”"financial statements"). In our opinion, the financial statements present fairly, in all material respects, the financial position of the Company at December 31, 20172019 and 2016,2018, and the results of theirits operations and theirits cash flows for each of the three years in the period ended December 31, 2017,2019, in conformity with U.S. generally accepted accounting principles.
We also have audited, in accordance with the standards of the Public Company Accounting Oversight Board (United States) (“PCAOB”("PCAOB"), the Company’sCompany's internal control over financial reporting as of December 31, 2017,2019, based on criteria established in Internal Control —– Integrated Framework (2013) issued by the Committee of Sponsoring Organizations of the Treadway Commission and our report dated March 16, 2018,2020 expressed an unqualified opinion thereon.
Basis for Opinion
These financial statements are the responsibility of the Company’sCompany's management. Our responsibility is to express an opinion on the Company’sCompany's financial statements based on our audits. We are a public accounting firm registered with the PCAOB and are required to be independent with respect to the Company in accordance with the U.S. federal securities laws and the applicable rules and regulations of the Securities and Exchange Commission and the PCAOB.
We conducted our audits in accordance with the standards of the PCAOB. Those standards require that we plan and perform the audit to obtain reasonable assurance about whether the financial statements are free of material misstatement, whether due to error or fraud.
Our audits included performing procedures to assess the risks of material misstatement of the financial statements, whether due to error or fraud, and performing procedures that respond to those risks. Such procedures included examining, on a test basis, evidence regarding the amounts and disclosures in the financial statements. Our audits also included evaluating the accounting principles used and significant estimates made by management, as well as evaluating the overall presentation of the financial statements. We believe that our audits provide a reasonable basis for our opinion.
/s/ Dixon Hughes Goodman LLP
We have served as the Company’sCompany's auditor since 2013.
Greenville, North Carolina
March 16, 20182020
67

Report of Independent Registered Public Accounting Firm
To the Stockholders and Board of Directors of
Southern National Bancorp of Virginia, Inc.
Opinion on Internal Control Over Financial Reporting
We have audited Southern National Bancorp of Virginia, Inc. and Subsidiaries’s (the “Company”) internal control overfinancial reporting as of December 31, 2017,2019, based on criteria established inInternal Control — Control—Integrated Framework (2013)issued by the Committee of Sponsoring Organizations of the Treadway Commission. In our opinion, Southern National Bancorp of Virginia, Inc. and Subsidiaries (the "Company”) maintained, in all material respects, effective internal control over financial reporting as of December 31, 20172019 based on criteria established in Internal Control — Control—Integrated Framework (2013)issued by the Committee of Sponsoring Organizations of the Treadway Commission.
We also have audited, in accordance with the standards of the Public Company Accounting Oversight Board (United States) (“PCAOB”), the consolidated financial statements of the Company as of December 31, 20172019 and 20162018 and for each of the three years in the period ended December 31, 2017,2019, and our report dated March 16, 2018,2020 expressed an unqualified opinion on those consolidated financial statements.
Basis for Opinion
The Company’sCompany's management is responsible for maintaining effective internal control over financial reporting, and for its assessment of the effectiveness of internal control over financial reporting, included in the accompanying Management’s Report on Internal Control Over Financial Reporting. Our responsibility is to express an opinion on the Company’sCompany's internal control over financial reporting based on our audit. We are a public accounting firm registered with the PCAOB and are required to be independent with respect to the Company in accordance with the U.S. federal securities laws and the applicable rules and regulations of the Securities and Exchange Commission and the PCAOB.
We conducted our audit in accordance with the standards of the PCAOB. Those standards require that we plan and perform the audit to obtain reasonable assurance about whether effective internal control over financial reporting was maintained in all material respects. Our audit included obtaining an understanding of internal control over financial reporting, assessing the risk that a material weakness exists, testing and evaluating the design and operating effectiveness of internal control based on the assessed risk, and performing such other procedures as we considered necessary in the circumstances. We believe that our audit provides a reasonable basis for our opinion.
Definition and Limitations of Internal Control Over Financial Reporting
A company’scompany's internal control over financial reporting is a process designed to provide reasonable assurance regarding the reliability of financial reporting and the preparation of financial statements for external purposes in accordance with generally accepted accounting principles. A company’scompany's internal control over financial reporting includes those policies and procedures that (1) pertain to the maintenance of records that, in reasonable detail, accurately and fairly reflect the transactions and dispositions of the assets of the company; (2) provide reasonable assurance that transactions are recorded as necessary to
68
Because of its inherent limitations, internal control over financial reporting may not prevent or detect misstatements. Also, projections of any evaluation of effectiveness to future periods are subject to the risk that controls may become inadequate because of changes in conditions, or that the degree of compliance with the policies or procedures may deteriorate.
/s/ Dixon Hughes Goodman LLP
69
SOUTHERN NATIONAL BANCORP OF VIRGINIA, INC.
CONSOLIDATED BALANCE SHEETS
(dollars in thousands, except per share amounts)
| | | | December 31, 2017 | | | December 31, 2016 | | ||||||
| ASSETS | | | | | | | | | | | | | |
| Cash and cash equivalents: | | | | | | | | | | | | | |
| Cash and due from financial institutions | | | | $ | 7,937 | | | | | $ | 4,656 | | |
| Interest-bearing deposits in other financial institutions | | | | | 15,815 | | | | | | 42,736 | | |
| Federal funds sold | | | | | 1,711 | | | | | | — | | |
| Total cash and cash equivalents | | | | | 25,463 | | | | | | 47,392 | | |
| Securities available for sale, at fair value | | | | | 160,673 | | | | | | 3,918 | | |
| Securities held to maturity, at amortized cost (fair value of $97,597 and $83,344, respectively) | | | | | 98,912 | | | | | | 85,300 | | |
| Loans | | | | | 2,062,328 | | | | | | 930,415 | | |
| Less allowance for loan losses | | | | | (9,397) | | | | | | (8,610) | | |
| Net loans | | | | | 2,052,931 | | | | | | 921,805 | | |
| Stock in Federal Reserve Bank and Federal Home Loan Bank | | | | | 26,775 | | | | | | 7,929 | | |
| Equity investment in mortgage affiliate | | | | | 4,723 | | | | | | 4,629 | | |
| Preferred investment in mortgage affiliate | | | | | 3,305 | | | | | | 2,555 | | |
| Bank premises and equipment, net | | | | | 35,788 | | | | | | 8,227 | | |
| Goodwill | | | | | 100,606 | | | | | | 10,514 | | |
| Core deposit intangibles, net | | | | | 10,054 | | | | | | 874 | | |
| FDIC indemnification asset | | | | | 1,353 | | | | | | 2,111 | | |
| Bank-owned life insurance | | | | | 50,790 | | | | | | 23,826 | | |
| Other real estate owned | | | | | 7,577 | | | | | | 8,617 | | |
| Deferred tax assets, net | | | | | 16,903 | | | | | | 6,780 | | |
| Other assets | | | | | 18,399 | | | | | | 7,966 | | |
| Total assets | | | | $ | 2,614,252 | | | | | $ | 1,142,443 | | |
| LIABILITIES AND STOCKHOLDERS’ EQUITY | | | | | | | | | | | | | |
| Noninterest-bearing demand deposits | | | | $ | 319,189 | | | | | $ | 88,783 | | |
| Interest-bearing deposits: | | | | | | | | | | | | | |
| NOW accounts | | | | | 329,878 | | | | | | 26,338 | | |
| Cash management accounts | | | | | — | | | | | | 9,658 | | |
| Money market accounts | | | | | 355,084 | | | | | | 129,835 | | |
| Savings accounts | | | | | 161,947 | | | | | | 52,755 | | |
| Time deposits | | | | | 699,058 | | | | | | 605,613 | | |
| Total interest-bearing deposits | | | | | 1,545,967 | | | | | | 824,199 | | |
| Total deposits | | | | | 1,865,156 | | | | | | 912,982 | | |
| Securities sold under agreements to repurchase-short term | | | | | 15,468 | | | | | | — | | |
| Federal Home Loan Bank (FHLB) advances-short term | | | | | 335,615 | | | | | | 95,000 | | |
| Junior subordinated debt-long term | | | | | 9,534 | | | | | | — | | |
| Senior subordinated notes-long term | | | | | 47,128 | | | | | | — | | |
| Other liabilities | | | | | 18,579 | | | | | | 8,117 | | |
| Total liabilities | | | | | 2,291,480 | | | | | | 1,016,099 | | |
| Commitments and contingencies (See Note 15) | | | | | — | | | | | | — | | |
| Stockholders’ equity: | | | | | | | | | | | | | |
| Preferred stock, $0.01 par value. Authorized 5,000,000 shares; no shares issued and outstanding | | | | | — | | | | | | — | | |
| Common stock, $0.01 par value. Authorized 45,000,000 shares; issued and outstanding, 23,936,453 shares, at December 31, 2017 and 12,263,643 at December 31, 2016 | | | | | 239 | | | | | | 123 | | |
| Additional paid in capital | | | | | 304,932 | | | | | | 104,884 | | |
| Retained earnings | | | | | 18,753 | | | | | | 22,126 | | |
| Accumulated other comprehensive loss | | | | | (1,152) | | | | | | (789) | | |
| Total stockholders’ equity | | | | | 322,772 | | | | | | 126,344 | | |
| Total liabilities and stockholders’ equity | | | | $ | 2,614,252 | | | | | $ | 1,142,443 | | |
| | |||||||||||||
| | | | | | |
|
| December 31, |
| December 31, | ||
| | 2019 | | 2018 | ||
| | | | | ||
ASSETS | | | | | | |
Cash and cash equivalents: |
| |
|
| |
|
Cash and due from financial institutions | | $ | 7,909 |
| $ | 6,939 |
Interest-bearing deposits in other financial institutions | |
| 24,019 |
| | 20,877 |
Federal funds sold | |
| — |
| | 795 |
Total cash and cash equivalents | |
| 31,928 |
| | 28,611 |
| | | | | | |
Securities available for sale, at fair value | |
| 164,820 |
| | 143,377 |
| | | | | | |
Securities held to maturity, at amortized cost (fair value of $72,666 and $89,109, respectively) | |
| 72,448 |
| | 92,462 |
| | | | | | |
Total loans | |
| 2,186,047 |
| | 2,178,824 |
Less allowance for loan losses | |
| (10,261) |
| | (12,283) |
Net loans | |
| 2,175,786 |
| | 2,166,541 |
Stock in Federal Reserve Bank and Federal Home Loan Bank | |
| 17,832 |
| | 19,522 |
Equity investment in mortgage affiliate | |
| 5,020 |
| | 3,829 |
Preferred investment in mortgage affiliate | |
| 3,305 |
| | 3,305 |
Bank premises and equipment, net | |
| 31,184 |
| | 32,352 |
Operating lease right-of-use assets | | | 8,013 | | | — |
Goodwill | |
| 101,954 |
| | 101,954 |
Core deposit intangibles, net | |
| 7,191 |
| | 8,609 |
Bank-owned life insurance | |
| 63,850 |
| | 62,495 |
Other real estate owned | |
| 6,224 |
| | 5,077 |
Deferred tax assets, net | |
| 11,788 |
| | 14,104 |
Other assets | |
| 20,827 |
| | 19,057 |
Total assets | | $ | 2,722,170 |
| $ | 2,701,295 |
| | | | | | |
LIABILITIES AND STOCKHOLDERS' EQUITY | |
|
|
| |
|
Noninterest-bearing demand deposits | | $ | 339,153 |
| $ | 320,043 |
Interest-bearing deposits: | |
|
|
| |
|
NOW accounts | |
| 391,172 |
| | 345,597 |
Money market accounts | |
| 466,867 |
| | 355,469 |
Savings accounts | |
| 144,486 |
| | 151,050 |
Time deposits | |
| 783,040 |
| | 925,441 |
Total interest-bearing deposits | |
| 1,785,565 |
| | 1,777,557 |
Total deposits | |
| 2,124,718 |
| | 2,097,600 |
| | | | | | |
Securities sold under agreements to repurchase - short term | |
| 12,883 |
| | 18,721 |
Federal Home Loan Bank (FHLB) advances - short term | |
| 121,640 |
| | 163,340 |
Junior subordinated debt - long term | |
| 9,632 |
| | 9,584 |
Senior subordinated notes - long term | |
| 47,051 |
| | 47,089 |
Operating lease liabilities | | | 8,469 | | | — |
Other liabilities | |
| 20,536 |
| | 16,671 |
Total liabilities | |
| 2,344,929 |
| | 2,353,005 |
Commitments and contingencies (See Note 15) | |
| |
| | |
| | | | | | |
Stockholders' equity: | |
|
|
| |
|
Preferred stock, $0.01 par value. Authorized 5,000,000 shares; 0 shares issued and outstanding | |
| — |
| | — |
Common stock, $0.01 par value. Authorized 45,000,000 shares; 24,181,534 and 24,052,253 shares issued and outstanding at December 31, 2019 and December 31, 2018, respectively | |
| 241 |
| | 240 |
Additional paid in capital | |
| 306,755 |
| | 305,654 |
Retained earnings | |
| 69,462 |
| | 44,985 |
Accumulated other comprehensive income (loss) | |
| 783 |
| | (2,589) |
Total stockholders' equity | |
| 377,241 |
| | 348,290 |
Total liabilities and stockholders' equity | | $ | 2,722,170 |
| $ | 2,701,295 |
See accompanying notes to consolidated financial statements.
70
SOUTHERN NATIONAL BANCORP OF VIRGINIA, INC.
CONSOLIDATED STATEMENTS OF INCOME AND COMPREHENSIVE INCOME
(dollars in thousands, except per share amounts)
| | | | For the Years Ended December 31, | ||||||||||||||
| | | | 2017 | | | 2016 | | | 2015 | ||||||||
| Interest and dividend income: | | | | | | | | | | | | | | | | | |
| Interest and fees on loans | | | | $ | 77,764 | | | | | $ | 45,348 | | | | | $ | 40,104 |
| Interest and dividends on taxable securities | | | | | 4,077 | | | | | | 2,619 | | | | | | 2,395 |
| Interest and dividends on tax exempt securities | | | | | 492 | | | | | | 336 | | | | | | 411 |
| Interest and dividends on other earning assets | | | | | 1,231 | | | | | | 644 | | | | | | 791 |
| Interest on federal funds sold | | | | | 6 | | | | | | — | | | | | | — |
| Total interest and dividend income | | | | | 83,570 | | | | | | 48,947 | | | | | | 43,701 |
| Interest expense: | | | | | | | | | | | | | | | | | |
| Interest on deposits | | | | | 10,993 | | | | | | 8,101 | | | | | | 6,433 |
| Interest on repurchase agreements | | | | | 36 | | | | | | 18 | | | | | | 103 |
| Interest on junior subordinated debt | | | | | 253 | | | | | | — | | | | | | — |
| Interest on senior subordinated notes | | | | | 2,194 | | | | | | — | | | | | | — |
| Interest on other borrowings | | | | | 2,177 | | | | | | 514 | | | | | | 541 |
| Total interest expense | | | | | 15,653 | | | | | | 8,633 | | | | | | 7,077 |
| Net interest income | | | | | 67,917 | | | | | | 40,314 | | | | | | 36,624 |
| Provision for loan losses | | | | | 8,625 | | | | | | 4,912 | | | | | | 3,171 |
| Net interest income after provision for loan losses | | | | | 59,292 | | | | | | 35,402 | | | | | | 33,453 |
| Noninterest income: | | | | | | | | | | | | | | | | | |
| Account maintenance and deposit service fees | | | | | 3,564 | | | | | | 896 | | | | | | 953 |
| Income from bank-owned life insurance | | | | | 929 | | | | | | 700 | | | | | | 636 |
| Equity (loss) income from mortgage affiliate | | | | | (345) | | | | | | 1,109 | | | | | | 1,459 |
| Net gain on other assets | | | | | — | | | | | | — | | | | | | 7 |
| Gain on sales of investment securities | | | | | 255 | | | | | | — | | | | | | 520 |
| Other | | | | | 1,026 | | | | | | 115 | | | | | | 206 |
| Total noninterest income | | | | | 5,429 | | | | | | 2,820 | | | | | | 3,781 |
| Noninterest expenses: | | | | | | | | | | | | | | | | | |
| Salaries and benefits | | | | | 20,285 | | | | | | 11,675 | | | | | | 11,860 |
| Occupancy expenses | | | | | 4,809 | | | | | | 3,155 | | | | | | 3,269 |
| Furniture and equipment expenses | | | | | 2,228 | | | | | | 975 | | | | | | 815 |
| Amortization of core deposit intangible | | | | | 845 | | | | | | 219 | | | | | | 261 |
| Virginia franchise tax expense | | | | | 969 | | | | | | 387 | | | | | | 352 |
| FDIC assessment | | | | | 802 | | | | | | 543 | | | | | | 664 |
| Data processing expense | | | | | 1,140 | | | | | | 744 | | | | | | 668 |
| Telephone and communication expense | | | | | 1,422 | | | | | | 745 | | | | | | 786 |
| Amortization of FDIC indemnification asset | | | | | 712 | | | | | | 793 | | | | | | 630 |
| Net loss on other real estate owned | | | | | 520 | | | | | | 174 | | | | | | 291 |
| Merger expenses | | | | | 9,426 | | | | | | 429 | | | | | | — |
| Other operating expenses | | | | | 5,991 | | | | | | 2,976 | | | | | | 3,682 |
| Total noninterest expenses | | | | | 49,149 | | | | | | 22,815 | | | | | | 23,278 |
| Income before income taxes | | | | | 15,572 | | | | | | 15,407 | | | | | | 13,956 |
| Income tax expense | | | | | 13,147 | | | | | | 5,095 | | | | | | 4,667 |
| Net income | | | | $ | 2,425 | | | | | $ | 10,312 | | | | | $ | 9,289 |
| Other comprehensive (loss) income: | | | | | | | | | | | | | | | | | |
| Unrealized loss on available for sale securities | | | | $ | (309) | | | | | $ | (284) | | | | | $ | (138) |
| Realized amounts on investment securities sold, net | | | | | (255) | | | | | | — | | | | | | (520) |
| Non-credit component of other-than-temporary impairment on held-to-maturity securities | | | | | — | | | | | | — | | | | | | 4,278 |
| Accretion of amounts previously recorded upon transfer to held-to-maturity from available-for-sale | | | | | 13 | | | | | | 12 | | | | | | 32 |
| Net unrealized (loss) gain | | | | | (551) | | | | | | (272) | | | | | | 3,652 |
| Tax effect | | | | | (188) | | | | | | (93) | | | | | | 1,242 |
| Other comprehensive (loss) income | | | | | (363) | | | | | | (179) | | | | | | 2,410 |
| Comprehensive income | | | | $ | 2,062 | | | | | $ | 10,133 | | | | | $ | 11,699 |
| Earnings per share, basic | | | | $ | 0.13 | | | | | $ | 0.84 | | | | | $ | 0.76 |
| Earnings per share, diluted | | | | $ | 0.13 | | | | | $ | 0.83 | | | | | $ | 0.75 |
| | |||||||||||||||||
| | | | | | | | | | |
| | | | | | | | | | |
| | | For the Years Ended December 31, | |||||||
|
|
| 2019 |
| 2018 |
| 2017 | |||
Interest and dividend income: |
|
| |
|
| |
|
| |
|
Interest and fees on loans | | | $ | 112,181 | | $ | 110,213 | | $ | 77,764 |
Interest and dividends on taxable securities | | |
| 5,639 | |
| 5,752 | |
| 4,077 |
Interest and dividends on tax exempt securities | | |
| 585 | |
| 634 | |
| 492 |
Interest and dividends on other earning assets | | |
| 2,117 | |
| 2,256 | |
| 1,231 |
Interest on federal funds sold | | |
| 2 | |
| 52 | |
| 6 |
Total interest and dividend income | | |
| 120,524 | |
| 118,907 | |
| 83,570 |
Interest expense: | | |
|
| |
|
| |
|
|
Interest on deposits | | |
| 30,602 | |
| 18,235 | |
| 10,993 |
Interest on repurchase agreements | | |
| 87 | |
| 97 | |
| 36 |
Interest on junior subordinated debt | | |
| 589 | |
| 575 | |
| 253 |
Interest on senior subordinated notes | | |
| 2,847 | |
| 2,847 | |
| 2,194 |
Interest on other borrowings | | |
| 2,799 | |
| 6,087 | |
| 2,177 |
Total interest expense | | |
| 36,924 | |
| 27,841 | |
| 15,653 |
Net interest income | | |
| 83,600 | |
| 91,066 | |
| 67,917 |
Provision for loan losses | | |
| 350 | |
| 4,200 | |
| 8,625 |
Net interest income after provision for loan losses | | |
| 83,250 | |
| 86,866 | |
| 59,292 |
| | | | | | | | | | |
Noninterest income: | | |
|
| |
|
| |
|
|
Account maintenance and deposit service fees | | |
| 7,159 | |
| 5,959 | |
| 3,564 |
Income from bank-owned life insurance | | |
| 1,699 | |
| 1,983 | |
| 929 |
Equity gain (loss) from mortgage affiliate | | |
| 1,191 | |
| (894) | |
| (345) |
Gain on sales of investment securities | | |
| — | |
| — | |
| 255 |
Recoveries related to acquired charged-off loans and investment securities | | | | 1,537 | | | 2,610 | | | 757 |
Other | | |
| 1,000 | |
| 541 | |
| 269 |
Total noninterest income | | |
| 12,586 | |
| 10,199 | |
| 5,429 |
| | | | | | | | | | |
Noninterest expenses: | | |
|
| |
|
| |
|
|
Salaries and benefits | | |
| 26,261 | |
| 27,706 | |
| 20,285 |
Occupancy expenses | | |
| 6,204 | |
| 6,628 | |
| 4,809 |
Furniture and equipment expenses | | |
| 2,719 | |
| 2,795 | |
| 2,228 |
Amortization of core deposit intangible | | |
| 1,418 | |
| 1,445 | |
| 845 |
Virginia franchise tax expense | | |
| 2,251 | |
| 1,839 | |
| 969 |
Data processing expense | | |
| 2,381 | |
| 1,885 | |
| 1,140 |
Telephone and communication expense | | |
| 1,615 | |
| 2,035 | |
| 1,422 |
Net (gain) loss on other real estate owned | | |
| (38) | |
| 360 | |
| 520 |
Professional fees | | |
| 3,612 | |
| 1,644 | |
| 1,798 |
Merger expenses | | | | — | | | — | | | 9,426 |
Other operating expenses | | |
| 10,169 | |
| 7,423 | |
| 5,707 |
Total noninterest expenses | | |
| 56,592 | |
| 53,760 | |
| 49,149 |
Income before income taxes | | |
| 39,244 | |
| 43,305 | |
| 15,572 |
Income tax expense | | |
| 6,077 | |
| 9,614 | |
| 13,147 |
Net income | | | $ | 33,167 | | $ | 33,691 | | $ | 2,425 |
Other comprehensive income (loss): | | |
|
| |
|
| |
|
|
Unrealized gain (loss) on available for sale securities | | | $ | 4,256 | | $ | (1,548) | | $ | (309) |
Non-credit component of other-than-temporary impairment on held-to-maturity securities | | |
| — | |
| — | |
| (255) |
Accretion of amounts previously recorded upon transfer to held to maturity from available for sale | | |
| 13 | |
| 16 | |
| 13 |
Net unrealized gain (loss) | | |
| 4,269 | |
| (1,532) | |
| (551) |
Tax effect | | |
| 897 | |
| (324) | |
| (188) |
Other comprehensive income (loss) | | |
| 3,372 | |
| (1,208) | |
| (363) |
Comprehensive income | | | $ | 36,539 | | $ | 32,483 | | $ | 2,062 |
Earnings per share, basic | | | $ | 1.38 | | $ | 1.40 | | $ | 0.13 |
Earnings per share, diluted | | | $ | 1.36 | | $ | 1.39 | | $ | 0.13 |
See accompanying notes to consolidated financial statements.
71
SOUTHERN NATIONAL BANCORP OF VIRGINIA, INC.
CONSOLIDATED STATEMENTS OF CHANGES IN STOCKHOLDERS’ EQUITY
FOR THE YEARS ENDED DECEMBER 31, 2017, 20162019, 2018 AND 2015
(dollars in thousands, except per share amounts)
| | | | Common Stock | | | Additional Paid in Capital | | | Retained Earnings | | | Accumulated Other Comprehensive Loss | | | Total | | |||||||||||||||
| Balance – January 1, 2015 | | | | $ | 122 | | | | | $ | 104,072 | | | | | $ | 12,805 | | | | | $ | (3,020) | | | | | $ | 113,979 | | |
| Comprehensive income: | | | | | | | | | | | | | | | | | | | | | | | | | | | | | | | |
| Net income | | | | | — | | | | | | — | | | | | | 9,289 | | | | | | — | | | | | | 9,289 | | |
| Change in unrealized loss on securities available for sale (net of tax benefit, $224) | | | | | — | | | | | | — | | | | | | — | | | | | | (434) | | | | | | (434) | | |
| Change in unrecognized loss on securities held to maturity for which a portion of OTTI has been recognized (net of tax, $1,466 and accretion, $32 and amounts recorded into other comprehensive income at transfer) | | | | | — | | | | | | — | | | | | | — | | | | | | 2,844 | | | | | | 2,844 | | |
| Dividends on common stock ($0.52 per share) | | | | | — | | | | | | — | | | | | | (6,359) | | | | | | — | | | | | | (6,359) | | |
| Repurchase of common stock (62,177 shares) | | | | | (1) | | | | | | (720) | | | | | | — | | | | | | — | | | | | | (721) | | |
| Issuance of common stock under Stock Incentive Plan (79,950 shares) | | | | | 1 | | | | | | 706 | | | | | | — | | | | | | — | | | | | | 707 | | |
| Stock-based compensation expense | | | | | — | | | | | | 331 | | | | | | — | | | | | | — | | | | | | 331 | | |
| Balance – December 31, 2015 | | | | | 122 | | | | | | 104,389 | | | | | | 15,735 | | | | | | (610) | | | | | | 119,636 | | |
| Comprehensive income: | | | | | | | | | | | | | | | | | | | | | | | | | | | | | | | |
| Net income | | | | | — | | | | | | — | | | | | | 10,312 | | | | | | — | | | | | | 10,312 | | |
| Change in unrealized loss on securities available for sale (net of tax benefit, $97) | | | | | — | | | | | | — | | | | | | — | | | | | | (187) | | | | | | (187) | | |
| Change in unrecognized loss on securities held to maturity for which a portion of OTTI has been recognized (net of tax, $4 and accretion, $8 and amounts recorded into other comprehensive income at transfer) | | | | | — | | | | | | — | | | | | | — | | | | | | 8 | | | | | | 8 | | |
| Dividends on common stock ($0.32 per share) | | | | | — | | | | | | — | | | | | | (3,921) | | | | | | — | | | | | | (3,921) | | |
| Issuance of common stock for warrants exercised (11,000 shares) | | | | | 1 | | | | | | 100 | | | | | | — | | | | | | — | | | | | | 101 | | |
| Issuance of common stock under Stock Incentive Plan (18,200 shares) | | | | | — | | | | | | 135 | | | | | | — | | | | | | — | | | | | | 135 | | |
| Stock-based compensation expense | | | | | — | | | | | | 260 | | | | | | — | | | | | | — | | | | | | 260 | | |
| Balance – December 31, 2016 | | | | | 123 | | | | | | 104,884 | | | | | | 22,126 | | | | | | (789) | | | | | | 126,344 | | |
| Comprehensive income: | | | | | | | | | | | | | | | | | | | | | | | | | | | | | | | |
| Net income | | | | | — | | | | | | — | | | | | | 2,425 | | | | | | — | | | | | | 2,425 | | |
| Change in unrealized loss on securities available for sale (net of tax benefit, $192) | | | | | — | | | | | | — | | | | | | — | | | | | | (372) | | | | | | (372) | | |
| Change in unrecognized loss on securities held to maturity for which a portion of OTTI has been recognized (net of tax, $4 and accretion, $8 and amounts recorded into other comprehensive income at transfer) | | | | | — | | | | | | — | | | | | | — | | | | | | 9 | | | | | | 9 | | |
| Dividends on common stock ($0.32 per share) | | | | | — | | | | | | — | | | | | | (5,798) | | | | | | — | | | | | | (5,798) | | |
| Issuance of common stock for warrants exercised (49,500 shares) | | | | | — | | | | | | 449 | | | | | | — | | | | | | — | | | | | | 449 | | |
| Issuance of common stock under Stock Incentive Plan (65,550 shares) | | | | | — | | | | | | 555 | | | | | | — | | | | | | — | | | | | | 555 | | |
| Issuance of common stock in connection with Eastern Virginia Bankshares, Inc. merger (11,557,760 shares) | | | | | 116 | | | | | | 198,793 | | | | | | — | | | | | | — | | | | | | 198,909 | | |
| Stock-based compensation expense | | | | | — | | | | | | 251 | | | | | | — | | | | | | — | | | | | | 251 | | |
| Balance – December 31, 2017 | | | | $ | 239 | | | | | $ | 304,932 | | | | | $ | 18,753 | | | | | $ | (1,152) | | | | | $ | 322,772 | | |
| | |||||||||||||||||||||||||||||||
| | | | | | | | | | | | | | | |
| | | | | | | | | | | Accumulated | | | | |
| | | | Additional | | | | Other | | | |||||
| | Common | | Paid in | | Retained | | Comprehensive | | | |||||
|
| Stock |
| Capital |
| Earnings |
| Income (Loss) |
| Total | |||||
Balance - January 1, 2017 | | $ | 123 | | $ | 104,884 | | $ | 22,126 | | $ | (789) | | $ | 126,344 |
Comprehensive income: | |
|
| |
|
| |
|
| |
|
| |
|
|
Net income | |
| — | |
| — | |
| 2,425 | |
| — | |
| 2,425 |
Change in unrealized loss on securities available for sale (net of tax benefit, $192) | |
| — | |
| — | |
| — | |
| (372) | |
| (372) |
Change in unrecognized loss on securities held to maturity for which a portion of OTTI has been recognized (net of tax, $4 and accretion, $8 and amounts recorded into other comprehensive income at transfer) | |
| — | |
| — | |
| — | |
| 9 | |
| 9 |
Dividends on common stock ($0.32 per share) | |
| — | |
| — | |
| (5,798) | |
| — | |
| (5,798) |
Issuance of common stock for warrants exercised (49,500 shares) | |
| — | |
| 449 | |
| — | |
| — | |
| 449 |
Issuance of common stock under Stock Incentive Plan (65,550 shares) | |
| — | |
| 555 | |
| — | |
| — | |
| 555 |
Issuance of common stock in connection with Eastern Virginia Bankshares, Inc. merger (11,557,760 shares) | |
| 116 | |
| 198,793 | |
| — | |
| — | |
| 198,909 |
Stock-based compensation expense | |
| — | |
| 251 | |
| — | |
| — | |
| 251 |
Balance - December 31, 2017 | | $ | 239 | | $ | 304,932 | | $ | 18,753 | | $ | (1,152) | | $ | 322,772 |
Comprehensive income: | |
|
| |
|
| |
|
| |
|
| |
|
|
Net income | |
| — | |
| — | |
| 33,691 | |
| — | |
| 33,691 |
Changes in other comprehensive loss on investment securities (net of tax, $(324) and accretion of $16) | |
| — | |
| — | |
| — | |
| (1,208) | |
| (1,208) |
Dividends on common stock ($0.32 per share) | |
| — | |
| — | |
| (7,688) | |
| — | |
| (7,688) |
Issuance of common stock under Stock Incentive Plan (58,000 shares) | |
| 1 | |
| 442 | |
| — | |
| — | |
| 443 |
Reclassification adjustment from accumulated other comprehensive income to retained earnings for adoption of ASU 2018-02 | |
| — | |
| — | |
| 229 | |
| (229) | |
| — |
Stock-based compensation expense | |
| — | |
| 280 | |
| — | |
| — | |
| 280 |
Balance - December 31, 2018 | | $ | 240 | | $ | 305,654 | | $ | 44,985 | | $ | (2,589) | | $ | 348,290 |
Net income | |
| — | |
| — | |
| 33,167 | |
| — | |
| 33,167 |
Changes in other comprehensive income on investment securities (net of tax, $897 and accretion of $13) | | | — | | | — | | | — | | | 3,372 | | | 3,372 |
Dividends on common stock ($0.36 per share) | |
| — | |
| — | |
| (8,690) | |
| — | |
| (8,690) |
Issuance of common stock under Stock Incentive Plan (83,900 shares) | |
| 1 | |
| 669 | |
| — | |
| — | |
| 670 |
Stock-based compensation expense | |
| — | |
| 432 | |
| — | |
| — | |
| 432 |
Balance - December 31, 2019 | | $ | 241 | | $ | 306,755 | | $ | 69,462 | | $ | 783 | | $ | 377,241 |
| | | | | | | | | | | | | | | |
See accompanying notes to consolidated financial statements.
72
SOUTHERN NATIONAL BANCORP OF VIRGINIA, INC.
CONSOLIDATED STATEMENTS OF CASH FLOWS
(dollars in thousands)
| | | | For the Years Ended December 31, | | |||||||||||||||
| | | | 2017 | | | 2016 | | | 2015 | | |||||||||
| Operating activities: | | | | | | | | | | | | | | | | | | | |
| Net income | | | | $ | 2,425 | | | | | $ | 10,312 | | | | | $ | 9,289 | | |
| Adjustments to reconcile net income to net cash and cash equivalents provided by operating activities: | | | | | |||||||||||||||
| Depreciation | | | | | 2,176 | | | | | | 798 | | | | | | 876 | | |
| Amortization of core deposit intangible | | | | | 845 | | | | | | 219 | | | | | | 261 | | |
| Other amortization, net | | | | | 1,606 | | | | | | (36) | | | | | | 149 | | |
| Accretion of loan discount | | | | | (3,802) | | | | | | (1,874) | | | | | | (2,510) | | |
| Amortization of FDIC indemnification asset | | | | | 712 | | | | | | 793 | | | | | | 630 | | |
| Provision for loan losses | | | | | 8,625 | | | | | | 4,912 | | | | | | 3,171 | | |
| Earnings on bank-owned life insurance | | | | | (929) | | | | | | (700) | | | | | | (636) | | |
| Equity loss (income) on mortgage affiliate | | | | | 345 | | | | | | (1,109) | | | | | | (1,459) | | |
| Stock-based compensation expense | | | | | 251 | | | | | | 260 | | | | | | 331 | | |
| Net gain on sales of investment securities | | | | | (255) | | | | | | — | | | | | | (520) | | |
| Net loss on other real estate owned | | | | | 520 | | | | | | 174 | | | | | | 291 | | |
| Provision for deferred income taxes | | | | | 9,686 | | | | | | 29 | | | | | | 2,132 | | |
| Net decrease (increase) in other assets | | | | | 6,069 | | | | | | 2,924 | | | | | | (385) | | |
| Net (decrease) increase in other liabilities | | | | | (3,687) | | | | | | 1,321 | | | | | | 599 | | |
| Net cash and cash equivalents provided by operating activities | | | | | 24,587 | | | | | | 18,023 | | | | | | 12,219 | | |
| Investing activities: | | | | | | | | | | | | | | | | | | | |
| Proceeds from sales of investment securities | | | | | 4,767 | | | | | | — | | | | | | 3,966 | | |
| Purchases of held to maturity investment securities | | | | | (9,950) | | | | | | (46,055) | | | | | | (18,153) | | |
| Purchases of available for sale investment securities | | | | | (3,247) | | | | | | — | | | | | | — | | |
| Proceeds from paydowns, maturities and calls of available for sale investment securities | | | | | 7,987 | | | | | | — | | | | | | 1 | | |
| Proceeds from paydowns, maturities and calls of held to maturity investment securities | | | | | 11,037 | | | | | | 57,622 | | | | | | 13,607 | | |
| Loan originations and payments, net | | | | | (104,009) | | | | | | (108,760) | | | | | | (127,334) | | |
| Proceeds from sales of loans held for sale | | | | | 19,689 | | | | | | — | | | | | | — | | |
| Purchase of bank-owned life insurance | | | | | — | | | | | | — | | | | | | (1,500) | | |
| Investment in mortgage affiliate, net | | | | | 46 | | | | | | 939 | | | | | | (119) | | |
| Net increase in stock in Federal Reserve Bank and Federal Home Loan Bank | | | | | (12,112) | | | | | | (1,000) | | | | | | (1,248) | | |
| Payments received on FDIC indemnification asset | | | | | 46 | | | | | | 18 | | | | | | 3 | | |
| Proceeds from sales of other real estate owned | | | | | 1,110 | | | | | | 1,790 | | | | | | 4,048 | | |
| Purchases of bank premises and equipment | | | | | (1,425) | | | | | | (143) | | | | | | (307) | | |
| Proceeds from sales of bank premises and equipment | | | | | 40 | | | | | | — | | | | | | — | | |
| Net cash acquired in acquisition of Eastern Virginia Bankshares, Inc. | | | | | 24,015 | | | | | | — | | | | | | — | | |
| Net cash and cash equivalents used in investing activities | | | | | (62,006) | | | | | | (95,589) | | | | | | (127,036) | | |
| Financing activities: | | | | | | | | | | | | | | | | | | | |
| Net (decrease) increase in deposits | | | | | (196,801) | | | | | | 77,307 | | | | | | 82,869 | | |
| Cash dividends paid – common stock | | | | | (5,798) | | | | | | (3,921) | | | | | | (6,359) | | |
| Issuance of common stock under Stock Incentive Plan | | | | | 555 | | | | | | 135 | | | | | | 707 | | |
| Issuance of common stock for warrants exercised | | | | | 449 | | | | | | 101 | | | | | | — | | |
| Issuance of subordinated notes, net of cost | | | | | 26,075 | | | | | | — | | | | | | — | | |
| Repurchase of common stock | | | | | — | | | | | | — | | | | | | (721) | | |
| Net decrease in long-term borrowings | | | | | — | | | | | | — | | | | | | (10,000) | | |
| Net increase in short-term borrowings | | | | | 191,010 | | | | | | 21,000 | | | | | | 40,337 | | |
| Net cash and cash equivalents provided by financing activities | | | | | 15,490 | | | | | | 94,622 | | | | | | 106,833 | | |
| (Decrease) increase in cash and cash equivalents | | | | | (21,929) | | | | | | 17,056 | | | | | | (7,984) | | |
| Cash and cash equivalents at beginning of period | | | | | 47,392 | | | | | | 30,336 | | | | | | 38,320 | | |
| Cash and cash equivalents at end of period | | | | $ | 25,463 | | | | | $ | 47,392 | | | | | $ | 30,336 | | |
| Supplemental disclosure of cash flow information | | | | | | | | | | | | | | | | | | | |
| Cash payments for: | | | | | | | | | | | | | | | | | | | |
| Interest | | | | $ | 14,571 | | | | | $ | 8,289 | | | | | $ | 6,791 | | |
| Income taxes | | | | | 3,671 | | | | | | 4,604 | | | | | | 2,993 | | |
| Supplemental schedule of noncash investing and financing activities | | | | | | | | | | | | | | | | | | | |
| Transfer from loans to other real estate owned | | | | $ | 43 | | | | | $ | 144 | | | | | $ | 1,727 | | |
| Transfer from long-term FHLB advances to short-term FHLB advances | | | | | — | | | | | | 15,000 | | | | | | — | | |
| Transfer from securities sold under agreements to repurchase to deposits | | | | | — | | | | | | 10,381 | | | | | | — | | |
| Fair value of assets and liabilities from acquisition: | | | | | | | | | | | | | | | | | | | |
| Fair value of tangible assets acquired | | | | $ | 1,356,637 | | | | | $ | — | | | | | $ | — | | |
| Other intangible assets acquired | | | | | 100,127 | | | | | | — | | | | | | — | | |
| Fair value of liabilities assumed | | | | | (1,257,845) | | | | | | — | | | | | | — | | |
| Total merger consideration | | | | $ | 198,919 | | | | | $ | — | | | | | $ | — | | |
| | |||||||||||||||||||
| | | | | | | | | |
| | For the Years Ended December 31, | |||||||
|
| 2019 |
| 2018 |
| 2017 | |||
Operating activities: |
| |
|
| |
|
| |
|
Net income | | $ | 33,167 | | $ | 33,691 | | $ | 2,425 |
Adjustments to reconcile net income to net cash and cash equivalents provided by operating activities: | |
|
| |
|
| |
|
|
Depreciation and amortization | |
| 5,632 | |
| 7,403 | |
| 4,627 |
Amortization of operating lease right-of-use assets | | | 2,546 | | | — | | | — |
Accretion of loan discount | |
| (3,859) | |
| (4,534) | |
| (3,802) |
Amortization of FDIC indemnification asset | |
| 649 | |
| 704 | |
| 712 |
Provision for loan losses | |
| 350 | |
| 4,200 | |
| 8,625 |
Earnings on bank-owned life insurance | |
| (1,565) | |
| (1,633) | |
| (929) |
Equity (gain) loss on mortgage affiliate | |
| (1,191) | |
| 894 | |
| 345 |
Stock-based compensation expense | |
| 432 | |
| 280 | |
| 251 |
Net gain on sales of investment securities | |
| — | |
| — | |
| (255) |
Gain on bank-owned life insurance death benefit | | | (134) | | | (350) | | | — |
(Gain) loss on other real estate owned | |
| (38) | |
| 360 | |
| 520 |
Provision for deferred income taxes | |
| 1,420 | |
| 3,121 | |
| 9,686 |
Net (increase) decrease in other assets | |
| (2,203) | |
| 213 | |
| 6,069 |
Net increase (decrease) in other liabilities | |
| 1,558 | |
| (2,909) | |
| (3,687) |
Net cash and cash equivalents provided by operating activities | |
| 36,764 | |
| 41,440 | |
| 24,587 |
Investing activities: | |
|
| |
|
| |
|
|
Proceeds from sales of investment securities | |
| — | |
| — | |
| 4,767 |
Purchases of held to maturity investment securities | |
| (15,260) | |
| — | |
| (9,950) |
Purchases of available for sale investment securities | |
| (45,135) | |
| — | |
| (3,247) |
Proceeds from paydowns, maturities and calls of available for sale investment securities | |
| 26,283 | |
| 14,360 | |
| 7,987 |
Proceeds from paydowns, maturities and calls of held to maturity investment securities | |
| 35,006 | |
| 5,955 | |
| 11,037 |
Net (increase) decrease of FRB and FHLB stock | | | 1,690 | | | 7,253 | | | (12,112) |
Net increase in loans | |
| (7,059) | |
| (113,845) | |
| (104,009) |
Proceeds from sales of loans held for sale | |
| — | |
| — | |
| 19,689 |
Purchase of bank-owned life insurance | |
| — | |
| (12,000) | |
| — |
Proceeds from bank-owned life insurance death benefit | | | 344 | | | 2,278 | | | — |
Sales of other real estate owned, net of improvements | | | 214 | | | 2,140 | | | 1,110 |
Investment in mortgage affiliate, net | |
| — | |
| — | |
| 46 |
Payments received on FDIC indemnification asset | |
| — | |
| — | |
| 46 |
Proceeds from sales of bank premise and equipment and assets held for sale | | | — | | | 2,136 | | | 40 |
Purchases of bank premises and equipment | |
| (1,101) | |
| (1,973) | |
| (1,425) |
Cash acquired in acquisition of Eastern Virginia Bankshares, Inc. | |
| — | |
| — | |
| 24,015 |
Net cash and cash equivalents used in investing activities | |
| (5,018) | |
| (93,696) | |
| (62,006) |
Financing activities: | |
|
| |
|
| |
|
|
Net increase (decrease) in deposits | |
| 27,129 | |
| 231,671 | |
| (196,801) |
Cash dividends paid on common stock | |
| (8,690) | |
| (7,688) | |
| (5,798) |
Issuance of common stock for warrants exercised | |
| — | |
| — | |
| 449 |
Issuance of common stock under Stock Incentive Plan | |
| 670 | |
| 443 | |
| 555 |
Issuance of subordinated notes, net of cost | |
| — | |
| — | |
| 26,075 |
Net decrease (increase) in short-term borrowings | |
| (47,538) | |
| (169,022) | |
| 191,010 |
Net cash and cash equivalents provided by (used in) financing activities | |
| (28,429) | |
| 55,404 | |
| 15,490 |
Increase in cash and cash equivalents | |
| 3,317 | |
| 3,148 | |
| (21,929) |
Cash and cash equivalents at beginning of period | |
| 28,611 | |
| 25,463 | |
| 47,392 |
Cash and cash equivalents at end of period | | $ | 31,928 | | $ | 28,611 | | $ | 25,463 |
Supplemental disclosure of cash flow information | |
|
| |
|
| |
|
|
Cash payments for: | |
|
| |
|
| | | |
Interest | | $ | 36,002 | | $ | 26,129 | | $ | 14,571 |
Income taxes | |
| 4,897 | |
| 6,672 | | | 3,671 |
Non-cash investing and financing activities: | | | | | | | |
|
|
Initial recognition of operating lease right-of-use assets | | $ | 8,615 | | $ | — | | $ | — |
Initial recognition of operating lease liabilities | | | 9,099 | | | — | |
| — |
Supplemental schedule of noncash investing and financing activities: | |
|
| |
|
| |
|
|
Transfer from loans to other real estate owned | | $ | 1,323 | | $ | — | | $ | 43 |
Fair value of assets and liabilities from acquisition: | |
|
| |
|
| |
|
|
Fair value of tangible assets acquired | | $ | — | | $ | — | | $ | 1,356,637 |
Other intangible assets acquired | |
| — | |
| — | |
| 100,127 |
Fair value of liabilities assumed | |
| — | |
| — | |
| (1,257,845) |
Total merger consideration | | $ | — | | $ | — | | $ | 198,919 |
See accompanying notes to consolidated financial statements.
73
1.
Southern National Bancorp of Virginia, Inc. (“Southern National” or “SNBV” or the “Company”) is a corporation that was formed on July 28, 2004 under the laws of the Commonwealth of Virginia and is the holding company for Sonabank (“Sonabank” or the “Bank”) a Virginia state-chartered bank which commenced operations on April 14, 2005. As of the close of business on June 23, 2017, SNBV completed its merger with Eastern Virginia Bankshares, Inc. (“EVBS”) and the merger of EVBS’s wholly-owned subsidiary, EVB, with and into SNBV’s wholly-owned subsidiary, Sonabank (see Note 2 — Business Combinations). Sonabank.
Sonabank provides a range of financial services to individuals and small and medium sized businesses. At December 31, 2017,2019, Sonabank had thirty-eightNaN full-service branches. NaN full-service retail branches are in Virginia, located in the counties of Chesterfield (2), Essex (2), Fairfax (Reston, McLean and Fairfax), Gloucester (2), Hanover (3), King William, Lancaster, Middlesex (3), New Kent, Northumberland (3), Southampton, Surry, Sussex, and inAshland, Burgess, Callao, Central Garage, Charlottesville, Chester, Clifton Forge, Colonial Heights, Courtland, Deltaville, Fairfax, Front Royal, Gloucester, Gloucester Point, Hampton, Hartfield, Haymarket, Heathsville, Kilmarnock, Leesburg, McLean, Mechanicsville (2), Middleburg, Midlothian, New Market, Newport News, Quinton, Reston, Richmond, South Riding, Surry, Tappahannock (2), Urbanna, Warrenton, Waverly, and Williamsburg, and seven7 full-service retail branches in Maryland, located in Bethesda, Brandywine, Huntingtown, Owings, Rockville, Shady Grove, Bethesda,and Upper Marlboro, Brandywine, Owings and Huntingtown.
The accounting policies and practices of Southern National and its subsidiaries conform to U.S. generally accepted accounting principles (“U.S. GAAP”) and to general practice within the banking industry. Major policies and practices are described below:
Principles of Consolidation
The consolidated financial statements include the accounts of Southern National and its subsidiaries Sonabank and EVB Statutory Trust I (the “Trust”). Significant inter-company accounts and transactions have been eliminated in consolidation. Southern National consolidates subsidiaries in which it holds, directly or indirectly, more than 50 percent of the voting rights or where it exercises control. Entities where Southern National holds 20 to 50 percent of the voting rights, or has the ability to exercise significant influence, or both, are accounted for under the equity method. Southern National has an interest in one affiliate, Southern Trust Mortgage, LLC (“STM”), which it accounts for as an equity method investment. In addition, Southern National owns the Trust which is an unconsolidated subsidiary. The junior subordinated debt owed to the Trust is reported as a liability of Southern National.
Use of Estimates
The preparation of the consolidated financial statements in conformity with U.S. GAAP requires management to make estimates and assumptions that affect the reported amounts of assets and liabilities at the date of the financial statements and the reported amounts of revenue and expenses during the reporting period. Actual results could differ from these estimates. Material estimates that are particularly susceptible to significant change in the near term include: the determination of the allowance for loan losses, the carryingfair value of investment securities, other than temporary impairment of investment securities, the valuation of goodwill and intangible assets, fair value measurements related to assets acquired and liabilities assumed from business combinations, the FDIC indemnification asset, other real estate owned (“OREO”) and deferred tax assets.
Business Combinations
U.S. GAAP requires that the acquisition method of accounting be used for all business combinations and that an acquirer be identified for each business combination. Under U.S. GAAP, the acquirer is the entity that obtains control of one or more businesses in the business combination, and the acquisition date is the date the acquirer achieves control. U.S. GAAP requires that the acquirer recognize the fair value of assets acquired, liabilities assumed, and any non-controlling interest in the acquiree at the acquisition date.date, with any excess of purchase price recognized as either intangibles or goodwill.
If the initial accounting for a business combination is incomplete by the end of the reporting period in which the combination occurs, the acquirer shall report in its financial statements provisional amounts for the items for which the accounting is incomplete. The measurement period ends as soon as the acquirer receives the information it was seeking
74
about facts and circumstances that existed as of the acquisition date or learns that more information is not obtainable. However, the measurement period shall not exceed one year from the acquisition date. The acquirer recognizes an increase (decrease) in the provisional amount recognized for an identifiable asset (liability) by means of a decrease (increase) in goodwill.
Investment Securities
Debt securities that Southern National has the positive intent and ability to hold to maturity are classified as held-to-maturity and carried at amortized cost.
Securities classified as available for sale are those debt securities that may be sold in response to changes in interest rates, liquidity needs or other similar factors. Securities available for sale are carried at fair value, with unrealized gains or losses net of deferred taxes, included in accumulated other comprehensive income (loss) in stockholders’ equity.
Premiums and discounts are generally amortized using the interest method with a constant effective yield without anticipating prepayments, except for mortgage-backed securities where prepayments are anticipated. Premiums on callable securities are amortized to their earliest call date. Prior to the adoption of Financial Accounting Standards Board (FASB) Accounting Standards Update (ASU) 2017-08 in 2019, premiums and discounts arewere recognized in interest income using the interest method over the terms of the securities without anticipating prepayments, except for mortgage-backed securities where prepayments arewere anticipated. Gains and losses on the sale of investment securities are recorded on the settlement date and are determined using the specific identification method.
Southern National purchases amortizing investment securities in which the underlying assets are residential mortgage loans subject to prepayments. The actual principal reduction on these assets varies from the expected contractual principal reduction due to principal prepayments resulting from the borrowers’ election to refinance the underlying mortgage based on market and other conditions. The purchased premiums and discounts associated with these assets are amortized or accreted to interest income over the estimated life of the related assets. The estimated life is calculated by projecting future prepayments and the resulting principal cash flows until maturity. Prepayment rate projections utilize actual prepayment speed experience and available market information on like-kind instruments. The prepayment rates form the basis for income recognition of premiums and discounts on the related assets. Changes in prepayment estimates may cause the earnings recognized on these assets to vary over the term that the assets are held, creating volatility in the net interest margin. Prepayment rate assumptions are monitored and updated monthly to reflect actual activity and the most recent market projections.
Management evaluates investment securities for other-than-temporary impairment (“OTTI”) on at least a quarterly basis, and more frequently when economic or market conditions warrant such an evaluation. For investment securities in an unrealized loss position, management considers the extent and duration of the unrealized loss, and the financial condition and near-term prospects of the issuer. Management also assesses whether it intends to sell, or it is more likely than not that it will be required to sell, an investment security in an unrealized loss position before recovery of its amortized cost basis. If either of the criteria regarding intent or requirement to sell is met, the entire difference between amortized cost and fair value is recognized as impairment through earnings. For debt securities that do not meet the aforementioned criteria, the amount of impairment is split into two components as follows: 1)(1) OTTI related to credit loss, which must be recognized in the income statement and 2)(2) OTTI related to other factors, which is recognized in other comprehensive income. The credit loss is defined as the difference between the present value of the cash flows expected to be collected and the amortized cost basis. For equity securities, the entire amount of impairment is recognized through earnings.
In order to determine OTTI for purchased beneficial interests that, on the purchase date, were not highly rated, Southern National compares the present value of the remaining cash flows as estimated at the preceding evaluation date to the current expected remaining cash flows. OTTI is deemed to have occurred if there has been an adverse change in the remaining expected future cash flows.
Loans
Southern National provides mortgage, commercial and consumer loans to customers. A substantial portion of the loan portfolio is represented by loans secured by real estate throughout its market area. The ability of Southern National’s
75
debtors to honor their contracts is in varying degrees dependent upon the real estate market conditions and general economic conditions in this area.
Loans that management has the intent and ability to hold for the foreseeable future or until maturity or pay-off are reported at their outstanding unpaid principal balances adjusted for the allowance for loan losses, purchased premiums and discounts and any deferred loan fees or costs on originated loans. Interest income is accrued on the unpaid principal balance. Loan origination fees, net of certain direct origination costs, are deferred and recognized as an adjustment of the related loan yield using the interest method without anticipating prepayments.
Commercial real estate consists of borrowings secured by owner occupied and non-owner occupied commercial real estate. Repayment of these loans is dependent upon rental income or the subsequent sale of the property for loans secured by non-owner occupied commercial real estate and by cash flows from business operations for owner occupied commercial real estate. Loans for which the source of repayment is rental income are primarily impacted by local economic conditions which dictate occupancy rates and the amount of rent charged. Commercial real estate loans that are dependent on cash flows from operations can also be adversely affected by current market conditions for their product or service.
Construction and land development primarily consist of borrowings to purchase and develop raw land into residential and non-residential properties. Construction loans are extended to individuals as well as corporations for the construction of an individual or multiple properties and are secured by raw land and the subsequent improvements. Repayment of the loans to real estate developers is dependent upon the sale or lease of properties to third parties in a timely fashion upon completion. Should there be delays in construction or a downturn in the market for those properties, there may be significant erosion in value which may be absorbed by Southern National.
Commercial loans consist of borrowings for commercial purposes to individuals, corporations, partnerships, sole proprietorships, and other business enterprises. Commercial loans are generally secured by business assets such as equipment, accounts receivable, inventory, or any other asset excluding real estate and generally made to finance capital expenditures or operations. Southern National’s risk exposure is related to deterioration in the value of collateral securing the loan should foreclosure become necessary. Generally, business assets used or produced in operations do not maintain their value upon foreclosure which may require Southern National to write-down the value significantly to sell.
Residential real estate loans consist of loans to individuals for the purchase of primary residences with repayment primarily through wage or other income sources of the individual borrower. Southern National’s loss exposure to these loans is dependent on local market conditions for residential properties as loan amounts are determined, in part, by the fair value of the property at origination.
On May 15, 2014, we purchased a 44.0% equity investment and preferred stock of STM, a regional mortgage banking company headquartered in Virginia Beach, Virginia. On June 23, 2017, in connection with the EVBS acquisition, we added 4.9% of additional equity investment and preferred stock in STM, bringing us to a total equity investment of 48.9%. STM has mortgage banking originators in Delaware, Virginia, Maryland, North Carolina and South Carolina. STM only originates retail mortgage production.
Sonabank has established with STM underwriting guidelines under which it will purchase residential construction only, construction loans that convert to permanent, and permanent loans primarily in its Virginia and Maryland footprint from STM. These will be largely loans that do not conform to FNMA or FHLMC standards because of size or acreage.
Other consumer loans are comprised of loans to individuals both unsecured and secured and home equity loans secured by real estate (closed and open-end), with repayment dependent on individual wages and other income. The risk of loss on consumer loans is elevated as the collateral securing these loans, if any, rapidly depreciate in value or may be worthless and/or difficult to locate if repossession is necessary. Losses in this portfolio are generally relatively low, however, due to the small individual loan size and the balance outstanding as a percentage of Southern National’s entire portfolio.
76
As part of the Greater Atlantic Bank (“GAB”) acquisition in 2009, the Bank and the Federal Deposit Insurance Corporation (“FDIC”) entered into a loss sharing agreement on approximately $143.4 million (cost basis) of GAB’s assets. The Bank will shareshared in the losses on the loans and foreclosed loan collateral
The accrual of interest on all loans is discontinued at the time the loan is 90 days delinquent unless the credit is well secured and in process of collection. In all cases, loans are placed on nonaccrual status or charged-off at an earlier date if collection of principal and interest is considered doubtful.
All interest accrued but not collected for loans that are placed on nonaccrual status or charged-off is reversed against interest income. The interest on these loans is accounted for on the cash-basis or cost-recovery method, until qualifying for return to accrual status. Loans are returned to accrual status when all the principal and interest amounts contractually due are brought current and future payments are reasonably assured.
Most of Southern National’s business activity is with customers located within Virginia and Maryland. Therefore, our exposure to credit risk is significantly affected by changes in the economy in those areas. We are not dependent on any single customer or group of customers whose insolvency would have a material adverse effect on operations.
Southern National has purchased, primarily through acquisitions, individual loans and groups of loans, some of which have shown evidence of credit deterioration since origination. These purchased loans are recorded at fair value such that there is no carryover of the seller’s allowance for loan losses. After acquisition, losses are recognized by an increase in the allowance for loan losses. Purchased credit-impaired (“PCI”) loans are accounted for using the expected cash flow methodology, and purchased performing loans are accounted for using the contractual cash flow methodology.
Such purchasedPCI loans are accounted for individually or aggregated into pools of loans based on common risk characteristics such as, credit score, loan type, and date of origination. Southern National estimates the amount and timing of expected cash flows for each PCI loan or pool, and the expected cash flows in excess of fair value are recorded as interest income over the remaining life of the loan or pool (accretable yield). The excess of the loans’ or pool’s contractual principal and interest over expected cash flows is not recorded (nonaccretable difference).
Over the life of the loan or pool, expected cash flows continue to be estimated. If the present value of expected cash flows is less than the carrying amount, a loss is recorded. If the present value of expected cash flows is greater than the carrying amount, it is recognized as part of future interest income.
Allowance for Loan and Lease Losses (“ALLL”)
The allowance for loan and lease losses is a valuation allowance for probable incurred credit losses. Loan losses are charged against the allowance when management believes the collection of the principal is unlikely. Recoveries of amounts previously charged-off are credited to the allowance. Management’s determination of the adequacy of the allowance is based on a three year historical average net loss experience for each portfolio segment adjusted for current industry and economic conditions and estimates of their effect on loan collectability. While management uses available information to estimate losses on loans, future additions to the allowance may be necessary based on changes in economic conditions, particularly those affecting real estate values.
77
The allowance consists of specific and general components. The specific component relates to loans that are individually classified as impaired. The general component provides for estimated losses in unimpaired loans and is based on historical loss experience adjusted for current factors.
A loan is considered impaired when, based on current information and events, it is probable that Southern National will be unable to collect the scheduled payments of principal or interest when due according to the terms of the loan. Factors considered by management in determining impairment include payment status, collateral value, and the probability of collecting scheduled principal and interest payments when due. Loans that experience insignificant payment delays and payment shortfalls generally are not classified as impaired. Management determines the significance of payment delays and payment shortfalls on a case-by-case basis, taking into consideration all of the circumstances surrounding the loan and the borrower, including the length of the delay, the reasons for the delay, the borrower’s prior payment record, and the amount of the shortfall in relation to the principal and interest owed. Impairment is measured on a loan by loan basis by either the present value of expected future cash flows discounted at the loan’s effective interest rate, the loan’s obtainable market price, or the fair value of the collateral if the loan is collateral dependent.
The general component covers non-impaired loans and is based on historical loss experience adjusted for current factors. The historical loss experience is determined by portfolio segment and is based on the actual net loss history experienced by Southern National over the most recent three years.years, except consumer loans that are tracked on a two year basis. This actual loss experience is supplemented with other economic factors based on the risks present for each portfolio segment. These economic factors include consideration of the following: levels of and trends in delinquencies and impaired loans; levels of and trends in charge-offs and recoveries; trends in volume and terms of loans; effects of any changes in risk selection and underwriting standards; other changes in lending policies, procedures, and practices; experience, ability, and depth of lending management and other relevant staff; national and local economic trends and conditions; industry conditions; and effects of changes in credit concentrations. The following portfolio segments have been identified: owner occupied commercial real estate, non-owner occupied commercial real estate, construction and land development, commercial loans, 1-4 family residential, and other consumer. While underwriting practices in this environment are more stringent, the Bank estimates the effect of internal factors on future net loss experience to be negligible.fairly small. Management’s estimate of the effect of current external economic environmental conditions on future net loss experience is significant in all loan segments and particularly on loans secured by real estate including single family 1-4, non-owner occupied commercial real estate and construction and land development loans. These factors include excess inventory, generally less demand driven in part by fewer qualified borrowers and buyers. These considerations have played a significant role in management’s estimate of the adequacy of the allowance for loan and lease losses.
Transfers of Financial Assets
Transfers of financial assets are accounted for as sales, when control over the assets has been relinquished. Control over transferred assets is deemed to be surrendered when the assets have been isolated from Southern National, the transferee obtains the right (free of conditions that constrain it from taking advantage of that right) to pledge or exchange the transferred assets, and Southern National does not maintain effective control over the transferred assets through an agreement to repurchase them before their maturity.
Investments
Southern National’s investment in STM, our mortgage affiliate,STM’s common stock is being accounted for under the equity method. Under the equity method, the carrying value of Southern National’s investment in STM was originally recorded at cost but is adjusted periodically to record Southern National’s proportionate share of STM’s earnings or losses through noninterest income and decreased by the amount of cash dividends or similar distributions received from STM.
Southern National’s investment in STM’s preferred stock is considered to be a non-marketable equity security that does not have a readily determinable fair value. Equity securities with no recurring market value data available are reviewed periodically and any observable market value change are adjusting through net income. Southern National evaluated this non-marketable equity security for impairment and recoverability of the recorded investment by considering positive and negative evidence, including the profitability and asset quality of STM, dividend payment history and recent redemption experience. Impairment is assessed at each reporting period and if identified, is recognized in noninterest income.
78
Bank Premises and Equipment
Land is carried at cost. Premises and equipment are stated at cost less accumulated depreciation. Buildings and related components are depreciated using the straight-line method with useful lives of 30 years. Furniture, fixtures and equipment are depreciated using the straight-line method with useful lives ranging from 3 to 10 years. Leasehold improvements
Operating Leases
The Company leases certain properties and equipment under operating leases. The Company recognizes a liability to make lease payments, the operating lease liability, and an asset representing the right to use the underlying asset during the lease term, the right-of-use asset. In recognizing lease right-of-use assets and related right-of-use liabilities, we account for lease and non-lease components (such as taxes, insurance, and common area maintenance costs) separately as such amounts are amortizedgenerally readily determinable under our lease contracts. The operating lease liability is measured at the present value of the remaining lease payments, discounted at the Company’s incremental borrowing rate at inception. The right-of-use asset is measured at the amount of the operating lease liability adjusted for the remaining balance of any lease incentives received, any cumulative prepaid or accrued rent if the lease payments are uneven throughout the lease term, any unamortized initial direct costs, and any impairment of the right-of-use-asset. Lease expense consists of a single lease cost calculated so that the remaining cost of the lease is allocated over the shorterremaining lease term on a straight-line basis, variable lease payments not included in the operating lease liability, and any impairment of their estimated useful lives or the right-of-use asset. Lease renewal options are generally not included in the calculation of the operating lease term.
Goodwill and Intangible Assets
Goodwill resulting from business combinations after January 1, 2009, is generally determined as the excess of the fair value of the consideration transferred, plus the fair value of any noncontrolling interests in the acquiree, over the fair value of the net assets acquired and liabilities assumed as of the acquisition date. Goodwill and intangible assets acquired in a purchase business combination and determined to have an indefinite useful life are not amortized, but tested for impairment at least annually. Southern National
Other intangible assets consist of loan servicing rights and core deposit intangible assets arising from whole-bank and branch acquisitions and are amortized over their estimated useful lives, which range from 6 to 15 years.
Stock Based Compensation
Compensation cost is recognized for stock options issued to employees, based on the fair value of these awards at the date of grant. A Black-Scholes option-pricing model is utilized to estimate the fair value of stock options. Compensation cost for grants of restricted shares is accounted for based on the closing price of Southern National’s common stock on the date the restricted shares are awarded. Compensation cost for stock options and restricted shares is recognized over the required service period, generally defined as the vesting period. For awards with graded vesting, compensation cost is recognized on a straight-line basis over the requisite service period for the entire award.
Bank-owned Life Insurance
Southern National has purchased, and acquired through acquisitions, life insurance policies on certain former and current key executives. Bank-owned life insurance is recorded at the amount that can be realized under the insurance contract at the balance sheet date, which is the cash surrender value adjusted for other charges or other amounts due that are probable at settlement.
79
Other Real Estate Owned (“OREO”)
Real estate acquired through or instead of foreclosure is held for sale and initially recorded at fair value less costs to sell when acquired, establishing a new cost basis. If fair value declines subsequent to foreclosure, thea direct charge-off method is recorded through expense. Operating costs after acquisition are expensed as incurred.
Stock in Federal Home Loan Bank (“FHLB”) and Federal Reserve Bank (“FRB”)
The Bank is a member of the FHLB system. Members are required to own a certain amount of stock based on the level of borrowings and other factors, and may invest in additional amounts. The Bank is also required to own FRB stock with a par value equal to 6% of capital. FHLB and FRB stock are carried at cost, classified as a restricted security, and periodically evaluated for impairment based on ultimate recovery of par value. Both cash and stock dividends are reported as income.
Impairment of Long-Lived Assets
Premises and equipment, core deposit intangible assets the FDIC indemnification asset and other long-term assets are reviewed for impairment when events indicate their carrying amount may not be recoverable from future undiscounted cash flows. If impaired, the assets are recorded at fair value.
FDIC Indemnification Asset
The acquisition of GAB on December 4, 2009 was accounted for under the acquisition method of accounting, and the assets and liabilities were recorded at their estimated fair values. The FDIC indemnification asset was measured separately from each of the covered asset categories as it iswas not contractually embedded in any of the covered asset categories. The indemnification asset represents the present value of cash flows expected to be received from the FDIC for future losses on covered assets based on the expected credit losses estimated for each covered loan or loan pool and the loss sharing percentages at the acquisition date. Cash flows are discounted at a market-based rate to reflect the uncertainty of the timing of the loss sharing reimbursement from the FDIC. The ultimate collectability of this asset is dependent upon the performance of the underlying covered assets, the passage of time and claims paid by the FDIC. We acquired the GAB loans in December 2009 and continuously evaluateevaluated our estimates of expected losses on these loans. During 2017, and based on the actual historical losses on the loan pools over
Retirement Plans
Employee 401(k) plan expense is the amount of matching contributions. Supplemental retirement plan expense allocates the benefits over years of service.
Loss Contingencies
Loss contingencies, including claims and legal actions arising in the ordinary course of business, are recorded as liabilities when the likelihood of loss is probable and an amount or range of loss can be reasonably estimated. Management does not believe there are such matters that will have a material effect on the financial statements.
Dividend Restriction
Banking regulations require maintaining certain capital levels and may limit the dividends paid by the Bank to Southern National or by Southern National to shareholders.
Estimates and Uncertainties
Estimates including the carrying value of investment securities, other than temporary impairment of investment securities, the determination of the allowance for loan losses expected loan performance and recoveries from the FDIC, the valuation of goodwill and intangible assets OREO and deferred tax assets, and fair value measurements related to assets acquired and liabilities assumed from business combinations, involves uncertainties and matters of significant judgement regarding interest rates, credit risk, repayments and prepayments, and
80
other factors, especially in the absence of broad markets for particular items. Changes in assumptions or in market conditions could significantly affect the estimates.
Operating Segments
While the chief decision-makers monitor the revenue streams of the various products and services, operations are managed and financial performance is evaluated on a company-wide basis. Discrete financial information is not available other than on a company-wide basis. Accordingly, all of the financial service operations are considered by management to be aggregated in one1 reportable operating segment.
Reclassifications
In certain instances, amounts reported in prior years’ consolidated financial statements have been reclassified to conform to the current financial statement presentation. Such reclassifications had no effect on previously reported cash flows, shareholders’stockholders’ equity or net income.
During 2019, the Company determined that certain assets were incorrectly recorded in the Company’s fixed asset accounting software in a prior period. In correcting these errors the Company has reduced the previously disclosed cost basis of bank premises and equipment and accumulated depreciation by $22.5 million each. These corrections did not result in a change to amounts previously reported as bank premises and equipment, net, stockholders’ equity, or net income. The Company has evaluated the effect of the error, both qualitatively and quantitatively, and concluded that it was immaterial.
Advertising Costs
Advertising costs are expensed as incurred.
Income Taxes
Income tax expense is the total of the current year income tax due or refundable and the change in deferred tax assets and liabilities. Deferred tax assets and liabilities are the expected future tax amounts for the temporary differences between carrying amounts and tax bases of assets and liabilities, computed using enacted tax rates. A valuation allowance, if needed, reduces deferred tax assets to the amount expected to be realized.
A tax position is recognized as a benefit only if it is “more likely than not” that the tax position would be sustained in a tax examination, with a tax examination being presumed to occur. The amount recognized is the largest amount of tax benefit that is greater than 50% likely of being realized on examination. For tax positions not meeting the “more likely than not” test, no tax benefit is recorded. We have no0 unrecognized tax benefits and do not anticipate any increase in unrecognized tax benefits during the next twelve months. Should the accrual of any interest or penalties relative to unrecognized tax benefits be necessary, it is our policy to record such accruals in our income tax accounts; no0 such accruals exist as of December 31, 2017.2019. Southern National and its subsidiaries file a consolidated U.S. federal tax return; Sonabank files a Maryland state income tax return and Southern National files a Virginia state incomefranchise tax return. These returns are subject to examination by taxing authorities for all years after 2013.
On December 22, 2017 the Tax Cuts and Jobs Act was enacted into Federal Law.enacted. The new law establishesestablished a new flat corporate federal statutory income tax rate of 21%. For more information on the impact the new law had on Southern National, see discussion in Note 12 —- Income Taxes.
Restrictions on Cash
No regulatory reserve or clearing requirements with the FRB were needed at December 31, 2017. However, cash on hand or on deposit with the FRB was required to meet regulatory reserve2019 and clearing requirements2018.
81
Consolidated Statements of Cash Flows
For purposes of reporting cash flows, Southern National defines cash and cash equivalents as cash due from financial institutions, and interest-bearing deposits and federal funds sold in other financial institutions with maturities less than 90 days. Net cash flows are reported for customer loan and deposit transactions and short-term borrowings.
Earnings Per Share (“EPS”)
Basic EPS is computed by dividing net income by the weighted average number of common shares outstanding during the year. Diluted EPS reflects additional common shares that would have been outstanding if dilutive potential common shares had been issued, as well as any adjustment to net income that would result from the assumed issuance. Potential common shares that may be issued by Southern National relate solely to outstanding stock options and warrants and are determined using the treasury stock method.
Comprehensive Income
Comprehensive income consists of net income and other comprehensive (loss) income. Other comprehensive (loss) income includes unrealized gains and losses on investment securities available for sale and the non-credit component of other than temporary impairment of investment securities held-to-maturity which are also recognized as a separate component of equity.
Off Balance Sheet Credit Related Financial Instruments
In the ordinary course of business, Southern National has entered into commitments to extend credit, standby letters of credit, and guarantees of previously sold credit card accounts assumed in the merger with EVBS. The face amount for these items represents the exposure to loss, before considering customer collateral or ability to repay.
Fair Value Measurements
In general, fair values of financial instruments are based upon quoted market prices, where available. If such quoted market prices are not available, fair value is based upon observable market-based parameters. Valuation assumptions may be made to ensure that financial instruments are recorded at fair value. These assumptions may reflect assumptions that market participants would use in pricing an asset or liability, among other things, as well as unobservable parameters. Any such valuation assumptions are applied consistently over time.
Recent Accounting Pronouncements
New Accounting Standards Not Yet Adopted:
In February 2016, the FASB issued ASU 2016-02, Leases (Topic 842). The FASB issued this ASU to increase transparency and comparability among organizations by recognizing lease assets and lease liabilities on the balance sheet by lessees for those leases classified as operating leases under current U.S. GAAP and disclosing key information about leasing arrangements. In July 2018, the FASB issued ASU 2018-10, Codification Improvements to Topic 842, Leases, which updated narrow aspects of the guidance issued in ASU 2016-02. The amendments in this ASU arewere effective for public business entities for annual periods, and interim periods within those annual periods, beginning after December 15, 2018. Early applicationadoption of this ASU iswas permitted for all entities. Southern National is currently assessingThe Company adopted ASU 2016-02 and its subsequent updates in the impact first quarter of 2019 and inventoried and categorized its lease agreements. Upon adoption, the Company recognized right-of-use assets and associated operating lease liabilities of $8.6 million and $9.1 million, respectively. Right-of-use assets and operating lease liabilities are reflected on our consolidated balance sheets. The Company elected to apply certain practical adoption expedients provided under the updates whereby we did not reassess (i) whether any expired or existing contracts are or contain leases, (ii) the lease classification for any expired or existing leases and (iii) initial direct costs for existing leases. The Company has elected to use the practical expedient to make an accounting policy election for property leases to use the discount rates in effect on January 2, 2019 for the remaining life
82
of the adoption of this ASU on its consolidated financial statements and anticipates recognizing a right-of-use asset and a lease liability associated with its long-term operating leases. Management is still in the process of inventorying and categorizing Southern National’s lease agreements, including those assumed in the acquisition of EVBS, and is also exploring the possible engagement of a third-party vendor solution to assist in the application of this ASU.
In January 2017, the FASB issued ASU 2017-04, Intangibles —- Goodwill and Other (Topic 350): Simplifying the Test for Goodwill Impairment,, which eliminates the second step of the previous FASB guidance for testing goodwill for impairment and is intended to reduce cost and complexity of goodwill impairment testing. The amendments in this ASU modify the concept of impairment from the condition that exists when the carrying amount of goodwill exceeds its implied fair value to the condition that exists when the carrying amount of a reporting unit exceeds its fair value. After determining if the carrying amount of a reporting unit exceeds its fair value, the entity should take an impairment charge of the same amount to the goodwill for that reporting unit, not to exceed the total goodwill amount for that reporting unit. ASU 2017-04 is effective for annual periods beginning after December 15, 2019, including interim periods within those annual periods. Early adoption is permitted for interim or annual goodwill impairment tests performed on testing dates after January 1, 2017. Southern National is currently evaluatingThe Company early adopted ASU 2017-04 in the third quarter of 2019 and it did not have an impact of adoptingon the new guidance on itsCompany’s consolidated financial statements.
In March 2017, the FASB issued ASU 2017-08, Receivables —– Nonrefundable Fees and Other Costs (Subtopic 310-20), Premium Amortization on Purchased Callable Debt Securities,which shortenshortens the amortization period for certain callable debt securities held at a premium. Specifically, the amendments require the premium to be amortized to the earliest call date. The amendments do not require an accounting change for securities held at a discount; the discount continues to be amortized to maturity. The amendments in this ASU are2017-08 became effective for public business entities for fiscal years, and interim periods within those fiscal years, beginning after December 15, 2018. Southern National is currently reviewing its portfolioThe Company adopted ASU 2017-08 in the first quarter of debt securities to determine2019 and it did not have a material impact on the impact that this ASU will have on itsCompany’s consolidated financial statements.
New Accounting Standards Not Yet Adopted:
In May 2017, June 2016, the FASB issued ASU 2017-09, Compensation — Stock Compensation2016-13, Financial Instruments – Credit Losses (Topic 718)326): Measurement of Credit Losses on Financial Instruments, Scopewhich along with several other subsequent codification updates related to accounting for credit losses, sets forth a “current expected credit loss” ("CECL") model requiring the Company to measure all expected credit losses for financial instruments recorded at amortized cost held at the reporting date. The estimate is to be based on historical experience, current conditions and reasonable and supportable forecasts. This replaces the existing incurred loss model and is applicable to the measurement of Modification Accounting.credit losses on financial assets measured at amortized cost and applies to some off-balance sheet credit exposures. The amendments provide guidance on determining whichare effective for the Company beginning January 1, 2020. Southern National engaged a third-party to collect data that was needed to produce historical inputs into any models created as a result of adopting this ASU. We have had our models validated and are currently evaluating the results and certain changes to our models. We currently expect the termsadoption of this ASU will result in an increase of approximately $10.0 million to $15.0 million in our allowance for loan losses, including transfers of non-accretable discount on purchased credit-impaired loans. As we are currently finalizing the execution of our implementation controls and conditionsprocesses, the ultimate impact of share-based payment awards requirethe adoption of this ASU could materially differ from our current expectation. The expected increase is a result of changing from an entity“incurred loss” model, which encompasses allowances for current known and inherent losses within the portfolio, to apply modification accounting under Topic 718.an “expected loss” model, which encompasses allowances for losses expected to be incurred over the life of the portfolio. The guidanceadoption of this ASU requires that we establish an allowance for expected credit losses for certain debt securities and other financial assets; however, we do not expect these allowances to be material. We plan to elect the federal banking agencies’ rule providing for an optional three-year phase-in period for the day-one adverse regulatory capital effects upon adopting the standard. The adoption of this ASU is effectivenot expected to have a significant impact on our regulatory capital ratios.
In August 2018, FASB issued ASU 2018-13, Fair Value measurement (Topic 820). This ASU adds, eliminates and modifies certain disclosure requirements for all entitiesfair value measurements. The amendments in ASU 2018-13 are effective for fiscal years, and interim periods within those fiscal years, beginning after December 15, 2017.2019. Early adoption is permitted, including adoption in an interim period.permitted. The amendments in this ASU should be applied prospectively to an award modified on or afterdisclosures are effective using the adoption date.prospective method for certain disclosures and retrospective for a majority of the disclosures. Southern National is currently in the process of evaluating the impact of adopting the amendments in the ASUnew guidance on its consolidated financial statements.statements and disclosures.
83
In February 2018, theDecember 2019, FASB issued ASU 2018-02, 2019-12, Simplifying the Accounting for Income Statement — Reporting Comprehensive IncomeTaxes (Topic 220); Reclassification740). This ASU simplifies the accounting for income taxes by eliminating certain exceptions to the guidance in ASC 740 related to the approach for intraperiod tax allocation, the methodology for calculating income taxes in an interim period and the recognition for deferred tax liabilities for outside basis differences. This ASU also simplifies aspects of Certain Tax Effects from Accumulated Other Comprehensive Income. The amendmentsthe accounting for franchise taxes and enacted changes in this ASU requiretax laws or rates and clarifies the accounting transactions that result in a reclassification from/to accumulated other comprehensive income and to/from retained earnings for stranded tax effects resulting from the changestep-up in the newly enacted federal corporate income tax rate. Consequently, the amendments in thisbasis of goodwill. ASU eliminates the stranded tax effects associated with the change in the federal corporate income tax rate in the Tax Cuts and Jobs Act of 2017. The amendments in this ASU are2019-12 is effective for all entities for fiscal yearsannual periods beginning after December 15, 2018 with early2020, including interim periods within those annual periods. Early adoption allowed.is permitted. Southern National plans to early adopt this ASU during the first quarter of 2018. The effect of the adoption of this ASU will be to increase accumulated other comprehensive loss by approximately $227 thousand with the offset to retained earnings as recordedis currently in the statementprocess of changes in stockholders’ equity. This representsevaluating the difference betweenimpact of adopting the historical federal corporate income tax ratenew guidance on its consolidated financial statements and the newly enacted 21 percent federal corporate income tax rate.
| (dollars in thousands) | | | As Recorded by EVBS | | | Fair Value Adjustments | | | As Recorded by the Company | | |||||||||
| Consideration paid: | | | | | | | | | | | | | | | | | | | |
| Cash | | | | | | | | | | | | | | | | $ | 10 | | |
| SNBV common stock | | | | | | | | | | | | | | | | | 198,909 | | |
| Total consideration paid | | | | | | | | | | | | | | | | $ | 198,919 | | |
| Identifiable assets acquired: | | | | | | | | | | | | | | | | | | | |
| Cash and due from banks | | | | $ | 4,350 | | | | | $ | — | | | | | $ | 4,350 | | |
| Interest bearing deposits with banks | | | | | 18,993 | | | | | | — | | | | | | 18,993 | | |
| Federal funds sold | | | | | 682 | | | | | | — | | | | | | 682 | | |
| Securities available for sale, at fair value | | | | | 163,029 | | | | | | (150) | | | | | | 162,879 | | |
| Securities held to maturity, at carrying value | | | | | 19,036 | | | | | | 508 | | | | | | 19,544 | | |
| Restricted securities, at cost | | | | | 6,734 | | | | | | — | | | | | | 6,734 | | |
| Loans | | | | | 1,045,600 | | | | | | (13,618) | | | | | | 1,031,982 | | |
| Loans held for sale | | | | | 19,689 | | | | | | — | | | | | | 19,689 | | |
| Deferred income taxes | | | | | 15,735 | | | | | | 4,912 | | | | | | 20,647 | | |
| Bank premises and equipment | | | | | 24,242 | | | | | | 4,110 | | | | | | 28,352 | | |
| Assets held for sale | | | | | 2,970 | | | | | | (1,043) | | | | | | 1,927 | | |
| Accrued interest receivable | | | | | 4,272 | | | | | | — | | | | | | 4,272 | | |
| Other real estate owned | | | | | 563 | | | | | | (16) | | | | | | 547 | | |
| Core deposit intangible | | | | | 435 | | | | | | 9,590 | | | | | | 10,025 | | |
| Bank owned life insurance | | | | | 26,035 | | | | | | — | | | | | | 26,035 | | |
| Other assets | | | | | 10,004 | | | | | | — | | | | | | 10,004 | | |
| Total identifiable assets acquired | | | | | 1,362,369 | | | | | | 4,293 | | | | | | 1,366,662 | | |
| Identifiable liabilities assumed: | | | | | | | | | | | | | | | | | | | |
| Noninterest-bearing demand accounts | | | | | 226,637 | | | | | | — | | | | | | 226,637 | | |
| Interest-bearing deposits | | | | | 920,743 | | | | | | 1,182 | | | | | | 921,925 | | |
| Federal funds purchased and repurchase agreements | | | | | 7,598 | | | | | | — | | | | | | 7,598 | | |
| Federal Home Loan Bank advances | | | | | 57,475 | | | | | | — | | | | | | 57,475 | | |
| Junior subordinated debt | | | | | 10,310 | | | | | | (801) | | | | | | 9,509 | | |
| Senior subordinated notes | | | | | 19,175 | | | | | | 1,876 | | | | | | 21,051 | | |
| Accrued interest payable | | | | | 902 | | | | | | — | | | | | | 902 | | |
| Other liabilities | | | | | 12,748 | | | | | | — | | | | | | 12,748 | | |
| Total identifiable liabilities assumed | | | | | 1,255,588 | | | | | | 2,257 | | | | | | 1,257,845 | | |
| Net identifiable assets acquired | | | | $ | 106,781 | | | | | $ | 2,036 | | | | | $ | 108,817 | | |
| Goodwill resulting from acquisition | | | | | | | | | | | | | | | | $ | 90,102 | | |
| | |||||||||||||||||||
| (dollars in thousands) | | | For the Year Ended December 31, 2017 | | |||
| Loans(1) | | | | $ | 2,800 | | |
Time deposits(2) | | | | | 407 | | |
Junior and senior subordinated debt(3) | | | | | 43 | | |
Core deposit intangible(4) | | | | | (651) | | |
| Net impact to income before income taxes | | | | $ | 2,599 | | |
| | |||||||
| | | | Purchased Credit Impaired Loans | | |||
| Contractually required principal and interest at acquisition | | | | $ | 17,970 | | |
| Contractual cash flows not expected to be collected (nonaccretable difference) | | | | | (6,243) | | |
| Expected cash flows at acquisition | | | | | 11,727 | | |
| Accretable difference | | | | | 398 | | |
| Basis in acquired loans at acquisition – estimated fair value | | | | $ | 11,329 | | |
| | |||||||
| (dollars in thousands, except per share data) | | | Pro Forma Twelve Months Ended December 31, 2017 | | | Pro Forma Twelve Months Ended December 31, 2016 | | ||||||
| Net interest income | | | | $ | 91,010 | | | | | $ | 85,114 | | |
| Net income | | | | | 9,555 | | | | | | 18,354 | | |
| Earnings per share, basic | | | | $ | 0.40 | | | | | $ | 0.77 | | |
| Earnings per share, diluted | | | | $ | 0.39 | | | | | $ | 0.76 | | |
| Weighted average shares outstanding – Basic | | | | | 23,923,410 | | | | | | 23,923,410 | | |
| Weighted average shares outstanding – Diluted | | | | | 24,228,054 | | | | | | 24,228,054 | | |
The amortized cost and fair value of available for sale investment securities and the related gross unrealized gains and losses recognized in accumulated other comprehensive income (loss) were as follows (in thousands):
| December 31, 2017 | | | Amortized Cost | | | Gross Unrealized | | | Fair Value | | |||||||||||||||
| | Gains | | | Losses | | ||||||||||||||||||||
| Residential government-sponsored mortgage-backed securities | | | | $ | 31,145 | | | | | $ | 3 | | | | | $ | (284) | | | | | $ | 30,864 | | |
| Obligations of states and political subdivisions | | | | | 18,581 | | | | | | 187 | | | | | | (41) | | | | | | 18,727 | | |
| Corporate securities | | | | | 2,013 | | | | | | 2 | | | | | | — | | | | | | 2,015 | | |
| Trust preferred securities | | | | | 2,590 | | | | | | — | | | | | | (202) | | | | | | 2,388 | | |
| Residential government-sponsored collateralized mortgage obligations | | | | | 51,521 | | | | | | 1 | | | | | | (756) | | | | | | 50,766 | | |
| Government-sponsored agency securities | | | | | 3,247 | | | | | | — | | | | | | (21) | | | | | | 3,226 | | |
| Agency commercial mortgage-backed securities | | | | | 28,263 | | | | | | — | | | | | | (365) | | | | | | 27,898 | | |
| SBA pool securities | | | | | 24,829 | | | | | | 68 | | | | | | (108) | | | | | | 24,789 | | |
| | | | | $ | 162,189 | | | | | $ | 261 | | | | | $ | (1,777) | | | | | $ | 160,673 | | |
| | |||||||||||||||||||||||||
| December 31, 2016 | | | Amortized Cost | | | Gross Unrealized | | | Fair Value | | |||||||||||||||
| | Gains | | | Losses | | ||||||||||||||||||||
| Obligations of states and political subdivisions | | | | $ | 2,280 | | | | | $ | 9 | | | | | $ | (30) | | | | | $ | 2,259 | | |
| Trust preferred securities | | | | | 2,590 | | | | | | — | | | | | | (931) | | | | | | 1,659 | | |
| | | | | $ | 4,870 | | | | | $ | 9 | | | | | $ | (961) | | | | | $ | 3,918 | | |
| | |||||||||||||||||||||||||
| | | | | | | | | | | | |
| | Amortized | | Gross Unrealized | | Fair | ||||||
|
| Cost |
| Gains |
| Losses |
| Value | ||||
December 31, 2019 | | | | | | | | | | | | |
Residential government-sponsored mortgage-backed securities | | $ | 48,540 | | $ | 455 | | $ | (16) | | $ | 48,979 |
Obligations of states and political subdivisions | |
| 17,041 | |
| 541 | |
| — | |
| 17,582 |
Corporate securities | |
| 2,004 | |
| 8 | |
| — | |
| 2,012 |
Trust preferred securities | |
| 2,530 | |
| 283 | |
| (245) | |
| 2,568 |
Residential government-sponsored collateralized mortgage obligations | |
| 36,511 | |
| 217 | |
| (39) | |
| 36,689 |
Government-sponsored agency securities | |
| 14,823 | |
| 47 | |
| (48) | |
| 14,822 |
Agency commercial mortgage-backed securities | |
| 27,557 | |
| 192 | |
| (18) | |
| 27,731 |
SBA pool securities | |
| 14,622 | |
| 11 | |
| (196) | |
| 14,437 |
Total | | $ | 163,628 | | $ | 1,754 | | $ | (562) | | $ | 164,820 |
| | | | | | | | | | | | |
| | Amortized | | Gross Unrealized | | Fair | ||||||
|
| Cost |
| Gains |
| Losses |
| Value | ||||
December 31, 2018 | | | | | | | | | | | | |
Residential government-sponsored mortgage-backed securities | | $ | 27,945 | | $ | — | | $ | (643) | | $ | 27,302 |
Obligations of states and political subdivisions | | | 18,305 | | | 30 | | | (280) | | | 18,055 |
Corporate securities | | | 2,008 | | | 1 | | | (1) | | | 2,008 |
Trust preferred securities | | | 2,589 | | | 356 | | | (304) | | | 2,641 |
Residential government-sponsored collateralized mortgage obligations | | | 44,095 | | | 3 | | | (1,041) | | | 43,057 |
Government-sponsored agency securities | | | 3,247 | | | — | | | (122) | | | 3,125 |
Agency commercial mortgage-backed securities | | | 28,069 | | | — | | | (765) | | | 27,304 |
SBA pool securities | | | 20,183 | | | 10 | | | (308) | | | 19,885 |
Total | | $ | 146,441 | | $ | 400 | | $ | (3,464) | | $ | 143,377 |
The amortized cost, unrecognized gains and losses, and fair value of investment securities held to maturity were as follows (in thousands):
| | | | | | | | | | | | |
| | Amortized | | Gross Unrecognized | | Fair | ||||||
|
| Cost |
| Gains |
| Losses |
| Value | ||||
December 31, 2019 | | | | | | | | | | | | |
Residential government-sponsored mortgage-backed securities | | $ | 22,925 | | $ | 62 | | $ | (52) | | $ | 22,935 |
Obligations of states and political subdivisions | |
| 15,071 |
| | 165 |
| | (1) | |
| 15,235 |
Trust preferred securities | |
| 1,938 |
| | 99 |
| | (2) | |
| 2,035 |
Residential government-sponsored collateralized mortgage obligations | |
| 3,128 |
| | 10 |
| | (9) | |
| 3,129 |
Government-sponsored agency securities | |
| 29,386 |
| | 108 |
| | (162) | |
| 29,332 |
Total | | $ | 72,448 | | $ | 444 | | $ | (226) | | $ | 72,666 |
| December 31, 2017 | | | Amortized Cost | | | Gross Unrecognized | | | Fair Value | | |||||||||||||||
| | Gains | | | Losses | | ||||||||||||||||||||
| Residential government-sponsored mortgage-backed securities | | | | $ | 11,500 | | | | | $ | 23 | | | | | $ | (77) | | | | | $ | 11,446 | | |
| Obligations of states and political subdivisions | | | | | 22,830 | | | | | | 169 | | | | | | (56) | | | | | | 22,943 | | |
| Trust preferred securities | | | | | 3,205 | | | | | | 165 | | | | | | (17) | | | | | | 3,353 | | |
| Residential government-sponsored collateralized mortgage obligations | | | | | 8,727 | | | | | | — | | | | | | (99) | | | | | | 8,628 | | |
| Government-sponsored agency securities | | | | | 52,650 | | | | | | 25 | | | | | | (1,448) | | | | | | 51,227 | | |
| | | | | $ | 98,912 | | | | | $ | 382 | | | | | $ | (1,697) | | | | | $ | 97,597 | | |
| | |||||||||||||||||||||||||
| December 31, 2016 | | | Amortized Cost | | | Gross Unrecognized | | | Fair Value | | |||||||||||||||
| | Gains | | | Losses | | ||||||||||||||||||||
| Residential government-sponsored mortgage-backed securities | | | | $ | 18,594 | | | | | $ | 308 | | | | | $ | (118) | | | | | $ | 18,784 | | |
| Obligations of states and political subdivisions | | | | | 12,706 | | | | | | 53 | | | | | | (162) | | | | | | 12,597 | | |
| Trust preferred securities | | | | | 3,654 | | | | | | — | | | | | | (146) | | | | | | 3,508 | | |
| Residential government-sponsored collateralized mortgage obligations | | | | | 2,371 | | | | | | — | | | | | | (54) | | | | | | 2,317 | | |
| Government-sponsored agency securities | | | | | 47,975 | | | | | | 28 | | | | | | (1,865) | | | | | | 46,138 | | |
| | | | | $ | 85,300 | | | | | $ | 389 | | | | | $ | (2,345) | | | | | $ | 83,344 | | |
| | |||||||||||||||||||||||||
84
| | | | | | | | | | | | |
| | Amortized | | Gross Unrecognized | | Fair | ||||||
|
| Cost |
| Gains |
| Losses |
| Value | ||||
December 31, 2018 | | | | | | | | | | | | |
Residential government-sponsored mortgage-backed securities | | $ | 9,699 | | $ | 4 | | $ | (230) | | $ | 9,473 |
Obligations of states and political subdivisions |
| | 21,496 |
| | 85 |
| | (147) | |
| 21,434 |
Trust preferred securities |
| | 2,610 |
| | 150 |
| | (1) | |
| 2,759 |
Residential government-sponsored collateralized mortgage obligations |
| | 6,001 |
| | — |
| | (91) | |
| 5,910 |
Government-sponsored agency securities |
| | 52,656 |
| | — |
| | (3,123) | |
| 49,533 |
Total | | $ | 92,462 | | $ | 239 | | $ | (3,592) | | $ | 89,109 |
During 2017, as part2019, $45.1 million and $15.3 million, respectively, of ouravailable for sale investment securities portfolio restructuring, $3.2 million of odd-lot residential government-sponsored mortgage-backed securities and $1.3 million of odd-lot residential government-sponsored collateralized mortgage obligations were sold. In addition, $5.7 million of callable agencyheld to maturity investment securities were called during 2017. We recognized $257 thousand of gross gains on sales ofpurchased. No investment securities and $2 thousand of gross losses on sales ofwere sold during 2019. No investment securities were purchased or sold during 2017.
The fair value and carrying amount, if different, of debt investment securities as of December 31, 2017,2019, by contractual maturity were as follows (in thousands). Investment securities not due at a single maturity date are shown separately.
| | | | Available for Sale | | | Held to Maturity | |||||||||||||||||
| | | | Amortized Cost | | | Fair Value | | | Amortized Cost | | | Fair Value | |||||||||||
| Due in one to five years | �� | | | $ | 1,932 | | | | | $ | 1,911 | | | | | $ | 1,895 | | | | | $ | 1,892 |
| Due in five to ten years | | | | | 6,886 | | | | | | 6,925 | | | | | | 23,033 | | | | | | 22,616 |
| Due after ten years | | | | | 17,613 | | | | | | 17,520 | | | | | | 53,757 | | | | | | 53,015 |
| Residential government-sponsored mortgage-backed securities | | | | | 31,145 | | | | | | 30,864 | | | | | | 11,500 | | | | | | 11,446 |
| Residential government-sponsored collateralized mortgage obligations | | | | | 51,521 | | | | | | 50,766 | | | | | | 8,727 | | | | | | 8,628 |
| Agency commercial mortgage-backed securities | | | | | 28,263 | | | | | | 27,898 | | | | | | — | | | | | | — |
| SBA pool securities | | | | | 24,829 | | | | | | 24,789 | | | | | | — | | | | | | — |
| Total | | | | $ | 162,189 | | | | | $ | 160,673 | | | | | $ | 98,912 | | | | | $ | 97,597 |
| | |||||||||||||||||||||||
| | | | | | | | | | | | |
| | Available for Sale | | Held to Maturity | ||||||||
|
| Amortized |
| | |
| Amortized |
| | | ||
| | Cost | | Fair Value | | Cost | | Fair Value | ||||
Due in one to five years | | $ | 2,327 | | $ | 2,358 | | $ | 2,731 | | $ | 2,804 |
Due in five to ten years | |
| 12,402 | |
| 12,547 | |
| 12,241 | |
| 12,274 |
Due after ten years | |
| 21,669 | |
| 22,079 | |
| 31,423 | |
| 31,524 |
Residential government-sponsored mortgage-backed securities | |
| 48,540 | |
| 48,979 | |
| 22,925 | |
| 22,935 |
Residential government-sponsored collateralized mortgage obligations | |
| 36,511 | |
| 36,689 | |
| 3,128 | |
| 3,129 |
Agency commercial mortgage-backed securities | |
| 27,557 | |
| 27,731 | |
| — | |
| — |
SBA pool securities | |
| 14,622 | |
| 14,437 | |
| — | |
| — |
Total | | $ | 163,628 | | $ | 164,820 | | $ | 72,448 | | $ | 72,666 |
Investment securities with a carrying amount of approximately $173.4$120.5 million and $73.9$165.7 million at December 31, 20172019 and 2016,2018, respectively, were pledged to secure public deposits, certain other deposits, a line of credit for advances from the FHLB of Atlanta, and repurchase agreements.
Southern National monitors the portfolio for indicators of OTTI. At December 31, 20172019 and 2016,2018, certain investment securities’ fair values were below cost. As outlined in the tabletables below, there were 15259 investment securities with fair values totaling approximately $196.9$75.1 million in the portfolio with the carrying value exceeding the estimated fair value that are considered temporarily impaired at December 31, 2017.2019. Because the decline in fair value is attributable to changes in interest rates and market illiquidity, and not credit quality, and because we do not have the intent to sell these investment securities and it is likely that we will not be required to sell the investment securities before their anticipated recovery, management does not consider these investment securities to be other than temporarily impaired as of December 31, 2017. 2019.
85
The following tables present information regarding investment securities in a continuous unrealized loss position as of December 31, 20172019 and 20162018 by duration of time in a loss position (in thousands):
| | | | | | | | | | | | | | | | | | |
December 31, 2019 | | Less than 12 months | | 12 Months or More | | Total | ||||||||||||
|
| Fair |
| Unrealized |
| Fair |
| Unrealized |
| Fair |
| Unrealized | ||||||
Available for Sale | | value | | Losses | | value | | Losses | | value | | Losses | ||||||
Residential government-sponsored mortgage-backed securities | | $ | 2,686 | | $ | (7) | | $ | 1,758 | | $ | (9) | | $ | 4,444 | | $ | (16) |
Trust preferred securities | |
| — | |
| — | |
| 795 | |
| (245) | |
| 795 | |
| (245) |
Residential government-sponsored collateralized mortgage obligations | |
| 4,253 | |
| (25) | |
| 3,133 | |
| (14) | |
| 7,386 | |
| (39) |
Government-sponsored agency securities | |
| 4,924 | |
| (48) | |
| — | |
| — | |
| 4,924 | |
| (48) |
Agency commercial mortgage-backed securities | |
| 2,833 | |
| (6) | |
| 3,126 | |
| (12) | |
| 5,959 | |
| (18) |
SBA pool securities | |
| 1,148 | |
| (2) | |
| 9,420 | |
| (194) | |
| 10,568 | |
| (196) |
Total | | $ | 15,844 | | $ | (88) | | $ | 18,232 | | $ | (474) | | $ | 34,076 | | $ | (562) |
| | | | | | | | | | | | | | | | | | |
December 31, 2019 | | Less than 12 months | | 12 Months or More | | Total | ||||||||||||
|
| Fair |
| Unrecognized |
| Fair |
| Unrecognized |
| Fair |
| Unrecognized | ||||||
Held to Maturity | | value | | Losses | | value | | Losses | | value | | Losses | ||||||
Residential government-sponsored mortgage-backed securities | | $ | 14,978 | | $ | (41) | | $ | 1,402 | | $ | (11) | | $ | 16,380 | | $ | (52) |
Obligations of states and political subdivisions | |
| 2,011 | |
| (1) | |
| — | |
| — | |
| 2,011 | |
| (1) |
Trust preferred securities | |
| — | |
| — | |
| 53 | |
| (2) | |
| 53 | |
| (2) |
Residential government-sponsored collateralized mortgage obligations | |
| 1,162 | |
| (3) | |
| 571 | |
| (6) | |
| 1,733 | |
| (9) |
Government-sponsored agency securities | |
| — | |
| — | |
| 20,833 | |
| (162) | |
| 20,833 | |
| (162) |
Total | | $ | 18,151 | | $ | (45) | | $ | 22,859 | | $ | (181) | | $ | 41,010 | | $ | (226) |
| | | | | | | | | | | | | | | | | | |
December 31, 2018 | | Less than 12 months | | 12 Months or More | | Total | ||||||||||||
|
| Fair |
| Unrealized |
| Fair |
| Unrealized |
| Fair |
| Unrealized | ||||||
Available for Sale | | value | | Losses | | value | | Losses | | value | | Losses | ||||||
Residential government-sponsored mortgage-backed securities | | $ | 393 | | $ | (5) | | $ | 26,910 | | $ | (638) | | $ | 27,303 | | $ | (643) |
Obligations of states and political subdivisions | | | 2,220 | |
| (78) | |
| 13,385 | |
| (202) | |
| 15,605 | |
| (280) |
Corporate securities | | | 1,008 | | | (1) | | | — | | | — | | | 1,008 | | | (1) |
Trust preferred securities | |
| — | |
| — | |
| 795 | |
| (304) | |
| 795 | |
| (304) |
Residential government-sponsored collateralized mortgage obligations | | | — | |
| — | |
| 42,598 | |
| (1,041) | |
| 42,598 | |
| (1,041) |
Government-sponsored agency securities | | | — | |
| — | |
| 3,125 | |
| (122) | |
| 3,125 | |
| (122) |
Agency commercial mortgage-backed securities | | | — | |
| — | |
| 27,304 | |
| (765) | |
| 27,304 | |
| (765) |
SBA pool securities | | | 6,009 | |
| (70) | |
| 10,546 | |
| (238) | |
| 16,555 | |
| (308) |
Total | | $ | 9,630 | | $ | (154) | | $ | 124,663 | | $ | (3,310) | | $ | 134,293 | | $ | (3,464) |
| | | | | | | | | | | | | | | | | | |
December 31, 2018 | | Less than 12 months | | 12 Months or More | | Total | ||||||||||||
|
| Fair |
| Unrecognized |
| Fair |
| Unrecognized |
| Fair |
| Unrecognized | ||||||
Held to Maturity | | value | | Losses | | value | | Losses | | value | | Losses | ||||||
Residential government-sponsored mortgage-backed securities | | $ | — | | $ | — | | $ | 8,935 | | $ | (230) | | $ | 8,935 | | $ | (230) |
Obligations of states and political subdivisions | |
| 3,273 | |
| (10) | |
| 7,187 | |
| (137) | |
| 10,460 | |
| (147) |
Trust preferred securities | |
| — | |
| — | |
| 60 | |
| (1) | |
| 60 | |
| (1) |
Residential government-sponsored collateralized mortgage obligations | |
| — | |
| — | |
| 5,910 | |
| (91) | |
| 5,910 | |
| (91) |
Government-sponsored agency securities | |
| — | |
| — | |
| 49,532 | |
| (3,123) | |
| 49,532 | |
| (3,123) |
Total | | $ | 3,273 | | $ | (10) | | $ | 71,624 | | $ | (3,582) | | $ | 74,897 | | $ | (3,592) |
86
| | | | Less than 12 months | | | 12 Months or More | | | Total | | |||||||||||||||||||||||||||
| Available for Sale | | | Fair value | | | Unrealized Losses | | | Fair value | | | Unrealized Losses | | | Fair value | | | Unrealized Losses | | ||||||||||||||||||
| Residential government-sponsored mortgage-backed securities | | | | $ | 30,336 | | | | | $ | (284) | | | | | $ | — | | | | | $ | — | | | | | $ | 30,336 | | | | | $ | (284) | | |
| Obligations of states and political subdivisions | | | | | 4,642 | | | | | | (41) | | | | | | — | | | | | | — | | | | | | 4,642 | | | | | | (41) | | |
| Trust preferred securities | | | | | 1,473 | | | | | | (18) | | | | | | 915 | | | | | | (184) | | | | | | 2,388 | | | | | | (202) | | |
| Residential government-sponsored collateralized mortgage obligations | | | | | 50,555 | | | | | | (756) | | | | | | — | | | | | | — | | | | | | 50,555 | | | | | | (756) | | |
| Government-sponsored agency securities | | | | | 1,726 | | | | | | (21) | | | | | | — | | | | | | — | | | | | | 1,726 | | | | | | (21) | | |
| Agency commercial mortgage-backed securities | | | | | 27,898 | | | | | | (365) | | | | | | — | | | | | | — | | | | | | 27,898 | | | | | | (365) | | |
| SBA pool securities | | | | | 15,156 | | | | | | (108) | | | | | | — | | | | | | — | | | | | | 15,156 | | | | | | (108) | | |
| | | | | $ | 131,786 | | | | | $ | (1,593) | | | | | $ | 915 | | | | | $ | (184) | | | | | $ | 132,701 | | | | | $ | (1,777) | | |
| | |||||||||||||||||||||||||||||||||||||
| | | | Less than 12 months | | | 12 Months or More | | | Total | | |||||||||||||||||||||||||||
| Held to Maturity | | | Fair value | | | Unrecognized Losses | | | Fair value | | | Unrecognized Losses | | | Fair value | | | Unrecognized Losses | | ||||||||||||||||||
| Residential government-sponsored mortgage-backed securities | | | | $ | 3,409 | | | | | $ | (26) | | | | | $ | 2,986 | | | | | $ | (51) | | | | | $ | 6,395 | | | | | $ | (77) | | |
| Obligations of states and political subdivisions | | | | | 7,918 | | | | | | (34) | | | | | | 1,782 | | | | | | (22) | | | | | | 9,700 | | | | | | (56) | | |
| Trust preferred securities | | | | | — | | | | | | — | | | | | | 240 | | | | | | (17) | | | | | | 240 | | | | | | (17) | | |
| Residential government-sponsored collateralized mortgage obligations | | | | | 7,112 | | | | | | (46) | | | | | | 1,516 | | | | | | (53) | | | | | | 8,628 | | | | | | (99) | | |
| Government-sponsored agency securities | | | | | 1,719 | | | | | | (2) | | | | | | 37,532 | | | | | | (1,446) | | | | | | 39,251 | | | | | | (1,448) | | |
| | | | | $ | 20,158 | | | | | $ | (108) | | | | | $ | 44,056 | | | | | $ | (1,589) | | | | | $ | 64,214 | | | | | $ | (1,697) | | |
| | |||||||||||||||||||||||||||||||||||||
| | | | Less than 12 months | | | 12 Months or More | | | Total | | |||||||||||||||||||||||||||
| Available for Sale | | | Fair value | | | Unrealized Losses | | | Fair value | | | Unrealized Losses | | | Fair value | | | Unrealized Losses | | ||||||||||||||||||
| Obligations of states and political subdivisions | | | | $ | 1,706 | | | | | $ | (30) | | | | | $ | — | | | | | $ | — | | | | | $ | 1,706 | | | | | $ | (30) | | |
| Trust preferred securities | | | | | — | | | | | | — | | | | | | 1,658 | | | | | | (931) | | | | | | 1,658 | | | | | | (931) | | |
| | | | | $ | 1,706 | | | | | $ | (30) | | | | | $ | 1,658 | | | | | $ | (931) | | | | | $ | 3,364 | | | | | $ | (961) | | |
| | |||||||||||||||||||||||||||||||||||||
| | | | Less than 12 months | | | 12 Months or More | | | Total | | |||||||||||||||||||||||||||
| Held to Maturity | | | Fair value | | | Unrecognized Losses | | | Fair value | | | Unrecognized Losses | | | Fair value | | | Unrecognized Losses | | ||||||||||||||||||
| Residential government-sponsored mortgage-backed securities | | | | $ | 10,238 | | | | | $ | (110) | | | | | $ | 457 | | | | | $ | (8) | | | | | $ | 10,695 | | | | | $ | (118) | | |
| Obligations of states and political subdivisions | | | | | 3,578 | | | | | | (98) | | | | | | 1,065 | | | | | | (64) | | | | | | 4,643 | | | | | | (162) | | |
| Trust preferred securities | | | | | — | | | | | | — | | | | | | 3,508 | | | | | | (146) | | | | | | 3,508 | | | | | | (146) | | |
| Residential government-sponsored collateralized mortgage obligations | | | | | 1,346 | | | | | | (27) | | | | | | 971 | | | | | | (27) | | | | | | 2,317 | | | | | | (54) | | |
| Government-sponsored agency securities | | | | | 41,110 | | | | | | (1,865) | | | | | | — | | | | | | — | | | | | | 41,110 | | | | | | (1,865) | | |
| | | | | $ | 56,272 | | | | | $ | (2,100) | | | | | $ | 6,001 | | | | | $ | (245) | | | | | $ | 62,273 | | | | | $ | (2,345) | | |
| | |||||||||||||||||||||||||||||||||||||
As of December 31, 2017,2019, we owned pooled trust preferred investment securities as follows (in thousands):
| Security | | | Tranche Level | | | Ratings When Purchased | | | Current Ratings | | | Par Value | | | Book Value | | | Estimated Fair Value | | | % of Current Defaults and Deferrals to Total Collateral | | | Previously Recognized Cumulative Other Comprehensive Loss(1) | | |||||||||||||||||||||
| | Moody’s | | | Fitch | | | Moody’s | | | Fitch | | |||||||||||||||||||||||||||||||||||
| Held to Maturity | | | | | | | | | | | | | | | | | | | | | | | | | | | | | | | | | | | | | | | | | | | | | | |
| ALESCO VII A1B | | | Senior | | | Aaa | | | AAA | | | Aa2 | | | A | | | | $ | 3,192 | | | | | $ | 2,948 | | | | | $ | 3,113 | | | | | | 18% | | | | | $ | 226 | | |
| MMCF III B | | | Senior Sub | | | A3 | | | A- | | | Ba1 | | | BBB | | | | | 261 | | | | | | 257 | | | | | | 240 | | | | | | 32% | | | | | | 4 | | |
| | | | | | | | | | | | | | | | | | | | $ | 3,453 | | | | | $ | 3,205 | | | | | $ | 3,353 | | | | | | | | | | | $ | 230 | | |
| Available for Sale Other Than Temporarily Impaired: | | | | | | | | | | | | | | | | | | | | | | | | | | | | | | | | | | | | | | | | | | Cumulative OTTI Related to Credit Loss(2) | | |||
| TPREF FUNDING II | | | Mezzanine | | | A1 | | | A- | | | Caa3 | | | C | | | | $ | 1,500 | | | | | $ | 1,099 | | | | | $ | 915 | | | | | | 29% | | | | | $ | 400 | | |
| ALESCO V C1 | | | Mezzanine | | | A2 | | | A | | | Caa1 | | | C | | | | | 2,150 | | | | | | 1,491 | | | | | | 1,473 | | | | | | 14% | | | | | | 660 | | |
| | | | | | | | | | | | | | | | | | | | $ | 3,650 | | | | | $ | 2,590 | | | | | $ | 2,388 | | | | | | | | | | | $ | 1,060 | | |
| Total | | | | | | | | | | | | | | | | | | | $ | 7,103 | | | | | $ | 5,795 | | | | | $ | 5,741 | | | | | | | | | | | | | | |
| | ||||||||||||||||||||||||||||||||||||||||||||||
| | | | | | | | | | | | | | | | | | | | | | | | |
| | | | | | | | | | | | | | | | | | | | | % of | | Previously | |
| | | | | | | | | | | | | | | | | | | | | Current | | Recognized | |
| | | | | | | | | | | | | | | | | | | | | Defaults and | | Cumulative | |
| | | | Ratings When | | | | | | | | Estimated | | Deferrals to | | Other | ||||||||
| | Tranche | | Purchased | | Current Ratings | | Par | | Book | | Fair | | Total | | Comprehensive | ||||||||
Security |
| Level |
| Moody's |
| Fitch |
| Moody's |
| Fitch |
| Value |
| Value |
| Value |
| Collateral |
| Loss (1) | ||||
Held to Maturity | | | | | | | | | | | | | | | | | | | | | | | | |
ALESCO VII A1B |
| Senior |
| Aaa |
| AAA |
| Aa1 |
| AA | | $ | 2,019 | | $ | 1,882 | | $ | 1,982 |
| 17 | % | $ | 219 |
MMCF III B |
| Senior Sub |
| A3 |
| A- |
| Ba1 |
| WD | |
| 57 | |
| 56 | |
| 53 |
| 45 | % |
| 4 |
|
|
|
|
|
|
|
|
|
|
| | $ | 2,076 | | $ | 1,938 | | $ | 2,035 |
|
| | $ | 223 |
| | | | | | | | | | | | | | | | | | | | | | | | |
Available for Sale |
|
|
|
|
|
|
|
|
|
| |
|
| |
|
| |
|
|
|
| | Cumulative OTTI | |
Other Than |
|
|
|
|
|
|
|
|
|
| |
|
| |
|
| |
|
|
|
| | Related to | |
Temporarily Impaired: |
|
|
|
|
|
|
|
|
|
| |
|
| |
|
| |
|
|
|
| | Credit Loss (2) | |
TPREF FUNDING II |
| Mezzanine |
| A1 |
| A- |
| Caa3 |
| WD | | $ | 1,500 | | $ | 1,040 | | $ | 795 |
| 32 | % | $ | 400 |
ALESCO V C1 |
| Mezzanine |
| A2 |
| A |
| Caa1 |
| C | |
| 2,150 | | | 1,490 | | | 1,773 |
| 15 | % |
| 660 |
|
|
|
|
|
|
|
|
|
|
| | $ | 3,650 | | $ | 2,530 | | $ | 2,568 |
|
| | $ | 1,060 |
| | | | | | | | | | | | | | | | | | | | | | | | |
Total |
|
|
|
|
|
|
|
|
|
| | $ | 5,726 | | $ | 4,468 | | $ | 4,603 |
|
| |
|
|
| (1) | Pre-tax, and represents unrealized losses at date of transfer from available for sale to held to maturity, net of accretion |
| (2) | Pre-tax |
Each of these investment securities has been evaluated for OTTI. In performing a detailed cash flow analysis of each investment security, Sonabank works with independent third parties to estimate expected cash flows and assist with the evaluation of OTTI. The cash flow analyses performed included the following assumptions:
| ● | 0.5% of the remaining performing collateral will default or defer per annum. |
| ● | Recoveries of 9% with a two-year lag on all defaults and deferrals. |
| ● | No prepayments for 10 years and then 1% per annum for the remaining life of the investment security. |
| ● | Our investment securities have been modeled using the above assumptions by independent third parties using the forward London Inter-bank Offered Rate (“LIBOR”) curve to discount projected cash flows to present values. |
The amount of the remaining performing collateral will default or defer per annum.
| | | | 2017 | | | 2016 | | | 2015 | | |||||||||
| Amount of cumulative other than temporary impairment related to credit loss prior to January 1 | | | | $ | 1,060 | | | | | $ | 1,060 | | | | | $ | 8,949 | | |
| Reductions due to sales of investment securities for which an other than temporary impairment was previously recognized | | | | | — | | | | | | — | | | | | | (7,889) | | |
| Amount of cumulative other than temporary impairment related to credit loss as of December 31 | | | | $ | 1,060 | | | | | $ | 1,060 | | | | | $ | 1,060 | | |
| | |||||||||||||||||||
Changes in accumulated other comprehensive (loss) by component for the years ended December 31, 2017, 20162019, 2018 and 20152017 are shown in the table below. All amounts are net of tax (in thousands).
| | | | | | | | | |
| | Unrealized Holding | | | | | | | |
| | Gains (Losses) on | | Held to Maturity | | | | ||
For the year ended December 31, 2019 |
| Available for Sale |
| Securities |
| Total | |||
Beginning balance | | $ | (2,419) | | $ | (170) | | $ | (2,589) |
Current period other comprehensive income | |
| 3,362 | |
| 10 | |
| 3,372 |
Ending balance | | $ | 943 | | $ | (160) | | $ | 783 |
| For the year ended December 31, 2017 | | | Unrealized Holding (Losses) on Available for Sale Securities | | | Held to Maturity Securities | | | Total | | |||||||||
| Beginning balance | | | | $ | (627) | | | | | $ | (162) | | | | | $ | (789) | | |
| Other comprehensive (loss) income before reclassifications | | | | | (372) | | | | | | (246) | | | | | | (618) | | |
| Amounts reclassified from accumulated other comprehensive income | | | | | — | | | | | | 255 | | | | | | 255 | | |
| Net current-period other comprehensive (loss) income | | | | | (372) | | | | | | 9 | | | | | | (363) | | |
| Ending balance | | | | $ | (999) | | | | | $ | (153) | | | | | $ | (1,152) | | |
| | |||||||||||||||||||
| For the year ended December 31, 2016 | | | Unrealized Holding (Losses) on Available for Sale Securities | | | Held to Maturity Securities | | | Total | | |||||||||
| Beginning balance | | | | $ | (440) | | | | | $ | (170) | | | | | $ | (610) | | |
| Other comprehensive (loss) income before reclassifications | | | | | (187) | | | | | | 8 | | | | | | (179) | | |
| Net current-period other comprehensive (loss) income | | | | | (187) | | | | | | 8 | | | | | | (179) | | |
| Ending balance | | | | $ | (627) | | | | | $ | (162) | | | | | $ | (789) | | |
| | |||||||||||||||||||
87
| For the year ended December 31, 2015 | | | Unrealized Holding (Losses) on Available for Sale Securities | | | Held to Maturity Securities | | | Total | | |||||||||
| Beginning balance | | | | $ | (6) | | | | | $ | (3,014) | | | | | $ | (3,020) | | |
| Other comprehensive (loss) income before reclassifications | | | | | (434) | | | | | | 21 | | | | | | (413) | | |
| Amounts reclassified from accumulated other comprehensive income | | | | | — | | | | | | 2,823 | | | | | | 2,823 | | |
| Net current-period other comprehensive (loss) income | | | | | (434) | | | | | | 2,844 | | | | | | 2,410 | | |
| Ending balance | | | | $ | (440) | | | | | $ | (170) | | | | | $ | (610) | | |
| | |||||||||||||||||||
| | | | | | | | | |
| | Unrealized Holding | | | | | | | |
| | Losses on | | Held to Maturity | | | | ||
For the year ended December 31, 2018 | | Available for Sale | | Securities | | Total | |||
Beginning balance | | $ | (999) | | $ | (153) | | $ | (1,152) |
Amounts reclassified from accumulated other comprehensive loss due to the adoption of ASU 2018-02 | |
| (199) | |
| (30) | |
| (229) |
Subtotal | | | (1,198) | | | (183) | | | (1,381) |
Current period other comprehensive (loss) income | |
| (1,221) | |
| 13 | |
| (1,208) |
Ending balance | | $ | (2,419) | | $ | (170) | | $ | (2,589) |
| | | | | | | | | |
| | Unrealized Holding | | | | | | | |
| | Losses on | | Held to Maturity | | | | ||
For the year ended December 31, 2017 | | Available for Sale | | Securities | | Total | |||
Beginning balance | | $ | (627) | | $ | (162) | | $ | (789) |
Other comprehensive loss before reclassifications | |
| (372) | |
| (246) | |
| (618) |
Amounts reclassified from accumulated other comprehensive loss | |
| — | |
| 255 | |
| 255 |
Net current period other comprehensive income (loss) | | | (372) | | | 9 | | | (363) |
Ending balance | | $ | (999) | | $ | (153) | | $ | (1,152) |
3. LOANS AND ALLOWANCE FOR LOAN LOSSES
Loans, net of unearned income,deferred fees, consist of the following at year end (in thousands):
| | | | December 31, 2017 | | | December 31, 2016 | | ||||||
| Loans secured by real estate: | | | | | | | | | | | | | |
| Commercial real estate – owner occupied | | | | $ | 401,847 | | | | | $ | 154,807 | | |
| Commercial real estate – non-owner occupied | | | | | 440,700 | | | | | | 279,634 | | |
| Secured by farmland | | | | | 23,038 | | | | | | 541 | | |
| Construction and land development | | | | | 197,972 | | | | | | 91,067 | | |
Residential 1-4 family(1) | | | | | 483,006 | | | | | | 230,810 | | |
| Multi-family residential | | | | | 70,892 | | | | | | 30,021 | | |
Home equity lines of credit(1) | | | | | 152,829 | | | | | | 29,203 | | |
| Total real estate loans | | | | | 1,770,284 | | | | | | 816,083 | | |
| Commercial loans | | | | | 253,258 | | | | | | 115,365 | | |
| Consumer loans | | | | | 39,374 | | | | | | 856 | | |
| Gross loans | | | | | 2,062,916 | | | | | | 932,304 | | |
| Less deferred fees on loans | | | | | (588) | | | | | | (1,889) | | |
| Loans, net of deferred fees | | | | $ | 2,062,328 | | | | | $ | 930,415 | | |
| | |||||||||||||
| | | | | | |
|
| December 31, 2019 |
| December 31, 2018 | ||
Loans secured by real estate: | | | |
| |
|
Commercial real estate - owner occupied | | $ | 414,479 | | $ | 407,031 |
Commercial real estate - non-owner occupied | |
| 559,195 | |
| 540,698 |
Secured by farmland | |
| 17,622 | |
| 20,966 |
Construction and land loans | |
| 150,750 | |
| 146,654 |
Residential 1-4 family (1) | |
| 604,777 | |
| 565,083 |
Multi- family residential | |
| 82,055 | |
| 82,516 |
Home equity lines of credit (1) | |
| 109,006 | |
| 128,225 |
Total real estate loans | |
| 1,937,884 | |
| 1,891,173 |
| | | | | | |
Commercial loans | |
| 221,447 | |
| 255,441 |
Consumer loans | |
| 26,304 | |
| 32,347 |
Subtotal | |
| 2,185,635 | |
| 2,178,961 |
Plus (less) deferred costs (fees) on loans | |
| 412 | |
| (137) |
Loans, net of deferred fees | | $ | 2,186,047 | | $ | 2,178,824 |
| (1) | Includes $13.5 million and $18.3 million of loans as of December 31, 2019 and 2018, respectively, acquired in the GAB transaction covered under an FDIC loss-share agreement. The agreement covering single family loans expired on December 31, 2019. |
In 2019, $33.9 million of commercial loans aswere reclassified into loans secured by real estate, upon review and validation of December 31, 2017collateral and 2016, respectively, acquired in the GAB transaction covered under an FDIC loss-share agreement. The agreement covering single family loans expires in December 2019.
Accounting policy related to the allowance for loan losses is considered a critical policy given the level of estimation, judgment, and uncertainty in the levels of the allowance required to account for the inherent probable losses in the loan portfolio and the material effect such estimation, judgment, and uncertainty can have on the consolidated financial results.
As part of the GAB acquisition, the Bank and the FDIC entered into loss sharing agreements on approximately $143.4 million (contractual basis) of GAB’s assets. There were two2 agreements with the FDIC, one for single family loans which iswas a 10-year agreement expiring inwhich expired on December 31, 2019, and one for non-single family (commercial) assets which was a 5-year agreement which expired inon December 31, 2014. The Bank will shareshared in the losses on the loans and foreclosed loan collateral with the FDIC as specified in the loss sharing agreements;agreement related to single family loans; we refer
88
referred to these assets collectively as “covered assets.” Loans that arewere not covered in the loss sharing agreement arewere referred to as “non-covered loans”. As ofloans.” Covered loans totaled $13.5 million and $18.3 million at December 31, 2017, non-covered loans included $3.9 million of loans acquired in the GAB acquisition, $19.2 million of loans acquired in the HarVest acquisition, $36.3 million acquired in the Prince Georges Federal Savings Bank (“PGFSB”) acquisition,2019 and $942.8 million acquired in the EVBS acquisition. Covered loans are now considered an immaterial part of our overall loan portfolio and have been blended together with our non-covered loans for presentation purposes.
Accretable discount on the acquired performing loans in the EVBS, GAB, HarVest, and PGFSB acquisitions totaled $17.5$11.2 million and $6.5$15.1 million at December 31, 2019 and 2018, respectively. Accretion associated with the acquired loans held for investment of $3.9 million, $4.5 million and $3.9 million was recognized during the twelve months ended December 31, 2019, 2018 and 2017, and 2016, respectively.
Impaired loans for the portfolio were as follows (in thousands):
| December 31, 2017 | | | Total Loans | | |||||||||||||||
| | Recorded Investment(1) | | | Unpaid Principal Balance | | | Related Allowance | | |||||||||||
| With no related allowance recorded: | | | | | | | | | | | | | | | | | | | |
| Commercial real estate – owner occupied | | | | $ | 767 | | | | | $ | 781 | | | | | $ | — | | |
Commercial real estate – non-owner occupied(2) | | | | | 766 | | | | | | 830 | | | | | | — | | |
| Construction and land development | | | | | 9,969 | | | | | | 9,984 | | | | | | — | | |
| Commercial loans | | | | | 6,035 | | | | | | 12,847 | | | | | | — | | |
Residential 1-4 family(3) | | | | | 3,160 | | | | | | 3,430 | | | | | | — | | |
| Other consumer loans | | | | | — | | | | | | — | | | | | | — | | |
| Total | | | | $ | 20,697 | | | | | $ | 27,872 | | | | | $ | — | | |
| With an allowance recorded: | | | | | | | | | | | | | | | | | | | |
| Commercial real estate – owner occupied | | | | $ | — | | | | | $ | — | | | | | $ | — | | |
Commercial real estate – non-owner occupied(2) | | | | | — | | | | | | — | | | | | | — | | |
| Construction and land development | | | | | — | | | | | | — | | | | | | — | | |
| Commercial loans | | | | | — | | | | | | — | | | | | | — | | |
Residential 1-4 family(3) | | | | | — | | | | | | — | | | | | | — | | |
| Other consumer loans | | | | | — | | | | | | — | | | | | | — | | |
| Total | | | | $ | — | | | | | $ | — | | | | | $ | — | | |
| Grand total | | | | $ | 20,697 | | | | | $ | 27,872 | | | | | $ | — | | |
| | |||||||||||||||||||
| | | | | �� | | | | |
| | Total Loans | |||||||
|
| | |
| Unpaid |
| | | |
| | Recorded | | Principal | | Related | |||
December 31, 2019 | | Investment (1) | | Balance | | Allowance | |||
With no related allowance recorded |
| |
|
| |
|
| |
|
Commercial real estate - owner occupied | | $ | 6,890 | | $ | 8,530 | | $ | — |
Commercial real estate - non-owner occupied (2) | |
| 3,120 | |
| 3,363 | |
| — |
Construction and land development | |
| 345 | |
| 747 | |
| — |
Commercial loans | |
| 5,049 | |
| 8,490 | |
| — |
Residential 1-4 family (3) | |
| 1,021 | |
| 2,719 | |
| — |
Other consumer loans | |
| — | |
| — | |
| — |
Total | | $ | 16,425 | | $ | 23,849 | | $ | — |
| | | | | | | | | |
With an allowance recorded | |
|
| |
|
| |
|
|
Commercial real estate - owner occupied | | $ | — | | $ | — | | $ | — |
Commercial real estate - non-owner occupied (2) | |
| 176 | |
| 281 | |
| 1 |
Construction and land development | |
| — | |
| — | |
| — |
Commercial loans | |
| 2,498 | | | 2,533 | | | 957 |
Residential 1-4 family (3) | |
| 2,841 | | | 3,243 | | | 92 |
Other consumer loans | |
| 39 | |
| 39 | |
| 1 |
Total | | $ | 5,554 | | $ | 6,096 | | $ | 1,051 |
Grand total | | $ | 21,979 | | $ | 29,945 | | $ | 1,051 |
| (1) | Recorded investment is after cumulative prior charge offs of $1.5 million. These loans also have aggregate SBA guarantees of $4.4 million. |
| (2) | Includes loans secured by farmland and multi-family residential loans. |
| (3) | Includes home equity lines of credit. |
89
| | | | | | | | | |
| | Total Loans | |||||||
|
| | |
| Unpaid |
| | | |
| | Recorded | | Principal | | Related | |||
December 31, 2018 | | Investment (1) | | Balance | | Allowance | |||
With no related allowance recorded |
| |
|
| |
|
| |
|
Commercial real estate - owner occupied | | $ | 2,795 | | $ | 4,777 | | $ | — |
Commercial real estate - non-owner occupied (2) | |
| 171 | |
| 333 | |
| — |
Construction and land development | |
| — | |
| 336 | |
| — |
Commercial loans | |
| 3,450 | |
| 6,013 | |
| — |
Residential 1-4 family (3) | |
| 1,591 | |
| 5,911 | |
| — |
Other consumer loans | |
| — | |
| — | |
| — |
Total | | $ | 8,007 | | $ | 17,370 | | $ | — |
| | | | | | | | | |
With an allowance recorded | |
|
| |
|
| |
|
|
Commercial real estate - owner occupied | | $ | — | | $ | — | | $ | — |
Commercial real estate - non-owner occupied (2) | |
| — | |
| — | |
| — |
Construction and land development | |
| — | |
| — | |
| — |
Commercial loans | |
| 2,626 | |
| 3,276 | |
| 612 |
Residential 1-4 family (3) | |
| 1,429 | |
| 1,476 | |
| 6 |
Other consumer loans | |
| — | |
| — | |
| — |
Total | | $ | 4,055 | | $ | 4,752 | | $ | 618 |
Grand total | | $ | 12,062 | | $ | 22,122 | | $ | 618 |
| (1) | Recorded investment is after cumulative prior charge offs of $1.5 million. These loans also have aggregate SBA guarantees of $3.4 million. |
| (2) | Includes loans secured by farmland and multi-family residential loans. |
| (3) | Includes home equity lines of credit. |
| December 31, 2016 | | | Total Loans | | |||||||||||||||
| | Recorded Investment(1) | | | Unpaid Principal Balance | | | Related Allowance | | |||||||||||
| With no related allowance recorded: | | | | | | | | | | | | | | | | | | | |
| Commercial real estate – owner occupied | | | | $ | 5,583 | | | | | $ | 5,592 | | | | | $ | — | | |
Commercial real estate – non-owner occupied(2) | | | | | — | | | | | | — | | | | | | — | | |
| Construction and land development | | | | | — | | | | | | — | | | | | | — | | |
| Commercial loans | | | | | 3,002 | | | | | | 3,603 | | | | | | — | | |
Residential 1-4 family(3) | | | | | 963 | | | | | | 1,113 | | | | | | — | | |
| Other consumer loans | | | | | — | | | | | | — | | | | | | — | | |
| Total | | | | $ | 9,548 | | | | | $ | 10,308 | | | | | $ | — | | |
| With an allowance recorded: | | | | | | | | | | | | | | | | | | | |
| Commercial real estate – owner occupied | | | | $ | 688 | | | | | $ | 688 | | | | | $ | 150 | | |
Commercial real estate – non-owner occupied(2) | | | | | — | | | | | | — | | | | | | — | | |
| Construction and land development | | | | | — | | | | | | — | | | | | | — | | |
| Commercial loans | | | | | 3,378 | | | | | | 5,798 | | | | | | 750 | | |
Residential 1-4 family(3) | | | | | — | | | | | | — | | | | | | — | | |
| Other consumer loans | | | | | — | | | | | | — | | | | | | — | | |
| Total | | | | $ | 4,066 | | | | | $ | 6,486 | | | | | $ | 900 | | |
| Grand total | | | | $ | 13,614 | | | | | $ | 16,794 | | | | | $ | 900 | | |
| | |||||||||||||||||||
The following tables present the average recorded investment and interest income recognized for impaired loans recognized by class of loans for the years ended December 31, 2017, 20162019, 2018 and 20152017 (in thousands):
| | | | Total Loans | | |||||||||
| For the Year Ended December 31, 2017 | | | Average Recorded Investment | | | Interest Income Recognized | | ||||||
| With no related allowance recorded: | | | | | | | | | | | | | |
| Commercial real estate – owner occupied | | | | $ | 875 | | | | | $ | 34 | | |
Commercial real estate – non-owner occupied(1) | | | | | 890 | | | | | | 56 | | |
| Construction and land development | | | | | 9,942 | | | | | | 139 | | |
| Commercial loans | | | | | 12,655 | | | | | | 485 | | |
Residential 1-4 family(2) | | | | | 3,398 | | | | | | 91 | | |
| Other consumer loans | | | | | — | | | | | | — | | |
| Total | | | | $ | 27,760 | | | | | $ | 805 | | |
| With an allowance recorded: | | | | | | | | | | | | | |
| Commercial real estate – owner occupied | | | | $ | — | | | | | $ | — | | |
Commercial real estate – non-owner occupied(1) | | | | | — | | | | | | — | | |
| Construction and land development | | | | | — | | | | | | — | | |
| Commercial loans | | | | | — | | | | | | — | | |
Residential 1-4 family(2) | | | | | — | | | | | | — | | |
| Other consumer loans | | | | | — | | | | | | — | | |
| Total | | | | $ | — | | | | | $ | — | | |
| Grand total | | | | $ | 27,760 | | | | | $ | 805 | | |
| | |||||||||||||
| | | | | | |
| | Total Loans | ||||
| | Average | | Interest | ||
| | Recorded | | Income | ||
Year Ended December 31, 2019 |
| Investment |
| Recognized | ||
With no related allowance recorded |
| |
|
| |
|
Commercial real estate - owner occupied | | $ | 7,387 | | $ | 453 |
Commercial real estate - non-owner occupied (1) | |
| 3,205 | |
| 191 |
Construction and land development | |
| 398 | |
| 57 |
Commercial loans | |
| 5,254 | |
| 214 |
Residential 1-4 family (2) | |
| 1,061 | |
| 149 |
Other consumer loans | |
| — | |
| — |
Total | | $ | 17,305 | | $ | 1,064 |
| | | | | | |
With an allowance recorded | |
|
| |
|
|
Commercial real estate - owner occupied | | $ | — | | $ | — |
Commercial real estate - non-owner occupied (1) | |
| 182 | |
| 19 |
Construction and land development | |
| — | |
| — |
Commercial loans | |
| 3,027 | | | 176 |
Residential 1-4 family (2) | |
| 2,944 | | | 111 |
Other consumer loans | |
| 39 | |
| — |
Total | | $ | 6,192 | | $ | 306 |
Grand total | | $ | 23,497 | | $ | 1,370 |
| (1) | Includes loans secured by farmland and multi-family residential loans. |
| (2) | Includes home equity lines of credit. |
90
| | | | | | |
| | Total Loans | ||||
| | Average | | Interest | ||
| | Recorded | | Income | ||
Year Ended December 31, 2018 |
| Investment |
| Recognized | ||
With no related allowance recorded |
| |
|
| |
|
Commercial real estate - owner occupied | | $ | 2,780 | | $ | 179 |
Commercial real estate - non-owner occupied (1) | |
| 169 | |
| 22 |
Construction and land development | |
| — | |
| — |
Commercial loans | |
| 3,319 | |
| 92 |
Residential 1-4 family (2) | |
| 1,582 | |
| 125 |
Other consumer loans | |
| — | |
| — |
Total | | $ | 7,850 | | $ | 418 |
| | | | | | |
With an allowance recorded | |
|
| |
|
|
Commercial real estate - owner occupied | | $ | — | | $ | — |
Commercial real estate - non-owner occupied (1) | |
| — | |
| — |
Construction and land development | |
| — | |
| — |
Commercial loans | |
| 2,530 | |
| 200 |
Residential 1-4 family (2) | |
| 1,422 | |
| 67 |
Other consumer loans | |
| — | |
| — |
Total | | $ | 3,952 | | $ | 267 |
Grand total | | $ | 11,802 | | $ | 685 |
| (1) | Includes loans secured by farmland and multi-family residential loans. |
| (2) | Includes home equity lines of credit. |
| | | | | | |
| | Total Loans | ||||
| | Average | | Interest | ||
|
| Recorded |
| Income | ||
For the Year Ended December 31, 2017 | | Investment | | Recognized | ||
With no related allowance recorded | | | | | | |
Commercial real estate - owner occupied | | $ | 875 |
| $ | 34 |
Commercial real estate - non-owner occupied (1) | |
| 890 |
|
| 56 |
Construction and land development | |
| 9,942 |
|
| 139 |
Commercial loans | |
| 12,655 |
|
| 485 |
Residential 1-4 family (2) | |
| 3,398 |
|
| 91 |
Other consumer loans | |
| — |
|
| — |
Total | | $ | 27,760 |
| $ | 805 |
| | | | | | |
With an allowance recorded | | | | | | |
Commercial real estate - owner occupied | | $ | — |
| $ | — |
Commercial real estate - non-owner occupied (1) | |
| — |
|
| — |
Construction and land development | |
| — |
|
| — |
Commercial loans | |
| — |
|
| — |
Residential 1-4 family (2) | |
| — |
|
| — |
Other consumer loans | |
| — |
|
| — |
Total | | $ | — |
| $ | — |
Grand total | | $ | 27,760 |
| $ | 805 |
| (1) | Includes loans secured by farmland and multi-family residential loans. |
| (2) | Includes home equity lines of credit. |
| For the Year Ended December 31, 2016 | | | Total Loans | | |||||||||
| | Average Recorded Investment | | | Interest Income Recognized | | ||||||||
| With no related allowance recorded: | | | | | | | | | | | | | |
| Commercial real estate – owner occupied | | | | $ | 6,454 | | | | | $ | 292 | | |
Commercial real estate – non-owner occupied(1) | | | | | 103 | | | | | | 3 | | |
| Construction and land development | | | | | — | | | | | | — | | |
| Commercial loans | | | | | 2,888 | | | | | | 54 | | |
Residential 1-4 family(2) | | | | | 988 | | | | | | 32 | | |
| Other consumer loans | | | | | — | | | | | | — | | |
| Total | | | | $ | 10,433 | | | | | $ | 381 | | |
| With an allowance recorded: | | | | | | | | | | | | | |
| Commercial real estate – owner occupied | | | | $ | 694 | | | | | $ | 31 | | |
Commercial real estate – non-owner occupied(1) | | | | | — | | | | | | — | | |
| Construction and land development | | | | | — | | | | | | — | | |
| Commercial loans | | | | | 3,402 | | | | | | 155 | | |
Residential 1-4 family(2) | | | | | — | | | | | | — | | |
| Other consumer loans | | | | | — | | | | | | — | | |
| Total | | | | $ | 4,096 | | | | | $ | 186 | | |
| Grand total | | | | $ | 14,529 | | | | | $ | 567 | | |
| | |||||||||||||
91
| For the Year Ended December 31, 2015 | | | Total Loans | | |||||||||
| | Average Recorded Investment | | | Interest Income Recognized | | ||||||||
| With no related allowance recorded: | | | | | | | | | | | | | |
| Commercial real estate – owner occupied | | | | $ | 7,156 | | | | | $ | 297 | | |
Commercial real estate – non-owner occupied(1) | | | | | 822 | | | | | | 11 | | |
| Construction and land development | | | | | 89 | | | | | | — | | |
| Commercial loans | | | | | 3,428 | | | | | | — | | |
Residential 1-4 family(2) | | | | | 1,501 | | | | | | 26 | | |
| Other consumer loans | | | | | — | | | | | | — | | |
| Total | | | | $ | 12,996 | | | | | $ | 334 | | |
| With an allowance recorded: | | | | | | | | | | | | | |
| Commercial real estate – owner occupied | | | | $ | 2,259 | | | | | $ | 42 | | |
Commercial real estate – non-owner occupied(1) | | | | | — | | | | | | — | | |
| Construction and land development | | | | | 93 | | | | | | — | | |
| Commercial loans | | | | | 3,488 | | | | | | 213 | | |
Residential 1-4 family(2) | | | | | 416 | | | | | | — | | |
| Other consumer loans | | | | | — | | | | | | — | | |
| Total | | | | $ | 6,256 | | | | | $ | 255 | | |
| Grand total | | | | $ | 19,252 | | | | | $ | 589 | | |
| | |||||||||||||
The following tables present the aging of the recorded investment in past due loans by class of loans as of December 31, 20172019 and 20162018 (in thousands):
| December 31, 2017 | | | 30 – 59 Days Past Due | | | 60 – 89 Days Past Due | | | 90 Days or More | | | Total Past Due | | | Nonaccrual Loans | | | Loans Not Past Due | | | Total Loans | | |||||||||||||||||||||
| Total loans: | | | | | | | | | | | | | | | | | | | | | | | | | | | | | | | | | | | | | | | | | | | |
| Commercial real estate – owner occupied | | | | $ | 687 | | | | | $ | — | | | | | $ | — | | | | | $ | 687 | | | | | $ | — | | | | | $ | 401,160 | | | | | $ | 401,847 | | |
Commercial real estate – non-owner occupied(1) | | | | | 138 | | | | | | 50 | | | | | | — | | | | | | 188 | | | | | | — | | | | | | 534,442 | | | | | | 534,630 | | |
| Construction and land development | | | | | 1,134 | | | | | | 149 | | | | | | — | | | | | | 1,283 | | | | | | 9,969 | | | | | | 186,720 | | | | | | 197,972 | | |
| Commercial loans | | | | | 496 | | | | | | — | | | | | | — | | | | | | 496 | | | | | | 5,664 | | | | | | 247,098 | | | | | | 253,258 | | |
Residential 1-4 family(2) | | | | | 2,926 | | | | | | 361 | | | | | | — | | | | | | 3,287 | | | | | | 2,392 | | | | | | 630,156 | | | | | | 635,835 | | |
| Other consumer loans | | | | | 57 | | | | | | 1 | | | | | | — | | | | | | 58 | | | | | | — | | | | | | 39,316 | | | | | | 39,374 | | |
| Total | | | | $ | 5,438 | | | | | $ | 561 | | | | | $ | — | | | | | $ | 5,999 | | | | | $ | 18,025 | | | | | $ | 2,038,892 | | | | | $ | 2,062,916 | | |
| | |||||||||||||||||||||||||||||||||||||||||||
| December 31, 2016 | | | 30 – 59 Days Past Due | | | 60 – 89 Days Past Due | | | 90 Days or More | | | Total Past Due | | | Nonaccrual Loans | | | Loans Not Past Due | | | Total Loans | | |||||||||||||||||||||
| Total loans: | | | | | | | | | | | | | | | | | | | | | | | | | | | | | | | | | | | | | | | | | | | |
| Commercial real estate – owner occupied | | | | $ | — | | | | | $ | — | | | | | $ | — | | | | | $ | — | | | | | $ | 637 | | | | | $ | 154,170 | | | | | $ | 154,807 | | |
Commercial real estate – non-owner occupied(1) | | | | | — | | | | | | — | | | | | | — | | | | | | — | | | | | | — | | | | | | 310,196 | | | | | | 310,196 | | |
| Construction and land development | | | | | — | | | | | | — | | | | | | — | | | | | | — | | | | | | — | | | | | | 91,067 | | | | | | 91,067 | | |
| Commercial loans | | | | | 1,349 | | | | | | — | | | | | | — | | | | | | 1,349 | | | | | | 3,158 | | | | | | 110,858 | | | | | | 115,365 | | |
Residential 1-4 family(2) | | | | | 1,232 | | | | | | 95 | | | | | | — | | | | | | 1,327 | | | | | | 850 | | | | | | 257,836 | | | | | | 260,013 | | |
| Other consumer loans | | | | | — | | | | | | — | | | | | | — | | | | | | — | | | | | | — | | | | | | 856 | | | | | | 856 | | |
| Total | | | | $ | 2,581 | | | | | $ | 95 | | | | | $ | — | | | | | $ | 2,676 | | | | | $ | 4,645 | | | | | $ | 924,983 | | | | | $ | 932,304 | | |
| | |||||||||||||||||||||||||||||||||||||||||||
| | | | | | | | | | | | | | | | | | | | | |
|
| 30 - 59 |
| 60 - 89 |
| 90 |
| | |
| | |
| | |
| | | |||
| | Days | | Days | | Days | | Total | | Nonaccrual | | Loans Not | | Total | |||||||
December 31, 2019 | | Past Due | | Past Due | | or More | | Past Due | | Loans | | Past Due | | Loans | |||||||
Total loans: |
| |
|
| |
|
| |
|
| |
|
| |
|
| |
|
| |
|
Commercial real estate - owner occupied | | $ | 813 | | $ | — | | $ | — | | $ | 813 | | $ | — | | $ | 413,666 | | $ | 414,479 |
Commercial real estate - non-owner occupied (1) | |
| 936 | |
| — | |
| — | |
| 936 | |
| — | |
| 657,936 | |
| 658,872 |
Construction and land development | |
| 746 | |
| 275 | |
| — | |
| 1,021 | |
| — | |
| 149,729 | |
| 150,750 |
Commercial loans | |
| 234 | |
| 62 | |
| — | |
| 296 | |
| 6,337 | |
| 214,814 | |
| 221,447 |
Residential 1-4 family (2) | |
| 4,060 | |
| — | |
| — | |
| 4,060 | |
| 2,524 | |
| 707,199 | |
| 713,783 |
Other consumer loans | |
| 107 | |
| — | |
| — | |
| 107 | |
| 39 | |
| 26,158 | |
| 26,304 |
Total | | $ | 6,896 | | $ | 337 | | $ | — | | $ | 7,233 | | $ | 8,900 | | $ | 2,169,502 | | $ | 2,185,635 |
| | | | | | | | | | | | | | | | | | | | | |
|
| 30 - 59 |
| 60 - 89 |
| 90 |
| | |
| | |
| | |
| | | |||
| | Days | | Days | | Days | | Total | | Nonaccrual | | Loans Not | | Total | |||||||
December 31, 2018 | | Past Due | | Past Due | | or More | | Past Due | | Loans | | Past Due | | Loans | |||||||
Total loans: |
| |
|
| |
|
| |
|
| |
|
| |
|
| |
|
| |
|
Commercial real estate - owner occupied | | $ | 577 | | $ | 344 | | $ | — | | $ | 921 | | $ | 1,284 | | $ | 404,826 | | $ | 407,031 |
Commercial real estate - non-owner occupied (1) | |
| 581 | |
| 617 | |
| — | |
| 1,198 | |
| — | |
| 642,982 | |
| 644,180 |
Construction and land development | |
| 851 | |
| — | |
| — | |
| 851 | |
| — | |
| 145,803 | |
| 146,654 |
Commercial loans | |
| 319 | |
| 168 | |
| — | |
| 487 | |
| 3,391 | |
| 251,563 | |
| 255,441 |
Residential 1-4 family (2) | |
| 5,523 | |
| 197 | |
| — | |
| 5,720 | |
| 2,055 | |
| 685,533 | |
| 693,308 |
Other consumer loans | |
| 142 | |
| 18 | |
| — | |
| 160 | |
| — | |
| 32,187 | |
| 32,347 |
Total | | $ | 7,993 | | $ | 1,344 | | $ | — | | $ | 9,337 | | $ | 6,730 | | $ | 2,162,894 | | $ | 2,178,961 |
| (1) | Includes loans secured by farmland and multi-family residential loans. |
| (2) | Includes home equity lines of credit. |
Nonaccrual loans include SBA guaranteed amounts totaling $4.7$4.1 million and $2.2$3.4 million at December 31, 20172019 and 2016,2018, respectively.
92
Activity in the allowance for loan and lease losses by class of loan for the years ended December 31, 2017, 20162019, 2018 and 20152017 is summarized below (in thousands):
| Year ended December 31, 2017 | | | Commercial Real Estate Owner Occupied | | | Commercial Real Estate Non-owner Occupied(1) | | | Construction and Land Development | | | Commercial Loans | | | 1-4 Family Residential(2) | | | Other Consumer Loans | | | Unallocated | | | Total | | ||||||||||||||||||||||||
| Allowance for loan losses: | | | | | | | | | | | | | | | | | | | | | | | | | | | | | | | | | | | | | | | | | | | | | | | | | |
| Beginning balance | | | | $ | 905 | | | | | $ | 1,484 | | | | | $ | 752 | | | | | $ | 3,366 | | | | | $ | 1,279 | | | | | $ | 78 | | | | | $ | 746 | | | | | $ | 8,610 | | |
| Charge offs | | | | | — | | | | | | (100) | | | | | | — | | | | | | (8,250) | | | | | | (369) | | | | | | (110) | | | | | | — | | | | | | (8,829) | | |
| Recoveries | | | | | 132 | | | | | | 299 | | | | | | 1 | | | | | | 538 | | | | | | 17 | | | | | | 4 | | | | | | — | | | | | | 991 | | |
| Provision | | | | | (347) | | | | | | (362) | | | | | | (61) | | | | | | 8,842 | | | | | | 659 | | | | | | 640 | | | | | | (746) | | | | | | 8,625 | | |
| Ending balance | | | | $ | 690 | | | | | $ | 1,321 | | | | | $ | 692 | | | | | $ | 4,496 | | | | | $ | 1,586 | | | | | $ | 612 | | | | | $ | — | | | | | $ | 9,397 | | |
| Year ended December 31, 2016 | | | | | | | | | | | | | | | | | | | | | | | | | | | | | | | | | | | | | | | | | | | | | | | | | |
| Allowance for loan losses: | | | | | | | | | | | | | | | | | | | | | | | | | | | | | | | | | | | | | | | | | | | | | | | | | |
| Beginning balance | | | | $ | 1,185 | | | | | $ | 1,222 | | | | | $ | 865 | | | | | $ | 3,041 | | | | | $ | 1,408 | | | | | $ | 48 | | | | | $ | 652 | | | | | $ | 8,421 | | |
| Charge offs | | | | | (799) | | | | | | — | | | | | | (449) | | | | | | (3,370) | | | | | | (22) | | | | | | (322) | | | | | | — | | | | | | (4,962) | | |
| Recoveries | | | | | 8 | | | | | | — | | | | | | 121 | | | | | | 96 | | | | | | 10 | | | | | | 4 | | | | | | — | | | | | | 239 | | |
| Provision | | | | | 511 | | | | | | 262 | | | | | | 215 | | | | | | 3,599 | | | | | | (117) | | | | | | 348 | | | | | | 94 | | | | | | 4,912 | | |
| Ending balance | | | | $ | 905 | | | | | $ | 1,484 | | | | | $ | 752 | | | | | $ | 3,366 | | | | | $ | 1,279 | | | | | $ | 78 | | | | | $ | 746 | | | | | $ | 8,610 | | |
| Year ended December 31, 2015 | | | | | | | | | | | | | | | | | | | | | | | | | | | | | | | | | | | | | | | | | | | | | | | | | |
| Allowance for loan losses: | | | | | | | | | | | | | | | | | | | | | | | | | | | | | | | | | | | | | | | | | | | | | | | | | |
| Beginning balance | | | | $ | 855 | | | | | $ | 1,123 | | | | | $ | 1,644 | | | | | $ | 2,063 | | | | | $ | 1,339 | | | | | $ | 53 | | | | | $ | 337 | | | | | $ | 7,414 | | |
Adjustments(3) | | | | | — | | | | | | — | | | | | | — | | | | | | — | | | | | | (17) | | | | | | — | | | | | | — | | | | | | (17) | | |
| Charge offs | | | | | (1,067) | | | | | | — | | | | | | — | | | | | | (1,174) | | | | | | (413) | | | | | | (19) | | | | | | — | | | | | | (2,673) | | |
| Recoveries | | | | | 18 | | | | | | 18 | | | | | | 139 | | | | | | 91 | | | | | | 259 | | | | | | 1 | | | | | | — | | | | | | 526 | | |
| Provision | | | | | 1,379 | | | | | | 81 | | | | | | (918) | | | | | | 2,061 | | | | | | 240 | | | | | | 13 | | | | | | 315 | | | | | | 3,171 | | |
| Ending balance | | | | $ | 1,185 | | | | | $ | 1,222 | | | | | $ | 865 | | | | | $ | 3,041 | | | | | $ | 1,408 | | | | | $ | 48 | | | | | $ | 652 | | | | | $ | 8,421 | | |
| | |||||||||||||||||||||||||||||||||||||||||||||||||
| | | | | | | | | | | | | | | | | | | | | | | | |
|
| Commercial |
| Commercial |
|
| |
|
| |
|
| |
|
| |
|
| |
|
| | ||
| | Real Estate | | Real Estate | | Construction | | | | | | | | Other | | | | |
| | ||||
| | Owner | | Non-owner | | and Land | | Commercial | | 1-4 Family | | Consumer | | | | | ||||||||
Year Ended December 31, 2019 |
| Occupied |
| Occupied (1) |
| Development |
| Loans |
| Residential (2) |
| Loans |
| Unallocated |
| Total | ||||||||
Allowance for loan losses: |
| |
|
| |
|
| |
|
| |
|
| |
|
| |
|
| |
|
| |
|
Beginning balance | | $ | 802 | | $ | 1,669 | | $ | 821 | | $ | 7,097 | | $ | 1,106 | | $ | 224 | | $ | 564 | | $ | 12,283 |
Provision (recovery) for non-purchased loans | |
| 587 | |
| 904 | |
| (138) | |
| (1,708) | |
| 596 | |
| 199 | |
| (390) | |
| 50 |
Provision for purchase credit impaired loans | | | — | | | — | | | — | | | 300 | | | — | | | — | | | — | | | 300 |
Total provision (recovery) | | | 587 | | | 904 | | | (138) | | | (1,408) | | | 596 | | | 199 | | | (390) | | | 350 |
Charge offs | |
| (782) | |
| (863) | |
| — | |
| (622) | |
| (742) | |
| (269) | |
| — | |
| (3,278) |
Recoveries | |
| 203 | |
| 10 | |
| — | |
| 351 | |
| 306 | |
| 36 | |
| — | |
| 906 |
Ending balance | | $ | 810 | | $ | 1,720 | | $ | 683 | | $ | 5,418 | | $ | 1,266 | | $ | 190 | | $ | 174 | | $ | 10,261 |
| | | | | | | | | | | | | | | | | | | | | | | | |
Year Ended December 31, 2018 | |
|
| |
|
| |
|
| |
|
| |
|
| |
|
| |
|
| |
|
|
Allowance for loan losses: | |
|
| |
|
| |
|
| |
|
| |
|
| |
|
| |
|
| |
|
|
Beginning balance | | $ | 690 | | $ | 1,321 | | $ | 692 | | $ | 4,496 | | $ | 1,586 | | $ | 612 | | $ | — | | $ | 9,397 |
Provision (recovery) for non-purchased loans | | | 497 | | | 348 | | | 129 | | | 1,941 | | | 237 | | | (116) | | | 564 | | | 3,600 |
Provision for purchase credit impaired loans | | | — | | | — | | | — | | | 600 | | | — | | | — | | | — | | | 600 |
Total provision (recovery) | | | 497 | | | 348 | | | 129 | | | 2,541 | | | 237 | | | (116) | | | 564 | | | 4,200 |
Charge offs | |
| (400) | |
| — | |
| — | |
| (1,566) | |
| (842) | |
| (290) | |
| — | |
| (3,098) |
Recoveries | |
| 15 | |
| — | |
| — | |
| 1,626 | |
| 125 | |
| 18 | |
| — | |
| 1,784 |
Ending balance | | $ | 802 | | $ | 1,669 | | $ | 821 | | $ | 7,097 | | $ | 1,106 | | $ | 224 | | $ | 564 | | $ | 12,283 |
| | | | | | | | | | | | | | | | | | | | | | | | |
Year ended December 31, 2017 | |
|
| |
|
| |
|
| |
|
| |
|
| |
|
| |
|
| |
|
|
Allowance for loan losses: | |
|
| |
|
| |
|
| |
|
| |
|
| |
|
| |
|
| |
|
|
Beginning balance | | $ | 905 | | $ | 1,484 | | $ | 752 | | $ | 3,366 | | $ | 1,279 | | $ | 78 | | $ | 746 | | $ | 8,610 |
Provision (recovery) | |
| (347) | |
| (362) | |
| (61) | |
| 8,842 | |
| 659 | |
| 640 | |
| (746) | |
| 8,625 |
Charge offs | |
| — | |
| (100) | |
| — | |
| (8,250) | |
| (369) | |
| (110) | |
| — | |
| (8,829) |
Recoveries | |
| 132 | |
| 299 | |
| 1 | |
| 538 | |
| 17 | |
| 4 | |
| — | |
| 991 |
Ending balance | | $ | 690 | | $ | 1,321 | | $ | 692 | | $ | 4,496 | | $ | 1,586 | | $ | 612 | | $ | — | | $ | 9,397 |
| (1) | Includes loans secured by farmland and multi-family residential loans. |
| (2) | Includes home equity lines of credit. |
93
The following table presents the balance in the allowance for loan losses and the recorded investment in loans by portfolio segment and based on impairment method as of December 31, 20172019 and 20162018 (in thousands):
| | | | Commercial Real Estate Owner Occupied | | | Commercial Real Estate Non-owner Occupied(1) | | | Construction and Land Development | | | Commercial Loans | | | 1-4 Family Residential(2) | | | Other Consumer Loans | | | Unallocated | | | Total | | ||||||||||||||||||||||||
| December 31, 2017 | | | | | | | | | | ||||||||||||||||||||||||||||||||||||||||
| Ending allowance balance attributable to loans: | | | | | | | | | | | | | | | | | | | | | | | | | | | | | | | | | | | | | | | | | | | | | | | | | |
| Individually evaluated for impairment | | | | $ | — | | | | | $ | — | | | | | $ | — | | | | | $ | — | | | | | $ | — | | | | | $ | — | | | | | $ | — | | | | | $ | — | | |
| Collectively evaluated for impairment | | | | | 690 | | | | | | 1,321 | | | | | | 692 | | | | | | 4,496 | | | | | | 1,586 | | | | | | 612 | | | | | | — | | | | | | 9,397 | | |
| Total ending allowance | | | | $ | 690 | | | | | $ | 1,321 | | | | | $ | 692 | | | | | $ | 4,496 | | | | | $ | 1,586 | | | | | $ | 612 | | | | | $ | — | | | | | $ | 9,397 | | |
| Loans: | | | | | | | | | | | | | | | | | | | | | | | | | | | | | | | | | | | | | | | | | | | | | | | | | |
| Individually evaluated for impairment | | | | $ | 767 | | | | | $ | 766 | | | | | $ | 9,969 | | | | | $ | 6,035 | | | | | $ | 3,160 | | | | | $ | — | | | | | $ | — | | | | | $ | 20,697 | | |
| Collectively evaluated for impairment | | | | | 401,080 | | | | | | 533,864 | | | | | | 188,003 | | | | | | 247,223 | | | | | | 632,675 | | | | | | 39,374 | | | | | | — | | | | | | 2,042,219 | | |
| Total ending loan balances | | | | $ | 401,847 | | | | | $ | 534,630 | | | | | $ | 197,972 | | | | | $ | 253,258 | | | | | $ | 635,835 | | | | | $ | 39,374 | | | | | $ | — | | | | | $ | 2,062,916 | | |
| December 31, 2016 | | | | | | | | | | | | | | | | | | | | | | | | | | | | | | | | | | | | | | | | | | | | | | | | | |
| Ending allowance balance attributable to loans: | | | | | | | | | | | | | | | | | | | | | | | | | | | | | | | | | | | | | | | | | | | | | | | | | |
| Individually evaluated for impairment | | | | $ | 150 | | | | | $ | — | | | | | $ | — | | | | | $ | 750 | | | | | $ | — | | | | | $ | — | | | | | $ | — | | | | | $ | 900 | | |
| Collectively evaluated for impairment | | | | | 755 | | | | | | 1,484 | | | | | | 752 | | | | | | 2,616 | | | | | | 1,279 | | | | | | 78 | | | | | | 746 | | | | | | 7,710 | | |
| Total ending allowance | | | | $ | 905 | | | | | $ | 1,484 | | | | | $ | 752 | | | | | $ | 3,366 | | | | | $ | 1,279 | | | | | $ | 78 | | | | | $ | 746 | | | | | $ | 8,610 | | |
| Loans: | | | | | | | | | | | | | | | | | | | | | | | | | | | | | | | | | | | | | | | | | | | | | | | | | |
| Individually evaluated for impairment | | | | $ | 6,271 | | | | | $ | — | | | | | $ | — | | | | | $ | 6,380 | | | | | $ | 963 | | | | | $ | — | | | | | $ | — | | | | | $ | 13,614 | | |
| Collectively evaluated for impairment | | | | | 148,536 | | | | | | 310,196 | | | | | | 91,067 | | | | | | 108,985 | | | | | | 259,050 | | | | | | 856 | | | | | | — | | | | | | 918,690 | | |
| Total ending loan balances | | | | $ | 154,807 | | | | | $ | 310,196 | | | | | $ | 91,067 | | | | | $ | 115,365 | | | | | $ | 260,013 | | | | | $ | 856 | | | | | $ | — | | | | | $ | 932,304 | | |
| | |||||||||||||||||||||||||||||||||||||||||||||||||
| | | | | | | | | | | | | | | | | | | | | | | | |
|
| Commercial |
| Commercial |
| | |
| | |
| | |
| | |
| | |
| | | ||
| | Real Estate | | Real Estate | | Construction | | | | | | | | Other | | | | |
| | ||||
| | Owner | | Non-owner | | and Land | | Commercial | | 1-4 Family | | Consumer | | | | |
| | ||||||
December 31, 2019 | | Occupied | | Occupied (1) | | Development | | Loans | | Residential (2) | | Loans | | Unallocated | | Total | ||||||||
Ending allowance balance attributable to loans: |
| |
|
| |
|
| |
|
| |
|
| |
|
| |
|
| |
|
| |
|
Individually evaluated for impairment | | $ | — | | $ | — | | $ | — | | $ | 957 | | $ | 85 | | $ | — | | $ | — | | $ | 1,042 |
Collectively evaluated for impairment | |
| 810 | |
| 1,720 | |
| 683 | |
| 4,461 | |
| 1,181 | |
| 190 | |
| 174 | |
| 9,219 |
Total ending allowance | | $ | 810 | | $ | 1,720 | | $ | 683 | | $ | 5,418 | | $ | 1,266 | | $ | 190 | | $ | 174 | | $ | 10,261 |
| | | | | | | | | | | | | | | | | | | | | | | | |
Loans: | |
|
| |
|
| |
|
| |
|
| |
|
| |
|
| |
|
| |
|
|
Individually evaluated for impairment | | $ | 6,890 | | $ | 3,120 | | $ | 345 | | $ | 7,544 | | $ | 1,443 | | $ | — | | $ | — | | $ | 19,342 |
Collectively evaluated for impairment | |
| 407,589 | |
| 655,752 | |
| 150,405 | |
| 213,903 | |
| 712,340 | |
| 26,304 | |
| — | |
| 2,166,293 |
Total ending loan balances | | $ | 414,479 | | $ | 658,872 | | $ | 150,750 | | $ | 221,447 | | $ | 713,783 | | $ | 26,304 | | $ | — | | $ | 2,185,635 |
| | | | | | | | | | | | | | | | | | | | | | | | |
December 31, 2018 | |
|
| |
|
| |
|
| |
|
| |
|
| |
|
| |
|
| |
|
|
Ending allowance balance attributable to loans: | |
|
| |
|
| |
|
| |
|
| |
|
| |
|
| |
|
| |
|
|
Individually evaluated for impairment | | $ | — | | $ | — | | $ | — | | $ | 600 | | $ | — | | $ | — | | $ | — | | $ | 600 |
Collectively evaluated for impairment | |
| 802 | |
| 1,669 | |
| 821 | |
| 6,497 | |
| 1,106 | |
| 224 | |
| 564 | |
| 11,683 |
Total ending allowance | | $ | 802 | | $ | 1,669 | | $ | 821 | | $ | 7,097 | | $ | 1,106 | | $ | 224 | | $ | 564 | | $ | 12,283 |
| | | | | | | | | | | | | | | | | | | | | | | | |
Loans: | |
|
| |
|
| |
|
| |
|
| |
|
| |
|
| |
|
| |
|
|
Individually evaluated for impairment | | $ | 2,795 | | $ | 171 | | $ | — | | $ | 6,076 | | $ | 1,591 | | $ | — | | $ | — | | $ | 10,633 |
Collectively evaluated for impairment | |
| 404,236 | |
| 644,009 | |
| 146,654 | |
| 249,365 | |
| 691,717 | |
| 32,347 | |
| — | |
| 2,168,328 |
Total ending loan balances | | $ | 407,031 | | $ | 644,180 | | $ | 146,654 | | $ | 255,441 | | $ | 693,308 | | $ | 32,347 | | $ | — | | $ | 2,178,961 |
| (1) | Includes loans secured by farmland and multi-family residential loans. |
| (2) | Includes home equity lines of credit. |
Troubled Debt Restructurings
A modification is classified as a troubled debt restructuring (“TDR”) if both of the following exist: (1) the borrower is experiencing financial difficulty and (2) the Bank has granted a concession to the borrower. The Bank determines that a borrower may be experiencing financial difficulty if the borrower is currently delinquent on any of its debt, or if the Bank is concerned that the borrower may not be able to perform in accordance with the current terms of the loan agreement in the foreseeable future. Many aspects of the borrower’s financial situation are assessed when determining whether they are experiencing financial difficulty, particularly as it relates to commercial borrowers due to the complex nature of the loan structure, business/industry risk and borrower/guarantor structures. Concessions may include the reduction of an interest rate at a rate lower than current market raterates for a new loan with similar risk, extension of the maturity date, reduction of accrued interest, or principal forgiveness. When evaluating whether a concession has been granted, the Bank also considers whether the borrower has provided additional collateral or guarantors and whether such additions adequately compensate the Bank for the restructured terms, or if the revised terms are consistent with those currently being offered to new loan customers. The assessments of whether a borrower is experiencing (or is likely to experience) financial difficulty and whether a concession has been granted is subjective in nature and management’s judgment is required when determining whether a modification is a TDR.
Although each occurrence is unique to the borrower and is evaluated separately, for all portfolio segments, TDRs are typically modified through reduction in interest rates, reductions in payments, changing the payment terms from principal and interest to interest only, and/or extensions in term maturity.
94
Through its system of internal controls, Southern National evaluates and segments loan portfolio credit quality on a quarterly basis using regulatory definitions for Special Mention, Substandard and Doubtful. Special Mention loans are considered to be criticized. Substandard and Doubtful loans are considered to be classified. Southern National had no0 loans classified Doubtful at December 31, 20172019 or 2016.
Special Mention loans are loans that have a potential weakness that deservesdeserve management’s close attention. If left uncorrected, these potential weaknesses may result in deterioration of the repayment prospects for the loan or of the institution’s credit position.
Substandard loans may be inadequately protected by the current net worth and paying capacity of the obligor or of the collateral pledged if any. Loans so classified have a well-defined weakness or weaknesses that jeopardize the liquidation of the debt. They are characterized by the distinct possibility that the institution will sustain some loss if the deficiencies are not corrected.
Doubtful loans have all the weaknesses inherent in those classified as substandard, with the added characteristic that the weaknesses make collection or liquidation in full, on the basis of currently existing facts, conditions, and values, highly questionable and improbable.
As of December 31, 20172019 and 2016,2018, and based on the most recent analysis performed, the risk category of loans by class of loans is as follows (in thousands):
| December 31, 2017 | | | Total Loans | | |||||||||||||||||||||
| | Special Mention | | | Substandard(3) | | | Pass | | | Total | | ||||||||||||||
| Commercial real estate – owner occupied | | | | $ | 4,178 | | | | | $ | 1,678 | | | | | $ | 395,991 | | | | | $ | 401,847 | | |
Commercial real estate – non-owner occupied(1) | | | | | 5,705 | | | | | | 830 | | | | | | 528,095 | | | | | | 534,630 | | |
| Construction and land development | | | | | 128 | | | | | | 9,969 | | | | | | 187,875 | | | | | | 197,972 | | |
| Commercial loans | | | | | 5,936 | | | | | | 6,035 | | | | | | 241,287 | | | | | | 253,258 | | |
Residential 1-4 family(2) | | | | | 1,323 | | | | | | 3,935 | | | | | | 630,577 | | | | | | 635,835 | | |
| Other consumer loans | | | | | 162 | | | | | | — | | | | | | 39,212 | | | | | | 39,374 | | |
| Total | | | | $ | 17,432 | | | | | $ | 22,447 | | | | | $ | 2,023,037 | | | | | $ | 2,062,916 | | |
| | |||||||||||||||||||||||||
| December 31, 2016 | | | Total Loans | | |||||||||||||||||||||
| | Special Mention | | | Substandard(3) | | | Pass | | | Total | | ||||||||||||||
| Commercial real estate – owner occupied | | | | $ | — | | | | | $ | 6,271 | | | | | $ | 148,536 | | | | | $ | 154,807 | | |
Commercial real estate – non-owner occupied(1) | | | | | — | | | | | | — | | | | | | 310,196 | | | | | | 310,196 | | |
| Construction and land development | | | | | — | | | | | | — | | | | | | 91,067 | | | | | | 91,067 | | |
| Commercial loans | | | | | 28 | | | | | | 6,380 | | | | | | 108,957 | | | | | | 115,365 | | |
Residential 1-4 family(2) | | | | | — | | | | | | 963 | | | | | | 259,050 | | | | | | 260,013 | | |
| Other consumer loans | | | | | — | | | | | | — | | | | | | 856 | | | | | | 856 | | |
| Total | | | | $ | 28 | | | | | $ | 13,614 | | | | | $ | 918,662 | | | | | $ | 932,304 | | |
| | |||||||||||||||||||||||||
| | | | | | | | | | | | |
| | Total Loans | ||||||||||
|
| Special |
| | |
| | |
|
| | |
December 31, 2019 | | Mention | | Substandard (3) | | Pass | | Total | ||||
Commercial real estate - owner occupied | | $ | 3,821 | | $ | 3,975 | | $ | 406,683 | | $ | 414,479 |
Commercial real estate - non-owner occupied (1) | |
| 4,193 | |
| 176 | |
| 654,503 | |
| 658,872 |
Construction and land development | |
| — | |
| 690 | |
| 150,060 | |
| 150,750 |
Commercial loans | |
| 3,432 | |
| 4,462 | |
| 213,553 | |
| 221,447 |
Residential 1-4 family (2) | |
| 666 | |
| 1,194 | |
| 711,923 | |
| 713,783 |
Other consumer loans | |
| 122 | |
| — | |
| 26,182 | |
| 26,304 |
Total | | $ | 12,234 | | $ | 10,497 | | $ | 2,162,904 | | $ | 2,185,635 |
| | | | | | | | | | | | |
| | Total Loans | ||||||||||
|
| Special |
| | |
| | |
|
| | |
December 31, 2018 | | Mention | | Substandard (3) | | Pass | | Total | ||||
Commercial real estate - owner occupied | | $ | 6,611 | | $ | 2,810 | | $ | 397,610 | | $ | 407,031 |
Commercial real estate - non-owner occupied (1) | |
| 4,382 | |
| 189 | |
| 639,609 | |
| 644,180 |
Construction and land development | |
| — | |
| — | |
| 146,654 | |
| 146,654 |
Commercial loans | |
| 2,373 | |
| 2,689 | |
| 250,379 | |
| 255,441 |
Residential 1-4 family (2) | |
| 395 | |
| 1,982 | |
| 690,931 | |
| 693,308 |
Other consumer loans | |
| 142 | |
| — | |
| 32,205 | |
| 32,347 |
Total | | $ | 13,903 | | $ | 7,670 | | $ | 2,157,388 | | $ | 2,178,961 |
| (1) | Includes loans secured by farmland and multi-family residential loans. |
| (2) | Includes home equity lines of credit. |
| (3) | Includes SBA guarantees of $4.1 million and $3.4 million as of December 31, 2019 and 2018, respectively. |
The amount of foreclosed residential real estate property held at December 31, 20172019 and 20162018 was $3.3$1.4 million and $3.4$1.2 million, respectively. The recorded investment in consumer mortgage loans collateralized by residential real estate property that are in the process of foreclosure was $939 thousand$1.9 million and $1.8$1.5 million at December 31, 20172019 and 2016,2018, respectively.
95
The following table presents the carrying amount of purchased impaired and non-impaired loans from the EVBS acquisitionacquisitions as of December 31, 20172019 and 2018 (in thousands):
| | | | December 31, 2017 | | |||||||||||||||
| | | | Purchased Impaired Loans | | | Purchased Non-impaired Loans | | | Total | | |||||||||
Commercial real estate(1) | | | | $ | 5,788 | | | | | $ | 418,170 | | | | | $ | 423,958 | | |
| Construction and land development | | | | | — | | | | | | 85,036 | | | | | | 85,036 | | |
| Commercial loans | | | | | 3,598 | | | | | | 112,693 | | | | | | 116,291 | | |
Residential 1-4 family(2) | | | | | 1,255 | | | | | | 282,702 | | | | | | 283,957 | | |
| Other consumer loans | | | | | — | | | | | | 33,539 | | | | | | 33,539 | | |
| Total | | | | $ | 10,641 | | | | | $ | 932,140 | | | | | $ | 942,781 | | |
| | |||||||||||||||||||
| | | | | | | | | | | | | | | | | | |
| | December 31, 2019 | | December 31, 2018 | ||||||||||||||
|
| Purchased |
| Purchased |
| | |
| Purchased |
| Purchased |
| | | ||||
| | Impaired | | Non-impaired | | | | | Impaired | | Non-impaired | | | | ||||
| | Loans | | Loans | | Total | | Loans | | Loans | | Total | ||||||
Commercial real estate (1) | | $ | 3,978 | | $ | 307,289 | | $ | 311,267 | | $ | 4,387 | | $ | 379,889 | | $ | 384,276 |
Construction and land development | |
| 26 | |
| 21,111 | |
| 21,137 | |
| 358 | |
| 47,466 | |
| 47,824 |
Commercial loans | |
| 2,354 | |
| 34,729 | |
| 37,083 | |
| 3,050 | |
| 71,146 | |
| 74,196 |
Residential 1-4 family (2) | |
| 2,841 | |
| 232,887 | |
| 235,728 | |
| 3,654 | |
| 275,527 | |
| 279,181 |
Other consumer loans | |
| — | |
| 15,153 | |
| 15,153 | |
| — | |
| 21,731 | |
| 21,731 |
Total | | $ | 9,199 | | $ | 611,169 | | $ | 620,368 | | $ | 11,449 | | $ | 795,759 | | $ | 807,208 |
| (1) | Includes owner occupied and non-owner occupied as well as loans secured by farmland and multi-family residential loans. |
| (2) | Includes home equity lines of credit. |
The FDIC indemnification on the GAB residential mortgages and non-owner occupied as well as loans secured by farmland and multi-family residential loans.
Changes in the carrying amount and accretable yield for purchased impaired and non-impaired loans from the EVBS acquisition were as follows for the year ended December 31, 2017 (in thousands):
| | | | December 31, 2017 | | |||||||||||||||||||||
| | | | Purchased Impaired | | | Purchased Non-impaired | | ||||||||||||||||||
| | | | Accretable Yield | | | Carrying Amount of Loans | | | Accretable Discount | | | Carrying Amount of Loans | | ||||||||||||
| Balance at beginning of period | | | | $ | — | | | | | $ | — | | | | | $ | — | | | | | $ | — | | |
| Additions | | | | | 398 | | | | | | 11,329 | | | | | | 14,783 | | | | | | 1,020,653 | | |
| Accretion | | | | | (83) | | | | | | 83 | | | | | | (2,669) | | | | | | 2,669 | | |
| Adjustment-transfer to OREO | | | | | — | | | | | | — | | | | | | — | | | | | | (43) | | |
| Payments received | | | | | — | | | | | | (771) | | | | | | — | | | | | | (91,139) | | |
| Balance at end of the period | | | | $ | 315 | | | | | $ | 10,641 | | | | | $ | 12,114 | | | | | $ | 932,140 | | |
| | |||||||||||||||||||||||||
| | | | December 31, 2017 | | | December 31, 2016 | | ||||||||||||||||||||||||||||||
| | | | Purchased Impaired Loans | | | Purchased Non-impaired Loans | | | Total | | | Purchased Impaired Loans | | | Purchased Non-impaired Loans | | | Total | | ||||||||||||||||||
Commercial real estate(1) | | | | $ | 1,050 | | | | | $ | 2,257 | | | | | $ | 3,307 | | | | | $ | 1,080 | | | | | $ | 3,630 | | | | | $ | 4,710 | | |
| Construction and land development | | | | | — | | | | | | — | | | | | | — | | | | | | — | | | | | | — | | | | | | — | | |
| Commercial loans | | | | | 189 | | | | | | 280 | | | | | | 469 | | | | | | 193 | | | | | | 347 | | | | | | 540 | | |
Residential 1-4 family(2) | | | | | — | | | | | | 23,339 | | | | | | 23,339 | | | | | | — | | | | | | 28,180 | | | | | | 28,180 | | |
| Other consumer loans | | | | | — | | | | | | 67 | | | | | | 67 | | | | | | — | | | | | | 14 | | | | | | 14 | | |
| Total | | | | $ | 1,239 | | | | | $ | 25,943 | | | | | $ | 27,182 | | | | | $ | 1,273 | | | | | $ | 32,171 | | | | | $ | 33,444 | | |
| | |||||||||||||||||||||||||||||||||||||
| | | | December 31, 2017 | | | December 31, 2016 | | ||||||||||||||||||||||||||||||||||||||||||
| | | | Purchased Impaired | | | Purchased Non-impaired | | | Purchased Impaired | | | Purchased Non-impaired | | ||||||||||||||||||||||||||||||||||||
| | | | Accretable Yield | | | Carrying Amount of Loans | | | Accretable Yield | | | Carrying Amount of Loans | | | Accretable Yield | | | Carrying Amount of Loans | | | Accretable Yield | | | Carrying Amount of Loans | | ||||||||||||||||||||||||
| Balance at beginning of the period | | | | $ | — | | | | | $ | 1,273 | | | | | $ | 3,761 | | | | | $ | 32,171 | | | | | $ | — | | | | | $ | 1,444 | | | | | $ | 4,597 | | | | | $ | 38,758 | | |
| Additions | | | | | — | | | | | | — | | | | | | — | | | | | | — | | | | | | — | | | | | | — | | | | | | — | | | | | | — | | |
| Accretion | | | | | — | | | | | | — | | | | | | (886) | | | | | | 892 | | | | | | — | | | | | | — | | | | | | (1,085) | | | | | | 1,085 | | |
| Reclassifications from nonaccretable balance | | | | | — | | | | | | — | | | | | | 230 | | | | | | — | | | | | | — | | | | | | — | | | | | | 269 | | | | | | — | | |
| Adjustment-transfer to OREO | | | | | — | | | | | | — | | | | | | — | | | | | | — | | | | | | — | | | | | | — | | | | | | (20) | | | | | | (169) | | |
| Payments received | | | | | — | | | | | | (34) | | | | | | — | | | | | | (7,120) | | | | | | — | | | | | | (171) | | | | | | — | | | | | | (7,503) | | |
| Balance at end of the period | | | | $ | — | | | | | $ | 1,239 | | | | | $ | 3,105 | | | | | $ | 25,943 | | | | | $ | — | | | | | $ | 1,273 | | | | | $ | 3,761 | | | | | $ | 32,171 | | |
| | |||||||||||||||||||||||||||||||||||||||||||||||||
| | | | December 31, 2017 | | | December 31, 2016 | | ||||||||||||||||||||||||||||||
| | | | Purchased Impaired Loans | | | Purchased Non-impaired Loans | | | Total | | | Purchased Impaired Loans | | | Purchased Non-impaired Loans | | | Total | | ||||||||||||||||||
Commercial real estate(1) | | | | $ | — | | | | | $ | 9,162 | | | | | $ | 9,162 | | | | | $ | 258 | | | | | $ | 10,150 | | | | | $ | 10,408 | | |
| Construction and land development | | | | | 396 | | | | | | 2,869 | | | | | | 3,265 | | | | | | 488 | | | | | | 2,996 | | | | | | 3,484 | | |
| Commercial loans | | | | | — | | | | | | 1,688 | | | | | | 1,688 | | | | | | — | | | | | | 2,062 | | | | | | 2,062 | | |
Residential 1-4 family(2) | | | | | 792 | | | | | | 4,290 | | | | | | 5,082 | | | | | | 818 | | | | | | 6,221 | | | | | | 7,039 | | |
| Other consumer loans | | | | | — | | | | | | — | | | | | | — | | | | | | — | | | | | | 2 | | | | | | 2 | | |
| Total | | | | $ | 1,188 | | | | | $ | 18,009 | | | | | $ | 19,197 | | | | | $ | 1,564 | | | | | $ | 21,431 | | | | | $ | 22,995 | | |
| | |||||||||||||||||||||||||||||||||||||
| | | | | | | | | | | | | | | | | | | | | | | | |
| | December 31, 2019 | | December 31, 2018 | ||||||||||||||||||||
| | Purchased Impaired | | Purchased Non-impaired | | Purchased Impaired | | Purchased Non-impaired | ||||||||||||||||
|
| | |
| Carrying |
| | |
| Carrying |
| | |
| Carrying |
| | |
| Carrying | ||||
| | Accretable | | Amount | | Accretable | | Amount | | Accretable | | Amount | | Accretable | | Amount | ||||||||
| | Yield | | of Loans | | Discount | | of Loans | | Yield | | of Loans | | Discount | | of Loans | ||||||||
Balance at beginning of the period | | $ | 174 | | $ | 11,449 | | $ | 13,474 | | $ | 795,759 | | $ | 315 | | $ | 13,614 | | $ | 17,460 | | $ | 1,011,801 |
Additions | |
| — | |
| — | |
| — | |
| — | |
| — | |
| — | |
| — | |
| — |
Accretion | |
| (72) | |
| 72 | |
| (3,549) | |
| 3,549 | |
| (141) | |
| 141 | |
| (4,196) | |
| 4,196 |
Reclassifications from nonaccretable balance | |
| — | |
| — | |
| — | |
| — | |
| — | |
| — | |
| 210 | |
| — |
Adjustment-transfer to OREO | |
| — | |
| — | |
| — | |
| — | |
| — | |
| — | |
| — | |
| — |
Payments received | |
| — | |
| (2,322) | |
| — | |
| (188,139) | |
| — | |
| (2,306) | |
| — | |
| (220,238) |
Balance at end of the period | | $ | 102 | | $ | 9,199 | | $ | 9,925 | | $ | 611,169 | | $ | 174 | | $ | 11,449 | | $ | 13,474 | | $ | 795,759 |
| | | | December 31, 2017 | | | December 31, 2016 | | ||||||||||||||||||||||||||||||||||||||||||
| | | | Purchased Impaired | | | Purchased Non-impaired | | | Purchased Impaired | | | Purchased Non-impaired | | ||||||||||||||||||||||||||||||||||||
| | | | Accretable Yield | | | Carrying Amount of Loans | | | Accretable Discount | | | Carrying Amount of Loans | | | Accretable Yield | | | Carrying Amount of Loans | | | Accretable Discount | | | Carrying Amount of Loans | | ||||||||||||||||||||||||
| Balance at beginning of the period | | | | $ | — | | | | | $ | 1,564 | | | | | $ | 662 | | | | | $ | 21,431 | | | | | $ | — | | | | | $ | 1,688 | | | | | $ | 858 | | | | | $ | 27,878 | | |
| Additions | | | | | — | | | | | | — | | | | | | — | | | | | | — | | | | | | — | | | | | | — | | | | | | — | | | | | | — | | |
| Accretion | | | | | — | | | | | | — | | | | | | (184) | | | | | | 184 | | | | | | — | | | | | | — | | | | | | (196) | | | | | | 139 | | |
| Payments received | | | | | — | | | | | | (376) | | | | | | — | | | | | | (3,606) | | | | | | — | | | | | | (124) | | | | | | — | | | | | | (6,586) | | |
| Balance at end of the period | | | | $ | — | | | | | $ | 1,188 | | | | | $ | 478 | | | | | $ | 18,009 | | | | | $ | — | | | | | $ | 1,564 | | | | | $ | 662 | | | | | $ | 21,431 | | |
| | |||||||||||||||||||||||||||||||||||||||||||||||||
| | | | December 31, 2017 | | | December 31, 2016 | | ||||||||||||||||||||||||||||||
| | ��� | | Purchased Impaired Loans | | | Purchased Non-impaired Loans | | | Total | | | Purchased Impaired Loans | | | Purchased Non-impaired Loans | | | Total | | ||||||||||||||||||
Commercial real estate(1) | | | | $ | 198 | | | | | $ | 1,997 | | | | | $ | 2,195 | | | | | $ | 225 | | | | | $ | 2,638 | | | | | $ | 2,863 | | |
| Construction and land development | | | | | — | | | | | | 1,216 | | | | | | 1,216 | | | | | | 355 | | | | | | 860 | | | | | | 1,215 | | |
| Commercial loans | | | | | — | | | | | | 39 | | | | | | 39 | | | | | | — | | | | | | 116 | | | | | | 116 | | |
Residential 1-4 family(2) | | | | | 348 | | | | | | 32,357 | | | | | | 32,705 | | | | | | — | | | | | | 38,018 | | | | | | 38,018 | | |
| Other consumer loans | | | | | — | | | | | | 100 | | | | | | 100 | | | | | | — | | | | | | 142 | | | | | | 142 | | |
| Total | | | | $ | 546 | | | | | $ | 35,709 | | | | | $ | 36,255 | | | | | $ | 580 | | | | | $ | 41,774 | | | | | $ | 42,354 | | |
| | |||||||||||||||||||||||||||||||||||||
| | | | December 31, 2017 | | | December 31, 2016 | | ||||||||||||||||||||||||||||||||||||||||||
| | | | Purchased Impaired | | | Purchased Non-impaired | | | Purchased Impaired | | | Purchased Non-impaired | | ||||||||||||||||||||||||||||||||||||
| | | | Accretable Yield | | | Carrying Amount of Loans | | | Accretable Discount | | | Carrying Amount of Loans | | | Accretable Yield | | | Carrying Amount of Loans | | | Accretable Discount | | | Carrying Amount of Loans | | ||||||||||||||||||||||||
| Balance at beginning of the period | | | | $ | — | | | | | $ | 580 | | | | | $ | 2,096 | | | | | $ | 41,774 | | | | | $ | — | | | | | $ | 703 | | | | | $ | 2,462 | | | | | $ | 51,263 | | |
| Additions | | | | | — | | | | | | — | | | | | | — | | | | | | — | | | | | | — | | | | | | — | | | | | | — | | | | | | — | | |
| Accretion | | | | | — | | | | | | — | | | | | | (333) | | | | | | 333 | | | | | | — | | | | | | — | | | | | | (366) | | | | | | 365 | | |
| Payments received | | | | | — | | | | | | (34) | | | | | | — | | | | | | (6,398) | | | | | | — | | | | | | (123) | | | | | | — | | | | | | (9,854) | | |
| Balance at end of the period | | | | $ | — | | | | | $ | 546 | | | | | $ | 1,763 | | | | | $ | 35,709 | | | | | $ | — | | | | | $ | 580 | | | | | $ | 2,096 | | | | | $ | 41,774 | | |
| | |||||||||||||||||||||||||||||||||||||||||||||||||
4. FAIR VALUE
ASC 820-10820 establishes a fair value hierarchy which requires an entity to maximize the use of observable inputs and minimize the use of unobservable inputs when measuring fair value. The standard describes three levels of inputs that may be used to measure fair value:
Level 1: Quoted prices (unadjusted) for identical assets or liabilities in active markets that the entity has the ability to access as of the measurement date
Level 2: Significant other observable inputs other than Level 1 prices such as quoted prices for similar assets or liabilities; quoted prices in markets that are not active; or other inputs that are observable or can be corroborated by observable market data
96
Level 3: Significant unobservable inputs that reflect a reporting entity’s own assumptions about the assumptions that market participants would use in pricing an asset or liability
The following is a description of the valuation methodologies used for instruments measured at fair value, as well as the general classification of such instruments pursuant to the valuation hierarchy:
Assets Measured on a Recurring Basis:
Investment Securities Available for Sale
Where quoted prices are available in an active market, investment securities are classified within Level 1 of the valuation hierarchy. Level 1 investment securities would include highly liquid government bonds and mortgage products and exchange traded equities.products. If quoted market prices are not available, then fair values are estimated by using pricing models, quoted prices of investment securities with similar characteristics, or discounted cash flow. Level 2 investment securities would include U.S. agency securities, mortgage-backed securities, obligations of states and political subdivisions and certain corporate, asset-backed and other securities. In certain cases where there is limited activity or less transparency around inputs to the valuation, investment securities are classified within Level 3 of the valuation hierarchy. Currently, alla majority of Southern National’s available for sale debt investment securities are considered to be Level 2 investment securities, except for a few corporate securities that are classified as Level 3 investment securities.
Assets measured at fair value on a recurring basis are summarized below:
| | | | | | | | | | | | |
| | | | | Fair Value Measurements Using | |||||||
| | | | | | | | Significant | |
| | |
| | | | | Quoted Prices in | | Other | | Significant | |||
| | | | | Active Markets for | | Observable | | Unobservable | |||
| | Total at | | Identical Assets | | Inputs | | Inputs | ||||
(dollars in thousands) |
| December 31, 2019 |
| (Level 1) |
| (Level 2) |
| (Level 3) | ||||
Available for sale securities |
| |
|
| |
|
| |
|
| |
|
Residential government-sponsored mortgage-backed securities | | $ | 48,979 | | $ | — | | $ | 48,979 | | $ | — |
Obligations of states and political subdivisions | |
| 17,582 | |
| — | |
| 17,582 | |
| — |
Corporate securities | |
| 2,012 | |
| — | |
| 1,012 | |
| 1,000 |
Trust preferred securities | |
| 2,568 | |
| — | |
| 2,568 | |
| — |
Residential government-sponsored collateralized mortgage obligations | |
| 36,689 | |
| — | |
| 36,689 | |
| — |
Government-sponsored agency securities | |
| 14,822 | |
| — | |
| 14,822 | |
| — |
Agency commercial mortgage-backed securities | |
| 27,731 | |
| — | |
| 27,731 | |
| — |
SBA pool securities | |
| 14,437 | |
| — | |
| 14,437 | |
| — |
Total | | $ | 164,820 | | $ | — | | $ | 163,820 | | $ | 1,000 |
| | | | | | | | | | | | |
| | | | | Fair Value Measurements Using | |||||||
| | | | | | | | Significant | |
| | |
| | | | | Quoted Prices in | | Other | | Significant | |||
| | | | | Active Markets for | | Observable | | Unobservable | |||
| | Total at | | Identical Assets | | Inputs | | Inputs | ||||
(dollars in thousands) |
| December 31, 2018 |
| (Level 1) |
| (Level 2) |
| (Level 3) | ||||
Available for sale securities |
| |
|
| |
|
| |
|
| |
|
Residential government-sponsored mortgage-backed securities | | $ | 27,302 | | $ | — | | $ | 27,302 | | $ | — |
Obligations of states and political subdivisions | | | 18,055 | | | — | | | 18,055 | | | — |
Corporate securities | | | 2,008 | | | — | | | 1,008 | | | 1,000 |
Trust preferred securities | |
| 2,641 | |
| — | |
| 2,641 | |
| — |
Residential government-sponsored collateralized mortgage obligations | | | 43,057 | | | — | | | 43,057 | | | — |
Government-sponsored agency securities | | | 3,125 | | | — | | | 3,125 | | | — |
Agency commercial mortgage-backed securities | | | 27,304 | | | — | | | 27,304 | | | — |
SBA pool securities | | | 19,885 | | | — | | | 19,885 | | | — |
Total | | $ | 143,377 | | $ | — | | $ | 142,377 | | $ | 1,000 |
| | | | | | | | | | Fair Value Measurements Using | | |||||||||||||||
| (dollars in thousands) | | | Total at December 31, 2017 | | | Quoted Prices in Active Markets for Identical Assets (Level 1) | | | Significant Other Observable Inputs (Level 2) | | | Significant Unobservable Inputs (Level 3) | | ||||||||||||
| Financial assets: | | | | | | | | | | | | | | | | | | | | | | | | | |
| Available for sale investment securities | | | | | | | | | | | | | | | | | | | | | | | | | |
| Residential government-sponsored mortgage-backed securities | | | | $ | 30,864 | | | | | $ | — | | | | | $ | 30,864 | | | | | $ | — | | |
| Obligations of states and political subdivisions | | | | | 18,727 | | | | | | — | | | | | | 18,727 | | | | | | — | | |
| Corporate securities | | | | | 2,015 | | | | | | — | | | | | | 2,015 | | | | | | — | | |
| Trust preferred securities | | | | | 2,388 | | | | | | — | | | | | | 2,388 | | | | | | — | | |
| Residential government-sponsored collateralized mortgage obligations | | | | | 50,766 | | | | | | — | | | | | | 50,766 | | | | | | — | | |
| Government-sponsored agency securities | | | | | 3,226 | | | | | | — | | | | | | 3,226 | | | | | | — | | |
| Agency commercial mortgage-backed securities | | | | | 27,898 | | | | | | — | | | | | | 27,898 | | | | | | — | | |
| SBA pool securities | | | | | 24,789 | | | | | | — | | | | | | 24,789 | | | | | | — | | |
| | | | | $ | 160,673 | | | | | $ | — | | | | | $ | 160,673 | | | | | $ | — | | |
| | |||||||||||||||||||||||||
97
| | | | | | | | | | Fair Value Measurements Using | | |||||||||||||||
| (dollars in thousands) | | | Total at December 31, 2016 | | | Quoted Prices in Active Markets for Identical Assets (Level 1) | | | Significant Other Observable Inputs (Level 2) | | | Significant Unobservable Inputs (Level 3) | | ||||||||||||
| Financial assets: | | | | | | | | | | | | | | | | | | | | | | | | | |
| Available for sale investment securities | | | | | | | | | | | | | | | | | | | | | | | | | |
| Obligations of states and political subdivisions | | | | $ | 2,259 | | | | | $ | — | | | | | $ | 2,259 | | | | | $ | — | | |
| Trust preferred securities | | | | | 1,659 | | | | | | — | | | | | | 1,659 | | | | | | — | | |
| | | | | $ | 3,918 | | | | | $ | — | | | | | $ | 3,918 | | | | | $ | — | | |
| | |||||||||||||||||||||||||
No corporate securities that are classified as Level 3 above were purchased or sold during 2019. These corporate securities did not have a material impact on the income statement for the year ended December 31, 2019.
Assets and Liabilities Measured on a Non-recurring Basis:
Impaired Loans
Generally, we measure the impairment for impaired loans considering the fair value of the loan’s collateral (if the loan is collateral dependent). Fair value of the loan’s collateral is determined by an independent appraisal or evaluation less estimated costs related to selling the collateral. In some cases appraised value is net of costs to sell. Estimated selling costs range from 6%5% to 10% of collateral valuation at December 31, 20172019 and 2016.2018. Fair value is classified as Level 3 in the fair value hierarchy. Loans identified as impaired totaled $20.7$22.0 million (including SBA guarantees of $5.0$4.4 million) as of December 31, 2017 with $0 allocated$1.1 million allocation made to the allowance for loan losses at December 31, 2019 compared to a carrying amount of $13.6$12.1 million (including SBA guarantees of $2.2$3.4 million) with an allocateda $618 thousand allocation made to the allowance for loan losses totaling $900 thousand at December 31, 2016.
Assets held for sale
In connection with the merger with EVBS, SNBV acquired four4 properties that were either former EVBS administrative locations or previously anticipated to be future EVBS administrative locations. As of December 31, 2019, 3 of these properties have been sold. Assets held for sale are measured at fair value less cost to sell, based on appraisals conducted by an independent, licensed appraiser outside of the Company using observable market data. If the fair value is significantly adjusted due to differences in the comparable properties, or is discounted by the Company because of marketability, then the fair value is considered Level 3. Assets held for sale are measured at fair value on a non-recurring basis.basis and are included in other assets in the consolidated balance sheets. Subsequent fair value adjustments are recorded in the period incurred and included in other noninterest expense on the consolidated statements of comprehensive income.
Other Real Estate Owned
OREO is evaluated at the time of acquisition and recorded at fair value as determined by independent appraisal or evaluation less cost to sell. In some cases appraised value is net of costs to sell. Selling costs have been in the range from 5.0%5% to 7.6%10% of collateral valuation at December 31, 20172019 and 2016.2018. Fair value is classified as Level 3 in the fair value hierarchy. OREO is further evaluated quarterly for any additional impairment. At December 31, 20172019 and 2016,2018, the total amount of OREO was $7.6$6.2 million and $8.6$5.1 million, respectively.
98
| | | | | | | | | | Fair Value Measurements Using | | |||||||||||||||
| (dollars in thousands) | | | Total at December 31, 2017 | | | Quoted Prices in Active Markets for Identical Assets (Level 1) | | | Significant Other Observable Inputs (Level 2) | | | Significant Unobservable Inputs (Level 3) | | ||||||||||||
| Impaired loans: | | | | | | | | | | | | | | | | | | | | | | | | | |
| Commercial real estate – owner occupied | | | | $ | 767 | | | | | $ | — | | | | | $ | — | | | | | $ | 767 | | |
Commercial real estate – non-owner occupied(1) | | | | | 766 | | | | | | — | | | | | | — | | | | | | 766 | | |
| Construction and land development | | | | | 9,969 | | | | | | — | | | | | | — | | | | | | 9,969 | | |
| Commercial loans | | | | | 6,035 | | | | | | — | | | | | | — | | | | | | 6,035 | | |
Residential 1-4 family(2) | | | | | 3,160 | | | | | | — | | | | | | — | | | | | | 3,160 | | |
| Assets held for sale | | | | | 1,927 | | | | | | — | | | | | | — | | | | | | 1,927 | | |
| Other real estate owned: | | | | | | | | | | | | | | | | | | | | | | | | | |
| Commercial real estate – owner occupied | | | | | 1,060 | | | | | | — | | | | | | — | | | | | | 1,060 | | |
| Construction and land development | | | | | 3,229 | | | | | | — | | | | | | — | | | | | | 3,229 | | |
Residential 1-4 family(2) | | | | | 3,288 | | | | | | — | | | | | | — | | | | | | 3,288 | | |
| | | | | | | | | | Fair Value Measurements Using | | |||||||||||||||
| (dollars in thousands) | | | Total at December 31, 2016 | | | Quoted Prices in Active Markets for Identical Assets (Level 1) | | | Significant Other Observable Inputs (Level 2) | | | Significant Unobservable Inputs (Level 3) | | ||||||||||||
| Impaired loans: | | | | | | | | | | | | | | | | | | | | | | | | | |
| Commercial real estate – owner occupied | | | | $ | 6,121 | | | | | $ | — | | | | | $ | — | | | | | $ | 6,121 | | |
| Commercial loans | | | | | 5,630 | | | | | | — | | | | | | — | | | | | | 5,630 | | |
Residential 1-4 family(2) | | | | | 963 | | | | | | — | | | | | | — | | | | | | 963 | | |
| Other real estate owned: | | | | | | | | | | | | | | | | | | | | | | | | | |
| Commercial real estate – owner occupied | | | | | 1,110 | | | | | | — | | | | | | — | | | | | | 1,110 | | |
Commercial real estate – non-owner occupied(1) | | | | | 237 | | | | | | — | | | | | | — | | | | | | 237 | | |
| Construction and land development | | | | | 3,863 | | | | | | — | | | | | | — | | | | | | 3,863 | | |
Residential 1-4 family(2) | | | | | 3,407 | | | | | | — | | | | | | — | | | | | | 3,407 | | |
| | | | | | | | | | | | |
| | | | | Fair Value Measurements Using | |||||||
| | | | | | | | Significant | | |
| |
| | | | | Quoted Prices in | | Other | | Significant | |||
| | | | | Active Markets for | | Observable | | Unobservable | |||
| | Total at | | Identical Assets | | Inputs | | Inputs | ||||
(dollars in thousands) |
| December 31, 2019 |
| (Level 1) |
| (Level 2) |
| (Level 3) | ||||
Impaired loans: | | | | | | | | | | | | |
Commercial real estate - owner occupied | | $ | 6,890 | | $ | — | | $ | — |
| $ | 6,890 |
Commercial real estate - non-owner occupied (1) | |
| 3,296 | |
| — | |
| — |
| | 3,296 |
Construction and land development | |
| 345 | |
| — | |
| — |
| | 345 |
Commercial loans | |
| 7,547 | |
| — | |
| — |
| | 7,547 |
Residential 1-4 family (2) | |
| 3,862 | |
| — | |
| — |
| | 3,862 |
Consumer | |
| 39 | |
| — | |
| — |
| | 39 |
Assets held for sale | | | — | | | — | | | — | | | — |
Other real estate owned: | |
| | |
| | |
|
|
| | |
Commercial real estate - owner occupied (1) | |
| 1,984 | |
| — | |
| — |
| | 1,984 |
Construction and land development | |
| 2,874 | |
| — | |
| — |
| | 2,874 |
Residential 1-4 family (2) | |
| 1,366 | |
| — | |
| — |
| | 1,366 |
| | | | | | | | | | | | |
| | | | | Fair Value Measurements Using | |||||||
| | | | | | | | Significant | | | | |
| | | | | Quoted Prices in | | Other | | Significant | |||
| | | | | Active Markets for | | Observable | | Unobservable | |||
| | Total at | | Identical Assets | | Inputs | | Inputs | ||||
(dollars in thousands) |
| December 31, 2018 |
| (Level 1) |
| (Level 2) |
| (Level 3) | ||||
Impaired loans: |
| |
|
| |
|
| |
|
| | |
Commercial real estate - owner occupied | | $ | 2,795 | | $ | — | | $ | — | | $ | 2,795 |
Commercial real estate - non-owner occupied (1) | | | 171 | | | — | | | — | | | 171 |
Commercial loans | |
| 6,076 | |
| — | |
| — | | | 6,076 |
Residential 1-4 family (2) | |
| 3,020 | |
| — | |
| — | | | 3,020 |
Assets held for sale | | | 600 | | | — | | | — | | | 600 |
Other real estate owned: | |
|
| |
|
| |
|
| | |
|
Commercial real estate - owner occupied (1) | |
| 908 | |
| — | |
| — | | | 908 |
Construction and land development | |
| 2,938 | |
| — | |
| — | | | 2,938 |
Residential 1-4 family (2) | |
| 1,231 | |
| — | |
| — | | | 1,231 |
| (1) | Includes loans secured by farmland and multi-family residential loans. |
| (2) | Includes home equity lines of credit. |
99
The carrying amount, estimated fair values and fair value hierarchy levels (previously defined) of financial instruments were as follows (in thousands):
| | | | | | | December 31, 2017 | | | December 31, 2016 | | ||||||||||||||||||
| | | | Fair Value Hierarchy Level | | | Carrying Amount | | | Fair Value | | | Carrying Amount | | | Fair Value | | ||||||||||||
| Financial assets: | | | | | | | | | | | | | | | | | | | | | | | | | | | | |
| Cash and cash equivalents | | | Level 1 | | | | $ | 25,463 | | | | | $ | 25,463 | | | | | $ | 47,392 | | | | | $ | 47,392 | | |
| Securities available for sale | | | Level 2 | | | | | 160,673 | | | | | | 160,673 | | | | | | 3,918 | | | | | | 3,918 | | |
| Securities held to maturity | | | Level 2 | | | | | 98,912 | | | | | | 97,597 | | | | | | 85,300 | | | | | | 83,344 | | |
| Stock in Federal Reserve Bank and Federal Home Loan Bank | | | n/a | | | | | 26,775 | | | | | | n/a | | | | | | 7,929 | | | | | | n/a | | |
| Equity investment in mortgage affiliate | | | Level 3 | | | | | 4,723 | | | | | | 4,723 | | | | | | 4,629 | | | | | | 4,629 | | |
| Preferred investment in mortgage affiliate | | | Level 3 | | | | | 3,305 | | | | | | 3,305 | | | | | | 2,555 | | | | | | 2,555 | | |
| Net loans | | | Level 3 | | | | | 2,052,931 | | | | | | 2,058,779 | | | | | | 921,805 | | | | | | 935,258 | | |
| Accrued interest receivable | | | Level 2 & Level 3 | | | | | 8,073 | | | | | | 8,073 | | | | | | 3,202 | | | | | | 3,202 | | |
| FDIC indemnification asset | | | Level 3 | | | | | 1,353 | | | | | | 309 | | | | | | 2,111 | | | | | | 528 | | |
| Financial liabilities: | | | | | | | | | | | | | | | | | | | | | | | | | | | | |
| Demand deposits | | | Level 1 | | | | | 649,067 | | | | | | 649,067 | | | | | | 124,779 | | | | | | 124,779 | | |
| Money market and savings accounts | | | Level 1 | | | | | 517,031 | | | | | | 517,031 | | | | | | 182,590 | | | | | | 182,590 | | |
| Certificates of deposit | | | Level 3 | | | | | 699,058 | | | | | | 694,368 | | | | | | 605,613 | | | | | | 605,394 | | |
| Securities sold under agreements to repurchase | | | Level 1 | | | | | 15,468 | | | | | | 15,468 | | | | | | — | | | | | | — | | |
| FHLB short term advances | | | Level 1 | | | | | 335,615 | | | | | | 335,615 | | | | | | 95,000 | | | | | | 95,000 | | |
| Junior subordinated debt | | | Level 2 | | | | | 9,534 | | | | | | 12,043 | | | | | | — | | | | | | — | | |
| Senior subordinated notes | | | Level 2 | | | | | 47,128 | | | | | | 58,163 | | | | | | — | | | | | | — | | |
| Accrued interest payable | | | Level 1 & Level 3 | | | | | 2,273 | | | | | | 2,273 | | | | | | 1,190 | | | | | | 1,190 | | |
| | | | | | | | | | | | | | |
| | | | December 31, 2019 | | December 31, 2018 | ||||||||
|
| Fair Value |
| Carrying |
| Fair |
| Carrying |
| Fair | ||||
| | Hierarchy Level | | Amount | | Value | | Amount | | Value | ||||
Financial assets: |
|
|
| |
|
| |
|
| |
|
| |
|
Cash and cash equivalents |
| Level 1 | | $ | 31,928 | | $ | 31,928 | | $ | 28,611 | | $ | 28,611 |
Securities available for sale |
| Level 2 & Level 3 | |
| 164,820 | |
| 164,820 | |
| 143,377 | |
| 143,377 |
Securities held to maturity |
| Level 2 | |
| 72,448 | |
| 72,666 | |
| 92,462 | |
| 89,109 |
Stock in Federal Reserve Bank and Federal Home Loan Bank |
| Level 2 | |
| 17,832 | |
| 17,832 | |
| 19,522 | |
| 19,522 |
Equity investment in mortgage affiliate |
| Level 3 | |
| 5,020 | |
| 5,020 | |
| 3,829 | |
| 3,829 |
Preferred investment in mortgage affiliate |
| Level 3 | |
| 3,305 | |
| 3,305 | |
| 3,305 | |
| 3,305 |
Net loans |
| Level 3 | |
| 2,175,786 | |
| 2,180,487 | |
| 2,166,541 | |
| 2,134,021 |
Accrued interest receivable |
| Level 2 & Level 3 | |
| 8,210 | |
| 8,210 | |
| 8,745 | |
| 8,745 |
Financial liabilities: |
|
| |
| | |
| | |
| | |
| |
Demand deposits and NOW accounts |
| Level 2 | | $ | 730,325 | | $ | 730,325 | | $ | 665,640 | | $ | 665,640 |
Money market and savings accounts |
| Level 2 | |
| 611,353 | |
| 611,353 | |
| 506,519 | |
| 506,519 |
Time deposits |
| Level 3 | |
| 783,040 | |
| 786,420 | |
| 925,441 | |
| 919,175 |
Securities sold under agreements to repurchase |
| Level 1 | |
| 12,883 | |
| 12,883 | |
| 18,721 | |
| 18,721 |
FHLB short term advances |
| Level 1 | |
| 121,640 | |
| 121,640 | |
| 163,340 | |
| 163,340 |
Junior subordinated debt |
| Level 2 | |
| 9,632 | |
| 9,206 | |
| 9,584 | |
| 12,065 |
Senior subordinated notes |
| Level 2 | |
| 47,051 | |
| 48,156 | |
| 47,089 | |
| 57,173 |
Accrued interest payable |
| Level 1 & Level 3 | |
| 4,907 | |
| 4,907 | |
| 3,985 | |
| 3,985 |
Carrying amount is the estimated fair value for cash and cash equivalents (including federal funds sold), equity investment in mortgage affiliate, preferred investment in mortgage affiliate, accrued interest receivable and payable, demand deposits, savings accounts, money market accounts and short-term debt (FHLB short-term advances and securities sold under agreements to repurchase, short-term debt, and variable rate loans that reprice frequently and fully. For fixed rate loans or deposits andrepurchase).
The investment in common stock of our mortgage affiliate is accounted for variable rate loans with infrequent repricing or repricing limits, fair value is based on discounted cash flows using current market rates applied to the estimated life. A discount for liquidity risk was not considered necessary in estimatingequity method. Under the fairequity method, the carrying value of loans. ItSouthern National’s investment in STM was originally recorded at cost but is adjusted periodically to record Southern National’s proportionate share of STM’s earnings or losses through noninterest income and decreased by the amount of cash dividends or similar distributions received from STM. The investment in preferred stock of our mortgage affiliate is considered to be a non-marketable equity security that does not practicable to determinehave a readily determinable fair value. Non-marketable equity securities with no recurring market value data available are reviewed periodically and any observable market value change are adjusting through noninterest income. Southern National evaluates its investments in this non-marketable equity security for impairment and recoverability of the fair valuerecorded investment by considering positive and negative evidence, including the profitability and asset quality of Federal Reserve BankSTM, dividend payment history and Federal Home Loan Bank stock due to restrictions placed on its transferability. recent redemption experience. Impairment is assessed at each reporting period and if identified, is recognized in noninterest income.
Fair value of long-term debt is based on current rates for similar financing. TheCarrying amount of Federal Reserve Bank and Federal Home Loan Bank stock is a reasonable estimate of fair value as these securities are not readily marketable and are based on the ultimate recoverability of the FDIC indemnification asset was determined by discounting estimated future cash flows using the long-term risk free rate plus a premium and represents the present value of our current expectation for recoveries from the FDIC on covered loans.par value. The fair value of off-balance-sheet items is not considered material. The fairFair value of net loans, is not presented on an exit price basis.
time deposits, junior subordinated debt, and senior subordinated notes are measured using the exit-price notion in accordance with the adoption of ASU 2016-01.
100
Bank premises and equipment as of December 31, 20172019 and 20162018 were as follows (in thousands):
| | | | | | |
| | 2019 | | 2018 | ||
Land | | $ | 8,139 | | $ | 8,139 |
Land improvements | |
| 1,558 | |
| 1,558 |
Building and improvements | |
| 23,164 | |
| 23,132 |
Leasehold improvements | |
| 2,933 | |
| 2,933 |
Furniture and equipment | |
| 8,789 | |
| 8,349 |
Construction in progress | |
| 719 | |
| 133 |
| |
| 45,302 | |
| 44,244 |
Less accumulated depreciation and amortization | |
| 14,118 | |
| 11,892 |
Bank premises and equipment, net | | $ | 31,184 | | $ | 32,352 |
Depreciation and amortization expense related to bank premises and equipment for 2019, 2018 and 2017 was $2.3 million, $3.3 million and $2.2 million, respectively.
6. LEASES
The Company leases certain premises and equipment under operating leases. In recognizing lease right-of-use assets and related liabilities, we account for lease and non-lease components (such as taxes, insurance, and common area maintenance costs) separately as such amounts are generally readily determinable under our lease contracts. At December 31, 2019, the Company had operating lease liabilities totaling $8.5 million and right-of-use assets totaling $8.0 million related to these leases. Operating lease liabilities and right-of-use assets are reflected in our consolidated balance sheets. We do not currently have any financing leases. For the year ended December 31, 2019, our net operating lease cost was $2.5 million and was reflected in occupancy expenses on our income statement.
The following table presents supplemental cash flow and other information related to our operating leases:
| | | | |
| | For the Year Ended | | |
(in thousands except for percent and period data) | | December 31, 2019 | | |
Supplemental cash flow information: | | | | |
Cash paid for amounts included in the measurement of lease liabilities | | $ | 4,883 | |
Right-of-use assets obtained in exchange for new operating lease liabilities | | $ | — | |
| | | | |
Other information: | | | | |
Weighted-average remaining lease term - operating leases, in years | | | 5.7 | |
Weighted-average discount rate - operating leases | |
| 2.8 | % |
The following table summarizes the maturity of remaining lease liabilities:
| | | |
| | | |
| | As of | |
(dollars in thousands) | | December 31, 2019 | |
Lease payments due: | | | |
Less than one year | | $ | 2,386 |
One to three years | | | 3,139 |
Three to five years | | | 2,067 |
More than five years | |
| 1,654 |
Total lease payments | | | 9,246 |
Less: imputed interest | | | (777) |
Lease liabilities | | $ | 8,469 |
| | | | 2017 | | | 2016 | | ||||||
| Land | | | | $ | 8,133 | | | | | $ | 2,261 | | |
| Land improvements | | | | | 2,027 | | | | | | — | | |
| Building and improvements | | | | | 33,928 | | | | | | 5,842 | | |
| Leasehold improvements | | | | | 3,217 | | | | | | 2,428 | | |
| Furniture and equipment | | | | | 20,022 | | | | | | 4,332 | | |
| Construction in progress | | | | | 41 | | | | | | — | | |
| | | | | | 67,368 | | | | | | 14,863 | | |
| Less accumulated depreciation and amortization | | | | | 31,580 | | | | | | 6,636 | | |
| Bank premises and equipment, net | | | | $ | 35,788 | | | | | $ | 8,227 | | |
| | |||||||||||||
101
As of December 31, 2019, the Company does not have or expect any operating leases that have not yet commenced or will create additional lease liabilities and right-of-use assets for the Company.
As of December 31, 2018, future minimum rental payments required under non-cancelable operating leases for bank premises that havehad initial or remaining terms in excess of one year as of December 31, 2017 areaccounted for under the previous lease accounting guidance were as follows (in thousands):
| | 2018 | | | | $ | 2,554 | | |
| | 2019 | | | | | 2,208 | | |
| | 2020 | | | | | 1,767 | | |
| | 2021 | | | | | 1,102 | | |
| | 2022 | | | | | 1,074 | | |
| | Thereafter | | | | | 3,141 | | |
| | Total | | | | $ | 11,846 | | |
| | ||||||||
Goodwill
Southern National has recorded $100.6 million and $10.5$101.9 million of goodwill at December 31, 2019 and 2018. Goodwill is primarily related to the acquisition of EVBS, which increased goodwill by $90.1 million in 2017. During 2018, as part of recognition of all measurement period adjustments, we recognized additional goodwill of $1.3 million related to the 2017 and 2016, respectively. acquisition of EVBS.
Goodwill is evaluated for impairment on an annual basis or more frequently if events or circumstances warrant. Goodwill is primarily related to the 2017 acquisition of EVBS, which increased goodwill by $90.1 million. Our annual assessment timing is during the third calendar quarter. For the 20172019 assessment, we performed a qualitative assessment to determine if it was more likely than not that the fair value of our single reporting unit is less than its carrying amount. We concluded that the fair value of our single reporting unit exceeded its carrying amount and that it was not necessary to perform the two-step quantitative impairmenttest pursuant to ASC 350-20. Our qualitative assessment considered many factors including, but not limited to, our actual and projected operating performance and profitability, as well as consideration of recent bank merger and acquisition transaction metrics. No impairment was indicated in 20172019, 2018 or 2016.
Intangible Assets
Intangible assets were as follows at year end (in thousands):
| | | | | | | | | |
| | December 31, 2019 | |||||||
|
| Gross Carrying |
| Accumulated |
| Net Carrying | |||
| | Value | | Amortization | | Value | |||
Amortizable core deposit intangibles | | $ | 17,503 | | $ | (10,312) | | $ | 7,191 |
| | | | | | | | | |
| | December 31, 2018 | |||||||
|
| Gross Carrying |
| Accumulated |
| Net Carrying | |||
| | Value | | Amortization | | Value | |||
Amortizable core deposit intangibles | | $ | 17,503 | | $ | (8,894) | | $ | 8,609 |
| | | | December 31, 2017 | | |||||||||||||||
| | | | Gross Carrying Value | | | Accumulated Amortization | | | Net Carrying Value | | |||||||||
| Amortizable core deposit intangibles | | | | $ | 17,503 | | | | | $ | (7,449) | | | | | $ | 10,054 | | |
| | | | December 31, 2016 | | |||||||||||||||
| | | | Gross Carrying Value | | | Accumulated Amortization | | | Net Carrying Value | | |||||||||
| Amortizable core deposit intangibles | | | | $ | 7,477 | | | | | $ | (6,603) | | | | | $ | 874 | | |
102
Estimated amortization expense of intangibles for the years ended December 31 were as follows (in thousands):
| | 2018 | | | | $ | 1,471 | | |
| | 2019 | | | | | 1,438 | | |
| | 2020 | | | | | 1,377 | | |
| | 2021 | | | | | 1,377 | | |
| | 2022 | | | | | 1,337 | | |
| | Thereafter | | | | | 3,203 | | |
| | Total | | | | $ | 10,203 | | |
| | ||||||||
The indemnification asset representsrepresented our estimate of future expected recoveries under the FDIC loss sharing arrangement for covered loans acquired in the GAB acquisition in 2009. The estimated fair value of the indemnification asset was $8.8 million at December 4, 2009, the date of acquisition. The following table presents changes in the indemnification asset for the periods indicated (in thousands):
| | | | 2017 | | | 2016 | | ||||||
| Balance as of January 1 | | | | $ | 2,111 | | | | | $ | 2,922 | | |
| Payments from FDIC | | | | | (46) | | | | | | (18) | | |
| Amortization | | | | | (712) | | | | | | (793) | | |
| Balance as of December 31 | | | | $ | 1,353 | | | | | $ | 2,111 | | |
| | |||||||||||||
| | | | | | |
|
| 2019 |
| 2018 | ||
Balance as of January 1 | | $ | 649 | | $ | 1,353 |
Payments from FDIC | |
| — | |
| — |
Amortization | |
| (649) | |
| (704) |
Balance as of December 31, | | $ | — | | $ | 649 |
There were two2 agreements with the FDIC, one1 for single family assets which iswas a 10-year agreement expiring inwhich expired on December 31, 2019, and one1 for non-single family (commercial) assets which was a 5-year agreement which expired inon December 31, 2014. The current overstatement is due to improvements in the loss estimates in the single family covered loans.
The aggregate amount of time deposits in denominations of $250 thousand or more at December 31, 20172019 and 20162018 was $171.0$163.2 million and $147.6$190.6 million, respectively.
At December 31, 2017,2019, the scheduled maturities of time deposits are as follows (in thousands):
| | 2018 | | | | $ | 402,078 | | |
| | 2019 | | | | | 190,455 | | |
| | 2020 | | | | | 49,378 | | |
| | 2021 | | | | | 34,325 | | |
| | 2022 | | | | | 22,822 | | |
| | Total | | | | $ | 699,058 | | |
| | ||||||||
| | | |
2020 |
| $ | 554,168 |
2021 | |
| 154,289 |
2022 | |
| 53,897 |
2023 | |
| 10,009 |
2024 | |
| 10,677 |
Total | | $ | 783,040 |
The following table sets forth the maturities of certificates of deposit of $250 thousand and over as of December 31, 20172019 (in thousands):
| | Within 3 Months | | | 3 to 6 Months | | | 6 to 12 Months | | | Over 12 Months | | | Total | |
| | $26,041 | | | $23,576 | | | $28,589 | | | $92,807 | | | $171,013 | |
| | | | | | | | | | | | | |
Within |
| 3 to 6 |
| 6 to 12 |
| Over 12 |
|
| | ||||
3 Months | | Months | | Months | | Months | | Total | |||||
$ | 38,800 | | $ | 15,576 | | $ | 37,932 | | $ | 70,866 | | $ | 163,174 |
As of December 31, 2017,2019, we had brokered certificates of deposit in the amount of $109.8$114.1 million and brokered money market deposits of $17.0$24.4 million. At December 31, 2016,2018, we had brokered certificates of deposit in the amount of $66.5$254.6 million, and we had brokered money market deposits of $14.2$16.9 million.
103
For our deposit agreements with certain customers, we hold the collateral in a segregated custodial account. We are required to maintain adequate collateral levels. In the event the collateral fair value falls below stipulated levels, we will pledge additional securities. We closely monitor collateral levels to ensure adequate levels are maintained, while mitigating the potential risk of over-collateralization.
Short-term borrowings can consist of FHLB of Atlanta overnight advances, other FHLB advances maturing within one year, federal funds purchased and securities sold under agreements to repurchase (“repo”) that mature within one year, which are secured transactions with customers. During the second quarter of 2016, the Company discontinued offeringThe balance in repo accounts. However, repo accounts totaling $7.6 million were assumed on June 23, 2017 in the merger with EVBS. During the third quarter of 2017 the Company determined that it will continue to offer repo accounts, and the balance at December 31, 20172019 and 2018 was $15.5 million.
At December 31, 20172019 and 2016,2018, we have pledged callable agency securities, residential government-sponsored mortgage-backed securities and collateralized mortgage obligations with a carrying value of $24.2$22.0 million and $13.6$28.5 million, respectively, to customers who require collateral for overnight repurchase agreements and other deposits.
Short-term borrowings consist of the following (in thousands):
| | | | December 31, | | |||||||||||||||
| | | | 2017 | | | 2016 | | | 2015 | | |||||||||
| FHLB overnight advances | | | | $ | 56,860 | | | | | $ | 50,000 | | | | | $ | 49,000 | | |
| Other short-term FHLB advances maturing 6/27/2018 | | | | | 10,000 | | | | | | — | | | | | | — | | |
| Other short-term FHLB advances maturing 6/20/2018 | | | | | 27,200 | | | | | | — | | | | | | — | | |
| Other short-term FHLB advances maturing 6/14/2018 | | | | | 10,000 | | | | | | — | | | | | | — | | |
| Other short-term FHLB advances maturing 6/13/2018 | | | | | 80,640 | | | | | | — | | | | | | — | | |
| Other short-term FHLB advances maturing 6/12/2018 | | | | | 10,000 | | | | | | — | | | | | | — | | |
| Other short-term FHLB advances maturing 3/28/2018 | | | | | 30,000 | | | | | | — | | | | | | — | | |
| Other short-term FHLB advances maturing 3/14/2018 | | | | | 80,640 | | | | | | — | | | | | | — | | |
| Other short-term FHLB advances maturing 3/13/2018 | | | | | 30,275 | | | | | | — | | | | | | — | | |
| Other short-term FHLB advances maturing 3/27/2017 | | | | | — | | | | | | 10,000 | | | | | | — | | |
| Other short-term FHLB advances maturing 5/4/2017 | | | | | — | | | | | | 10,000 | | | | | | — | | |
| Other short-term FHLB advances maturing 6/5/2017 | | | | | — | | | | | | 10,000 | | | | | | — | | |
| Other short-term FHLB advances maturing 6/19/2017 | | | | | — | | | | | | 5,000 | | | | | | — | | |
| Other short-term FHLB advances maturing 12/15/2017 | | | | | — | | | | | | 10,000 | | | | | | — | | |
| Other short-term FHLB advances maturing 11/4/2016 | | | | | — | | | | | | — | | | | | | 10,000 | | |
| Securities sold under agreements to repurchase | | | | | 15,468 | | | | | | — | | | | | | 10,381 | | |
| Total | | | | $ | 351,083 | | | | | $ | 95,000 | | | | | $ | 69,381 | | |
| Weighted average interest rate at year end | | | | | 1.50% | | | | | | 0.86% | | | | | | 0.51% | | |
| For the periods ended December 31, 2017, 2016 and 2015: | | | | | | | | | | | | | | | | | | | |
| Average outstanding balance | | | | $ | 177,983 | | | | | $ | 66,864 | | | | | $ | 34,673 | | |
| Average interest rate during the year | | | | | 1.24% | | | | | | 0.74% | | | | | | 0.76% | | |
| Maximum month-end outstanding balance | | | | $ | 351,083 | | | | | $ | 95,000 | | | | | $ | 69,381 | | |
| | | | | | | |
| | December 31, | | ||||
|
| 2019 |
| 2018 |
| ||
| | | | | | | |
FHLB overnight advances |
| $ | 81,000 |
| $ | 5,500 | |
Short-term FHLB advances maturing 3/10/2020 | | | 40,640 | | | — | |
Short-term FHLB advances maturing 6/27/2019 | | | — | | | 40,000 | |
Short-term FHLB advances maturing 6/18/2019 | | | — | | | 27,200 | |
Short-term FHLB advances maturing 6/12/2019 | | | — | | | 10,000 | |
Short-term FHLB advances maturing 6/11/2019 | | | — | | | 80,640 | |
Total FHLB advances | | | 121,640 | | | 163,340 | |
Securities sold under agreements to repurchase |
|
| 12,883 |
|
| 18,721 | |
Total |
| $ | 134,523 |
| $ | 182,061 | |
| | | | | | | |
Weighted average interest rate at year end |
| | 1.75 | % | | 2.68 | % |
Each FHLB advance is payable at its maturity date, with a prepayment penalty for fixed rate advances paid off earlier than maturity. Residential 1-4 family mortgage loans in the amount of approximately $323.3$376.3 million and $128.9$347.4 million were pledged as collateral for FHLB advances as of December 31, 20172019 and 2016,2018, respectively. Home equity lines of credit (“HELOCs”)HELOCs in the amount of approximately $82.0$46.9 million and $17.5$54.7 million were pledged as collateral for FHLB advances at December 31, 20172019 and 2016,2018, respectively. Commercial mortgage loans in the amount of approximately $124.4$76.6 million and $172.6$107.7 million were pledged as collateral for FHLB advances as of December 31, 20172019 and 2016,2018, respectively. Investment securities in the amount of $26.0$17.6 million and $46.7$25.3 million were pledged as collateral for FHLB advances at December 31, 20172019 and 2016,2018, respectively. At December 31, 2017,2019, Sonabank had available collateral to borrow an additional $314.2$554.3 million from the FHLB.
11. JUNIOR SUBORDINATED DEBT AND SENIOR SUBORDINATED NOTES
In connection with our merger with EVBS, the Company assumed $10.3 million (fair value adjustment of $801 thousand) of trust preferred securities that were issued on September 17, 2003 and placed through the Trust in a pooled underwriting totaling approximately $650 million. The trust issuer has invested the total proceeds from the sale of the trust preferred securities in Floating Rate Junior Subordinated Deferrable Interest Debentures (“Junior Subordinated Debt”) issued by EVBS. At December 31, 2019 and 2018, we had $9.6 million of Junior Subordinated Debt. The trust preferred securities pay cumulative cash distributions quarterly at a variable rate per annum, reset quarterly, equal to the 3-month LIBOR plus 2.95%. As of December 31, 20172019 and 2016,2018, the interest rate was 4.55%4.85% and 3.94%5.73%, respectively. The dividends paid to holders of the trust preferred securities, which are recorded as interest expense, are deductible for income tax purposes. The trust preferred securities have a mandatory redemption date
104
The trust preferred securities may be included in Tier 1 capital for regulatory capital adequacy determination purposes up to 25% of Tier 1 capital after its inclusion. At December 31, 2017,2019, all of the trust preferred securities qualified as Tier 1 capital.
On January 20, 2017, Southern National completed the sale of $27.0 million of its fixed-to-floating rate Subordinated Notes due 2027 (the “SNBV Senior Subordinated Notes”). The SNBV Senior Subordinated Notes will initially bear interest at 5.875% per annum until January 31, 2022; thereafter, the SNBV Senior Subordinated Notes will be payable at an annual floating rate equal to three-month LIBOR plus a spread of 3.95% until maturity or early redemption. At December 31, 2017,2019, all of the SNBV Senior Subordinated Notes qualified as Tier 2 capital. At December 31, 2017,2019, the remaining unamortized debt issuance costs related to the SNBV Senior Subordinated Notes totaled $854$666 thousand.
Also in connection with our merger with EVBS, the Company assumed the Senior Subordinated Note Purchase Agreement previously entered into by EVBS on April 22, 2015 with certain institutional accredited investors pursuant to which EVBS sold $20.0 million (fair value adjustment of $1.9 million) in aggregate principal amount of its 6.50% Fixed-to-Floating Rate Subordinated Notes due 2025 (the “EVBS Senior Subordinated Notes”) to the investors at a price equal to 100% of the aggregate principal amount of the EVBS Senior Subordinated Notes. The EVBS Senior Subordinated Notes bear interest at an annual rate of 6.50%, payable semi-annually in arrears on May 1 and November 1 of each year ending on May 1, 2020. From and including May 1, 2020 to, but excluding, the maturity date, the EVBS Senior Subordinated Notes will bear interest at an annual rate, reset quarterly, equal to LIBOR determined on the determination date of the applicable interest period plus 502 basis points, payable quarterly in arrears on February 1, May 1, August 1 and November 1 of each year, beginning on August 1, 2020. The Company may, at its option, redeem, in whole or in part, the EVBS Senior Subordinated Notes as early as May 1, 2020, and any partial redemption would be made pro rata among all of the holders. At December 31, 20172019 all of the EVBS Senior Subordinated Notes qualified as Tier 2 capital.
At December 31, 2019 and 2018, we had $47.1 million of Senior Subordinated Notes.
Deferred income taxes reflect the net tax effects of temporary differences between the carrying amounts of assets and liabilities for financial reporting and income tax purposes. Net deferred tax assets at December 31, 20172019 and 20162018 consist primarily of the following:following (in thousands):
| | | | 2017 | | | 2016 | | ||||||
| Deferred tax assets: | | | | | | | | | | | | | |
| Allowance for loan losses | | | | $ | 2,100 | | | | | $ | 2,997 | | |
| Organization costs | | | | | 78 | | | | | | 72 | | |
| Unearned loan fees and other | | | | | 987 | | | | | | 656 | | |
| Other real estate owned write-downs | | | | | 794 | | | | | | 945 | | |
| Other than temporary impairment charge | | | | | 235 | | | | | | 369 | | |
| Net unrealized loss on investment securities available for sale | | | | | 367 | | | | | | 406 | | |
| Purchase accounting | | | | | 3,411 | | | | | | 934 | | |
| Federal net operating loss carryforward | | | | | 4,845 | | | �� | | | — | | |
| Federal AMT credit carryforward | | | | | 1,137 | | | | | | — | | |
| Federal low income housing credit carryforward | | | | | 2,386 | | | | | | — | | |
| Deferred compensation | | | | | 1,114 | | | | | | 878 | | |
| Other | | | | | 712 | | | | | | 871 | | |
| Total deferred tax assets | | | | | 18,166 | | | | | | 8,128 | | |
| Deferred tax liabilities: | | | | | | | | | | | | | |
| FDIC indemnification asset | | | | | 300 | | | | | | 735 | | |
| Depreciation | | | | | 963 | | | | | | 613 | | |
| Total deferred tax liabilities | | | | | 1,263 | | | | | | 1,348 | | |
| Net deferred tax assets | | | | $ | 16,903 | | | | | $ | 6,780 | | |
| | |||||||||||||
| | | | | | |
|
| 2019 |
| 2018 | ||
Deferred tax assets: |
| |
|
| |
|
Allowance for loan losses | | $ | 2,235 | | $ | 2,686 |
Unearned loan fees and other | |
| 1,064 | |
| 1,058 |
Other real estate owned write-downs | |
| 748 | |
| 783 |
Lease liability | | | 1,829 | | | — |
Other than temporary impairment charge | |
| 229 | |
| 232 |
Net unrealized loss on investment securities available for sale | |
| — | |
| 694 |
Purchase accounting | |
| 949 | |
| 1,909 |
Federal and state net operating loss carryforward | |
| — | |
| 762 |
Federal AMT credit carryforward | |
| 1,137 | |
| 1,137 |
Federal low income housing credit carryforward | |
| 3,226 | |
| 2,887 |
Deferred compensation | |
| 1,573 | |
| 1,390 |
Depreciation | | | 218 | | | — |
Other | |
| 511 | |
| 729 |
Total deferred tax assets | |
| 13,719 | |
| 14,267 |
Deferred tax liabilities: | |
|
| |
|
|
FDIC indemnification asset | |
| — | |
| 140 |
Right-of-use assets | | | 1,731 | | | — |
Net unrealized gain on investment securities available for sale | | | 200 | | | — |
Depreciation | |
| — | |
| 23 |
Total deferred tax liabilities | |
| 1,931 | |
| 163 |
Net deferred tax assets | | $ | 11,788 | | $ | 14,104 |
NaN valuation allowance was deemed necessary on deferred tax assets in 20172019 or 2016.2018. Management believes that the realization of the deferred tax assets is more likely than not based on the expectation that Southern National will generate the necessary taxable income in future periods.
105
We have no0 unrecognized tax benefits and do not anticipate any increase in unrecognized tax benefits during the next twelve months. Should the accrual of any interest or penalties relative to unrecognized tax benefits be necessary, it is our policy to record such accruals in our income tax accounts; no0 such accruals existed as of December 31, 2017, 20162019, 2018 or 2015.2017. Southern National and its subsidiaries file a consolidated U.S. federal income tax return, and Southern National files a Virginia state income tax return. Sonabank files a Maryland state income tax return. These returns are subject to examination by taxing authorities for all years after 2013.
The provision for income taxes consists of the following for the years ended December 31, 2017, 20162019, 2018 and 20152017 (in thousands):
| | | | 2017 | | | 2016 | | | 2015 | | |||||||||
| Current tax expense | | | | | | | | | | | | | | | | | | | |
| Federal | | | | $ | 3,145 | | | | | $ | 4,781 | | | | | $ | 2,367 | | |
| State | | | | | 316 | | | | | | 285 | | | | | | 168 | | |
| Total current tax expense | | | | | 3,461 | | | | | | 5,066 | | | | | | 2,535 | | |
| Deferred tax benefit | | | | | | | | | | | | | | | | | | | |
| Federal | | | | | 10,234 | | | | | | 28 | | | | | | 2,123 | | |
| State | | | | | (548) | | | | | | 1 | | | | | | 9 | | |
| Total deferred tax expense | | | | | 9,686 | | | | | | 29 | | | | | | 2,132 | | |
| Total income tax expense | | | | $ | 13,147 | | | | | $ | 5,095 | | | | | $ | 4,667 | | |
| | |||||||||||||||||||
| | | | | | | | | |
|
| 2019 |
| 2018 |
| 2017 | |||
Current tax expense |
| |
|
| |
|
| |
|
Federal | | $ | 4,429 | | $ | 6,244 | | $ | 3,145 |
State | |
| 228 | |
| 249 | |
| 316 |
Total current tax expense | |
| 4,657 | |
| 6,493 | |
| 3,461 |
| | | | | | | | | |
Deferred tax expense (benefit) | |
|
| |
|
| |
|
|
Federal | |
| 1,350 | |
| 2,692 | |
| 10,234 |
State | |
| 70 | |
| 429 | |
| (548) |
Total deferred tax expense | |
| 1,420 | |
| 3,121 | |
| 9,686 |
Total income tax expense | | $ | 6,077 | | $ | 9,614 | | $ | 13,147 |
The income tax expense differed from the amount of income tax determined by applying the U.S. Federal income tax rate of 34%21% to pretax income for the years ended December 31, 2017, 20162019 and 20152018 and 34% to pretax income for the year ended December 31, 2017 due to the following (in thousands):
| | | | 2017 | | | 2016 | | | 2015 | | |||||||||
| Computed expected tax expense at statutory rate | | | | $ | 5,294 | | | | | $ | 5,238 | | | | | $ | 4,745 | | |
| Reduction in tax expense resulting from: | | | | | | | | | | | | | | | | | | | |
| Income from bank-owned life insurance | | | | | (316) | | | | | | (238) | | | | | | (216) | | |
| Other, net | | | | | 234 | | | | | | 95 | | | | | | 138 | | |
| Transaction costs | | | | | 724 | | | | | | — | | | | | | — | | |
| Provisional tax adjustment related to reduction in U.S. federal statutory income tax rate | | | | | 7,211 | | | | | | — | | | | | | — | | |
| Income tax expense | | | | $ | 13,147 | | | | | $ | 5,095 | | | | | $ | 4,667 | | |
| | |||||||||||||||||||
| | | | | | | | | |
|
| 2019 |
| 2018 |
| 2017 | |||
Computed expected tax expense at statutory rate | | $ | 8,241 | | $ | 9,094 | | $ | 5,294 |
Increase (decrease) in tax expense resulting from: | |
|
| |
|
| |
|
|
Remeasurement of deferred tax assets and liabilities | | | (1,659) | | | 1,130 | | | — |
Low income housing tax credits, net of amortization | | | (255) | | | (502) | | | — |
Income from bank-owned life insurance | |
| (357) | |
| (416) | |
| (316) |
Other, net | |
| 107 | |
| 308 | |
| 234 |
Transaction costs | |
| — | |
| — | |
| 724 |
Tax adjustment related to reduction in U.S. federal statutory income tax rate | |
| — | |
| — | |
| 7,211 |
Income tax expense | | $ | 6,077 | | $ | 9,614 | | $ | 13,147 |
During 2018, the Company determined that certain net operating loss carryforwards were impaired due to Section 382 limitations. During 2019, the Company completed its formal assessment of the Section 382 limitation and rebooked $1.2 million deferred tax asset stemming from a $5.5 million acquired net operating loss carryforward that was written off in the fourth quarter of 2018. Additionally, the Company remeasured the depreciation deferred tax liability by $0.6 million, net, to reflect a 2018 adjustment to the assets held for sale not previously included.
Income tax expense for 2017 was impacted by the adjustment of our deferred tax assets and liabilities related to the reduction in the U.S. federal statutory income tax rate to 21% under the Tax Cuts and Jobs Act, which was enacted on December 22, 2017. As a result of the new law, which is more fully discussed below,Tax Cuts and Jobs Act, we recognized additional income tax expense totaling $7.2 million in 2017, as reported in the rate change line item in the table above.
13.
Southern National has a 401(k) plan that allows employees to make pre-tax contributions for retirement. The 401(k) plan provides for discretionary matching contributions by Southern National. Expense for 2019, 2018 and 2017 2016was $704 thousand, $784 thousand and 2015 was $433 thousand, $132 thousand and $108 thousand, respectively.
106
A deferred compensation plan that covers two2 executive officers was established in 2007. Under the plan, the Bank pays each participant, or their beneficiary, the amount of compensation deferred plus accrued interest over 10 years, beginning with the individual’s retirement. A liability is accrued for the obligation under these plans.
In connection with our merger with EVBS, Southern National assumed the EVBS Supplemental Executive Retirement Plan, which had two2 participants. The normal retirement benefits for both participants became fully vested as a result of the merger. The completion of the merger, however, did not accelerate the time of payment under the EVBS Supplemental Executive Retirement Plan. For one participant, benefits are to be paid in equal monthly installments over a 15-year period. There is no pre-retirement benefit, but a beneficiary can be named to receive the remaining payments for the 15-year
The expense incurred for the deferred compensation plans in 2019, 2018 and 2017 2016was $1.2 million, $1.2 million and 2015 was $415 thousand, $495 thousand and $403 thousand, respectively. The deferred compensation plan liability was $5.0$7.3 million and $2.5$6.1 million as of December 31, 20172019 and 2016,2018, respectively.
At the June 21, 2017 Annual Meeting of Stockholders of Southern National, the 2017 Equity Compensation Plan (the “2017 Plan”) was approved as recommended by the Board of Directors. The 2017 Plan replacesreplaced the 2010 Plan and has a maximum number of 750,000 shares reserved for issuance. The purpose of the 2017 Plan iswas to promote the success of the Company by providing greater incentive to employees, non-employee directors, consultants and advisors to associate their personal interests with the long-term financial success of the Company, including its subsidiaries, and with growth in stockholder value, consistent with the Company’s risk management practices. Because the 2017 Plan was approved, shares under the 2004 stock-option plan or 2010 Plan willwere to be no longer be awarded.
Southern National granted no0 regular options during 2019 and 2018, but in 2017 but did issueissued 22,559 options under the 2017 Plan in connection with the merger with EVBS which options were previously outstanding under the EVBS 2003 Stock Incentive Plan. Immediately prior to the effective time of the merger, each option to purchase shares of EVBS common stock granted under an EVBS stock plan vested and was converted into and became an option to purchase shares of common stock of SNBV (each, an “Assumed Option”), which was adjusted (i) by multiplying the number of shares of common stock that could be purchased under the Assumed Option by the 0.6313 exchange ratio and rounding down to the nearest share and (ii) by dividing the per share exercise price of the option by the 0.6313 exchange ratio and rounding up to the nearest cent. SNBV assumed each Assumed Option in accordance with the terms of the EVBS stock plan and award agreement by which it is evidenced.
| | | | 2016 | | | 2015 | | ||||||
| Expected life | | | 10 years | | | 10 years | | ||||||
| Expected volatility | | | | | 14.16% | | | | | | 14.71% | | |
| Risk-free interest rate | | | | | 1.62% | | | | | | 2.26% | | |
| Weighted average fair value per option granted | | | | $ | 0.63 | | | | | $ | 0.51 | | |
| Dividend yield | | | | | 4.44% | | | | | | 5.51% | | |
A summary of the activity in the stock option plan for 20172019 follows:
| | | | Shares | | | Weighted Average Exercise Price | | | Weighted Average Remaining Contractual Term | | | Aggregate Intrinsic Value (in thousands) | | ||||||||||||
| Options outstanding, beginning of period | | | | | 782,200 | | | | | $ | 9.56 | | | | | | | | | | | | | | |
| Granted | | | | | — | | | | | | — | | | | | | | | | | | | | | |
| Options issued in connection with EVBS merger | | | | | 22,559 | | | | | | 24.54 | | | | | | | | | | | | | | |
| Forfeited | | | | | (27,042) | | | | | | 21.44 | | | | | | | | | | | | | | |
| Exercised | | | | | (62,750) | | | | | | 8.84 | | | | | | | | | | | | | | |
| Options outstanding, end of period | | | | | 714,967 | | | | | $ | 9.83 | | | | | | 5.6 | | | | | $ | 4,553 | | |
| Exercisable at end of period | | | | | 379,557 | | | | | $ | 8.74 | | | | | | 4.1 | | | | | $ | 3,099 | | |
| | | | | | | | | | |
|
| |
| | |
| Weighted |
|
| |
| | | | Weighted | | Average | | Aggregate | ||
| | | | Average | | Remaining | | Intrinsic | ||
| | | | Exercise | | Contractual | | Value | ||
| | Shares | | Price | | Term | | (in thousands) | ||
Options outstanding, beginning of period |
| 642,350 | | $ | 9.77 |
| 5.0 |
| $ | 2,219 |
Forfeited |
| (2,700) | |
| 10.52 |
|
|
| |
|
Exercised |
| (83,900) | |
| 8.06 |
| |
| |
|
Options outstanding, end of period |
| 555,750 | | $ | 10.02 |
| 4.3 | | $ | 3,518 |
| | | | | | | | | | |
Exercisable at end of period |
| 484,070 | | $ | 9.52 |
| 3.9 | | $ | 3,193 |
Stock-based compensation expense associated with stock options was $237$62 thousand, $260$122 thousand and $331$223 thousand for the years ended December 31, 2017, 20162019, 2018 and 2015,2017, respectively. As of December 31, 2017,2019, unrecognized compensation expense associated with stock options was $214$31 thousand, which is expected to be recognized over a weighted average period of 2.01.3 years.
107
A summary of the third quarter of 2017, 2,800 shares ofactivity in the restricted stock with a price of $15.78 were granted to certain officers of Southern National under the 2017 Plan and are subject to time vesting in two equal annual installments on July 31, 2018 andplan for 2019 respectively. These shares are included in the total shares issued and outstanding at December 31, 2017. follows:
| | | | | | | | |
|
| |
| | |
| Weighted |
|
| | | | Weighted | | Average | | |
| | | | Average | | Remaining | | |
| | | | Exercise | | Contractual | | |
| | Shares | | Price | | Term | | |
Unvested restricted stock outstanding, beginning of period |
| 58,550 | | $ | 15.87 |
| 4.3 |
|
Granted |
| 48,500 | |
| 14.15 |
|
|
|
Vested |
| (17,850) | |
| 16.16 |
|
|
|
Forfeited |
| (2,700) | |
| 15.75 |
| |
|
Unvested restricted stock outstanding, end of period |
| 86,500 | | $ | 14.85 |
| 3.8 | |
Restricted stock compensation expense totaled $370 thousand, $158 thousand and $14 thousand for the yearyears ended December 31, 2019, 2018 and 2017, and totalrespectively. As of December 31, 2019, unrecognized compensation expense associated with restricted stock compensation expense totaled $30 thousand at December 31, 2017 and willwas $1.1 million, which is expected to be amortizedrecognized over the remaining vesting time period.
15.
Southern National is a party to financial instruments with off-balance sheet risk in the normal course of business to meet the financing needs of its customers. These financial instruments include commitments to extend credit, standby letters of credit and guarantees of credit card accounts sold by EVBS premerger.accounts. These instruments involve elements of credit and funding risk in excess of the amount recognized in the consolidated balance sheet. Letters of credit are written conditional commitments issued by Southern National to guarantee the performance of a customer to a third party. The credit risk involved in issuing letters of credit is essentially the same as that involved in extending loans to customers. We had letters of credit outstanding totaling $15.2$17.7 million and $6.4$19.2 million as of December 31, 20172019 and 2016,2018, respectively.
Our exposure to credit loss in the event of nonperformance by the other party to the financial instruments for commitments to extend credit and letters of credit is based on the contractual amount of these instruments. We use the same credit policies in making commitments and conditional obligations as we do for on-balance sheet instruments. Unless noted otherwise, we do not require collateral or other security to support financial instruments with credit risk.
Commitments to extend credit are agreements to lend to a customer as long as there is no violation of any condition established in the contract. Commitments are made predominately for adjustable rate loans, and generally have fixed expiration dates of up to three months or other termination clauses and usually require payment of a fee. Since many of the commitments may expire without being completely drawn upon, the total commitment amounts do not necessarily represent future cash requirements. We evaluate each customer’s creditworthiness on a case-by-case basis.
At December 31, 20172019 and 2016,2018, we had unfunded lines of credit and undisbursed construction loan funds totaling $361.7$324.8 million and $135.8$339.2 million, respectively. Virtually all of our unfunded lines of credit and undisbursed construction loan funds are variable rate.
108
The following is a reconciliation of the denominators of the basic and diluted EPS computations for 2019, 2018 and 2017 2016 and 2015 (dollars(amounts in thousands, except per share data):
| | | | Income (Numerator) | | | Weighted Average Shares (Denominator) | | | Per Share Amount | | |||||||||
| For the year ended December 31, 2017 | | | | | | | | | | | | | | | | | | | |
| Basic EPS | | | | $ | 2,425 | | | | | | 18,391 | | | | | $ | 0.13 | | |
| Effect of dilutive stock options and warrants | | | | | — | | | | | | 281 | | | | | | — | | |
| Diluted EPS | | | | $ | 2,425 | | | | | | 18,672 | | | | | $ | 0.13 | | |
| For the year ended December 31, 2016 | | | | | | | | | | | | | | | | | | | |
| Basic EPS | | | | $ | 10,312 | | | | | | 12,252 | | | | | $ | 0.84 | | |
| Effect of dilutive stock options and warrants | | | | | — | | | | | | 175 | | | | | | — | | |
| Diluted EPS | | | | $ | 10,312 | | | | | | 12,427 | | | | | $ | 0.83 | | |
| For the year ended December 31, 2015 | | | | | | | | | | | | | | | | | | | |
| Basic EPS | | | | $ | 9,289 | | | | | | 12,224 | | | | | $ | 0.76 | | |
| Effect of dilutive stock options and warrants | | | | | — | | | | | | 106 | | | | | | — | | |
| Diluted EPS | | | | $ | 9,289 | | | | | | 12,330 | | | | | $ | 0.75 | | |
| | |||||||||||||||||||
| | | | | | | | |
|
| | | �� | Weighted |
|
| |
| | | | | Average | |
| |
| | Income | | Shares | | Per Share | ||
| | (Numerator) | | (Denominator) | | Amount | ||
For the year ended December 31, 2019 |
| |
|
|
|
| |
|
Basic EPS | | $ | 33,167 |
| 24,050 | | $ | 1.38 |
Effect of dilutive stock options and unvested restricted stock | |
| — |
| 275 | |
| (0.02) |
Diluted EPS | | $ | 33,167 |
| 24,325 | | $ | 1.36 |
| | | | | | | | |
For the year ended December 31, 2018 | |
|
|
|
| |
|
|
Basic EPS | | $ | 33,691 |
| 24,012 | | $ | 1.40 |
Effect of dilutive stock options and unvested restricted stock | |
| — |
| 261 | |
| (0.01) |
Diluted EPS | | $ | 33,691 |
| 24,273 | | $ | 1.39 |
| | | | | | | | |
For the year ended December 31, 2017 | |
|
|
|
| |
|
|
Basic EPS | | $ | 2,425 |
| 18,391 | | $ | 0.13 |
Effect of dilutive stock options | |
| — |
| 281 | |
| — |
Diluted EPS | | $ | 2,425 |
| 18,672 | | $ | 0.13 |
| | | | | | | | |
The Company did 0t have any anti-dilutive options during 2017. All2019 and 2018. There were 8,517 anti-dilutive options during 2017 and all unexercised warrants expired in 2017. There were 678,721 anti-dilutive options and warrants during 2016, and there were 643,164 anti-dilutive options and warrants during 2015.
17.
Southern National and its subsidiary bank are subject to various regulatory capital requirements administered by the federal banking agencies. Failure to meet minimum capital requirements can initiate certain mandatory —- and possibly additional discretionary —- actions by regulators that, if undertaken, could have a direct material effect on our financial statements. Under capital adequacy guidelines and the regulatory framework for prompt corrective action (“PCA”), we must meet specific capital guidelines that involve quantitative measures of our assets, liabilities and certain off-balance sheet items as calculated under regulatory accounting practices. The capital amounts and classification are also subject to qualitative judgments by the regulators about components, risk weightings and other factors. At December 31, 20172019 and 2016,2018, the most recent regulatory notifications categorized the Bank as well capitalized under regulatory framework for PCA.
Quantitative measures established by regulation to ensure capital adequacy require Southern National to maintain minimum amounts and ratios of Total and Tier I capital (as defined in the regulations) to average assets (as defined). Management believes, as of December 31, 2017,2019, that Southern National meets all capital adequacy requirements to which it is subject.
109
The capital amounts and ratios for Southern National and Sonabank at year end are presented in the following table (in thousands):
| | | | Actual | | | Required For Capital Adequacy Purposes(1) | | | To Be Categorized as Well Capitalized(2) | | |||||||||||||||||||||||||||
| | | | Amount | | | Ratio | | | Amount | | | Ratio | | | Amount | | | Ratio | | ||||||||||||||||||
| December 31, 2017 | | | | | | | | | | | | | | | | | | | | | | | | | | | | | | | | | | | | | |
| Southern National | | | | | | | | | | | | | | | | | | | | | | | | | | | | | | | | | | | | | |
| Common equity tier 1 capital ratio | | | | $ | 211,399 | | | | | | 10.53% | | | | | $ | 90,300 | | | | | | 4.50% | | | | | | n/a | | | | | | n/a | | |
| Tier 1 risk-based capital ratio | | | | | 220,430 | | | | | | 10.98% | | | | | | 120,399 | | | | | | 6.00% | | | | | | n/a | | | | | | n/a | | |
| Total risk-based capital ratio | | | | | 276,827 | | | | | | 13.80% | | | | | | 160,533 | | | | | | 8.00% | | | | | | n/a | | | | | | n/a | | |
| Leverage ratio | | | | | 220,430 | | | | | | 8.82% | | | | | | 100,022 | | | | | | 4.00% | | | | | | n/a | | | | | | n/a | | |
| Sonabank | | | | | | | | | | | | | | | | | | | | | | | | | | | | | | | | | | | | | |
| Common equity tier 1 capital ratio | | | | $ | 256,615 | | | | | | 12.79% | | | | | $ | 90,282 | | | | | | 4.50% | | | | | $ | 130,407 | | | | | | 6.50% | | |
| Tier 1 risk-based capital ratio | | | | | 256,615 | | | | | | 12.79% | | | | | | 120,375 | | | | | | 6.00% | | | | | | 160,500 | | | | | | 8.00% | | |
| Total risk-based capital ratio | | | | | 266,012 | | | | | | 13.26% | | | | | | 160,500 | | | | | | 8.00% | | | | | | 200,626 | | | | | | 10.00% | | |
| Leverage ratio | | | | | 256,615 | | | | | | 10.26% | | | | | | 100,040 | | | | | | 4.00% | | | | | | 125,051 | | | | | | 5.00% | | |
| December 31, 2016 | | | | | | | | | | | | | | | | | | | | | | | | | | | | | | | | | | | | | |
| Southern National | | | | | | | | | | | | | | | | | | | | | | | | | | | | | | | | | | | | | |
| Common equity tier 1 capital ratio | | | | $ | 116,076 | | | | | | 12.69% | | | | | $ | 41,171 | | | | | | 4.50% | | | | | | n/a | | | | | | n/a | | |
| Tier 1 risk-based capital ratio | | | | | 116,076 | | | | | | 12.69% | | | | | | 54,894 | | | | | | 6.00% | | | | | | n/a | | | | | | n/a | | |
| Total risk-based capital ratio | | | | | 124,686 | | | | | | 13.63% | | | | | | 73,193 | | | | | | 8.00% | | | | | | n/a | | | | | | n/a | | |
| Leverage ratio | | | | | 116,076 | | | | | | 10.56% | | | | | | 43,965 | | | | | | 4.00% | | | | | | n/a | | | | | | n/a | | |
| Sonabank | | | | | | | | | | | | | | | | | | | | | | | | | | | | | | | | | | | | | |
| Common equity tier 1 capital ratio | | | | $ | 114,779 | | | | | | 12.55% | | | | | $ | 41,151 | | | | | | 4.50% | | | | | $ | 59,440 | | | | | | 6.50% | | |
| Tier 1 risk-based capital ratio | | | | | 114,779 | | | | | | 12.55% | | | | | | 54,868 | | | | | | 6.00% | | | | | | 73,157 | | | | | | 8.00% | | |
| Total risk-based capital ratio | | | | | 123,389 | | | | | | 13.49% | | | | | | 73,157 | | | | | | 8.00% | | | | | | 91,447 | | | | | | 10.00% | | |
| Leverage ratio | | | | | 114,779 | | | | | | 10.45% | | | | | | 43,947 | | | | | | 4.00% | | | | | | 54,934 | | | | | | 5.00% | | |
| | | | | | | | | | | | | | | | |
| | | | | | | Required | | | | |
| | |||
| | | | | | | For Capital | | To Be Categorized as | | ||||||
| | Actual | | Adequacy Purposes (1) | | Well Capitalized (2) | | |||||||||
|
| Amount |
| Ratio |
| Amount |
| Ratio |
| Amount |
| Ratio | | |||
December 31, 2019 |
| |
|
|
|
| |
|
|
|
| |
|
|
| |
Sonabank | |
| |
| | |
| |
| | | | |
| | |
Common equity tier 1 capital ratio | | $ | 313,354 | | 14.81 | % | $ | 95,229 |
| 4.50 | % | $ | 137,553 | | 6.50 | % |
Tier 1 risk-based capital ratio | |
| 313,354 |
| 14.81 | % |
| 126,972 |
| 6.00 | % |
| 169,296 | | 8.00 | % |
Total risk-based capital ratio | |
| 323,615 |
| 15.29 | % |
| 169,296 |
| 8.00 | % |
| 211,619 | | 10.00 | % |
Leverage ratio | |
| 313,354 |
| 12.07 | % |
| 103,838 |
| 4.00 | % |
| 105,810 | | 5.00 | % |
| |
| |
| | |
| |
| | |
| | | | |
December 31, 2018 | |
| |
| | |
| |
| | |
| | | | |
Sonabank | |
| |
| | |
| |
| | | | |
| | |
Common equity tier 1 capital ratio | | $ | 288,018 | | 13.64 | % | $ | 95,020 |
| 4.50 | % | $ | 137,251 | | 6.50 | % |
Tier 1 risk-based capital ratio | |
| 288,018 |
| 13.64 | % |
| 126,693 |
| 6.00 | % |
| 168,924 | | 8.00 | % |
Total risk-based capital ratio | |
| 300,301 |
| 14.22 | % |
| 168,924 |
| 8.00 | % |
| 211,156 | | 10.00 | % |
Leverage ratio | |
| 288,018 |
| 11.03 | % |
| 104,420 |
| 4.00 | % |
| 105,578 | | 5.00 | % |
| |
|
|
|
| |
|
|
|
| |
|
| | | |
| (1) | Once fully phased-in on January 1, 2019, the Basel III capital rules included a capital conservation buffer of 2.5% that was added on top of each of the minimum risk-based capital ratios noted above. Implementation began on January 1, 2016 at the 0.625% level and increased each subsequent January 1, until it reached 2.5% on January 1, 2019. |
| (2) | PCA provisions are not applicable at the bank holding company level. |
Southern National’s principal source of funds for dividend payments is dividends received from the Bank. Banking regulations limit the amount of dividends that may be paid without prior approval of regulatory agencies. Under these regulations, the amount of dividends that may be paid in any calendar year is limited to the current year’s net profits, combined with the retained net profits of the preceding two years, subject to the capital requirements described above.
110
Condensed financial information of Southern National Bancorp of Virginia, Inc. follows (in thousands):
CONDENSED BALANCE SHEETS
DECEMBER 31,
| | | | 2017 | | | 2016 | | ||||||
| ASSETS | | | | | | | | | | | | | |
| Cash | | | | $ | 4,535 | | | | | $ | 856 | | |
| Investment in subsidiaries | | | | | 369,266 | | | | | | 125,047 | | |
| Other assets | | | | | 6,405 | | | | | | 441 | | |
| Total assets | | | | $ | 380,206 | | | | | $ | 126,344 | | |
| LIABILITIES AND STOCKHOLDERS’ EQUITY | | | | | | | | | | | | | |
| Liabilities: | | | | | | | | | | | | | |
| Junior subordinated debt | | | | $ | 9,534 | | | | | $ | — | | |
| Senior subordinated notes | | | | | 47,128 | | | | | | — | | |
| Other liabilities | | | | | 772 | | | | | | — | | |
| Total liabilities | | | | | 57,434 | | | | | | — | | |
| Stockholders’ equity: | | | | | | | | | | | | | |
| Common stock | | | | | 239 | | | | | | 123 | | |
| Additional paid in capital | | | | | 304,932 | | | | | | 104,884 | | |
| Retained earnings | | | | | 18,753 | | | | | | 22,126 | | |
| Accumulated other comprehensive loss | | | | | (1,152) | | | | | | (789) | | |
| Total stockholders’ equity | | | | | 322,772 | | | | | | 126,344 | | |
| Total liabilities and stockholders’ equity | | | | $ | 380,206 | | | | | $ | 126,344 | | |
| | |||||||||||||
| | | | | | |
|
| 2019 |
| 2018 | ||
ASSETS |
| |
|
| |
|
Cash | | $ | 2,707 | | $ | 1,393 |
Investment in subsidiaries | |
| 423,591 | |
| 397,063 |
Other assets | |
| 8,128 | |
| 7,174 |
Total assets | | $ | 434,426 | | $ | 405,630 |
| | | | | | |
LIABILITIES AND STOCKHOLDERS' EQUITY | |
|
| |
|
|
Liabilities: | |
|
| |
|
|
Junior subordinated debt - long term | | $ | 9,632 | | $ | 9,584 |
Senior subordinated notes - long term | |
| 47,051 | |
| 47,089 |
Other liabilities | |
| 502 | |
| 667 |
Total liabilities | |
| 57,185 | |
| 57,340 |
Stockholders' equity: | |
|
| |
|
|
Common stock | |
| 241 | |
| 240 |
Additional paid in capital | |
| 306,755 | |
| 305,654 |
Retained earnings | |
| 69,462 | |
| 44,985 |
Accumulated other comprehensive income (loss) | |
| 783 | |
| (2,589) |
Total stockholders' equity | |
| 377,241 | |
| 348,290 |
Total liabilities and stockholders' equity | | $ | 434,426 | | $ | 405,630 |
CONDENSED STATEMENTS OF INCOME
FOR THE YEARS ENDED DECEMBER 31,
| | | | | | | | | |
|
| 2019 |
| 2018 |
| 2017 | |||
Income: |
| |
|
| |
|
| |
|
Cash dividends received from subsidiaries | | $ | 13,300 | | $ | 8,000 | | $ | 4,900 |
Interest on deposit with subsidiary | |
| — | |
| — | |
| 3 |
Total income | |
| 13,300 | |
| 8,000 | |
| 4,903 |
Expenses: | |
|
| |
|
| |
|
|
Interest on junior subordinated debt | |
| 589 | |
| 575 | |
| 253 |
Interest on senior subordinated notes | |
| 2,847 | |
| 2,847 | |
| 2,194 |
Merger expenses | |
| — | |
| — | |
| 2,812 |
Other operating expenses | |
| 726 | |
| 765 | |
| 478 |
Total expenses | |
| 4,162 | |
| 4,187 | |
| 5,737 |
Income (loss) before income tax benefit and equity in undistributed net income of subsidiaries | |
| 9,138 | |
| 3,813 | |
| (834) |
Income tax benefit | |
| (862) | |
| (872) | |
| (1,196) |
Equity in undistributed net income of subsidiaries | |
| 23,167 | |
| 29,006 | |
| 2,063 |
Net income | | $ | 33,167 | | $ | 33,691 | | $ | 2,425 |
| | | | 2017 | | | 2016 | | | 2015 | | |||||||||
| Income: | | | | | | | | | | | | | | | | | | | |
| Cash dividends received from subsidiary | | | | $ | 4,900 | | | | | $ | 3,600 | | | | | $ | 6,300 | | |
| Interest on deposit with subsidiary | | | | | 3 | | | | | | — | | | | | | — | | |
| Total income | | | | | 4,903 | | | | | | 3,600 | | | | | | 6,300 | | |
| Expenses: | | | | | | | | | | | | | | | | | | | |
| Interest on junior subordinated debt | | | | | 253 | | | | | | — | | | | | | — | | |
| Interest on senior subordinated notes | | | | | 2,194 | | | | | | — | | | | | | — | | |
| Merger expenses | | | | | 2,812 | | | | | | — | | | | | | — | | |
| Other operating expenses | | | | | 478 | | | | | | 153 | | | | | | 204 | | |
| Total expenses | | | | | 5,737 | | | | | | 153 | | | | | | 204 | | |
| (Loss) income before income tax benefit and equity in undistributed net income of subsidiary | | | | | (834) | | | | | | 3,447 | | | | | | 6,096 | | |
| Income tax benefit | | | | | (1,196) | | | | | | (52) | | | | | | (69) | | |
| Equity in undistributed net income of subsidiary | | | | | 2,063 | | | | | | 6,813 | | | | | | 3,124 | | |
| Net income | | | | $ | 2,425 | | | | | $ | 10,312 | | | | | $ | 9,289 | | |
| | |||||||||||||||||||
111
| | | | 2017 | | | 2016 | | | 2015 | | |||||||||
| Operating activities: | | | | | | | | | | | | | | | | | | | |
| Net income | | | | $ | 2,425 | | | | | $ | 10,312 | | | | | $ | 9,289 | | |
| Adjustments to reconcile net income to net cash and cash equivalents (used in) provided by operating activities: | | | | | | | | | | | | | | | | | | | |
| Equity in undistributed net income of subsidiary | | | | | (6,963) | | | | | | (10,413) | | | | | | (9,424) | | |
| Other, net | | | | | 4,046 | | | | | | 219 | | | | | | 262 | | |
| Net cash and cash equivalents (used in) provided by operating activities | | | | | (492) | | | | | | 118 | | | | | | 127 | | |
| Investing activities: | | | | | | | | | | | | | | | | | | | |
| Increase in investment in subsidiary | | | | | (22,000) | | | | | | — | | | | | | — | | |
| Dividend from subsidiary | | | | | 4,900 | | | | | | 3,600 | | | | | | 6,300 | | |
| Acquisition of Eastern Virginia Bankshares, Inc. | | | | | (10) | | | | | | — | | | | | | — | | |
| Net cash and cash equivalents (used in) provided by investing activities | | | | | (17,110) | | | | | | 3,600 | | | | | | 6,300 | | |
| Financing activities: | | | | | | | | | | | | | | | | | | | |
| Issuance of subordinated notes, net of cost | | | | | 26,075 | | | | | | — | | | | | | — | | |
| Issuance of common stock | | | | | 1,004 | | | | | | 236 | | | | | | 707 | | |
| Repurchase of common stock | | | | | — | | | | | | — | | | | | | (721) | | |
| Cash dividends paid on common stock | | | | | (5,798) | | | | | | (3,921) | | | | | | (6,359) | | |
| Net cash and cash equivalents provided by (used in) financing activities | | | | | 21,281 | | | | | | (3,685) | | | | | | (6,373) | | |
| Increase in cash and cash equivalents | | | | | 3,679 | | | | | | 33 | | | | | | 54 | | |
| Cash and cash equivalents at beginning of period | | | | | 856 | | | | | | 823 | | | | | | 769 | | |
| Cash and cash equivalents at end of period | | | | $ | 4,535 | | | | | $ | 856 | | | | | $ | 823 | | |
| | |||||||||||||||||||
| | | | | | | | | |
|
| 2019 |
| 2018 |
| 2017 | |||
Operating activities: |
| |
|
| |
|
| |
|
Net income | | $ | 33,167 | | $ | 33,691 | | $ | 2,425 |
Adjustments to reconcile net income to net cash and cash equivalents (used in) provided by operating activities: | |
| | |
| | |
|
|
Equity in undistributed net income of subsidiaries | |
| (36,467) | |
| (37,006) | |
| (6,963) |
Other, net | |
| (666) | |
| (582) | |
| 4,046 |
Net cash and cash equivalents used in operating activities | |
| (3,966) | |
| (3,897) | |
| (492) |
Investing activities: | |
|
| |
|
| |
|
|
Increase in investment in subsidiary | |
| — | |
| — | |
| (22,000) |
Dividend from subsidiaries | |
| 13,300 | |
| 8,000 | |
| 4,900 |
Acquisition of Eastern Virginia Bankshares, Inc. | |
| — | |
| — | |
| (10) |
Net cash and cash equivalents (used in) provided by investing activities | |
| 13,300 | |
| 8,000 | |
| (17,110) |
Financing activities: | |
|
| |
|
| |
|
|
Issuance of subordinated notes, net of cost | |
| — | |
| — | |
| 26,075 |
Issuance of common stock | |
| 670 | |
| 443 | |
| 1,004 |
Cash dividends paid on common stock | |
| (8,690) | |
| (7,688) | |
| (5,798) |
Net cash and cash equivalents provided by (used in) financing activities | |
| (8,020) | |
| (7,245) | |
| 21,281 |
Increase (decrease) in cash and cash equivalents | |
| 1,314 | |
| (3,142) | |
| 3,679 |
Cash and cash equivalents at beginning of period | |
| 1,393 | |
| 4,535 | |
| 856 |
Cash and cash equivalents at end of period | | $ | 2,707 | | $ | 1,393 | | $ | 4,535 |
19.
The following is a summary of the accumulated other comprehensive income (loss) balances, net of tax (in thousands):
| | | | Balance at December 31, 2016 | | | Current Period Change | | | Balance at December 31, 2017 | | |||||||||
| Unrealized (loss) on investment securities available for sale | | | | $ | (627) | | | | | $ | (372) | | | | | $ | (999) | | |
| Unrecognized gain on investment securities held to maturity for which other than temporary impairment charges have been taken | | | | | 311 | | | | | | — | | | | | | 311 | | |
| Unrealized (loss) on investment securities available for sale transferred to held to maturity | | | | | (473) | | | | | | 9 | | | | | | (464) | | |
| Total | | | | $ | (789) | | | | | $ | (363) | | | | | $ | (1,152) | | |
| | |||||||||||||||||||
| | | | | | | | | |
|
| Balance at |
| Current Period |
| Balance at | |||
| | December 31, 2018 | | Change | | December 31, 2019 | |||
Unrealized gain (loss) on investment securities available for sale | | $ | (2,419) | | $ | 3,362 | | $ | 943 |
Unrecognized gain on investment securities held to maturity for which other than temporary impairment charges have been taken | |
| 311 | |
| — | |
| 311 |
Unrealized gain (loss) on investment securities available for sale transferred to held to maturity | |
| (481) | |
| 10 | |
| (471) |
Total | | $ | (2,589) | | $ | 3,372 | | $ | 783 |
Sonabank has entered into loan transactions with STM in the ordinary course of business on substantially the same terms, including interest rates and collateral, as those prevailing at the same time for comparable transactions with other customers, and did not, in the opinion of management, involve more than normal credit risk.
| | | | 2017 | | | 2016 | | ||||||
| Balance at January 1 | | | | $ | 8,126 | | | | | $ | 10,438 | | |
| Principal advances | | | | | 238,503 | | | | | | 149,725 | | |
| Acquired from EVBS | | | | | 13,044 | | | | | | — | | |
| Principal paid | | | | | (233,906) | | | | | | (152,037) | | |
| Balance at December 31 | | | | $ | 25,767 | | | | | $ | 8,126 | | |
| | |||||||||||||
| | | | | | |
|
| 2019 |
| 2018 | ||
Balance at January 1, | | $ | 24,168 | | $ | 25,767 |
Principal advances | |
| 298,639 | |
| 296,627 |
Principal paid | |
| (296,047) | |
| (298,226) |
Balance at December 31, | | $ | 26,760 | | $ | 24,168 |
Sonabank has established with STM underwriting guidelines under which it will purchase residential construction only, construction loans that convert to permanent, and permanent loans primarily in its Virginia and Maryland footprint from
112
STM. These will be largely loans that do not conform to FNMA or FHLMC standards because of size or acreage. We purchased loans in an aggregate amount of $102.1$152.2 million during 2017,2019 and $77.4$125.1 million during 20162018 from STM.
During the year, officers, directors, principal shareholders, and their affiliates (related parties) were customers of and had transactions with the Company in the ordinary course of business. In management’s opinion, these transactions were made on substantially the same terms, including interest rates and collateral, as those prevailing at the time for comparable loans to non-related customers and did not involve more than the normal risk of collectability or present other unfavorable features.
| | | | 2017 | | |||
| Balance at January 1 | | | | $ | — | | |
| Acquired from EVBS | | | | | 7,871 | | |
| Principal advances | | | | | 2,498 | | |
| Principal paid | | | | | (1,020) | | |
| Balance at December 31 | | | | $ | 9,349 | | |
| | |||||||
| | | | |
|
|
| 2019 | |
Balance at January 1, | | | $ | 22,869 |
Principal advances | | |
| 1,702 |
Principal paid | | |
| (3,165) |
Balance at December 31, | | | $ | 21,406 |
Sonabank has also entered into deposit transactions with its related parties including STM, all of which are under the same terms as other customers.STM. The aggregate amount of these deposit accounts were $15.6$20.1 million and $5.9$12.8 million as of December 31, 20172019 and 2016,2018, respectively.
| | | | Interest Income | | | Net Interest Income | | | Income (Loss) Before Taxes | | | Net Income (Loss) | | | Earnings (Loss) Per Share | | |||||||||||||||||||||
| | | | Basic | | | Diluted | | ||||||||||||||||||||||||||||||
| | | | (dollars in thousands, except per share amounts) | | |||||||||||||||||||||||||||||||||
| 2017 | | | | | | | | | | | | | | | | | | | | | | | | | | | | | | | | | | | | | |
| First quarter | | | | $ | 12,545 | | | | | $ | 9,891 | | | | | $ | 3,221 | | | | | $ | 2,054 | | | | | $ | 0.17 | | | | | $ | 0.16 | | |
| Second quarter | | | | | 14,249 | | | | | | 11,205 | | | | | | (3,804) | | | | | | (2,842) | | | | | | (0.21) | | | | | | (0.21) | | |
| Third quarter | | | | | 28,811 | | | | | | 23,850 | | | | | | 6,463 | | | | | | 4,374 | | | | | | 0.18 | | | | | | 0.18 | | |
| Fourth quarter | | | | | 27,965 | | | | | | 22,971 | | | | | | 9,692 | | | | | | (1,161) | | | | | | (0.05) | | | | | | (0.05) | | |
| 2016 | | | | | | | | | | | | | | | | | | | | | | | | | | | | | | | | | | | | | |
| First quarter | | | | $ | 11,673 | | | | | $ | 9,712 | | | | | $ | 3,555 | | | | | $ | 2,566 | | | | | $ | 0.21 | | | | | $ | 0.21 | | |
| Second quarter | | | | | 12,291 | | | | | | 10,174 | | | | | | 4,182 | | | | | | 2,789 | | | | | | 0.23 | | | | | | 0.23 | | |
| Third quarter | | | | | 12,619 | | | | | | 10,373 | | | | | | 4,140 | | | | | | 2,765 | | | | | | 0.23 | | | | | | 0.22 | | |
| Fourth quarter | | | | | 12,364 | | | | | | 10,055 | | | | | | 3,530 | | | | | | 2,192 | | | | | | 0.18 | | | | | | 0.18 | | |
| | | | | | | | | | | | | | | | | | |
| | Interest | | Net Interest | | Income | | Net | | Earnings Per Share | ||||||||
|
| Income |
| Income |
| Before Taxes |
| Income |
| Basic |
| Diluted | ||||||
| | (dollars in thousands, except per share amounts) | |
| | |||||||||||||
2019 |
| |
|
| |
|
| |
|
| |
|
| |
|
| |
|
First quarter | | $ | 30,303 | | $ | 20,952 | | $ | 7,524 | | $ | 6,020 | | $ | 0.25 | | $ | 0.25 |
Second quarter | |
| 30,393 | |
| 20,964 | |
| 10,263 | |
| 9,319 | |
| 0.39 | |
| 0.38 |
Third quarter | |
| 30,474 | |
| 21,015 | |
| 11,225 | |
| 8,864 | |
| 0.37 | |
| 0.36 |
Fourth quarter | |
| 29,354 | |
| 20,669 | |
| 10,232 | |
| 8,964 | |
| 0.37 | |
| 0.37 |
| | | | | | | | | | | | | | | | | | |
2018 | |
|
| |
|
| |
|
| |
|
| |
|
| |
|
|
First quarter | | $ | 28,020 | | $ | 22,500 | | $ | 10,360 | | $ | 8,259 | | $ | 0.34 | | $ | 0.34 |
Second quarter | |
| 29,683 | |
| 23,174 | |
| 11,060 | |
| 8,867 | |
| 0.37 | |
| 0.37 |
Third quarter | |
| 30,054 | |
| 22,588 | |
| 11,061 | |
| 8,861 | |
| 0.37 | |
| 0.36 |
Fourth quarter | |
| 31,150 | |
| 22,804 | |
| 10,824 | |
| 7,704 | |
| 0.32 | |
| 0.32 |
22.
The general purpose of thesehousing equity funds is to encourage and assist participants in investing in low-income residential rental properties located in the Commonwealth of Virginia, develop and implement strategies to maintain projects as low-income housing, deliver Federal Low Income Housing Credits to investors, allocate tax losses and other possible tax benefits to investors, and to preserve and protect project assets. The investments in these funds were recorded as other assets on the consolidated balance sheets and were carried at $1.9$6.0 million and $0$2.7 million at December 31, 20172019 and 2016,2018, respectively. These investments and related tax benefits have expected terms through 2033, with the majority maturing by 2027. Tax credits, and other tax benefitsnet of amortization recognized related to these investments during the years ended December 31, 20172019 and 20162018 were $227$255 thousand and $0,$502 thousand, respectively. Total projected tax credits to be received for 20172019 are $154$643 thousand, which is based on the most recent quarterly estimates received from the funds. Additional capital calls expected for the funds totaled $949 thousand$3.8 million and $0$4.1 million at December 31, 20172019 and 2016, respectively,2018, respectively.
23.SUBSEQUENT EVENT
On February 20, 2020, the Company announced that effective February 19, 2020, Mr. Joe A. Shearin would be retiring as Chief Executive Officer of the Company and are included in other liabilities on the consolidated balance sheets.Company’s wholly-owned subsidiary, Sonabank, and resigning as a director of the Company and Sonabank. On February 19, 2020, the Company’s Board of Directors appointed Dennis J. Zember Jr. as the new President and Chief Executive Officer of the Company and Sonabank, and as a member of the Board of Directors of the Company and Sonabank, effective February 19, 2020.
113
None.
(a) Evaluation of Disclosure Controls and Procedures.
As of the end of the period covered by this Annual Report on Form 10-K, under the supervision and with the participation of management, including our chief executive officer and chief financial officer, we have evaluated the effectiveness of the design and operation of our disclosure controls and procedures (as defined in Rules 13a-15(e) and 15d -15(e) under the Securities Exchange Act of 1934) utilizing the framework established in “Internal ControlDisclosure controls and procedures are our controls and other procedures that are designed to ensure that information required to be disclosed by us in the reports that we file or submit under the Securities Exchange Act of 1934 is accumulated and communicated to our management, including our principal executive officer and principal financial officer, as appropriate, to allow timely decisions regarding required disclosure.
(b) Management’s Report on Internal Control Over Financial Reporting.
Dixon Hughes Goodman LLP, an independent registered public accounting firm, has audited the consolidated financial statements included in this Annual Report and has issued a report on the effectiveness of our internal control over financial reporting, which report is included in “Part"Part II - Item 8. Financial Statements and Supplementary Data”Data" of this Report.
(c) Changes in Internal Control over Financial Reporting
.
Item 9B. Other Information
None.
114
PART III
The information under the captions “Election"Election of Directors,” “Continuing"Continuing Directors and Executive Officers," "Delinquent Section 16(a) Reports,” “Section 16(a) Beneficial Ownership Reporting Compliance,” “Corporate"Corporate Governance — Committees of the Board of Directors —Directors— Audit Committee,” “Corporate"Corporate Governance — Director Nominations Process”Process" and “Corporate"Corporate Governance — Code of Ethics”Ethics" in Southern National’s definitive Proxy Statement for its 20182020 Annual Meeting of Shareholders to be filed with the SEC within 120 days after December 31, 20172019 pursuant to Regulation 14A under the Exchange Act (the “2018"2020 Proxy Statement”Statement"), is incorporated herein by reference in response to this item.
The information under the captions “Executive"Executive Compensation and Other Matters,” “Director Compensation”" "Director Compensation" and “Compensation"Compensation Committee Report on Executive Compensation”Compensation" in the 20182020 Proxy Statement is incorporated herein by reference in response to this item.
The information under the caption “Beneficial"Beneficial Ownership of Common Stock by Management of the Company and Principal Stockholders”Stockholders" in the 20182020 Proxy Statement is incorporated herein by reference in response to this item.
The information required by this Item concerning securities authorized for issuance under equity compensation plans is incorporated herein by reference to Part II, Item 5 of this Annual Report on Form 10-K.
The information under the captions “Corporate"Corporate Governance — Director Independence”Independence" and “Certain"Certain Relationships and Related Party Transactions”Transactions" in the 20182020 Proxy Statement is incorporated herein by reference in response to this item.
The information under the caption “Fees"Fees and Services of Independent Registered Public Accounting Firm”Firm" in the 20182020 Proxy Statement is incorporated herein by reference in response to this item.
115
The following documents are filed as part of this report:
(a)(1)
The following consolidated financial statements and reports of independent registered public accounting firm are in Part II, Item 8:
Reports of Independent Registered Public Accounting Firm
Consolidated Balance Sheets —- December 31, 20172019 and 2016
Consolidated Statements of Income and Comprehensive Income —- Years ended December 31, 2017, 20162019, 2018 and 2015
Consolidated Statements of Changes in Stockholders’ Equity —- Years ended December 31, 2017, 20162019, 2018 and 2015
Consolidated Statements of Cash Flows — Years-Years ended December 31, 2017, 20162019, 2018 and 2015
Notes to Consolidated Financial Statements
(a)(2)
All schedules are omitted since they are not required, are not applicable, or the required information is shown in the consolidated financial statements or notes thereto.
(a)(3)
The following are filed or furnished, as noted below, as part of this Annual Report on Form 10-K and this list includes the Exhibit Index.
116
117
118
| | | |||
|---|---|---|---|---|---|
Exhibit No. | Description | ||||
10.17+ | | Form of Subordinated Note Purchase Agreement, dated January 20, 2017 (incorporated herein by reference to Exhibit 10.1 to Southern National’s Current Report on Form 8-K filed on January 24, 2017) | |||
10.18+ | | ||||
10.19+ | | ||||
10.20+ | | ||||
10.21+ | | ||||
10.22+ | | ||||
10.23+ | | ||||
10.24+ | | ||||
10.25+ | | ||||
10.26+ | | ||||
10.27+ | | ||||
21.0* | | ||||
23.1* | | Consent of Dixon Hughes Goodman LLP | |||
31.1* | | Certification of Chief Executive Officer pursuant to Section 302 of the | |||
31.2* | | Certification of Chief Financial Officer pursuant to Section 302 of the |
119
| | | |||
|---|---|---|---|---|---|
Exhibit No. | Description | ||||
32.1** | | Certification of Chief Executive Officer and Chief Financial Officer pursuant to Section 906 of the Sarbanes-Oxley Act of 2002 | |||
101 | | The following materials from Southern National Bancorp of Virginia, Inc.’s Annual Report on Form 10-K for the year ended December 31, | |||
104 | | The cover page from Southern National Bancorp of Virginia, Inc.’s Annual Report on Form 10-K for the year ended December 31, 2019, formatted in Inline XBRL. |
+
*
**
None.
120
Southern National Bancorp of Virginia, Inc. will furnish, upon written request, a copy of any exhibit listed above upon the payment of a reasonable fee covering the expense of furnishing the copy. Requests should be directed to:
Jeffrey L. Karafa, Executive Vice President and Chief Financial Officer
Southern National Bancorp of Virginia, Inc.
10900 Nuckols Road, Suite 325
Glen Allen, Virginia 23060
121
SIGNATURES
Pursuant to the requirements of Section 13 or 15(d) of the Securities Exchange Act of 1934, the registrant has duly caused this report to be signed on its behalf by the undersigned, thereunto duly authorized.
Southern National Bancorp of Virginia, Inc.
| | | | |||
By: | /s/ Dennis J. Zember | Date: March 16, 2020 | ||||
| Dennis J. Zember | | | |||
| President and Chief Executive Officer | | | |||
| (Principal Executive Officer) | | | |||
| | | ||||
By: | /s/ Jeffrey L. Karafa | | Date: March 16, | |||
| Jeffrey L. Karafa | | | |||
| Executive Vice President and Chief Financial Officer | | | |||
| (Principal Financial and Accounting Officer) | | | |||
Pursuant to the requirements of the Securities Exchange Act of 1934, this report has been signed below by the following persons on behalf of the registrant and in the capacities and on the dates indicated.
Date: March 16, 2018
| | | ||||||
Signature | Title | |||||||
| | | ||||||
/s/ Georgia S. Derrico | | Executive Chairman | ||||||
Georgia S. Derrico | | | ||||||
| | | ||||||
/s/ R. Roderick Porter | | Executive Vice Chairman | ||||||
R. Roderick Porter | | | ||||||
| | | ||||||
/s/ | | President and Chief Executive Officer, Director | ||||||
Dennis J. Zember | | | ||||||
| | | ||||||
/s/ John F. Biagas | | Director | ||||||
John F. Biagas | | | ||||||
| | | ||||||
/s/ Daniel H. Burch | | Director | ||||||
Daniel H. Burch | | | ||||||
| | | ||||||
/s/ Robert Y. Clagett | | Director | ||||||
Robert Y. Clagett | | | ||||||
| | | ||||||
/s/ W. Rand Cook | | Director | ||||||
W. Rand Cook | | | ||||||
| | | ||||||
/s/ F. L. Garrett, III | | Director | ||||||
F. L. Garrett, III | | | ||||||
| | | ||||||
/s/ W. Bruce Jennings | | Director | ||||||
W. Bruce Jennings | | | ||||||
| | | |||||
/s/ Eric A. Johnson | | Director | |||||
Eric A. Johnson | | | |||||
| | | |||||
/s/ Charles A. Kabbash | | Director | |||||
Charles A. Kabbash | | | |||||
122